Sagamore, MA Map & Demographics
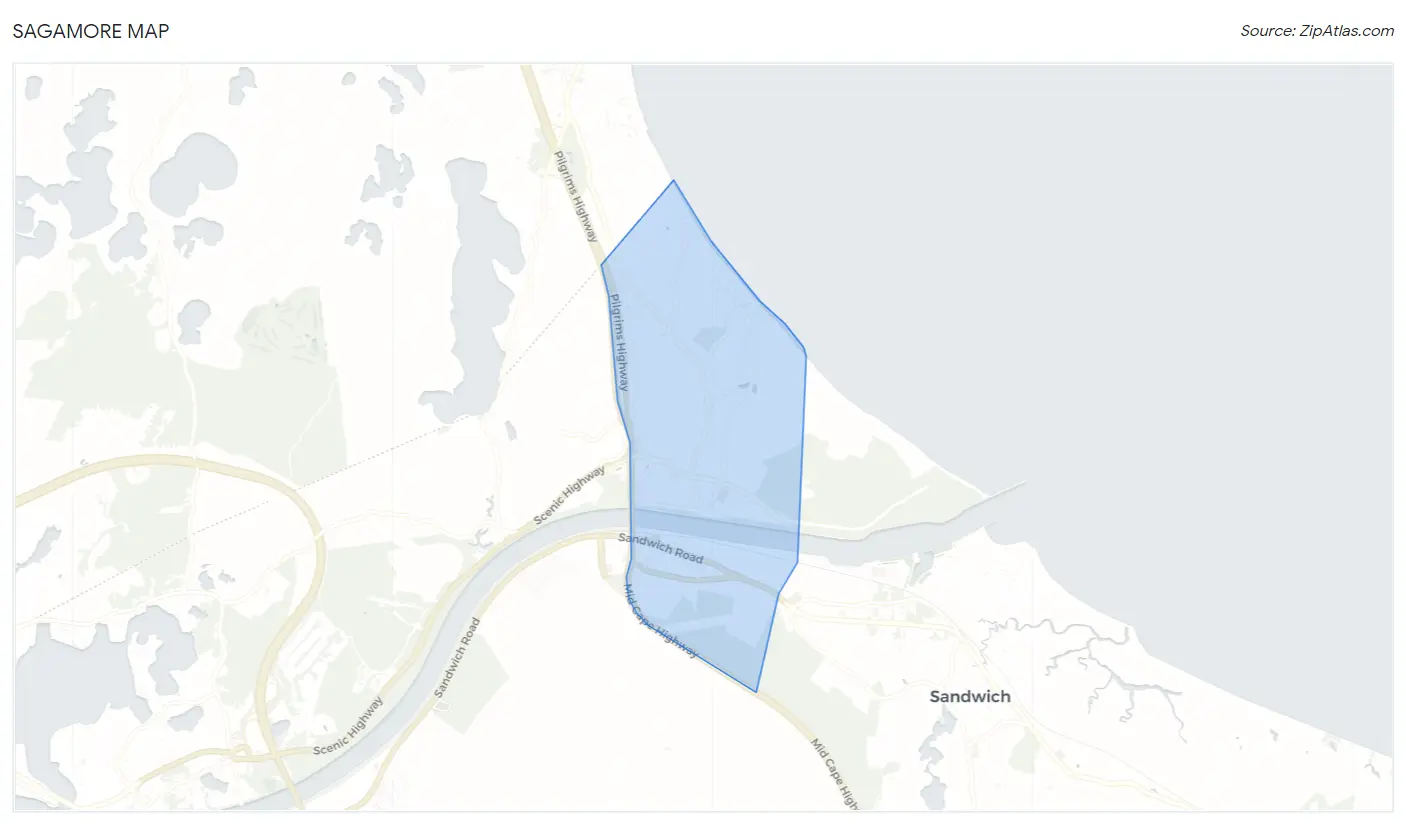
Sagamore Map
Sagamore Overview
$53,529
PER CAPITA INCOME
$145,357
AVG FAMILY INCOME
$113,289
AVG HOUSEHOLD INCOME
29.0%
WAGE / INCOME GAP [ % ]
71.0¢/ $1
WAGE / INCOME GAP [ $ ]
0.35
INEQUALITY / GINI INDEX
3,966
TOTAL POPULATION
1,822
MALE POPULATION
2,144
FEMALE POPULATION
84.98
MALES / 100 FEMALES
117.67
FEMALES / 100 MALES
46.0
MEDIAN AGE
2.8
AVG FAMILY SIZE
2.5
AVG HOUSEHOLD SIZE
2,668
LABOR FORCE [ PEOPLE ]
78.6%
PERCENT IN LABOR FORCE
3.0%
UNEMPLOYMENT RATE
Sagamore Zip Codes
Sagamore Area Codes
Income in Sagamore
Income Overview in Sagamore
Per Capita Income in Sagamore is $53,529, while median incomes of families and households are $145,357 and $113,289 respectively.
| Characteristic | Number | Measure |
| Per Capita Income | 3,966 | $53,529 |
| Median Family Income | 1,172 | $145,357 |
| Mean Family Income | 1,172 | $147,994 |
| Median Household Income | 1,560 | $113,289 |
| Mean Household Income | 1,560 | $134,546 |
| Income Deficit | 1,172 | $0 |
| Wage / Income Gap (%) | 3,966 | 29.03% |
| Wage / Income Gap ($) | 3,966 | 70.97¢ per $1 |
| Gini / Inequality Index | 3,966 | 0.35 |
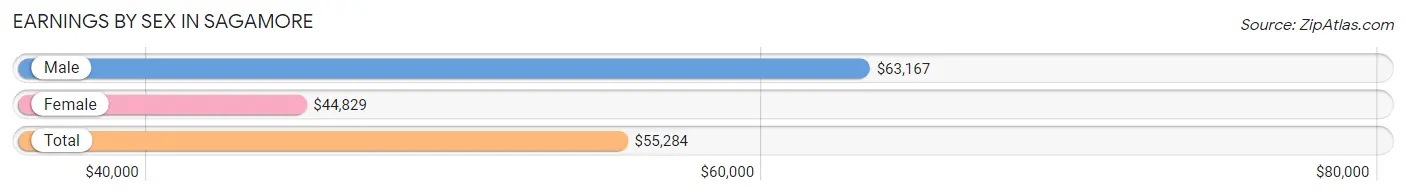
Earnings by Sex in Sagamore
Average Earnings in Sagamore are $55,284, $63,167 for men and $44,829 for women, a difference of 29.0%.
| Sex | Number | Average Earnings |
| Male | 1,274 (46.4%) | $63,167 |
| Female | 1,473 (53.6%) | $44,829 |
| Total | 2,747 (100.0%) | $55,284 |
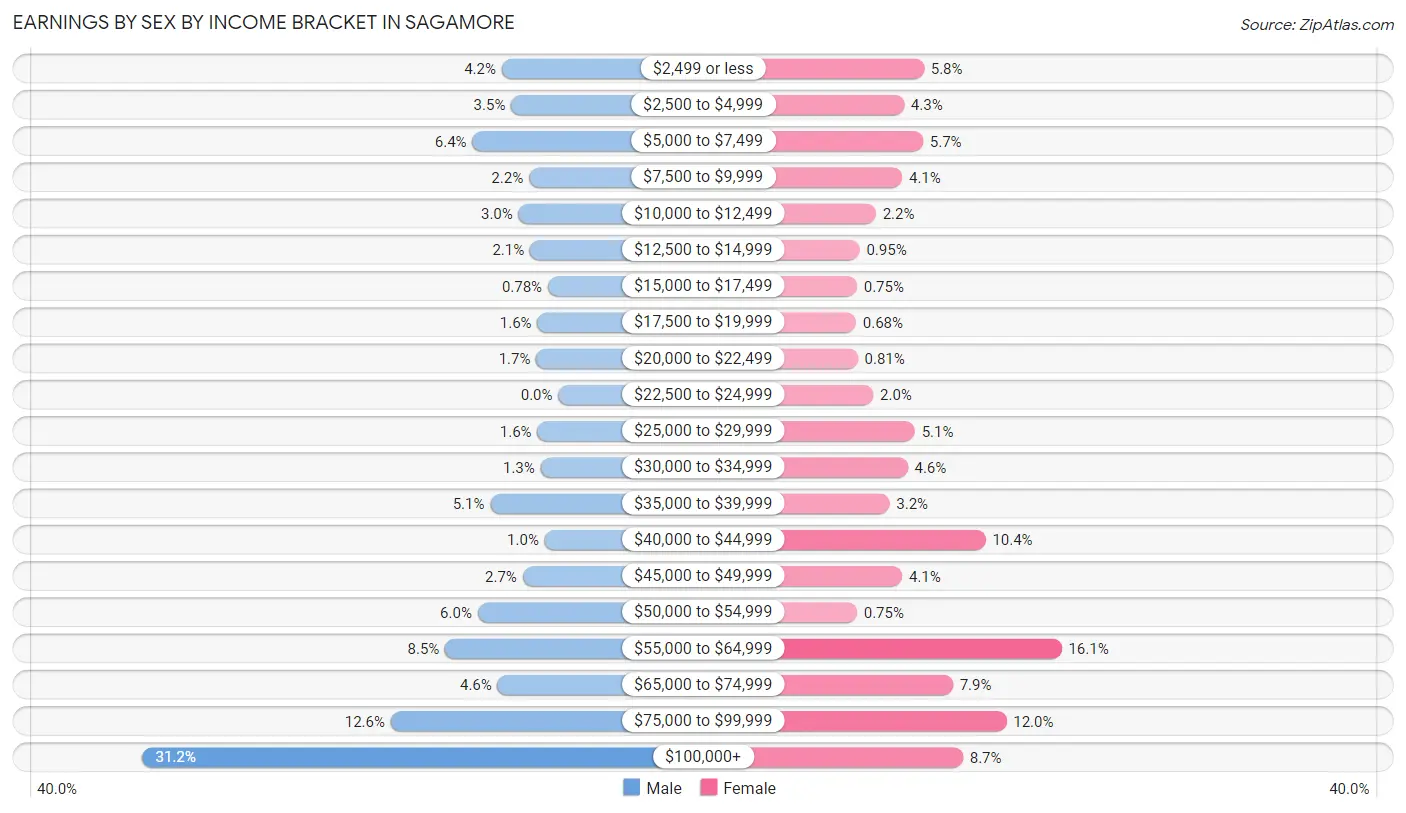
Earnings by Sex by Income Bracket in Sagamore
The most common earnings brackets in Sagamore are $100,000+ for men (397 | 31.2%) and $55,000 to $64,999 for women (237 | 16.1%).
| Income | Male | Female |
| $2,499 or less | 54 (4.2%) | 85 (5.8%) |
| $2,500 to $4,999 | 45 (3.5%) | 63 (4.3%) |
| $5,000 to $7,499 | 82 (6.4%) | 84 (5.7%) |
| $7,500 to $9,999 | 28 (2.2%) | 61 (4.1%) |
| $10,000 to $12,499 | 38 (3.0%) | 32 (2.2%) |
| $12,500 to $14,999 | 27 (2.1%) | 14 (0.9%) |
| $15,000 to $17,499 | 10 (0.8%) | 11 (0.7%) |
| $17,500 to $19,999 | 20 (1.6%) | 10 (0.7%) |
| $20,000 to $22,499 | 21 (1.7%) | 12 (0.8%) |
| $22,500 to $24,999 | 0 (0.0%) | 29 (2.0%) |
| $25,000 to $29,999 | 20 (1.6%) | 75 (5.1%) |
| $30,000 to $34,999 | 17 (1.3%) | 67 (4.5%) |
| $35,000 to $39,999 | 65 (5.1%) | 47 (3.2%) |
| $40,000 to $44,999 | 13 (1.0%) | 153 (10.4%) |
| $45,000 to $49,999 | 34 (2.7%) | 61 (4.1%) |
| $50,000 to $54,999 | 77 (6.0%) | 11 (0.7%) |
| $55,000 to $64,999 | 108 (8.5%) | 237 (16.1%) |
| $65,000 to $74,999 | 58 (4.5%) | 117 (7.9%) |
| $75,000 to $99,999 | 160 (12.6%) | 176 (11.9%) |
| $100,000+ | 397 (31.2%) | 128 (8.7%) |
| Total | 1,274 (100.0%) | 1,473 (100.0%) |
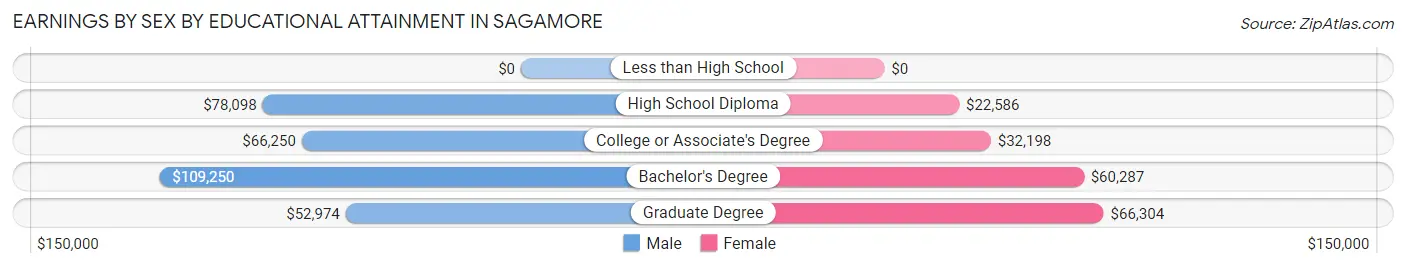
Earnings by Sex by Educational Attainment in Sagamore
Average earnings in Sagamore are $76,294 for men and $56,111 for women, a difference of 26.5%. Men with an educational attainment of bachelor's degree enjoy the highest average annual earnings of $109,250, while those with graduate degree education earn the least with $52,974. Women with an educational attainment of graduate degree earn the most with the average annual earnings of $66,304, while those with high school diploma education have the smallest earnings of $22,586.
| Educational Attainment | Male Income | Female Income |
| Less than High School | - | - |
| High School Diploma | $78,098 | $22,586 |
| College or Associate's Degree | $66,250 | $32,198 |
| Bachelor's Degree | $109,250 | $60,287 |
| Graduate Degree | $52,974 | $66,304 |
| Total | $76,294 | $56,111 |
Family Income in Sagamore
Family Income Brackets in Sagamore
According to the Sagamore family income data, there are 275 families falling into the $150,000 to $199,999 income range, which is the most common income bracket and makes up 23.5% of all families.
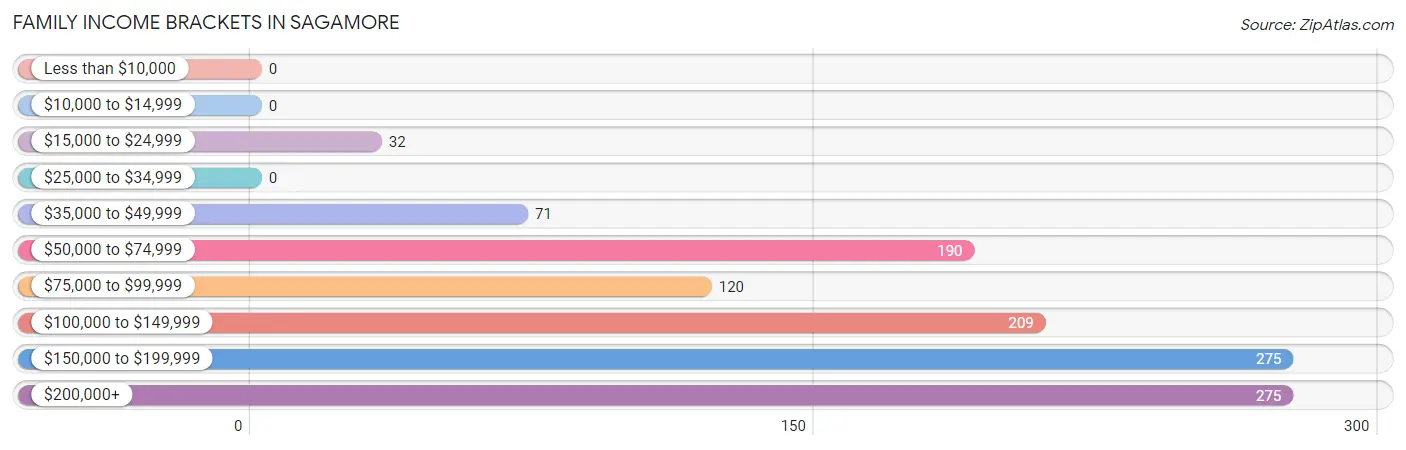
| Income Bracket | # Families | % Families |
| Less than $10,000 | 0 | 0.0% |
| $10,000 to $14,999 | 0 | 0.0% |
| $15,000 to $24,999 | 32 | 2.7% |
| $25,000 to $34,999 | 0 | 0.0% |
| $35,000 to $49,999 | 71 | 6.1% |
| $50,000 to $74,999 | 190 | 16.2% |
| $75,000 to $99,999 | 120 | 10.2% |
| $100,000 to $149,999 | 209 | 17.8% |
| $150,000 to $199,999 | 275 | 23.5% |
| $200,000+ | 275 | 23.5% |
Family Income by Famaliy Size in Sagamore
3-person families (160 | 13.7%) account for the highest median family income in Sagamore with $177,557 per family, while 2-person families (729 | 62.2%) have the highest median income of $59,542 per family member.
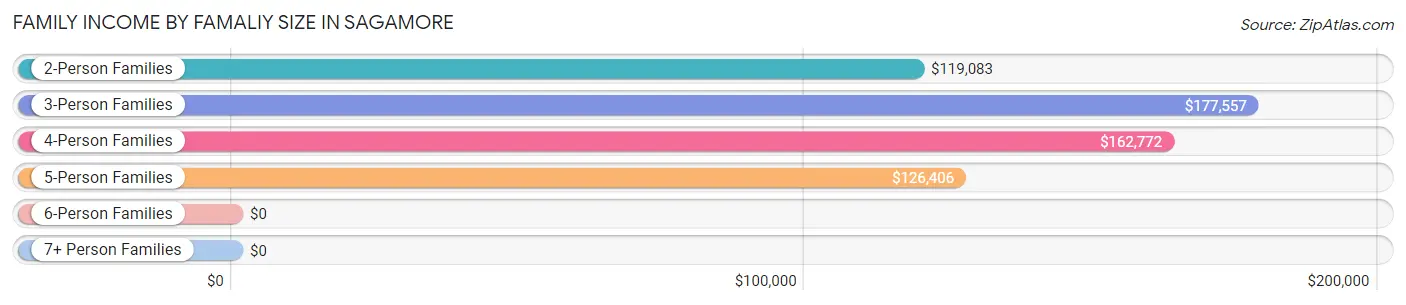
| Income Bracket | # Families | Median Income |
| 2-Person Families | 729 (62.2%) | $119,083 |
| 3-Person Families | 160 (13.7%) | $177,557 |
| 4-Person Families | 181 (15.4%) | $162,772 |
| 5-Person Families | 78 (6.7%) | $126,406 |
| 6-Person Families | 24 (2.1%) | $0 |
| 7+ Person Families | 0 (0.0%) | $0 |
| Total | 1,172 (100.0%) | $145,357 |
Family Income by Number of Earners in Sagamore
The median family income in Sagamore is $145,357, with families comprising 2 earners (567) having the highest median family income of $167,574, while families with 1 earner (307) have the lowest median family income of $59,107, accounting for 48.4% and 26.2% of families, respectively.
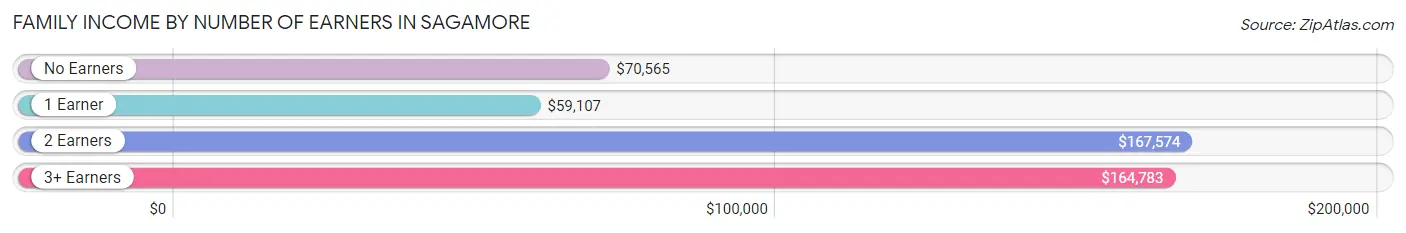
| Number of Earners | # Families | Median Income |
| No Earners | 88 (7.5%) | $70,565 |
| 1 Earner | 307 (26.2%) | $59,107 |
| 2 Earners | 567 (48.4%) | $167,574 |
| 3+ Earners | 210 (17.9%) | $164,783 |
| Total | 1,172 (100.0%) | $145,357 |
Household Income in Sagamore
Household Income Brackets in Sagamore
With 329 households falling in the category, the $150,000 to $199,999 income range is the most frequent in Sagamore, accounting for 21.1% of all households.
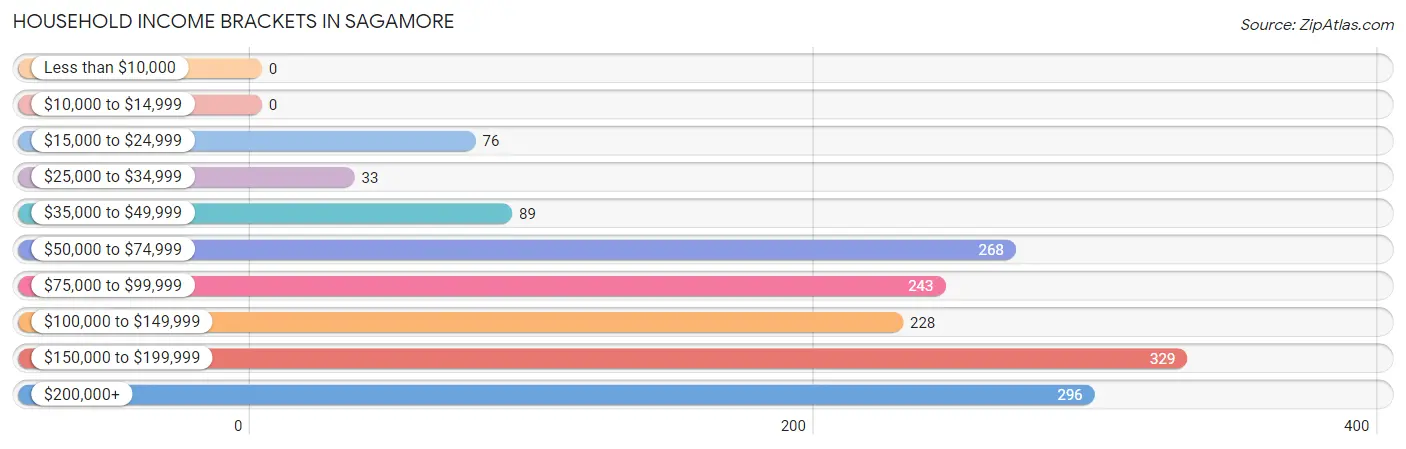
| Income Bracket | # Households | % Households |
| Less than $10,000 | 0 | 0.0% |
| $10,000 to $14,999 | 0 | 0.0% |
| $15,000 to $24,999 | 76 | 4.9% |
| $25,000 to $34,999 | 33 | 2.1% |
| $35,000 to $49,999 | 89 | 5.7% |
| $50,000 to $74,999 | 268 | 17.2% |
| $75,000 to $99,999 | 243 | 15.6% |
| $100,000 to $149,999 | 228 | 14.6% |
| $150,000 to $199,999 | 329 | 21.1% |
| $200,000+ | 296 | 19.0% |
Household Income by Householder Age in Sagamore
The median household income in Sagamore is $113,289, with the highest median household income of $136,369 found in the 45 to 64 years age bracket for the primary householder. A total of 735 households (47.1%) fall into this category. Meanwhile, the 15 to 24 years age bracket for the primary householder has the lowest median household income of $0, with 13 households (0.8%) in this group.
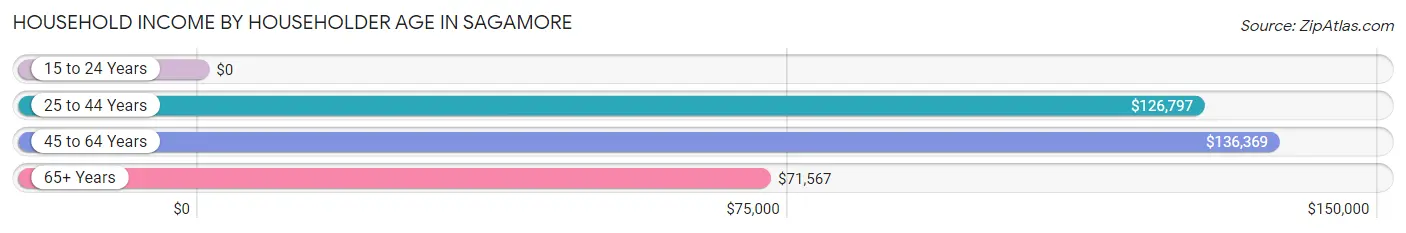
| Income Bracket | # Households | Median Income |
| 15 to 24 Years | 13 (0.8%) | $0 |
| 25 to 44 Years | 403 (25.8%) | $126,797 |
| 45 to 64 Years | 735 (47.1%) | $136,369 |
| 65+ Years | 409 (26.2%) | $71,567 |
| Total | 1,560 (100.0%) | $113,289 |
Poverty in Sagamore
Income Below Poverty by Sex and Age in Sagamore
With 3.0% poverty level for males and 4.0% for females among the residents of Sagamore, 6 to 11 year old males and 15 year old females are the most vulnerable to poverty, with 33 males (26.4%) and 21 females (100.0%) in their respective age groups living below the poverty level.
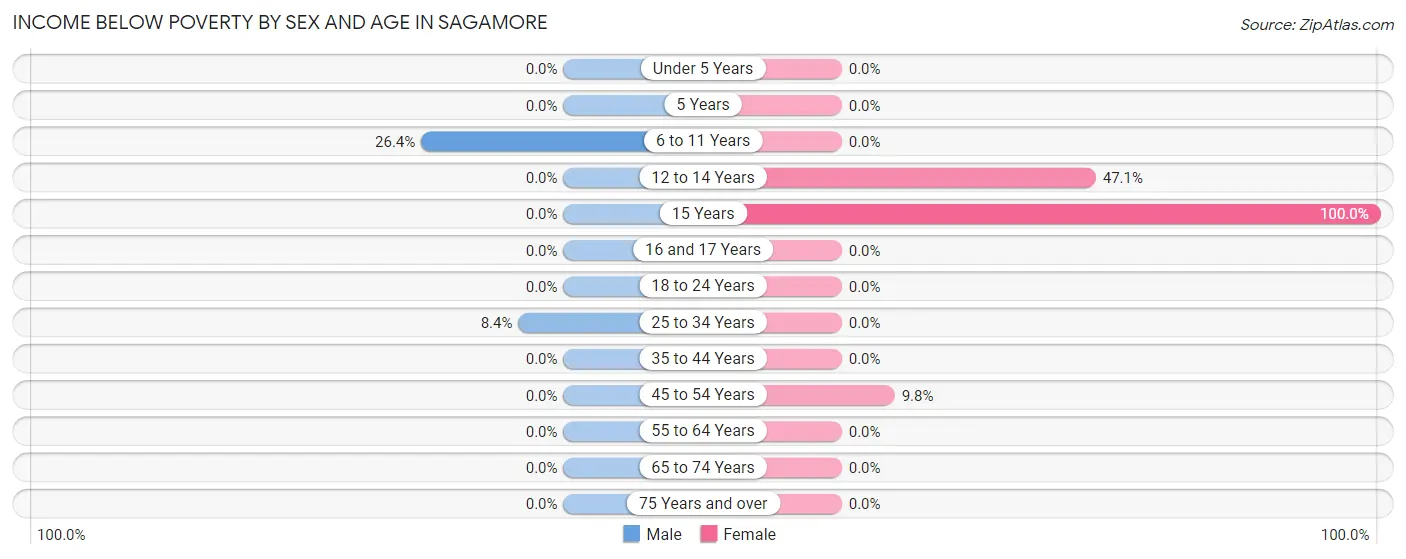
| Age Bracket | Male | Female |
| Under 5 Years | 0 (0.0%) | 0 (0.0%) |
| 5 Years | 0 (0.0%) | 0 (0.0%) |
| 6 to 11 Years | 33 (26.4%) | 0 (0.0%) |
| 12 to 14 Years | 0 (0.0%) | 33 (47.1%) |
| 15 Years | 0 (0.0%) | 21 (100.0%) |
| 16 and 17 Years | 0 (0.0%) | 0 (0.0%) |
| 18 to 24 Years | 0 (0.0%) | 0 (0.0%) |
| 25 to 34 Years | 22 (8.4%) | 0 (0.0%) |
| 35 to 44 Years | 0 (0.0%) | 0 (0.0%) |
| 45 to 54 Years | 0 (0.0%) | 32 (9.8%) |
| 55 to 64 Years | 0 (0.0%) | 0 (0.0%) |
| 65 to 74 Years | 0 (0.0%) | 0 (0.0%) |
| 75 Years and over | 0 (0.0%) | 0 (0.0%) |
| Total | 55 (3.0%) | 86 (4.0%) |
Income Above Poverty by Sex and Age in Sagamore
According to the poverty statistics in Sagamore, males aged 5 years and females aged under 5 years are the age groups that are most secure financially, with 100.0% of males and 100.0% of females in these age groups living above the poverty line.
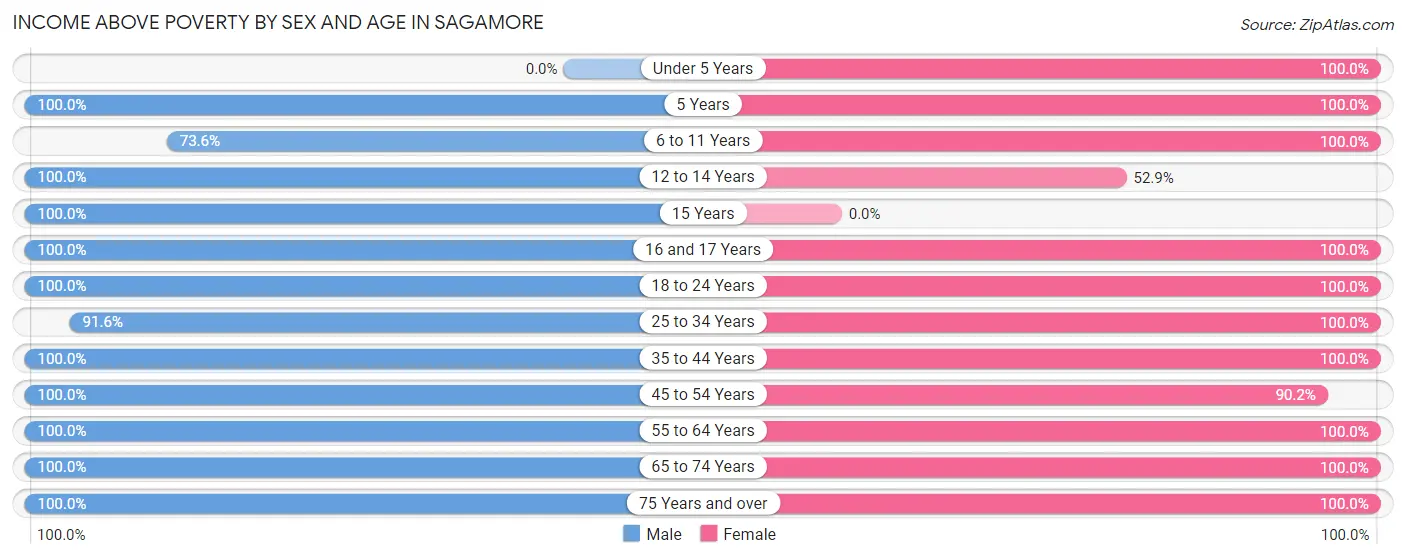
| Age Bracket | Male | Female |
| Under 5 Years | 0 (0.0%) | 95 (100.0%) |
| 5 Years | 45 (100.0%) | 26 (100.0%) |
| 6 to 11 Years | 92 (73.6%) | 103 (100.0%) |
| 12 to 14 Years | 44 (100.0%) | 37 (52.9%) |
| 15 Years | 42 (100.0%) | 0 (0.0%) |
| 16 and 17 Years | 91 (100.0%) | 84 (100.0%) |
| 18 to 24 Years | 219 (100.0%) | 113 (100.0%) |
| 25 to 34 Years | 241 (91.6%) | 283 (100.0%) |
| 35 to 44 Years | 77 (100.0%) | 224 (100.0%) |
| 45 to 54 Years | 264 (100.0%) | 294 (90.2%) |
| 55 to 64 Years | 331 (100.0%) | 429 (100.0%) |
| 65 to 74 Years | 228 (100.0%) | 226 (100.0%) |
| 75 Years and over | 85 (100.0%) | 127 (100.0%) |
| Total | 1,759 (97.0%) | 2,041 (96.0%) |
Income Below Poverty Among Married-Couple Families in Sagamore
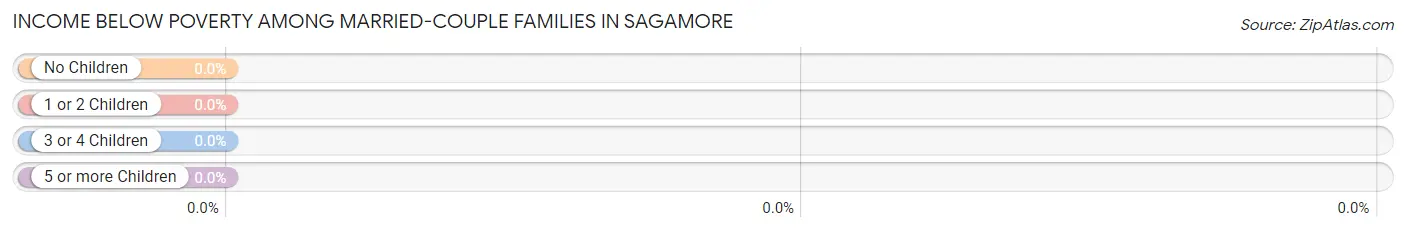
| Children | Above Poverty | Below Poverty |
| No Children | 607 (100.0%) | 0 (0.0%) |
| 1 or 2 Children | 243 (100.0%) | 0 (0.0%) |
| 3 or 4 Children | 24 (100.0%) | 0 (0.0%) |
| 5 or more Children | 0 (0.0%) | 0 (0.0%) |
| Total | 874 (100.0%) | 0 (0.0%) |
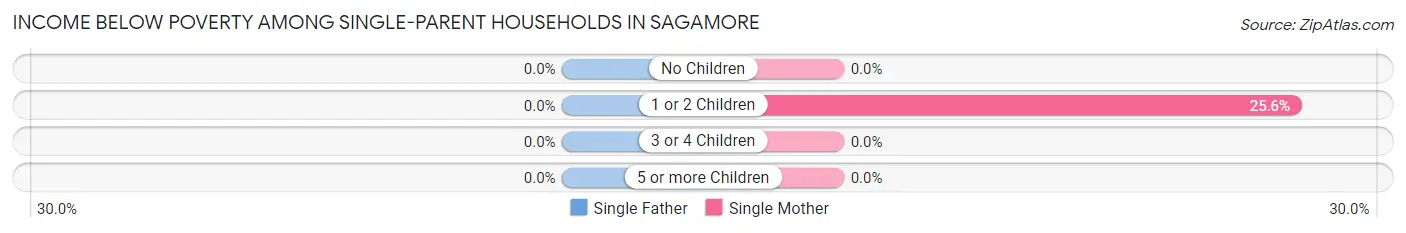
Income Below Poverty Among Single-Parent Households in Sagamore
| Children | Single Father | Single Mother |
| No Children | 0 (0.0%) | 0 (0.0%) |
| 1 or 2 Children | 0 (0.0%) | 32 (25.6%) |
| 3 or 4 Children | 0 (0.0%) | 0 (0.0%) |
| 5 or more Children | 0 (0.0%) | 0 (0.0%) |
| Total | 0 (0.0%) | 32 (13.3%) |
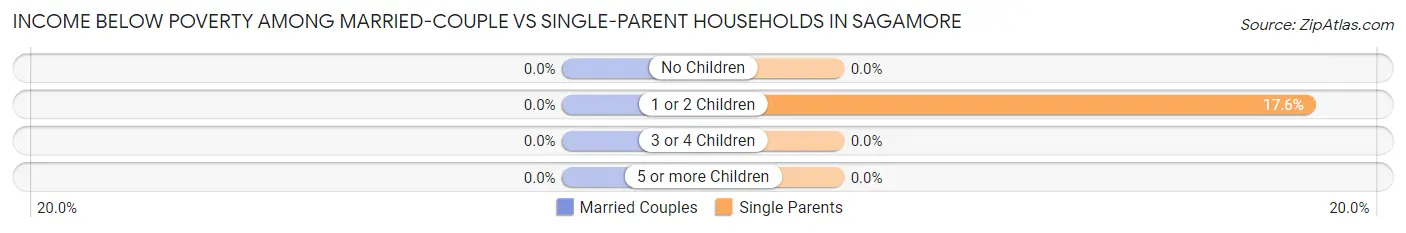
Income Below Poverty Among Married-Couple vs Single-Parent Households in Sagamore
| Children | Married-Couple Families | Single-Parent Households |
| No Children | 0 (0.0%) | 0 (0.0%) |
| 1 or 2 Children | 0 (0.0%) | 32 (17.6%) |
| 3 or 4 Children | 0 (0.0%) | 0 (0.0%) |
| 5 or more Children | 0 (0.0%) | 0 (0.0%) |
| Total | 0 (0.0%) | 32 (10.7%) |
Race in Sagamore
The most populous races in Sagamore are White / Caucasian (3,693 | 93.1%), Asian (207 | 5.2%), and Two or more Races (66 | 1.7%).
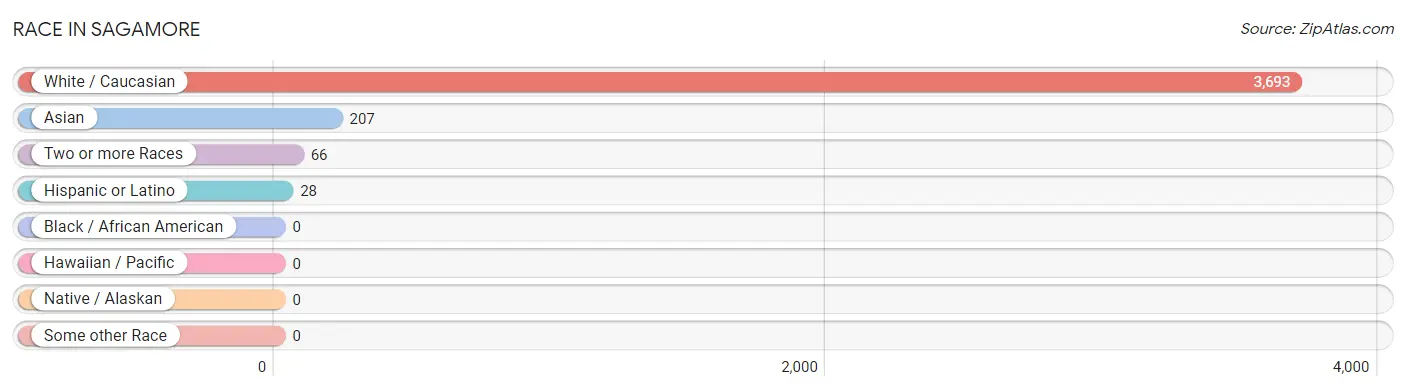
| Race | # Population | % Population |
| Asian | 207 | 5.2% |
| Black / African American | 0 | 0.0% |
| Hawaiian / Pacific | 0 | 0.0% |
| Hispanic or Latino | 28 | 0.7% |
| Native / Alaskan | 0 | 0.0% |
| White / Caucasian | 3,693 | 93.1% |
| Two or more Races | 66 | 1.7% |
| Some other Race | 0 | 0.0% |
| Total | 3,966 | 100.0% |
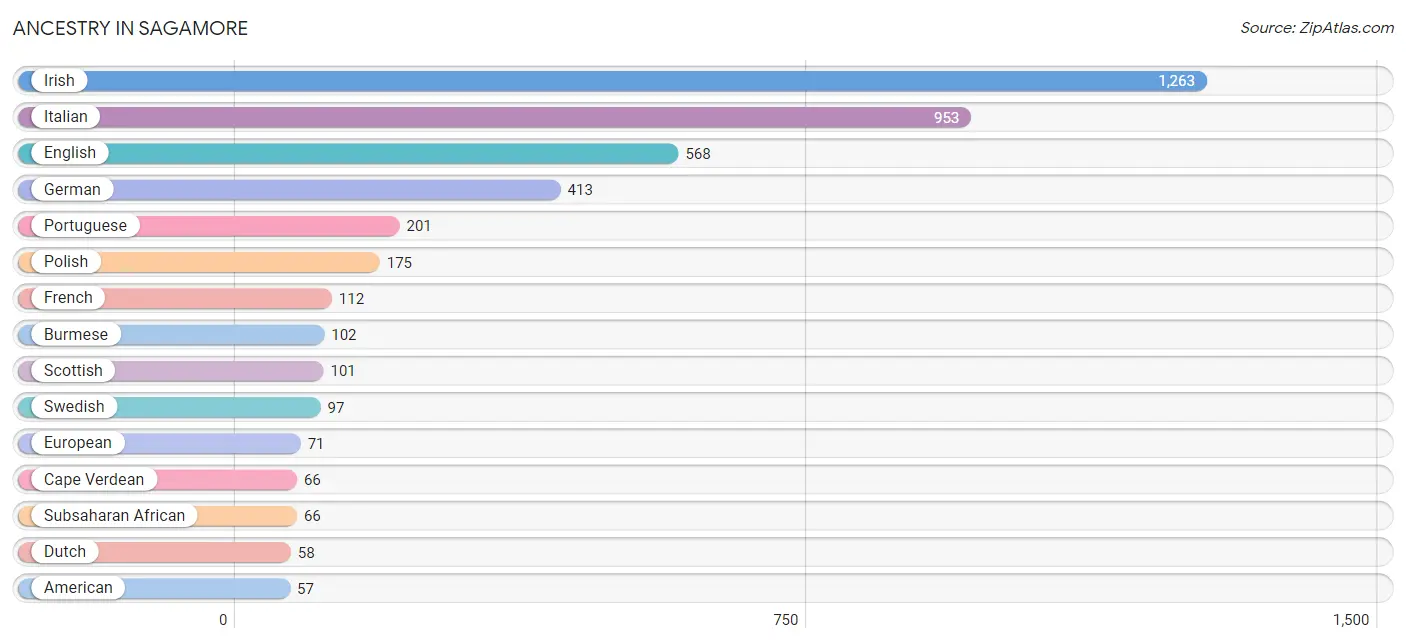
Ancestry in Sagamore
The most populous ancestries reported in Sagamore are Irish (1,263 | 31.9%), Italian (953 | 24.0%), English (568 | 14.3%), German (413 | 10.4%), and Portuguese (201 | 5.1%), together accounting for 85.7% of all Sagamore residents.
| Ancestry | # Population | % Population |
| Albanian | 42 | 1.1% |
| American | 57 | 1.4% |
| Arab | 29 | 0.7% |
| Bhutanese | 51 | 1.3% |
| British | 9 | 0.2% |
| Bulgarian | 23 | 0.6% |
| Burmese | 102 | 2.6% |
| Cape Verdean | 66 | 1.7% |
| Croatian | 21 | 0.5% |
| Czech | 43 | 1.1% |
| Dutch | 58 | 1.5% |
| Eastern European | 10 | 0.3% |
| English | 568 | 14.3% |
| European | 71 | 1.8% |
| French | 112 | 2.8% |
| French Canadian | 18 | 0.4% |
| German | 413 | 10.4% |
| Greek | 43 | 1.1% |
| Hungarian | 10 | 0.3% |
| Irish | 1,263 | 31.9% |
| Italian | 953 | 24.0% |
| Lebanese | 29 | 0.7% |
| Lithuanian | 34 | 0.9% |
| Norwegian | 9 | 0.2% |
| Polish | 175 | 4.4% |
| Portuguese | 201 | 5.1% |
| Romanian | 9 | 0.2% |
| Russian | 32 | 0.8% |
| Scandinavian | 16 | 0.4% |
| Scottish | 101 | 2.5% |
| Slavic | 23 | 0.6% |
| Subsaharan African | 66 | 1.7% |
| Swedish | 97 | 2.5% |
| Welsh | 42 | 1.1% | View All 34 Rows |
Immigrants in Sagamore
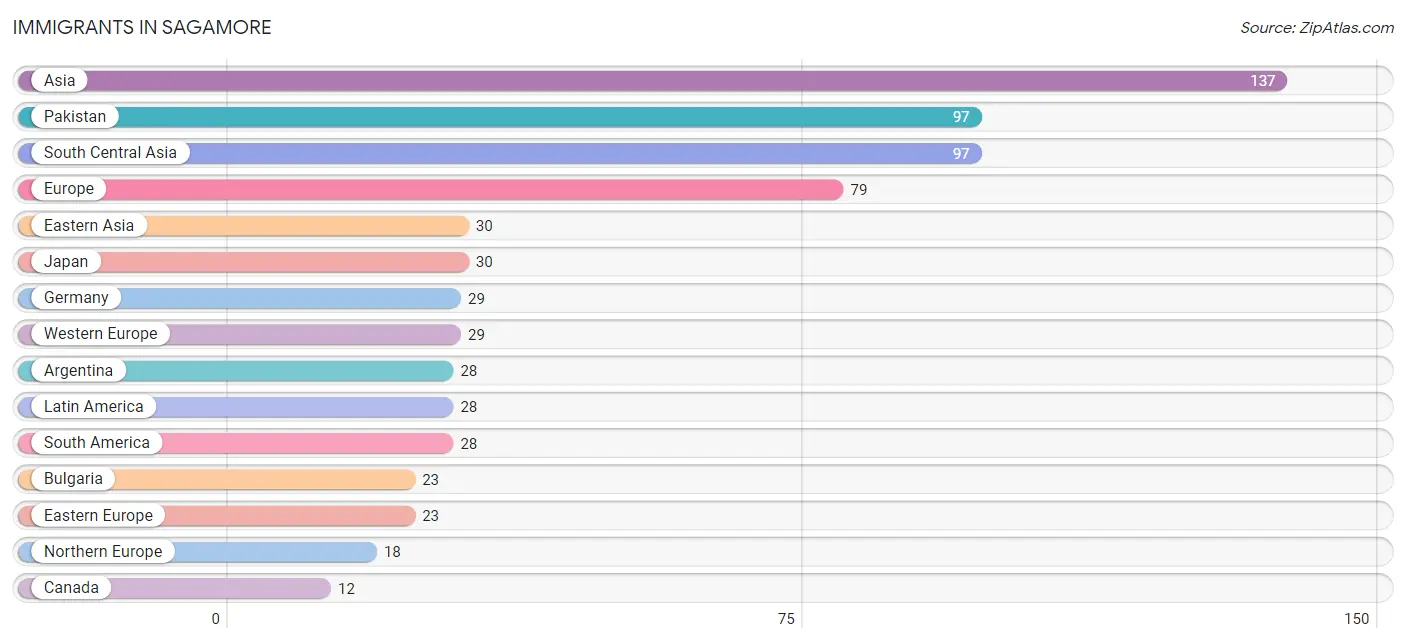
The most numerous immigrant groups reported in Sagamore came from Asia (137 | 3.5%), Pakistan (97 | 2.5%), South Central Asia (97 | 2.5%), Europe (79 | 2.0%), and Eastern Asia (30 | 0.8%), together accounting for 11.1% of all Sagamore residents.
| Immigration Origin | # Population | % Population |
| Argentina | 28 | 0.7% |
| Asia | 137 | 3.5% |
| Bulgaria | 23 | 0.6% |
| Canada | 12 | 0.3% |
| Eastern Asia | 30 | 0.8% |
| Eastern Europe | 23 | 0.6% |
| Europe | 79 | 2.0% |
| Germany | 29 | 0.7% |
| Japan | 30 | 0.8% |
| Latin America | 28 | 0.7% |
| Lebanon | 10 | 0.3% |
| Northern Europe | 18 | 0.4% |
| Pakistan | 97 | 2.5% |
| Portugal | 9 | 0.2% |
| Scotland | 9 | 0.2% |
| South America | 28 | 0.7% |
| South Central Asia | 97 | 2.5% |
| Southern Europe | 9 | 0.2% |
| Western Asia | 10 | 0.3% |
| Western Europe | 29 | 0.7% | View All 20 Rows |
Sex and Age in Sagamore
Sex and Age in Sagamore
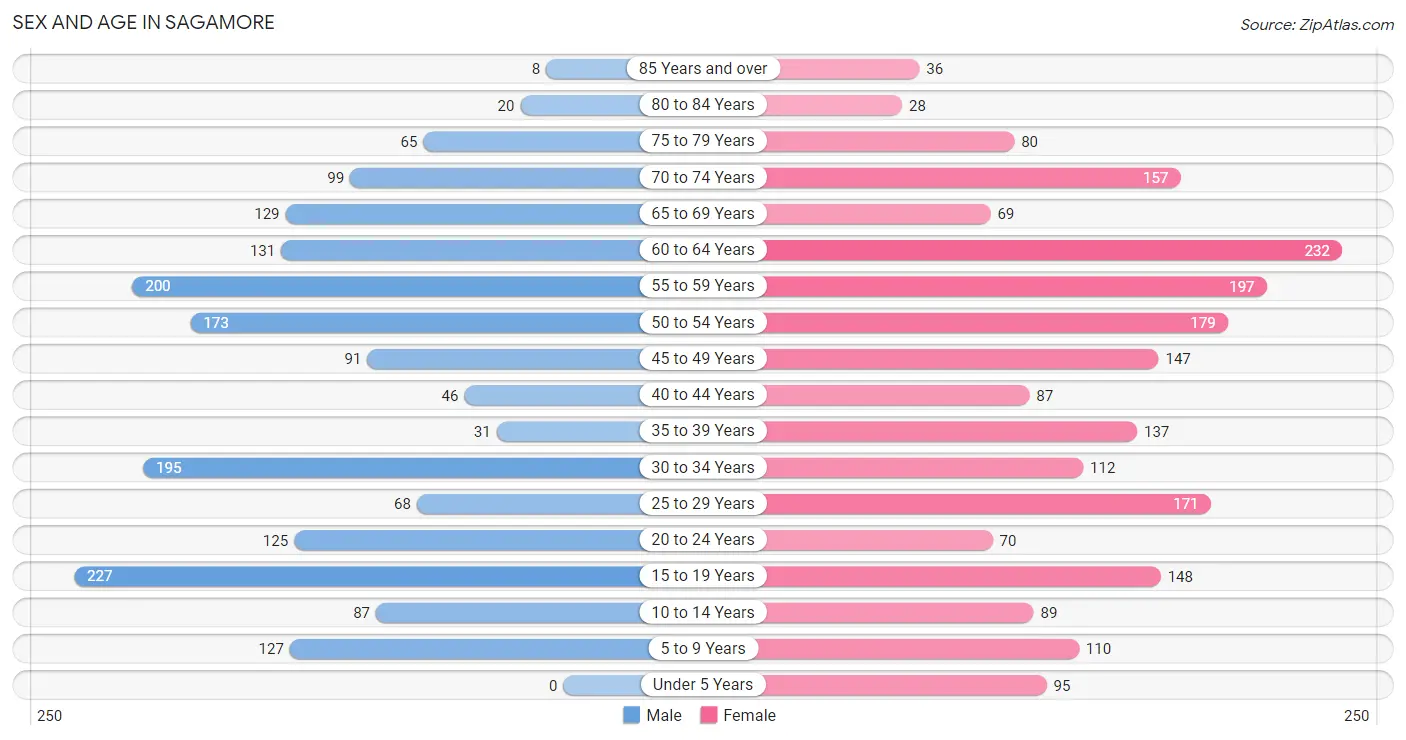
The most populous age groups in Sagamore are 15 to 19 Years (227 | 12.5%) for men and 60 to 64 Years (232 | 10.8%) for women.
| Age Bracket | Male | Female |
| Under 5 Years | 0 (0.0%) | 95 (4.4%) |
| 5 to 9 Years | 127 (7.0%) | 110 (5.1%) |
| 10 to 14 Years | 87 (4.8%) | 89 (4.2%) |
| 15 to 19 Years | 227 (12.5%) | 148 (6.9%) |
| 20 to 24 Years | 125 (6.9%) | 70 (3.3%) |
| 25 to 29 Years | 68 (3.7%) | 171 (8.0%) |
| 30 to 34 Years | 195 (10.7%) | 112 (5.2%) |
| 35 to 39 Years | 31 (1.7%) | 137 (6.4%) |
| 40 to 44 Years | 46 (2.5%) | 87 (4.1%) |
| 45 to 49 Years | 91 (5.0%) | 147 (6.9%) |
| 50 to 54 Years | 173 (9.5%) | 179 (8.4%) |
| 55 to 59 Years | 200 (11.0%) | 197 (9.2%) |
| 60 to 64 Years | 131 (7.2%) | 232 (10.8%) |
| 65 to 69 Years | 129 (7.1%) | 69 (3.2%) |
| 70 to 74 Years | 99 (5.4%) | 157 (7.3%) |
| 75 to 79 Years | 65 (3.6%) | 80 (3.7%) |
| 80 to 84 Years | 20 (1.1%) | 28 (1.3%) |
| 85 Years and over | 8 (0.4%) | 36 (1.7%) |
| Total | 1,822 (100.0%) | 2,144 (100.0%) |
Families and Households in Sagamore
Median Family Size in Sagamore
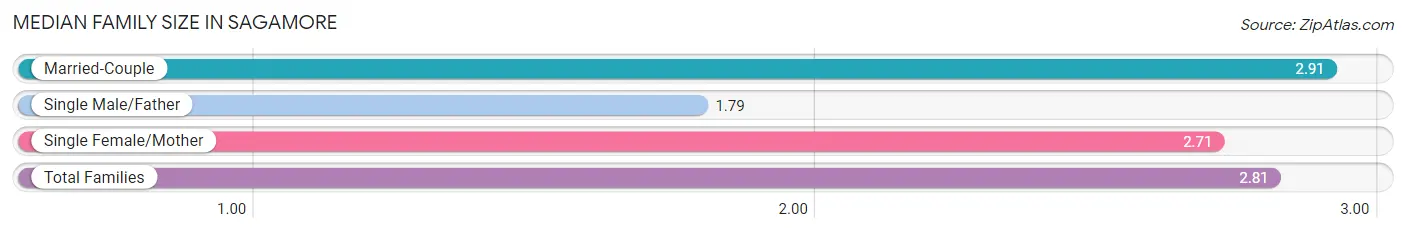
The median family size in Sagamore is 2.81 persons per family, with married-couple families (874 | 74.6%) accounting for the largest median family size of 2.91 persons per family. On the other hand, single male/father families (57 | 4.9%) represent the smallest median family size with 1.79 persons per family.
| Family Type | # Families | Family Size |
| Married-Couple | 874 (74.6%) | 2.91 |
| Single Male/Father | 57 (4.9%) | 1.79 |
| Single Female/Mother | 241 (20.6%) | 2.71 |
| Total Families | 1,172 (100.0%) | 2.81 |
Median Household Size in Sagamore
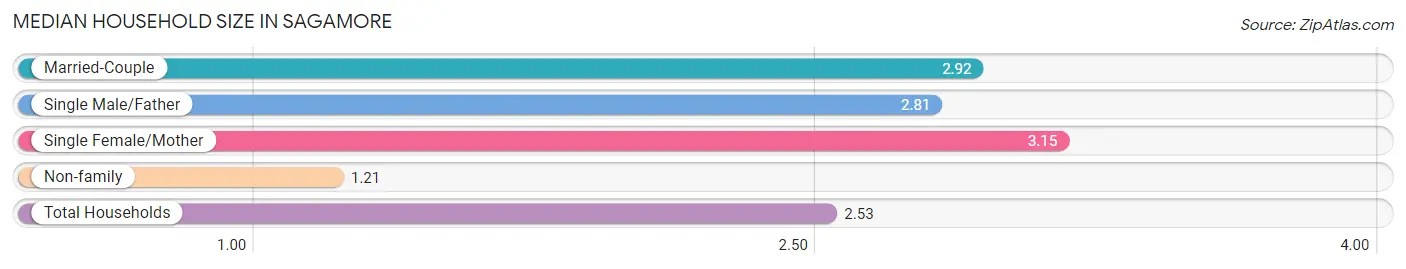
The median household size in Sagamore is 2.53 persons per household, with single female/mother households (241 | 15.4%) accounting for the largest median household size of 3.15 persons per household. non-family households (388 | 24.9%) represent the smallest median household size with 1.21 persons per household.
| Household Type | # Households | Household Size |
| Married-Couple | 874 (56.0%) | 2.92 |
| Single Male/Father | 57 (3.6%) | 2.81 |
| Single Female/Mother | 241 (15.4%) | 3.15 |
| Non-family | 388 (24.9%) | 1.21 |
| Total Households | 1,560 (100.0%) | 2.53 |
Household Size by Marriage Status in Sagamore
Out of a total of 1,560 households in Sagamore, 1,172 (75.1%) are family households, while 388 (24.9%) are nonfamily households. The most numerous type of family households are 2-person households, comprising 598, and the most common type of nonfamily households are 1-person households, comprising 341.
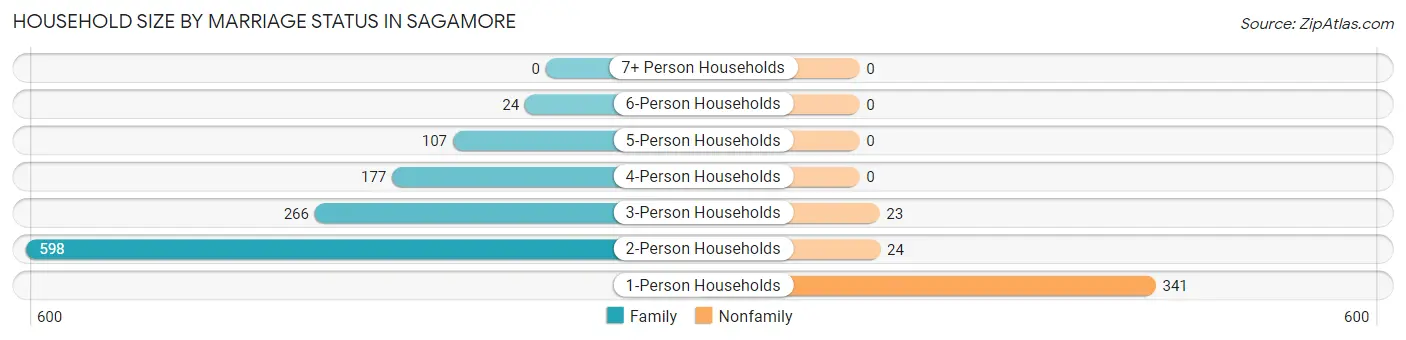
| Household Size | Family Households | Nonfamily Households |
| 1-Person Households | - | 341 (21.9%) |
| 2-Person Households | 598 (38.3%) | 24 (1.5%) |
| 3-Person Households | 266 (17.1%) | 23 (1.5%) |
| 4-Person Households | 177 (11.4%) | 0 (0.0%) |
| 5-Person Households | 107 (6.9%) | 0 (0.0%) |
| 6-Person Households | 24 (1.5%) | 0 (0.0%) |
| 7+ Person Households | 0 (0.0%) | 0 (0.0%) |
| Total | 1,172 (75.1%) | 388 (24.9%) |
Female Fertility in Sagamore
Fertility by Age in Sagamore
| Age Bracket | Women with Births | Births / 1,000 Women |
| 15 to 19 years | 0 (0.0%) | 0.0 |
| 20 to 34 years | 0 (0.0%) | 0.0 |
| 35 to 50 years | 0 (0.0%) | 0.0 |
| Total | 0 (0.0%) | 0.0 |
Fertility by Age by Marriage Status in Sagamore
| Age Bracket | Married | Unmarried |
| 15 to 19 years | 0 (0.0%) | 0 (0.0%) |
| 20 to 34 years | 0 (0.0%) | 0 (0.0%) |
| 35 to 50 years | 0 (0.0%) | 0 (0.0%) |
| Total | 0 (0.0%) | 0 (0.0%) |
Fertility by Education in Sagamore
| Educational Attainment | Women with Births | Births / 1,000 Women |
| Less than High School | 0 (0.0%) | 0.0 |
| High School Diploma | 0 (0.0%) | 0.0 |
| College or Associate's Degree | 0 (0.0%) | 0.0 |
| Bachelor's Degree | 0 (0.0%) | 0.0 |
| Graduate Degree | 0 (0.0%) | 0.0 |
| Total | 0 (0.0%) | 0.0 |
Fertility by Education by Marriage Status in Sagamore
| Educational Attainment | Married | Unmarried |
| Less than High School | 0 (0.0%) | 0 (0.0%) |
| High School Diploma | 0 (0.0%) | 0 (0.0%) |
| College or Associate's Degree | 0 (0.0%) | 0 (0.0%) |
| Bachelor's Degree | 0 (0.0%) | 0 (0.0%) |
| Graduate Degree | 0 (0.0%) | 0 (0.0%) |
| Total | 0 (0.0%) | 0 (0.0%) |
Employment Characteristics in Sagamore
Employment by Class of Employer in Sagamore
Among the 2,565 employed individuals in Sagamore, private company employees (1,799 | 70.1%), self-employed (not incorporated) (292 | 11.4%), and not-for-profit organizations (136 | 5.3%) make up the most common classes of employment.
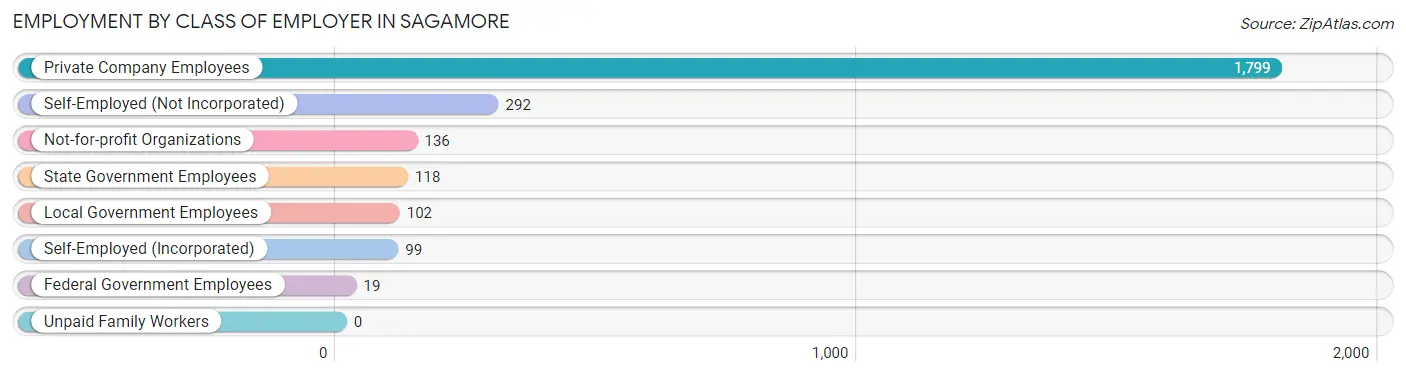
| Employer Class | # Employees | % Employees |
| Private Company Employees | 1,799 | 70.1% |
| Self-Employed (Incorporated) | 99 | 3.9% |
| Self-Employed (Not Incorporated) | 292 | 11.4% |
| Not-for-profit Organizations | 136 | 5.3% |
| Local Government Employees | 102 | 4.0% |
| State Government Employees | 118 | 4.6% |
| Federal Government Employees | 19 | 0.7% |
| Unpaid Family Workers | 0 | 0.0% |
| Total | 2,565 | 100.0% |
Employment Status by Age in Sagamore
According to the labor force statistics for Sagamore, out of the total population over 16 years of age (3,395), 78.6% or 2,668 individuals are in the labor force, with 3.0% or 80 of them unemployed. The age group with the highest labor force participation rate is 25 to 29 years, with 100.0% or 239 individuals in the labor force. Within the labor force, the 16 to 19 years age range has the highest percentage of unemployed individuals, with 25.7% or 46 of them being unemployed.
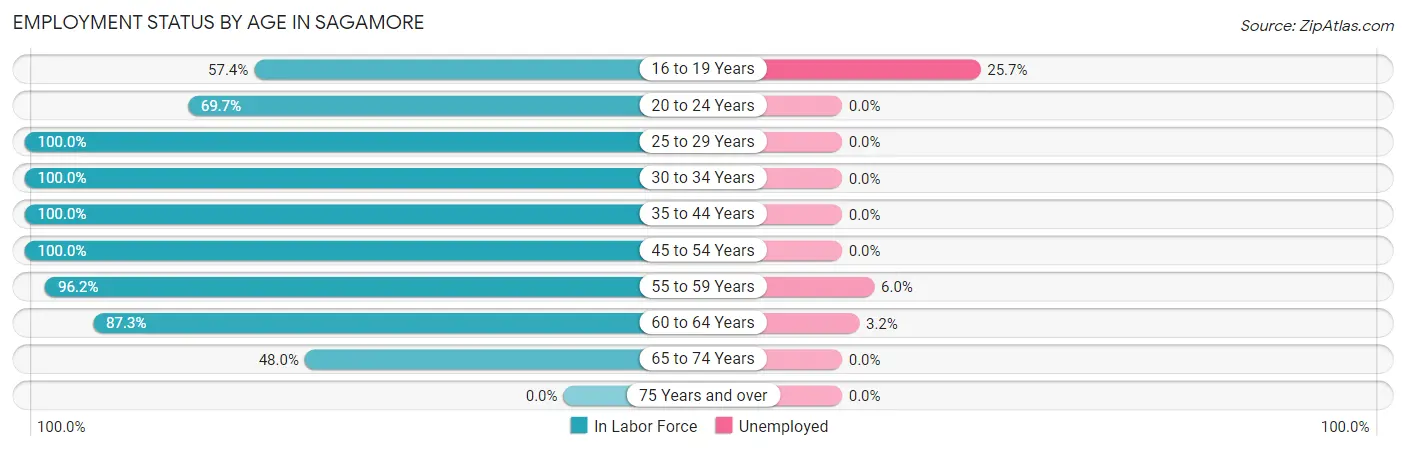
| Age Bracket | In Labor Force | Unemployed |
| 16 to 19 Years | 179 (57.4%) | 46 (25.7%) |
| 20 to 24 Years | 136 (69.7%) | 0 (0.0%) |
| 25 to 29 Years | 239 (100.0%) | 0 (0.0%) |
| 30 to 34 Years | 307 (100.0%) | 0 (0.0%) |
| 35 to 44 Years | 301 (100.0%) | 0 (0.0%) |
| 45 to 54 Years | 590 (100.0%) | 0 (0.0%) |
| 55 to 59 Years | 382 (96.2%) | 23 (6.0%) |
| 60 to 64 Years | 317 (87.3%) | 10 (3.2%) |
| 65 to 74 Years | 218 (48.0%) | 0 (0.0%) |
| 75 Years and over | 0 (0.0%) | 0 (0.0%) |
| Total | 2,668 (78.6%) | 80 (3.0%) |
Employment Status by Educational Attainment in Sagamore
According to labor force statistics for Sagamore, 97.2% of individuals (2,135) out of the total population between 25 and 64 years of age (2,197) are in the labor force, with 1.5% or 32 of them being unemployed. The group with the highest labor force participation rate are those with the educational attainment of less than high school, with 100.0% or 26 individuals in the labor force. Within the labor force, individuals with high school diploma education have the highest percentage of unemployment, with 4.3% or 10 of them being unemployed.
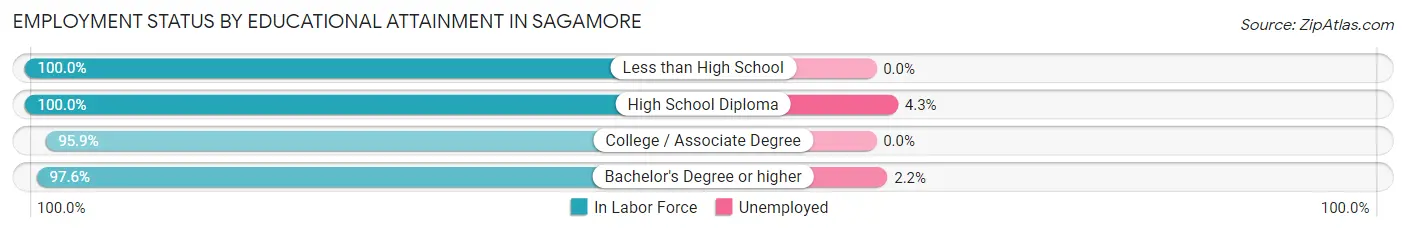
| Educational Attainment | In Labor Force | Unemployed |
| Less than High School | 26 (100.0%) | 0 (0.0%) |
| High School Diploma | 232 (100.0%) | 10 (4.3%) |
| College / Associate Degree | 819 (95.9%) | 0 (0.0%) |
| Bachelor's Degree or higher | 1,059 (97.6%) | 24 (2.2%) |
| Total | 2,135 (97.2%) | 33 (1.5%) |
Employment Occupations by Sex in Sagamore
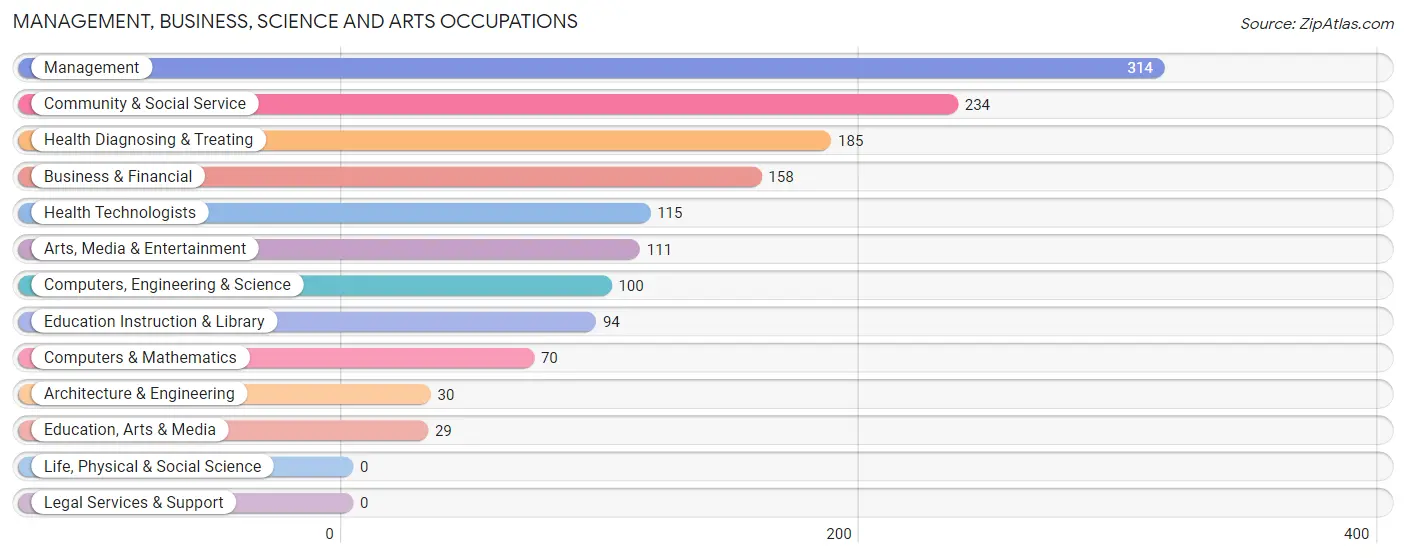
Management, Business, Science and Arts Occupations
The most common Management, Business, Science and Arts occupations in Sagamore are Management (314 | 12.2%), Community & Social Service (234 | 9.1%), Health Diagnosing & Treating (185 | 7.2%), Business & Financial (158 | 6.1%), and Health Technologists (115 | 4.5%).
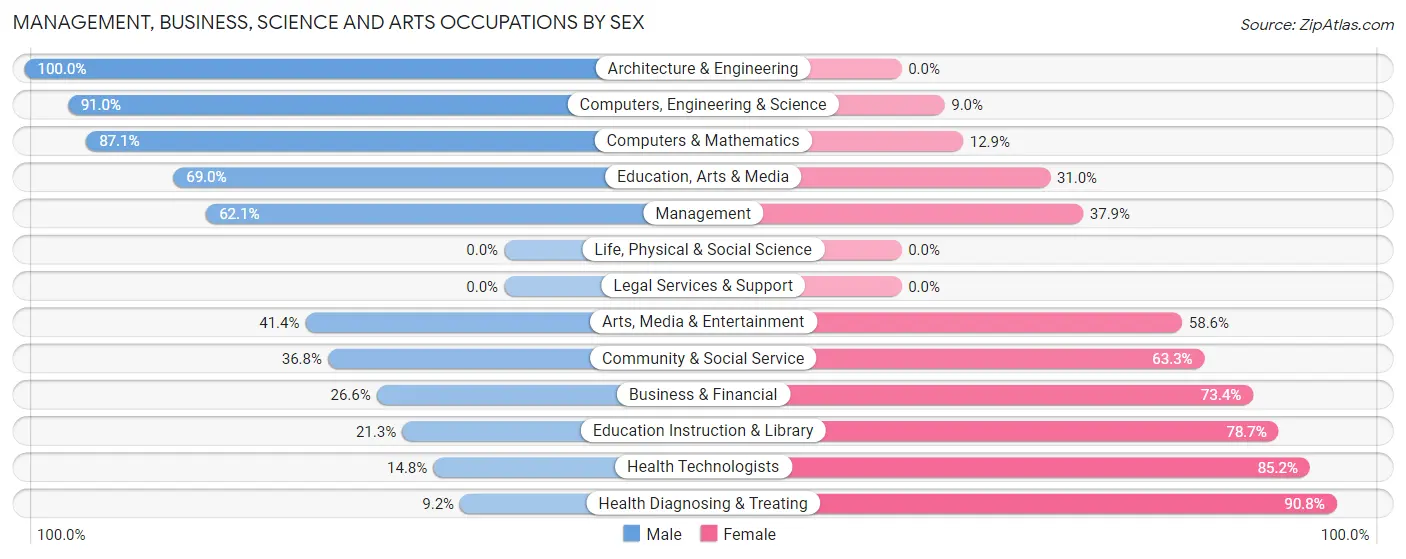
Management, Business, Science and Arts Occupations by Sex
Within the Management, Business, Science and Arts occupations in Sagamore, the most male-oriented occupations are Architecture & Engineering (100.0%), Computers, Engineering & Science (91.0%), and Computers & Mathematics (87.1%), while the most female-oriented occupations are Health Diagnosing & Treating (90.8%), Health Technologists (85.2%), and Education Instruction & Library (78.7%).
| Occupation | Male | Female |
| Management | 195 (62.1%) | 119 (37.9%) |
| Business & Financial | 42 (26.6%) | 116 (73.4%) |
| Computers, Engineering & Science | 91 (91.0%) | 9 (9.0%) |
| Computers & Mathematics | 61 (87.1%) | 9 (12.9%) |
| Architecture & Engineering | 30 (100.0%) | 0 (0.0%) |
| Life, Physical & Social Science | 0 (0.0%) | 0 (0.0%) |
| Community & Social Service | 86 (36.7%) | 148 (63.2%) |
| Education, Arts & Media | 20 (69.0%) | 9 (31.0%) |
| Legal Services & Support | 0 (0.0%) | 0 (0.0%) |
| Education Instruction & Library | 20 (21.3%) | 74 (78.7%) |
| Arts, Media & Entertainment | 46 (41.4%) | 65 (58.6%) |
| Health Diagnosing & Treating | 17 (9.2%) | 168 (90.8%) |
| Health Technologists | 17 (14.8%) | 98 (85.2%) |
| Total (Category) | 431 (43.5%) | 560 (56.5%) |
| Total (Overall) | 1,151 (44.7%) | 1,426 (55.3%) |
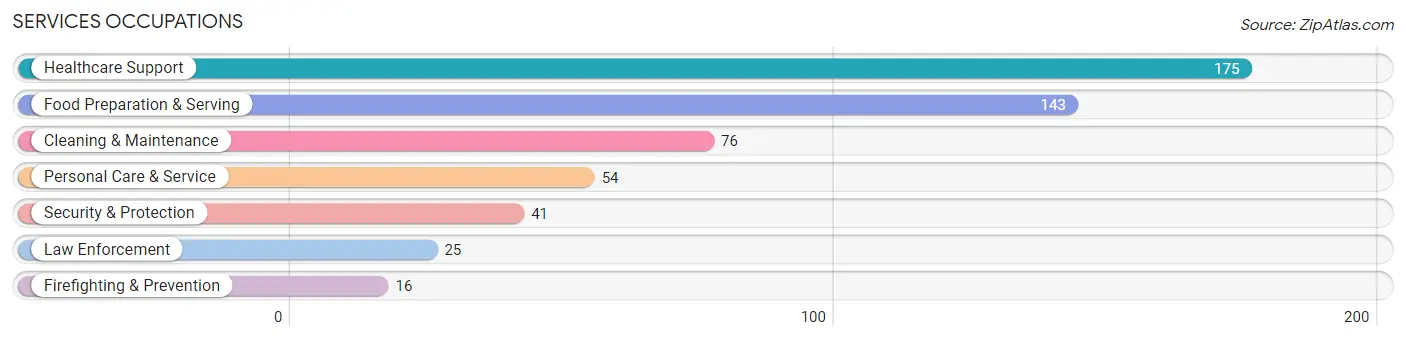
Services Occupations
The most common Services occupations in Sagamore are Healthcare Support (175 | 6.8%), Food Preparation & Serving (143 | 5.6%), Cleaning & Maintenance (76 | 2.9%), Personal Care & Service (54 | 2.1%), and Security & Protection (41 | 1.6%).
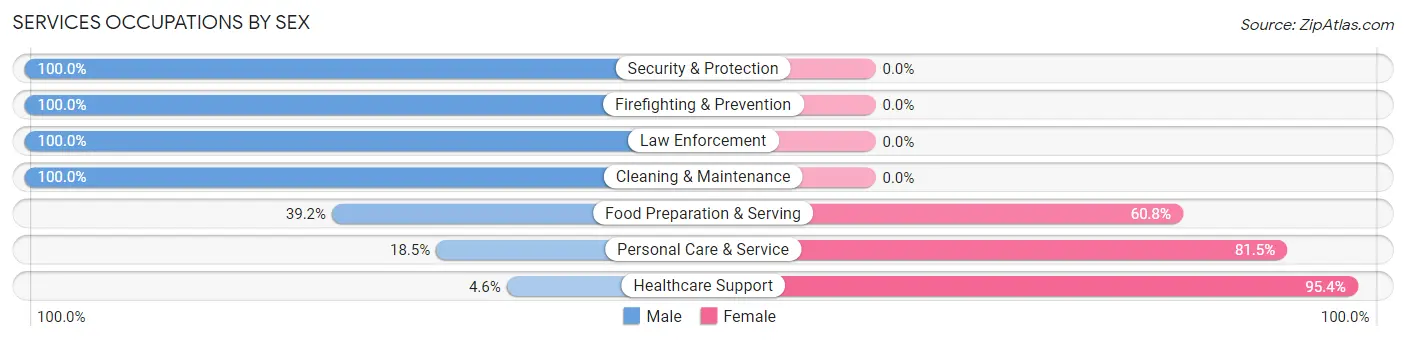
Services Occupations by Sex
Within the Services occupations in Sagamore, the most male-oriented occupations are Security & Protection (100.0%), Firefighting & Prevention (100.0%), and Law Enforcement (100.0%), while the most female-oriented occupations are Healthcare Support (95.4%), Personal Care & Service (81.5%), and Food Preparation & Serving (60.8%).
| Occupation | Male | Female |
| Healthcare Support | 8 (4.6%) | 167 (95.4%) |
| Security & Protection | 41 (100.0%) | 0 (0.0%) |
| Firefighting & Prevention | 16 (100.0%) | 0 (0.0%) |
| Law Enforcement | 25 (100.0%) | 0 (0.0%) |
| Food Preparation & Serving | 56 (39.2%) | 87 (60.8%) |
| Cleaning & Maintenance | 76 (100.0%) | 0 (0.0%) |
| Personal Care & Service | 10 (18.5%) | 44 (81.5%) |
| Total (Category) | 191 (39.1%) | 298 (60.9%) |
| Total (Overall) | 1,151 (44.7%) | 1,426 (55.3%) |
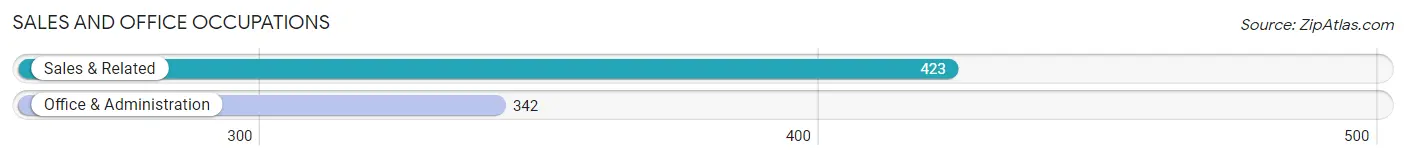
Sales and Office Occupations
The most common Sales and Office occupations in Sagamore are Sales & Related (423 | 16.4%), and Office & Administration (342 | 13.3%).
Sales and Office Occupations by Sex
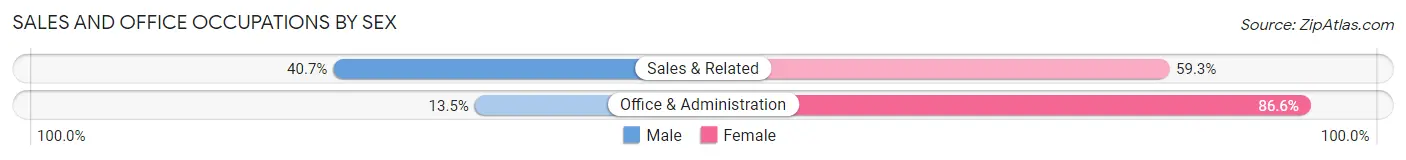
| Occupation | Male | Female |
| Sales & Related | 172 (40.7%) | 251 (59.3%) |
| Office & Administration | 46 (13.5%) | 296 (86.6%) |
| Total (Category) | 218 (28.5%) | 547 (71.5%) |
| Total (Overall) | 1,151 (44.7%) | 1,426 (55.3%) |
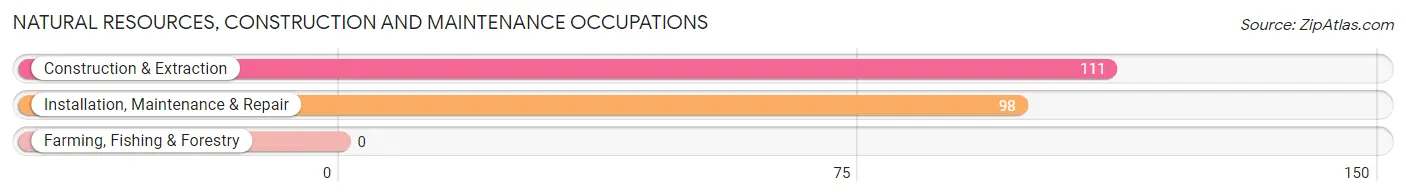
Natural Resources, Construction and Maintenance Occupations
The most common Natural Resources, Construction and Maintenance occupations in Sagamore are Construction & Extraction (111 | 4.3%), and Installation, Maintenance & Repair (98 | 3.8%).
Natural Resources, Construction and Maintenance Occupations by Sex
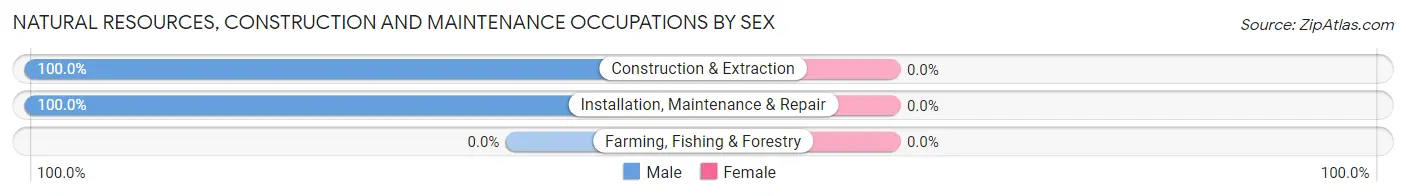
| Occupation | Male | Female |
| Farming, Fishing & Forestry | 0 (0.0%) | 0 (0.0%) |
| Construction & Extraction | 111 (100.0%) | 0 (0.0%) |
| Installation, Maintenance & Repair | 98 (100.0%) | 0 (0.0%) |
| Total (Category) | 209 (100.0%) | 0 (0.0%) |
| Total (Overall) | 1,151 (44.7%) | 1,426 (55.3%) |
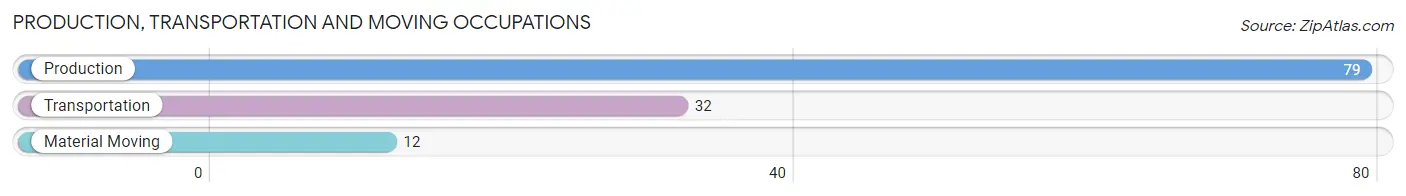
Production, Transportation and Moving Occupations
The most common Production, Transportation and Moving occupations in Sagamore are Production (79 | 3.1%), Transportation (32 | 1.2%), and Material Moving (12 | 0.5%).
Production, Transportation and Moving Occupations by Sex
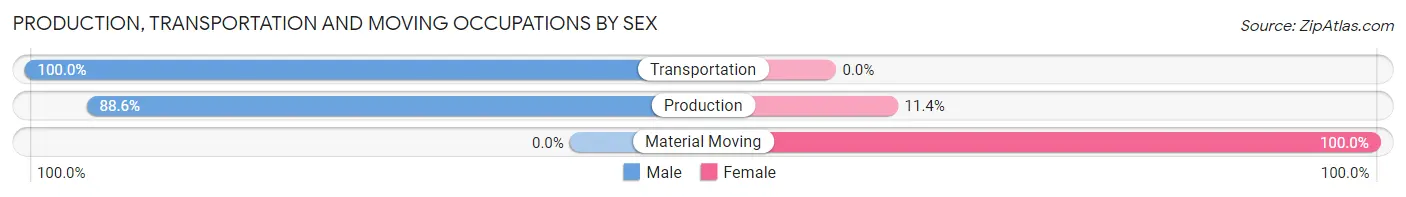
| Occupation | Male | Female |
| Production | 70 (88.6%) | 9 (11.4%) |
| Transportation | 32 (100.0%) | 0 (0.0%) |
| Material Moving | 0 (0.0%) | 12 (100.0%) |
| Total (Category) | 102 (82.9%) | 21 (17.1%) |
| Total (Overall) | 1,151 (44.7%) | 1,426 (55.3%) |
Employment Industries by Sex in Sagamore
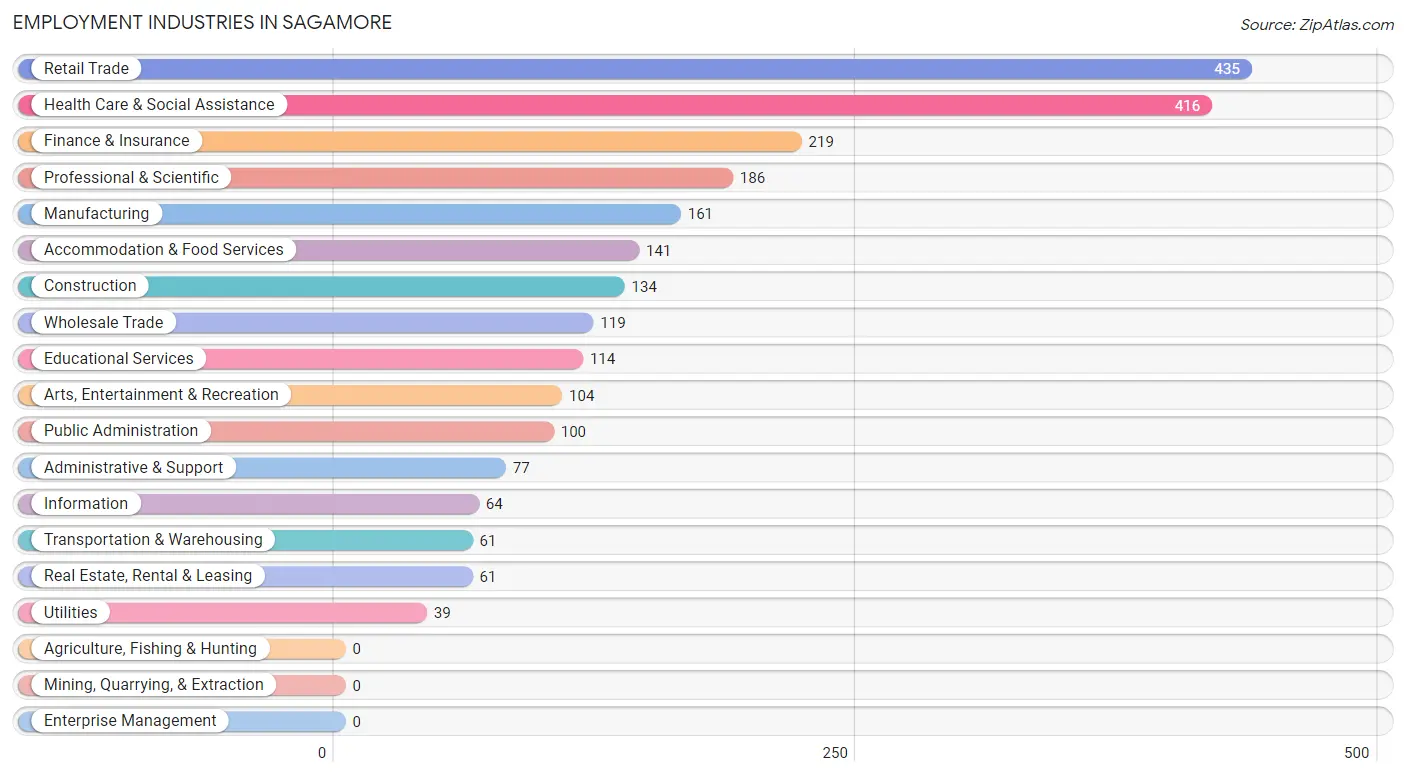
Employment Industries in Sagamore
The major employment industries in Sagamore include Retail Trade (435 | 16.9%), Health Care & Social Assistance (416 | 16.1%), Finance & Insurance (219 | 8.5%), Professional & Scientific (186 | 7.2%), and Manufacturing (161 | 6.2%).
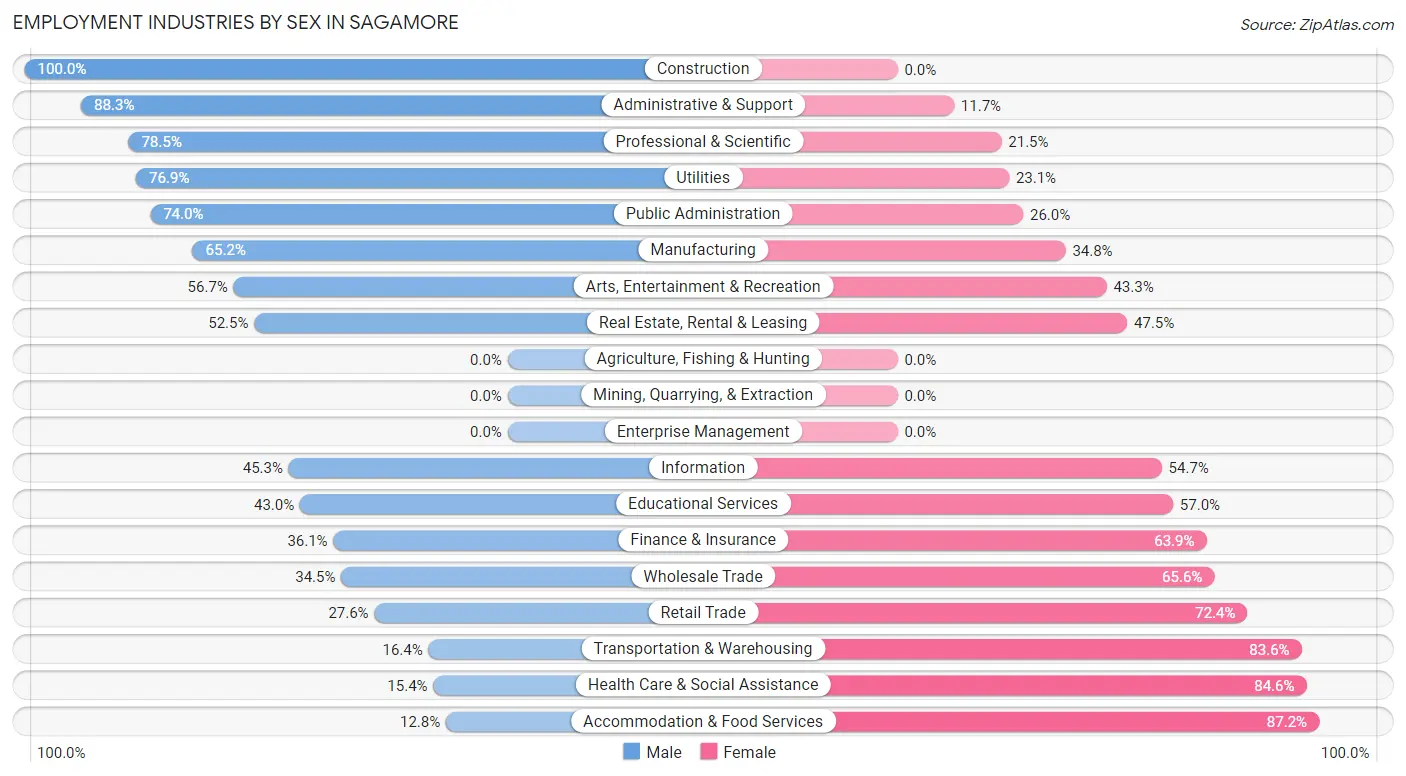
Employment Industries by Sex in Sagamore
The Sagamore industries that see more men than women are Construction (100.0%), Administrative & Support (88.3%), and Professional & Scientific (78.5%), whereas the industries that tend to have a higher number of women are Accommodation & Food Services (87.2%), Health Care & Social Assistance (84.6%), and Transportation & Warehousing (83.6%).
| Industry | Male | Female |
| Agriculture, Fishing & Hunting | 0 (0.0%) | 0 (0.0%) |
| Mining, Quarrying, & Extraction | 0 (0.0%) | 0 (0.0%) |
| Construction | 134 (100.0%) | 0 (0.0%) |
| Manufacturing | 105 (65.2%) | 56 (34.8%) |
| Wholesale Trade | 41 (34.4%) | 78 (65.5%) |
| Retail Trade | 120 (27.6%) | 315 (72.4%) |
| Transportation & Warehousing | 10 (16.4%) | 51 (83.6%) |
| Utilities | 30 (76.9%) | 9 (23.1%) |
| Information | 29 (45.3%) | 35 (54.7%) |
| Finance & Insurance | 79 (36.1%) | 140 (63.9%) |
| Real Estate, Rental & Leasing | 32 (52.5%) | 29 (47.5%) |
| Professional & Scientific | 146 (78.5%) | 40 (21.5%) |
| Enterprise Management | 0 (0.0%) | 0 (0.0%) |
| Administrative & Support | 68 (88.3%) | 9 (11.7%) |
| Educational Services | 49 (43.0%) | 65 (57.0%) |
| Health Care & Social Assistance | 64 (15.4%) | 352 (84.6%) |
| Arts, Entertainment & Recreation | 59 (56.7%) | 45 (43.3%) |
| Accommodation & Food Services | 18 (12.8%) | 123 (87.2%) |
| Public Administration | 74 (74.0%) | 26 (26.0%) |
| Total | 1,151 (44.7%) | 1,426 (55.3%) |
Education in Sagamore
School Enrollment in Sagamore
The most common levels of schooling among the 817 students in Sagamore are high school (247 | 30.2%), college / undergraduate (190 | 23.3%), and middle school (166 | 20.3%).
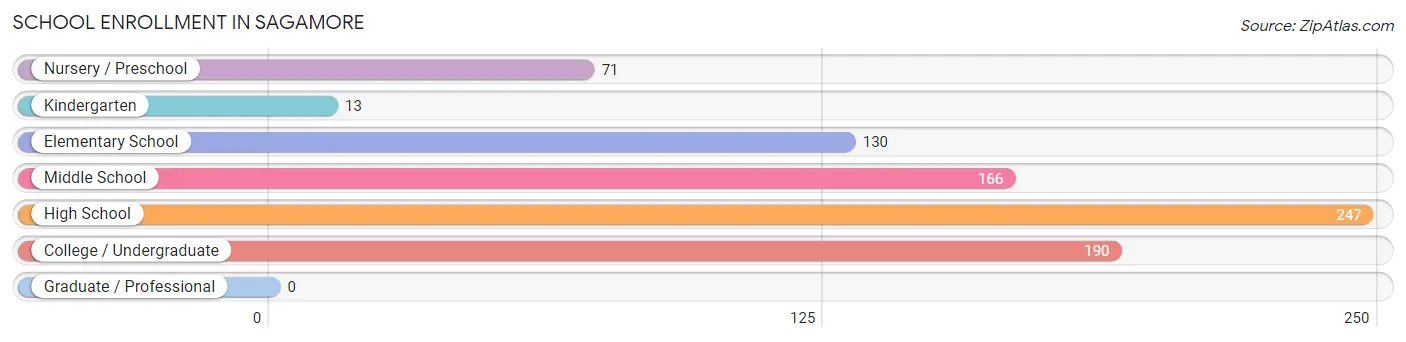
| School Level | # Students | % Students |
| Nursery / Preschool | 71 | 8.7% |
| Kindergarten | 13 | 1.6% |
| Elementary School | 130 | 15.9% |
| Middle School | 166 | 20.3% |
| High School | 247 | 30.2% |
| College / Undergraduate | 190 | 23.3% |
| Graduate / Professional | 0 | 0.0% |
| Total | 817 | 100.0% |
School Enrollment by Age by Funding Source in Sagamore
Out of a total of 817 students who are enrolled in schools in Sagamore, 162 (19.8%) attend a private institution, while the remaining 655 (80.2%) are enrolled in public schools. The age group of 20 to 24 year olds has the highest likelihood of being enrolled in private schools, with 42 (100.0% in the age bracket) enrolled. Conversely, the age group of 15 to 17 year olds has the lowest likelihood of being enrolled in a private school, with 207 (100.0% in the age bracket) attending a public institution.
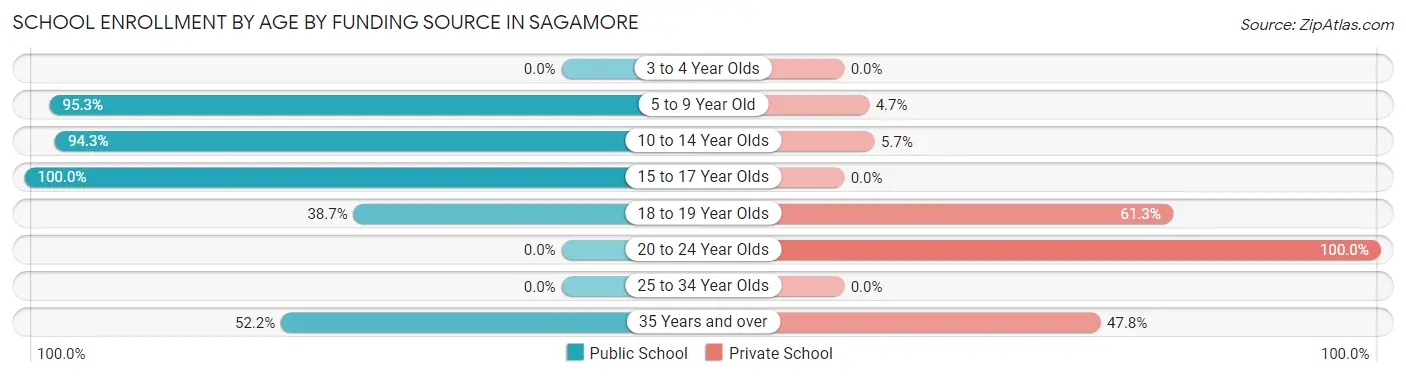
| Age Bracket | Public School | Private School |
| 3 to 4 Year Olds | 0 (0.0%) | 0 (0.0%) |
| 5 to 9 Year Old | 204 (95.3%) | 10 (4.7%) |
| 10 to 14 Year Olds | 166 (94.3%) | 10 (5.7%) |
| 15 to 17 Year Olds | 207 (100.0%) | 0 (0.0%) |
| 18 to 19 Year Olds | 43 (38.7%) | 68 (61.3%) |
| 20 to 24 Year Olds | 0 (0.0%) | 42 (100.0%) |
| 25 to 34 Year Olds | 0 (0.0%) | 0 (0.0%) |
| 35 Years and over | 35 (52.2%) | 32 (47.8%) |
| Total | 655 (80.2%) | 162 (19.8%) |
Educational Attainment by Field of Study in Sagamore
Education (255 | 17.0%), business (236 | 15.7%), science & technology (139 | 9.3%), arts & humanities (125 | 8.3%), and literature & languages (120 | 8.0%) are the most common fields of study among 1,500 individuals in Sagamore who have obtained a bachelor's degree or higher.
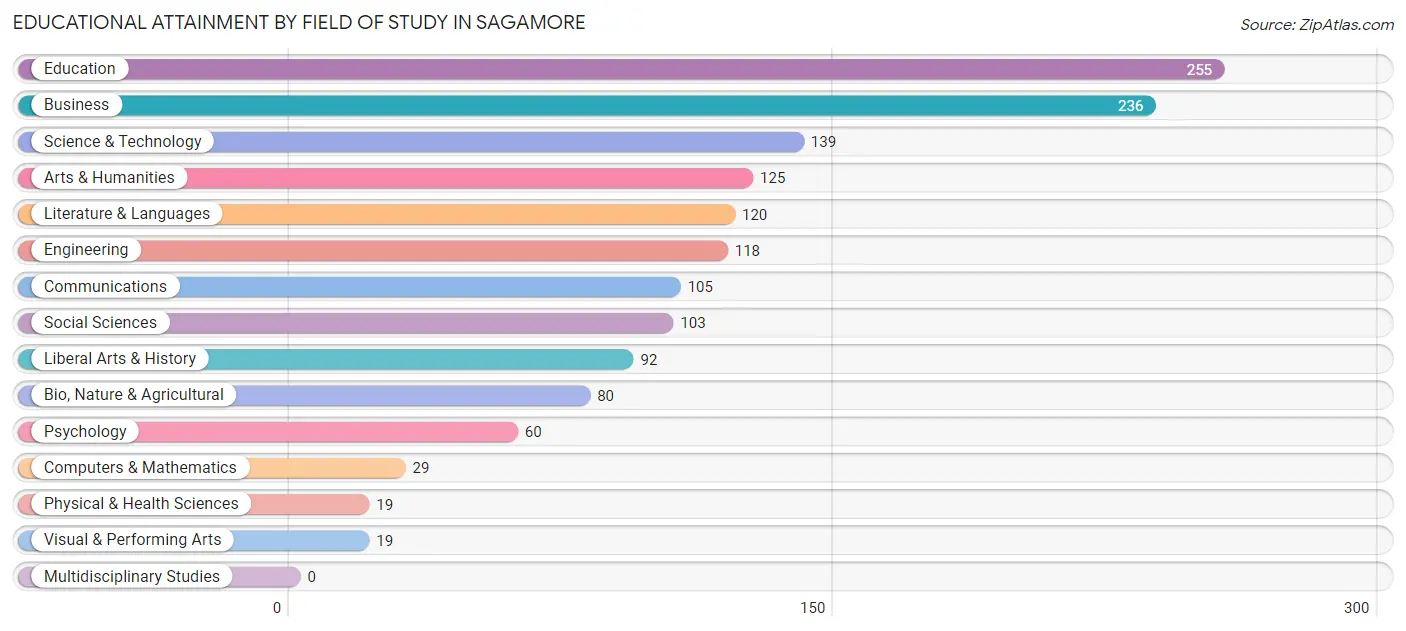
| Field of Study | # Graduates | % Graduates |
| Computers & Mathematics | 29 | 1.9% |
| Bio, Nature & Agricultural | 80 | 5.3% |
| Physical & Health Sciences | 19 | 1.3% |
| Psychology | 60 | 4.0% |
| Social Sciences | 103 | 6.9% |
| Engineering | 118 | 7.9% |
| Multidisciplinary Studies | 0 | 0.0% |
| Science & Technology | 139 | 9.3% |
| Business | 236 | 15.7% |
| Education | 255 | 17.0% |
| Literature & Languages | 120 | 8.0% |
| Liberal Arts & History | 92 | 6.1% |
| Visual & Performing Arts | 19 | 1.3% |
| Communications | 105 | 7.0% |
| Arts & Humanities | 125 | 8.3% |
| Total | 1,500 | 100.0% |
Transportation & Commute in Sagamore
Vehicle Availability by Sex in Sagamore
The most prevalent vehicle ownership categories in Sagamore are males with 2 vehicles (498, accounting for 43.7%) and females with 2 vehicles (690, making up 34.9%).
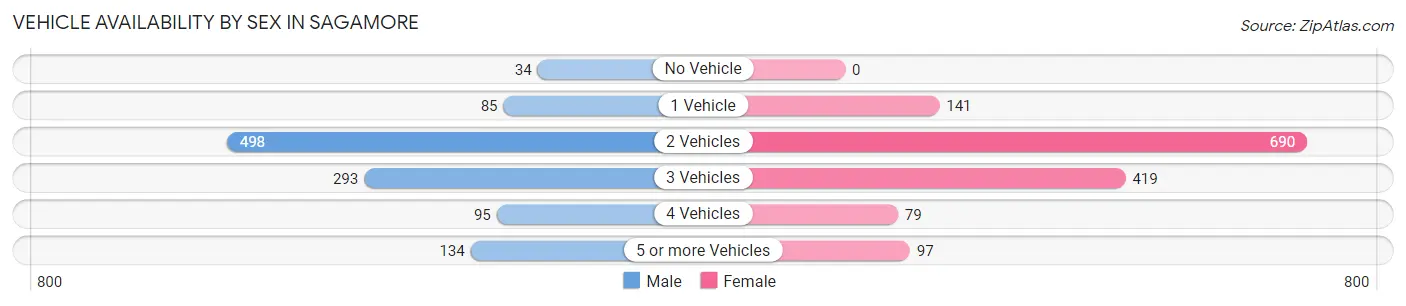
| Vehicles Available | Male | Female |
| No Vehicle | 34 (3.0%) | 0 (0.0%) |
| 1 Vehicle | 85 (7.5%) | 141 (9.9%) |
| 2 Vehicles | 498 (43.7%) | 690 (48.4%) |
| 3 Vehicles | 293 (25.7%) | 419 (29.4%) |
| 4 Vehicles | 95 (8.3%) | 79 (5.5%) |
| 5 or more Vehicles | 134 (11.8%) | 97 (6.8%) |
| Total | 1,139 (100.0%) | 1,426 (100.0%) |
Commute Time in Sagamore
The most frequently occuring commute durations in Sagamore are 20 to 24 minutes (427 commuters, 19.4%), 30 to 34 minutes (333 commuters, 15.1%), and 5 to 9 minutes (313 commuters, 14.2%).
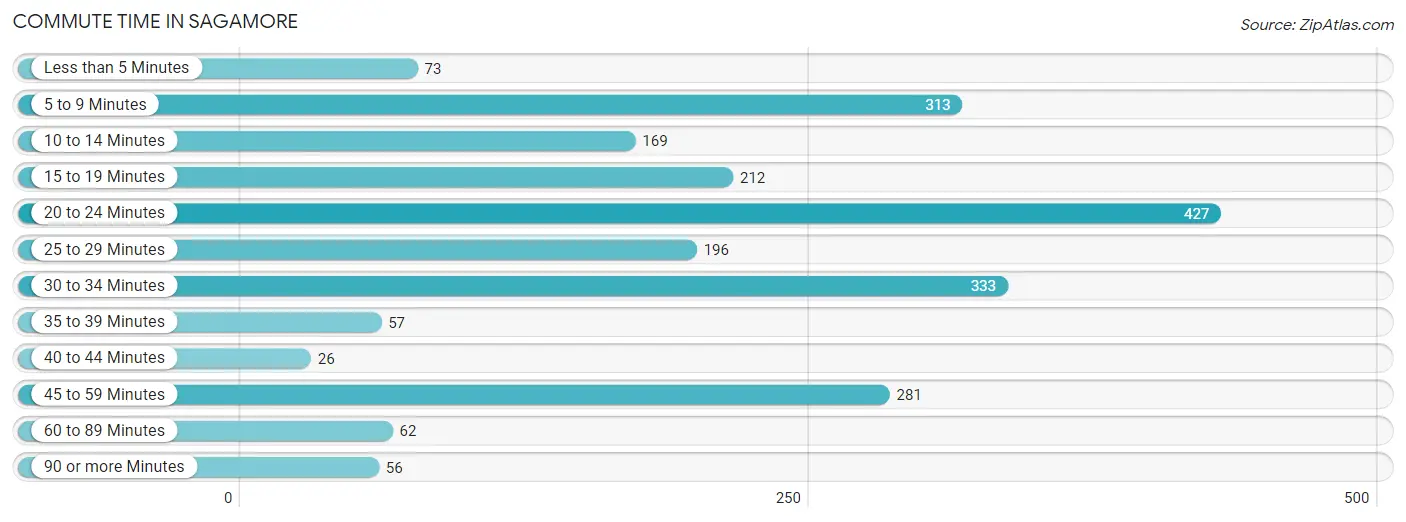
| Commute Time | # Commuters | % Commuters |
| Less than 5 Minutes | 73 | 3.3% |
| 5 to 9 Minutes | 313 | 14.2% |
| 10 to 14 Minutes | 169 | 7.7% |
| 15 to 19 Minutes | 212 | 9.6% |
| 20 to 24 Minutes | 427 | 19.4% |
| 25 to 29 Minutes | 196 | 8.9% |
| 30 to 34 Minutes | 333 | 15.1% |
| 35 to 39 Minutes | 57 | 2.6% |
| 40 to 44 Minutes | 26 | 1.2% |
| 45 to 59 Minutes | 281 | 12.7% |
| 60 to 89 Minutes | 62 | 2.8% |
| 90 or more Minutes | 56 | 2.5% |
Commute Time by Sex in Sagamore
The most common commute times in Sagamore are 20 to 24 minutes (240 commuters, 25.6%) for males and 30 to 34 minutes (202 commuters, 15.9%) for females.
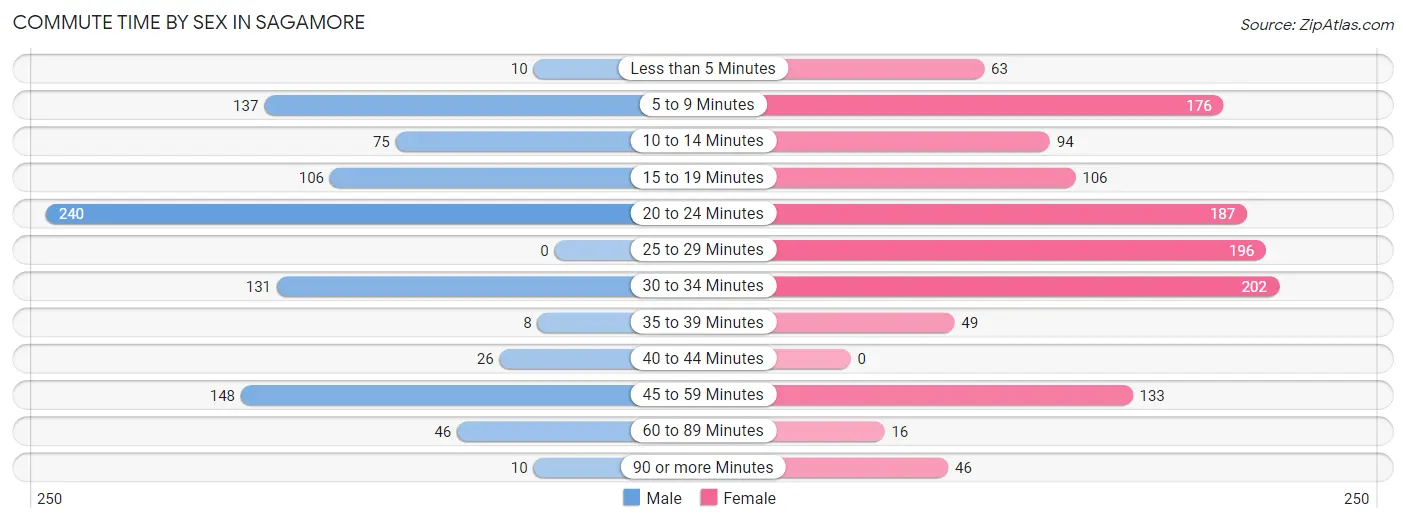
| Commute Time | Male | Female |
| Less than 5 Minutes | 10 (1.1%) | 63 (5.0%) |
| 5 to 9 Minutes | 137 (14.6%) | 176 (13.9%) |
| 10 to 14 Minutes | 75 (8.0%) | 94 (7.4%) |
| 15 to 19 Minutes | 106 (11.3%) | 106 (8.4%) |
| 20 to 24 Minutes | 240 (25.6%) | 187 (14.7%) |
| 25 to 29 Minutes | 0 (0.0%) | 196 (15.5%) |
| 30 to 34 Minutes | 131 (14.0%) | 202 (15.9%) |
| 35 to 39 Minutes | 8 (0.9%) | 49 (3.9%) |
| 40 to 44 Minutes | 26 (2.8%) | 0 (0.0%) |
| 45 to 59 Minutes | 148 (15.8%) | 133 (10.5%) |
| 60 to 89 Minutes | 46 (4.9%) | 16 (1.3%) |
| 90 or more Minutes | 10 (1.1%) | 46 (3.6%) |
Time of Departure to Work by Sex in Sagamore
The most frequent times of departure to work in Sagamore are 7:00 AM to 7:29 AM (236, 25.2%) for males and 7:30 AM to 7:59 AM (194, 15.3%) for females.
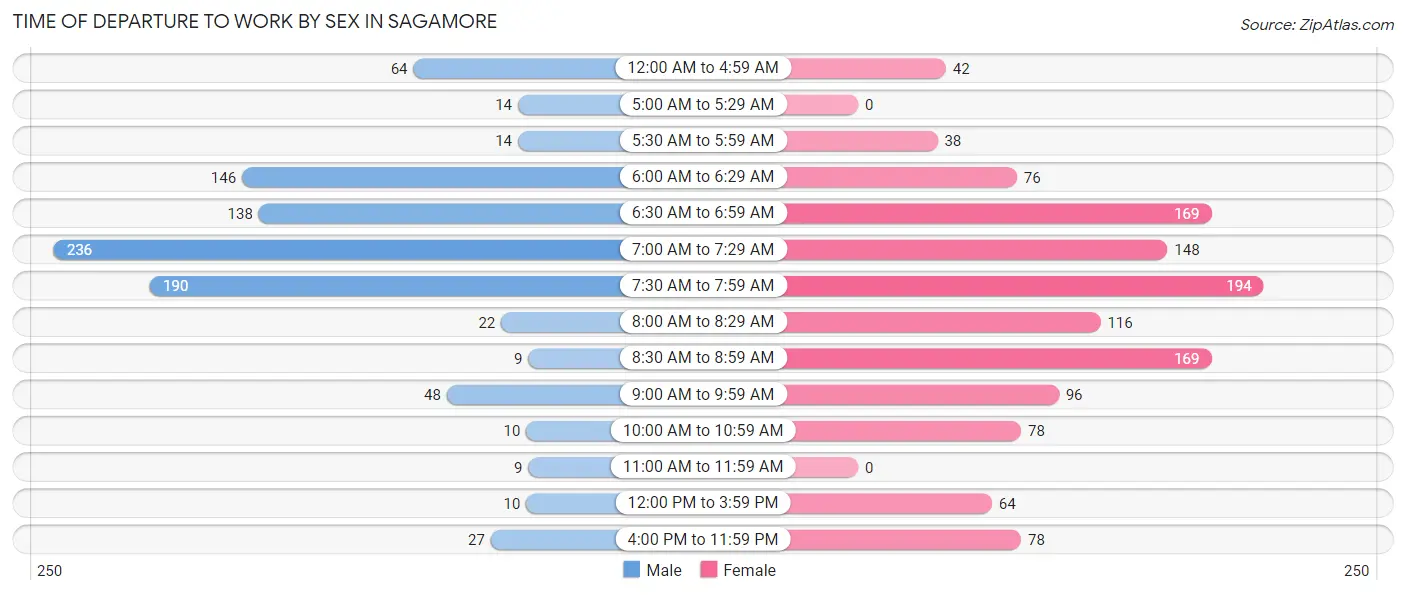
| Time of Departure | Male | Female |
| 12:00 AM to 4:59 AM | 64 (6.8%) | 42 (3.3%) |
| 5:00 AM to 5:29 AM | 14 (1.5%) | 0 (0.0%) |
| 5:30 AM to 5:59 AM | 14 (1.5%) | 38 (3.0%) |
| 6:00 AM to 6:29 AM | 146 (15.6%) | 76 (6.0%) |
| 6:30 AM to 6:59 AM | 138 (14.7%) | 169 (13.3%) |
| 7:00 AM to 7:29 AM | 236 (25.2%) | 148 (11.7%) |
| 7:30 AM to 7:59 AM | 190 (20.3%) | 194 (15.3%) |
| 8:00 AM to 8:29 AM | 22 (2.4%) | 116 (9.1%) |
| 8:30 AM to 8:59 AM | 9 (1.0%) | 169 (13.3%) |
| 9:00 AM to 9:59 AM | 48 (5.1%) | 96 (7.6%) |
| 10:00 AM to 10:59 AM | 10 (1.1%) | 78 (6.1%) |
| 11:00 AM to 11:59 AM | 9 (1.0%) | 0 (0.0%) |
| 12:00 PM to 3:59 PM | 10 (1.1%) | 64 (5.1%) |
| 4:00 PM to 11:59 PM | 27 (2.9%) | 78 (6.1%) |
| Total | 937 (100.0%) | 1,268 (100.0%) |
Housing Occupancy in Sagamore
Occupancy by Ownership in Sagamore
Of the total 1,560 dwellings in Sagamore, owner-occupied units account for 1,276 (81.8%), while renter-occupied units make up 284 (18.2%).
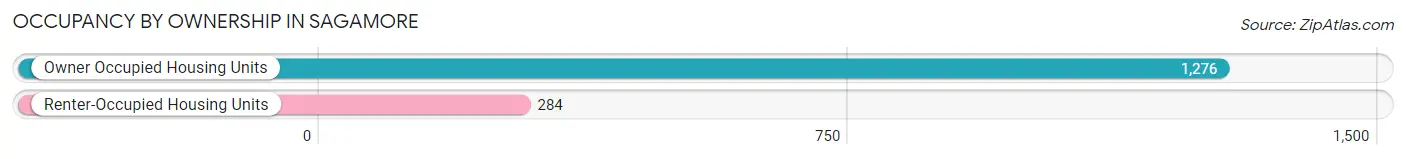
| Occupancy | # Housing Units | % Housing Units |
| Owner Occupied Housing Units | 1,276 | 81.8% |
| Renter-Occupied Housing Units | 284 | 18.2% |
| Total Occupied Housing Units | 1,560 | 100.0% |
Occupancy by Household Size in Sagamore
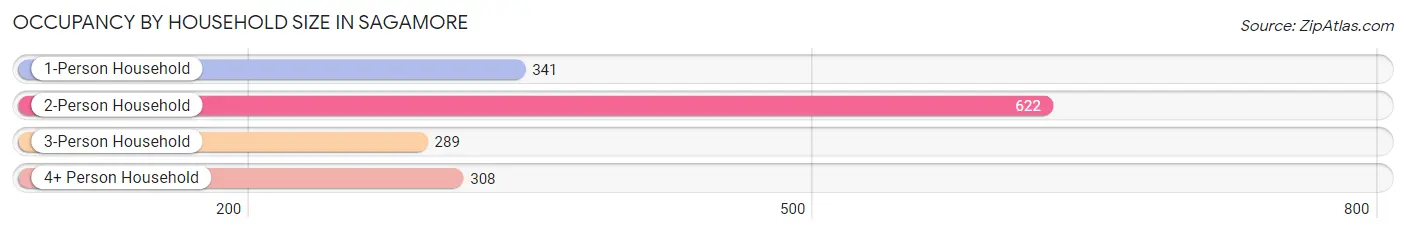
| Household Size | # Housing Units | % Housing Units |
| 1-Person Household | 341 | 21.9% |
| 2-Person Household | 622 | 39.9% |
| 3-Person Household | 289 | 18.5% |
| 4+ Person Household | 308 | 19.7% |
| Total Housing Units | 1,560 | 100.0% |
Occupancy by Ownership by Household Size in Sagamore
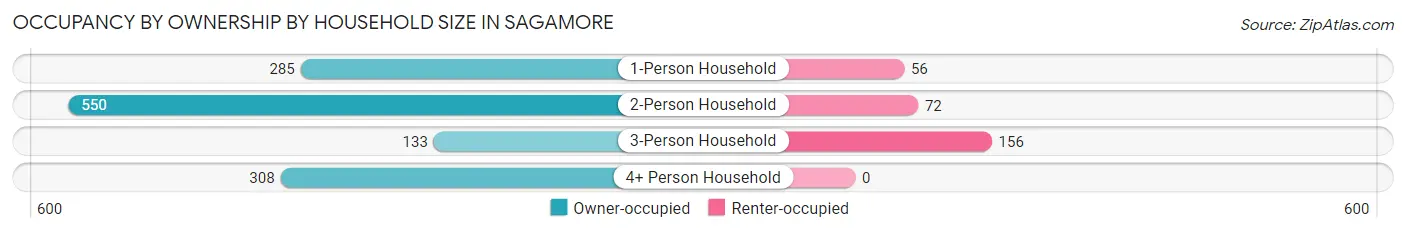
| Household Size | Owner-occupied | Renter-occupied |
| 1-Person Household | 285 (83.6%) | 56 (16.4%) |
| 2-Person Household | 550 (88.4%) | 72 (11.6%) |
| 3-Person Household | 133 (46.0%) | 156 (54.0%) |
| 4+ Person Household | 308 (100.0%) | 0 (0.0%) |
| Total Housing Units | 1,276 (81.8%) | 284 (18.2%) |
Occupancy by Educational Attainment in Sagamore
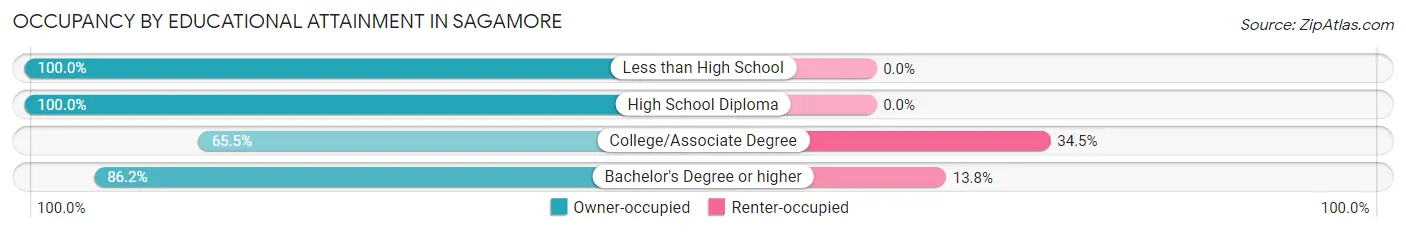
| Household Size | Owner-occupied | Renter-occupied |
| Less than High School | 9 (100.0%) | 0 (0.0%) |
| High School Diploma | 207 (100.0%) | 0 (0.0%) |
| College/Associate Degree | 311 (65.5%) | 164 (34.5%) |
| Bachelor's Degree or higher | 749 (86.2%) | 120 (13.8%) |
Occupancy by Age of Householder in Sagamore
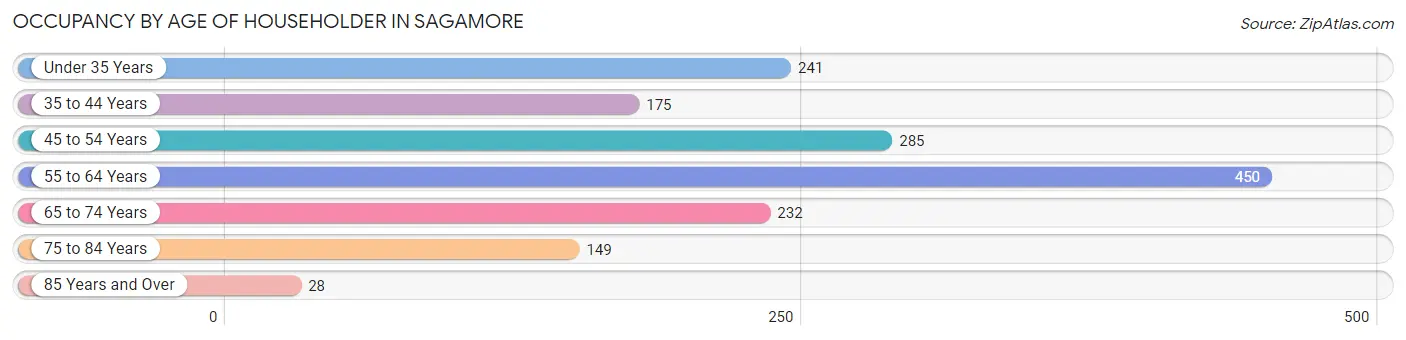
| Age Bracket | # Households | % Households |
| Under 35 Years | 241 | 15.4% |
| 35 to 44 Years | 175 | 11.2% |
| 45 to 54 Years | 285 | 18.3% |
| 55 to 64 Years | 450 | 28.8% |
| 65 to 74 Years | 232 | 14.9% |
| 75 to 84 Years | 149 | 9.6% |
| 85 Years and Over | 28 | 1.8% |
| Total | 1,560 | 100.0% |
Housing Finances in Sagamore
Median Income by Occupancy in Sagamore
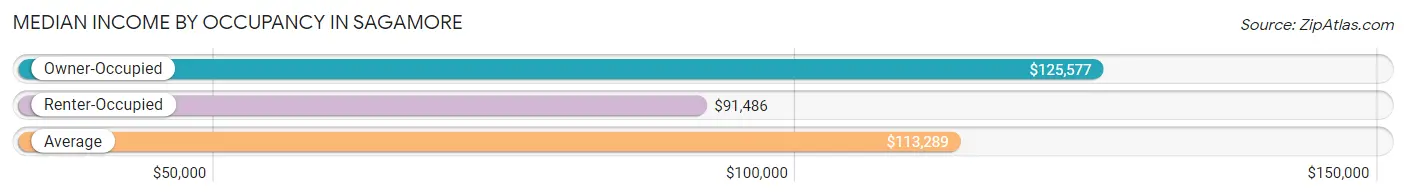
| Occupancy Type | # Households | Median Income |
| Owner-Occupied | 1,276 (81.8%) | $125,577 |
| Renter-Occupied | 284 (18.2%) | $91,486 |
| Average | 1,560 (100.0%) | $113,289 |
Occupancy by Householder Income Bracket in Sagamore
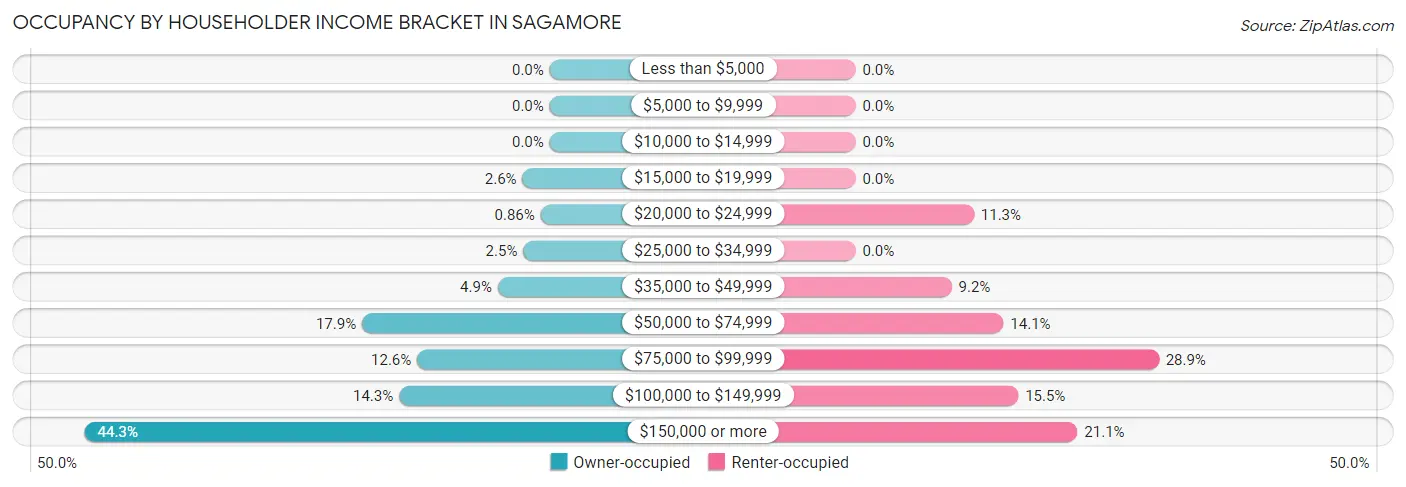
| Income Bracket | Owner-occupied | Renter-occupied |
| Less than $5,000 | 0 (0.0%) | 0 (0.0%) |
| $5,000 to $9,999 | 0 (0.0%) | 0 (0.0%) |
| $10,000 to $14,999 | 0 (0.0%) | 0 (0.0%) |
| $15,000 to $19,999 | 33 (2.6%) | 0 (0.0%) |
| $20,000 to $24,999 | 11 (0.9%) | 32 (11.3%) |
| $25,000 to $34,999 | 32 (2.5%) | 0 (0.0%) |
| $35,000 to $49,999 | 63 (4.9%) | 26 (9.1%) |
| $50,000 to $74,999 | 228 (17.9%) | 40 (14.1%) |
| $75,000 to $99,999 | 161 (12.6%) | 82 (28.9%) |
| $100,000 to $149,999 | 183 (14.3%) | 44 (15.5%) |
| $150,000 or more | 565 (44.3%) | 60 (21.1%) |
| Total | 1,276 (100.0%) | 284 (100.0%) |
Monthly Housing Cost Tiers in Sagamore
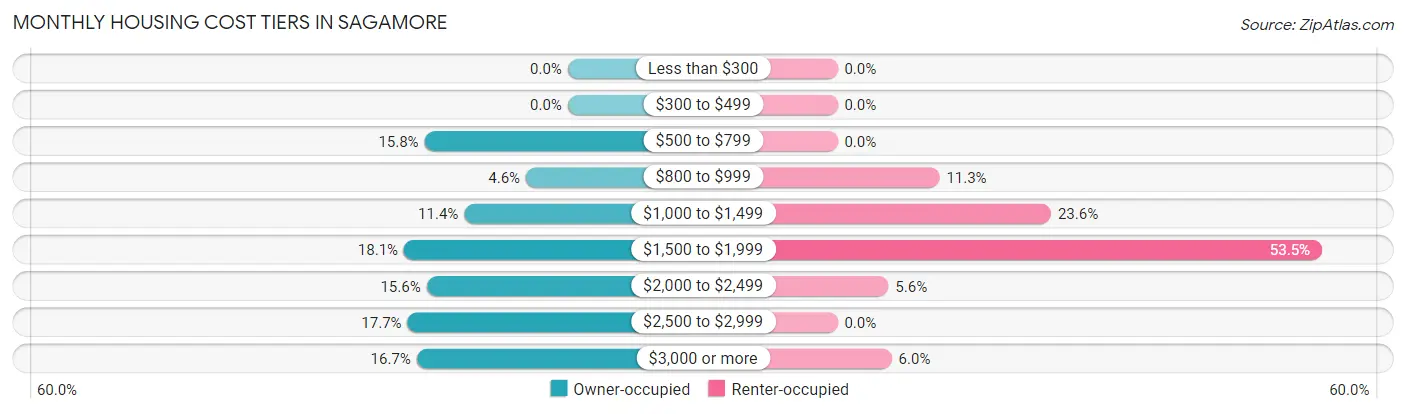
| Monthly Cost | Owner-occupied | Renter-occupied |
| Less than $300 | 0 (0.0%) | 0 (0.0%) |
| $300 to $499 | 0 (0.0%) | 0 (0.0%) |
| $500 to $799 | 202 (15.8%) | 0 (0.0%) |
| $800 to $999 | 59 (4.6%) | 32 (11.3%) |
| $1,000 to $1,499 | 146 (11.4%) | 67 (23.6%) |
| $1,500 to $1,999 | 231 (18.1%) | 152 (53.5%) |
| $2,000 to $2,499 | 199 (15.6%) | 16 (5.6%) |
| $2,500 to $2,999 | 226 (17.7%) | 0 (0.0%) |
| $3,000 or more | 213 (16.7%) | 17 (6.0%) |
| Total | 1,276 (100.0%) | 284 (100.0%) |
Physical Housing Characteristics in Sagamore
Housing Structures in Sagamore
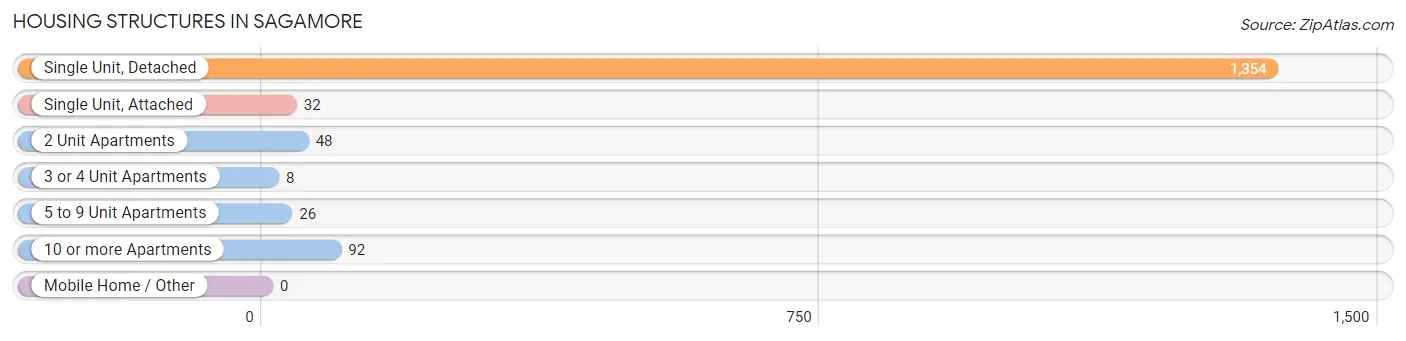
| Structure Type | # Housing Units | % Housing Units |
| Single Unit, Detached | 1,354 | 86.8% |
| Single Unit, Attached | 32 | 2.1% |
| 2 Unit Apartments | 48 | 3.1% |
| 3 or 4 Unit Apartments | 8 | 0.5% |
| 5 to 9 Unit Apartments | 26 | 1.7% |
| 10 or more Apartments | 92 | 5.9% |
| Mobile Home / Other | 0 | 0.0% |
| Total | 1,560 | 100.0% |
Housing Structures by Occupancy in Sagamore

| Structure Type | Owner-occupied | Renter-occupied |
| Single Unit, Detached | 1,230 (90.8%) | 124 (9.2%) |
| Single Unit, Attached | 32 (100.0%) | 0 (0.0%) |
| 2 Unit Apartments | 0 (0.0%) | 48 (100.0%) |
| 3 or 4 Unit Apartments | 0 (0.0%) | 8 (100.0%) |
| 5 to 9 Unit Apartments | 0 (0.0%) | 26 (100.0%) |
| 10 or more Apartments | 14 (15.2%) | 78 (84.8%) |
| Mobile Home / Other | 0 (0.0%) | 0 (0.0%) |
| Total | 1,276 (81.8%) | 284 (18.2%) |
Housing Structures by Number of Rooms in Sagamore
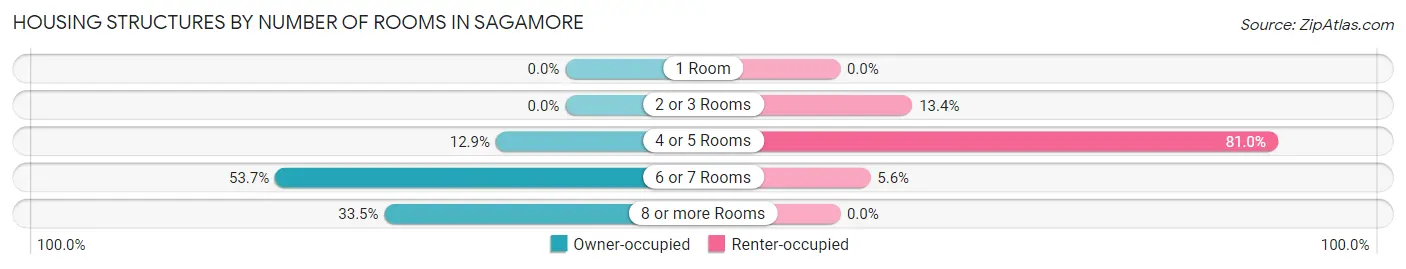
| Number of Rooms | Owner-occupied | Renter-occupied |
| 1 Room | 0 (0.0%) | 0 (0.0%) |
| 2 or 3 Rooms | 0 (0.0%) | 38 (13.4%) |
| 4 or 5 Rooms | 164 (12.9%) | 230 (81.0%) |
| 6 or 7 Rooms | 685 (53.7%) | 16 (5.6%) |
| 8 or more Rooms | 427 (33.5%) | 0 (0.0%) |
| Total | 1,276 (100.0%) | 284 (100.0%) |
Housing Structure by Heating Type in Sagamore
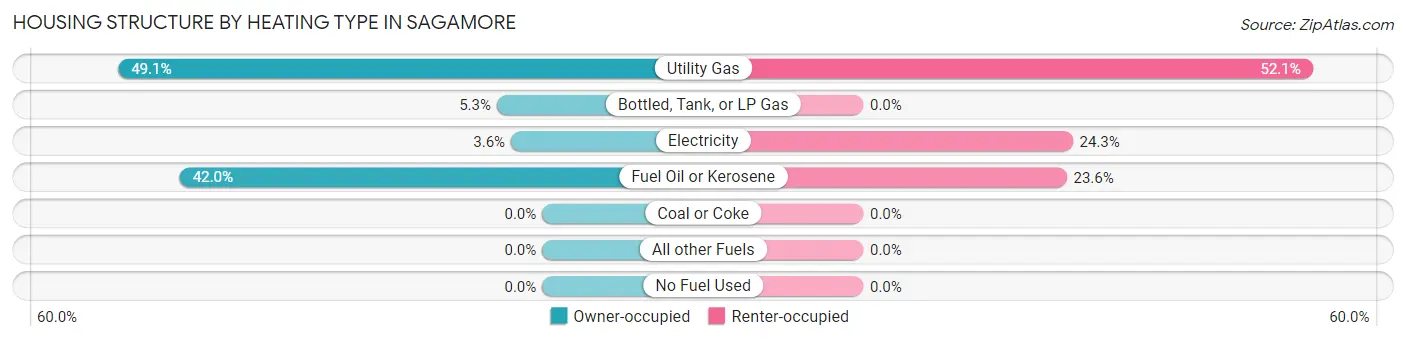
| Heating Type | Owner-occupied | Renter-occupied |
| Utility Gas | 627 (49.1%) | 148 (52.1%) |
| Bottled, Tank, or LP Gas | 67 (5.2%) | 0 (0.0%) |
| Electricity | 46 (3.6%) | 69 (24.3%) |
| Fuel Oil or Kerosene | 536 (42.0%) | 67 (23.6%) |
| Coal or Coke | 0 (0.0%) | 0 (0.0%) |
| All other Fuels | 0 (0.0%) | 0 (0.0%) |
| No Fuel Used | 0 (0.0%) | 0 (0.0%) |
| Total | 1,276 (100.0%) | 284 (100.0%) |
Household Vehicle Usage in Sagamore
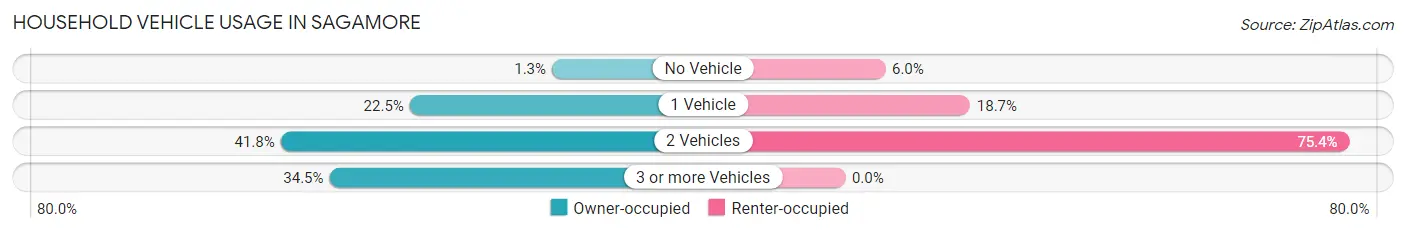
| Vehicles per Household | Owner-occupied | Renter-occupied |
| No Vehicle | 16 (1.3%) | 17 (6.0%) |
| 1 Vehicle | 287 (22.5%) | 53 (18.7%) |
| 2 Vehicles | 533 (41.8%) | 214 (75.3%) |
| 3 or more Vehicles | 440 (34.5%) | 0 (0.0%) |
| Total | 1,276 (100.0%) | 284 (100.0%) |
Real Estate & Mortgages in Sagamore
Real Estate and Mortgage Overview in Sagamore
| Characteristic | Without Mortgage | With Mortgage |
| Housing Units | 414 | 862 |
| Median Property Value | $458,700 | $514,900 |
| Median Household Income | $70,489 | $462 |
| Monthly Housing Costs | $824 | $213 |
| Real Estate Taxes | $4,100 | $0 |
Property Value by Mortgage Status in Sagamore
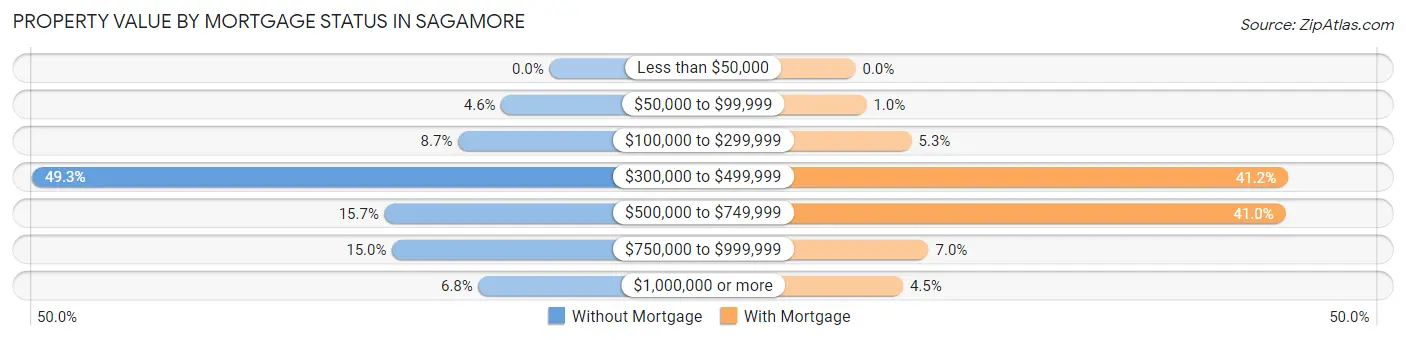
| Property Value | Without Mortgage | With Mortgage |
| Less than $50,000 | 0 (0.0%) | 0 (0.0%) |
| $50,000 to $99,999 | 19 (4.6%) | 9 (1.0%) |
| $100,000 to $299,999 | 36 (8.7%) | 46 (5.3%) |
| $300,000 to $499,999 | 204 (49.3%) | 355 (41.2%) |
| $500,000 to $749,999 | 65 (15.7%) | 353 (40.9%) |
| $750,000 to $999,999 | 62 (15.0%) | 60 (7.0%) |
| $1,000,000 or more | 28 (6.8%) | 39 (4.5%) |
| Total | 414 (100.0%) | 862 (100.0%) |
Household Income by Mortgage Status in Sagamore
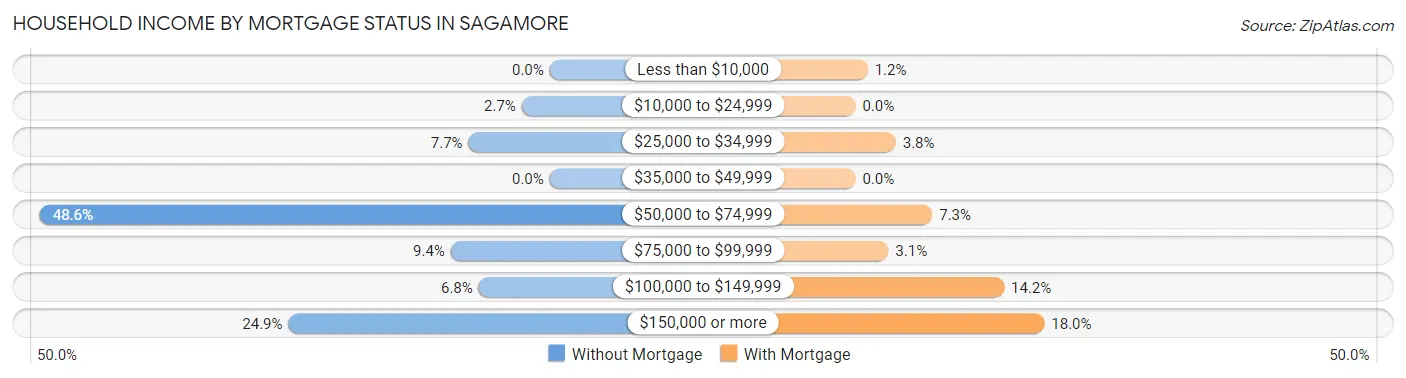
| Household Income | Without Mortgage | With Mortgage |
| Less than $10,000 | 0 (0.0%) | 10 (1.2%) |
| $10,000 to $24,999 | 11 (2.7%) | 0 (0.0%) |
| $25,000 to $34,999 | 32 (7.7%) | 33 (3.8%) |
| $35,000 to $49,999 | 0 (0.0%) | 0 (0.0%) |
| $50,000 to $74,999 | 201 (48.5%) | 63 (7.3%) |
| $75,000 to $99,999 | 39 (9.4%) | 27 (3.1%) |
| $100,000 to $149,999 | 28 (6.8%) | 122 (14.1%) |
| $150,000 or more | 103 (24.9%) | 155 (18.0%) |
| Total | 414 (100.0%) | 862 (100.0%) |
Property Value to Household Income Ratio in Sagamore
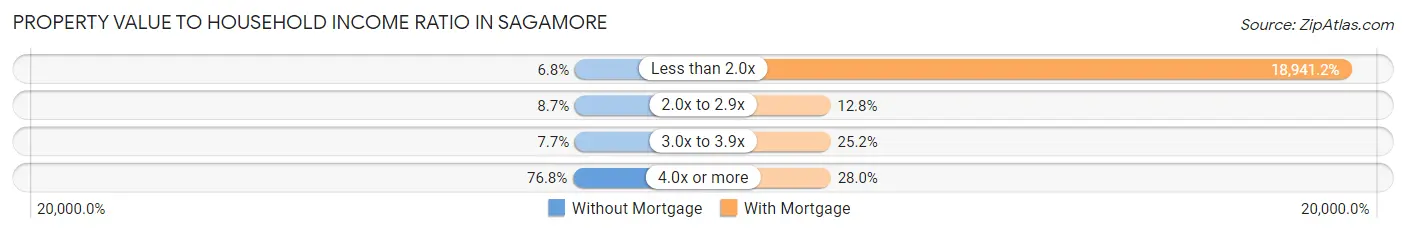
| Value-to-Income Ratio | Without Mortgage | With Mortgage |
| Less than 2.0x | 28 (6.8%) | 163,273 (18,941.2%) |
| 2.0x to 2.9x | 36 (8.7%) | 110 (12.8%) |
| 3.0x to 3.9x | 32 (7.7%) | 217 (25.2%) |
| 4.0x or more | 318 (76.8%) | 241 (28.0%) |
| Total | 414 (100.0%) | 862 (100.0%) |
Real Estate Taxes by Mortgage Status in Sagamore
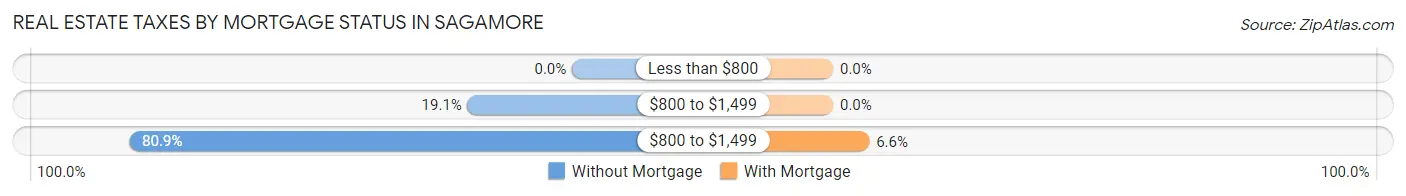
| Property Taxes | Without Mortgage | With Mortgage |
| Less than $800 | 0 (0.0%) | 0 (0.0%) |
| $800 to $1,499 | 79 (19.1%) | 0 (0.0%) |
| $800 to $1,499 | 335 (80.9%) | 57 (6.6%) |
| Total | 414 (100.0%) | 862 (100.0%) |
Health & Disability in Sagamore
Health Insurance Coverage by Age in Sagamore
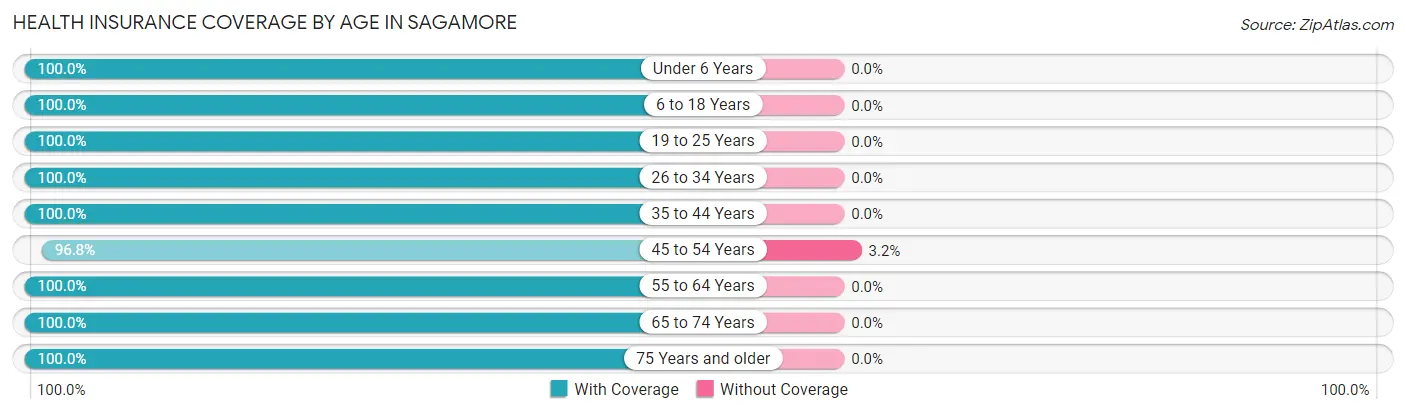
| Age Bracket | With Coverage | Without Coverage |
| Under 6 Years | 166 (100.0%) | 0 (0.0%) |
| 6 to 18 Years | 623 (100.0%) | 0 (0.0%) |
| 19 to 25 Years | 303 (100.0%) | 0 (0.0%) |
| 26 to 34 Years | 519 (100.0%) | 0 (0.0%) |
| 35 to 44 Years | 301 (100.0%) | 0 (0.0%) |
| 45 to 54 Years | 571 (96.8%) | 19 (3.2%) |
| 55 to 64 Years | 760 (100.0%) | 0 (0.0%) |
| 65 to 74 Years | 454 (100.0%) | 0 (0.0%) |
| 75 Years and older | 212 (100.0%) | 0 (0.0%) |
| Total | 3,909 (99.5%) | 19 (0.5%) |
Health Insurance Coverage by Citizenship Status in Sagamore
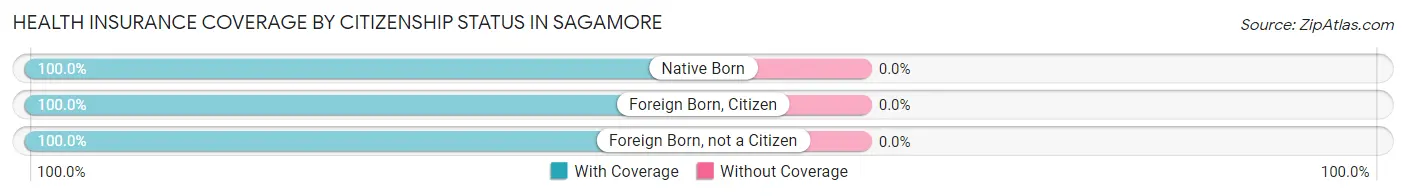
| Citizenship Status | With Coverage | Without Coverage |
| Native Born | 166 (100.0%) | 0 (0.0%) |
| Foreign Born, Citizen | 623 (100.0%) | 0 (0.0%) |
| Foreign Born, not a Citizen | 303 (100.0%) | 0 (0.0%) |
Health Insurance Coverage by Household Income in Sagamore
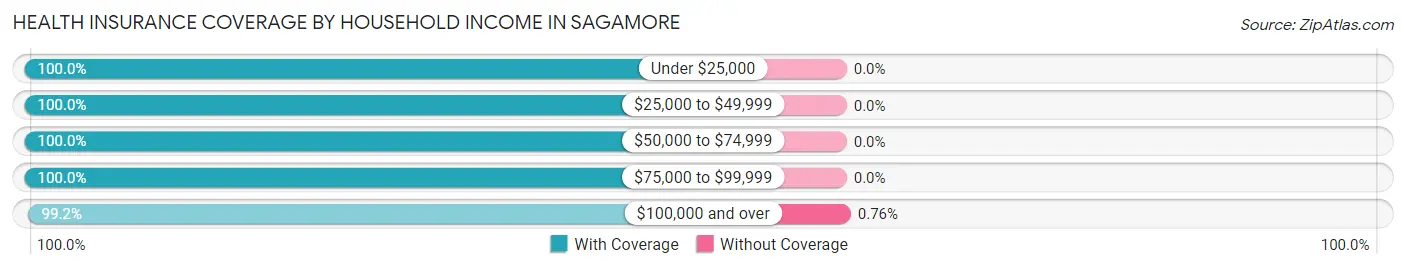
| Household Income | With Coverage | Without Coverage |
| Under $25,000 | 142 (100.0%) | 0 (0.0%) |
| $25,000 to $49,999 | 173 (100.0%) | 0 (0.0%) |
| $50,000 to $74,999 | 478 (100.0%) | 0 (0.0%) |
| $75,000 to $99,999 | 634 (100.0%) | 0 (0.0%) |
| $100,000 and over | 2,482 (99.2%) | 19 (0.8%) |
Public vs Private Health Insurance Coverage by Age in Sagamore
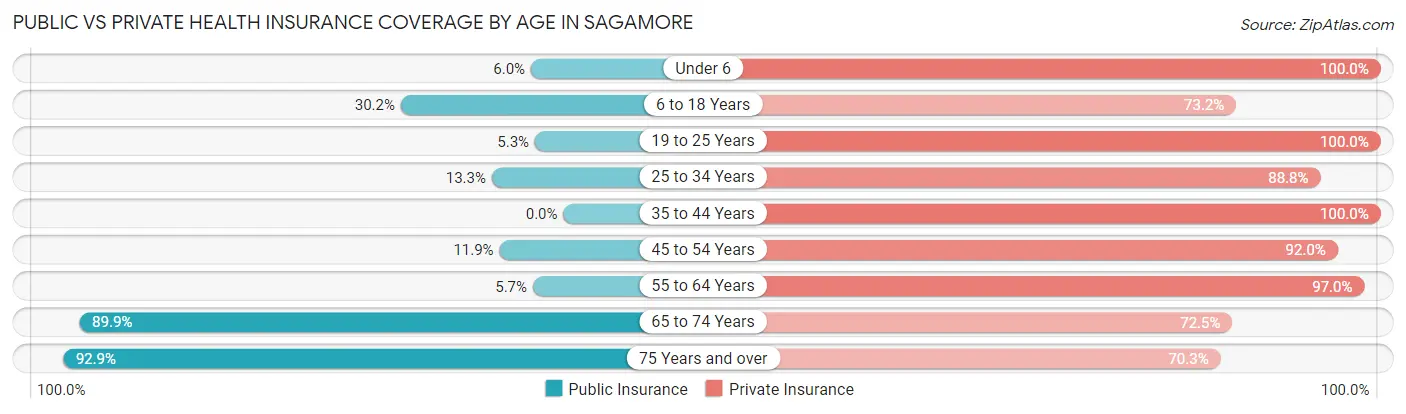
| Age Bracket | Public Insurance | Private Insurance |
| Under 6 | 10 (6.0%) | 166 (100.0%) |
| 6 to 18 Years | 188 (30.2%) | 456 (73.2%) |
| 19 to 25 Years | 16 (5.3%) | 303 (100.0%) |
| 25 to 34 Years | 69 (13.3%) | 461 (88.8%) |
| 35 to 44 Years | 0 (0.0%) | 301 (100.0%) |
| 45 to 54 Years | 70 (11.9%) | 543 (92.0%) |
| 55 to 64 Years | 43 (5.7%) | 737 (97.0%) |
| 65 to 74 Years | 408 (89.9%) | 329 (72.5%) |
| 75 Years and over | 197 (92.9%) | 149 (70.3%) |
| Total | 1,001 (25.5%) | 3,445 (87.7%) |
Disability Status by Sex by Age in Sagamore
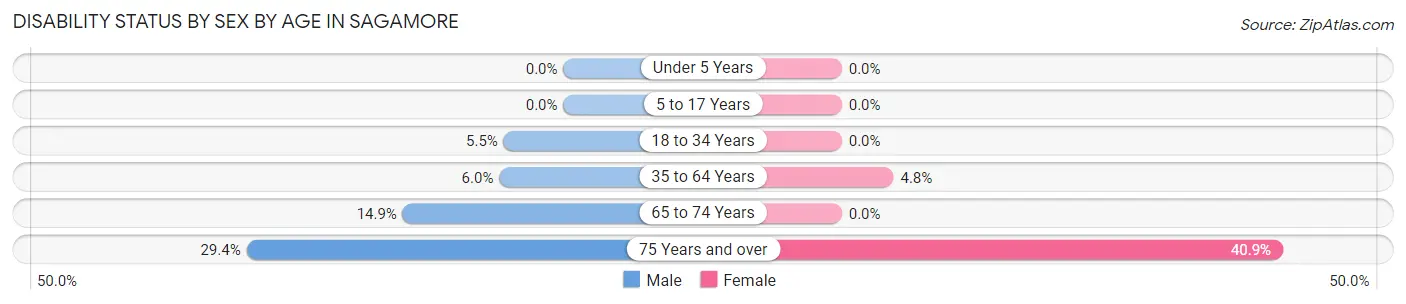
| Age Bracket | Male | Female |
| Under 5 Years | 0 (0.0%) | 0 (0.0%) |
| 5 to 17 Years | 0 (0.0%) | 0 (0.0%) |
| 18 to 34 Years | 26 (5.5%) | 0 (0.0%) |
| 35 to 64 Years | 40 (5.9%) | 47 (4.8%) |
| 65 to 74 Years | 34 (14.9%) | 0 (0.0%) |
| 75 Years and over | 25 (29.4%) | 52 (40.9%) |
Disability Class by Sex by Age in Sagamore
Disability Class: Hearing Difficulty
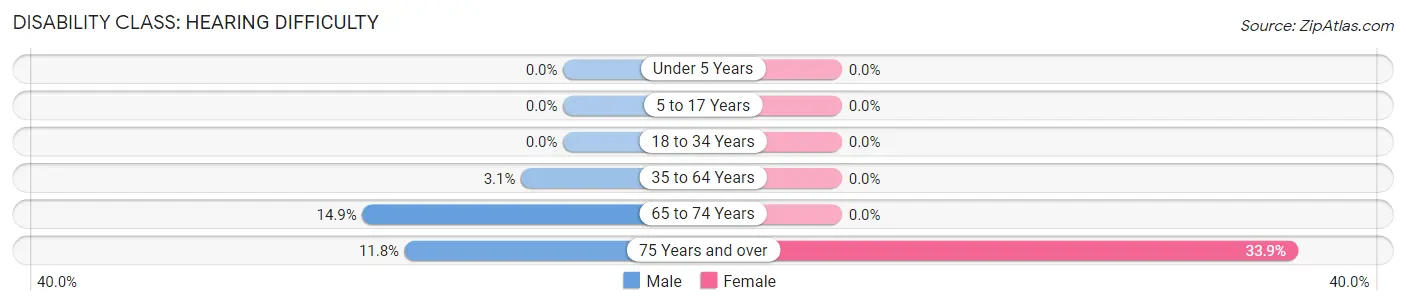
| Age Bracket | Male | Female |
| Under 5 Years | 0 (0.0%) | 0 (0.0%) |
| 5 to 17 Years | 0 (0.0%) | 0 (0.0%) |
| 18 to 34 Years | 0 (0.0%) | 0 (0.0%) |
| 35 to 64 Years | 21 (3.1%) | 0 (0.0%) |
| 65 to 74 Years | 34 (14.9%) | 0 (0.0%) |
| 75 Years and over | 10 (11.8%) | 43 (33.9%) |
Disability Class: Vision Difficulty
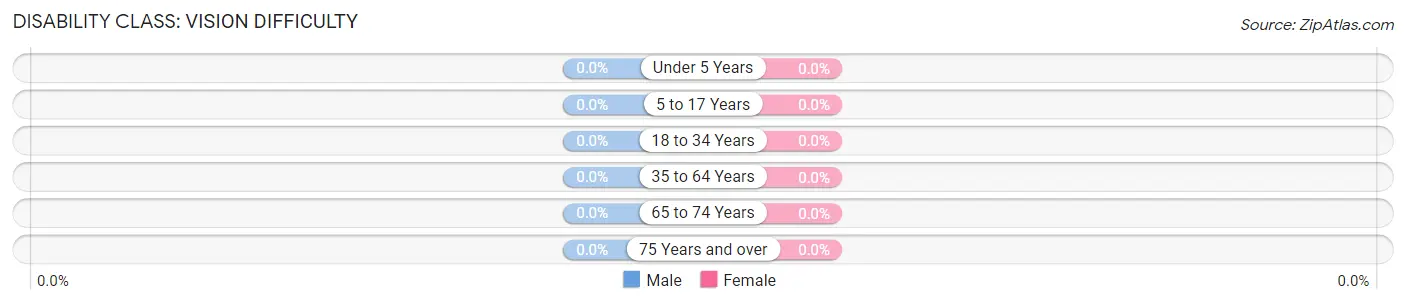
| Age Bracket | Male | Female |
| Under 5 Years | 0 (0.0%) | 0 (0.0%) |
| 5 to 17 Years | 0 (0.0%) | 0 (0.0%) |
| 18 to 34 Years | 0 (0.0%) | 0 (0.0%) |
| 35 to 64 Years | 0 (0.0%) | 0 (0.0%) |
| 65 to 74 Years | 0 (0.0%) | 0 (0.0%) |
| 75 Years and over | 0 (0.0%) | 0 (0.0%) |
Disability Class: Cognitive Difficulty
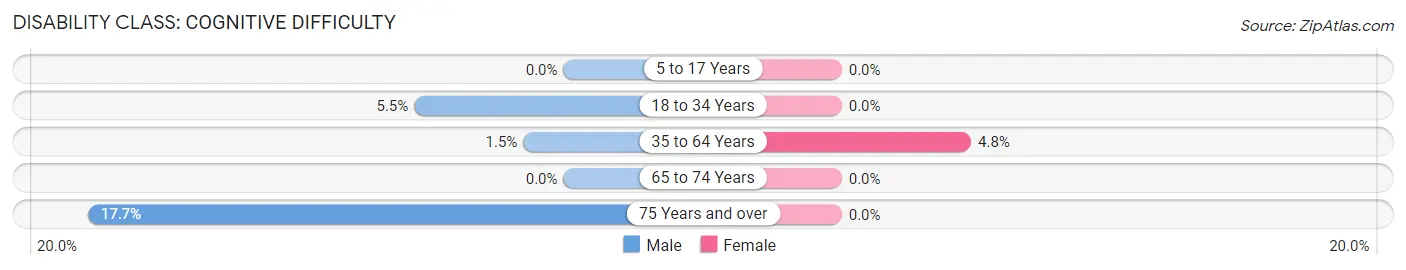
| Age Bracket | Male | Female |
| 5 to 17 Years | 0 (0.0%) | 0 (0.0%) |
| 18 to 34 Years | 26 (5.5%) | 0 (0.0%) |
| 35 to 64 Years | 10 (1.5%) | 47 (4.8%) |
| 65 to 74 Years | 0 (0.0%) | 0 (0.0%) |
| 75 Years and over | 15 (17.6%) | 0 (0.0%) |
Disability Class: Ambulatory Difficulty
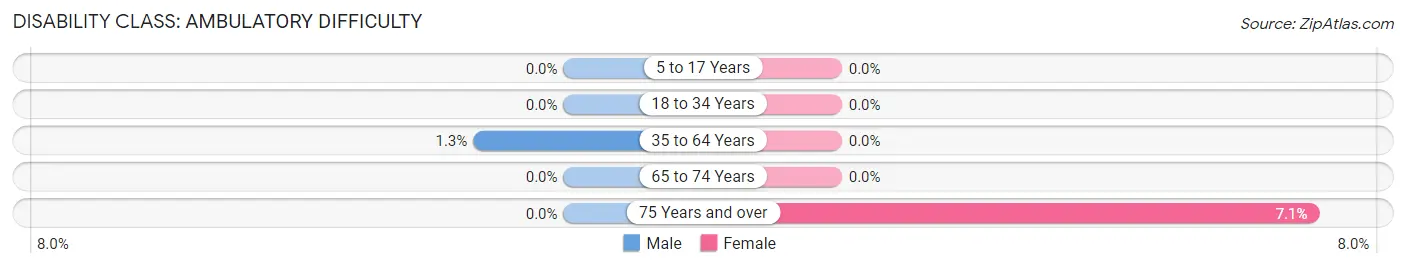
| Age Bracket | Male | Female |
| 5 to 17 Years | 0 (0.0%) | 0 (0.0%) |
| 18 to 34 Years | 0 (0.0%) | 0 (0.0%) |
| 35 to 64 Years | 9 (1.3%) | 0 (0.0%) |
| 65 to 74 Years | 0 (0.0%) | 0 (0.0%) |
| 75 Years and over | 0 (0.0%) | 9 (7.1%) |
Disability Class: Self-Care Difficulty
| Age Bracket | Male | Female |
| 5 to 17 Years | 0 (0.0%) | 0 (0.0%) |
| 18 to 34 Years | 0 (0.0%) | 0 (0.0%) |
| 35 to 64 Years | 0 (0.0%) | 0 (0.0%) |
| 65 to 74 Years | 0 (0.0%) | 0 (0.0%) |
| 75 Years and over | 0 (0.0%) | 0 (0.0%) |
Technology Access in Sagamore
Computing Device Access in Sagamore
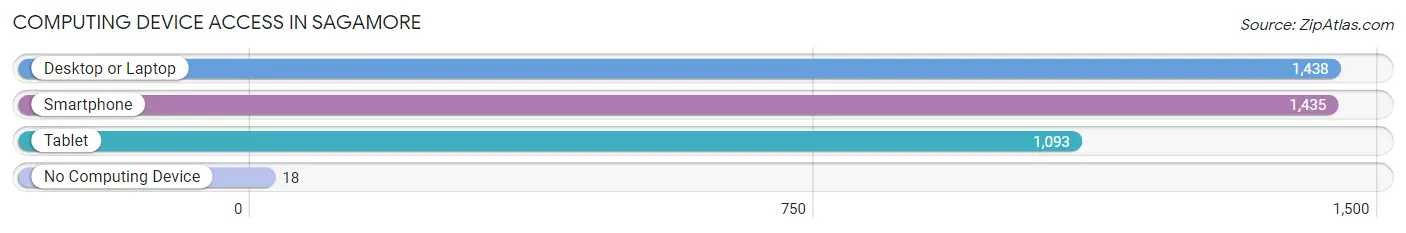
| Device Type | # Households | % Households |
| Desktop or Laptop | 1,438 | 92.2% |
| Smartphone | 1,435 | 92.0% |
| Tablet | 1,093 | 70.1% |
| No Computing Device | 18 | 1.1% |
| Total | 1,560 | 100.0% |
Internet Access in Sagamore
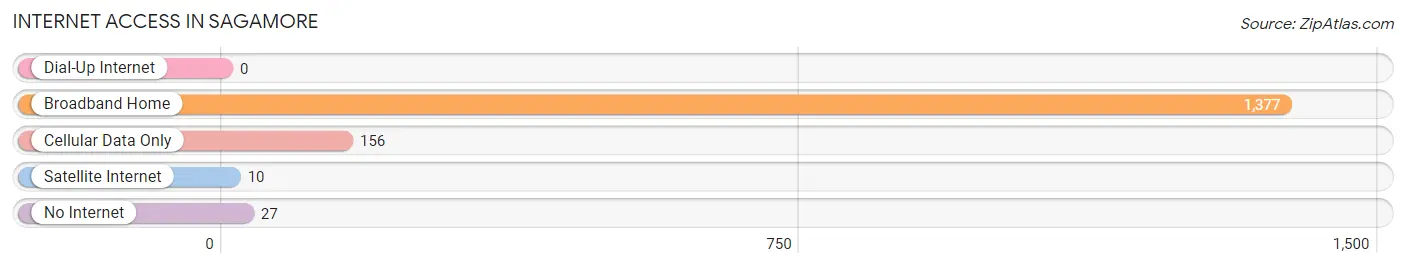
| Internet Type | # Households | % Households |
| Dial-Up Internet | 0 | 0.0% |
| Broadband Home | 1,377 | 88.3% |
| Cellular Data Only | 156 | 10.0% |
| Satellite Internet | 10 | 0.6% |
| No Internet | 27 | 1.7% |
| Total | 1,560 | 100.0% |
Sagamore Summary
Sagamore is a small town located in Barnstable County, Massachusetts, United States. It is situated on the north side of Cape Cod, and is bordered by the towns of Bourne, Sandwich, and Mashpee. The town has a population of approximately 2,000 people, and is a popular summer destination for tourists.
History
Sagamore was first settled in 1639 by a group of English settlers from Plymouth Colony. The town was originally known as “Sagamore Plantation”, and was part of the town of Sandwich until it was incorporated as its own town in 1884. The town was named after the Sagamore River, which was named after the Native American chief of the same name.
Geography
Sagamore is located on the north side of Cape Cod, and is bordered by the towns of Bourne, Sandwich, and Mashpee. The town is situated on a peninsula, with the Sagamore River to the east and the Cape Cod Canal to the west. The town is mostly rural, with a few small villages scattered throughout. The town is home to several beaches, including Sagamore Beach, which is a popular destination for tourists.
Economy
Sagamore’s economy is largely based on tourism, with many visitors coming to the town during the summer months. The town is home to several restaurants, shops, and other businesses that cater to tourists. The town is also home to several marinas, which provide services to boaters and fishermen. In addition, the town is home to several small businesses, including a few farms and a winery.
Demographics
As of the 2010 census, the population of Sagamore was 2,039. The racial makeup of the town was 97.2% White, 0.7% African American, 0.3% Native American, 0.4% Asian, 0.1% Pacific Islander, 0.3% from other races, and 1.0% from two or more races. Hispanic or Latino of any race were 1.2% of the population.
The median income for a household in the town was $50,938, and the median income for a family was $60,000. The per capita income for the town was $25,945. About 5.2% of families and 7.2% of the population were below the poverty line, including 8.3% of those under age 18 and 4.2% of those age 65 or over.
Sagamore is a small town with a rich history and a vibrant economy. The town is a popular summer destination for tourists, and is home to several businesses and attractions. The town is also home to a diverse population, with a variety of racial and ethnic backgrounds. With its beautiful beaches and scenic views, Sagamore is a great place to visit or live.
Common Questions
What is Per Capita Income in Sagamore?
Per Capita income in Sagamore is $53,529.
What is the Median Family Income in Sagamore?
Median Family Income in Sagamore is $145,357.
What is the Median Household income in Sagamore?
Median Household Income in Sagamore is $113,289.
What is Income or Wage Gap in Sagamore?
Income or Wage Gap in Sagamore is 29.0%.
Women in Sagamore earn 71.0 cents for every dollar earned by a man.
What is Inequality or Gini Index in Sagamore?
Inequality or Gini Index in Sagamore is 0.35.
What is the Total Population of Sagamore?
Total Population of Sagamore is 3,966.
What is the Total Male Population of Sagamore?
Total Male Population of Sagamore is 1,822.
What is the Total Female Population of Sagamore?
Total Female Population of Sagamore is 2,144.
What is the Ratio of Males per 100 Females in Sagamore?
There are 84.98 Males per 100 Females in Sagamore.
What is the Ratio of Females per 100 Males in Sagamore?
There are 117.67 Females per 100 Males in Sagamore.
What is the Median Population Age in Sagamore?
Median Population Age in Sagamore is 46.0 Years.
What is the Average Family Size in Sagamore
Average Family Size in Sagamore is 2.8 People.
What is the Average Household Size in Sagamore
Average Household Size in Sagamore is 2.5 People.
How Large is the Labor Force in Sagamore?
There are 2,668 People in the Labor Forcein in Sagamore.
What is the Percentage of People in the Labor Force in Sagamore?
78.6% of People are in the Labor Force in Sagamore.
What is the Unemployment Rate in Sagamore?
Unemployment Rate in Sagamore is 3.0%.