Northwest Harwich, MA Map & Demographics
Northwest Harwich Map
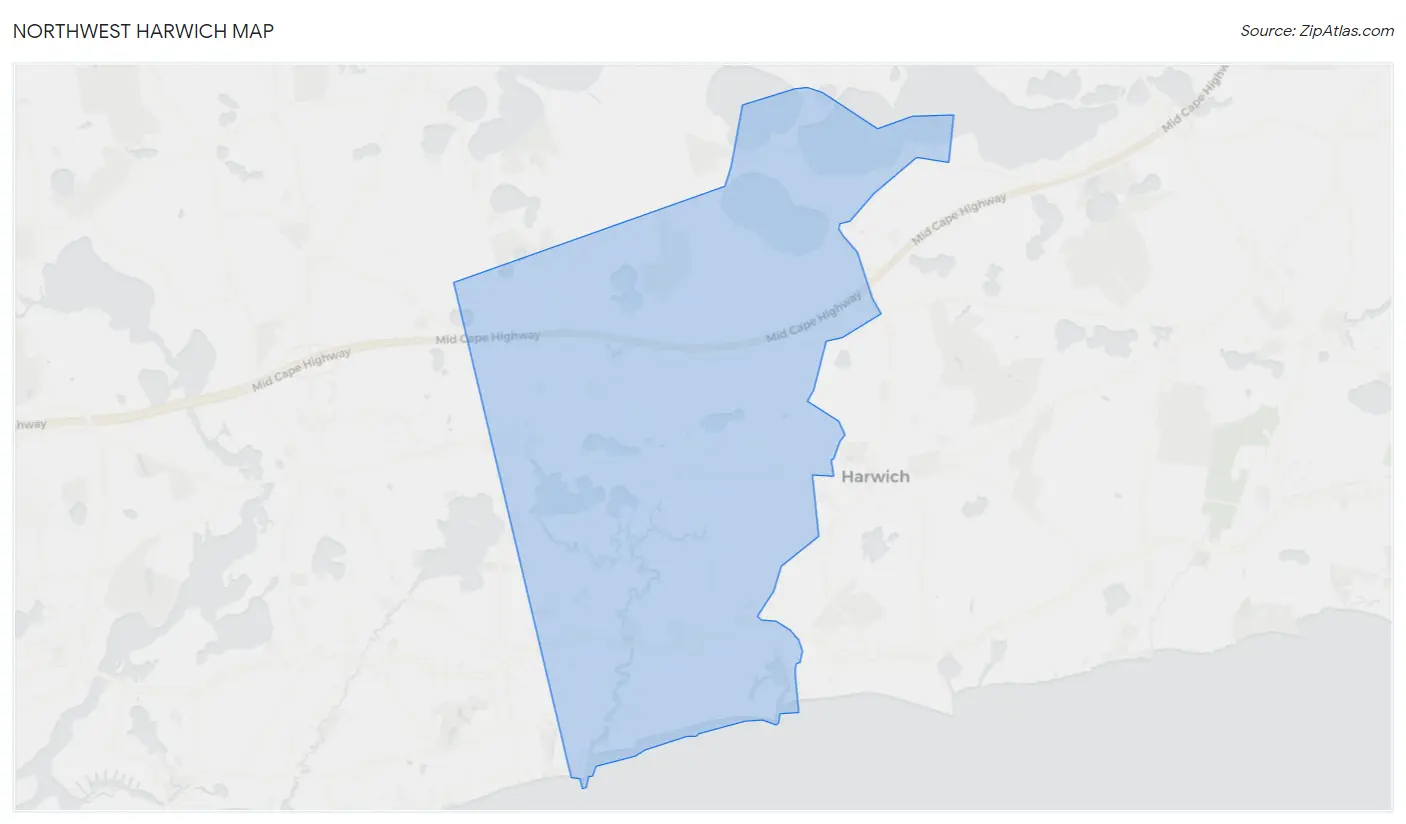
Northwest Harwich Overview
$53,295
PER CAPITA INCOME
$92,500
AVG FAMILY INCOME
$81,268
AVG HOUSEHOLD INCOME
46.0%
WAGE / INCOME GAP [ % ]
54.0¢/ $1
WAGE / INCOME GAP [ $ ]
0.46
INEQUALITY / GINI INDEX
4,076
TOTAL POPULATION
2,117
MALE POPULATION
1,959
FEMALE POPULATION
108.07
MALES / 100 FEMALES
92.54
FEMALES / 100 MALES
56.4
MEDIAN AGE
2.6
AVG FAMILY SIZE
2.3
AVG HOUSEHOLD SIZE
2,031
LABOR FORCE [ PEOPLE ]
57.2%
PERCENT IN LABOR FORCE
12.8%
UNEMPLOYMENT RATE
Income in Northwest Harwich
Income Overview in Northwest Harwich
Per Capita Income in Northwest Harwich is $53,295, while median incomes of families and households are $92,500 and $81,268 respectively.
| Characteristic | Number | Measure |
| Per Capita Income | 4,076 | $53,295 |
| Median Family Income | 1,248 | $92,500 |
| Mean Family Income | 1,248 | $140,477 |
| Median Household Income | 1,720 | $81,268 |
| Mean Household Income | 1,720 | $121,993 |
| Income Deficit | 1,248 | $0 |
| Wage / Income Gap (%) | 4,076 | 45.97% |
| Wage / Income Gap ($) | 4,076 | 54.03¢ per $1 |
| Gini / Inequality Index | 4,076 | 0.46 |
Earnings by Sex in Northwest Harwich
Average Earnings in Northwest Harwich are $48,071, $62,656 for men and $33,850 for women, a difference of 46.0%.
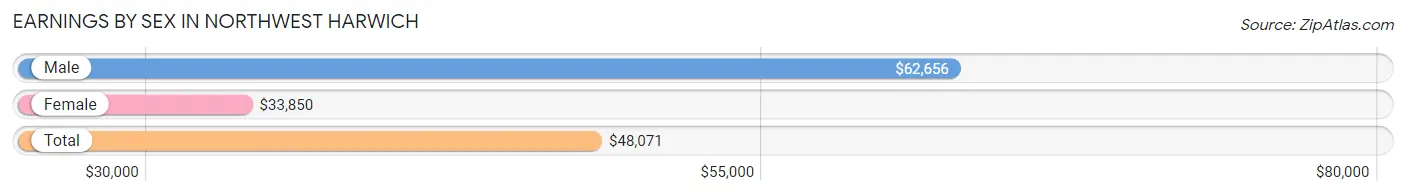
| Sex | Number | Average Earnings |
| Male | 1,162 (51.4%) | $62,656 |
| Female | 1,099 (48.6%) | $33,850 |
| Total | 2,261 (100.0%) | $48,071 |
Earnings by Sex by Income Bracket in Northwest Harwich
The most common earnings brackets in Northwest Harwich are $100,000+ for men (288 | 24.8%) and $7,500 to $9,999 for women (176 | 16.0%).
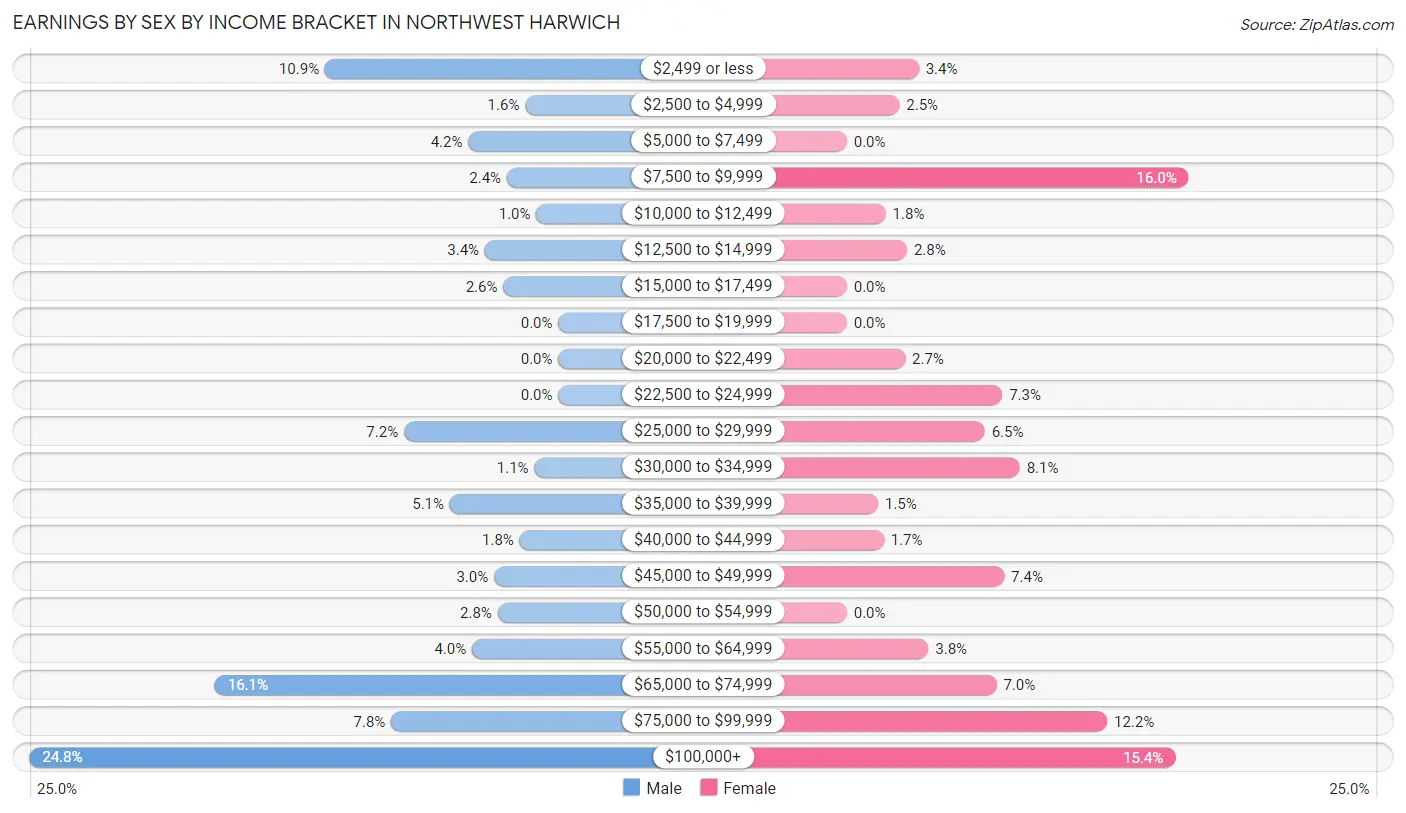
| Income | Male | Female |
| $2,499 or less | 127 (10.9%) | 37 (3.4%) |
| $2,500 to $4,999 | 18 (1.5%) | 27 (2.5%) |
| $5,000 to $7,499 | 49 (4.2%) | 0 (0.0%) |
| $7,500 to $9,999 | 28 (2.4%) | 176 (16.0%) |
| $10,000 to $12,499 | 12 (1.0%) | 20 (1.8%) |
| $12,500 to $14,999 | 40 (3.4%) | 31 (2.8%) |
| $15,000 to $17,499 | 30 (2.6%) | 0 (0.0%) |
| $17,500 to $19,999 | 0 (0.0%) | 0 (0.0%) |
| $20,000 to $22,499 | 0 (0.0%) | 30 (2.7%) |
| $22,500 to $24,999 | 0 (0.0%) | 80 (7.3%) |
| $25,000 to $29,999 | 84 (7.2%) | 71 (6.5%) |
| $30,000 to $34,999 | 13 (1.1%) | 89 (8.1%) |
| $35,000 to $39,999 | 59 (5.1%) | 16 (1.5%) |
| $40,000 to $44,999 | 21 (1.8%) | 19 (1.7%) |
| $45,000 to $49,999 | 35 (3.0%) | 81 (7.4%) |
| $50,000 to $54,999 | 33 (2.8%) | 0 (0.0%) |
| $55,000 to $64,999 | 47 (4.0%) | 42 (3.8%) |
| $65,000 to $74,999 | 187 (16.1%) | 77 (7.0%) |
| $75,000 to $99,999 | 91 (7.8%) | 134 (12.2%) |
| $100,000+ | 288 (24.8%) | 169 (15.4%) |
| Total | 1,162 (100.0%) | 1,099 (100.0%) |
Earnings by Sex by Educational Attainment in Northwest Harwich
Average earnings in Northwest Harwich are $68,940 for men and $35,938 for women, a difference of 47.9%. Men with an educational attainment of graduate degree enjoy the highest average annual earnings of $118,284, while those with high school diploma education earn the least with $51,477. Women with an educational attainment of graduate degree earn the most with the average annual earnings of $93,681, while those with high school diploma education have the smallest earnings of $30,455.
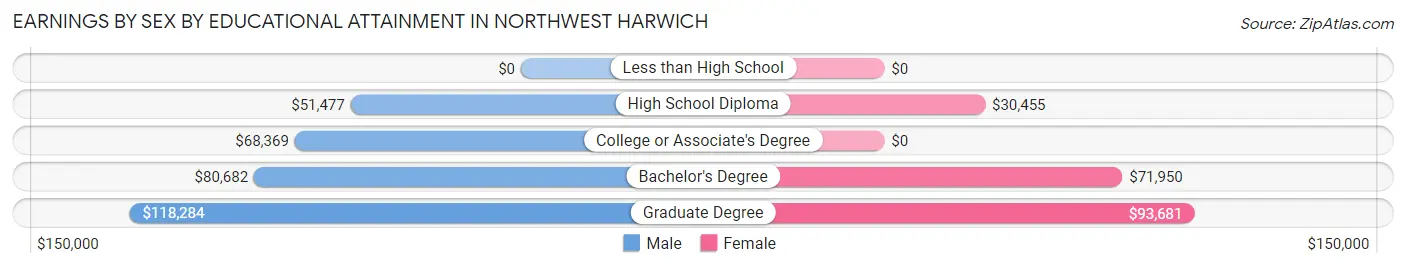
| Educational Attainment | Male Income | Female Income |
| Less than High School | - | - |
| High School Diploma | $51,477 | $30,455 |
| College or Associate's Degree | $68,369 | $0 |
| Bachelor's Degree | $80,682 | $71,950 |
| Graduate Degree | $118,284 | $93,681 |
| Total | $68,940 | $35,938 |
Family Income in Northwest Harwich
Family Income Brackets in Northwest Harwich
According to the Northwest Harwich family income data, there are 310 families falling into the $50,000 to $74,999 income range, which is the most common income bracket and makes up 24.8% of all families.
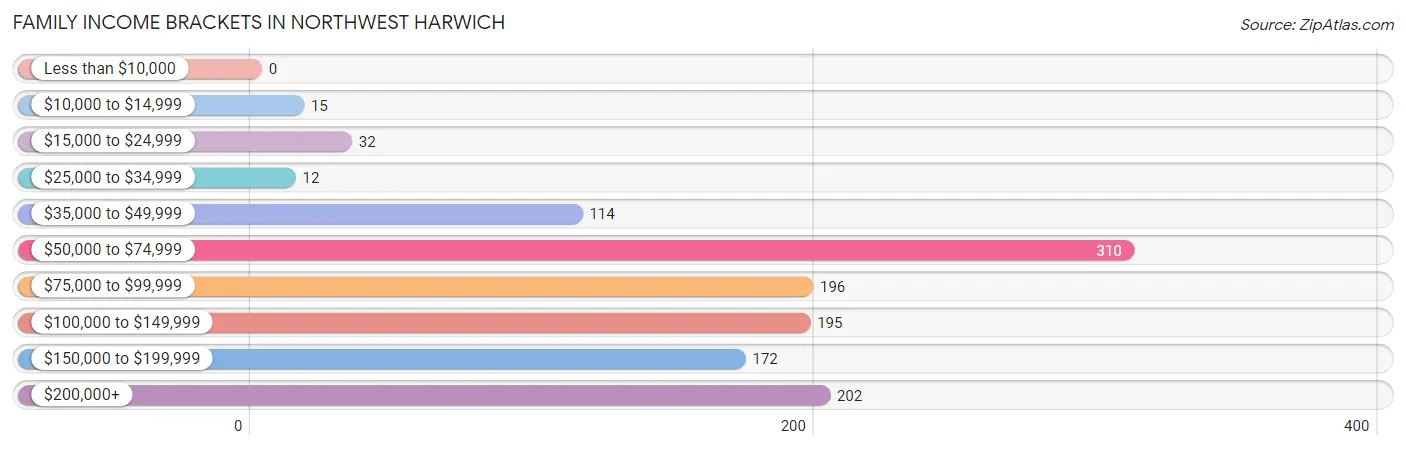
| Income Bracket | # Families | % Families |
| Less than $10,000 | 0 | 0.0% |
| $10,000 to $14,999 | 15 | 1.2% |
| $15,000 to $24,999 | 32 | 2.6% |
| $25,000 to $34,999 | 12 | 1.0% |
| $35,000 to $49,999 | 114 | 9.1% |
| $50,000 to $74,999 | 310 | 24.8% |
| $75,000 to $99,999 | 196 | 15.7% |
| $100,000 to $149,999 | 195 | 15.6% |
| $150,000 to $199,999 | 172 | 13.8% |
| $200,000+ | 202 | 16.2% |
Family Income by Famaliy Size in Northwest Harwich
4-person families (94 | 7.5%) account for the highest median family income in Northwest Harwich with $225,890 per family, while 4-person families (94 | 7.5%) have the highest median income of $56,472 per family member.
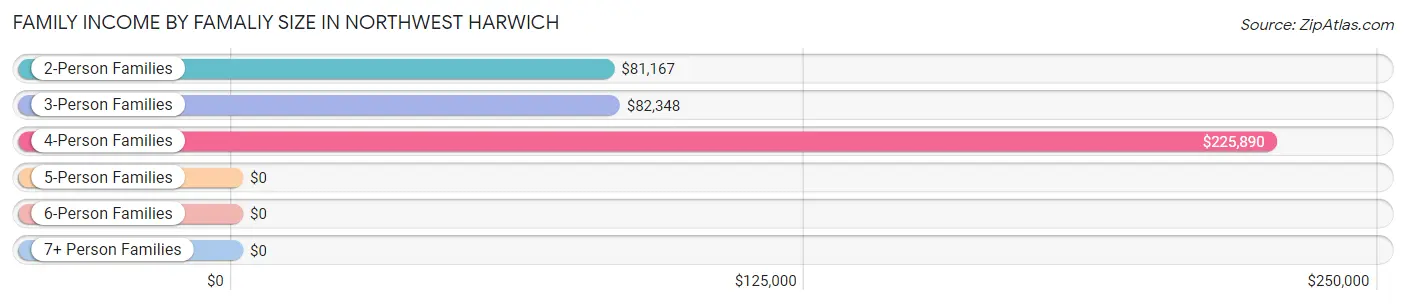
| Income Bracket | # Families | Median Income |
| 2-Person Families | 896 (71.8%) | $81,167 |
| 3-Person Families | 232 (18.6%) | $82,348 |
| 4-Person Families | 94 (7.5%) | $225,890 |
| 5-Person Families | 26 (2.1%) | $0 |
| 6-Person Families | 0 (0.0%) | $0 |
| 7+ Person Families | 0 (0.0%) | $0 |
| Total | 1,248 (100.0%) | $92,500 |
Family Income by Number of Earners in Northwest Harwich
The median family income in Northwest Harwich is $92,500, with families comprising 3+ earners (134) having the highest median family income of $225,424, while families with 1 earner (420) have the lowest median family income of $69,703, accounting for 10.7% and 33.7% of families, respectively.
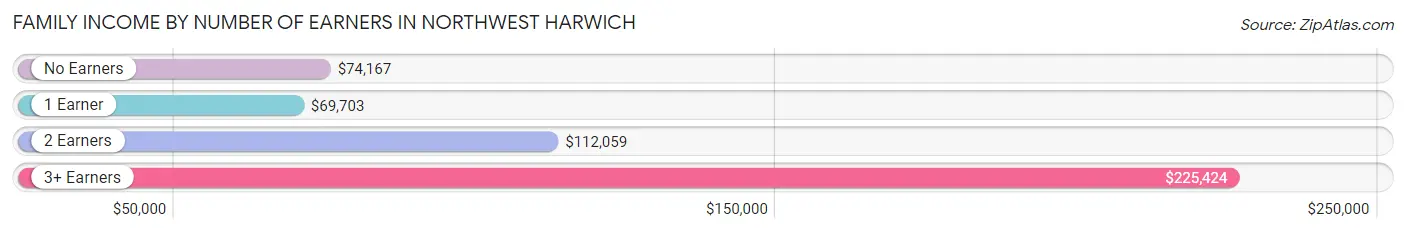
| Number of Earners | # Families | Median Income |
| No Earners | 250 (20.0%) | $74,167 |
| 1 Earner | 420 (33.7%) | $69,703 |
| 2 Earners | 444 (35.6%) | $112,059 |
| 3+ Earners | 134 (10.7%) | $225,424 |
| Total | 1,248 (100.0%) | $92,500 |
Household Income in Northwest Harwich
Household Income Brackets in Northwest Harwich
With 354 households falling in the category, the $75,000 to $99,999 income range is the most frequent in Northwest Harwich, accounting for 20.6% of all households. In contrast, only 22 households (1.3%) fall into the $25,000 to $34,999 income bracket, making it the least populous group.
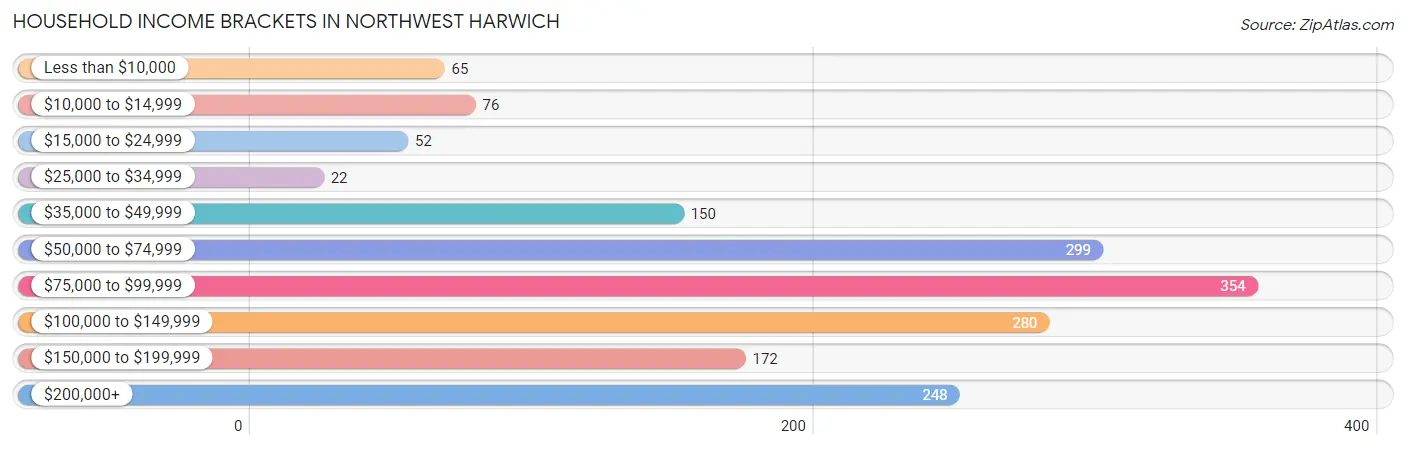
| Income Bracket | # Households | % Households |
| Less than $10,000 | 65 | 3.8% |
| $10,000 to $14,999 | 76 | 4.4% |
| $15,000 to $24,999 | 52 | 3.0% |
| $25,000 to $34,999 | 22 | 1.3% |
| $35,000 to $49,999 | 150 | 8.7% |
| $50,000 to $74,999 | 299 | 17.4% |
| $75,000 to $99,999 | 354 | 20.6% |
| $100,000 to $149,999 | 280 | 16.3% |
| $150,000 to $199,999 | 172 | 10.0% |
| $200,000+ | 248 | 14.4% |
Household Income by Householder Age in Northwest Harwich
The median household income in Northwest Harwich is $81,268, with the highest median household income of $99,231 found in the 25 to 44 years age bracket for the primary householder. A total of 136 households (7.9%) fall into this category. Meanwhile, the 15 to 24 years age bracket for the primary householder has the lowest median household income of $0, with 15 households (0.9%) in this group.
| Income Bracket | # Households | Median Income |
| 15 to 24 Years | 15 (0.9%) | $0 |
| 25 to 44 Years | 136 (7.9%) | $99,231 |
| 45 to 64 Years | 852 (49.5%) | $91,944 |
| 65+ Years | 717 (41.7%) | $73,542 |
| Total | 1,720 (100.0%) | $81,268 |
Poverty in Northwest Harwich
Income Below Poverty by Sex and Age in Northwest Harwich
With 4.7% poverty level for males and 15.5% for females among the residents of Northwest Harwich, 18 to 24 year old males and 45 to 54 year old females are the most vulnerable to poverty, with 14 males (16.7%) and 115 females (33.2%) in their respective age groups living below the poverty level.
| Age Bracket | Male | Female |
| Under 5 Years | 0 (0.0%) | 0 (0.0%) |
| 5 Years | 0 (0.0%) | 0 (0.0%) |
| 6 to 11 Years | 0 (0.0%) | 0 (0.0%) |
| 12 to 14 Years | 0 (0.0%) | 0 (0.0%) |
| 15 Years | 0 (0.0%) | 0 (0.0%) |
| 16 and 17 Years | 0 (0.0%) | 0 (0.0%) |
| 18 to 24 Years | 14 (16.7%) | 0 (0.0%) |
| 25 to 34 Years | 0 (0.0%) | 0 (0.0%) |
| 35 to 44 Years | 9 (9.1%) | 28 (19.2%) |
| 45 to 54 Years | 28 (8.8%) | 115 (33.2%) |
| 55 to 64 Years | 28 (7.8%) | 45 (9.4%) |
| 65 to 74 Years | 8 (2.2%) | 36 (11.2%) |
| 75 Years and over | 10 (5.0%) | 75 (22.9%) |
| Total | 97 (4.7%) | 299 (15.5%) |
Income Above Poverty by Sex and Age in Northwest Harwich
According to the poverty statistics in Northwest Harwich, males aged under 5 years and females aged under 5 years are the age groups that are most secure financially, with 100.0% of males and 100.0% of females in these age groups living above the poverty line.
| Age Bracket | Male | Female |
| Under 5 Years | 43 (100.0%) | 85 (100.0%) |
| 5 Years | 18 (100.0%) | 35 (100.0%) |
| 6 to 11 Years | 183 (100.0%) | 12 (100.0%) |
| 12 to 14 Years | 73 (100.0%) | 0 (0.0%) |
| 15 Years | 65 (100.0%) | 0 (0.0%) |
| 16 and 17 Years | 127 (100.0%) | 12 (100.0%) |
| 18 to 24 Years | 70 (83.3%) | 51 (100.0%) |
| 25 to 34 Years | 132 (100.0%) | 108 (100.0%) |
| 35 to 44 Years | 90 (90.9%) | 118 (80.8%) |
| 45 to 54 Years | 291 (91.2%) | 231 (66.8%) |
| 55 to 64 Years | 331 (92.2%) | 435 (90.6%) |
| 65 to 74 Years | 347 (97.8%) | 286 (88.8%) |
| 75 Years and over | 189 (95.0%) | 252 (77.1%) |
| Total | 1,959 (95.3%) | 1,625 (84.5%) |
Income Below Poverty Among Married-Couple Families in Northwest Harwich
The poverty statistics for married-couple families in Northwest Harwich show that 1.7% or 15 of the total 895 families live below the poverty line. Families with no children have the highest poverty rate of 2.1%, comprising of 15 families. On the other hand, families with 1 or 2 children have the lowest poverty rate of 0.0%, which includes 0 families.
| Children | Above Poverty | Below Poverty |
| No Children | 707 (97.9%) | 15 (2.1%) |
| 1 or 2 Children | 173 (100.0%) | 0 (0.0%) |
| 3 or 4 Children | 0 (0.0%) | 0 (0.0%) |
| 5 or more Children | 0 (0.0%) | 0 (0.0%) |
| Total | 880 (98.3%) | 15 (1.7%) |
Income Below Poverty Among Single-Parent Households in Northwest Harwich
According to the poverty data in Northwest Harwich, 4.4% or 9 single-father households and 15.3% or 23 single-mother households are living below the poverty line. Among single-father households, those with no children have the highest poverty rate, with 9 households (50.0%) experiencing poverty. Likewise, among single-mother households, those with no children have the highest poverty rate, with 23 households (23.0%) falling below the poverty line.

| Children | Single Father | Single Mother |
| No Children | 9 (50.0%) | 23 (23.0%) |
| 1 or 2 Children | 0 (0.0%) | 0 (0.0%) |
| 3 or 4 Children | 0 (0.0%) | 0 (0.0%) |
| 5 or more Children | 0 (0.0%) | 0 (0.0%) |
| Total | 9 (4.4%) | 23 (15.3%) |
Income Below Poverty Among Married-Couple vs Single-Parent Households in Northwest Harwich
The poverty data for Northwest Harwich shows that 15 of the married-couple family households (1.7%) and 32 of the single-parent households (9.1%) are living below the poverty level. Within the married-couple family households, those with no children have the highest poverty rate, with 15 households (2.1%) falling below the poverty line. Among the single-parent households, those with no children have the highest poverty rate, with 32 household (27.1%) living below poverty.
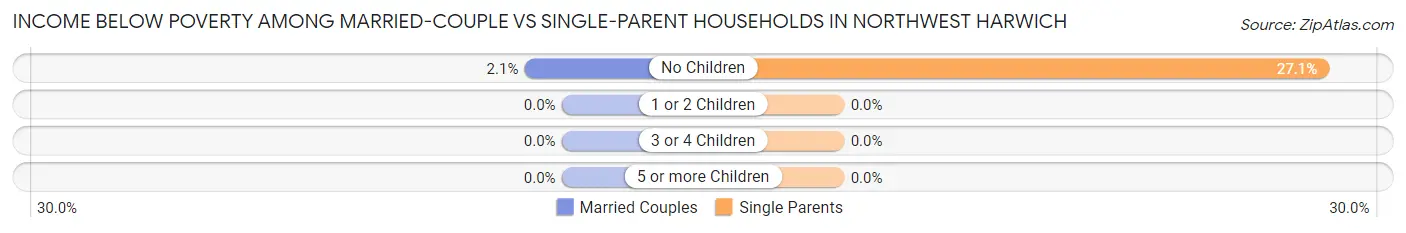
| Children | Married-Couple Families | Single-Parent Households |
| No Children | 15 (2.1%) | 32 (27.1%) |
| 1 or 2 Children | 0 (0.0%) | 0 (0.0%) |
| 3 or 4 Children | 0 (0.0%) | 0 (0.0%) |
| 5 or more Children | 0 (0.0%) | 0 (0.0%) |
| Total | 15 (1.7%) | 32 (9.1%) |
Race in Northwest Harwich
The most populous races in Northwest Harwich are White / Caucasian (3,393 | 83.2%), Two or more Races (378 | 9.3%), and Some other Race (237 | 5.8%).
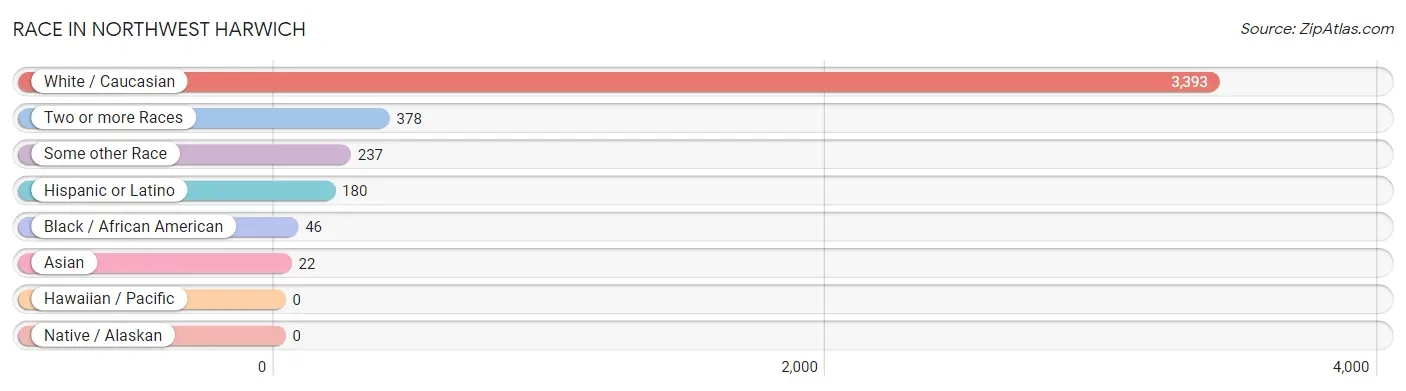
| Race | # Population | % Population |
| Asian | 22 | 0.5% |
| Black / African American | 46 | 1.1% |
| Hawaiian / Pacific | 0 | 0.0% |
| Hispanic or Latino | 180 | 4.4% |
| Native / Alaskan | 0 | 0.0% |
| White / Caucasian | 3,393 | 83.2% |
| Two or more Races | 378 | 9.3% |
| Some other Race | 237 | 5.8% |
| Total | 4,076 | 100.0% |
Ancestry in Northwest Harwich
The most populous ancestries reported in Northwest Harwich are Irish (1,047 | 25.7%), English (758 | 18.6%), American (322 | 7.9%), Greek (280 | 6.9%), and Italian (220 | 5.4%), together accounting for 64.5% of all Northwest Harwich residents.
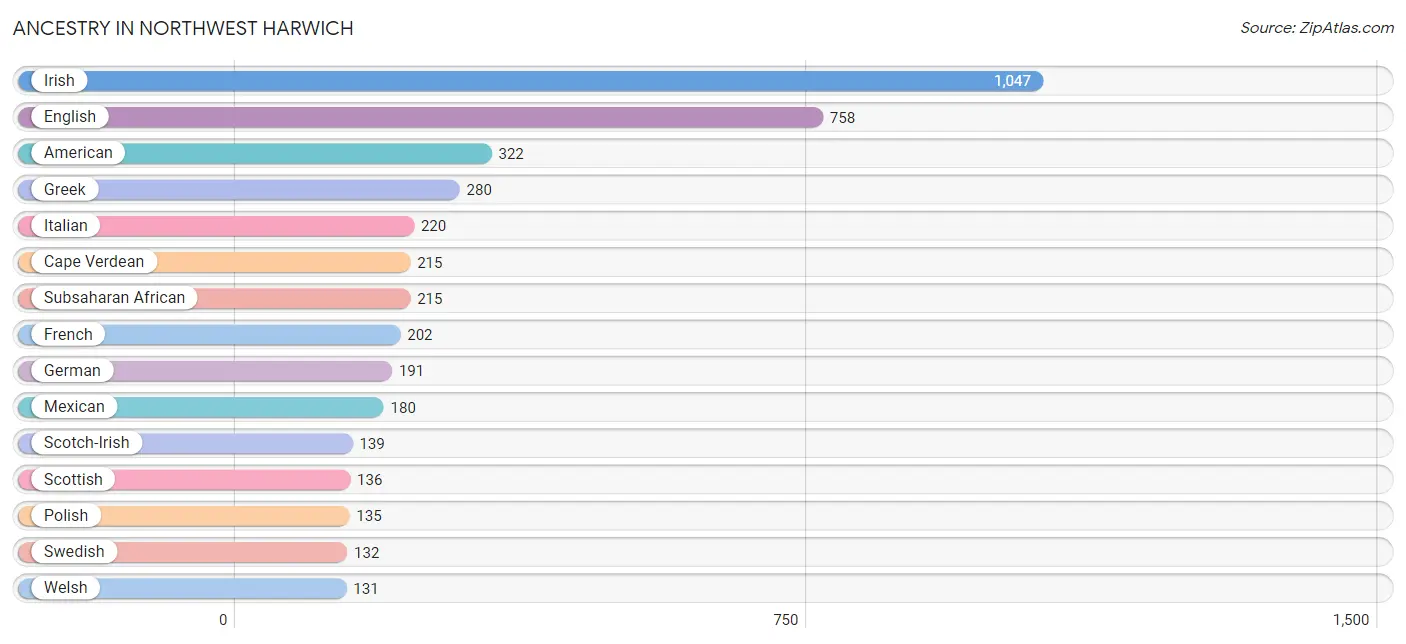
| Ancestry | # Population | % Population |
| American | 322 | 7.9% |
| Arab | 20 | 0.5% |
| Armenian | 18 | 0.4% |
| Austrian | 11 | 0.3% |
| British | 17 | 0.4% |
| Burmese | 14 | 0.3% |
| Canadian | 65 | 1.6% |
| Cape Verdean | 215 | 5.3% |
| Cherokee | 121 | 3.0% |
| Danish | 13 | 0.3% |
| Dutch | 12 | 0.3% |
| Eastern European | 10 | 0.3% |
| English | 758 | 18.6% |
| European | 75 | 1.8% |
| Finnish | 27 | 0.7% |
| French | 202 | 5.0% |
| French Canadian | 61 | 1.5% |
| German | 191 | 4.7% |
| Greek | 280 | 6.9% |
| Haitian | 46 | 1.1% |
| Hungarian | 26 | 0.6% |
| Indian (Asian) | 22 | 0.5% |
| Irish | 1,047 | 25.7% |
| Italian | 220 | 5.4% |
| Lebanese | 20 | 0.5% |
| Lithuanian | 43 | 1.1% |
| Mexican | 180 | 4.4% |
| Northern European | 18 | 0.4% |
| Norwegian | 27 | 0.7% |
| Pennsylvania German | 8 | 0.2% |
| Polish | 135 | 3.3% |
| Portuguese | 78 | 1.9% |
| Russian | 24 | 0.6% |
| Scotch-Irish | 139 | 3.4% |
| Scottish | 136 | 3.3% |
| Subsaharan African | 215 | 5.3% |
| Swedish | 132 | 3.2% |
| Ukrainian | 8 | 0.2% |
| Welsh | 131 | 3.2% | View All 39 Rows |
Immigrants in Northwest Harwich
The most numerous immigrant groups reported in Northwest Harwich came from Caribbean (46 | 1.1%), Europe (46 | 1.1%), Jamaica (46 | 1.1%), Latin America (46 | 1.1%), and Western Europe (30 | 0.7%), together accounting for 5.3% of all Northwest Harwich residents.
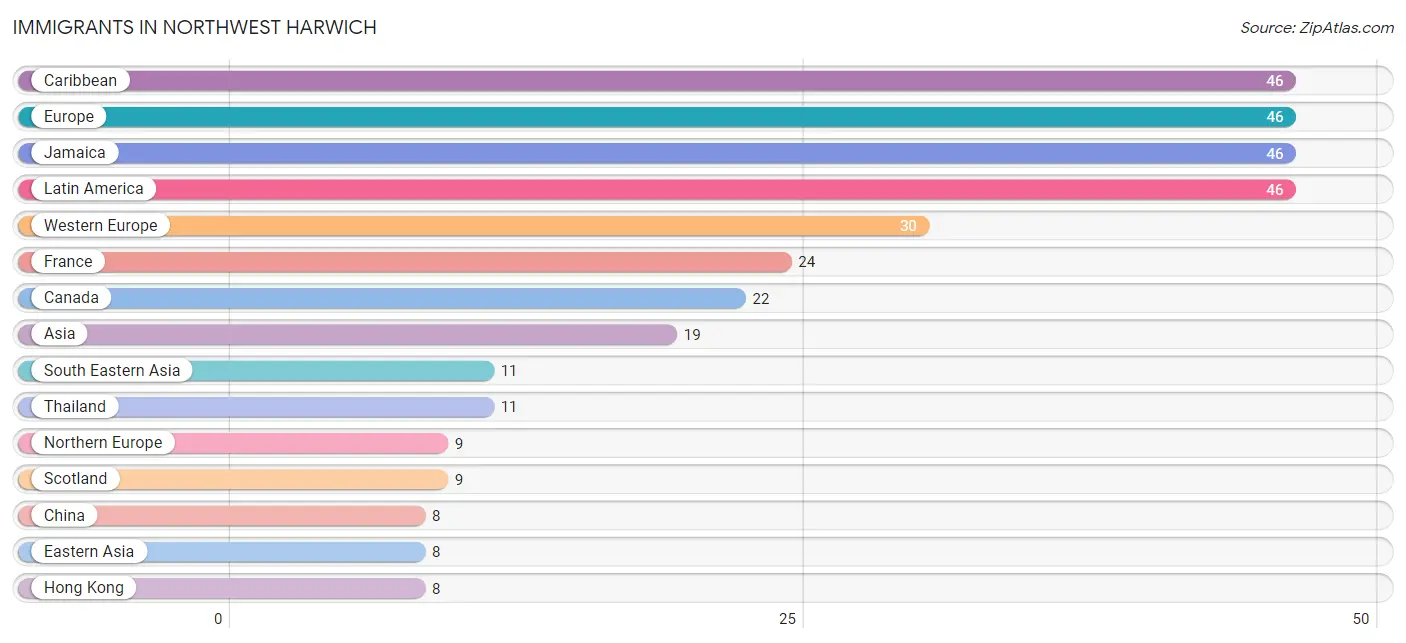
| Immigration Origin | # Population | % Population |
| Asia | 19 | 0.5% |
| Canada | 22 | 0.5% |
| Caribbean | 46 | 1.1% |
| China | 8 | 0.2% |
| Eastern Asia | 8 | 0.2% |
| Eastern Europe | 7 | 0.2% |
| Europe | 46 | 1.1% |
| France | 24 | 0.6% |
| Hong Kong | 8 | 0.2% |
| Jamaica | 46 | 1.1% |
| Latin America | 46 | 1.1% |
| Netherlands | 6 | 0.2% |
| Northern Europe | 9 | 0.2% |
| Poland | 7 | 0.2% |
| Scotland | 9 | 0.2% |
| South Eastern Asia | 11 | 0.3% |
| Thailand | 11 | 0.3% |
| Western Europe | 30 | 0.7% | View All 18 Rows |
Sex and Age in Northwest Harwich
Sex and Age in Northwest Harwich
The most populous age groups in Northwest Harwich are 60 to 64 Years (242 | 11.4%) for men and 60 to 64 Years (284 | 14.5%) for women.
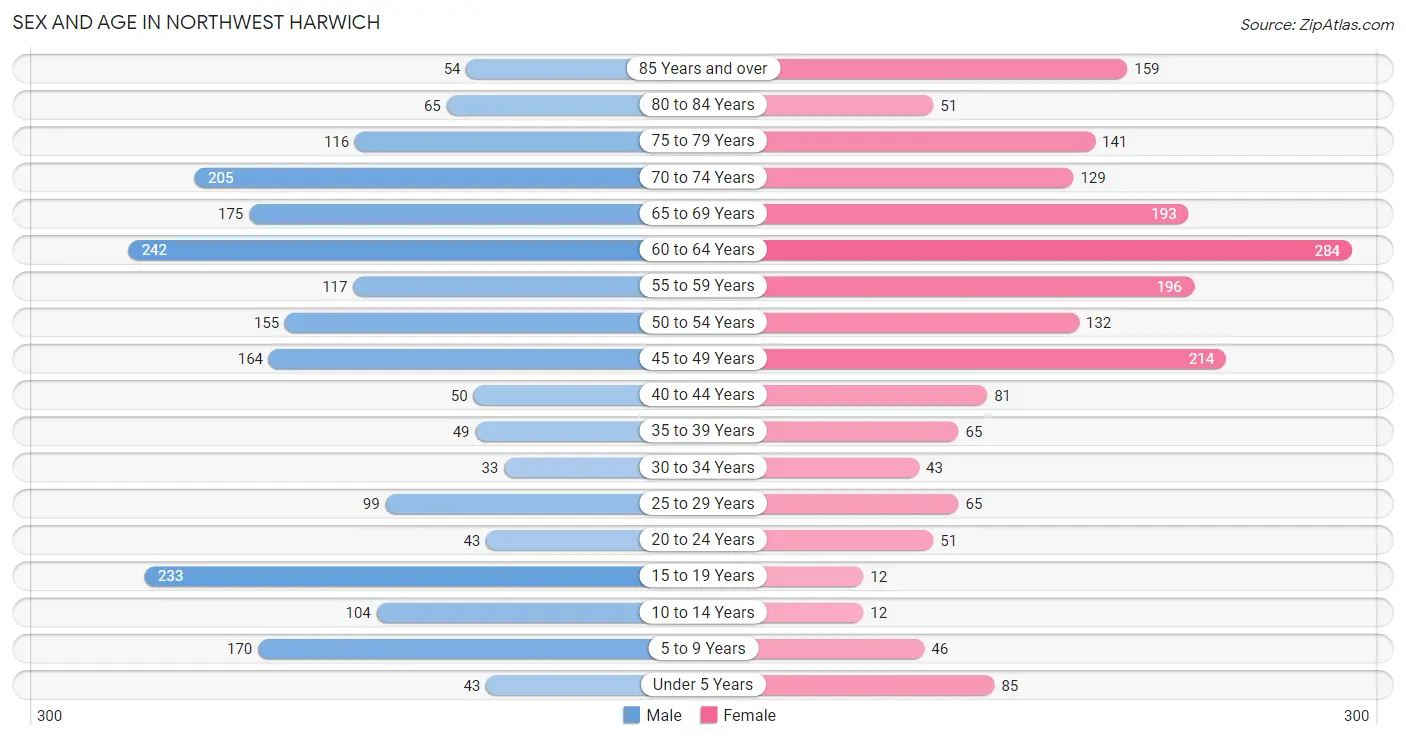
| Age Bracket | Male | Female |
| Under 5 Years | 43 (2.0%) | 85 (4.3%) |
| 5 to 9 Years | 170 (8.0%) | 46 (2.4%) |
| 10 to 14 Years | 104 (4.9%) | 12 (0.6%) |
| 15 to 19 Years | 233 (11.0%) | 12 (0.6%) |
| 20 to 24 Years | 43 (2.0%) | 51 (2.6%) |
| 25 to 29 Years | 99 (4.7%) | 65 (3.3%) |
| 30 to 34 Years | 33 (1.6%) | 43 (2.2%) |
| 35 to 39 Years | 49 (2.3%) | 65 (3.3%) |
| 40 to 44 Years | 50 (2.4%) | 81 (4.1%) |
| 45 to 49 Years | 164 (7.7%) | 214 (10.9%) |
| 50 to 54 Years | 155 (7.3%) | 132 (6.7%) |
| 55 to 59 Years | 117 (5.5%) | 196 (10.0%) |
| 60 to 64 Years | 242 (11.4%) | 284 (14.5%) |
| 65 to 69 Years | 175 (8.3%) | 193 (9.9%) |
| 70 to 74 Years | 205 (9.7%) | 129 (6.6%) |
| 75 to 79 Years | 116 (5.5%) | 141 (7.2%) |
| 80 to 84 Years | 65 (3.1%) | 51 (2.6%) |
| 85 Years and over | 54 (2.5%) | 159 (8.1%) |
| Total | 2,117 (100.0%) | 1,959 (100.0%) |
Families and Households in Northwest Harwich
Median Family Size in Northwest Harwich
The median family size in Northwest Harwich is 2.57 persons per family, with married-couple families (895 | 71.7%) accounting for the largest median family size of 2.61 persons per family. On the other hand, single male/father families (203 | 16.3%) represent the smallest median family size with 2.44 persons per family.
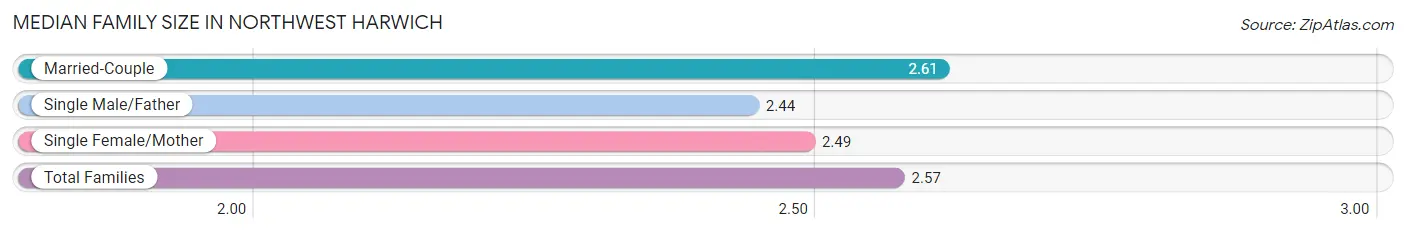
| Family Type | # Families | Family Size |
| Married-Couple | 895 (71.7%) | 2.61 |
| Single Male/Father | 203 (16.3%) | 2.44 |
| Single Female/Mother | 150 (12.0%) | 2.49 |
| Total Families | 1,248 (100.0%) | 2.57 |
Median Household Size in Northwest Harwich
The median household size in Northwest Harwich is 2.31 persons per household, with single male/father households (203 | 11.8%) accounting for the largest median household size of 3.21 persons per household. non-family households (472 | 27.4%) represent the smallest median household size with 1.18 persons per household.
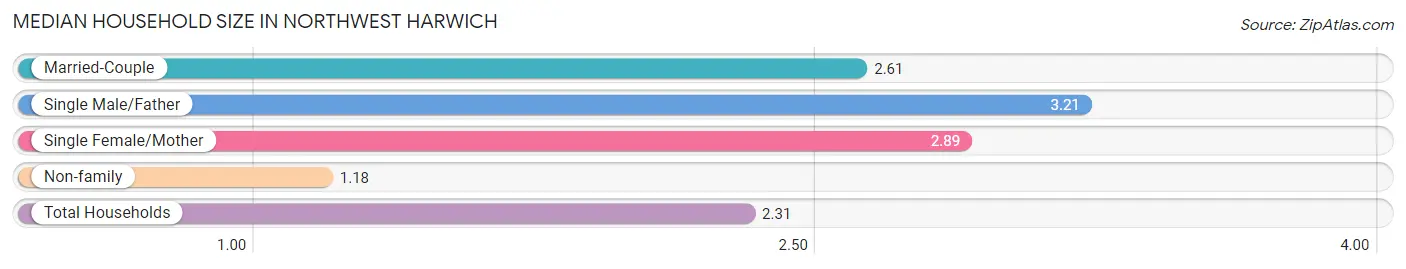
| Household Type | # Households | Household Size |
| Married-Couple | 895 (52.0%) | 2.61 |
| Single Male/Father | 203 (11.8%) | 3.21 |
| Single Female/Mother | 150 (8.7%) | 2.89 |
| Non-family | 472 (27.4%) | 1.18 |
| Total Households | 1,720 (100.0%) | 2.31 |
Household Size by Marriage Status in Northwest Harwich
Out of a total of 1,720 households in Northwest Harwich, 1,248 (72.6%) are family households, while 472 (27.4%) are nonfamily households. The most numerous type of family households are 2-person households, comprising 753, and the most common type of nonfamily households are 1-person households, comprising 398.
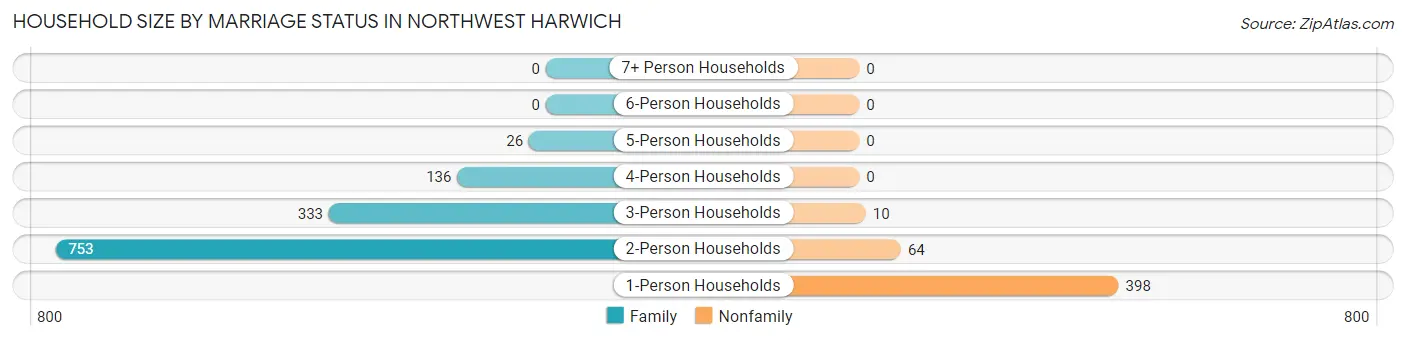
| Household Size | Family Households | Nonfamily Households |
| 1-Person Households | - | 398 (23.1%) |
| 2-Person Households | 753 (43.8%) | 64 (3.7%) |
| 3-Person Households | 333 (19.4%) | 10 (0.6%) |
| 4-Person Households | 136 (7.9%) | 0 (0.0%) |
| 5-Person Households | 26 (1.5%) | 0 (0.0%) |
| 6-Person Households | 0 (0.0%) | 0 (0.0%) |
| 7+ Person Households | 0 (0.0%) | 0 (0.0%) |
| Total | 1,248 (72.6%) | 472 (27.4%) |
Female Fertility in Northwest Harwich
Fertility by Age in Northwest Harwich
Average fertility rate in Northwest Harwich is 26.0 births per 1,000 women. Women in the age bracket of 20 to 34 years have the highest fertility rate with 88.0 births per 1,000 women. Women in the age bracket of 20 to 34 years acount for 100.0% of all women with births.
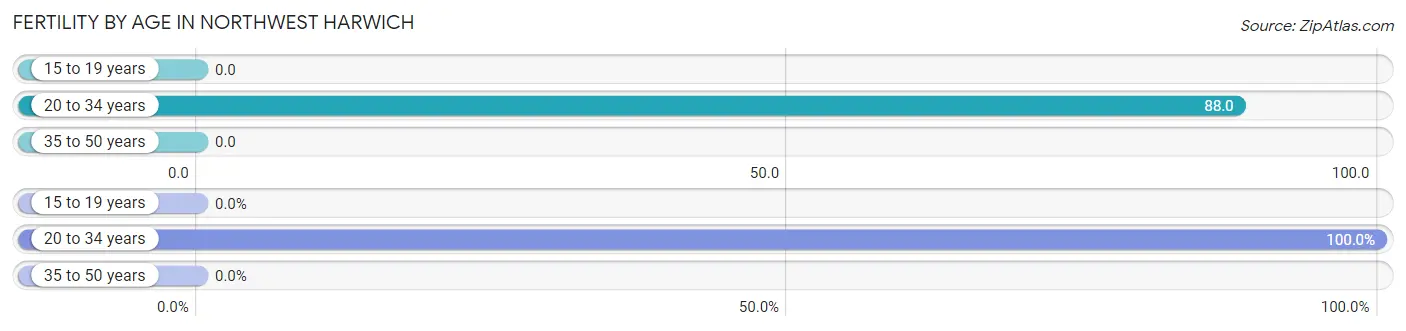
| Age Bracket | Women with Births | Births / 1,000 Women |
| 15 to 19 years | 0 (0.0%) | 0.0 |
| 20 to 34 years | 14 (100.0%) | 88.0 |
| 35 to 50 years | 0 (0.0%) | 0.0 |
| Total | 14 (100.0%) | 26.0 |
Fertility by Age by Marriage Status in Northwest Harwich
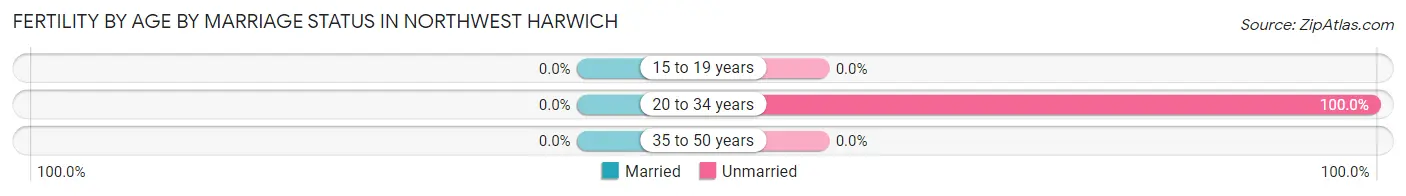
| Age Bracket | Married | Unmarried |
| 15 to 19 years | 0 (0.0%) | 0 (0.0%) |
| 20 to 34 years | 0 (0.0%) | 14 (100.0%) |
| 35 to 50 years | 0 (0.0%) | 0 (0.0%) |
| Total | 0 (0.0%) | 14 (100.0%) |
Fertility by Education in Northwest Harwich
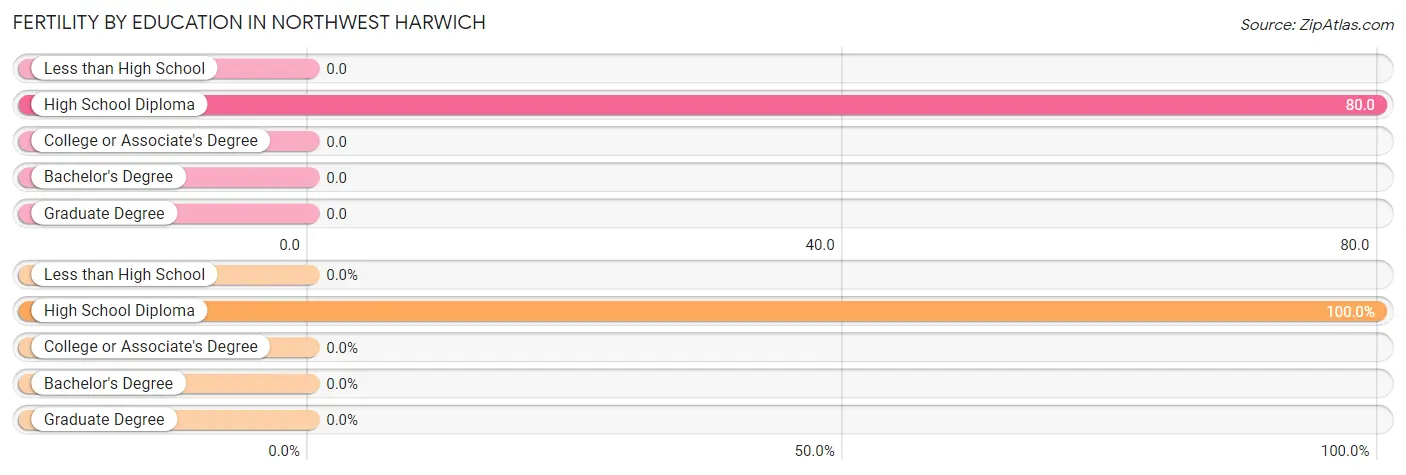
| Educational Attainment | Women with Births | Births / 1,000 Women |
| Less than High School | 0 (0.0%) | 0.0 |
| High School Diploma | 14 (100.0%) | 80.0 |
| College or Associate's Degree | 0 (0.0%) | 0.0 |
| Bachelor's Degree | 0 (0.0%) | 0.0 |
| Graduate Degree | 0 (0.0%) | 0.0 |
| Total | 14 (100.0%) | 26.0 |
Fertility by Education by Marriage Status in Northwest Harwich
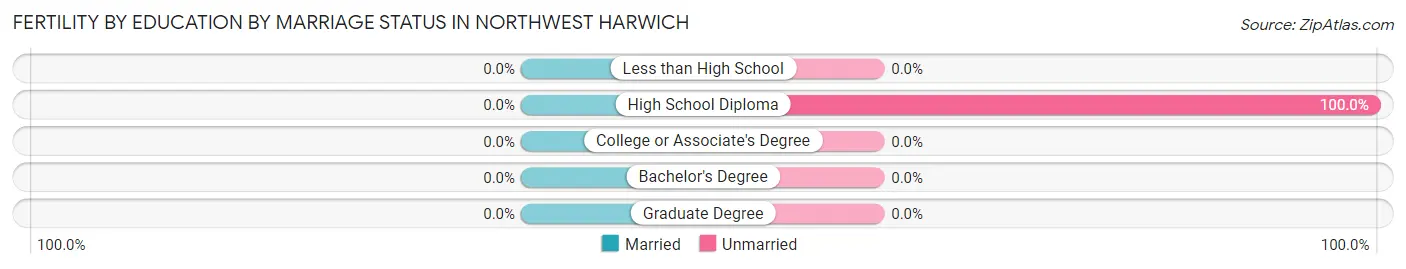
| Educational Attainment | Married | Unmarried |
| Less than High School | 0 (0.0%) | 0 (0.0%) |
| High School Diploma | 0 (0.0%) | 14 (100.0%) |
| College or Associate's Degree | 0 (0.0%) | 0 (0.0%) |
| Bachelor's Degree | 0 (0.0%) | 0 (0.0%) |
| Graduate Degree | 0 (0.0%) | 0 (0.0%) |
| Total | 0 (0.0%) | 14 (100.0%) |
Employment Characteristics in Northwest Harwich
Employment by Class of Employer in Northwest Harwich
Among the 1,741 employed individuals in Northwest Harwich, private company employees (1,008 | 57.9%), local government employees (286 | 16.4%), and not-for-profit organizations (192 | 11.0%) make up the most common classes of employment.
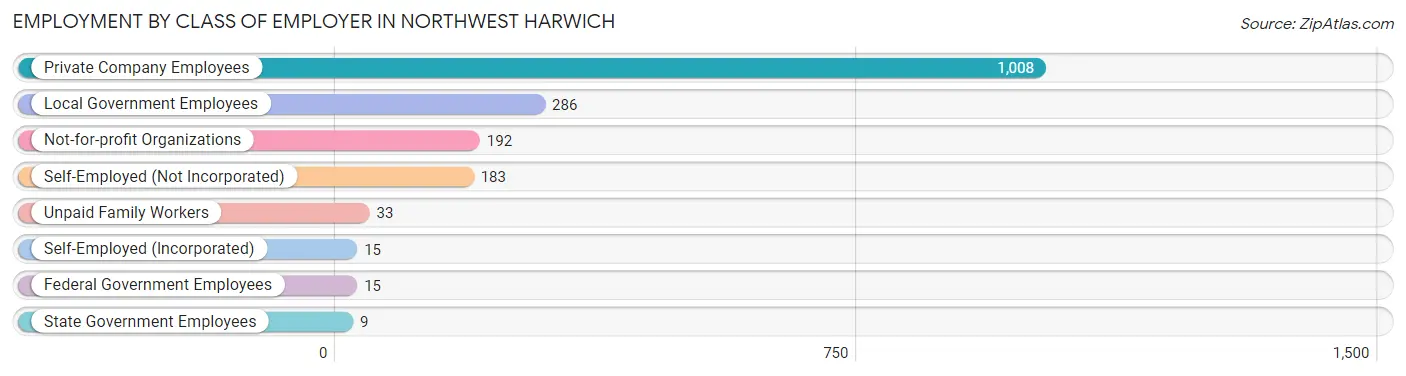
| Employer Class | # Employees | % Employees |
| Private Company Employees | 1,008 | 57.9% |
| Self-Employed (Incorporated) | 15 | 0.9% |
| Self-Employed (Not Incorporated) | 183 | 10.5% |
| Not-for-profit Organizations | 192 | 11.0% |
| Local Government Employees | 286 | 16.4% |
| State Government Employees | 9 | 0.5% |
| Federal Government Employees | 15 | 0.9% |
| Unpaid Family Workers | 33 | 1.9% |
| Total | 1,741 | 100.0% |
Employment Status by Age in Northwest Harwich
According to the labor force statistics for Northwest Harwich, out of the total population over 16 years of age (3,551), 57.2% or 2,031 individuals are in the labor force, with 12.8% or 260 of them unemployed. The age group with the highest labor force participation rate is 20 to 24 years, with 100.0% or 94 individuals in the labor force. Within the labor force, the 45 to 54 years age range has the highest percentage of unemployed individuals, with 23.6% or 115 of them being unemployed.
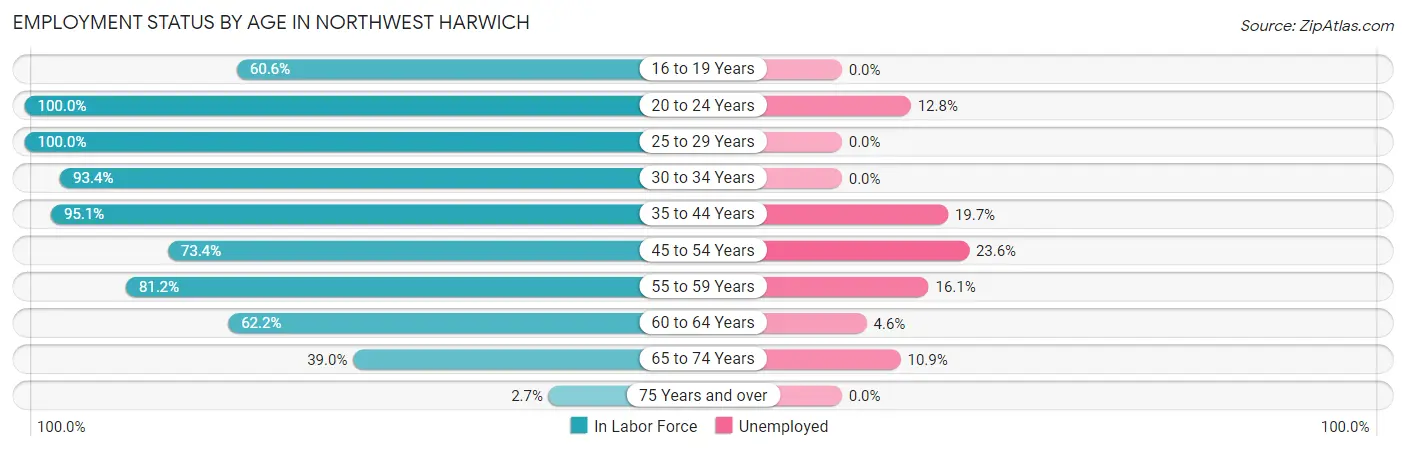
| Age Bracket | In Labor Force | Unemployed |
| 16 to 19 Years | 109 (60.6%) | 0 (0.0%) |
| 20 to 24 Years | 94 (100.0%) | 12 (12.8%) |
| 25 to 29 Years | 164 (100.0%) | 0 (0.0%) |
| 30 to 34 Years | 71 (93.4%) | 0 (0.0%) |
| 35 to 44 Years | 233 (95.1%) | 46 (19.7%) |
| 45 to 54 Years | 488 (73.4%) | 115 (23.6%) |
| 55 to 59 Years | 254 (81.2%) | 41 (16.1%) |
| 60 to 64 Years | 327 (62.2%) | 15 (4.6%) |
| 65 to 74 Years | 274 (39.0%) | 30 (10.9%) |
| 75 Years and over | 16 (2.7%) | 0 (0.0%) |
| Total | 2,031 (57.2%) | 260 (12.8%) |
Employment Status by Educational Attainment in Northwest Harwich
According to labor force statistics for Northwest Harwich, 77.3% of individuals (1,537) out of the total population between 25 and 64 years of age (1,989) are in the labor force, with 14.1% or 217 of them being unemployed. The group with the highest labor force participation rate are those with the educational attainment of bachelor's degree or higher, with 84.0% or 647 individuals in the labor force. Within the labor force, individuals with college / associate degree education have the highest percentage of unemployment, with 36.9% or 141 of them being unemployed.
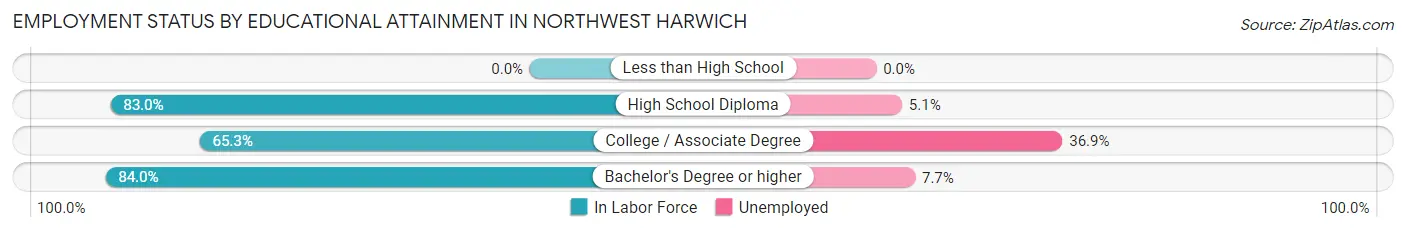
| Educational Attainment | In Labor Force | Unemployed |
| Less than High School | 0 (0.0%) | 0 (0.0%) |
| High School Diploma | 508 (83.0%) | 31 (5.1%) |
| College / Associate Degree | 382 (65.3%) | 216 (36.9%) |
| Bachelor's Degree or higher | 647 (84.0%) | 59 (7.7%) |
| Total | 1,537 (77.3%) | 280 (14.1%) |
Employment Occupations by Sex in Northwest Harwich
Management, Business, Science and Arts Occupations
The most common Management, Business, Science and Arts occupations in Northwest Harwich are Community & Social Service (309 | 17.4%), Management (276 | 15.6%), Education Instruction & Library (253 | 14.3%), Business & Financial (82 | 4.6%), and Health Diagnosing & Treating (71 | 4.0%).
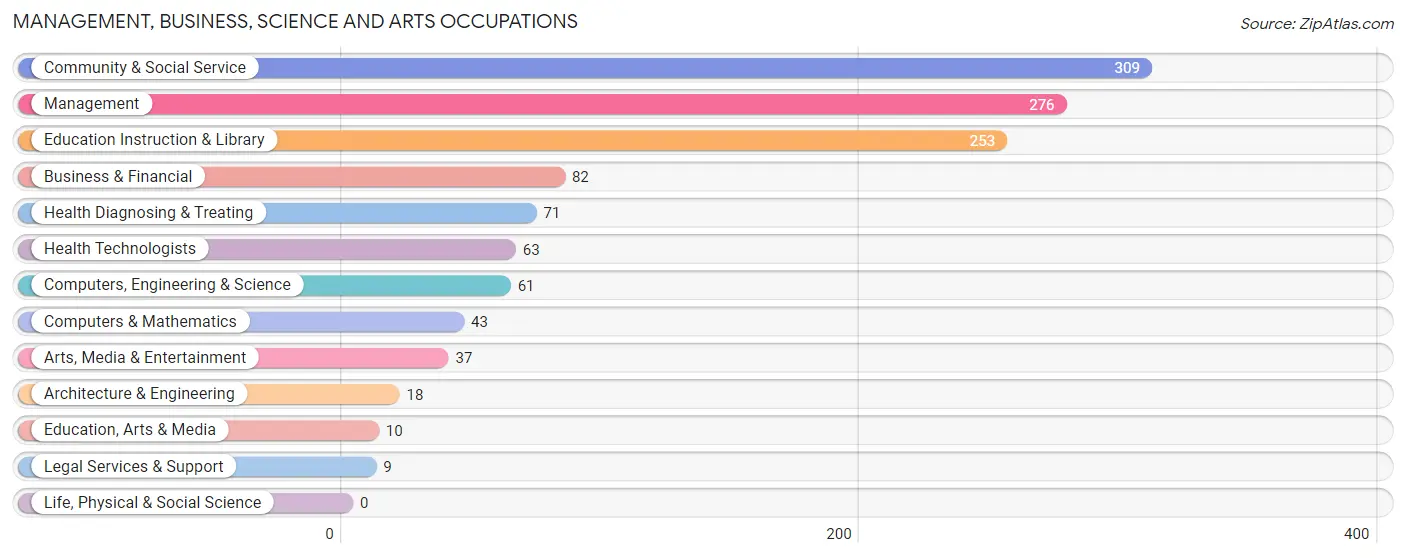
Management, Business, Science and Arts Occupations by Sex
Within the Management, Business, Science and Arts occupations in Northwest Harwich, the most male-oriented occupations are Legal Services & Support (100.0%), Computers & Mathematics (69.8%), and Business & Financial (54.9%), while the most female-oriented occupations are Architecture & Engineering (100.0%), Education, Arts & Media (100.0%), and Health Diagnosing & Treating (87.3%).
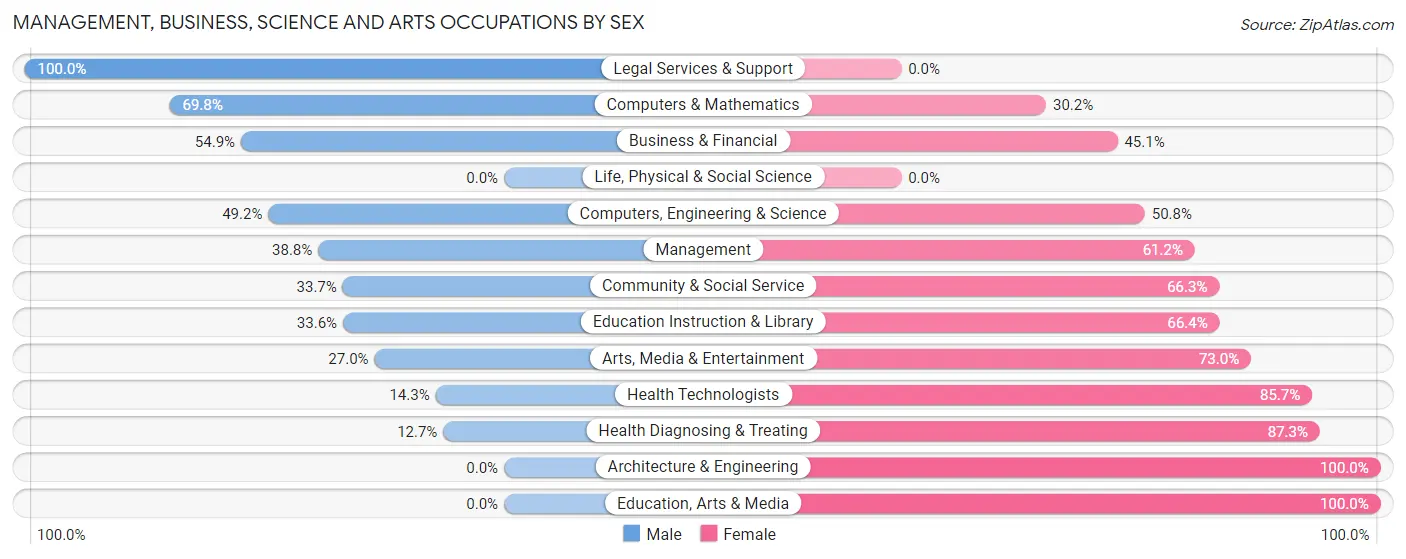
| Occupation | Male | Female |
| Management | 107 (38.8%) | 169 (61.2%) |
| Business & Financial | 45 (54.9%) | 37 (45.1%) |
| Computers, Engineering & Science | 30 (49.2%) | 31 (50.8%) |
| Computers & Mathematics | 30 (69.8%) | 13 (30.2%) |
| Architecture & Engineering | 0 (0.0%) | 18 (100.0%) |
| Life, Physical & Social Science | 0 (0.0%) | 0 (0.0%) |
| Community & Social Service | 104 (33.7%) | 205 (66.3%) |
| Education, Arts & Media | 0 (0.0%) | 10 (100.0%) |
| Legal Services & Support | 9 (100.0%) | 0 (0.0%) |
| Education Instruction & Library | 85 (33.6%) | 168 (66.4%) |
| Arts, Media & Entertainment | 10 (27.0%) | 27 (73.0%) |
| Health Diagnosing & Treating | 9 (12.7%) | 62 (87.3%) |
| Health Technologists | 9 (14.3%) | 54 (85.7%) |
| Total (Category) | 295 (36.9%) | 504 (63.1%) |
| Total (Overall) | 860 (48.6%) | 911 (51.4%) |
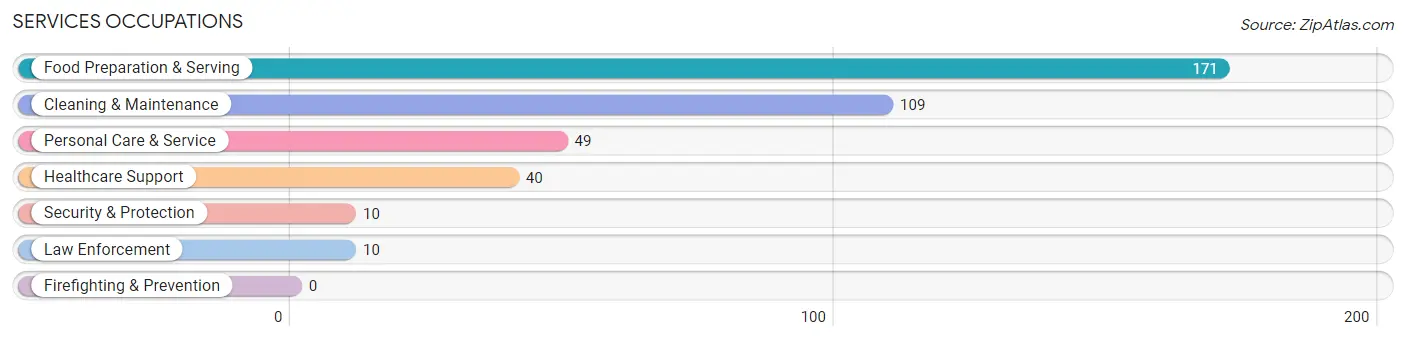
Services Occupations
The most common Services occupations in Northwest Harwich are Food Preparation & Serving (171 | 9.7%), Cleaning & Maintenance (109 | 6.1%), Personal Care & Service (49 | 2.8%), Healthcare Support (40 | 2.3%), and Security & Protection (10 | 0.6%).
Services Occupations by Sex
Within the Services occupations in Northwest Harwich, the most male-oriented occupations are Security & Protection (100.0%), Law Enforcement (100.0%), and Cleaning & Maintenance (79.8%), while the most female-oriented occupations are Healthcare Support (100.0%), Personal Care & Service (83.7%), and Food Preparation & Serving (33.9%).
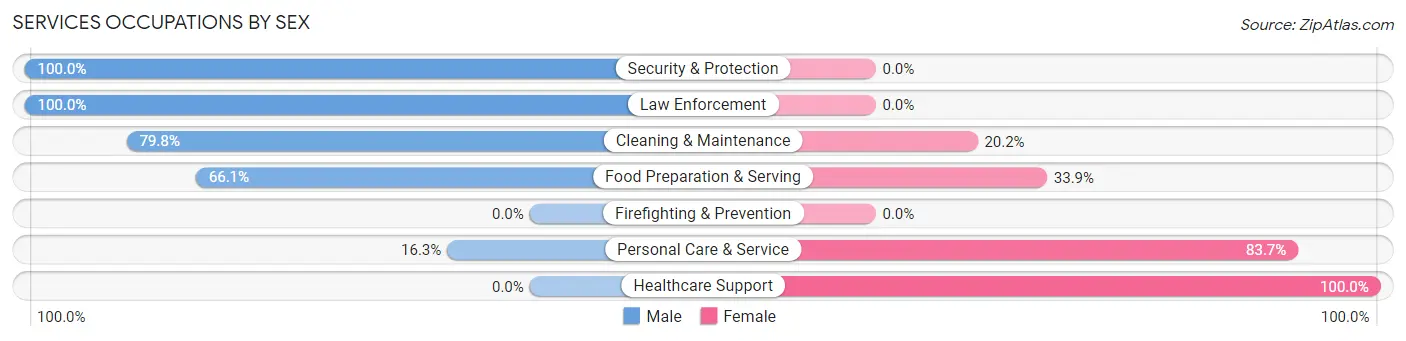
| Occupation | Male | Female |
| Healthcare Support | 0 (0.0%) | 40 (100.0%) |
| Security & Protection | 10 (100.0%) | 0 (0.0%) |
| Firefighting & Prevention | 0 (0.0%) | 0 (0.0%) |
| Law Enforcement | 10 (100.0%) | 0 (0.0%) |
| Food Preparation & Serving | 113 (66.1%) | 58 (33.9%) |
| Cleaning & Maintenance | 87 (79.8%) | 22 (20.2%) |
| Personal Care & Service | 8 (16.3%) | 41 (83.7%) |
| Total (Category) | 218 (57.5%) | 161 (42.5%) |
| Total (Overall) | 860 (48.6%) | 911 (51.4%) |
Sales and Office Occupations
The most common Sales and Office occupations in Northwest Harwich are Office & Administration (199 | 11.2%), and Sales & Related (132 | 7.4%).
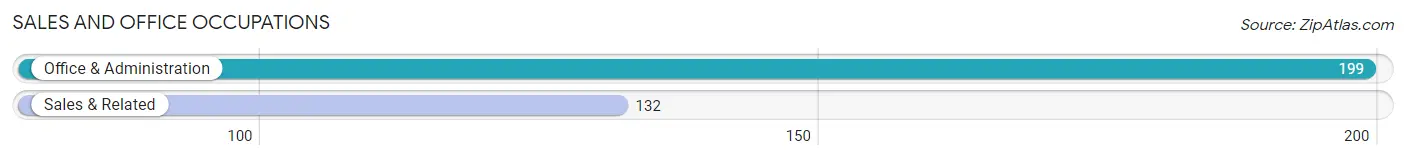
Sales and Office Occupations by Sex
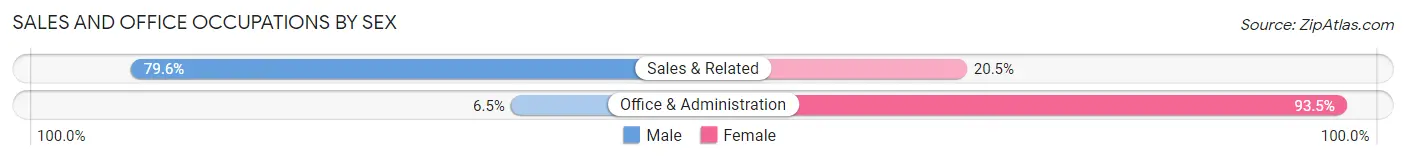
| Occupation | Male | Female |
| Sales & Related | 105 (79.5%) | 27 (20.4%) |
| Office & Administration | 13 (6.5%) | 186 (93.5%) |
| Total (Category) | 118 (35.6%) | 213 (64.3%) |
| Total (Overall) | 860 (48.6%) | 911 (51.4%) |
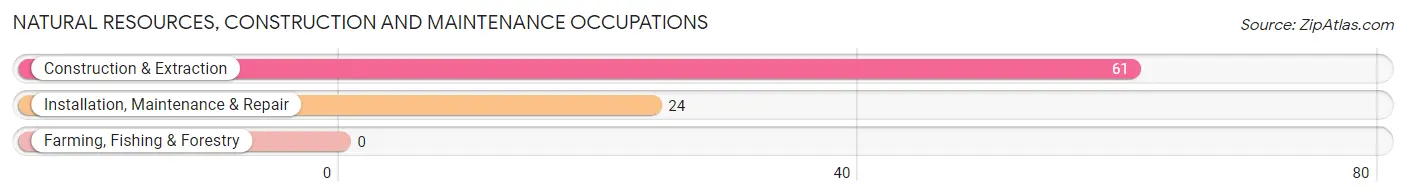
Natural Resources, Construction and Maintenance Occupations
The most common Natural Resources, Construction and Maintenance occupations in Northwest Harwich are Construction & Extraction (61 | 3.4%), and Installation, Maintenance & Repair (24 | 1.4%).
Natural Resources, Construction and Maintenance Occupations by Sex
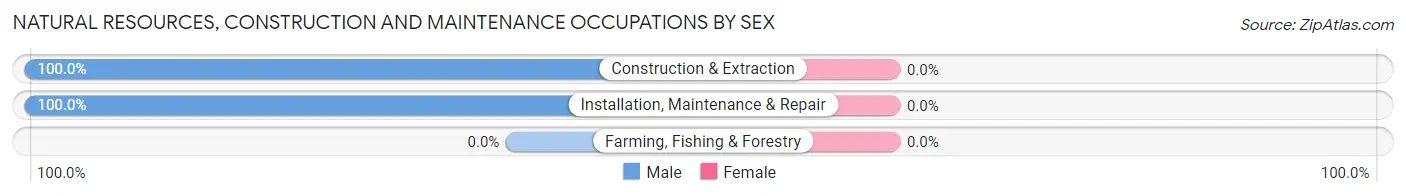
| Occupation | Male | Female |
| Farming, Fishing & Forestry | 0 (0.0%) | 0 (0.0%) |
| Construction & Extraction | 61 (100.0%) | 0 (0.0%) |
| Installation, Maintenance & Repair | 24 (100.0%) | 0 (0.0%) |
| Total (Category) | 85 (100.0%) | 0 (0.0%) |
| Total (Overall) | 860 (48.6%) | 911 (51.4%) |
Production, Transportation and Moving Occupations
The most common Production, Transportation and Moving occupations in Northwest Harwich are Transportation (91 | 5.1%), Material Moving (47 | 2.6%), and Production (39 | 2.2%).
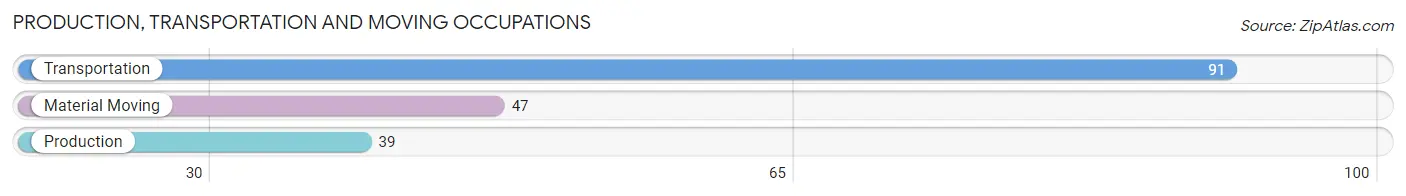
Production, Transportation and Moving Occupations by Sex
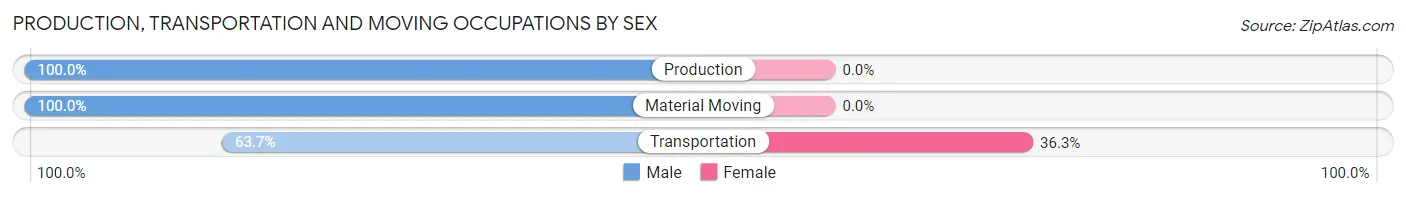
| Occupation | Male | Female |
| Production | 39 (100.0%) | 0 (0.0%) |
| Transportation | 58 (63.7%) | 33 (36.3%) |
| Material Moving | 47 (100.0%) | 0 (0.0%) |
| Total (Category) | 144 (81.4%) | 33 (18.6%) |
| Total (Overall) | 860 (48.6%) | 911 (51.4%) |
Employment Industries by Sex in Northwest Harwich
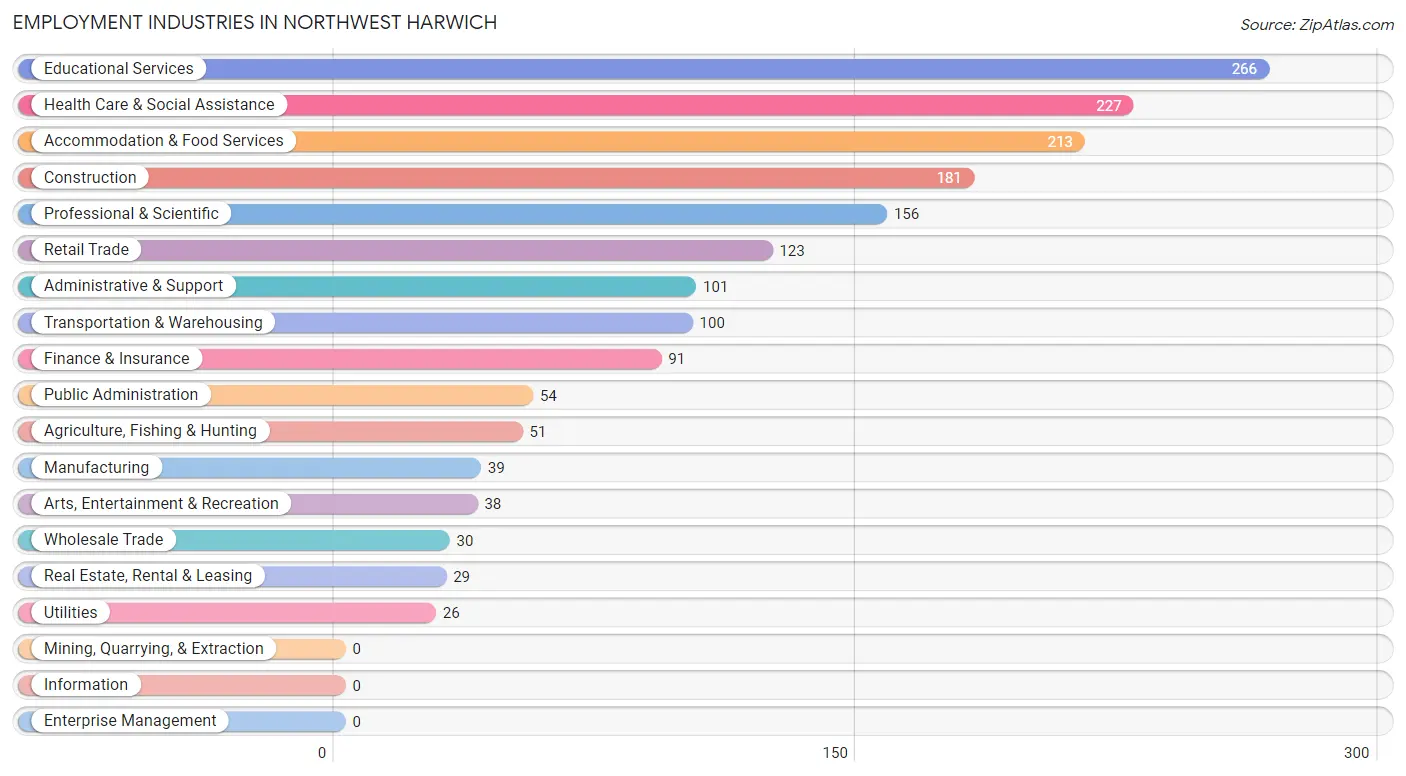
Employment Industries in Northwest Harwich
The major employment industries in Northwest Harwich include Educational Services (266 | 15.0%), Health Care & Social Assistance (227 | 12.8%), Accommodation & Food Services (213 | 12.0%), Construction (181 | 10.2%), and Professional & Scientific (156 | 8.8%).
Employment Industries by Sex in Northwest Harwich
The Northwest Harwich industries that see more men than women are Construction (100.0%), Wholesale Trade (100.0%), and Utilities (100.0%), whereas the industries that tend to have a higher number of women are Agriculture, Fishing & Hunting (100.0%), Health Care & Social Assistance (89.4%), and Finance & Insurance (75.8%).
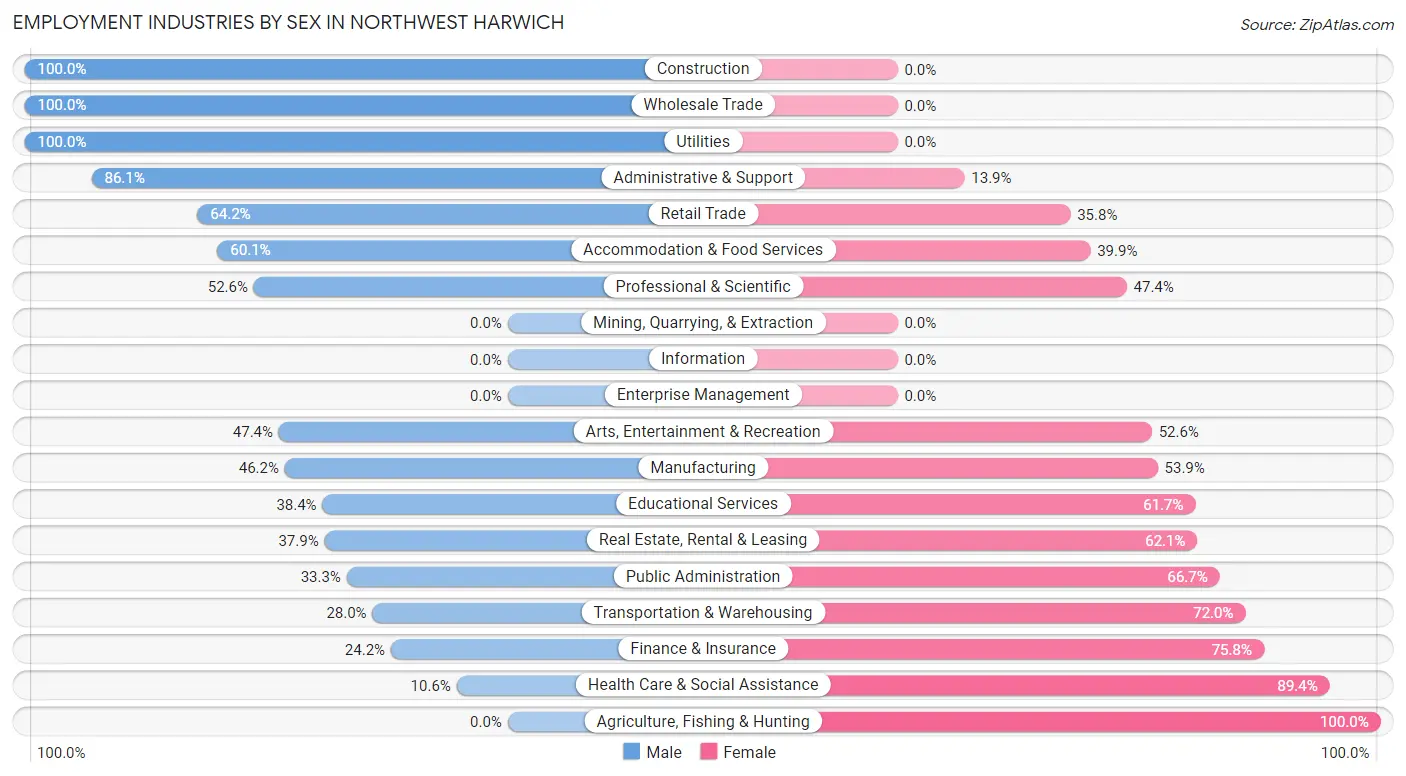
| Industry | Male | Female |
| Agriculture, Fishing & Hunting | 0 (0.0%) | 51 (100.0%) |
| Mining, Quarrying, & Extraction | 0 (0.0%) | 0 (0.0%) |
| Construction | 181 (100.0%) | 0 (0.0%) |
| Manufacturing | 18 (46.2%) | 21 (53.8%) |
| Wholesale Trade | 30 (100.0%) | 0 (0.0%) |
| Retail Trade | 79 (64.2%) | 44 (35.8%) |
| Transportation & Warehousing | 28 (28.0%) | 72 (72.0%) |
| Utilities | 26 (100.0%) | 0 (0.0%) |
| Information | 0 (0.0%) | 0 (0.0%) |
| Finance & Insurance | 22 (24.2%) | 69 (75.8%) |
| Real Estate, Rental & Leasing | 11 (37.9%) | 18 (62.1%) |
| Professional & Scientific | 82 (52.6%) | 74 (47.4%) |
| Enterprise Management | 0 (0.0%) | 0 (0.0%) |
| Administrative & Support | 87 (86.1%) | 14 (13.9%) |
| Educational Services | 102 (38.4%) | 164 (61.7%) |
| Health Care & Social Assistance | 24 (10.6%) | 203 (89.4%) |
| Arts, Entertainment & Recreation | 18 (47.4%) | 20 (52.6%) |
| Accommodation & Food Services | 128 (60.1%) | 85 (39.9%) |
| Public Administration | 18 (33.3%) | 36 (66.7%) |
| Total | 860 (48.6%) | 911 (51.4%) |
Education in Northwest Harwich
School Enrollment in Northwest Harwich
The most common levels of schooling among the 577 students in Northwest Harwich are high school (264 | 45.8%), elementary school (195 | 33.8%), and middle school (54 | 9.4%).
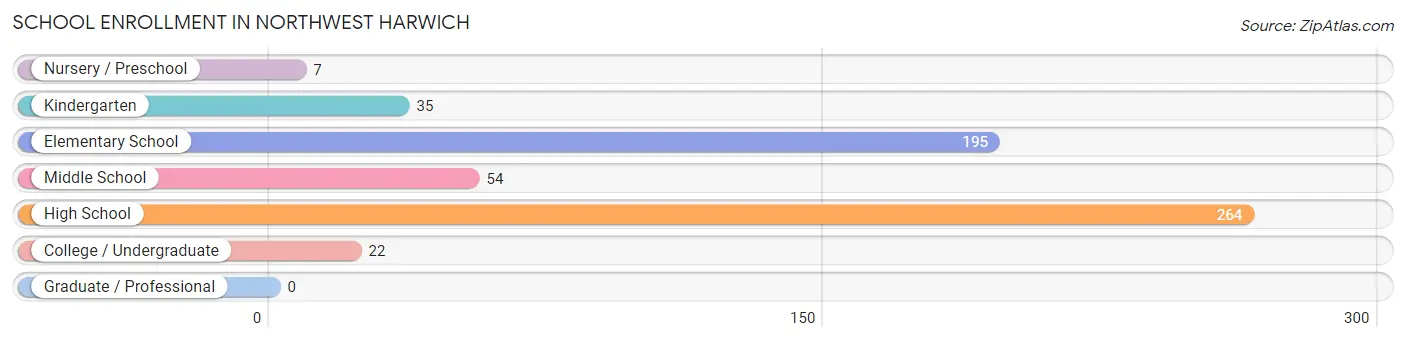
| School Level | # Students | % Students |
| Nursery / Preschool | 7 | 1.2% |
| Kindergarten | 35 | 6.1% |
| Elementary School | 195 | 33.8% |
| Middle School | 54 | 9.4% |
| High School | 264 | 45.8% |
| College / Undergraduate | 22 | 3.8% |
| Graduate / Professional | 0 | 0.0% |
| Total | 577 | 100.0% |
School Enrollment by Age by Funding Source in Northwest Harwich
Out of a total of 577 students who are enrolled in schools in Northwest Harwich, 59 (10.2%) attend a private institution, while the remaining 518 (89.8%) are enrolled in public schools. The age group of 20 to 24 year olds has the highest likelihood of being enrolled in private schools, with 12 (100.0% in the age bracket) enrolled. Conversely, the age group of 3 to 4 year olds has the lowest likelihood of being enrolled in a private school, with 7 (100.0% in the age bracket) attending a public institution.
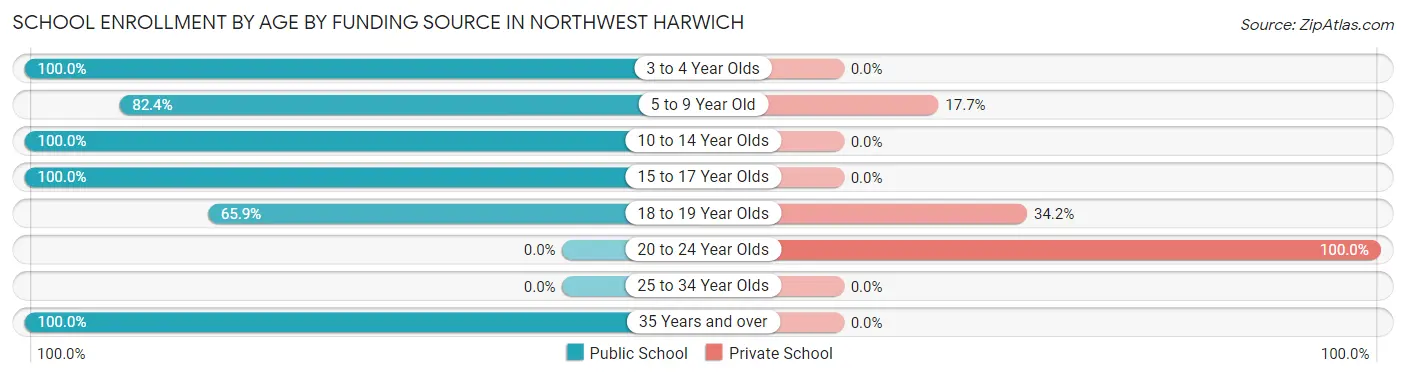
| Age Bracket | Public School | Private School |
| 3 to 4 Year Olds | 7 (100.0%) | 0 (0.0%) |
| 5 to 9 Year Old | 154 (82.4%) | 33 (17.6%) |
| 10 to 14 Year Olds | 116 (100.0%) | 0 (0.0%) |
| 15 to 17 Year Olds | 204 (100.0%) | 0 (0.0%) |
| 18 to 19 Year Olds | 27 (65.8%) | 14 (34.2%) |
| 20 to 24 Year Olds | 0 (0.0%) | 12 (100.0%) |
| 25 to 34 Year Olds | 0 (0.0%) | 0 (0.0%) |
| 35 Years and over | 10 (100.0%) | 0 (0.0%) |
| Total | 518 (89.8%) | 59 (10.2%) |
Educational Attainment by Field of Study in Northwest Harwich
Business (301 | 20.8%), education (296 | 20.4%), liberal arts & history (137 | 9.5%), social sciences (127 | 8.8%), and science & technology (124 | 8.6%) are the most common fields of study among 1,449 individuals in Northwest Harwich who have obtained a bachelor's degree or higher.
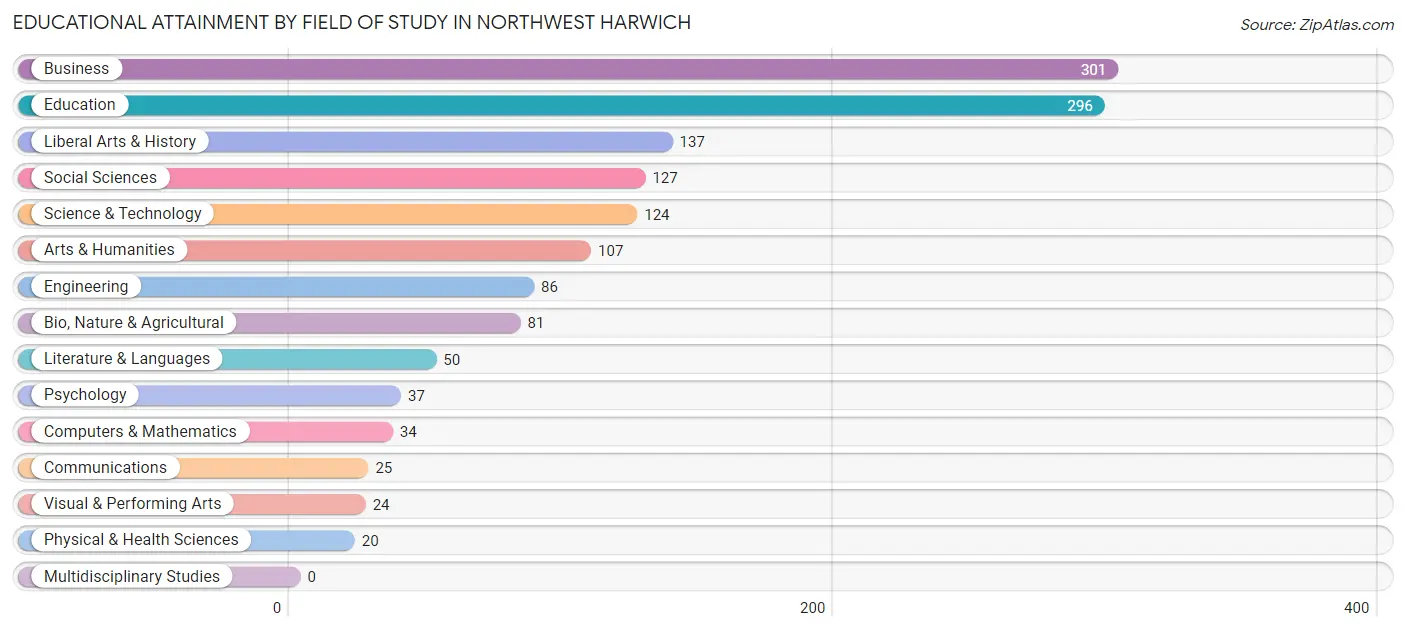
| Field of Study | # Graduates | % Graduates |
| Computers & Mathematics | 34 | 2.4% |
| Bio, Nature & Agricultural | 81 | 5.6% |
| Physical & Health Sciences | 20 | 1.4% |
| Psychology | 37 | 2.5% |
| Social Sciences | 127 | 8.8% |
| Engineering | 86 | 5.9% |
| Multidisciplinary Studies | 0 | 0.0% |
| Science & Technology | 124 | 8.6% |
| Business | 301 | 20.8% |
| Education | 296 | 20.4% |
| Literature & Languages | 50 | 3.5% |
| Liberal Arts & History | 137 | 9.5% |
| Visual & Performing Arts | 24 | 1.7% |
| Communications | 25 | 1.7% |
| Arts & Humanities | 107 | 7.4% |
| Total | 1,449 | 100.0% |
Transportation & Commute in Northwest Harwich
Vehicle Availability by Sex in Northwest Harwich
The most prevalent vehicle ownership categories in Northwest Harwich are males with 3 vehicles (323, accounting for 38.3%) and females with 3 vehicles (207, making up 36.0%).
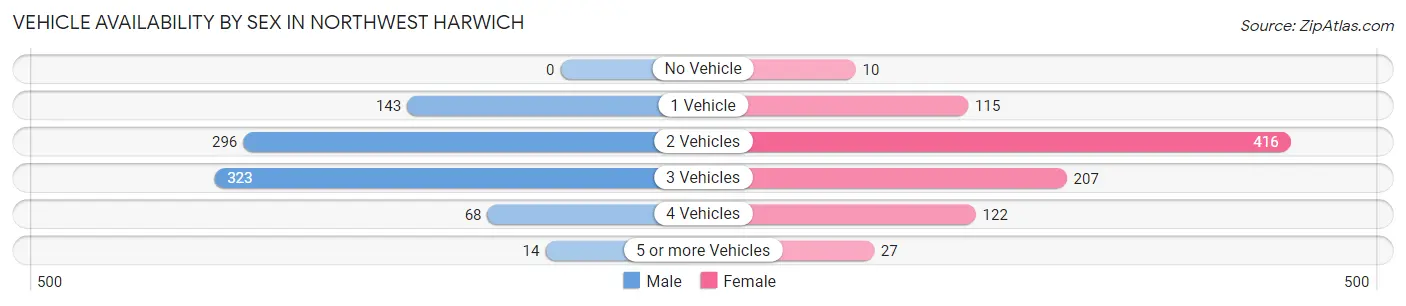
| Vehicles Available | Male | Female |
| No Vehicle | 0 (0.0%) | 10 (1.1%) |
| 1 Vehicle | 143 (16.9%) | 115 (12.8%) |
| 2 Vehicles | 296 (35.1%) | 416 (46.4%) |
| 3 Vehicles | 323 (38.3%) | 207 (23.1%) |
| 4 Vehicles | 68 (8.1%) | 122 (13.6%) |
| 5 or more Vehicles | 14 (1.7%) | 27 (3.0%) |
| Total | 844 (100.0%) | 897 (100.0%) |
Commute Time in Northwest Harwich
The most frequently occuring commute durations in Northwest Harwich are 15 to 19 minutes (288 commuters, 21.6%), 10 to 14 minutes (237 commuters, 17.7%), and 5 to 9 minutes (220 commuters, 16.5%).
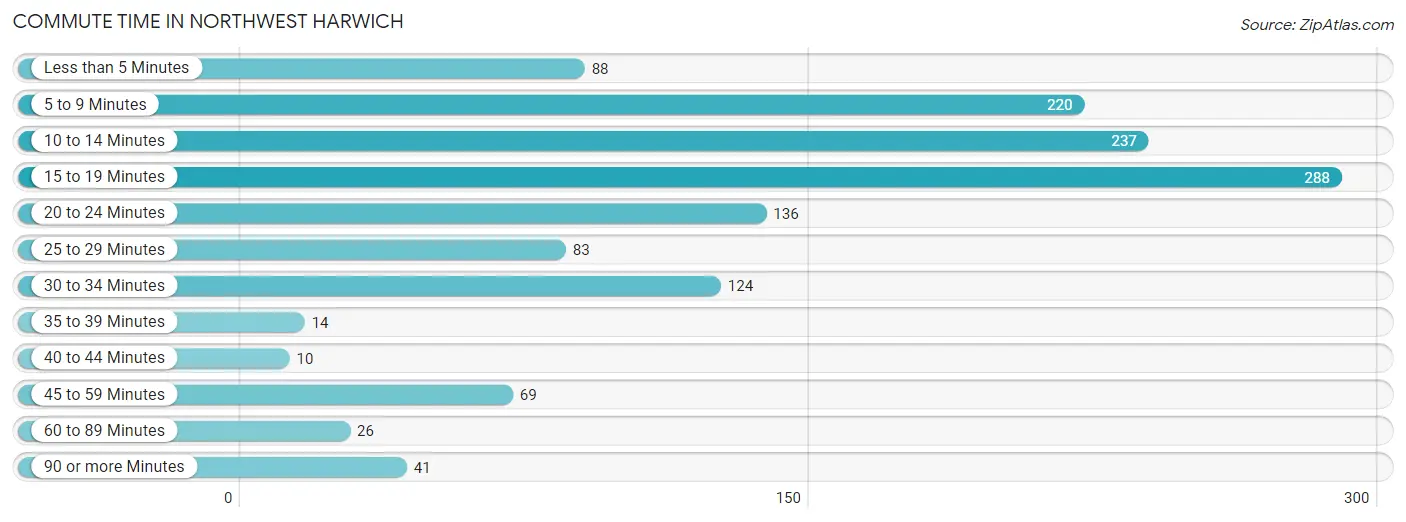
| Commute Time | # Commuters | % Commuters |
| Less than 5 Minutes | 88 | 6.6% |
| 5 to 9 Minutes | 220 | 16.5% |
| 10 to 14 Minutes | 237 | 17.7% |
| 15 to 19 Minutes | 288 | 21.6% |
| 20 to 24 Minutes | 136 | 10.2% |
| 25 to 29 Minutes | 83 | 6.2% |
| 30 to 34 Minutes | 124 | 9.3% |
| 35 to 39 Minutes | 14 | 1.1% |
| 40 to 44 Minutes | 10 | 0.7% |
| 45 to 59 Minutes | 69 | 5.2% |
| 60 to 89 Minutes | 26 | 1.9% |
| 90 or more Minutes | 41 | 3.1% |
Commute Time by Sex in Northwest Harwich
The most common commute times in Northwest Harwich are 5 to 9 minutes (165 commuters, 24.4%) for males and 15 to 19 minutes (144 commuters, 21.8%) for females.
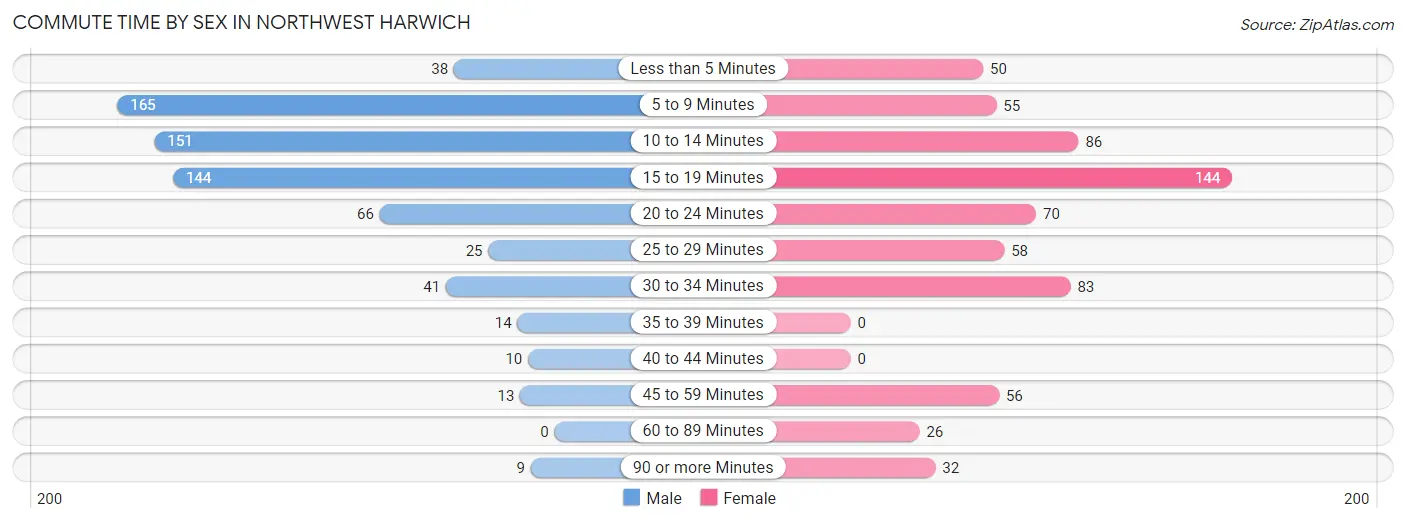
| Commute Time | Male | Female |
| Less than 5 Minutes | 38 (5.6%) | 50 (7.6%) |
| 5 to 9 Minutes | 165 (24.4%) | 55 (8.3%) |
| 10 to 14 Minutes | 151 (22.3%) | 86 (13.0%) |
| 15 to 19 Minutes | 144 (21.3%) | 144 (21.8%) |
| 20 to 24 Minutes | 66 (9.8%) | 70 (10.6%) |
| 25 to 29 Minutes | 25 (3.7%) | 58 (8.8%) |
| 30 to 34 Minutes | 41 (6.1%) | 83 (12.6%) |
| 35 to 39 Minutes | 14 (2.1%) | 0 (0.0%) |
| 40 to 44 Minutes | 10 (1.5%) | 0 (0.0%) |
| 45 to 59 Minutes | 13 (1.9%) | 56 (8.5%) |
| 60 to 89 Minutes | 0 (0.0%) | 26 (3.9%) |
| 90 or more Minutes | 9 (1.3%) | 32 (4.9%) |
Time of Departure to Work by Sex in Northwest Harwich
The most frequent times of departure to work in Northwest Harwich are 6:30 AM to 6:59 AM (162, 24.0%) for males and 9:00 AM to 9:59 AM (146, 22.1%) for females.
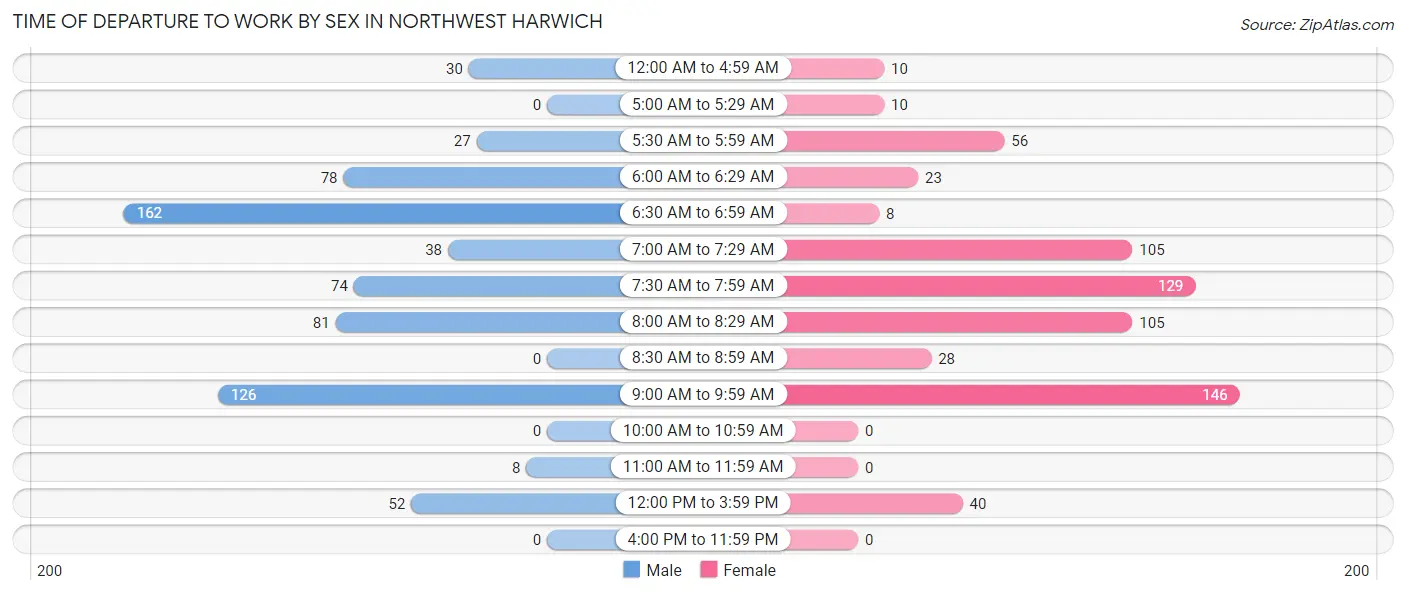
| Time of Departure | Male | Female |
| 12:00 AM to 4:59 AM | 30 (4.4%) | 10 (1.5%) |
| 5:00 AM to 5:29 AM | 0 (0.0%) | 10 (1.5%) |
| 5:30 AM to 5:59 AM | 27 (4.0%) | 56 (8.5%) |
| 6:00 AM to 6:29 AM | 78 (11.5%) | 23 (3.5%) |
| 6:30 AM to 6:59 AM | 162 (24.0%) | 8 (1.2%) |
| 7:00 AM to 7:29 AM | 38 (5.6%) | 105 (15.9%) |
| 7:30 AM to 7:59 AM | 74 (11.0%) | 129 (19.6%) |
| 8:00 AM to 8:29 AM | 81 (12.0%) | 105 (15.9%) |
| 8:30 AM to 8:59 AM | 0 (0.0%) | 28 (4.2%) |
| 9:00 AM to 9:59 AM | 126 (18.6%) | 146 (22.1%) |
| 10:00 AM to 10:59 AM | 0 (0.0%) | 0 (0.0%) |
| 11:00 AM to 11:59 AM | 8 (1.2%) | 0 (0.0%) |
| 12:00 PM to 3:59 PM | 52 (7.7%) | 40 (6.1%) |
| 4:00 PM to 11:59 PM | 0 (0.0%) | 0 (0.0%) |
| Total | 676 (100.0%) | 660 (100.0%) |
Housing Occupancy in Northwest Harwich
Occupancy by Ownership in Northwest Harwich
Of the total 1,720 dwellings in Northwest Harwich, owner-occupied units account for 1,494 (86.9%), while renter-occupied units make up 226 (13.1%).
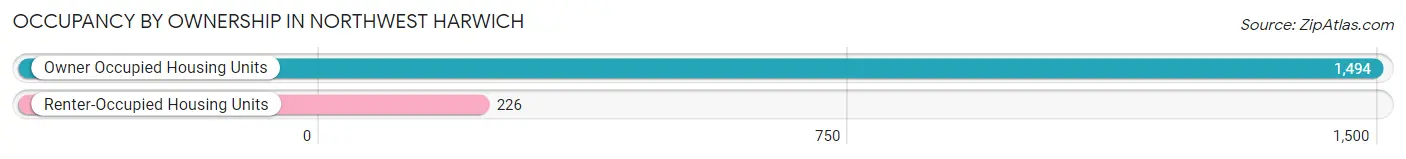
| Occupancy | # Housing Units | % Housing Units |
| Owner Occupied Housing Units | 1,494 | 86.9% |
| Renter-Occupied Housing Units | 226 | 13.1% |
| Total Occupied Housing Units | 1,720 | 100.0% |
Occupancy by Household Size in Northwest Harwich
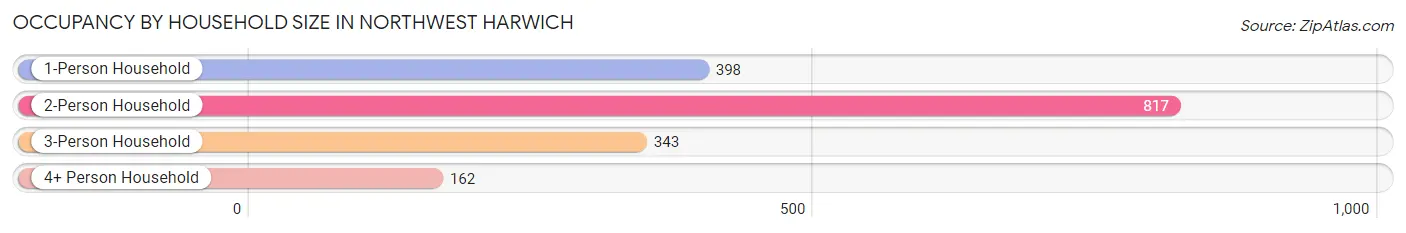
| Household Size | # Housing Units | % Housing Units |
| 1-Person Household | 398 | 23.1% |
| 2-Person Household | 817 | 47.5% |
| 3-Person Household | 343 | 19.9% |
| 4+ Person Household | 162 | 9.4% |
| Total Housing Units | 1,720 | 100.0% |
Occupancy by Ownership by Household Size in Northwest Harwich
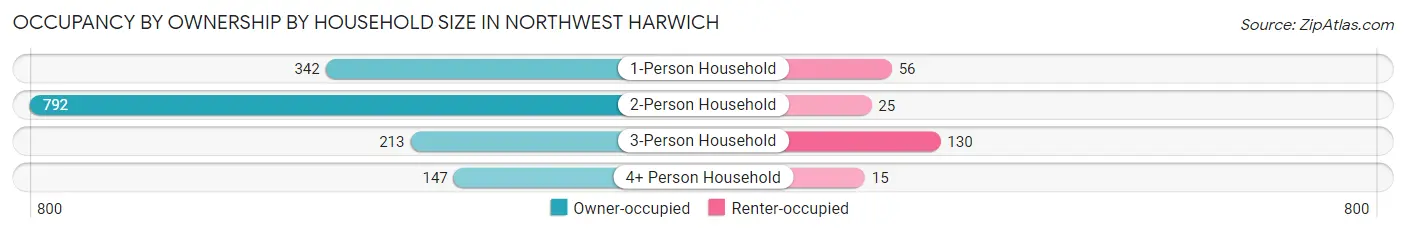
| Household Size | Owner-occupied | Renter-occupied |
| 1-Person Household | 342 (85.9%) | 56 (14.1%) |
| 2-Person Household | 792 (96.9%) | 25 (3.1%) |
| 3-Person Household | 213 (62.1%) | 130 (37.9%) |
| 4+ Person Household | 147 (90.7%) | 15 (9.3%) |
| Total Housing Units | 1,494 (86.9%) | 226 (13.1%) |
Occupancy by Educational Attainment in Northwest Harwich
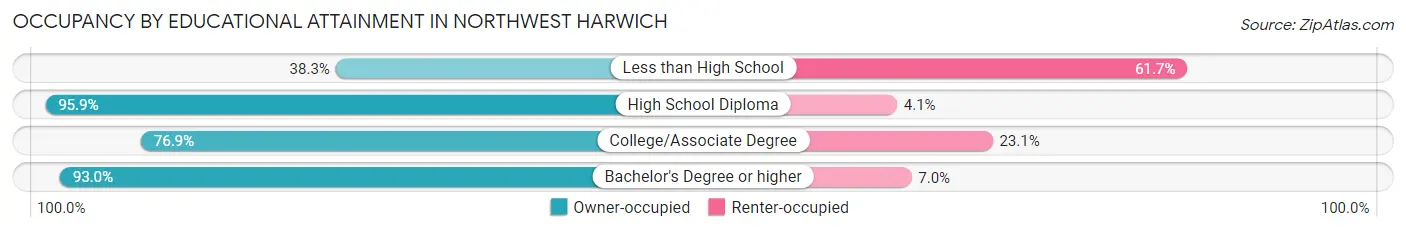
| Household Size | Owner-occupied | Renter-occupied |
| Less than High School | 23 (38.3%) | 37 (61.7%) |
| High School Diploma | 398 (95.9%) | 17 (4.1%) |
| College/Associate Degree | 407 (76.9%) | 122 (23.1%) |
| Bachelor's Degree or higher | 666 (93.0%) | 50 (7.0%) |
Occupancy by Age of Householder in Northwest Harwich
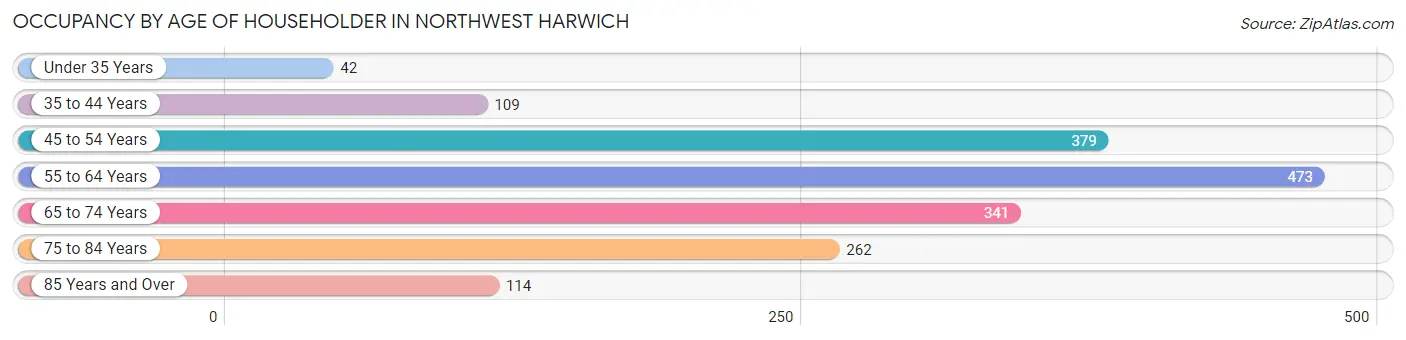
| Age Bracket | # Households | % Households |
| Under 35 Years | 42 | 2.4% |
| 35 to 44 Years | 109 | 6.3% |
| 45 to 54 Years | 379 | 22.0% |
| 55 to 64 Years | 473 | 27.5% |
| 65 to 74 Years | 341 | 19.8% |
| 75 to 84 Years | 262 | 15.2% |
| 85 Years and Over | 114 | 6.6% |
| Total | 1,720 | 100.0% |
Housing Finances in Northwest Harwich
Median Income by Occupancy in Northwest Harwich
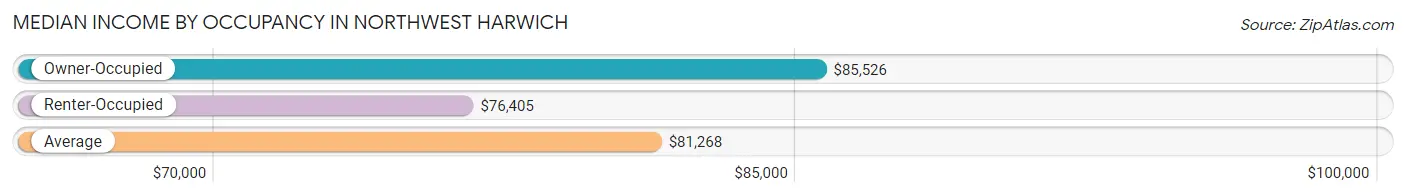
| Occupancy Type | # Households | Median Income |
| Owner-Occupied | 1,494 (86.9%) | $85,526 |
| Renter-Occupied | 226 (13.1%) | $76,405 |
| Average | 1,720 (100.0%) | $81,268 |
Occupancy by Householder Income Bracket in Northwest Harwich
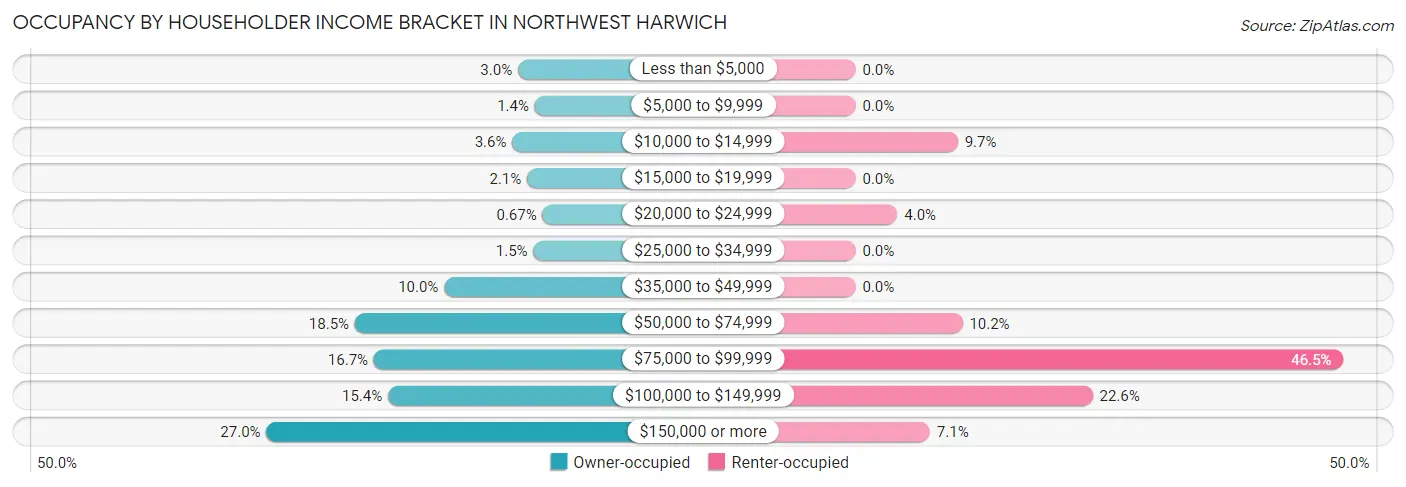
| Income Bracket | Owner-occupied | Renter-occupied |
| Less than $5,000 | 45 (3.0%) | 0 (0.0%) |
| $5,000 to $9,999 | 21 (1.4%) | 0 (0.0%) |
| $10,000 to $14,999 | 53 (3.5%) | 22 (9.7%) |
| $15,000 to $19,999 | 32 (2.1%) | 0 (0.0%) |
| $20,000 to $24,999 | 10 (0.7%) | 9 (4.0%) |
| $25,000 to $34,999 | 23 (1.5%) | 0 (0.0%) |
| $35,000 to $49,999 | 150 (10.0%) | 0 (0.0%) |
| $50,000 to $74,999 | 277 (18.5%) | 23 (10.2%) |
| $75,000 to $99,999 | 250 (16.7%) | 105 (46.5%) |
| $100,000 to $149,999 | 230 (15.4%) | 51 (22.6%) |
| $150,000 or more | 403 (27.0%) | 16 (7.1%) |
| Total | 1,494 (100.0%) | 226 (100.0%) |
Monthly Housing Cost Tiers in Northwest Harwich
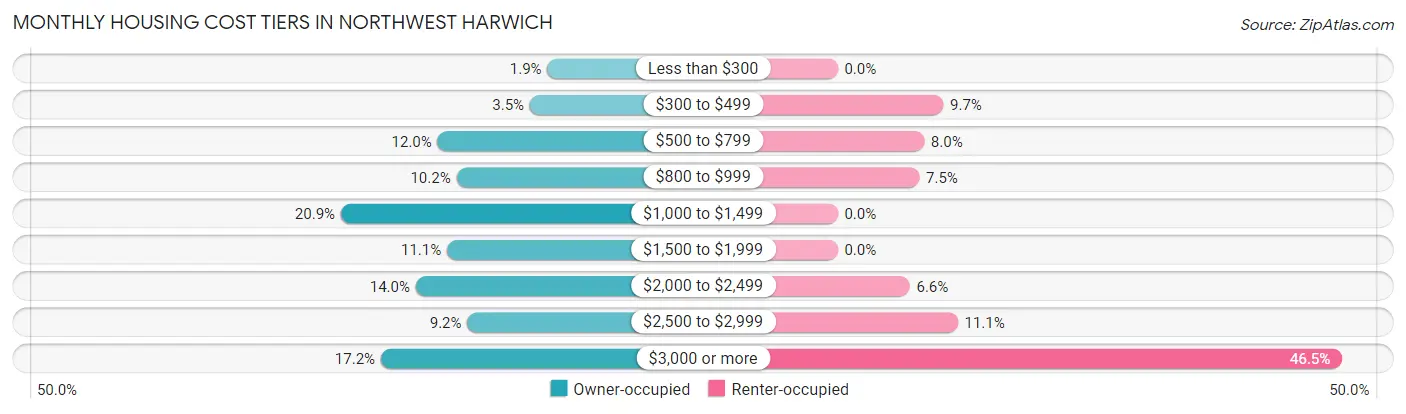
| Monthly Cost | Owner-occupied | Renter-occupied |
| Less than $300 | 28 (1.9%) | 0 (0.0%) |
| $300 to $499 | 52 (3.5%) | 22 (9.7%) |
| $500 to $799 | 179 (12.0%) | 18 (8.0%) |
| $800 to $999 | 153 (10.2%) | 17 (7.5%) |
| $1,000 to $1,499 | 312 (20.9%) | 0 (0.0%) |
| $1,500 to $1,999 | 166 (11.1%) | 0 (0.0%) |
| $2,000 to $2,499 | 209 (14.0%) | 15 (6.6%) |
| $2,500 to $2,999 | 138 (9.2%) | 25 (11.1%) |
| $3,000 or more | 257 (17.2%) | 105 (46.5%) |
| Total | 1,494 (100.0%) | 226 (100.0%) |
Physical Housing Characteristics in Northwest Harwich
Housing Structures in Northwest Harwich
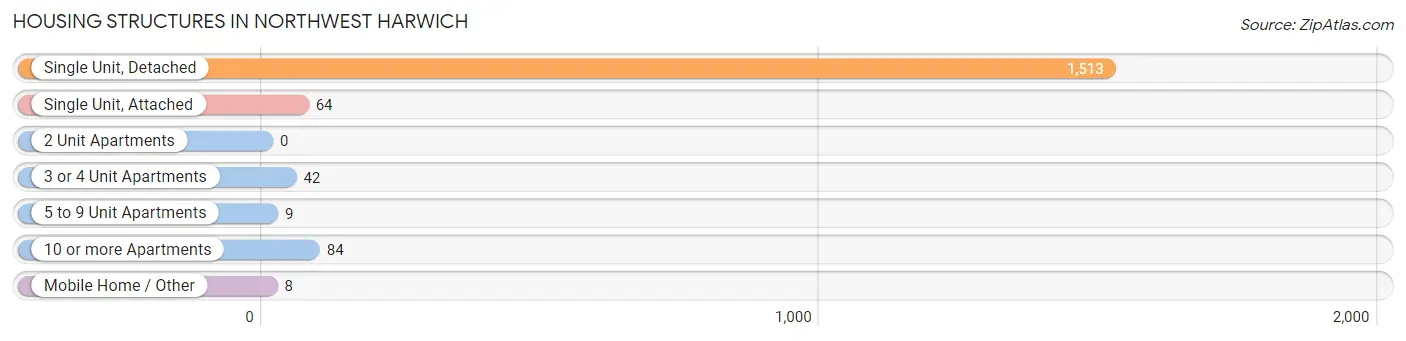
| Structure Type | # Housing Units | % Housing Units |
| Single Unit, Detached | 1,513 | 88.0% |
| Single Unit, Attached | 64 | 3.7% |
| 2 Unit Apartments | 0 | 0.0% |
| 3 or 4 Unit Apartments | 42 | 2.4% |
| 5 to 9 Unit Apartments | 9 | 0.5% |
| 10 or more Apartments | 84 | 4.9% |
| Mobile Home / Other | 8 | 0.5% |
| Total | 1,720 | 100.0% |
Housing Structures by Occupancy in Northwest Harwich
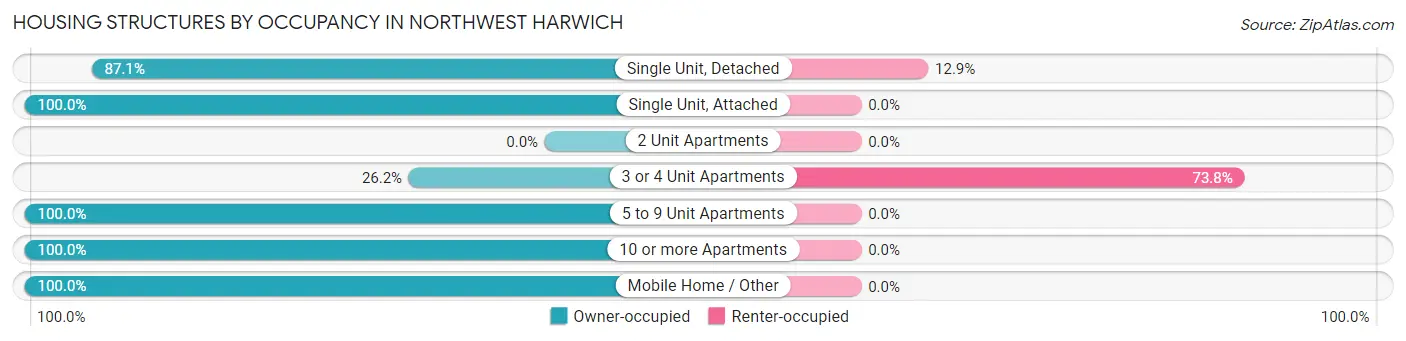
| Structure Type | Owner-occupied | Renter-occupied |
| Single Unit, Detached | 1,318 (87.1%) | 195 (12.9%) |
| Single Unit, Attached | 64 (100.0%) | 0 (0.0%) |
| 2 Unit Apartments | 0 (0.0%) | 0 (0.0%) |
| 3 or 4 Unit Apartments | 11 (26.2%) | 31 (73.8%) |
| 5 to 9 Unit Apartments | 9 (100.0%) | 0 (0.0%) |
| 10 or more Apartments | 84 (100.0%) | 0 (0.0%) |
| Mobile Home / Other | 8 (100.0%) | 0 (0.0%) |
| Total | 1,494 (86.9%) | 226 (13.1%) |
Housing Structures by Number of Rooms in Northwest Harwich
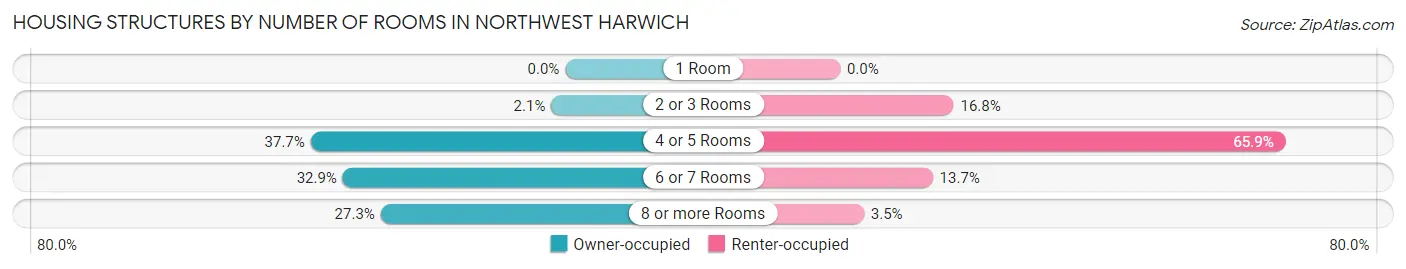
| Number of Rooms | Owner-occupied | Renter-occupied |
| 1 Room | 0 (0.0%) | 0 (0.0%) |
| 2 or 3 Rooms | 31 (2.1%) | 38 (16.8%) |
| 4 or 5 Rooms | 563 (37.7%) | 149 (65.9%) |
| 6 or 7 Rooms | 492 (32.9%) | 31 (13.7%) |
| 8 or more Rooms | 408 (27.3%) | 8 (3.5%) |
| Total | 1,494 (100.0%) | 226 (100.0%) |
Housing Structure by Heating Type in Northwest Harwich
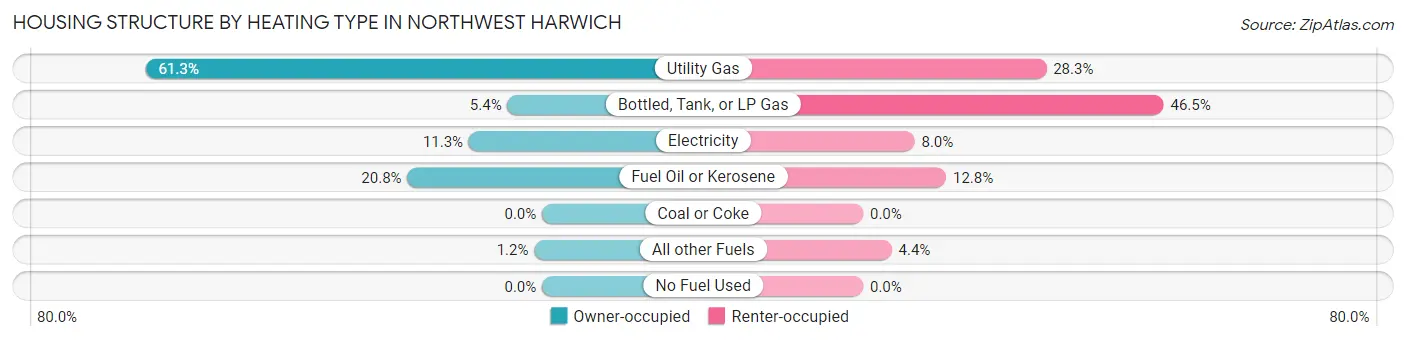
| Heating Type | Owner-occupied | Renter-occupied |
| Utility Gas | 916 (61.3%) | 64 (28.3%) |
| Bottled, Tank, or LP Gas | 80 (5.3%) | 105 (46.5%) |
| Electricity | 169 (11.3%) | 18 (8.0%) |
| Fuel Oil or Kerosene | 311 (20.8%) | 29 (12.8%) |
| Coal or Coke | 0 (0.0%) | 0 (0.0%) |
| All other Fuels | 18 (1.2%) | 10 (4.4%) |
| No Fuel Used | 0 (0.0%) | 0 (0.0%) |
| Total | 1,494 (100.0%) | 226 (100.0%) |
Household Vehicle Usage in Northwest Harwich
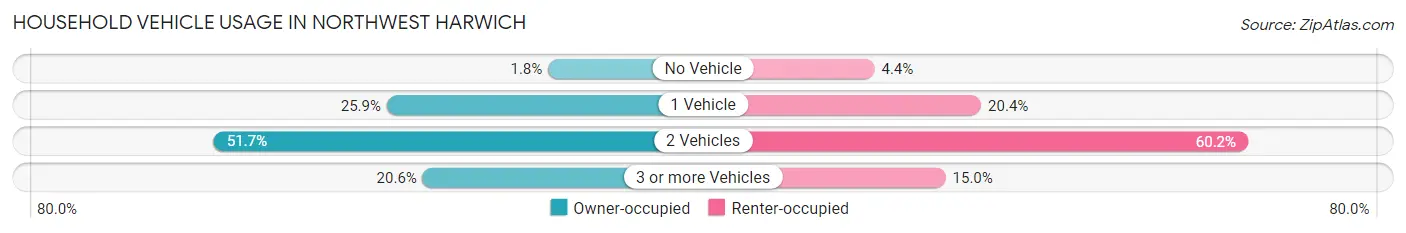
| Vehicles per Household | Owner-occupied | Renter-occupied |
| No Vehicle | 27 (1.8%) | 10 (4.4%) |
| 1 Vehicle | 387 (25.9%) | 46 (20.3%) |
| 2 Vehicles | 773 (51.7%) | 136 (60.2%) |
| 3 or more Vehicles | 307 (20.5%) | 34 (15.0%) |
| Total | 1,494 (100.0%) | 226 (100.0%) |
Real Estate & Mortgages in Northwest Harwich
Real Estate and Mortgage Overview in Northwest Harwich
| Characteristic | Without Mortgage | With Mortgage |
| Housing Units | 677 | 817 |
| Median Property Value | $581,900 | $529,800 |
| Median Household Income | $84,531 | $247 |
| Monthly Housing Costs | $941 | $239 |
| Real Estate Taxes | $5,252 | $0 |
Property Value by Mortgage Status in Northwest Harwich
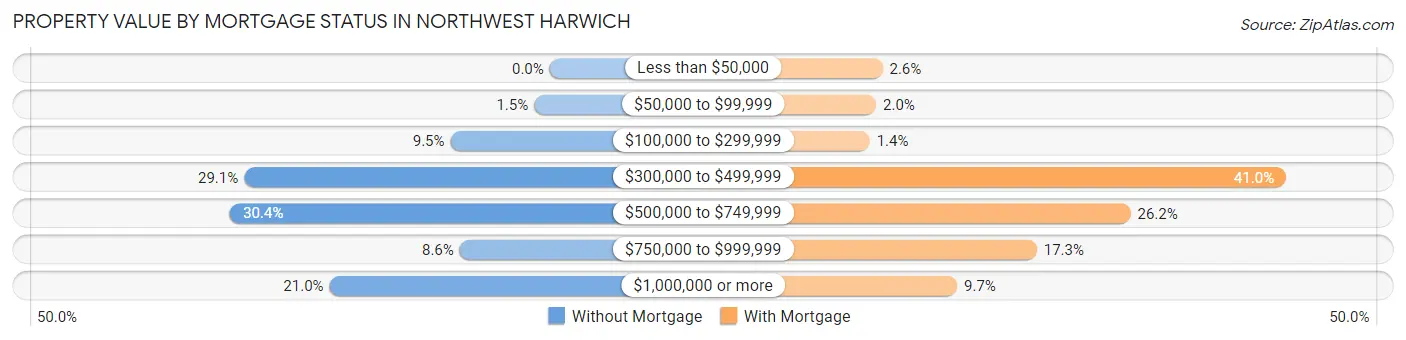
| Property Value | Without Mortgage | With Mortgage |
| Less than $50,000 | 0 (0.0%) | 21 (2.6%) |
| $50,000 to $99,999 | 10 (1.5%) | 16 (2.0%) |
| $100,000 to $299,999 | 64 (9.5%) | 11 (1.3%) |
| $300,000 to $499,999 | 197 (29.1%) | 335 (41.0%) |
| $500,000 to $749,999 | 206 (30.4%) | 214 (26.2%) |
| $750,000 to $999,999 | 58 (8.6%) | 141 (17.3%) |
| $1,000,000 or more | 142 (21.0%) | 79 (9.7%) |
| Total | 677 (100.0%) | 817 (100.0%) |
Household Income by Mortgage Status in Northwest Harwich
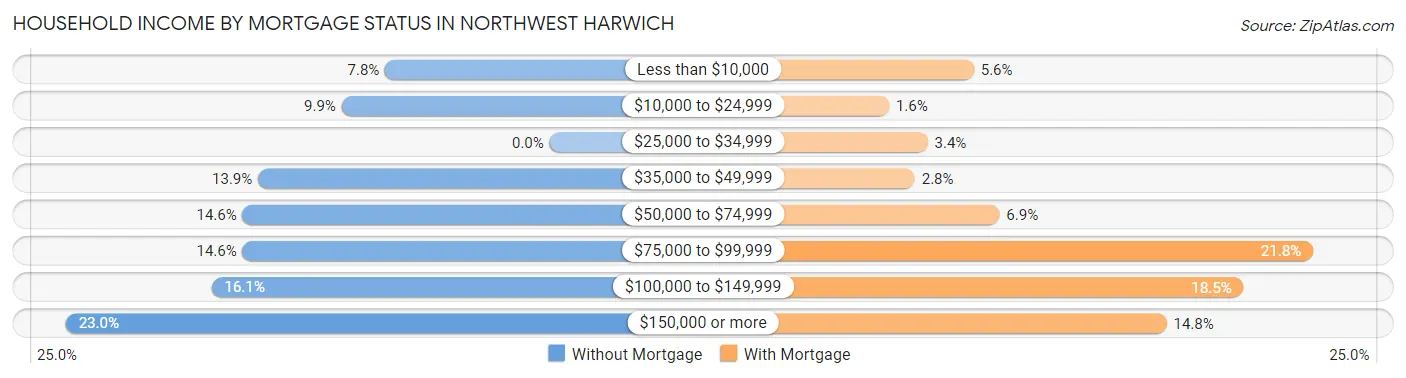
| Household Income | Without Mortgage | With Mortgage |
| Less than $10,000 | 53 (7.8%) | 46 (5.6%) |
| $10,000 to $24,999 | 67 (9.9%) | 13 (1.6%) |
| $25,000 to $34,999 | 0 (0.0%) | 28 (3.4%) |
| $35,000 to $49,999 | 94 (13.9%) | 23 (2.8%) |
| $50,000 to $74,999 | 99 (14.6%) | 56 (6.9%) |
| $75,000 to $99,999 | 99 (14.6%) | 178 (21.8%) |
| $100,000 to $149,999 | 109 (16.1%) | 151 (18.5%) |
| $150,000 or more | 156 (23.0%) | 121 (14.8%) |
| Total | 677 (100.0%) | 817 (100.0%) |
Property Value to Household Income Ratio in Northwest Harwich
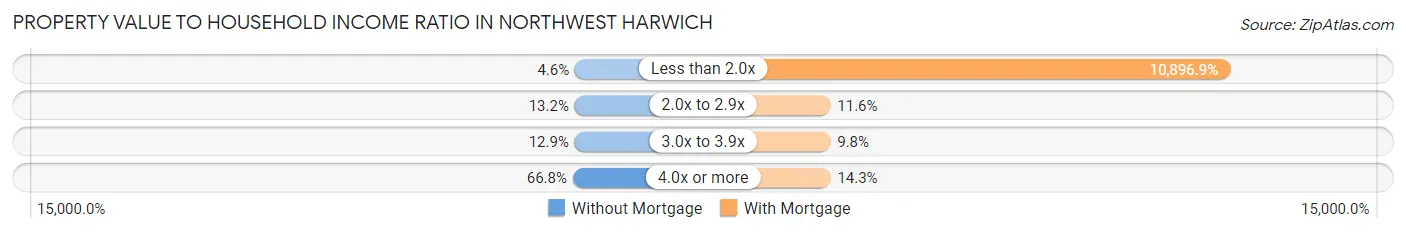
| Value-to-Income Ratio | Without Mortgage | With Mortgage |
| Less than 2.0x | 31 (4.6%) | 89,028 (10,896.9%) |
| 2.0x to 2.9x | 89 (13.2%) | 95 (11.6%) |
| 3.0x to 3.9x | 87 (12.9%) | 80 (9.8%) |
| 4.0x or more | 452 (66.8%) | 117 (14.3%) |
| Total | 677 (100.0%) | 817 (100.0%) |
Real Estate Taxes by Mortgage Status in Northwest Harwich
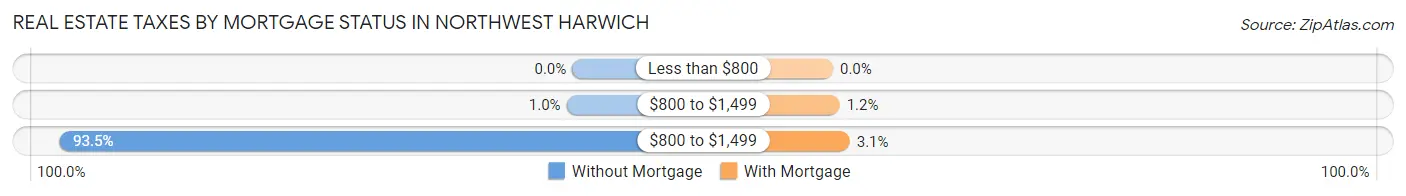
| Property Taxes | Without Mortgage | With Mortgage |
| Less than $800 | 0 (0.0%) | 0 (0.0%) |
| $800 to $1,499 | 7 (1.0%) | 10 (1.2%) |
| $800 to $1,499 | 633 (93.5%) | 25 (3.1%) |
| Total | 677 (100.0%) | 817 (100.0%) |
Health & Disability in Northwest Harwich
Health Insurance Coverage by Age in Northwest Harwich
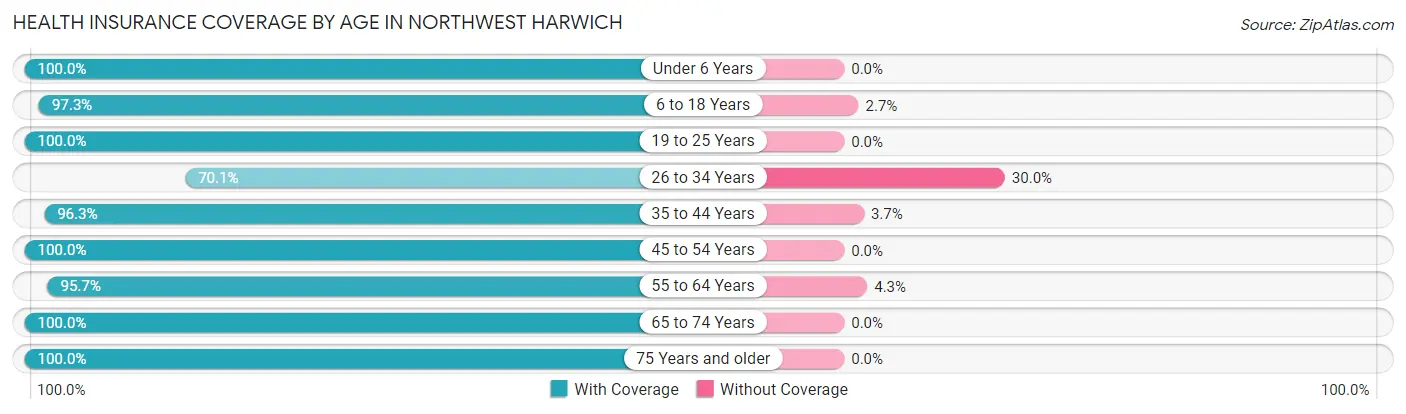
| Age Bracket | With Coverage | Without Coverage |
| Under 6 Years | 181 (100.0%) | 0 (0.0%) |
| 6 to 18 Years | 510 (97.3%) | 14 (2.7%) |
| 19 to 25 Years | 137 (100.0%) | 0 (0.0%) |
| 26 to 34 Years | 138 (70.1%) | 59 (29.9%) |
| 35 to 44 Years | 236 (96.3%) | 9 (3.7%) |
| 45 to 54 Years | 665 (100.0%) | 0 (0.0%) |
| 55 to 64 Years | 803 (95.7%) | 36 (4.3%) |
| 65 to 74 Years | 677 (100.0%) | 0 (0.0%) |
| 75 Years and older | 526 (100.0%) | 0 (0.0%) |
| Total | 3,873 (97.0%) | 118 (3.0%) |
Health Insurance Coverage by Citizenship Status in Northwest Harwich
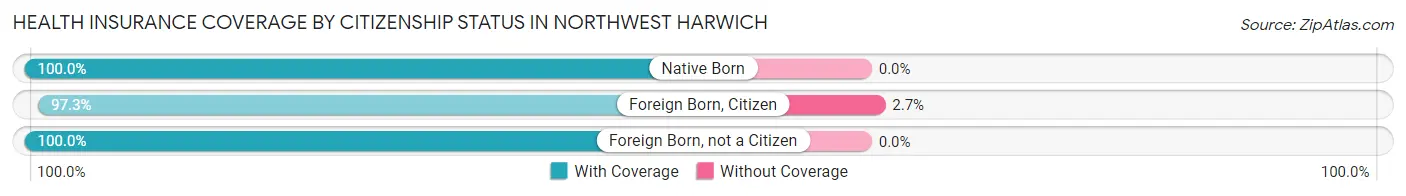
| Citizenship Status | With Coverage | Without Coverage |
| Native Born | 181 (100.0%) | 0 (0.0%) |
| Foreign Born, Citizen | 510 (97.3%) | 14 (2.7%) |
| Foreign Born, not a Citizen | 137 (100.0%) | 0 (0.0%) |
Health Insurance Coverage by Household Income in Northwest Harwich
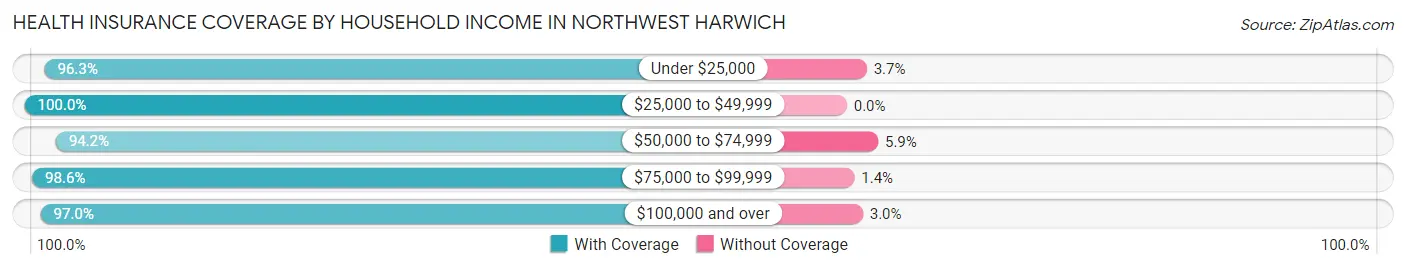
| Household Income | With Coverage | Without Coverage |
| Under $25,000 | 232 (96.3%) | 9 (3.7%) |
| $25,000 to $49,999 | 296 (100.0%) | 0 (0.0%) |
| $50,000 to $74,999 | 676 (94.2%) | 42 (5.9%) |
| $75,000 to $99,999 | 904 (98.6%) | 13 (1.4%) |
| $100,000 and over | 1,753 (97.0%) | 54 (3.0%) |
Public vs Private Health Insurance Coverage by Age in Northwest Harwich
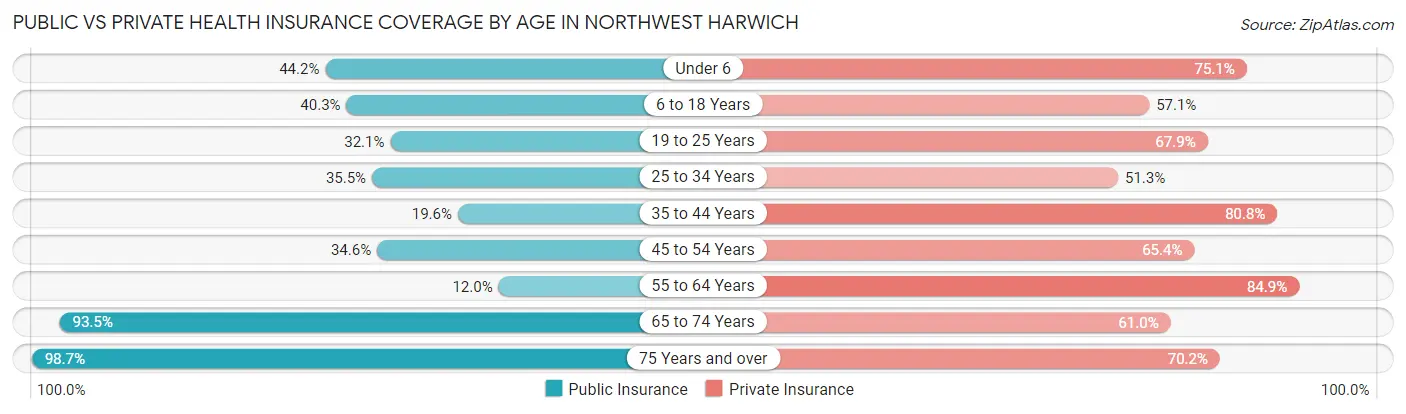
| Age Bracket | Public Insurance | Private Insurance |
| Under 6 | 80 (44.2%) | 136 (75.1%) |
| 6 to 18 Years | 211 (40.3%) | 299 (57.1%) |
| 19 to 25 Years | 44 (32.1%) | 93 (67.9%) |
| 25 to 34 Years | 70 (35.5%) | 101 (51.3%) |
| 35 to 44 Years | 48 (19.6%) | 198 (80.8%) |
| 45 to 54 Years | 230 (34.6%) | 435 (65.4%) |
| 55 to 64 Years | 101 (12.0%) | 712 (84.9%) |
| 65 to 74 Years | 633 (93.5%) | 413 (61.0%) |
| 75 Years and over | 519 (98.7%) | 369 (70.2%) |
| Total | 1,936 (48.5%) | 2,756 (69.1%) |
Disability Status by Sex by Age in Northwest Harwich
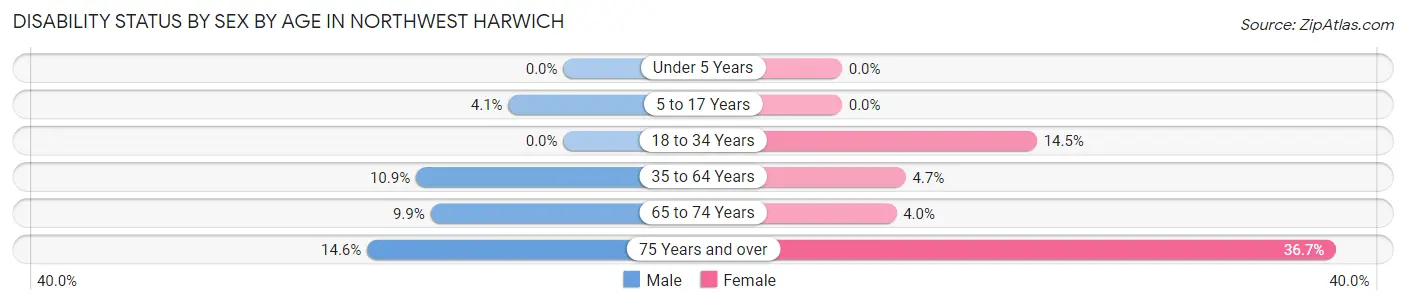
| Age Bracket | Male | Female |
| Under 5 Years | 0 (0.0%) | 0 (0.0%) |
| 5 to 17 Years | 19 (4.1%) | 0 (0.0%) |
| 18 to 34 Years | 0 (0.0%) | 23 (14.5%) |
| 35 to 64 Years | 85 (10.9%) | 46 (4.7%) |
| 65 to 74 Years | 35 (9.9%) | 13 (4.0%) |
| 75 Years and over | 29 (14.6%) | 120 (36.7%) |
Disability Class by Sex by Age in Northwest Harwich
Disability Class: Hearing Difficulty
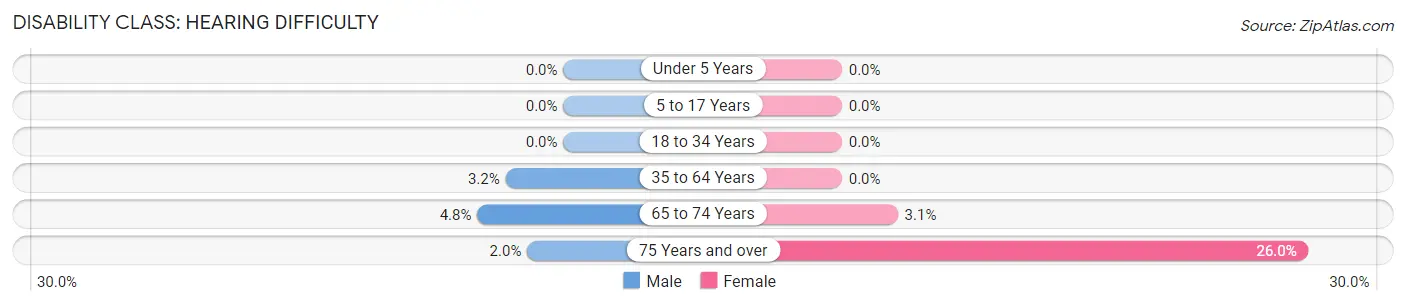
| Age Bracket | Male | Female |
| Under 5 Years | 0 (0.0%) | 0 (0.0%) |
| 5 to 17 Years | 0 (0.0%) | 0 (0.0%) |
| 18 to 34 Years | 0 (0.0%) | 0 (0.0%) |
| 35 to 64 Years | 25 (3.2%) | 0 (0.0%) |
| 65 to 74 Years | 17 (4.8%) | 10 (3.1%) |
| 75 Years and over | 4 (2.0%) | 85 (26.0%) |
Disability Class: Vision Difficulty
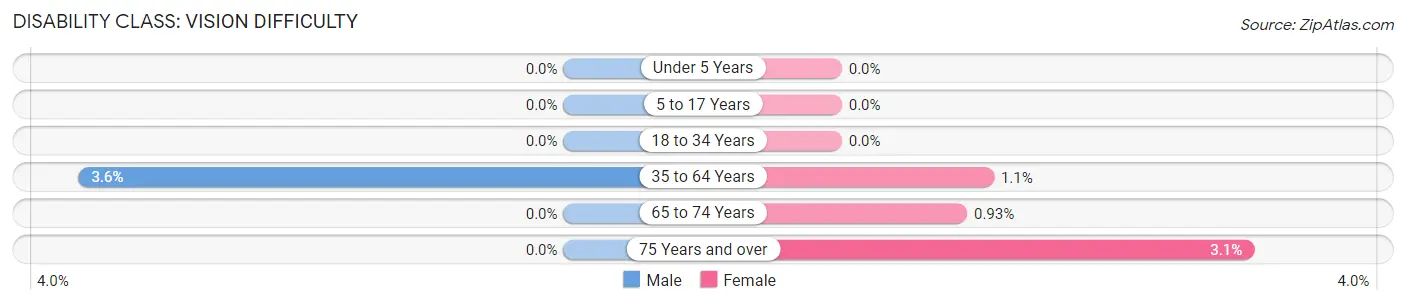
| Age Bracket | Male | Female |
| Under 5 Years | 0 (0.0%) | 0 (0.0%) |
| 5 to 17 Years | 0 (0.0%) | 0 (0.0%) |
| 18 to 34 Years | 0 (0.0%) | 0 (0.0%) |
| 35 to 64 Years | 28 (3.6%) | 11 (1.1%) |
| 65 to 74 Years | 0 (0.0%) | 3 (0.9%) |
| 75 Years and over | 0 (0.0%) | 10 (3.1%) |
Disability Class: Cognitive Difficulty
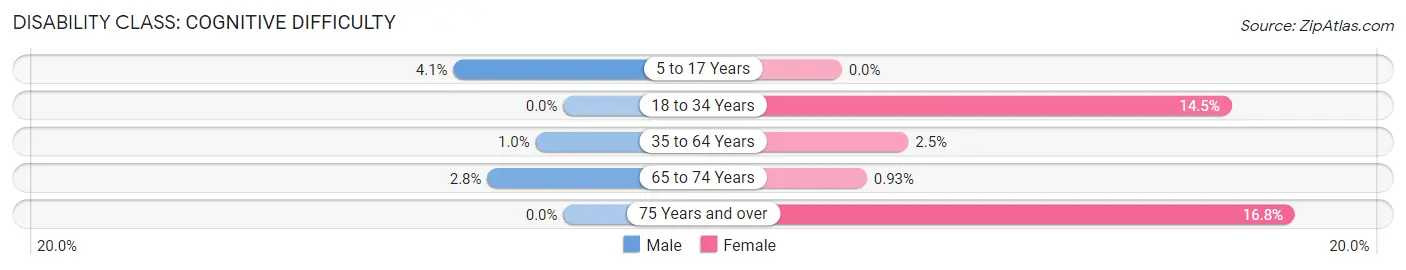
| Age Bracket | Male | Female |
| 5 to 17 Years | 19 (4.1%) | 0 (0.0%) |
| 18 to 34 Years | 0 (0.0%) | 23 (14.5%) |
| 35 to 64 Years | 8 (1.0%) | 24 (2.5%) |
| 65 to 74 Years | 10 (2.8%) | 3 (0.9%) |
| 75 Years and over | 0 (0.0%) | 55 (16.8%) |
Disability Class: Ambulatory Difficulty
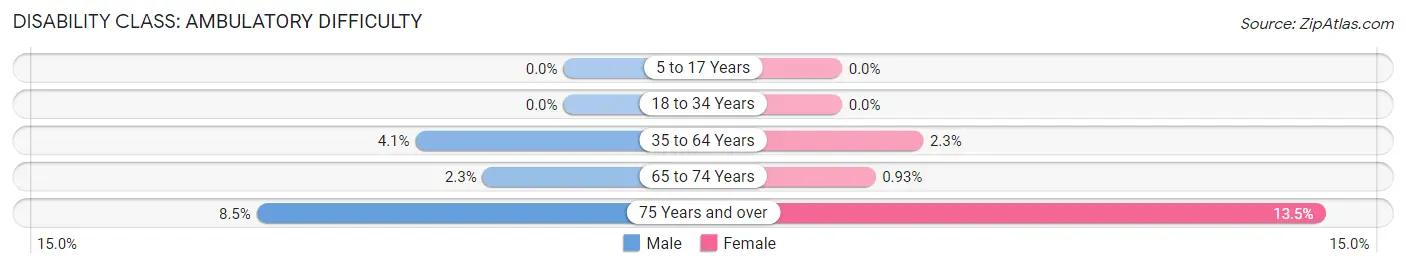
| Age Bracket | Male | Female |
| 5 to 17 Years | 0 (0.0%) | 0 (0.0%) |
| 18 to 34 Years | 0 (0.0%) | 0 (0.0%) |
| 35 to 64 Years | 32 (4.1%) | 22 (2.3%) |
| 65 to 74 Years | 8 (2.2%) | 3 (0.9%) |
| 75 Years and over | 17 (8.5%) | 44 (13.5%) |
Disability Class: Self-Care Difficulty
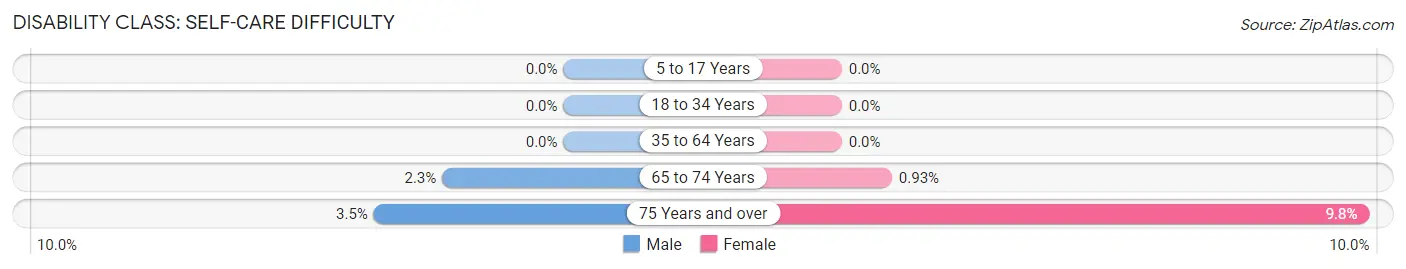
| Age Bracket | Male | Female |
| 5 to 17 Years | 0 (0.0%) | 0 (0.0%) |
| 18 to 34 Years | 0 (0.0%) | 0 (0.0%) |
| 35 to 64 Years | 0 (0.0%) | 0 (0.0%) |
| 65 to 74 Years | 8 (2.2%) | 3 (0.9%) |
| 75 Years and over | 7 (3.5%) | 32 (9.8%) |
Technology Access in Northwest Harwich
Computing Device Access in Northwest Harwich
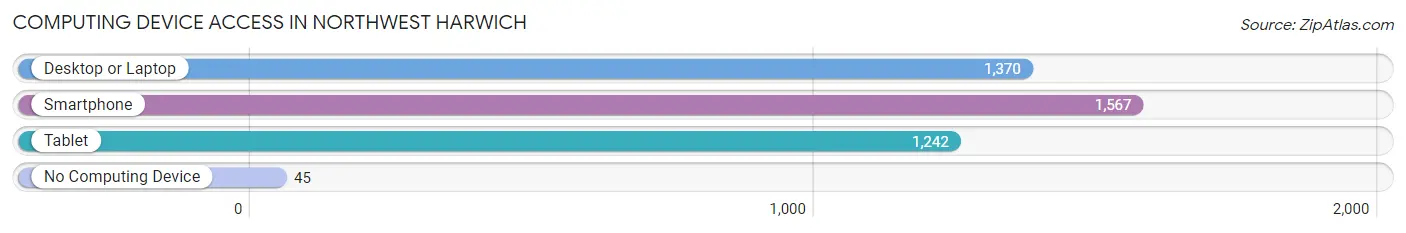
| Device Type | # Households | % Households |
| Desktop or Laptop | 1,370 | 79.6% |
| Smartphone | 1,567 | 91.1% |
| Tablet | 1,242 | 72.2% |
| No Computing Device | 45 | 2.6% |
| Total | 1,720 | 100.0% |
Internet Access in Northwest Harwich
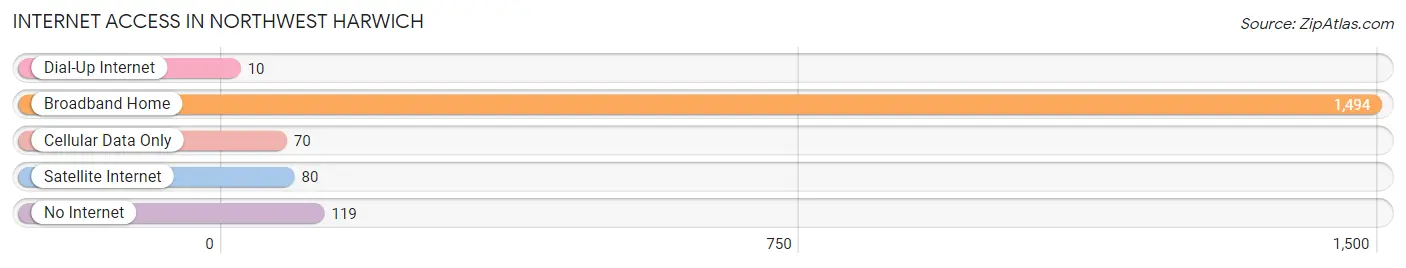
| Internet Type | # Households | % Households |
| Dial-Up Internet | 10 | 0.6% |
| Broadband Home | 1,494 | 86.9% |
| Cellular Data Only | 70 | 4.1% |
| Satellite Internet | 80 | 4.6% |
| No Internet | 119 | 6.9% |
| Total | 1,720 | 100.0% |
Northwest Harwich Summary
Northwest Harwich, MA is a small town located in the southeastern corner of Massachusetts. It is part of the town of Harwich, which is located in Barnstable County. The town of Harwich is bordered by the towns of Brewster, Chatham, Dennis, and Orleans. The population of Northwest Harwich was 2,845 at the 2010 census.
Geography
Northwest Harwich is located at 41°41'N 70°7'W. It is situated on the western side of the town of Harwich, and is bordered by the towns of Brewster, Chatham, Dennis, and Orleans. The town is located on the south side of Cape Cod Bay, and is approximately 8 miles from the Atlantic Ocean. The town is mostly rural, with a few small villages and hamlets scattered throughout. The town is home to several ponds, including Long Pond, Round Pond, and Mill Pond. The town is also home to several conservation areas, including the Harwich Conservation Trust, the Harwich Conservation Land Trust, and the Harwich Conservation Area.
Demographics
At the 2010 census, the population of Northwest Harwich was 2,845. The racial makeup of the town was 97.2% White, 0.7% African American, 0.3% Native American, 0.4% Asian, 0.1% Pacific Islander, 0.3% from other races, and 1.0% from two or more races. Hispanic or Latino of any race were 1.2% of the population.
The median age in the town was 48.7 years. 22.2% of residents were under the age of 18; 5.7% were between the ages of 18 and 24; 19.2% were from 25 to 44; 33.2% were from 45 to 64; and 19.7% were 65 years of age or older. The gender makeup of the town was 48.3% male and 51.7% female.
Economy
The economy of Northwest Harwich is largely based on tourism and fishing. The town is home to several marinas, including the Harwich Port Marina, the Harwich Yacht Club, and the Harwich Harbor Marina. The town is also home to several restaurants, shops, and other businesses. The town is also home to several cranberry bogs, which are a major source of income for the town.
The town is also home to several educational institutions, including the Harwich Elementary School, the Harwich Middle School, and the Harwich High School. The town is also home to Cape Cod Community College, which offers a variety of degree and certificate programs.
Conclusion
Northwest Harwich, MA is a small town located in the southeastern corner of Massachusetts. It is part of the town of Harwich, which is located in Barnstable County. The town is mostly rural, with a few small villages and hamlets scattered throughout. The economy of the town is largely based on tourism and fishing, and the town is home to several marinas, restaurants, shops, and other businesses. The town is also home to several educational institutions, including the Harwich Elementary School, the Harwich Middle School, and the Harwich High School. The population of Northwest Harwich was 2,845 at the 2010 census.
Common Questions
What is Per Capita Income in Northwest Harwich?
Per Capita income in Northwest Harwich is $53,295.
What is the Median Family Income in Northwest Harwich?
Median Family Income in Northwest Harwich is $92,500.
What is the Median Household income in Northwest Harwich?
Median Household Income in Northwest Harwich is $81,268.
What is Income or Wage Gap in Northwest Harwich?
Income or Wage Gap in Northwest Harwich is 46.0%.
Women in Northwest Harwich earn 54.0 cents for every dollar earned by a man.
What is Inequality or Gini Index in Northwest Harwich?
Inequality or Gini Index in Northwest Harwich is 0.46.
What is the Total Population of Northwest Harwich?
Total Population of Northwest Harwich is 4,076.
What is the Total Male Population of Northwest Harwich?
Total Male Population of Northwest Harwich is 2,117.
What is the Total Female Population of Northwest Harwich?
Total Female Population of Northwest Harwich is 1,959.
What is the Ratio of Males per 100 Females in Northwest Harwich?
There are 108.07 Males per 100 Females in Northwest Harwich.
What is the Ratio of Females per 100 Males in Northwest Harwich?
There are 92.54 Females per 100 Males in Northwest Harwich.
What is the Median Population Age in Northwest Harwich?
Median Population Age in Northwest Harwich is 56.4 Years.
What is the Average Family Size in Northwest Harwich
Average Family Size in Northwest Harwich is 2.6 People.
What is the Average Household Size in Northwest Harwich
Average Household Size in Northwest Harwich is 2.3 People.
How Large is the Labor Force in Northwest Harwich?
There are 2,031 People in the Labor Forcein in Northwest Harwich.
What is the Percentage of People in the Labor Force in Northwest Harwich?
57.2% of People are in the Labor Force in Northwest Harwich.
What is the Unemployment Rate in Northwest Harwich?
Unemployment Rate in Northwest Harwich is 12.8%.