Zip Codes with the Highest Percentage of Population Employed in Food Preparation & Serving in Lynn, MA
RELATED REPORTS & OPTIONS
Food Preparation & Serving
Lynn
Compare Zip Codes
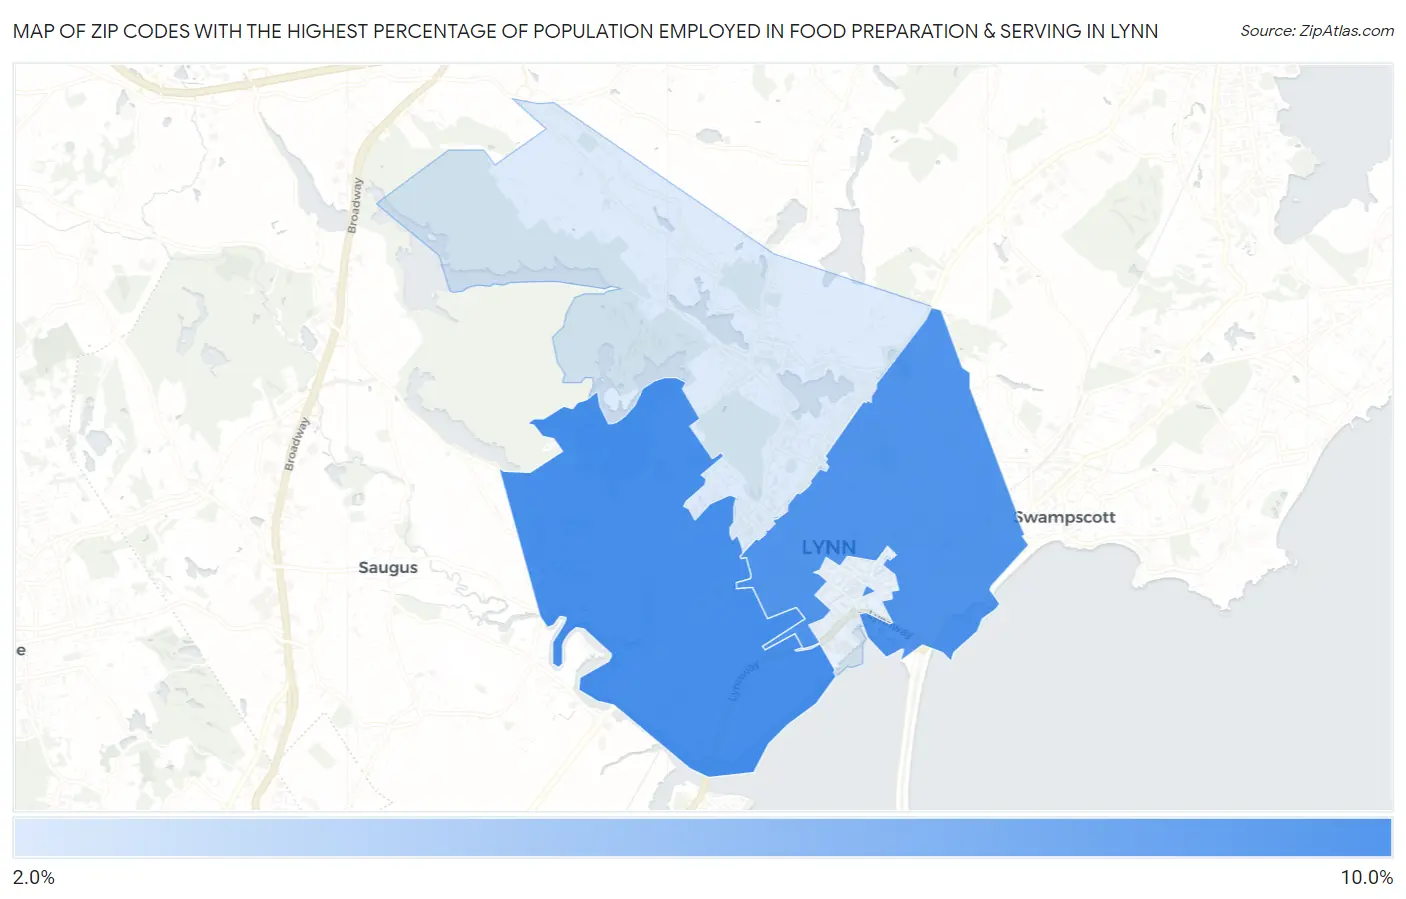
Map of Zip Codes with the Highest Percentage of Population Employed in Food Preparation & Serving in Lynn
2.5%
8.6%
Zip Codes with the Highest Percentage of Population Employed in Food Preparation & Serving in Lynn, MA
| Zip Code | % Employed | vs State | vs National | |
| 1. | 01905 | 8.6% | 4.6%(+3.95)#34 | 5.3%(+3.27)#4,020 |
| 2. | 01902 | 8.2% | 4.6%(+3.58)#43 | 5.3%(+2.90)#4,456 |
| 3. | 01904 | 2.5% | 4.6%(-2.14)#378 | 5.3%(-2.81)#23,240 |
1
Common Questions
What are the Top 3 Zip Codes with the Highest Percentage of Population Employed in Food Preparation & Serving in Lynn, MA?
Top 3 Zip Codes with the Highest Percentage of Population Employed in Food Preparation & Serving in Lynn, MA are:
What zip code has the Highest Percentage of Population Employed in Food Preparation & Serving in Lynn, MA?
01905 has the Highest Percentage of Population Employed in Food Preparation & Serving in Lynn, MA with 8.6%.
What is the Percentage of Population Employed in Food Preparation & Serving in Lynn, MA?
Percentage of Population Employed in Food Preparation & Serving in Lynn is 7.0%.
What is the Percentage of Population Employed in Food Preparation & Serving in Massachusetts?
Percentage of Population Employed in Food Preparation & Serving in Massachusetts is 4.6%.
What is the Percentage of Population Employed in Food Preparation & Serving in the United States?
Percentage of Population Employed in Food Preparation & Serving in the United States is 5.3%.