Lenox, MA Map & Demographics
Lenox Map
Lenox Overview
$47,546
PER CAPITA INCOME
$104,946
AVG FAMILY INCOME
$57,460
AVG HOUSEHOLD INCOME
60.6%
WAGE / INCOME GAP [ % ]
39.4¢/ $1
WAGE / INCOME GAP [ $ ]
0.50
INEQUALITY / GINI INDEX
1,999
TOTAL POPULATION
790
MALE POPULATION
1,209
FEMALE POPULATION
65.34
MALES / 100 FEMALES
153.04
FEMALES / 100 MALES
64.2
MEDIAN AGE
2.8
AVG FAMILY SIZE
1.9
AVG HOUSEHOLD SIZE
688
LABOR FORCE [ PEOPLE ]
37.9%
PERCENT IN LABOR FORCE
Lenox Zip Codes
Lenox Area Codes
Income in Lenox
Income Overview in Lenox
Per Capita Income in Lenox is $47,546, while median incomes of families and households are $104,946 and $57,460 respectively.
| Characteristic | Number | Measure |
| Per Capita Income | 1,999 | $47,546 |
| Median Family Income | 416 | $104,946 |
| Mean Family Income | 416 | $156,738 |
| Median Household Income | 991 | $57,460 |
| Mean Household Income | 991 | $95,072 |
| Income Deficit | 416 | $0 |
| Wage / Income Gap (%) | 1,999 | 60.55% |
| Wage / Income Gap ($) | 1,999 | 39.45¢ per $1 |
| Gini / Inequality Index | 1,999 | 0.50 |
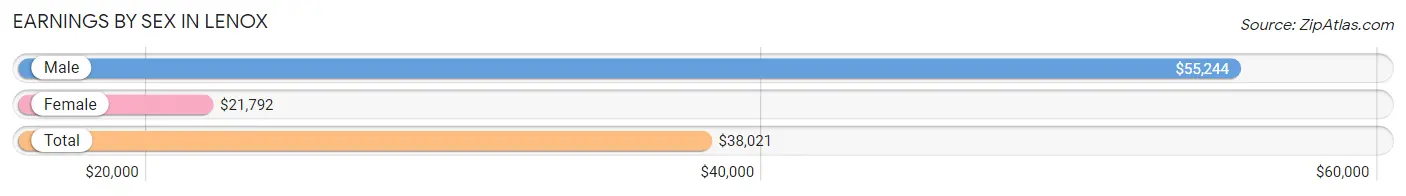
Earnings by Sex in Lenox
Average Earnings in Lenox are $38,021, $55,244 for men and $21,792 for women, a difference of 60.6%.
| Sex | Number | Average Earnings |
| Male | 338 (39.5%) | $55,244 |
| Female | 518 (60.5%) | $21,792 |
| Total | 856 (100.0%) | $38,021 |
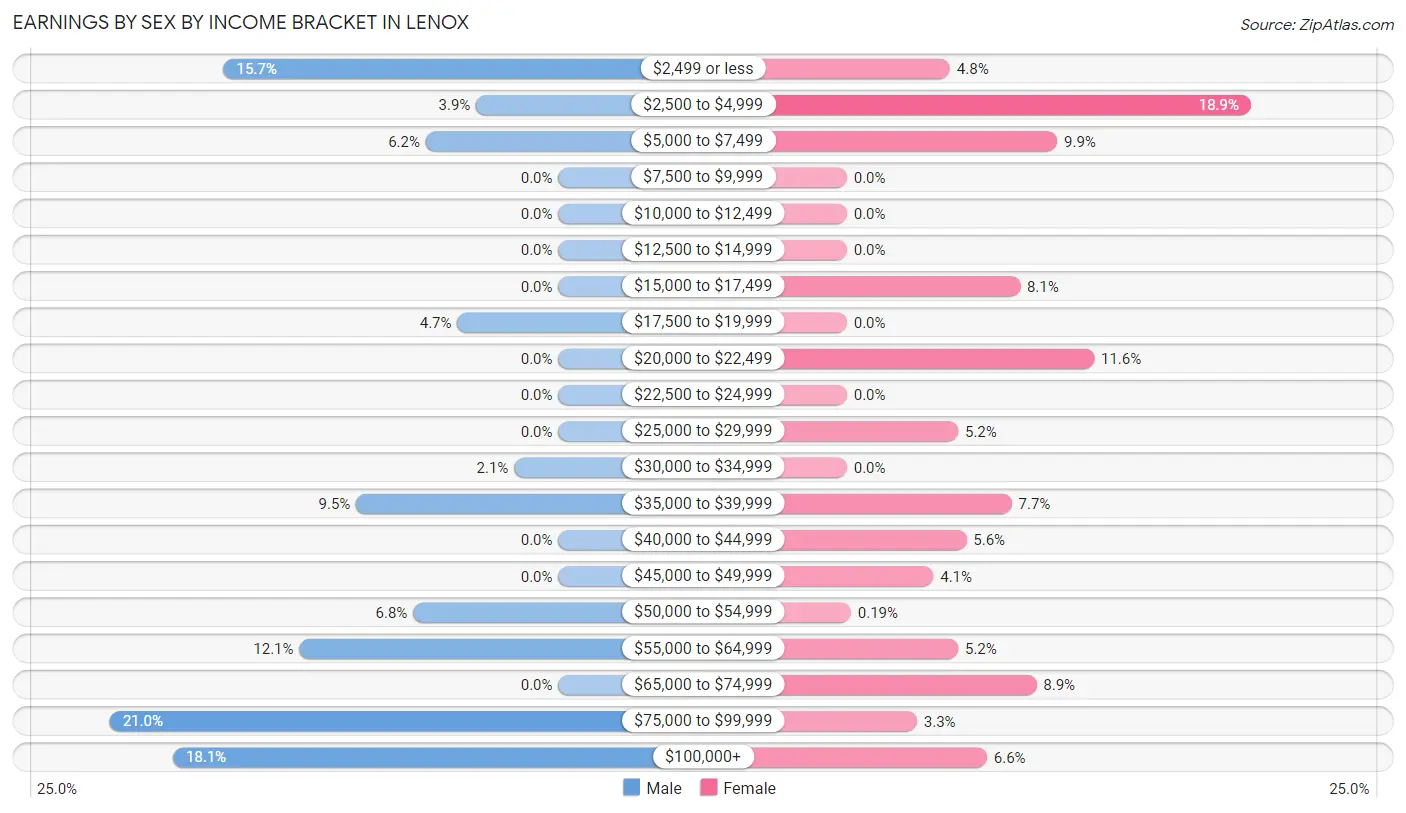
Earnings by Sex by Income Bracket in Lenox
The most common earnings brackets in Lenox are $75,000 to $99,999 for men (71 | 21.0%) and $2,500 to $4,999 for women (98 | 18.9%).
| Income | Male | Female |
| $2,499 or less | 53 (15.7%) | 25 (4.8%) |
| $2,500 to $4,999 | 13 (3.8%) | 98 (18.9%) |
| $5,000 to $7,499 | 21 (6.2%) | 51 (9.9%) |
| $7,500 to $9,999 | 0 (0.0%) | 0 (0.0%) |
| $10,000 to $12,499 | 0 (0.0%) | 0 (0.0%) |
| $12,500 to $14,999 | 0 (0.0%) | 0 (0.0%) |
| $15,000 to $17,499 | 0 (0.0%) | 42 (8.1%) |
| $17,500 to $19,999 | 16 (4.7%) | 0 (0.0%) |
| $20,000 to $22,499 | 0 (0.0%) | 60 (11.6%) |
| $22,500 to $24,999 | 0 (0.0%) | 0 (0.0%) |
| $25,000 to $29,999 | 0 (0.0%) | 27 (5.2%) |
| $30,000 to $34,999 | 7 (2.1%) | 0 (0.0%) |
| $35,000 to $39,999 | 32 (9.5%) | 40 (7.7%) |
| $40,000 to $44,999 | 0 (0.0%) | 29 (5.6%) |
| $45,000 to $49,999 | 0 (0.0%) | 21 (4.1%) |
| $50,000 to $54,999 | 23 (6.8%) | 1 (0.2%) |
| $55,000 to $64,999 | 41 (12.1%) | 27 (5.2%) |
| $65,000 to $74,999 | 0 (0.0%) | 46 (8.9%) |
| $75,000 to $99,999 | 71 (21.0%) | 17 (3.3%) |
| $100,000+ | 61 (18.0%) | 34 (6.6%) |
| Total | 338 (100.0%) | 518 (100.0%) |
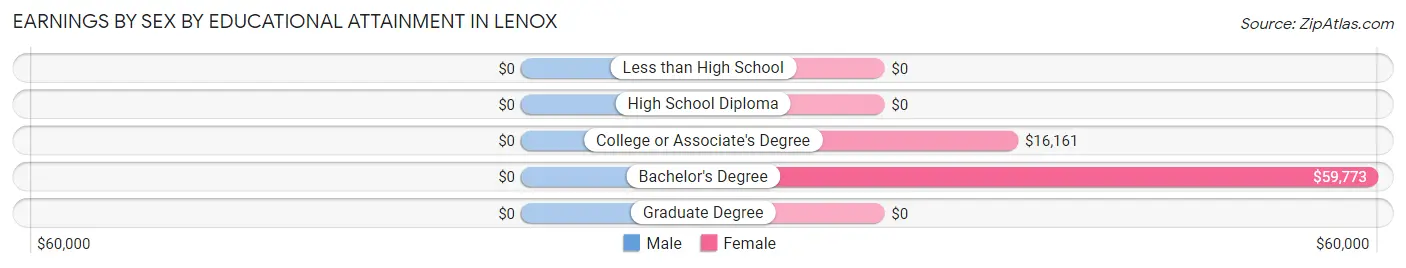
Earnings by Sex by Educational Attainment in Lenox
| Educational Attainment | Male Income | Female Income |
| Less than High School | - | - |
| High School Diploma | - | - |
| College or Associate's Degree | - | - |
| Bachelor's Degree | - | - |
| Graduate Degree | - | - |
| Total | $55,213 | $38,469 |
Family Income in Lenox
Family Income Brackets in Lenox
According to the Lenox family income data, there are 109 families falling into the $100,000 to $149,999 income range, which is the most common income bracket and makes up 26.2% of all families.
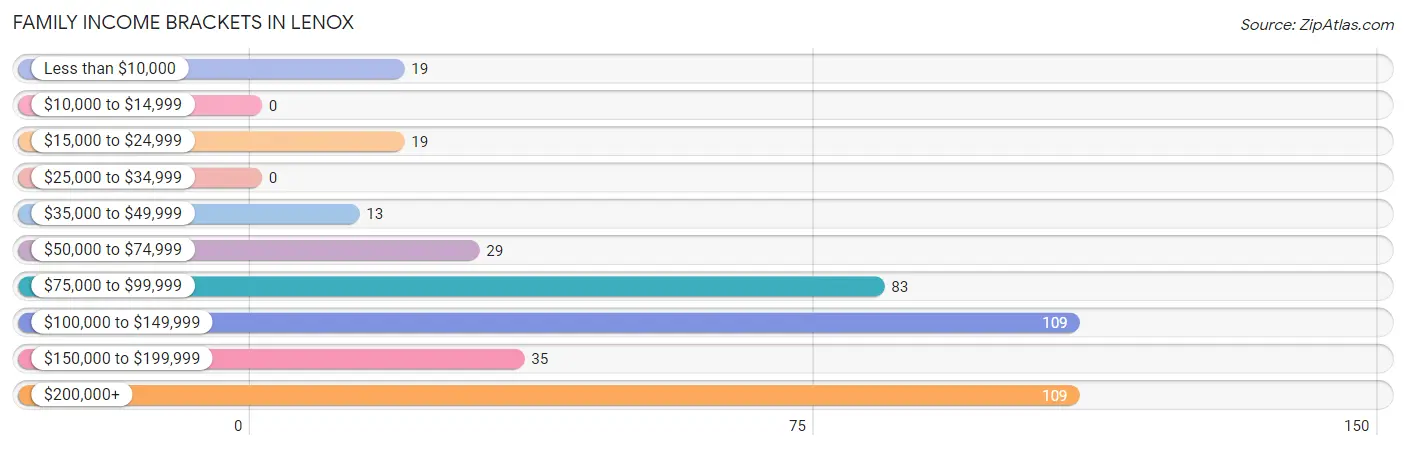
| Income Bracket | # Families | % Families |
| Less than $10,000 | 19 | 4.6% |
| $10,000 to $14,999 | 0 | 0.0% |
| $15,000 to $24,999 | 19 | 4.6% |
| $25,000 to $34,999 | 0 | 0.0% |
| $35,000 to $49,999 | 13 | 3.1% |
| $50,000 to $74,999 | 29 | 7.0% |
| $75,000 to $99,999 | 83 | 20.0% |
| $100,000 to $149,999 | 109 | 26.2% |
| $150,000 to $199,999 | 35 | 8.4% |
| $200,000+ | 109 | 26.2% |
Family Income by Famaliy Size in Lenox
4-person families (81 | 19.5%) account for the highest median family income in Lenox with $125,060 per family, while 2-person families (303 | 72.8%) have the highest median income of $52,024 per family member.
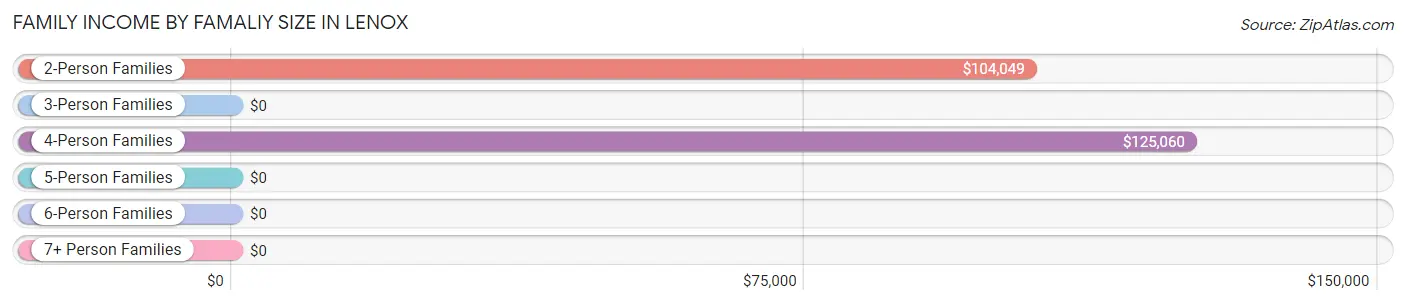
| Income Bracket | # Families | Median Income |
| 2-Person Families | 303 (72.8%) | $104,049 |
| 3-Person Families | 0 (0.0%) | $0 |
| 4-Person Families | 81 (19.5%) | $125,060 |
| 5-Person Families | 32 (7.7%) | $0 |
| 6-Person Families | 0 (0.0%) | $0 |
| 7+ Person Families | 0 (0.0%) | $0 |
| Total | 416 (100.0%) | $104,946 |
Family Income by Number of Earners in Lenox
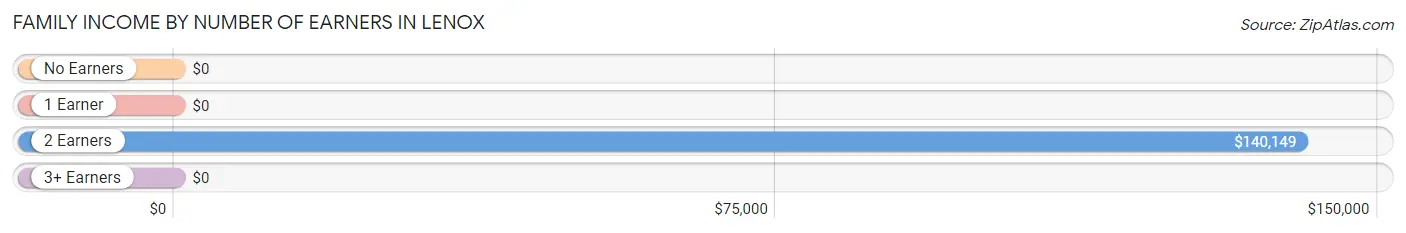
| Number of Earners | # Families | Median Income |
| No Earners | 62 (14.9%) | $0 |
| 1 Earner | 124 (29.8%) | $0 |
| 2 Earners | 209 (50.2%) | $140,149 |
| 3+ Earners | 21 (5.1%) | $0 |
| Total | 416 (100.0%) | $104,946 |
Household Income in Lenox
Household Income Brackets in Lenox
With 196 households falling in the category, the $35,000 to $49,999 income range is the most frequent in Lenox, accounting for 19.8% of all households. In contrast, only 49 households (4.9%) fall into the less than $10,000 income bracket, making it the least populous group.
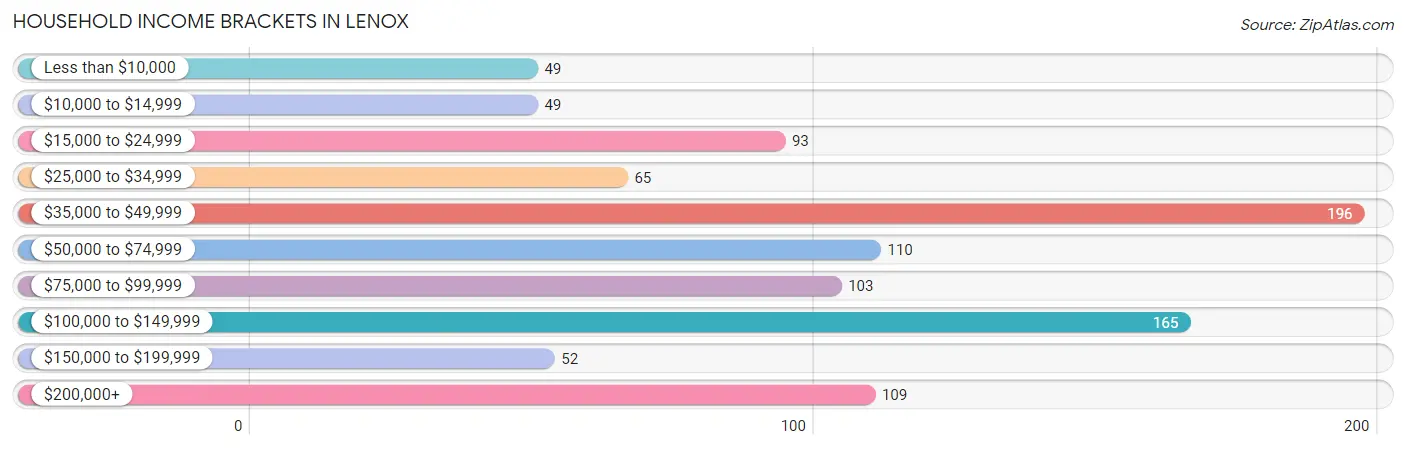
| Income Bracket | # Households | % Households |
| Less than $10,000 | 49 | 4.9% |
| $10,000 to $14,999 | 49 | 4.9% |
| $15,000 to $24,999 | 93 | 9.4% |
| $25,000 to $34,999 | 65 | 6.6% |
| $35,000 to $49,999 | 196 | 19.8% |
| $50,000 to $74,999 | 110 | 11.1% |
| $75,000 to $99,999 | 103 | 10.4% |
| $100,000 to $149,999 | 165 | 16.6% |
| $150,000 to $199,999 | 52 | 5.2% |
| $200,000+ | 109 | 11.0% |
Household Income by Householder Age in Lenox
The median household income in Lenox is $57,460, with the highest median household income of $44,570 found in the 65+ years age bracket for the primary householder. A total of 665 households (67.1%) fall into this category. Meanwhile, the 15 to 24 years age bracket for the primary householder has the lowest median household income of $0, with 18 households (1.8%) in this group.
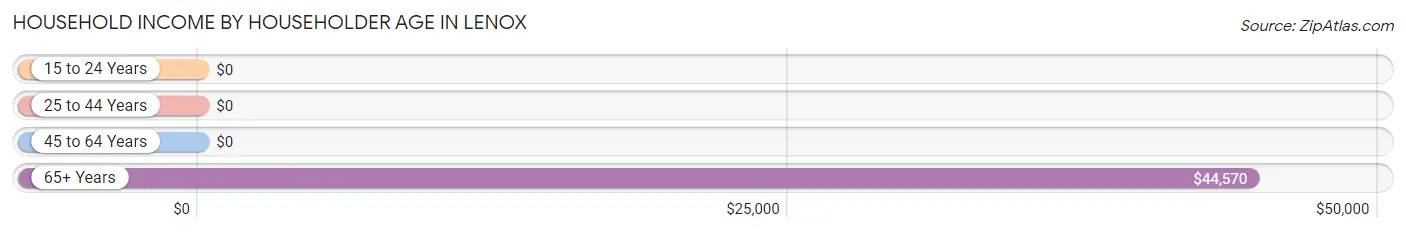
| Income Bracket | # Households | Median Income |
| 15 to 24 Years | 18 (1.8%) | $0 |
| 25 to 44 Years | 108 (10.9%) | $0 |
| 45 to 64 Years | 200 (20.2%) | $0 |
| 65+ Years | 665 (67.1%) | $44,570 |
| Total | 991 (100.0%) | $57,460 |
Poverty in Lenox
Income Below Poverty by Sex and Age in Lenox
With 15.4% poverty level for males and 8.2% for females among the residents of Lenox, 45 to 54 year old males and under 5 year old females are the most vulnerable to poverty, with 25 males (52.1%) and 24 females (100.0%) in their respective age groups living below the poverty level.
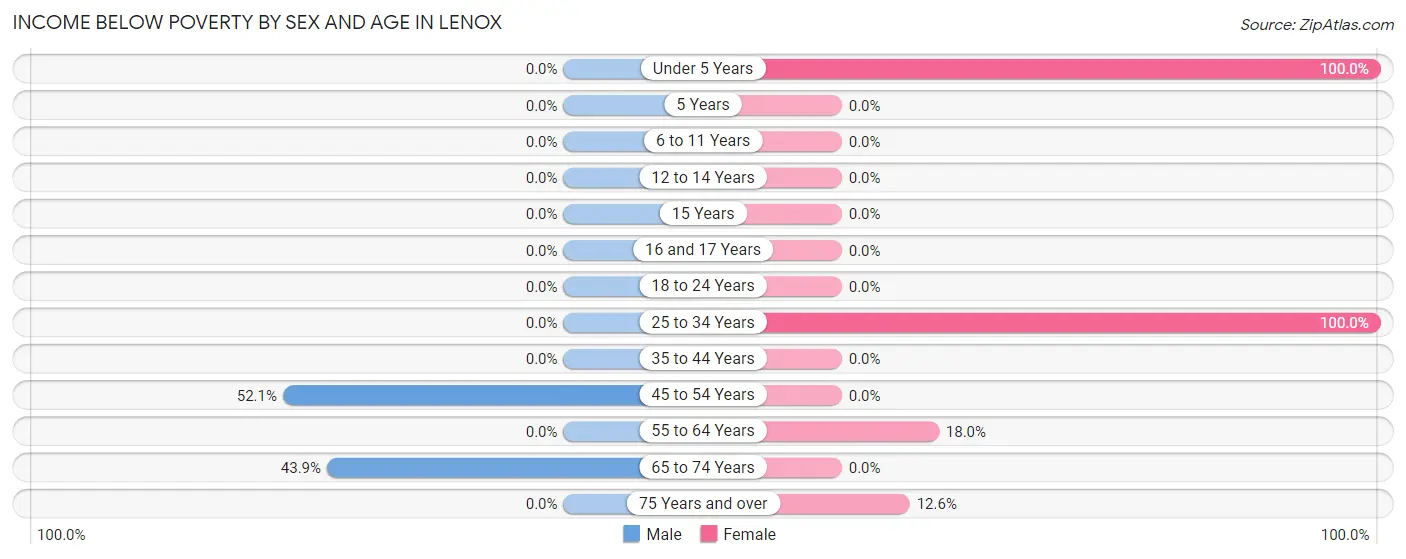
| Age Bracket | Male | Female |
| Under 5 Years | 0 (0.0%) | 24 (100.0%) |
| 5 Years | 0 (0.0%) | 0 (0.0%) |
| 6 to 11 Years | 0 (0.0%) | 0 (0.0%) |
| 12 to 14 Years | 0 (0.0%) | 0 (0.0%) |
| 15 Years | 0 (0.0%) | 0 (0.0%) |
| 16 and 17 Years | 0 (0.0%) | 0 (0.0%) |
| 18 to 24 Years | 0 (0.0%) | 0 (0.0%) |
| 25 to 34 Years | 0 (0.0%) | 19 (100.0%) |
| 35 to 44 Years | 0 (0.0%) | 0 (0.0%) |
| 45 to 54 Years | 25 (52.1%) | 0 (0.0%) |
| 55 to 64 Years | 0 (0.0%) | 20 (18.0%) |
| 65 to 74 Years | 90 (43.9%) | 0 (0.0%) |
| 75 Years and over | 0 (0.0%) | 30 (12.6%) |
| Total | 115 (15.4%) | 93 (8.2%) |
Income Above Poverty by Sex and Age in Lenox
According to the poverty statistics in Lenox, males aged 6 to 11 years and females aged 6 to 11 years are the age groups that are most secure financially, with 100.0% of males and 100.0% of females in these age groups living above the poverty line.
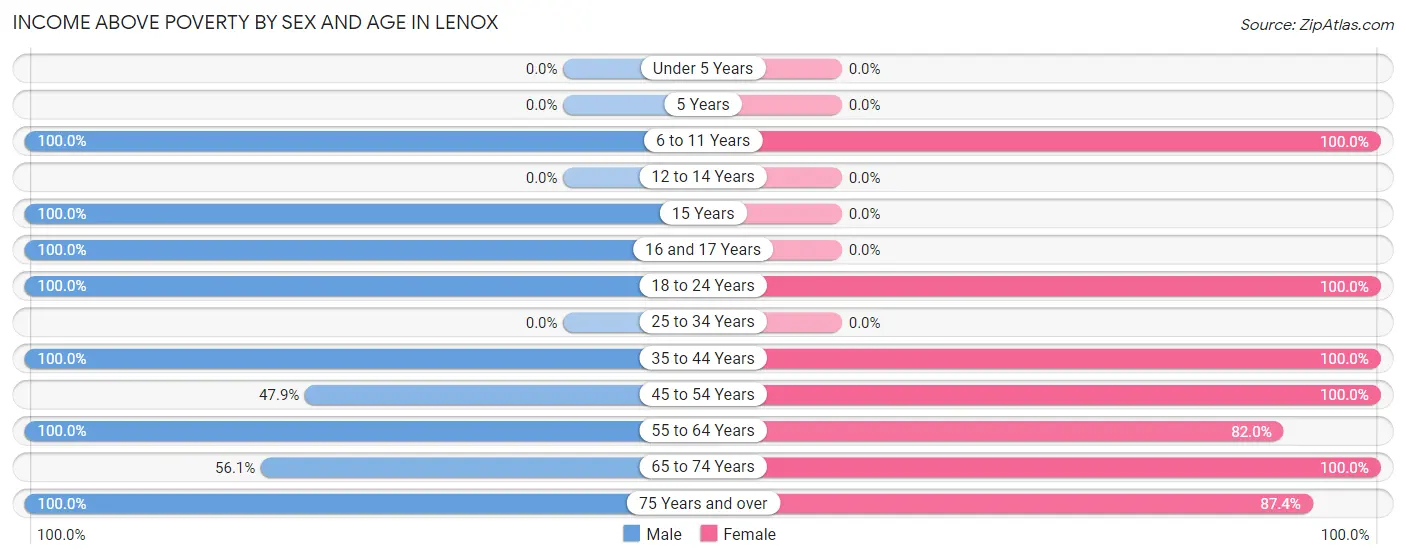
| Age Bracket | Male | Female |
| Under 5 Years | 0 (0.0%) | 0 (0.0%) |
| 5 Years | 0 (0.0%) | 0 (0.0%) |
| 6 to 11 Years | 47 (100.0%) | 58 (100.0%) |
| 12 to 14 Years | 0 (0.0%) | 0 (0.0%) |
| 15 Years | 54 (100.0%) | 0 (0.0%) |
| 16 and 17 Years | 23 (100.0%) | 0 (0.0%) |
| 18 to 24 Years | 68 (100.0%) | 151 (100.0%) |
| 25 to 34 Years | 0 (0.0%) | 0 (0.0%) |
| 35 to 44 Years | 89 (100.0%) | 94 (100.0%) |
| 45 to 54 Years | 23 (47.9%) | 134 (100.0%) |
| 55 to 64 Years | 47 (100.0%) | 91 (82.0%) |
| 65 to 74 Years | 115 (56.1%) | 305 (100.0%) |
| 75 Years and over | 167 (100.0%) | 208 (87.4%) |
| Total | 633 (84.6%) | 1,041 (91.8%) |
Income Below Poverty Among Married-Couple Families in Lenox
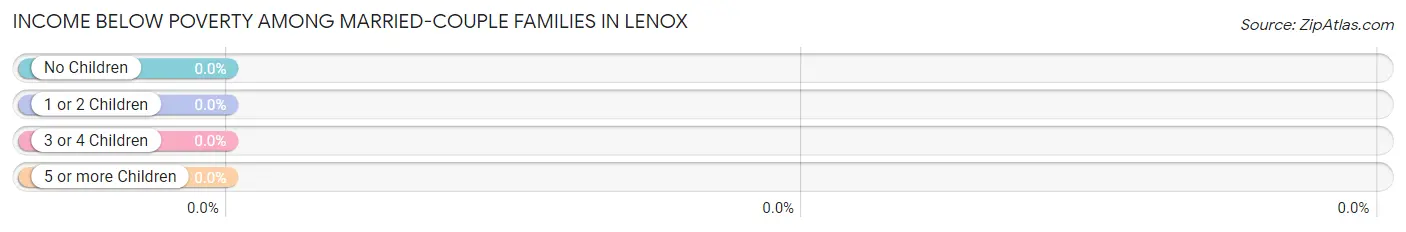
| Children | Above Poverty | Below Poverty |
| No Children | 226 (100.0%) | 0 (0.0%) |
| 1 or 2 Children | 53 (100.0%) | 0 (0.0%) |
| 3 or 4 Children | 0 (0.0%) | 0 (0.0%) |
| 5 or more Children | 0 (0.0%) | 0 (0.0%) |
| Total | 279 (100.0%) | 0 (0.0%) |
Income Below Poverty Among Single-Parent Households in Lenox
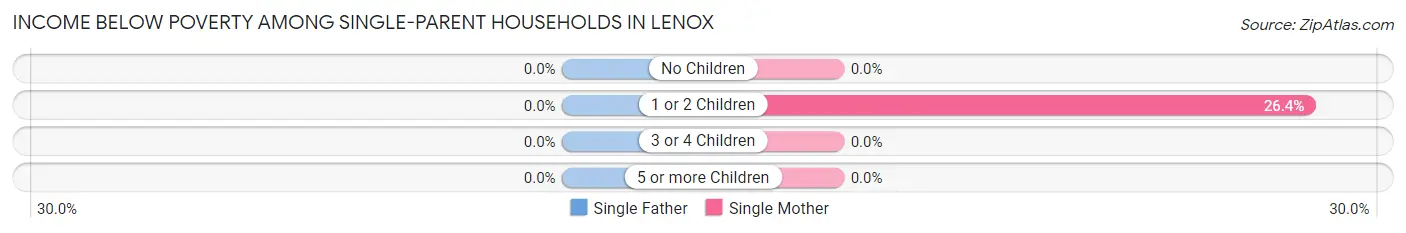
| Children | Single Father | Single Mother |
| No Children | 0 (0.0%) | 0 (0.0%) |
| 1 or 2 Children | 0 (0.0%) | 19 (26.4%) |
| 3 or 4 Children | 0 (0.0%) | 0 (0.0%) |
| 5 or more Children | 0 (0.0%) | 0 (0.0%) |
| Total | 0 (0.0%) | 19 (13.9%) |
Income Below Poverty Among Married-Couple vs Single-Parent Households in Lenox
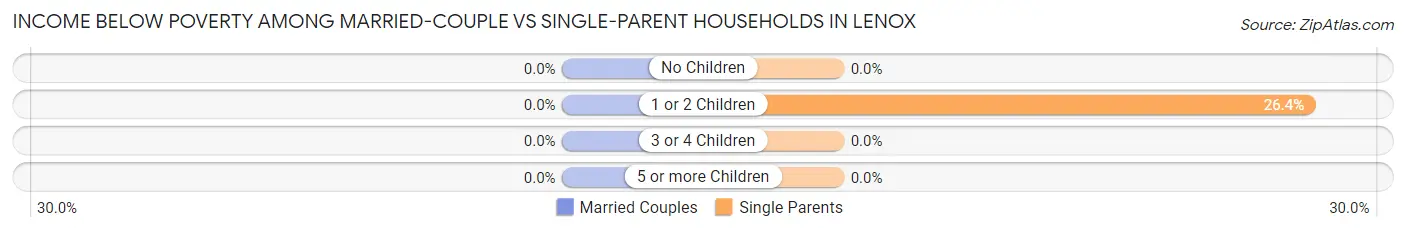
| Children | Married-Couple Families | Single-Parent Households |
| No Children | 0 (0.0%) | 0 (0.0%) |
| 1 or 2 Children | 0 (0.0%) | 19 (26.4%) |
| 3 or 4 Children | 0 (0.0%) | 0 (0.0%) |
| 5 or more Children | 0 (0.0%) | 0 (0.0%) |
| Total | 0 (0.0%) | 19 (13.9%) |
Race in Lenox
The most populous races in Lenox are White / Caucasian (1,821 | 91.1%), Hispanic or Latino (102 | 5.1%), and Two or more Races (98 | 4.9%).
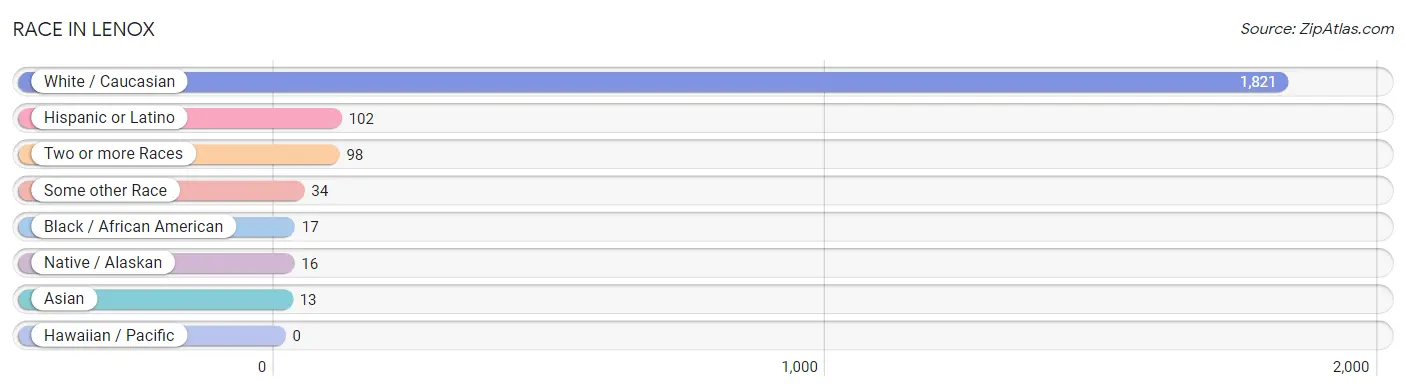
| Race | # Population | % Population |
| Asian | 13 | 0.6% |
| Black / African American | 17 | 0.9% |
| Hawaiian / Pacific | 0 | 0.0% |
| Hispanic or Latino | 102 | 5.1% |
| Native / Alaskan | 16 | 0.8% |
| White / Caucasian | 1,821 | 91.1% |
| Two or more Races | 98 | 4.9% |
| Some other Race | 34 | 1.7% |
| Total | 1,999 | 100.0% |
Ancestry in Lenox
The most populous ancestries reported in Lenox are Irish (574 | 28.7%), English (341 | 17.1%), Italian (202 | 10.1%), Polish (169 | 8.5%), and German (156 | 7.8%), together accounting for 72.1% of all Lenox residents.
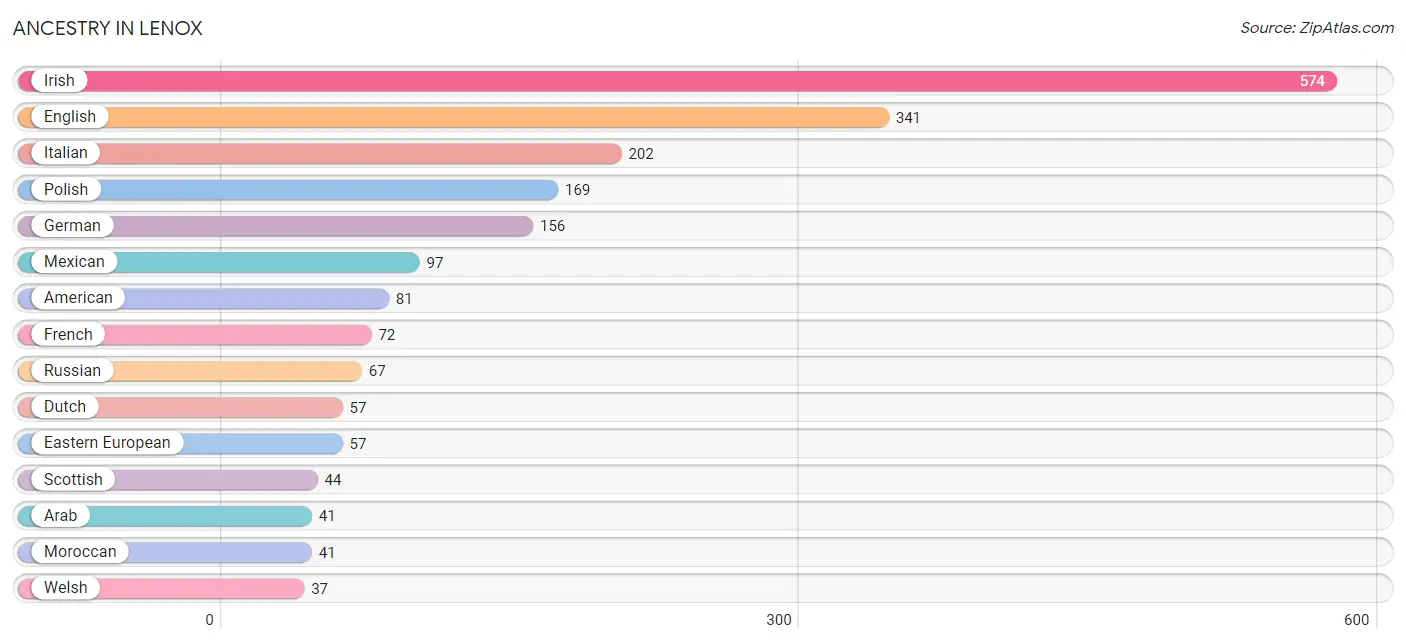
| Ancestry | # Population | % Population |
| American | 81 | 4.1% |
| Arab | 41 | 2.1% |
| Austrian | 16 | 0.8% |
| Burmese | 16 | 0.8% |
| Cherokee | 7 | 0.4% |
| Dutch | 57 | 2.9% |
| Eastern European | 57 | 2.9% |
| English | 341 | 17.1% |
| European | 16 | 0.8% |
| French | 72 | 3.6% |
| French Canadian | 16 | 0.8% |
| German | 156 | 7.8% |
| Irish | 574 | 28.7% |
| Italian | 202 | 10.1% |
| Lithuanian | 15 | 0.7% |
| Mexican | 97 | 4.9% |
| Mexican American Indian | 16 | 0.8% |
| Moroccan | 41 | 2.1% |
| Norwegian | 16 | 0.8% |
| Pakistani | 36 | 1.8% |
| Polish | 169 | 8.5% |
| Puerto Rican | 5 | 0.3% |
| Romanian | 22 | 1.1% |
| Russian | 67 | 3.4% |
| Scandinavian | 15 | 0.7% |
| Scotch-Irish | 30 | 1.5% |
| Scottish | 44 | 2.2% |
| Swedish | 24 | 1.2% |
| Welsh | 37 | 1.8% | View All 29 Rows |
Immigrants in Lenox
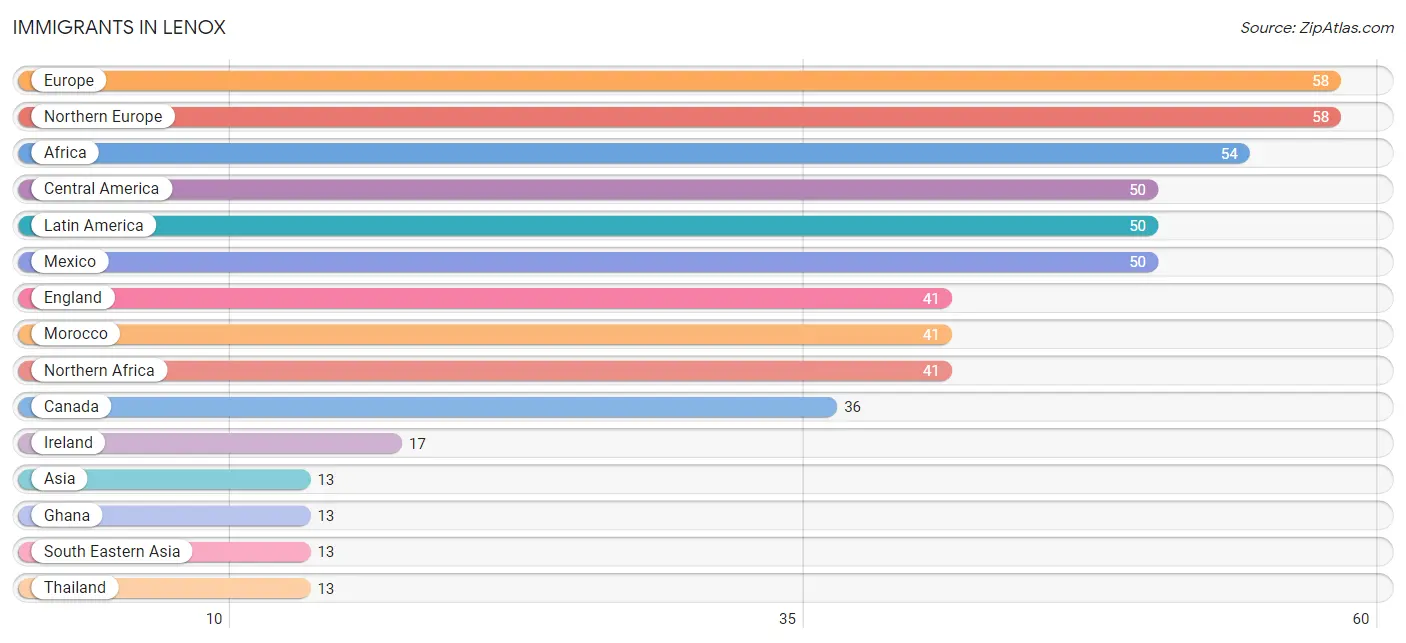
The most numerous immigrant groups reported in Lenox came from Europe (58 | 2.9%), Northern Europe (58 | 2.9%), Africa (54 | 2.7%), Central America (50 | 2.5%), and Latin America (50 | 2.5%), together accounting for 13.5% of all Lenox residents.
| Immigration Origin | # Population | % Population |
| Africa | 54 | 2.7% |
| Asia | 13 | 0.6% |
| Canada | 36 | 1.8% |
| Central America | 50 | 2.5% |
| England | 41 | 2.1% |
| Europe | 58 | 2.9% |
| Ghana | 13 | 0.6% |
| Ireland | 17 | 0.9% |
| Latin America | 50 | 2.5% |
| Mexico | 50 | 2.5% |
| Morocco | 41 | 2.1% |
| Northern Africa | 41 | 2.1% |
| Northern Europe | 58 | 2.9% |
| South Eastern Asia | 13 | 0.6% |
| Thailand | 13 | 0.6% |
| Western Africa | 13 | 0.6% | View All 16 Rows |
Sex and Age in Lenox
Sex and Age in Lenox
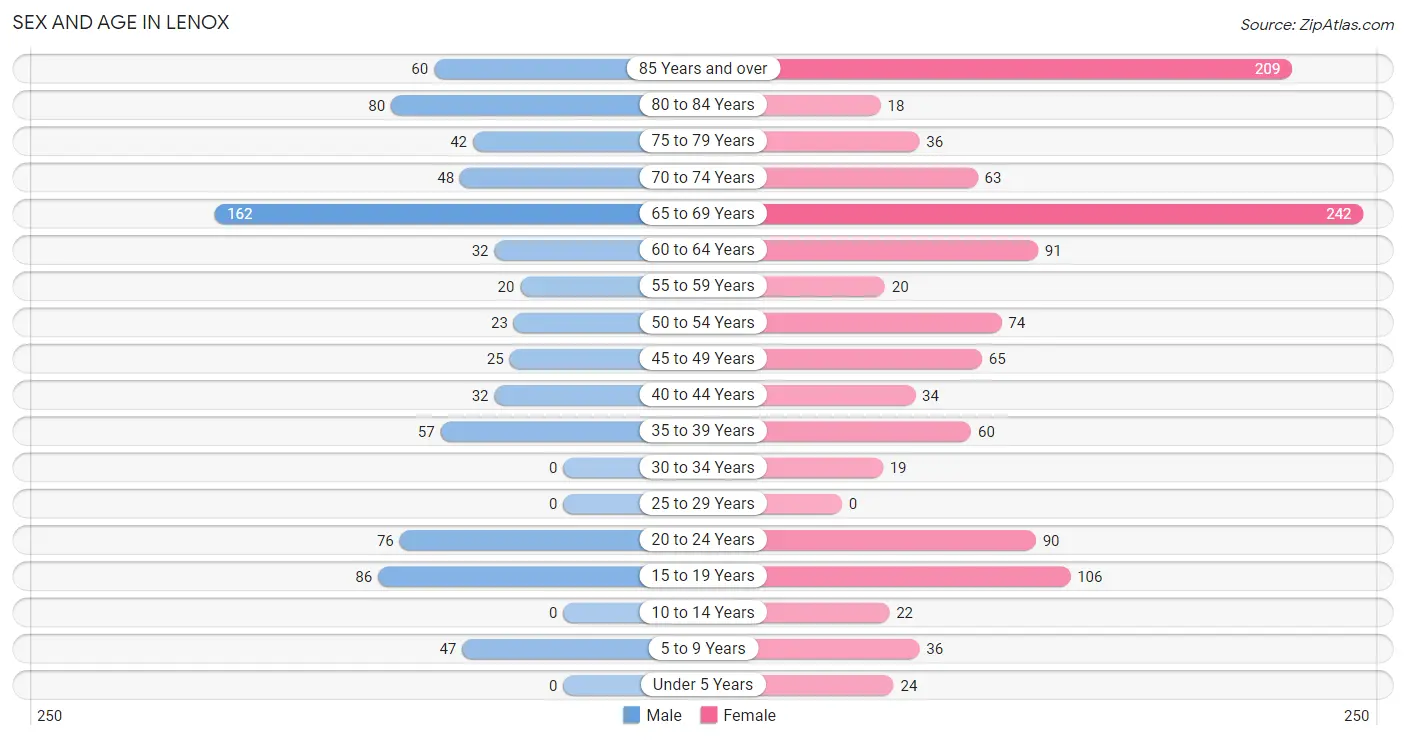
The most populous age groups in Lenox are 65 to 69 Years (162 | 20.5%) for men and 65 to 69 Years (242 | 20.0%) for women.
| Age Bracket | Male | Female |
| Under 5 Years | 0 (0.0%) | 24 (2.0%) |
| 5 to 9 Years | 47 (5.9%) | 36 (3.0%) |
| 10 to 14 Years | 0 (0.0%) | 22 (1.8%) |
| 15 to 19 Years | 86 (10.9%) | 106 (8.8%) |
| 20 to 24 Years | 76 (9.6%) | 90 (7.4%) |
| 25 to 29 Years | 0 (0.0%) | 0 (0.0%) |
| 30 to 34 Years | 0 (0.0%) | 19 (1.6%) |
| 35 to 39 Years | 57 (7.2%) | 60 (5.0%) |
| 40 to 44 Years | 32 (4.1%) | 34 (2.8%) |
| 45 to 49 Years | 25 (3.2%) | 65 (5.4%) |
| 50 to 54 Years | 23 (2.9%) | 74 (6.1%) |
| 55 to 59 Years | 20 (2.5%) | 20 (1.7%) |
| 60 to 64 Years | 32 (4.1%) | 91 (7.5%) |
| 65 to 69 Years | 162 (20.5%) | 242 (20.0%) |
| 70 to 74 Years | 48 (6.1%) | 63 (5.2%) |
| 75 to 79 Years | 42 (5.3%) | 36 (3.0%) |
| 80 to 84 Years | 80 (10.1%) | 18 (1.5%) |
| 85 Years and over | 60 (7.6%) | 209 (17.3%) |
| Total | 790 (100.0%) | 1,209 (100.0%) |
Families and Households in Lenox
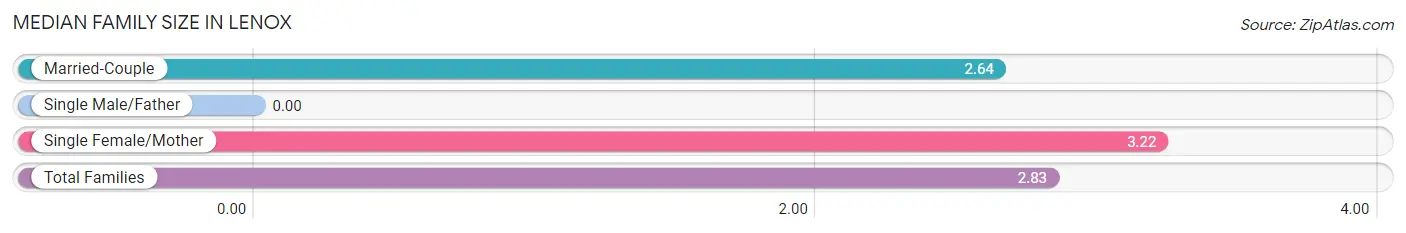
Median Family Size in Lenox
| Family Type | # Families | Family Size |
| Married-Couple | 279 (67.1%) | 2.64 |
| Single Male/Father | 0 (0.0%) | - |
| Single Female/Mother | 137 (32.9%) | 3.22 |
| Total Families | 416 (100.0%) | 2.83 |
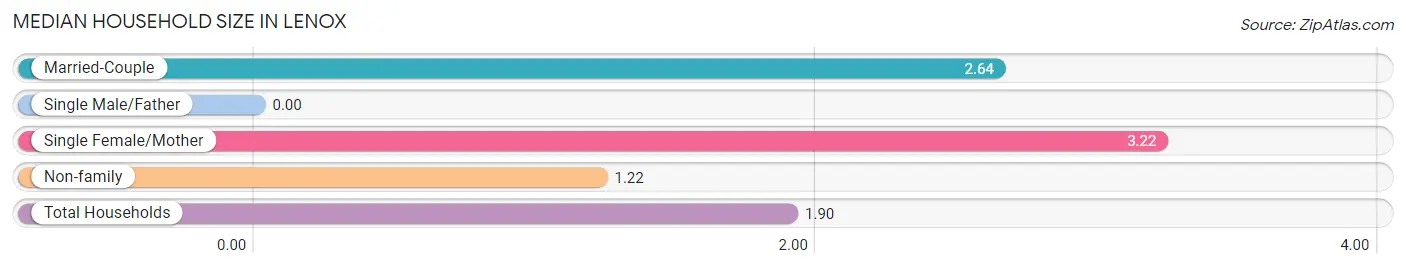
Median Household Size in Lenox
| Household Type | # Households | Household Size |
| Married-Couple | 279 (28.1%) | 2.64 |
| Single Male/Father | 0 (0.0%) | - |
| Single Female/Mother | 137 (13.8%) | 3.22 |
| Non-family | 575 (58.0%) | 1.22 |
| Total Households | 991 (100.0%) | 1.90 |
Household Size by Marriage Status in Lenox
Out of a total of 991 households in Lenox, 416 (42.0%) are family households, while 575 (58.0%) are nonfamily households. The most numerous type of family households are 2-person households, comprising 303, and the most common type of nonfamily households are 1-person households, comprising 440.
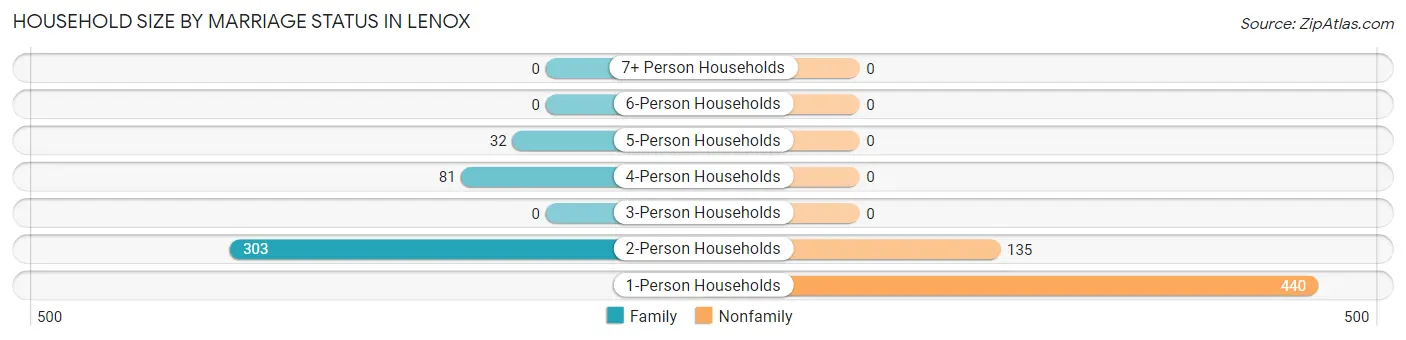
| Household Size | Family Households | Nonfamily Households |
| 1-Person Households | - | 440 (44.4%) |
| 2-Person Households | 303 (30.6%) | 135 (13.6%) |
| 3-Person Households | 0 (0.0%) | 0 (0.0%) |
| 4-Person Households | 81 (8.2%) | 0 (0.0%) |
| 5-Person Households | 32 (3.2%) | 0 (0.0%) |
| 6-Person Households | 0 (0.0%) | 0 (0.0%) |
| 7+ Person Households | 0 (0.0%) | 0 (0.0%) |
| Total | 416 (42.0%) | 575 (58.0%) |
Female Fertility in Lenox
Fertility by Age in Lenox
| Age Bracket | Women with Births | Births / 1,000 Women |
| 15 to 19 years | 0 (0.0%) | 0.0 |
| 20 to 34 years | 0 (0.0%) | 0.0 |
| 35 to 50 years | 0 (0.0%) | 0.0 |
| Total | 0 (0.0%) | 0.0 |
Fertility by Age by Marriage Status in Lenox
| Age Bracket | Married | Unmarried |
| 15 to 19 years | 0 (0.0%) | 0 (0.0%) |
| 20 to 34 years | 0 (0.0%) | 0 (0.0%) |
| 35 to 50 years | 0 (0.0%) | 0 (0.0%) |
| Total | 0 (0.0%) | 0 (0.0%) |
Fertility by Education in Lenox
| Educational Attainment | Women with Births | Births / 1,000 Women |
| Less than High School | 0 (0.0%) | 0.0 |
| High School Diploma | 0 (0.0%) | 0.0 |
| College or Associate's Degree | 0 (0.0%) | 0.0 |
| Bachelor's Degree | 0 (0.0%) | 0.0 |
| Graduate Degree | 0 (0.0%) | 0.0 |
| Total | 0 (0.0%) | 0.0 |
Fertility by Education by Marriage Status in Lenox
| Educational Attainment | Married | Unmarried |
| Less than High School | 0 (0.0%) | 0 (0.0%) |
| High School Diploma | 0 (0.0%) | 0 (0.0%) |
| College or Associate's Degree | 0 (0.0%) | 0 (0.0%) |
| Bachelor's Degree | 0 (0.0%) | 0 (0.0%) |
| Graduate Degree | 0 (0.0%) | 0 (0.0%) |
| Total | 0 (0.0%) | 0 (0.0%) |
Employment Characteristics in Lenox
Employment by Class of Employer in Lenox
Among the 689 employed individuals in Lenox, private company employees (398 | 57.8%), not-for-profit organizations (135 | 19.6%), and state government employees (80 | 11.6%) make up the most common classes of employment.
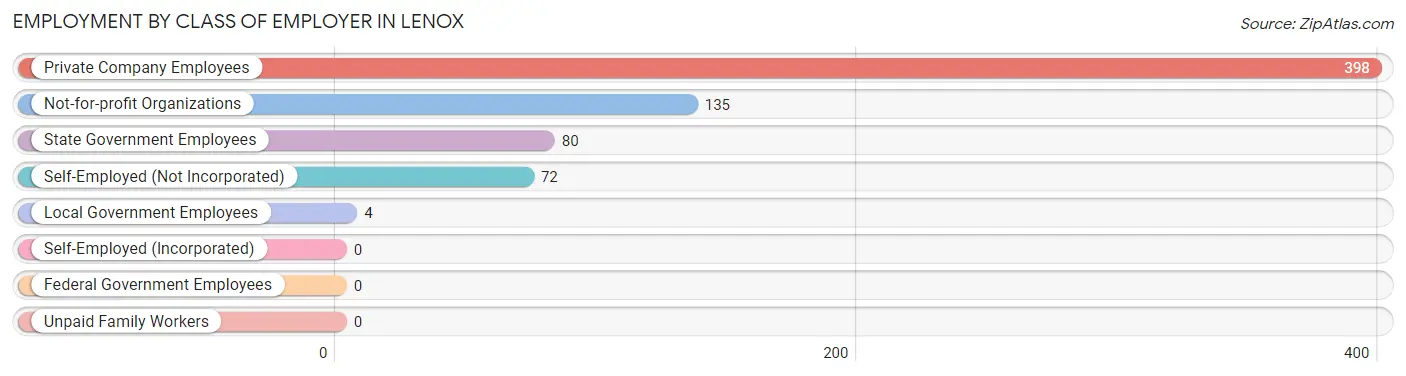
| Employer Class | # Employees | % Employees |
| Private Company Employees | 398 | 57.8% |
| Self-Employed (Incorporated) | 0 | 0.0% |
| Self-Employed (Not Incorporated) | 72 | 10.4% |
| Not-for-profit Organizations | 135 | 19.6% |
| Local Government Employees | 4 | 0.6% |
| State Government Employees | 80 | 11.6% |
| Federal Government Employees | 0 | 0.0% |
| Unpaid Family Workers | 0 | 0.0% |
| Total | 689 | 100.0% |
Employment Status by Age in Lenox
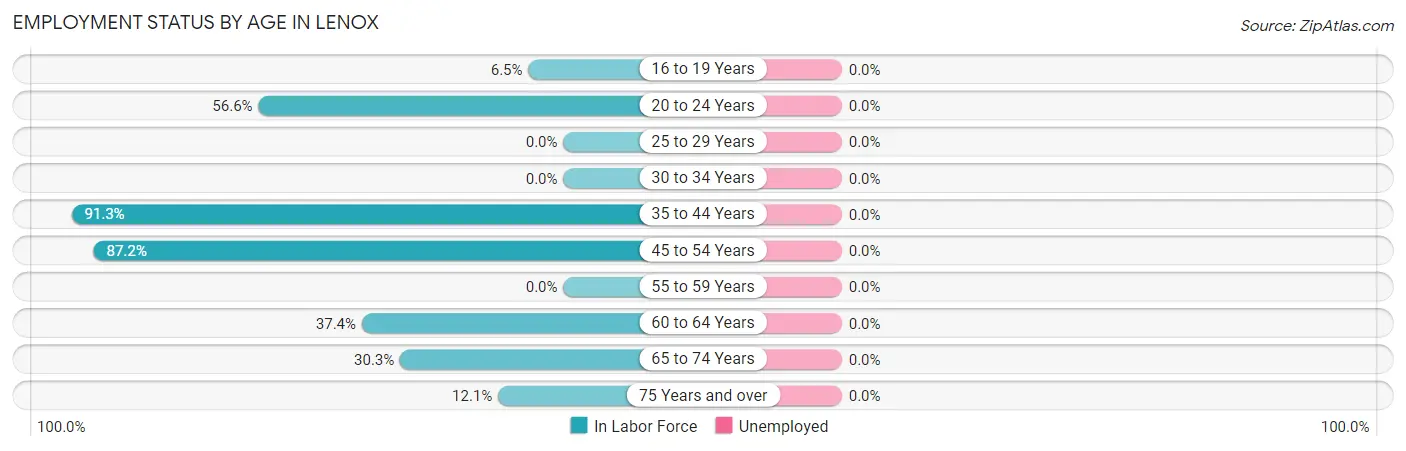
| Age Bracket | In Labor Force | Unemployed |
| 16 to 19 Years | 9 (6.5%) | 0 (0.0%) |
| 20 to 24 Years | 94 (56.6%) | 0 (0.0%) |
| 25 to 29 Years | 0 (0.0%) | 0 (0.0%) |
| 30 to 34 Years | 0 (0.0%) | 0 (0.0%) |
| 35 to 44 Years | 167 (91.3%) | 0 (0.0%) |
| 45 to 54 Years | 163 (87.2%) | 0 (0.0%) |
| 55 to 59 Years | 0 (0.0%) | 0 (0.0%) |
| 60 to 64 Years | 46 (37.4%) | 0 (0.0%) |
| 65 to 74 Years | 156 (30.3%) | 0 (0.0%) |
| 75 Years and over | 54 (12.1%) | 0 (0.0%) |
| Total | 688 (37.9%) | 0 (0.0%) |
Employment Status by Educational Attainment in Lenox
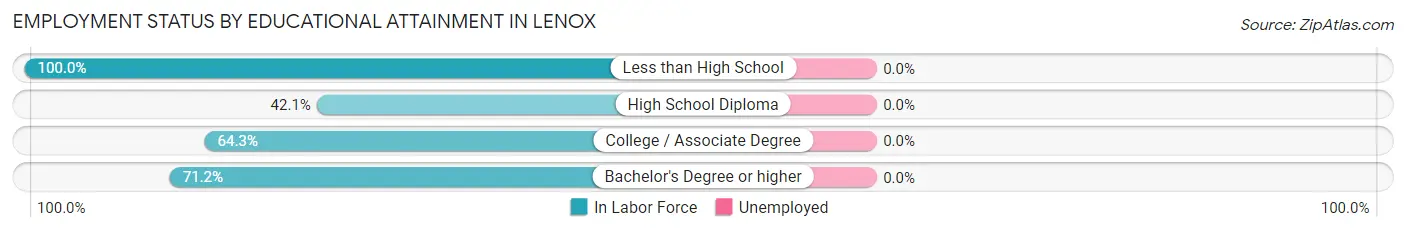
| Educational Attainment | In Labor Force | Unemployed |
| Less than High School | 101 (100.0%) | 0 (0.0%) |
| High School Diploma | 61 (42.1%) | 0 (0.0%) |
| College / Associate Degree | 36 (64.3%) | 0 (0.0%) |
| Bachelor's Degree or higher | 178 (71.2%) | 0 (0.0%) |
| Total | 376 (68.1%) | 0 (0.0%) |
Employment Occupations by Sex in Lenox
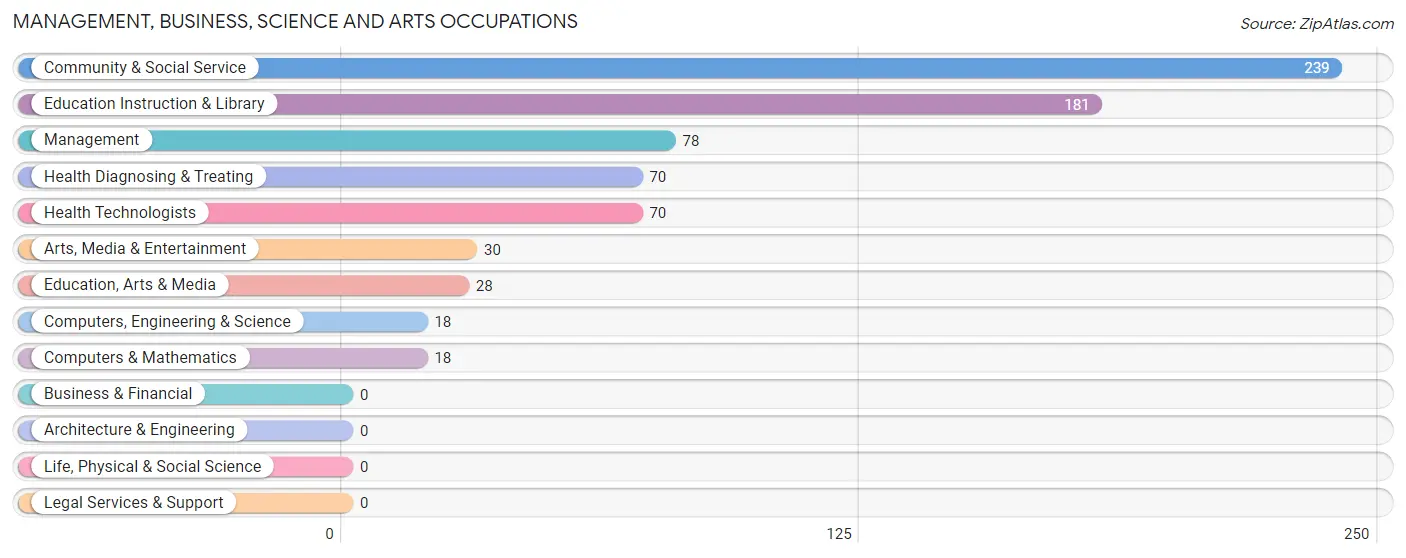
Management, Business, Science and Arts Occupations
The most common Management, Business, Science and Arts occupations in Lenox are Community & Social Service (239 | 34.7%), Education Instruction & Library (181 | 26.3%), Management (78 | 11.3%), Health Diagnosing & Treating (70 | 10.2%), and Health Technologists (70 | 10.2%).
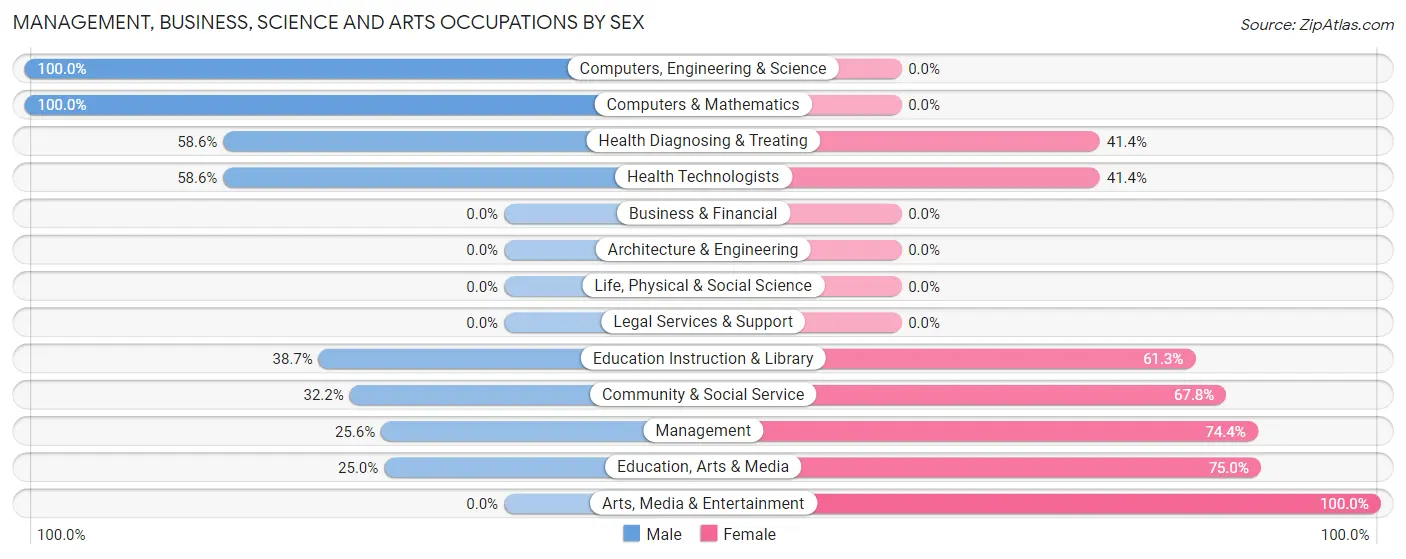
Management, Business, Science and Arts Occupations by Sex
Within the Management, Business, Science and Arts occupations in Lenox, the most male-oriented occupations are Computers, Engineering & Science (100.0%), Computers & Mathematics (100.0%), and Health Diagnosing & Treating (58.6%), while the most female-oriented occupations are Arts, Media & Entertainment (100.0%), Education, Arts & Media (75.0%), and Management (74.4%).
| Occupation | Male | Female |
| Management | 20 (25.6%) | 58 (74.4%) |
| Business & Financial | 0 (0.0%) | 0 (0.0%) |
| Computers, Engineering & Science | 18 (100.0%) | 0 (0.0%) |
| Computers & Mathematics | 18 (100.0%) | 0 (0.0%) |
| Architecture & Engineering | 0 (0.0%) | 0 (0.0%) |
| Life, Physical & Social Science | 0 (0.0%) | 0 (0.0%) |
| Community & Social Service | 77 (32.2%) | 162 (67.8%) |
| Education, Arts & Media | 7 (25.0%) | 21 (75.0%) |
| Legal Services & Support | 0 (0.0%) | 0 (0.0%) |
| Education Instruction & Library | 70 (38.7%) | 111 (61.3%) |
| Arts, Media & Entertainment | 0 (0.0%) | 30 (100.0%) |
| Health Diagnosing & Treating | 41 (58.6%) | 29 (41.4%) |
| Health Technologists | 41 (58.6%) | 29 (41.4%) |
| Total (Category) | 156 (38.5%) | 249 (61.5%) |
| Total (Overall) | 290 (42.1%) | 399 (57.9%) |
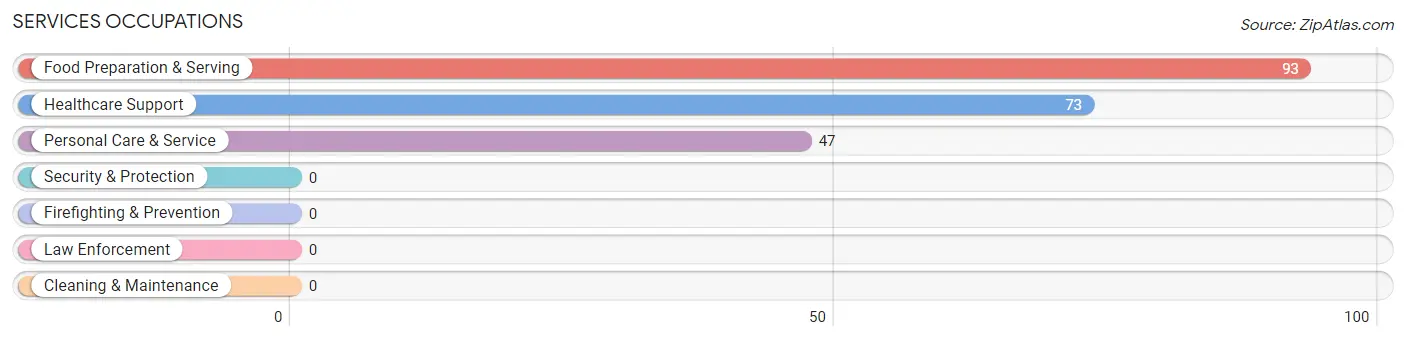
Services Occupations
The most common Services occupations in Lenox are Food Preparation & Serving (93 | 13.5%), Healthcare Support (73 | 10.6%), and Personal Care & Service (47 | 6.8%).
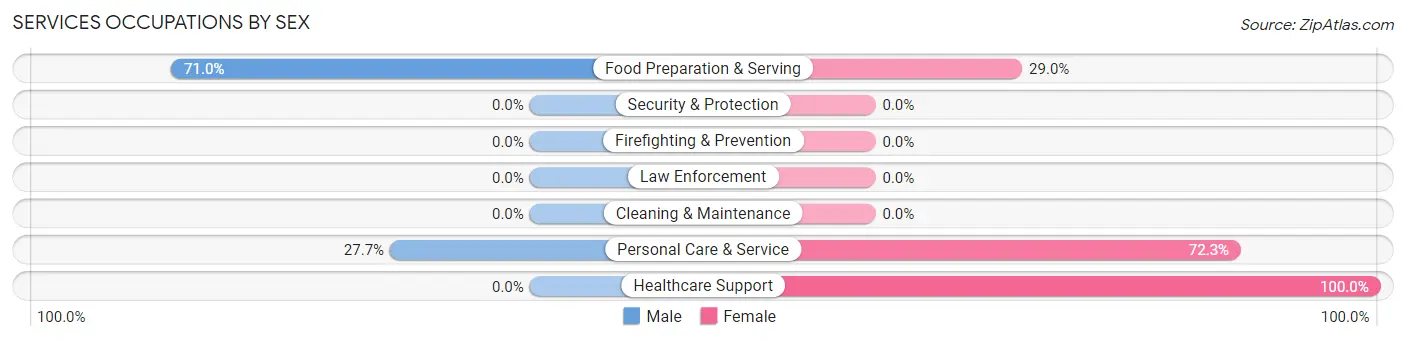
Services Occupations by Sex
Within the Services occupations in Lenox, the most male-oriented occupations are Food Preparation & Serving (71.0%), and Personal Care & Service (27.7%), while the most female-oriented occupations are Healthcare Support (100.0%), Personal Care & Service (72.3%), and Food Preparation & Serving (29.0%).
| Occupation | Male | Female |
| Healthcare Support | 0 (0.0%) | 73 (100.0%) |
| Security & Protection | 0 (0.0%) | 0 (0.0%) |
| Firefighting & Prevention | 0 (0.0%) | 0 (0.0%) |
| Law Enforcement | 0 (0.0%) | 0 (0.0%) |
| Food Preparation & Serving | 66 (71.0%) | 27 (29.0%) |
| Cleaning & Maintenance | 0 (0.0%) | 0 (0.0%) |
| Personal Care & Service | 13 (27.7%) | 34 (72.3%) |
| Total (Category) | 79 (37.1%) | 134 (62.9%) |
| Total (Overall) | 290 (42.1%) | 399 (57.9%) |
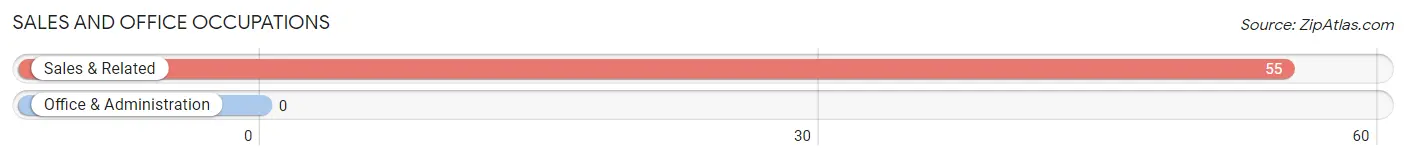
Sales and Office Occupations
The most common Sales and Office occupations in Lenox are , and Sales & Related (55 | 8.0%).
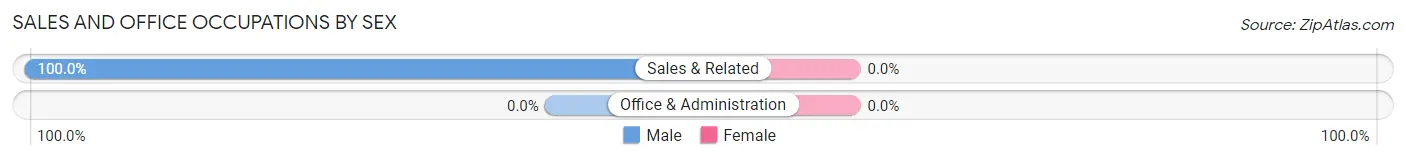
Sales and Office Occupations by Sex
| Occupation | Male | Female |
| Sales & Related | 55 (100.0%) | 0 (0.0%) |
| Office & Administration | 0 (0.0%) | 0 (0.0%) |
| Total (Category) | 55 (100.0%) | 0 (0.0%) |
| Total (Overall) | 290 (42.1%) | 399 (57.9%) |
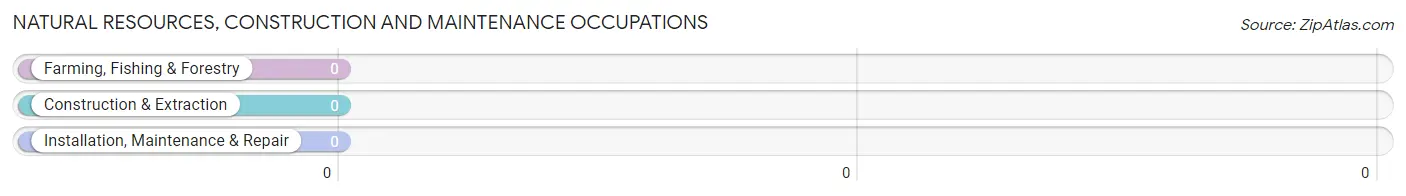
Natural Resources, Construction and Maintenance Occupations
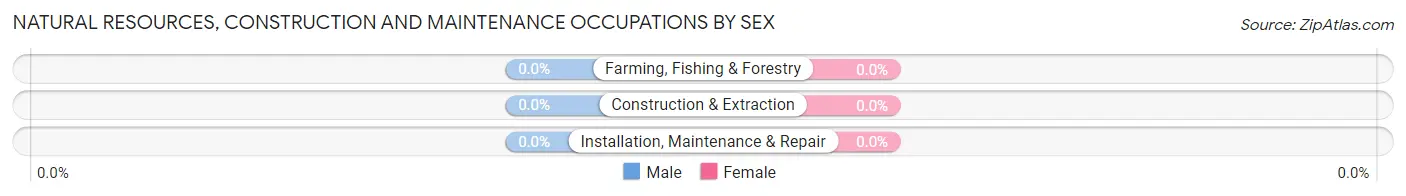
Natural Resources, Construction and Maintenance Occupations by Sex
| Occupation | Male | Female |
| Farming, Fishing & Forestry | 0 (0.0%) | 0 (0.0%) |
| Construction & Extraction | 0 (0.0%) | 0 (0.0%) |
| Installation, Maintenance & Repair | 0 (0.0%) | 0 (0.0%) |
| Total (Category) | 0 (0.0%) | 0 (0.0%) |
| Total (Overall) | 290 (42.1%) | 399 (57.9%) |
Production, Transportation and Moving Occupations
The most common Production, Transportation and Moving occupations in Lenox are , and Transportation (16 | 2.3%).
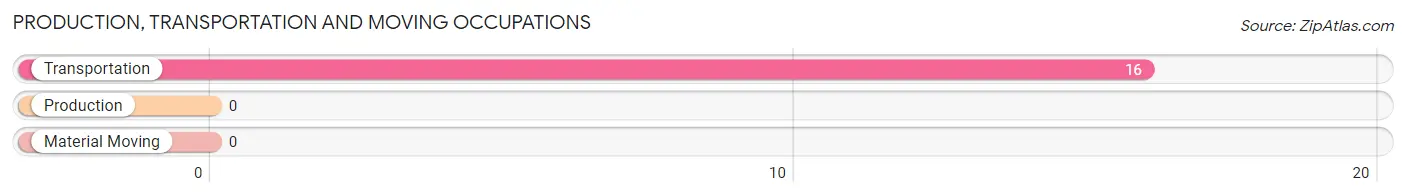
Production, Transportation and Moving Occupations by Sex
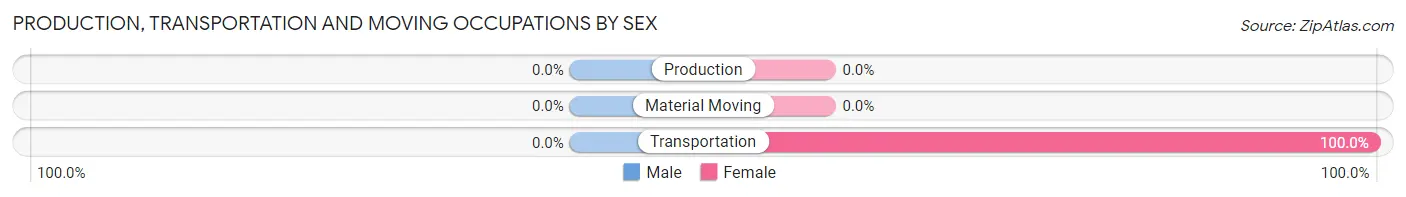
| Occupation | Male | Female |
| Production | 0 (0.0%) | 0 (0.0%) |
| Transportation | 0 (0.0%) | 16 (100.0%) |
| Material Moving | 0 (0.0%) | 0 (0.0%) |
| Total (Category) | 0 (0.0%) | 16 (100.0%) |
| Total (Overall) | 290 (42.1%) | 399 (57.9%) |
Employment Industries by Sex in Lenox
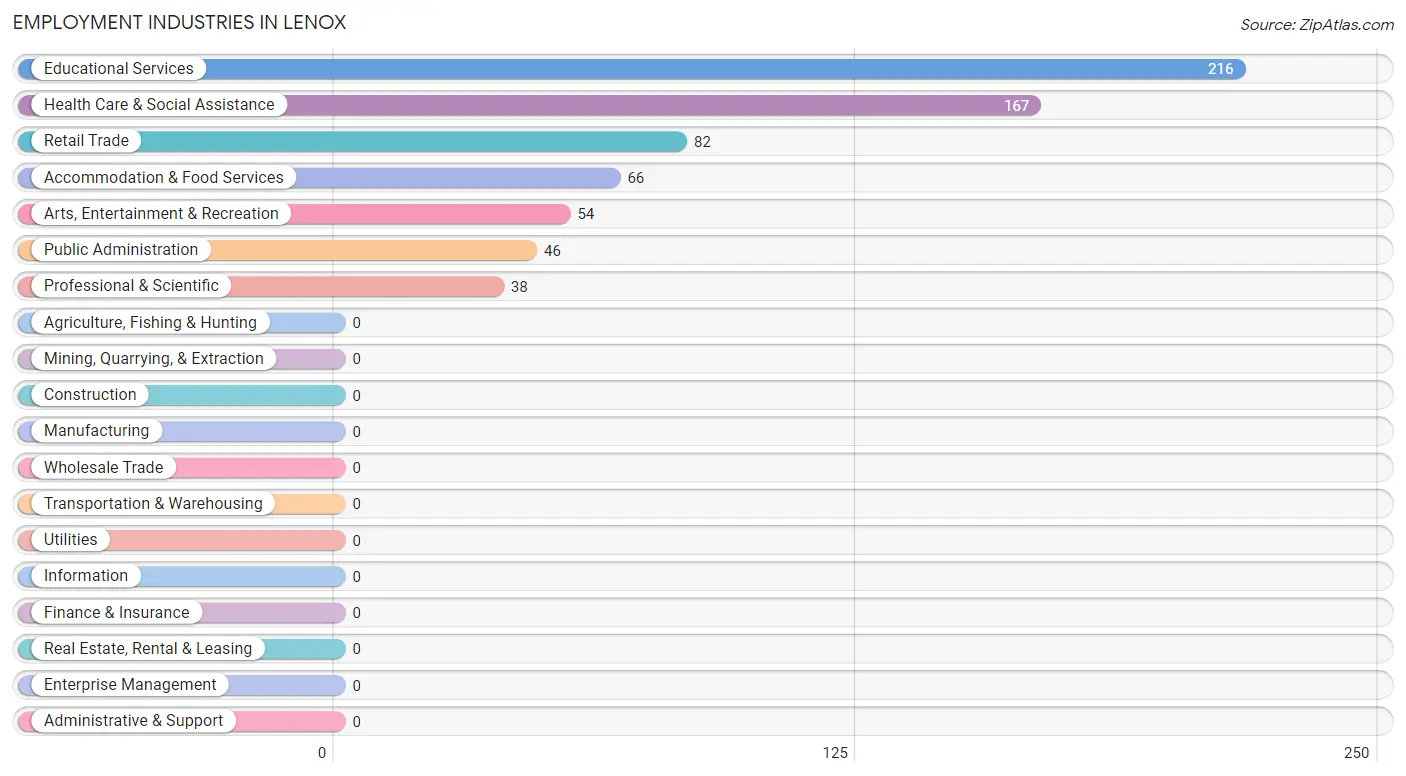
Employment Industries in Lenox
The major employment industries in Lenox include Educational Services (216 | 31.4%), Health Care & Social Assistance (167 | 24.2%), Retail Trade (82 | 11.9%), Accommodation & Food Services (66 | 9.6%), and Arts, Entertainment & Recreation (54 | 7.8%).
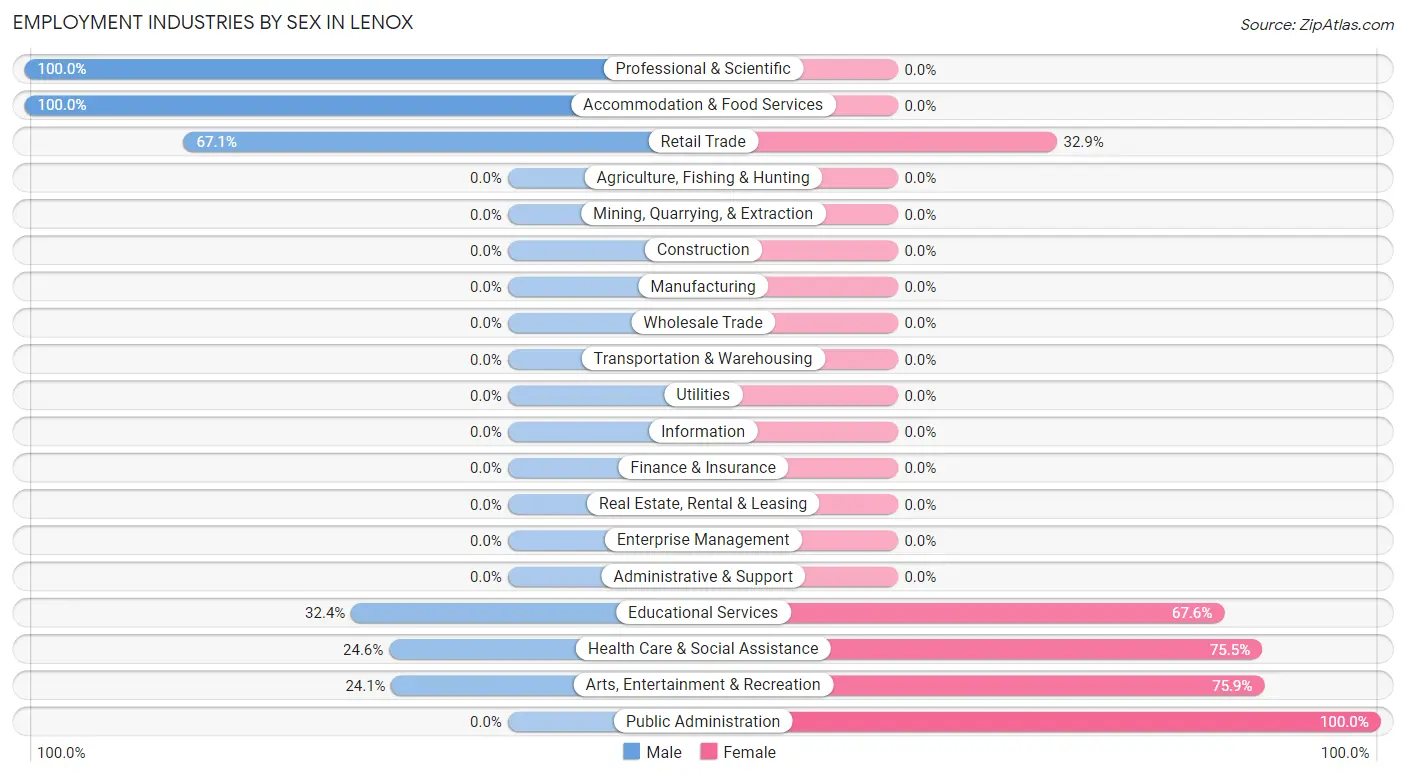
Employment Industries by Sex in Lenox
The Lenox industries that see more men than women are Professional & Scientific (100.0%), Accommodation & Food Services (100.0%), and Retail Trade (67.1%), whereas the industries that tend to have a higher number of women are Public Administration (100.0%), Arts, Entertainment & Recreation (75.9%), and Health Care & Social Assistance (75.4%).
| Industry | Male | Female |
| Agriculture, Fishing & Hunting | 0 (0.0%) | 0 (0.0%) |
| Mining, Quarrying, & Extraction | 0 (0.0%) | 0 (0.0%) |
| Construction | 0 (0.0%) | 0 (0.0%) |
| Manufacturing | 0 (0.0%) | 0 (0.0%) |
| Wholesale Trade | 0 (0.0%) | 0 (0.0%) |
| Retail Trade | 55 (67.1%) | 27 (32.9%) |
| Transportation & Warehousing | 0 (0.0%) | 0 (0.0%) |
| Utilities | 0 (0.0%) | 0 (0.0%) |
| Information | 0 (0.0%) | 0 (0.0%) |
| Finance & Insurance | 0 (0.0%) | 0 (0.0%) |
| Real Estate, Rental & Leasing | 0 (0.0%) | 0 (0.0%) |
| Professional & Scientific | 38 (100.0%) | 0 (0.0%) |
| Enterprise Management | 0 (0.0%) | 0 (0.0%) |
| Administrative & Support | 0 (0.0%) | 0 (0.0%) |
| Educational Services | 70 (32.4%) | 146 (67.6%) |
| Health Care & Social Assistance | 41 (24.5%) | 126 (75.4%) |
| Arts, Entertainment & Recreation | 13 (24.1%) | 41 (75.9%) |
| Accommodation & Food Services | 66 (100.0%) | 0 (0.0%) |
| Public Administration | 0 (0.0%) | 46 (100.0%) |
| Total | 290 (42.1%) | 399 (57.9%) |
Education in Lenox
School Enrollment in Lenox
The most common levels of schooling among the 372 students in Lenox are college / undergraduate (171 | 46.0%), elementary school (83 | 22.3%), and high school (77 | 20.7%).
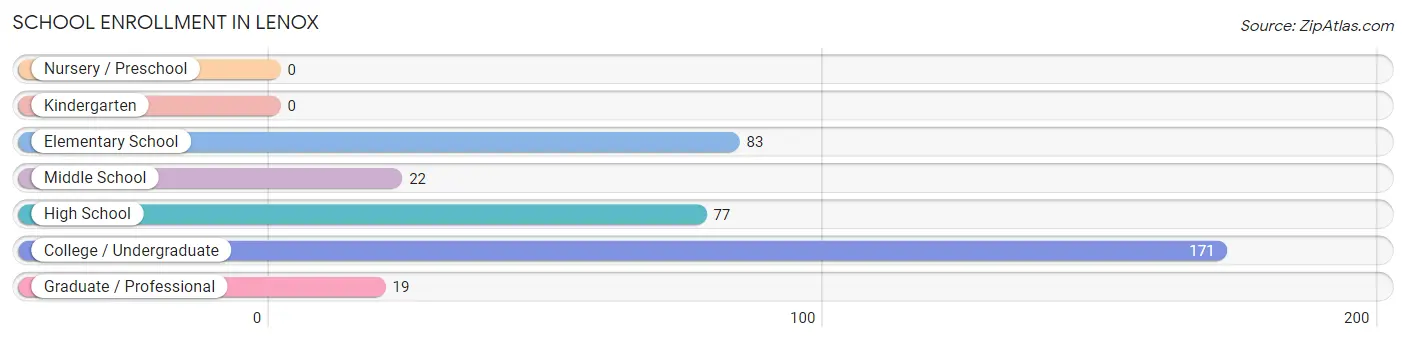
| School Level | # Students | % Students |
| Nursery / Preschool | 0 | 0.0% |
| Kindergarten | 0 | 0.0% |
| Elementary School | 83 | 22.3% |
| Middle School | 22 | 5.9% |
| High School | 77 | 20.7% |
| College / Undergraduate | 171 | 46.0% |
| Graduate / Professional | 19 | 5.1% |
| Total | 372 | 100.0% |
School Enrollment by Age by Funding Source in Lenox
Out of a total of 372 students who are enrolled in schools in Lenox, 124 (33.3%) attend a private institution, while the remaining 248 (66.7%) are enrolled in public schools. The age group of 20 to 24 year olds has the highest likelihood of being enrolled in private schools, with 56 (100.0% in the age bracket) enrolled. Conversely, the age group of 10 to 14 year olds has the lowest likelihood of being enrolled in a private school, with 22 (100.0% in the age bracket) attending a public institution.
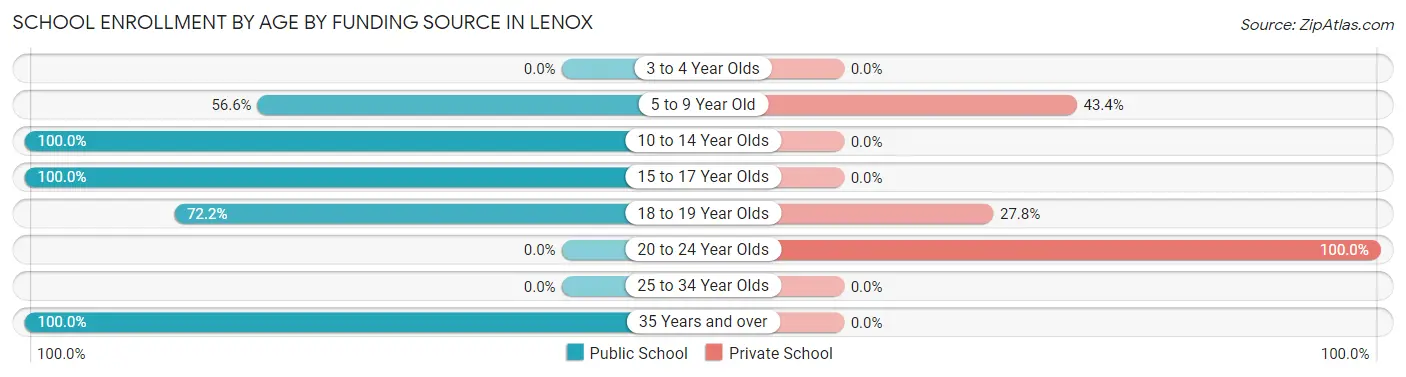
| Age Bracket | Public School | Private School |
| 3 to 4 Year Olds | 0 (0.0%) | 0 (0.0%) |
| 5 to 9 Year Old | 47 (56.6%) | 36 (43.4%) |
| 10 to 14 Year Olds | 22 (100.0%) | 0 (0.0%) |
| 15 to 17 Year Olds | 77 (100.0%) | 0 (0.0%) |
| 18 to 19 Year Olds | 83 (72.2%) | 32 (27.8%) |
| 20 to 24 Year Olds | 0 (0.0%) | 56 (100.0%) |
| 25 to 34 Year Olds | 0 (0.0%) | 0 (0.0%) |
| 35 Years and over | 19 (100.0%) | 0 (0.0%) |
| Total | 248 (66.7%) | 124 (33.3%) |
Educational Attainment by Field of Study in Lenox
Visual & performing arts (160 | 17.5%), psychology (147 | 16.1%), social sciences (122 | 13.4%), science & technology (100 | 11.0%), and engineering (94 | 10.3%) are the most common fields of study among 913 individuals in Lenox who have obtained a bachelor's degree or higher.
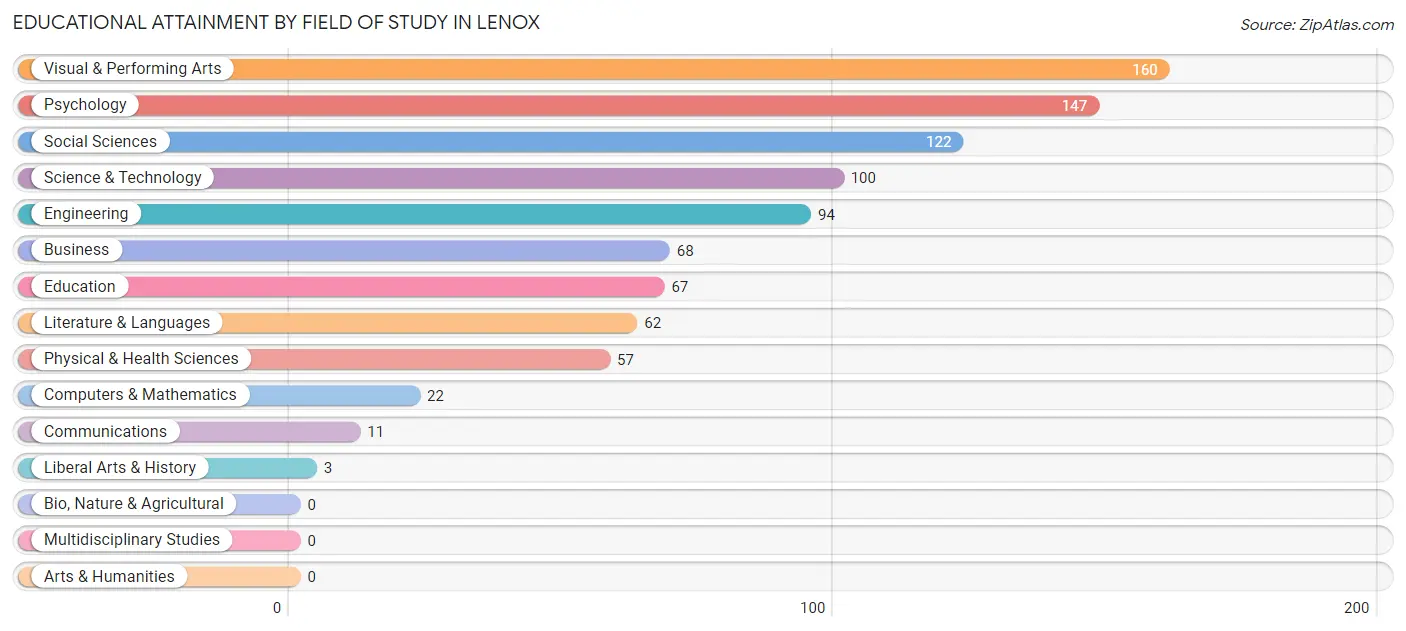
| Field of Study | # Graduates | % Graduates |
| Computers & Mathematics | 22 | 2.4% |
| Bio, Nature & Agricultural | 0 | 0.0% |
| Physical & Health Sciences | 57 | 6.2% |
| Psychology | 147 | 16.1% |
| Social Sciences | 122 | 13.4% |
| Engineering | 94 | 10.3% |
| Multidisciplinary Studies | 0 | 0.0% |
| Science & Technology | 100 | 11.0% |
| Business | 68 | 7.4% |
| Education | 67 | 7.3% |
| Literature & Languages | 62 | 6.8% |
| Liberal Arts & History | 3 | 0.3% |
| Visual & Performing Arts | 160 | 17.5% |
| Communications | 11 | 1.2% |
| Arts & Humanities | 0 | 0.0% |
| Total | 913 | 100.0% |
Transportation & Commute in Lenox
Vehicle Availability by Sex in Lenox
The most prevalent vehicle ownership categories in Lenox are males with 1 vehicle (86, accounting for 31.5%) and females with 1 vehicle (139, making up 21.6%).
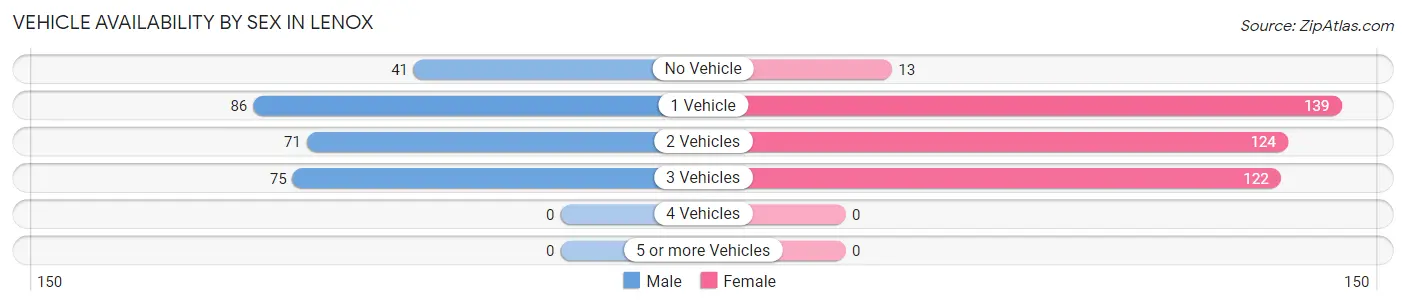
| Vehicles Available | Male | Female |
| No Vehicle | 41 (15.0%) | 13 (3.3%) |
| 1 Vehicle | 86 (31.5%) | 139 (34.9%) |
| 2 Vehicles | 71 (26.0%) | 124 (31.2%) |
| 3 Vehicles | 75 (27.5%) | 122 (30.6%) |
| 4 Vehicles | 0 (0.0%) | 0 (0.0%) |
| 5 or more Vehicles | 0 (0.0%) | 0 (0.0%) |
| Total | 273 (100.0%) | 398 (100.0%) |
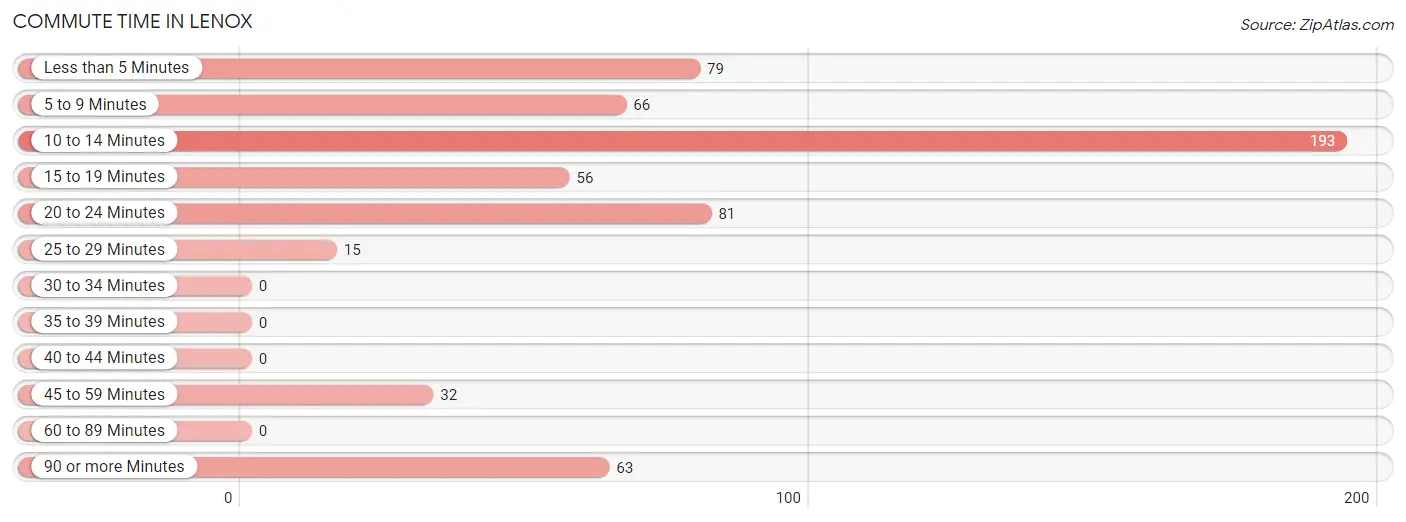
Commute Time in Lenox
The most frequently occuring commute durations in Lenox are 10 to 14 minutes (193 commuters, 33.0%), 20 to 24 minutes (81 commuters, 13.9%), and less than 5 minutes (79 commuters, 13.5%).
| Commute Time | # Commuters | % Commuters |
| Less than 5 Minutes | 79 | 13.5% |
| 5 to 9 Minutes | 66 | 11.3% |
| 10 to 14 Minutes | 193 | 33.0% |
| 15 to 19 Minutes | 56 | 9.6% |
| 20 to 24 Minutes | 81 | 13.9% |
| 25 to 29 Minutes | 15 | 2.6% |
| 30 to 34 Minutes | 0 | 0.0% |
| 35 to 39 Minutes | 0 | 0.0% |
| 40 to 44 Minutes | 0 | 0.0% |
| 45 to 59 Minutes | 32 | 5.5% |
| 60 to 89 Minutes | 0 | 0.0% |
| 90 or more Minutes | 63 | 10.8% |
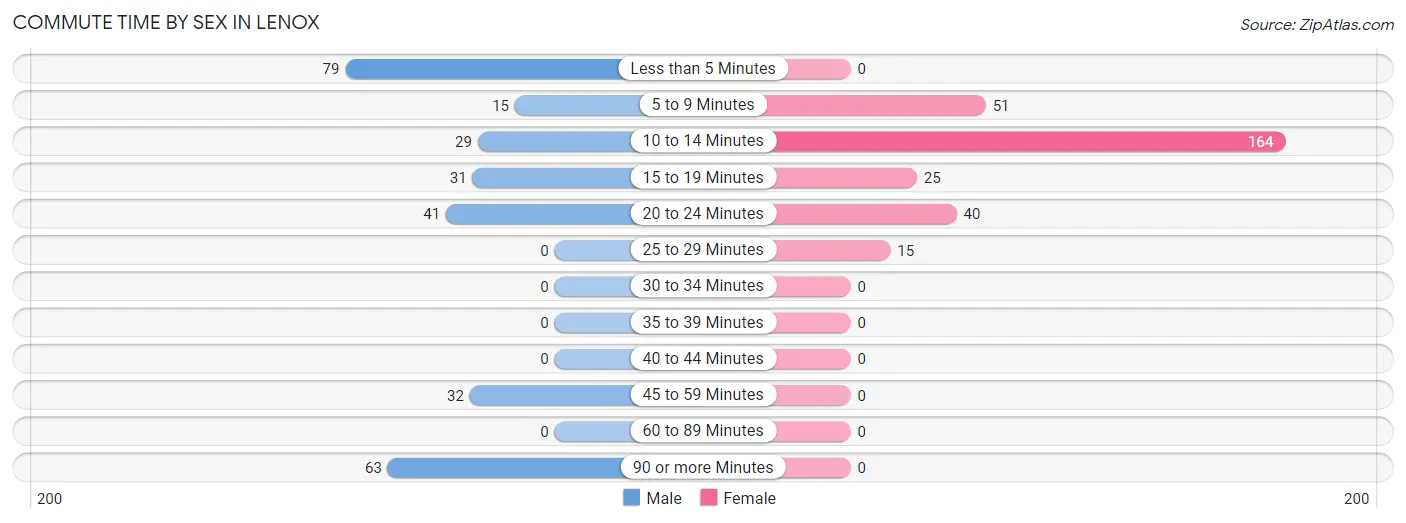
Commute Time by Sex in Lenox
The most common commute times in Lenox are less than 5 minutes (79 commuters, 27.2%) for males and 10 to 14 minutes (164 commuters, 55.6%) for females.
| Commute Time | Male | Female |
| Less than 5 Minutes | 79 (27.2%) | 0 (0.0%) |
| 5 to 9 Minutes | 15 (5.2%) | 51 (17.3%) |
| 10 to 14 Minutes | 29 (10.0%) | 164 (55.6%) |
| 15 to 19 Minutes | 31 (10.7%) | 25 (8.5%) |
| 20 to 24 Minutes | 41 (14.1%) | 40 (13.6%) |
| 25 to 29 Minutes | 0 (0.0%) | 15 (5.1%) |
| 30 to 34 Minutes | 0 (0.0%) | 0 (0.0%) |
| 35 to 39 Minutes | 0 (0.0%) | 0 (0.0%) |
| 40 to 44 Minutes | 0 (0.0%) | 0 (0.0%) |
| 45 to 59 Minutes | 32 (11.0%) | 0 (0.0%) |
| 60 to 89 Minutes | 0 (0.0%) | 0 (0.0%) |
| 90 or more Minutes | 63 (21.7%) | 0 (0.0%) |
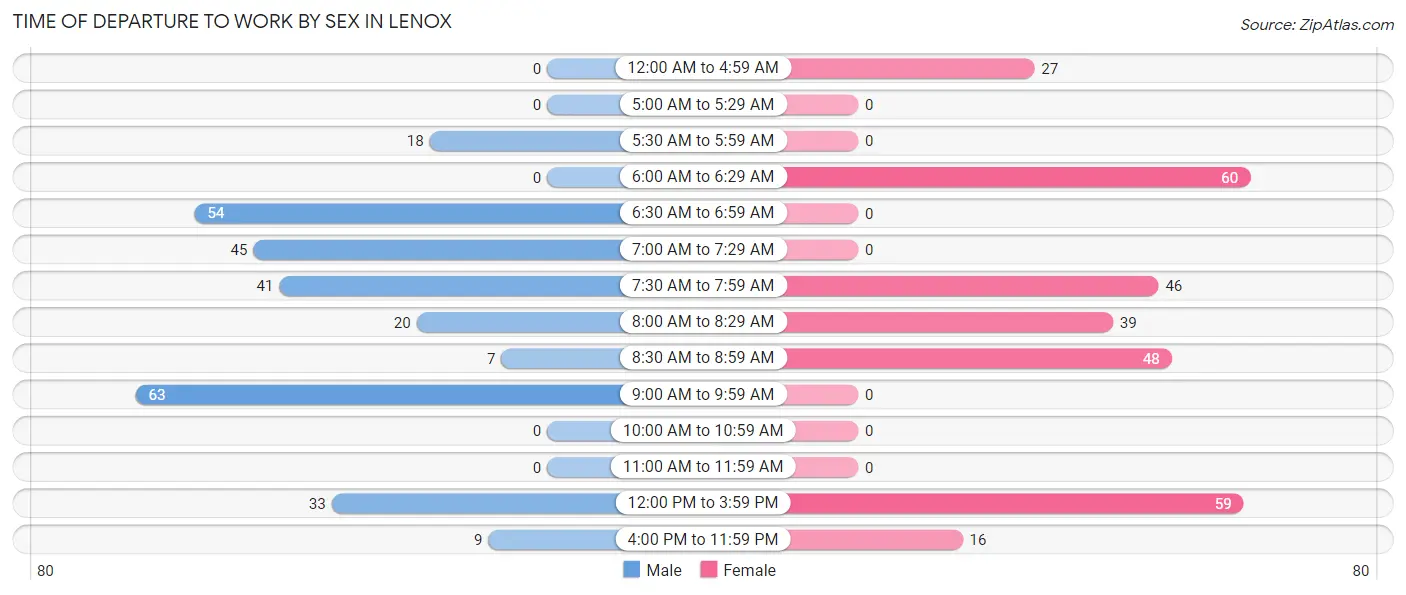
Time of Departure to Work by Sex in Lenox
The most frequent times of departure to work in Lenox are 9:00 AM to 9:59 AM (63, 21.7%) for males and 6:00 AM to 6:29 AM (60, 20.3%) for females.
| Time of Departure | Male | Female |
| 12:00 AM to 4:59 AM | 0 (0.0%) | 27 (9.1%) |
| 5:00 AM to 5:29 AM | 0 (0.0%) | 0 (0.0%) |
| 5:30 AM to 5:59 AM | 18 (6.2%) | 0 (0.0%) |
| 6:00 AM to 6:29 AM | 0 (0.0%) | 60 (20.3%) |
| 6:30 AM to 6:59 AM | 54 (18.6%) | 0 (0.0%) |
| 7:00 AM to 7:29 AM | 45 (15.5%) | 0 (0.0%) |
| 7:30 AM to 7:59 AM | 41 (14.1%) | 46 (15.6%) |
| 8:00 AM to 8:29 AM | 20 (6.9%) | 39 (13.2%) |
| 8:30 AM to 8:59 AM | 7 (2.4%) | 48 (16.3%) |
| 9:00 AM to 9:59 AM | 63 (21.7%) | 0 (0.0%) |
| 10:00 AM to 10:59 AM | 0 (0.0%) | 0 (0.0%) |
| 11:00 AM to 11:59 AM | 0 (0.0%) | 0 (0.0%) |
| 12:00 PM to 3:59 PM | 33 (11.4%) | 59 (20.0%) |
| 4:00 PM to 11:59 PM | 9 (3.1%) | 16 (5.4%) |
| Total | 290 (100.0%) | 295 (100.0%) |
Housing Occupancy in Lenox
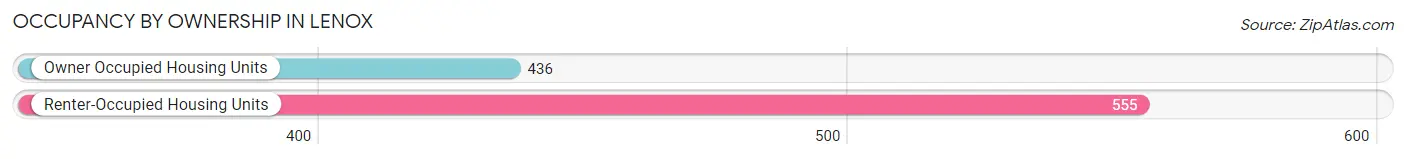
Occupancy by Ownership in Lenox
Of the total 991 dwellings in Lenox, owner-occupied units account for 436 (44.0%), while renter-occupied units make up 555 (56.0%).
| Occupancy | # Housing Units | % Housing Units |
| Owner Occupied Housing Units | 436 | 44.0% |
| Renter-Occupied Housing Units | 555 | 56.0% |
| Total Occupied Housing Units | 991 | 100.0% |
Occupancy by Household Size in Lenox
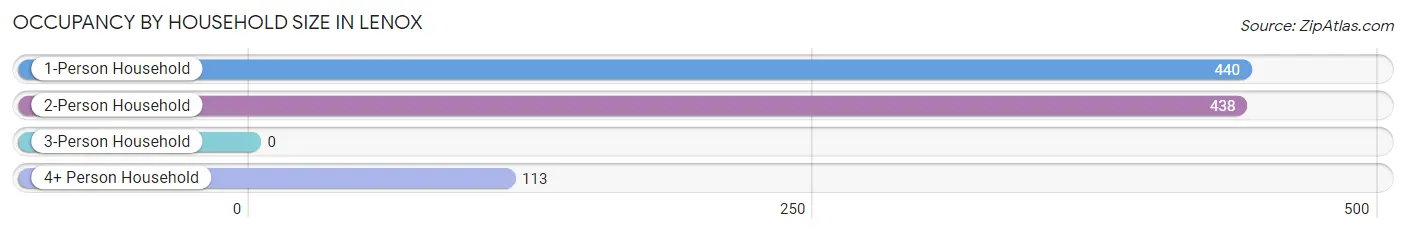
| Household Size | # Housing Units | % Housing Units |
| 1-Person Household | 440 | 44.4% |
| 2-Person Household | 438 | 44.2% |
| 3-Person Household | 0 | 0.0% |
| 4+ Person Household | 113 | 11.4% |
| Total Housing Units | 991 | 100.0% |
Occupancy by Ownership by Household Size in Lenox
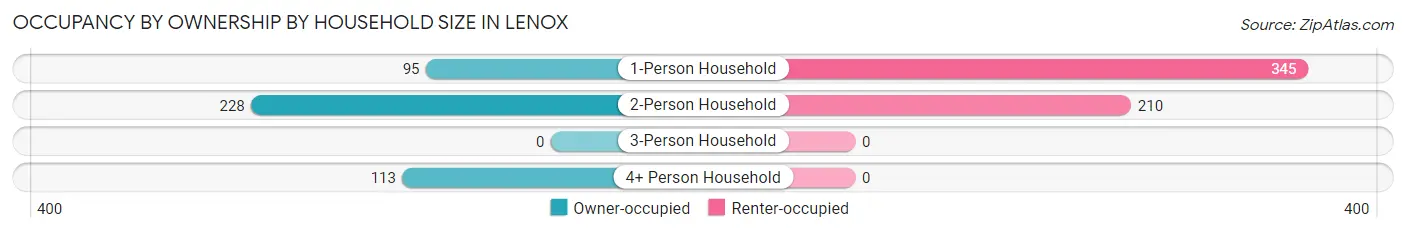
| Household Size | Owner-occupied | Renter-occupied |
| 1-Person Household | 95 (21.6%) | 345 (78.4%) |
| 2-Person Household | 228 (52.0%) | 210 (47.9%) |
| 3-Person Household | 0 (0.0%) | 0 (0.0%) |
| 4+ Person Household | 113 (100.0%) | 0 (0.0%) |
| Total Housing Units | 436 (44.0%) | 555 (56.0%) |
Occupancy by Educational Attainment in Lenox
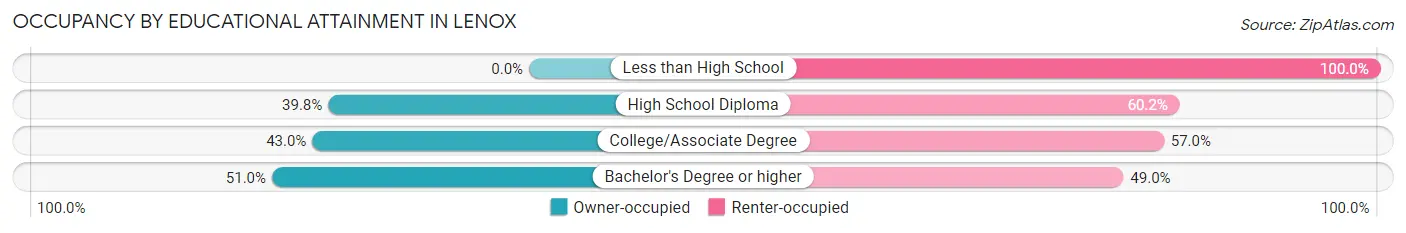
| Household Size | Owner-occupied | Renter-occupied |
| Less than High School | 0 (0.0%) | 72 (100.0%) |
| High School Diploma | 47 (39.8%) | 71 (60.2%) |
| College/Associate Degree | 104 (43.0%) | 138 (57.0%) |
| Bachelor's Degree or higher | 285 (51.0%) | 274 (49.0%) |
Occupancy by Age of Householder in Lenox
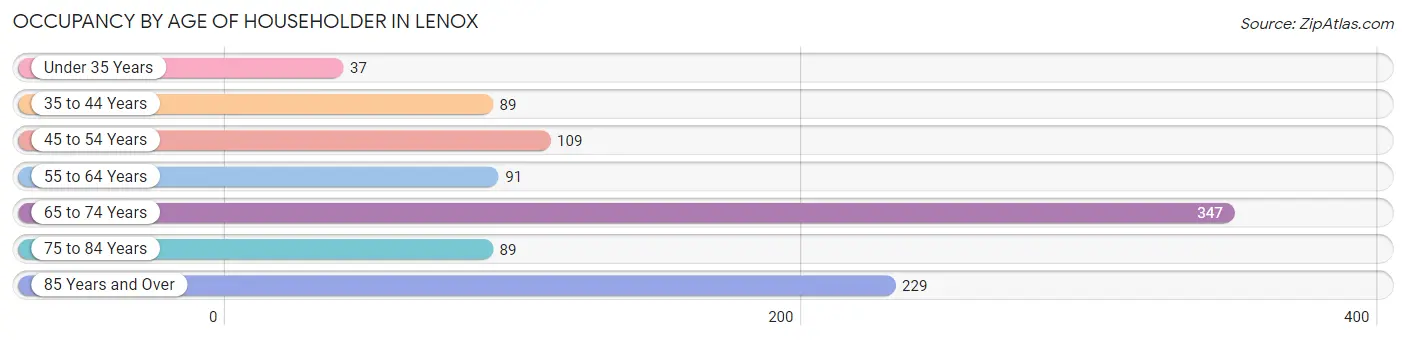
| Age Bracket | # Households | % Households |
| Under 35 Years | 37 | 3.7% |
| 35 to 44 Years | 89 | 9.0% |
| 45 to 54 Years | 109 | 11.0% |
| 55 to 64 Years | 91 | 9.2% |
| 65 to 74 Years | 347 | 35.0% |
| 75 to 84 Years | 89 | 9.0% |
| 85 Years and Over | 229 | 23.1% |
| Total | 991 | 100.0% |
Housing Finances in Lenox
Median Income by Occupancy in Lenox
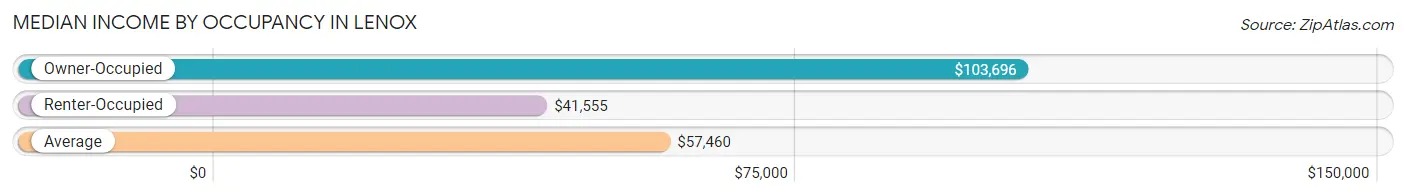
| Occupancy Type | # Households | Median Income |
| Owner-Occupied | 436 (44.0%) | $103,696 |
| Renter-Occupied | 555 (56.0%) | $41,555 |
| Average | 991 (100.0%) | $57,460 |
Occupancy by Householder Income Bracket in Lenox
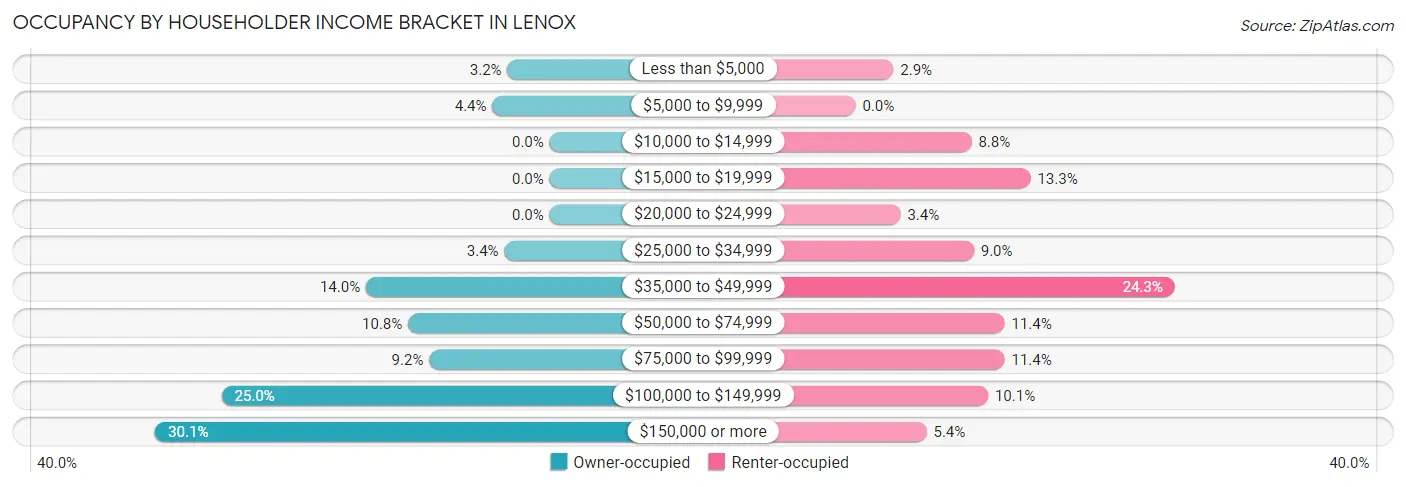
| Income Bracket | Owner-occupied | Renter-occupied |
| Less than $5,000 | 14 (3.2%) | 16 (2.9%) |
| $5,000 to $9,999 | 19 (4.4%) | 0 (0.0%) |
| $10,000 to $14,999 | 0 (0.0%) | 49 (8.8%) |
| $15,000 to $19,999 | 0 (0.0%) | 74 (13.3%) |
| $20,000 to $24,999 | 0 (0.0%) | 19 (3.4%) |
| $25,000 to $34,999 | 15 (3.4%) | 50 (9.0%) |
| $35,000 to $49,999 | 61 (14.0%) | 135 (24.3%) |
| $50,000 to $74,999 | 47 (10.8%) | 63 (11.4%) |
| $75,000 to $99,999 | 40 (9.2%) | 63 (11.4%) |
| $100,000 to $149,999 | 109 (25.0%) | 56 (10.1%) |
| $150,000 or more | 131 (30.0%) | 30 (5.4%) |
| Total | 436 (100.0%) | 555 (100.0%) |
Monthly Housing Cost Tiers in Lenox
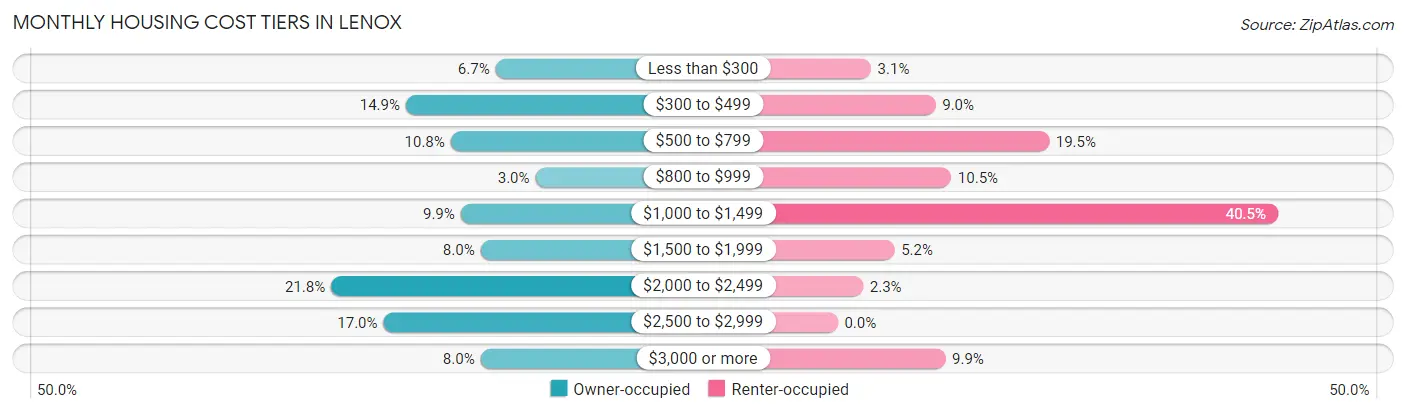
| Monthly Cost | Owner-occupied | Renter-occupied |
| Less than $300 | 29 (6.7%) | 17 (3.1%) |
| $300 to $499 | 65 (14.9%) | 50 (9.0%) |
| $500 to $799 | 47 (10.8%) | 108 (19.5%) |
| $800 to $999 | 13 (3.0%) | 58 (10.4%) |
| $1,000 to $1,499 | 43 (9.9%) | 225 (40.5%) |
| $1,500 to $1,999 | 35 (8.0%) | 29 (5.2%) |
| $2,000 to $2,499 | 95 (21.8%) | 13 (2.3%) |
| $2,500 to $2,999 | 74 (17.0%) | 0 (0.0%) |
| $3,000 or more | 35 (8.0%) | 55 (9.9%) |
| Total | 436 (100.0%) | 555 (100.0%) |
Physical Housing Characteristics in Lenox
Housing Structures in Lenox
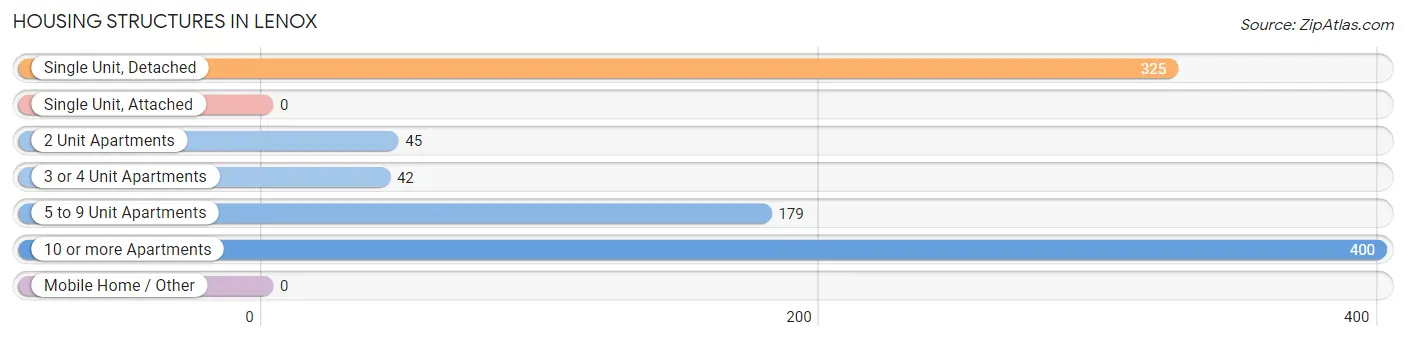
| Structure Type | # Housing Units | % Housing Units |
| Single Unit, Detached | 325 | 32.8% |
| Single Unit, Attached | 0 | 0.0% |
| 2 Unit Apartments | 45 | 4.5% |
| 3 or 4 Unit Apartments | 42 | 4.2% |
| 5 to 9 Unit Apartments | 179 | 18.1% |
| 10 or more Apartments | 400 | 40.4% |
| Mobile Home / Other | 0 | 0.0% |
| Total | 991 | 100.0% |
Housing Structures by Occupancy in Lenox
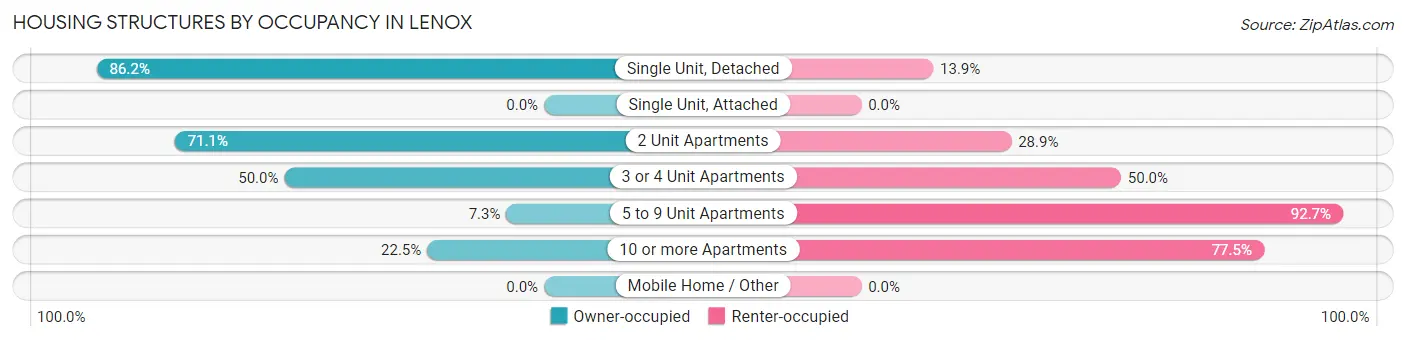
| Structure Type | Owner-occupied | Renter-occupied |
| Single Unit, Detached | 280 (86.2%) | 45 (13.9%) |
| Single Unit, Attached | 0 (0.0%) | 0 (0.0%) |
| 2 Unit Apartments | 32 (71.1%) | 13 (28.9%) |
| 3 or 4 Unit Apartments | 21 (50.0%) | 21 (50.0%) |
| 5 to 9 Unit Apartments | 13 (7.3%) | 166 (92.7%) |
| 10 or more Apartments | 90 (22.5%) | 310 (77.5%) |
| Mobile Home / Other | 0 (0.0%) | 0 (0.0%) |
| Total | 436 (44.0%) | 555 (56.0%) |
Housing Structures by Number of Rooms in Lenox
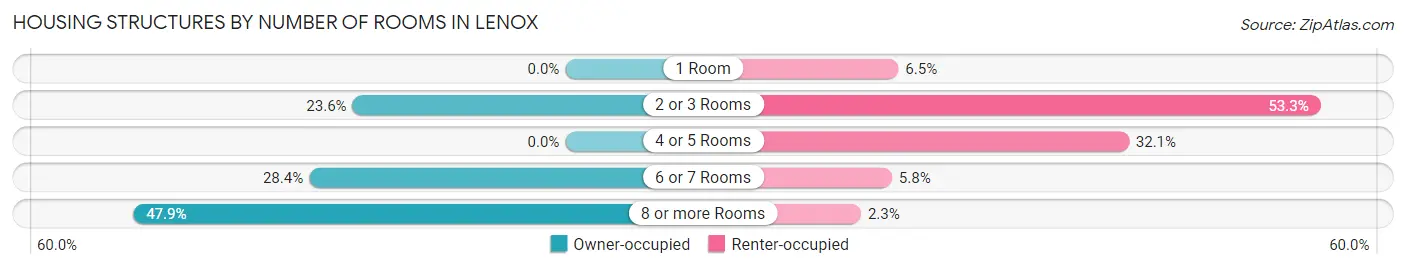
| Number of Rooms | Owner-occupied | Renter-occupied |
| 1 Room | 0 (0.0%) | 36 (6.5%) |
| 2 or 3 Rooms | 103 (23.6%) | 296 (53.3%) |
| 4 or 5 Rooms | 0 (0.0%) | 178 (32.1%) |
| 6 or 7 Rooms | 124 (28.4%) | 32 (5.8%) |
| 8 or more Rooms | 209 (47.9%) | 13 (2.3%) |
| Total | 436 (100.0%) | 555 (100.0%) |
Housing Structure by Heating Type in Lenox
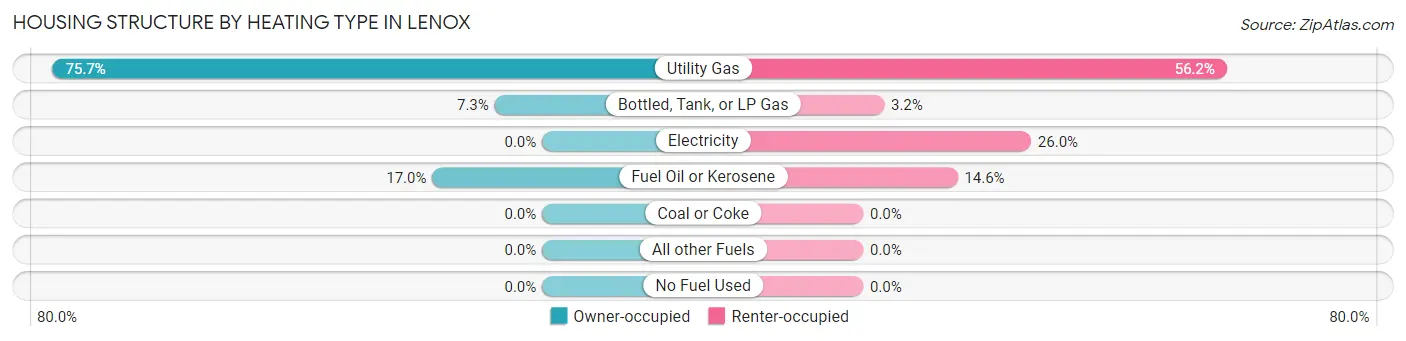
| Heating Type | Owner-occupied | Renter-occupied |
| Utility Gas | 330 (75.7%) | 312 (56.2%) |
| Bottled, Tank, or LP Gas | 32 (7.3%) | 18 (3.2%) |
| Electricity | 0 (0.0%) | 144 (26.0%) |
| Fuel Oil or Kerosene | 74 (17.0%) | 81 (14.6%) |
| Coal or Coke | 0 (0.0%) | 0 (0.0%) |
| All other Fuels | 0 (0.0%) | 0 (0.0%) |
| No Fuel Used | 0 (0.0%) | 0 (0.0%) |
| Total | 436 (100.0%) | 555 (100.0%) |
Household Vehicle Usage in Lenox
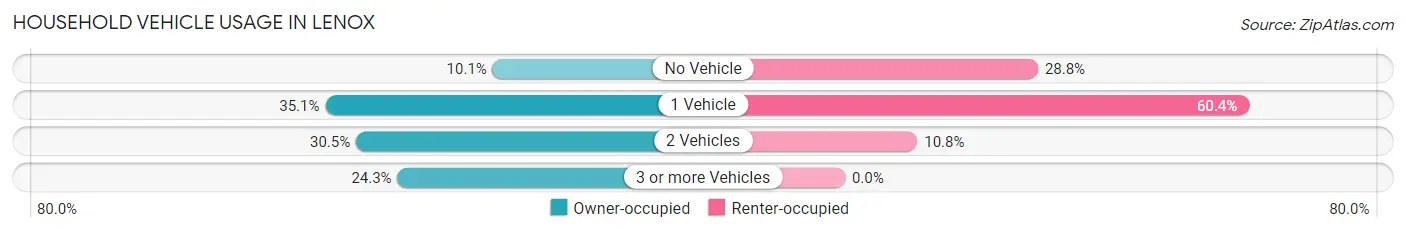
| Vehicles per Household | Owner-occupied | Renter-occupied |
| No Vehicle | 44 (10.1%) | 160 (28.8%) |
| 1 Vehicle | 153 (35.1%) | 335 (60.4%) |
| 2 Vehicles | 133 (30.5%) | 60 (10.8%) |
| 3 or more Vehicles | 106 (24.3%) | 0 (0.0%) |
| Total | 436 (100.0%) | 555 (100.0%) |
Real Estate & Mortgages in Lenox
Real Estate and Mortgage Overview in Lenox
| Characteristic | Without Mortgage | With Mortgage |
| Housing Units | 217 | 219 |
| Median Property Value | $240,100 | $640,200 |
| Median Household Income | - | - |
| Monthly Housing Costs | $591 | $35 |
| Real Estate Taxes | $2,614 | $0 |
Property Value by Mortgage Status in Lenox
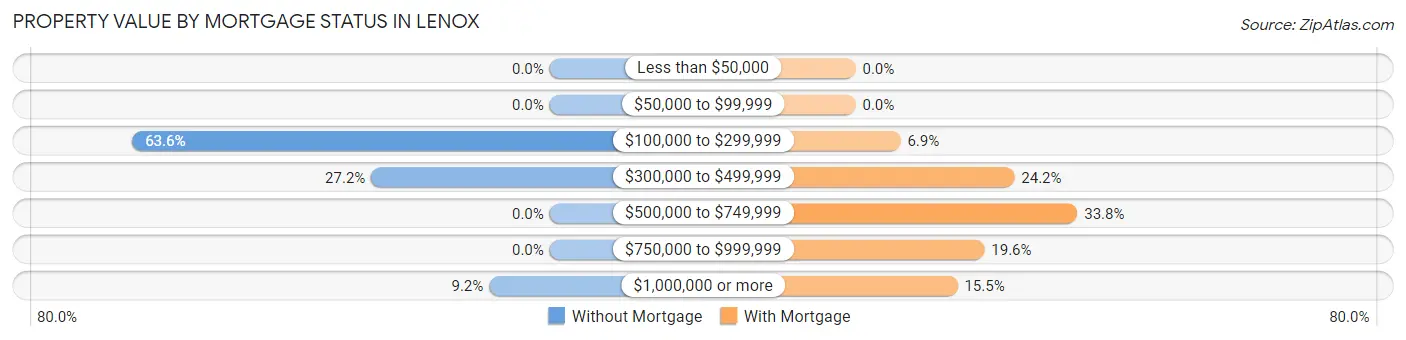
| Property Value | Without Mortgage | With Mortgage |
| Less than $50,000 | 0 (0.0%) | 0 (0.0%) |
| $50,000 to $99,999 | 0 (0.0%) | 0 (0.0%) |
| $100,000 to $299,999 | 138 (63.6%) | 15 (6.9%) |
| $300,000 to $499,999 | 59 (27.2%) | 53 (24.2%) |
| $500,000 to $749,999 | 0 (0.0%) | 74 (33.8%) |
| $750,000 to $999,999 | 0 (0.0%) | 43 (19.6%) |
| $1,000,000 or more | 20 (9.2%) | 34 (15.5%) |
| Total | 217 (100.0%) | 219 (100.0%) |
Household Income by Mortgage Status in Lenox
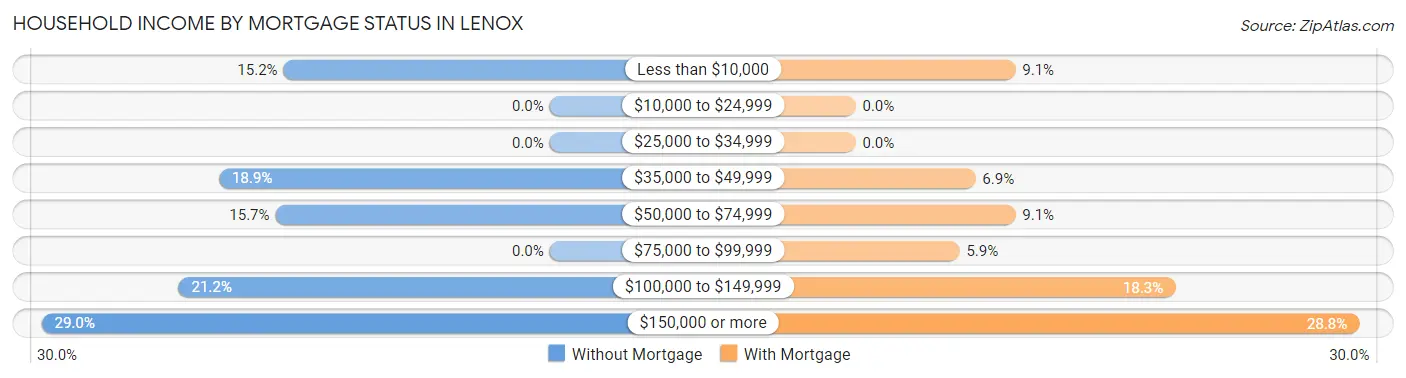
| Household Income | Without Mortgage | With Mortgage |
| Less than $10,000 | 33 (15.2%) | 20 (9.1%) |
| $10,000 to $24,999 | 0 (0.0%) | 0 (0.0%) |
| $25,000 to $34,999 | 0 (0.0%) | 0 (0.0%) |
| $35,000 to $49,999 | 41 (18.9%) | 15 (6.9%) |
| $50,000 to $74,999 | 34 (15.7%) | 20 (9.1%) |
| $75,000 to $99,999 | 0 (0.0%) | 13 (5.9%) |
| $100,000 to $149,999 | 46 (21.2%) | 40 (18.3%) |
| $150,000 or more | 63 (29.0%) | 63 (28.8%) |
| Total | 217 (100.0%) | 219 (100.0%) |
Property Value to Household Income Ratio in Lenox
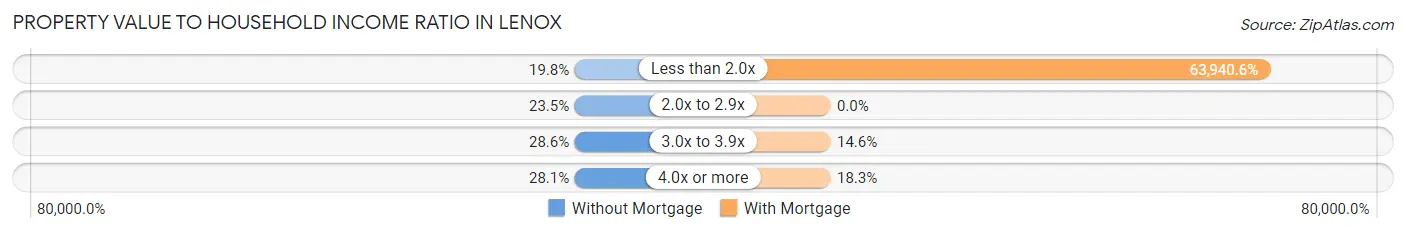
| Value-to-Income Ratio | Without Mortgage | With Mortgage |
| Less than 2.0x | 43 (19.8%) | 140,030 (63,940.6%) |
| 2.0x to 2.9x | 51 (23.5%) | 0 (0.0%) |
| 3.0x to 3.9x | 62 (28.6%) | 32 (14.6%) |
| 4.0x or more | 61 (28.1%) | 40 (18.3%) |
| Total | 217 (100.0%) | 219 (100.0%) |
Real Estate Taxes by Mortgage Status in Lenox
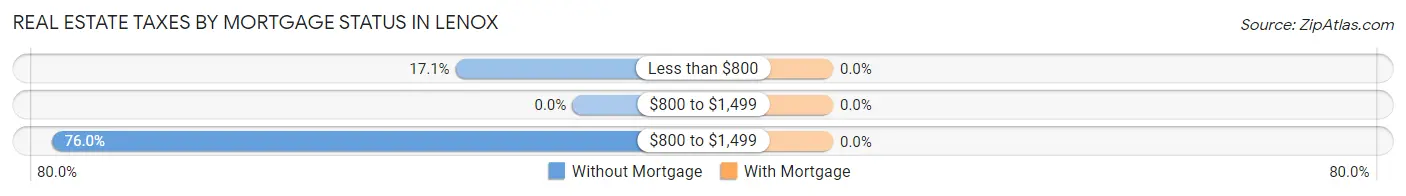
| Property Taxes | Without Mortgage | With Mortgage |
| Less than $800 | 37 (17.1%) | 0 (0.0%) |
| $800 to $1,499 | 0 (0.0%) | 0 (0.0%) |
| $800 to $1,499 | 165 (76.0%) | 0 (0.0%) |
| Total | 217 (100.0%) | 219 (100.0%) |
Health & Disability in Lenox
Health Insurance Coverage by Age in Lenox
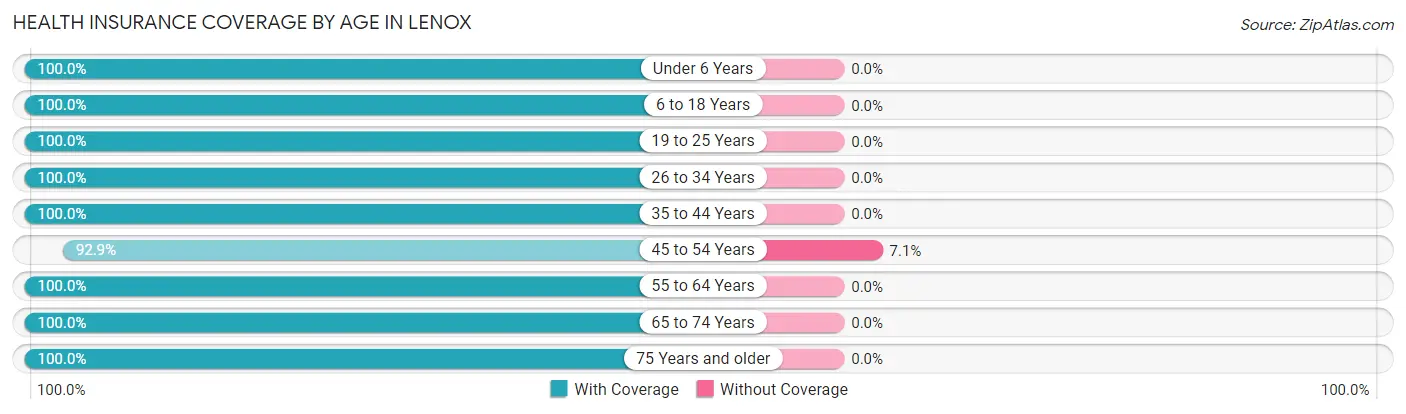
| Age Bracket | With Coverage | Without Coverage |
| Under 6 Years | 24 (100.0%) | 0 (0.0%) |
| 6 to 18 Years | 288 (100.0%) | 0 (0.0%) |
| 19 to 25 Years | 175 (100.0%) | 0 (0.0%) |
| 26 to 34 Years | 19 (100.0%) | 0 (0.0%) |
| 35 to 44 Years | 183 (100.0%) | 0 (0.0%) |
| 45 to 54 Years | 169 (92.9%) | 13 (7.1%) |
| 55 to 64 Years | 158 (100.0%) | 0 (0.0%) |
| 65 to 74 Years | 510 (100.0%) | 0 (0.0%) |
| 75 Years and older | 405 (100.0%) | 0 (0.0%) |
| Total | 1,931 (99.3%) | 13 (0.7%) |
Health Insurance Coverage by Citizenship Status in Lenox
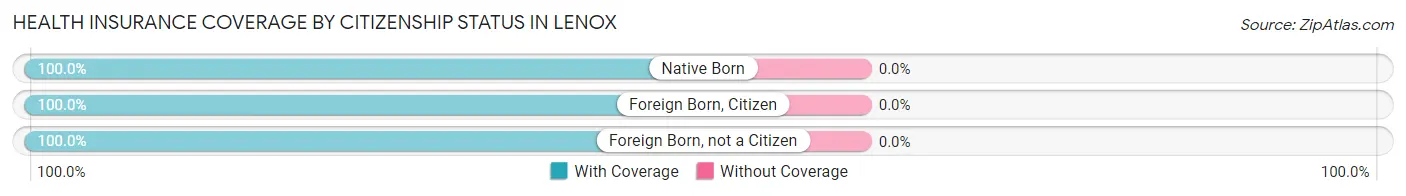
| Citizenship Status | With Coverage | Without Coverage |
| Native Born | 24 (100.0%) | 0 (0.0%) |
| Foreign Born, Citizen | 288 (100.0%) | 0 (0.0%) |
| Foreign Born, not a Citizen | 175 (100.0%) | 0 (0.0%) |
Health Insurance Coverage by Household Income in Lenox
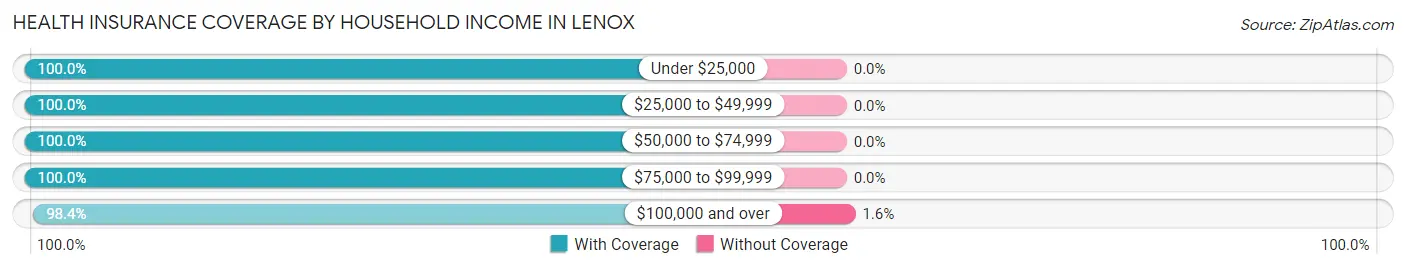
| Household Income | With Coverage | Without Coverage |
| Under $25,000 | 239 (100.0%) | 0 (0.0%) |
| $25,000 to $49,999 | 375 (100.0%) | 0 (0.0%) |
| $50,000 to $74,999 | 150 (100.0%) | 0 (0.0%) |
| $75,000 to $99,999 | 316 (100.0%) | 0 (0.0%) |
| $100,000 and over | 788 (98.4%) | 13 (1.6%) |
Public vs Private Health Insurance Coverage by Age in Lenox
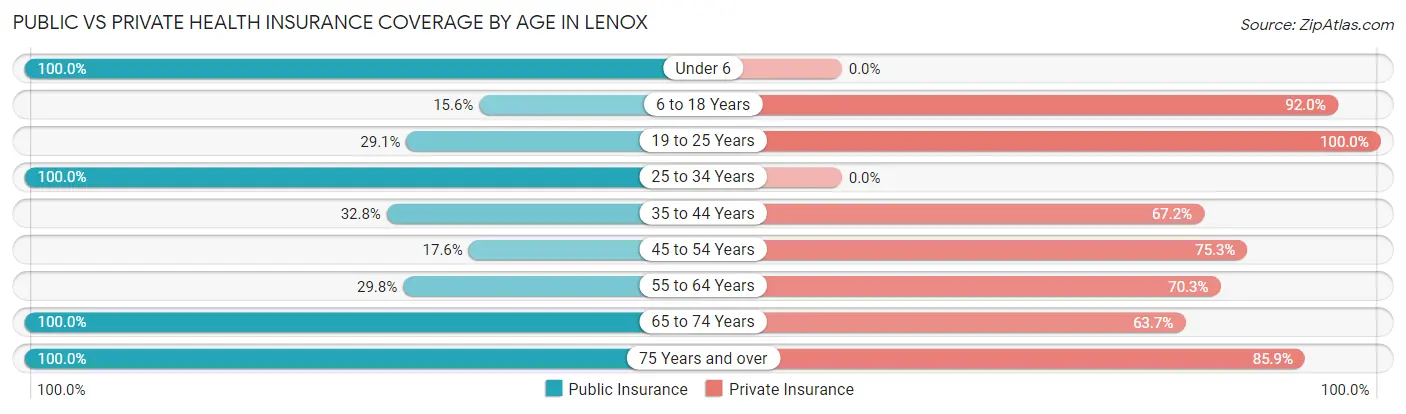
| Age Bracket | Public Insurance | Private Insurance |
| Under 6 | 24 (100.0%) | 0 (0.0%) |
| 6 to 18 Years | 45 (15.6%) | 265 (92.0%) |
| 19 to 25 Years | 51 (29.1%) | 175 (100.0%) |
| 25 to 34 Years | 19 (100.0%) | 0 (0.0%) |
| 35 to 44 Years | 60 (32.8%) | 123 (67.2%) |
| 45 to 54 Years | 32 (17.6%) | 137 (75.3%) |
| 55 to 64 Years | 47 (29.7%) | 111 (70.3%) |
| 65 to 74 Years | 510 (100.0%) | 325 (63.7%) |
| 75 Years and over | 405 (100.0%) | 348 (85.9%) |
| Total | 1,193 (61.4%) | 1,484 (76.3%) |
Disability Status by Sex by Age in Lenox
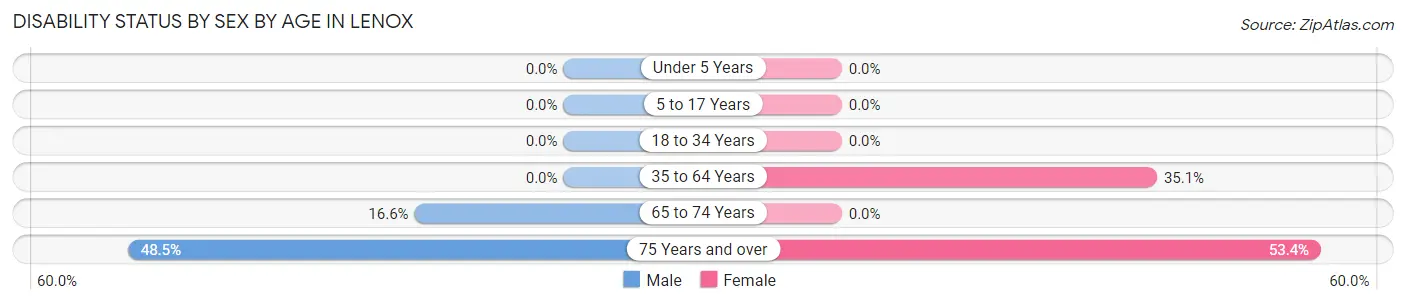
| Age Bracket | Male | Female |
| Under 5 Years | 0 (0.0%) | 0 (0.0%) |
| 5 to 17 Years | 0 (0.0%) | 0 (0.0%) |
| 18 to 34 Years | 0 (0.0%) | 0 (0.0%) |
| 35 to 64 Years | 0 (0.0%) | 119 (35.1%) |
| 65 to 74 Years | 34 (16.6%) | 0 (0.0%) |
| 75 Years and over | 81 (48.5%) | 127 (53.4%) |
Disability Class by Sex by Age in Lenox
Disability Class: Hearing Difficulty
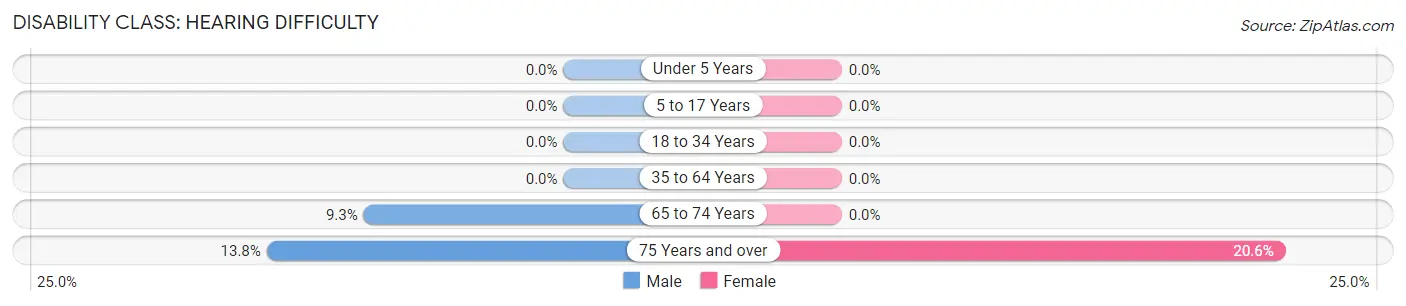
| Age Bracket | Male | Female |
| Under 5 Years | 0 (0.0%) | 0 (0.0%) |
| 5 to 17 Years | 0 (0.0%) | 0 (0.0%) |
| 18 to 34 Years | 0 (0.0%) | 0 (0.0%) |
| 35 to 64 Years | 0 (0.0%) | 0 (0.0%) |
| 65 to 74 Years | 19 (9.3%) | 0 (0.0%) |
| 75 Years and over | 23 (13.8%) | 49 (20.6%) |
Disability Class: Vision Difficulty
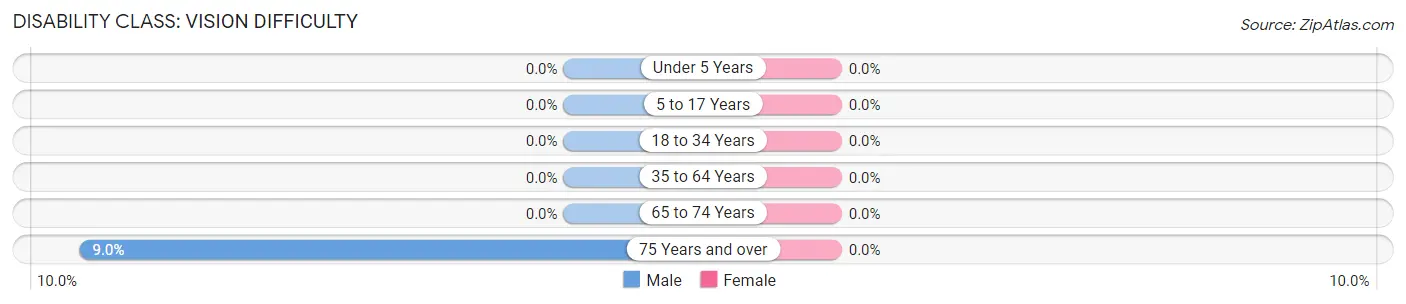
| Age Bracket | Male | Female |
| Under 5 Years | 0 (0.0%) | 0 (0.0%) |
| 5 to 17 Years | 0 (0.0%) | 0 (0.0%) |
| 18 to 34 Years | 0 (0.0%) | 0 (0.0%) |
| 35 to 64 Years | 0 (0.0%) | 0 (0.0%) |
| 65 to 74 Years | 0 (0.0%) | 0 (0.0%) |
| 75 Years and over | 15 (9.0%) | 0 (0.0%) |
Disability Class: Cognitive Difficulty
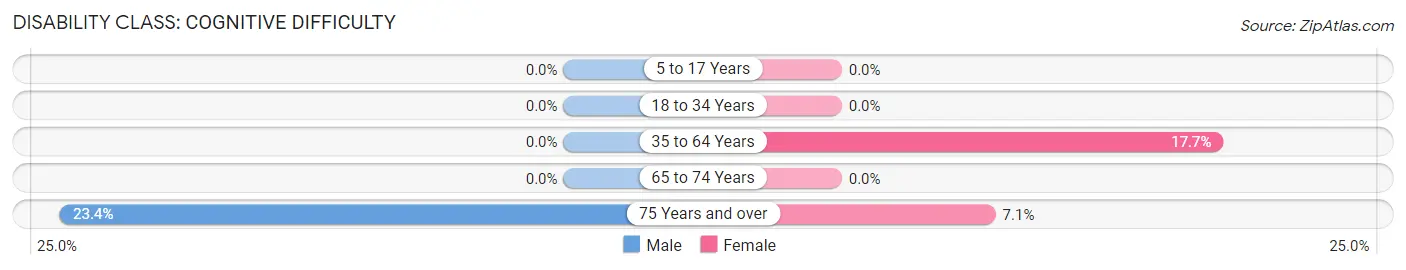
| Age Bracket | Male | Female |
| 5 to 17 Years | 0 (0.0%) | 0 (0.0%) |
| 18 to 34 Years | 0 (0.0%) | 0 (0.0%) |
| 35 to 64 Years | 0 (0.0%) | 60 (17.7%) |
| 65 to 74 Years | 0 (0.0%) | 0 (0.0%) |
| 75 Years and over | 39 (23.4%) | 17 (7.1%) |
Disability Class: Ambulatory Difficulty
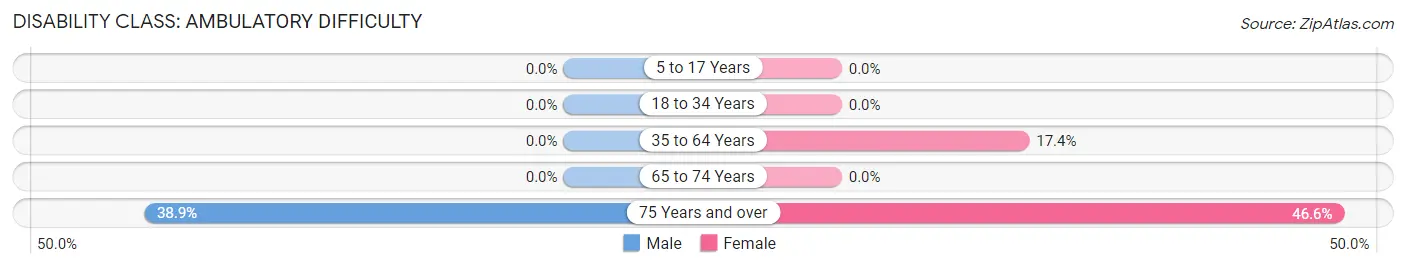
| Age Bracket | Male | Female |
| 5 to 17 Years | 0 (0.0%) | 0 (0.0%) |
| 18 to 34 Years | 0 (0.0%) | 0 (0.0%) |
| 35 to 64 Years | 0 (0.0%) | 59 (17.4%) |
| 65 to 74 Years | 0 (0.0%) | 0 (0.0%) |
| 75 Years and over | 65 (38.9%) | 111 (46.6%) |
Disability Class: Self-Care Difficulty
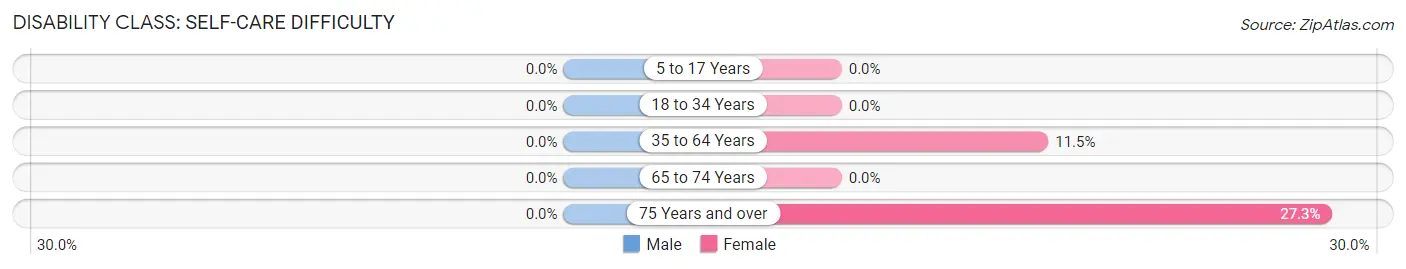
| Age Bracket | Male | Female |
| 5 to 17 Years | 0 (0.0%) | 0 (0.0%) |
| 18 to 34 Years | 0 (0.0%) | 0 (0.0%) |
| 35 to 64 Years | 0 (0.0%) | 39 (11.5%) |
| 65 to 74 Years | 0 (0.0%) | 0 (0.0%) |
| 75 Years and over | 0 (0.0%) | 65 (27.3%) |
Technology Access in Lenox
Computing Device Access in Lenox
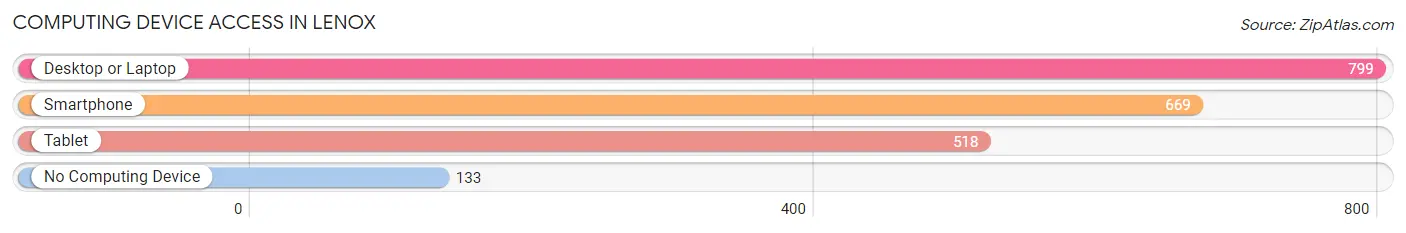
| Device Type | # Households | % Households |
| Desktop or Laptop | 799 | 80.6% |
| Smartphone | 669 | 67.5% |
| Tablet | 518 | 52.3% |
| No Computing Device | 133 | 13.4% |
| Total | 991 | 100.0% |
Internet Access in Lenox
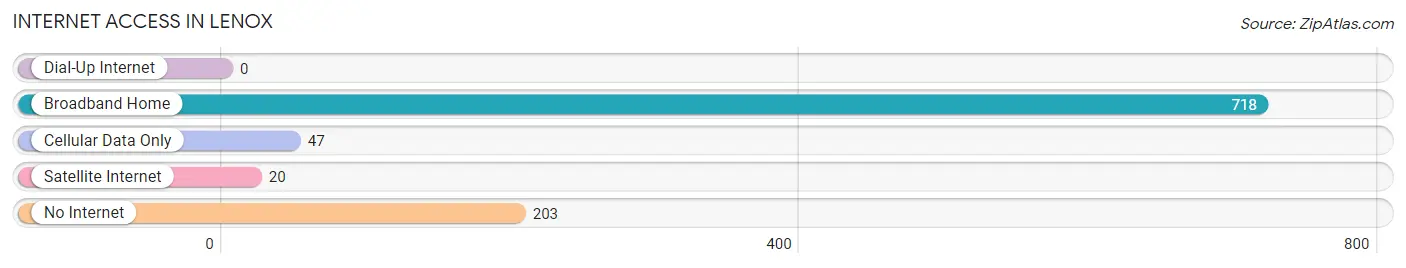
| Internet Type | # Households | % Households |
| Dial-Up Internet | 0 | 0.0% |
| Broadband Home | 718 | 72.5% |
| Cellular Data Only | 47 | 4.7% |
| Satellite Internet | 20 | 2.0% |
| No Internet | 203 | 20.5% |
| Total | 991 | 100.0% |
Lenox Summary
Lenox, Massachusetts is a small town located in the Berkshire Hills of western Massachusetts. It is part of the county of Berkshire and is bordered by the towns of Stockbridge, Lee, Richmond, and Pittsfield. The town has a population of 5,025 as of the 2010 census and is known for its picturesque landscape, historic architecture, and cultural attractions.
History
Lenox was first settled in 1750 by a group of settlers from Connecticut. The town was originally known as Yokuntown, after the local Native American tribe, the Yokun. The town was renamed Lenox in 1767 after the Earl of Lenox, Charles Lennox, who was a friend of the settlers.
Lenox was an agricultural community for much of its early history, with the main crops being wheat, corn, and potatoes. In the late 19th century, Lenox began to attract wealthy visitors from Boston and New York City who were looking for a rural retreat. This influx of wealthy visitors led to the development of several grand hotels and resorts, such as the Hotel Aspinwall and the Hotel Lenox.
Geography
Lenox is located in the Berkshire Hills of western Massachusetts. The town is situated in a valley between two mountain ranges, the Taconic Mountains to the west and the Berkshire Mountains to the east. The town is bordered by the towns of Stockbridge, Lee, Richmond, and Pittsfield.
The town has a total area of 24.2 square miles, of which 24.1 square miles is land and 0.1 square miles is water. The town is drained by the Housatonic River, which flows through the center of town.
Economy
Lenox is a rural community with a strong agricultural and tourism-based economy. The town is home to several farms, including the historic Hancock Shaker Village, which is a living museum of the Shaker lifestyle.
The town is also home to several cultural attractions, such as the Tanglewood Music Center, the Norman Rockwell Museum, and the Berkshire Theatre Festival. These attractions draw thousands of visitors to the town each year, providing a boost to the local economy.
Demographics
As of the 2010 census, Lenox had a population of 5,025. The racial makeup of the town was 94.3% White, 1.7% African American, 0.3% Native American, 1.2% Asian, 0.1% Pacific Islander, 0.7% from other races, and 1.9% from two or more races. Hispanic or Latino of any race were 2.7% of the population.
The median income for a household in the town was $60,938, and the median income for a family was $76,944. The per capita income for the town was $37,945. About 4.3% of families and 6.7% of the population were below the poverty line, including 8.2% of those under age 18 and 4.2% of those age 65 or over.
Common Questions
What is Per Capita Income in Lenox?
Per Capita income in Lenox is $47,546.
What is the Median Family Income in Lenox?
Median Family Income in Lenox is $104,946.
What is the Median Household income in Lenox?
Median Household Income in Lenox is $57,460.
What is Income or Wage Gap in Lenox?
Income or Wage Gap in Lenox is 60.6%.
Women in Lenox earn 39.4 cents for every dollar earned by a man.
What is Inequality or Gini Index in Lenox?
Inequality or Gini Index in Lenox is 0.50.
What is the Total Population of Lenox?
Total Population of Lenox is 1,999.
What is the Total Male Population of Lenox?
Total Male Population of Lenox is 790.
What is the Total Female Population of Lenox?
Total Female Population of Lenox is 1,209.
What is the Ratio of Males per 100 Females in Lenox?
There are 65.34 Males per 100 Females in Lenox.
What is the Ratio of Females per 100 Males in Lenox?
There are 153.04 Females per 100 Males in Lenox.
What is the Median Population Age in Lenox?
Median Population Age in Lenox is 64.2 Years.
What is the Average Family Size in Lenox
Average Family Size in Lenox is 2.8 People.
What is the Average Household Size in Lenox
Average Household Size in Lenox is 1.9 People.
How Large is the Labor Force in Lenox?
There are 688 People in the Labor Forcein in Lenox.
What is the Percentage of People in the Labor Force in Lenox?
37.9% of People are in the Labor Force in Lenox.