Barre, MA Map & Demographics
Barre Map
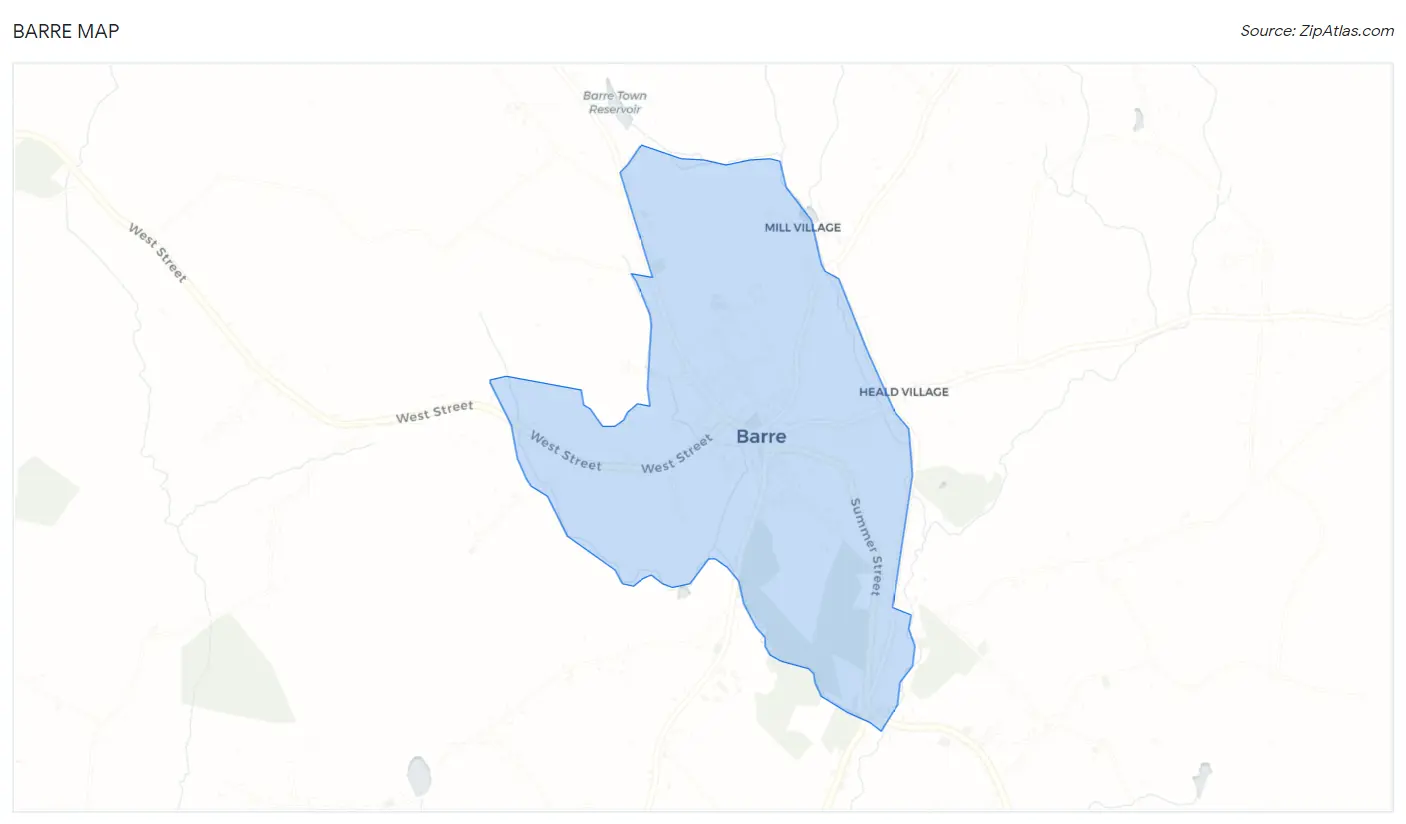
Barre Overview
$48,935
PER CAPITA INCOME
$99,500
AVG FAMILY INCOME
$75,813
AVG HOUSEHOLD INCOME
31.3%
WAGE / INCOME GAP [ % ]
68.7¢/ $1
WAGE / INCOME GAP [ $ ]
0.34
INEQUALITY / GINI INDEX
594
TOTAL POPULATION
277
MALE POPULATION
317
FEMALE POPULATION
87.38
MALES / 100 FEMALES
114.44
FEMALES / 100 MALES
53.1
MEDIAN AGE
2.2
AVG FAMILY SIZE
1.9
AVG HOUSEHOLD SIZE
400
LABOR FORCE [ PEOPLE ]
67.3%
PERCENT IN LABOR FORCE
6.8%
UNEMPLOYMENT RATE
Barre Zip Codes
Barre Area Codes
Income in Barre
Income Overview in Barre
Per Capita Income in Barre is $48,935, while median incomes of families and households are $99,500 and $75,813 respectively.
| Characteristic | Number | Measure |
| Per Capita Income | 594 | $48,935 |
| Median Family Income | 212 | $99,500 |
| Mean Family Income | 212 | $111,300 |
| Median Household Income | 319 | $75,813 |
| Mean Household Income | 319 | $88,851 |
| Income Deficit | 212 | $0 |
| Wage / Income Gap (%) | 594 | 31.35% |
| Wage / Income Gap ($) | 594 | 68.65¢ per $1 |
| Gini / Inequality Index | 594 | 0.34 |
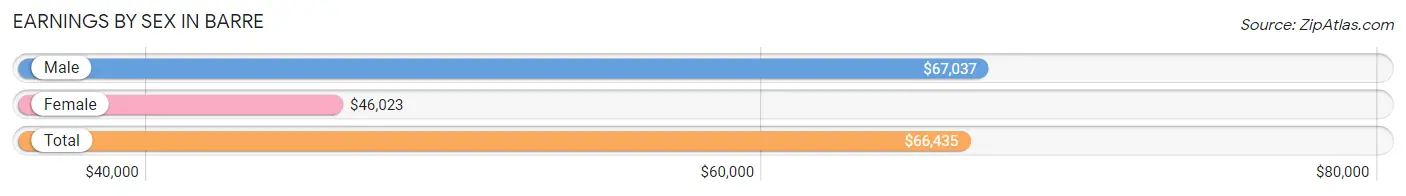
Earnings by Sex in Barre
Average Earnings in Barre are $66,435, $67,037 for men and $46,023 for women, a difference of 31.4%.
| Sex | Number | Average Earnings |
| Male | 214 (53.5%) | $67,037 |
| Female | 186 (46.5%) | $46,023 |
| Total | 400 (100.0%) | $66,435 |
Earnings by Sex by Income Bracket in Barre
The most common earnings brackets in Barre are $75,000 to $99,999 for men (65 | 30.4%) and $65,000 to $74,999 for women (68 | 36.6%).
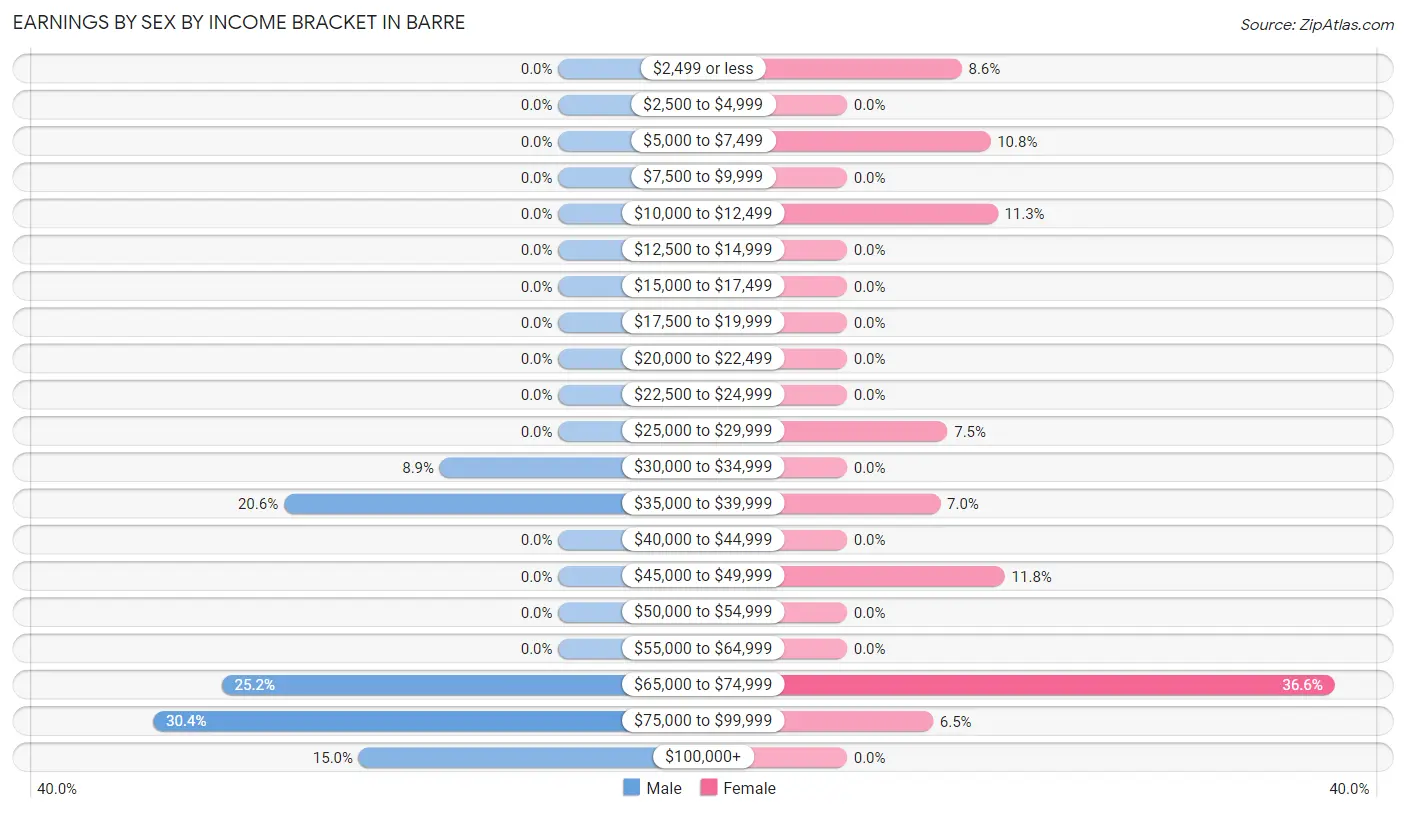
| Income | Male | Female |
| $2,499 or less | 0 (0.0%) | 16 (8.6%) |
| $2,500 to $4,999 | 0 (0.0%) | 0 (0.0%) |
| $5,000 to $7,499 | 0 (0.0%) | 20 (10.7%) |
| $7,500 to $9,999 | 0 (0.0%) | 0 (0.0%) |
| $10,000 to $12,499 | 0 (0.0%) | 21 (11.3%) |
| $12,500 to $14,999 | 0 (0.0%) | 0 (0.0%) |
| $15,000 to $17,499 | 0 (0.0%) | 0 (0.0%) |
| $17,500 to $19,999 | 0 (0.0%) | 0 (0.0%) |
| $20,000 to $22,499 | 0 (0.0%) | 0 (0.0%) |
| $22,500 to $24,999 | 0 (0.0%) | 0 (0.0%) |
| $25,000 to $29,999 | 0 (0.0%) | 14 (7.5%) |
| $30,000 to $34,999 | 19 (8.9%) | 0 (0.0%) |
| $35,000 to $39,999 | 44 (20.6%) | 13 (7.0%) |
| $40,000 to $44,999 | 0 (0.0%) | 0 (0.0%) |
| $45,000 to $49,999 | 0 (0.0%) | 22 (11.8%) |
| $50,000 to $54,999 | 0 (0.0%) | 0 (0.0%) |
| $55,000 to $64,999 | 0 (0.0%) | 0 (0.0%) |
| $65,000 to $74,999 | 54 (25.2%) | 68 (36.6%) |
| $75,000 to $99,999 | 65 (30.4%) | 12 (6.5%) |
| $100,000+ | 32 (14.9%) | 0 (0.0%) |
| Total | 214 (100.0%) | 186 (100.0%) |
Earnings by Sex by Educational Attainment in Barre
Average earnings in Barre are $67,037 for men and $67,702 for women, a difference of 1.0%. Men with an educational attainment of high school diploma enjoy the highest average annual earnings of $98,750, while those with high school diploma education earn the least with $98,750. Women with an educational attainment of bachelor's degree earn the most with the average annual earnings of $68,971, while those with college or associate's degree education have the smallest earnings of $37,019.
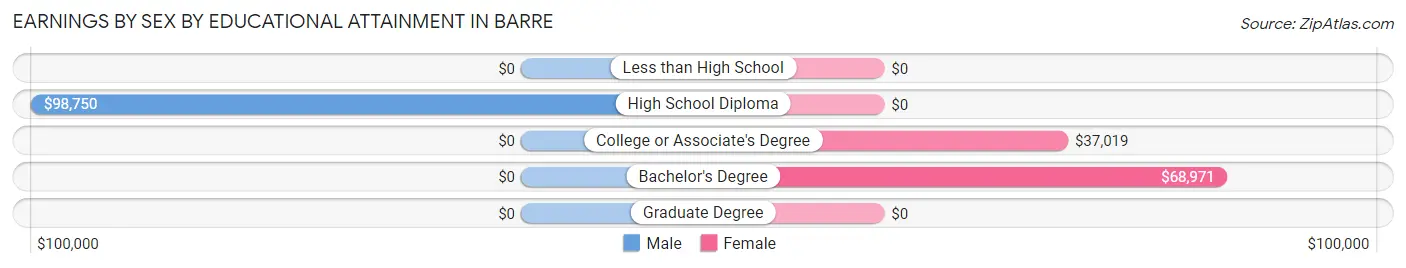
| Educational Attainment | Male Income | Female Income |
| Less than High School | - | - |
| High School Diploma | $98,750 | $0 |
| College or Associate's Degree | - | - |
| Bachelor's Degree | - | - |
| Graduate Degree | - | - |
| Total | $67,037 | $67,702 |
Family Income in Barre
Family Income Brackets in Barre
According to the Barre family income data, there are 55 families falling into the $75,000 to $99,999 income range, which is the most common income bracket and makes up 25.9% of all families.
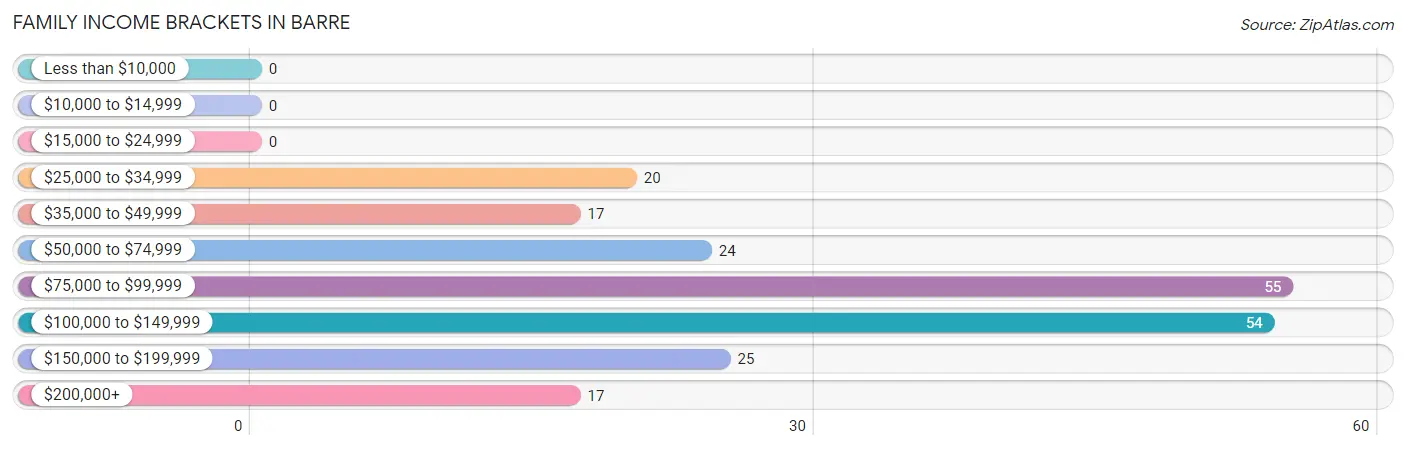
| Income Bracket | # Families | % Families |
| Less than $10,000 | 0 | 0.0% |
| $10,000 to $14,999 | 0 | 0.0% |
| $15,000 to $24,999 | 0 | 0.0% |
| $25,000 to $34,999 | 20 | 9.4% |
| $35,000 to $49,999 | 17 | 8.0% |
| $50,000 to $74,999 | 24 | 11.3% |
| $75,000 to $99,999 | 55 | 25.9% |
| $100,000 to $149,999 | 54 | 25.5% |
| $150,000 to $199,999 | 25 | 11.8% |
| $200,000+ | 17 | 8.0% |
Family Income by Famaliy Size in Barre
2-person families (200 | 94.3%) account for the highest median family income in Barre with $99,200 per family, while 2-person families (200 | 94.3%) have the highest median income of $49,600 per family member.
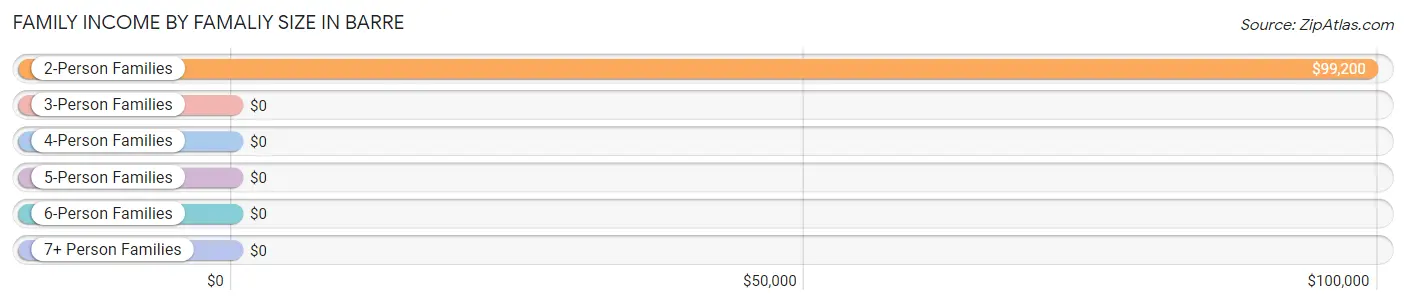
| Income Bracket | # Families | Median Income |
| 2-Person Families | 200 (94.3%) | $99,200 |
| 3-Person Families | 0 (0.0%) | $0 |
| 4-Person Families | 12 (5.7%) | $0 |
| 5-Person Families | 0 (0.0%) | $0 |
| 6-Person Families | 0 (0.0%) | $0 |
| 7+ Person Families | 0 (0.0%) | $0 |
| Total | 212 (100.0%) | $99,500 |
Family Income by Number of Earners in Barre
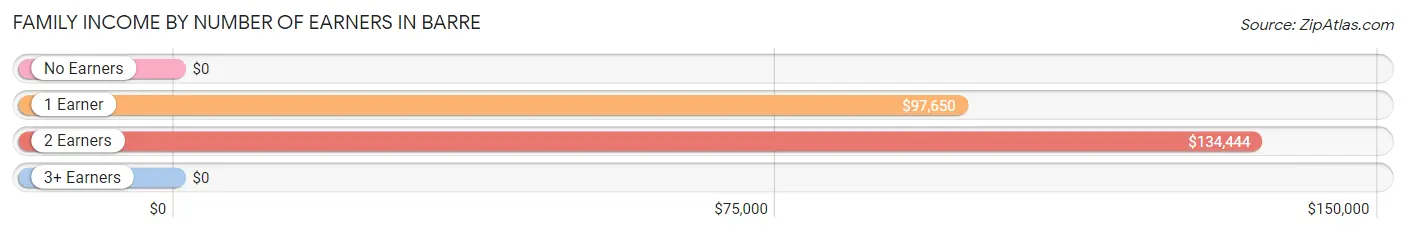
| Number of Earners | # Families | Median Income |
| No Earners | 22 (10.4%) | $0 |
| 1 Earner | 94 (44.3%) | $97,650 |
| 2 Earners | 84 (39.6%) | $134,444 |
| 3+ Earners | 12 (5.7%) | $0 |
| Total | 212 (100.0%) | $99,500 |
Household Income in Barre
Household Income Brackets in Barre
With 70 households falling in the category, the $75,000 to $99,999 income range is the most frequent in Barre, accounting for 21.9% of all households.
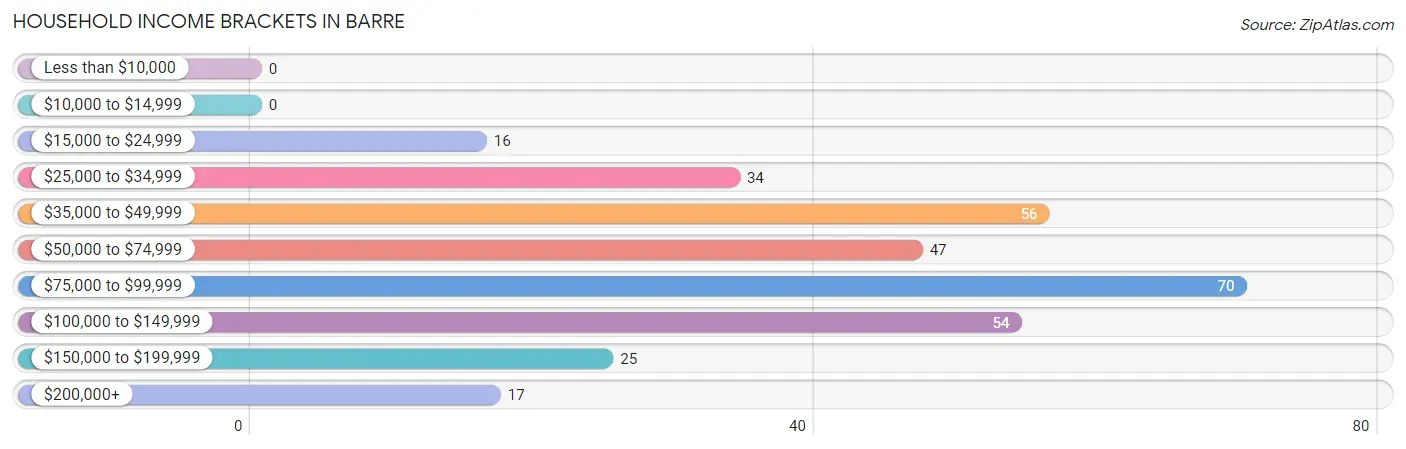
| Income Bracket | # Households | % Households |
| Less than $10,000 | 0 | 0.0% |
| $10,000 to $14,999 | 0 | 0.0% |
| $15,000 to $24,999 | 16 | 5.0% |
| $25,000 to $34,999 | 34 | 10.7% |
| $35,000 to $49,999 | 56 | 17.6% |
| $50,000 to $74,999 | 47 | 14.7% |
| $75,000 to $99,999 | 70 | 21.9% |
| $100,000 to $149,999 | 54 | 16.9% |
| $150,000 to $199,999 | 25 | 7.8% |
| $200,000+ | 17 | 5.3% |
Household Income by Householder Age in Barre
The median household income in Barre is $75,813, with the highest median household income of $98,575 found in the 45 to 64 years age bracket for the primary householder. A total of 141 households (44.2%) fall into this category.
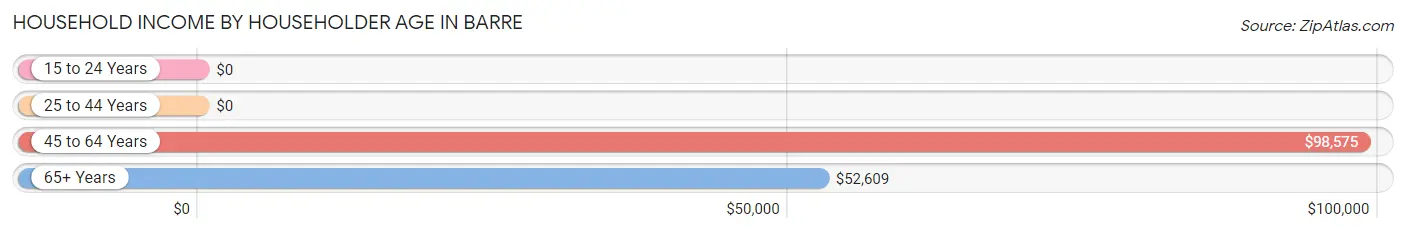
| Income Bracket | # Households | Median Income |
| 15 to 24 Years | 0 (0.0%) | $0 |
| 25 to 44 Years | 76 (23.8%) | $0 |
| 45 to 64 Years | 141 (44.2%) | $98,575 |
| 65+ Years | 102 (32.0%) | $52,609 |
| Total | 319 (100.0%) | $75,813 |
Poverty in Barre
Income Below Poverty by Sex and Age in Barre
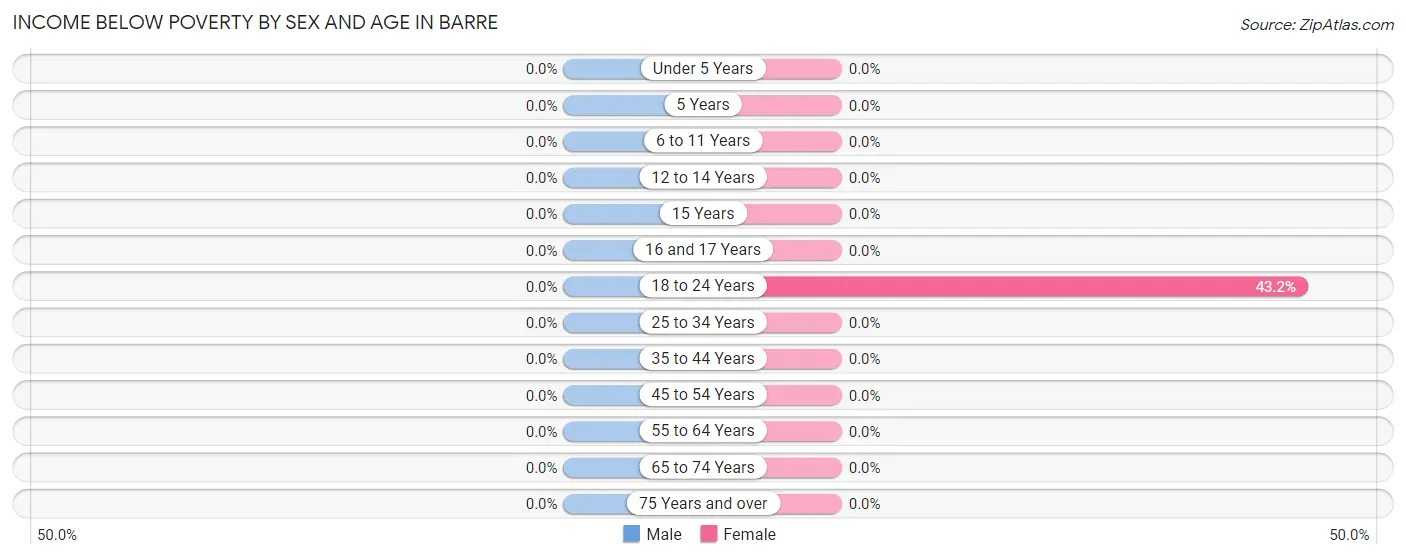
| Age Bracket | Male | Female |
| Under 5 Years | 0 (0.0%) | 0 (0.0%) |
| 5 Years | 0 (0.0%) | 0 (0.0%) |
| 6 to 11 Years | 0 (0.0%) | 0 (0.0%) |
| 12 to 14 Years | 0 (0.0%) | 0 (0.0%) |
| 15 Years | 0 (0.0%) | 0 (0.0%) |
| 16 and 17 Years | 0 (0.0%) | 0 (0.0%) |
| 18 to 24 Years | 0 (0.0%) | 16 (43.2%) |
| 25 to 34 Years | 0 (0.0%) | 0 (0.0%) |
| 35 to 44 Years | 0 (0.0%) | 0 (0.0%) |
| 45 to 54 Years | 0 (0.0%) | 0 (0.0%) |
| 55 to 64 Years | 0 (0.0%) | 0 (0.0%) |
| 65 to 74 Years | 0 (0.0%) | 0 (0.0%) |
| 75 Years and over | 0 (0.0%) | 0 (0.0%) |
| Total | 0 (0.0%) | 16 (5.1%) |
Income Above Poverty by Sex and Age in Barre
According to the poverty statistics in Barre, males aged 25 to 34 years and females aged 25 to 34 years are the age groups that are most secure financially, with 100.0% of males and 100.0% of females in these age groups living above the poverty line.
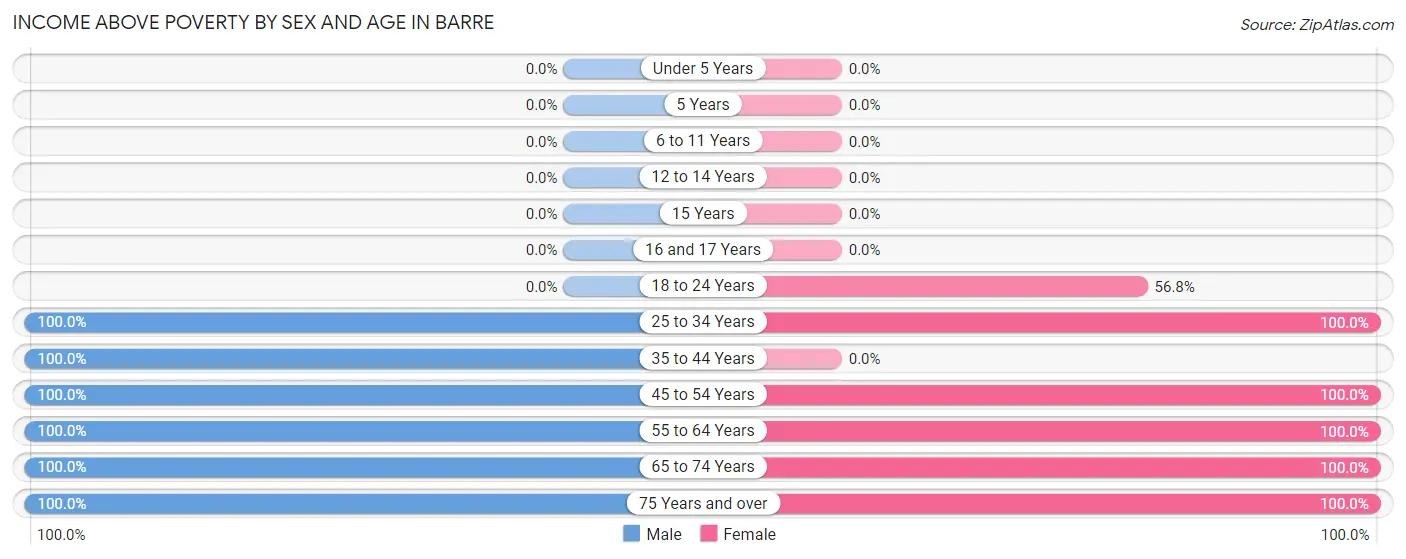
| Age Bracket | Male | Female |
| Under 5 Years | 0 (0.0%) | 0 (0.0%) |
| 5 Years | 0 (0.0%) | 0 (0.0%) |
| 6 to 11 Years | 0 (0.0%) | 0 (0.0%) |
| 12 to 14 Years | 0 (0.0%) | 0 (0.0%) |
| 15 Years | 0 (0.0%) | 0 (0.0%) |
| 16 and 17 Years | 0 (0.0%) | 0 (0.0%) |
| 18 to 24 Years | 0 (0.0%) | 21 (56.8%) |
| 25 to 34 Years | 73 (100.0%) | 74 (100.0%) |
| 35 to 44 Years | 27 (100.0%) | 0 (0.0%) |
| 45 to 54 Years | 82 (100.0%) | 79 (100.0%) |
| 55 to 64 Years | 32 (100.0%) | 64 (100.0%) |
| 65 to 74 Years | 58 (100.0%) | 30 (100.0%) |
| 75 Years and over | 5 (100.0%) | 33 (100.0%) |
| Total | 277 (100.0%) | 301 (95.0%) |
Income Below Poverty Among Married-Couple Families in Barre
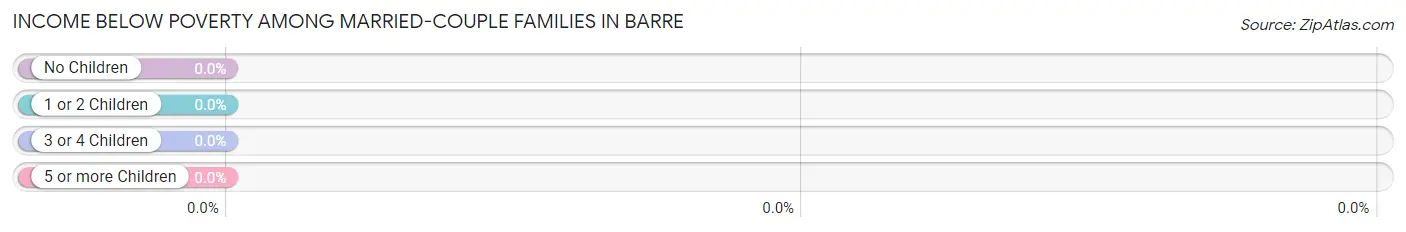
| Children | Above Poverty | Below Poverty |
| No Children | 188 (100.0%) | 0 (0.0%) |
| 1 or 2 Children | 0 (0.0%) | 0 (0.0%) |
| 3 or 4 Children | 0 (0.0%) | 0 (0.0%) |
| 5 or more Children | 0 (0.0%) | 0 (0.0%) |
| Total | 188 (100.0%) | 0 (0.0%) |
Income Below Poverty Among Single-Parent Households in Barre
| Children | Single Father | Single Mother |
| No Children | 0 (0.0%) | 0 (0.0%) |
| 1 or 2 Children | 0 (0.0%) | 0 (0.0%) |
| 3 or 4 Children | 0 (0.0%) | 0 (0.0%) |
| 5 or more Children | 0 (0.0%) | 0 (0.0%) |
| Total | 0 (0.0%) | 0 (0.0%) |
Income Below Poverty Among Married-Couple vs Single-Parent Households in Barre
| Children | Married-Couple Families | Single-Parent Households |
| No Children | 0 (0.0%) | 0 (0.0%) |
| 1 or 2 Children | 0 (0.0%) | 0 (0.0%) |
| 3 or 4 Children | 0 (0.0%) | 0 (0.0%) |
| 5 or more Children | 0 (0.0%) | 0 (0.0%) |
| Total | 0 (0.0%) | 0 (0.0%) |
Race in Barre
The most populous races in Barre are , and White / Caucasian (594 | 100.0%).
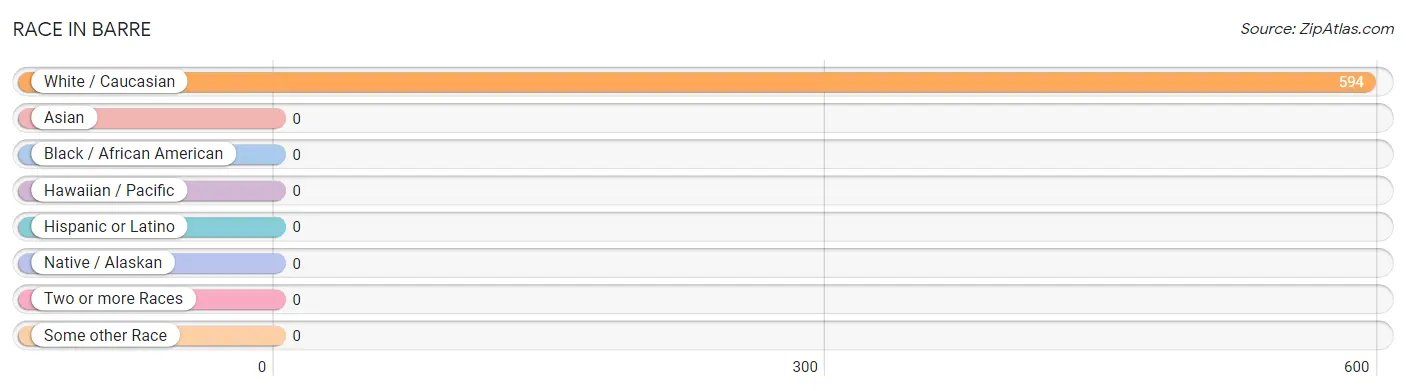
| Race | # Population | % Population |
| Asian | 0 | 0.0% |
| Black / African American | 0 | 0.0% |
| Hawaiian / Pacific | 0 | 0.0% |
| Hispanic or Latino | 0 | 0.0% |
| Native / Alaskan | 0 | 0.0% |
| White / Caucasian | 594 | 100.0% |
| Two or more Races | 0 | 0.0% |
| Some other Race | 0 | 0.0% |
| Total | 594 | 100.0% |
Ancestry in Barre
The most populous ancestries reported in Barre are Irish (159 | 26.8%), English (142 | 23.9%), American (123 | 20.7%), German (101 | 17.0%), and Italian (94 | 15.8%), together accounting for 104.2% of all Barre residents.
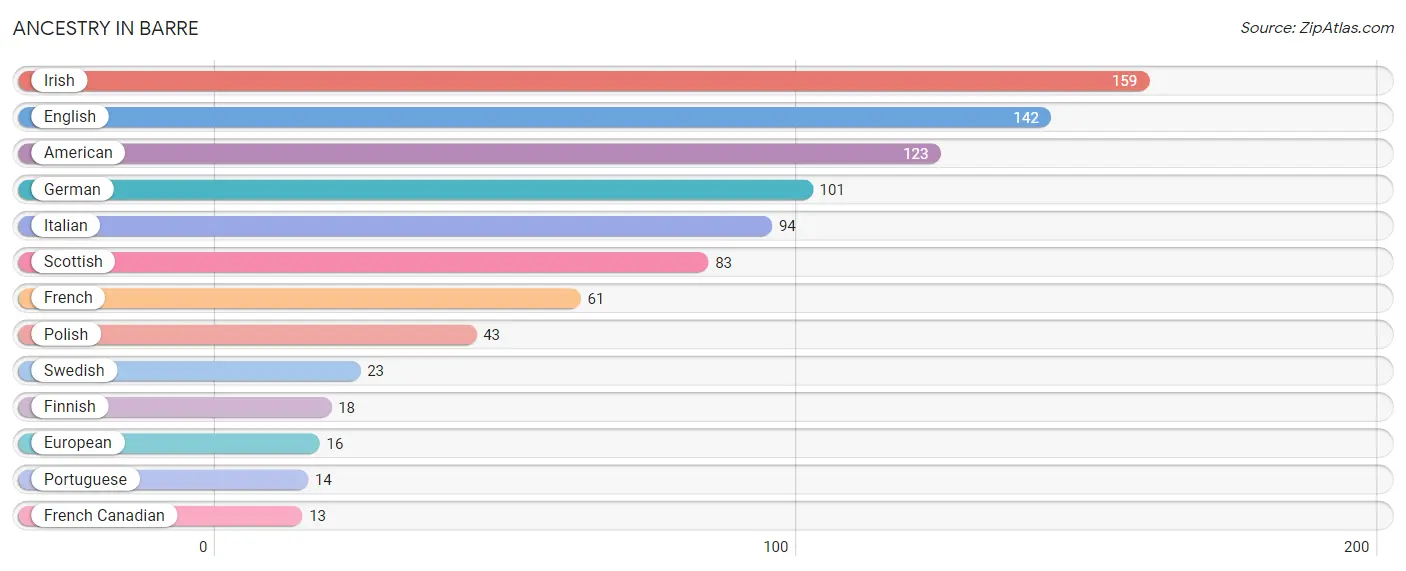
| Ancestry | # Population | % Population |
| American | 123 | 20.7% |
| English | 142 | 23.9% |
| European | 16 | 2.7% |
| Finnish | 18 | 3.0% |
| French | 61 | 10.3% |
| French Canadian | 13 | 2.2% |
| German | 101 | 17.0% |
| Irish | 159 | 26.8% |
| Italian | 94 | 15.8% |
| Polish | 43 | 7.2% |
| Portuguese | 14 | 2.4% |
| Scottish | 83 | 14.0% |
| Swedish | 23 | 3.9% | View All 13 Rows |
Immigrants in Barre

| Immigration Origin | # Population | % Population | View All 0 Rows |
Sex and Age in Barre
Sex and Age in Barre
The most populous age groups in Barre are 50 to 54 Years (67 | 24.2%) for men and 30 to 34 Years (74 | 23.3%) for women.
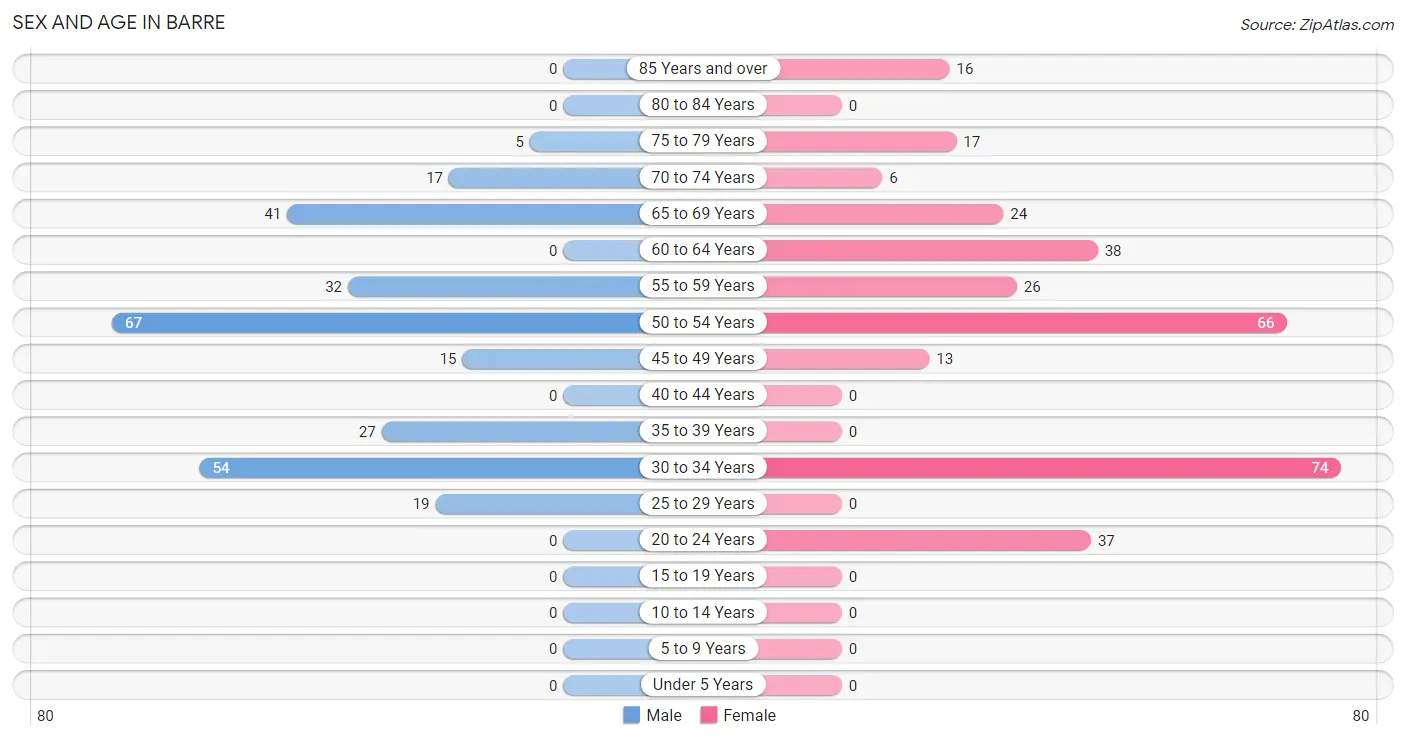
| Age Bracket | Male | Female |
| Under 5 Years | 0 (0.0%) | 0 (0.0%) |
| 5 to 9 Years | 0 (0.0%) | 0 (0.0%) |
| 10 to 14 Years | 0 (0.0%) | 0 (0.0%) |
| 15 to 19 Years | 0 (0.0%) | 0 (0.0%) |
| 20 to 24 Years | 0 (0.0%) | 37 (11.7%) |
| 25 to 29 Years | 19 (6.9%) | 0 (0.0%) |
| 30 to 34 Years | 54 (19.5%) | 74 (23.3%) |
| 35 to 39 Years | 27 (9.8%) | 0 (0.0%) |
| 40 to 44 Years | 0 (0.0%) | 0 (0.0%) |
| 45 to 49 Years | 15 (5.4%) | 13 (4.1%) |
| 50 to 54 Years | 67 (24.2%) | 66 (20.8%) |
| 55 to 59 Years | 32 (11.6%) | 26 (8.2%) |
| 60 to 64 Years | 0 (0.0%) | 38 (12.0%) |
| 65 to 69 Years | 41 (14.8%) | 24 (7.6%) |
| 70 to 74 Years | 17 (6.1%) | 6 (1.9%) |
| 75 to 79 Years | 5 (1.8%) | 17 (5.4%) |
| 80 to 84 Years | 0 (0.0%) | 0 (0.0%) |
| 85 Years and over | 0 (0.0%) | 16 (5.1%) |
| Total | 277 (100.0%) | 317 (100.0%) |
Families and Households in Barre
Median Family Size in Barre
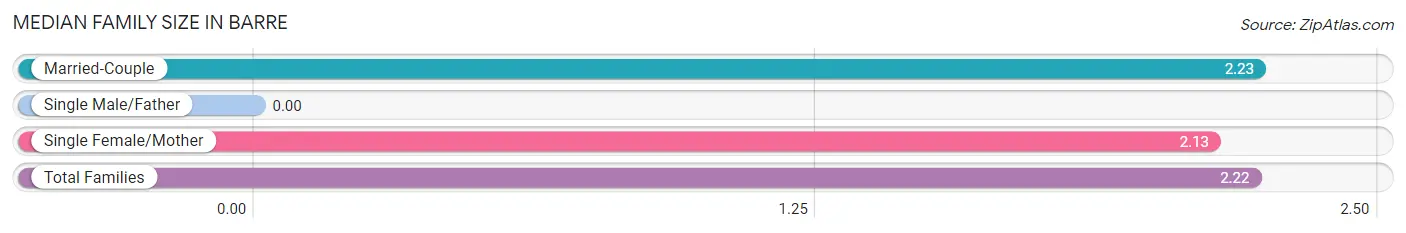
| Family Type | # Families | Family Size |
| Married-Couple | 188 (88.7%) | 2.23 |
| Single Male/Father | 0 (0.0%) | - |
| Single Female/Mother | 24 (11.3%) | 2.13 |
| Total Families | 212 (100.0%) | 2.22 |
Median Household Size in Barre
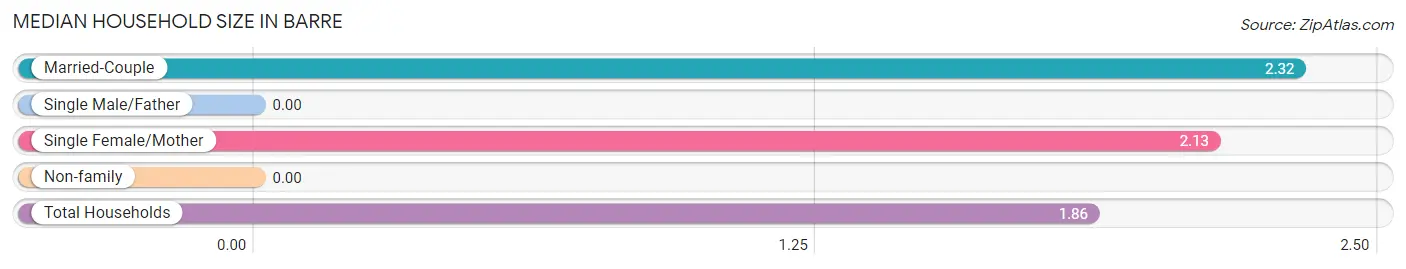
| Household Type | # Households | Household Size |
| Married-Couple | 188 (58.9%) | 2.32 |
| Single Male/Father | 0 (0.0%) | - |
| Single Female/Mother | 24 (7.5%) | 2.13 |
| Non-family | 107 (33.5%) | - |
| Total Households | 319 (100.0%) | 1.86 |
Household Size by Marriage Status in Barre
Out of a total of 319 households in Barre, 212 (66.5%) are family households, while 107 (33.5%) are nonfamily households. The most numerous type of family households are 2-person households, comprising 200, and the most common type of nonfamily households are 1-person households, comprising 107.
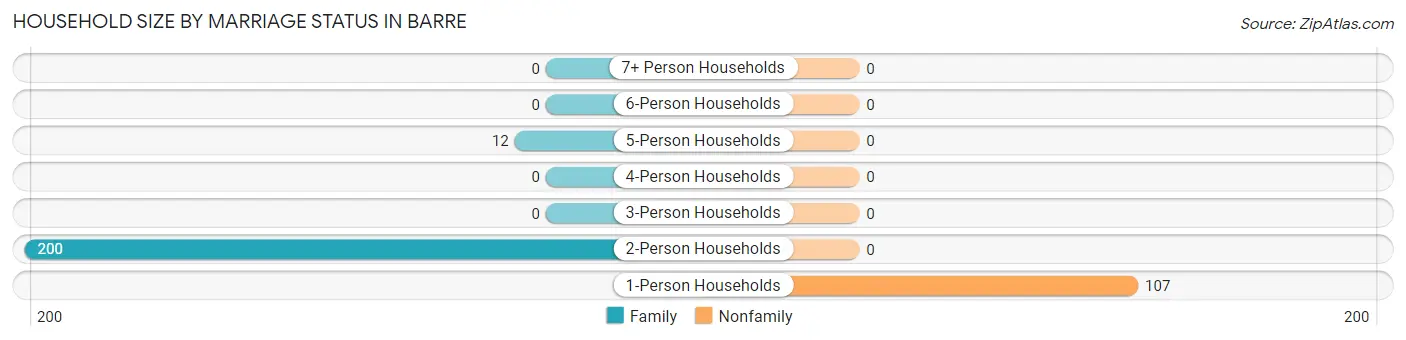
| Household Size | Family Households | Nonfamily Households |
| 1-Person Households | - | 107 (33.5%) |
| 2-Person Households | 200 (62.7%) | 0 (0.0%) |
| 3-Person Households | 0 (0.0%) | 0 (0.0%) |
| 4-Person Households | 0 (0.0%) | 0 (0.0%) |
| 5-Person Households | 12 (3.8%) | 0 (0.0%) |
| 6-Person Households | 0 (0.0%) | 0 (0.0%) |
| 7+ Person Households | 0 (0.0%) | 0 (0.0%) |
| Total | 212 (66.5%) | 107 (33.5%) |
Female Fertility in Barre
Fertility by Age in Barre
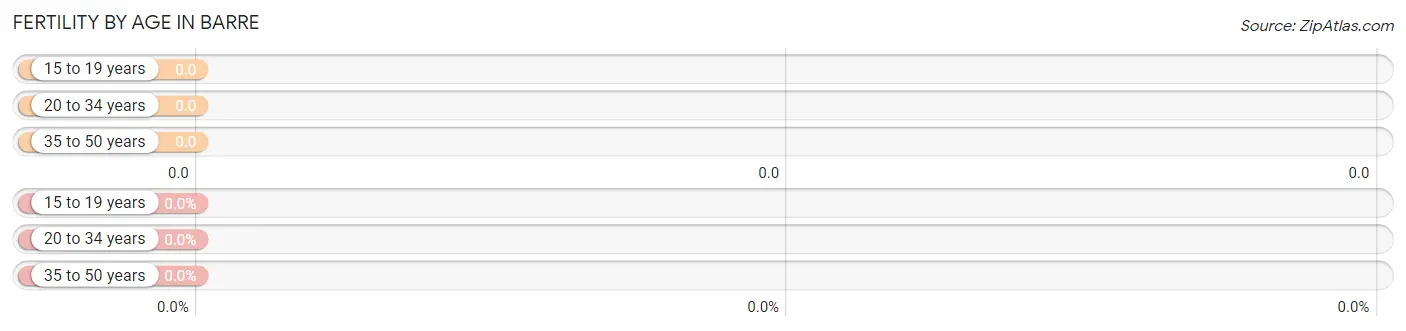
| Age Bracket | Women with Births | Births / 1,000 Women |
| 15 to 19 years | 0 (0.0%) | 0.0 |
| 20 to 34 years | 0 (0.0%) | 0.0 |
| 35 to 50 years | 0 (0.0%) | 0.0 |
| Total | 0 (0.0%) | 0.0 |
Fertility by Age by Marriage Status in Barre
| Age Bracket | Married | Unmarried |
| 15 to 19 years | 0 (0.0%) | 0 (0.0%) |
| 20 to 34 years | 0 (0.0%) | 0 (0.0%) |
| 35 to 50 years | 0 (0.0%) | 0 (0.0%) |
| Total | 0 (0.0%) | 0 (0.0%) |
Fertility by Education in Barre
| Educational Attainment | Women with Births | Births / 1,000 Women |
| Less than High School | 0 (0.0%) | 0.0 |
| High School Diploma | 0 (0.0%) | 0.0 |
| College or Associate's Degree | 0 (0.0%) | 0.0 |
| Bachelor's Degree | 0 (0.0%) | 0.0 |
| Graduate Degree | 0 (0.0%) | 0.0 |
| Total | 0 (0.0%) | 0.0 |
Fertility by Education by Marriage Status in Barre
| Educational Attainment | Married | Unmarried |
| Less than High School | 0 (0.0%) | 0 (0.0%) |
| High School Diploma | 0 (0.0%) | 0 (0.0%) |
| College or Associate's Degree | 0 (0.0%) | 0 (0.0%) |
| Bachelor's Degree | 0 (0.0%) | 0 (0.0%) |
| Graduate Degree | 0 (0.0%) | 0 (0.0%) |
| Total | 0 (0.0%) | 0 (0.0%) |
Employment Characteristics in Barre
Employment by Class of Employer in Barre
Among the 373 employed individuals in Barre, local government employees (126 | 33.8%), private company employees (110 | 29.5%), and state government employees (64 | 17.2%) make up the most common classes of employment.
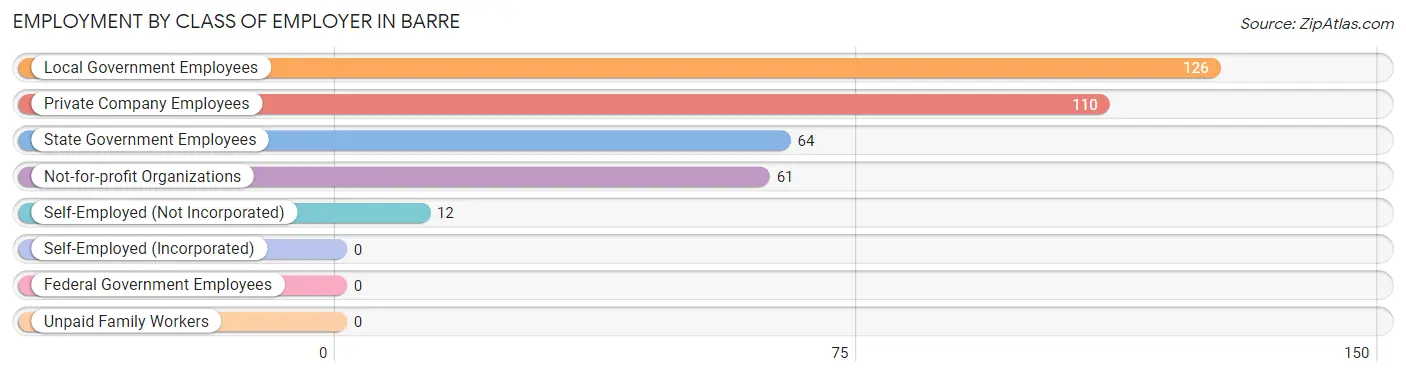
| Employer Class | # Employees | % Employees |
| Private Company Employees | 110 | 29.5% |
| Self-Employed (Incorporated) | 0 | 0.0% |
| Self-Employed (Not Incorporated) | 12 | 3.2% |
| Not-for-profit Organizations | 61 | 16.4% |
| Local Government Employees | 126 | 33.8% |
| State Government Employees | 64 | 17.2% |
| Federal Government Employees | 0 | 0.0% |
| Unpaid Family Workers | 0 | 0.0% |
| Total | 373 | 100.0% |
Employment Status by Age in Barre
According to the labor force statistics for Barre, out of the total population over 16 years of age (594), 67.3% or 400 individuals are in the labor force, with 6.8% or 27 of them unemployed. The age group with the highest labor force participation rate is 20 to 24 years, with 100.0% or 37 individuals in the labor force. Within the labor force, the 35 to 44 years age range has the highest percentage of unemployed individuals, with 100.0% or 27 of them being unemployed.
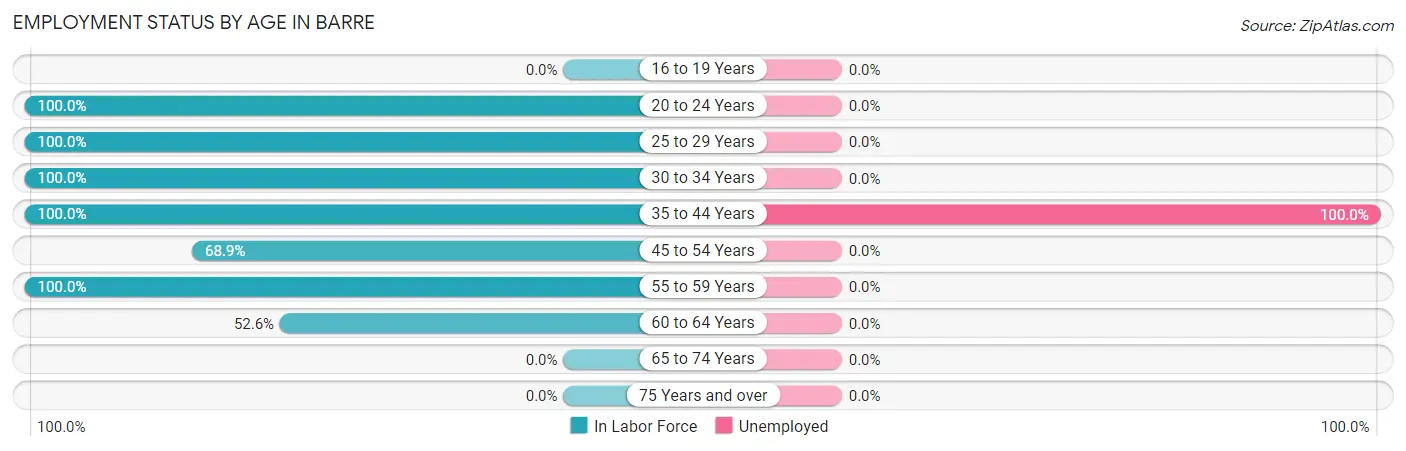
| Age Bracket | In Labor Force | Unemployed |
| 16 to 19 Years | 0 (0.0%) | 0 (0.0%) |
| 20 to 24 Years | 37 (100.0%) | 0 (0.0%) |
| 25 to 29 Years | 19 (100.0%) | 0 (0.0%) |
| 30 to 34 Years | 128 (100.0%) | 0 (0.0%) |
| 35 to 44 Years | 27 (100.0%) | 27 (100.0%) |
| 45 to 54 Years | 111 (68.9%) | 0 (0.0%) |
| 55 to 59 Years | 58 (100.0%) | 0 (0.0%) |
| 60 to 64 Years | 20 (52.6%) | 0 (0.0%) |
| 65 to 74 Years | 0 (0.0%) | 0 (0.0%) |
| 75 Years and over | 0 (0.0%) | 0 (0.0%) |
| Total | 400 (67.3%) | 27 (6.8%) |
Employment Status by Educational Attainment in Barre
According to labor force statistics for Barre, 84.2% of individuals (363) out of the total population between 25 and 64 years of age (431) are in the labor force, with 7.4% or 27 of them being unemployed. The group with the highest labor force participation rate are those with the educational attainment of bachelor's degree or higher, with 100.0% or 190 individuals in the labor force. Within the labor force, individuals with college / associate degree education have the highest percentage of unemployment, with 29.0% or 27 of them being unemployed.
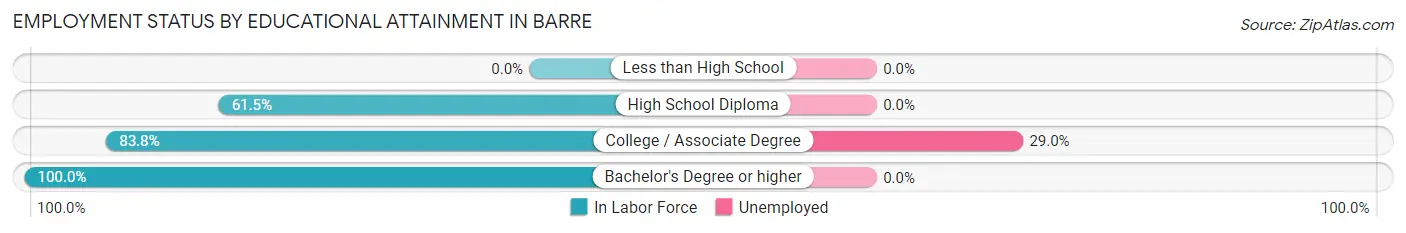
| Educational Attainment | In Labor Force | Unemployed |
| Less than High School | 0 (0.0%) | 0 (0.0%) |
| High School Diploma | 80 (61.5%) | 0 (0.0%) |
| College / Associate Degree | 93 (83.8%) | 32 (29.0%) |
| Bachelor's Degree or higher | 190 (100.0%) | 0 (0.0%) |
| Total | 363 (84.2%) | 32 (7.4%) |
Employment Occupations by Sex in Barre
Management, Business, Science and Arts Occupations
The most common Management, Business, Science and Arts occupations in Barre are Community & Social Service (87 | 23.3%), Education Instruction & Library (71 | 19.0%), Management (69 | 18.5%), Arts, Media & Entertainment (16 | 4.3%), and Health Diagnosing & Treating (14 | 3.7%).
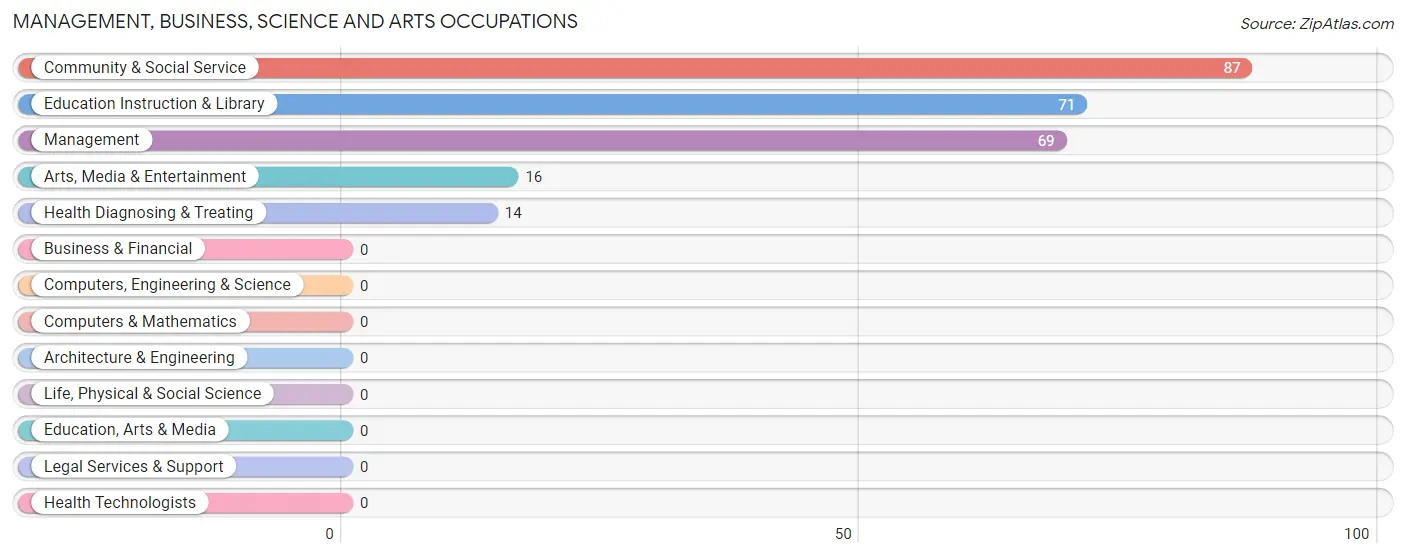
Management, Business, Science and Arts Occupations by Sex
Within the Management, Business, Science and Arts occupations in Barre, the most male-oriented occupations are Education Instruction & Library (100.0%), Community & Social Service (81.6%), and Management (24.6%), while the most female-oriented occupations are Arts, Media & Entertainment (100.0%), Health Diagnosing & Treating (100.0%), and Management (75.4%).
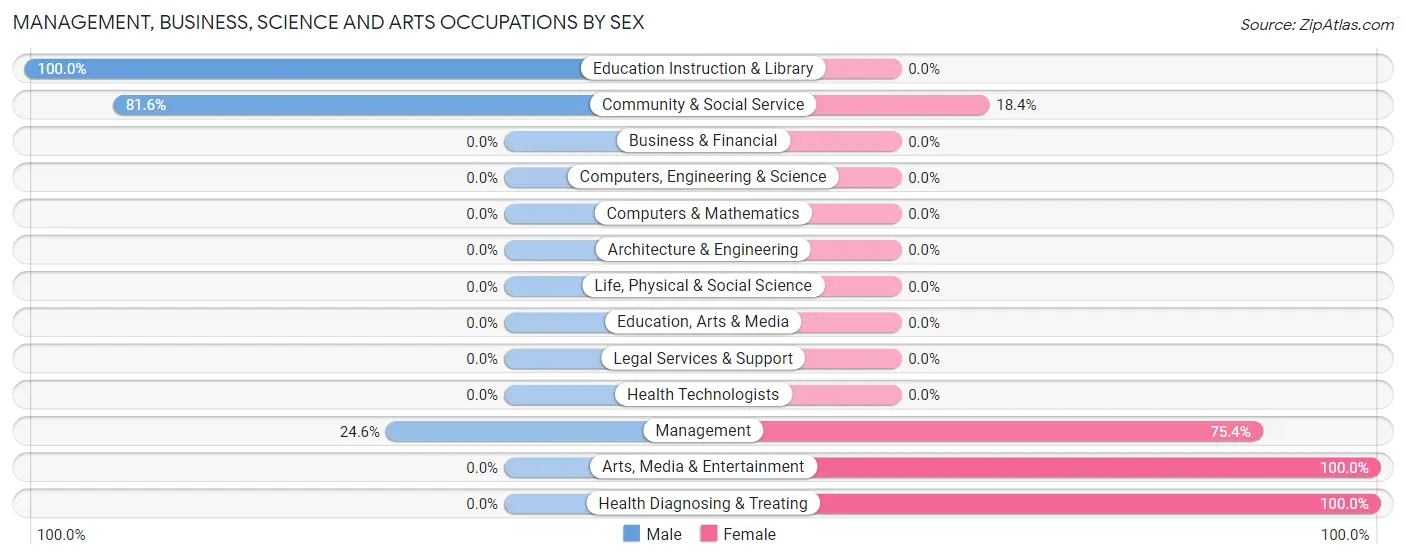
| Occupation | Male | Female |
| Management | 17 (24.6%) | 52 (75.4%) |
| Business & Financial | 0 (0.0%) | 0 (0.0%) |
| Computers, Engineering & Science | 0 (0.0%) | 0 (0.0%) |
| Computers & Mathematics | 0 (0.0%) | 0 (0.0%) |
| Architecture & Engineering | 0 (0.0%) | 0 (0.0%) |
| Life, Physical & Social Science | 0 (0.0%) | 0 (0.0%) |
| Community & Social Service | 71 (81.6%) | 16 (18.4%) |
| Education, Arts & Media | 0 (0.0%) | 0 (0.0%) |
| Legal Services & Support | 0 (0.0%) | 0 (0.0%) |
| Education Instruction & Library | 71 (100.0%) | 0 (0.0%) |
| Arts, Media & Entertainment | 0 (0.0%) | 16 (100.0%) |
| Health Diagnosing & Treating | 0 (0.0%) | 14 (100.0%) |
| Health Technologists | 0 (0.0%) | 0 (0.0%) |
| Total (Category) | 88 (51.8%) | 82 (48.2%) |
| Total (Overall) | 187 (50.1%) | 186 (49.9%) |
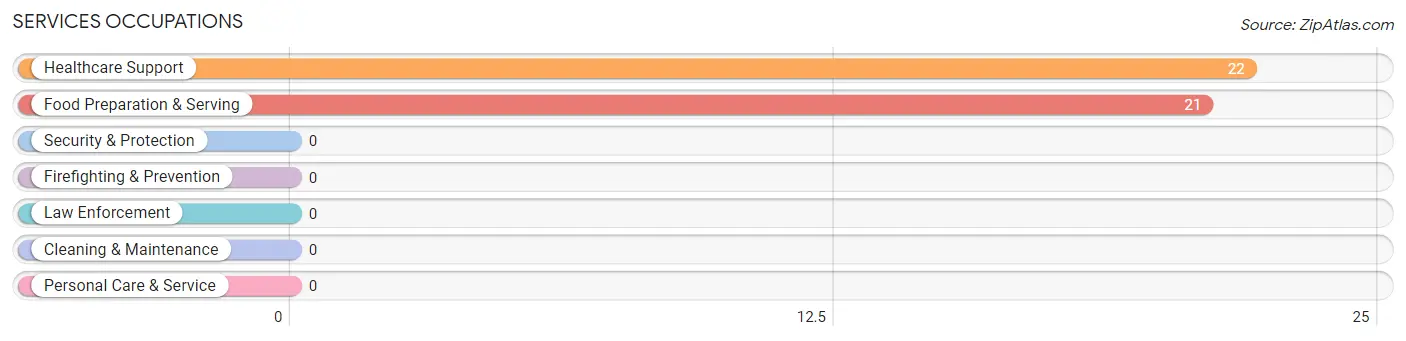
Services Occupations
The most common Services occupations in Barre are Healthcare Support (22 | 5.9%), and Food Preparation & Serving (21 | 5.6%).
Services Occupations by Sex
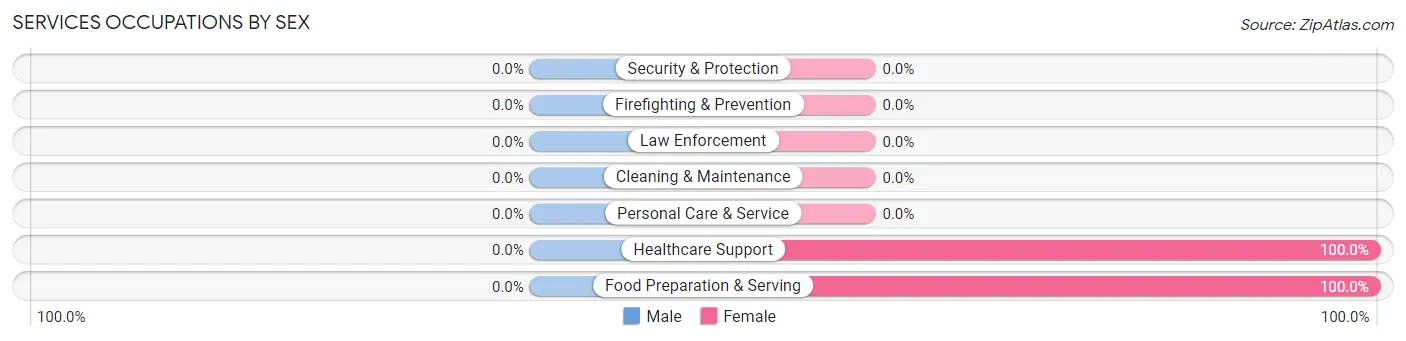
| Occupation | Male | Female |
| Healthcare Support | 0 (0.0%) | 22 (100.0%) |
| Security & Protection | 0 (0.0%) | 0 (0.0%) |
| Firefighting & Prevention | 0 (0.0%) | 0 (0.0%) |
| Law Enforcement | 0 (0.0%) | 0 (0.0%) |
| Food Preparation & Serving | 0 (0.0%) | 21 (100.0%) |
| Cleaning & Maintenance | 0 (0.0%) | 0 (0.0%) |
| Personal Care & Service | 0 (0.0%) | 0 (0.0%) |
| Total (Category) | 0 (0.0%) | 43 (100.0%) |
| Total (Overall) | 187 (50.1%) | 186 (49.9%) |
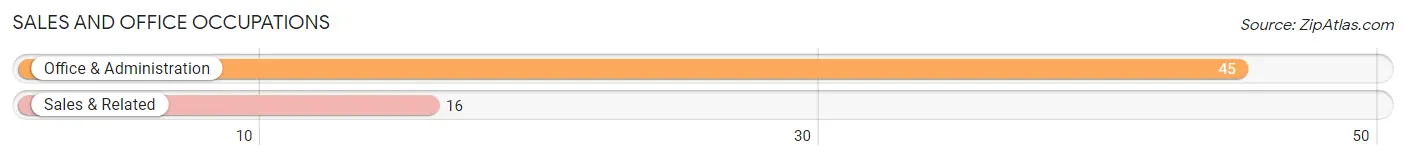
Sales and Office Occupations
The most common Sales and Office occupations in Barre are Office & Administration (45 | 12.1%), and Sales & Related (16 | 4.3%).
Sales and Office Occupations by Sex
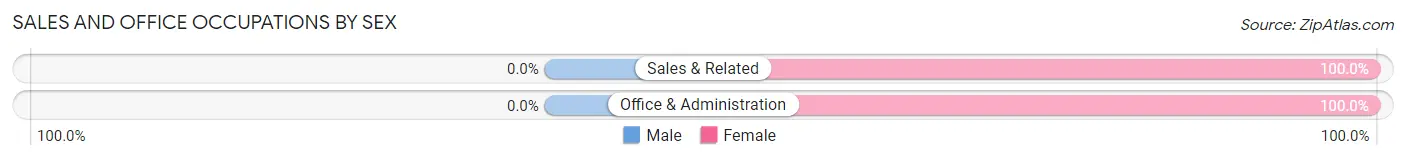
| Occupation | Male | Female |
| Sales & Related | 0 (0.0%) | 16 (100.0%) |
| Office & Administration | 0 (0.0%) | 45 (100.0%) |
| Total (Category) | 0 (0.0%) | 61 (100.0%) |
| Total (Overall) | 187 (50.1%) | 186 (49.9%) |
Natural Resources, Construction and Maintenance Occupations
The most common Natural Resources, Construction and Maintenance occupations in Barre are Construction & Extraction (69 | 18.5%), and Installation, Maintenance & Repair (15 | 4.0%).
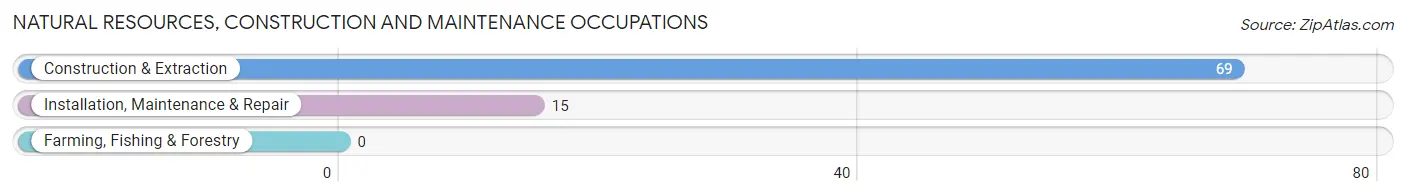
Natural Resources, Construction and Maintenance Occupations by Sex
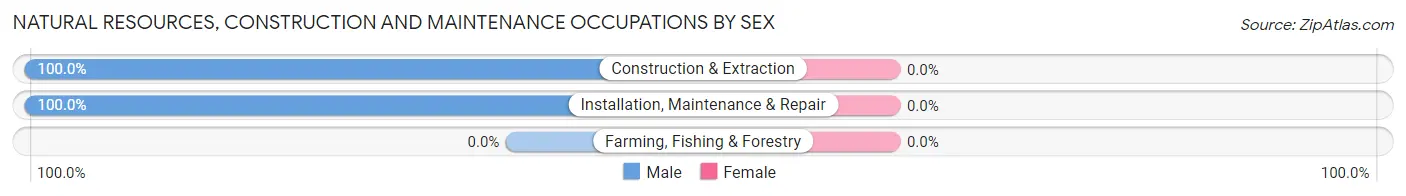
| Occupation | Male | Female |
| Farming, Fishing & Forestry | 0 (0.0%) | 0 (0.0%) |
| Construction & Extraction | 69 (100.0%) | 0 (0.0%) |
| Installation, Maintenance & Repair | 15 (100.0%) | 0 (0.0%) |
| Total (Category) | 84 (100.0%) | 0 (0.0%) |
| Total (Overall) | 187 (50.1%) | 186 (49.9%) |
Production, Transportation and Moving Occupations
The most common Production, Transportation and Moving occupations in Barre are , and Production (15 | 4.0%).
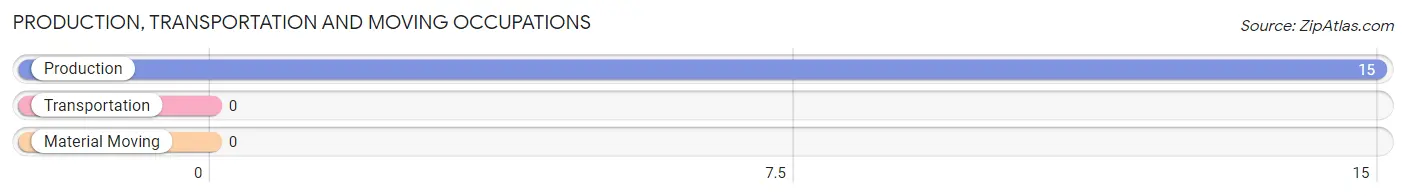
Production, Transportation and Moving Occupations by Sex
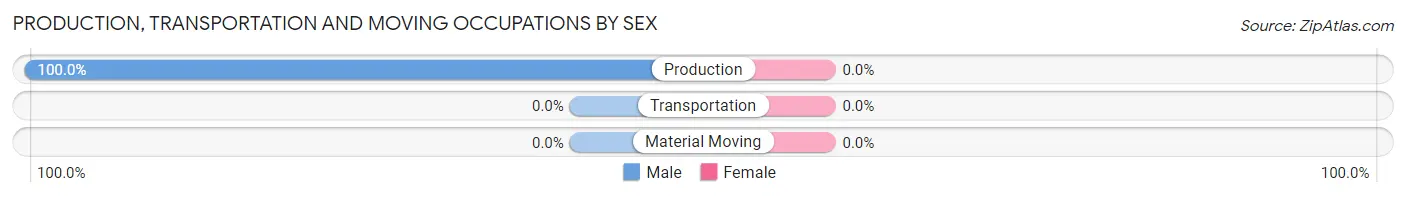
| Occupation | Male | Female |
| Production | 15 (100.0%) | 0 (0.0%) |
| Transportation | 0 (0.0%) | 0 (0.0%) |
| Material Moving | 0 (0.0%) | 0 (0.0%) |
| Total (Category) | 15 (100.0%) | 0 (0.0%) |
| Total (Overall) | 187 (50.1%) | 186 (49.9%) |
Employment Industries by Sex in Barre
Employment Industries in Barre
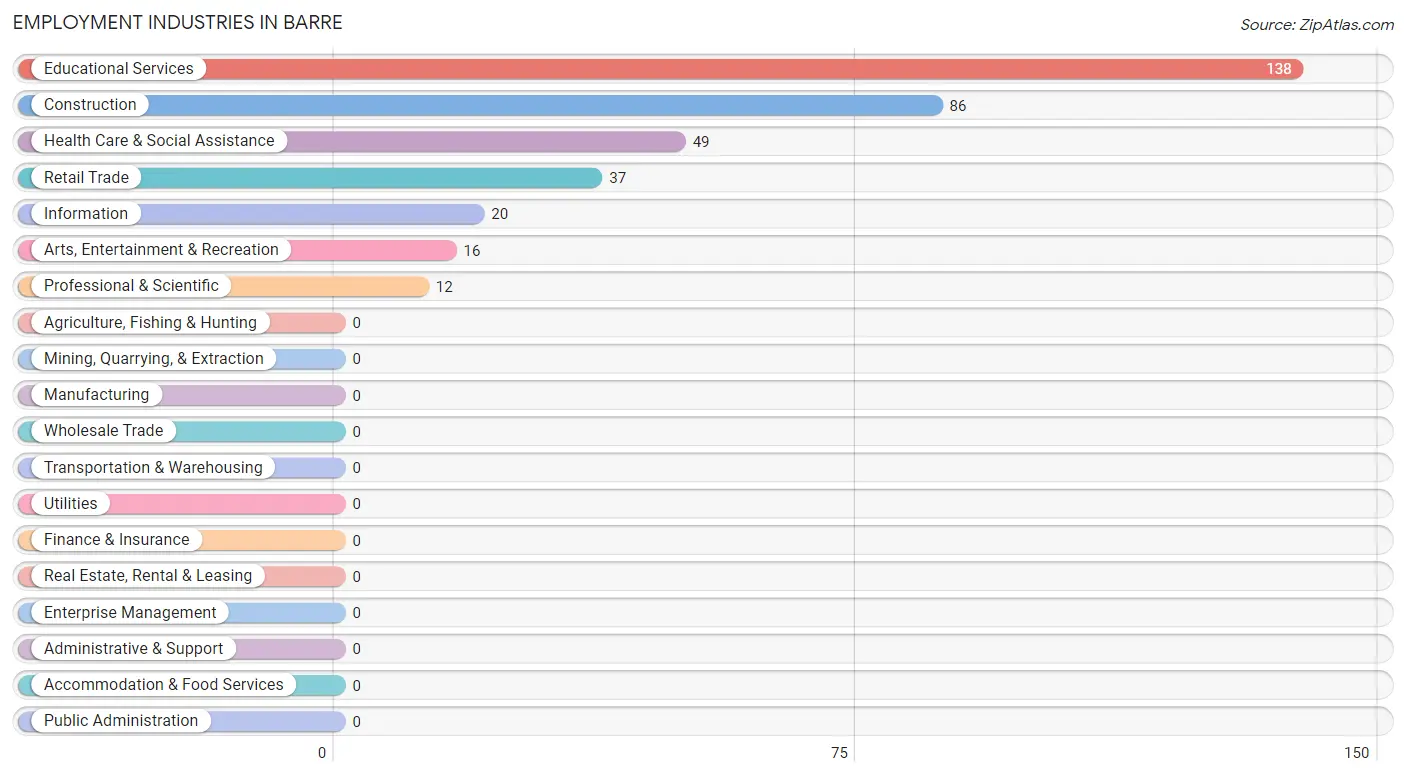
The major employment industries in Barre include Educational Services (138 | 37.0%), Construction (86 | 23.1%), Health Care & Social Assistance (49 | 13.1%), Retail Trade (37 | 9.9%), and Information (20 | 5.4%).
Employment Industries by Sex in Barre
The Barre industries that see more men than women are Construction (100.0%), and Educational Services (62.3%), whereas the industries that tend to have a higher number of women are Retail Trade (100.0%), Information (100.0%), and Professional & Scientific (100.0%).
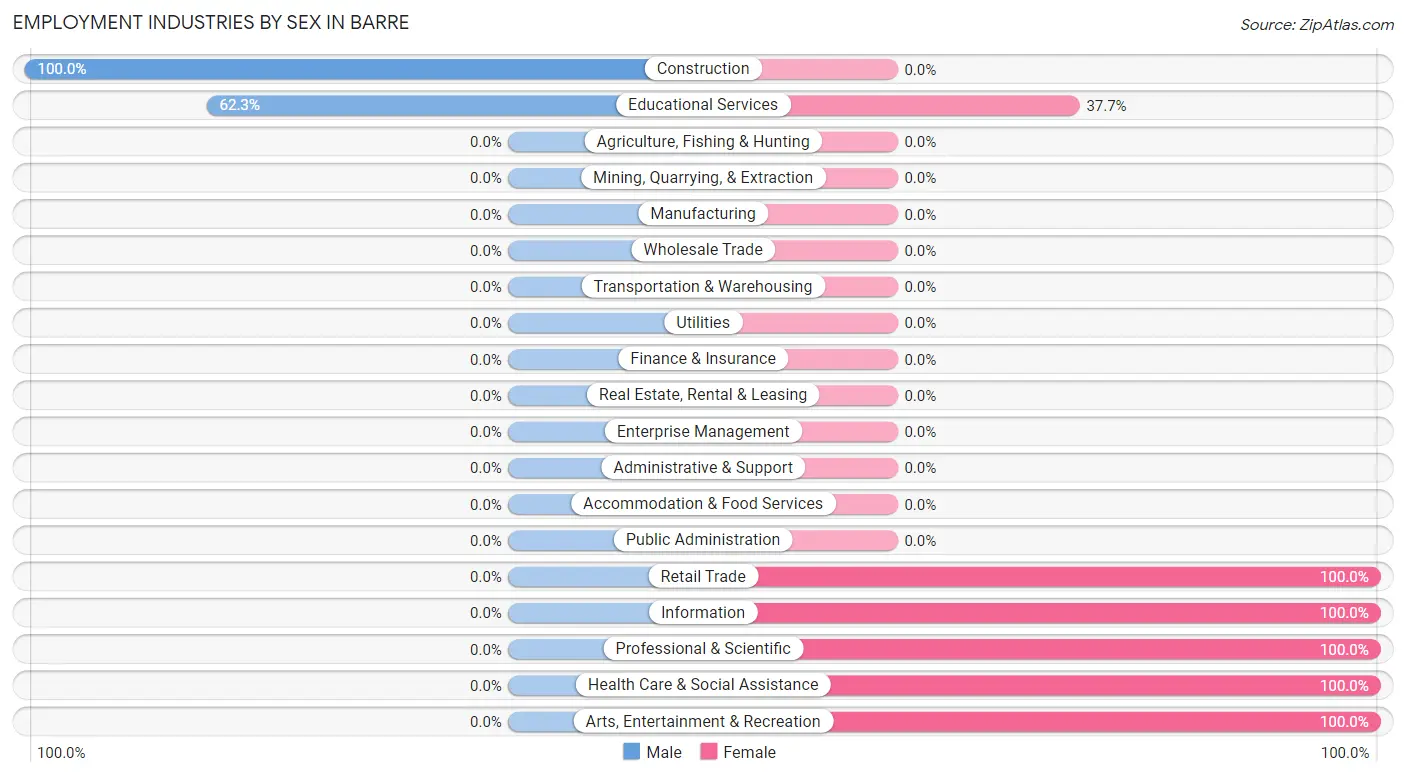
| Industry | Male | Female |
| Agriculture, Fishing & Hunting | 0 (0.0%) | 0 (0.0%) |
| Mining, Quarrying, & Extraction | 0 (0.0%) | 0 (0.0%) |
| Construction | 86 (100.0%) | 0 (0.0%) |
| Manufacturing | 0 (0.0%) | 0 (0.0%) |
| Wholesale Trade | 0 (0.0%) | 0 (0.0%) |
| Retail Trade | 0 (0.0%) | 37 (100.0%) |
| Transportation & Warehousing | 0 (0.0%) | 0 (0.0%) |
| Utilities | 0 (0.0%) | 0 (0.0%) |
| Information | 0 (0.0%) | 20 (100.0%) |
| Finance & Insurance | 0 (0.0%) | 0 (0.0%) |
| Real Estate, Rental & Leasing | 0 (0.0%) | 0 (0.0%) |
| Professional & Scientific | 0 (0.0%) | 12 (100.0%) |
| Enterprise Management | 0 (0.0%) | 0 (0.0%) |
| Administrative & Support | 0 (0.0%) | 0 (0.0%) |
| Educational Services | 86 (62.3%) | 52 (37.7%) |
| Health Care & Social Assistance | 0 (0.0%) | 49 (100.0%) |
| Arts, Entertainment & Recreation | 0 (0.0%) | 16 (100.0%) |
| Accommodation & Food Services | 0 (0.0%) | 0 (0.0%) |
| Public Administration | 0 (0.0%) | 0 (0.0%) |
| Total | 187 (50.1%) | 186 (49.9%) |
Education in Barre
School Enrollment in Barre
The most common levels of schooling among the 74 students in Barre are graduate / professional (52 | 70.3%), and college / undergraduate (22 | 29.7%).
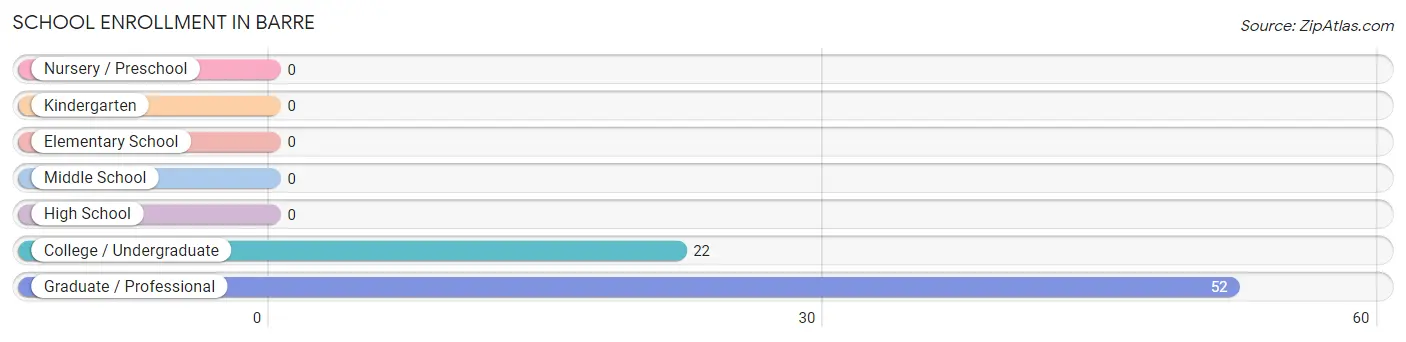
| School Level | # Students | % Students |
| Nursery / Preschool | 0 | 0.0% |
| Kindergarten | 0 | 0.0% |
| Elementary School | 0 | 0.0% |
| Middle School | 0 | 0.0% |
| High School | 0 | 0.0% |
| College / Undergraduate | 22 | 29.7% |
| Graduate / Professional | 52 | 70.3% |
| Total | 74 | 100.0% |
School Enrollment by Age by Funding Source in Barre
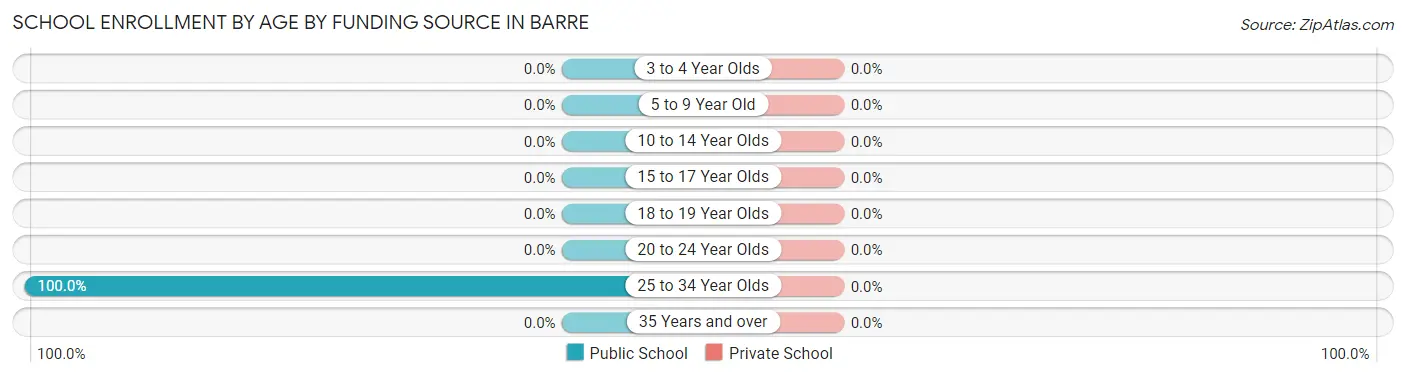
| Age Bracket | Public School | Private School |
| 3 to 4 Year Olds | 0 (0.0%) | 0 (0.0%) |
| 5 to 9 Year Old | 0 (0.0%) | 0 (0.0%) |
| 10 to 14 Year Olds | 0 (0.0%) | 0 (0.0%) |
| 15 to 17 Year Olds | 0 (0.0%) | 0 (0.0%) |
| 18 to 19 Year Olds | 0 (0.0%) | 0 (0.0%) |
| 20 to 24 Year Olds | 0 (0.0%) | 0 (0.0%) |
| 25 to 34 Year Olds | 74 (100.0%) | 0 (0.0%) |
| 35 Years and over | 0 (0.0%) | 0 (0.0%) |
| Total | 74 (100.0%) | 0 (0.0%) |
Educational Attainment by Field of Study in Barre
Literature & languages (106 | 46.1%), business (48 | 20.9%), science & technology (23 | 10.0%), psychology (20 | 8.7%), and social sciences (17 | 7.4%) are the most common fields of study among 230 individuals in Barre who have obtained a bachelor's degree or higher.
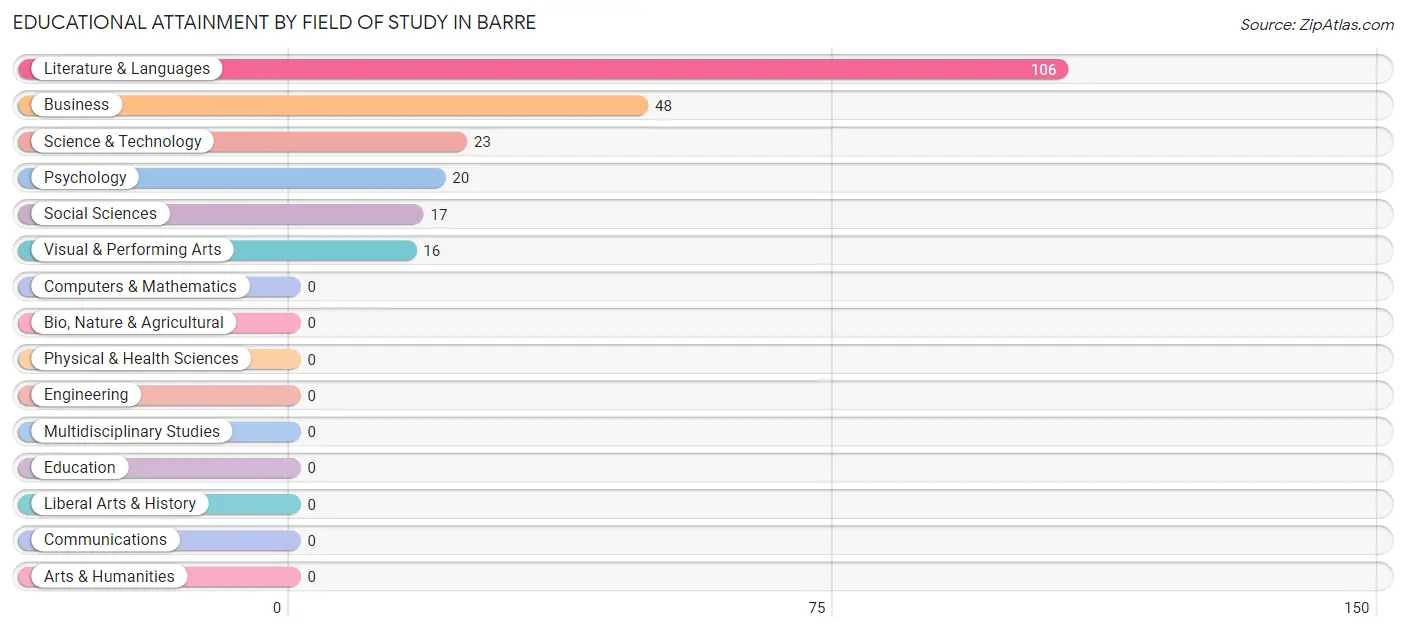
| Field of Study | # Graduates | % Graduates |
| Computers & Mathematics | 0 | 0.0% |
| Bio, Nature & Agricultural | 0 | 0.0% |
| Physical & Health Sciences | 0 | 0.0% |
| Psychology | 20 | 8.7% |
| Social Sciences | 17 | 7.4% |
| Engineering | 0 | 0.0% |
| Multidisciplinary Studies | 0 | 0.0% |
| Science & Technology | 23 | 10.0% |
| Business | 48 | 20.9% |
| Education | 0 | 0.0% |
| Literature & Languages | 106 | 46.1% |
| Liberal Arts & History | 0 | 0.0% |
| Visual & Performing Arts | 16 | 7.0% |
| Communications | 0 | 0.0% |
| Arts & Humanities | 0 | 0.0% |
| Total | 230 | 100.0% |
Transportation & Commute in Barre
Vehicle Availability by Sex in Barre
The most prevalent vehicle ownership categories in Barre are males with 2 vehicles (134, accounting for 71.7%) and females with 2 vehicles (85, making up 72.0%).
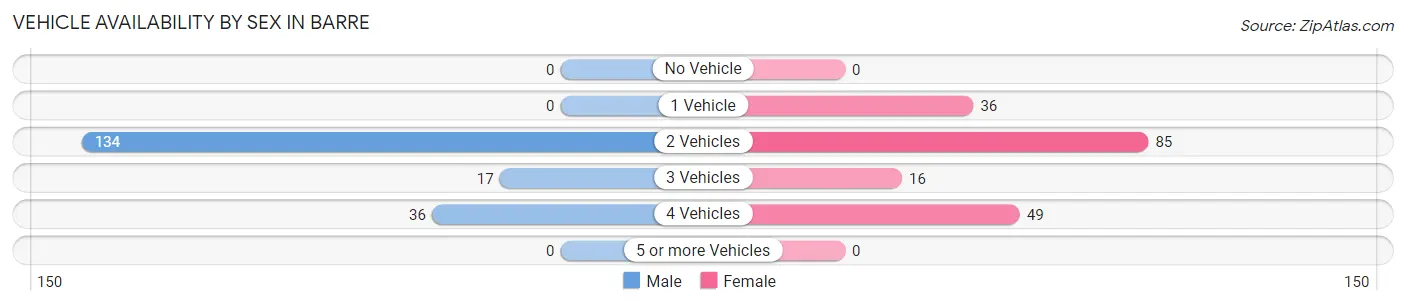
| Vehicles Available | Male | Female |
| No Vehicle | 0 (0.0%) | 0 (0.0%) |
| 1 Vehicle | 0 (0.0%) | 36 (19.4%) |
| 2 Vehicles | 134 (71.7%) | 85 (45.7%) |
| 3 Vehicles | 17 (9.1%) | 16 (8.6%) |
| 4 Vehicles | 36 (19.3%) | 49 (26.3%) |
| 5 or more Vehicles | 0 (0.0%) | 0 (0.0%) |
| Total | 187 (100.0%) | 186 (100.0%) |
Commute Time in Barre
The most frequently occuring commute durations in Barre are 35 to 39 minutes (103 commuters, 28.5%), 5 to 9 minutes (56 commuters, 15.5%), and 60 to 89 minutes (54 commuters, 15.0%).
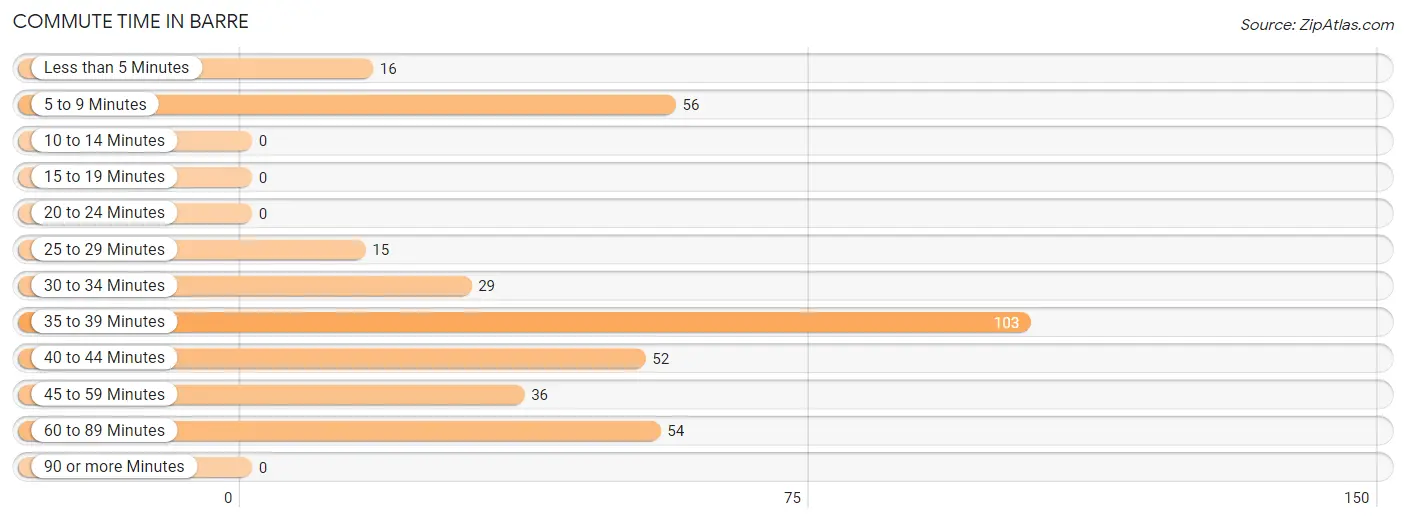
| Commute Time | # Commuters | % Commuters |
| Less than 5 Minutes | 16 | 4.4% |
| 5 to 9 Minutes | 56 | 15.5% |
| 10 to 14 Minutes | 0 | 0.0% |
| 15 to 19 Minutes | 0 | 0.0% |
| 20 to 24 Minutes | 0 | 0.0% |
| 25 to 29 Minutes | 15 | 4.2% |
| 30 to 34 Minutes | 29 | 8.0% |
| 35 to 39 Minutes | 103 | 28.5% |
| 40 to 44 Minutes | 52 | 14.4% |
| 45 to 59 Minutes | 36 | 10.0% |
| 60 to 89 Minutes | 54 | 15.0% |
| 90 or more Minutes | 0 | 0.0% |
Commute Time by Sex in Barre
The most common commute times in Barre are 35 to 39 minutes (103 commuters, 55.1%) for males and 5 to 9 minutes (56 commuters, 32.2%) for females.
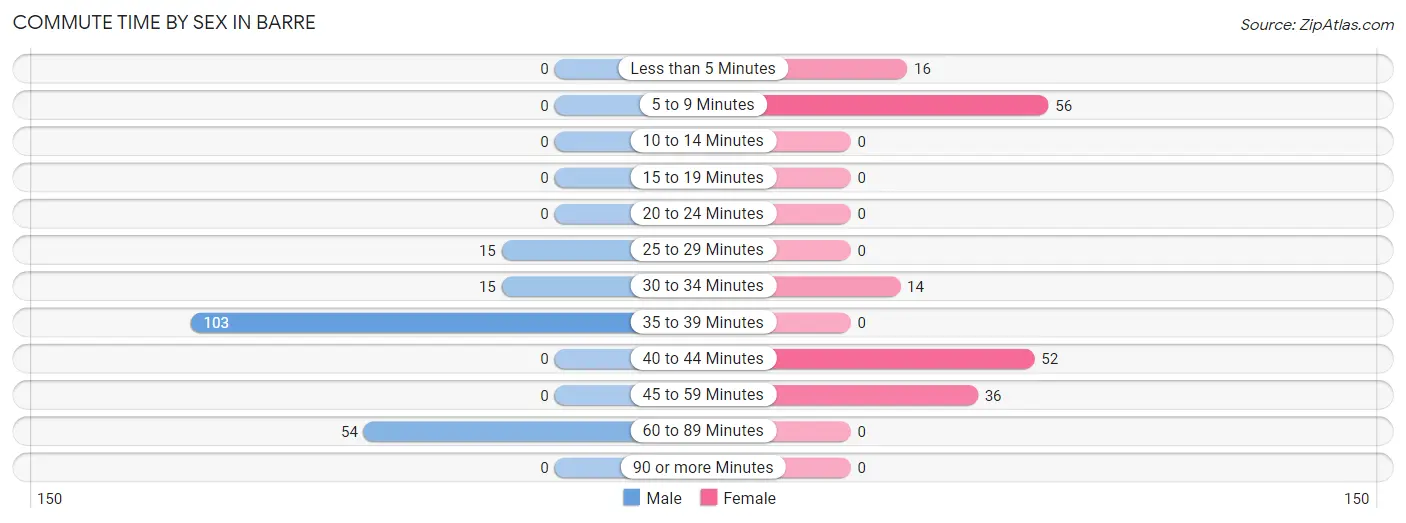
| Commute Time | Male | Female |
| Less than 5 Minutes | 0 (0.0%) | 16 (9.2%) |
| 5 to 9 Minutes | 0 (0.0%) | 56 (32.2%) |
| 10 to 14 Minutes | 0 (0.0%) | 0 (0.0%) |
| 15 to 19 Minutes | 0 (0.0%) | 0 (0.0%) |
| 20 to 24 Minutes | 0 (0.0%) | 0 (0.0%) |
| 25 to 29 Minutes | 15 (8.0%) | 0 (0.0%) |
| 30 to 34 Minutes | 15 (8.0%) | 14 (8.1%) |
| 35 to 39 Minutes | 103 (55.1%) | 0 (0.0%) |
| 40 to 44 Minutes | 0 (0.0%) | 52 (29.9%) |
| 45 to 59 Minutes | 0 (0.0%) | 36 (20.7%) |
| 60 to 89 Minutes | 54 (28.9%) | 0 (0.0%) |
| 90 or more Minutes | 0 (0.0%) | 0 (0.0%) |
Time of Departure to Work by Sex in Barre
The most frequent times of departure to work in Barre are 6:30 AM to 6:59 AM (73, 39.0%) for males and 7:00 AM to 7:29 AM (66, 37.9%) for females.
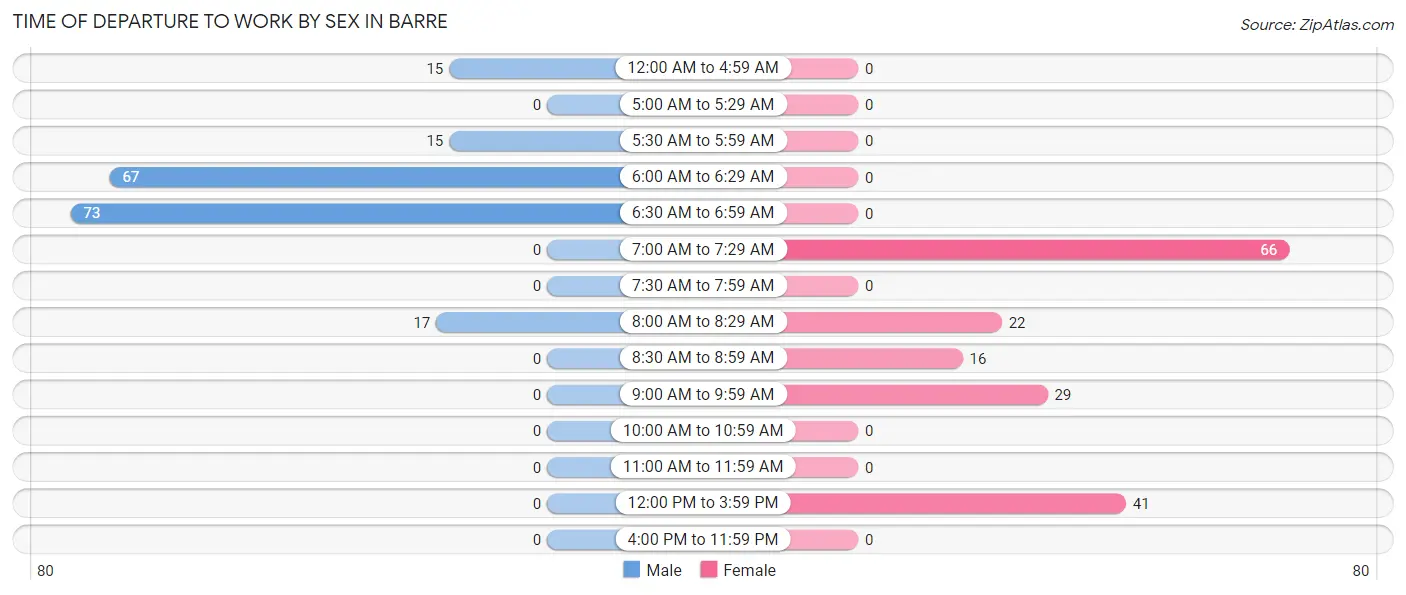
| Time of Departure | Male | Female |
| 12:00 AM to 4:59 AM | 15 (8.0%) | 0 (0.0%) |
| 5:00 AM to 5:29 AM | 0 (0.0%) | 0 (0.0%) |
| 5:30 AM to 5:59 AM | 15 (8.0%) | 0 (0.0%) |
| 6:00 AM to 6:29 AM | 67 (35.8%) | 0 (0.0%) |
| 6:30 AM to 6:59 AM | 73 (39.0%) | 0 (0.0%) |
| 7:00 AM to 7:29 AM | 0 (0.0%) | 66 (37.9%) |
| 7:30 AM to 7:59 AM | 0 (0.0%) | 0 (0.0%) |
| 8:00 AM to 8:29 AM | 17 (9.1%) | 22 (12.6%) |
| 8:30 AM to 8:59 AM | 0 (0.0%) | 16 (9.2%) |
| 9:00 AM to 9:59 AM | 0 (0.0%) | 29 (16.7%) |
| 10:00 AM to 10:59 AM | 0 (0.0%) | 0 (0.0%) |
| 11:00 AM to 11:59 AM | 0 (0.0%) | 0 (0.0%) |
| 12:00 PM to 3:59 PM | 0 (0.0%) | 41 (23.6%) |
| 4:00 PM to 11:59 PM | 0 (0.0%) | 0 (0.0%) |
| Total | 187 (100.0%) | 174 (100.0%) |
Housing Occupancy in Barre
Occupancy by Ownership in Barre
Of the total 319 dwellings in Barre, owner-occupied units account for 319 (100.0%), while renter-occupied units make up 0 (0.0%).
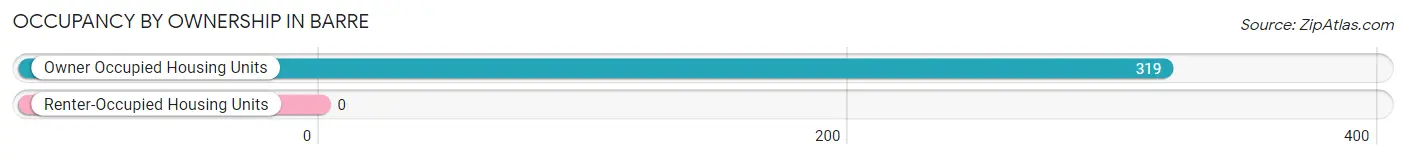
| Occupancy | # Housing Units | % Housing Units |
| Owner Occupied Housing Units | 319 | 100.0% |
| Renter-Occupied Housing Units | 0 | 0.0% |
| Total Occupied Housing Units | 319 | 100.0% |
Occupancy by Household Size in Barre
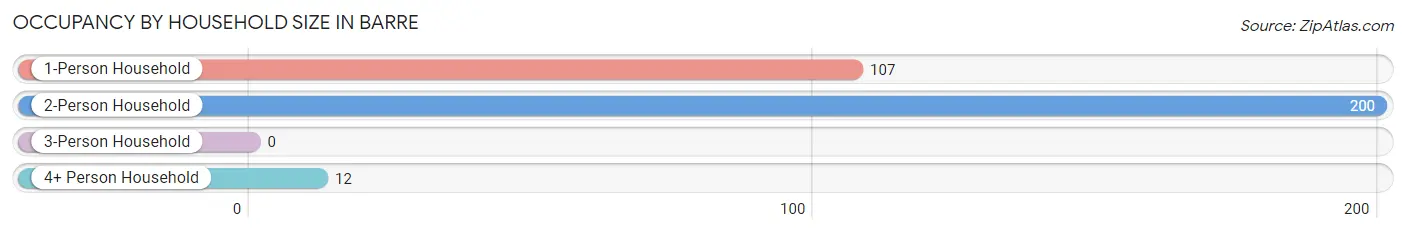
| Household Size | # Housing Units | % Housing Units |
| 1-Person Household | 107 | 33.5% |
| 2-Person Household | 200 | 62.7% |
| 3-Person Household | 0 | 0.0% |
| 4+ Person Household | 12 | 3.8% |
| Total Housing Units | 319 | 100.0% |
Occupancy by Ownership by Household Size in Barre
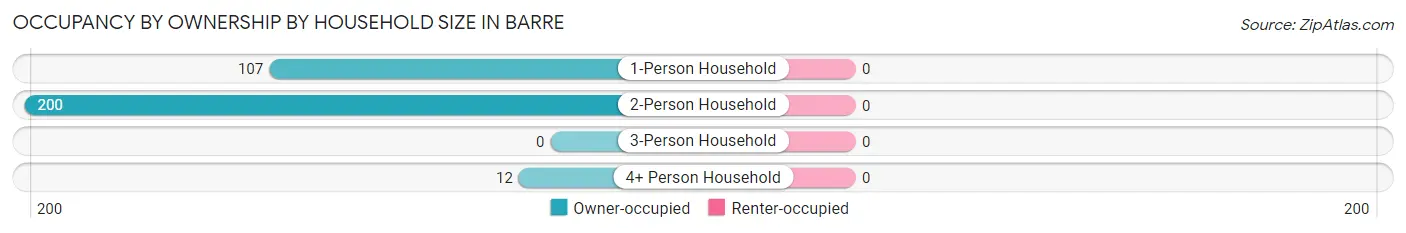
| Household Size | Owner-occupied | Renter-occupied |
| 1-Person Household | 107 (100.0%) | 0 (0.0%) |
| 2-Person Household | 200 (100.0%) | 0 (0.0%) |
| 3-Person Household | 0 (0.0%) | 0 (0.0%) |
| 4+ Person Household | 12 (100.0%) | 0 (0.0%) |
| Total Housing Units | 319 (100.0%) | 0 (0.0%) |
Occupancy by Educational Attainment in Barre
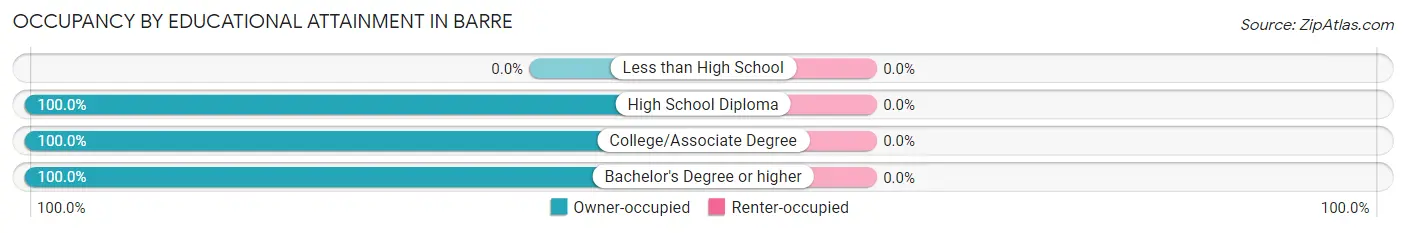
| Household Size | Owner-occupied | Renter-occupied |
| Less than High School | 0 (0.0%) | 0 (0.0%) |
| High School Diploma | 86 (100.0%) | 0 (0.0%) |
| College/Associate Degree | 90 (100.0%) | 0 (0.0%) |
| Bachelor's Degree or higher | 143 (100.0%) | 0 (0.0%) |
Occupancy by Age of Householder in Barre
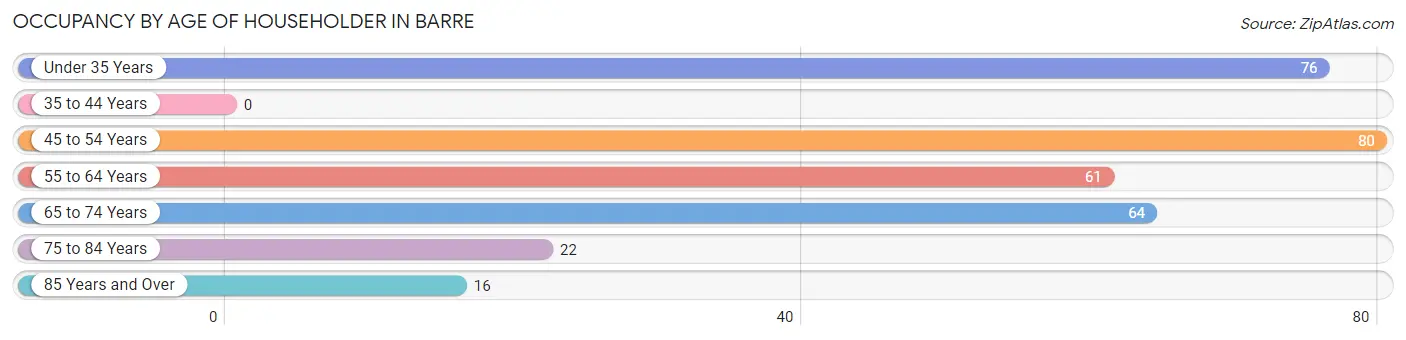
| Age Bracket | # Households | % Households |
| Under 35 Years | 76 | 23.8% |
| 35 to 44 Years | 0 | 0.0% |
| 45 to 54 Years | 80 | 25.1% |
| 55 to 64 Years | 61 | 19.1% |
| 65 to 74 Years | 64 | 20.1% |
| 75 to 84 Years | 22 | 6.9% |
| 85 Years and Over | 16 | 5.0% |
| Total | 319 | 100.0% |
Housing Finances in Barre
Median Income by Occupancy in Barre
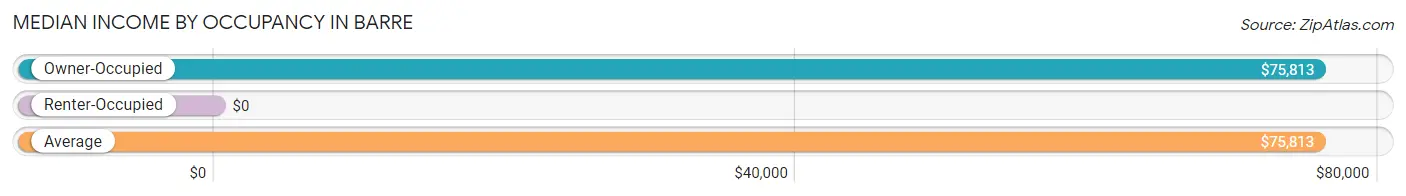
| Occupancy Type | # Households | Median Income |
| Owner-Occupied | 319 (100.0%) | $75,813 |
| Renter-Occupied | 0 (0.0%) | $0 |
| Average | 319 (100.0%) | $75,813 |
Occupancy by Householder Income Bracket in Barre
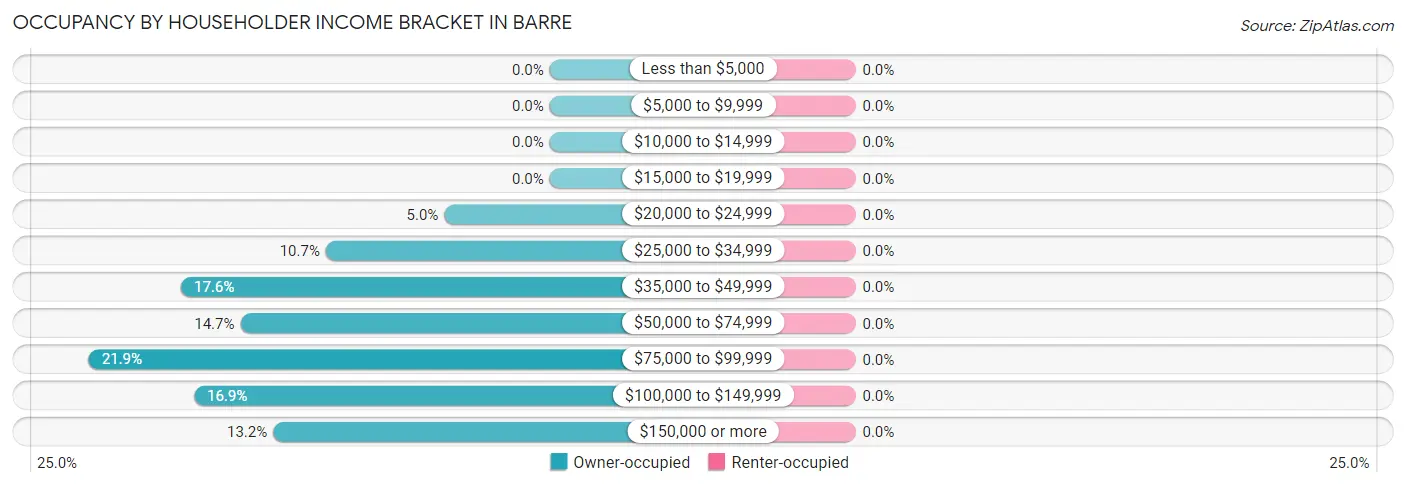
| Income Bracket | Owner-occupied | Renter-occupied |
| Less than $5,000 | 0 (0.0%) | 0 (0.0%) |
| $5,000 to $9,999 | 0 (0.0%) | 0 (0.0%) |
| $10,000 to $14,999 | 0 (0.0%) | 0 (0.0%) |
| $15,000 to $19,999 | 0 (0.0%) | 0 (0.0%) |
| $20,000 to $24,999 | 16 (5.0%) | 0 (0.0%) |
| $25,000 to $34,999 | 34 (10.7%) | 0 (0.0%) |
| $35,000 to $49,999 | 56 (17.5%) | 0 (0.0%) |
| $50,000 to $74,999 | 47 (14.7%) | 0 (0.0%) |
| $75,000 to $99,999 | 70 (21.9%) | 0 (0.0%) |
| $100,000 to $149,999 | 54 (16.9%) | 0 (0.0%) |
| $150,000 or more | 42 (13.2%) | 0 (0.0%) |
| Total | 319 (100.0%) | 0 (0.0%) |
Monthly Housing Cost Tiers in Barre
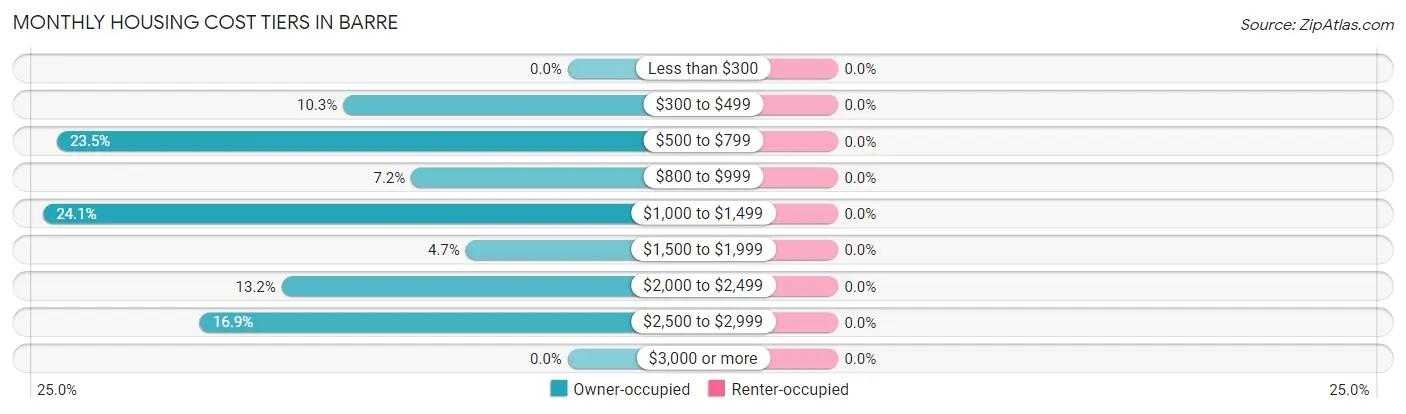
| Monthly Cost | Owner-occupied | Renter-occupied |
| Less than $300 | 0 (0.0%) | 0 (0.0%) |
| $300 to $499 | 33 (10.3%) | 0 (0.0%) |
| $500 to $799 | 75 (23.5%) | 0 (0.0%) |
| $800 to $999 | 23 (7.2%) | 0 (0.0%) |
| $1,000 to $1,499 | 77 (24.1%) | 0 (0.0%) |
| $1,500 to $1,999 | 15 (4.7%) | 0 (0.0%) |
| $2,000 to $2,499 | 42 (13.2%) | 0 (0.0%) |
| $2,500 to $2,999 | 54 (16.9%) | 0 (0.0%) |
| $3,000 or more | 0 (0.0%) | 0 (0.0%) |
| Total | 319 (100.0%) | 0 (0.0%) |
Physical Housing Characteristics in Barre
Housing Structures in Barre
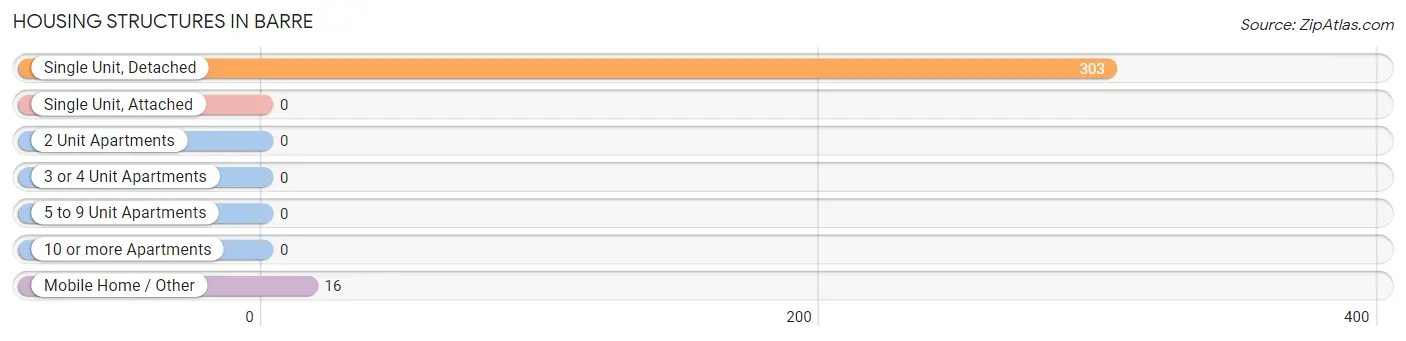
| Structure Type | # Housing Units | % Housing Units |
| Single Unit, Detached | 303 | 95.0% |
| Single Unit, Attached | 0 | 0.0% |
| 2 Unit Apartments | 0 | 0.0% |
| 3 or 4 Unit Apartments | 0 | 0.0% |
| 5 to 9 Unit Apartments | 0 | 0.0% |
| 10 or more Apartments | 0 | 0.0% |
| Mobile Home / Other | 16 | 5.0% |
| Total | 319 | 100.0% |
Housing Structures by Occupancy in Barre
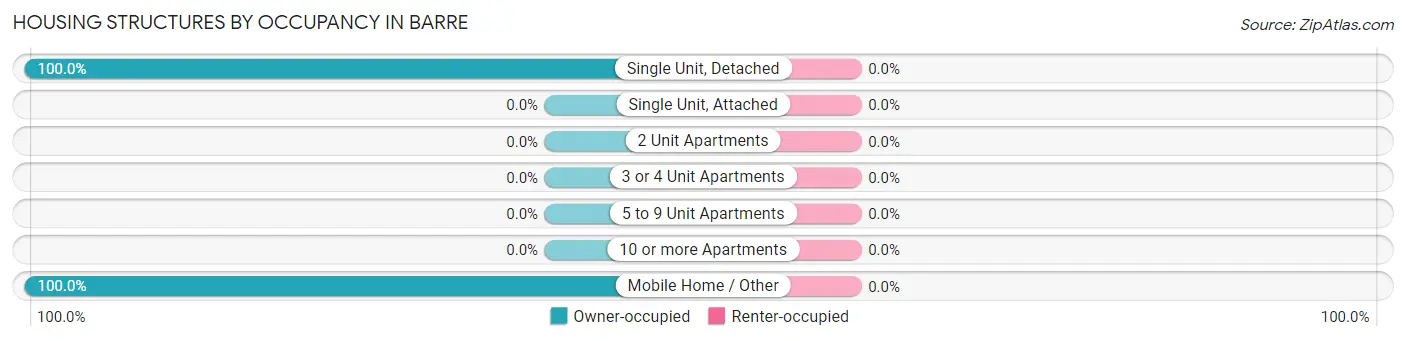
| Structure Type | Owner-occupied | Renter-occupied |
| Single Unit, Detached | 303 (100.0%) | 0 (0.0%) |
| Single Unit, Attached | 0 (0.0%) | 0 (0.0%) |
| 2 Unit Apartments | 0 (0.0%) | 0 (0.0%) |
| 3 or 4 Unit Apartments | 0 (0.0%) | 0 (0.0%) |
| 5 to 9 Unit Apartments | 0 (0.0%) | 0 (0.0%) |
| 10 or more Apartments | 0 (0.0%) | 0 (0.0%) |
| Mobile Home / Other | 16 (100.0%) | 0 (0.0%) |
| Total | 319 (100.0%) | 0 (0.0%) |
Housing Structures by Number of Rooms in Barre
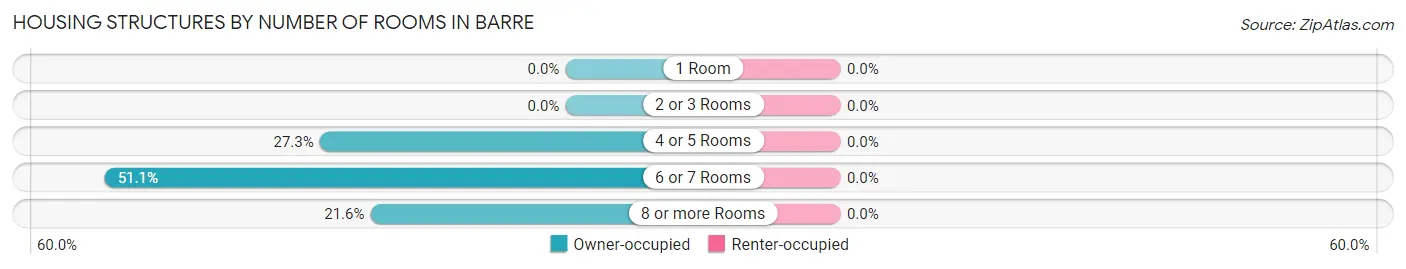
| Number of Rooms | Owner-occupied | Renter-occupied |
| 1 Room | 0 (0.0%) | 0 (0.0%) |
| 2 or 3 Rooms | 0 (0.0%) | 0 (0.0%) |
| 4 or 5 Rooms | 87 (27.3%) | 0 (0.0%) |
| 6 or 7 Rooms | 163 (51.1%) | 0 (0.0%) |
| 8 or more Rooms | 69 (21.6%) | 0 (0.0%) |
| Total | 319 (100.0%) | 0 (0.0%) |
Housing Structure by Heating Type in Barre
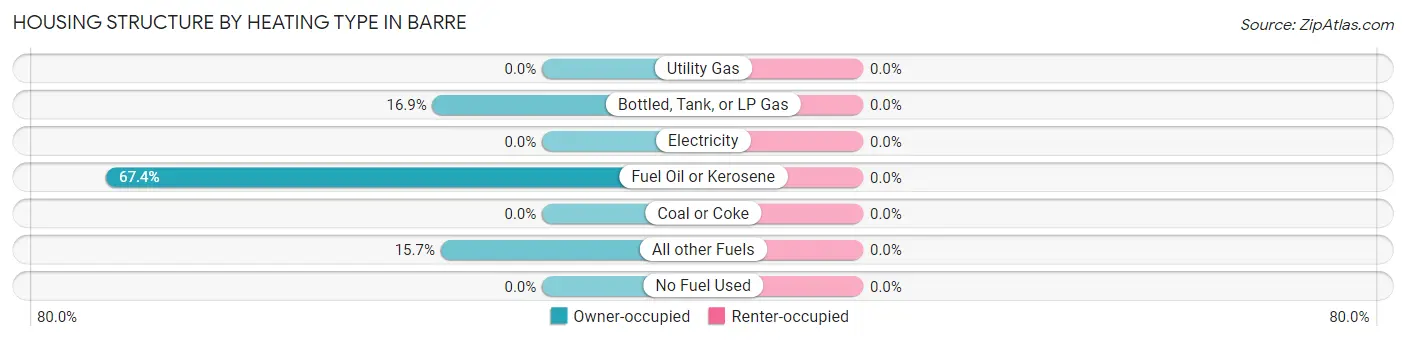
| Heating Type | Owner-occupied | Renter-occupied |
| Utility Gas | 0 (0.0%) | 0 (0.0%) |
| Bottled, Tank, or LP Gas | 54 (16.9%) | 0 (0.0%) |
| Electricity | 0 (0.0%) | 0 (0.0%) |
| Fuel Oil or Kerosene | 215 (67.4%) | 0 (0.0%) |
| Coal or Coke | 0 (0.0%) | 0 (0.0%) |
| All other Fuels | 50 (15.7%) | 0 (0.0%) |
| No Fuel Used | 0 (0.0%) | 0 (0.0%) |
| Total | 319 (100.0%) | 0 (0.0%) |
Household Vehicle Usage in Barre
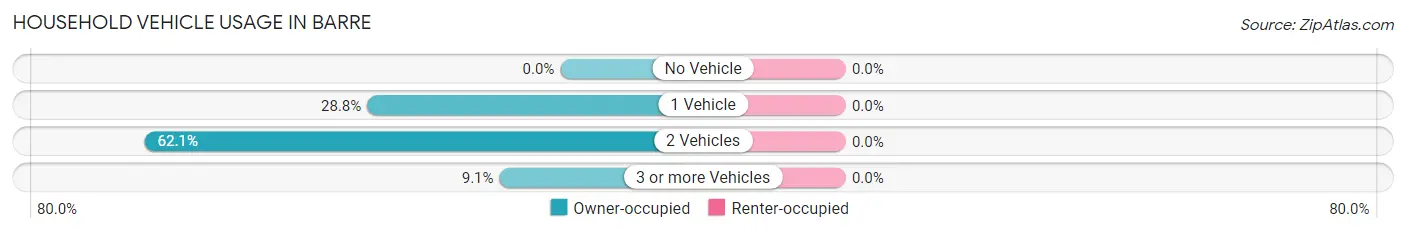
| Vehicles per Household | Owner-occupied | Renter-occupied |
| No Vehicle | 0 (0.0%) | 0 (0.0%) |
| 1 Vehicle | 92 (28.8%) | 0 (0.0%) |
| 2 Vehicles | 198 (62.1%) | 0 (0.0%) |
| 3 or more Vehicles | 29 (9.1%) | 0 (0.0%) |
| Total | 319 (100.0%) | 0 (0.0%) |
Real Estate & Mortgages in Barre
Real Estate and Mortgage Overview in Barre
| Characteristic | Without Mortgage | With Mortgage |
| Housing Units | 111 | 208 |
| Median Property Value | $282,800 | $285,000 |
| Median Household Income | $48,750 | $42 |
| Monthly Housing Costs | $694 | $0 |
| Real Estate Taxes | $2,731 | $0 |
Property Value by Mortgage Status in Barre
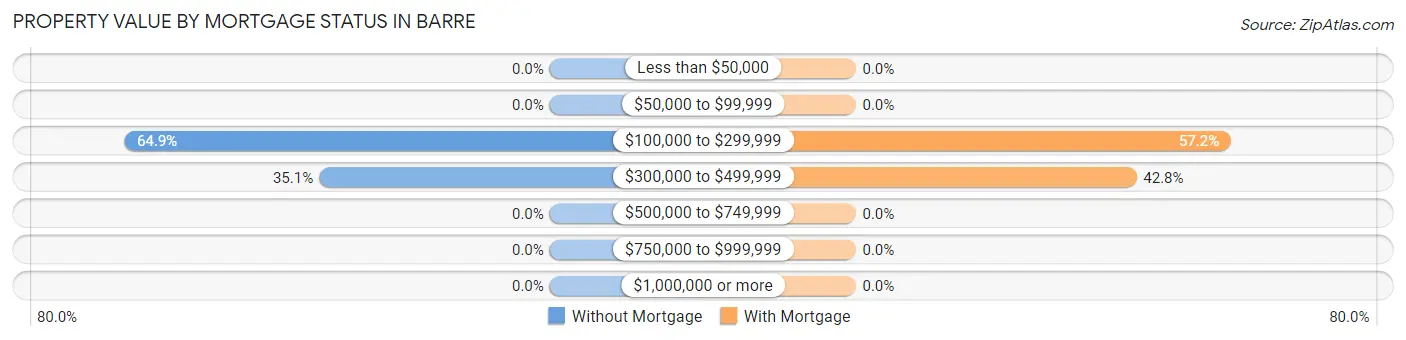
| Property Value | Without Mortgage | With Mortgage |
| Less than $50,000 | 0 (0.0%) | 0 (0.0%) |
| $50,000 to $99,999 | 0 (0.0%) | 0 (0.0%) |
| $100,000 to $299,999 | 72 (64.9%) | 119 (57.2%) |
| $300,000 to $499,999 | 39 (35.1%) | 89 (42.8%) |
| $500,000 to $749,999 | 0 (0.0%) | 0 (0.0%) |
| $750,000 to $999,999 | 0 (0.0%) | 0 (0.0%) |
| $1,000,000 or more | 0 (0.0%) | 0 (0.0%) |
| Total | 111 (100.0%) | 208 (100.0%) |
Household Income by Mortgage Status in Barre
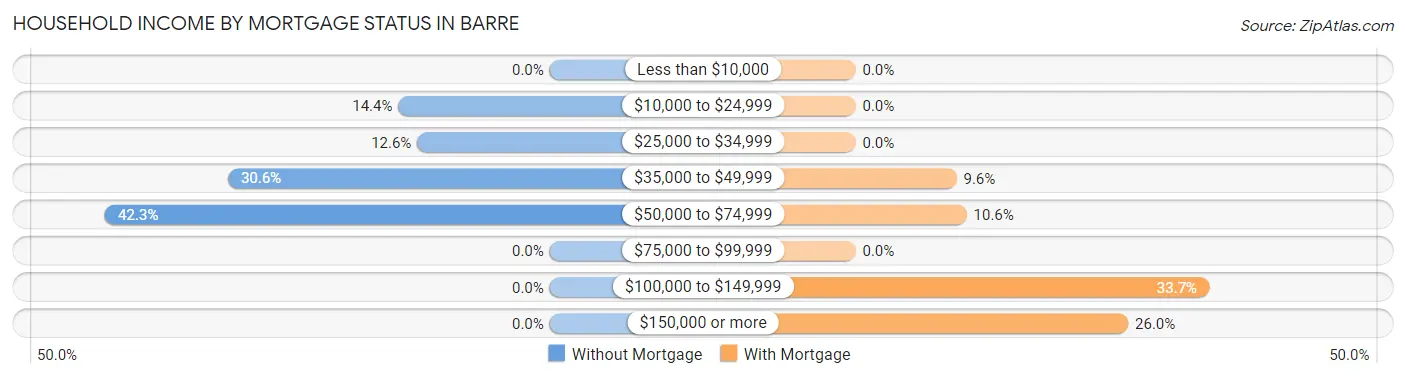
| Household Income | Without Mortgage | With Mortgage |
| Less than $10,000 | 0 (0.0%) | 0 (0.0%) |
| $10,000 to $24,999 | 16 (14.4%) | 0 (0.0%) |
| $25,000 to $34,999 | 14 (12.6%) | 0 (0.0%) |
| $35,000 to $49,999 | 34 (30.6%) | 20 (9.6%) |
| $50,000 to $74,999 | 47 (42.3%) | 22 (10.6%) |
| $75,000 to $99,999 | 0 (0.0%) | 0 (0.0%) |
| $100,000 to $149,999 | 0 (0.0%) | 70 (33.7%) |
| $150,000 or more | 0 (0.0%) | 54 (26.0%) |
| Total | 111 (100.0%) | 208 (100.0%) |
Property Value to Household Income Ratio in Barre
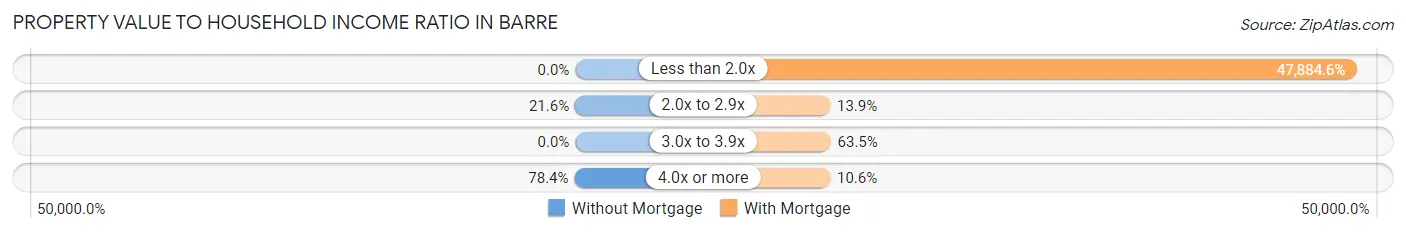
| Value-to-Income Ratio | Without Mortgage | With Mortgage |
| Less than 2.0x | 0 (0.0%) | 99,600 (47,884.6%) |
| 2.0x to 2.9x | 24 (21.6%) | 29 (13.9%) |
| 3.0x to 3.9x | 0 (0.0%) | 132 (63.5%) |
| 4.0x or more | 87 (78.4%) | 22 (10.6%) |
| Total | 111 (100.0%) | 208 (100.0%) |
Real Estate Taxes by Mortgage Status in Barre
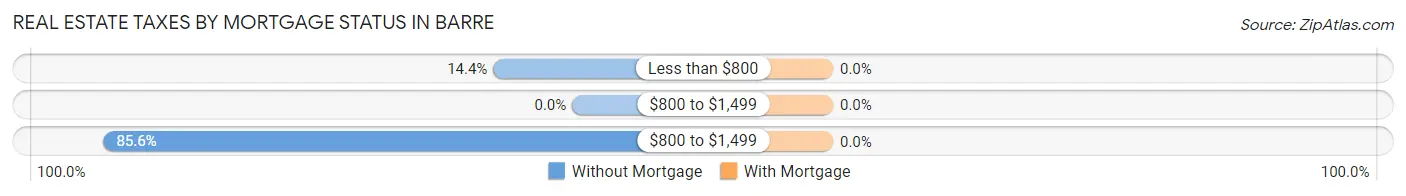
| Property Taxes | Without Mortgage | With Mortgage |
| Less than $800 | 16 (14.4%) | 0 (0.0%) |
| $800 to $1,499 | 0 (0.0%) | 0 (0.0%) |
| $800 to $1,499 | 95 (85.6%) | 0 (0.0%) |
| Total | 111 (100.0%) | 208 (100.0%) |
Health & Disability in Barre
Health Insurance Coverage by Age in Barre
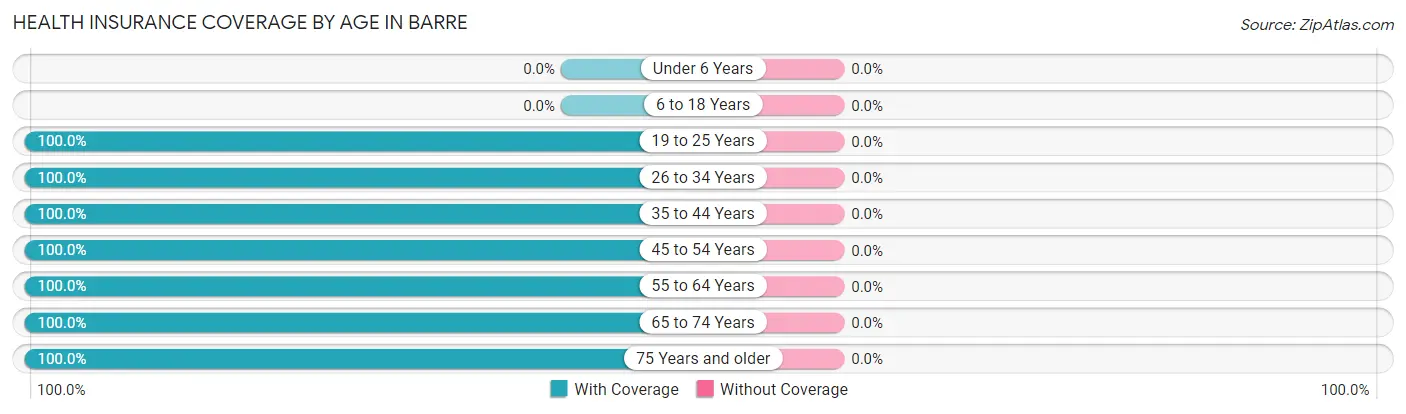
| Age Bracket | With Coverage | Without Coverage |
| Under 6 Years | 0 (0.0%) | 0 (0.0%) |
| 6 to 18 Years | 0 (0.0%) | 0 (0.0%) |
| 19 to 25 Years | 37 (100.0%) | 0 (0.0%) |
| 26 to 34 Years | 147 (100.0%) | 0 (0.0%) |
| 35 to 44 Years | 27 (100.0%) | 0 (0.0%) |
| 45 to 54 Years | 161 (100.0%) | 0 (0.0%) |
| 55 to 64 Years | 96 (100.0%) | 0 (0.0%) |
| 65 to 74 Years | 88 (100.0%) | 0 (0.0%) |
| 75 Years and older | 38 (100.0%) | 0 (0.0%) |
| Total | 594 (100.0%) | 0 (0.0%) |
Health Insurance Coverage by Citizenship Status in Barre
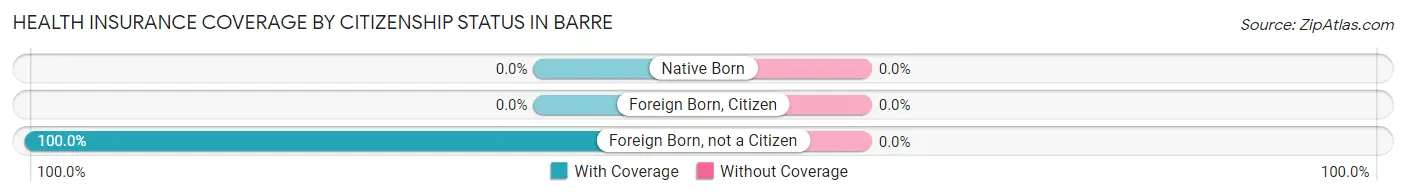
| Citizenship Status | With Coverage | Without Coverage |
| Native Born | 0 (0.0%) | 0 (0.0%) |
| Foreign Born, Citizen | 0 (0.0%) | 0 (0.0%) |
| Foreign Born, not a Citizen | 37 (100.0%) | 0 (0.0%) |
Health Insurance Coverage by Household Income in Barre
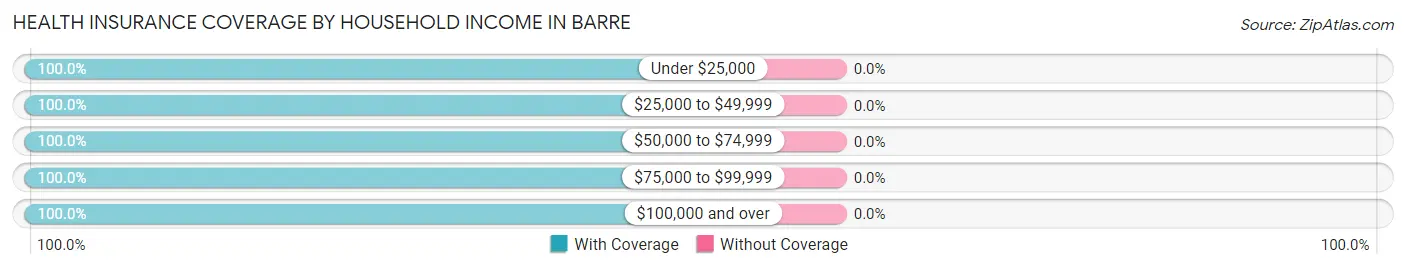
| Household Income | With Coverage | Without Coverage |
| Under $25,000 | 16 (100.0%) | 0 (0.0%) |
| $25,000 to $49,999 | 126 (100.0%) | 0 (0.0%) |
| $50,000 to $74,999 | 74 (100.0%) | 0 (0.0%) |
| $75,000 to $99,999 | 126 (100.0%) | 0 (0.0%) |
| $100,000 and over | 252 (100.0%) | 0 (0.0%) |
Public vs Private Health Insurance Coverage by Age in Barre
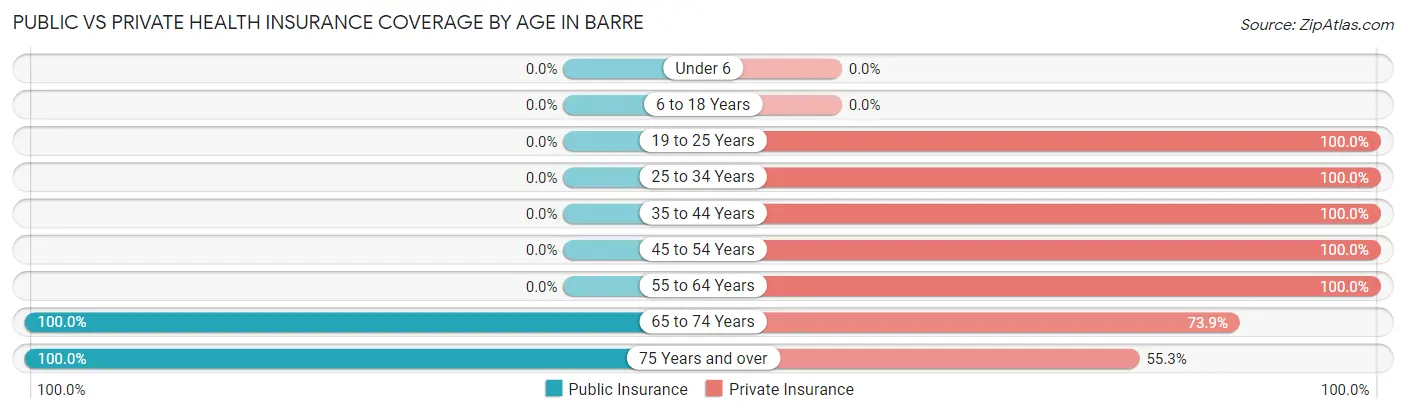
| Age Bracket | Public Insurance | Private Insurance |
| Under 6 | 0 (0.0%) | 0 (0.0%) |
| 6 to 18 Years | 0 (0.0%) | 0 (0.0%) |
| 19 to 25 Years | 0 (0.0%) | 37 (100.0%) |
| 25 to 34 Years | 0 (0.0%) | 147 (100.0%) |
| 35 to 44 Years | 0 (0.0%) | 27 (100.0%) |
| 45 to 54 Years | 0 (0.0%) | 161 (100.0%) |
| 55 to 64 Years | 0 (0.0%) | 96 (100.0%) |
| 65 to 74 Years | 88 (100.0%) | 65 (73.9%) |
| 75 Years and over | 38 (100.0%) | 21 (55.3%) |
| Total | 126 (21.2%) | 554 (93.3%) |
Disability Status by Sex by Age in Barre
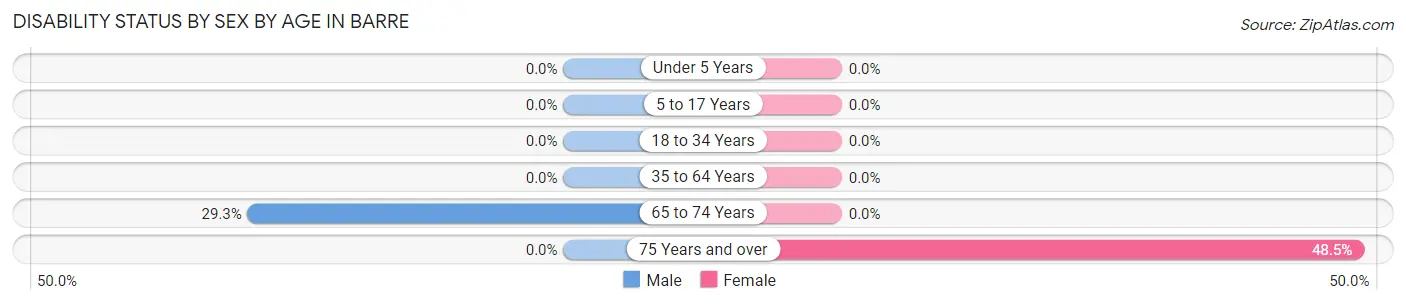
| Age Bracket | Male | Female |
| Under 5 Years | 0 (0.0%) | 0 (0.0%) |
| 5 to 17 Years | 0 (0.0%) | 0 (0.0%) |
| 18 to 34 Years | 0 (0.0%) | 0 (0.0%) |
| 35 to 64 Years | 0 (0.0%) | 0 (0.0%) |
| 65 to 74 Years | 17 (29.3%) | 0 (0.0%) |
| 75 Years and over | 0 (0.0%) | 16 (48.5%) |
Disability Class by Sex by Age in Barre
Disability Class: Hearing Difficulty
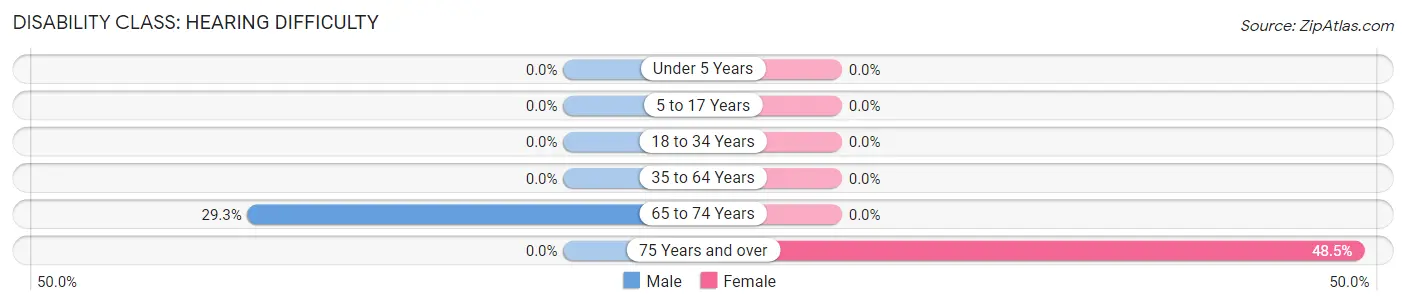
| Age Bracket | Male | Female |
| Under 5 Years | 0 (0.0%) | 0 (0.0%) |
| 5 to 17 Years | 0 (0.0%) | 0 (0.0%) |
| 18 to 34 Years | 0 (0.0%) | 0 (0.0%) |
| 35 to 64 Years | 0 (0.0%) | 0 (0.0%) |
| 65 to 74 Years | 17 (29.3%) | 0 (0.0%) |
| 75 Years and over | 0 (0.0%) | 16 (48.5%) |
Disability Class: Vision Difficulty
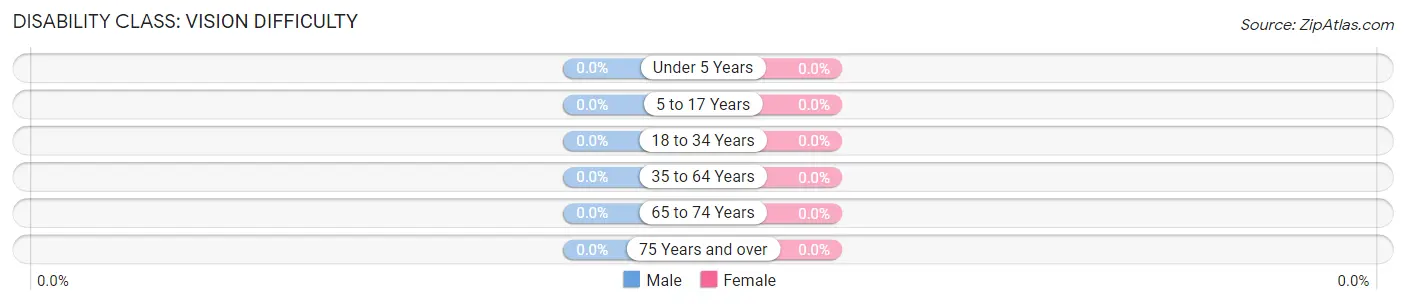
| Age Bracket | Male | Female |
| Under 5 Years | 0 (0.0%) | 0 (0.0%) |
| 5 to 17 Years | 0 (0.0%) | 0 (0.0%) |
| 18 to 34 Years | 0 (0.0%) | 0 (0.0%) |
| 35 to 64 Years | 0 (0.0%) | 0 (0.0%) |
| 65 to 74 Years | 0 (0.0%) | 0 (0.0%) |
| 75 Years and over | 0 (0.0%) | 0 (0.0%) |
Disability Class: Cognitive Difficulty
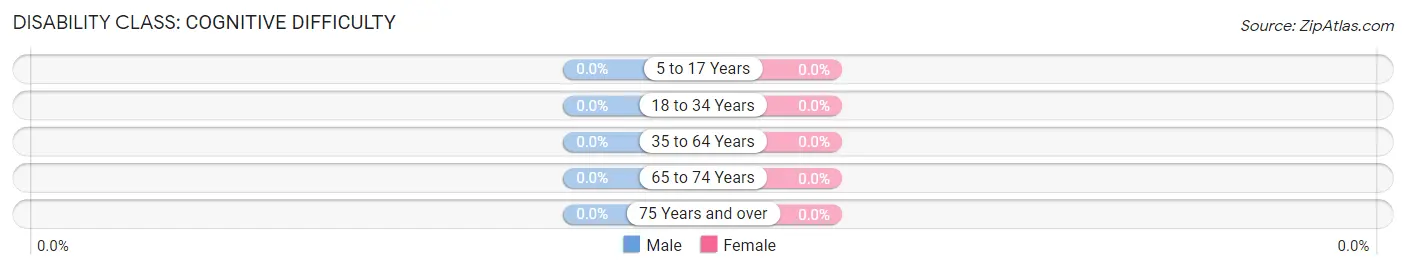
| Age Bracket | Male | Female |
| 5 to 17 Years | 0 (0.0%) | 0 (0.0%) |
| 18 to 34 Years | 0 (0.0%) | 0 (0.0%) |
| 35 to 64 Years | 0 (0.0%) | 0 (0.0%) |
| 65 to 74 Years | 0 (0.0%) | 0 (0.0%) |
| 75 Years and over | 0 (0.0%) | 0 (0.0%) |
Disability Class: Ambulatory Difficulty
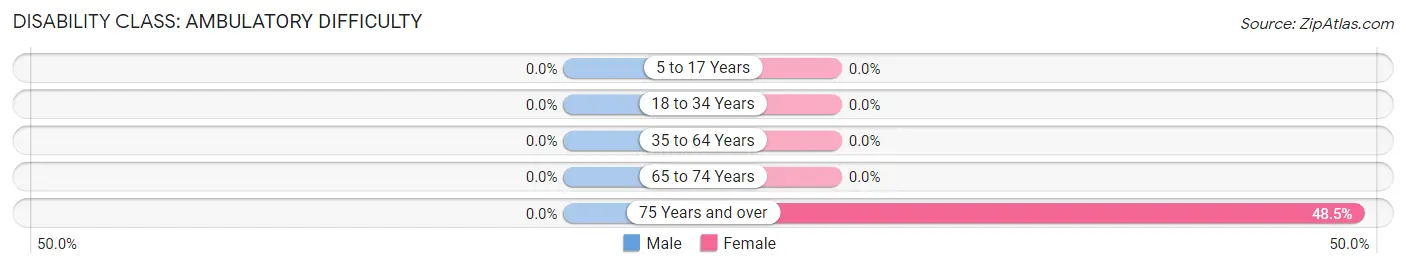
| Age Bracket | Male | Female |
| 5 to 17 Years | 0 (0.0%) | 0 (0.0%) |
| 18 to 34 Years | 0 (0.0%) | 0 (0.0%) |
| 35 to 64 Years | 0 (0.0%) | 0 (0.0%) |
| 65 to 74 Years | 0 (0.0%) | 0 (0.0%) |
| 75 Years and over | 0 (0.0%) | 16 (48.5%) |
Disability Class: Self-Care Difficulty
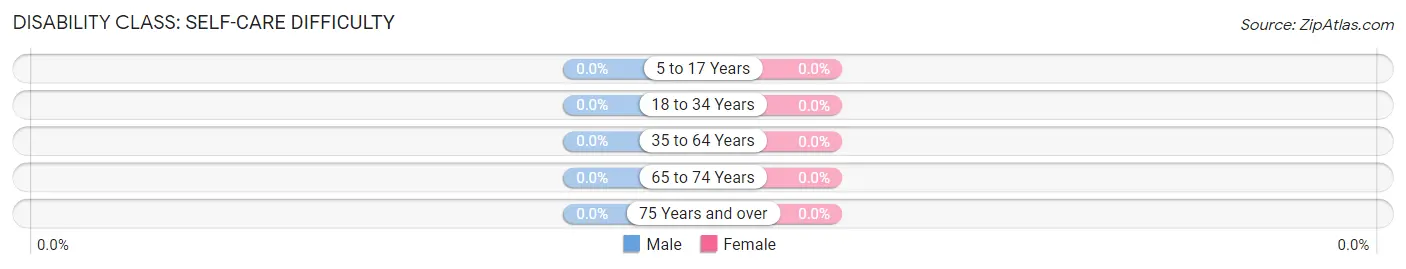
| Age Bracket | Male | Female |
| 5 to 17 Years | 0 (0.0%) | 0 (0.0%) |
| 18 to 34 Years | 0 (0.0%) | 0 (0.0%) |
| 35 to 64 Years | 0 (0.0%) | 0 (0.0%) |
| 65 to 74 Years | 0 (0.0%) | 0 (0.0%) |
| 75 Years and over | 0 (0.0%) | 0 (0.0%) |
Technology Access in Barre
Computing Device Access in Barre
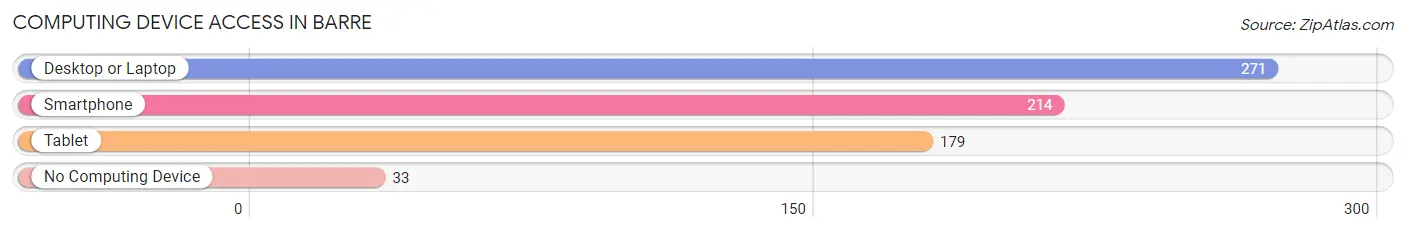
| Device Type | # Households | % Households |
| Desktop or Laptop | 271 | 85.0% |
| Smartphone | 214 | 67.1% |
| Tablet | 179 | 56.1% |
| No Computing Device | 33 | 10.3% |
| Total | 319 | 100.0% |
Internet Access in Barre
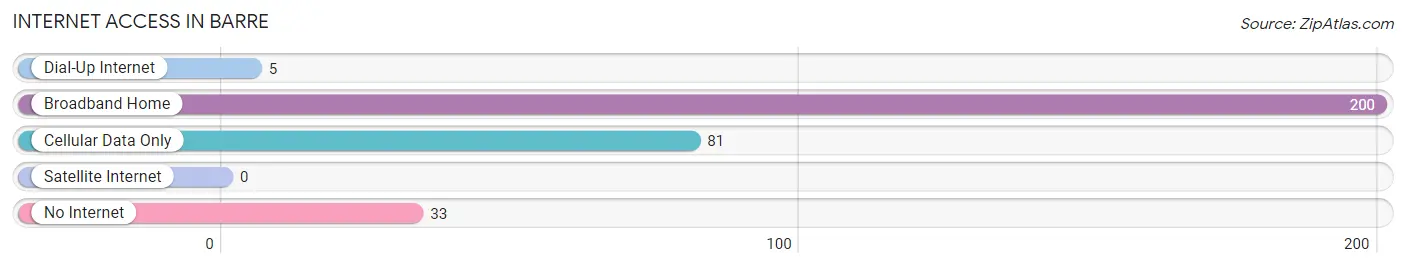
| Internet Type | # Households | % Households |
| Dial-Up Internet | 5 | 1.6% |
| Broadband Home | 200 | 62.7% |
| Cellular Data Only | 81 | 25.4% |
| Satellite Internet | 0 | 0.0% |
| No Internet | 33 | 10.3% |
| Total | 319 | 100.0% |
Barre Summary
Wilkes-Barre is a city located in Luzerne County, Pennsylvania, United States. It is the county seat of Luzerne County and the principal city of the Wilkes-Barre, PA Metropolitan Statistical Area. The population of Wilkes-Barre was 41,498 at the 2010 census, making it the 11th largest city in Pennsylvania.
History
Wilkes-Barre was founded in 1769 and incorporated as a borough in 1806. It was named after John Wilkes and Isaac Barré, two British members of Parliament who supported colonial America during the American Revolution. Wilkes-Barre was a major center of coal mining and anthracite production during the 19th century. The city was the site of the Wyoming Massacre, an event in the Revolutionary War in which British soldiers and local Loyalists killed more than 300 Patriots.
Geography
Wilkes-Barre is located in northeastern Pennsylvania at the confluence of the Susquehanna and Lackawanna rivers. It is situated in the Wyoming Valley, a large valley that is part of the Ridge-and-Valley Appalachians. The city is located in the Pocono Mountains region of the Appalachian Mountains. The city is located at an elevation of approximately 500 feet (152 m) above sea level.
Economy
Wilkes-Barre is a major center of commerce and industry in northeastern Pennsylvania. The city is home to several large employers, including Geisinger Health System, Wilkes University, and the Wilkes-Barre/Scranton International Airport. The city is also home to several major manufacturing companies, including Procter & Gamble, Frito-Lay, and Nestle.
Demographics
As of the 2010 census, the population of Wilkes-Barre was 41,498. The racial makeup of the city was 87.2% White, 8.3% African American, 0.3% Native American, 1.2% Asian, 0.1% Pacific Islander, 1.2% from other races, and 1.8% from two or more races. Hispanic or Latino of any race were 4.2% of the population.
The median income for a household in Wilkes-Barre was $35,945, and the median income for a family was $45,919. The per capita income for the city was $19,945. About 15.2% of families and 18.7% of the population were below the poverty line, including 28.2% of those under age 18 and 10.2% of those age 65 or over.
Common Questions
What is Per Capita Income in Barre?
Per Capita income in Barre is $48,935.
What is the Median Family Income in Barre?
Median Family Income in Barre is $99,500.
What is the Median Household income in Barre?
Median Household Income in Barre is $75,813.
What is Income or Wage Gap in Barre?
Income or Wage Gap in Barre is 31.3%.
Women in Barre earn 68.7 cents for every dollar earned by a man.
What is Inequality or Gini Index in Barre?
Inequality or Gini Index in Barre is 0.34.
What is the Total Population of Barre?
Total Population of Barre is 594.
What is the Total Male Population of Barre?
Total Male Population of Barre is 277.
What is the Total Female Population of Barre?
Total Female Population of Barre is 317.
What is the Ratio of Males per 100 Females in Barre?
There are 87.38 Males per 100 Females in Barre.
What is the Ratio of Females per 100 Males in Barre?
There are 114.44 Females per 100 Males in Barre.
What is the Median Population Age in Barre?
Median Population Age in Barre is 53.1 Years.
What is the Average Family Size in Barre
Average Family Size in Barre is 2.2 People.
What is the Average Household Size in Barre
Average Household Size in Barre is 1.9 People.
How Large is the Labor Force in Barre?
There are 400 People in the Labor Forcein in Barre.
What is the Percentage of People in the Labor Force in Barre?
67.3% of People are in the Labor Force in Barre.
What is the Unemployment Rate in Barre?
Unemployment Rate in Barre is 6.8%.