Shelburne Falls, MA Map & Demographics
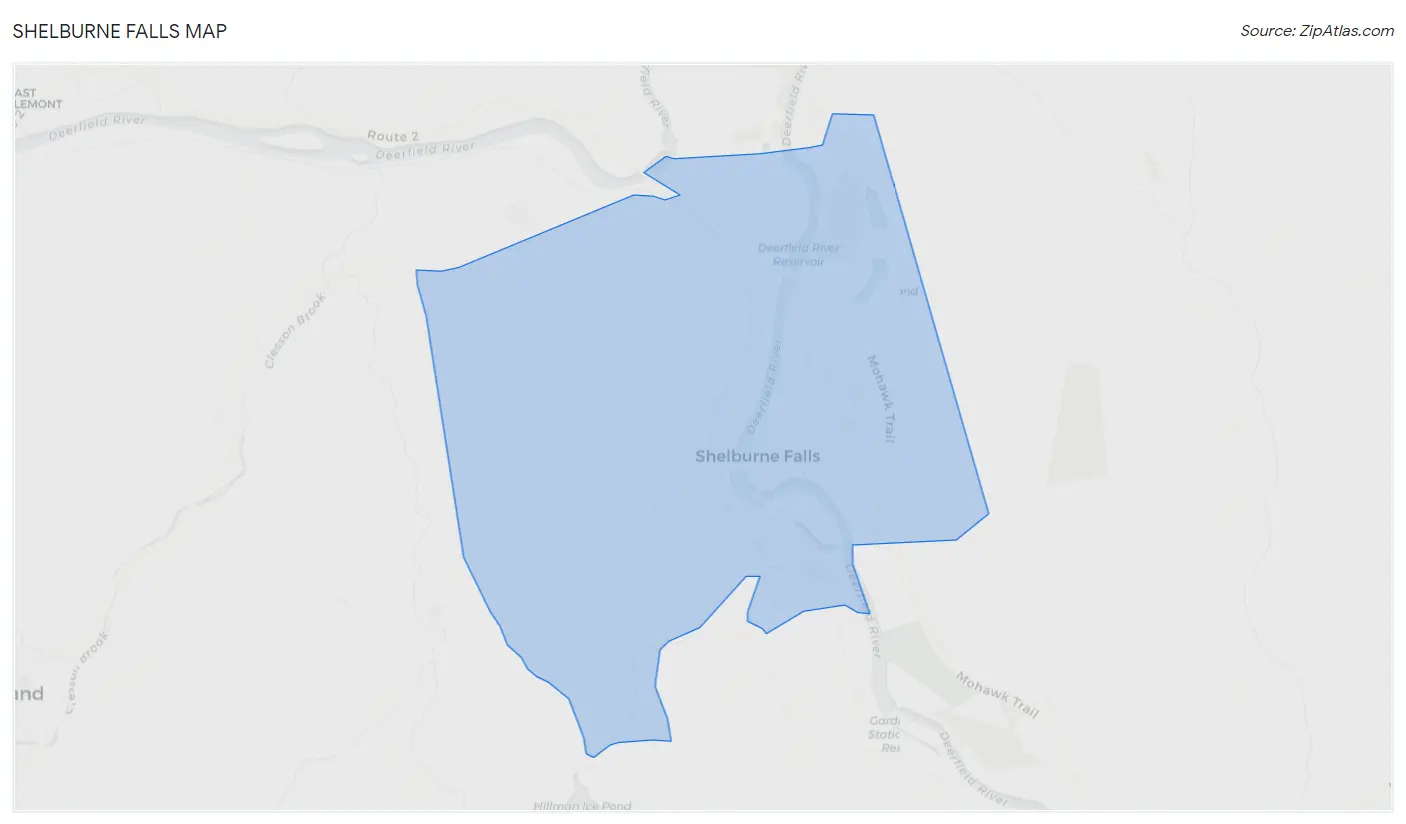
Shelburne Falls Map
Shelburne Falls Overview
$35,677
PER CAPITA INCOME
$79,934
AVG FAMILY INCOME
$54,250
AVG HOUSEHOLD INCOME
18.1%
WAGE / INCOME GAP [ % ]
81.9¢/ $1
WAGE / INCOME GAP [ $ ]
0.45
INEQUALITY / GINI INDEX
1,699
TOTAL POPULATION
836
MALE POPULATION
863
FEMALE POPULATION
96.87
MALES / 100 FEMALES
103.23
FEMALES / 100 MALES
50.0
MEDIAN AGE
2.7
AVG FAMILY SIZE
2.0
AVG HOUSEHOLD SIZE
869
LABOR FORCE [ PEOPLE ]
60.6%
PERCENT IN LABOR FORCE
7.1%
UNEMPLOYMENT RATE
Shelburne Falls Zip Codes
Shelburne Falls Area Codes
Income in Shelburne Falls
Income Overview in Shelburne Falls
Per Capita Income in Shelburne Falls is $35,677, while median incomes of families and households are $79,934 and $54,250 respectively.
| Characteristic | Number | Measure |
| Per Capita Income | 1,699 | $35,677 |
| Median Family Income | 433 | $79,934 |
| Mean Family Income | 433 | $91,715 |
| Median Household Income | 810 | $54,250 |
| Mean Household Income | 810 | $74,200 |
| Income Deficit | 433 | $0 |
| Wage / Income Gap (%) | 1,699 | 18.14% |
| Wage / Income Gap ($) | 1,699 | 81.86¢ per $1 |
| Gini / Inequality Index | 1,699 | 0.45 |
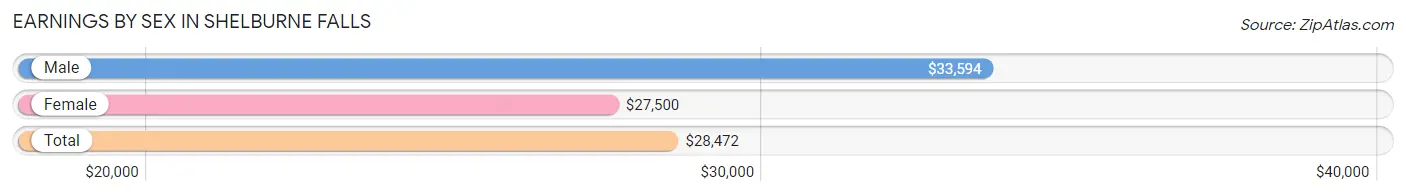
Earnings by Sex in Shelburne Falls
Average Earnings in Shelburne Falls are $28,472, $33,594 for men and $27,500 for women, a difference of 18.1%.
| Sex | Number | Average Earnings |
| Male | 441 (50.2%) | $33,594 |
| Female | 438 (49.8%) | $27,500 |
| Total | 879 (100.0%) | $28,472 |
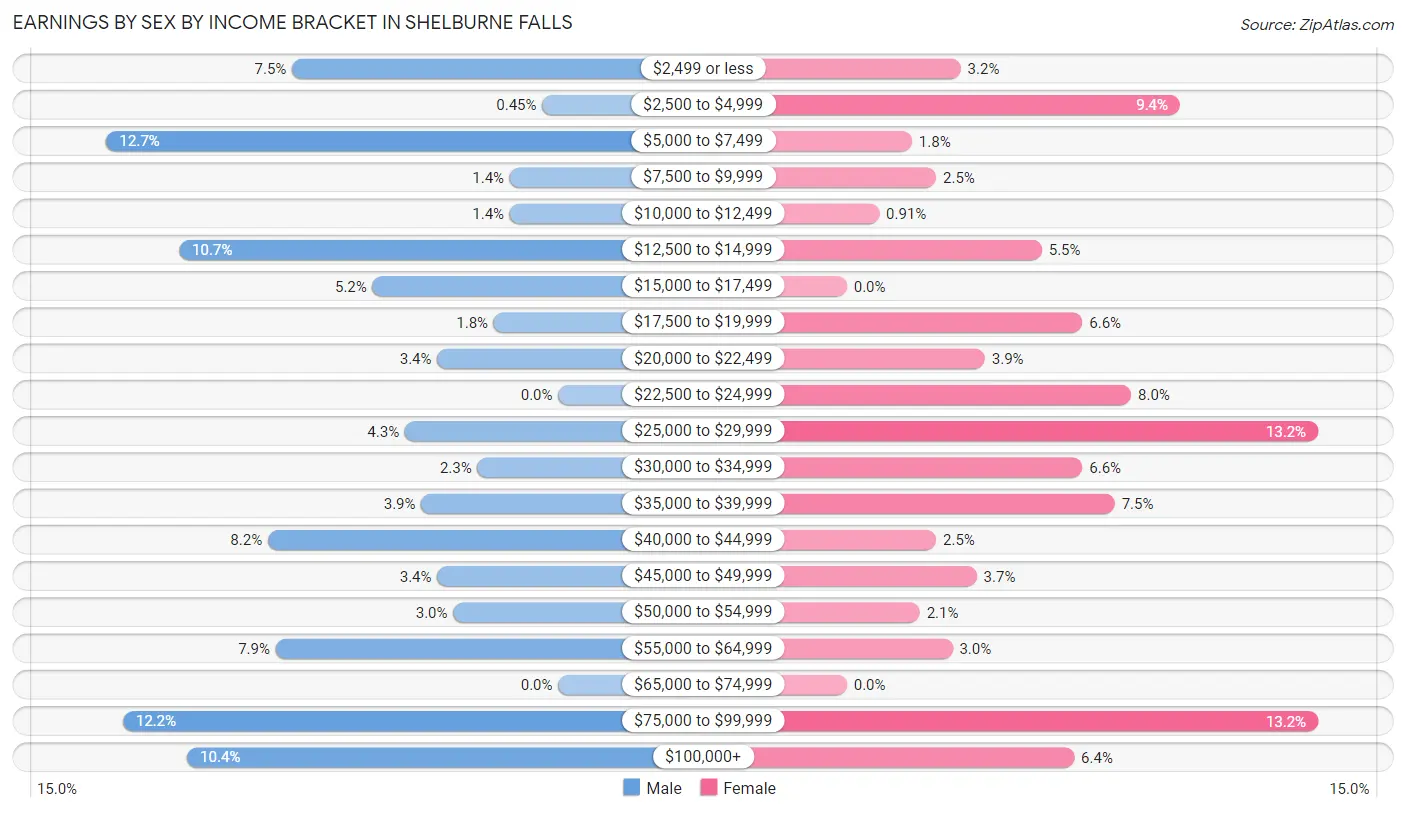
Earnings by Sex by Income Bracket in Shelburne Falls
The most common earnings brackets in Shelburne Falls are $5,000 to $7,499 for men (56 | 12.7%) and $25,000 to $29,999 for women (58 | 13.2%).
| Income | Male | Female |
| $2,499 or less | 33 (7.5%) | 14 (3.2%) |
| $2,500 to $4,999 | 2 (0.4%) | 41 (9.4%) |
| $5,000 to $7,499 | 56 (12.7%) | 8 (1.8%) |
| $7,500 to $9,999 | 6 (1.4%) | 11 (2.5%) |
| $10,000 to $12,499 | 6 (1.4%) | 4 (0.9%) |
| $12,500 to $14,999 | 47 (10.7%) | 24 (5.5%) |
| $15,000 to $17,499 | 23 (5.2%) | 0 (0.0%) |
| $17,500 to $19,999 | 8 (1.8%) | 29 (6.6%) |
| $20,000 to $22,499 | 15 (3.4%) | 17 (3.9%) |
| $22,500 to $24,999 | 0 (0.0%) | 35 (8.0%) |
| $25,000 to $29,999 | 19 (4.3%) | 58 (13.2%) |
| $30,000 to $34,999 | 10 (2.3%) | 29 (6.6%) |
| $35,000 to $39,999 | 17 (3.8%) | 33 (7.5%) |
| $40,000 to $44,999 | 36 (8.2%) | 11 (2.5%) |
| $45,000 to $49,999 | 15 (3.4%) | 16 (3.6%) |
| $50,000 to $54,999 | 13 (2.9%) | 9 (2.1%) |
| $55,000 to $64,999 | 35 (7.9%) | 13 (3.0%) |
| $65,000 to $74,999 | 0 (0.0%) | 0 (0.0%) |
| $75,000 to $99,999 | 54 (12.2%) | 58 (13.2%) |
| $100,000+ | 46 (10.4%) | 28 (6.4%) |
| Total | 441 (100.0%) | 438 (100.0%) |
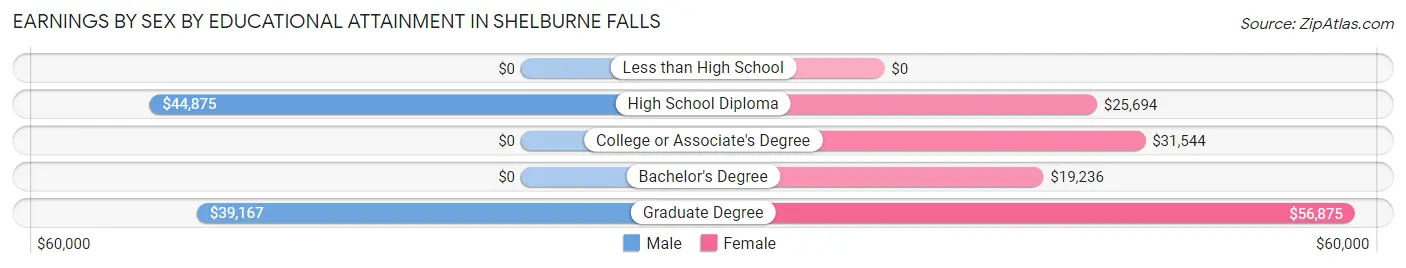
Earnings by Sex by Educational Attainment in Shelburne Falls
Average earnings in Shelburne Falls are $39,615 for men and $28,864 for women, a difference of 27.1%. Men with an educational attainment of high school diploma enjoy the highest average annual earnings of $44,875, while those with graduate degree education earn the least with $39,167. Women with an educational attainment of graduate degree earn the most with the average annual earnings of $56,875, while those with bachelor's degree education have the smallest earnings of $19,236.
| Educational Attainment | Male Income | Female Income |
| Less than High School | - | - |
| High School Diploma | $44,875 | $25,694 |
| College or Associate's Degree | - | - |
| Bachelor's Degree | - | - |
| Graduate Degree | $39,167 | $56,875 |
| Total | $39,615 | $28,864 |
Family Income in Shelburne Falls
Family Income Brackets in Shelburne Falls
According to the Shelburne Falls family income data, there are 117 families falling into the $75,000 to $99,999 income range, which is the most common income bracket and makes up 27.0% of all families. Conversely, the $25,000 to $34,999 income bracket is the least frequent group with only 15 families (3.5%) belonging to this category.
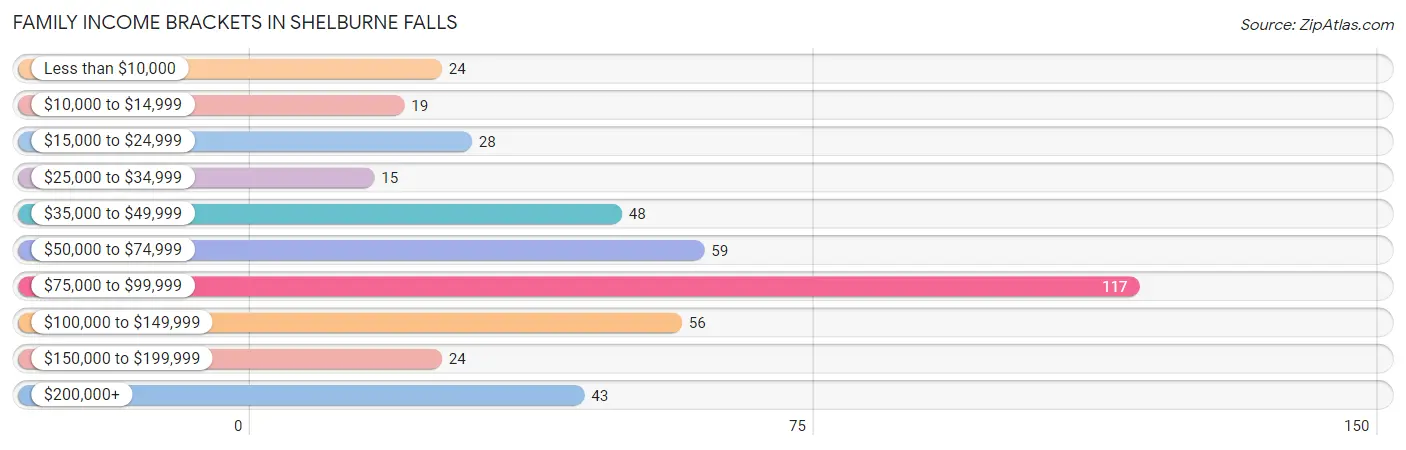
| Income Bracket | # Families | % Families |
| Less than $10,000 | 24 | 5.5% |
| $10,000 to $14,999 | 19 | 4.4% |
| $15,000 to $24,999 | 28 | 6.5% |
| $25,000 to $34,999 | 15 | 3.5% |
| $35,000 to $49,999 | 48 | 11.1% |
| $50,000 to $74,999 | 59 | 13.6% |
| $75,000 to $99,999 | 117 | 27.0% |
| $100,000 to $149,999 | 56 | 12.9% |
| $150,000 to $199,999 | 24 | 5.5% |
| $200,000+ | 43 | 9.9% |
Family Income by Famaliy Size in Shelburne Falls
3-person families (183 | 42.3%) account for the highest median family income in Shelburne Falls with $89,219 per family, while 2-person families (185 | 42.7%) have the highest median income of $33,282 per family member.
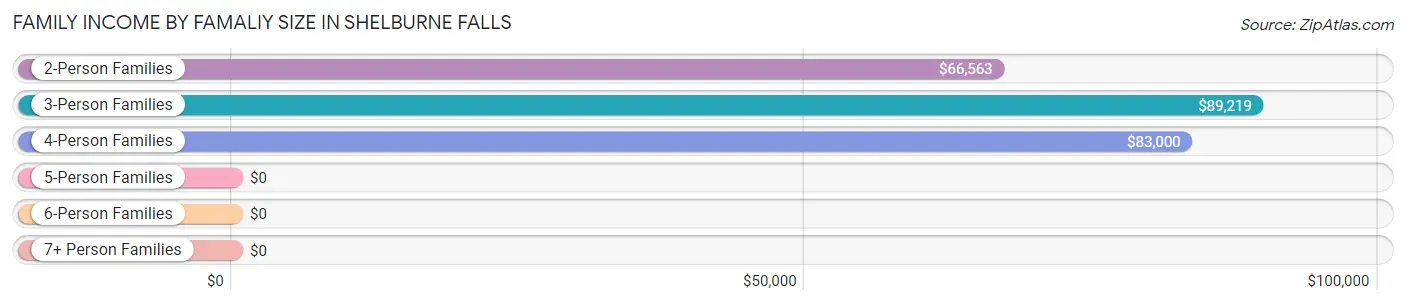
| Income Bracket | # Families | Median Income |
| 2-Person Families | 185 (42.7%) | $66,563 |
| 3-Person Families | 183 (42.3%) | $89,219 |
| 4-Person Families | 56 (12.9%) | $83,000 |
| 5-Person Families | 5 (1.1%) | $0 |
| 6-Person Families | 0 (0.0%) | $0 |
| 7+ Person Families | 4 (0.9%) | $0 |
| Total | 433 (100.0%) | $79,934 |
Family Income by Number of Earners in Shelburne Falls
The median family income in Shelburne Falls is $79,934, with families comprising 3+ earners (31) having the highest median family income of $95,446, while families with no earners (68) have the lowest median family income of $48,947, accounting for 7.2% and 15.7% of families, respectively.
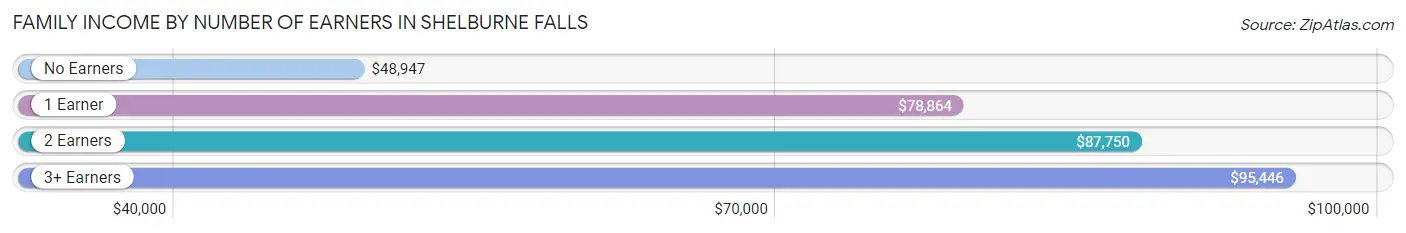
| Number of Earners | # Families | Median Income |
| No Earners | 68 (15.7%) | $48,947 |
| 1 Earner | 186 (43.0%) | $78,864 |
| 2 Earners | 148 (34.2%) | $87,750 |
| 3+ Earners | 31 (7.2%) | $95,446 |
| Total | 433 (100.0%) | $79,934 |
Household Income in Shelburne Falls
Household Income Brackets in Shelburne Falls
With 140 households falling in the category, the $75,000 to $99,999 income range is the most frequent in Shelburne Falls, accounting for 17.3% of all households. In contrast, only 28 households (3.5%) fall into the $150,000 to $199,999 income bracket, making it the least populous group.
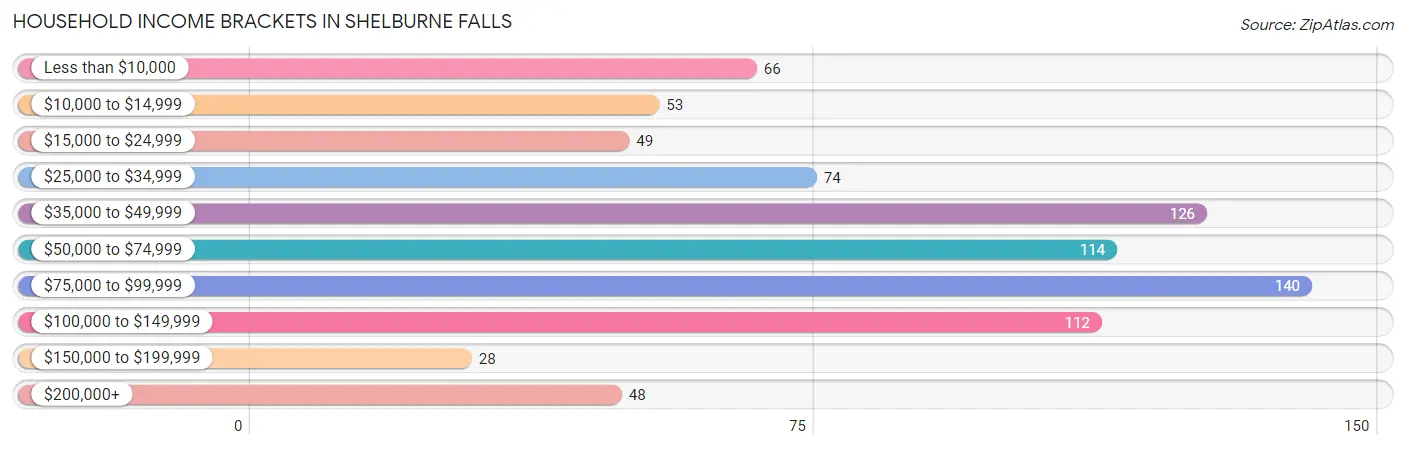
| Income Bracket | # Households | % Households |
| Less than $10,000 | 66 | 8.1% |
| $10,000 to $14,999 | 53 | 6.5% |
| $15,000 to $24,999 | 49 | 6.0% |
| $25,000 to $34,999 | 74 | 9.1% |
| $35,000 to $49,999 | 126 | 15.6% |
| $50,000 to $74,999 | 114 | 14.1% |
| $75,000 to $99,999 | 140 | 17.3% |
| $100,000 to $149,999 | 112 | 13.8% |
| $150,000 to $199,999 | 28 | 3.5% |
| $200,000+ | 48 | 5.9% |
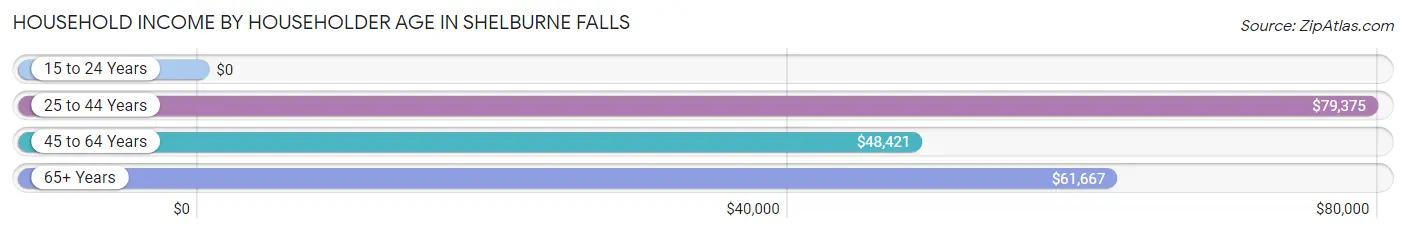
Household Income by Householder Age in Shelburne Falls
The median household income in Shelburne Falls is $54,250, with the highest median household income of $79,375 found in the 25 to 44 years age bracket for the primary householder. A total of 176 households (21.7%) fall into this category.
| Income Bracket | # Households | Median Income |
| 15 to 24 Years | 0 (0.0%) | $0 |
| 25 to 44 Years | 176 (21.7%) | $79,375 |
| 45 to 64 Years | 322 (39.8%) | $48,421 |
| 65+ Years | 312 (38.5%) | $61,667 |
| Total | 810 (100.0%) | $54,250 |
Poverty in Shelburne Falls
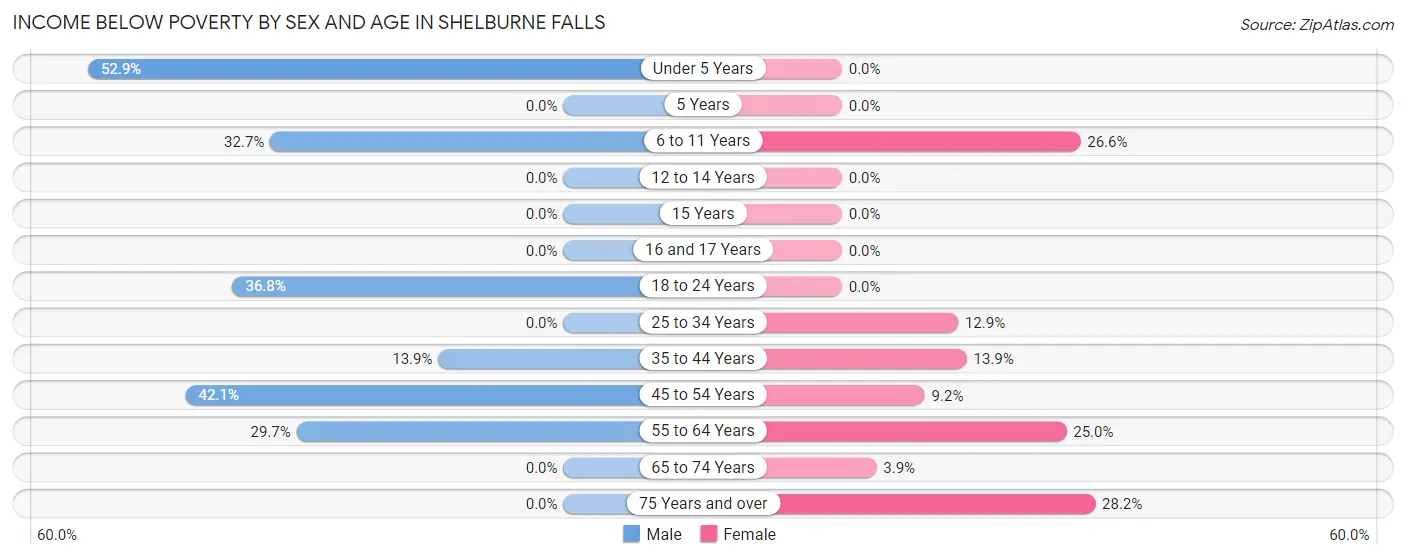
Income Below Poverty by Sex and Age in Shelburne Falls
With 18.7% poverty level for males and 14.7% for females among the residents of Shelburne Falls, under 5 year old males and 75 year old and over females are the most vulnerable to poverty, with 9 males (52.9%) and 33 females (28.2%) in their respective age groups living below the poverty level.
| Age Bracket | Male | Female |
| Under 5 Years | 9 (52.9%) | 0 (0.0%) |
| 5 Years | 0 (0.0%) | 0 (0.0%) |
| 6 to 11 Years | 16 (32.7%) | 17 (26.6%) |
| 12 to 14 Years | 0 (0.0%) | 0 (0.0%) |
| 15 Years | 0 (0.0%) | 0 (0.0%) |
| 16 and 17 Years | 0 (0.0%) | 0 (0.0%) |
| 18 to 24 Years | 28 (36.8%) | 0 (0.0%) |
| 25 to 34 Years | 0 (0.0%) | 11 (12.9%) |
| 35 to 44 Years | 17 (13.9%) | 10 (13.9%) |
| 45 to 54 Years | 45 (42.1%) | 12 (9.2%) |
| 55 to 64 Years | 41 (29.7%) | 39 (25.0%) |
| 65 to 74 Years | 0 (0.0%) | 5 (3.8%) |
| 75 Years and over | 0 (0.0%) | 33 (28.2%) |
| Total | 156 (18.7%) | 127 (14.7%) |
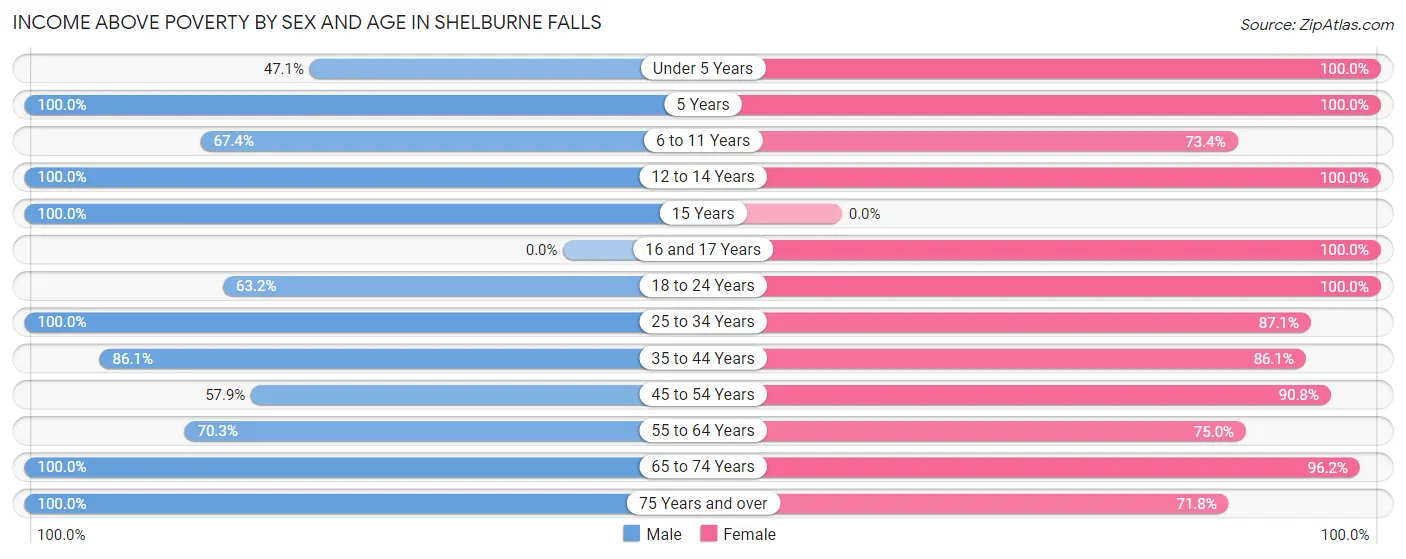
Income Above Poverty by Sex and Age in Shelburne Falls
According to the poverty statistics in Shelburne Falls, males aged 5 years and females aged under 5 years are the age groups that are most secure financially, with 100.0% of males and 100.0% of females in these age groups living above the poverty line.
| Age Bracket | Male | Female |
| Under 5 Years | 8 (47.1%) | 32 (100.0%) |
| 5 Years | 28 (100.0%) | 5 (100.0%) |
| 6 to 11 Years | 33 (67.3%) | 47 (73.4%) |
| 12 to 14 Years | 15 (100.0%) | 29 (100.0%) |
| 15 Years | 26 (100.0%) | 0 (0.0%) |
| 16 and 17 Years | 0 (0.0%) | 19 (100.0%) |
| 18 to 24 Years | 48 (63.2%) | 24 (100.0%) |
| 25 to 34 Years | 54 (100.0%) | 74 (87.1%) |
| 35 to 44 Years | 105 (86.1%) | 62 (86.1%) |
| 45 to 54 Years | 62 (57.9%) | 118 (90.8%) |
| 55 to 64 Years | 97 (70.3%) | 117 (75.0%) |
| 65 to 74 Years | 157 (100.0%) | 125 (96.2%) |
| 75 Years and over | 47 (100.0%) | 84 (71.8%) |
| Total | 680 (81.3%) | 736 (85.3%) |
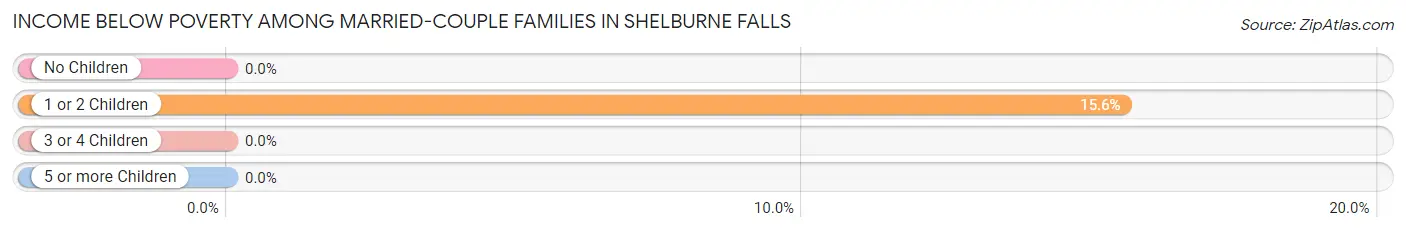
Income Below Poverty Among Married-Couple Families in Shelburne Falls
The poverty statistics for married-couple families in Shelburne Falls show that 6.4% or 19 of the total 298 families live below the poverty line. Families with 1 or 2 children have the highest poverty rate of 15.6%, comprising of 19 families. On the other hand, families with no children have the lowest poverty rate of 0.0%, which includes 0 families.
| Children | Above Poverty | Below Poverty |
| No Children | 172 (100.0%) | 0 (0.0%) |
| 1 or 2 Children | 103 (84.4%) | 19 (15.6%) |
| 3 or 4 Children | 0 (0.0%) | 0 (0.0%) |
| 5 or more Children | 4 (100.0%) | 0 (0.0%) |
| Total | 279 (93.6%) | 19 (6.4%) |
Income Below Poverty Among Single-Parent Households in Shelburne Falls
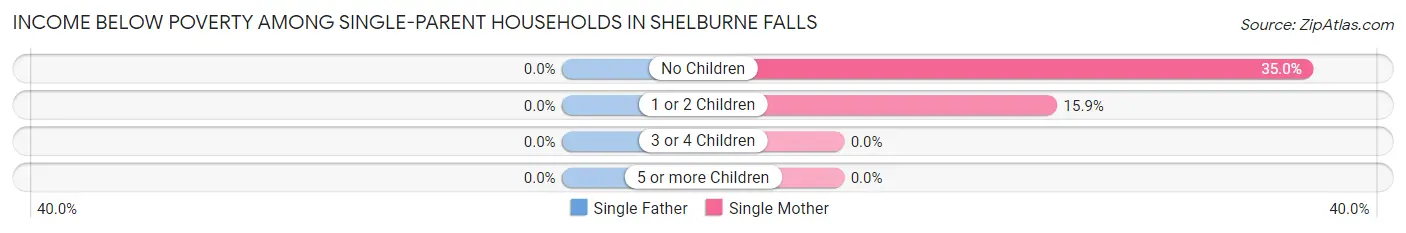
| Children | Single Father | Single Mother |
| No Children | 0 (0.0%) | 14 (35.0%) |
| 1 or 2 Children | 0 (0.0%) | 10 (15.9%) |
| 3 or 4 Children | 0 (0.0%) | 0 (0.0%) |
| 5 or more Children | 0 (0.0%) | 0 (0.0%) |
| Total | 0 (0.0%) | 24 (23.3%) |
Income Below Poverty Among Married-Couple vs Single-Parent Households in Shelburne Falls
The poverty data for Shelburne Falls shows that 19 of the married-couple family households (6.4%) and 24 of the single-parent households (17.8%) are living below the poverty level. Within the married-couple family households, those with 1 or 2 children have the highest poverty rate, with 19 households (15.6%) falling below the poverty line. Among the single-parent households, those with no children have the highest poverty rate, with 14 household (35.0%) living below poverty.
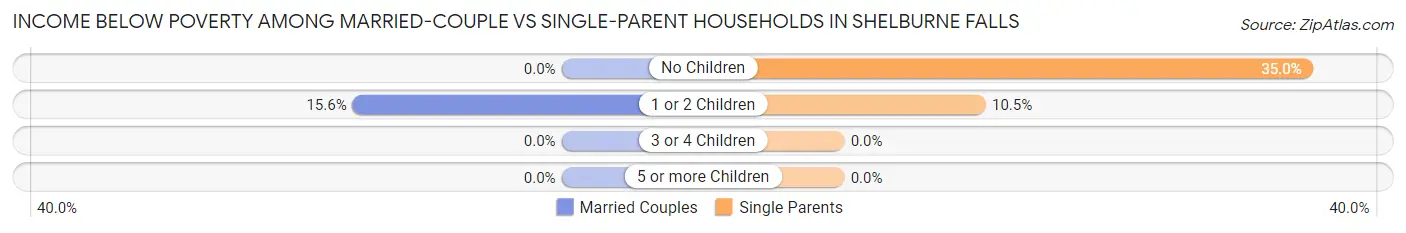
| Children | Married-Couple Families | Single-Parent Households |
| No Children | 0 (0.0%) | 14 (35.0%) |
| 1 or 2 Children | 19 (15.6%) | 10 (10.5%) |
| 3 or 4 Children | 0 (0.0%) | 0 (0.0%) |
| 5 or more Children | 0 (0.0%) | 0 (0.0%) |
| Total | 19 (6.4%) | 24 (17.8%) |
Race in Shelburne Falls
The most populous races in Shelburne Falls are White / Caucasian (1,506 | 88.6%), Two or more Races (151 | 8.9%), and Hispanic or Latino (98 | 5.8%).
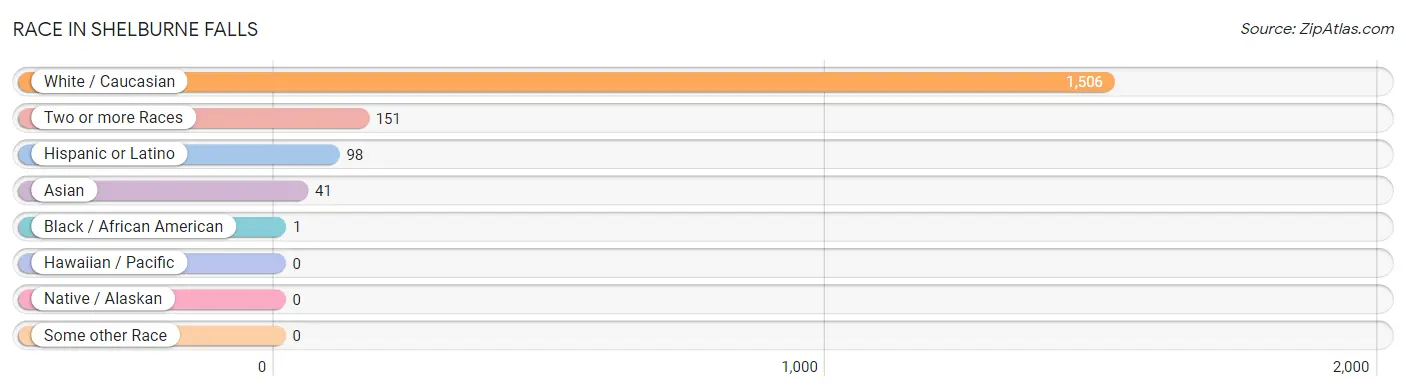
| Race | # Population | % Population |
| Asian | 41 | 2.4% |
| Black / African American | 1 | 0.1% |
| Hawaiian / Pacific | 0 | 0.0% |
| Hispanic or Latino | 98 | 5.8% |
| Native / Alaskan | 0 | 0.0% |
| White / Caucasian | 1,506 | 88.6% |
| Two or more Races | 151 | 8.9% |
| Some other Race | 0 | 0.0% |
| Total | 1,699 | 100.0% |
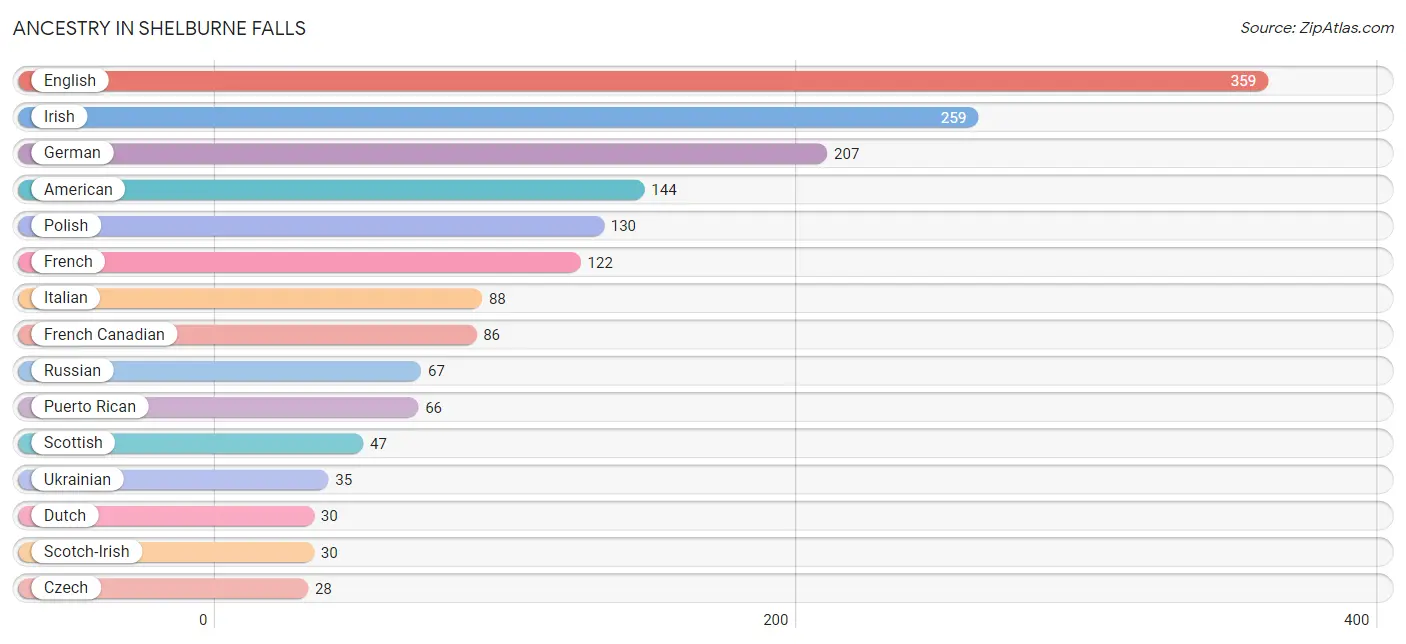
Ancestry in Shelburne Falls
The most populous ancestries reported in Shelburne Falls are English (359 | 21.1%), Irish (259 | 15.2%), German (207 | 12.2%), American (144 | 8.5%), and Polish (130 | 7.6%), together accounting for 64.7% of all Shelburne Falls residents.
| Ancestry | # Population | % Population |
| American | 144 | 8.5% |
| Bhutanese | 12 | 0.7% |
| Brazilian | 6 | 0.4% |
| British | 9 | 0.5% |
| Burmese | 4 | 0.2% |
| Canadian | 4 | 0.2% |
| Colombian | 7 | 0.4% |
| Czech | 28 | 1.7% |
| Dutch | 30 | 1.8% |
| Eastern European | 24 | 1.4% |
| English | 359 | 21.1% |
| European | 28 | 1.7% |
| French | 122 | 7.2% |
| French Canadian | 86 | 5.1% |
| German | 207 | 12.2% |
| Greek | 9 | 0.5% |
| Hungarian | 3 | 0.2% |
| Indian (Asian) | 26 | 1.5% |
| Indonesian | 4 | 0.2% |
| Irish | 259 | 15.2% |
| Italian | 88 | 5.2% |
| Korean | 15 | 0.9% |
| Laotian | 8 | 0.5% |
| Lithuanian | 22 | 1.3% |
| Mexican | 19 | 1.1% |
| Northern European | 10 | 0.6% |
| Norwegian | 5 | 0.3% |
| Polish | 130 | 7.6% |
| Portuguese | 15 | 0.9% |
| Puerto Rican | 66 | 3.9% |
| Romanian | 15 | 0.9% |
| Russian | 67 | 3.9% |
| Scotch-Irish | 30 | 1.8% |
| Scottish | 47 | 2.8% |
| Slovak | 11 | 0.6% |
| South American | 7 | 0.4% |
| Sri Lankan | 28 | 1.7% |
| Swedish | 13 | 0.8% |
| Swiss | 26 | 1.5% |
| Ukrainian | 35 | 2.1% |
| Welsh | 15 | 0.9% | View All 41 Rows |
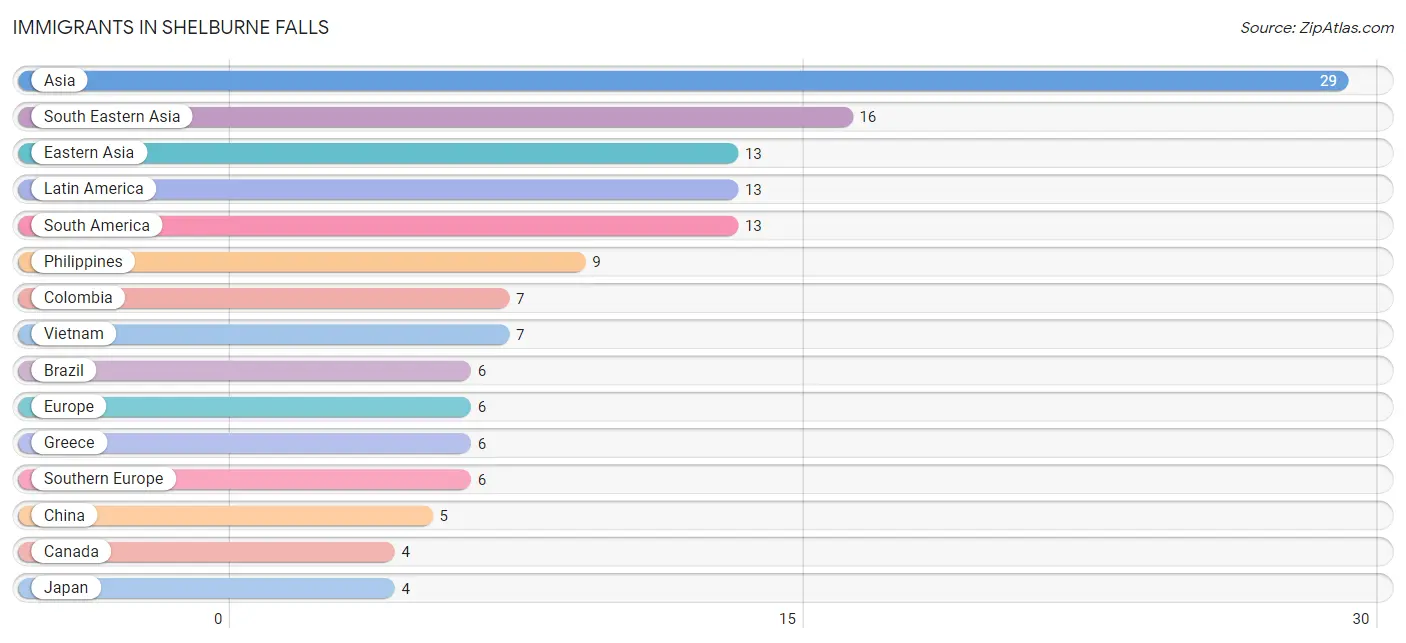
Immigrants in Shelburne Falls
The most numerous immigrant groups reported in Shelburne Falls came from Asia (29 | 1.7%), South Eastern Asia (16 | 0.9%), Eastern Asia (13 | 0.8%), Latin America (13 | 0.8%), and South America (13 | 0.8%), together accounting for 5.0% of all Shelburne Falls residents.
| Immigration Origin | # Population | % Population |
| Asia | 29 | 1.7% |
| Brazil | 6 | 0.4% |
| Canada | 4 | 0.2% |
| China | 5 | 0.3% |
| Colombia | 7 | 0.4% |
| Eastern Asia | 13 | 0.8% |
| Europe | 6 | 0.4% |
| Greece | 6 | 0.4% |
| Japan | 4 | 0.2% |
| Korea | 4 | 0.2% |
| Latin America | 13 | 0.8% |
| Philippines | 9 | 0.5% |
| South America | 13 | 0.8% |
| South Eastern Asia | 16 | 0.9% |
| Southern Europe | 6 | 0.4% |
| Vietnam | 7 | 0.4% | View All 16 Rows |
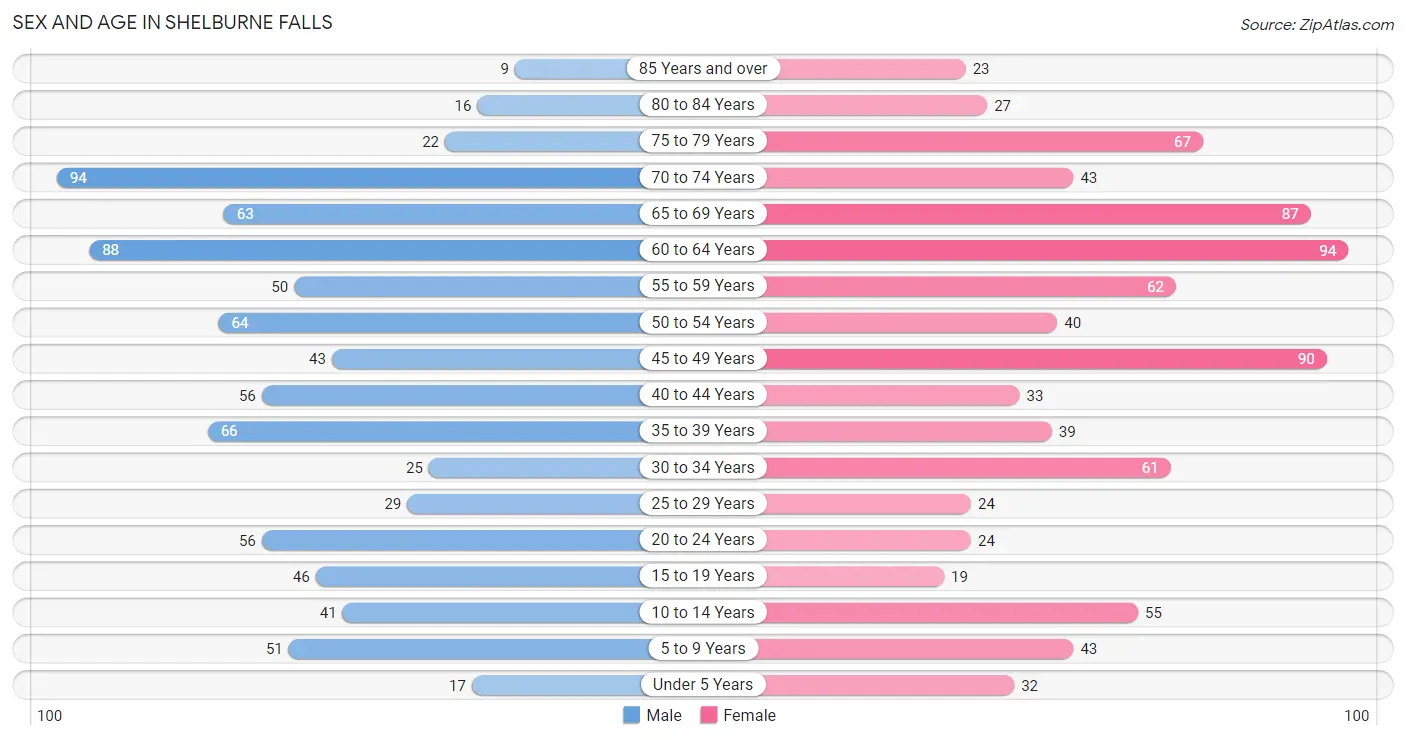
Sex and Age in Shelburne Falls
Sex and Age in Shelburne Falls
The most populous age groups in Shelburne Falls are 70 to 74 Years (94 | 11.2%) for men and 60 to 64 Years (94 | 10.9%) for women.
| Age Bracket | Male | Female |
| Under 5 Years | 17 (2.0%) | 32 (3.7%) |
| 5 to 9 Years | 51 (6.1%) | 43 (5.0%) |
| 10 to 14 Years | 41 (4.9%) | 55 (6.4%) |
| 15 to 19 Years | 46 (5.5%) | 19 (2.2%) |
| 20 to 24 Years | 56 (6.7%) | 24 (2.8%) |
| 25 to 29 Years | 29 (3.5%) | 24 (2.8%) |
| 30 to 34 Years | 25 (3.0%) | 61 (7.1%) |
| 35 to 39 Years | 66 (7.9%) | 39 (4.5%) |
| 40 to 44 Years | 56 (6.7%) | 33 (3.8%) |
| 45 to 49 Years | 43 (5.1%) | 90 (10.4%) |
| 50 to 54 Years | 64 (7.7%) | 40 (4.6%) |
| 55 to 59 Years | 50 (6.0%) | 62 (7.2%) |
| 60 to 64 Years | 88 (10.5%) | 94 (10.9%) |
| 65 to 69 Years | 63 (7.5%) | 87 (10.1%) |
| 70 to 74 Years | 94 (11.2%) | 43 (5.0%) |
| 75 to 79 Years | 22 (2.6%) | 67 (7.8%) |
| 80 to 84 Years | 16 (1.9%) | 27 (3.1%) |
| 85 Years and over | 9 (1.1%) | 23 (2.7%) |
| Total | 836 (100.0%) | 863 (100.0%) |
Families and Households in Shelburne Falls
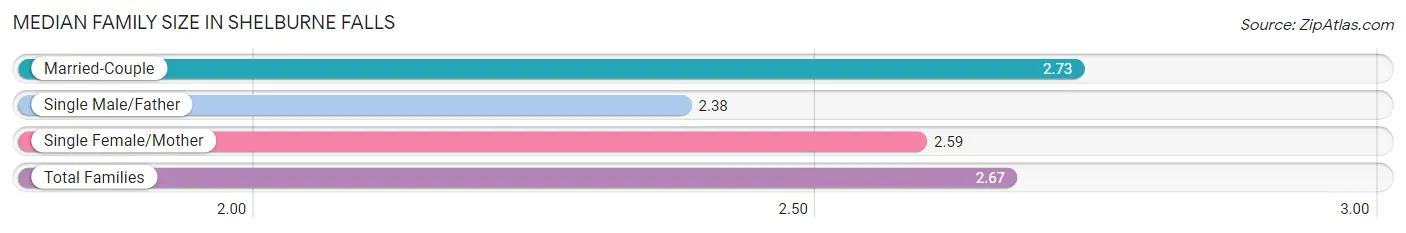
Median Family Size in Shelburne Falls
The median family size in Shelburne Falls is 2.67 persons per family, with married-couple families (298 | 68.8%) accounting for the largest median family size of 2.73 persons per family. On the other hand, single male/father families (32 | 7.4%) represent the smallest median family size with 2.38 persons per family.
| Family Type | # Families | Family Size |
| Married-Couple | 298 (68.8%) | 2.73 |
| Single Male/Father | 32 (7.4%) | 2.38 |
| Single Female/Mother | 103 (23.8%) | 2.59 |
| Total Families | 433 (100.0%) | 2.67 |
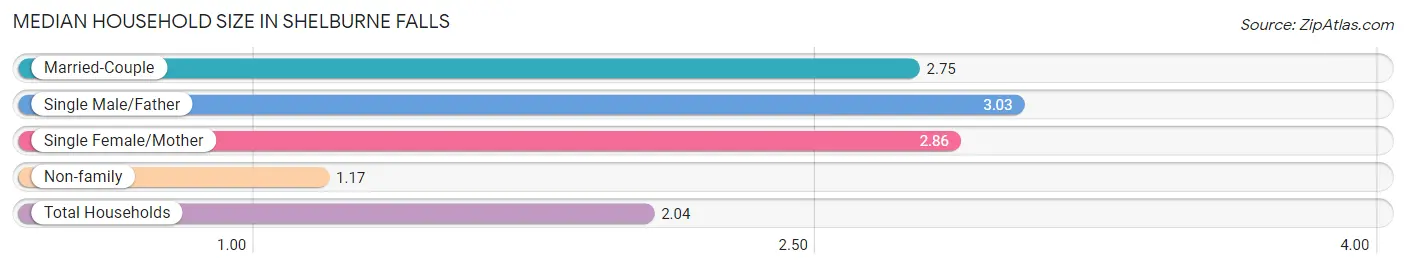
Median Household Size in Shelburne Falls
The median household size in Shelburne Falls is 2.04 persons per household, with single male/father households (32 | 4.0%) accounting for the largest median household size of 3.03 persons per household. non-family households (377 | 46.5%) represent the smallest median household size with 1.17 persons per household.
| Household Type | # Households | Household Size |
| Married-Couple | 298 (36.8%) | 2.75 |
| Single Male/Father | 32 (4.0%) | 3.03 |
| Single Female/Mother | 103 (12.7%) | 2.86 |
| Non-family | 377 (46.5%) | 1.17 |
| Total Households | 810 (100.0%) | 2.04 |
Household Size by Marriage Status in Shelburne Falls
Out of a total of 810 households in Shelburne Falls, 433 (53.5%) are family households, while 377 (46.5%) are nonfamily households. The most numerous type of family households are 3-person households, comprising 192, and the most common type of nonfamily households are 1-person households, comprising 326.
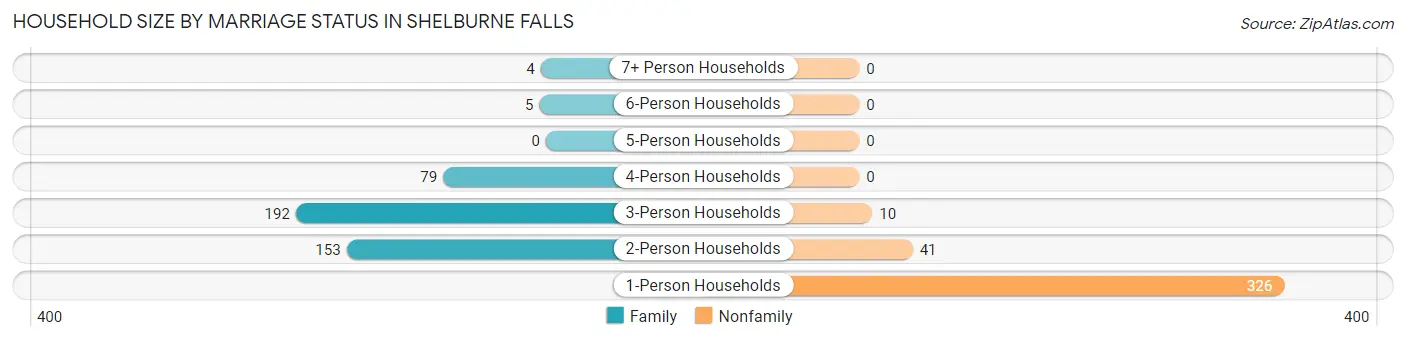
| Household Size | Family Households | Nonfamily Households |
| 1-Person Households | - | 326 (40.3%) |
| 2-Person Households | 153 (18.9%) | 41 (5.1%) |
| 3-Person Households | 192 (23.7%) | 10 (1.2%) |
| 4-Person Households | 79 (9.8%) | 0 (0.0%) |
| 5-Person Households | 0 (0.0%) | 0 (0.0%) |
| 6-Person Households | 5 (0.6%) | 0 (0.0%) |
| 7+ Person Households | 4 (0.5%) | 0 (0.0%) |
| Total | 433 (53.5%) | 377 (46.5%) |
Female Fertility in Shelburne Falls
Fertility by Age in Shelburne Falls
| Age Bracket | Women with Births | Births / 1,000 Women |
| 15 to 19 years | 0 (0.0%) | 0.0 |
| 20 to 34 years | 0 (0.0%) | 0.0 |
| 35 to 50 years | 0 (0.0%) | 0.0 |
| Total | 0 (0.0%) | 0.0 |
Fertility by Age by Marriage Status in Shelburne Falls
| Age Bracket | Married | Unmarried |
| 15 to 19 years | 0 (0.0%) | 0 (0.0%) |
| 20 to 34 years | 0 (0.0%) | 0 (0.0%) |
| 35 to 50 years | 0 (0.0%) | 0 (0.0%) |
| Total | 0 (0.0%) | 0 (0.0%) |
Fertility by Education in Shelburne Falls
| Educational Attainment | Women with Births | Births / 1,000 Women |
| Less than High School | 0 (0.0%) | 0.0 |
| High School Diploma | 0 (0.0%) | 0.0 |
| College or Associate's Degree | 0 (0.0%) | 0.0 |
| Bachelor's Degree | 0 (0.0%) | 0.0 |
| Graduate Degree | 0 (0.0%) | 0.0 |
| Total | 0 (0.0%) | 0.0 |
Fertility by Education by Marriage Status in Shelburne Falls
| Educational Attainment | Married | Unmarried |
| Less than High School | 0 (0.0%) | 0 (0.0%) |
| High School Diploma | 0 (0.0%) | 0 (0.0%) |
| College or Associate's Degree | 0 (0.0%) | 0 (0.0%) |
| Bachelor's Degree | 0 (0.0%) | 0 (0.0%) |
| Graduate Degree | 0 (0.0%) | 0 (0.0%) |
| Total | 0 (0.0%) | 0 (0.0%) |
Employment Characteristics in Shelburne Falls
Employment by Class of Employer in Shelburne Falls
Among the 766 employed individuals in Shelburne Falls, private company employees (370 | 48.3%), self-employed (not incorporated) (116 | 15.1%), and not-for-profit organizations (110 | 14.4%) make up the most common classes of employment.
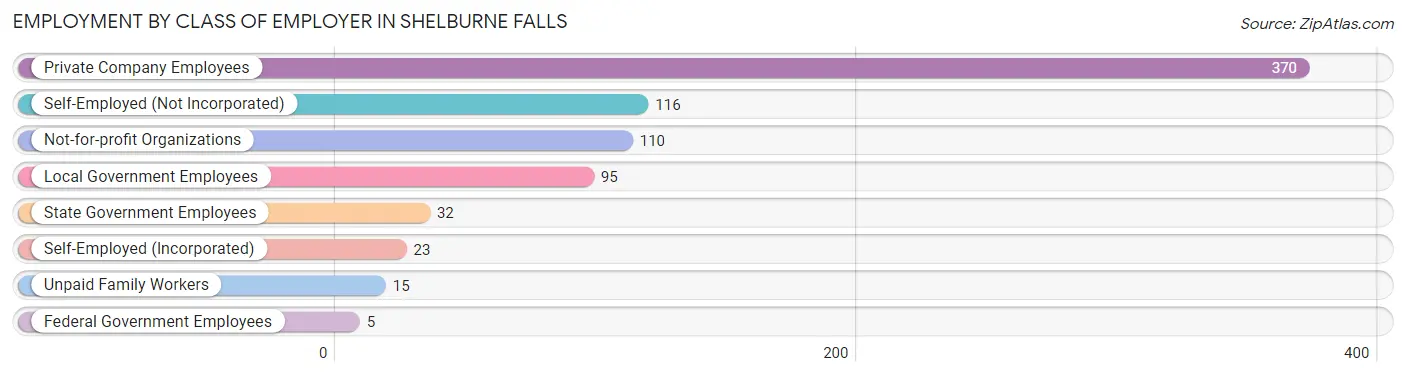
| Employer Class | # Employees | % Employees |
| Private Company Employees | 370 | 48.3% |
| Self-Employed (Incorporated) | 23 | 3.0% |
| Self-Employed (Not Incorporated) | 116 | 15.1% |
| Not-for-profit Organizations | 110 | 14.4% |
| Local Government Employees | 95 | 12.4% |
| State Government Employees | 32 | 4.2% |
| Federal Government Employees | 5 | 0.6% |
| Unpaid Family Workers | 15 | 2.0% |
| Total | 766 | 100.0% |
Employment Status by Age in Shelburne Falls
According to the labor force statistics for Shelburne Falls, out of the total population over 16 years of age (1,434), 60.6% or 869 individuals are in the labor force, with 7.1% or 62 of them unemployed. The age group with the highest labor force participation rate is 25 to 29 years, with 100.0% or 53 individuals in the labor force. Within the labor force, the 20 to 24 years age range has the highest percentage of unemployed individuals, with 32.1% or 18 of them being unemployed.
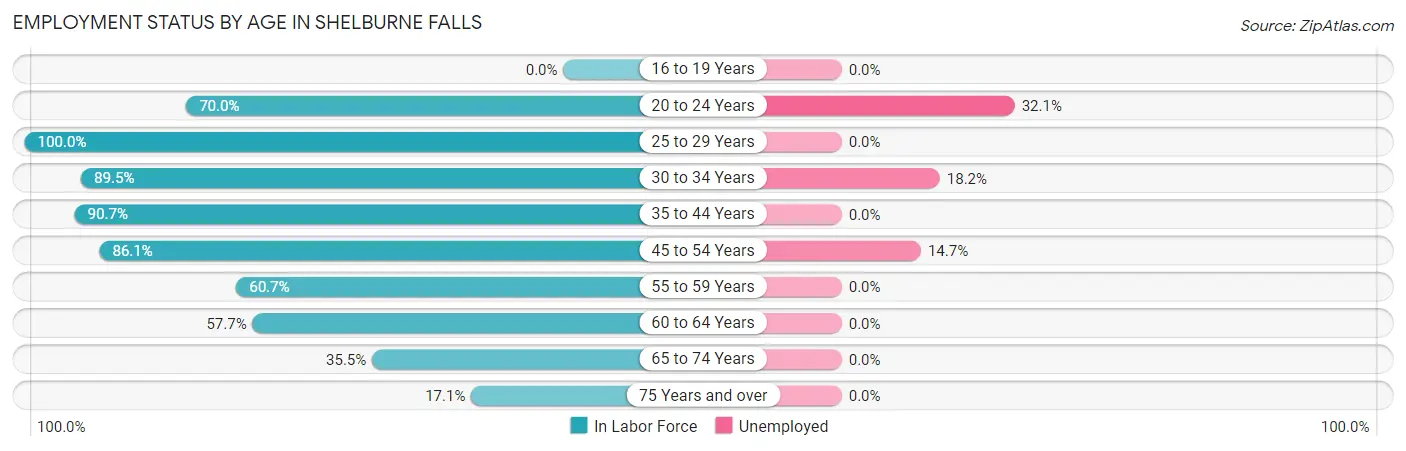
| Age Bracket | In Labor Force | Unemployed |
| 16 to 19 Years | 0 (0.0%) | 0 (0.0%) |
| 20 to 24 Years | 56 (70.0%) | 18 (32.1%) |
| 25 to 29 Years | 53 (100.0%) | 0 (0.0%) |
| 30 to 34 Years | 77 (89.5%) | 14 (18.2%) |
| 35 to 44 Years | 176 (90.7%) | 0 (0.0%) |
| 45 to 54 Years | 204 (86.1%) | 30 (14.7%) |
| 55 to 59 Years | 68 (60.7%) | 0 (0.0%) |
| 60 to 64 Years | 105 (57.7%) | 0 (0.0%) |
| 65 to 74 Years | 102 (35.5%) | 0 (0.0%) |
| 75 Years and over | 28 (17.1%) | 0 (0.0%) |
| Total | 869 (60.6%) | 62 (7.1%) |
Employment Status by Educational Attainment in Shelburne Falls
According to labor force statistics for Shelburne Falls, 79.1% of individuals (683) out of the total population between 25 and 64 years of age (864) are in the labor force, with 6.4% or 44 of them being unemployed. The group with the highest labor force participation rate are those with the educational attainment of bachelor's degree or higher, with 90.7% or 311 individuals in the labor force. Within the labor force, individuals with college / associate degree education have the highest percentage of unemployment, with 8.8% or 12 of them being unemployed.
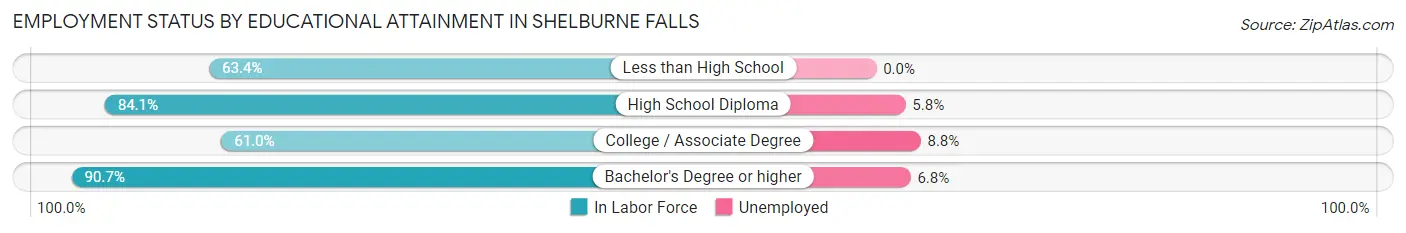
| Educational Attainment | In Labor Force | Unemployed |
| Less than High School | 45 (63.4%) | 0 (0.0%) |
| High School Diploma | 191 (84.1%) | 13 (5.8%) |
| College / Associate Degree | 136 (61.0%) | 20 (8.8%) |
| Bachelor's Degree or higher | 311 (90.7%) | 23 (6.8%) |
| Total | 683 (79.1%) | 55 (6.4%) |
Employment Occupations by Sex in Shelburne Falls
Management, Business, Science and Arts Occupations
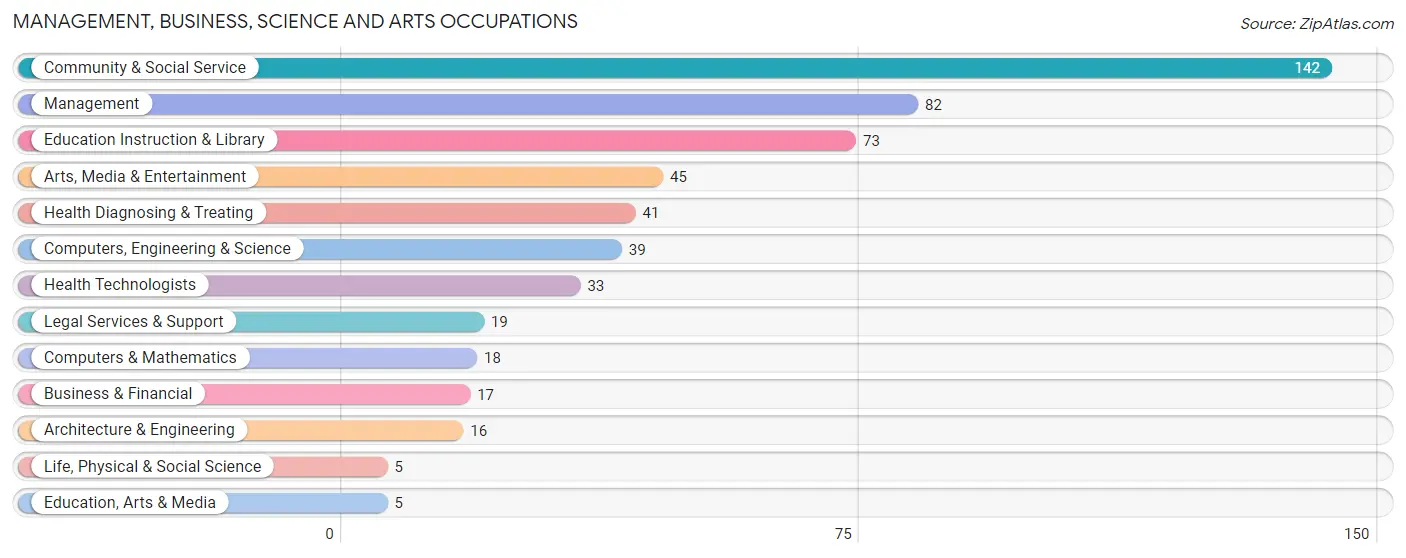
The most common Management, Business, Science and Arts occupations in Shelburne Falls are Community & Social Service (142 | 17.6%), Management (82 | 10.2%), Education Instruction & Library (73 | 9.0%), Arts, Media & Entertainment (45 | 5.6%), and Health Diagnosing & Treating (41 | 5.1%).
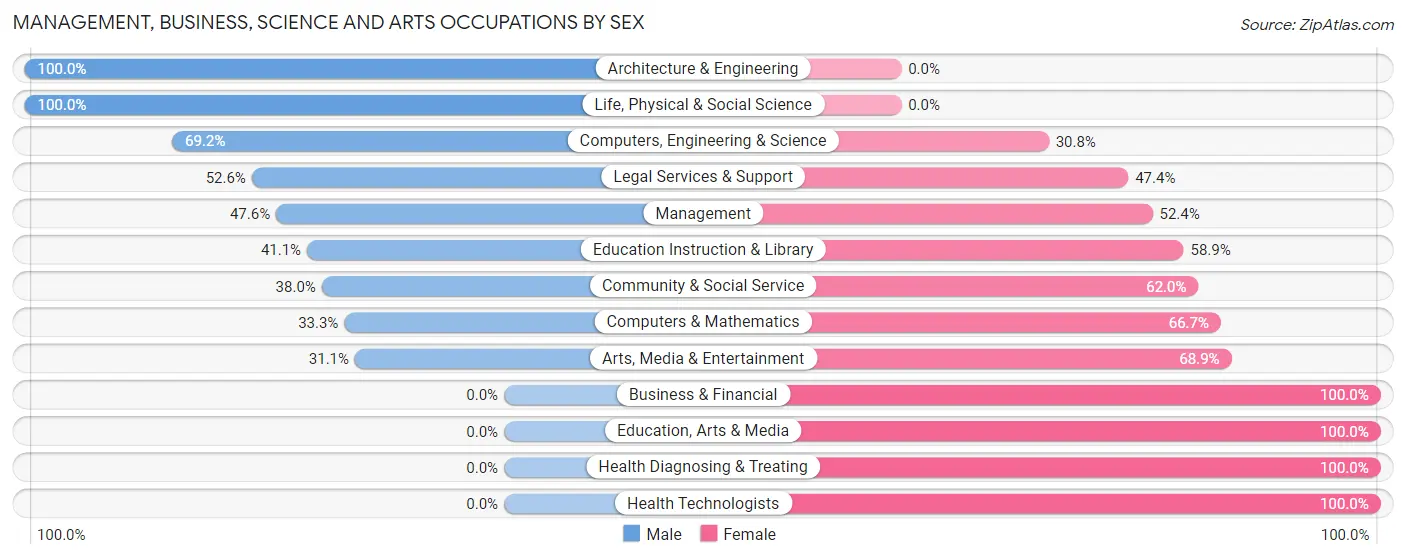
Management, Business, Science and Arts Occupations by Sex
Within the Management, Business, Science and Arts occupations in Shelburne Falls, the most male-oriented occupations are Architecture & Engineering (100.0%), Life, Physical & Social Science (100.0%), and Computers, Engineering & Science (69.2%), while the most female-oriented occupations are Business & Financial (100.0%), Education, Arts & Media (100.0%), and Health Diagnosing & Treating (100.0%).
| Occupation | Male | Female |
| Management | 39 (47.6%) | 43 (52.4%) |
| Business & Financial | 0 (0.0%) | 17 (100.0%) |
| Computers, Engineering & Science | 27 (69.2%) | 12 (30.8%) |
| Computers & Mathematics | 6 (33.3%) | 12 (66.7%) |
| Architecture & Engineering | 16 (100.0%) | 0 (0.0%) |
| Life, Physical & Social Science | 5 (100.0%) | 0 (0.0%) |
| Community & Social Service | 54 (38.0%) | 88 (62.0%) |
| Education, Arts & Media | 0 (0.0%) | 5 (100.0%) |
| Legal Services & Support | 10 (52.6%) | 9 (47.4%) |
| Education Instruction & Library | 30 (41.1%) | 43 (58.9%) |
| Arts, Media & Entertainment | 14 (31.1%) | 31 (68.9%) |
| Health Diagnosing & Treating | 0 (0.0%) | 41 (100.0%) |
| Health Technologists | 0 (0.0%) | 33 (100.0%) |
| Total (Category) | 120 (37.4%) | 201 (62.6%) |
| Total (Overall) | 391 (48.4%) | 416 (51.5%) |
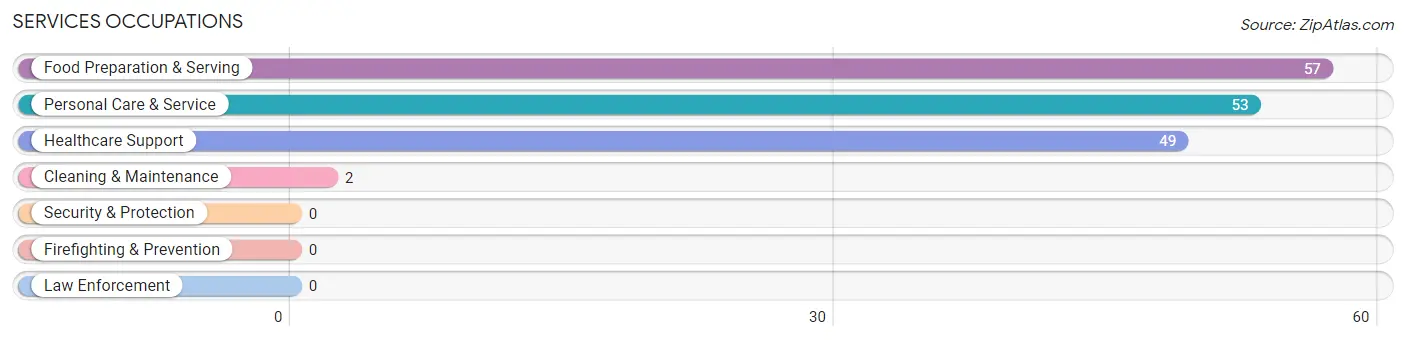
Services Occupations
The most common Services occupations in Shelburne Falls are Food Preparation & Serving (57 | 7.1%), Personal Care & Service (53 | 6.6%), Healthcare Support (49 | 6.1%), and Cleaning & Maintenance (2 | 0.3%).
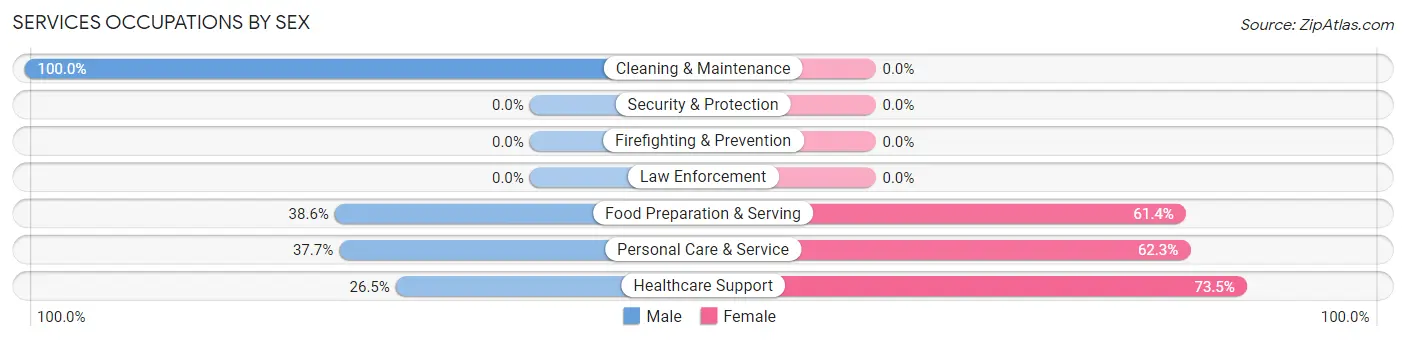
Services Occupations by Sex
Within the Services occupations in Shelburne Falls, the most male-oriented occupations are Cleaning & Maintenance (100.0%), Food Preparation & Serving (38.6%), and Personal Care & Service (37.7%), while the most female-oriented occupations are Healthcare Support (73.5%), Personal Care & Service (62.3%), and Food Preparation & Serving (61.4%).
| Occupation | Male | Female |
| Healthcare Support | 13 (26.5%) | 36 (73.5%) |
| Security & Protection | 0 (0.0%) | 0 (0.0%) |
| Firefighting & Prevention | 0 (0.0%) | 0 (0.0%) |
| Law Enforcement | 0 (0.0%) | 0 (0.0%) |
| Food Preparation & Serving | 22 (38.6%) | 35 (61.4%) |
| Cleaning & Maintenance | 2 (100.0%) | 0 (0.0%) |
| Personal Care & Service | 20 (37.7%) | 33 (62.3%) |
| Total (Category) | 57 (35.4%) | 104 (64.6%) |
| Total (Overall) | 391 (48.4%) | 416 (51.5%) |
Sales and Office Occupations
The most common Sales and Office occupations in Shelburne Falls are Office & Administration (78 | 9.7%), and Sales & Related (52 | 6.4%).
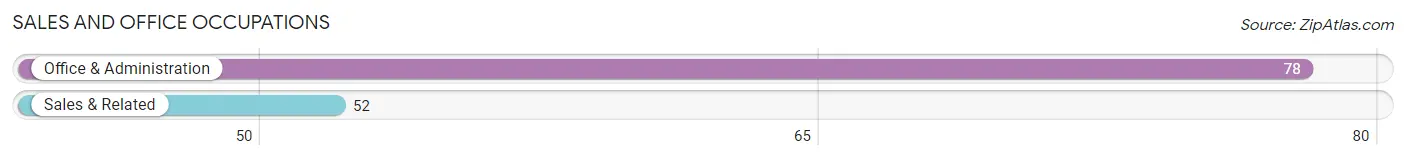
Sales and Office Occupations by Sex
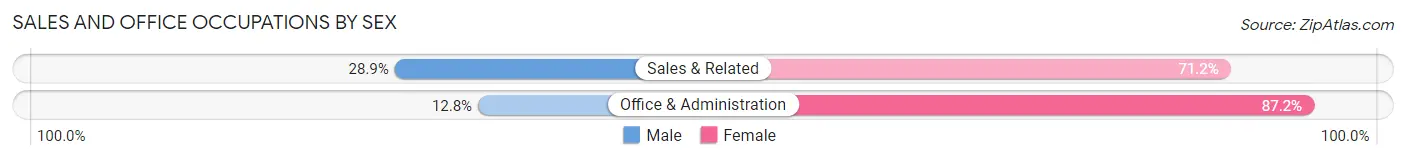
| Occupation | Male | Female |
| Sales & Related | 15 (28.8%) | 37 (71.2%) |
| Office & Administration | 10 (12.8%) | 68 (87.2%) |
| Total (Category) | 25 (19.2%) | 105 (80.8%) |
| Total (Overall) | 391 (48.4%) | 416 (51.5%) |
Natural Resources, Construction and Maintenance Occupations
The most common Natural Resources, Construction and Maintenance occupations in Shelburne Falls are , and Construction & Extraction (58 | 7.2%).
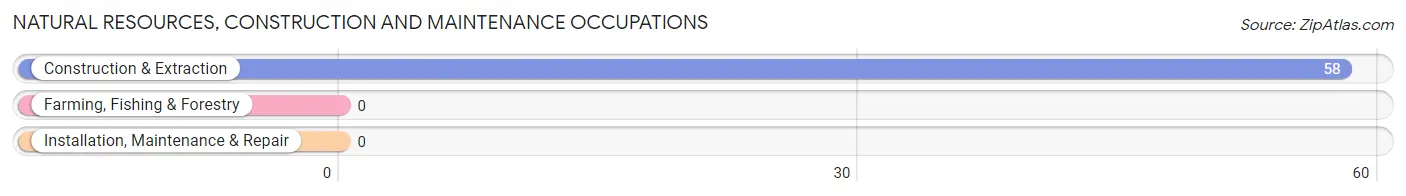
Natural Resources, Construction and Maintenance Occupations by Sex
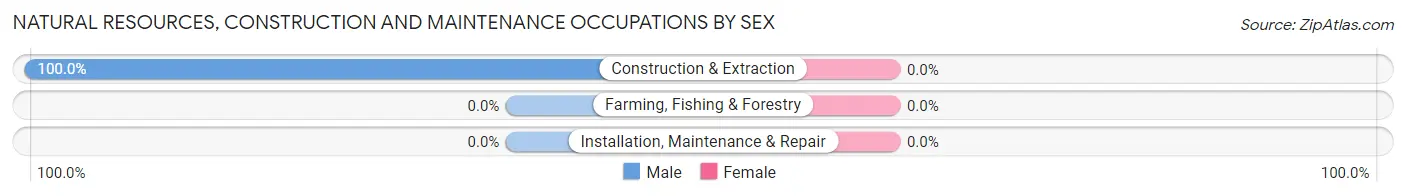
| Occupation | Male | Female |
| Farming, Fishing & Forestry | 0 (0.0%) | 0 (0.0%) |
| Construction & Extraction | 58 (100.0%) | 0 (0.0%) |
| Installation, Maintenance & Repair | 0 (0.0%) | 0 (0.0%) |
| Total (Category) | 58 (100.0%) | 0 (0.0%) |
| Total (Overall) | 391 (48.4%) | 416 (51.5%) |
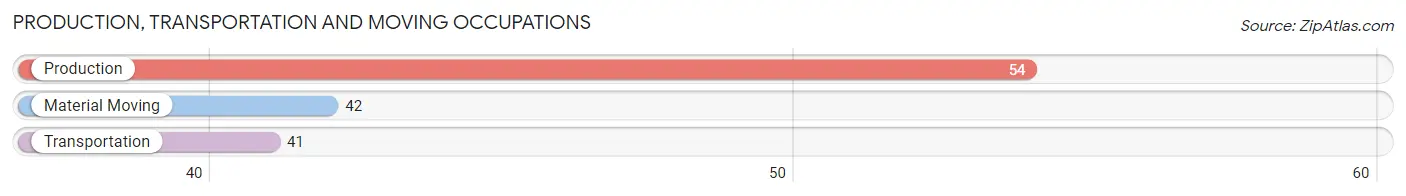
Production, Transportation and Moving Occupations
The most common Production, Transportation and Moving occupations in Shelburne Falls are Production (54 | 6.7%), Material Moving (42 | 5.2%), and Transportation (41 | 5.1%).
Production, Transportation and Moving Occupations by Sex
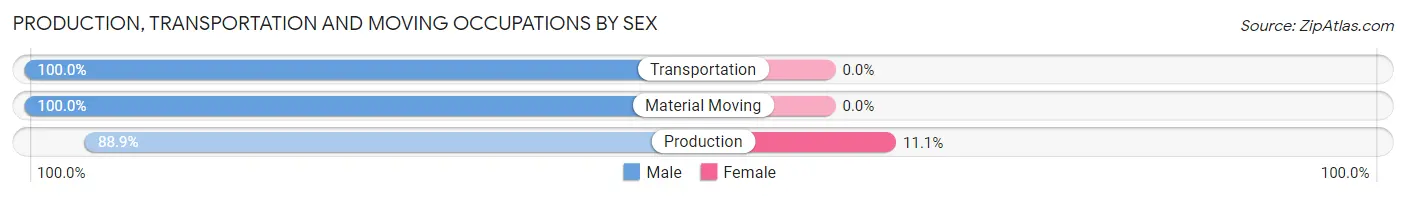
| Occupation | Male | Female |
| Production | 48 (88.9%) | 6 (11.1%) |
| Transportation | 41 (100.0%) | 0 (0.0%) |
| Material Moving | 42 (100.0%) | 0 (0.0%) |
| Total (Category) | 131 (95.6%) | 6 (4.4%) |
| Total (Overall) | 391 (48.4%) | 416 (51.5%) |
Employment Industries by Sex in Shelburne Falls
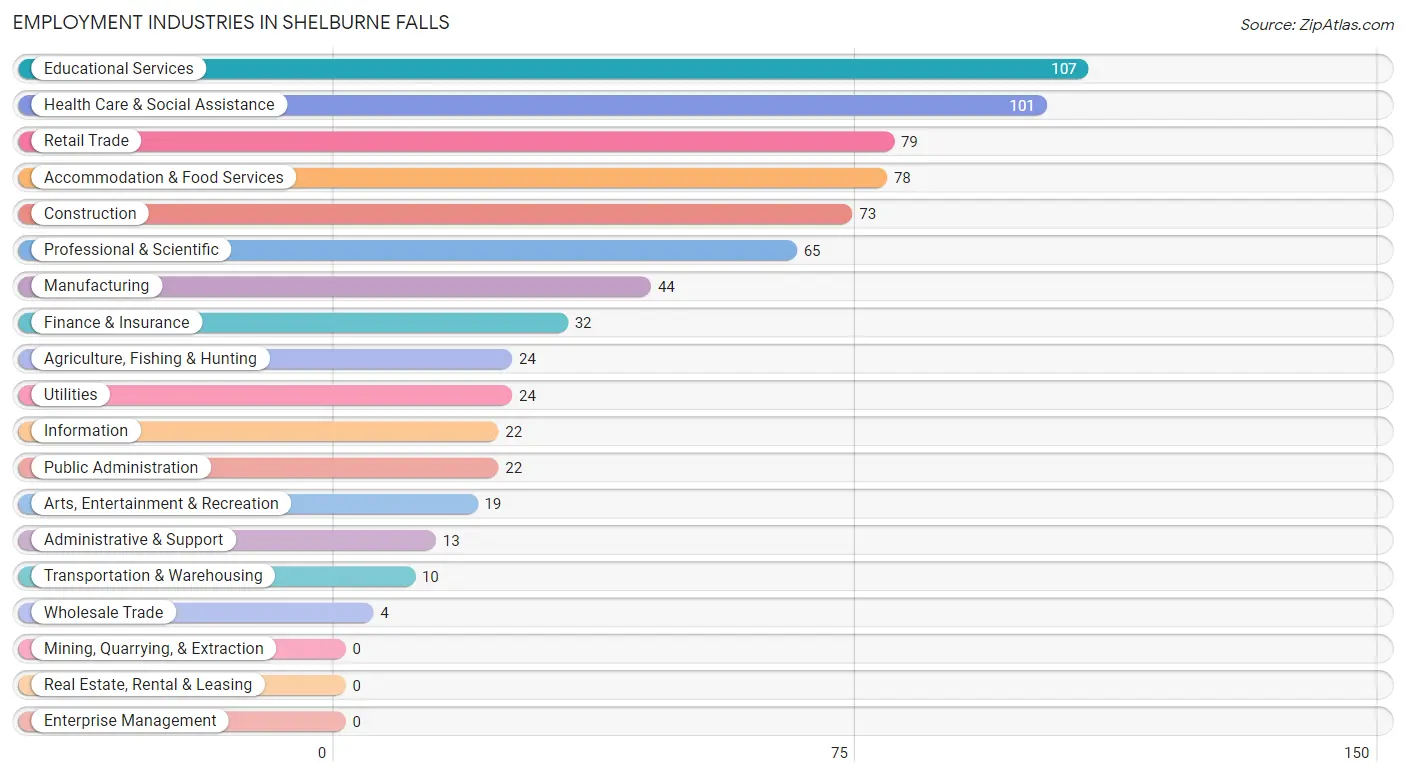
Employment Industries in Shelburne Falls
The major employment industries in Shelburne Falls include Educational Services (107 | 13.3%), Health Care & Social Assistance (101 | 12.5%), Retail Trade (79 | 9.8%), Accommodation & Food Services (78 | 9.7%), and Construction (73 | 9.0%).
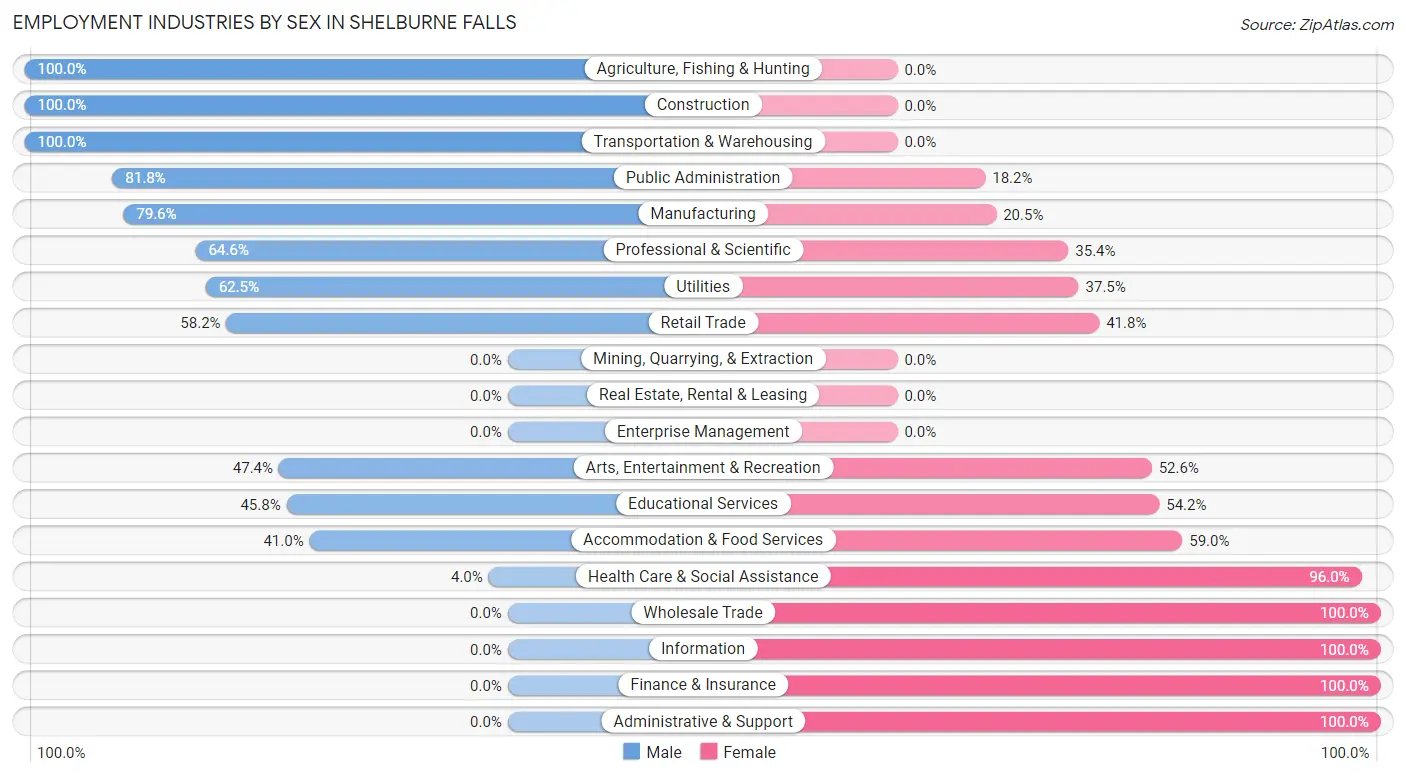
Employment Industries by Sex in Shelburne Falls
The Shelburne Falls industries that see more men than women are Agriculture, Fishing & Hunting (100.0%), Construction (100.0%), and Transportation & Warehousing (100.0%), whereas the industries that tend to have a higher number of women are Wholesale Trade (100.0%), Information (100.0%), and Finance & Insurance (100.0%).
| Industry | Male | Female |
| Agriculture, Fishing & Hunting | 24 (100.0%) | 0 (0.0%) |
| Mining, Quarrying, & Extraction | 0 (0.0%) | 0 (0.0%) |
| Construction | 73 (100.0%) | 0 (0.0%) |
| Manufacturing | 35 (79.5%) | 9 (20.4%) |
| Wholesale Trade | 0 (0.0%) | 4 (100.0%) |
| Retail Trade | 46 (58.2%) | 33 (41.8%) |
| Transportation & Warehousing | 10 (100.0%) | 0 (0.0%) |
| Utilities | 15 (62.5%) | 9 (37.5%) |
| Information | 0 (0.0%) | 22 (100.0%) |
| Finance & Insurance | 0 (0.0%) | 32 (100.0%) |
| Real Estate, Rental & Leasing | 0 (0.0%) | 0 (0.0%) |
| Professional & Scientific | 42 (64.6%) | 23 (35.4%) |
| Enterprise Management | 0 (0.0%) | 0 (0.0%) |
| Administrative & Support | 0 (0.0%) | 13 (100.0%) |
| Educational Services | 49 (45.8%) | 58 (54.2%) |
| Health Care & Social Assistance | 4 (4.0%) | 97 (96.0%) |
| Arts, Entertainment & Recreation | 9 (47.4%) | 10 (52.6%) |
| Accommodation & Food Services | 32 (41.0%) | 46 (59.0%) |
| Public Administration | 18 (81.8%) | 4 (18.2%) |
| Total | 391 (48.4%) | 416 (51.5%) |
Education in Shelburne Falls
School Enrollment in Shelburne Falls
The most common levels of schooling among the 322 students in Shelburne Falls are elementary school (78 | 24.2%), high school (70 | 21.7%), and middle school (69 | 21.4%).
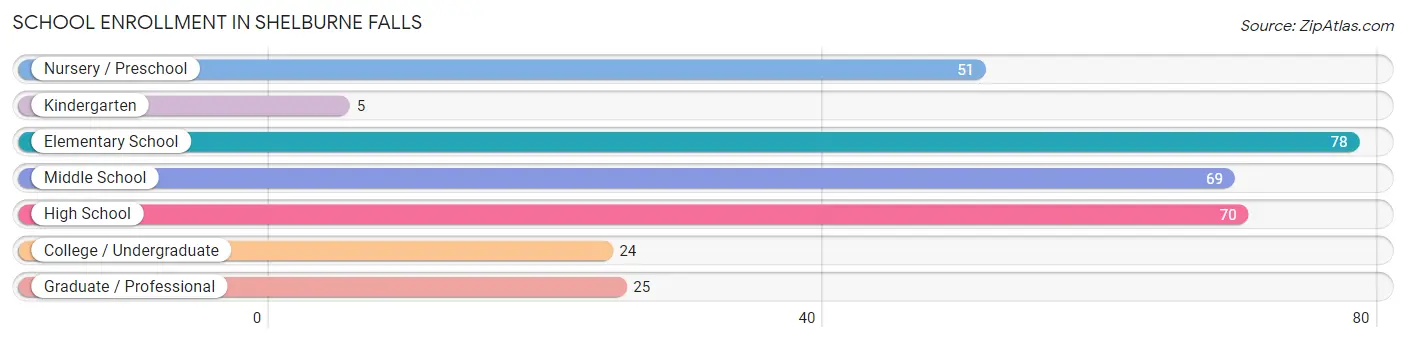
| School Level | # Students | % Students |
| Nursery / Preschool | 51 | 15.8% |
| Kindergarten | 5 | 1.5% |
| Elementary School | 78 | 24.2% |
| Middle School | 69 | 21.4% |
| High School | 70 | 21.7% |
| College / Undergraduate | 24 | 7.4% |
| Graduate / Professional | 25 | 7.8% |
| Total | 322 | 100.0% |
School Enrollment by Age by Funding Source in Shelburne Falls
Out of a total of 322 students who are enrolled in schools in Shelburne Falls, 52 (16.1%) attend a private institution, while the remaining 270 (83.9%) are enrolled in public schools. The age group of 35 years and over has the highest likelihood of being enrolled in private schools, with 12 (48.0% in the age bracket) enrolled. Conversely, the age group of 18 to 19 year olds has the lowest likelihood of being enrolled in a private school, with 20 (100.0% in the age bracket) attending a public institution.
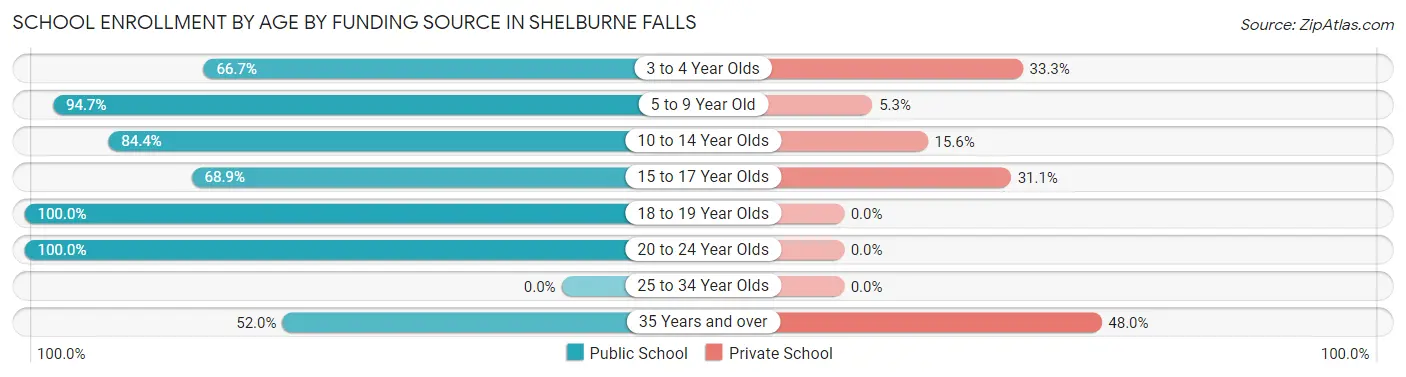
| Age Bracket | Public School | Private School |
| 3 to 4 Year Olds | 12 (66.7%) | 6 (33.3%) |
| 5 to 9 Year Old | 89 (94.7%) | 5 (5.3%) |
| 10 to 14 Year Olds | 81 (84.4%) | 15 (15.6%) |
| 15 to 17 Year Olds | 31 (68.9%) | 14 (31.1%) |
| 18 to 19 Year Olds | 20 (100.0%) | 0 (0.0%) |
| 20 to 24 Year Olds | 24 (100.0%) | 0 (0.0%) |
| 25 to 34 Year Olds | 0 (0.0%) | 0 (0.0%) |
| 35 Years and over | 13 (52.0%) | 12 (48.0%) |
| Total | 270 (83.9%) | 52 (16.1%) |
Educational Attainment by Field of Study in Shelburne Falls
Visual & performing arts (94 | 14.7%), social sciences (91 | 14.2%), science & technology (78 | 12.2%), bio, nature & agricultural (67 | 10.5%), and literature & languages (66 | 10.3%) are the most common fields of study among 639 individuals in Shelburne Falls who have obtained a bachelor's degree or higher.
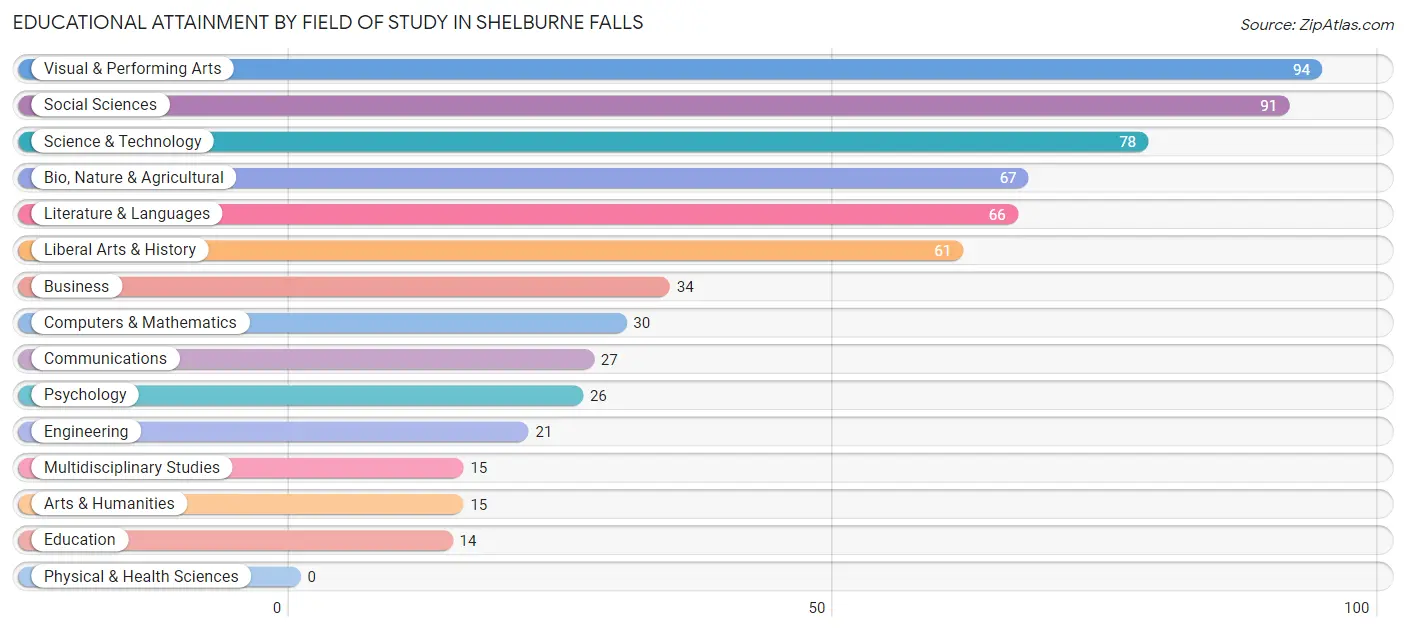
| Field of Study | # Graduates | % Graduates |
| Computers & Mathematics | 30 | 4.7% |
| Bio, Nature & Agricultural | 67 | 10.5% |
| Physical & Health Sciences | 0 | 0.0% |
| Psychology | 26 | 4.1% |
| Social Sciences | 91 | 14.2% |
| Engineering | 21 | 3.3% |
| Multidisciplinary Studies | 15 | 2.4% |
| Science & Technology | 78 | 12.2% |
| Business | 34 | 5.3% |
| Education | 14 | 2.2% |
| Literature & Languages | 66 | 10.3% |
| Liberal Arts & History | 61 | 9.6% |
| Visual & Performing Arts | 94 | 14.7% |
| Communications | 27 | 4.2% |
| Arts & Humanities | 15 | 2.4% |
| Total | 639 | 100.0% |
Transportation & Commute in Shelburne Falls
Vehicle Availability by Sex in Shelburne Falls
The most prevalent vehicle ownership categories in Shelburne Falls are males with 2 vehicles (192, accounting for 50.5%) and females with 2 vehicles (168, making up 49.7%).
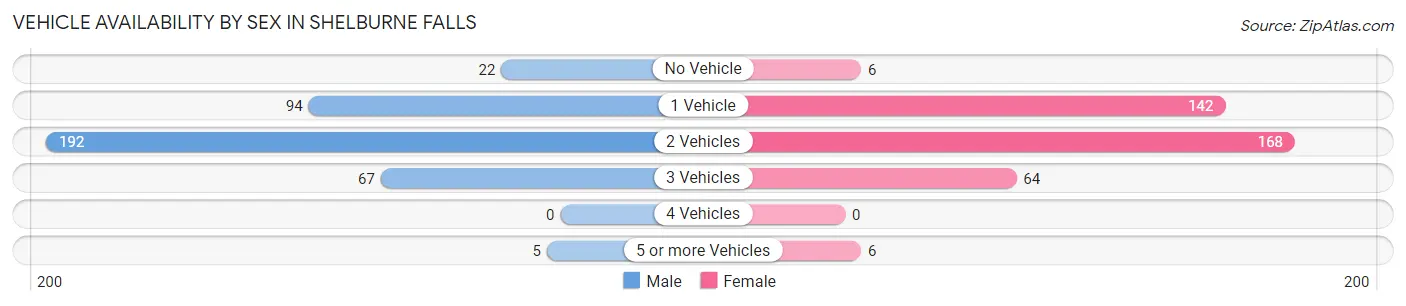
| Vehicles Available | Male | Female |
| No Vehicle | 22 (5.8%) | 6 (1.5%) |
| 1 Vehicle | 94 (24.7%) | 142 (36.8%) |
| 2 Vehicles | 192 (50.5%) | 168 (43.5%) |
| 3 Vehicles | 67 (17.6%) | 64 (16.6%) |
| 4 Vehicles | 0 (0.0%) | 0 (0.0%) |
| 5 or more Vehicles | 5 (1.3%) | 6 (1.5%) |
| Total | 380 (100.0%) | 386 (100.0%) |
Commute Time in Shelburne Falls
The most frequently occuring commute durations in Shelburne Falls are 5 to 9 minutes (102 commuters, 17.0%), 45 to 59 minutes (99 commuters, 16.5%), and 20 to 24 minutes (84 commuters, 14.0%).
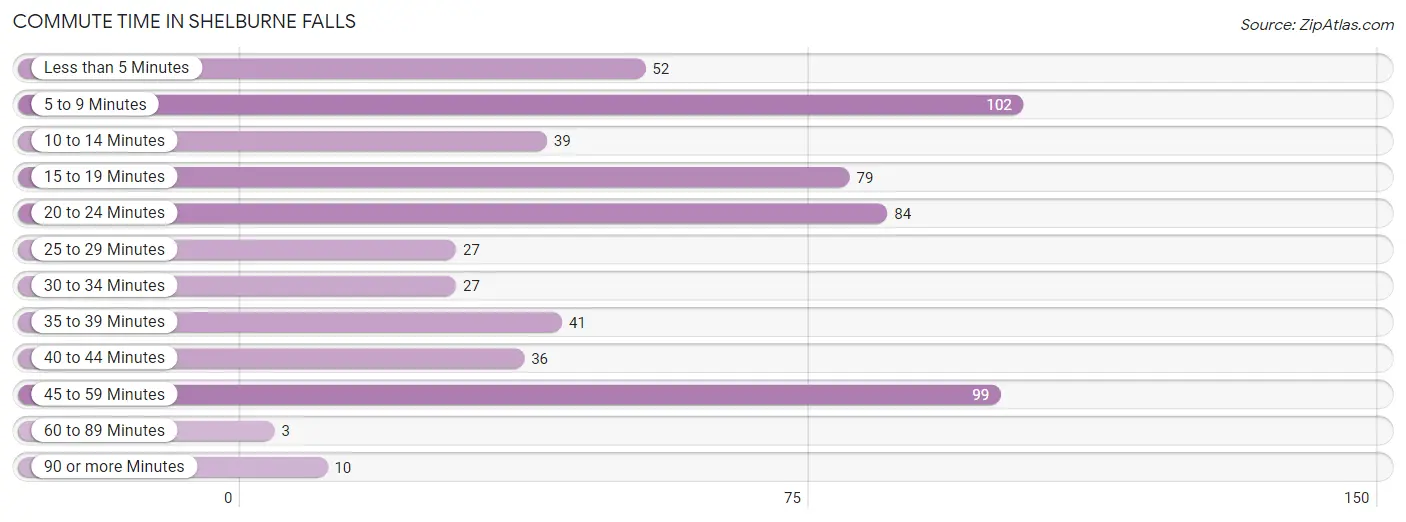
| Commute Time | # Commuters | % Commuters |
| Less than 5 Minutes | 52 | 8.7% |
| 5 to 9 Minutes | 102 | 17.0% |
| 10 to 14 Minutes | 39 | 6.5% |
| 15 to 19 Minutes | 79 | 13.2% |
| 20 to 24 Minutes | 84 | 14.0% |
| 25 to 29 Minutes | 27 | 4.5% |
| 30 to 34 Minutes | 27 | 4.5% |
| 35 to 39 Minutes | 41 | 6.8% |
| 40 to 44 Minutes | 36 | 6.0% |
| 45 to 59 Minutes | 99 | 16.5% |
| 60 to 89 Minutes | 3 | 0.5% |
| 90 or more Minutes | 10 | 1.7% |
Commute Time by Sex in Shelburne Falls
The most common commute times in Shelburne Falls are 5 to 9 minutes (80 commuters, 26.4%) for males and 20 to 24 minutes (60 commuters, 20.3%) for females.
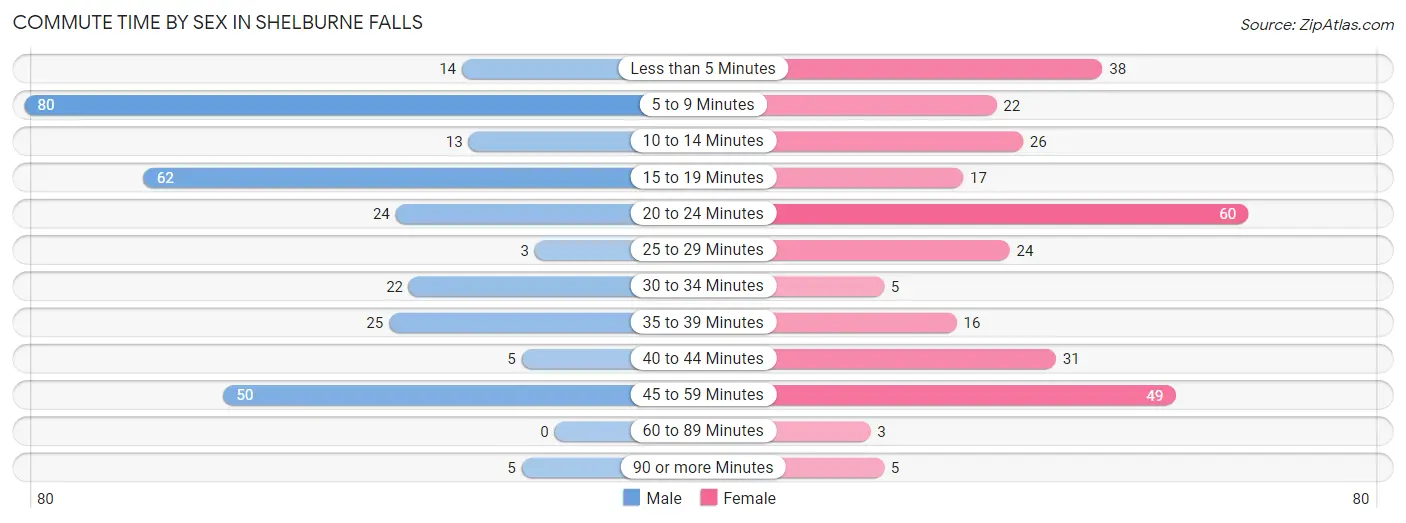
| Commute Time | Male | Female |
| Less than 5 Minutes | 14 (4.6%) | 38 (12.8%) |
| 5 to 9 Minutes | 80 (26.4%) | 22 (7.4%) |
| 10 to 14 Minutes | 13 (4.3%) | 26 (8.8%) |
| 15 to 19 Minutes | 62 (20.5%) | 17 (5.7%) |
| 20 to 24 Minutes | 24 (7.9%) | 60 (20.3%) |
| 25 to 29 Minutes | 3 (1.0%) | 24 (8.1%) |
| 30 to 34 Minutes | 22 (7.3%) | 5 (1.7%) |
| 35 to 39 Minutes | 25 (8.3%) | 16 (5.4%) |
| 40 to 44 Minutes | 5 (1.7%) | 31 (10.5%) |
| 45 to 59 Minutes | 50 (16.5%) | 49 (16.6%) |
| 60 to 89 Minutes | 0 (0.0%) | 3 (1.0%) |
| 90 or more Minutes | 5 (1.7%) | 5 (1.7%) |
Time of Departure to Work by Sex in Shelburne Falls
The most frequent times of departure to work in Shelburne Falls are 12:00 PM to 3:59 PM (53, 17.5%) for males and 7:00 AM to 7:29 AM (45, 15.2%) for females.
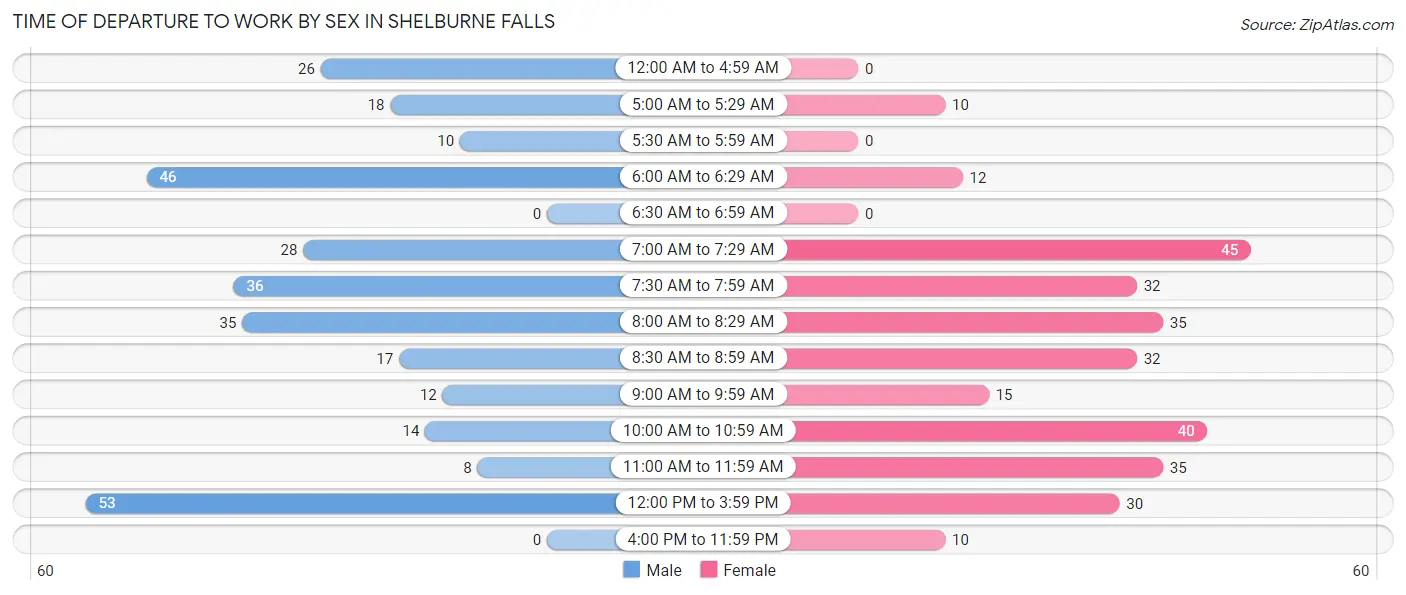
| Time of Departure | Male | Female |
| 12:00 AM to 4:59 AM | 26 (8.6%) | 0 (0.0%) |
| 5:00 AM to 5:29 AM | 18 (5.9%) | 10 (3.4%) |
| 5:30 AM to 5:59 AM | 10 (3.3%) | 0 (0.0%) |
| 6:00 AM to 6:29 AM | 46 (15.2%) | 12 (4.1%) |
| 6:30 AM to 6:59 AM | 0 (0.0%) | 0 (0.0%) |
| 7:00 AM to 7:29 AM | 28 (9.2%) | 45 (15.2%) |
| 7:30 AM to 7:59 AM | 36 (11.9%) | 32 (10.8%) |
| 8:00 AM to 8:29 AM | 35 (11.6%) | 35 (11.8%) |
| 8:30 AM to 8:59 AM | 17 (5.6%) | 32 (10.8%) |
| 9:00 AM to 9:59 AM | 12 (4.0%) | 15 (5.1%) |
| 10:00 AM to 10:59 AM | 14 (4.6%) | 40 (13.5%) |
| 11:00 AM to 11:59 AM | 8 (2.6%) | 35 (11.8%) |
| 12:00 PM to 3:59 PM | 53 (17.5%) | 30 (10.1%) |
| 4:00 PM to 11:59 PM | 0 (0.0%) | 10 (3.4%) |
| Total | 303 (100.0%) | 296 (100.0%) |
Housing Occupancy in Shelburne Falls
Occupancy by Ownership in Shelburne Falls
Of the total 810 dwellings in Shelburne Falls, owner-occupied units account for 449 (55.4%), while renter-occupied units make up 361 (44.6%).
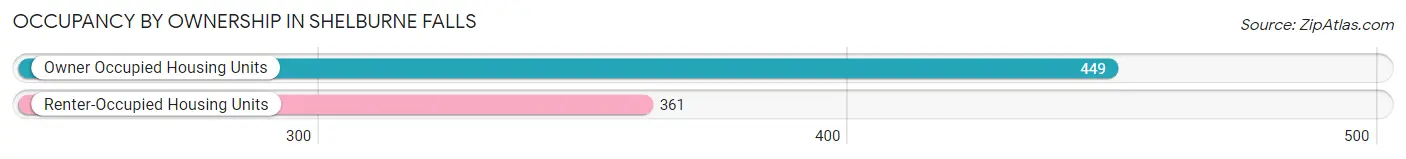
| Occupancy | # Housing Units | % Housing Units |
| Owner Occupied Housing Units | 449 | 55.4% |
| Renter-Occupied Housing Units | 361 | 44.6% |
| Total Occupied Housing Units | 810 | 100.0% |
Occupancy by Household Size in Shelburne Falls
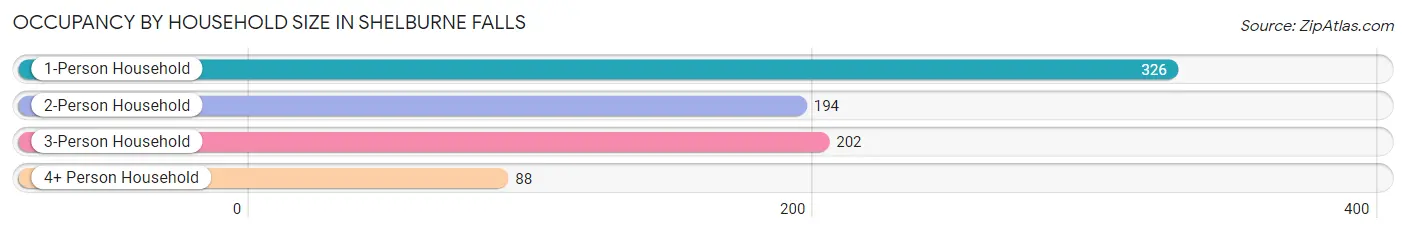
| Household Size | # Housing Units | % Housing Units |
| 1-Person Household | 326 | 40.3% |
| 2-Person Household | 194 | 23.9% |
| 3-Person Household | 202 | 24.9% |
| 4+ Person Household | 88 | 10.9% |
| Total Housing Units | 810 | 100.0% |
Occupancy by Ownership by Household Size in Shelburne Falls
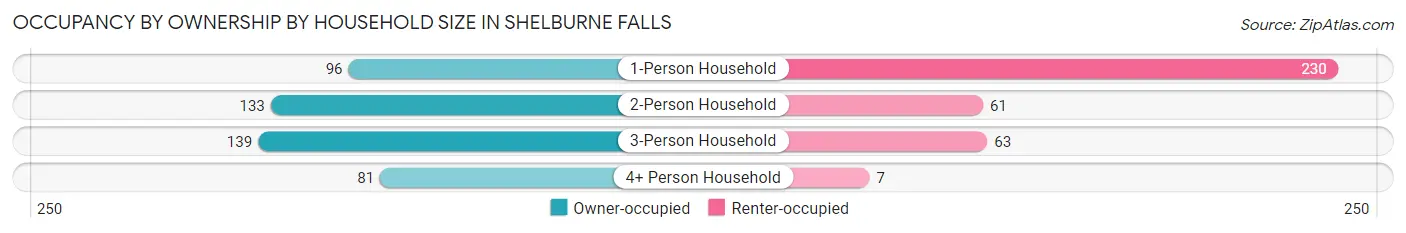
| Household Size | Owner-occupied | Renter-occupied |
| 1-Person Household | 96 (29.4%) | 230 (70.6%) |
| 2-Person Household | 133 (68.6%) | 61 (31.4%) |
| 3-Person Household | 139 (68.8%) | 63 (31.2%) |
| 4+ Person Household | 81 (92.0%) | 7 (8.0%) |
| Total Housing Units | 449 (55.4%) | 361 (44.6%) |
Occupancy by Educational Attainment in Shelburne Falls
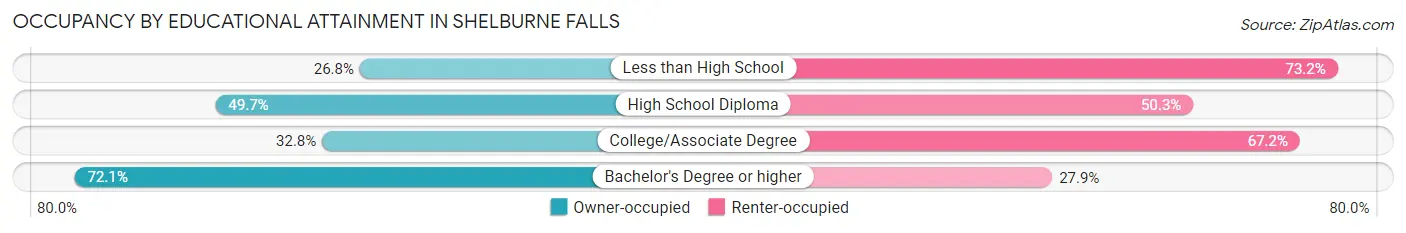
| Household Size | Owner-occupied | Renter-occupied |
| Less than High School | 11 (26.8%) | 30 (73.2%) |
| High School Diploma | 91 (49.7%) | 92 (50.3%) |
| College/Associate Degree | 63 (32.8%) | 129 (67.2%) |
| Bachelor's Degree or higher | 284 (72.1%) | 110 (27.9%) |
Occupancy by Age of Householder in Shelburne Falls
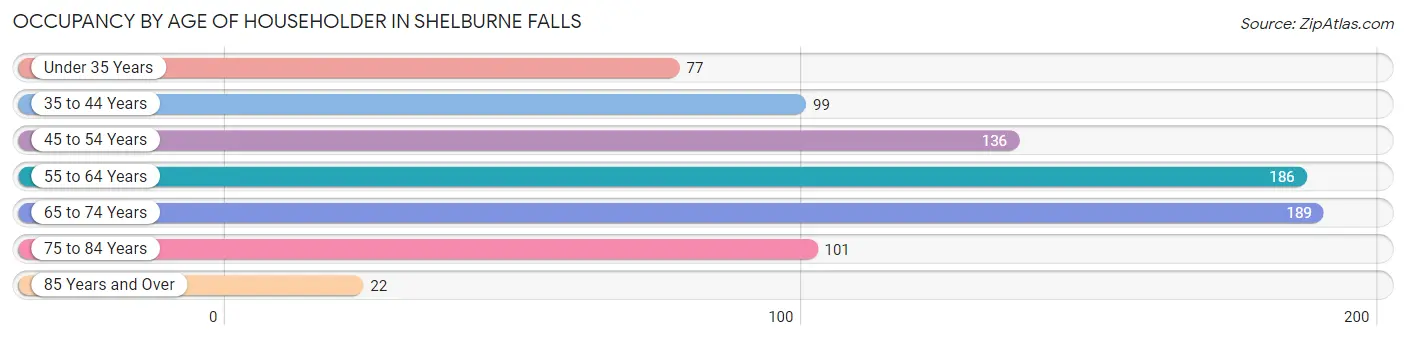
| Age Bracket | # Households | % Households |
| Under 35 Years | 77 | 9.5% |
| 35 to 44 Years | 99 | 12.2% |
| 45 to 54 Years | 136 | 16.8% |
| 55 to 64 Years | 186 | 23.0% |
| 65 to 74 Years | 189 | 23.3% |
| 75 to 84 Years | 101 | 12.5% |
| 85 Years and Over | 22 | 2.7% |
| Total | 810 | 100.0% |
Housing Finances in Shelburne Falls
Median Income by Occupancy in Shelburne Falls
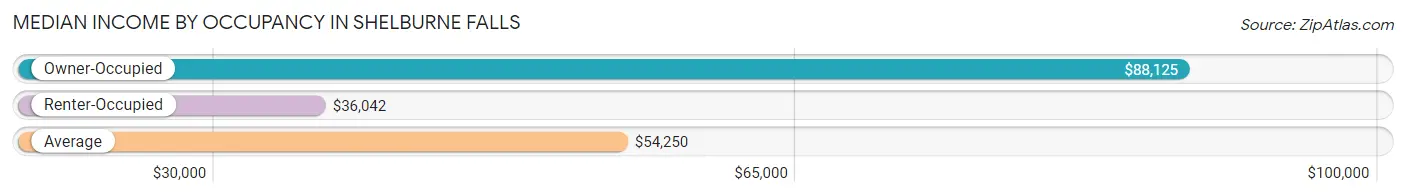
| Occupancy Type | # Households | Median Income |
| Owner-Occupied | 449 (55.4%) | $88,125 |
| Renter-Occupied | 361 (44.6%) | $36,042 |
| Average | 810 (100.0%) | $54,250 |
Occupancy by Householder Income Bracket in Shelburne Falls
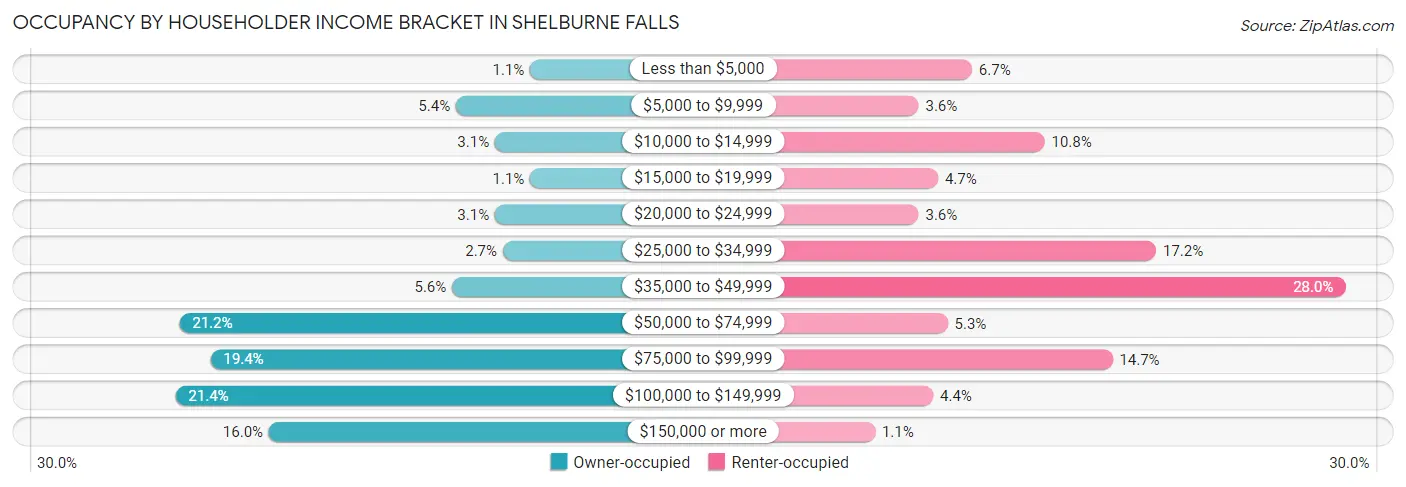
| Income Bracket | Owner-occupied | Renter-occupied |
| Less than $5,000 | 5 (1.1%) | 24 (6.7%) |
| $5,000 to $9,999 | 24 (5.3%) | 13 (3.6%) |
| $10,000 to $14,999 | 14 (3.1%) | 39 (10.8%) |
| $15,000 to $19,999 | 5 (1.1%) | 17 (4.7%) |
| $20,000 to $24,999 | 14 (3.1%) | 13 (3.6%) |
| $25,000 to $34,999 | 12 (2.7%) | 62 (17.2%) |
| $35,000 to $49,999 | 25 (5.6%) | 101 (28.0%) |
| $50,000 to $74,999 | 95 (21.2%) | 19 (5.3%) |
| $75,000 to $99,999 | 87 (19.4%) | 53 (14.7%) |
| $100,000 to $149,999 | 96 (21.4%) | 16 (4.4%) |
| $150,000 or more | 72 (16.0%) | 4 (1.1%) |
| Total | 449 (100.0%) | 361 (100.0%) |
Monthly Housing Cost Tiers in Shelburne Falls
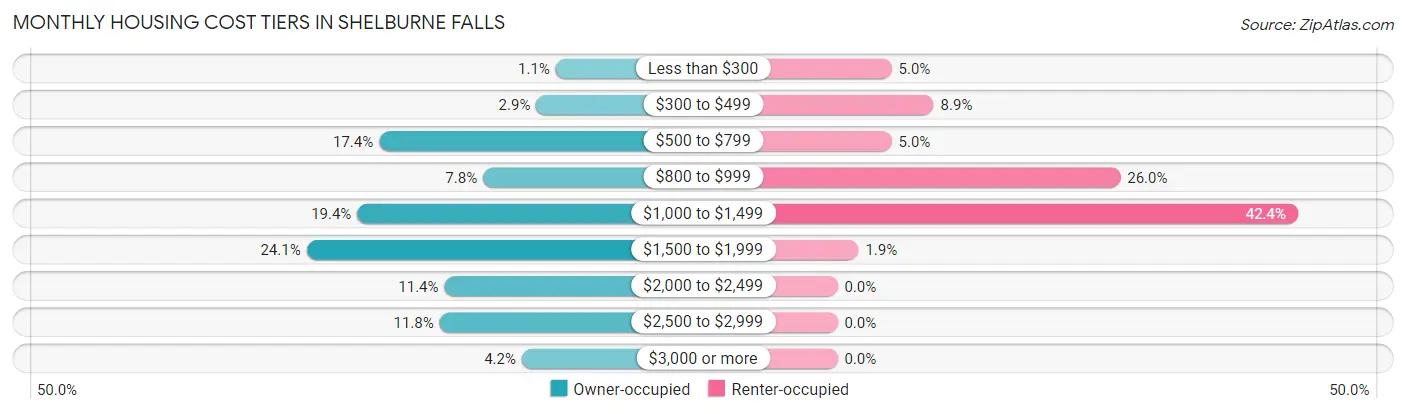
| Monthly Cost | Owner-occupied | Renter-occupied |
| Less than $300 | 5 (1.1%) | 18 (5.0%) |
| $300 to $499 | 13 (2.9%) | 32 (8.9%) |
| $500 to $799 | 78 (17.4%) | 18 (5.0%) |
| $800 to $999 | 35 (7.8%) | 94 (26.0%) |
| $1,000 to $1,499 | 87 (19.4%) | 153 (42.4%) |
| $1,500 to $1,999 | 108 (24.0%) | 7 (1.9%) |
| $2,000 to $2,499 | 51 (11.4%) | 0 (0.0%) |
| $2,500 to $2,999 | 53 (11.8%) | 0 (0.0%) |
| $3,000 or more | 19 (4.2%) | 0 (0.0%) |
| Total | 449 (100.0%) | 361 (100.0%) |
Physical Housing Characteristics in Shelburne Falls
Housing Structures in Shelburne Falls
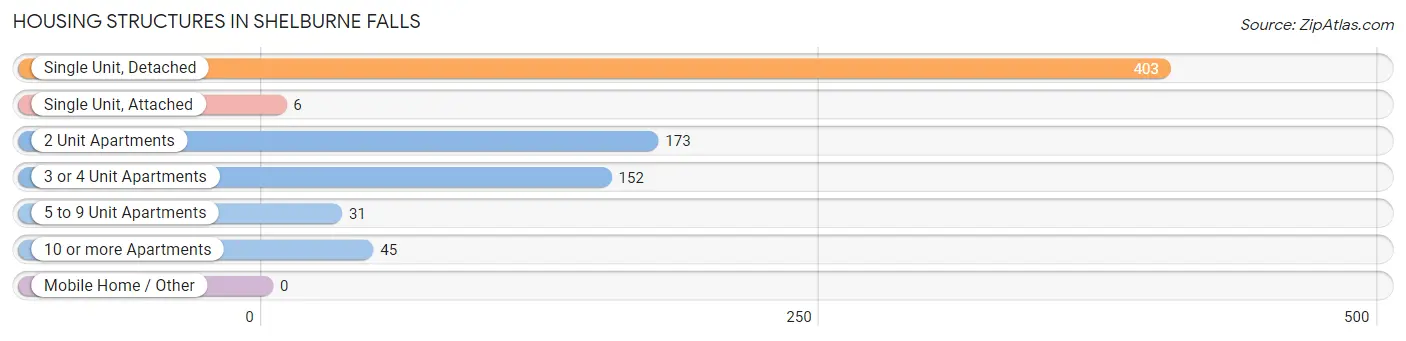
| Structure Type | # Housing Units | % Housing Units |
| Single Unit, Detached | 403 | 49.7% |
| Single Unit, Attached | 6 | 0.7% |
| 2 Unit Apartments | 173 | 21.4% |
| 3 or 4 Unit Apartments | 152 | 18.8% |
| 5 to 9 Unit Apartments | 31 | 3.8% |
| 10 or more Apartments | 45 | 5.6% |
| Mobile Home / Other | 0 | 0.0% |
| Total | 810 | 100.0% |
Housing Structures by Occupancy in Shelburne Falls
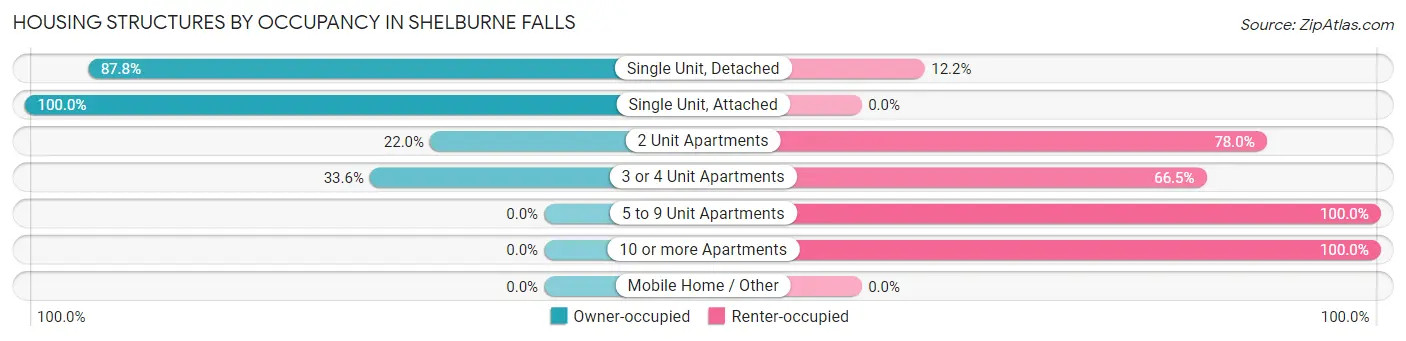
| Structure Type | Owner-occupied | Renter-occupied |
| Single Unit, Detached | 354 (87.8%) | 49 (12.2%) |
| Single Unit, Attached | 6 (100.0%) | 0 (0.0%) |
| 2 Unit Apartments | 38 (22.0%) | 135 (78.0%) |
| 3 or 4 Unit Apartments | 51 (33.6%) | 101 (66.4%) |
| 5 to 9 Unit Apartments | 0 (0.0%) | 31 (100.0%) |
| 10 or more Apartments | 0 (0.0%) | 45 (100.0%) |
| Mobile Home / Other | 0 (0.0%) | 0 (0.0%) |
| Total | 449 (55.4%) | 361 (44.6%) |
Housing Structures by Number of Rooms in Shelburne Falls
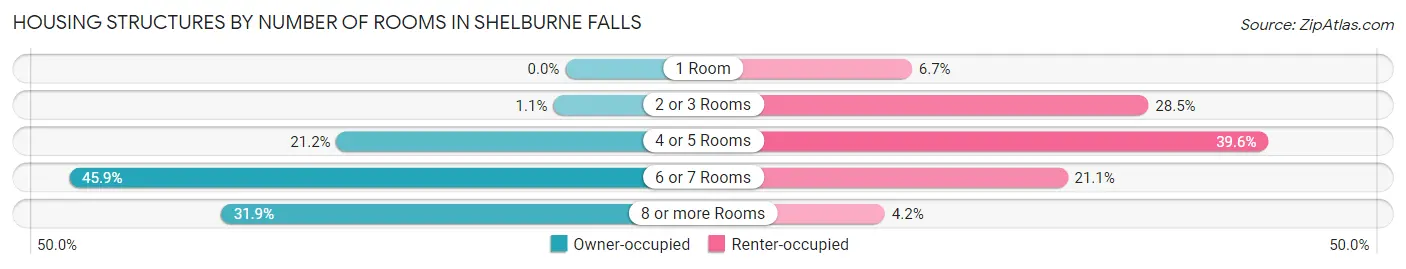
| Number of Rooms | Owner-occupied | Renter-occupied |
| 1 Room | 0 (0.0%) | 24 (6.7%) |
| 2 or 3 Rooms | 5 (1.1%) | 103 (28.5%) |
| 4 or 5 Rooms | 95 (21.2%) | 143 (39.6%) |
| 6 or 7 Rooms | 206 (45.9%) | 76 (21.0%) |
| 8 or more Rooms | 143 (31.9%) | 15 (4.2%) |
| Total | 449 (100.0%) | 361 (100.0%) |
Housing Structure by Heating Type in Shelburne Falls
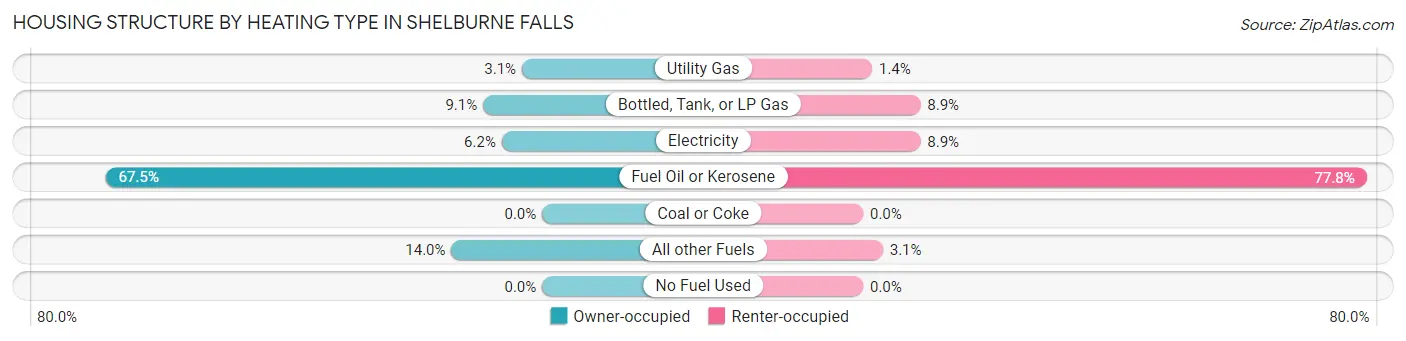
| Heating Type | Owner-occupied | Renter-occupied |
| Utility Gas | 14 (3.1%) | 5 (1.4%) |
| Bottled, Tank, or LP Gas | 41 (9.1%) | 32 (8.9%) |
| Electricity | 28 (6.2%) | 32 (8.9%) |
| Fuel Oil or Kerosene | 303 (67.5%) | 281 (77.8%) |
| Coal or Coke | 0 (0.0%) | 0 (0.0%) |
| All other Fuels | 63 (14.0%) | 11 (3.0%) |
| No Fuel Used | 0 (0.0%) | 0 (0.0%) |
| Total | 449 (100.0%) | 361 (100.0%) |
Household Vehicle Usage in Shelburne Falls
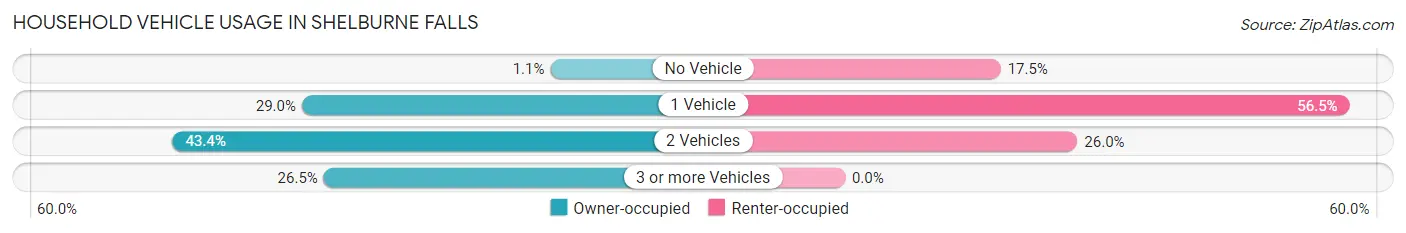
| Vehicles per Household | Owner-occupied | Renter-occupied |
| No Vehicle | 5 (1.1%) | 63 (17.4%) |
| 1 Vehicle | 130 (28.9%) | 204 (56.5%) |
| 2 Vehicles | 195 (43.4%) | 94 (26.0%) |
| 3 or more Vehicles | 119 (26.5%) | 0 (0.0%) |
| Total | 449 (100.0%) | 361 (100.0%) |
Real Estate & Mortgages in Shelburne Falls
Real Estate and Mortgage Overview in Shelburne Falls
| Characteristic | Without Mortgage | With Mortgage |
| Housing Units | 177 | 272 |
| Median Property Value | $309,000 | $285,800 |
| Median Household Income | $58,750 | $53 |
| Monthly Housing Costs | $792 | $19 |
| Real Estate Taxes | $4,633 | $0 |
Property Value by Mortgage Status in Shelburne Falls
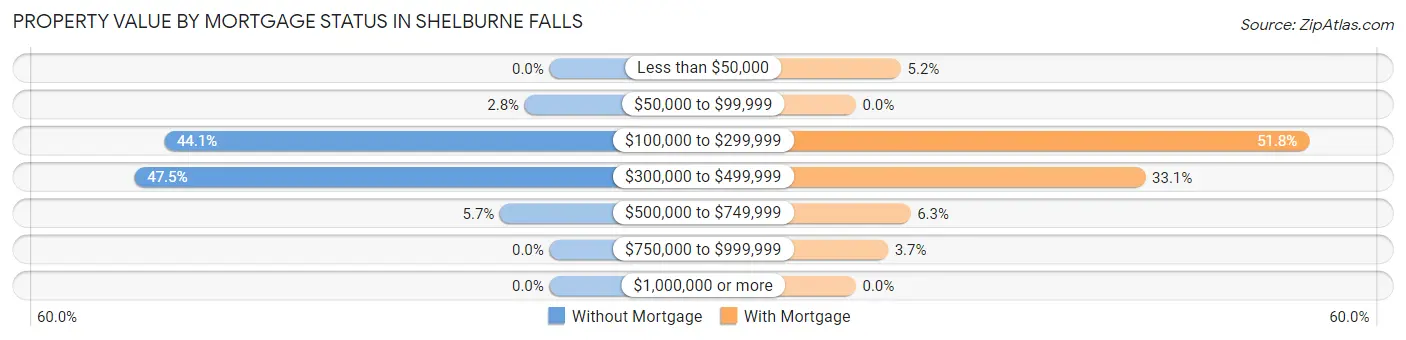
| Property Value | Without Mortgage | With Mortgage |
| Less than $50,000 | 0 (0.0%) | 14 (5.1%) |
| $50,000 to $99,999 | 5 (2.8%) | 0 (0.0%) |
| $100,000 to $299,999 | 78 (44.1%) | 141 (51.8%) |
| $300,000 to $499,999 | 84 (47.5%) | 90 (33.1%) |
| $500,000 to $749,999 | 10 (5.7%) | 17 (6.2%) |
| $750,000 to $999,999 | 0 (0.0%) | 10 (3.7%) |
| $1,000,000 or more | 0 (0.0%) | 0 (0.0%) |
| Total | 177 (100.0%) | 272 (100.0%) |
Household Income by Mortgage Status in Shelburne Falls
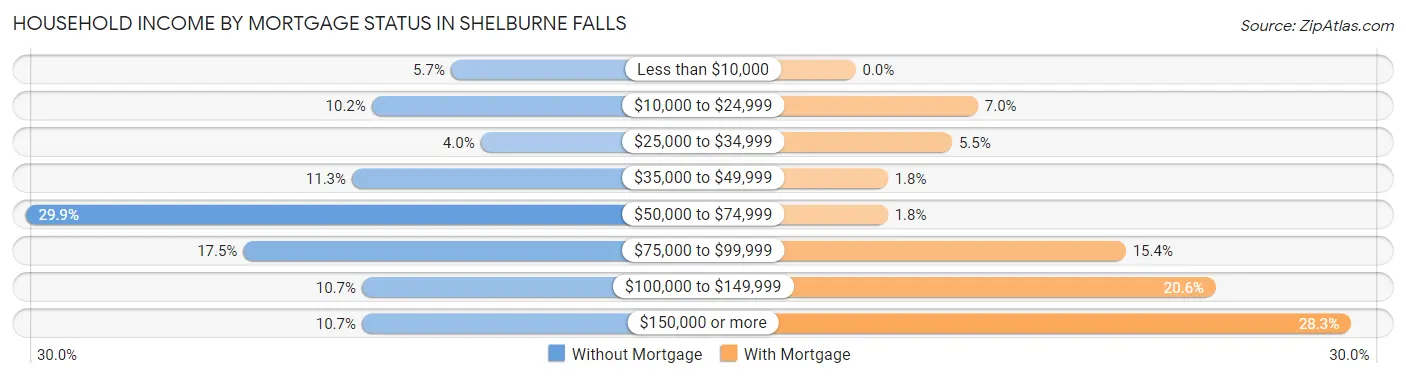
| Household Income | Without Mortgage | With Mortgage |
| Less than $10,000 | 10 (5.7%) | 0 (0.0%) |
| $10,000 to $24,999 | 18 (10.2%) | 19 (7.0%) |
| $25,000 to $34,999 | 7 (4.0%) | 15 (5.5%) |
| $35,000 to $49,999 | 20 (11.3%) | 5 (1.8%) |
| $50,000 to $74,999 | 53 (29.9%) | 5 (1.8%) |
| $75,000 to $99,999 | 31 (17.5%) | 42 (15.4%) |
| $100,000 to $149,999 | 19 (10.7%) | 56 (20.6%) |
| $150,000 or more | 19 (10.7%) | 77 (28.3%) |
| Total | 177 (100.0%) | 272 (100.0%) |
Property Value to Household Income Ratio in Shelburne Falls
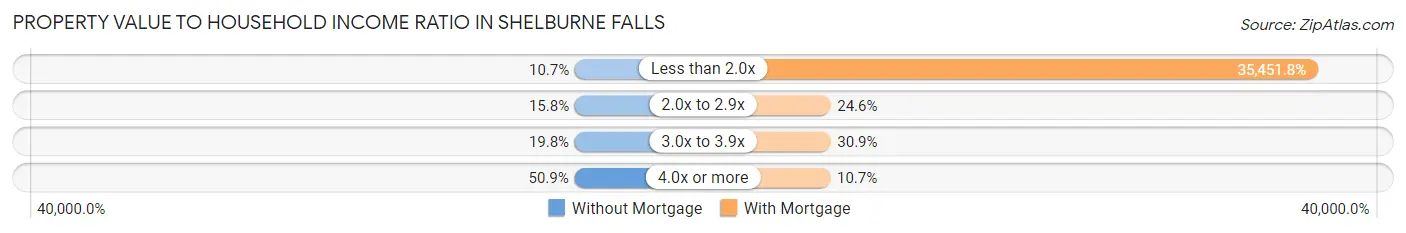
| Value-to-Income Ratio | Without Mortgage | With Mortgage |
| Less than 2.0x | 19 (10.7%) | 96,429 (35,451.8%) |
| 2.0x to 2.9x | 28 (15.8%) | 67 (24.6%) |
| 3.0x to 3.9x | 35 (19.8%) | 84 (30.9%) |
| 4.0x or more | 90 (50.8%) | 29 (10.7%) |
| Total | 177 (100.0%) | 272 (100.0%) |
Real Estate Taxes by Mortgage Status in Shelburne Falls
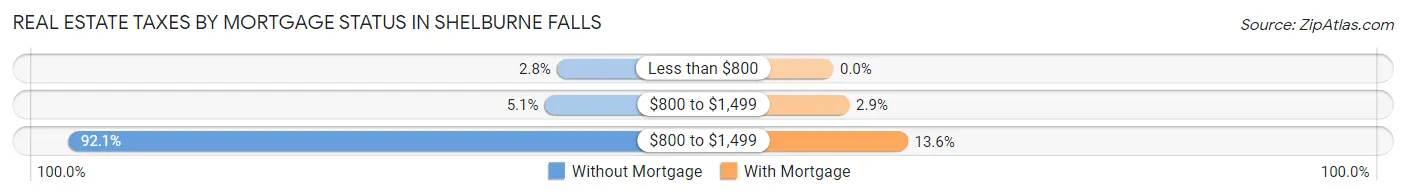
| Property Taxes | Without Mortgage | With Mortgage |
| Less than $800 | 5 (2.8%) | 0 (0.0%) |
| $800 to $1,499 | 9 (5.1%) | 8 (2.9%) |
| $800 to $1,499 | 163 (92.1%) | 37 (13.6%) |
| Total | 177 (100.0%) | 272 (100.0%) |
Health & Disability in Shelburne Falls
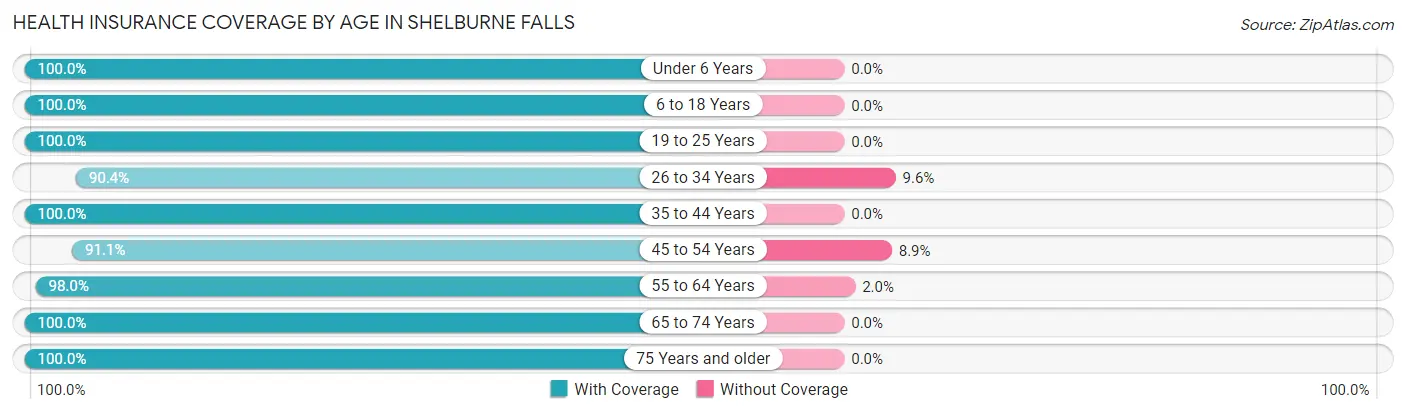
Health Insurance Coverage by Age in Shelburne Falls
| Age Bracket | With Coverage | Without Coverage |
| Under 6 Years | 82 (100.0%) | 0 (0.0%) |
| 6 to 18 Years | 222 (100.0%) | 0 (0.0%) |
| 19 to 25 Years | 104 (100.0%) | 0 (0.0%) |
| 26 to 34 Years | 104 (90.4%) | 11 (9.6%) |
| 35 to 44 Years | 194 (100.0%) | 0 (0.0%) |
| 45 to 54 Years | 216 (91.1%) | 21 (8.9%) |
| 55 to 64 Years | 288 (98.0%) | 6 (2.0%) |
| 65 to 74 Years | 287 (100.0%) | 0 (0.0%) |
| 75 Years and older | 164 (100.0%) | 0 (0.0%) |
| Total | 1,661 (97.8%) | 38 (2.2%) |
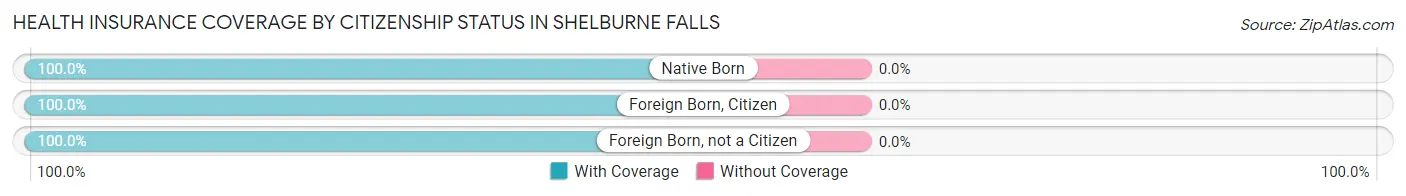
Health Insurance Coverage by Citizenship Status in Shelburne Falls
| Citizenship Status | With Coverage | Without Coverage |
| Native Born | 82 (100.0%) | 0 (0.0%) |
| Foreign Born, Citizen | 222 (100.0%) | 0 (0.0%) |
| Foreign Born, not a Citizen | 104 (100.0%) | 0 (0.0%) |
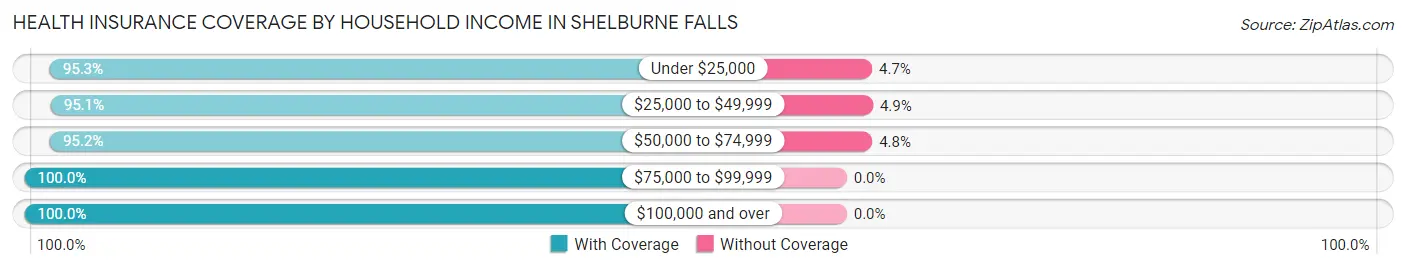
Health Insurance Coverage by Household Income in Shelburne Falls
| Household Income | With Coverage | Without Coverage |
| Under $25,000 | 221 (95.3%) | 11 (4.7%) |
| $25,000 to $49,999 | 310 (95.1%) | 16 (4.9%) |
| $50,000 to $74,999 | 220 (95.2%) | 11 (4.8%) |
| $75,000 to $99,999 | 320 (100.0%) | 0 (0.0%) |
| $100,000 and over | 544 (100.0%) | 0 (0.0%) |
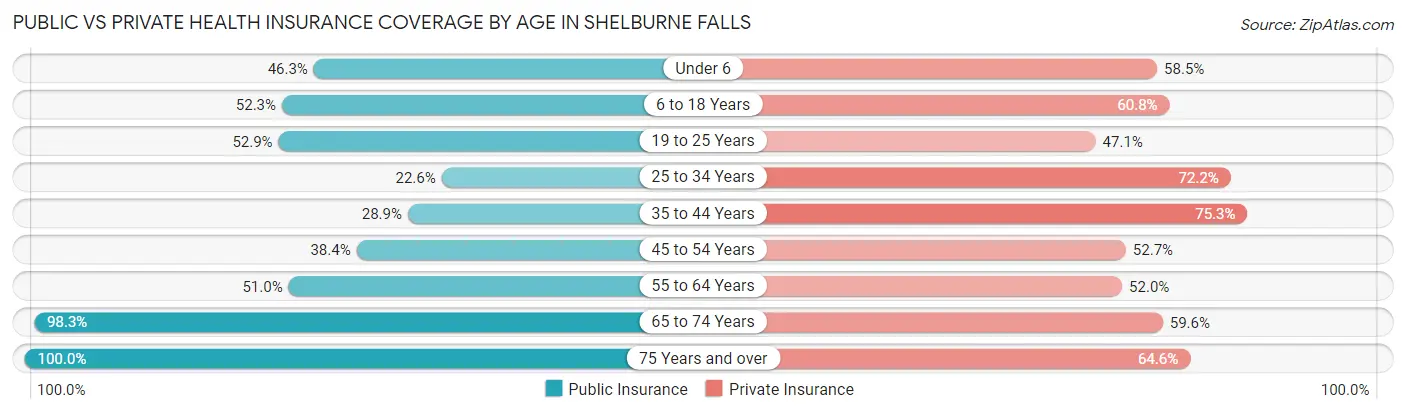
Public vs Private Health Insurance Coverage by Age in Shelburne Falls
| Age Bracket | Public Insurance | Private Insurance |
| Under 6 | 38 (46.3%) | 48 (58.5%) |
| 6 to 18 Years | 116 (52.2%) | 135 (60.8%) |
| 19 to 25 Years | 55 (52.9%) | 49 (47.1%) |
| 25 to 34 Years | 26 (22.6%) | 83 (72.2%) |
| 35 to 44 Years | 56 (28.9%) | 146 (75.3%) |
| 45 to 54 Years | 91 (38.4%) | 125 (52.7%) |
| 55 to 64 Years | 150 (51.0%) | 153 (52.0%) |
| 65 to 74 Years | 282 (98.3%) | 171 (59.6%) |
| 75 Years and over | 164 (100.0%) | 106 (64.6%) |
| Total | 978 (57.6%) | 1,016 (59.8%) |
Disability Status by Sex by Age in Shelburne Falls
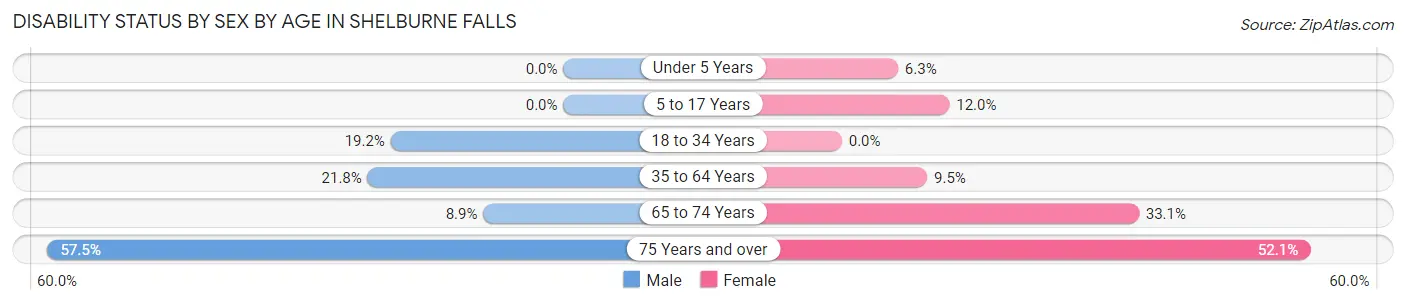
| Age Bracket | Male | Female |
| Under 5 Years | 0 (0.0%) | 2 (6.2%) |
| 5 to 17 Years | 0 (0.0%) | 14 (12.0%) |
| 18 to 34 Years | 25 (19.2%) | 0 (0.0%) |
| 35 to 64 Years | 80 (21.8%) | 34 (9.5%) |
| 65 to 74 Years | 14 (8.9%) | 43 (33.1%) |
| 75 Years and over | 27 (57.5%) | 61 (52.1%) |
Disability Class by Sex by Age in Shelburne Falls
Disability Class: Hearing Difficulty
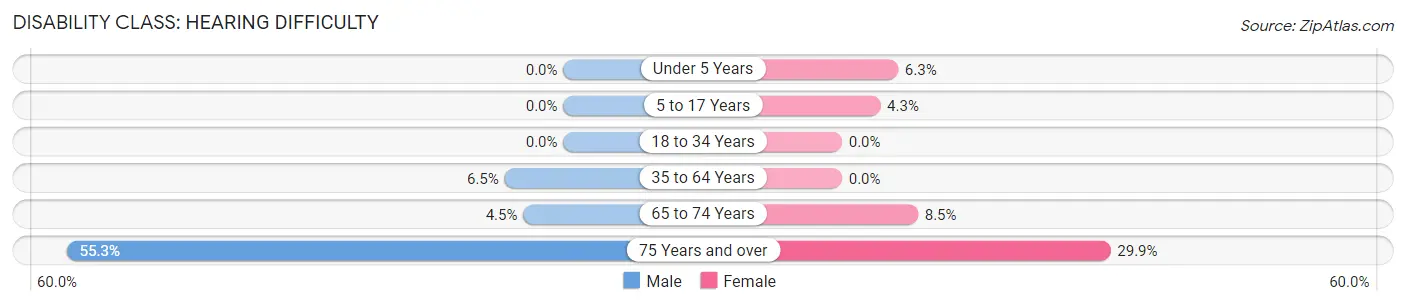
| Age Bracket | Male | Female |
| Under 5 Years | 0 (0.0%) | 2 (6.2%) |
| 5 to 17 Years | 0 (0.0%) | 5 (4.3%) |
| 18 to 34 Years | 0 (0.0%) | 0 (0.0%) |
| 35 to 64 Years | 24 (6.5%) | 0 (0.0%) |
| 65 to 74 Years | 7 (4.5%) | 11 (8.5%) |
| 75 Years and over | 26 (55.3%) | 35 (29.9%) |
Disability Class: Vision Difficulty
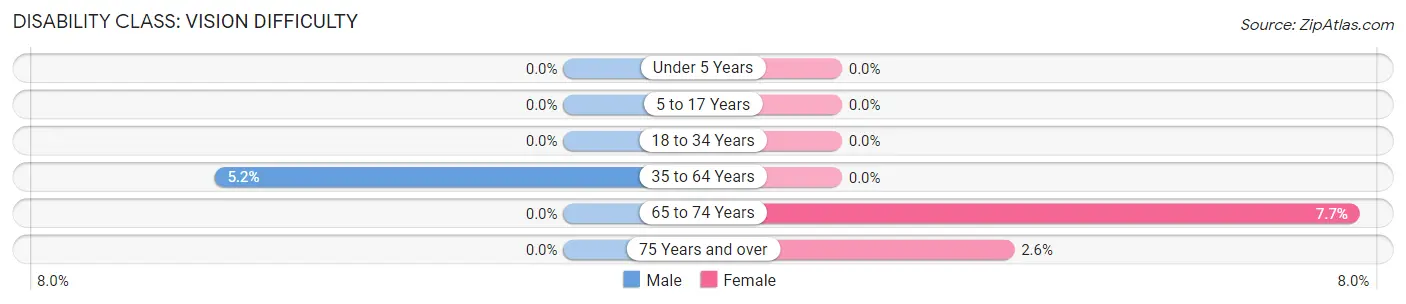
| Age Bracket | Male | Female |
| Under 5 Years | 0 (0.0%) | 0 (0.0%) |
| 5 to 17 Years | 0 (0.0%) | 0 (0.0%) |
| 18 to 34 Years | 0 (0.0%) | 0 (0.0%) |
| 35 to 64 Years | 19 (5.2%) | 0 (0.0%) |
| 65 to 74 Years | 0 (0.0%) | 10 (7.7%) |
| 75 Years and over | 0 (0.0%) | 3 (2.6%) |
Disability Class: Cognitive Difficulty
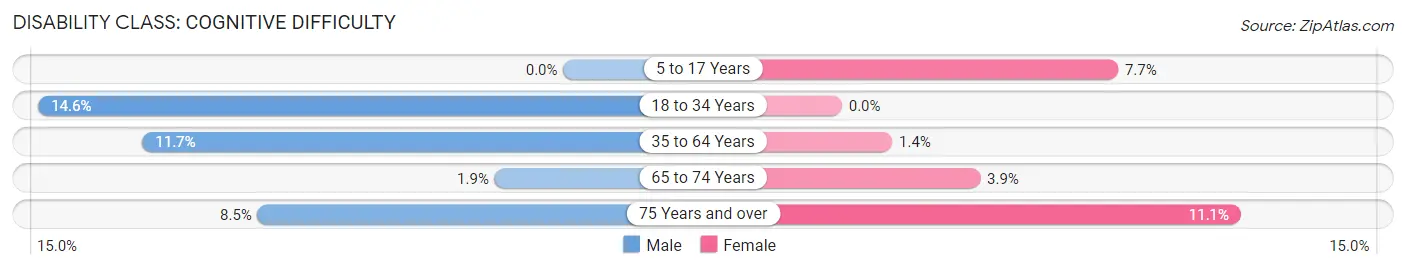
| Age Bracket | Male | Female |
| 5 to 17 Years | 0 (0.0%) | 9 (7.7%) |
| 18 to 34 Years | 19 (14.6%) | 0 (0.0%) |
| 35 to 64 Years | 43 (11.7%) | 5 (1.4%) |
| 65 to 74 Years | 3 (1.9%) | 5 (3.8%) |
| 75 Years and over | 4 (8.5%) | 13 (11.1%) |
Disability Class: Ambulatory Difficulty
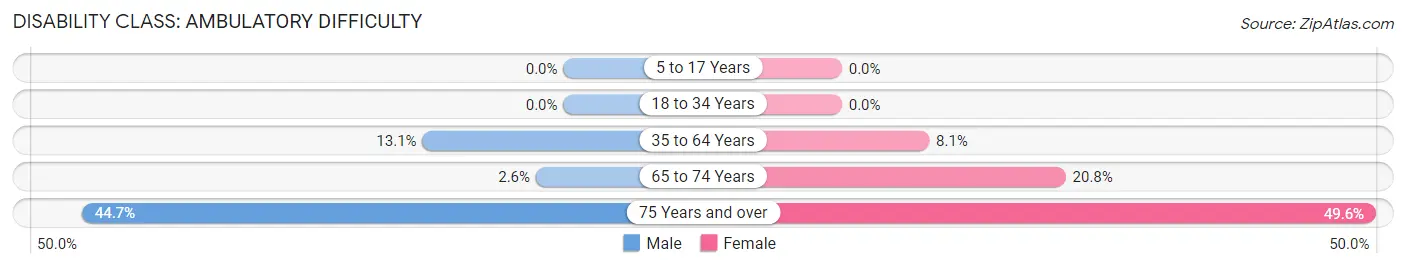
| Age Bracket | Male | Female |
| 5 to 17 Years | 0 (0.0%) | 0 (0.0%) |
| 18 to 34 Years | 0 (0.0%) | 0 (0.0%) |
| 35 to 64 Years | 48 (13.1%) | 29 (8.1%) |
| 65 to 74 Years | 4 (2.5%) | 27 (20.8%) |
| 75 Years and over | 21 (44.7%) | 58 (49.6%) |
Disability Class: Self-Care Difficulty
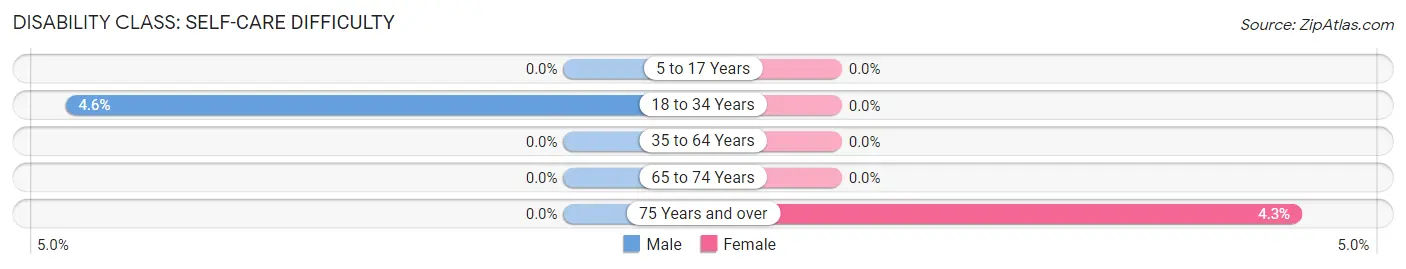
| Age Bracket | Male | Female |
| 5 to 17 Years | 0 (0.0%) | 0 (0.0%) |
| 18 to 34 Years | 6 (4.6%) | 0 (0.0%) |
| 35 to 64 Years | 0 (0.0%) | 0 (0.0%) |
| 65 to 74 Years | 0 (0.0%) | 0 (0.0%) |
| 75 Years and over | 0 (0.0%) | 5 (4.3%) |
Technology Access in Shelburne Falls
Computing Device Access in Shelburne Falls
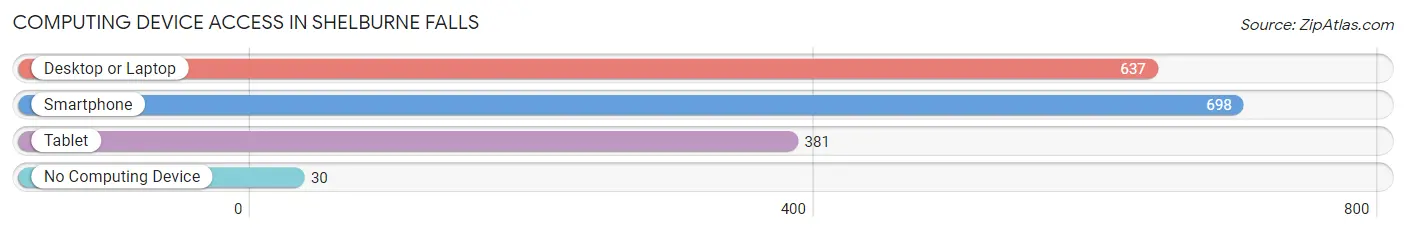
| Device Type | # Households | % Households |
| Desktop or Laptop | 637 | 78.6% |
| Smartphone | 698 | 86.2% |
| Tablet | 381 | 47.0% |
| No Computing Device | 30 | 3.7% |
| Total | 810 | 100.0% |
Internet Access in Shelburne Falls
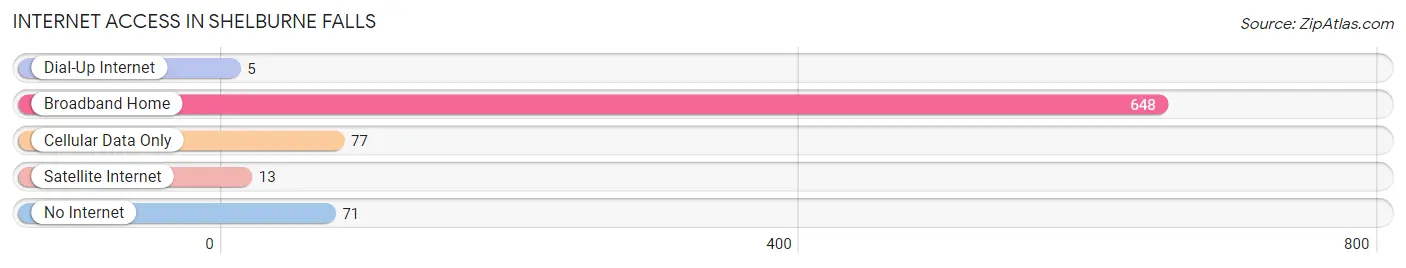
| Internet Type | # Households | % Households |
| Dial-Up Internet | 5 | 0.6% |
| Broadband Home | 648 | 80.0% |
| Cellular Data Only | 77 | 9.5% |
| Satellite Internet | 13 | 1.6% |
| No Internet | 71 | 8.8% |
| Total | 810 | 100.0% |
Shelburne Falls Summary
Shelburne Falls is a small village located in the foothills of the Berkshire Mountains in western Massachusetts. It is situated in the town of Shelburne, which is part of the county of Franklin. The village is located on the banks of the Deerfield River, which is a tributary of the Connecticut River. Shelburne Falls is known for its picturesque beauty, its historic architecture, and its vibrant arts and culture scene.
Geography
Shelburne Falls is located in the foothills of the Berkshire Mountains in western Massachusetts. It is situated in the town of Shelburne, which is part of the county of Franklin. The village is located on the banks of the Deerfield River, which is a tributary of the Connecticut River. The village is surrounded by the towns of Buckland, Conway, Deerfield, and Charlemont. The village is located at an elevation of approximately 500 feet above sea level.
The village is situated in a valley surrounded by hills and mountains. The highest point in the area is Mount Toby, which is located just to the north of the village. The village is located in a temperate climate zone, with warm summers and cold winters. The average annual temperature is around 50 degrees Fahrenheit.
Economy
Shelburne Falls is a small village with a population of just over 1,000 people. The village is home to a variety of small businesses, including restaurants, shops, and galleries. The village is also home to a number of small manufacturing companies, including a paper mill and a furniture factory. The village is also home to a number of small farms, which produce a variety of fruits and vegetables.
The village is also home to a number of tourist attractions, including the Bridge of Flowers, the Shelburne Falls Trolley Museum, and the Shelburne Falls Farmers Market. The village is also home to a number of art galleries, which feature the work of local artists.
Demographics
As of the 2010 census, the population of Shelburne Falls was 1,051. The racial makeup of the village was 97.3% White, 0.7% African American, 0.2% Native American, 0.3% Asian, 0.1% Pacific Islander, 0.3% from other races, and 1.3% from two or more races. Hispanic or Latino of any race were 1.3% of the population.
The median income for a household in the village was $45,625, and the median income for a family was $50,000. The per capita income for the village was $20,945. About 8.3% of families and 10.2% of the population were below the poverty line, including 14.3% of those under age 18 and 5.3% of those age 65 or over.
History
Shelburne Falls was first settled in 1745 by settlers from Deerfield. The village was originally known as "Deerfield Falls" and was later renamed "Shelburne Falls" after the Earl of Shelburne, who was a prominent British politician at the time. The village was an important stop on the stagecoach route between Boston and Albany, and it was also an important stop on the railroad line between Boston and Albany.
The village was an important center of industry in the 19th century, with a number of mills and factories located in the area. The village was also home to a number of artists and writers, including the poet Robert Frost, who lived in the village for a time.
The village is now known for its picturesque beauty, its historic architecture, and its vibrant arts and culture scene. The village is home to a number of tourist attractions, including the Bridge of Flowers, the Shelburne Falls Trolley Museum, and the Shelburne Falls Farmers Market. The village is also home to a number of art galleries, which feature the work of local artists.
Common Questions
What is Per Capita Income in Shelburne Falls?
Per Capita income in Shelburne Falls is $35,677.
What is the Median Family Income in Shelburne Falls?
Median Family Income in Shelburne Falls is $79,934.
What is the Median Household income in Shelburne Falls?
Median Household Income in Shelburne Falls is $54,250.
What is Income or Wage Gap in Shelburne Falls?
Income or Wage Gap in Shelburne Falls is 18.1%.
Women in Shelburne Falls earn 81.9 cents for every dollar earned by a man.
What is Inequality or Gini Index in Shelburne Falls?
Inequality or Gini Index in Shelburne Falls is 0.45.
What is the Total Population of Shelburne Falls?
Total Population of Shelburne Falls is 1,699.
What is the Total Male Population of Shelburne Falls?
Total Male Population of Shelburne Falls is 836.
What is the Total Female Population of Shelburne Falls?
Total Female Population of Shelburne Falls is 863.
What is the Ratio of Males per 100 Females in Shelburne Falls?
There are 96.87 Males per 100 Females in Shelburne Falls.
What is the Ratio of Females per 100 Males in Shelburne Falls?
There are 103.23 Females per 100 Males in Shelburne Falls.
What is the Median Population Age in Shelburne Falls?
Median Population Age in Shelburne Falls is 50.0 Years.
What is the Average Family Size in Shelburne Falls
Average Family Size in Shelburne Falls is 2.7 People.
What is the Average Household Size in Shelburne Falls
Average Household Size in Shelburne Falls is 2.0 People.
How Large is the Labor Force in Shelburne Falls?
There are 869 People in the Labor Forcein in Shelburne Falls.
What is the Percentage of People in the Labor Force in Shelburne Falls?
60.6% of People are in the Labor Force in Shelburne Falls.
What is the Unemployment Rate in Shelburne Falls?
Unemployment Rate in Shelburne Falls is 7.1%.