Southbridge Town, MA Map & Demographics
Southbridge Town Map
Southbridge Town Overview
$31,102
PER CAPITA INCOME
$72,456
AVG FAMILY INCOME
$55,182
AVG HOUSEHOLD INCOME
23.9%
WAGE / INCOME GAP [ % ]
76.1¢/ $1
WAGE / INCOME GAP [ $ ]
$10,580
FAMILY INCOME DEFICIT
0.46
INEQUALITY / GINI INDEX
17,669
TOTAL POPULATION
8,599
MALE POPULATION
9,070
FEMALE POPULATION
94.81
MALES / 100 FEMALES
105.48
FEMALES / 100 MALES
38.6
MEDIAN AGE
3.0
AVG FAMILY SIZE
2.5
AVG HOUSEHOLD SIZE
9,159
LABOR FORCE [ PEOPLE ]
63.7%
PERCENT IN LABOR FORCE
9.2%
UNEMPLOYMENT RATE
Income in Southbridge Town
Income Overview in Southbridge Town
Per Capita Income in Southbridge Town is $31,102, while median incomes of families and households are $72,456 and $55,182 respectively.
| Characteristic | Number | Measure |
| Per Capita Income | 17,669 | $31,102 |
| Median Family Income | 4,494 | $72,456 |
| Mean Family Income | 4,494 | $84,939 |
| Median Household Income | 7,030 | $55,182 |
| Mean Household Income | 7,030 | $72,883 |
| Income Deficit | 4,494 | $10,580 |
| Wage / Income Gap (%) | 17,669 | 23.94% |
| Wage / Income Gap ($) | 17,669 | 76.06¢ per $1 |
| Gini / Inequality Index | 17,669 | 0.46 |
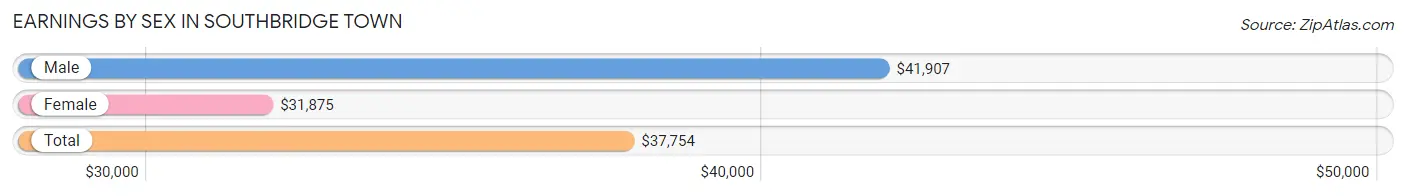
Earnings by Sex in Southbridge Town
Average Earnings in Southbridge Town are $37,754, $41,907 for men and $31,875 for women, a difference of 23.9%.
| Sex | Number | Average Earnings |
| Male | 4,798 (52.2%) | $41,907 |
| Female | 4,401 (47.8%) | $31,875 |
| Total | 9,199 (100.0%) | $37,754 |
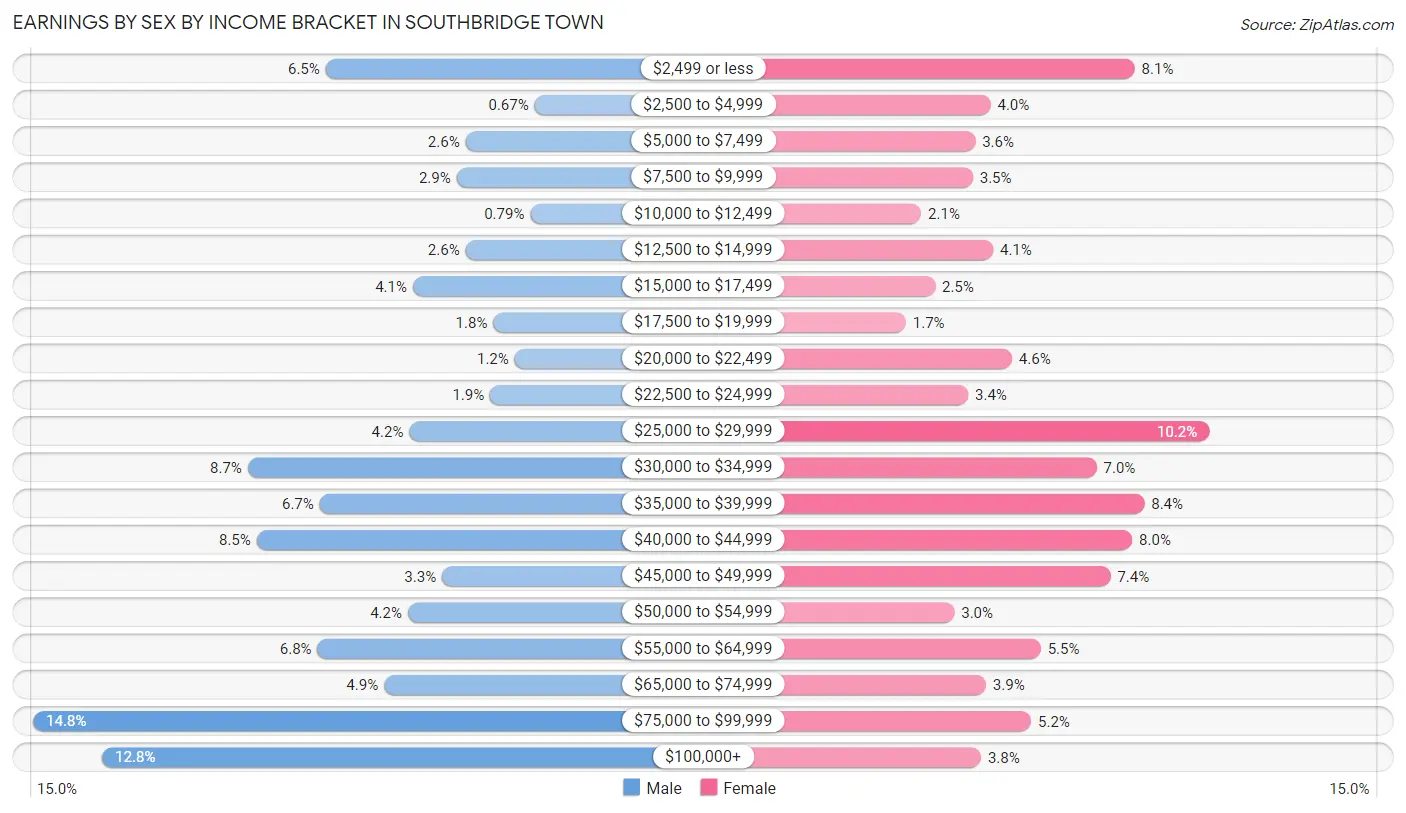
Earnings by Sex by Income Bracket in Southbridge Town
The most common earnings brackets in Southbridge Town are $75,000 to $99,999 for men (708 | 14.8%) and $25,000 to $29,999 for women (448 | 10.2%).
| Income | Male | Female |
| $2,499 or less | 314 (6.5%) | 356 (8.1%) |
| $2,500 to $4,999 | 32 (0.7%) | 178 (4.0%) |
| $5,000 to $7,499 | 125 (2.6%) | 159 (3.6%) |
| $7,500 to $9,999 | 137 (2.9%) | 156 (3.5%) |
| $10,000 to $12,499 | 38 (0.8%) | 92 (2.1%) |
| $12,500 to $14,999 | 125 (2.6%) | 181 (4.1%) |
| $15,000 to $17,499 | 196 (4.1%) | 109 (2.5%) |
| $17,500 to $19,999 | 88 (1.8%) | 73 (1.7%) |
| $20,000 to $22,499 | 59 (1.2%) | 204 (4.6%) |
| $22,500 to $24,999 | 92 (1.9%) | 150 (3.4%) |
| $25,000 to $29,999 | 201 (4.2%) | 448 (10.2%) |
| $30,000 to $34,999 | 419 (8.7%) | 309 (7.0%) |
| $35,000 to $39,999 | 322 (6.7%) | 368 (8.4%) |
| $40,000 to $44,999 | 407 (8.5%) | 353 (8.0%) |
| $45,000 to $49,999 | 157 (3.3%) | 326 (7.4%) |
| $50,000 to $54,999 | 203 (4.2%) | 133 (3.0%) |
| $55,000 to $64,999 | 325 (6.8%) | 240 (5.4%) |
| $65,000 to $74,999 | 235 (4.9%) | 172 (3.9%) |
| $75,000 to $99,999 | 708 (14.8%) | 228 (5.2%) |
| $100,000+ | 615 (12.8%) | 166 (3.8%) |
| Total | 4,798 (100.0%) | 4,401 (100.0%) |
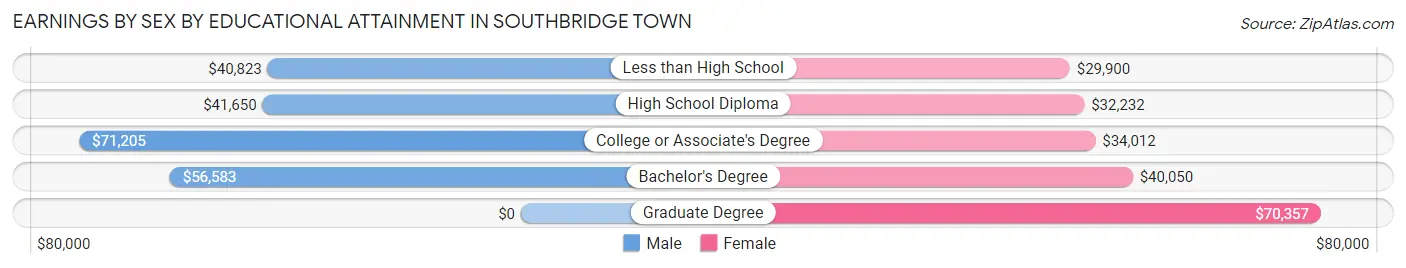
Earnings by Sex by Educational Attainment in Southbridge Town
Average earnings in Southbridge Town are $54,167 for men and $35,498 for women, a difference of 34.5%. Men with an educational attainment of college or associate's degree enjoy the highest average annual earnings of $71,205, while those with less than high school education earn the least with $40,823. Women with an educational attainment of graduate degree earn the most with the average annual earnings of $70,357, while those with less than high school education have the smallest earnings of $29,900.
| Educational Attainment | Male Income | Female Income |
| Less than High School | $40,823 | $29,900 |
| High School Diploma | $41,650 | $32,232 |
| College or Associate's Degree | $71,205 | $34,012 |
| Bachelor's Degree | $56,583 | $40,050 |
| Graduate Degree | - | - |
| Total | $54,167 | $35,498 |
Family Income in Southbridge Town
Family Income Brackets in Southbridge Town
According to the Southbridge Town family income data, there are 885 families falling into the $75,000 to $99,999 income range, which is the most common income bracket and makes up 19.7% of all families. Conversely, the $10,000 to $14,999 income bracket is the least frequent group with only 103 families (2.3%) belonging to this category.
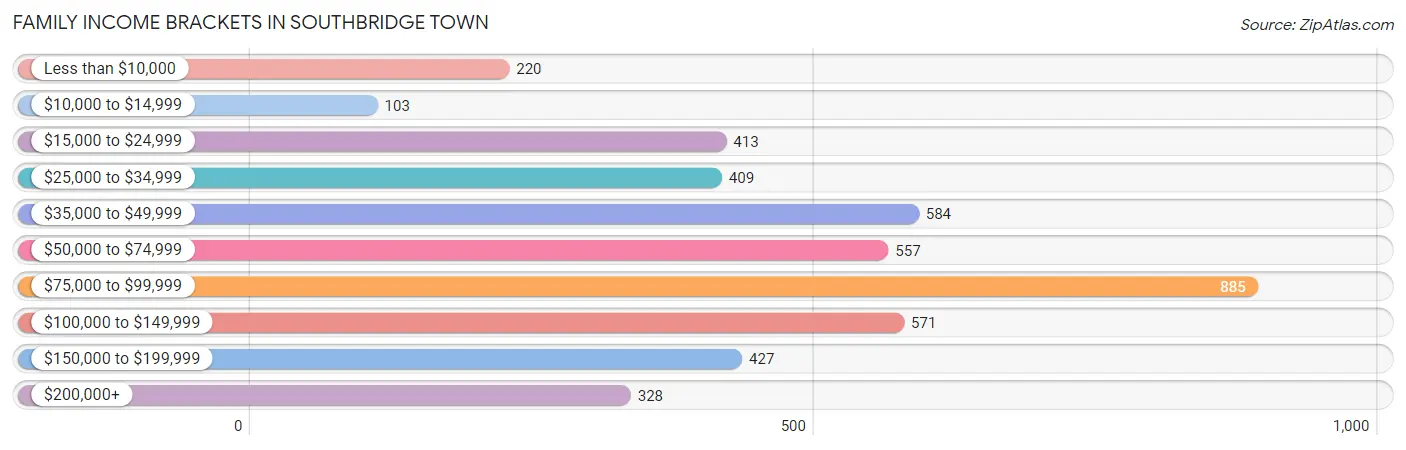
| Income Bracket | # Families | % Families |
| Less than $10,000 | 220 | 4.9% |
| $10,000 to $14,999 | 103 | 2.3% |
| $15,000 to $24,999 | 413 | 9.2% |
| $25,000 to $34,999 | 409 | 9.1% |
| $35,000 to $49,999 | 584 | 13.0% |
| $50,000 to $74,999 | 557 | 12.4% |
| $75,000 to $99,999 | 885 | 19.7% |
| $100,000 to $149,999 | 571 | 12.7% |
| $150,000 to $199,999 | 427 | 9.5% |
| $200,000+ | 328 | 7.3% |
Family Income by Famaliy Size in Southbridge Town
7+ person families (43 | 1.0%) account for the highest median family income in Southbridge Town with $168,688 per family, while 2-person families (2,146 | 47.7%) have the highest median income of $27,224 per family member.
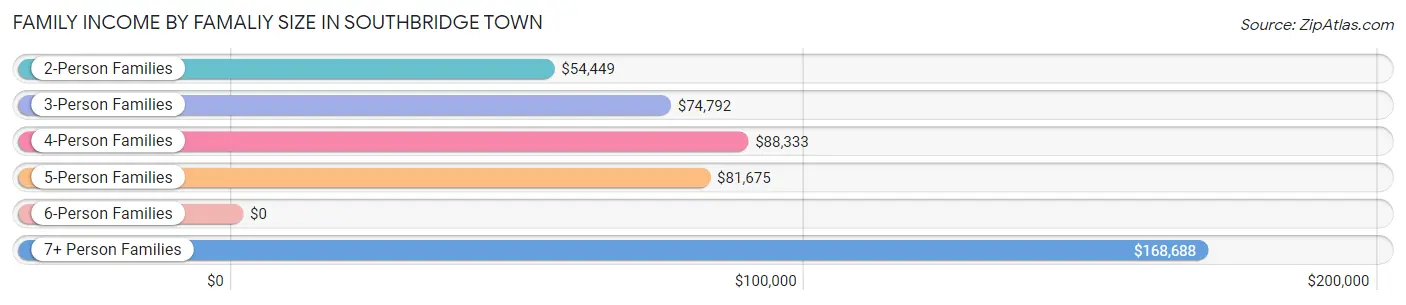
| Income Bracket | # Families | Median Income |
| 2-Person Families | 2,146 (47.7%) | $54,449 |
| 3-Person Families | 1,169 (26.0%) | $74,792 |
| 4-Person Families | 626 (13.9%) | $88,333 |
| 5-Person Families | 407 (9.1%) | $81,675 |
| 6-Person Families | 103 (2.3%) | $0 |
| 7+ Person Families | 43 (1.0%) | $168,688 |
| Total | 4,494 (100.0%) | $72,456 |
Family Income by Number of Earners in Southbridge Town
The median family income in Southbridge Town is $72,456, with families comprising 3+ earners (565) having the highest median family income of $122,083, while families with no earners (586) have the lowest median family income of $28,059, accounting for 12.6% and 13.0% of families, respectively.
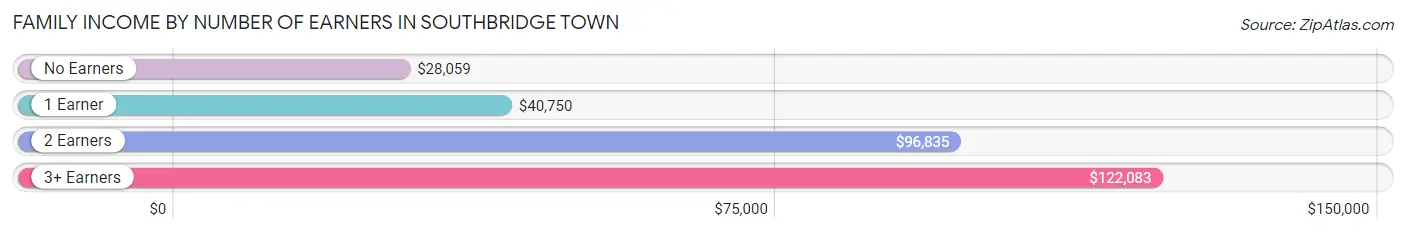
| Number of Earners | # Families | Median Income |
| No Earners | 586 (13.0%) | $28,059 |
| 1 Earner | 1,887 (42.0%) | $40,750 |
| 2 Earners | 1,456 (32.4%) | $96,835 |
| 3+ Earners | 565 (12.6%) | $122,083 |
| Total | 4,494 (100.0%) | $72,456 |
Household Income in Southbridge Town
Household Income Brackets in Southbridge Town
With 1,040 households falling in the category, the $75,000 to $99,999 income range is the most frequent in Southbridge Town, accounting for 14.8% of all households. In contrast, only 337 households (4.8%) fall into the $10,000 to $14,999 income bracket, making it the least populous group.
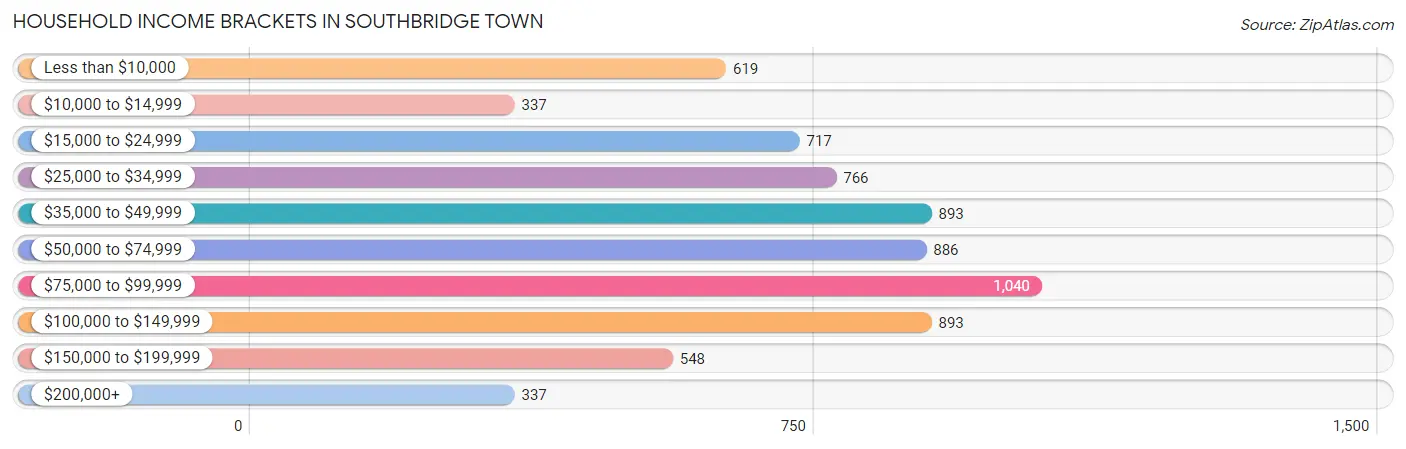
| Income Bracket | # Households | % Households |
| Less than $10,000 | 619 | 8.8% |
| $10,000 to $14,999 | 337 | 4.8% |
| $15,000 to $24,999 | 717 | 10.2% |
| $25,000 to $34,999 | 766 | 10.9% |
| $35,000 to $49,999 | 893 | 12.7% |
| $50,000 to $74,999 | 886 | 12.6% |
| $75,000 to $99,999 | 1,040 | 14.8% |
| $100,000 to $149,999 | 893 | 12.7% |
| $150,000 to $199,999 | 548 | 7.8% |
| $200,000+ | 337 | 4.8% |
Household Income by Householder Age in Southbridge Town
The median household income in Southbridge Town is $55,182, with the highest median household income of $64,486 found in the 45 to 64 years age bracket for the primary householder. A total of 3,095 households (44.0%) fall into this category. Meanwhile, the 65+ years age bracket for the primary householder has the lowest median household income of $30,238, with 1,522 households (21.6%) in this group.
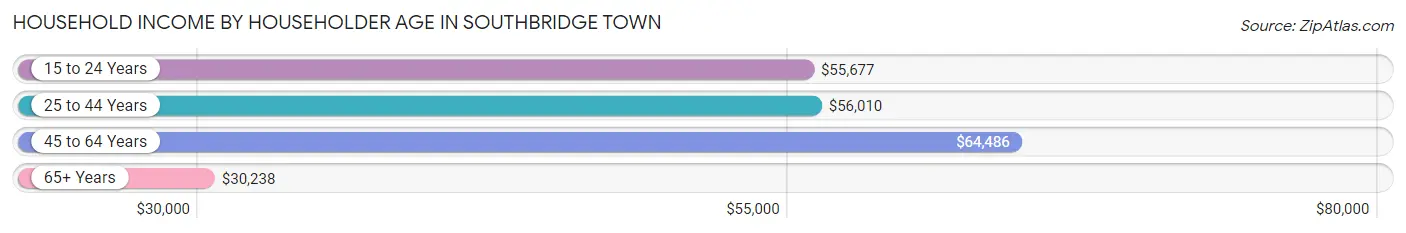
| Income Bracket | # Households | Median Income |
| 15 to 24 Years | 377 (5.4%) | $55,677 |
| 25 to 44 Years | 2,036 (29.0%) | $56,010 |
| 45 to 64 Years | 3,095 (44.0%) | $64,486 |
| 65+ Years | 1,522 (21.6%) | $30,238 |
| Total | 7,030 (100.0%) | $55,182 |
Poverty in Southbridge Town
Income Below Poverty by Sex and Age in Southbridge Town
With 15.1% poverty level for males and 20.6% for females among the residents of Southbridge Town, 5 year old males and 16 and 17 year old females are the most vulnerable to poverty, with 46 males (33.1%) and 109 females (42.7%) in their respective age groups living below the poverty level.
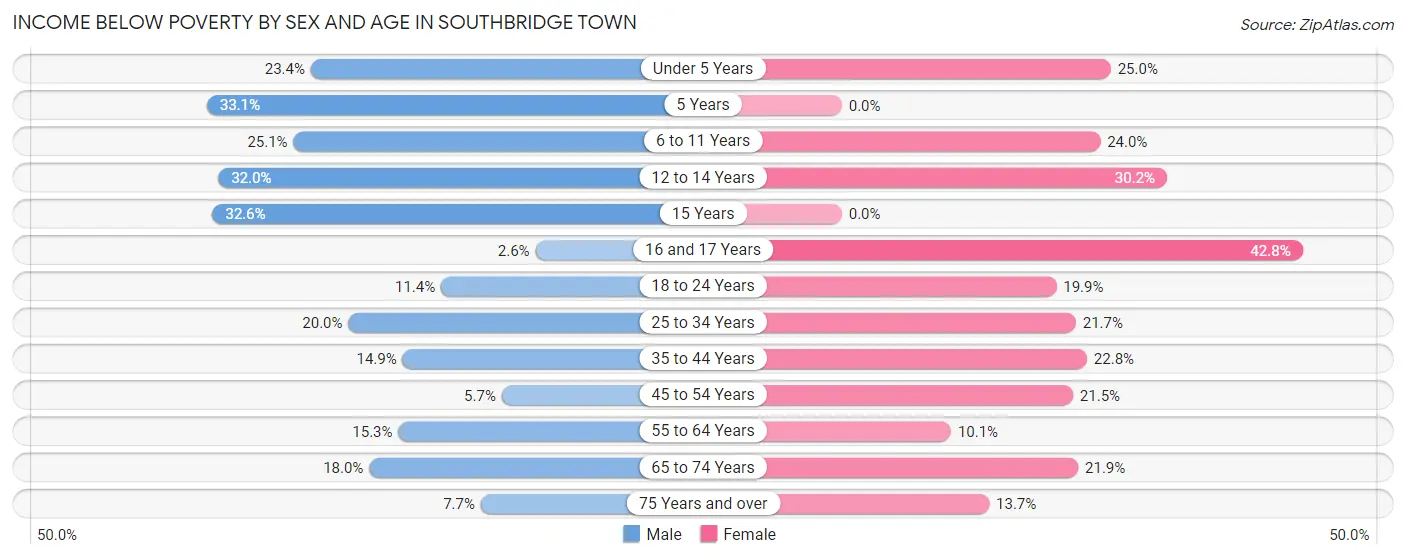
| Age Bracket | Male | Female |
| Under 5 Years | 105 (23.4%) | 154 (25.0%) |
| 5 Years | 46 (33.1%) | 0 (0.0%) |
| 6 to 11 Years | 130 (25.1%) | 117 (24.0%) |
| 12 to 14 Years | 82 (32.0%) | 143 (30.2%) |
| 15 Years | 29 (32.6%) | 0 (0.0%) |
| 16 and 17 Years | 11 (2.6%) | 109 (42.7%) |
| 18 to 24 Years | 136 (11.4%) | 185 (19.9%) |
| 25 to 34 Years | 174 (20.0%) | 263 (21.7%) |
| 35 to 44 Years | 127 (14.9%) | 220 (22.8%) |
| 45 to 54 Years | 73 (5.7%) | 290 (21.4%) |
| 55 to 64 Years | 218 (15.3%) | 106 (10.1%) |
| 65 to 74 Years | 131 (18.0%) | 152 (21.9%) |
| 75 Years and over | 20 (7.7%) | 98 (13.7%) |
| Total | 1,282 (15.1%) | 1,837 (20.6%) |
Income Above Poverty by Sex and Age in Southbridge Town
According to the poverty statistics in Southbridge Town, males aged 16 and 17 years and females aged 5 years are the age groups that are most secure financially, with 97.4% of males and 100.0% of females in these age groups living above the poverty line.
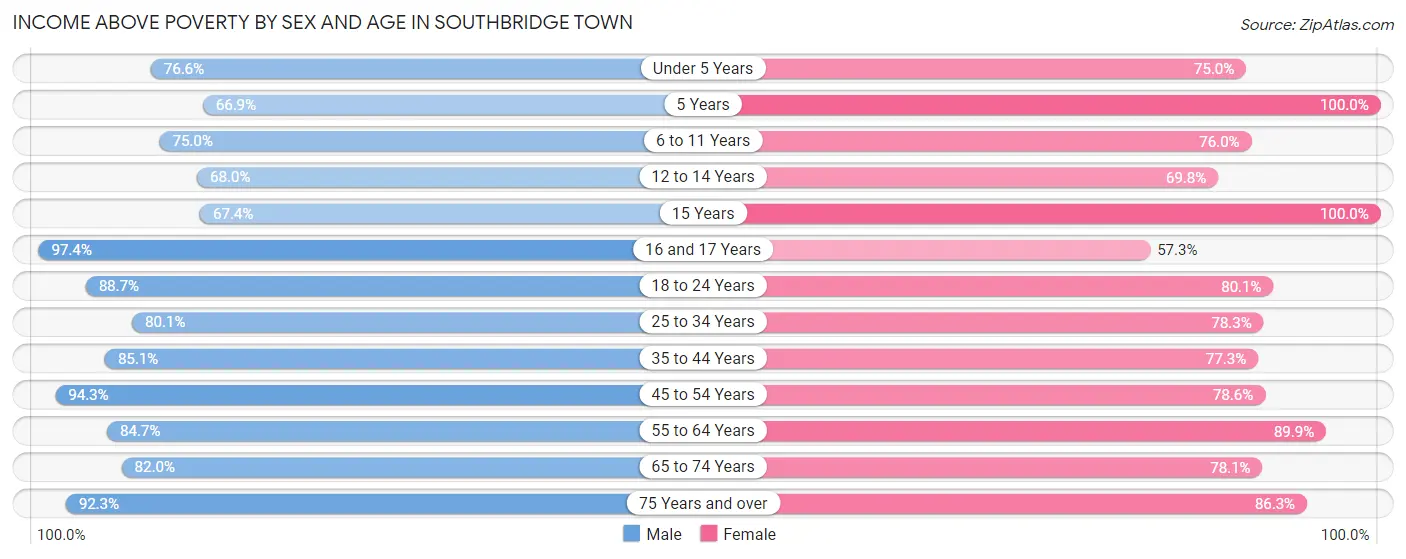
| Age Bracket | Male | Female |
| Under 5 Years | 343 (76.6%) | 463 (75.0%) |
| 5 Years | 93 (66.9%) | 85 (100.0%) |
| 6 to 11 Years | 389 (75.0%) | 371 (76.0%) |
| 12 to 14 Years | 174 (68.0%) | 331 (69.8%) |
| 15 Years | 60 (67.4%) | 70 (100.0%) |
| 16 and 17 Years | 414 (97.4%) | 146 (57.3%) |
| 18 to 24 Years | 1,062 (88.6%) | 744 (80.1%) |
| 25 to 34 Years | 698 (80.0%) | 948 (78.3%) |
| 35 to 44 Years | 724 (85.1%) | 747 (77.2%) |
| 45 to 54 Years | 1,204 (94.3%) | 1,062 (78.5%) |
| 55 to 64 Years | 1,206 (84.7%) | 940 (89.9%) |
| 65 to 74 Years | 596 (82.0%) | 541 (78.1%) |
| 75 Years and over | 241 (92.3%) | 619 (86.3%) |
| Total | 7,204 (84.9%) | 7,067 (79.4%) |
Income Below Poverty Among Married-Couple Families in Southbridge Town
The poverty statistics for married-couple families in Southbridge Town show that 6.9% or 167 of the total 2,406 families live below the poverty line. Families with 5 or more children have the highest poverty rate of 100.0%, comprising of 12 families. On the other hand, families with no children have the lowest poverty rate of 4.7%, which includes 64 families.
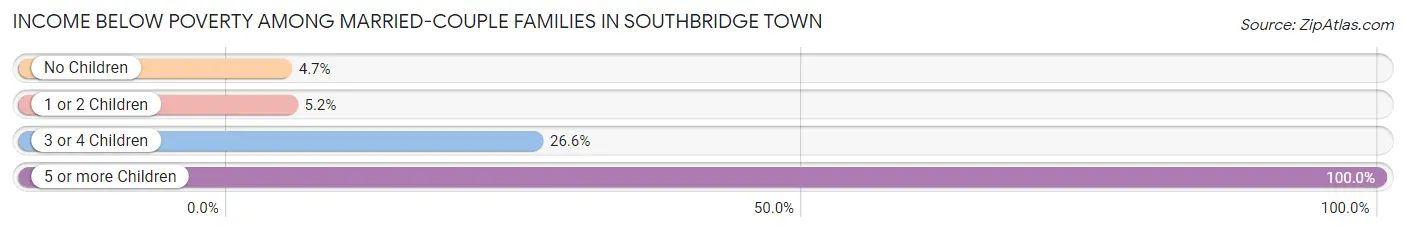
| Children | Above Poverty | Below Poverty |
| No Children | 1,304 (95.3%) | 64 (4.7%) |
| 1 or 2 Children | 805 (94.8%) | 44 (5.2%) |
| 3 or 4 Children | 130 (73.5%) | 47 (26.6%) |
| 5 or more Children | 0 (0.0%) | 12 (100.0%) |
| Total | 2,239 (93.1%) | 167 (6.9%) |
Income Below Poverty Among Single-Parent Households in Southbridge Town
According to the poverty data in Southbridge Town, 11.3% or 80 single-father households and 23.3% or 322 single-mother households are living below the poverty line. Among single-father households, those with no children have the highest poverty rate, with 61 households (20.5%) experiencing poverty. Likewise, among single-mother households, those with 3 or 4 children have the highest poverty rate, with 63 households (78.7%) falling below the poverty line.
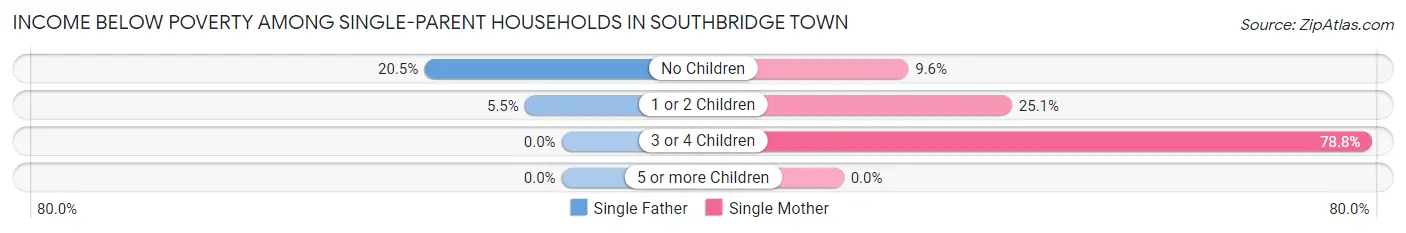
| Children | Single Father | Single Mother |
| No Children | 61 (20.5%) | 42 (9.6%) |
| 1 or 2 Children | 19 (5.5%) | 217 (25.1%) |
| 3 or 4 Children | 0 (0.0%) | 63 (78.7%) |
| 5 or more Children | 0 (0.0%) | 0 (0.0%) |
| Total | 80 (11.3%) | 322 (23.3%) |
Income Below Poverty Among Married-Couple vs Single-Parent Households in Southbridge Town
The poverty data for Southbridge Town shows that 167 of the married-couple family households (6.9%) and 402 of the single-parent households (19.3%) are living below the poverty level. Within the married-couple family households, those with 5 or more children have the highest poverty rate, with 12 households (100.0%) falling below the poverty line. Among the single-parent households, those with 3 or 4 children have the highest poverty rate, with 63 household (44.4%) living below poverty.
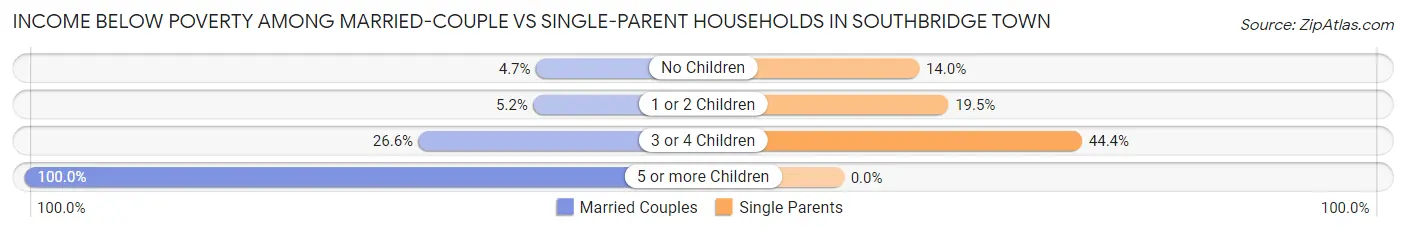
| Children | Married-Couple Families | Single-Parent Households |
| No Children | 64 (4.7%) | 103 (14.0%) |
| 1 or 2 Children | 44 (5.2%) | 236 (19.5%) |
| 3 or 4 Children | 47 (26.6%) | 63 (44.4%) |
| 5 or more Children | 12 (100.0%) | 0 (0.0%) |
| Total | 167 (6.9%) | 402 (19.3%) |
Race in Southbridge Town
The most populous races in Southbridge Town are White / Caucasian (12,301 | 69.6%), Hispanic or Latino (6,363 | 36.0%), and Two or more Races (2,589 | 14.6%).
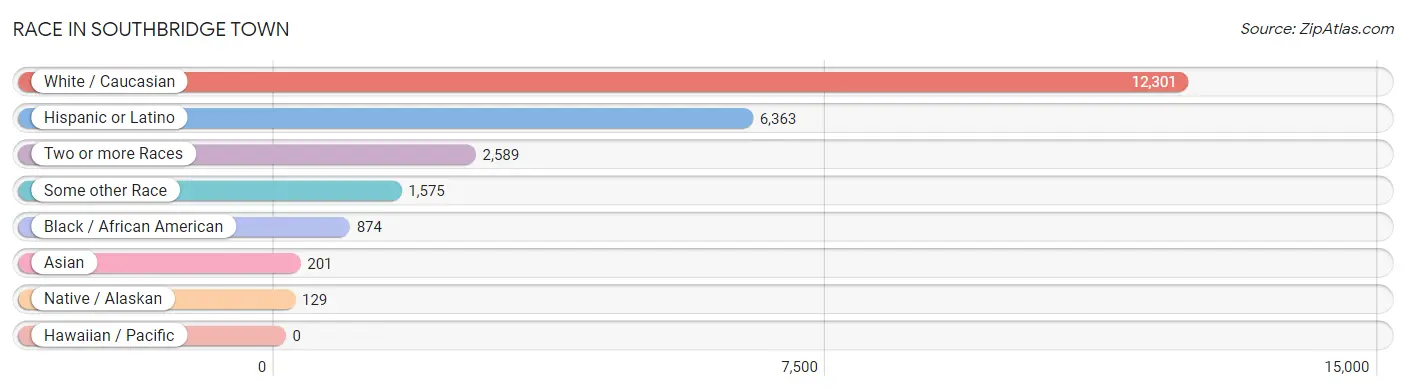
| Race | # Population | % Population |
| Asian | 201 | 1.1% |
| Black / African American | 874 | 5.0% |
| Hawaiian / Pacific | 0 | 0.0% |
| Hispanic or Latino | 6,363 | 36.0% |
| Native / Alaskan | 129 | 0.7% |
| White / Caucasian | 12,301 | 69.6% |
| Two or more Races | 2,589 | 14.6% |
| Some other Race | 1,575 | 8.9% |
| Total | 17,669 | 100.0% |
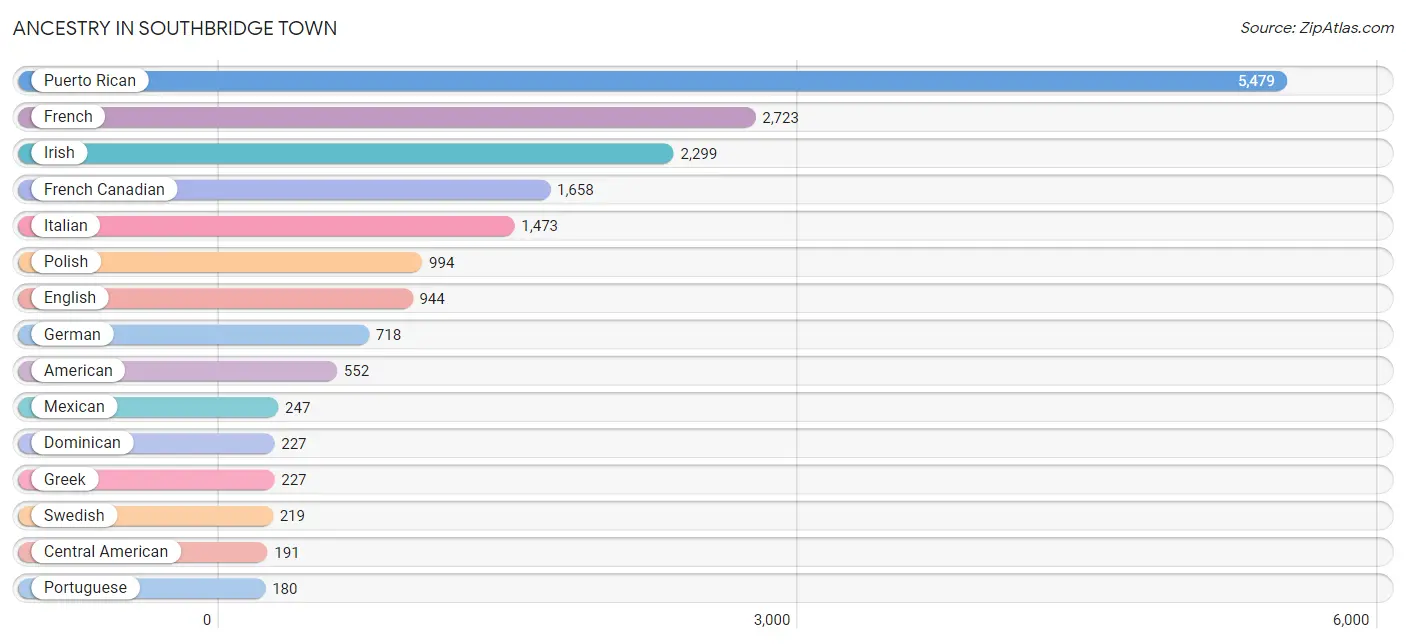
Ancestry in Southbridge Town
The most populous ancestries reported in Southbridge Town are Puerto Rican (5,479 | 31.0%), French (2,723 | 15.4%), Irish (2,299 | 13.0%), French Canadian (1,658 | 9.4%), and Italian (1,473 | 8.3%), together accounting for 77.1% of all Southbridge Town residents.
| Ancestry | # Population | % Population |
| African | 21 | 0.1% |
| Albanian | 24 | 0.1% |
| American | 552 | 3.1% |
| Arab | 64 | 0.4% |
| Assyrian / Chaldean / Syriac | 10 | 0.1% |
| Bhutanese | 18 | 0.1% |
| Brazilian | 7 | 0.0% |
| British | 12 | 0.1% |
| Canadian | 120 | 0.7% |
| Central American | 191 | 1.1% |
| Central American Indian | 103 | 0.6% |
| Colombian | 47 | 0.3% |
| Cuban | 15 | 0.1% |
| Czech | 8 | 0.1% |
| Dominican | 227 | 1.3% |
| Dutch | 122 | 0.7% |
| Eastern European | 9 | 0.1% |
| Ecuadorian | 30 | 0.2% |
| Egyptian | 13 | 0.1% |
| English | 944 | 5.3% |
| European | 43 | 0.2% |
| Finnish | 8 | 0.1% |
| French | 2,723 | 15.4% |
| French Canadian | 1,658 | 9.4% |
| German | 718 | 4.1% |
| Ghanaian | 91 | 0.5% |
| Greek | 227 | 1.3% |
| Guamanian / Chamorro | 8 | 0.1% |
| Guatemalan | 11 | 0.1% |
| Haitian | 27 | 0.2% |
| Honduran | 43 | 0.2% |
| Hungarian | 10 | 0.1% |
| Indian (Asian) | 11 | 0.1% |
| Irish | 2,299 | 13.0% |
| Iroquois | 4 | 0.0% |
| Italian | 1,473 | 8.3% |
| Jamaican | 48 | 0.3% |
| Kenyan | 60 | 0.3% |
| Korean | 76 | 0.4% |
| Laotian | 60 | 0.3% |
| Lebanese | 51 | 0.3% |
| Lithuanian | 36 | 0.2% |
| Mexican | 247 | 1.4% |
| Native Hawaiian | 31 | 0.2% |
| Navajo | 61 | 0.4% |
| Norwegian | 55 | 0.3% |
| Pakistani | 24 | 0.1% |
| Peruvian | 81 | 0.5% |
| Polish | 994 | 5.6% |
| Portuguese | 180 | 1.0% |
| Puerto Rican | 5,479 | 31.0% |
| Romanian | 11 | 0.1% |
| Russian | 125 | 0.7% |
| Salvadoran | 137 | 0.8% |
| Scotch-Irish | 34 | 0.2% |
| Scottish | 129 | 0.7% |
| Slovak | 19 | 0.1% |
| South American | 158 | 0.9% |
| Spaniard | 8 | 0.1% |
| Spanish | 26 | 0.2% |
| Sri Lankan | 36 | 0.2% |
| Subsaharan African | 172 | 1.0% |
| Swedish | 219 | 1.2% |
| Thai | 107 | 0.6% |
| Turkish | 32 | 0.2% |
| Ukrainian | 65 | 0.4% |
| West Indian | 58 | 0.3% | View All 67 Rows |
Immigrants in Southbridge Town
The most numerous immigrant groups reported in Southbridge Town came from Latin America (235 | 1.3%), Europe (197 | 1.1%), Africa (156 | 0.9%), Asia (130 | 0.7%), and South America (129 | 0.7%), together accounting for 4.8% of all Southbridge Town residents.
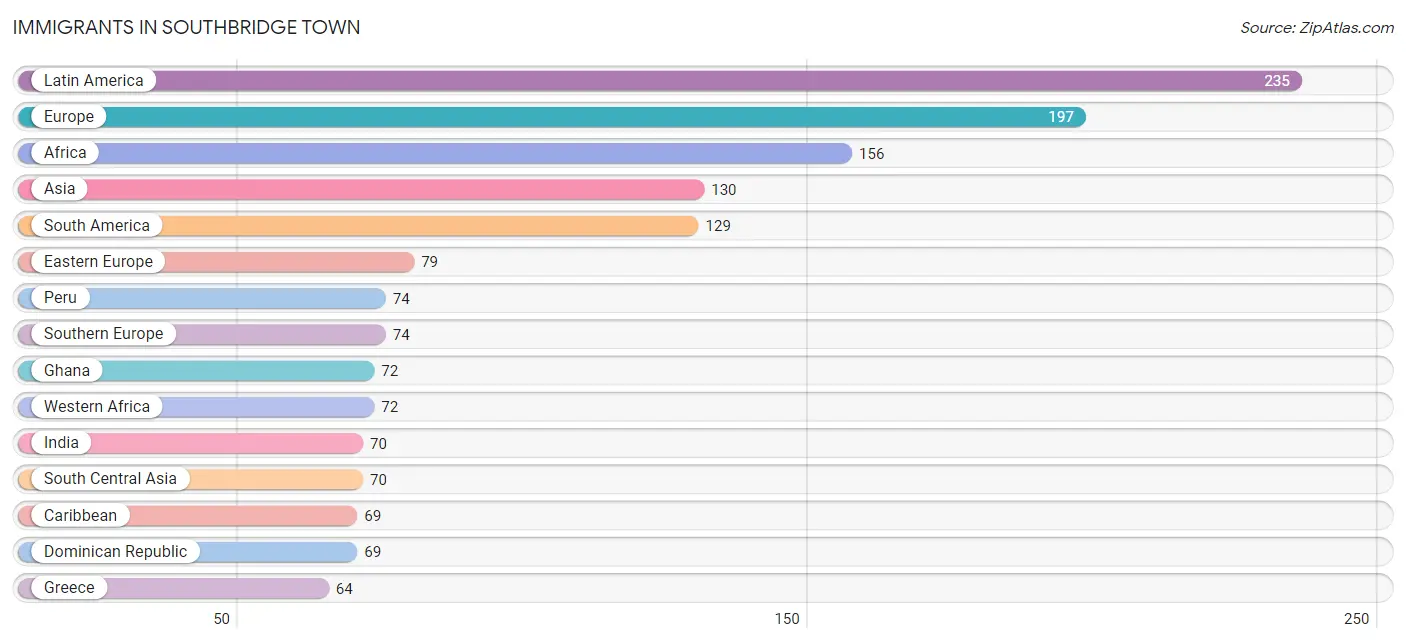
| Immigration Origin | # Population | % Population |
| Africa | 156 | 0.9% |
| Asia | 130 | 0.7% |
| Canada | 37 | 0.2% |
| Caribbean | 69 | 0.4% |
| Central America | 37 | 0.2% |
| China | 11 | 0.1% |
| Colombia | 51 | 0.3% |
| Dominican Republic | 69 | 0.4% |
| Eastern Africa | 39 | 0.2% |
| Eastern Asia | 18 | 0.1% |
| Eastern Europe | 79 | 0.4% |
| Egypt | 13 | 0.1% |
| El Salvador | 24 | 0.1% |
| England | 2 | 0.0% |
| Europe | 197 | 1.1% |
| Germany | 36 | 0.2% |
| Ghana | 72 | 0.4% |
| Greece | 64 | 0.4% |
| Guatemala | 11 | 0.1% |
| Guyana | 4 | 0.0% |
| India | 70 | 0.4% |
| Japan | 7 | 0.0% |
| Kenya | 39 | 0.2% |
| Latin America | 235 | 1.3% |
| Latvia | 6 | 0.0% |
| Mexico | 2 | 0.0% |
| Northern Africa | 14 | 0.1% |
| Northern Europe | 8 | 0.1% |
| Peru | 74 | 0.4% |
| Philippines | 7 | 0.0% |
| Poland | 22 | 0.1% |
| Portugal | 10 | 0.1% |
| Russia | 51 | 0.3% |
| Scotland | 6 | 0.0% |
| South America | 129 | 0.7% |
| South Central Asia | 70 | 0.4% |
| South Eastern Asia | 42 | 0.2% |
| Southern Europe | 74 | 0.4% |
| Sudan | 1 | 0.0% |
| Thailand | 24 | 0.1% |
| Vietnam | 11 | 0.1% |
| Western Africa | 72 | 0.4% |
| Western Europe | 36 | 0.2% | View All 43 Rows |
Sex and Age in Southbridge Town
Sex and Age in Southbridge Town
The most populous age groups in Southbridge Town are 20 to 24 Years (939 | 10.9%) for men and 20 to 24 Years (759 | 8.4%) for women.
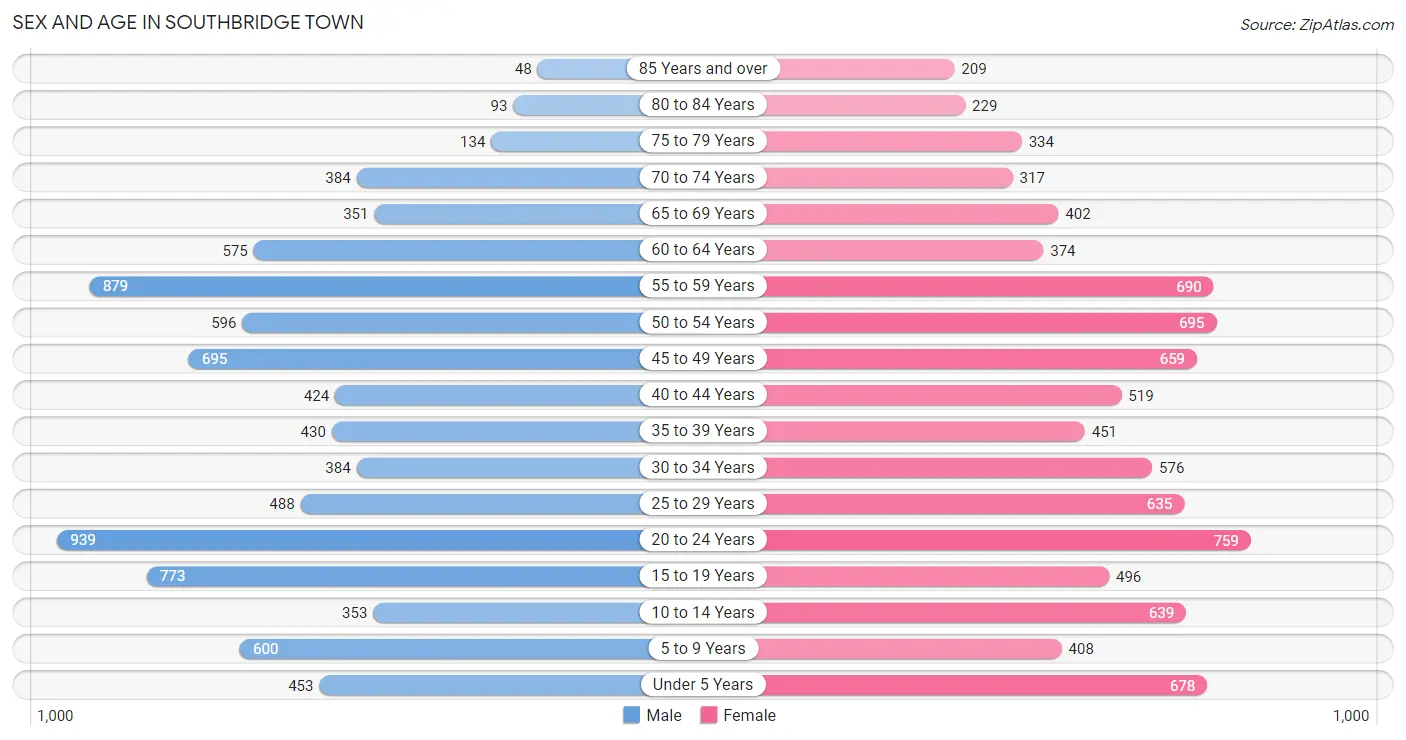
| Age Bracket | Male | Female |
| Under 5 Years | 453 (5.3%) | 678 (7.5%) |
| 5 to 9 Years | 600 (7.0%) | 408 (4.5%) |
| 10 to 14 Years | 353 (4.1%) | 639 (7.0%) |
| 15 to 19 Years | 773 (9.0%) | 496 (5.5%) |
| 20 to 24 Years | 939 (10.9%) | 759 (8.4%) |
| 25 to 29 Years | 488 (5.7%) | 635 (7.0%) |
| 30 to 34 Years | 384 (4.5%) | 576 (6.4%) |
| 35 to 39 Years | 430 (5.0%) | 451 (5.0%) |
| 40 to 44 Years | 424 (4.9%) | 519 (5.7%) |
| 45 to 49 Years | 695 (8.1%) | 659 (7.3%) |
| 50 to 54 Years | 596 (6.9%) | 695 (7.7%) |
| 55 to 59 Years | 879 (10.2%) | 690 (7.6%) |
| 60 to 64 Years | 575 (6.7%) | 374 (4.1%) |
| 65 to 69 Years | 351 (4.1%) | 402 (4.4%) |
| 70 to 74 Years | 384 (4.5%) | 317 (3.5%) |
| 75 to 79 Years | 134 (1.6%) | 334 (3.7%) |
| 80 to 84 Years | 93 (1.1%) | 229 (2.5%) |
| 85 Years and over | 48 (0.6%) | 209 (2.3%) |
| Total | 8,599 (100.0%) | 9,070 (100.0%) |
Families and Households in Southbridge Town
Median Family Size in Southbridge Town
The median family size in Southbridge Town is 3.00 persons per family, with married-couple families (2,406 | 53.5%) accounting for the largest median family size of 3.26 persons per family. On the other hand, single male/father families (706 | 15.7%) represent the smallest median family size with 2.53 persons per family.
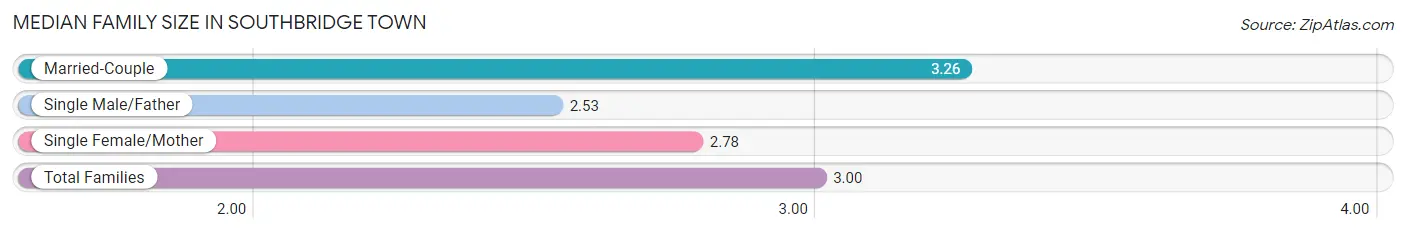
| Family Type | # Families | Family Size |
| Married-Couple | 2,406 (53.5%) | 3.26 |
| Single Male/Father | 706 (15.7%) | 2.53 |
| Single Female/Mother | 1,382 (30.7%) | 2.78 |
| Total Families | 4,494 (100.0%) | 3.00 |
Median Household Size in Southbridge Town
The median household size in Southbridge Town is 2.48 persons per household, with married-couple households (2,406 | 34.2%) accounting for the largest median household size of 3.28 persons per household. non-family households (2,536 | 36.1%) represent the smallest median household size with 1.27 persons per household.
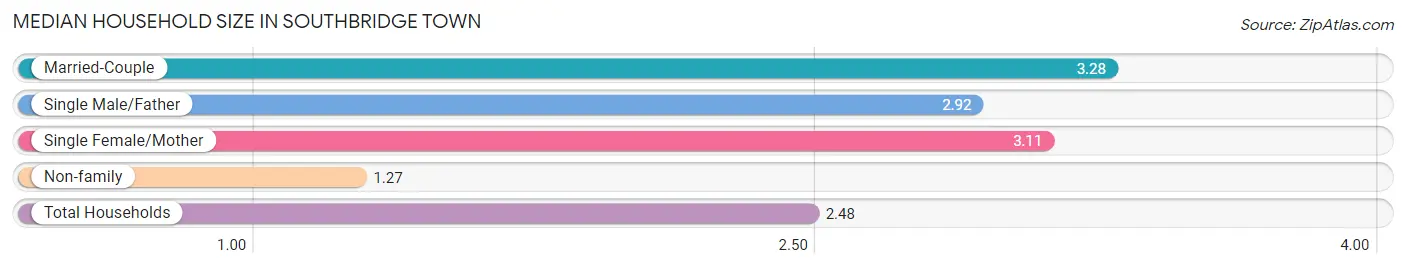
| Household Type | # Households | Household Size |
| Married-Couple | 2,406 (34.2%) | 3.28 |
| Single Male/Father | 706 (10.0%) | 2.92 |
| Single Female/Mother | 1,382 (19.7%) | 3.11 |
| Non-family | 2,536 (36.1%) | 1.27 |
| Total Households | 7,030 (100.0%) | 2.48 |
Household Size by Marriage Status in Southbridge Town
Out of a total of 7,030 households in Southbridge Town, 4,494 (63.9%) are family households, while 2,536 (36.1%) are nonfamily households. The most numerous type of family households are 2-person households, comprising 1,822, and the most common type of nonfamily households are 1-person households, comprising 2,032.
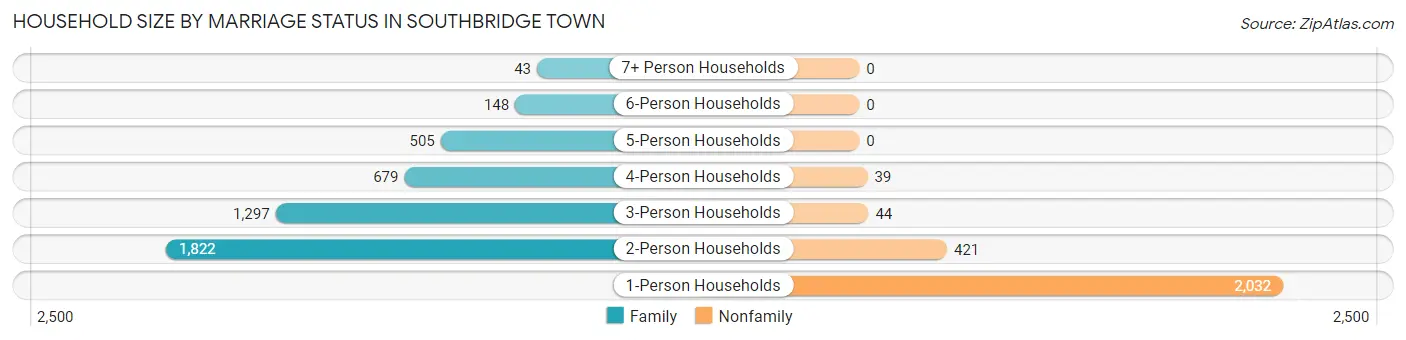
| Household Size | Family Households | Nonfamily Households |
| 1-Person Households | - | 2,032 (28.9%) |
| 2-Person Households | 1,822 (25.9%) | 421 (6.0%) |
| 3-Person Households | 1,297 (18.4%) | 44 (0.6%) |
| 4-Person Households | 679 (9.7%) | 39 (0.5%) |
| 5-Person Households | 505 (7.2%) | 0 (0.0%) |
| 6-Person Households | 148 (2.1%) | 0 (0.0%) |
| 7+ Person Households | 43 (0.6%) | 0 (0.0%) |
| Total | 4,494 (63.9%) | 2,536 (36.1%) |
Female Fertility in Southbridge Town
Fertility by Age in Southbridge Town
Average fertility rate in Southbridge Town is 81.0 births per 1,000 women. Women in the age bracket of 20 to 34 years have the highest fertility rate with 138.0 births per 1,000 women. Women in the age bracket of 20 to 34 years acount for 80.5% of all women with births.
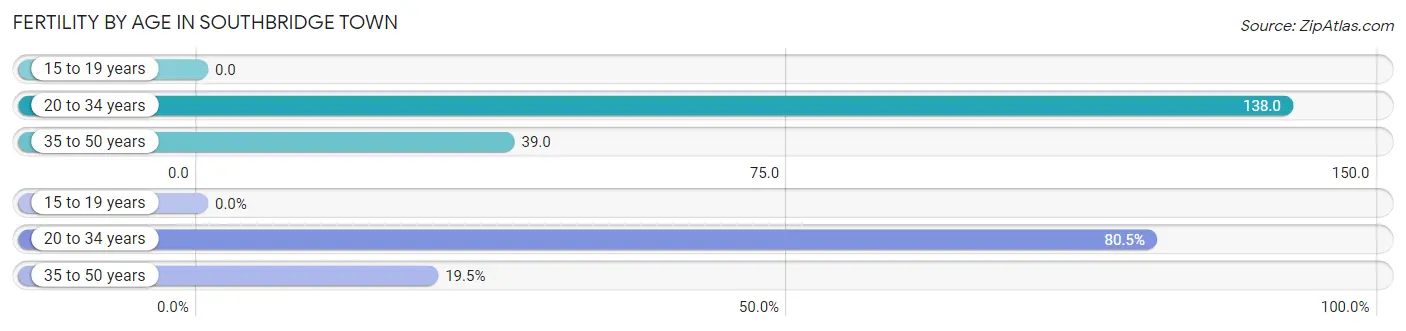
| Age Bracket | Women with Births | Births / 1,000 Women |
| 15 to 19 years | 0 (0.0%) | 0.0 |
| 20 to 34 years | 272 (80.5%) | 138.0 |
| 35 to 50 years | 66 (19.5%) | 39.0 |
| Total | 338 (100.0%) | 81.0 |
Fertility by Age by Marriage Status in Southbridge Town
32.0% of women with births (338) in Southbridge Town are married. The highest percentage of unmarried women with births falls into 20 to 34 years age bracket with 72.1% of them unmarried at the time of birth, while the lowest percentage of unmarried women with births belong to 35 to 50 years age bracket with 51.5% of them unmarried.
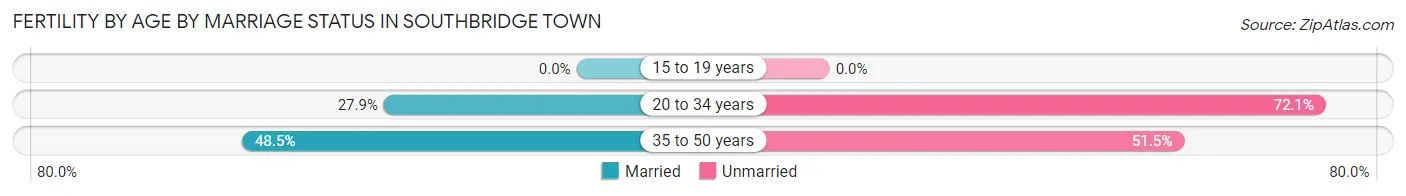
| Age Bracket | Married | Unmarried |
| 15 to 19 years | 0 (0.0%) | 0 (0.0%) |
| 20 to 34 years | 76 (27.9%) | 196 (72.1%) |
| 35 to 50 years | 32 (48.5%) | 34 (51.5%) |
| Total | 108 (32.0%) | 230 (68.0%) |
Fertility by Education in Southbridge Town
Average fertility rate in Southbridge Town is 81.0 births per 1,000 women. Women with the education attainment of bachelor's degree have the highest fertility rate of 121.0 births per 1,000 women, while women with the education attainment of less than high school have the lowest fertility at 8.0 births per 1,000 women. Women with the education attainment of college or associate's degree represent 40.8% of all women with births.
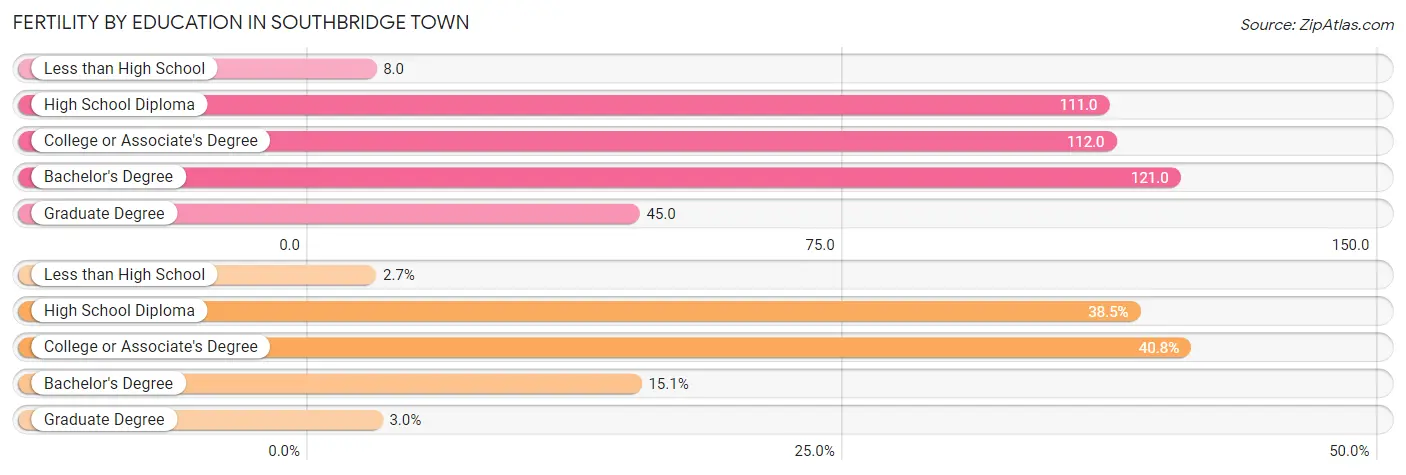
| Educational Attainment | Women with Births | Births / 1,000 Women |
| Less than High School | 9 (2.7%) | 8.0 |
| High School Diploma | 130 (38.5%) | 111.0 |
| College or Associate's Degree | 138 (40.8%) | 112.0 |
| Bachelor's Degree | 51 (15.1%) | 121.0 |
| Graduate Degree | 10 (3.0%) | 45.0 |
| Total | 338 (100.0%) | 81.0 |
Fertility by Education by Marriage Status in Southbridge Town
68.0% of women with births in Southbridge Town are unmarried. Women with the educational attainment of less than high school are most likely to be married with 100.0% of them married at childbirth, while women with the educational attainment of college or associate's degree are least likely to be married with 84.8% of them unmarried at childbirth.
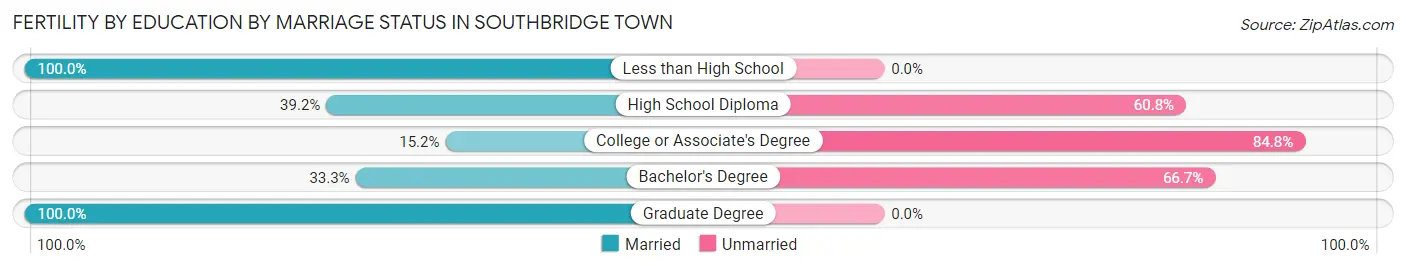
| Educational Attainment | Married | Unmarried |
| Less than High School | 9 (100.0%) | 0 (0.0%) |
| High School Diploma | 51 (39.2%) | 79 (60.8%) |
| College or Associate's Degree | 21 (15.2%) | 117 (84.8%) |
| Bachelor's Degree | 17 (33.3%) | 34 (66.7%) |
| Graduate Degree | 10 (100.0%) | 0 (0.0%) |
| Total | 108 (32.0%) | 230 (68.0%) |
Employment Characteristics in Southbridge Town
Employment by Class of Employer in Southbridge Town
Among the 8,028 employed individuals in Southbridge Town, private company employees (6,003 | 74.8%), not-for-profit organizations (657 | 8.2%), and local government employees (438 | 5.5%) make up the most common classes of employment.
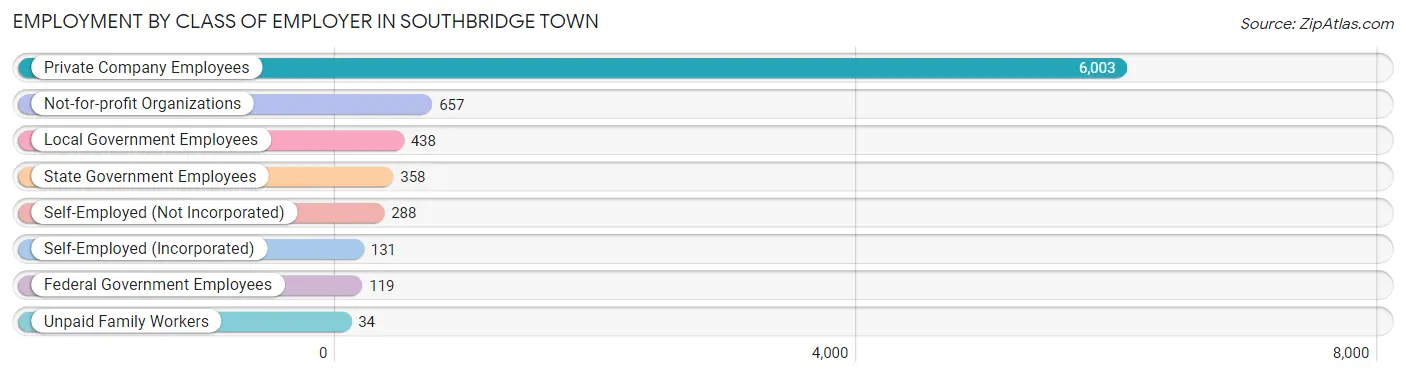
| Employer Class | # Employees | % Employees |
| Private Company Employees | 6,003 | 74.8% |
| Self-Employed (Incorporated) | 131 | 1.6% |
| Self-Employed (Not Incorporated) | 288 | 3.6% |
| Not-for-profit Organizations | 657 | 8.2% |
| Local Government Employees | 438 | 5.5% |
| State Government Employees | 358 | 4.5% |
| Federal Government Employees | 119 | 1.5% |
| Unpaid Family Workers | 34 | 0.4% |
| Total | 8,028 | 100.0% |
Employment Status by Age in Southbridge Town
According to the labor force statistics for Southbridge Town, out of the total population over 16 years of age (14,379), 63.7% or 9,159 individuals are in the labor force, with 9.2% or 843 of them unemployed. The age group with the highest labor force participation rate is 35 to 44 years, with 83.1% or 1,516 individuals in the labor force. Within the labor force, the 16 to 19 years age range has the highest percentage of unemployed individuals, with 21.1% or 129 of them being unemployed.
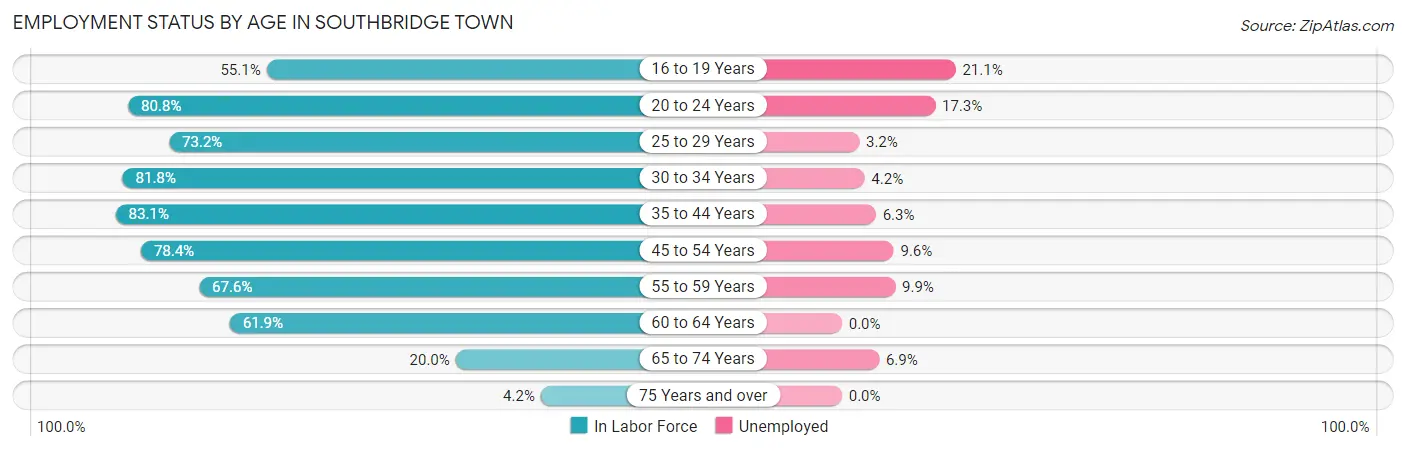
| Age Bracket | In Labor Force | Unemployed |
| 16 to 19 Years | 612 (55.1%) | 129 (21.1%) |
| 20 to 24 Years | 1,372 (80.8%) | 237 (17.3%) |
| 25 to 29 Years | 822 (73.2%) | 26 (3.2%) |
| 30 to 34 Years | 785 (81.8%) | 33 (4.2%) |
| 35 to 44 Years | 1,516 (83.1%) | 96 (6.3%) |
| 45 to 54 Years | 2,074 (78.4%) | 199 (9.6%) |
| 55 to 59 Years | 1,061 (67.6%) | 105 (9.9%) |
| 60 to 64 Years | 587 (61.9%) | 0 (0.0%) |
| 65 to 74 Years | 291 (20.0%) | 20 (6.9%) |
| 75 Years and over | 44 (4.2%) | 0 (0.0%) |
| Total | 9,159 (63.7%) | 843 (9.2%) |
Employment Status by Educational Attainment in Southbridge Town
According to labor force statistics for Southbridge Town, 75.5% of individuals (6,848) out of the total population between 25 and 64 years of age (9,070) are in the labor force, with 6.7% or 459 of them being unemployed. The group with the highest labor force participation rate are those with the educational attainment of bachelor's degree or higher, with 85.9% or 1,350 individuals in the labor force. Within the labor force, individuals with high school diploma education have the highest percentage of unemployment, with 8.4% or 198 of them being unemployed.
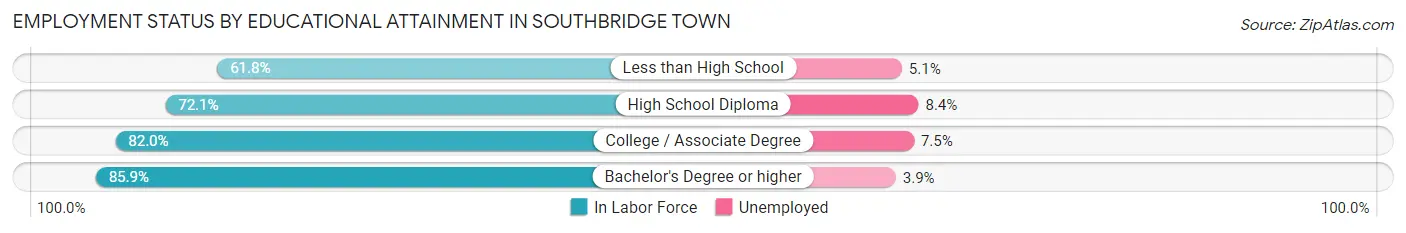
| Educational Attainment | In Labor Force | Unemployed |
| Less than High School | 1,006 (61.8%) | 83 (5.1%) |
| High School Diploma | 2,357 (72.1%) | 275 (8.4%) |
| College / Associate Degree | 2,133 (82.0%) | 195 (7.5%) |
| Bachelor's Degree or higher | 1,350 (85.9%) | 61 (3.9%) |
| Total | 6,848 (75.5%) | 608 (6.7%) |
Employment Occupations by Sex in Southbridge Town
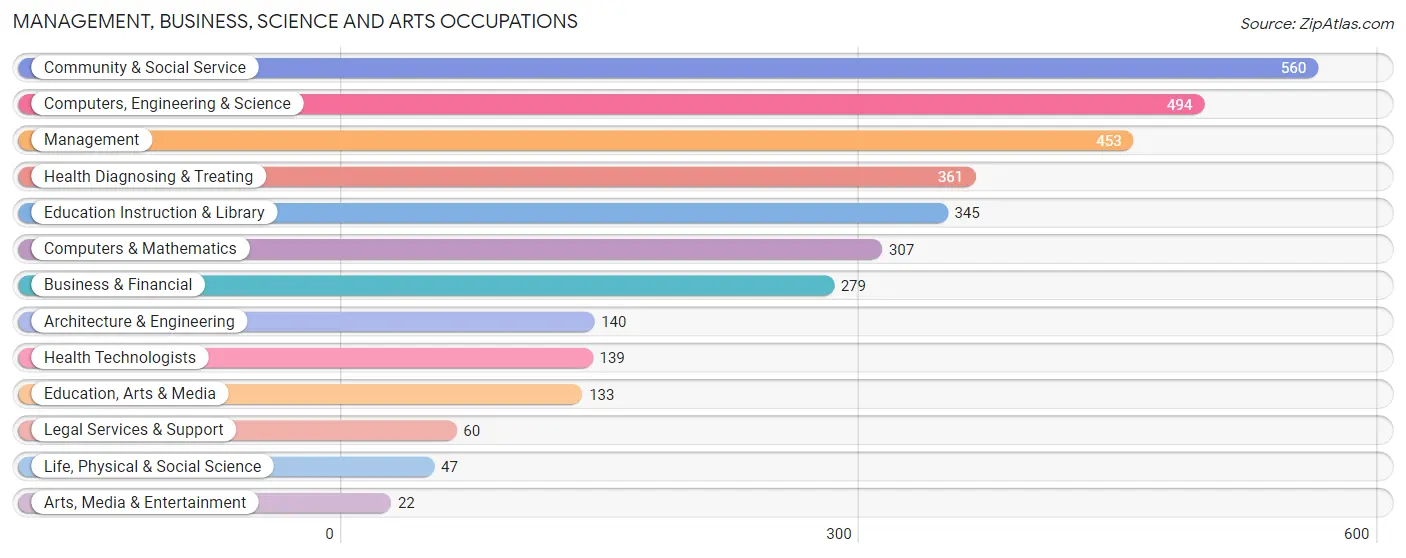
Management, Business, Science and Arts Occupations
The most common Management, Business, Science and Arts occupations in Southbridge Town are Community & Social Service (560 | 6.8%), Computers, Engineering & Science (494 | 6.0%), Management (453 | 5.5%), Health Diagnosing & Treating (361 | 4.4%), and Education Instruction & Library (345 | 4.2%).
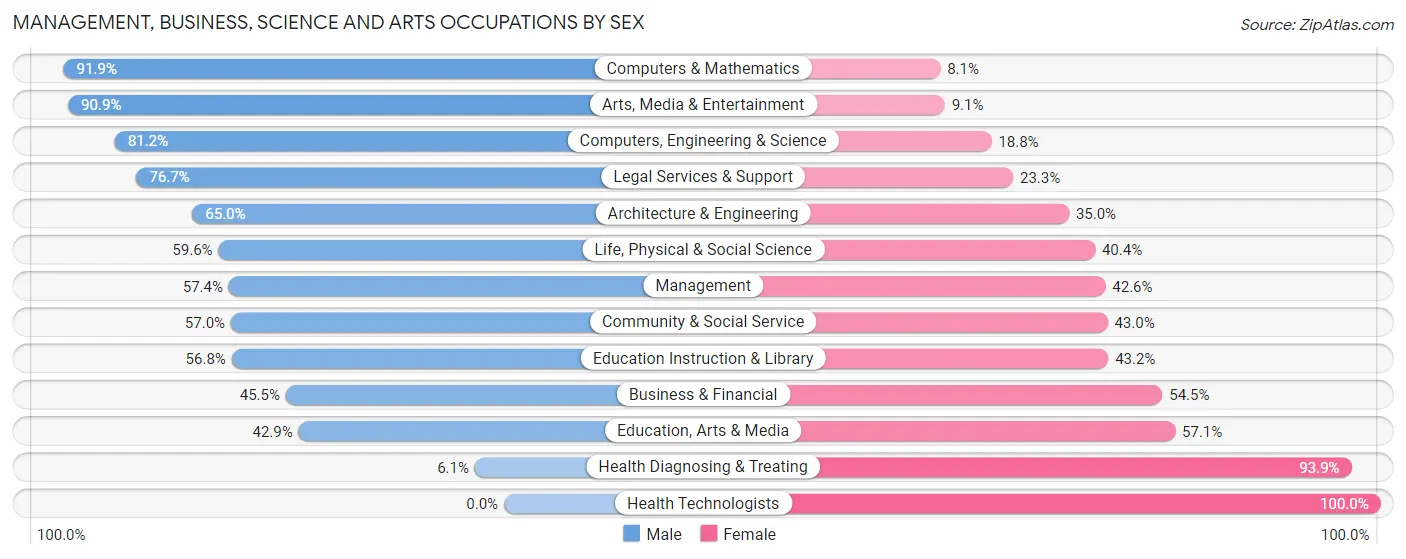
Management, Business, Science and Arts Occupations by Sex
Within the Management, Business, Science and Arts occupations in Southbridge Town, the most male-oriented occupations are Computers & Mathematics (91.9%), Arts, Media & Entertainment (90.9%), and Computers, Engineering & Science (81.2%), while the most female-oriented occupations are Health Technologists (100.0%), Health Diagnosing & Treating (93.9%), and Education, Arts & Media (57.1%).
| Occupation | Male | Female |
| Management | 260 (57.4%) | 193 (42.6%) |
| Business & Financial | 127 (45.5%) | 152 (54.5%) |
| Computers, Engineering & Science | 401 (81.2%) | 93 (18.8%) |
| Computers & Mathematics | 282 (91.9%) | 25 (8.1%) |
| Architecture & Engineering | 91 (65.0%) | 49 (35.0%) |
| Life, Physical & Social Science | 28 (59.6%) | 19 (40.4%) |
| Community & Social Service | 319 (57.0%) | 241 (43.0%) |
| Education, Arts & Media | 57 (42.9%) | 76 (57.1%) |
| Legal Services & Support | 46 (76.7%) | 14 (23.3%) |
| Education Instruction & Library | 196 (56.8%) | 149 (43.2%) |
| Arts, Media & Entertainment | 20 (90.9%) | 2 (9.1%) |
| Health Diagnosing & Treating | 22 (6.1%) | 339 (93.9%) |
| Health Technologists | 0 (0.0%) | 139 (100.0%) |
| Total (Category) | 1,129 (52.6%) | 1,018 (47.4%) |
| Total (Overall) | 4,459 (53.9%) | 3,819 (46.1%) |
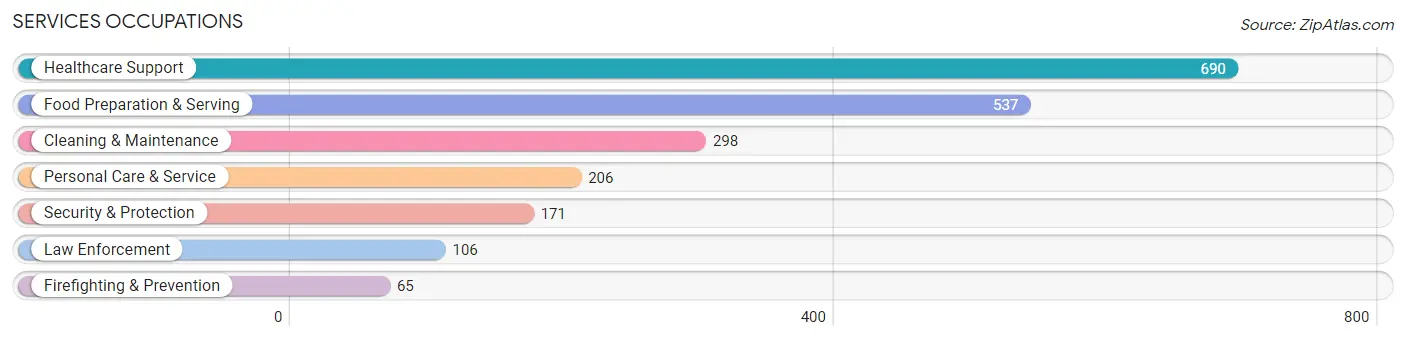
Services Occupations
The most common Services occupations in Southbridge Town are Healthcare Support (690 | 8.3%), Food Preparation & Serving (537 | 6.5%), Cleaning & Maintenance (298 | 3.6%), Personal Care & Service (206 | 2.5%), and Security & Protection (171 | 2.1%).
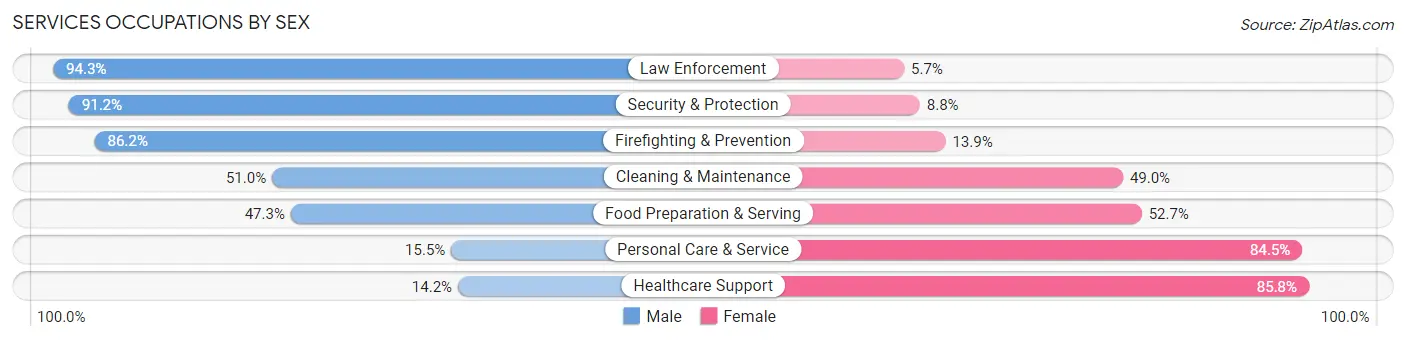
Services Occupations by Sex
Within the Services occupations in Southbridge Town, the most male-oriented occupations are Law Enforcement (94.3%), Security & Protection (91.2%), and Firefighting & Prevention (86.2%), while the most female-oriented occupations are Healthcare Support (85.8%), Personal Care & Service (84.5%), and Food Preparation & Serving (52.7%).
| Occupation | Male | Female |
| Healthcare Support | 98 (14.2%) | 592 (85.8%) |
| Security & Protection | 156 (91.2%) | 15 (8.8%) |
| Firefighting & Prevention | 56 (86.2%) | 9 (13.9%) |
| Law Enforcement | 100 (94.3%) | 6 (5.7%) |
| Food Preparation & Serving | 254 (47.3%) | 283 (52.7%) |
| Cleaning & Maintenance | 152 (51.0%) | 146 (49.0%) |
| Personal Care & Service | 32 (15.5%) | 174 (84.5%) |
| Total (Category) | 692 (36.4%) | 1,210 (63.6%) |
| Total (Overall) | 4,459 (53.9%) | 3,819 (46.1%) |
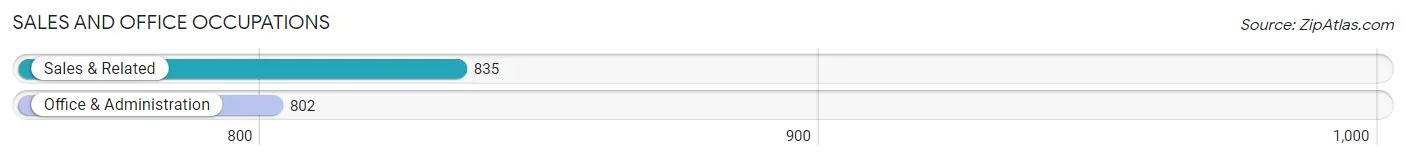
Sales and Office Occupations
The most common Sales and Office occupations in Southbridge Town are Sales & Related (835 | 10.1%), and Office & Administration (802 | 9.7%).
Sales and Office Occupations by Sex
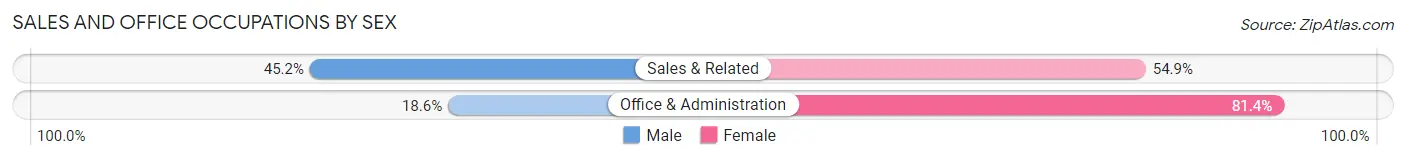
| Occupation | Male | Female |
| Sales & Related | 377 (45.2%) | 458 (54.8%) |
| Office & Administration | 149 (18.6%) | 653 (81.4%) |
| Total (Category) | 526 (32.1%) | 1,111 (67.9%) |
| Total (Overall) | 4,459 (53.9%) | 3,819 (46.1%) |
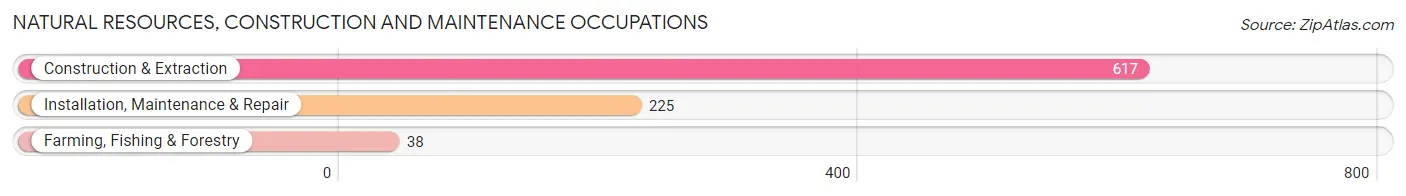
Natural Resources, Construction and Maintenance Occupations
The most common Natural Resources, Construction and Maintenance occupations in Southbridge Town are Construction & Extraction (617 | 7.4%), Installation, Maintenance & Repair (225 | 2.7%), and Farming, Fishing & Forestry (38 | 0.5%).
Natural Resources, Construction and Maintenance Occupations by Sex
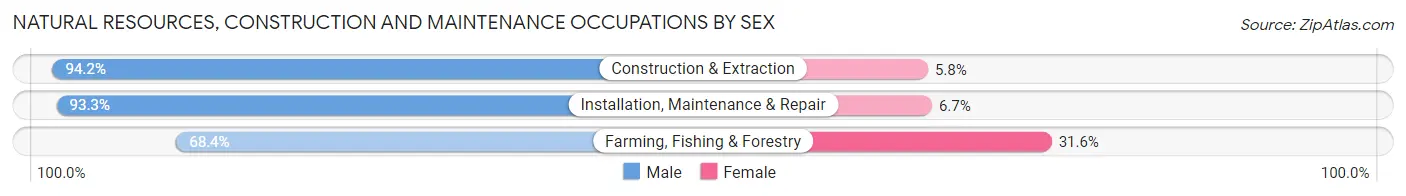
| Occupation | Male | Female |
| Farming, Fishing & Forestry | 26 (68.4%) | 12 (31.6%) |
| Construction & Extraction | 581 (94.2%) | 36 (5.8%) |
| Installation, Maintenance & Repair | 210 (93.3%) | 15 (6.7%) |
| Total (Category) | 817 (92.8%) | 63 (7.2%) |
| Total (Overall) | 4,459 (53.9%) | 3,819 (46.1%) |
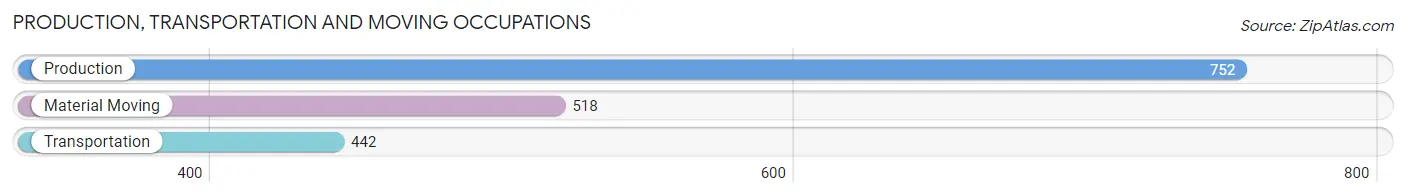
Production, Transportation and Moving Occupations
The most common Production, Transportation and Moving occupations in Southbridge Town are Production (752 | 9.1%), Material Moving (518 | 6.3%), and Transportation (442 | 5.3%).
Production, Transportation and Moving Occupations by Sex
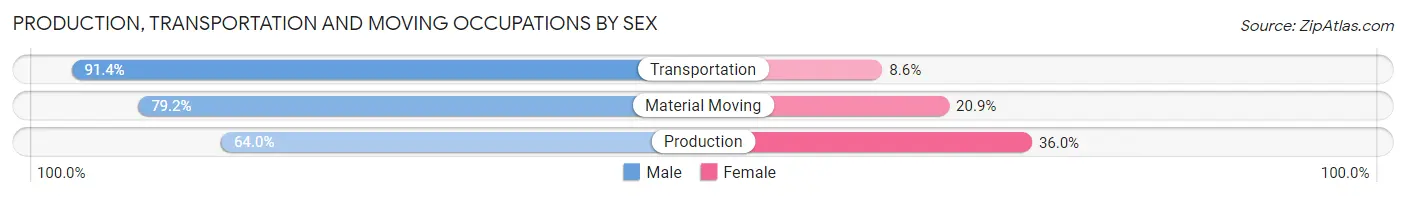
| Occupation | Male | Female |
| Production | 481 (64.0%) | 271 (36.0%) |
| Transportation | 404 (91.4%) | 38 (8.6%) |
| Material Moving | 410 (79.1%) | 108 (20.8%) |
| Total (Category) | 1,295 (75.6%) | 417 (24.4%) |
| Total (Overall) | 4,459 (53.9%) | 3,819 (46.1%) |
Employment Industries by Sex in Southbridge Town
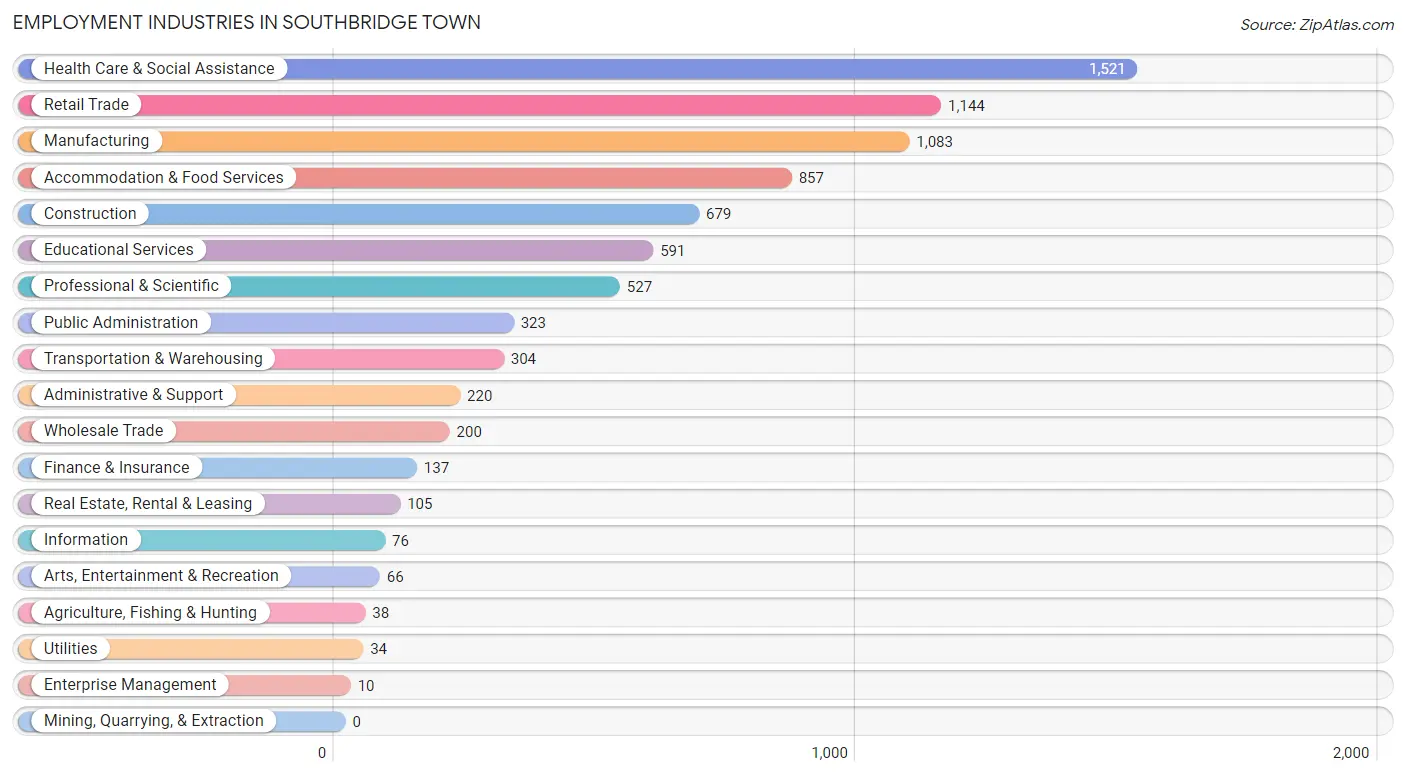
Employment Industries in Southbridge Town
The major employment industries in Southbridge Town include Health Care & Social Assistance (1,521 | 18.4%), Retail Trade (1,144 | 13.8%), Manufacturing (1,083 | 13.1%), Accommodation & Food Services (857 | 10.3%), and Construction (679 | 8.2%).
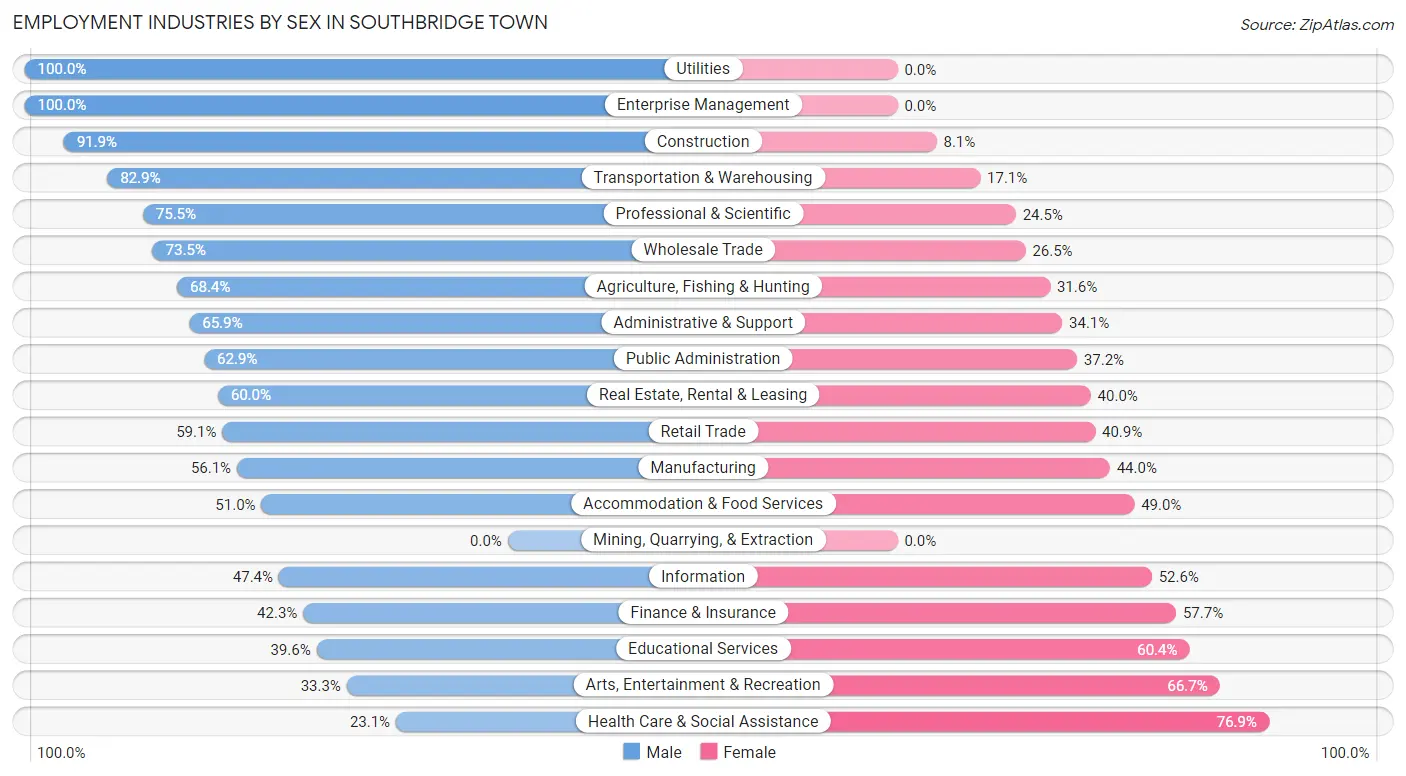
Employment Industries by Sex in Southbridge Town
The Southbridge Town industries that see more men than women are Utilities (100.0%), Enterprise Management (100.0%), and Construction (91.9%), whereas the industries that tend to have a higher number of women are Health Care & Social Assistance (76.9%), Arts, Entertainment & Recreation (66.7%), and Educational Services (60.4%).
| Industry | Male | Female |
| Agriculture, Fishing & Hunting | 26 (68.4%) | 12 (31.6%) |
| Mining, Quarrying, & Extraction | 0 (0.0%) | 0 (0.0%) |
| Construction | 624 (91.9%) | 55 (8.1%) |
| Manufacturing | 607 (56.0%) | 476 (44.0%) |
| Wholesale Trade | 147 (73.5%) | 53 (26.5%) |
| Retail Trade | 676 (59.1%) | 468 (40.9%) |
| Transportation & Warehousing | 252 (82.9%) | 52 (17.1%) |
| Utilities | 34 (100.0%) | 0 (0.0%) |
| Information | 36 (47.4%) | 40 (52.6%) |
| Finance & Insurance | 58 (42.3%) | 79 (57.7%) |
| Real Estate, Rental & Leasing | 63 (60.0%) | 42 (40.0%) |
| Professional & Scientific | 398 (75.5%) | 129 (24.5%) |
| Enterprise Management | 10 (100.0%) | 0 (0.0%) |
| Administrative & Support | 145 (65.9%) | 75 (34.1%) |
| Educational Services | 234 (39.6%) | 357 (60.4%) |
| Health Care & Social Assistance | 352 (23.1%) | 1,169 (76.9%) |
| Arts, Entertainment & Recreation | 22 (33.3%) | 44 (66.7%) |
| Accommodation & Food Services | 437 (51.0%) | 420 (49.0%) |
| Public Administration | 203 (62.8%) | 120 (37.1%) |
| Total | 4,459 (53.9%) | 3,819 (46.1%) |
Education in Southbridge Town
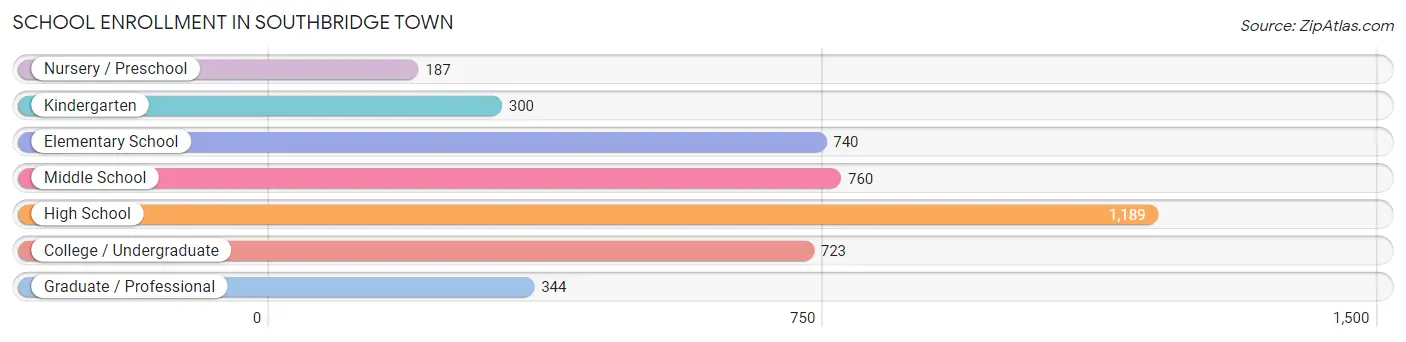
School Enrollment in Southbridge Town
The most common levels of schooling among the 4,243 students in Southbridge Town are high school (1,189 | 28.0%), middle school (760 | 17.9%), and elementary school (740 | 17.4%).
| School Level | # Students | % Students |
| Nursery / Preschool | 187 | 4.4% |
| Kindergarten | 300 | 7.1% |
| Elementary School | 740 | 17.4% |
| Middle School | 760 | 17.9% |
| High School | 1,189 | 28.0% |
| College / Undergraduate | 723 | 17.0% |
| Graduate / Professional | 344 | 8.1% |
| Total | 4,243 | 100.0% |
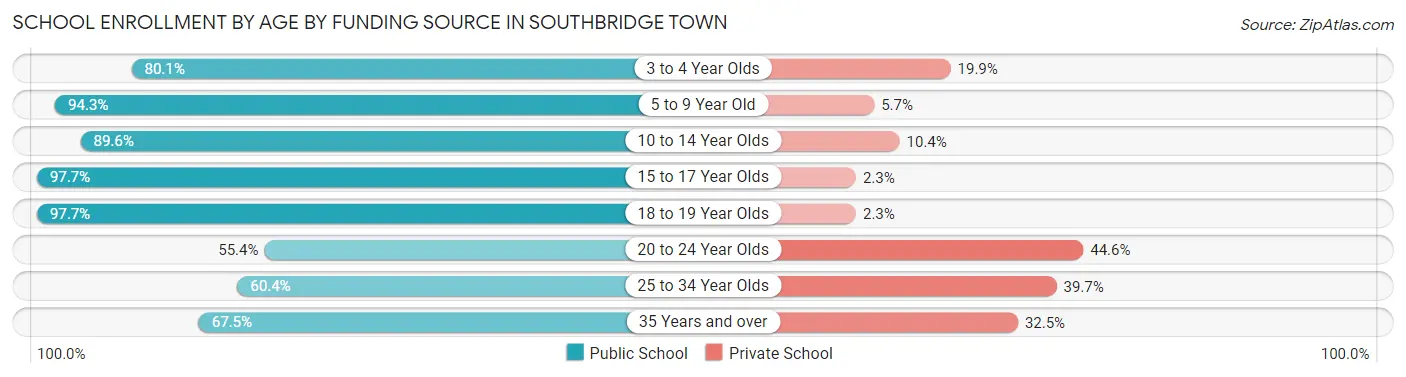
School Enrollment by Age by Funding Source in Southbridge Town
Out of a total of 4,243 students who are enrolled in schools in Southbridge Town, 628 (14.8%) attend a private institution, while the remaining 3,615 (85.2%) are enrolled in public schools. The age group of 20 to 24 year olds has the highest likelihood of being enrolled in private schools, with 254 (44.6% in the age bracket) enrolled. Conversely, the age group of 15 to 17 year olds has the lowest likelihood of being enrolled in a private school, with 812 (97.7% in the age bracket) attending a public institution.
| Age Bracket | Public School | Private School |
| 3 to 4 Year Olds | 193 (80.1%) | 48 (19.9%) |
| 5 to 9 Year Old | 912 (94.3%) | 55 (5.7%) |
| 10 to 14 Year Olds | 817 (89.6%) | 95 (10.4%) |
| 15 to 17 Year Olds | 812 (97.7%) | 19 (2.3%) |
| 18 to 19 Year Olds | 298 (97.7%) | 7 (2.3%) |
| 20 to 24 Year Olds | 315 (55.4%) | 254 (44.6%) |
| 25 to 34 Year Olds | 137 (60.4%) | 90 (39.7%) |
| 35 Years and over | 129 (67.5%) | 62 (32.5%) |
| Total | 3,615 (85.2%) | 628 (14.8%) |
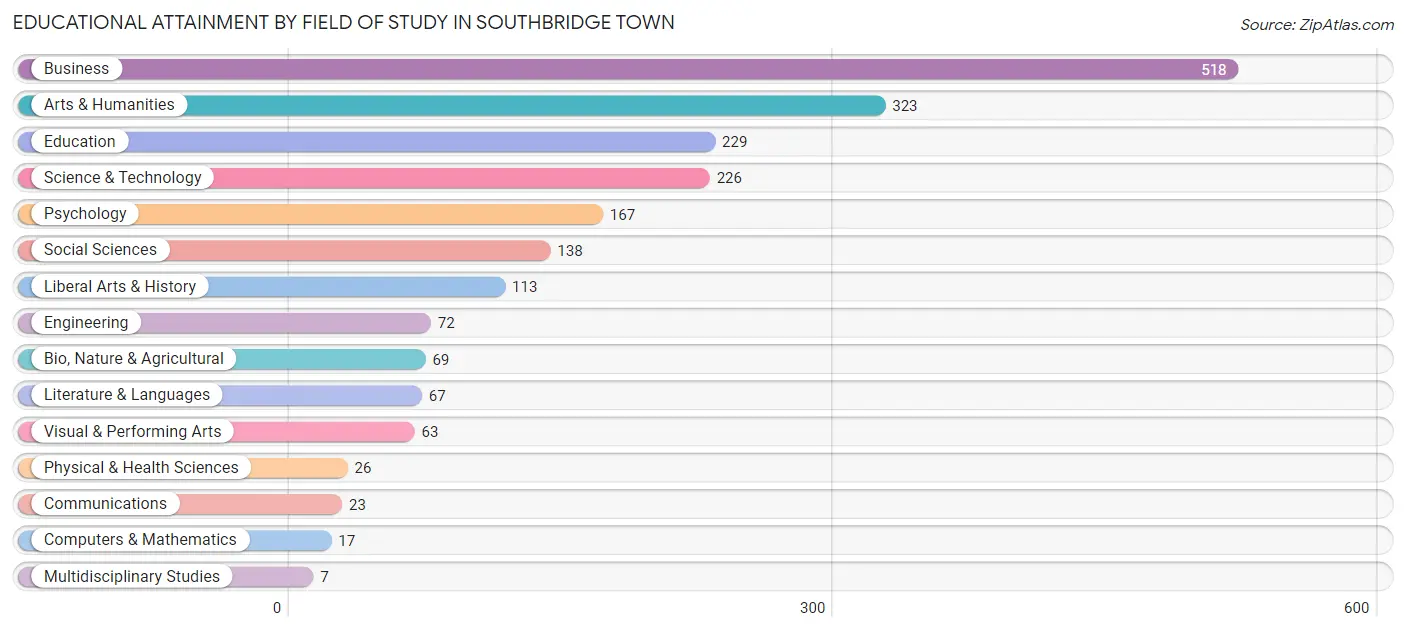
Educational Attainment by Field of Study in Southbridge Town
Business (518 | 25.2%), arts & humanities (323 | 15.7%), education (229 | 11.1%), science & technology (226 | 11.0%), and psychology (167 | 8.1%) are the most common fields of study among 2,058 individuals in Southbridge Town who have obtained a bachelor's degree or higher.
| Field of Study | # Graduates | % Graduates |
| Computers & Mathematics | 17 | 0.8% |
| Bio, Nature & Agricultural | 69 | 3.4% |
| Physical & Health Sciences | 26 | 1.3% |
| Psychology | 167 | 8.1% |
| Social Sciences | 138 | 6.7% |
| Engineering | 72 | 3.5% |
| Multidisciplinary Studies | 7 | 0.3% |
| Science & Technology | 226 | 11.0% |
| Business | 518 | 25.2% |
| Education | 229 | 11.1% |
| Literature & Languages | 67 | 3.3% |
| Liberal Arts & History | 113 | 5.5% |
| Visual & Performing Arts | 63 | 3.1% |
| Communications | 23 | 1.1% |
| Arts & Humanities | 323 | 15.7% |
| Total | 2,058 | 100.0% |
Transportation & Commute in Southbridge Town
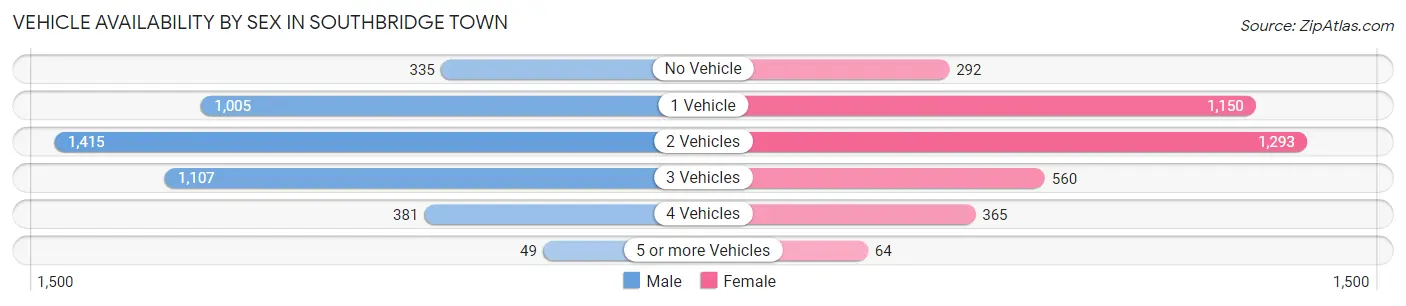
Vehicle Availability by Sex in Southbridge Town
The most prevalent vehicle ownership categories in Southbridge Town are males with 2 vehicles (1,415, accounting for 33.0%) and females with 2 vehicles (1,293, making up 38.0%).
| Vehicles Available | Male | Female |
| No Vehicle | 335 (7.8%) | 292 (7.8%) |
| 1 Vehicle | 1,005 (23.4%) | 1,150 (30.9%) |
| 2 Vehicles | 1,415 (33.0%) | 1,293 (34.7%) |
| 3 Vehicles | 1,107 (25.8%) | 560 (15.0%) |
| 4 Vehicles | 381 (8.9%) | 365 (9.8%) |
| 5 or more Vehicles | 49 (1.1%) | 64 (1.7%) |
| Total | 4,292 (100.0%) | 3,724 (100.0%) |
Commute Time in Southbridge Town
The most frequently occuring commute durations in Southbridge Town are 10 to 14 minutes (1,204 commuters, 15.9%), 30 to 34 minutes (1,140 commuters, 15.0%), and 5 to 9 minutes (1,103 commuters, 14.6%).
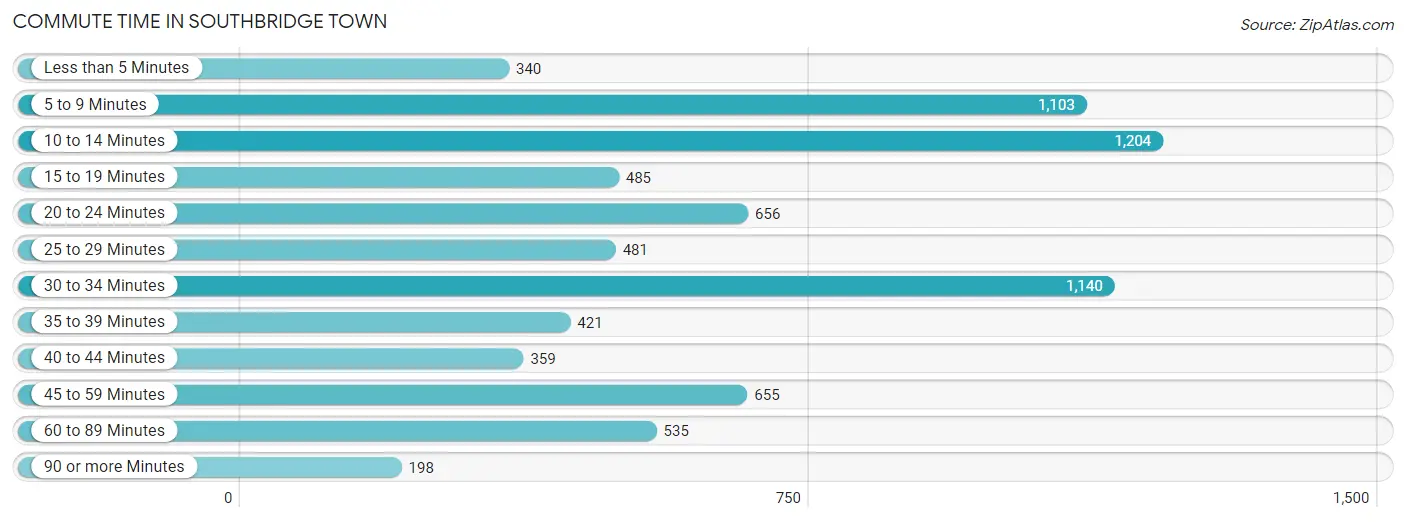
| Commute Time | # Commuters | % Commuters |
| Less than 5 Minutes | 340 | 4.5% |
| 5 to 9 Minutes | 1,103 | 14.6% |
| 10 to 14 Minutes | 1,204 | 15.9% |
| 15 to 19 Minutes | 485 | 6.4% |
| 20 to 24 Minutes | 656 | 8.7% |
| 25 to 29 Minutes | 481 | 6.4% |
| 30 to 34 Minutes | 1,140 | 15.0% |
| 35 to 39 Minutes | 421 | 5.6% |
| 40 to 44 Minutes | 359 | 4.7% |
| 45 to 59 Minutes | 655 | 8.6% |
| 60 to 89 Minutes | 535 | 7.1% |
| 90 or more Minutes | 198 | 2.6% |
Commute Time by Sex in Southbridge Town
The most common commute times in Southbridge Town are 10 to 14 minutes (656 commuters, 16.1%) for males and 5 to 9 minutes (615 commuters, 17.6%) for females.
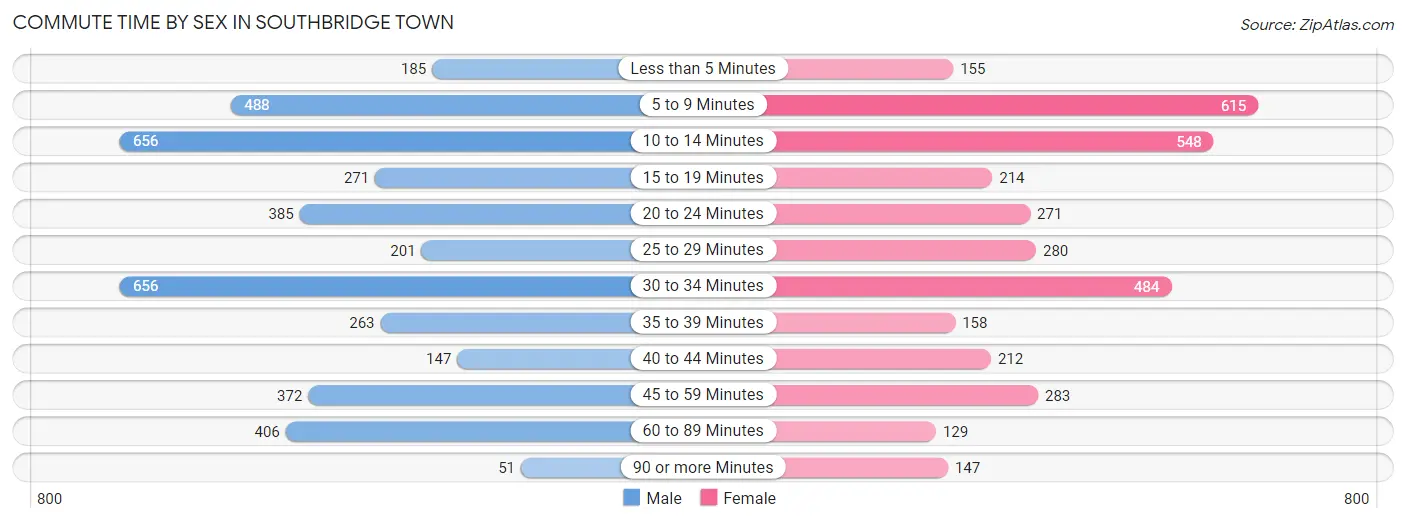
| Commute Time | Male | Female |
| Less than 5 Minutes | 185 (4.5%) | 155 (4.4%) |
| 5 to 9 Minutes | 488 (12.0%) | 615 (17.6%) |
| 10 to 14 Minutes | 656 (16.1%) | 548 (15.7%) |
| 15 to 19 Minutes | 271 (6.6%) | 214 (6.1%) |
| 20 to 24 Minutes | 385 (9.4%) | 271 (7.7%) |
| 25 to 29 Minutes | 201 (4.9%) | 280 (8.0%) |
| 30 to 34 Minutes | 656 (16.1%) | 484 (13.8%) |
| 35 to 39 Minutes | 263 (6.4%) | 158 (4.5%) |
| 40 to 44 Minutes | 147 (3.6%) | 212 (6.1%) |
| 45 to 59 Minutes | 372 (9.1%) | 283 (8.1%) |
| 60 to 89 Minutes | 406 (10.0%) | 129 (3.7%) |
| 90 or more Minutes | 51 (1.3%) | 147 (4.2%) |
Time of Departure to Work by Sex in Southbridge Town
The most frequent times of departure to work in Southbridge Town are 6:00 AM to 6:29 AM (784, 19.2%) for males and 6:30 AM to 6:59 AM (461, 13.2%) for females.
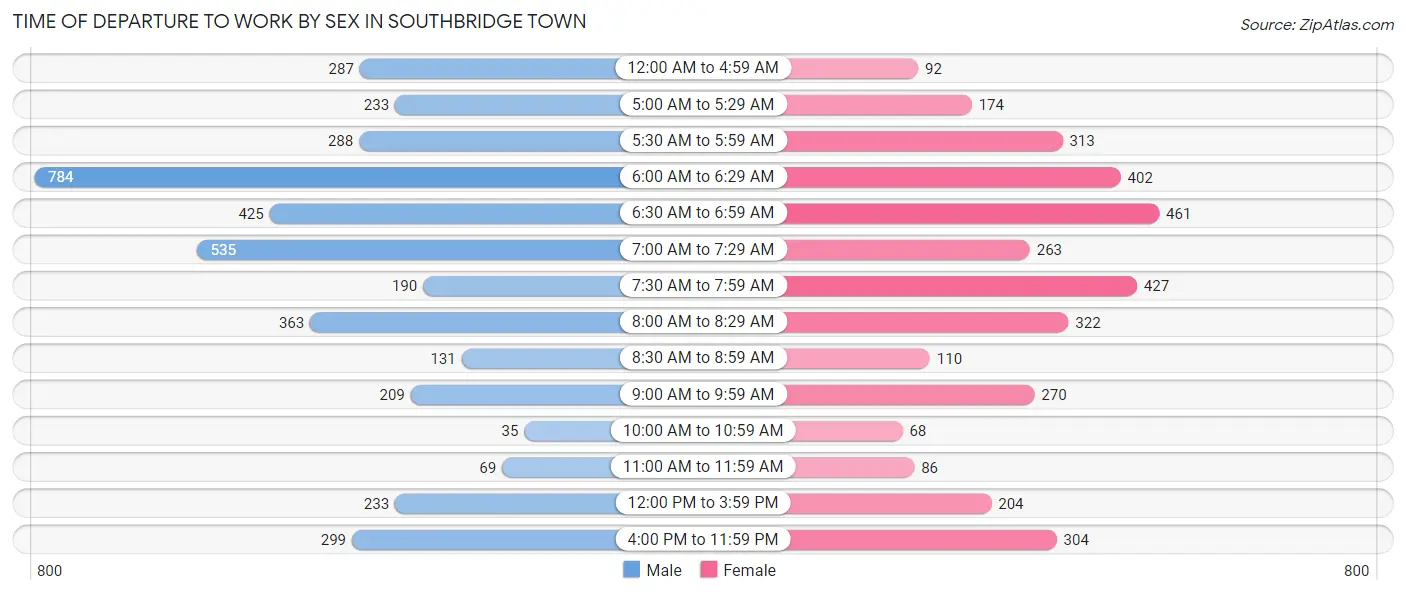
| Time of Departure | Male | Female |
| 12:00 AM to 4:59 AM | 287 (7.0%) | 92 (2.6%) |
| 5:00 AM to 5:29 AM | 233 (5.7%) | 174 (5.0%) |
| 5:30 AM to 5:59 AM | 288 (7.1%) | 313 (8.9%) |
| 6:00 AM to 6:29 AM | 784 (19.2%) | 402 (11.5%) |
| 6:30 AM to 6:59 AM | 425 (10.4%) | 461 (13.2%) |
| 7:00 AM to 7:29 AM | 535 (13.1%) | 263 (7.5%) |
| 7:30 AM to 7:59 AM | 190 (4.7%) | 427 (12.2%) |
| 8:00 AM to 8:29 AM | 363 (8.9%) | 322 (9.2%) |
| 8:30 AM to 8:59 AM | 131 (3.2%) | 110 (3.2%) |
| 9:00 AM to 9:59 AM | 209 (5.1%) | 270 (7.7%) |
| 10:00 AM to 10:59 AM | 35 (0.9%) | 68 (1.9%) |
| 11:00 AM to 11:59 AM | 69 (1.7%) | 86 (2.5%) |
| 12:00 PM to 3:59 PM | 233 (5.7%) | 204 (5.8%) |
| 4:00 PM to 11:59 PM | 299 (7.3%) | 304 (8.7%) |
| Total | 4,081 (100.0%) | 3,496 (100.0%) |
Housing Occupancy in Southbridge Town
Occupancy by Ownership in Southbridge Town
Of the total 7,030 dwellings in Southbridge Town, owner-occupied units account for 3,081 (43.8%), while renter-occupied units make up 3,949 (56.2%).
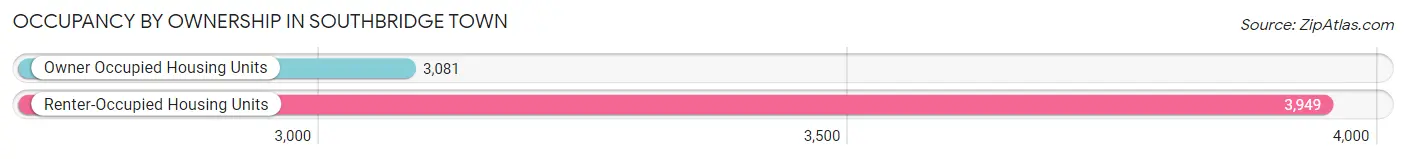
| Occupancy | # Housing Units | % Housing Units |
| Owner Occupied Housing Units | 3,081 | 43.8% |
| Renter-Occupied Housing Units | 3,949 | 56.2% |
| Total Occupied Housing Units | 7,030 | 100.0% |
Occupancy by Household Size in Southbridge Town
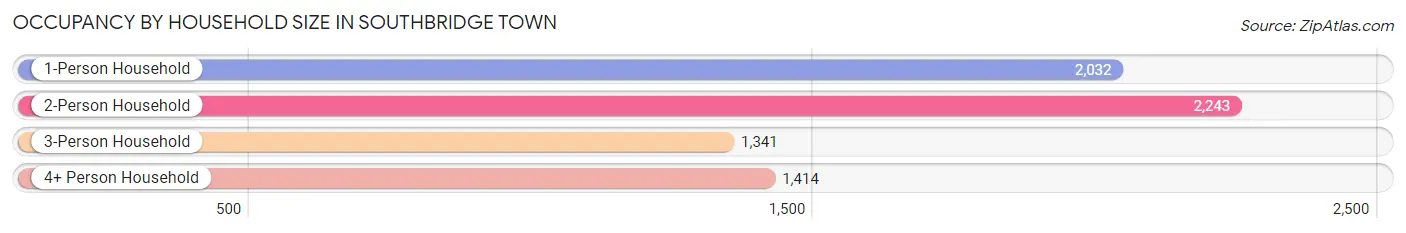
| Household Size | # Housing Units | % Housing Units |
| 1-Person Household | 2,032 | 28.9% |
| 2-Person Household | 2,243 | 31.9% |
| 3-Person Household | 1,341 | 19.1% |
| 4+ Person Household | 1,414 | 20.1% |
| Total Housing Units | 7,030 | 100.0% |
Occupancy by Ownership by Household Size in Southbridge Town
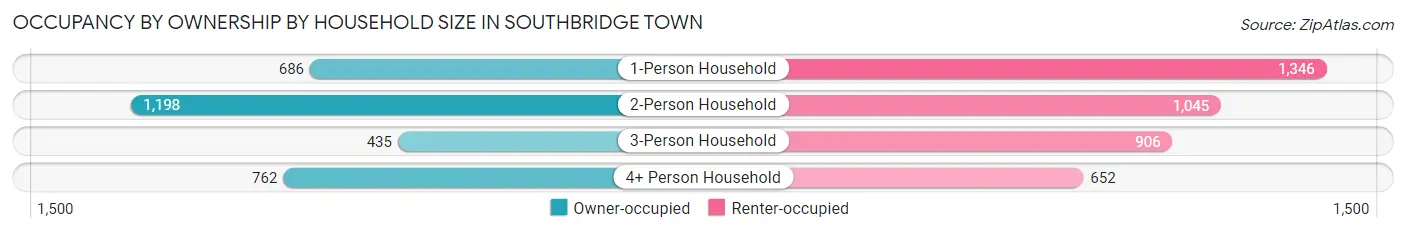
| Household Size | Owner-occupied | Renter-occupied |
| 1-Person Household | 686 (33.8%) | 1,346 (66.2%) |
| 2-Person Household | 1,198 (53.4%) | 1,045 (46.6%) |
| 3-Person Household | 435 (32.4%) | 906 (67.6%) |
| 4+ Person Household | 762 (53.9%) | 652 (46.1%) |
| Total Housing Units | 3,081 (43.8%) | 3,949 (56.2%) |
Occupancy by Educational Attainment in Southbridge Town
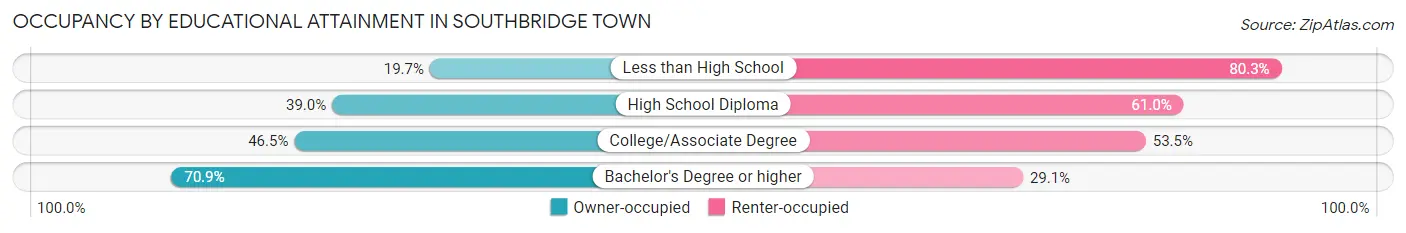
| Household Size | Owner-occupied | Renter-occupied |
| Less than High School | 230 (19.7%) | 940 (80.3%) |
| High School Diploma | 964 (39.0%) | 1,505 (61.0%) |
| College/Associate Degree | 988 (46.5%) | 1,135 (53.5%) |
| Bachelor's Degree or higher | 899 (70.9%) | 369 (29.1%) |
Occupancy by Age of Householder in Southbridge Town
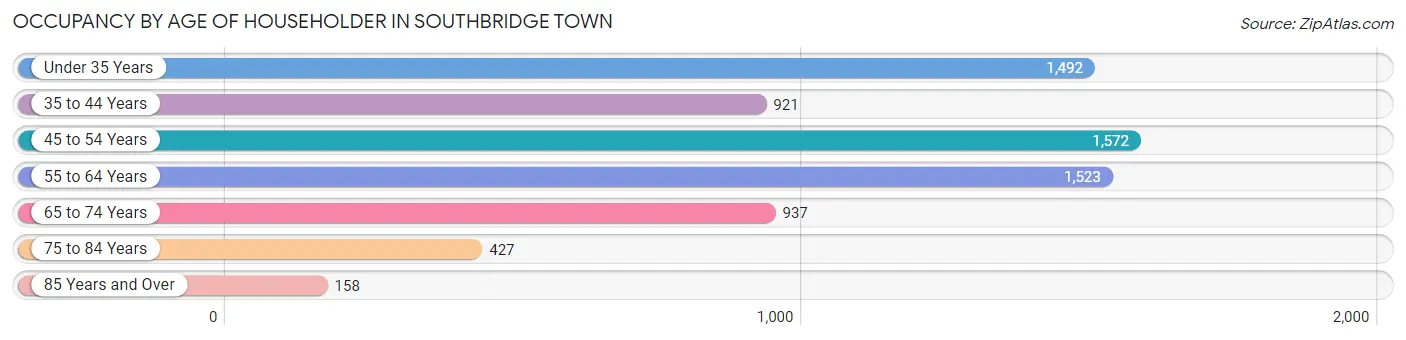
| Age Bracket | # Households | % Households |
| Under 35 Years | 1,492 | 21.2% |
| 35 to 44 Years | 921 | 13.1% |
| 45 to 54 Years | 1,572 | 22.4% |
| 55 to 64 Years | 1,523 | 21.7% |
| 65 to 74 Years | 937 | 13.3% |
| 75 to 84 Years | 427 | 6.1% |
| 85 Years and Over | 158 | 2.2% |
| Total | 7,030 | 100.0% |
Housing Finances in Southbridge Town
Median Income by Occupancy in Southbridge Town
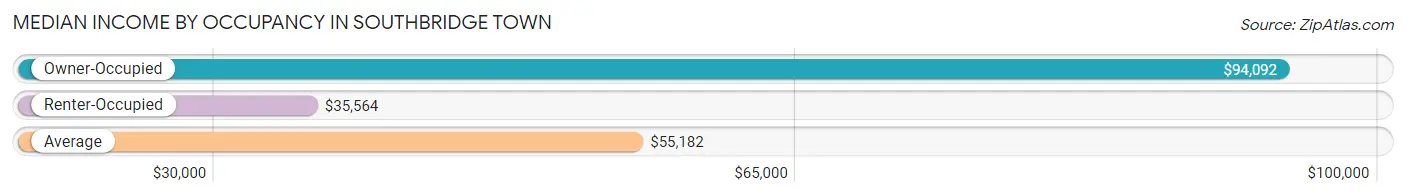
| Occupancy Type | # Households | Median Income |
| Owner-Occupied | 3,081 (43.8%) | $94,092 |
| Renter-Occupied | 3,949 (56.2%) | $35,564 |
| Average | 7,030 (100.0%) | $55,182 |
Occupancy by Householder Income Bracket in Southbridge Town
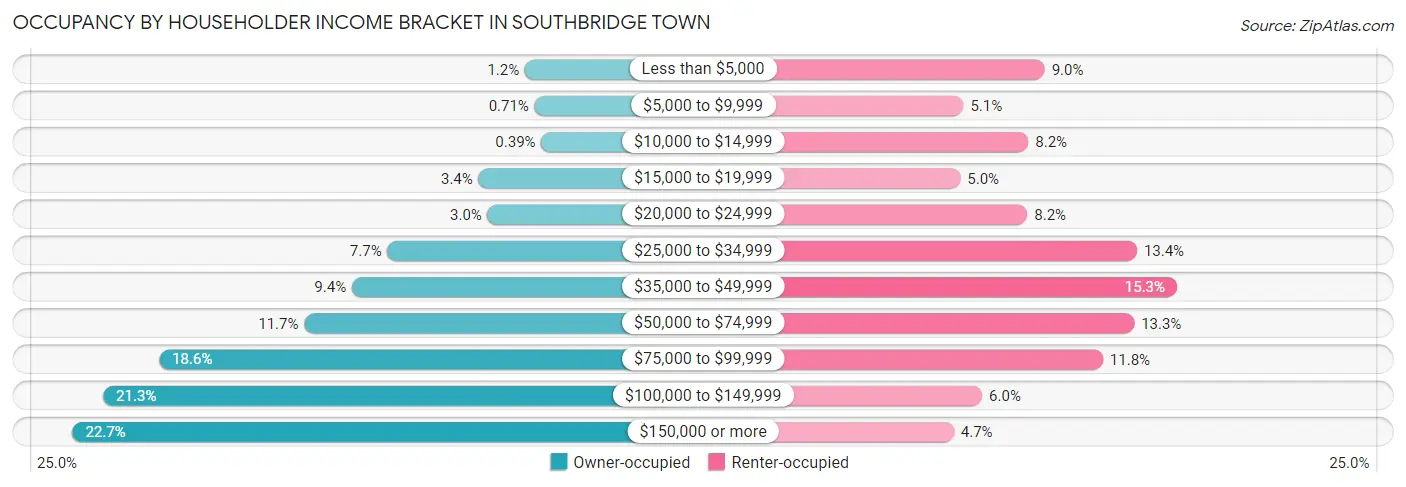
| Income Bracket | Owner-occupied | Renter-occupied |
| Less than $5,000 | 36 (1.2%) | 356 (9.0%) |
| $5,000 to $9,999 | 22 (0.7%) | 203 (5.1%) |
| $10,000 to $14,999 | 12 (0.4%) | 325 (8.2%) |
| $15,000 to $19,999 | 104 (3.4%) | 197 (5.0%) |
| $20,000 to $24,999 | 91 (2.9%) | 323 (8.2%) |
| $25,000 to $34,999 | 238 (7.7%) | 529 (13.4%) |
| $35,000 to $49,999 | 290 (9.4%) | 604 (15.3%) |
| $50,000 to $74,999 | 360 (11.7%) | 524 (13.3%) |
| $75,000 to $99,999 | 573 (18.6%) | 465 (11.8%) |
| $100,000 to $149,999 | 655 (21.3%) | 238 (6.0%) |
| $150,000 or more | 700 (22.7%) | 185 (4.7%) |
| Total | 3,081 (100.0%) | 3,949 (100.0%) |
Monthly Housing Cost Tiers in Southbridge Town
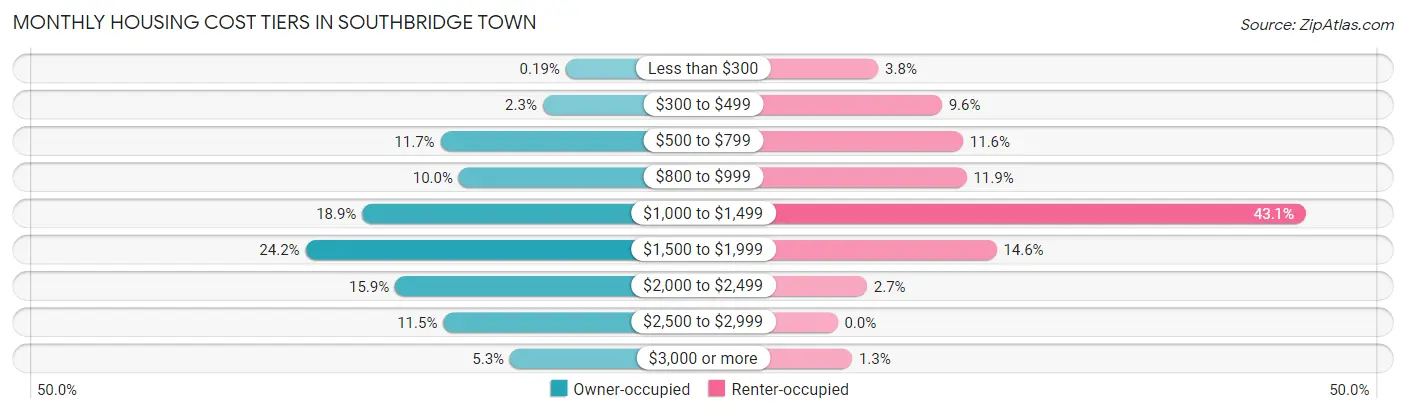
| Monthly Cost | Owner-occupied | Renter-occupied |
| Less than $300 | 6 (0.2%) | 148 (3.7%) |
| $300 to $499 | 71 (2.3%) | 379 (9.6%) |
| $500 to $799 | 361 (11.7%) | 456 (11.6%) |
| $800 to $999 | 309 (10.0%) | 469 (11.9%) |
| $1,000 to $1,499 | 583 (18.9%) | 1,703 (43.1%) |
| $1,500 to $1,999 | 744 (24.1%) | 578 (14.6%) |
| $2,000 to $2,499 | 490 (15.9%) | 107 (2.7%) |
| $2,500 to $2,999 | 353 (11.5%) | 0 (0.0%) |
| $3,000 or more | 164 (5.3%) | 53 (1.3%) |
| Total | 3,081 (100.0%) | 3,949 (100.0%) |
Physical Housing Characteristics in Southbridge Town
Housing Structures in Southbridge Town
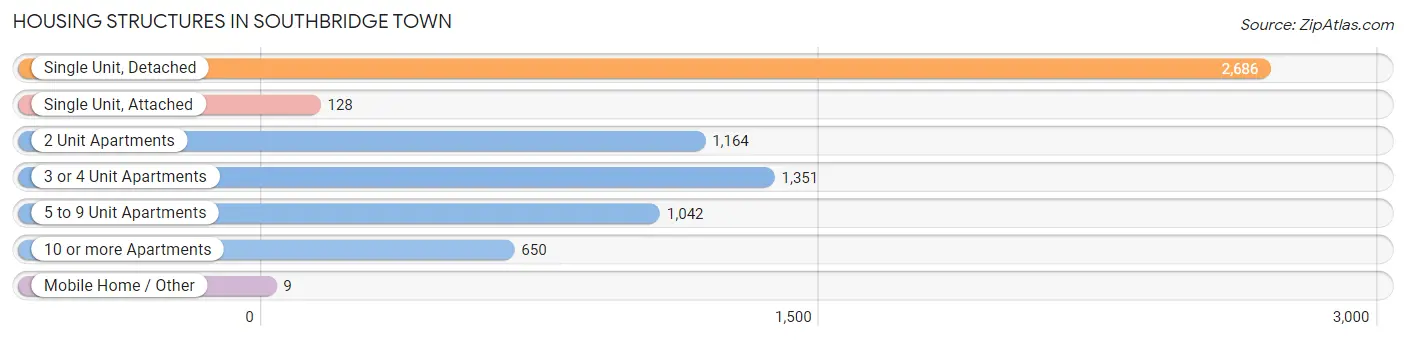
| Structure Type | # Housing Units | % Housing Units |
| Single Unit, Detached | 2,686 | 38.2% |
| Single Unit, Attached | 128 | 1.8% |
| 2 Unit Apartments | 1,164 | 16.6% |
| 3 or 4 Unit Apartments | 1,351 | 19.2% |
| 5 to 9 Unit Apartments | 1,042 | 14.8% |
| 10 or more Apartments | 650 | 9.2% |
| Mobile Home / Other | 9 | 0.1% |
| Total | 7,030 | 100.0% |
Housing Structures by Occupancy in Southbridge Town
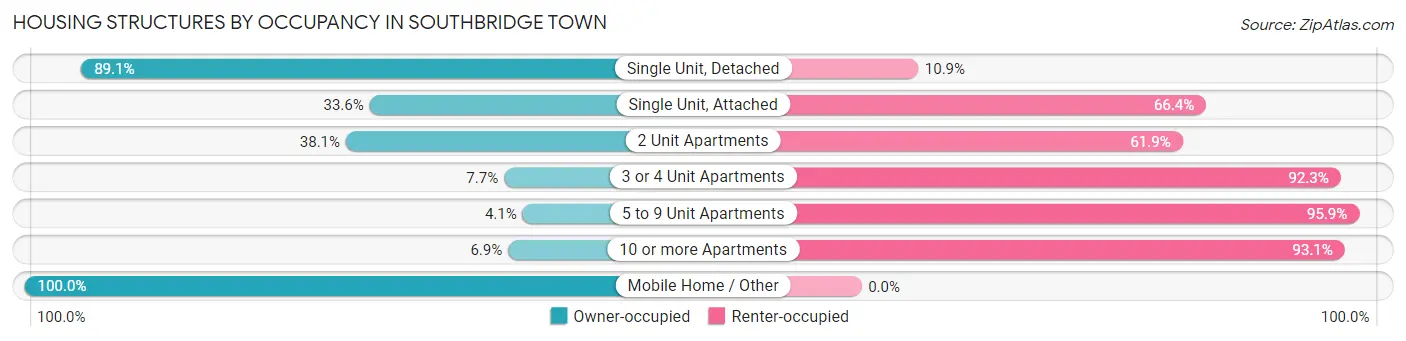
| Structure Type | Owner-occupied | Renter-occupied |
| Single Unit, Detached | 2,393 (89.1%) | 293 (10.9%) |
| Single Unit, Attached | 43 (33.6%) | 85 (66.4%) |
| 2 Unit Apartments | 444 (38.1%) | 720 (61.9%) |
| 3 or 4 Unit Apartments | 104 (7.7%) | 1,247 (92.3%) |
| 5 to 9 Unit Apartments | 43 (4.1%) | 999 (95.9%) |
| 10 or more Apartments | 45 (6.9%) | 605 (93.1%) |
| Mobile Home / Other | 9 (100.0%) | 0 (0.0%) |
| Total | 3,081 (43.8%) | 3,949 (56.2%) |
Housing Structures by Number of Rooms in Southbridge Town
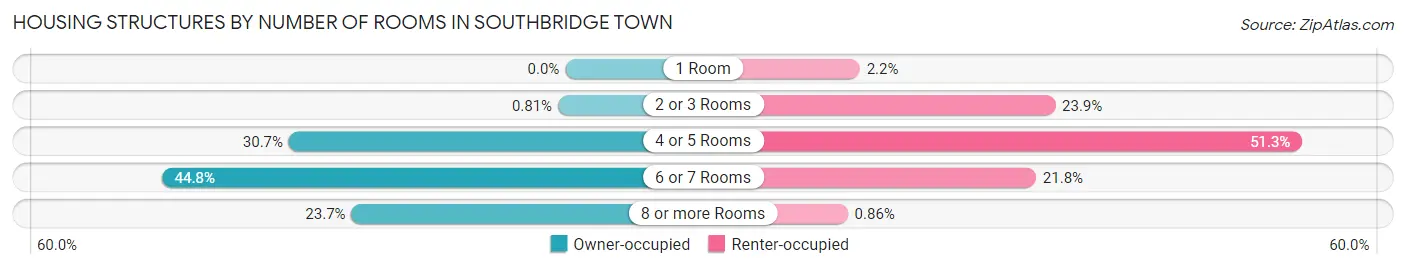
| Number of Rooms | Owner-occupied | Renter-occupied |
| 1 Room | 0 (0.0%) | 87 (2.2%) |
| 2 or 3 Rooms | 25 (0.8%) | 943 (23.9%) |
| 4 or 5 Rooms | 945 (30.7%) | 2,026 (51.3%) |
| 6 or 7 Rooms | 1,380 (44.8%) | 859 (21.7%) |
| 8 or more Rooms | 731 (23.7%) | 34 (0.9%) |
| Total | 3,081 (100.0%) | 3,949 (100.0%) |
Housing Structure by Heating Type in Southbridge Town
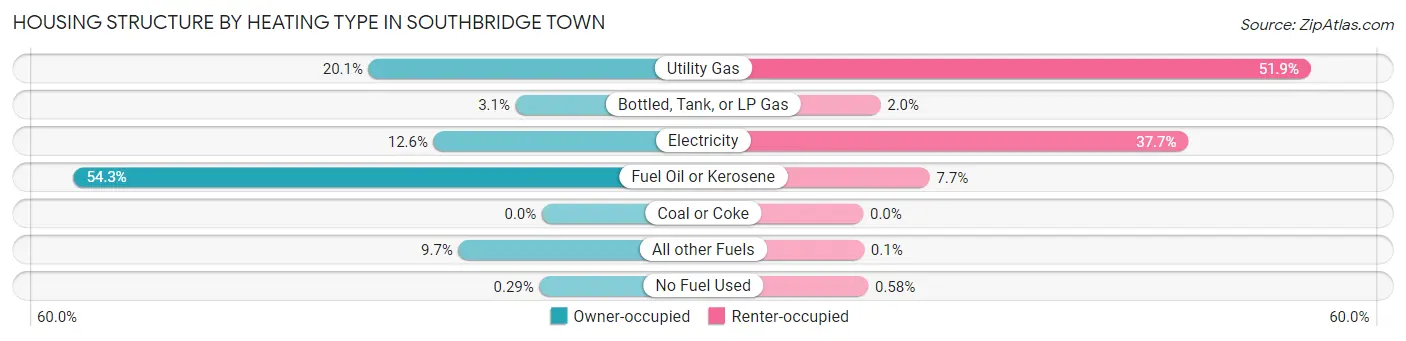
| Heating Type | Owner-occupied | Renter-occupied |
| Utility Gas | 619 (20.1%) | 2,050 (51.9%) |
| Bottled, Tank, or LP Gas | 94 (3.0%) | 79 (2.0%) |
| Electricity | 387 (12.6%) | 1,489 (37.7%) |
| Fuel Oil or Kerosene | 1,674 (54.3%) | 304 (7.7%) |
| Coal or Coke | 0 (0.0%) | 0 (0.0%) |
| All other Fuels | 298 (9.7%) | 4 (0.1%) |
| No Fuel Used | 9 (0.3%) | 23 (0.6%) |
| Total | 3,081 (100.0%) | 3,949 (100.0%) |
Household Vehicle Usage in Southbridge Town
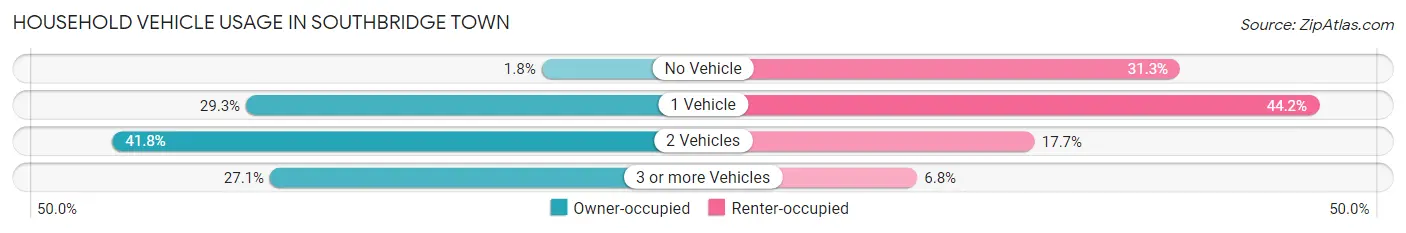
| Vehicles per Household | Owner-occupied | Renter-occupied |
| No Vehicle | 54 (1.8%) | 1,235 (31.3%) |
| 1 Vehicle | 904 (29.3%) | 1,747 (44.2%) |
| 2 Vehicles | 1,288 (41.8%) | 700 (17.7%) |
| 3 or more Vehicles | 835 (27.1%) | 267 (6.8%) |
| Total | 3,081 (100.0%) | 3,949 (100.0%) |
Real Estate & Mortgages in Southbridge Town
Real Estate and Mortgage Overview in Southbridge Town
| Characteristic | Without Mortgage | With Mortgage |
| Housing Units | 980 | 2,101 |
| Median Property Value | $221,700 | $271,000 |
| Median Household Income | $58,462 | $598 |
| Monthly Housing Costs | $830 | $164 |
| Real Estate Taxes | $4,153 | $7 |
Property Value by Mortgage Status in Southbridge Town
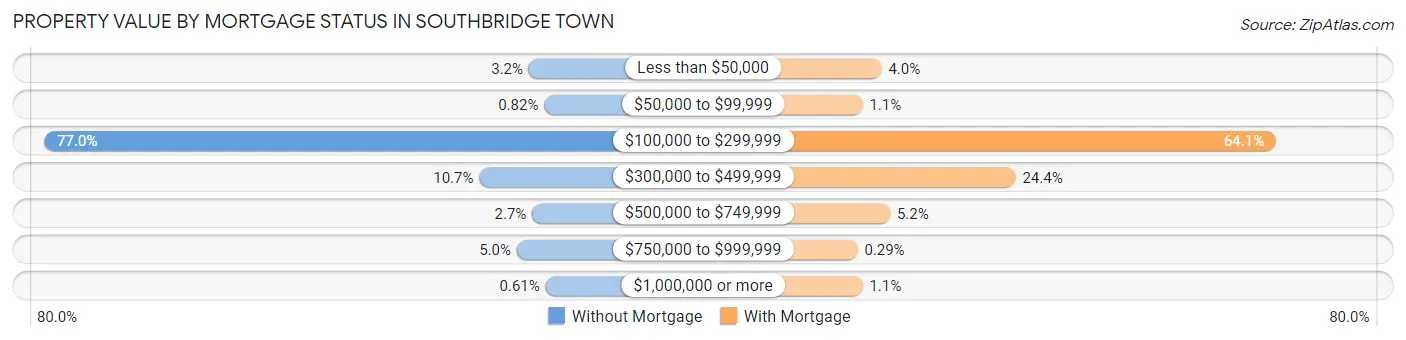
| Property Value | Without Mortgage | With Mortgage |
| Less than $50,000 | 31 (3.2%) | 83 (4.0%) |
| $50,000 to $99,999 | 8 (0.8%) | 22 (1.1%) |
| $100,000 to $299,999 | 755 (77.0%) | 1,346 (64.1%) |
| $300,000 to $499,999 | 105 (10.7%) | 512 (24.4%) |
| $500,000 to $749,999 | 26 (2.6%) | 110 (5.2%) |
| $750,000 to $999,999 | 49 (5.0%) | 6 (0.3%) |
| $1,000,000 or more | 6 (0.6%) | 22 (1.1%) |
| Total | 980 (100.0%) | 2,101 (100.0%) |
Household Income by Mortgage Status in Southbridge Town
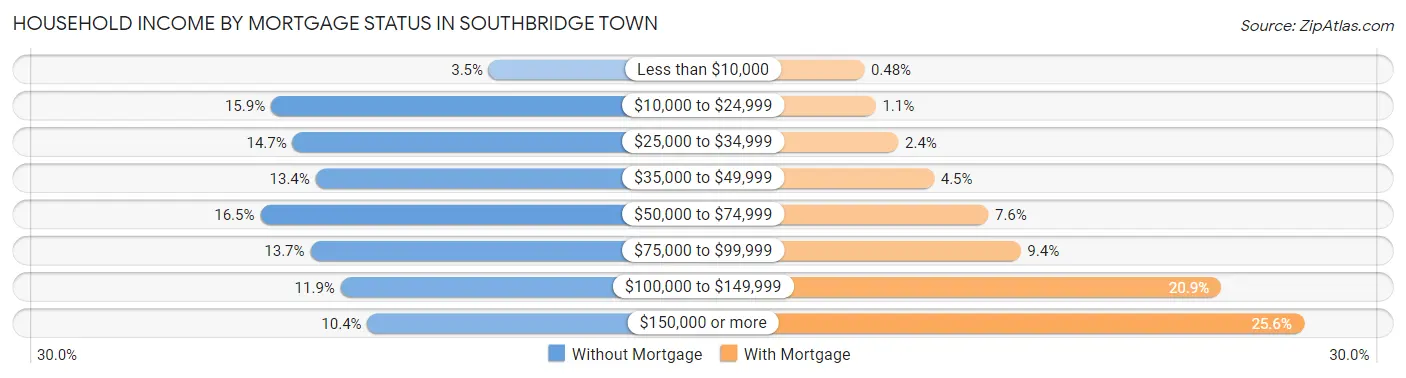
| Household Income | Without Mortgage | With Mortgage |
| Less than $10,000 | 34 (3.5%) | 10 (0.5%) |
| $10,000 to $24,999 | 156 (15.9%) | 24 (1.1%) |
| $25,000 to $34,999 | 144 (14.7%) | 51 (2.4%) |
| $35,000 to $49,999 | 131 (13.4%) | 94 (4.5%) |
| $50,000 to $74,999 | 162 (16.5%) | 159 (7.6%) |
| $75,000 to $99,999 | 134 (13.7%) | 198 (9.4%) |
| $100,000 to $149,999 | 117 (11.9%) | 439 (20.9%) |
| $150,000 or more | 102 (10.4%) | 538 (25.6%) |
| Total | 980 (100.0%) | 2,101 (100.0%) |
Property Value to Household Income Ratio in Southbridge Town
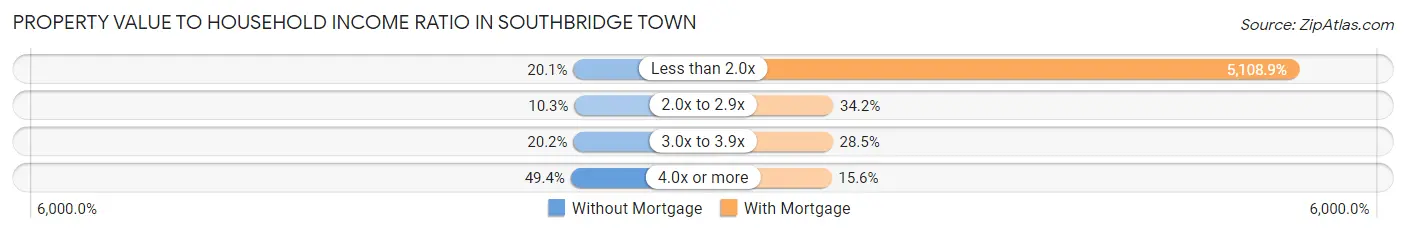
| Value-to-Income Ratio | Without Mortgage | With Mortgage |
| Less than 2.0x | 197 (20.1%) | 107,337 (5,108.9%) |
| 2.0x to 2.9x | 101 (10.3%) | 718 (34.2%) |
| 3.0x to 3.9x | 198 (20.2%) | 599 (28.5%) |
| 4.0x or more | 484 (49.4%) | 327 (15.6%) |
| Total | 980 (100.0%) | 2,101 (100.0%) |
Real Estate Taxes by Mortgage Status in Southbridge Town
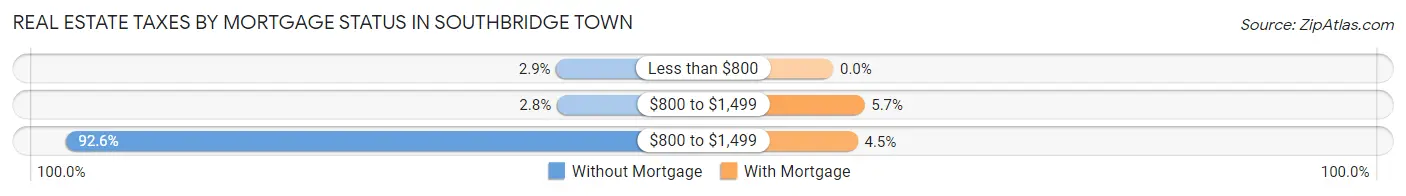
| Property Taxes | Without Mortgage | With Mortgage |
| Less than $800 | 28 (2.9%) | 0 (0.0%) |
| $800 to $1,499 | 27 (2.8%) | 120 (5.7%) |
| $800 to $1,499 | 907 (92.5%) | 94 (4.5%) |
| Total | 980 (100.0%) | 2,101 (100.0%) |
Health & Disability in Southbridge Town
Health Insurance Coverage by Age in Southbridge Town
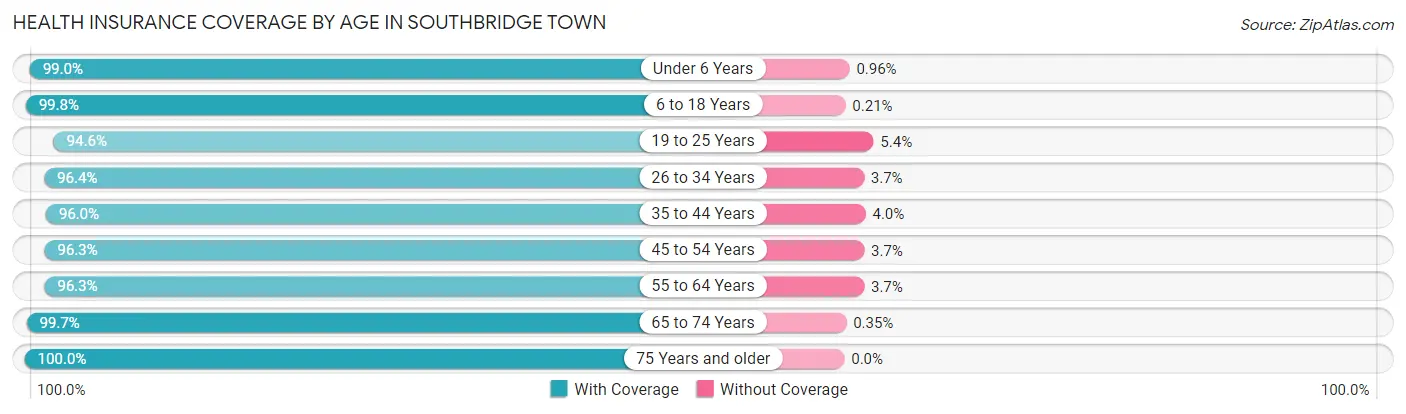
| Age Bracket | With Coverage | Without Coverage |
| Under 6 Years | 1,342 (99.0%) | 13 (1.0%) |
| 6 to 18 Years | 2,820 (99.8%) | 6 (0.2%) |
| 19 to 25 Years | 1,950 (94.6%) | 112 (5.4%) |
| 26 to 34 Years | 1,820 (96.4%) | 69 (3.6%) |
| 35 to 44 Years | 1,746 (96.0%) | 72 (4.0%) |
| 45 to 54 Years | 2,532 (96.3%) | 97 (3.7%) |
| 55 to 64 Years | 2,379 (96.3%) | 91 (3.7%) |
| 65 to 74 Years | 1,415 (99.7%) | 5 (0.4%) |
| 75 Years and older | 978 (100.0%) | 0 (0.0%) |
| Total | 16,982 (97.3%) | 465 (2.7%) |
Health Insurance Coverage by Citizenship Status in Southbridge Town
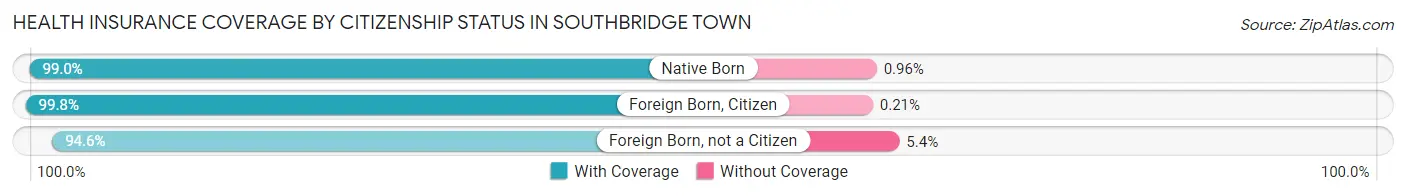
| Citizenship Status | With Coverage | Without Coverage |
| Native Born | 1,342 (99.0%) | 13 (1.0%) |
| Foreign Born, Citizen | 2,820 (99.8%) | 6 (0.2%) |
| Foreign Born, not a Citizen | 1,950 (94.6%) | 112 (5.4%) |
Health Insurance Coverage by Household Income in Southbridge Town
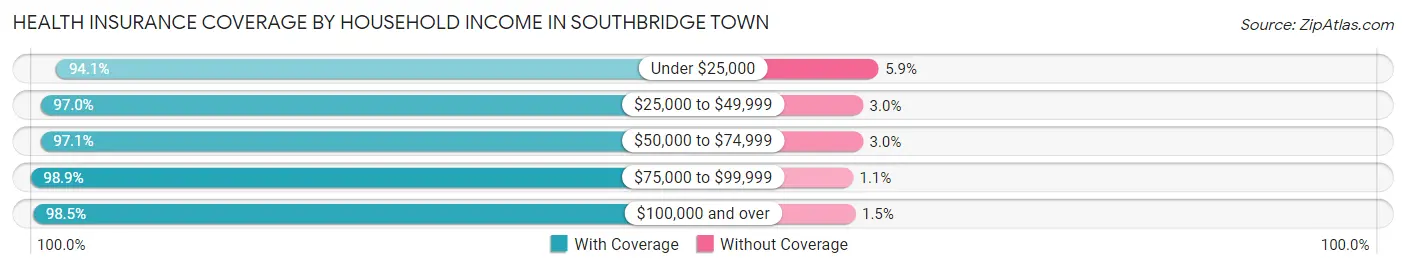
| Household Income | With Coverage | Without Coverage |
| Under $25,000 | 2,796 (94.1%) | 175 (5.9%) |
| $25,000 to $49,999 | 3,429 (97.0%) | 105 (3.0%) |
| $50,000 to $74,999 | 2,203 (97.1%) | 67 (2.9%) |
| $75,000 to $99,999 | 3,146 (98.9%) | 34 (1.1%) |
| $100,000 and over | 5,380 (98.5%) | 84 (1.5%) |
Public vs Private Health Insurance Coverage by Age in Southbridge Town
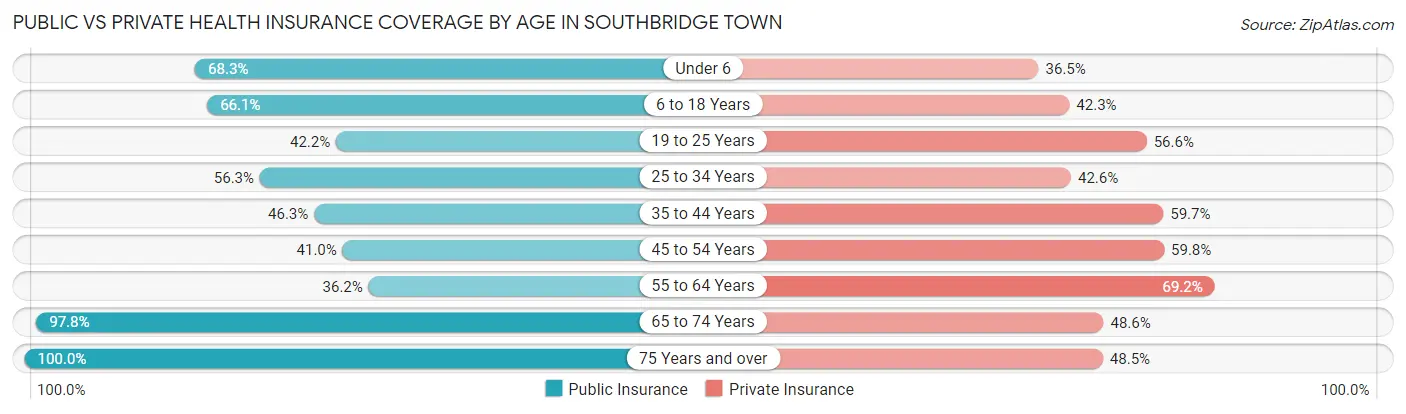
| Age Bracket | Public Insurance | Private Insurance |
| Under 6 | 926 (68.3%) | 495 (36.5%) |
| 6 to 18 Years | 1,868 (66.1%) | 1,194 (42.2%) |
| 19 to 25 Years | 870 (42.2%) | 1,167 (56.6%) |
| 25 to 34 Years | 1,064 (56.3%) | 804 (42.6%) |
| 35 to 44 Years | 841 (46.3%) | 1,085 (59.7%) |
| 45 to 54 Years | 1,077 (41.0%) | 1,573 (59.8%) |
| 55 to 64 Years | 893 (36.1%) | 1,709 (69.2%) |
| 65 to 74 Years | 1,389 (97.8%) | 690 (48.6%) |
| 75 Years and over | 978 (100.0%) | 474 (48.5%) |
| Total | 9,906 (56.8%) | 9,191 (52.7%) |
Disability Status by Sex by Age in Southbridge Town
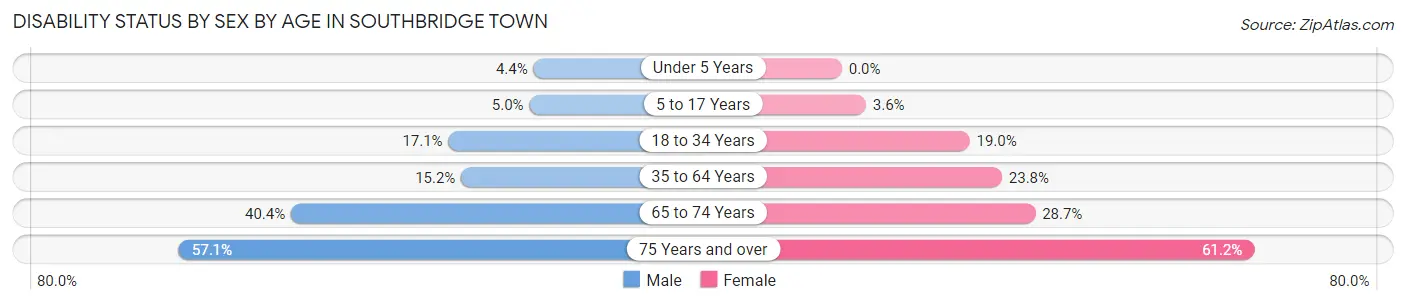
| Age Bracket | Male | Female |
| Under 5 Years | 20 (4.4%) | 0 (0.0%) |
| 5 to 17 Years | 74 (5.0%) | 49 (3.6%) |
| 18 to 34 Years | 345 (17.1%) | 406 (19.0%) |
| 35 to 64 Years | 539 (15.2%) | 800 (23.8%) |
| 65 to 74 Years | 294 (40.4%) | 199 (28.7%) |
| 75 Years and over | 149 (57.1%) | 439 (61.2%) |
Disability Class by Sex by Age in Southbridge Town
Disability Class: Hearing Difficulty
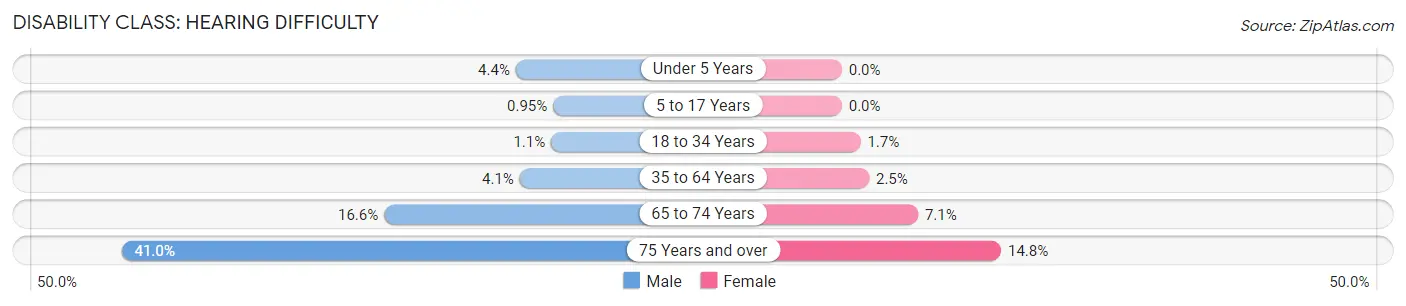
| Age Bracket | Male | Female |
| Under 5 Years | 20 (4.4%) | 0 (0.0%) |
| 5 to 17 Years | 14 (0.9%) | 0 (0.0%) |
| 18 to 34 Years | 23 (1.1%) | 37 (1.7%) |
| 35 to 64 Years | 144 (4.1%) | 85 (2.5%) |
| 65 to 74 Years | 121 (16.6%) | 49 (7.1%) |
| 75 Years and over | 107 (41.0%) | 106 (14.8%) |
Disability Class: Vision Difficulty
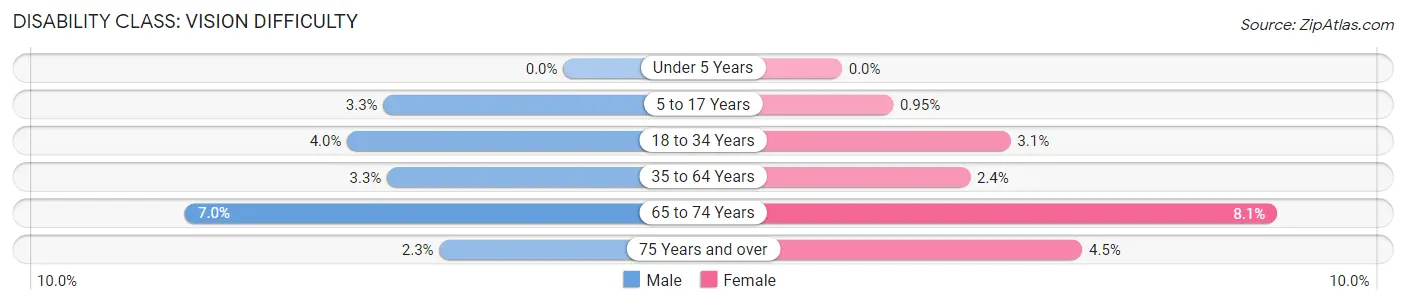
| Age Bracket | Male | Female |
| Under 5 Years | 0 (0.0%) | 0 (0.0%) |
| 5 to 17 Years | 49 (3.3%) | 13 (0.9%) |
| 18 to 34 Years | 81 (4.0%) | 67 (3.1%) |
| 35 to 64 Years | 116 (3.3%) | 80 (2.4%) |
| 65 to 74 Years | 51 (7.0%) | 56 (8.1%) |
| 75 Years and over | 6 (2.3%) | 32 (4.5%) |
Disability Class: Cognitive Difficulty
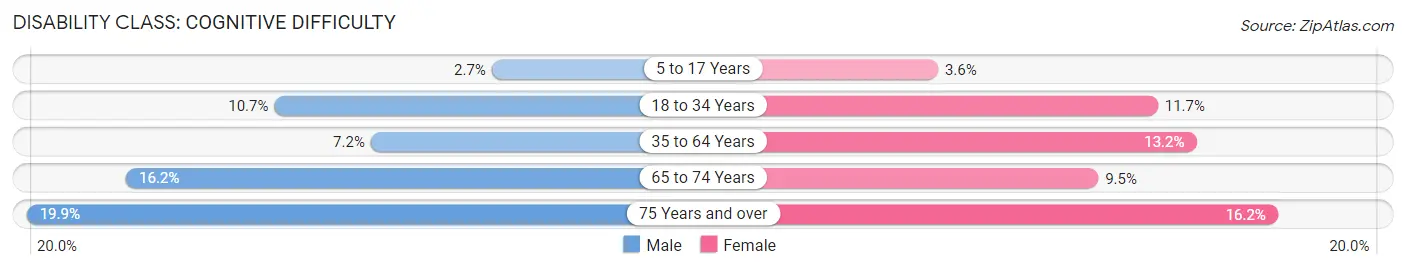
| Age Bracket | Male | Female |
| 5 to 17 Years | 39 (2.7%) | 49 (3.6%) |
| 18 to 34 Years | 217 (10.7%) | 251 (11.7%) |
| 35 to 64 Years | 254 (7.1%) | 443 (13.2%) |
| 65 to 74 Years | 118 (16.2%) | 66 (9.5%) |
| 75 Years and over | 52 (19.9%) | 116 (16.2%) |
Disability Class: Ambulatory Difficulty
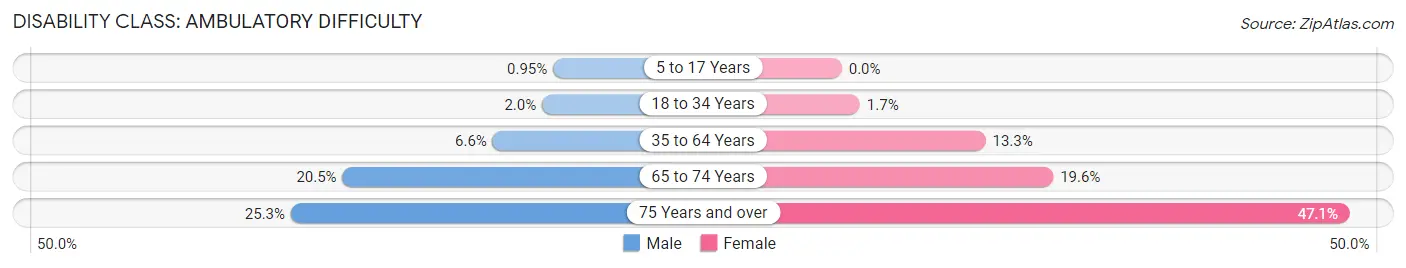
| Age Bracket | Male | Female |
| 5 to 17 Years | 14 (0.9%) | 0 (0.0%) |
| 18 to 34 Years | 40 (2.0%) | 36 (1.7%) |
| 35 to 64 Years | 233 (6.6%) | 449 (13.3%) |
| 65 to 74 Years | 149 (20.5%) | 136 (19.6%) |
| 75 Years and over | 66 (25.3%) | 338 (47.1%) |
Disability Class: Self-Care Difficulty
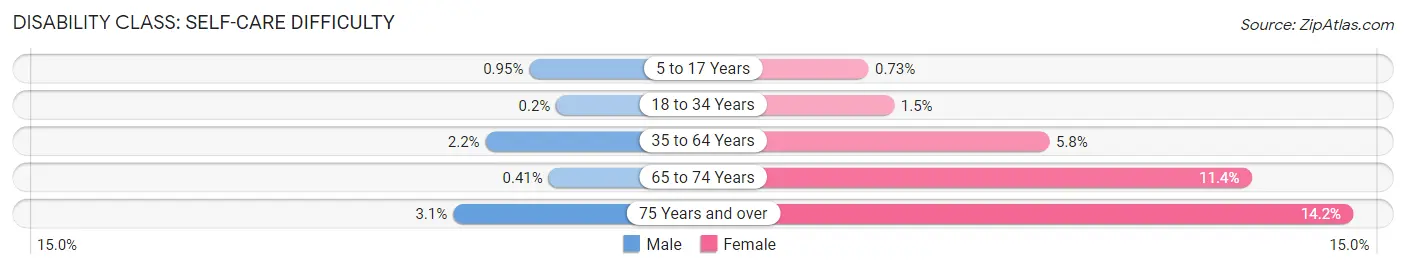
| Age Bracket | Male | Female |
| 5 to 17 Years | 14 (0.9%) | 10 (0.7%) |
| 18 to 34 Years | 4 (0.2%) | 31 (1.5%) |
| 35 to 64 Years | 77 (2.2%) | 194 (5.8%) |
| 65 to 74 Years | 3 (0.4%) | 79 (11.4%) |
| 75 Years and over | 8 (3.1%) | 102 (14.2%) |
Technology Access in Southbridge Town
Computing Device Access in Southbridge Town
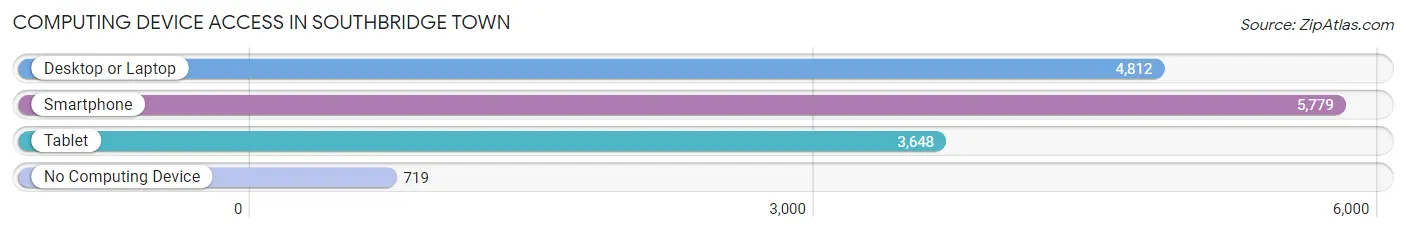
| Device Type | # Households | % Households |
| Desktop or Laptop | 4,812 | 68.4% |
| Smartphone | 5,779 | 82.2% |
| Tablet | 3,648 | 51.9% |
| No Computing Device | 719 | 10.2% |
| Total | 7,030 | 100.0% |
Internet Access in Southbridge Town
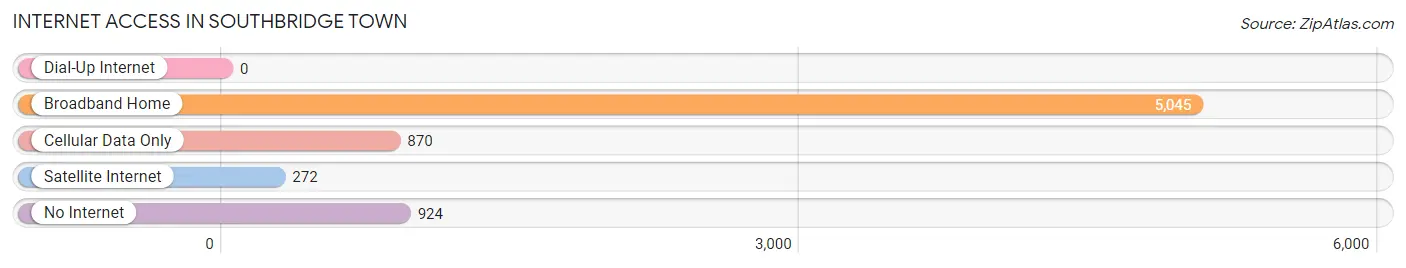
| Internet Type | # Households | % Households |
| Dial-Up Internet | 0 | 0.0% |
| Broadband Home | 5,045 | 71.8% |
| Cellular Data Only | 870 | 12.4% |
| Satellite Internet | 272 | 3.9% |
| No Internet | 924 | 13.1% |
| Total | 7,030 | 100.0% |
Southbridge Town Summary
Southbridge Town is a town located in Worcester County, Massachusetts, United States. It is situated in the south-central part of the state, approximately 40 miles southwest of Boston. The town was incorporated in 1730 and is the oldest town in Worcester County. As of the 2010 census, the town had a population of 16,719.
History
Southbridge Town was first settled in 1730 by a group of settlers from the nearby town of Sturbridge. The town was originally known as Charlton-Sturbridge, but was later renamed Southbridge in 1816. The town was officially incorporated in 1730 and was the first town to be incorporated in Worcester County.
The town was an important industrial center in the 19th century, with several factories producing textiles, paper, and other goods. The town was also home to the American Optical Company, which was founded in 1833 and is still in operation today.
Geography
Southbridge Town is located in south-central Massachusetts, approximately 40 miles southwest of Boston. The town is bordered by the towns of Sturbridge to the north, Charlton to the east, Dudley to the south, and Oxford to the west. The town is situated on the Quinebaug River, which flows through the center of town.
The town has a total area of 24.2 square miles, of which 24.1 square miles is land and 0.1 square miles is water. The town is mostly flat, with some hills in the northern part of town.
Economy
Southbridge Town has a diverse economy, with a mix of manufacturing, retail, and service industries. The town is home to several large employers, including the American Optical Company, which has been in operation since 1833. Other major employers in the town include Southbridge Savings Bank, Southbridge Hospital, and Southbridge Public Schools.
The town also has a thriving tourism industry, with several attractions, including the Southbridge Historical Society, the Southbridge Museum, and the Southbridge Town Hall.
Demographics
As of the 2010 census, Southbridge Town had a population of 16,719. The racial makeup of the town was 87.3% White, 5.2% African American, 0.5% Native American, 1.3% Asian, 0.1% Pacific Islander, 3.2% from other races, and 2.4% from two or more races. Hispanic or Latino of any race were 8.2% of the population.
The median income for a household in the town was $45,945, and the median income for a family was $54,945. The per capita income for the town was $21,945. About 11.2% of families and 14.2% of the population were below the poverty line, including 19.2% of those under age 18 and 8.2% of those age 65 or over.
Common Questions
What is Per Capita Income in Southbridge Town?
Per Capita income in Southbridge Town is $31,102.
What is the Median Family Income in Southbridge Town?
Median Family Income in Southbridge Town is $72,456.
What is the Median Household income in Southbridge Town?
Median Household Income in Southbridge Town is $55,182.
What is Income or Wage Gap in Southbridge Town?
Income or Wage Gap in Southbridge Town is 23.9%.
Women in Southbridge Town earn 76.1 cents for every dollar earned by a man.
What is Family Income Deficit in Southbridge Town?
Family Income Deficit in Southbridge Town is $10,580.
Families that are below poverty line in Southbridge Town earn $10,580 less on average than the poverty threshold level.
What is Inequality or Gini Index in Southbridge Town?
Inequality or Gini Index in Southbridge Town is 0.46.
What is the Total Population of Southbridge Town?
Total Population of Southbridge Town is 17,669.
What is the Total Male Population of Southbridge Town?
Total Male Population of Southbridge Town is 8,599.
What is the Total Female Population of Southbridge Town?
Total Female Population of Southbridge Town is 9,070.
What is the Ratio of Males per 100 Females in Southbridge Town?
There are 94.81 Males per 100 Females in Southbridge Town.
What is the Ratio of Females per 100 Males in Southbridge Town?
There are 105.48 Females per 100 Males in Southbridge Town.
What is the Median Population Age in Southbridge Town?
Median Population Age in Southbridge Town is 38.6 Years.
What is the Average Family Size in Southbridge Town
Average Family Size in Southbridge Town is 3.0 People.
What is the Average Household Size in Southbridge Town
Average Household Size in Southbridge Town is 2.5 People.
How Large is the Labor Force in Southbridge Town?
There are 9,159 People in the Labor Forcein in Southbridge Town.
What is the Percentage of People in the Labor Force in Southbridge Town?
63.7% of People are in the Labor Force in Southbridge Town.
What is the Unemployment Rate in Southbridge Town?
Unemployment Rate in Southbridge Town is 9.2%.