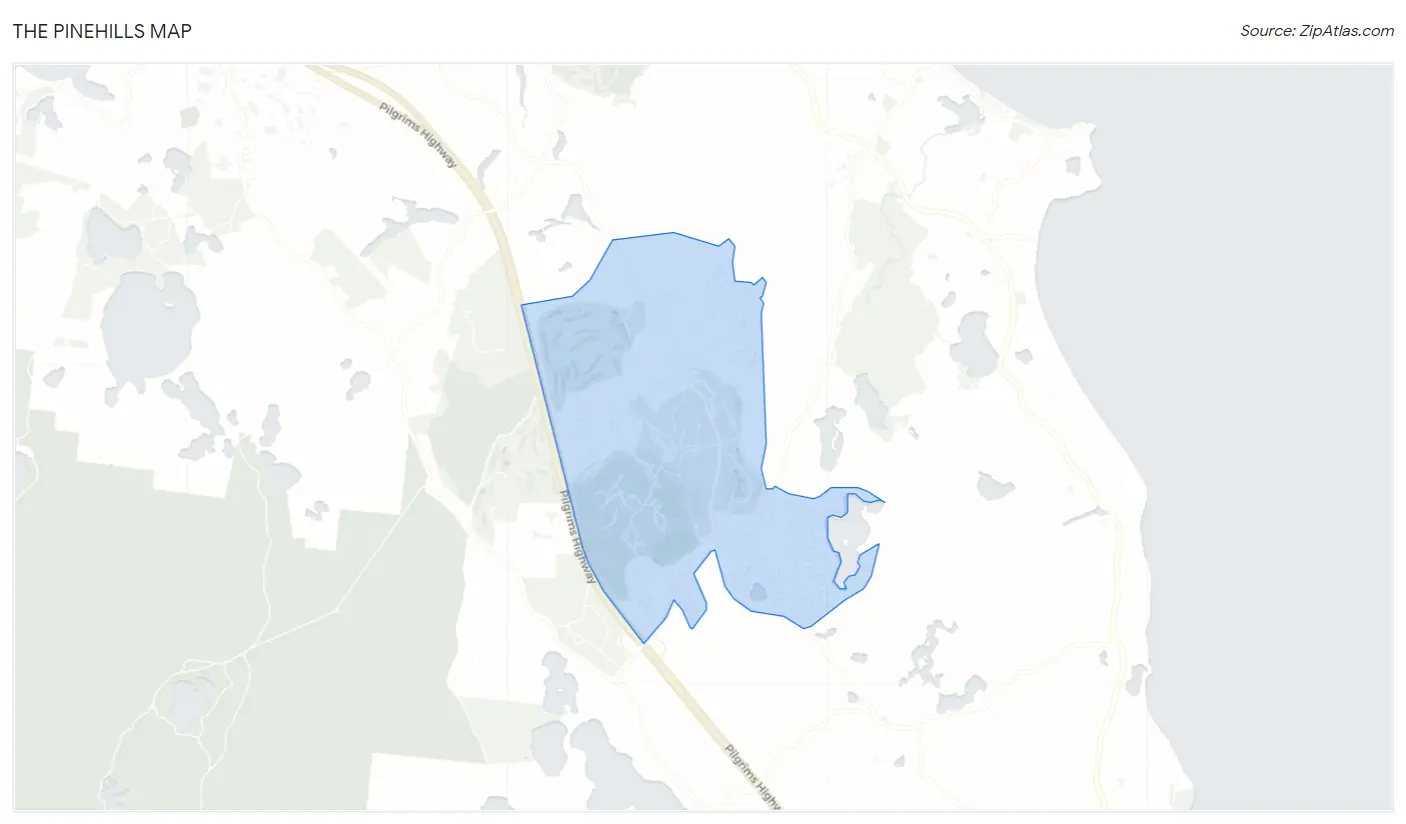
The Pinehills, MA Map & Demographics
The Pinehills Map
The Pinehills Overview
$95,431
PER CAPITA INCOME
$147,000
AVG FAMILY INCOME
$111,710
AVG HOUSEHOLD INCOME
52.1%
WAGE / INCOME GAP [ % ]
47.9¢/ $1
WAGE / INCOME GAP [ $ ]
0.51
INEQUALITY / GINI INDEX
5,127
TOTAL POPULATION
2,316
MALE POPULATION
2,811
FEMALE POPULATION
82.39
MALES / 100 FEMALES
121.37
FEMALES / 100 MALES
68.3
MEDIAN AGE
2.3
AVG FAMILY SIZE
1.9
AVG HOUSEHOLD SIZE
1,777
LABOR FORCE [ PEOPLE ]
36.6%
PERCENT IN LABOR FORCE
1.0%
UNEMPLOYMENT RATE
Income in The Pinehills
Income Overview in The Pinehills
Per Capita Income in The Pinehills is $95,431, while median incomes of families and households are $147,000 and $111,710 respectively.
| Characteristic | Number | Measure |
| Per Capita Income | 5,127 | $95,431 |
| Median Family Income | 1,714 | $147,000 |
| Mean Family Income | 1,714 | $234,245 |
| Median Household Income | 2,681 | $111,710 |
| Mean Household Income | 2,681 | $181,958 |
| Income Deficit | 1,714 | $0 |
| Wage / Income Gap (%) | 5,127 | 52.08% |
| Wage / Income Gap ($) | 5,127 | 47.92¢ per $1 |
| Gini / Inequality Index | 5,127 | 0.51 |
Earnings by Sex in The Pinehills
Average Earnings in The Pinehills are $76,899, $111,505 for men and $53,438 for women, a difference of 52.1%.
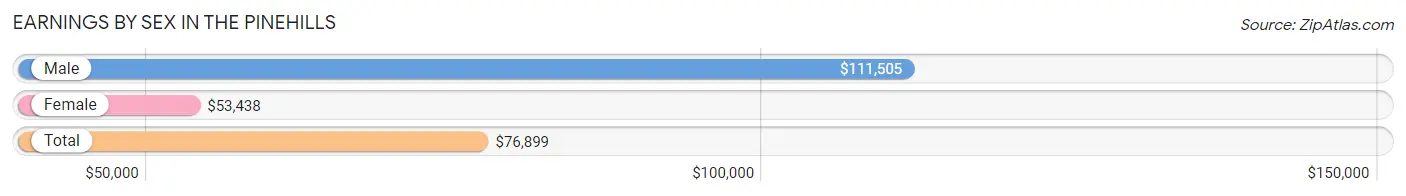
| Sex | Number | Average Earnings |
| Male | 1,145 (61.3%) | $111,505 |
| Female | 722 (38.7%) | $53,438 |
| Total | 1,867 (100.0%) | $76,899 |
Earnings by Sex by Income Bracket in The Pinehills
The most common earnings brackets in The Pinehills are $100,000+ for men (618 | 54.0%) and $100,000+ for women (150 | 20.8%).
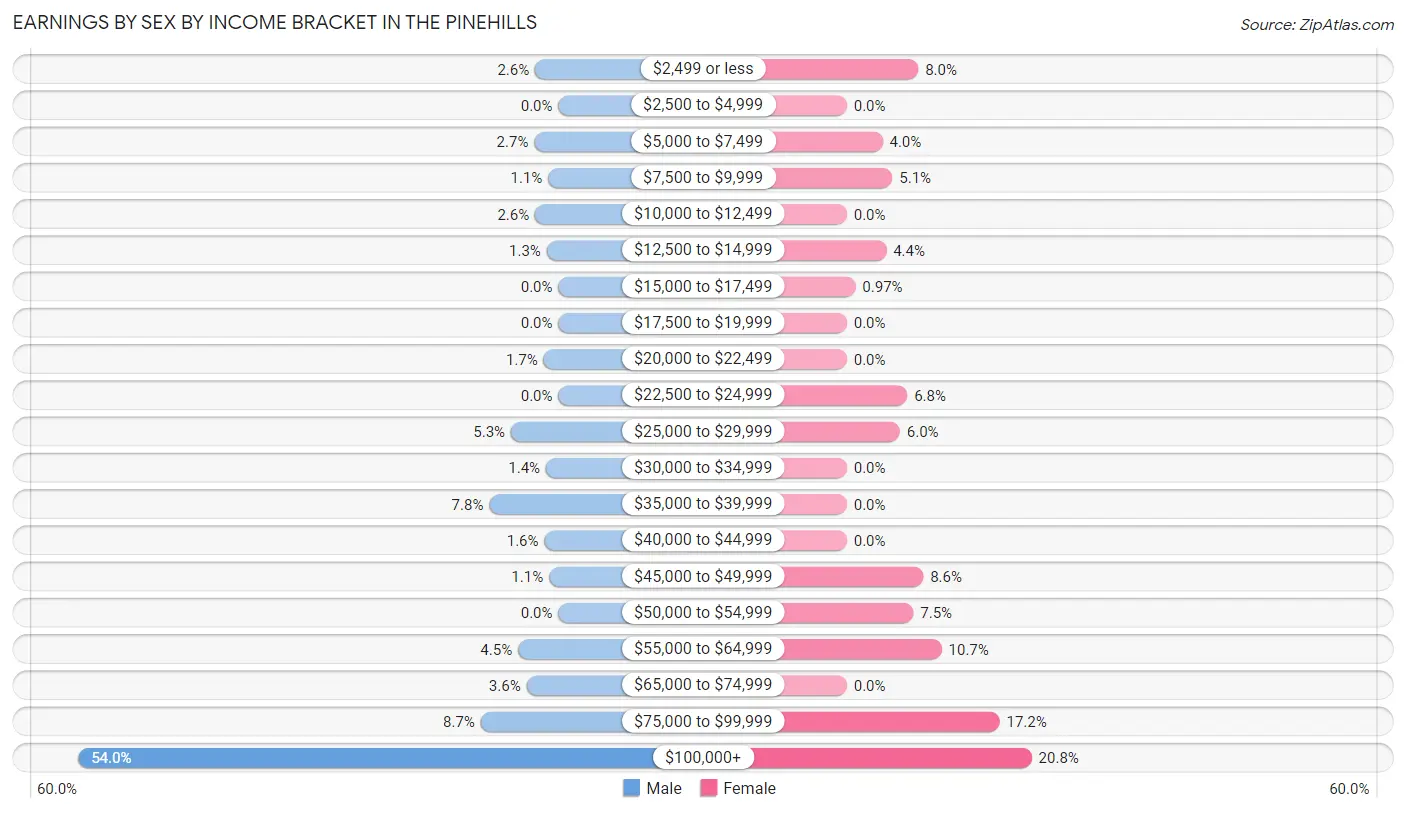
| Income | Male | Female |
| $2,499 or less | 30 (2.6%) | 58 (8.0%) |
| $2,500 to $4,999 | 0 (0.0%) | 0 (0.0%) |
| $5,000 to $7,499 | 31 (2.7%) | 29 (4.0%) |
| $7,500 to $9,999 | 13 (1.1%) | 37 (5.1%) |
| $10,000 to $12,499 | 30 (2.6%) | 0 (0.0%) |
| $12,500 to $14,999 | 15 (1.3%) | 32 (4.4%) |
| $15,000 to $17,499 | 0 (0.0%) | 7 (1.0%) |
| $17,500 to $19,999 | 0 (0.0%) | 0 (0.0%) |
| $20,000 to $22,499 | 19 (1.7%) | 0 (0.0%) |
| $22,500 to $24,999 | 0 (0.0%) | 49 (6.8%) |
| $25,000 to $29,999 | 61 (5.3%) | 43 (6.0%) |
| $30,000 to $34,999 | 16 (1.4%) | 0 (0.0%) |
| $35,000 to $39,999 | 89 (7.8%) | 0 (0.0%) |
| $40,000 to $44,999 | 18 (1.6%) | 0 (0.0%) |
| $45,000 to $49,999 | 12 (1.1%) | 62 (8.6%) |
| $50,000 to $54,999 | 0 (0.0%) | 54 (7.5%) |
| $55,000 to $64,999 | 52 (4.5%) | 77 (10.7%) |
| $65,000 to $74,999 | 41 (3.6%) | 0 (0.0%) |
| $75,000 to $99,999 | 100 (8.7%) | 124 (17.2%) |
| $100,000+ | 618 (54.0%) | 150 (20.8%) |
| Total | 1,145 (100.0%) | 722 (100.0%) |
Earnings by Sex by Educational Attainment in The Pinehills
Average earnings in The Pinehills are $112,296 for men and $52,303 for women, a difference of 53.4%. Men with an educational attainment of college or associate's degree enjoy the highest average annual earnings of $155,583, while those with graduate degree education earn the least with $111,735. Women with an educational attainment of bachelor's degree earn the most with the average annual earnings of $59,659, while those with college or associate's degree education have the smallest earnings of $46,573.
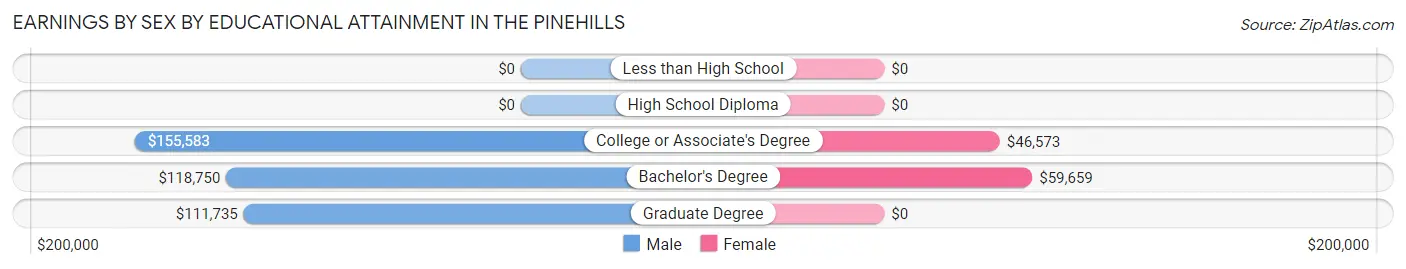
| Educational Attainment | Male Income | Female Income |
| Less than High School | - | - |
| High School Diploma | - | - |
| College or Associate's Degree | $155,583 | $46,573 |
| Bachelor's Degree | $118,750 | $59,659 |
| Graduate Degree | $111,735 | $0 |
| Total | $112,296 | $52,303 |
Family Income in The Pinehills
Family Income Brackets in The Pinehills
According to the The Pinehills family income data, there are 674 families falling into the $200,000+ income range, which is the most common income bracket and makes up 39.3% of all families.
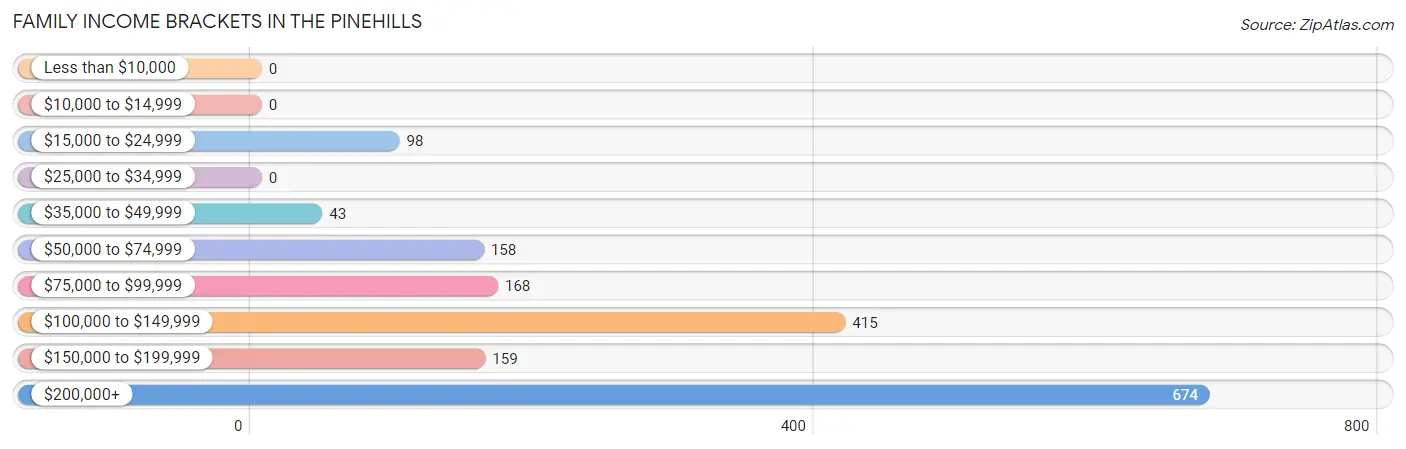
| Income Bracket | # Families | % Families |
| Less than $10,000 | 0 | 0.0% |
| $10,000 to $14,999 | 0 | 0.0% |
| $15,000 to $24,999 | 98 | 5.7% |
| $25,000 to $34,999 | 0 | 0.0% |
| $35,000 to $49,999 | 43 | 2.5% |
| $50,000 to $74,999 | 158 | 9.2% |
| $75,000 to $99,999 | 168 | 9.8% |
| $100,000 to $149,999 | 415 | 24.2% |
| $150,000 to $199,999 | 159 | 9.3% |
| $200,000+ | 674 | 39.3% |
Family Income by Famaliy Size in The Pinehills
3-person families (126 | 7.3%) account for the highest median family income in The Pinehills with $250,001 per family, while 3-person families (126 | 7.3%) have the highest median income of $83,334 per family member.
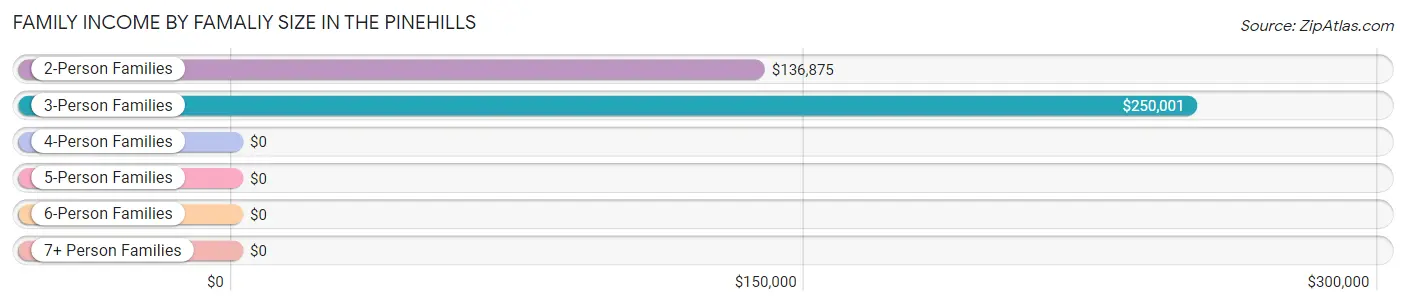
| Income Bracket | # Families | Median Income |
| 2-Person Families | 1,457 (85.0%) | $136,875 |
| 3-Person Families | 126 (7.3%) | $250,001 |
| 4-Person Families | 78 (4.5%) | $0 |
| 5-Person Families | 35 (2.0%) | $0 |
| 6-Person Families | 0 (0.0%) | $0 |
| 7+ Person Families | 18 (1.1%) | $0 |
| Total | 1,714 (100.0%) | $147,000 |
Family Income by Number of Earners in The Pinehills
The median family income in The Pinehills is $147,000, with families comprising 2 earners (331) having the highest median family income of $250,001, while families with no earners (728) have the lowest median family income of $110,132, accounting for 19.3% and 42.5% of families, respectively.
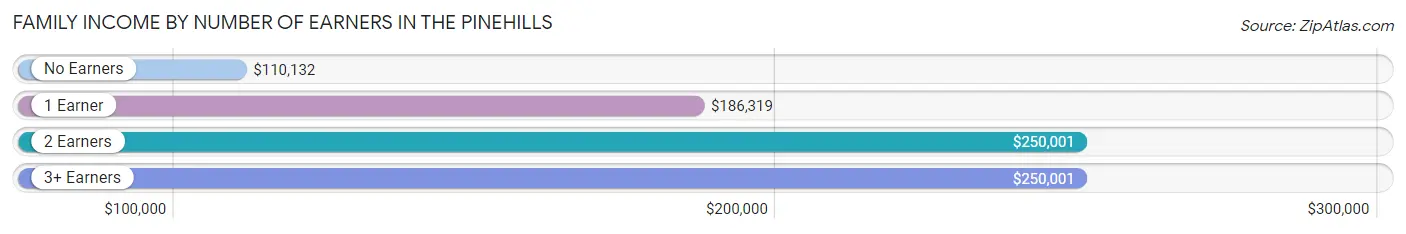
| Number of Earners | # Families | Median Income |
| No Earners | 728 (42.5%) | $110,132 |
| 1 Earner | 613 (35.8%) | $186,319 |
| 2 Earners | 331 (19.3%) | $250,001 |
| 3+ Earners | 42 (2.5%) | $250,001 |
| Total | 1,714 (100.0%) | $147,000 |
Household Income in The Pinehills
Household Income Brackets in The Pinehills
With 716 households falling in the category, the $200,000+ income range is the most frequent in The Pinehills, accounting for 26.7% of all households. In contrast, only 62 households (2.3%) fall into the $10,000 to $14,999 income bracket, making it the least populous group.
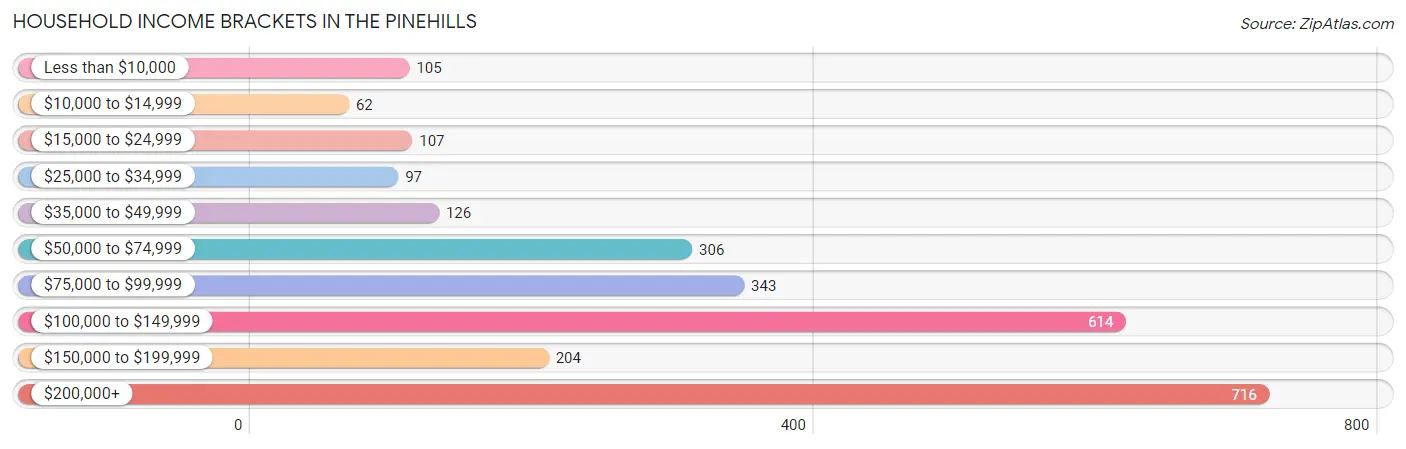
| Income Bracket | # Households | % Households |
| Less than $10,000 | 105 | 3.9% |
| $10,000 to $14,999 | 62 | 2.3% |
| $15,000 to $24,999 | 107 | 4.0% |
| $25,000 to $34,999 | 97 | 3.6% |
| $35,000 to $49,999 | 126 | 4.7% |
| $50,000 to $74,999 | 306 | 11.4% |
| $75,000 to $99,999 | 343 | 12.8% |
| $100,000 to $149,999 | 614 | 22.9% |
| $150,000 to $199,999 | 204 | 7.6% |
| $200,000+ | 716 | 26.7% |
Household Income by Householder Age in The Pinehills
The median household income in The Pinehills is $111,710, with the highest median household income of $192,723 found in the 45 to 64 years age bracket for the primary householder. A total of 777 households (29.0%) fall into this category.
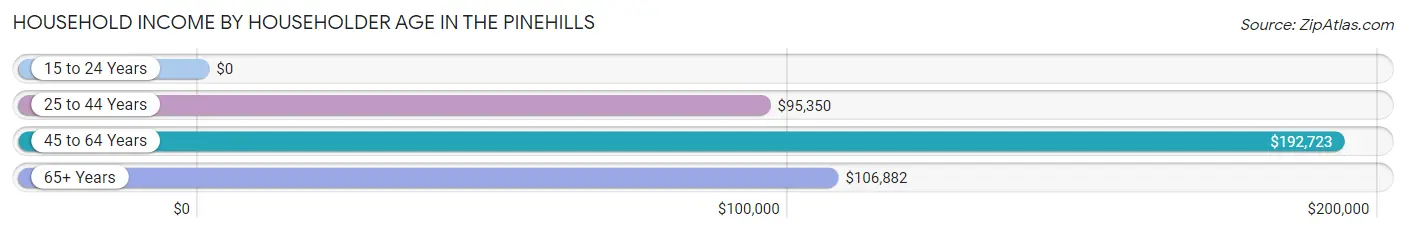
| Income Bracket | # Households | Median Income |
| 15 to 24 Years | 0 (0.0%) | $0 |
| 25 to 44 Years | 118 (4.4%) | $95,350 |
| 45 to 64 Years | 777 (29.0%) | $192,723 |
| 65+ Years | 1,786 (66.6%) | $106,882 |
| Total | 2,681 (100.0%) | $111,710 |
Poverty in The Pinehills
Income Below Poverty by Sex and Age in The Pinehills
With 0.6% poverty level for males and 6.8% for females among the residents of The Pinehills, 65 to 74 year old males and 35 to 44 year old females are the most vulnerable to poverty, with 14 males (1.8%) and 16 females (16.7%) in their respective age groups living below the poverty level.
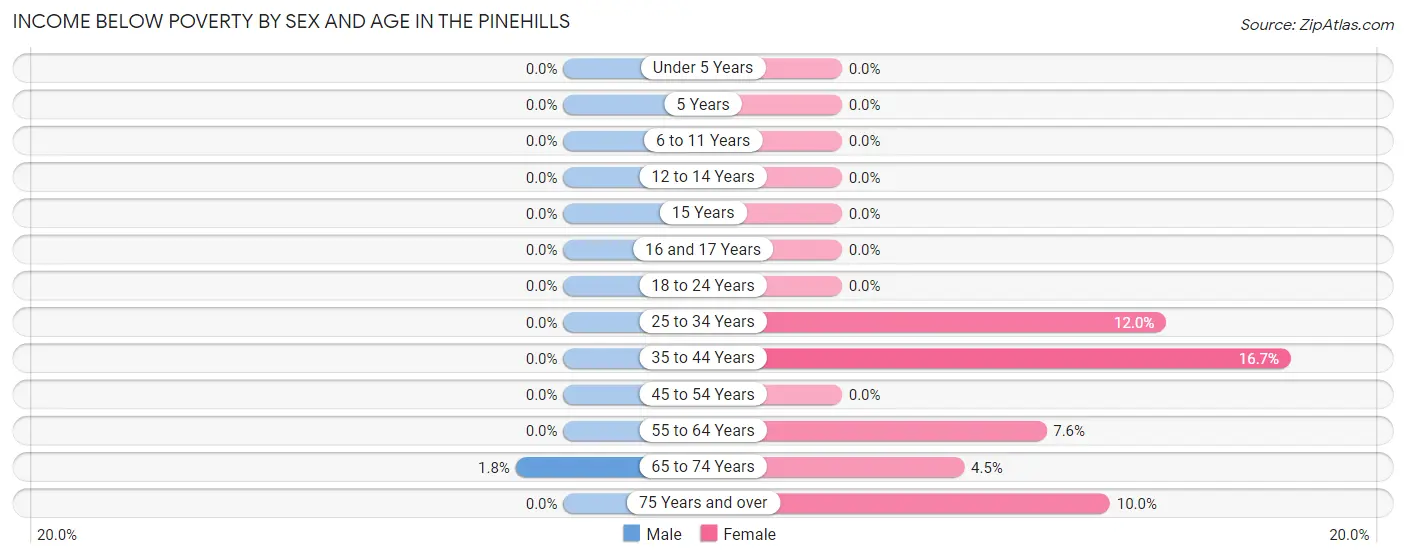
| Age Bracket | Male | Female |
| Under 5 Years | 0 (0.0%) | 0 (0.0%) |
| 5 Years | 0 (0.0%) | 0 (0.0%) |
| 6 to 11 Years | 0 (0.0%) | 0 (0.0%) |
| 12 to 14 Years | 0 (0.0%) | 0 (0.0%) |
| 15 Years | 0 (0.0%) | 0 (0.0%) |
| 16 and 17 Years | 0 (0.0%) | 0 (0.0%) |
| 18 to 24 Years | 0 (0.0%) | 0 (0.0%) |
| 25 to 34 Years | 0 (0.0%) | 13 (12.0%) |
| 35 to 44 Years | 0 (0.0%) | 16 (16.7%) |
| 45 to 54 Years | 0 (0.0%) | 0 (0.0%) |
| 55 to 64 Years | 0 (0.0%) | 34 (7.6%) |
| 65 to 74 Years | 14 (1.8%) | 46 (4.5%) |
| 75 Years and over | 0 (0.0%) | 81 (10.0%) |
| Total | 14 (0.6%) | 190 (6.8%) |
Income Above Poverty by Sex and Age in The Pinehills
According to the poverty statistics in The Pinehills, males aged 6 to 11 years and females aged under 5 years are the age groups that are most secure financially, with 100.0% of males and 100.0% of females in these age groups living above the poverty line.
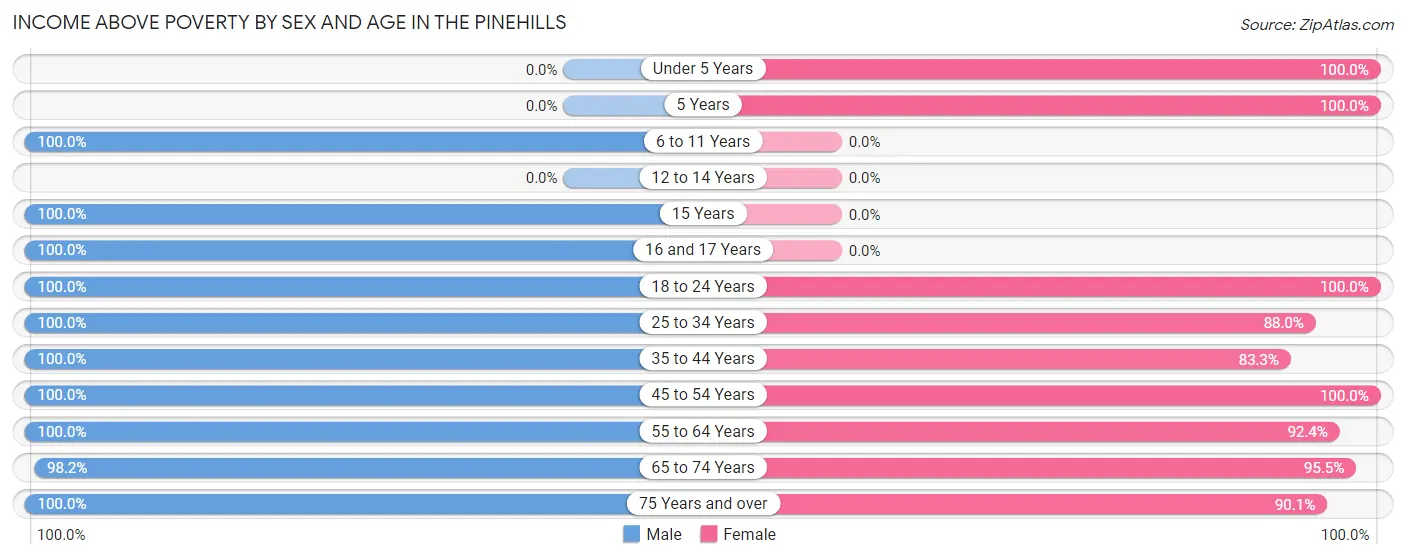
| Age Bracket | Male | Female |
| Under 5 Years | 0 (0.0%) | 51 (100.0%) |
| 5 Years | 0 (0.0%) | 57 (100.0%) |
| 6 to 11 Years | 100 (100.0%) | 0 (0.0%) |
| 12 to 14 Years | 0 (0.0%) | 0 (0.0%) |
| 15 Years | 65 (100.0%) | 0 (0.0%) |
| 16 and 17 Years | 57 (100.0%) | 0 (0.0%) |
| 18 to 24 Years | 14 (100.0%) | 18 (100.0%) |
| 25 to 34 Years | 93 (100.0%) | 95 (88.0%) |
| 35 to 44 Years | 36 (100.0%) | 80 (83.3%) |
| 45 to 54 Years | 324 (100.0%) | 205 (100.0%) |
| 55 to 64 Years | 284 (100.0%) | 414 (92.4%) |
| 65 to 74 Years | 778 (98.2%) | 968 (95.5%) |
| 75 Years and over | 551 (100.0%) | 733 (90.0%) |
| Total | 2,302 (99.4%) | 2,621 (93.2%) |
Income Below Poverty Among Married-Couple Families in The Pinehills
The poverty statistics for married-couple families in The Pinehills show that 0.9% or 14 of the total 1,635 families live below the poverty line. Families with no children have the highest poverty rate of 0.9%, comprising of 14 families. On the other hand, families with 1 or 2 children have the lowest poverty rate of 0.0%, which includes 0 families.
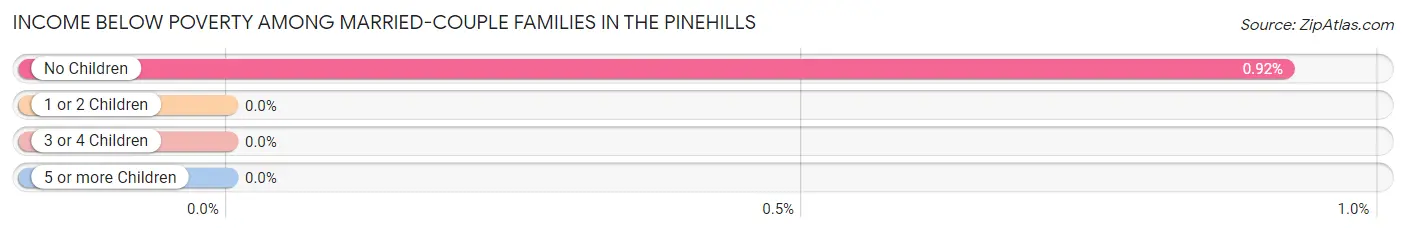
| Children | Above Poverty | Below Poverty |
| No Children | 1,502 (99.1%) | 14 (0.9%) |
| 1 or 2 Children | 84 (100.0%) | 0 (0.0%) |
| 3 or 4 Children | 35 (100.0%) | 0 (0.0%) |
| 5 or more Children | 0 (0.0%) | 0 (0.0%) |
| Total | 1,621 (99.1%) | 14 (0.9%) |
Income Below Poverty Among Single-Parent Households in The Pinehills
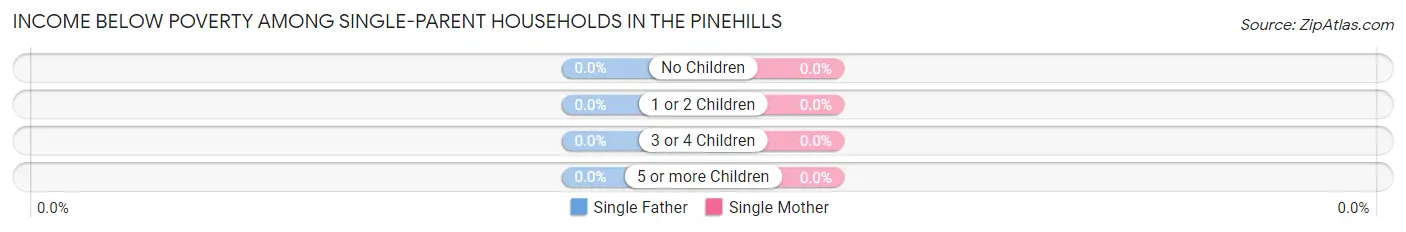
| Children | Single Father | Single Mother |
| No Children | 0 (0.0%) | 0 (0.0%) |
| 1 or 2 Children | 0 (0.0%) | 0 (0.0%) |
| 3 or 4 Children | 0 (0.0%) | 0 (0.0%) |
| 5 or more Children | 0 (0.0%) | 0 (0.0%) |
| Total | 0 (0.0%) | 0 (0.0%) |
Income Below Poverty Among Married-Couple vs Single-Parent Households in The Pinehills
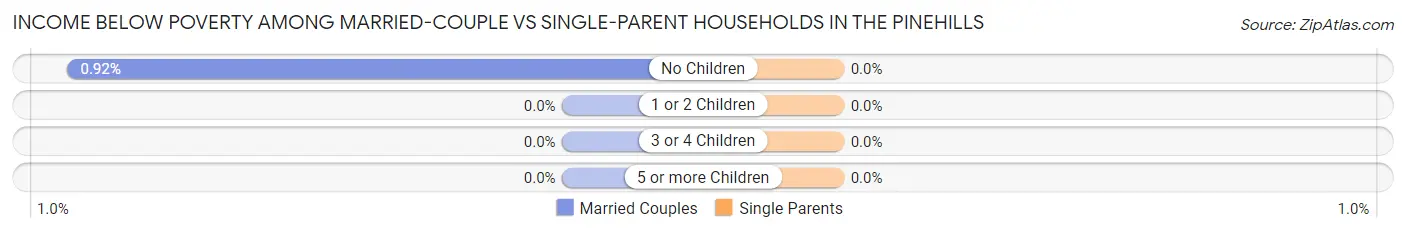
| Children | Married-Couple Families | Single-Parent Households |
| No Children | 14 (0.9%) | 0 (0.0%) |
| 1 or 2 Children | 0 (0.0%) | 0 (0.0%) |
| 3 or 4 Children | 0 (0.0%) | 0 (0.0%) |
| 5 or more Children | 0 (0.0%) | 0 (0.0%) |
| Total | 14 (0.9%) | 0 (0.0%) |
Race in The Pinehills
The most populous races in The Pinehills are White / Caucasian (5,053 | 98.6%), and Two or more Races (74 | 1.4%).
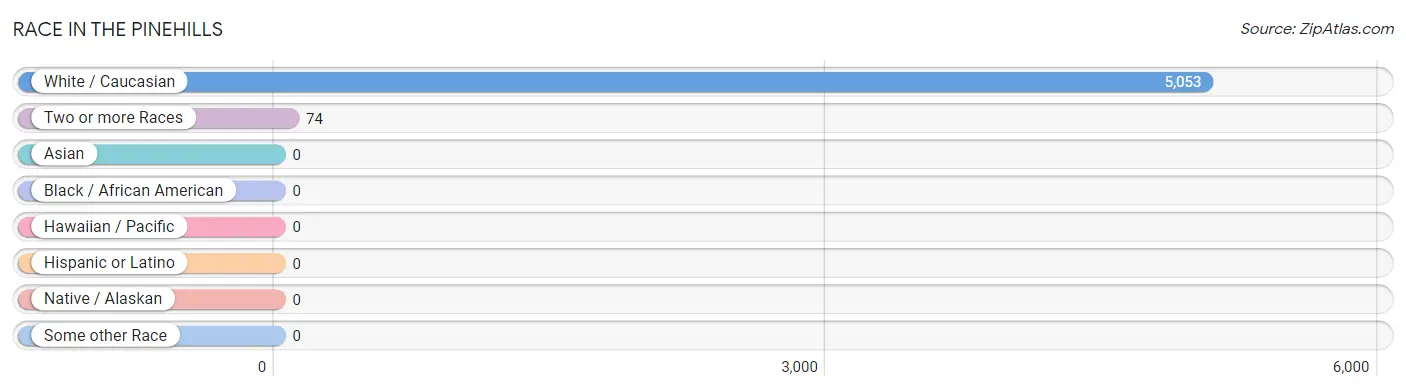
| Race | # Population | % Population |
| Asian | 0 | 0.0% |
| Black / African American | 0 | 0.0% |
| Hawaiian / Pacific | 0 | 0.0% |
| Hispanic or Latino | 0 | 0.0% |
| Native / Alaskan | 0 | 0.0% |
| White / Caucasian | 5,053 | 98.6% |
| Two or more Races | 74 | 1.4% |
| Some other Race | 0 | 0.0% |
| Total | 5,127 | 100.0% |
Ancestry in The Pinehills
The most populous ancestries reported in The Pinehills are Irish (1,636 | 31.9%), English (1,177 | 23.0%), Italian (866 | 16.9%), German (449 | 8.8%), and French (333 | 6.5%), together accounting for 87.0% of all The Pinehills residents.
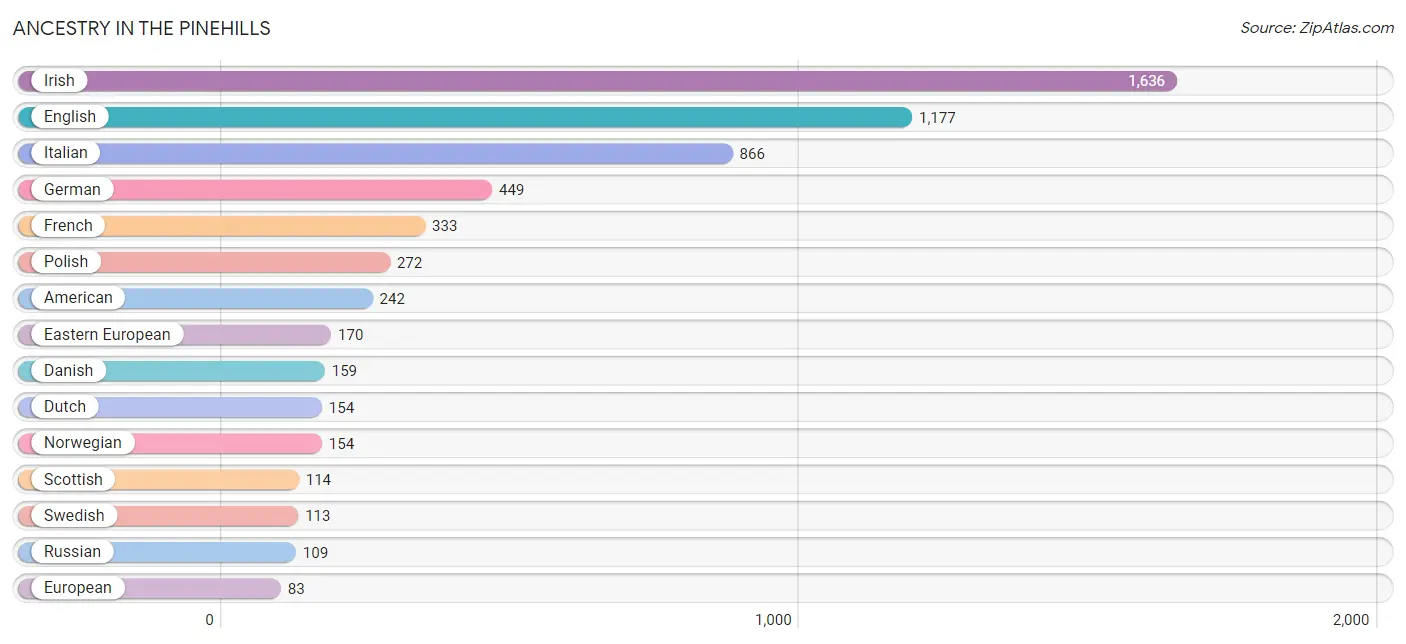
| Ancestry | # Population | % Population |
| African | 17 | 0.3% |
| American | 242 | 4.7% |
| Assyrian / Chaldean / Syriac | 14 | 0.3% |
| British | 31 | 0.6% |
| Canadian | 20 | 0.4% |
| Croatian | 14 | 0.3% |
| Danish | 159 | 3.1% |
| Dutch | 154 | 3.0% |
| Eastern European | 170 | 3.3% |
| English | 1,177 | 23.0% |
| European | 83 | 1.6% |
| French | 333 | 6.5% |
| French Canadian | 77 | 1.5% |
| German | 449 | 8.8% |
| Greek | 13 | 0.3% |
| Hungarian | 17 | 0.3% |
| Irish | 1,636 | 31.9% |
| Israeli | 12 | 0.2% |
| Italian | 866 | 16.9% |
| Lithuanian | 31 | 0.6% |
| Northern European | 15 | 0.3% |
| Norwegian | 154 | 3.0% |
| Polish | 272 | 5.3% |
| Portuguese | 53 | 1.0% |
| Romanian | 16 | 0.3% |
| Russian | 109 | 2.1% |
| Scotch-Irish | 24 | 0.5% |
| Scottish | 114 | 2.2% |
| Slavic | 13 | 0.3% |
| Slovak | 20 | 0.4% |
| Subsaharan African | 17 | 0.3% |
| Swedish | 113 | 2.2% |
| Ukrainian | 7 | 0.1% |
| Welsh | 35 | 0.7% | View All 34 Rows |
Immigrants in The Pinehills
The most numerous immigrant groups reported in The Pinehills came from Europe (51 | 1.0%), Portugal (36 | 0.7%), Southern Europe (36 | 0.7%), Latin America (32 | 0.6%), and South America (32 | 0.6%), together accounting for 3.6% of all The Pinehills residents.
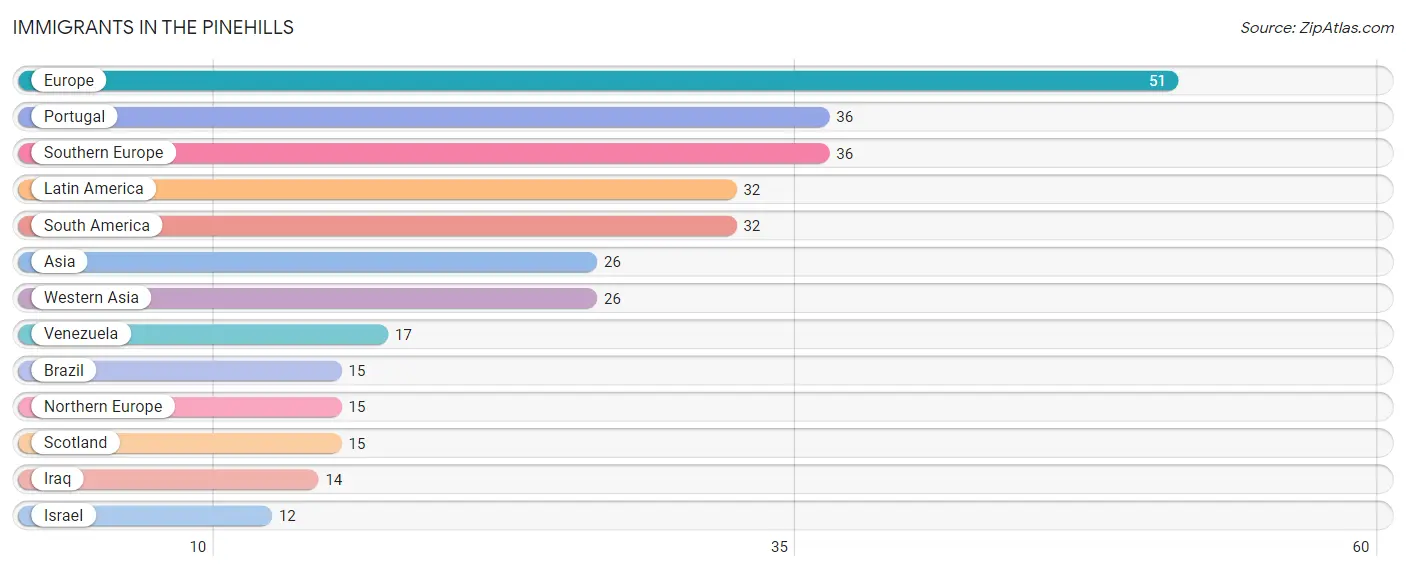
| Immigration Origin | # Population | % Population |
| Asia | 26 | 0.5% |
| Brazil | 15 | 0.3% |
| Europe | 51 | 1.0% |
| Iraq | 14 | 0.3% |
| Israel | 12 | 0.2% |
| Latin America | 32 | 0.6% |
| Northern Europe | 15 | 0.3% |
| Portugal | 36 | 0.7% |
| Scotland | 15 | 0.3% |
| South America | 32 | 0.6% |
| Southern Europe | 36 | 0.7% |
| Venezuela | 17 | 0.3% |
| Western Asia | 26 | 0.5% | View All 13 Rows |
Sex and Age in The Pinehills
Sex and Age in The Pinehills
The most populous age groups in The Pinehills are 65 to 69 Years (442 | 19.1%) for men and 65 to 69 Years (535 | 19.0%) for women.
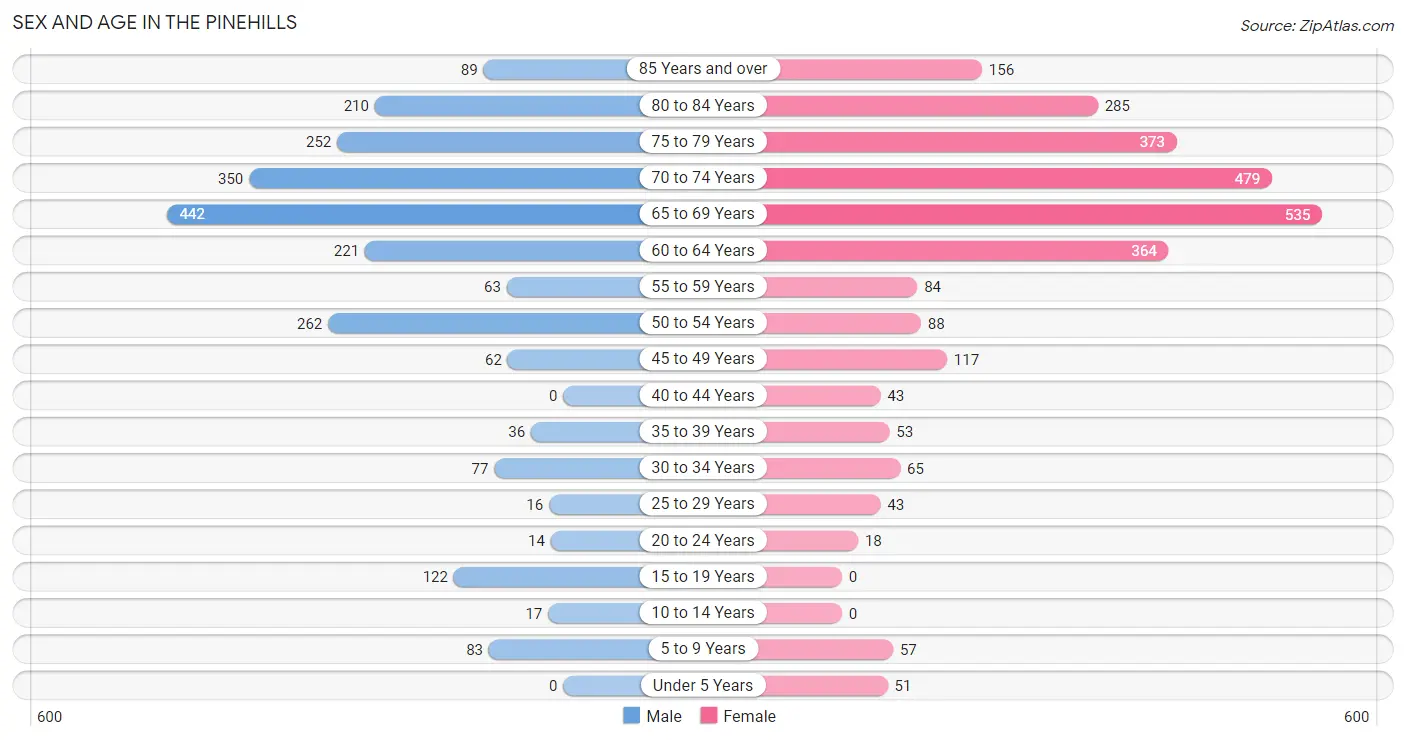
| Age Bracket | Male | Female |
| Under 5 Years | 0 (0.0%) | 51 (1.8%) |
| 5 to 9 Years | 83 (3.6%) | 57 (2.0%) |
| 10 to 14 Years | 17 (0.7%) | 0 (0.0%) |
| 15 to 19 Years | 122 (5.3%) | 0 (0.0%) |
| 20 to 24 Years | 14 (0.6%) | 18 (0.6%) |
| 25 to 29 Years | 16 (0.7%) | 43 (1.5%) |
| 30 to 34 Years | 77 (3.3%) | 65 (2.3%) |
| 35 to 39 Years | 36 (1.5%) | 53 (1.9%) |
| 40 to 44 Years | 0 (0.0%) | 43 (1.5%) |
| 45 to 49 Years | 62 (2.7%) | 117 (4.2%) |
| 50 to 54 Years | 262 (11.3%) | 88 (3.1%) |
| 55 to 59 Years | 63 (2.7%) | 84 (3.0%) |
| 60 to 64 Years | 221 (9.5%) | 364 (13.0%) |
| 65 to 69 Years | 442 (19.1%) | 535 (19.0%) |
| 70 to 74 Years | 350 (15.1%) | 479 (17.0%) |
| 75 to 79 Years | 252 (10.9%) | 373 (13.3%) |
| 80 to 84 Years | 210 (9.1%) | 285 (10.1%) |
| 85 Years and over | 89 (3.8%) | 156 (5.6%) |
| Total | 2,316 (100.0%) | 2,811 (100.0%) |
Families and Households in The Pinehills
Median Family Size in The Pinehills
The median family size in The Pinehills is 2.29 persons per family, with single male/father families (18 | 1.1%) accounting for the largest median family size of 7.61 persons per family. On the other hand, single female/mother families (61 | 3.6%) represent the smallest median family size with 2.16 persons per family.
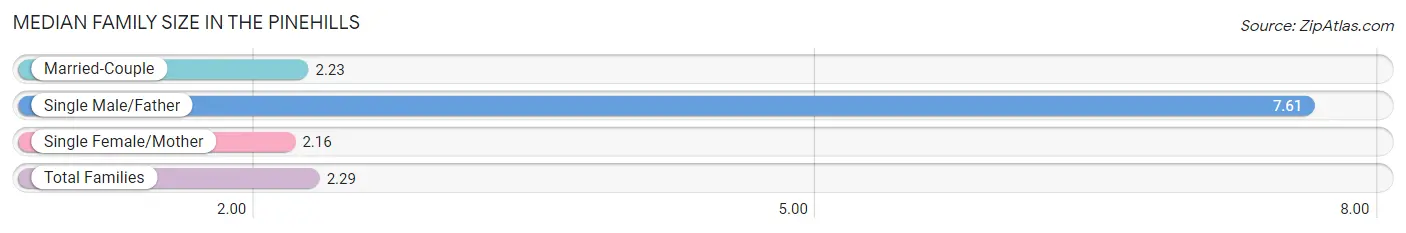
| Family Type | # Families | Family Size |
| Married-Couple | 1,635 (95.4%) | 2.23 |
| Single Male/Father | 18 (1.1%) | 7.61 |
| Single Female/Mother | 61 (3.6%) | 2.16 |
| Total Families | 1,714 (100.0%) | 2.29 |
Median Household Size in The Pinehills
The median household size in The Pinehills is 1.91 persons per household, with single male/father households (18 | 0.7%) accounting for the largest median household size of 7.61 persons per household. non-family households (967 | 36.1%) represent the smallest median household size with 1.25 persons per household.
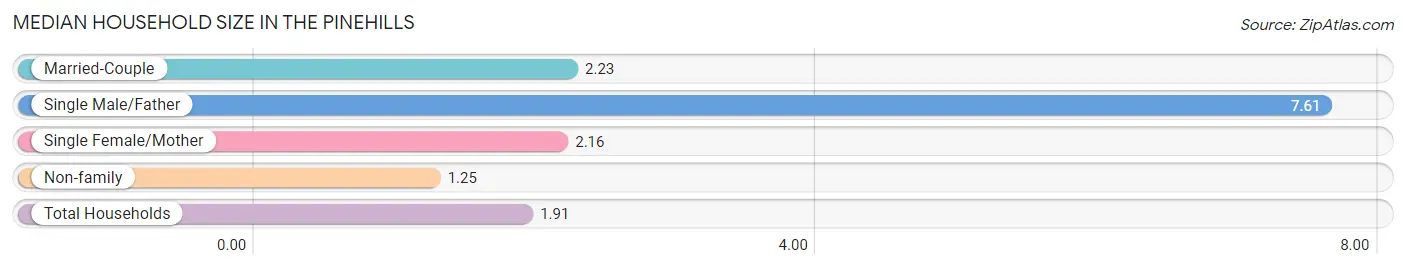
| Household Type | # Households | Household Size |
| Married-Couple | 1,635 (61.0%) | 2.23 |
| Single Male/Father | 18 (0.7%) | 7.61 |
| Single Female/Mother | 61 (2.3%) | 2.16 |
| Non-family | 967 (36.1%) | 1.25 |
| Total Households | 2,681 (100.0%) | 1.91 |
Household Size by Marriage Status in The Pinehills
Out of a total of 2,681 households in The Pinehills, 1,714 (63.9%) are family households, while 967 (36.1%) are nonfamily households. The most numerous type of family households are 2-person households, comprising 1,457, and the most common type of nonfamily households are 1-person households, comprising 715.
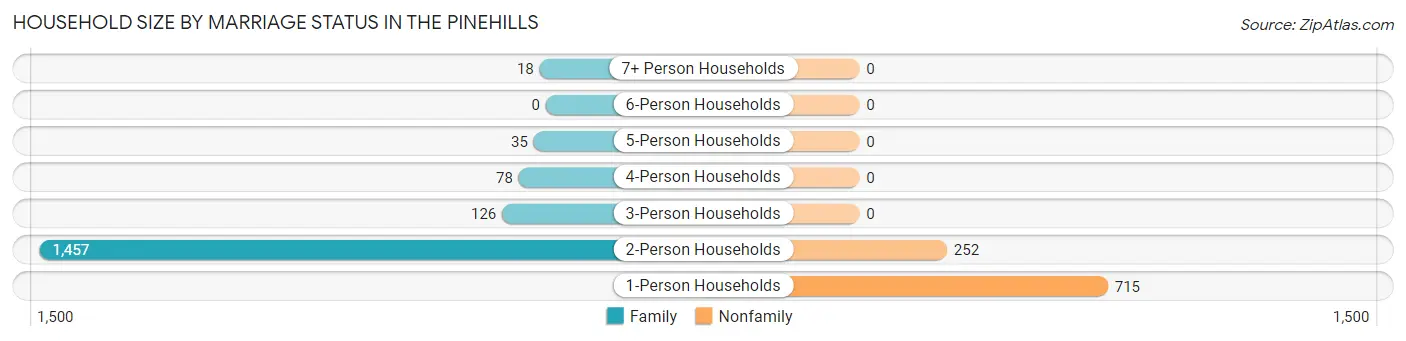
| Household Size | Family Households | Nonfamily Households |
| 1-Person Households | - | 715 (26.7%) |
| 2-Person Households | 1,457 (54.3%) | 252 (9.4%) |
| 3-Person Households | 126 (4.7%) | 0 (0.0%) |
| 4-Person Households | 78 (2.9%) | 0 (0.0%) |
| 5-Person Households | 35 (1.3%) | 0 (0.0%) |
| 6-Person Households | 0 (0.0%) | 0 (0.0%) |
| 7+ Person Households | 18 (0.7%) | 0 (0.0%) |
| Total | 1,714 (63.9%) | 967 (36.1%) |
Female Fertility in The Pinehills
Fertility by Age in The Pinehills
| Age Bracket | Women with Births | Births / 1,000 Women |
| 15 to 19 years | 0 (0.0%) | 0.0 |
| 20 to 34 years | 0 (0.0%) | 0.0 |
| 35 to 50 years | 0 (0.0%) | 0.0 |
| Total | 0 (0.0%) | 0.0 |
Fertility by Age by Marriage Status in The Pinehills

| Age Bracket | Married | Unmarried |
| 15 to 19 years | 0 (0.0%) | 0 (0.0%) |
| 20 to 34 years | 0 (0.0%) | 0 (0.0%) |
| 35 to 50 years | 0 (0.0%) | 0 (0.0%) |
| Total | 0 (0.0%) | 0 (0.0%) |
Fertility by Education in The Pinehills
| Educational Attainment | Women with Births | Births / 1,000 Women |
| Less than High School | 0 (0.0%) | 0.0 |
| High School Diploma | 0 (0.0%) | 0.0 |
| College or Associate's Degree | 0 (0.0%) | 0.0 |
| Bachelor's Degree | 0 (0.0%) | 0.0 |
| Graduate Degree | 0 (0.0%) | 0.0 |
| Total | 0 (0.0%) | 0.0 |
Fertility by Education by Marriage Status in The Pinehills
| Educational Attainment | Married | Unmarried |
| Less than High School | 0 (0.0%) | 0 (0.0%) |
| High School Diploma | 0 (0.0%) | 0 (0.0%) |
| College or Associate's Degree | 0 (0.0%) | 0 (0.0%) |
| Bachelor's Degree | 0 (0.0%) | 0 (0.0%) |
| Graduate Degree | 0 (0.0%) | 0 (0.0%) |
| Total | 0 (0.0%) | 0 (0.0%) |
Employment Characteristics in The Pinehills
Employment by Class of Employer in The Pinehills
Among the 1,759 employed individuals in The Pinehills, private company employees (1,130 | 64.2%), self-employed (not incorporated) (218 | 12.4%), and state government employees (115 | 6.5%) make up the most common classes of employment.
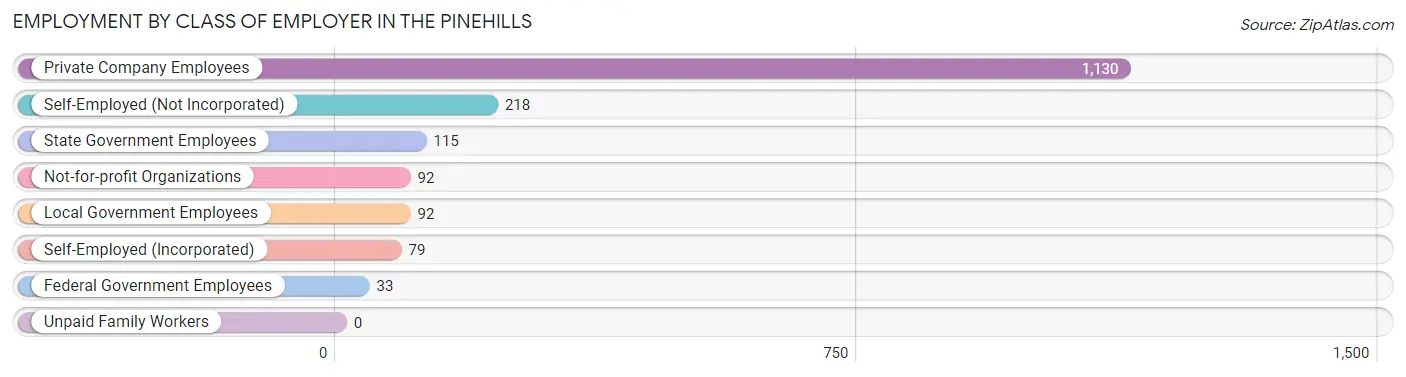
| Employer Class | # Employees | % Employees |
| Private Company Employees | 1,130 | 64.2% |
| Self-Employed (Incorporated) | 79 | 4.5% |
| Self-Employed (Not Incorporated) | 218 | 12.4% |
| Not-for-profit Organizations | 92 | 5.2% |
| Local Government Employees | 92 | 5.2% |
| State Government Employees | 115 | 6.5% |
| Federal Government Employees | 33 | 1.9% |
| Unpaid Family Workers | 0 | 0.0% |
| Total | 1,759 | 100.0% |
Employment Status by Age in The Pinehills
According to the labor force statistics for The Pinehills, out of the total population over 16 years of age (4,854), 36.6% or 1,777 individuals are in the labor force, with 1.0% or 18 of them unemployed. The age group with the highest labor force participation rate is 30 to 34 years, with 100.0% or 142 individuals in the labor force. Within the labor force, the 16 to 19 years age range has the highest percentage of unemployed individuals, with 100.0% or 17 of them being unemployed.
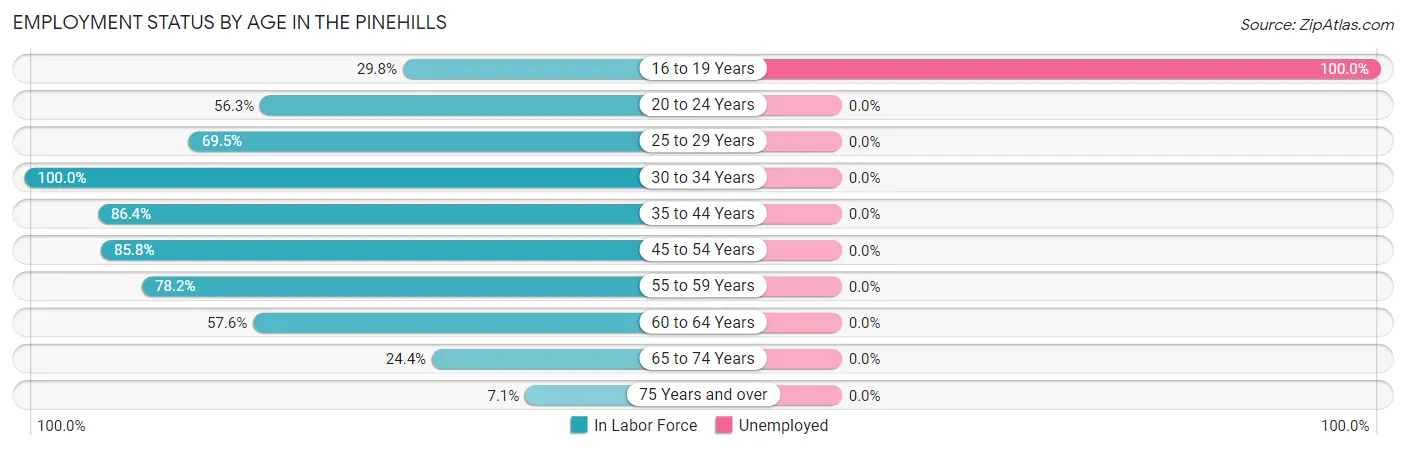
| Age Bracket | In Labor Force | Unemployed |
| 16 to 19 Years | 17 (29.8%) | 17 (100.0%) |
| 20 to 24 Years | 18 (56.3%) | 0 (0.0%) |
| 25 to 29 Years | 41 (69.5%) | 0 (0.0%) |
| 30 to 34 Years | 142 (100.0%) | 0 (0.0%) |
| 35 to 44 Years | 114 (86.4%) | 0 (0.0%) |
| 45 to 54 Years | 454 (85.8%) | 0 (0.0%) |
| 55 to 59 Years | 115 (78.2%) | 0 (0.0%) |
| 60 to 64 Years | 337 (57.6%) | 0 (0.0%) |
| 65 to 74 Years | 441 (24.4%) | 0 (0.0%) |
| 75 Years and over | 97 (7.1%) | 0 (0.0%) |
| Total | 1,777 (36.6%) | 18 (1.0%) |
Employment Status by Educational Attainment in The Pinehills
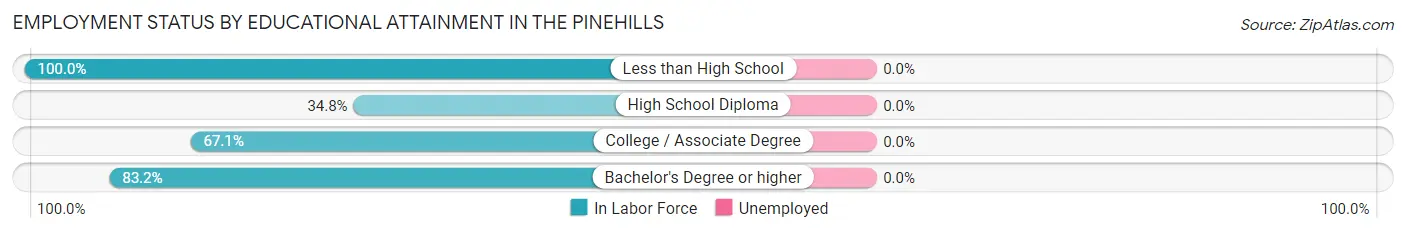
| Educational Attainment | In Labor Force | Unemployed |
| Less than High School | 7 (100.0%) | 0 (0.0%) |
| High School Diploma | 46 (34.8%) | 0 (0.0%) |
| College / Associate Degree | 251 (67.1%) | 0 (0.0%) |
| Bachelor's Degree or higher | 899 (83.2%) | 0 (0.0%) |
| Total | 1,203 (75.5%) | 0 (0.0%) |
Employment Occupations by Sex in The Pinehills
Management, Business, Science and Arts Occupations
The most common Management, Business, Science and Arts occupations in The Pinehills are Management (341 | 19.4%), Community & Social Service (313 | 17.8%), Legal Services & Support (168 | 9.6%), Business & Financial (165 | 9.4%), and Health Diagnosing & Treating (109 | 6.2%).
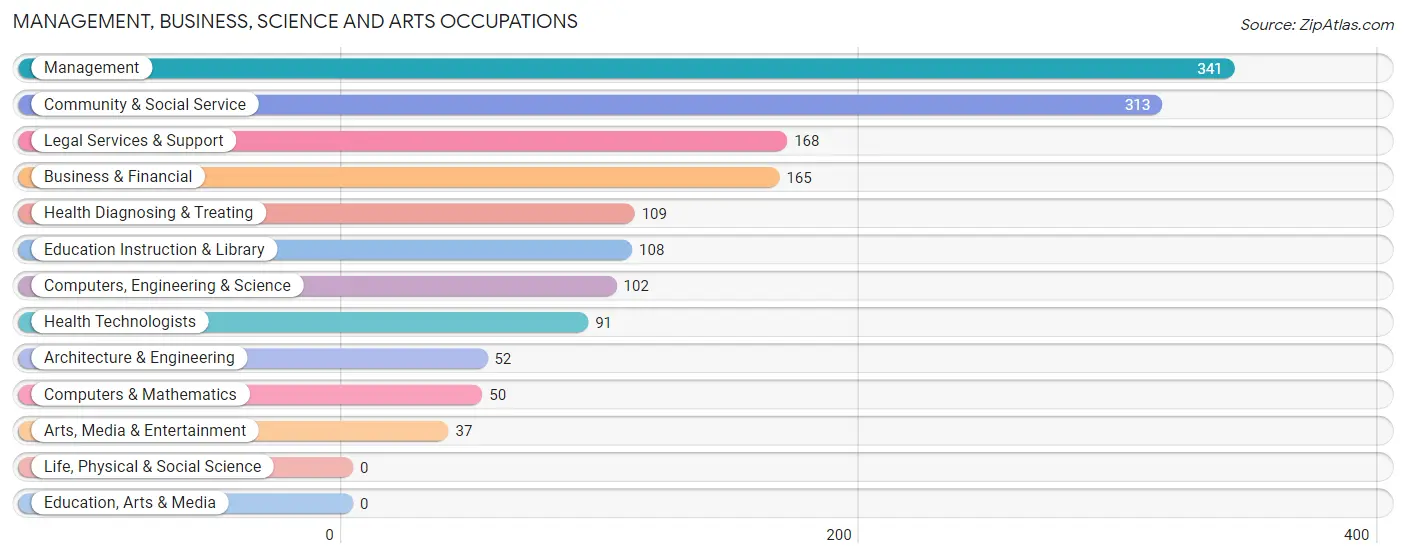
Management, Business, Science and Arts Occupations by Sex
Within the Management, Business, Science and Arts occupations in The Pinehills, the most male-oriented occupations are Computers & Mathematics (100.0%), Legal Services & Support (100.0%), and Management (84.2%), while the most female-oriented occupations are Architecture & Engineering (100.0%), Arts, Media & Entertainment (100.0%), and Health Diagnosing & Treating (100.0%).
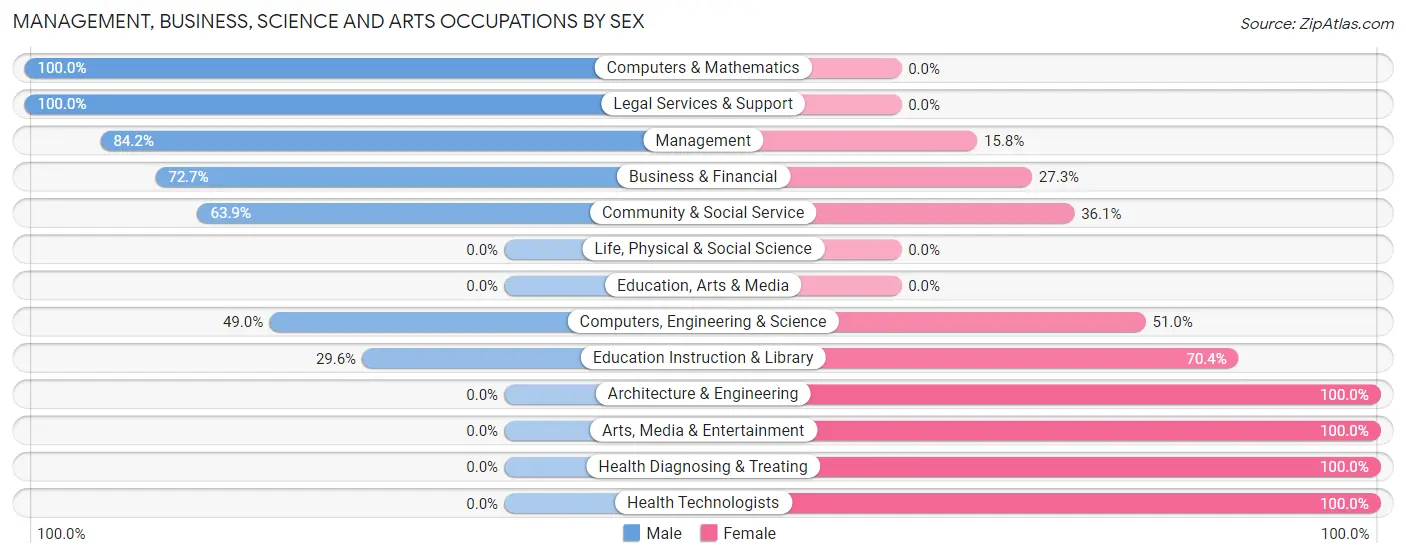
| Occupation | Male | Female |
| Management | 287 (84.2%) | 54 (15.8%) |
| Business & Financial | 120 (72.7%) | 45 (27.3%) |
| Computers, Engineering & Science | 50 (49.0%) | 52 (51.0%) |
| Computers & Mathematics | 50 (100.0%) | 0 (0.0%) |
| Architecture & Engineering | 0 (0.0%) | 52 (100.0%) |
| Life, Physical & Social Science | 0 (0.0%) | 0 (0.0%) |
| Community & Social Service | 200 (63.9%) | 113 (36.1%) |
| Education, Arts & Media | 0 (0.0%) | 0 (0.0%) |
| Legal Services & Support | 168 (100.0%) | 0 (0.0%) |
| Education Instruction & Library | 32 (29.6%) | 76 (70.4%) |
| Arts, Media & Entertainment | 0 (0.0%) | 37 (100.0%) |
| Health Diagnosing & Treating | 0 (0.0%) | 109 (100.0%) |
| Health Technologists | 0 (0.0%) | 91 (100.0%) |
| Total (Category) | 657 (63.8%) | 373 (36.2%) |
| Total (Overall) | 1,086 (61.7%) | 673 (38.3%) |
Services Occupations
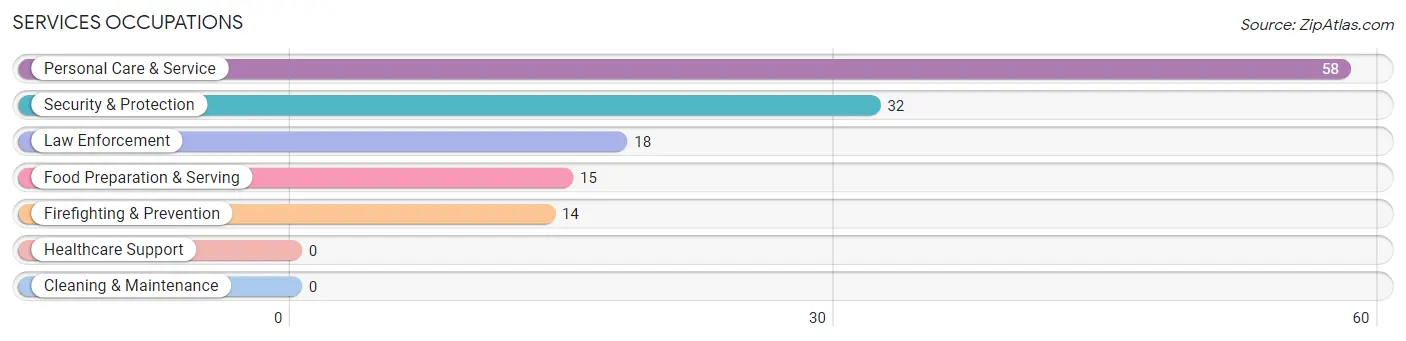
The most common Services occupations in The Pinehills are Personal Care & Service (58 | 3.3%), Security & Protection (32 | 1.8%), Law Enforcement (18 | 1.0%), Food Preparation & Serving (15 | 0.9%), and Firefighting & Prevention (14 | 0.8%).
Services Occupations by Sex
Within the Services occupations in The Pinehills, the most male-oriented occupations are Security & Protection (100.0%), Firefighting & Prevention (100.0%), and Law Enforcement (100.0%), while the most female-oriented occupations are Food Preparation & Serving (100.0%), and Personal Care & Service (100.0%).
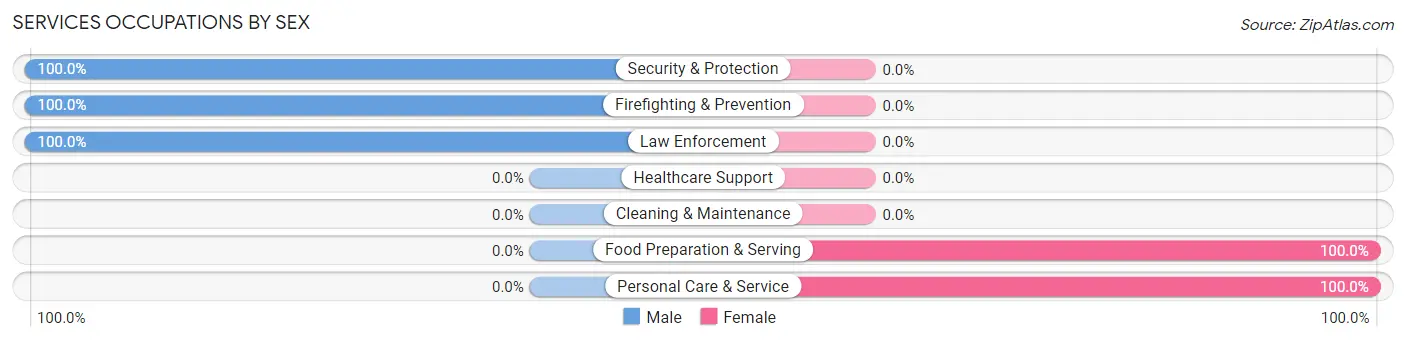
| Occupation | Male | Female |
| Healthcare Support | 0 (0.0%) | 0 (0.0%) |
| Security & Protection | 32 (100.0%) | 0 (0.0%) |
| Firefighting & Prevention | 14 (100.0%) | 0 (0.0%) |
| Law Enforcement | 18 (100.0%) | 0 (0.0%) |
| Food Preparation & Serving | 0 (0.0%) | 15 (100.0%) |
| Cleaning & Maintenance | 0 (0.0%) | 0 (0.0%) |
| Personal Care & Service | 0 (0.0%) | 58 (100.0%) |
| Total (Category) | 32 (30.5%) | 73 (69.5%) |
| Total (Overall) | 1,086 (61.7%) | 673 (38.3%) |
Sales and Office Occupations
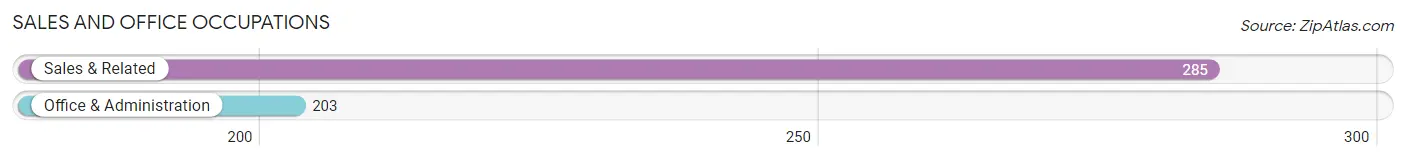
The most common Sales and Office occupations in The Pinehills are Sales & Related (285 | 16.2%), and Office & Administration (203 | 11.5%).
Sales and Office Occupations by Sex
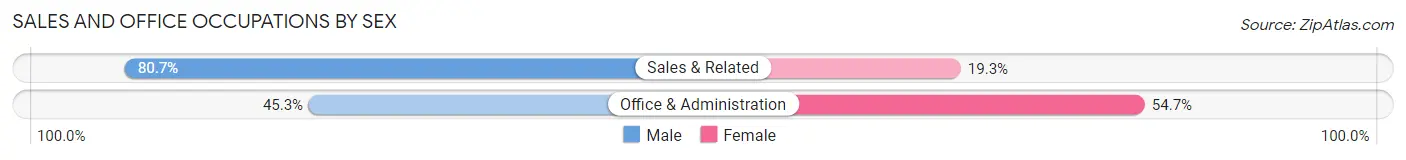
| Occupation | Male | Female |
| Sales & Related | 230 (80.7%) | 55 (19.3%) |
| Office & Administration | 92 (45.3%) | 111 (54.7%) |
| Total (Category) | 322 (66.0%) | 166 (34.0%) |
| Total (Overall) | 1,086 (61.7%) | 673 (38.3%) |
Natural Resources, Construction and Maintenance Occupations
The most common Natural Resources, Construction and Maintenance occupations in The Pinehills are Construction & Extraction (46 | 2.6%), and Installation, Maintenance & Repair (17 | 1.0%).
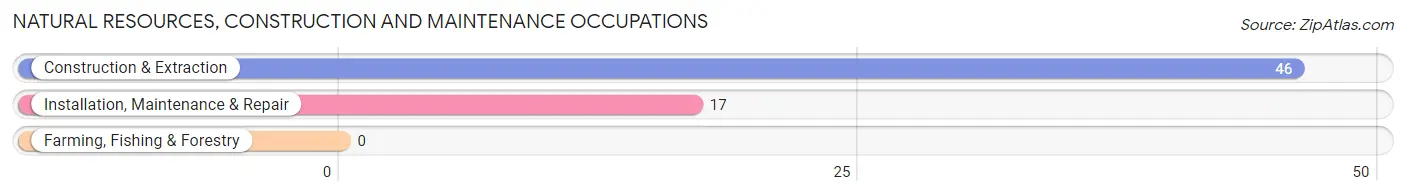
Natural Resources, Construction and Maintenance Occupations by Sex
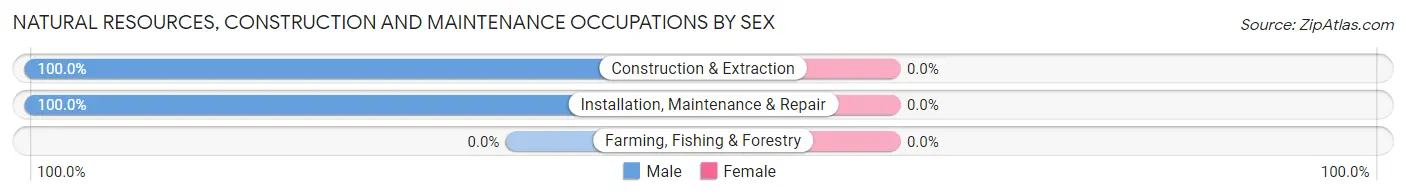
| Occupation | Male | Female |
| Farming, Fishing & Forestry | 0 (0.0%) | 0 (0.0%) |
| Construction & Extraction | 46 (100.0%) | 0 (0.0%) |
| Installation, Maintenance & Repair | 17 (100.0%) | 0 (0.0%) |
| Total (Category) | 63 (100.0%) | 0 (0.0%) |
| Total (Overall) | 1,086 (61.7%) | 673 (38.3%) |
Production, Transportation and Moving Occupations
The most common Production, Transportation and Moving occupations in The Pinehills are Material Moving (50 | 2.8%), and Transportation (23 | 1.3%).
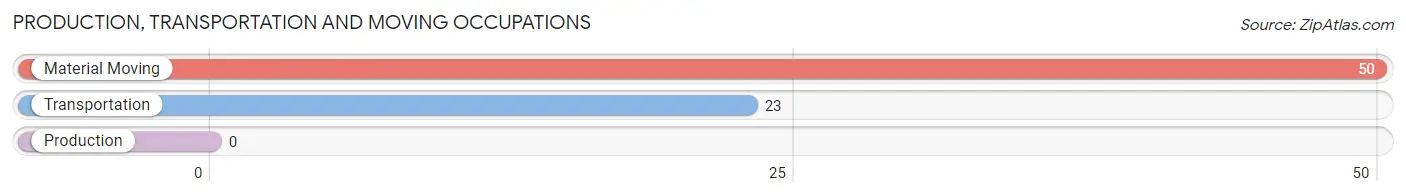
Production, Transportation and Moving Occupations by Sex
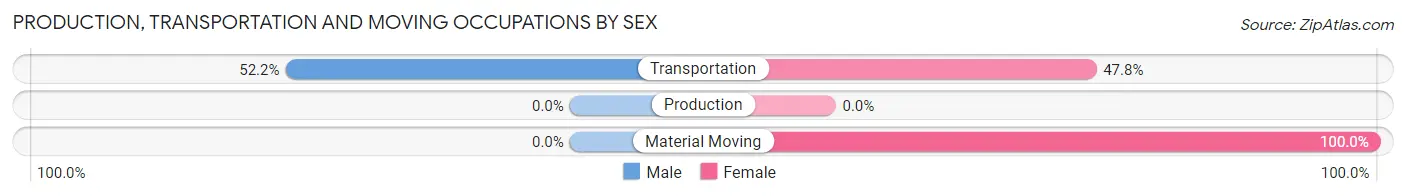
| Occupation | Male | Female |
| Production | 0 (0.0%) | 0 (0.0%) |
| Transportation | 12 (52.2%) | 11 (47.8%) |
| Material Moving | 0 (0.0%) | 50 (100.0%) |
| Total (Category) | 12 (16.4%) | 61 (83.6%) |
| Total (Overall) | 1,086 (61.7%) | 673 (38.3%) |
Employment Industries by Sex in The Pinehills
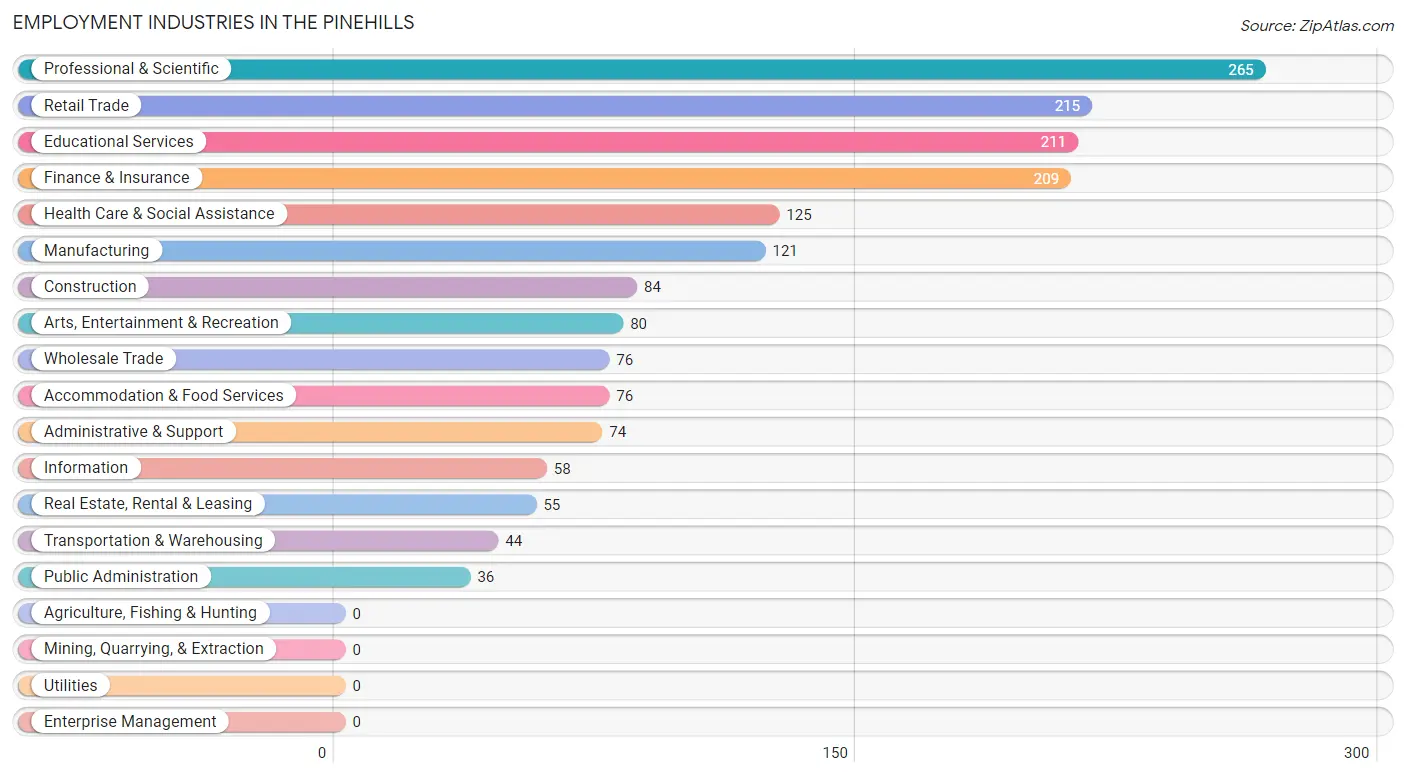
Employment Industries in The Pinehills
The major employment industries in The Pinehills include Professional & Scientific (265 | 15.1%), Retail Trade (215 | 12.2%), Educational Services (211 | 12.0%), Finance & Insurance (209 | 11.9%), and Health Care & Social Assistance (125 | 7.1%).
Employment Industries by Sex in The Pinehills
The The Pinehills industries that see more men than women are Construction (100.0%), Wholesale Trade (100.0%), and Information (100.0%), whereas the industries that tend to have a higher number of women are Health Care & Social Assistance (100.0%), Arts, Entertainment & Recreation (82.5%), and Real Estate, Rental & Leasing (76.4%).
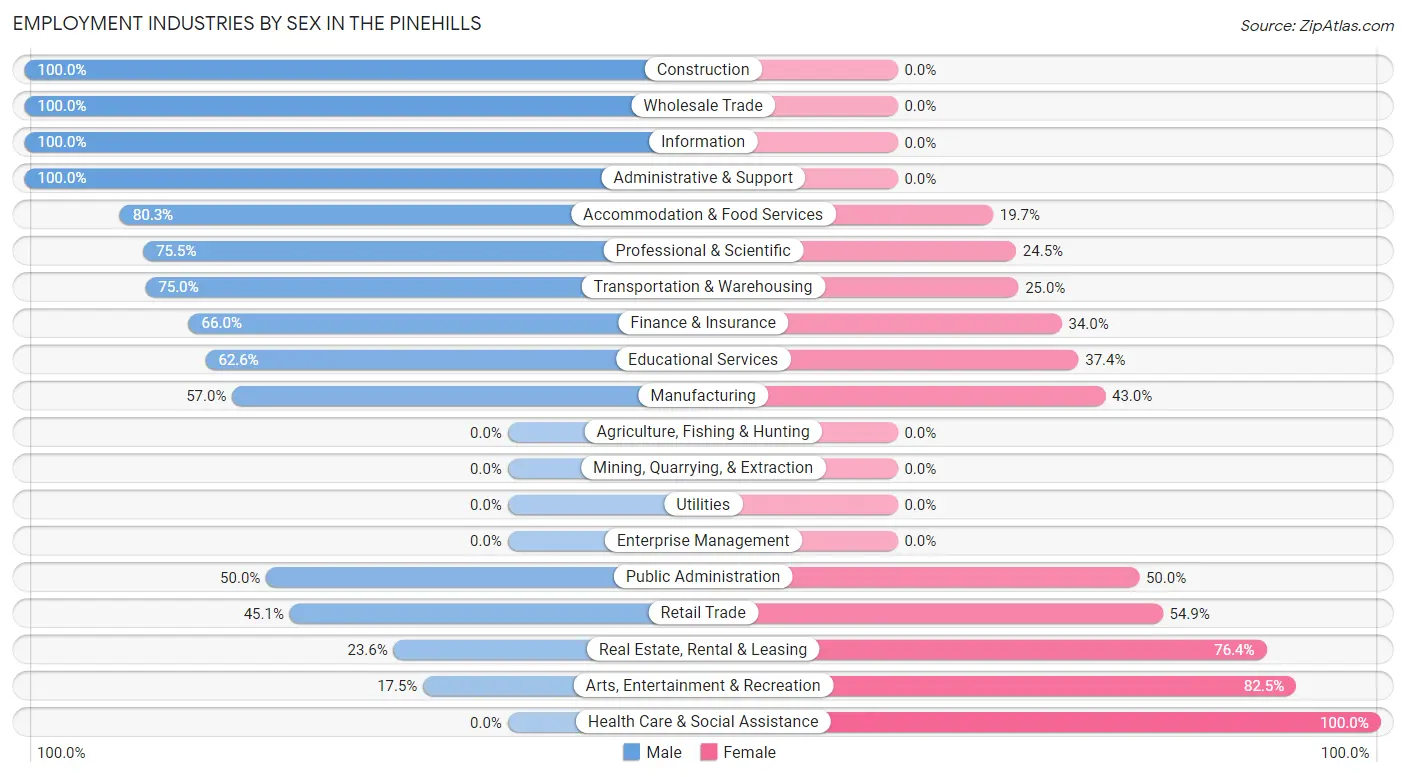
| Industry | Male | Female |
| Agriculture, Fishing & Hunting | 0 (0.0%) | 0 (0.0%) |
| Mining, Quarrying, & Extraction | 0 (0.0%) | 0 (0.0%) |
| Construction | 84 (100.0%) | 0 (0.0%) |
| Manufacturing | 69 (57.0%) | 52 (43.0%) |
| Wholesale Trade | 76 (100.0%) | 0 (0.0%) |
| Retail Trade | 97 (45.1%) | 118 (54.9%) |
| Transportation & Warehousing | 33 (75.0%) | 11 (25.0%) |
| Utilities | 0 (0.0%) | 0 (0.0%) |
| Information | 58 (100.0%) | 0 (0.0%) |
| Finance & Insurance | 138 (66.0%) | 71 (34.0%) |
| Real Estate, Rental & Leasing | 13 (23.6%) | 42 (76.4%) |
| Professional & Scientific | 200 (75.5%) | 65 (24.5%) |
| Enterprise Management | 0 (0.0%) | 0 (0.0%) |
| Administrative & Support | 74 (100.0%) | 0 (0.0%) |
| Educational Services | 132 (62.6%) | 79 (37.4%) |
| Health Care & Social Assistance | 0 (0.0%) | 125 (100.0%) |
| Arts, Entertainment & Recreation | 14 (17.5%) | 66 (82.5%) |
| Accommodation & Food Services | 61 (80.3%) | 15 (19.7%) |
| Public Administration | 18 (50.0%) | 18 (50.0%) |
| Total | 1,086 (61.7%) | 673 (38.3%) |
Education in The Pinehills
School Enrollment in The Pinehills
The most common levels of schooling among the 336 students in The Pinehills are high school (122 | 36.3%), elementary school (103 | 30.6%), and college / undergraduate (57 | 17.0%).
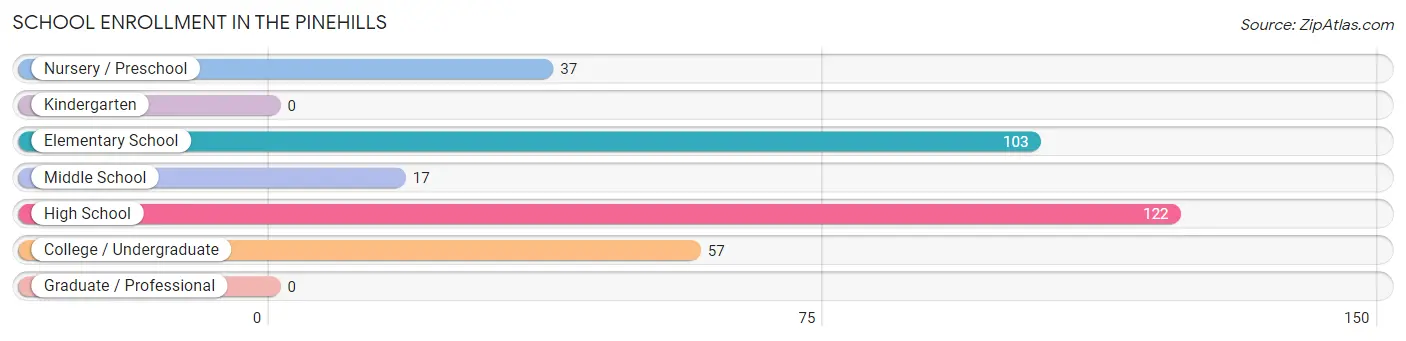
| School Level | # Students | % Students |
| Nursery / Preschool | 37 | 11.0% |
| Kindergarten | 0 | 0.0% |
| Elementary School | 103 | 30.6% |
| Middle School | 17 | 5.1% |
| High School | 122 | 36.3% |
| College / Undergraduate | 57 | 17.0% |
| Graduate / Professional | 0 | 0.0% |
| Total | 336 | 100.0% |
School Enrollment by Age by Funding Source in The Pinehills
Out of a total of 336 students who are enrolled in schools in The Pinehills, 108 (32.1%) attend a private institution, while the remaining 228 (67.9%) are enrolled in public schools. The age group of 20 to 24 year olds has the highest likelihood of being enrolled in private schools, with 14 (100.0% in the age bracket) enrolled. Conversely, the age group of 10 to 14 year olds has the lowest likelihood of being enrolled in a private school, with 17 (100.0% in the age bracket) attending a public institution.
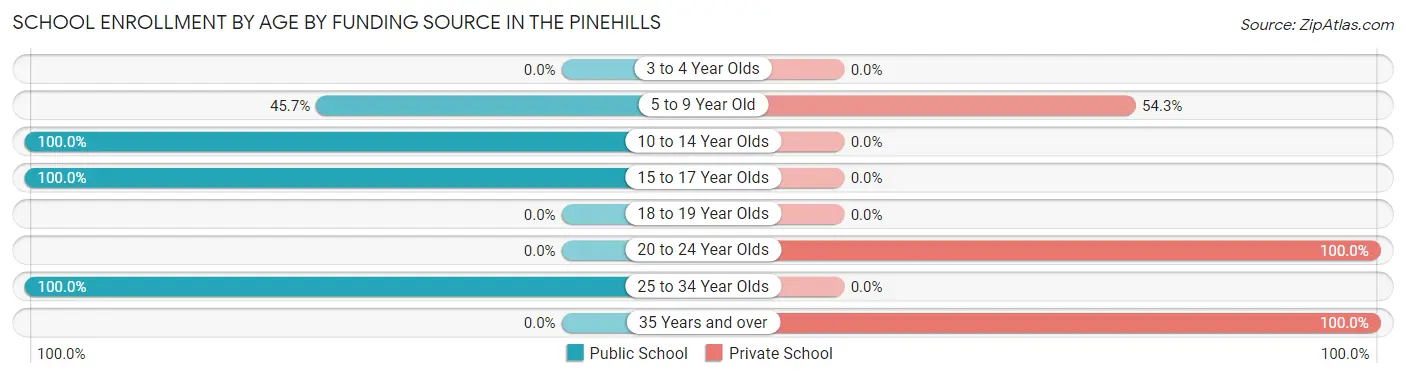
| Age Bracket | Public School | Private School |
| 3 to 4 Year Olds | 0 (0.0%) | 0 (0.0%) |
| 5 to 9 Year Old | 64 (45.7%) | 76 (54.3%) |
| 10 to 14 Year Olds | 17 (100.0%) | 0 (0.0%) |
| 15 to 17 Year Olds | 122 (100.0%) | 0 (0.0%) |
| 18 to 19 Year Olds | 0 (0.0%) | 0 (0.0%) |
| 20 to 24 Year Olds | 0 (0.0%) | 14 (100.0%) |
| 25 to 34 Year Olds | 25 (100.0%) | 0 (0.0%) |
| 35 Years and over | 0 (0.0%) | 18 (100.0%) |
| Total | 228 (67.9%) | 108 (32.1%) |
Educational Attainment by Field of Study in The Pinehills
Business (600 | 17.9%), education (455 | 13.6%), social sciences (364 | 10.8%), literature & languages (335 | 10.0%), and psychology (310 | 9.2%) are the most common fields of study among 3,359 individuals in The Pinehills who have obtained a bachelor's degree or higher.
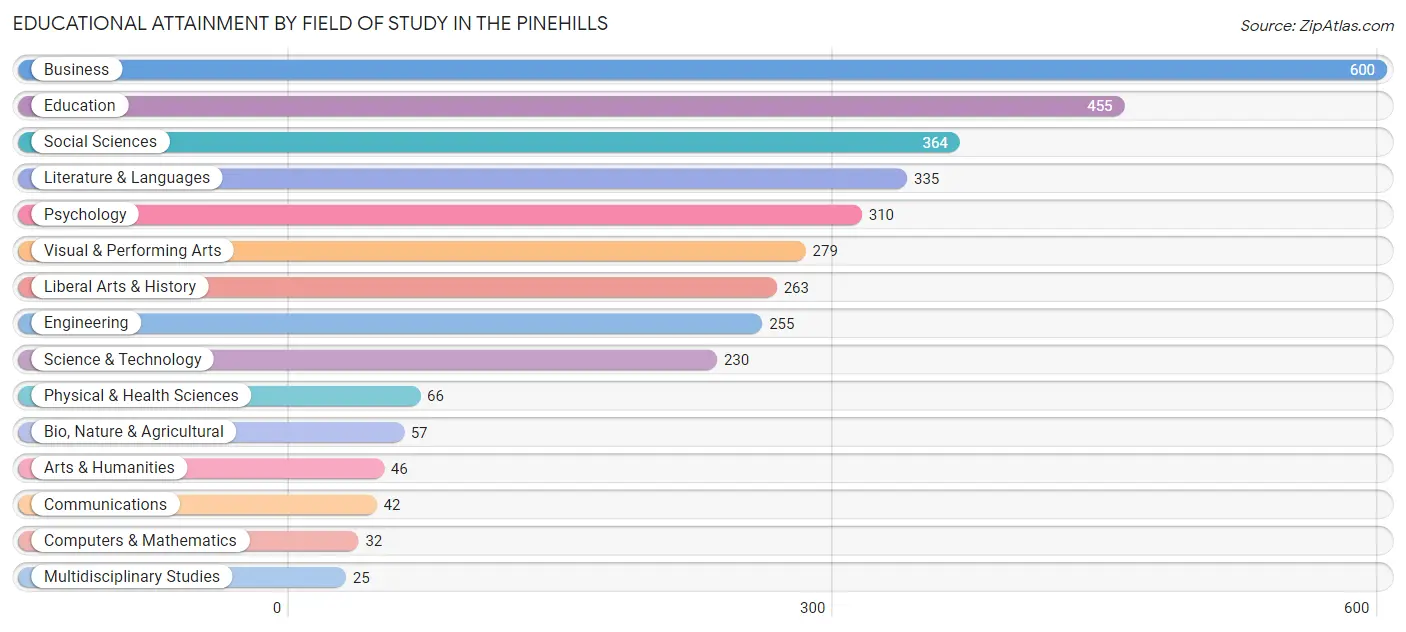
| Field of Study | # Graduates | % Graduates |
| Computers & Mathematics | 32 | 0.9% |
| Bio, Nature & Agricultural | 57 | 1.7% |
| Physical & Health Sciences | 66 | 2.0% |
| Psychology | 310 | 9.2% |
| Social Sciences | 364 | 10.8% |
| Engineering | 255 | 7.6% |
| Multidisciplinary Studies | 25 | 0.7% |
| Science & Technology | 230 | 6.9% |
| Business | 600 | 17.9% |
| Education | 455 | 13.6% |
| Literature & Languages | 335 | 10.0% |
| Liberal Arts & History | 263 | 7.8% |
| Visual & Performing Arts | 279 | 8.3% |
| Communications | 42 | 1.3% |
| Arts & Humanities | 46 | 1.4% |
| Total | 3,359 | 100.0% |
Transportation & Commute in The Pinehills
Vehicle Availability by Sex in The Pinehills
The most prevalent vehicle ownership categories in The Pinehills are males with 2 vehicles (749, accounting for 69.0%) and females with 2 vehicles (305, making up 111.3%).
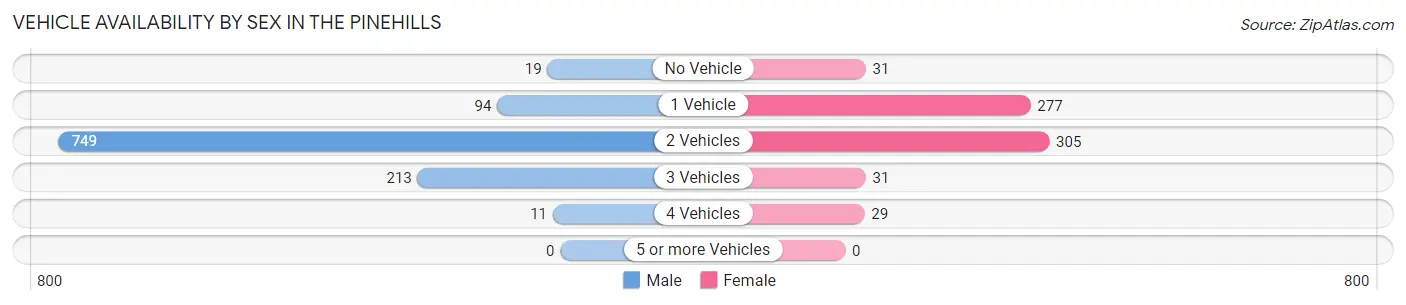
| Vehicles Available | Male | Female |
| No Vehicle | 19 (1.8%) | 31 (4.6%) |
| 1 Vehicle | 94 (8.7%) | 277 (41.2%) |
| 2 Vehicles | 749 (69.0%) | 305 (45.3%) |
| 3 Vehicles | 213 (19.6%) | 31 (4.6%) |
| 4 Vehicles | 11 (1.0%) | 29 (4.3%) |
| 5 or more Vehicles | 0 (0.0%) | 0 (0.0%) |
| Total | 1,086 (100.0%) | 673 (100.0%) |
Commute Time in The Pinehills
The most frequently occuring commute durations in The Pinehills are 60 to 89 minutes (262 commuters, 20.5%), 45 to 59 minutes (244 commuters, 19.1%), and 15 to 19 minutes (155 commuters, 12.1%).
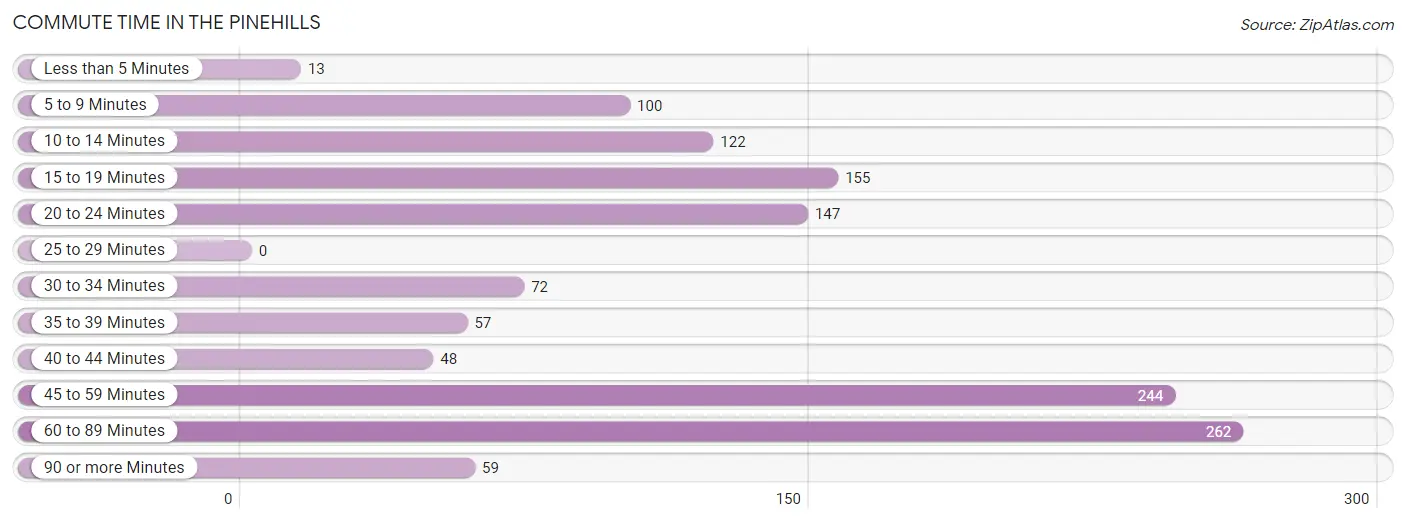
| Commute Time | # Commuters | % Commuters |
| Less than 5 Minutes | 13 | 1.0% |
| 5 to 9 Minutes | 100 | 7.8% |
| 10 to 14 Minutes | 122 | 9.5% |
| 15 to 19 Minutes | 155 | 12.1% |
| 20 to 24 Minutes | 147 | 11.5% |
| 25 to 29 Minutes | 0 | 0.0% |
| 30 to 34 Minutes | 72 | 5.6% |
| 35 to 39 Minutes | 57 | 4.5% |
| 40 to 44 Minutes | 48 | 3.7% |
| 45 to 59 Minutes | 244 | 19.1% |
| 60 to 89 Minutes | 262 | 20.5% |
| 90 or more Minutes | 59 | 4.6% |
Commute Time by Sex in The Pinehills
The most common commute times in The Pinehills are 45 to 59 minutes (226 commuters, 28.2%) for males and 20 to 24 minutes (120 commuters, 25.1%) for females.
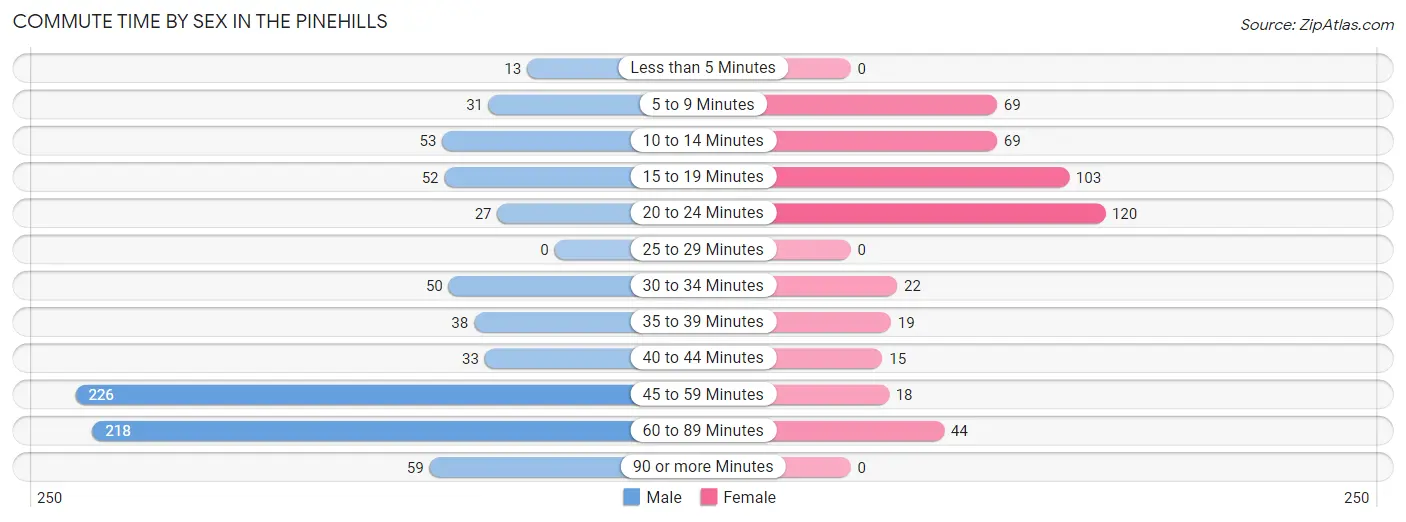
| Commute Time | Male | Female |
| Less than 5 Minutes | 13 (1.6%) | 0 (0.0%) |
| 5 to 9 Minutes | 31 (3.9%) | 69 (14.4%) |
| 10 to 14 Minutes | 53 (6.6%) | 69 (14.4%) |
| 15 to 19 Minutes | 52 (6.5%) | 103 (21.5%) |
| 20 to 24 Minutes | 27 (3.4%) | 120 (25.1%) |
| 25 to 29 Minutes | 0 (0.0%) | 0 (0.0%) |
| 30 to 34 Minutes | 50 (6.2%) | 22 (4.6%) |
| 35 to 39 Minutes | 38 (4.8%) | 19 (4.0%) |
| 40 to 44 Minutes | 33 (4.1%) | 15 (3.1%) |
| 45 to 59 Minutes | 226 (28.2%) | 18 (3.8%) |
| 60 to 89 Minutes | 218 (27.3%) | 44 (9.2%) |
| 90 or more Minutes | 59 (7.4%) | 0 (0.0%) |
Time of Departure to Work by Sex in The Pinehills
The most frequent times of departure to work in The Pinehills are 7:30 AM to 7:59 AM (255, 31.9%) for males and 8:00 AM to 8:29 AM (87, 18.2%) for females.
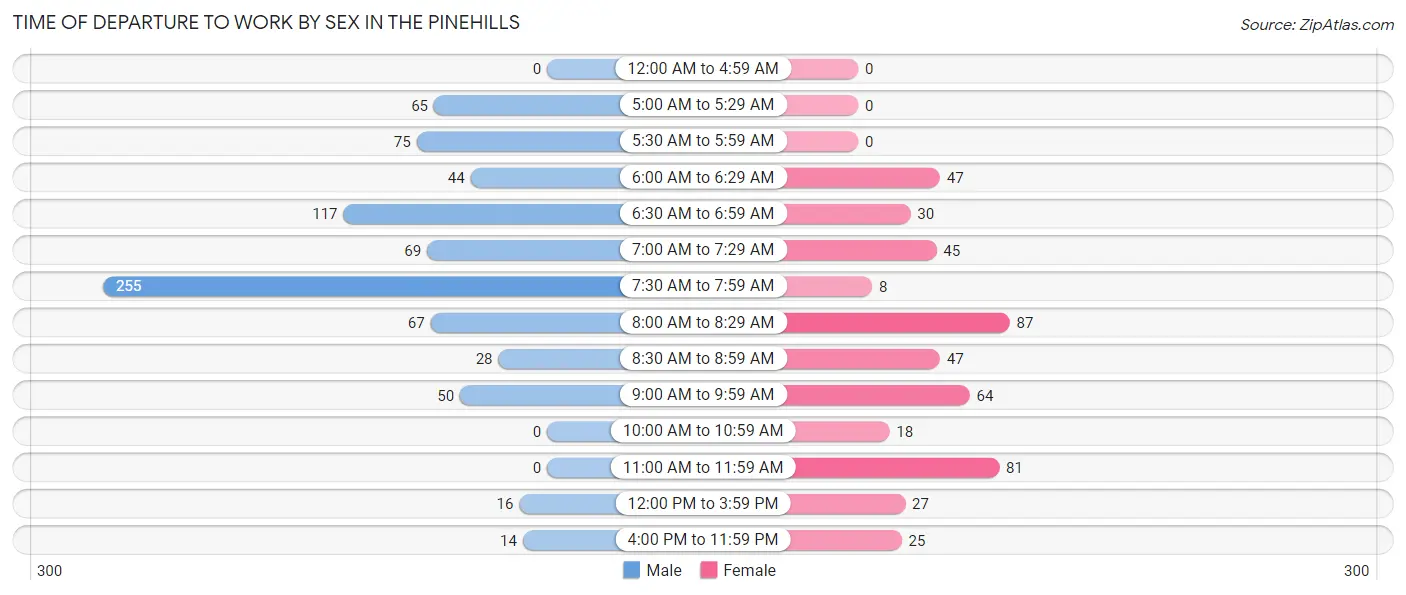
| Time of Departure | Male | Female |
| 12:00 AM to 4:59 AM | 0 (0.0%) | 0 (0.0%) |
| 5:00 AM to 5:29 AM | 65 (8.1%) | 0 (0.0%) |
| 5:30 AM to 5:59 AM | 75 (9.4%) | 0 (0.0%) |
| 6:00 AM to 6:29 AM | 44 (5.5%) | 47 (9.8%) |
| 6:30 AM to 6:59 AM | 117 (14.6%) | 30 (6.3%) |
| 7:00 AM to 7:29 AM | 69 (8.6%) | 45 (9.4%) |
| 7:30 AM to 7:59 AM | 255 (31.9%) | 8 (1.7%) |
| 8:00 AM to 8:29 AM | 67 (8.4%) | 87 (18.2%) |
| 8:30 AM to 8:59 AM | 28 (3.5%) | 47 (9.8%) |
| 9:00 AM to 9:59 AM | 50 (6.2%) | 64 (13.4%) |
| 10:00 AM to 10:59 AM | 0 (0.0%) | 18 (3.8%) |
| 11:00 AM to 11:59 AM | 0 (0.0%) | 81 (16.9%) |
| 12:00 PM to 3:59 PM | 16 (2.0%) | 27 (5.6%) |
| 4:00 PM to 11:59 PM | 14 (1.8%) | 25 (5.2%) |
| Total | 800 (100.0%) | 479 (100.0%) |
Housing Occupancy in The Pinehills
Occupancy by Ownership in The Pinehills
Of the total 2,681 dwellings in The Pinehills, owner-occupied units account for 2,314 (86.3%), while renter-occupied units make up 367 (13.7%).
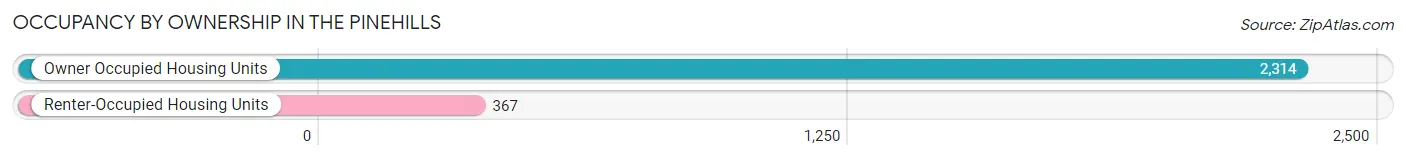
| Occupancy | # Housing Units | % Housing Units |
| Owner Occupied Housing Units | 2,314 | 86.3% |
| Renter-Occupied Housing Units | 367 | 13.7% |
| Total Occupied Housing Units | 2,681 | 100.0% |
Occupancy by Household Size in The Pinehills
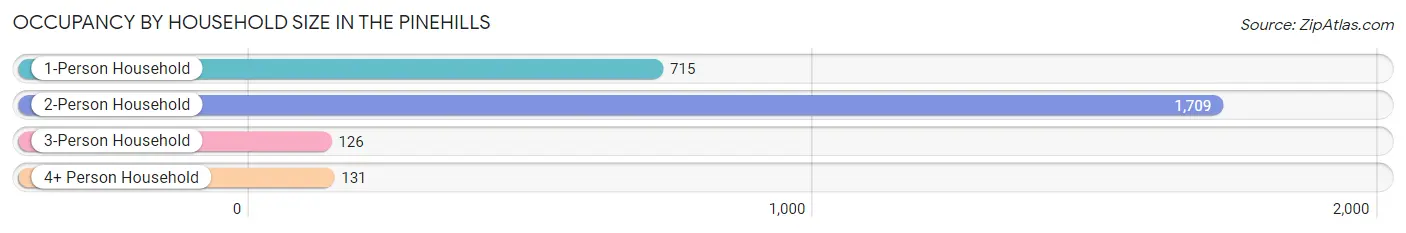
| Household Size | # Housing Units | % Housing Units |
| 1-Person Household | 715 | 26.7% |
| 2-Person Household | 1,709 | 63.7% |
| 3-Person Household | 126 | 4.7% |
| 4+ Person Household | 131 | 4.9% |
| Total Housing Units | 2,681 | 100.0% |
Occupancy by Ownership by Household Size in The Pinehills
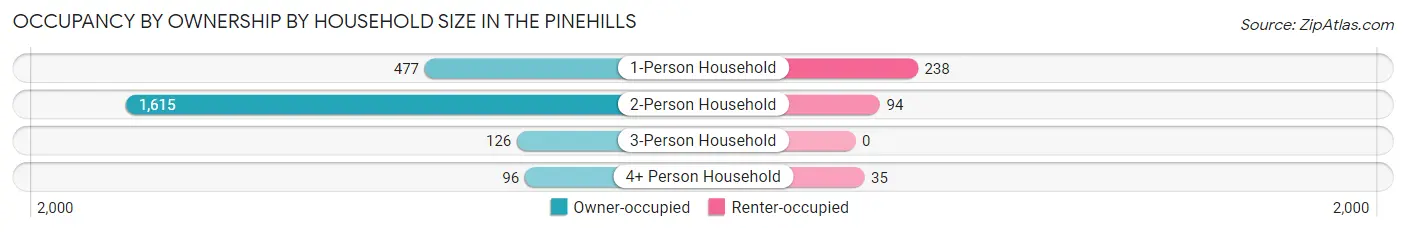
| Household Size | Owner-occupied | Renter-occupied |
| 1-Person Household | 477 (66.7%) | 238 (33.3%) |
| 2-Person Household | 1,615 (94.5%) | 94 (5.5%) |
| 3-Person Household | 126 (100.0%) | 0 (0.0%) |
| 4+ Person Household | 96 (73.3%) | 35 (26.7%) |
| Total Housing Units | 2,314 (86.3%) | 367 (13.7%) |
Occupancy by Educational Attainment in The Pinehills
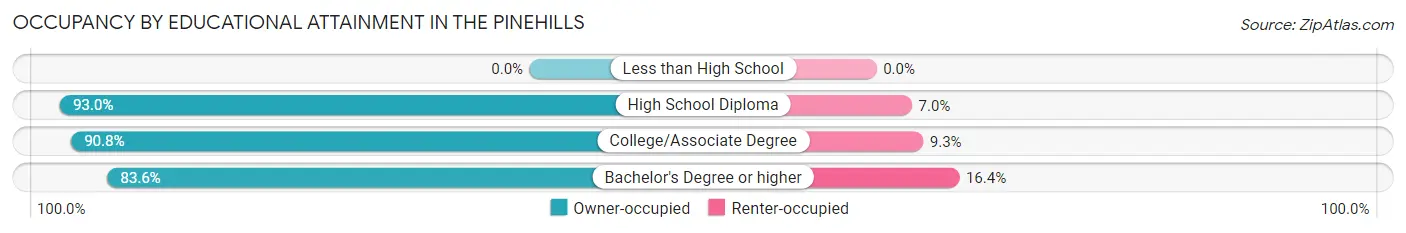
| Household Size | Owner-occupied | Renter-occupied |
| Less than High School | 0 (0.0%) | 0 (0.0%) |
| High School Diploma | 225 (93.0%) | 17 (7.0%) |
| College/Associate Degree | 638 (90.7%) | 65 (9.2%) |
| Bachelor's Degree or higher | 1,451 (83.6%) | 285 (16.4%) |
Occupancy by Age of Householder in The Pinehills
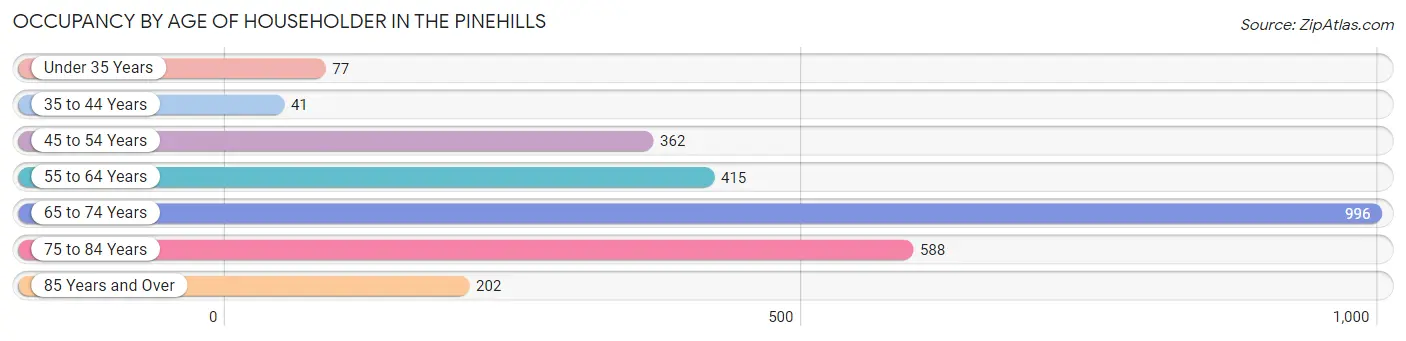
| Age Bracket | # Households | % Households |
| Under 35 Years | 77 | 2.9% |
| 35 to 44 Years | 41 | 1.5% |
| 45 to 54 Years | 362 | 13.5% |
| 55 to 64 Years | 415 | 15.5% |
| 65 to 74 Years | 996 | 37.1% |
| 75 to 84 Years | 588 | 21.9% |
| 85 Years and Over | 202 | 7.5% |
| Total | 2,681 | 100.0% |
Housing Finances in The Pinehills
Median Income by Occupancy in The Pinehills
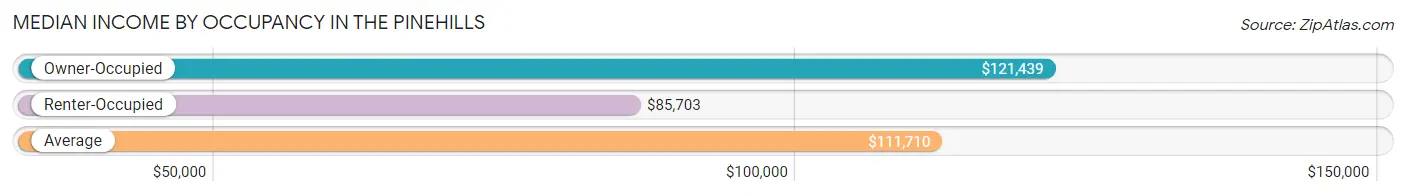
| Occupancy Type | # Households | Median Income |
| Owner-Occupied | 2,314 (86.3%) | $121,439 |
| Renter-Occupied | 367 (13.7%) | $85,703 |
| Average | 2,681 (100.0%) | $111,710 |
Occupancy by Householder Income Bracket in The Pinehills
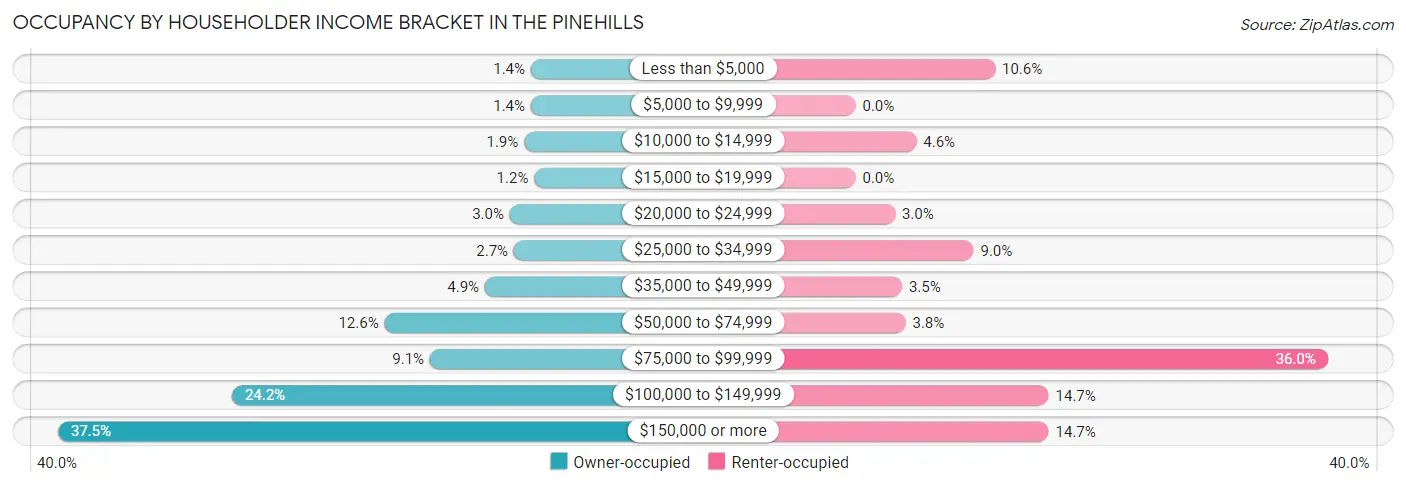
| Income Bracket | Owner-occupied | Renter-occupied |
| Less than $5,000 | 33 (1.4%) | 39 (10.6%) |
| $5,000 to $9,999 | 33 (1.4%) | 0 (0.0%) |
| $10,000 to $14,999 | 45 (1.9%) | 17 (4.6%) |
| $15,000 to $19,999 | 27 (1.2%) | 0 (0.0%) |
| $20,000 to $24,999 | 70 (3.0%) | 11 (3.0%) |
| $25,000 to $34,999 | 63 (2.7%) | 33 (9.0%) |
| $35,000 to $49,999 | 114 (4.9%) | 13 (3.5%) |
| $50,000 to $74,999 | 291 (12.6%) | 14 (3.8%) |
| $75,000 to $99,999 | 211 (9.1%) | 132 (36.0%) |
| $100,000 to $149,999 | 560 (24.2%) | 54 (14.7%) |
| $150,000 or more | 867 (37.5%) | 54 (14.7%) |
| Total | 2,314 (100.0%) | 367 (100.0%) |
Monthly Housing Cost Tiers in The Pinehills
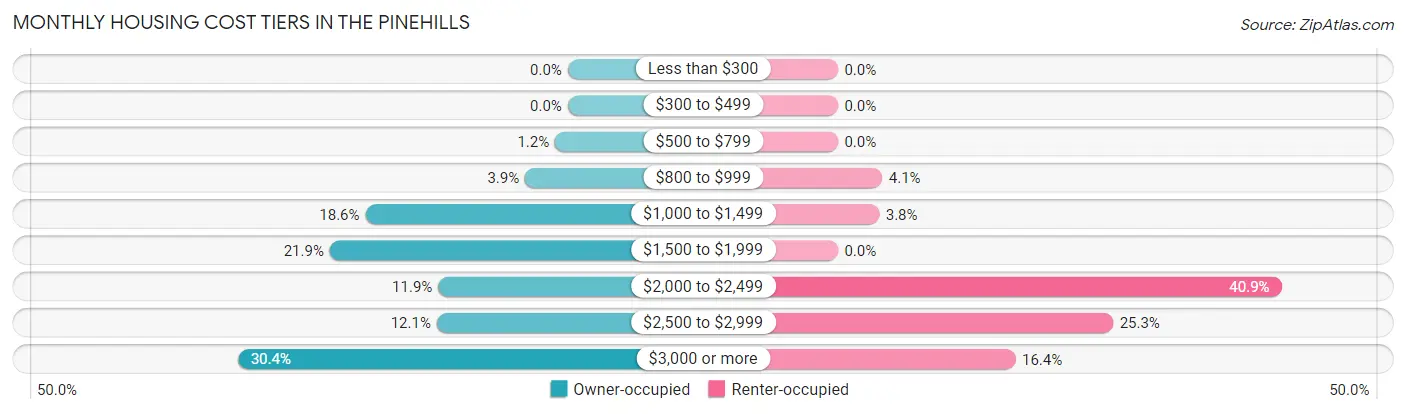
| Monthly Cost | Owner-occupied | Renter-occupied |
| Less than $300 | 0 (0.0%) | 0 (0.0%) |
| $300 to $499 | 0 (0.0%) | 0 (0.0%) |
| $500 to $799 | 27 (1.2%) | 0 (0.0%) |
| $800 to $999 | 91 (3.9%) | 15 (4.1%) |
| $1,000 to $1,499 | 431 (18.6%) | 14 (3.8%) |
| $1,500 to $1,999 | 507 (21.9%) | 0 (0.0%) |
| $2,000 to $2,499 | 276 (11.9%) | 150 (40.9%) |
| $2,500 to $2,999 | 279 (12.1%) | 93 (25.3%) |
| $3,000 or more | 703 (30.4%) | 60 (16.4%) |
| Total | 2,314 (100.0%) | 367 (100.0%) |
Physical Housing Characteristics in The Pinehills
Housing Structures in The Pinehills
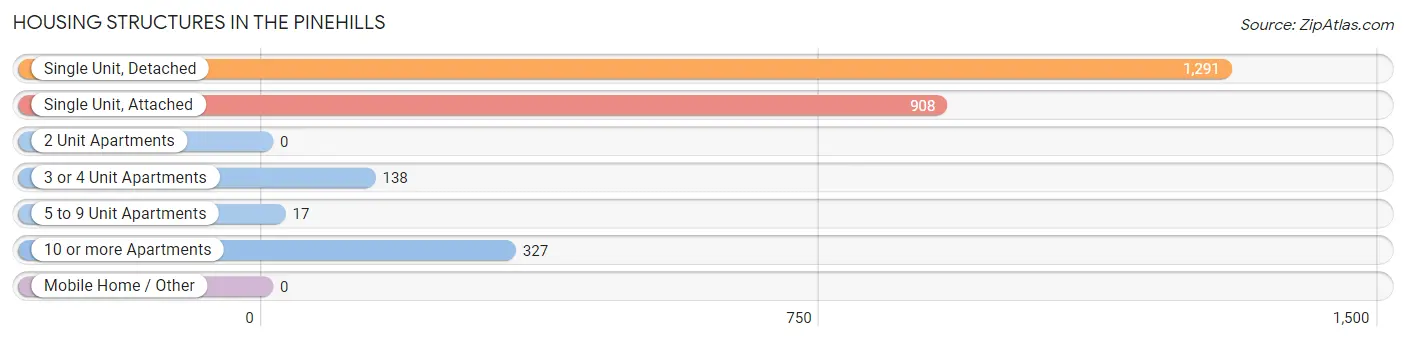
| Structure Type | # Housing Units | % Housing Units |
| Single Unit, Detached | 1,291 | 48.1% |
| Single Unit, Attached | 908 | 33.9% |
| 2 Unit Apartments | 0 | 0.0% |
| 3 or 4 Unit Apartments | 138 | 5.1% |
| 5 to 9 Unit Apartments | 17 | 0.6% |
| 10 or more Apartments | 327 | 12.2% |
| Mobile Home / Other | 0 | 0.0% |
| Total | 2,681 | 100.0% |
Housing Structures by Occupancy in The Pinehills
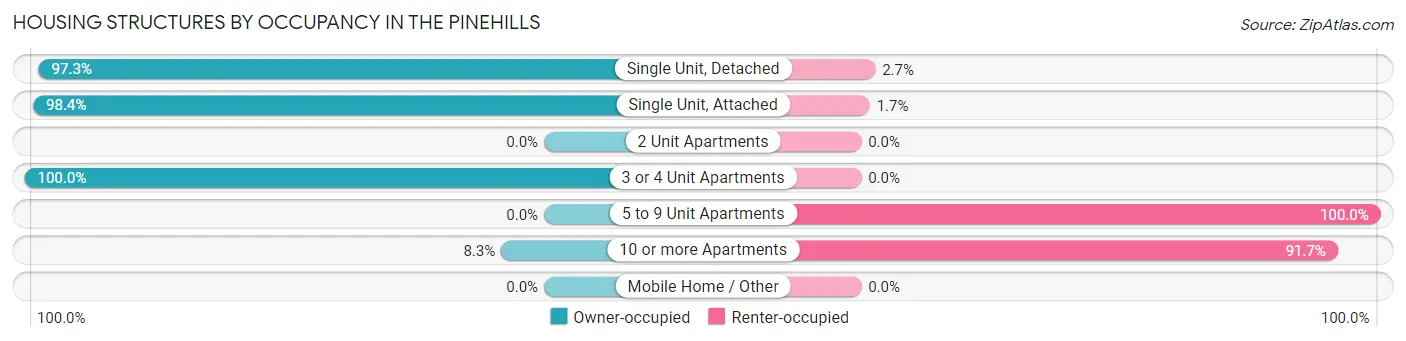
| Structure Type | Owner-occupied | Renter-occupied |
| Single Unit, Detached | 1,256 (97.3%) | 35 (2.7%) |
| Single Unit, Attached | 893 (98.4%) | 15 (1.7%) |
| 2 Unit Apartments | 0 (0.0%) | 0 (0.0%) |
| 3 or 4 Unit Apartments | 138 (100.0%) | 0 (0.0%) |
| 5 to 9 Unit Apartments | 0 (0.0%) | 17 (100.0%) |
| 10 or more Apartments | 27 (8.3%) | 300 (91.7%) |
| Mobile Home / Other | 0 (0.0%) | 0 (0.0%) |
| Total | 2,314 (86.3%) | 367 (13.7%) |
Housing Structures by Number of Rooms in The Pinehills
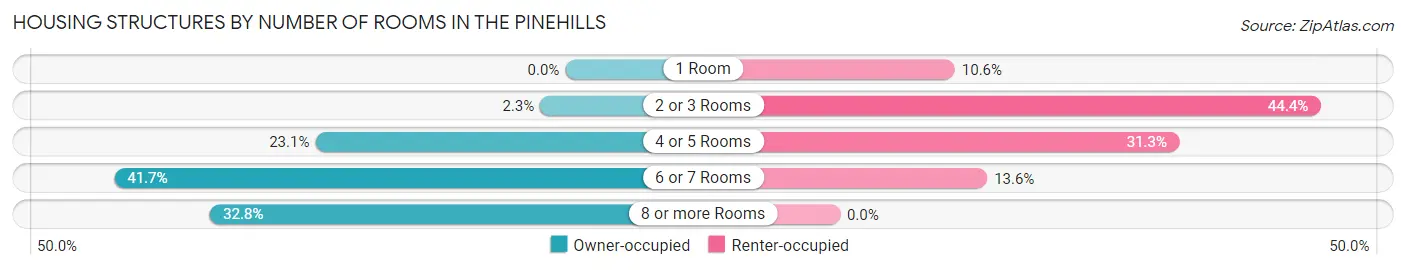
| Number of Rooms | Owner-occupied | Renter-occupied |
| 1 Room | 0 (0.0%) | 39 (10.6%) |
| 2 or 3 Rooms | 54 (2.3%) | 163 (44.4%) |
| 4 or 5 Rooms | 535 (23.1%) | 115 (31.3%) |
| 6 or 7 Rooms | 965 (41.7%) | 50 (13.6%) |
| 8 or more Rooms | 760 (32.8%) | 0 (0.0%) |
| Total | 2,314 (100.0%) | 367 (100.0%) |
Housing Structure by Heating Type in The Pinehills
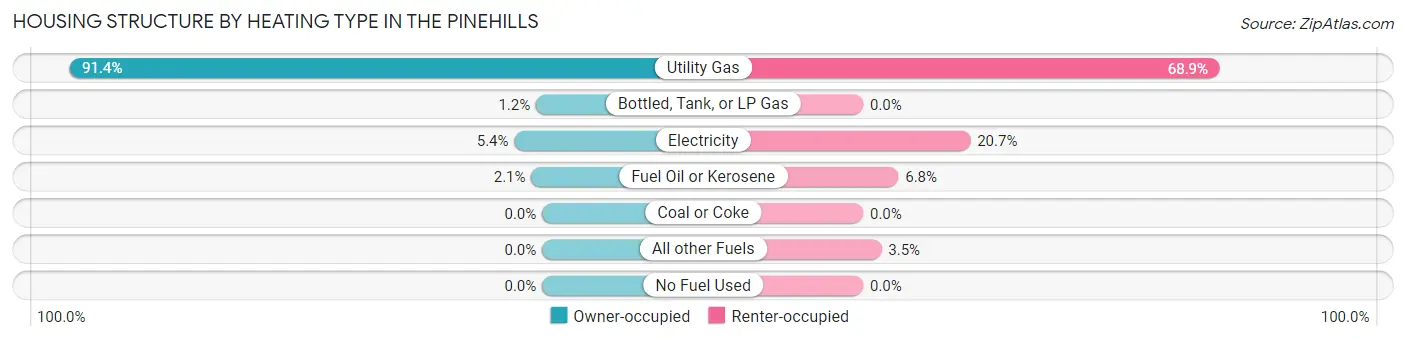
| Heating Type | Owner-occupied | Renter-occupied |
| Utility Gas | 2,115 (91.4%) | 253 (68.9%) |
| Bottled, Tank, or LP Gas | 27 (1.2%) | 0 (0.0%) |
| Electricity | 124 (5.4%) | 76 (20.7%) |
| Fuel Oil or Kerosene | 48 (2.1%) | 25 (6.8%) |
| Coal or Coke | 0 (0.0%) | 0 (0.0%) |
| All other Fuels | 0 (0.0%) | 13 (3.5%) |
| No Fuel Used | 0 (0.0%) | 0 (0.0%) |
| Total | 2,314 (100.0%) | 367 (100.0%) |
Household Vehicle Usage in The Pinehills
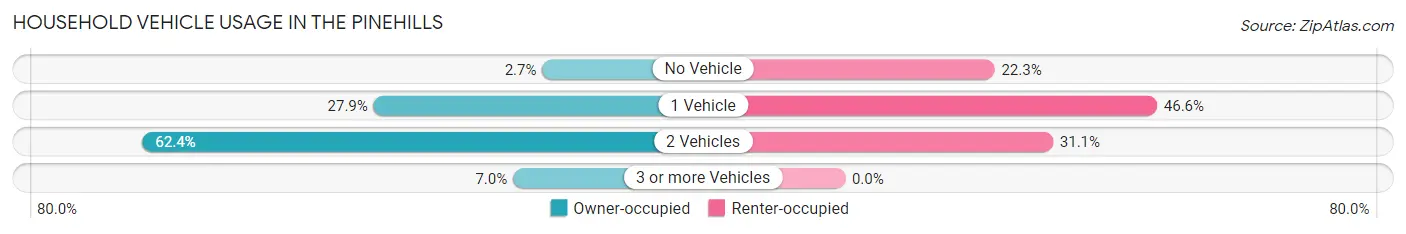
| Vehicles per Household | Owner-occupied | Renter-occupied |
| No Vehicle | 62 (2.7%) | 82 (22.3%) |
| 1 Vehicle | 645 (27.9%) | 171 (46.6%) |
| 2 Vehicles | 1,444 (62.4%) | 114 (31.1%) |
| 3 or more Vehicles | 163 (7.0%) | 0 (0.0%) |
| Total | 2,314 (100.0%) | 367 (100.0%) |
Real Estate & Mortgages in The Pinehills
Real Estate and Mortgage Overview in The Pinehills
| Characteristic | Without Mortgage | With Mortgage |
| Housing Units | 1,107 | 1,207 |
| Median Property Value | $627,200 | $665,900 |
| Median Household Income | $92,882 | $623 |
| Monthly Housing Costs | $1,501 | $703 |
| Real Estate Taxes | $9,026 | $13 |
Property Value by Mortgage Status in The Pinehills
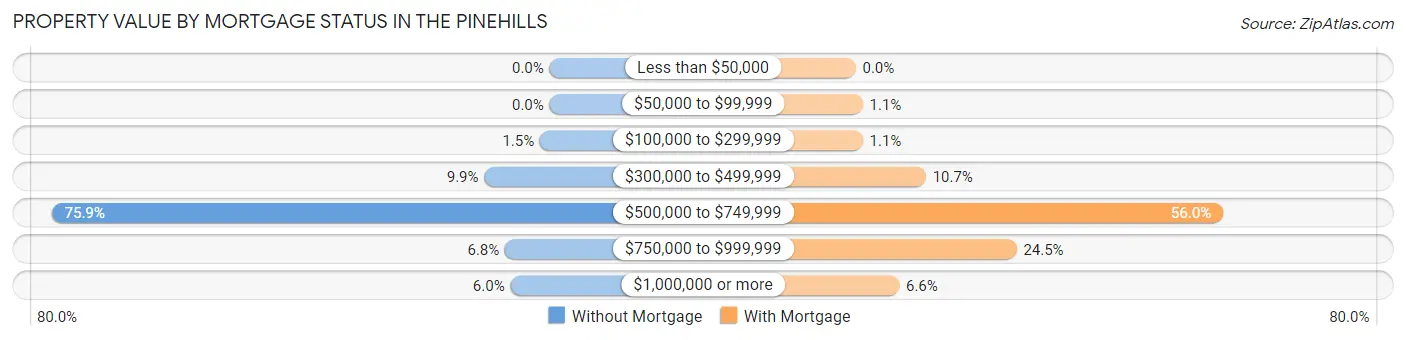
| Property Value | Without Mortgage | With Mortgage |
| Less than $50,000 | 0 (0.0%) | 0 (0.0%) |
| $50,000 to $99,999 | 0 (0.0%) | 13 (1.1%) |
| $100,000 to $299,999 | 16 (1.5%) | 13 (1.1%) |
| $300,000 to $499,999 | 110 (9.9%) | 129 (10.7%) |
| $500,000 to $749,999 | 840 (75.9%) | 676 (56.0%) |
| $750,000 to $999,999 | 75 (6.8%) | 296 (24.5%) |
| $1,000,000 or more | 66 (6.0%) | 80 (6.6%) |
| Total | 1,107 (100.0%) | 1,207 (100.0%) |
Household Income by Mortgage Status in The Pinehills
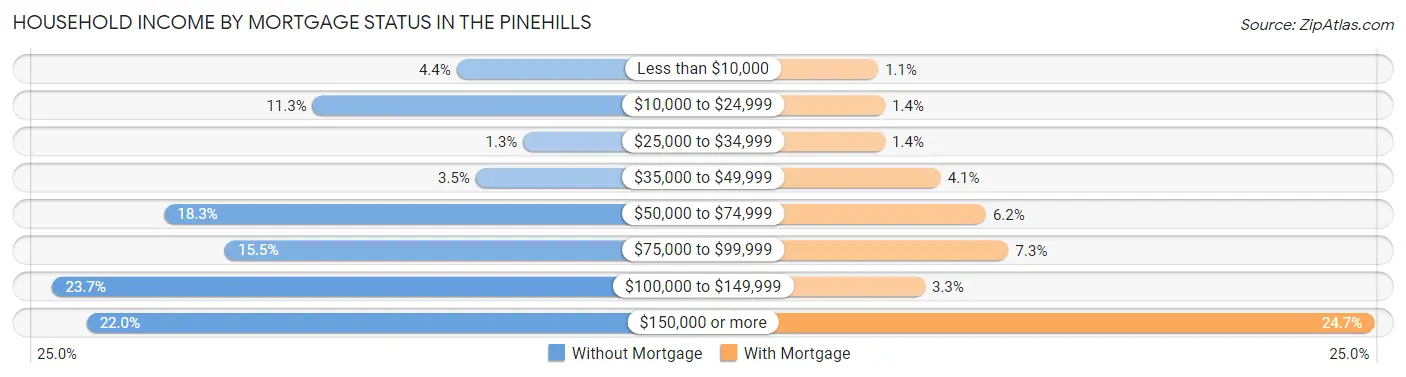
| Household Income | Without Mortgage | With Mortgage |
| Less than $10,000 | 49 (4.4%) | 13 (1.1%) |
| $10,000 to $24,999 | 125 (11.3%) | 17 (1.4%) |
| $25,000 to $34,999 | 14 (1.3%) | 17 (1.4%) |
| $35,000 to $49,999 | 39 (3.5%) | 49 (4.1%) |
| $50,000 to $74,999 | 203 (18.3%) | 75 (6.2%) |
| $75,000 to $99,999 | 171 (15.4%) | 88 (7.3%) |
| $100,000 to $149,999 | 262 (23.7%) | 40 (3.3%) |
| $150,000 or more | 244 (22.0%) | 298 (24.7%) |
| Total | 1,107 (100.0%) | 1,207 (100.0%) |
Property Value to Household Income Ratio in The Pinehills
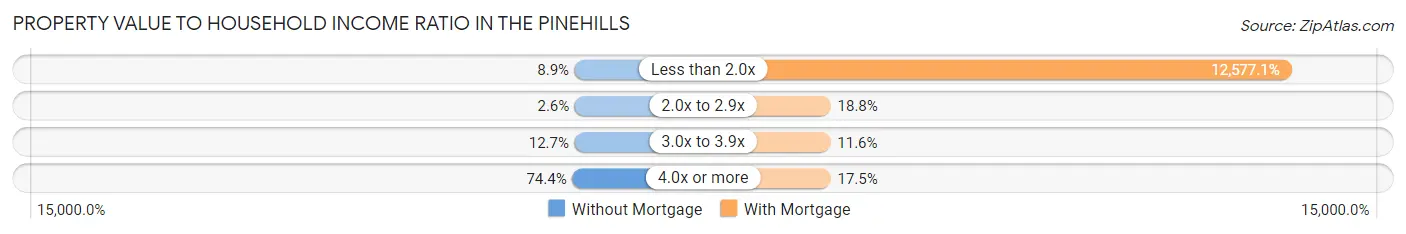
| Value-to-Income Ratio | Without Mortgage | With Mortgage |
| Less than 2.0x | 99 (8.9%) | 151,806 (12,577.1%) |
| 2.0x to 2.9x | 29 (2.6%) | 227 (18.8%) |
| 3.0x to 3.9x | 140 (12.7%) | 140 (11.6%) |
| 4.0x or more | 824 (74.4%) | 211 (17.5%) |
| Total | 1,107 (100.0%) | 1,207 (100.0%) |
Real Estate Taxes by Mortgage Status in The Pinehills
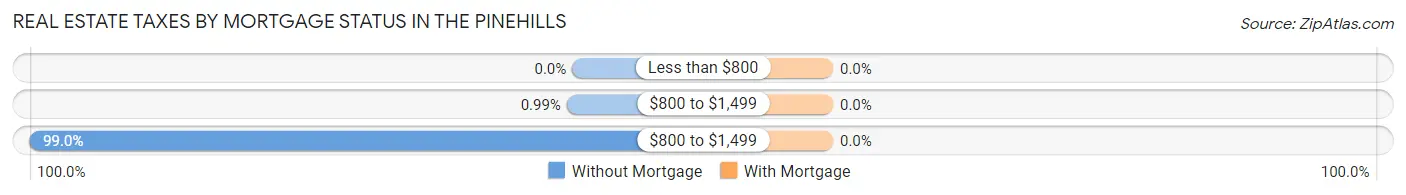
| Property Taxes | Without Mortgage | With Mortgage |
| Less than $800 | 0 (0.0%) | 0 (0.0%) |
| $800 to $1,499 | 11 (1.0%) | 0 (0.0%) |
| $800 to $1,499 | 1,096 (99.0%) | 0 (0.0%) |
| Total | 1,107 (100.0%) | 1,207 (100.0%) |
Health & Disability in The Pinehills
Health Insurance Coverage by Age in The Pinehills
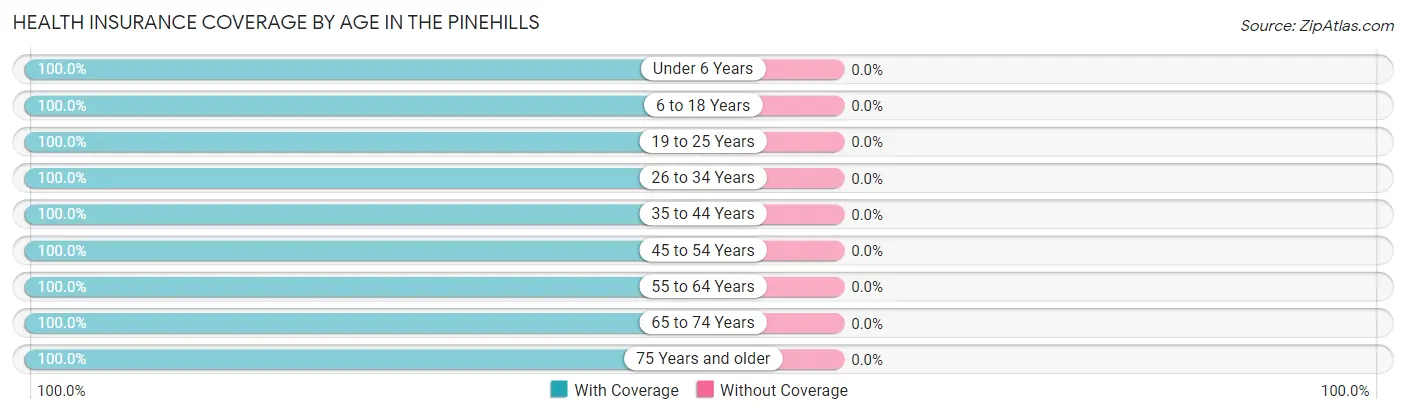
| Age Bracket | With Coverage | Without Coverage |
| Under 6 Years | 108 (100.0%) | 0 (0.0%) |
| 6 to 18 Years | 222 (100.0%) | 0 (0.0%) |
| 19 to 25 Years | 32 (100.0%) | 0 (0.0%) |
| 26 to 34 Years | 201 (100.0%) | 0 (0.0%) |
| 35 to 44 Years | 132 (100.0%) | 0 (0.0%) |
| 45 to 54 Years | 529 (100.0%) | 0 (0.0%) |
| 55 to 64 Years | 732 (100.0%) | 0 (0.0%) |
| 65 to 74 Years | 1,806 (100.0%) | 0 (0.0%) |
| 75 Years and older | 1,365 (100.0%) | 0 (0.0%) |
| Total | 5,127 (100.0%) | 0 (0.0%) |
Health Insurance Coverage by Citizenship Status in The Pinehills
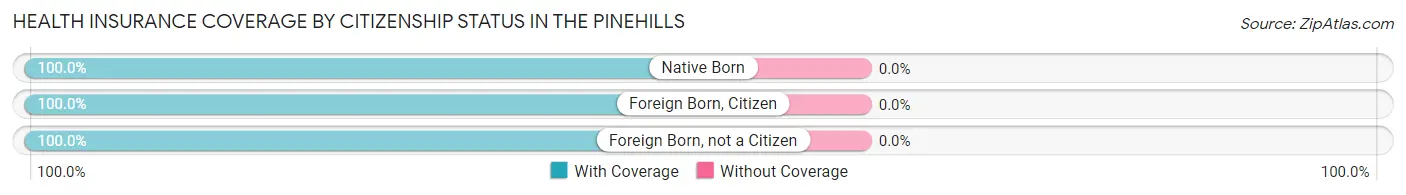
| Citizenship Status | With Coverage | Without Coverage |
| Native Born | 108 (100.0%) | 0 (0.0%) |
| Foreign Born, Citizen | 222 (100.0%) | 0 (0.0%) |
| Foreign Born, not a Citizen | 32 (100.0%) | 0 (0.0%) |
Health Insurance Coverage by Household Income in The Pinehills
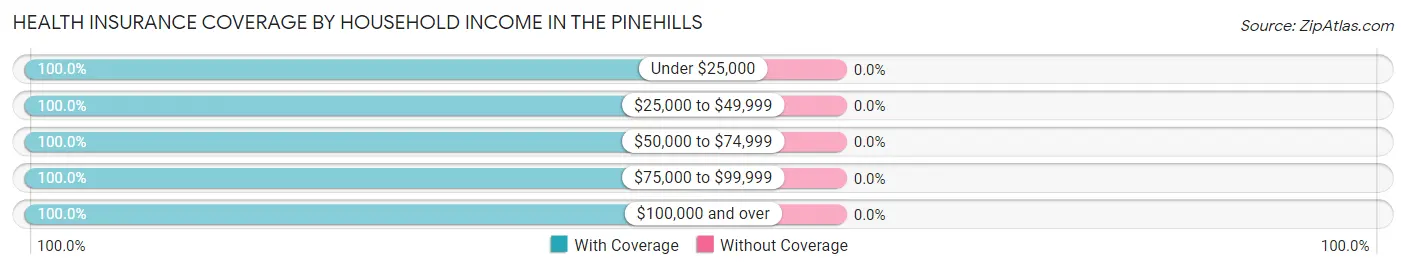
| Household Income | With Coverage | Without Coverage |
| Under $25,000 | 377 (100.0%) | 0 (0.0%) |
| $25,000 to $49,999 | 295 (100.0%) | 0 (0.0%) |
| $50,000 to $74,999 | 458 (100.0%) | 0 (0.0%) |
| $75,000 to $99,999 | 573 (100.0%) | 0 (0.0%) |
| $100,000 and over | 3,424 (100.0%) | 0 (0.0%) |
Public vs Private Health Insurance Coverage by Age in The Pinehills
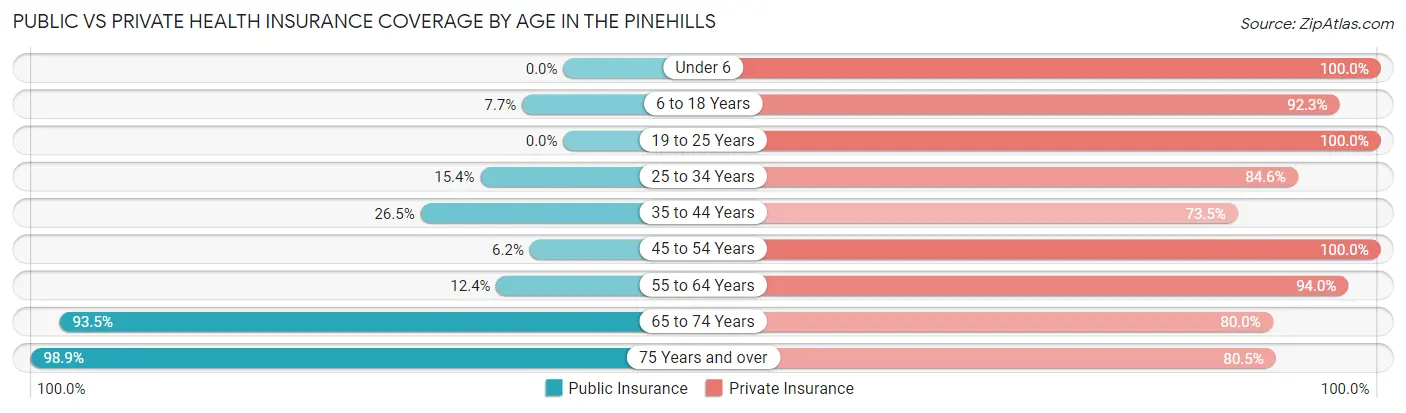
| Age Bracket | Public Insurance | Private Insurance |
| Under 6 | 0 (0.0%) | 108 (100.0%) |
| 6 to 18 Years | 17 (7.7%) | 205 (92.3%) |
| 19 to 25 Years | 0 (0.0%) | 32 (100.0%) |
| 25 to 34 Years | 31 (15.4%) | 170 (84.6%) |
| 35 to 44 Years | 35 (26.5%) | 97 (73.5%) |
| 45 to 54 Years | 33 (6.2%) | 529 (100.0%) |
| 55 to 64 Years | 91 (12.4%) | 688 (94.0%) |
| 65 to 74 Years | 1,689 (93.5%) | 1,444 (80.0%) |
| 75 Years and over | 1,350 (98.9%) | 1,099 (80.5%) |
| Total | 3,246 (63.3%) | 4,372 (85.3%) |
Disability Status by Sex by Age in The Pinehills
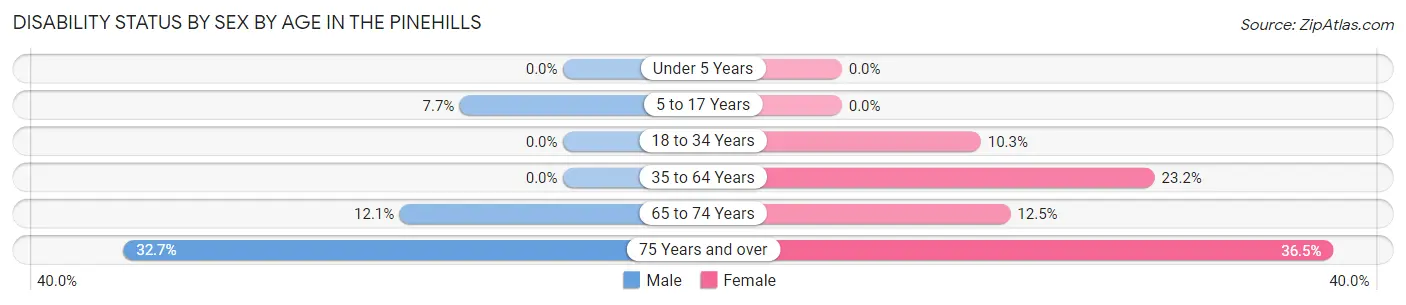
| Age Bracket | Male | Female |
| Under 5 Years | 0 (0.0%) | 0 (0.0%) |
| 5 to 17 Years | 17 (7.7%) | 0 (0.0%) |
| 18 to 34 Years | 0 (0.0%) | 13 (10.3%) |
| 35 to 64 Years | 0 (0.0%) | 174 (23.2%) |
| 65 to 74 Years | 96 (12.1%) | 127 (12.5%) |
| 75 Years and over | 180 (32.7%) | 297 (36.5%) |
Disability Class by Sex by Age in The Pinehills
Disability Class: Hearing Difficulty
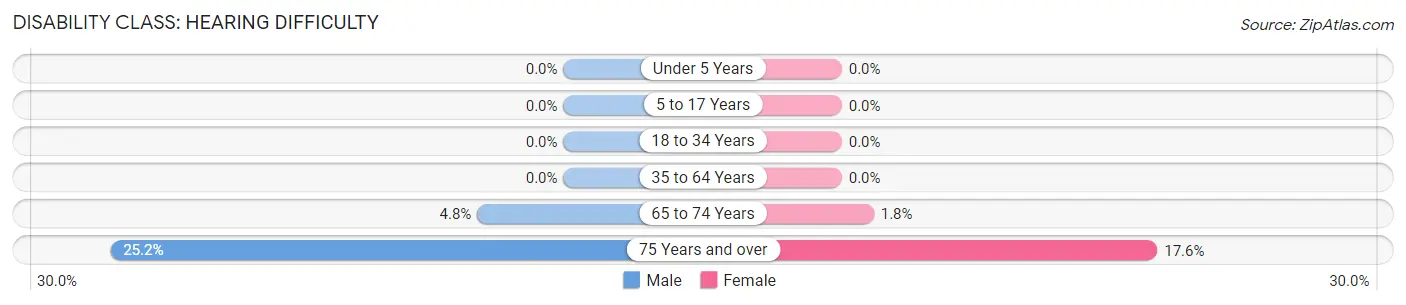
| Age Bracket | Male | Female |
| Under 5 Years | 0 (0.0%) | 0 (0.0%) |
| 5 to 17 Years | 0 (0.0%) | 0 (0.0%) |
| 18 to 34 Years | 0 (0.0%) | 0 (0.0%) |
| 35 to 64 Years | 0 (0.0%) | 0 (0.0%) |
| 65 to 74 Years | 38 (4.8%) | 18 (1.8%) |
| 75 Years and over | 139 (25.2%) | 143 (17.6%) |
Disability Class: Vision Difficulty
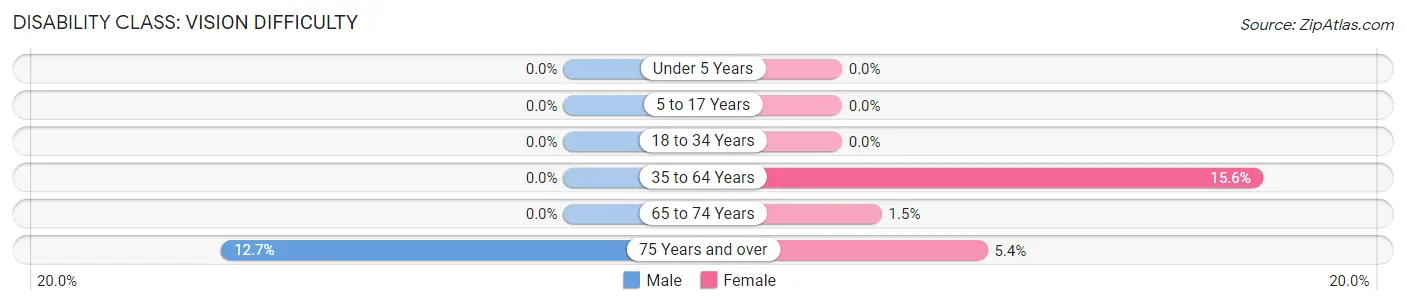
| Age Bracket | Male | Female |
| Under 5 Years | 0 (0.0%) | 0 (0.0%) |
| 5 to 17 Years | 0 (0.0%) | 0 (0.0%) |
| 18 to 34 Years | 0 (0.0%) | 0 (0.0%) |
| 35 to 64 Years | 0 (0.0%) | 117 (15.6%) |
| 65 to 74 Years | 0 (0.0%) | 15 (1.5%) |
| 75 Years and over | 70 (12.7%) | 44 (5.4%) |
Disability Class: Cognitive Difficulty
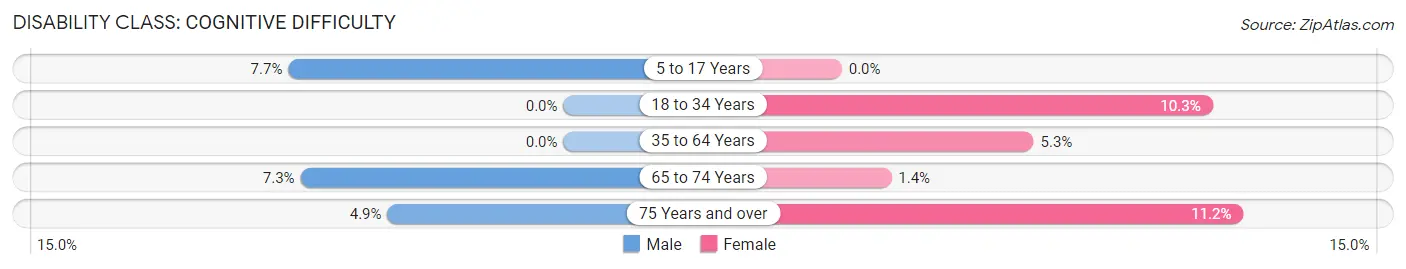
| Age Bracket | Male | Female |
| 5 to 17 Years | 17 (7.7%) | 0 (0.0%) |
| 18 to 34 Years | 0 (0.0%) | 13 (10.3%) |
| 35 to 64 Years | 0 (0.0%) | 40 (5.3%) |
| 65 to 74 Years | 58 (7.3%) | 14 (1.4%) |
| 75 Years and over | 27 (4.9%) | 91 (11.2%) |
Disability Class: Ambulatory Difficulty
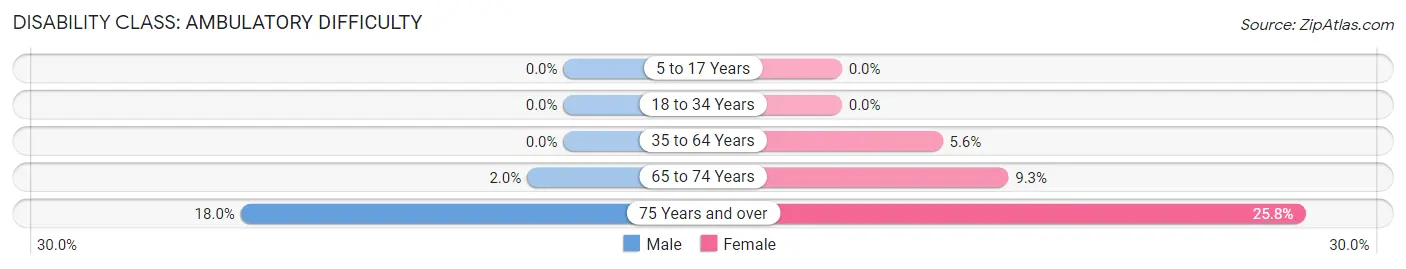
| Age Bracket | Male | Female |
| 5 to 17 Years | 0 (0.0%) | 0 (0.0%) |
| 18 to 34 Years | 0 (0.0%) | 0 (0.0%) |
| 35 to 64 Years | 0 (0.0%) | 42 (5.6%) |
| 65 to 74 Years | 16 (2.0%) | 94 (9.3%) |
| 75 Years and over | 99 (18.0%) | 210 (25.8%) |
Disability Class: Self-Care Difficulty
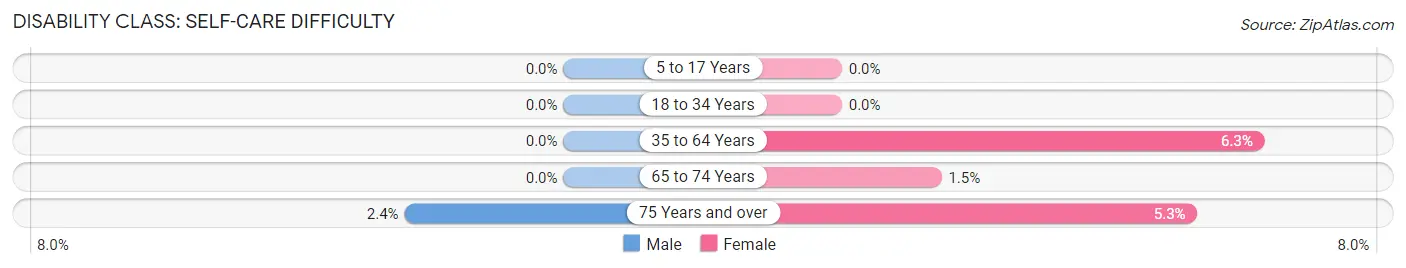
| Age Bracket | Male | Female |
| 5 to 17 Years | 0 (0.0%) | 0 (0.0%) |
| 18 to 34 Years | 0 (0.0%) | 0 (0.0%) |
| 35 to 64 Years | 0 (0.0%) | 47 (6.3%) |
| 65 to 74 Years | 0 (0.0%) | 15 (1.5%) |
| 75 Years and over | 13 (2.4%) | 43 (5.3%) |
Technology Access in The Pinehills
Computing Device Access in The Pinehills
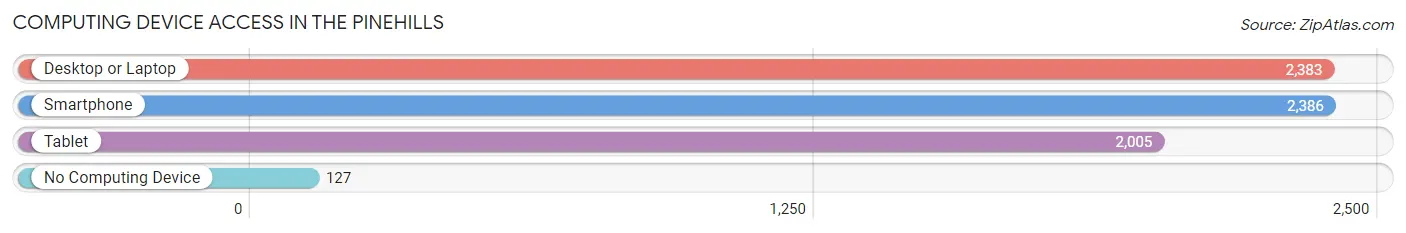
| Device Type | # Households | % Households |
| Desktop or Laptop | 2,383 | 88.9% |
| Smartphone | 2,386 | 89.0% |
| Tablet | 2,005 | 74.8% |
| No Computing Device | 127 | 4.7% |
| Total | 2,681 | 100.0% |
Internet Access in The Pinehills
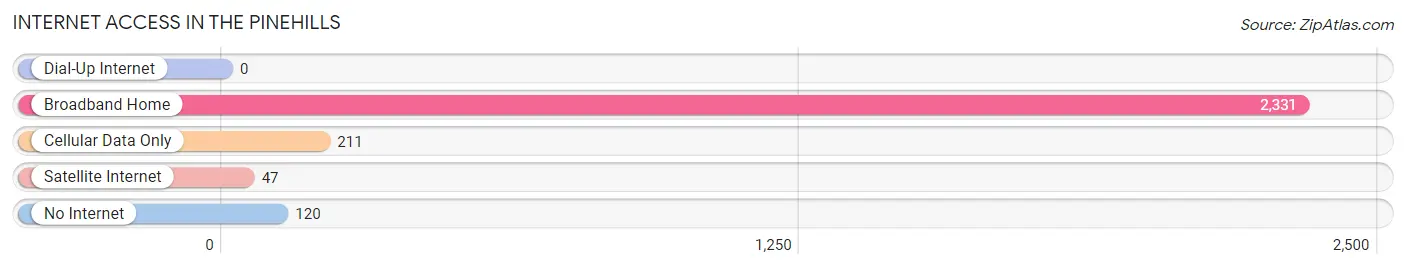
| Internet Type | # Households | % Households |
| Dial-Up Internet | 0 | 0.0% |
| Broadband Home | 2,331 | 87.0% |
| Cellular Data Only | 211 | 7.9% |
| Satellite Internet | 47 | 1.8% |
| No Internet | 120 | 4.5% |
| Total | 2,681 | 100.0% |
The Pinehills Summary
Pinehills, MA is a small town located in Plymouth County, Massachusetts. It is situated on the south shore of Massachusetts, approximately 25 miles south of Boston. The town is bordered by the towns of Kingston, Plymouth, Carver, and Wareham. The population of Pinehills was estimated to be 2,845 in 2019.
History
The area that is now Pinehills was originally inhabited by the Wampanoag people. The first European settlers arrived in the area in 1620, and the town was officially incorporated in 1711. The town was named after the pine trees that grew in the area.
In the 19th century, the town was a popular summer resort destination for wealthy Bostonians. The town was home to several large hotels, including the Pinehills Hotel, which was built in 1875. The hotel was destroyed by fire in 1891.
In the 20th century, the town became a popular retirement destination for wealthy Bostonians. The town was also home to several large estates, including the Pinehills Estate, which was built in the 1920s.
Geography
Pinehills is located in Plymouth County, Massachusetts. It is situated on the south shore of Massachusetts, approximately 25 miles south of Boston. The town is bordered by the towns of Kingston, Plymouth, Carver, and Wareham.
The town is located on a peninsula that is surrounded by the waters of Buzzards Bay and Plymouth Bay. The town is home to several small islands, including Hog Island, which is located off the coast of Pinehills.
The town is home to several small lakes, including Long Pond, which is located in the center of town. The town is also home to several small rivers, including the Jones River, which flows through the town.
Economy
The economy of Pinehills is largely based on tourism and retirement. The town is home to several small businesses, including restaurants, shops, and galleries. The town is also home to several large estates, which are popular tourist attractions.
The town is also home to several large marinas, which are popular destinations for boaters. The town is also home to several golf courses, which attract golfers from all over the region.
Demographics
As of 2019, the population of Pinehills was estimated to be 2,845. The town has a median age of 57.7 years, which is higher than the national median age of 38.4 years.
The town is predominantly white, with 92.3% of the population identifying as white. The town is also home to a small Hispanic population, with 4.2% of the population identifying as Hispanic or Latino.
The town has a median household income of $77,945, which is higher than the national median household income of $61,937. The town also has a poverty rate of 5.2%, which is lower than the national poverty rate of 11.8%.
Common Questions
What is Per Capita Income in The Pinehills?
Per Capita income in The Pinehills is $95,431.
What is the Median Family Income in The Pinehills?
Median Family Income in The Pinehills is $147,000.
What is the Median Household income in The Pinehills?
Median Household Income in The Pinehills is $111,710.
What is Income or Wage Gap in The Pinehills?
Income or Wage Gap in The Pinehills is 52.1%.
Women in The Pinehills earn 47.9 cents for every dollar earned by a man.
What is Inequality or Gini Index in The Pinehills?
Inequality or Gini Index in The Pinehills is 0.51.
What is the Total Population of The Pinehills?
Total Population of The Pinehills is 5,127.
What is the Total Male Population of The Pinehills?
Total Male Population of The Pinehills is 2,316.
What is the Total Female Population of The Pinehills?
Total Female Population of The Pinehills is 2,811.
What is the Ratio of Males per 100 Females in The Pinehills?
There are 82.39 Males per 100 Females in The Pinehills.
What is the Ratio of Females per 100 Males in The Pinehills?
There are 121.37 Females per 100 Males in The Pinehills.
What is the Median Population Age in The Pinehills?
Median Population Age in The Pinehills is 68.3 Years.
What is the Average Family Size in The Pinehills
Average Family Size in The Pinehills is 2.3 People.
What is the Average Household Size in The Pinehills
Average Household Size in The Pinehills is 1.9 People.
How Large is the Labor Force in The Pinehills?
There are 1,777 People in the Labor Forcein in The Pinehills.
What is the Percentage of People in the Labor Force in The Pinehills?
36.6% of People are in the Labor Force in The Pinehills.
What is the Unemployment Rate in The Pinehills?
Unemployment Rate in The Pinehills is 1.0%.