North Eastham, MA Map & Demographics
North Eastham Map
North Eastham Overview
$48,505
PER CAPITA INCOME
$96,845
AVG FAMILY INCOME
$81,544
AVG HOUSEHOLD INCOME
30.5%
WAGE / INCOME GAP [ % ]
69.5¢/ $1
WAGE / INCOME GAP [ $ ]
0.37
INEQUALITY / GINI INDEX
1,971
TOTAL POPULATION
941
MALE POPULATION
1,030
FEMALE POPULATION
91.36
MALES / 100 FEMALES
109.46
FEMALES / 100 MALES
62.5
MEDIAN AGE
2.5
AVG FAMILY SIZE
2.1
AVG HOUSEHOLD SIZE
859
LABOR FORCE [ PEOPLE ]
48.3%
PERCENT IN LABOR FORCE
10.5%
UNEMPLOYMENT RATE
North Eastham Area Codes
Income in North Eastham
Income Overview in North Eastham
Per Capita Income in North Eastham is $48,505, while median incomes of families and households are $96,845 and $81,544 respectively.
| Characteristic | Number | Measure |
| Per Capita Income | 1,971 | $48,505 |
| Median Family Income | 661 | $96,845 |
| Mean Family Income | 661 | $113,760 |
| Median Household Income | 928 | $81,544 |
| Mean Household Income | 928 | $101,306 |
| Income Deficit | 661 | $0 |
| Wage / Income Gap (%) | 1,971 | 30.52% |
| Wage / Income Gap ($) | 1,971 | 69.48¢ per $1 |
| Gini / Inequality Index | 1,971 | 0.37 |
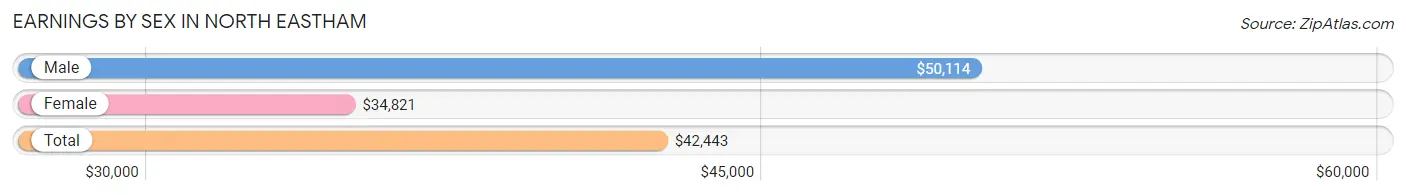
Earnings by Sex in North Eastham
Average Earnings in North Eastham are $42,443, $50,114 for men and $34,821 for women, a difference of 30.5%.
| Sex | Number | Average Earnings |
| Male | 434 (44.0%) | $50,114 |
| Female | 553 (56.0%) | $34,821 |
| Total | 987 (100.0%) | $42,443 |
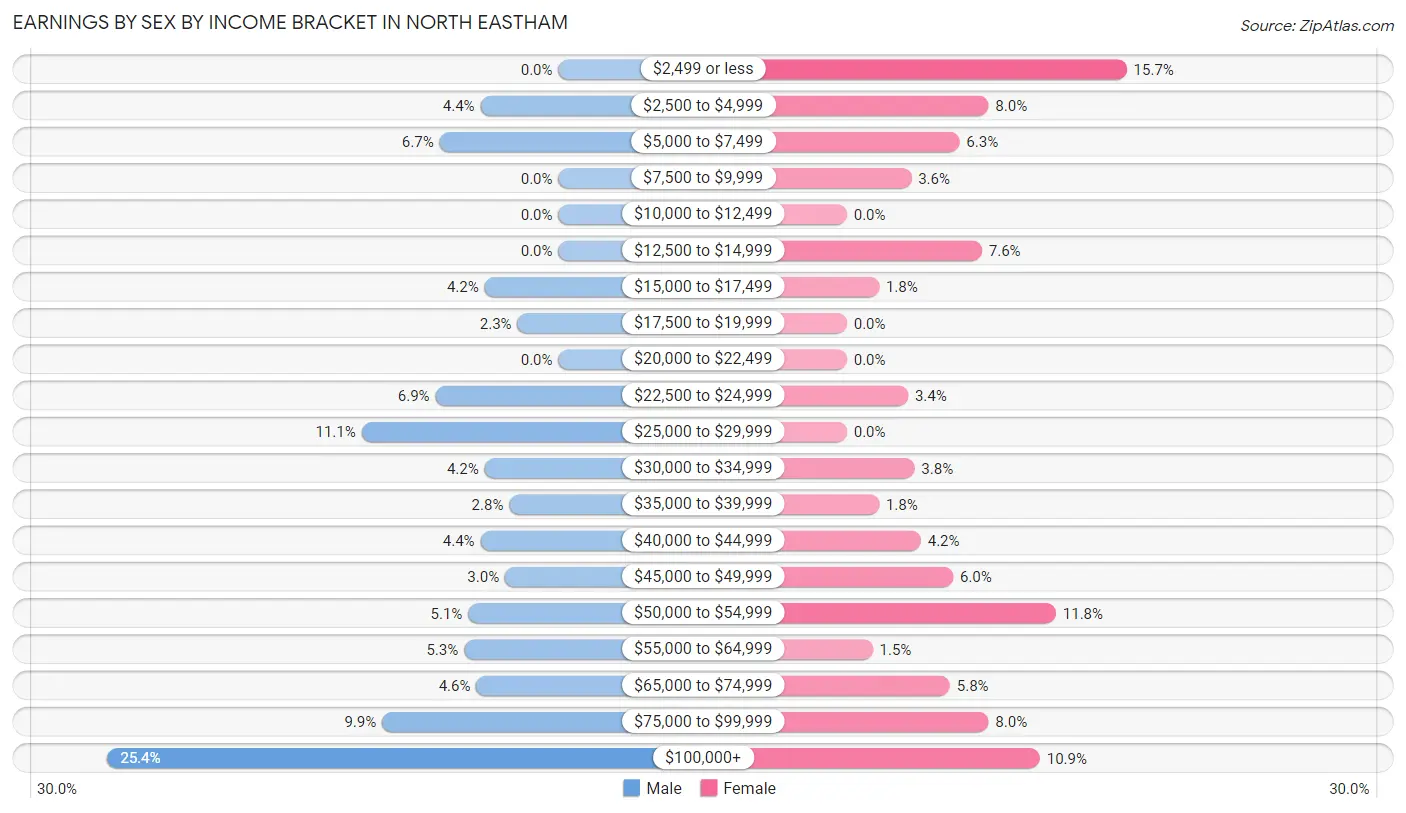
Earnings by Sex by Income Bracket in North Eastham
The most common earnings brackets in North Eastham are $100,000+ for men (110 | 25.4%) and $2,499 or less for women (87 | 15.7%).
| Income | Male | Female |
| $2,499 or less | 0 (0.0%) | 87 (15.7%) |
| $2,500 to $4,999 | 19 (4.4%) | 44 (8.0%) |
| $5,000 to $7,499 | 29 (6.7%) | 35 (6.3%) |
| $7,500 to $9,999 | 0 (0.0%) | 20 (3.6%) |
| $10,000 to $12,499 | 0 (0.0%) | 0 (0.0%) |
| $12,500 to $14,999 | 0 (0.0%) | 42 (7.6%) |
| $15,000 to $17,499 | 18 (4.2%) | 10 (1.8%) |
| $17,500 to $19,999 | 10 (2.3%) | 0 (0.0%) |
| $20,000 to $22,499 | 0 (0.0%) | 0 (0.0%) |
| $22,500 to $24,999 | 30 (6.9%) | 19 (3.4%) |
| $25,000 to $29,999 | 48 (11.1%) | 0 (0.0%) |
| $30,000 to $34,999 | 18 (4.2%) | 21 (3.8%) |
| $35,000 to $39,999 | 12 (2.8%) | 10 (1.8%) |
| $40,000 to $44,999 | 19 (4.4%) | 23 (4.2%) |
| $45,000 to $49,999 | 13 (3.0%) | 33 (6.0%) |
| $50,000 to $54,999 | 22 (5.1%) | 65 (11.7%) |
| $55,000 to $64,999 | 23 (5.3%) | 8 (1.5%) |
| $65,000 to $74,999 | 20 (4.6%) | 32 (5.8%) |
| $75,000 to $99,999 | 43 (9.9%) | 44 (8.0%) |
| $100,000+ | 110 (25.4%) | 60 (10.8%) |
| Total | 434 (100.0%) | 553 (100.0%) |
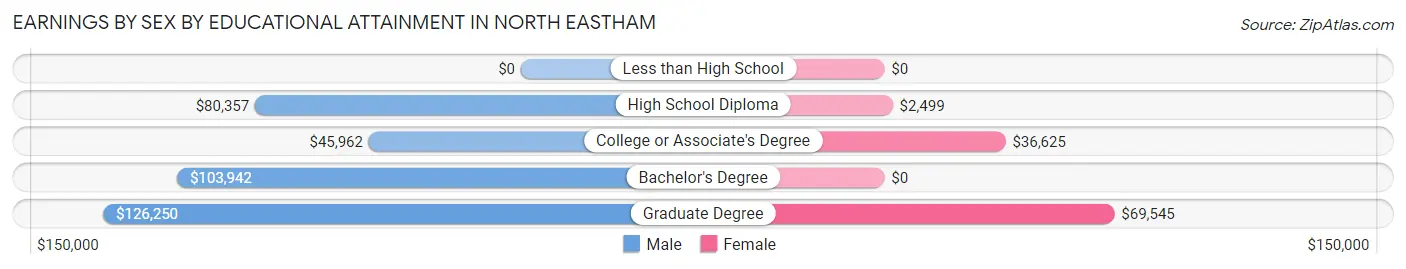
Earnings by Sex by Educational Attainment in North Eastham
Average earnings in North Eastham are $57,500 for men and $42,375 for women, a difference of 26.3%. Men with an educational attainment of graduate degree enjoy the highest average annual earnings of $126,250, while those with college or associate's degree education earn the least with $45,962. Women with an educational attainment of graduate degree earn the most with the average annual earnings of $69,545, while those with high school diploma education have the smallest earnings of $2,499.
| Educational Attainment | Male Income | Female Income |
| Less than High School | - | - |
| High School Diploma | $80,357 | $2,499 |
| College or Associate's Degree | $45,962 | $36,625 |
| Bachelor's Degree | $103,942 | $0 |
| Graduate Degree | $126,250 | $69,545 |
| Total | $57,500 | $42,375 |
Family Income in North Eastham
Family Income Brackets in North Eastham
According to the North Eastham family income data, there are 161 families falling into the $100,000 to $149,999 income range, which is the most common income bracket and makes up 24.4% of all families.
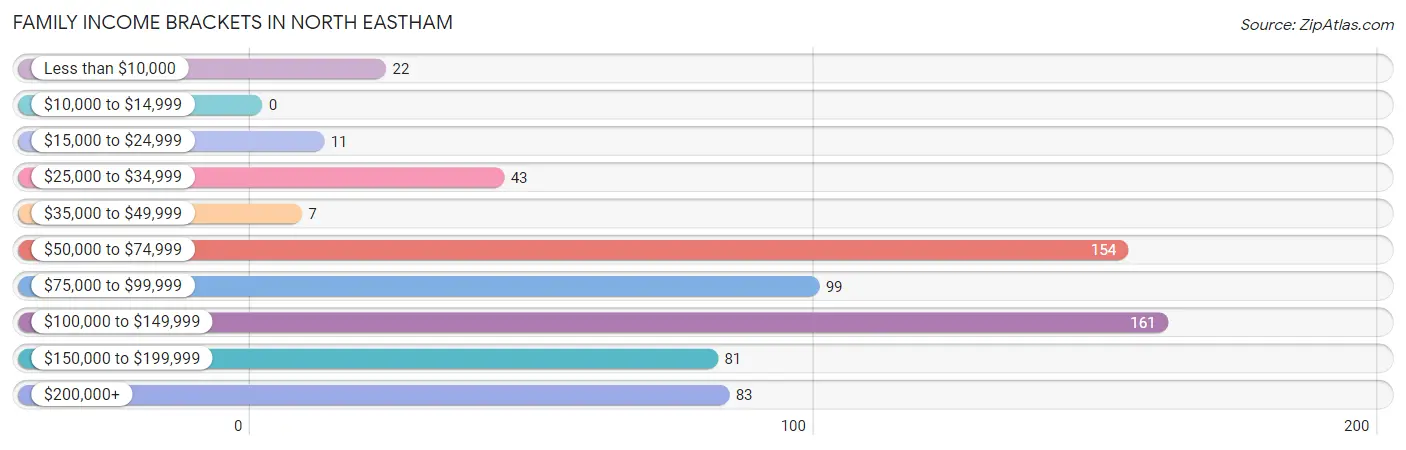
| Income Bracket | # Families | % Families |
| Less than $10,000 | 22 | 3.3% |
| $10,000 to $14,999 | 0 | 0.0% |
| $15,000 to $24,999 | 11 | 1.7% |
| $25,000 to $34,999 | 43 | 6.5% |
| $35,000 to $49,999 | 7 | 1.1% |
| $50,000 to $74,999 | 154 | 23.3% |
| $75,000 to $99,999 | 99 | 15.0% |
| $100,000 to $149,999 | 161 | 24.4% |
| $150,000 to $199,999 | 81 | 12.3% |
| $200,000+ | 83 | 12.6% |
Family Income by Famaliy Size in North Eastham
2-person families (489 | 74.0%) account for the highest median family income in North Eastham with $115,483 per family, while 2-person families (489 | 74.0%) have the highest median income of $57,742 per family member.
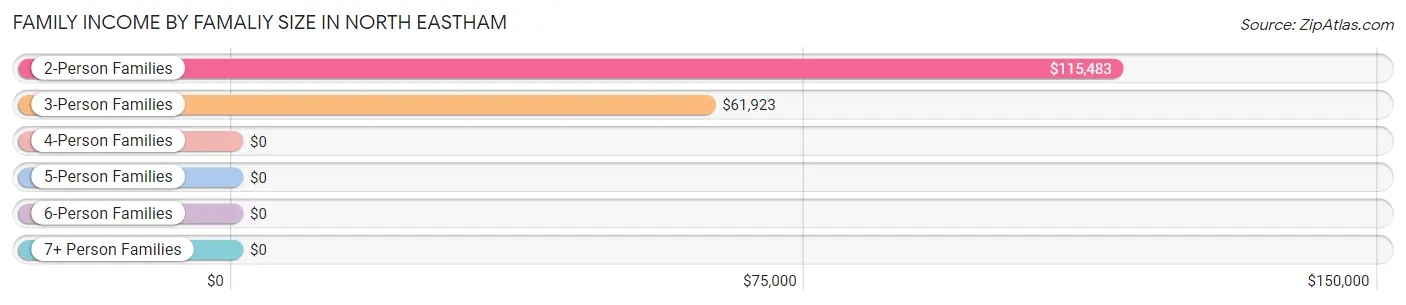
| Income Bracket | # Families | Median Income |
| 2-Person Families | 489 (74.0%) | $115,483 |
| 3-Person Families | 130 (19.7%) | $61,923 |
| 4-Person Families | 22 (3.3%) | $0 |
| 5-Person Families | 12 (1.8%) | $0 |
| 6-Person Families | 8 (1.2%) | $0 |
| 7+ Person Families | 0 (0.0%) | $0 |
| Total | 661 (100.0%) | $96,845 |
Family Income by Number of Earners in North Eastham
The median family income in North Eastham is $96,845, with families comprising 2 earners (166) having the highest median family income of $152,813, while families with 1 earner (219) have the lowest median family income of $89,375, accounting for 25.1% and 33.1% of families, respectively.
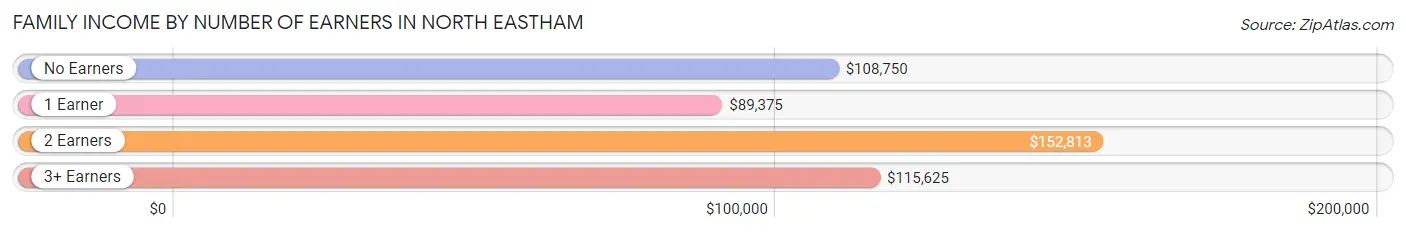
| Number of Earners | # Families | Median Income |
| No Earners | 242 (36.6%) | $108,750 |
| 1 Earner | 219 (33.1%) | $89,375 |
| 2 Earners | 166 (25.1%) | $152,813 |
| 3+ Earners | 34 (5.1%) | $115,625 |
| Total | 661 (100.0%) | $96,845 |
Household Income in North Eastham
Household Income Brackets in North Eastham
With 248 households falling in the category, the $50,000 to $74,999 income range is the most frequent in North Eastham, accounting for 26.7% of all households. In contrast, only 11 households (1.2%) fall into the $15,000 to $24,999 income bracket, making it the least populous group.
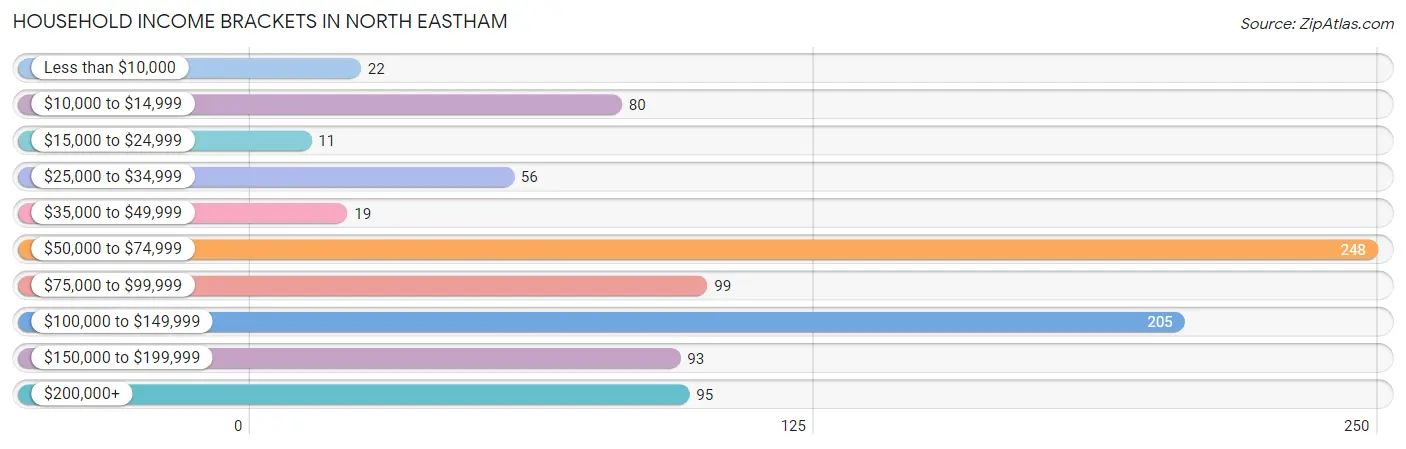
| Income Bracket | # Households | % Households |
| Less than $10,000 | 22 | 2.4% |
| $10,000 to $14,999 | 80 | 8.6% |
| $15,000 to $24,999 | 11 | 1.2% |
| $25,000 to $34,999 | 56 | 6.0% |
| $35,000 to $49,999 | 19 | 2.0% |
| $50,000 to $74,999 | 248 | 26.7% |
| $75,000 to $99,999 | 99 | 10.7% |
| $100,000 to $149,999 | 205 | 22.1% |
| $150,000 to $199,999 | 93 | 10.0% |
| $200,000+ | 95 | 10.2% |
Household Income by Householder Age in North Eastham
The median household income in North Eastham is $81,544, with the highest median household income of $104,926 found in the 45 to 64 years age bracket for the primary householder. A total of 237 households (25.5%) fall into this category.
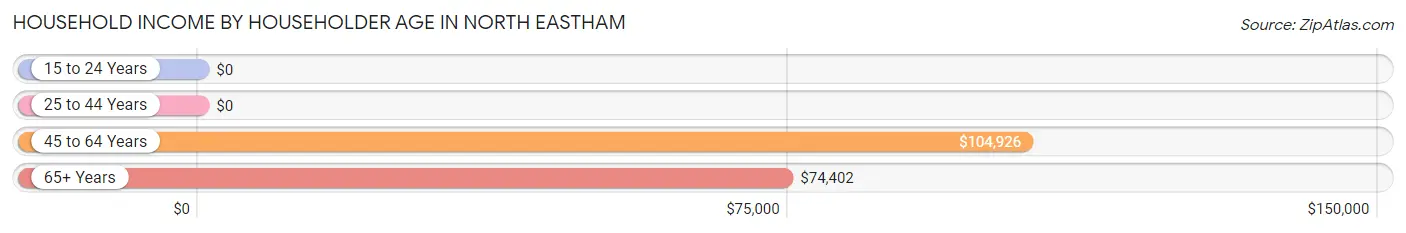
| Income Bracket | # Households | Median Income |
| 15 to 24 Years | 0 (0.0%) | $0 |
| 25 to 44 Years | 123 (13.3%) | $0 |
| 45 to 64 Years | 237 (25.5%) | $104,926 |
| 65+ Years | 568 (61.2%) | $74,402 |
| Total | 928 (100.0%) | $81,544 |
Poverty in North Eastham
Income Below Poverty by Sex and Age in North Eastham
With 3.8% poverty level for males and 14.2% for females among the residents of North Eastham, 35 to 44 year old males and 6 to 11 year old females are the most vulnerable to poverty, with 14 males (13.7%) and 21 females (52.5%) in their respective age groups living below the poverty level.
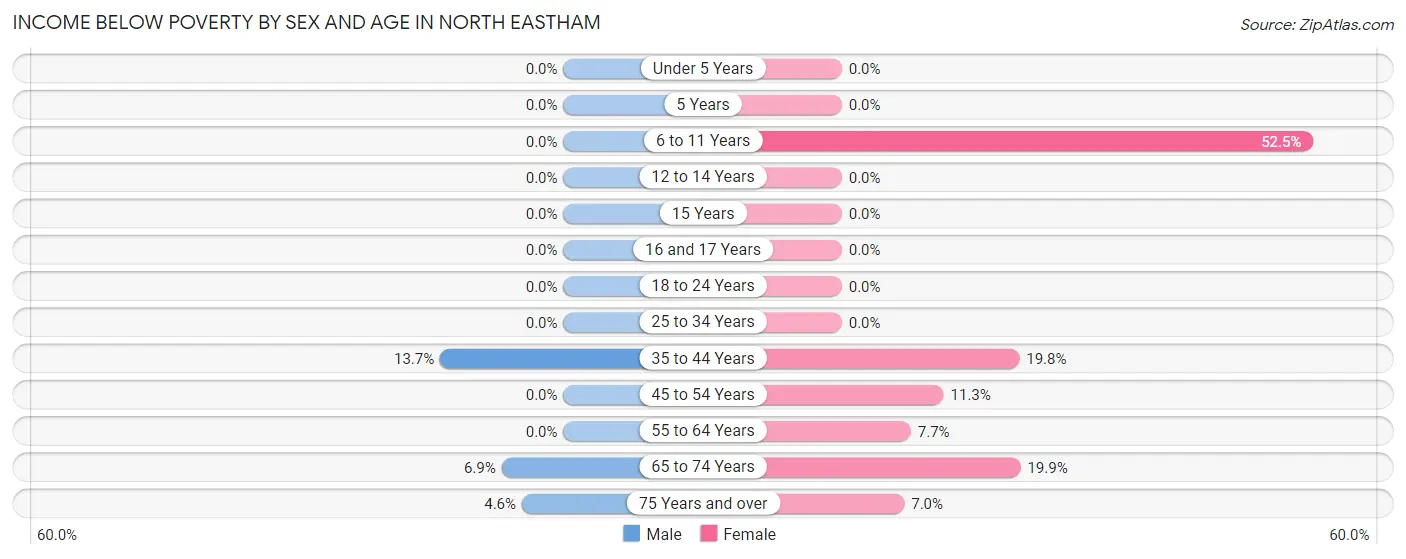
| Age Bracket | Male | Female |
| Under 5 Years | 0 (0.0%) | 0 (0.0%) |
| 5 Years | 0 (0.0%) | 0 (0.0%) |
| 6 to 11 Years | 0 (0.0%) | 21 (52.5%) |
| 12 to 14 Years | 0 (0.0%) | 0 (0.0%) |
| 15 Years | 0 (0.0%) | 0 (0.0%) |
| 16 and 17 Years | 0 (0.0%) | 0 (0.0%) |
| 18 to 24 Years | 0 (0.0%) | 0 (0.0%) |
| 25 to 34 Years | 0 (0.0%) | 0 (0.0%) |
| 35 to 44 Years | 14 (13.7%) | 17 (19.8%) |
| 45 to 54 Years | 0 (0.0%) | 11 (11.3%) |
| 55 to 64 Years | 0 (0.0%) | 13 (7.7%) |
| 65 to 74 Years | 13 (6.9%) | 76 (19.9%) |
| 75 Years and over | 9 (4.6%) | 8 (7.0%) |
| Total | 36 (3.8%) | 146 (14.2%) |
Income Above Poverty by Sex and Age in North Eastham
According to the poverty statistics in North Eastham, males aged under 5 years and females aged under 5 years are the age groups that are most secure financially, with 100.0% of males and 100.0% of females in these age groups living above the poverty line.
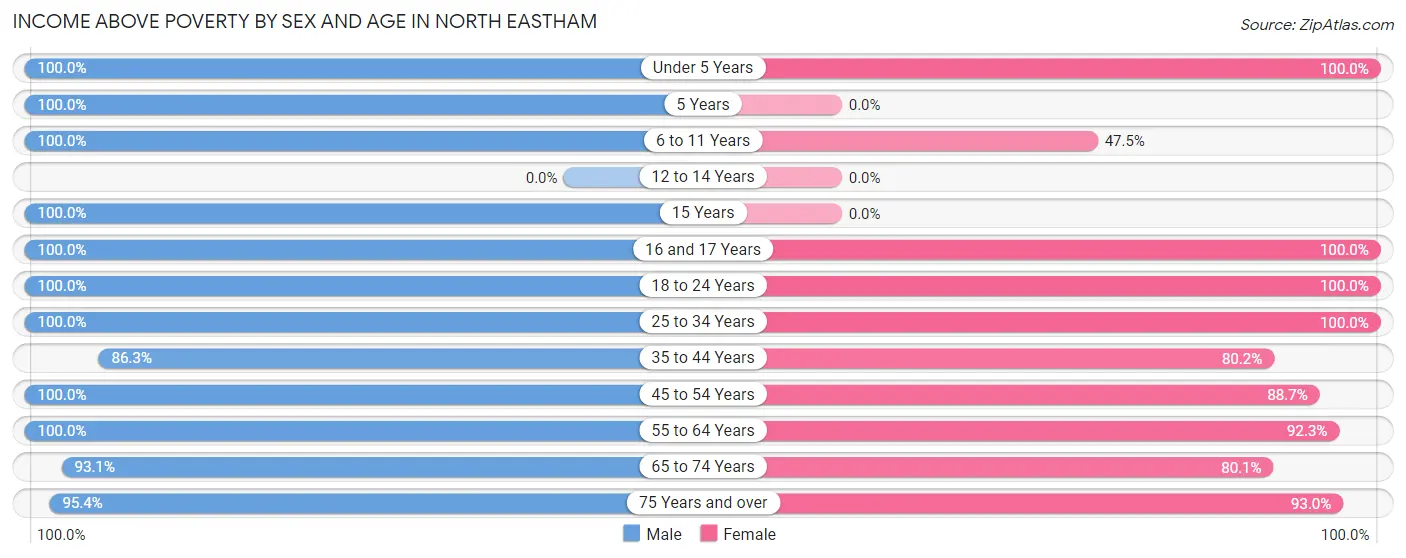
| Age Bracket | Male | Female |
| Under 5 Years | 58 (100.0%) | 34 (100.0%) |
| 5 Years | 40 (100.0%) | 0 (0.0%) |
| 6 to 11 Years | 8 (100.0%) | 19 (47.5%) |
| 12 to 14 Years | 0 (0.0%) | 0 (0.0%) |
| 15 Years | 13 (100.0%) | 0 (0.0%) |
| 16 and 17 Years | 31 (100.0%) | 16 (100.0%) |
| 18 to 24 Years | 47 (100.0%) | 34 (100.0%) |
| 25 to 34 Years | 58 (100.0%) | 57 (100.0%) |
| 35 to 44 Years | 88 (86.3%) | 69 (80.2%) |
| 45 to 54 Years | 75 (100.0%) | 86 (88.7%) |
| 55 to 64 Years | 125 (100.0%) | 156 (92.3%) |
| 65 to 74 Years | 176 (93.1%) | 306 (80.1%) |
| 75 Years and over | 186 (95.4%) | 107 (93.0%) |
| Total | 905 (96.2%) | 884 (85.8%) |
Income Below Poverty Among Married-Couple Families in North Eastham
The poverty statistics for married-couple families in North Eastham show that 1.7% or 9 of the total 521 families live below the poverty line. Families with no children have the highest poverty rate of 2.1%, comprising of 9 families. On the other hand, families with 1 or 2 children have the lowest poverty rate of 0.0%, which includes 0 families.
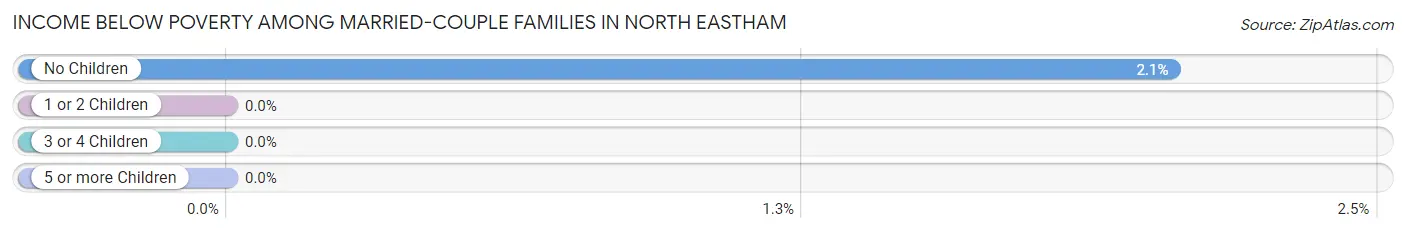
| Children | Above Poverty | Below Poverty |
| No Children | 431 (98.0%) | 9 (2.1%) |
| 1 or 2 Children | 81 (100.0%) | 0 (0.0%) |
| 3 or 4 Children | 0 (0.0%) | 0 (0.0%) |
| 5 or more Children | 0 (0.0%) | 0 (0.0%) |
| Total | 512 (98.3%) | 9 (1.7%) |
Income Below Poverty Among Single-Parent Households in North Eastham
According to the poverty data in North Eastham, 21.0% or 13 single-father households and 14.1% or 11 single-mother households are living below the poverty line. Among single-father households, those with no children have the highest poverty rate, with 13 households (52.0%) experiencing poverty. Likewise, among single-mother households, those with 1 or 2 children have the highest poverty rate, with 11 households (23.9%) falling below the poverty line.
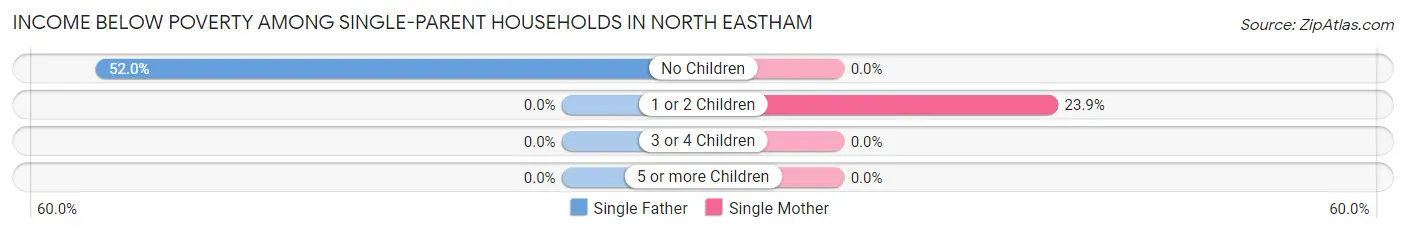
| Children | Single Father | Single Mother |
| No Children | 13 (52.0%) | 0 (0.0%) |
| 1 or 2 Children | 0 (0.0%) | 11 (23.9%) |
| 3 or 4 Children | 0 (0.0%) | 0 (0.0%) |
| 5 or more Children | 0 (0.0%) | 0 (0.0%) |
| Total | 13 (21.0%) | 11 (14.1%) |
Income Below Poverty Among Married-Couple vs Single-Parent Households in North Eastham
The poverty data for North Eastham shows that 9 of the married-couple family households (1.7%) and 24 of the single-parent households (17.1%) are living below the poverty level. Within the married-couple family households, those with no children have the highest poverty rate, with 9 households (2.1%) falling below the poverty line. Among the single-parent households, those with no children have the highest poverty rate, with 13 household (22.8%) living below poverty.
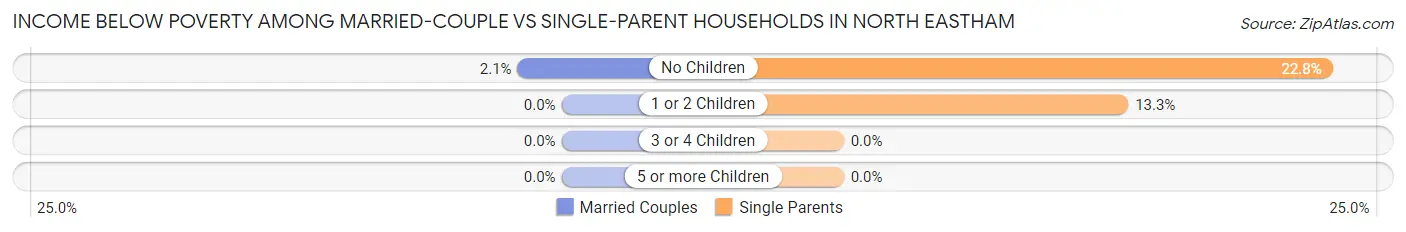
| Children | Married-Couple Families | Single-Parent Households |
| No Children | 9 (2.1%) | 13 (22.8%) |
| 1 or 2 Children | 0 (0.0%) | 11 (13.3%) |
| 3 or 4 Children | 0 (0.0%) | 0 (0.0%) |
| 5 or more Children | 0 (0.0%) | 0 (0.0%) |
| Total | 9 (1.7%) | 24 (17.1%) |
Race in North Eastham
The most populous races in North Eastham are White / Caucasian (1,874 | 95.1%), Two or more Races (76 | 3.9%), and Asian (11 | 0.6%).
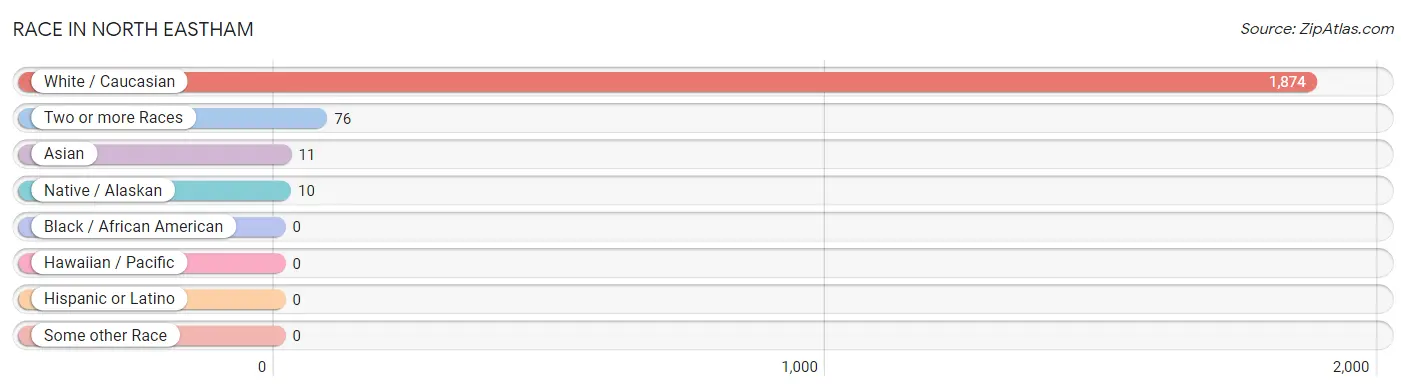
| Race | # Population | % Population |
| Asian | 11 | 0.6% |
| Black / African American | 0 | 0.0% |
| Hawaiian / Pacific | 0 | 0.0% |
| Hispanic or Latino | 0 | 0.0% |
| Native / Alaskan | 10 | 0.5% |
| White / Caucasian | 1,874 | 95.1% |
| Two or more Races | 76 | 3.9% |
| Some other Race | 0 | 0.0% |
| Total | 1,971 | 100.0% |
Ancestry in North Eastham
The most populous ancestries reported in North Eastham are Irish (490 | 24.9%), English (436 | 22.1%), American (296 | 15.0%), Italian (213 | 10.8%), and German (186 | 9.4%), together accounting for 82.3% of all North Eastham residents.
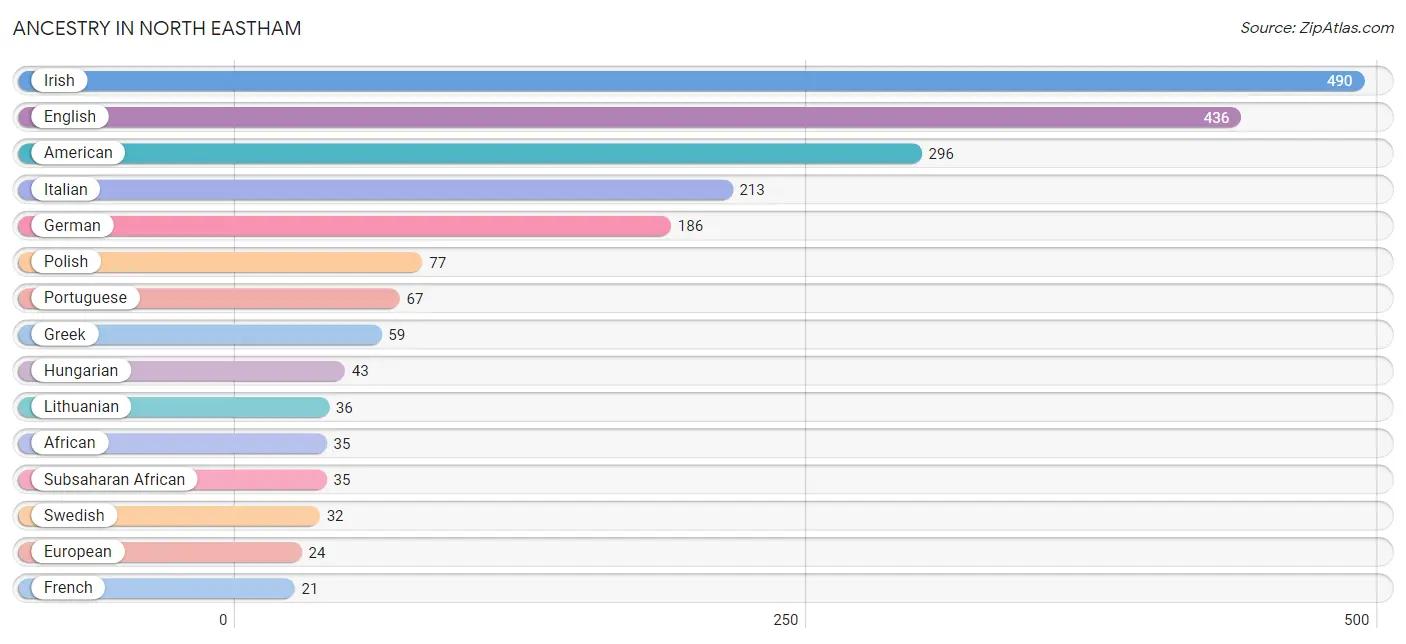
| Ancestry | # Population | % Population |
| African | 35 | 1.8% |
| American | 296 | 15.0% |
| Assyrian / Chaldean / Syriac | 8 | 0.4% |
| Bhutanese | 11 | 0.6% |
| Danish | 11 | 0.6% |
| Dutch | 8 | 0.4% |
| English | 436 | 22.1% |
| European | 24 | 1.2% |
| French | 21 | 1.1% |
| German | 186 | 9.4% |
| Greek | 59 | 3.0% |
| Hungarian | 43 | 2.2% |
| Irish | 490 | 24.9% |
| Italian | 213 | 10.8% |
| Korean | 11 | 0.6% |
| Lithuanian | 36 | 1.8% |
| Northern European | 6 | 0.3% |
| Polish | 77 | 3.9% |
| Portuguese | 67 | 3.4% |
| Scottish | 18 | 0.9% |
| Sioux | 10 | 0.5% |
| Subsaharan African | 35 | 1.8% |
| Swedish | 32 | 1.6% |
| Ukrainian | 12 | 0.6% |
| Welsh | 7 | 0.4% | View All 25 Rows |
Immigrants in North Eastham
The most numerous immigrant groups reported in North Eastham came from Europe (84 | 4.3%), Portugal (59 | 3.0%), Southern Europe (59 | 3.0%), Eastern Europe (14 | 0.7%), and Russia (14 | 0.7%), together accounting for 11.7% of all North Eastham residents.
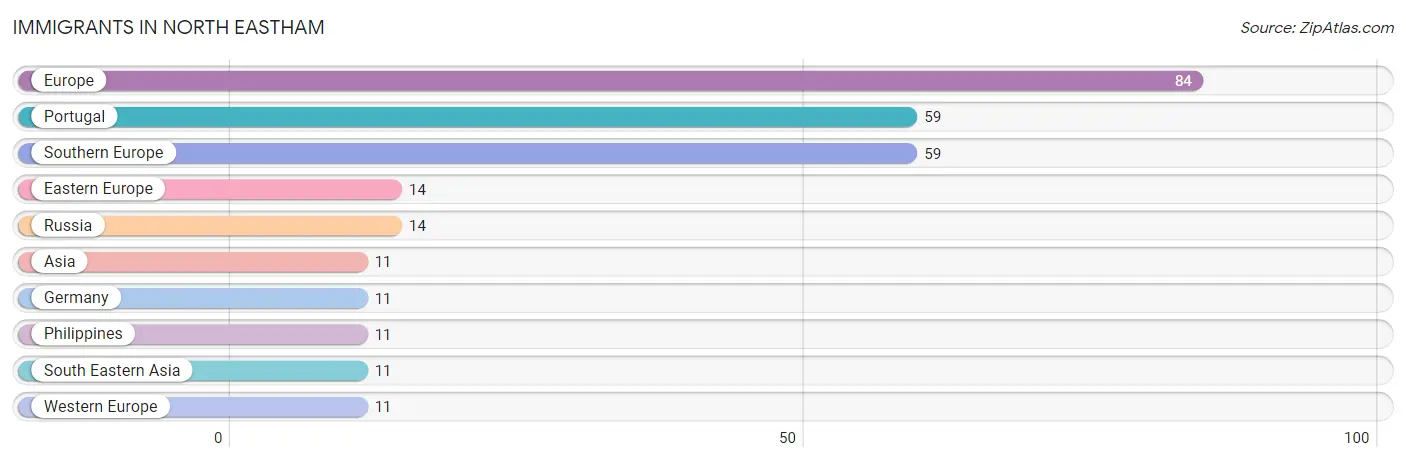
| Immigration Origin | # Population | % Population |
| Asia | 11 | 0.6% |
| Eastern Europe | 14 | 0.7% |
| Europe | 84 | 4.3% |
| Germany | 11 | 0.6% |
| Philippines | 11 | 0.6% |
| Portugal | 59 | 3.0% |
| Russia | 14 | 0.7% |
| South Eastern Asia | 11 | 0.6% |
| Southern Europe | 59 | 3.0% |
| Western Europe | 11 | 0.6% | View All 10 Rows |
Sex and Age in North Eastham
Sex and Age in North Eastham
The most populous age groups in North Eastham are 70 to 74 Years (137 | 14.6%) for men and 70 to 74 Years (237 | 23.0%) for women.
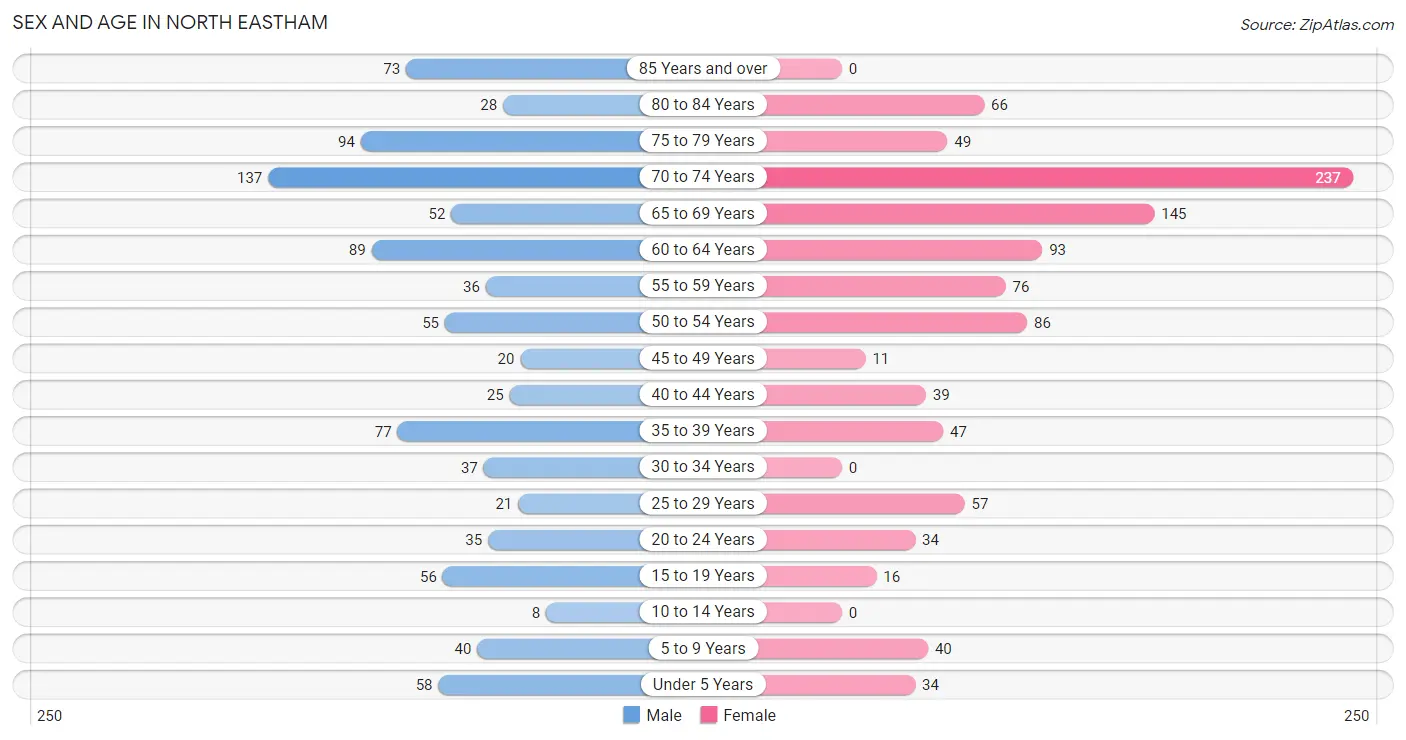
| Age Bracket | Male | Female |
| Under 5 Years | 58 (6.2%) | 34 (3.3%) |
| 5 to 9 Years | 40 (4.3%) | 40 (3.9%) |
| 10 to 14 Years | 8 (0.9%) | 0 (0.0%) |
| 15 to 19 Years | 56 (5.9%) | 16 (1.5%) |
| 20 to 24 Years | 35 (3.7%) | 34 (3.3%) |
| 25 to 29 Years | 21 (2.2%) | 57 (5.5%) |
| 30 to 34 Years | 37 (3.9%) | 0 (0.0%) |
| 35 to 39 Years | 77 (8.2%) | 47 (4.6%) |
| 40 to 44 Years | 25 (2.7%) | 39 (3.8%) |
| 45 to 49 Years | 20 (2.1%) | 11 (1.1%) |
| 50 to 54 Years | 55 (5.8%) | 86 (8.4%) |
| 55 to 59 Years | 36 (3.8%) | 76 (7.4%) |
| 60 to 64 Years | 89 (9.5%) | 93 (9.0%) |
| 65 to 69 Years | 52 (5.5%) | 145 (14.1%) |
| 70 to 74 Years | 137 (14.6%) | 237 (23.0%) |
| 75 to 79 Years | 94 (10.0%) | 49 (4.8%) |
| 80 to 84 Years | 28 (3.0%) | 66 (6.4%) |
| 85 Years and over | 73 (7.8%) | 0 (0.0%) |
| Total | 941 (100.0%) | 1,030 (100.0%) |
Families and Households in North Eastham
Median Family Size in North Eastham
The median family size in North Eastham is 2.48 persons per family, with single male/father families (62 | 9.4%) accounting for the largest median family size of 2.89 persons per family. On the other hand, married-couple families (521 | 78.8%) represent the smallest median family size with 2.42 persons per family.
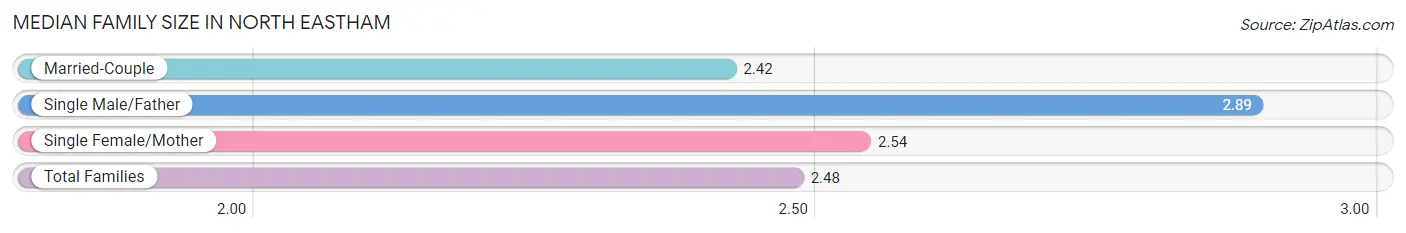
| Family Type | # Families | Family Size |
| Married-Couple | 521 (78.8%) | 2.42 |
| Single Male/Father | 62 (9.4%) | 2.89 |
| Single Female/Mother | 78 (11.8%) | 2.54 |
| Total Families | 661 (100.0%) | 2.48 |
Median Household Size in North Eastham
The median household size in North Eastham is 2.12 persons per household, with single male/father households (62 | 6.7%) accounting for the largest median household size of 2.89 persons per household. non-family households (267 | 28.8%) represent the smallest median household size with 1.18 persons per household.
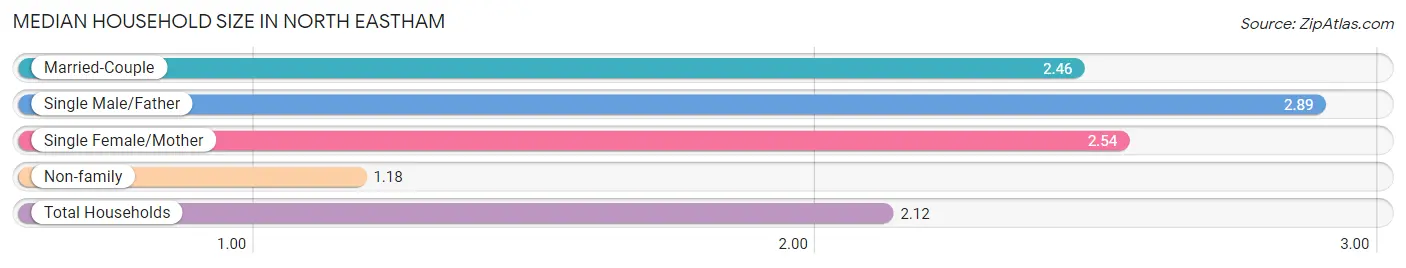
| Household Type | # Households | Household Size |
| Married-Couple | 521 (56.1%) | 2.46 |
| Single Male/Father | 62 (6.7%) | 2.89 |
| Single Female/Mother | 78 (8.4%) | 2.54 |
| Non-family | 267 (28.8%) | 1.18 |
| Total Households | 928 (100.0%) | 2.12 |
Household Size by Marriage Status in North Eastham
Out of a total of 928 households in North Eastham, 661 (71.2%) are family households, while 267 (28.8%) are nonfamily households. The most numerous type of family households are 2-person households, comprising 489, and the most common type of nonfamily households are 1-person households, comprising 221.
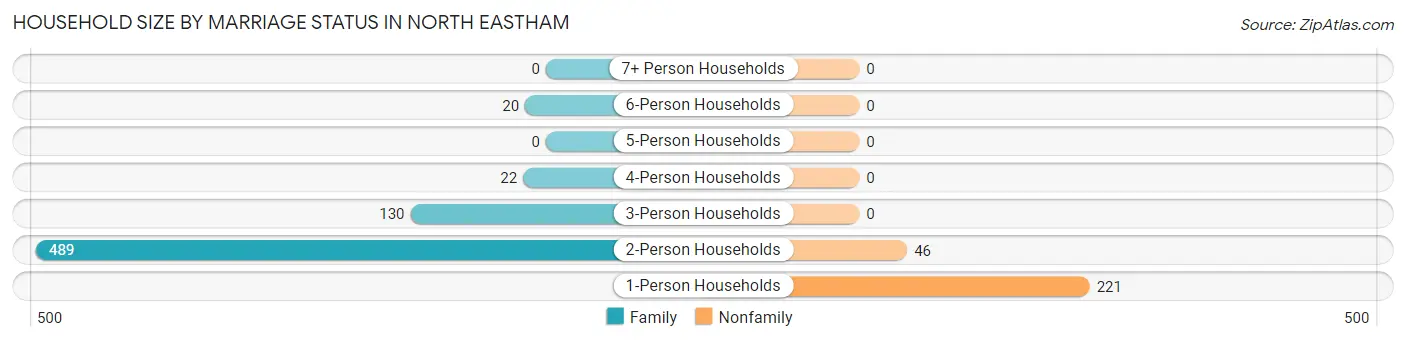
| Household Size | Family Households | Nonfamily Households |
| 1-Person Households | - | 221 (23.8%) |
| 2-Person Households | 489 (52.7%) | 46 (5.0%) |
| 3-Person Households | 130 (14.0%) | 0 (0.0%) |
| 4-Person Households | 22 (2.4%) | 0 (0.0%) |
| 5-Person Households | 0 (0.0%) | 0 (0.0%) |
| 6-Person Households | 20 (2.2%) | 0 (0.0%) |
| 7+ Person Households | 0 (0.0%) | 0 (0.0%) |
| Total | 661 (71.2%) | 267 (28.8%) |
Female Fertility in North Eastham
Fertility by Age in North Eastham
Average fertility rate in North Eastham is 139.0 births per 1,000 women. Women in the age bracket of 35 to 50 years have the highest fertility rate with 248.0 births per 1,000 women. Women in the age bracket of 35 to 50 years acount for 100.0% of all women with births.
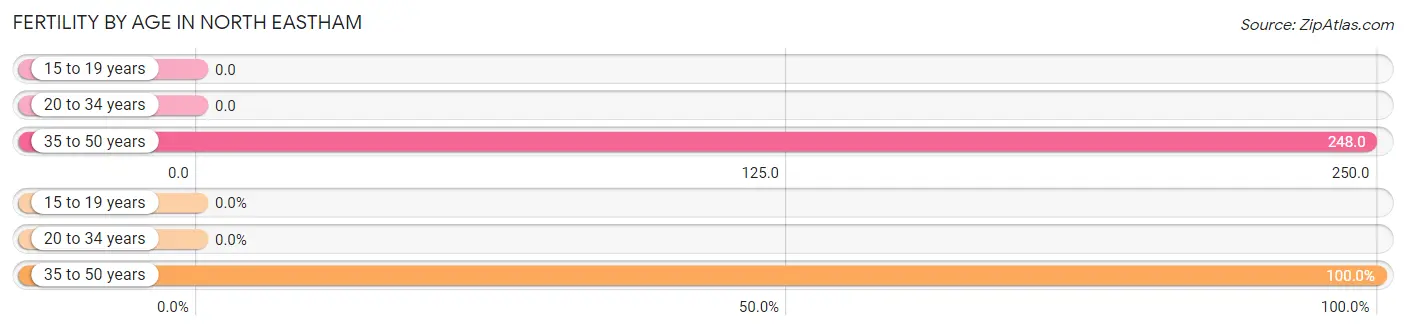
| Age Bracket | Women with Births | Births / 1,000 Women |
| 15 to 19 years | 0 (0.0%) | 0.0 |
| 20 to 34 years | 0 (0.0%) | 0.0 |
| 35 to 50 years | 34 (100.0%) | 248.0 |
| Total | 34 (100.0%) | 139.0 |
Fertility by Age by Marriage Status in North Eastham
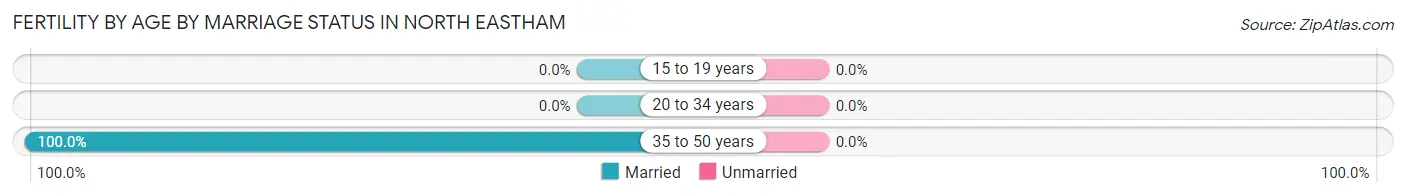
| Age Bracket | Married | Unmarried |
| 15 to 19 years | 0 (0.0%) | 0 (0.0%) |
| 20 to 34 years | 0 (0.0%) | 0 (0.0%) |
| 35 to 50 years | 34 (100.0%) | 0 (0.0%) |
| Total | 34 (100.0%) | 0 (0.0%) |
Fertility by Education in North Eastham
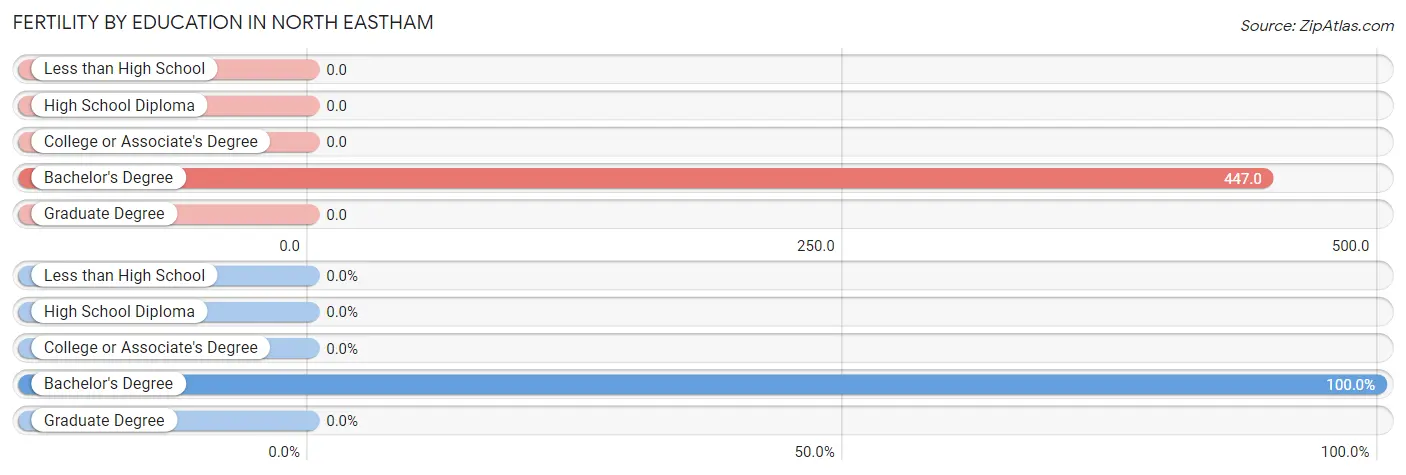
| Educational Attainment | Women with Births | Births / 1,000 Women |
| Less than High School | 0 (0.0%) | 0.0 |
| High School Diploma | 0 (0.0%) | 0.0 |
| College or Associate's Degree | 0 (0.0%) | 0.0 |
| Bachelor's Degree | 34 (100.0%) | 447.0 |
| Graduate Degree | 0 (0.0%) | 0.0 |
| Total | 34 (100.0%) | 139.0 |
Fertility by Education by Marriage Status in North Eastham
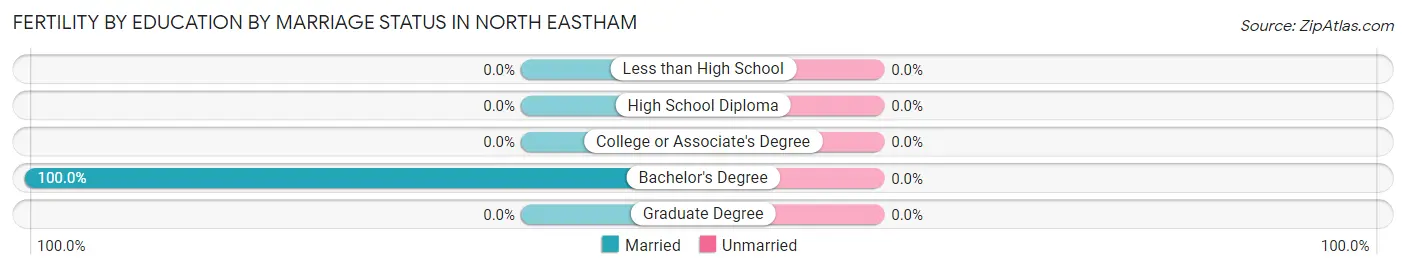
| Educational Attainment | Married | Unmarried |
| Less than High School | 0 (0.0%) | 0 (0.0%) |
| High School Diploma | 0 (0.0%) | 0 (0.0%) |
| College or Associate's Degree | 0 (0.0%) | 0 (0.0%) |
| Bachelor's Degree | 34 (100.0%) | 0 (0.0%) |
| Graduate Degree | 0 (0.0%) | 0 (0.0%) |
| Total | 34 (100.0%) | 0 (0.0%) |
Employment Characteristics in North Eastham
Employment by Class of Employer in North Eastham
Among the 756 employed individuals in North Eastham, private company employees (476 | 63.0%), self-employed (not incorporated) (112 | 14.8%), and local government employees (101 | 13.4%) make up the most common classes of employment.
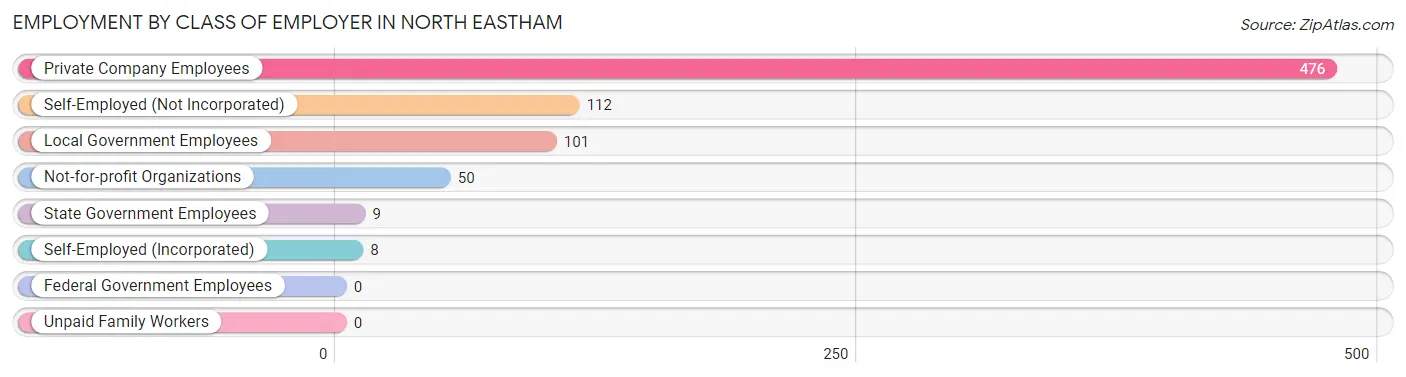
| Employer Class | # Employees | % Employees |
| Private Company Employees | 476 | 63.0% |
| Self-Employed (Incorporated) | 8 | 1.1% |
| Self-Employed (Not Incorporated) | 112 | 14.8% |
| Not-for-profit Organizations | 50 | 6.6% |
| Local Government Employees | 101 | 13.4% |
| State Government Employees | 9 | 1.2% |
| Federal Government Employees | 0 | 0.0% |
| Unpaid Family Workers | 0 | 0.0% |
| Total | 756 | 100.0% |
Employment Status by Age in North Eastham
According to the labor force statistics for North Eastham, out of the total population over 16 years of age (1,778), 48.3% or 859 individuals are in the labor force, with 10.5% or 90 of them unemployed. The age group with the highest labor force participation rate is 20 to 24 years, with 100.0% or 69 individuals in the labor force. Within the labor force, the 16 to 19 years age range has the highest percentage of unemployed individuals, with 37.5% or 12 of them being unemployed.
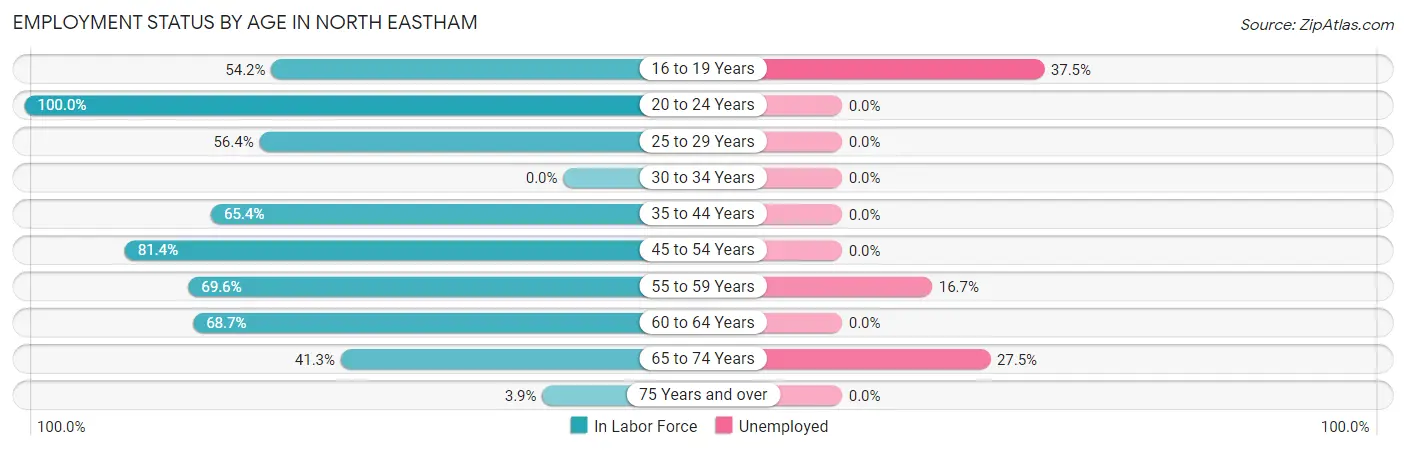
| Age Bracket | In Labor Force | Unemployed |
| 16 to 19 Years | 32 (54.2%) | 12 (37.5%) |
| 20 to 24 Years | 69 (100.0%) | 0 (0.0%) |
| 25 to 29 Years | 44 (56.4%) | 0 (0.0%) |
| 30 to 34 Years | 0 (0.0%) | 0 (0.0%) |
| 35 to 44 Years | 123 (65.4%) | 0 (0.0%) |
| 45 to 54 Years | 140 (81.4%) | 0 (0.0%) |
| 55 to 59 Years | 78 (69.6%) | 13 (16.7%) |
| 60 to 64 Years | 125 (68.7%) | 0 (0.0%) |
| 65 to 74 Years | 236 (41.3%) | 65 (27.5%) |
| 75 Years and over | 12 (3.9%) | 0 (0.0%) |
| Total | 859 (48.3%) | 90 (10.5%) |
Employment Status by Educational Attainment in North Eastham
According to labor force statistics for North Eastham, 66.3% of individuals (510) out of the total population between 25 and 64 years of age (769) are in the labor force, with 2.5% or 13 of them being unemployed. The group with the highest labor force participation rate are those with the educational attainment of high school diploma, with 71.6% or 116 individuals in the labor force. Within the labor force, individuals with college / associate degree education have the highest percentage of unemployment, with 7.9% or 13 of them being unemployed.
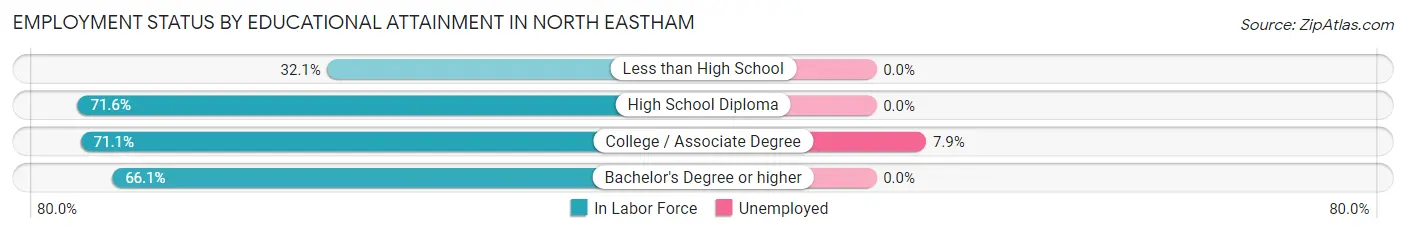
| Educational Attainment | In Labor Force | Unemployed |
| Less than High School | 18 (32.1%) | 0 (0.0%) |
| High School Diploma | 116 (71.6%) | 0 (0.0%) |
| College / Associate Degree | 165 (71.1%) | 18 (7.9%) |
| Bachelor's Degree or higher | 211 (66.1%) | 0 (0.0%) |
| Total | 510 (66.3%) | 19 (2.5%) |
Employment Occupations by Sex in North Eastham
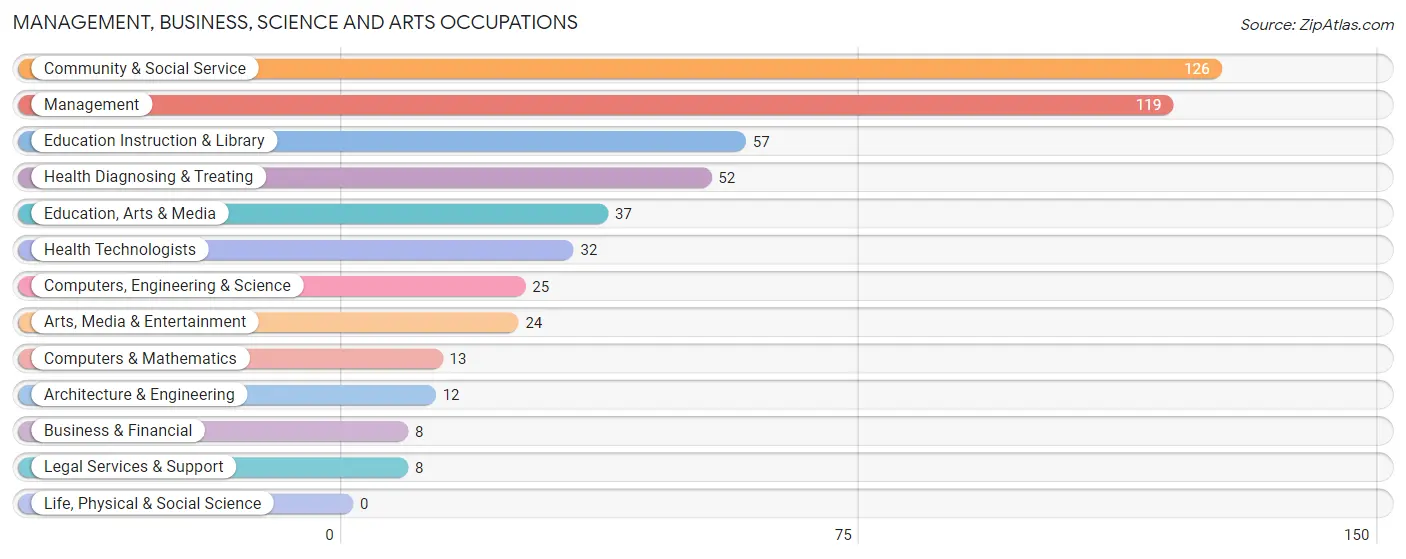
Management, Business, Science and Arts Occupations
The most common Management, Business, Science and Arts occupations in North Eastham are Community & Social Service (126 | 16.4%), Management (119 | 15.5%), Education Instruction & Library (57 | 7.4%), Health Diagnosing & Treating (52 | 6.8%), and Education, Arts & Media (37 | 4.8%).
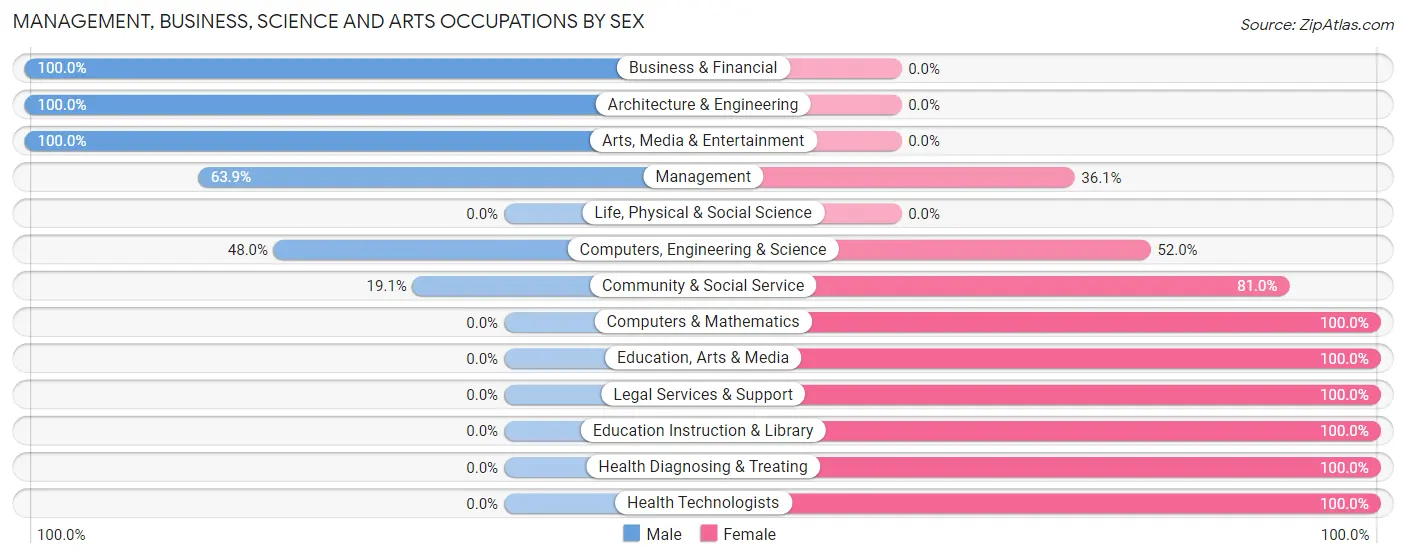
Management, Business, Science and Arts Occupations by Sex
Within the Management, Business, Science and Arts occupations in North Eastham, the most male-oriented occupations are Business & Financial (100.0%), Architecture & Engineering (100.0%), and Arts, Media & Entertainment (100.0%), while the most female-oriented occupations are Computers & Mathematics (100.0%), Education, Arts & Media (100.0%), and Legal Services & Support (100.0%).
| Occupation | Male | Female |
| Management | 76 (63.9%) | 43 (36.1%) |
| Business & Financial | 8 (100.0%) | 0 (0.0%) |
| Computers, Engineering & Science | 12 (48.0%) | 13 (52.0%) |
| Computers & Mathematics | 0 (0.0%) | 13 (100.0%) |
| Architecture & Engineering | 12 (100.0%) | 0 (0.0%) |
| Life, Physical & Social Science | 0 (0.0%) | 0 (0.0%) |
| Community & Social Service | 24 (19.1%) | 102 (80.9%) |
| Education, Arts & Media | 0 (0.0%) | 37 (100.0%) |
| Legal Services & Support | 0 (0.0%) | 8 (100.0%) |
| Education Instruction & Library | 0 (0.0%) | 57 (100.0%) |
| Arts, Media & Entertainment | 24 (100.0%) | 0 (0.0%) |
| Health Diagnosing & Treating | 0 (0.0%) | 52 (100.0%) |
| Health Technologists | 0 (0.0%) | 32 (100.0%) |
| Total (Category) | 120 (36.4%) | 210 (63.6%) |
| Total (Overall) | 375 (48.8%) | 394 (51.2%) |
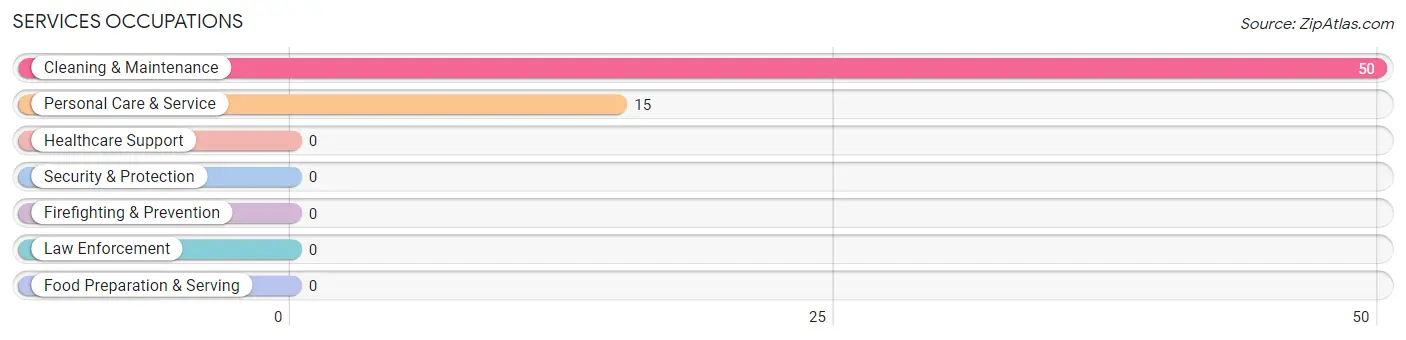
Services Occupations
The most common Services occupations in North Eastham are Cleaning & Maintenance (50 | 6.5%), and Personal Care & Service (15 | 1.9%).
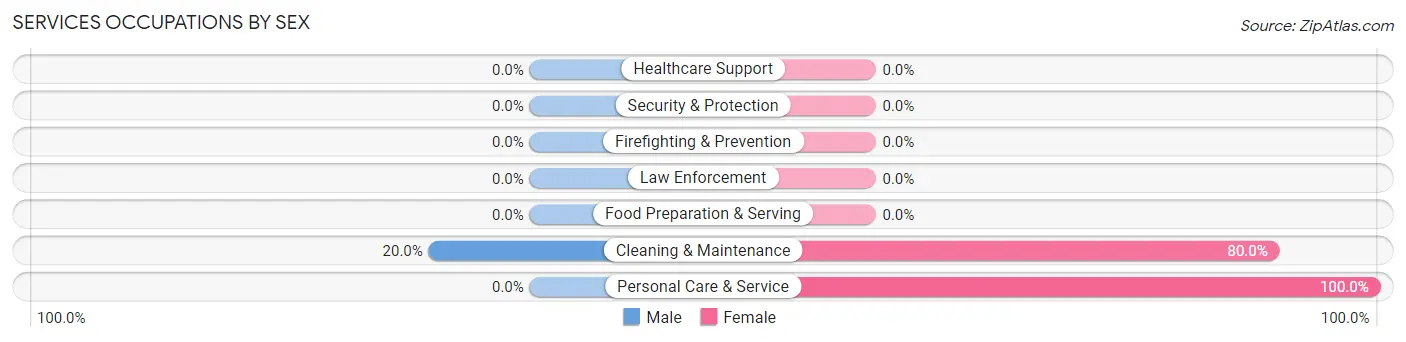
Services Occupations by Sex
| Occupation | Male | Female |
| Healthcare Support | 0 (0.0%) | 0 (0.0%) |
| Security & Protection | 0 (0.0%) | 0 (0.0%) |
| Firefighting & Prevention | 0 (0.0%) | 0 (0.0%) |
| Law Enforcement | 0 (0.0%) | 0 (0.0%) |
| Food Preparation & Serving | 0 (0.0%) | 0 (0.0%) |
| Cleaning & Maintenance | 10 (20.0%) | 40 (80.0%) |
| Personal Care & Service | 0 (0.0%) | 15 (100.0%) |
| Total (Category) | 10 (15.4%) | 55 (84.6%) |
| Total (Overall) | 375 (48.8%) | 394 (51.2%) |
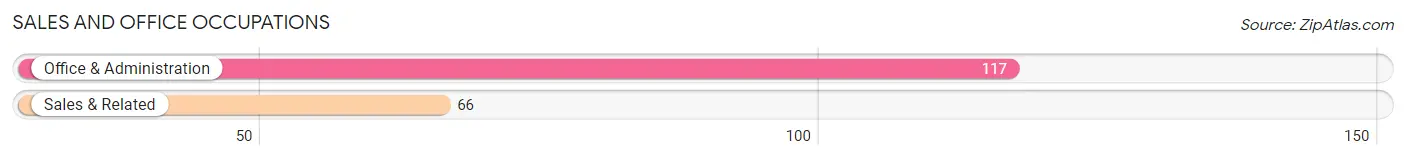
Sales and Office Occupations
The most common Sales and Office occupations in North Eastham are Office & Administration (117 | 15.2%), and Sales & Related (66 | 8.6%).
Sales and Office Occupations by Sex
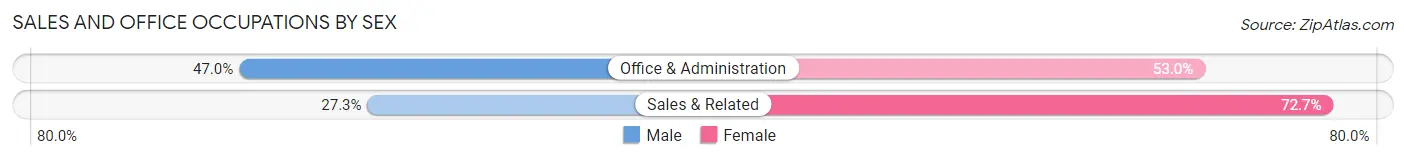
| Occupation | Male | Female |
| Sales & Related | 18 (27.3%) | 48 (72.7%) |
| Office & Administration | 55 (47.0%) | 62 (53.0%) |
| Total (Category) | 73 (39.9%) | 110 (60.1%) |
| Total (Overall) | 375 (48.8%) | 394 (51.2%) |
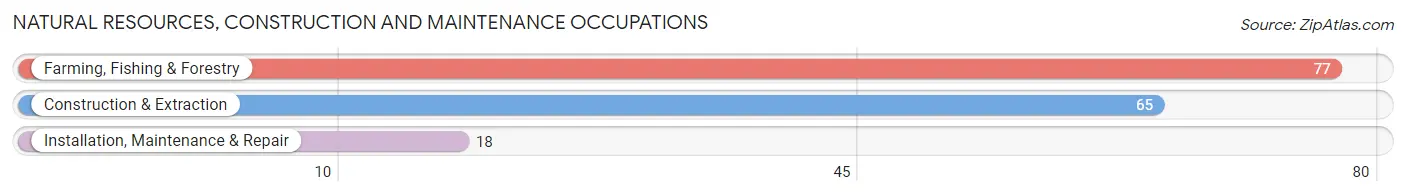
Natural Resources, Construction and Maintenance Occupations
The most common Natural Resources, Construction and Maintenance occupations in North Eastham are Farming, Fishing & Forestry (77 | 10.0%), Construction & Extraction (65 | 8.5%), and Installation, Maintenance & Repair (18 | 2.3%).
Natural Resources, Construction and Maintenance Occupations by Sex
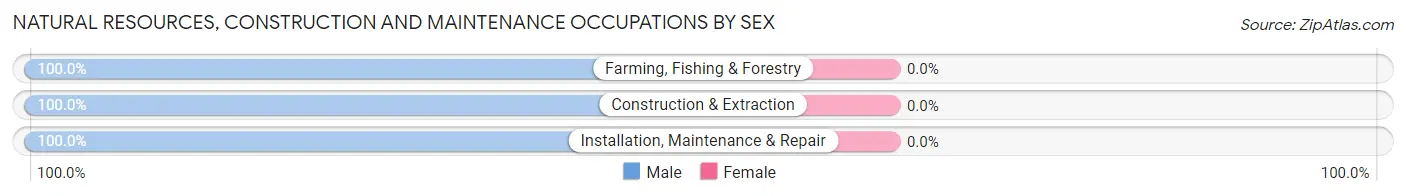
| Occupation | Male | Female |
| Farming, Fishing & Forestry | 77 (100.0%) | 0 (0.0%) |
| Construction & Extraction | 65 (100.0%) | 0 (0.0%) |
| Installation, Maintenance & Repair | 18 (100.0%) | 0 (0.0%) |
| Total (Category) | 160 (100.0%) | 0 (0.0%) |
| Total (Overall) | 375 (48.8%) | 394 (51.2%) |
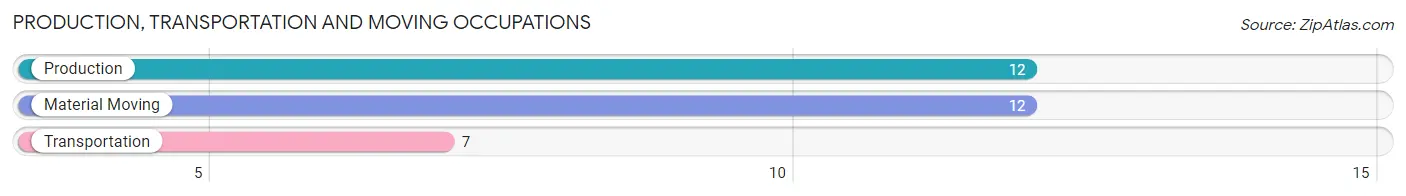
Production, Transportation and Moving Occupations
The most common Production, Transportation and Moving occupations in North Eastham are Production (12 | 1.6%), Material Moving (12 | 1.6%), and Transportation (7 | 0.9%).
Production, Transportation and Moving Occupations by Sex
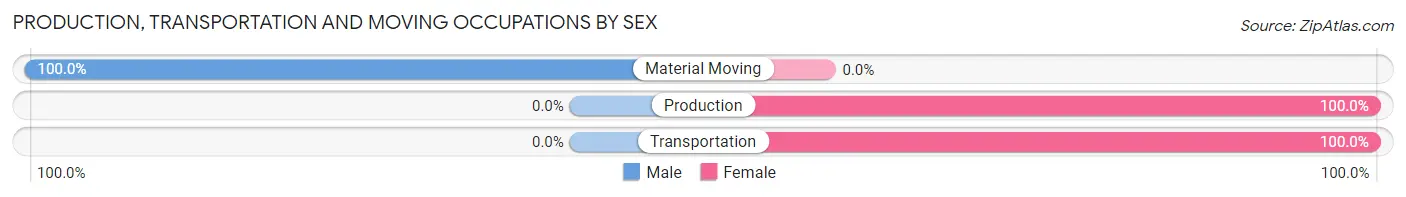
| Occupation | Male | Female |
| Production | 0 (0.0%) | 12 (100.0%) |
| Transportation | 0 (0.0%) | 7 (100.0%) |
| Material Moving | 12 (100.0%) | 0 (0.0%) |
| Total (Category) | 12 (38.7%) | 19 (61.3%) |
| Total (Overall) | 375 (48.8%) | 394 (51.2%) |
Employment Industries by Sex in North Eastham
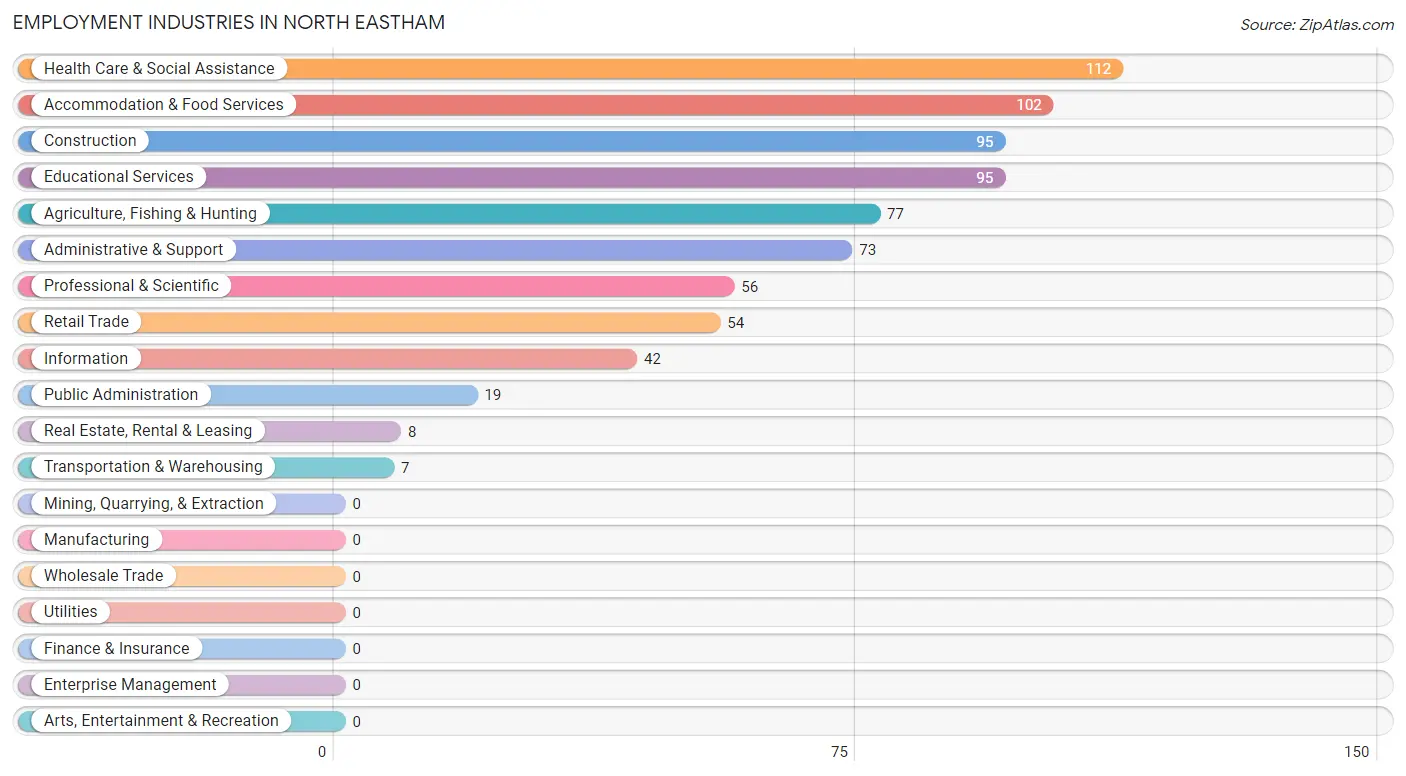
Employment Industries in North Eastham
The major employment industries in North Eastham include Health Care & Social Assistance (112 | 14.6%), Accommodation & Food Services (102 | 13.3%), Construction (95 | 12.3%), Educational Services (95 | 12.3%), and Agriculture, Fishing & Hunting (77 | 10.0%).
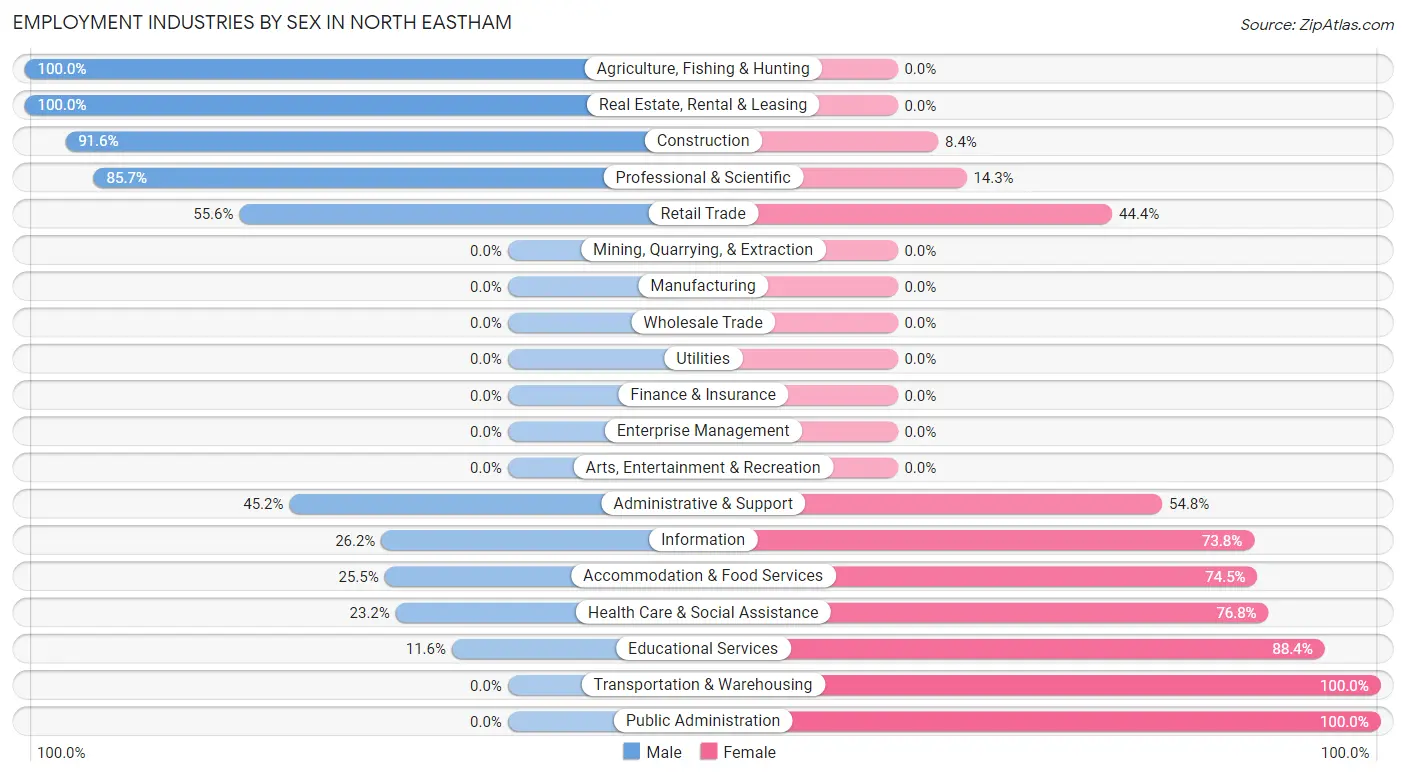
Employment Industries by Sex in North Eastham
The North Eastham industries that see more men than women are Agriculture, Fishing & Hunting (100.0%), Real Estate, Rental & Leasing (100.0%), and Construction (91.6%), whereas the industries that tend to have a higher number of women are Transportation & Warehousing (100.0%), Public Administration (100.0%), and Educational Services (88.4%).
| Industry | Male | Female |
| Agriculture, Fishing & Hunting | 77 (100.0%) | 0 (0.0%) |
| Mining, Quarrying, & Extraction | 0 (0.0%) | 0 (0.0%) |
| Construction | 87 (91.6%) | 8 (8.4%) |
| Manufacturing | 0 (0.0%) | 0 (0.0%) |
| Wholesale Trade | 0 (0.0%) | 0 (0.0%) |
| Retail Trade | 30 (55.6%) | 24 (44.4%) |
| Transportation & Warehousing | 0 (0.0%) | 7 (100.0%) |
| Utilities | 0 (0.0%) | 0 (0.0%) |
| Information | 11 (26.2%) | 31 (73.8%) |
| Finance & Insurance | 0 (0.0%) | 0 (0.0%) |
| Real Estate, Rental & Leasing | 8 (100.0%) | 0 (0.0%) |
| Professional & Scientific | 48 (85.7%) | 8 (14.3%) |
| Enterprise Management | 0 (0.0%) | 0 (0.0%) |
| Administrative & Support | 33 (45.2%) | 40 (54.8%) |
| Educational Services | 11 (11.6%) | 84 (88.4%) |
| Health Care & Social Assistance | 26 (23.2%) | 86 (76.8%) |
| Arts, Entertainment & Recreation | 0 (0.0%) | 0 (0.0%) |
| Accommodation & Food Services | 26 (25.5%) | 76 (74.5%) |
| Public Administration | 0 (0.0%) | 19 (100.0%) |
| Total | 375 (48.8%) | 394 (51.2%) |
Education in North Eastham
School Enrollment in North Eastham
The most common levels of schooling among the 191 students in North Eastham are high school (68 | 35.6%), nursery / preschool (49 | 25.7%), and elementary school (29 | 15.2%).
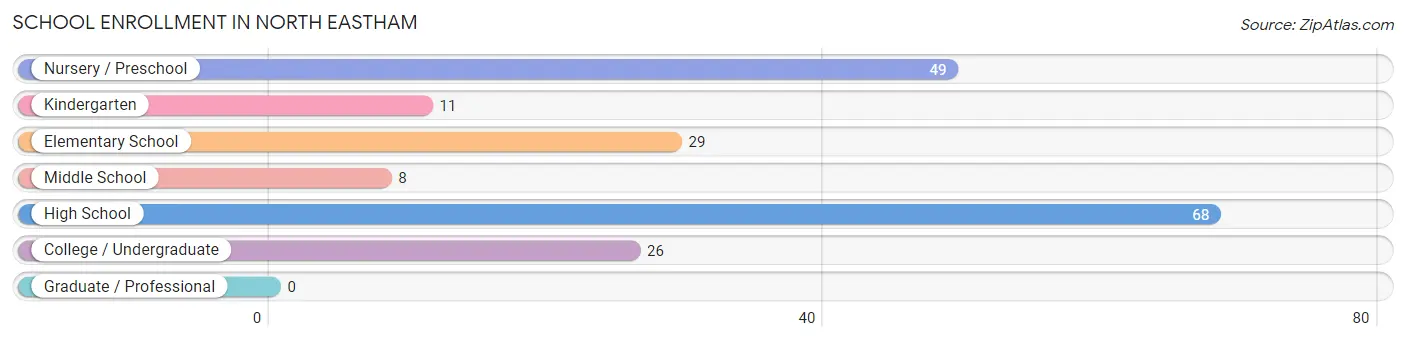
| School Level | # Students | % Students |
| Nursery / Preschool | 49 | 25.7% |
| Kindergarten | 11 | 5.8% |
| Elementary School | 29 | 15.2% |
| Middle School | 8 | 4.2% |
| High School | 68 | 35.6% |
| College / Undergraduate | 26 | 13.6% |
| Graduate / Professional | 0 | 0.0% |
| Total | 191 | 100.0% |
School Enrollment by Age by Funding Source in North Eastham
Out of a total of 191 students who are enrolled in schools in North Eastham, 51 (26.7%) attend a private institution, while the remaining 140 (73.3%) are enrolled in public schools. The age group of 35 years and over has the highest likelihood of being enrolled in private schools, with 11 (57.9% in the age bracket) enrolled. Conversely, the age group of 3 to 4 year olds has the lowest likelihood of being enrolled in a private school, with 9 (100.0% in the age bracket) attending a public institution.
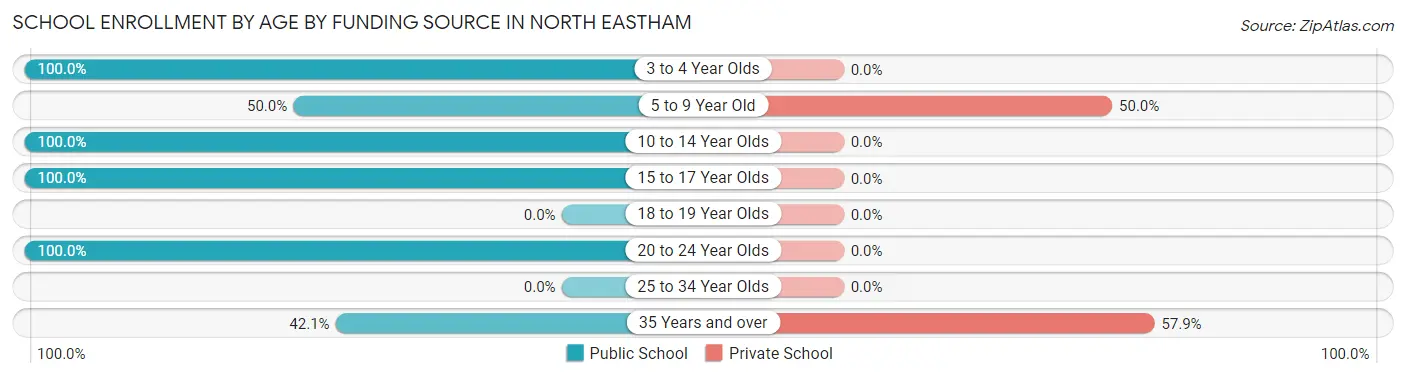
| Age Bracket | Public School | Private School |
| 3 to 4 Year Olds | 9 (100.0%) | 0 (0.0%) |
| 5 to 9 Year Old | 40 (50.0%) | 40 (50.0%) |
| 10 to 14 Year Olds | 8 (100.0%) | 0 (0.0%) |
| 15 to 17 Year Olds | 60 (100.0%) | 0 (0.0%) |
| 18 to 19 Year Olds | 0 (0.0%) | 0 (0.0%) |
| 20 to 24 Year Olds | 15 (100.0%) | 0 (0.0%) |
| 25 to 34 Year Olds | 0 (0.0%) | 0 (0.0%) |
| 35 Years and over | 8 (42.1%) | 11 (57.9%) |
| Total | 140 (73.3%) | 51 (26.7%) |
Educational Attainment by Field of Study in North Eastham
Education (138 | 15.2%), engineering (117 | 12.9%), literature & languages (111 | 12.2%), science & technology (106 | 11.7%), and business (103 | 11.3%) are the most common fields of study among 910 individuals in North Eastham who have obtained a bachelor's degree or higher.
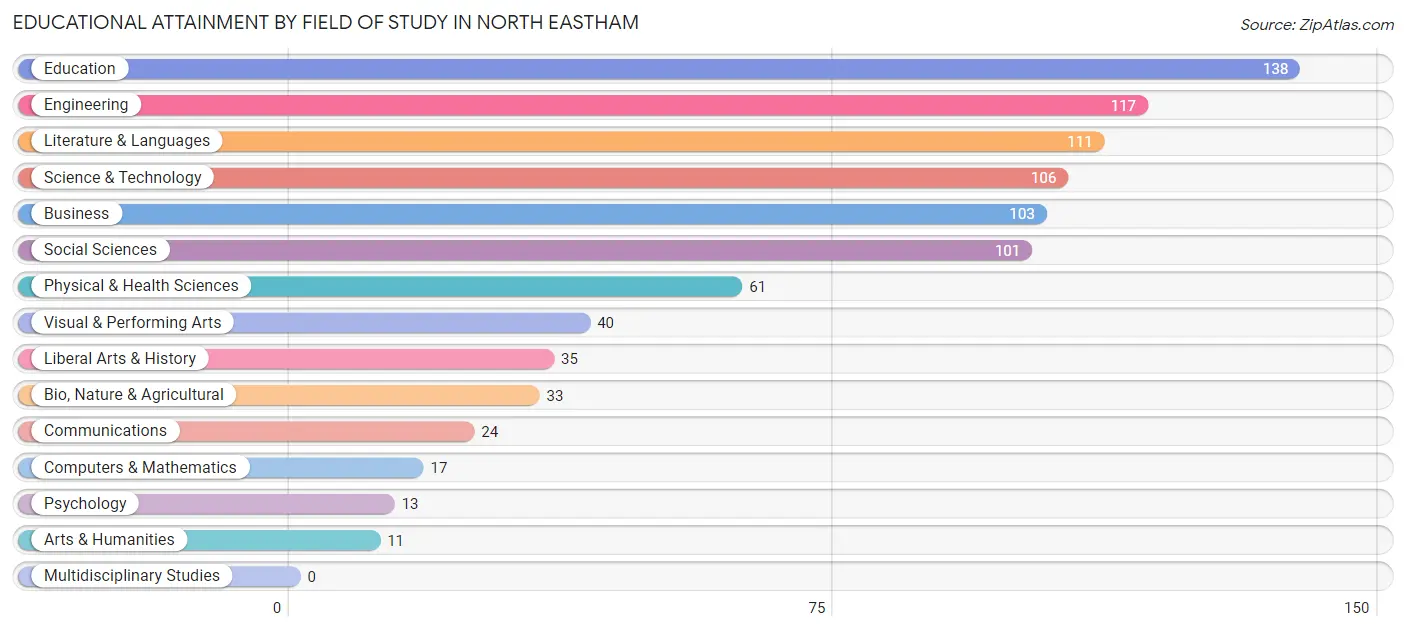
| Field of Study | # Graduates | % Graduates |
| Computers & Mathematics | 17 | 1.9% |
| Bio, Nature & Agricultural | 33 | 3.6% |
| Physical & Health Sciences | 61 | 6.7% |
| Psychology | 13 | 1.4% |
| Social Sciences | 101 | 11.1% |
| Engineering | 117 | 12.9% |
| Multidisciplinary Studies | 0 | 0.0% |
| Science & Technology | 106 | 11.7% |
| Business | 103 | 11.3% |
| Education | 138 | 15.2% |
| Literature & Languages | 111 | 12.2% |
| Liberal Arts & History | 35 | 3.8% |
| Visual & Performing Arts | 40 | 4.4% |
| Communications | 24 | 2.6% |
| Arts & Humanities | 11 | 1.2% |
| Total | 910 | 100.0% |
Transportation & Commute in North Eastham
Vehicle Availability by Sex in North Eastham
The most prevalent vehicle ownership categories in North Eastham are males with 2 vehicles (232, accounting for 61.9%) and females with 2 vehicles (100, making up 60.9%).
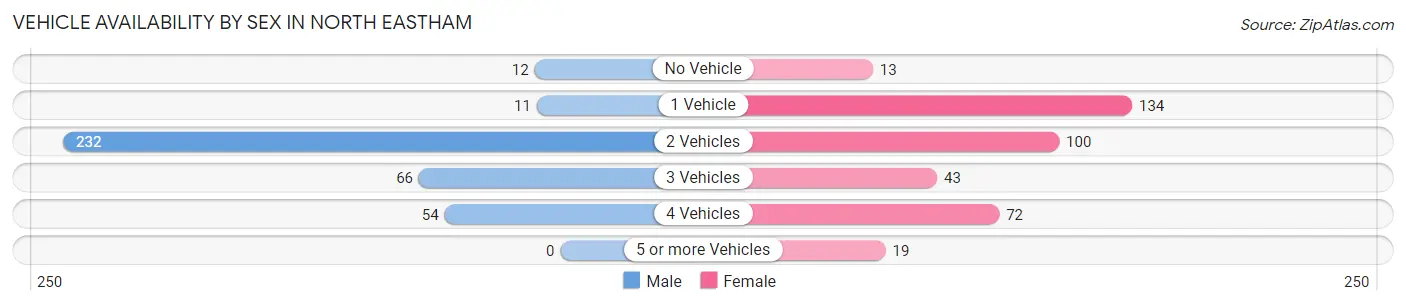
| Vehicles Available | Male | Female |
| No Vehicle | 12 (3.2%) | 13 (3.4%) |
| 1 Vehicle | 11 (2.9%) | 134 (35.2%) |
| 2 Vehicles | 232 (61.9%) | 100 (26.3%) |
| 3 Vehicles | 66 (17.6%) | 43 (11.3%) |
| 4 Vehicles | 54 (14.4%) | 72 (18.9%) |
| 5 or more Vehicles | 0 (0.0%) | 19 (5.0%) |
| Total | 375 (100.0%) | 381 (100.0%) |
Commute Time in North Eastham
The most frequently occuring commute durations in North Eastham are 20 to 24 minutes (133 commuters, 19.0%), 30 to 34 minutes (102 commuters, 14.5%), and 15 to 19 minutes (91 commuters, 13.0%).
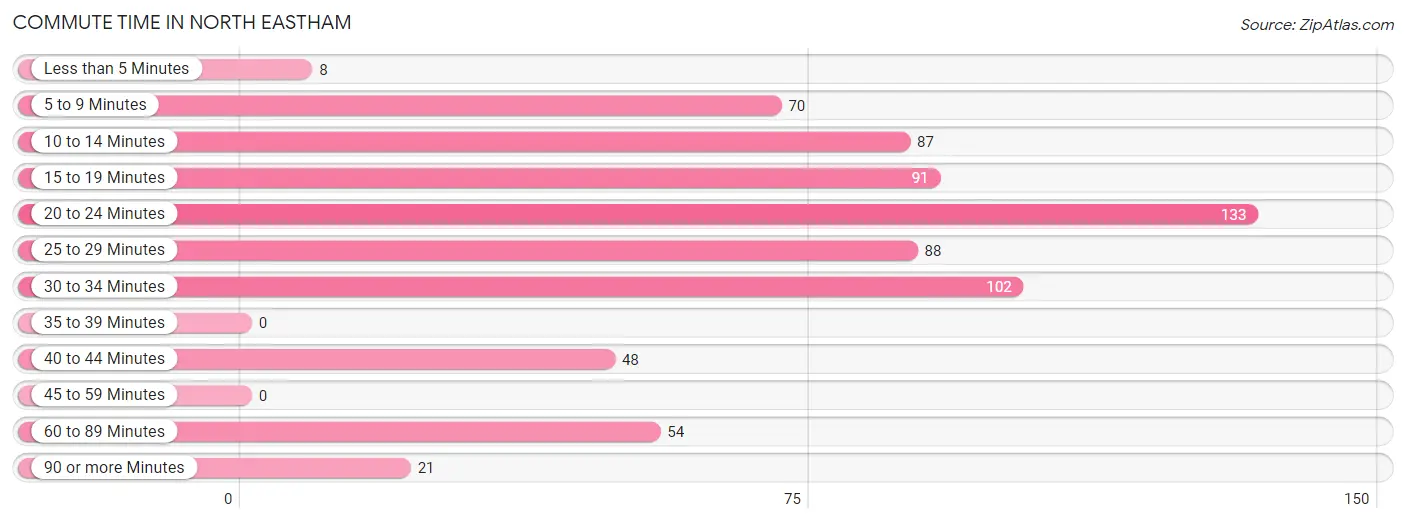
| Commute Time | # Commuters | % Commuters |
| Less than 5 Minutes | 8 | 1.1% |
| 5 to 9 Minutes | 70 | 10.0% |
| 10 to 14 Minutes | 87 | 12.4% |
| 15 to 19 Minutes | 91 | 13.0% |
| 20 to 24 Minutes | 133 | 19.0% |
| 25 to 29 Minutes | 88 | 12.5% |
| 30 to 34 Minutes | 102 | 14.5% |
| 35 to 39 Minutes | 0 | 0.0% |
| 40 to 44 Minutes | 48 | 6.8% |
| 45 to 59 Minutes | 0 | 0.0% |
| 60 to 89 Minutes | 54 | 7.7% |
| 90 or more Minutes | 21 | 3.0% |
Commute Time by Sex in North Eastham
The most common commute times in North Eastham are 30 to 34 minutes (61 commuters, 18.2%) for males and 20 to 24 minutes (86 commuters, 23.4%) for females.
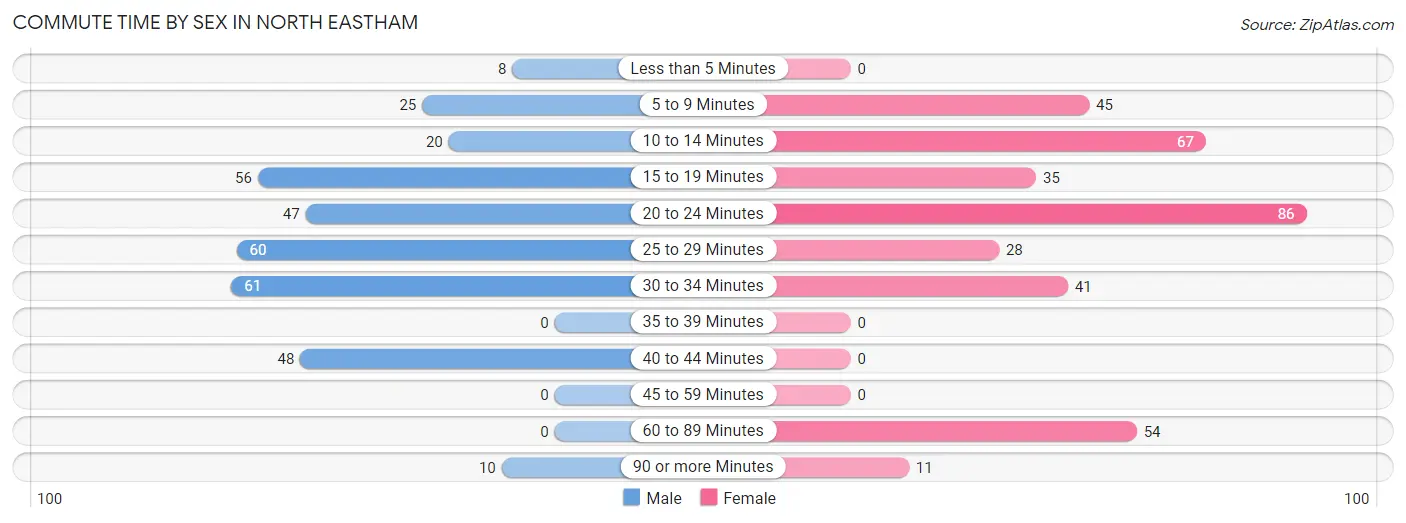
| Commute Time | Male | Female |
| Less than 5 Minutes | 8 (2.4%) | 0 (0.0%) |
| 5 to 9 Minutes | 25 (7.5%) | 45 (12.3%) |
| 10 to 14 Minutes | 20 (6.0%) | 67 (18.3%) |
| 15 to 19 Minutes | 56 (16.7%) | 35 (9.5%) |
| 20 to 24 Minutes | 47 (14.0%) | 86 (23.4%) |
| 25 to 29 Minutes | 60 (17.9%) | 28 (7.6%) |
| 30 to 34 Minutes | 61 (18.2%) | 41 (11.2%) |
| 35 to 39 Minutes | 0 (0.0%) | 0 (0.0%) |
| 40 to 44 Minutes | 48 (14.3%) | 0 (0.0%) |
| 45 to 59 Minutes | 0 (0.0%) | 0 (0.0%) |
| 60 to 89 Minutes | 0 (0.0%) | 54 (14.7%) |
| 90 or more Minutes | 10 (3.0%) | 11 (3.0%) |
Time of Departure to Work by Sex in North Eastham
The most frequent times of departure to work in North Eastham are 7:00 AM to 7:29 AM (89, 26.6%) for males and 7:30 AM to 7:59 AM (83, 22.6%) for females.
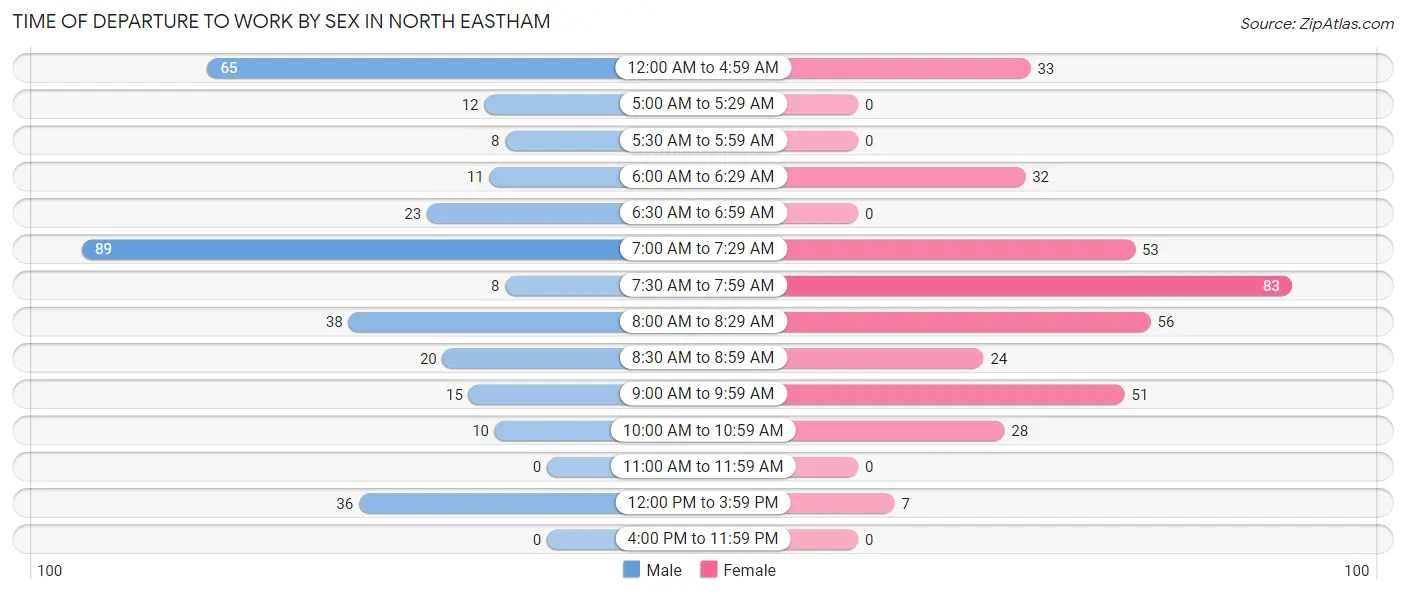
| Time of Departure | Male | Female |
| 12:00 AM to 4:59 AM | 65 (19.4%) | 33 (9.0%) |
| 5:00 AM to 5:29 AM | 12 (3.6%) | 0 (0.0%) |
| 5:30 AM to 5:59 AM | 8 (2.4%) | 0 (0.0%) |
| 6:00 AM to 6:29 AM | 11 (3.3%) | 32 (8.7%) |
| 6:30 AM to 6:59 AM | 23 (6.9%) | 0 (0.0%) |
| 7:00 AM to 7:29 AM | 89 (26.6%) | 53 (14.4%) |
| 7:30 AM to 7:59 AM | 8 (2.4%) | 83 (22.6%) |
| 8:00 AM to 8:29 AM | 38 (11.3%) | 56 (15.3%) |
| 8:30 AM to 8:59 AM | 20 (6.0%) | 24 (6.5%) |
| 9:00 AM to 9:59 AM | 15 (4.5%) | 51 (13.9%) |
| 10:00 AM to 10:59 AM | 10 (3.0%) | 28 (7.6%) |
| 11:00 AM to 11:59 AM | 0 (0.0%) | 0 (0.0%) |
| 12:00 PM to 3:59 PM | 36 (10.7%) | 7 (1.9%) |
| 4:00 PM to 11:59 PM | 0 (0.0%) | 0 (0.0%) |
| Total | 335 (100.0%) | 367 (100.0%) |
Housing Occupancy in North Eastham
Occupancy by Ownership in North Eastham
Of the total 928 dwellings in North Eastham, owner-occupied units account for 837 (90.2%), while renter-occupied units make up 91 (9.8%).
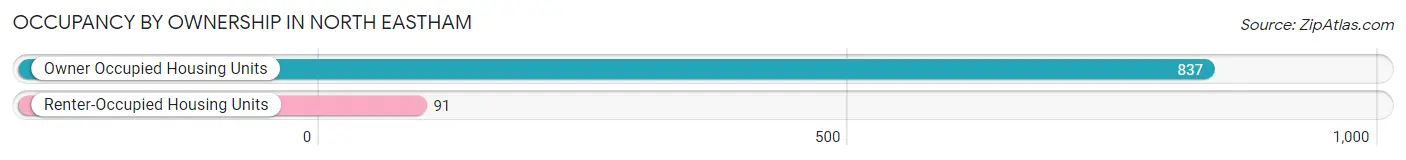
| Occupancy | # Housing Units | % Housing Units |
| Owner Occupied Housing Units | 837 | 90.2% |
| Renter-Occupied Housing Units | 91 | 9.8% |
| Total Occupied Housing Units | 928 | 100.0% |
Occupancy by Household Size in North Eastham
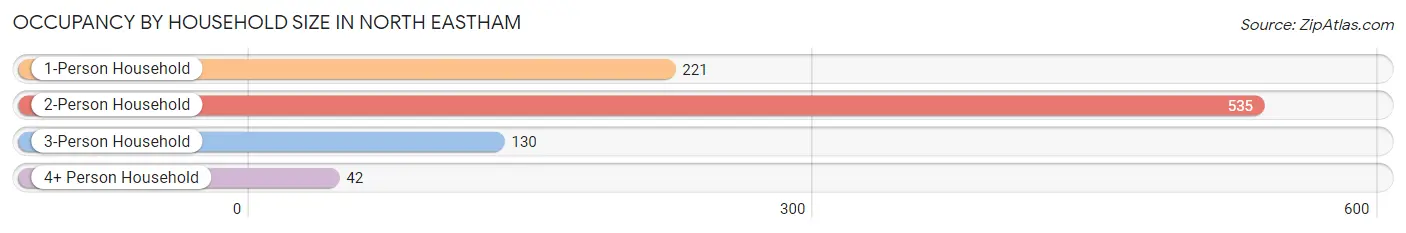
| Household Size | # Housing Units | % Housing Units |
| 1-Person Household | 221 | 23.8% |
| 2-Person Household | 535 | 57.7% |
| 3-Person Household | 130 | 14.0% |
| 4+ Person Household | 42 | 4.5% |
| Total Housing Units | 928 | 100.0% |
Occupancy by Ownership by Household Size in North Eastham
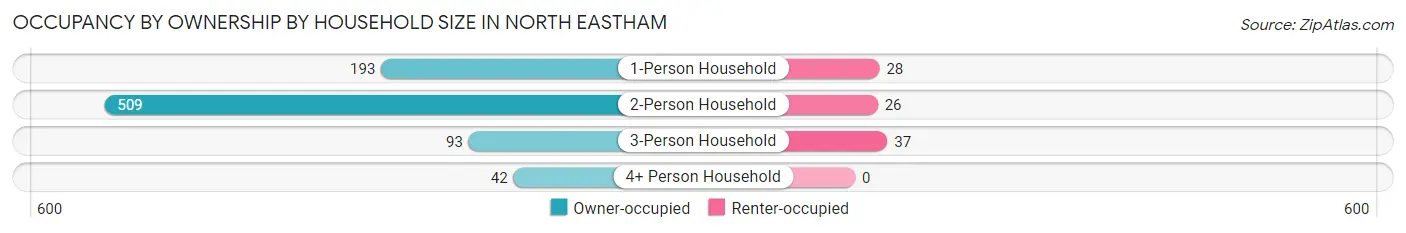
| Household Size | Owner-occupied | Renter-occupied |
| 1-Person Household | 193 (87.3%) | 28 (12.7%) |
| 2-Person Household | 509 (95.1%) | 26 (4.9%) |
| 3-Person Household | 93 (71.5%) | 37 (28.5%) |
| 4+ Person Household | 42 (100.0%) | 0 (0.0%) |
| Total Housing Units | 837 (90.2%) | 91 (9.8%) |
Occupancy by Educational Attainment in North Eastham
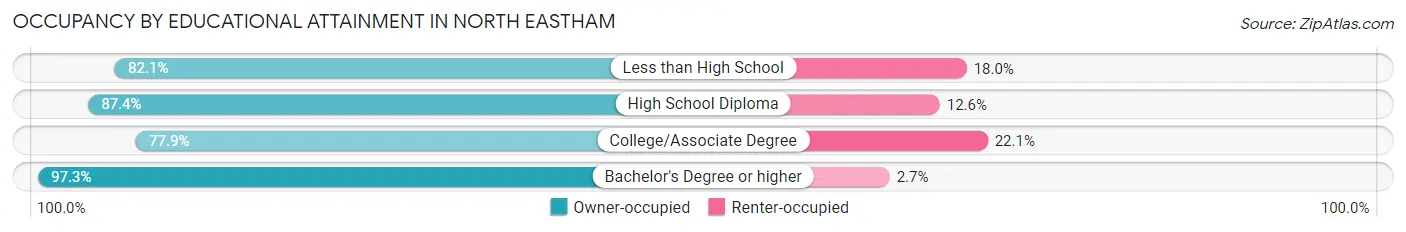
| Household Size | Owner-occupied | Renter-occupied |
| Less than High School | 64 (82.1%) | 14 (17.9%) |
| High School Diploma | 90 (87.4%) | 13 (12.6%) |
| College/Associate Degree | 176 (77.9%) | 50 (22.1%) |
| Bachelor's Degree or higher | 507 (97.3%) | 14 (2.7%) |
Occupancy by Age of Householder in North Eastham
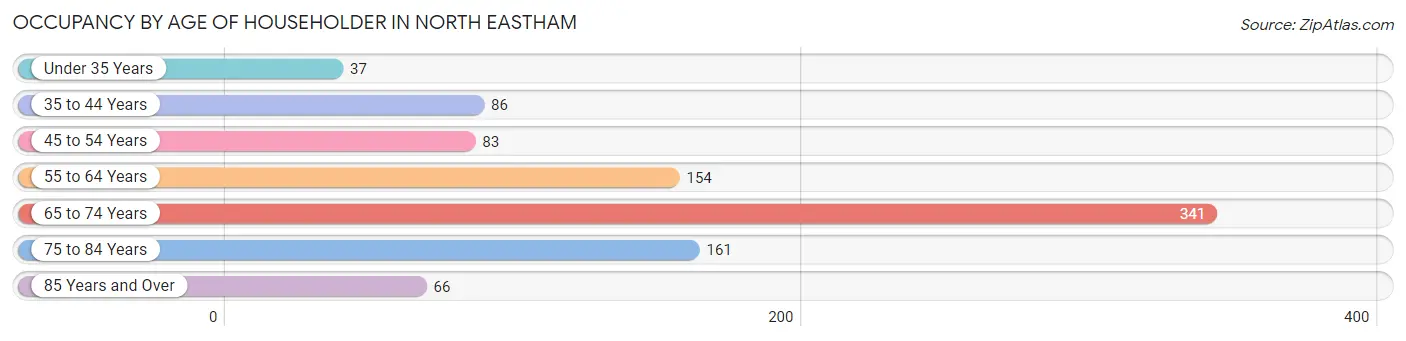
| Age Bracket | # Households | % Households |
| Under 35 Years | 37 | 4.0% |
| 35 to 44 Years | 86 | 9.3% |
| 45 to 54 Years | 83 | 8.9% |
| 55 to 64 Years | 154 | 16.6% |
| 65 to 74 Years | 341 | 36.7% |
| 75 to 84 Years | 161 | 17.3% |
| 85 Years and Over | 66 | 7.1% |
| Total | 928 | 100.0% |
Housing Finances in North Eastham
Median Income by Occupancy in North Eastham
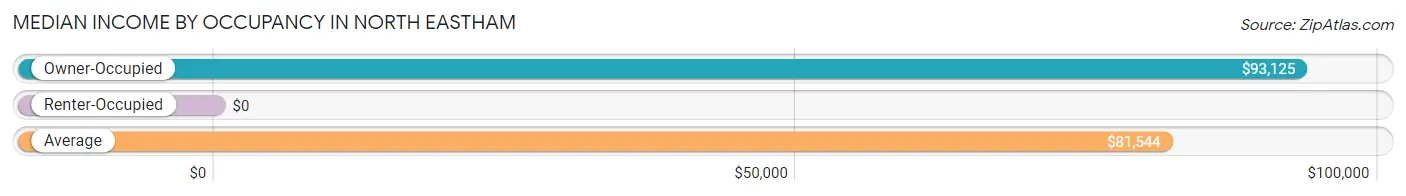
| Occupancy Type | # Households | Median Income |
| Owner-Occupied | 837 (90.2%) | $93,125 |
| Renter-Occupied | 91 (9.8%) | $0 |
| Average | 928 (100.0%) | $81,544 |
Occupancy by Householder Income Bracket in North Eastham
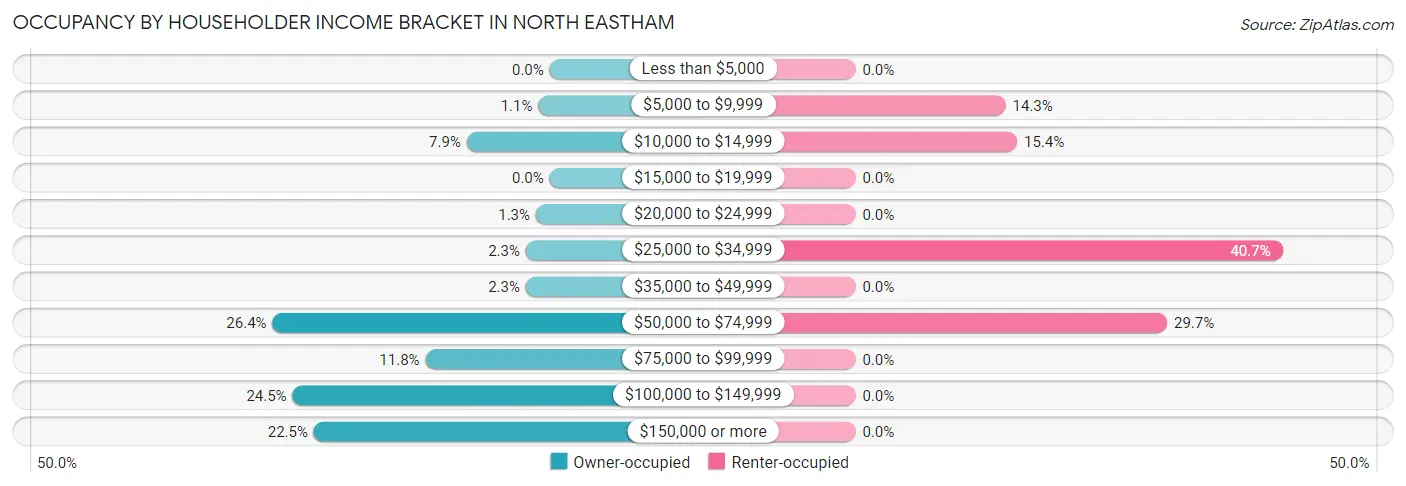
| Income Bracket | Owner-occupied | Renter-occupied |
| Less than $5,000 | 0 (0.0%) | 0 (0.0%) |
| $5,000 to $9,999 | 9 (1.1%) | 13 (14.3%) |
| $10,000 to $14,999 | 66 (7.9%) | 14 (15.4%) |
| $15,000 to $19,999 | 0 (0.0%) | 0 (0.0%) |
| $20,000 to $24,999 | 11 (1.3%) | 0 (0.0%) |
| $25,000 to $34,999 | 19 (2.3%) | 37 (40.7%) |
| $35,000 to $49,999 | 19 (2.3%) | 0 (0.0%) |
| $50,000 to $74,999 | 221 (26.4%) | 27 (29.7%) |
| $75,000 to $99,999 | 99 (11.8%) | 0 (0.0%) |
| $100,000 to $149,999 | 205 (24.5%) | 0 (0.0%) |
| $150,000 or more | 188 (22.5%) | 0 (0.0%) |
| Total | 837 (100.0%) | 91 (100.0%) |
Monthly Housing Cost Tiers in North Eastham
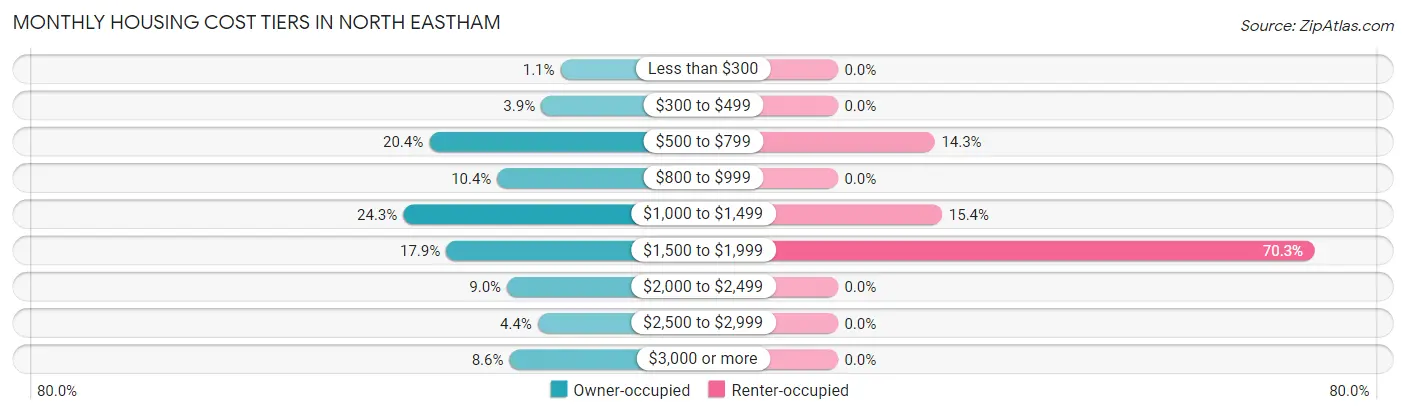
| Monthly Cost | Owner-occupied | Renter-occupied |
| Less than $300 | 9 (1.1%) | 0 (0.0%) |
| $300 to $499 | 33 (3.9%) | 0 (0.0%) |
| $500 to $799 | 171 (20.4%) | 13 (14.3%) |
| $800 to $999 | 87 (10.4%) | 0 (0.0%) |
| $1,000 to $1,499 | 203 (24.2%) | 14 (15.4%) |
| $1,500 to $1,999 | 150 (17.9%) | 64 (70.3%) |
| $2,000 to $2,499 | 75 (9.0%) | 0 (0.0%) |
| $2,500 to $2,999 | 37 (4.4%) | 0 (0.0%) |
| $3,000 or more | 72 (8.6%) | 0 (0.0%) |
| Total | 837 (100.0%) | 91 (100.0%) |
Physical Housing Characteristics in North Eastham
Housing Structures in North Eastham
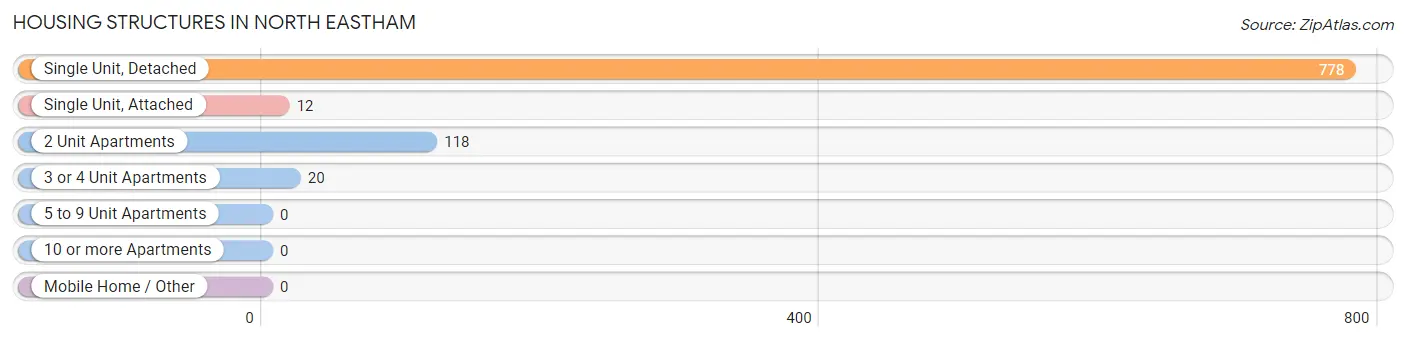
| Structure Type | # Housing Units | % Housing Units |
| Single Unit, Detached | 778 | 83.8% |
| Single Unit, Attached | 12 | 1.3% |
| 2 Unit Apartments | 118 | 12.7% |
| 3 or 4 Unit Apartments | 20 | 2.2% |
| 5 to 9 Unit Apartments | 0 | 0.0% |
| 10 or more Apartments | 0 | 0.0% |
| Mobile Home / Other | 0 | 0.0% |
| Total | 928 | 100.0% |
Housing Structures by Occupancy in North Eastham
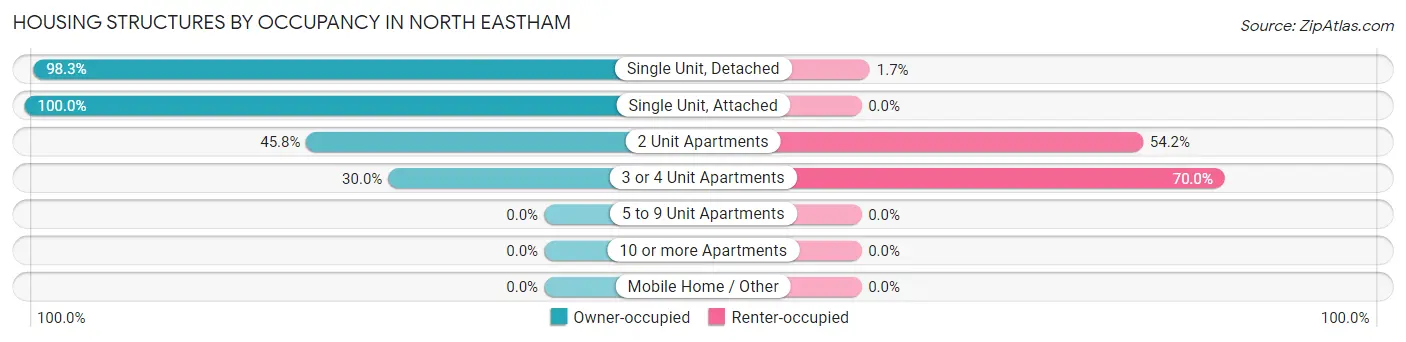
| Structure Type | Owner-occupied | Renter-occupied |
| Single Unit, Detached | 765 (98.3%) | 13 (1.7%) |
| Single Unit, Attached | 12 (100.0%) | 0 (0.0%) |
| 2 Unit Apartments | 54 (45.8%) | 64 (54.2%) |
| 3 or 4 Unit Apartments | 6 (30.0%) | 14 (70.0%) |
| 5 to 9 Unit Apartments | 0 (0.0%) | 0 (0.0%) |
| 10 or more Apartments | 0 (0.0%) | 0 (0.0%) |
| Mobile Home / Other | 0 (0.0%) | 0 (0.0%) |
| Total | 837 (90.2%) | 91 (9.8%) |
Housing Structures by Number of Rooms in North Eastham
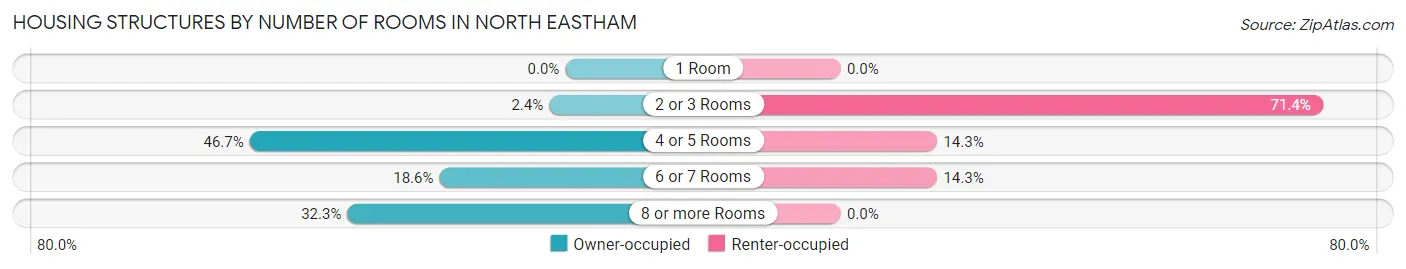
| Number of Rooms | Owner-occupied | Renter-occupied |
| 1 Room | 0 (0.0%) | 0 (0.0%) |
| 2 or 3 Rooms | 20 (2.4%) | 65 (71.4%) |
| 4 or 5 Rooms | 391 (46.7%) | 13 (14.3%) |
| 6 or 7 Rooms | 156 (18.6%) | 13 (14.3%) |
| 8 or more Rooms | 270 (32.3%) | 0 (0.0%) |
| Total | 837 (100.0%) | 91 (100.0%) |
Housing Structure by Heating Type in North Eastham
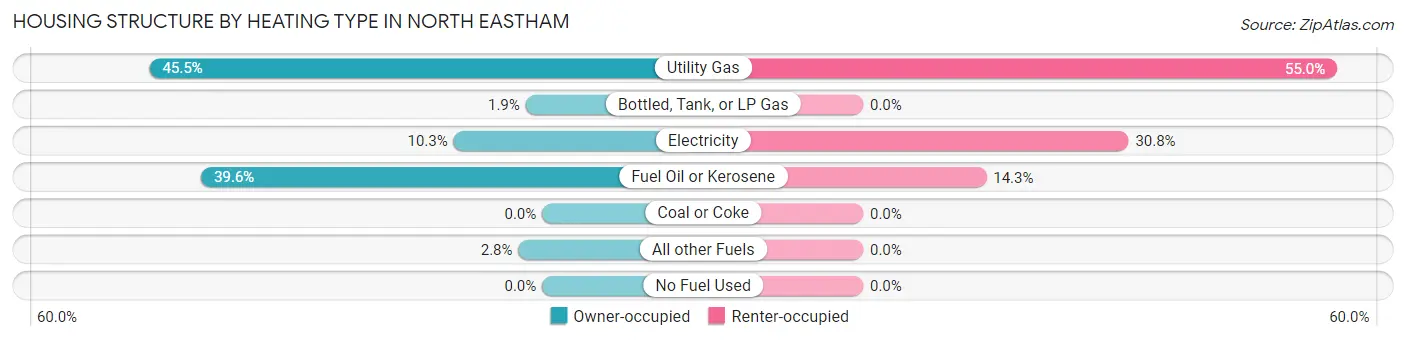
| Heating Type | Owner-occupied | Renter-occupied |
| Utility Gas | 381 (45.5%) | 50 (54.9%) |
| Bottled, Tank, or LP Gas | 16 (1.9%) | 0 (0.0%) |
| Electricity | 86 (10.3%) | 28 (30.8%) |
| Fuel Oil or Kerosene | 331 (39.6%) | 13 (14.3%) |
| Coal or Coke | 0 (0.0%) | 0 (0.0%) |
| All other Fuels | 23 (2.8%) | 0 (0.0%) |
| No Fuel Used | 0 (0.0%) | 0 (0.0%) |
| Total | 837 (100.0%) | 91 (100.0%) |
Household Vehicle Usage in North Eastham
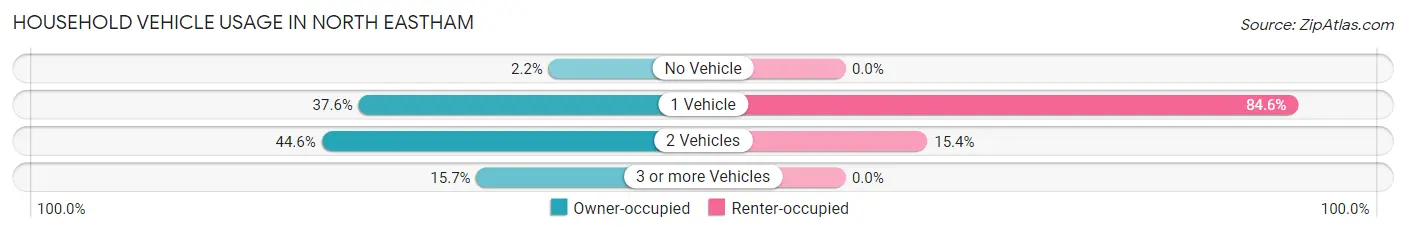
| Vehicles per Household | Owner-occupied | Renter-occupied |
| No Vehicle | 18 (2.1%) | 0 (0.0%) |
| 1 Vehicle | 315 (37.6%) | 77 (84.6%) |
| 2 Vehicles | 373 (44.6%) | 14 (15.4%) |
| 3 or more Vehicles | 131 (15.7%) | 0 (0.0%) |
| Total | 837 (100.0%) | 91 (100.0%) |
Real Estate & Mortgages in North Eastham
Real Estate and Mortgage Overview in North Eastham
| Characteristic | Without Mortgage | With Mortgage |
| Housing Units | 386 | 451 |
| Median Property Value | $723,400 | $482,700 |
| Median Household Income | $110,000 | $92 |
| Monthly Housing Costs | $864 | $72 |
| Real Estate Taxes | $5,448 | $0 |
Property Value by Mortgage Status in North Eastham
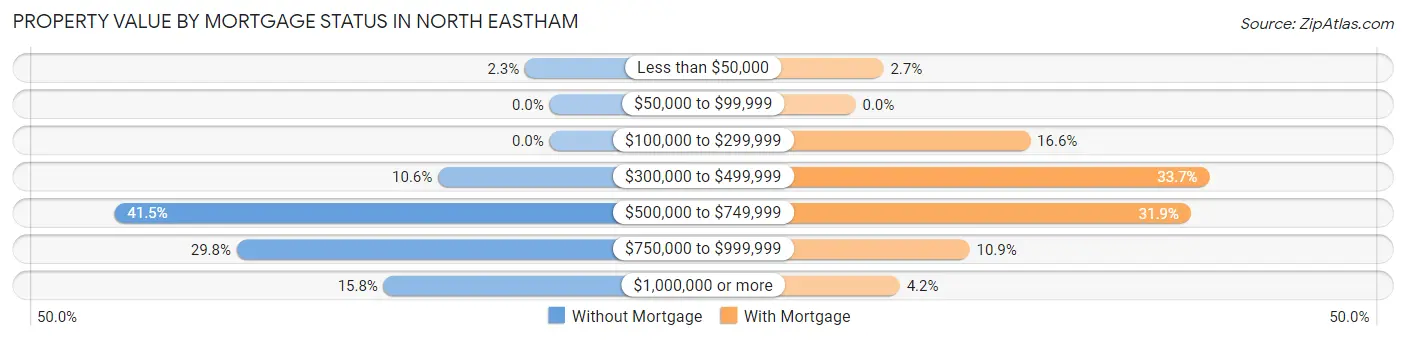
| Property Value | Without Mortgage | With Mortgage |
| Less than $50,000 | 9 (2.3%) | 12 (2.7%) |
| $50,000 to $99,999 | 0 (0.0%) | 0 (0.0%) |
| $100,000 to $299,999 | 0 (0.0%) | 75 (16.6%) |
| $300,000 to $499,999 | 41 (10.6%) | 152 (33.7%) |
| $500,000 to $749,999 | 160 (41.4%) | 144 (31.9%) |
| $750,000 to $999,999 | 115 (29.8%) | 49 (10.9%) |
| $1,000,000 or more | 61 (15.8%) | 19 (4.2%) |
| Total | 386 (100.0%) | 451 (100.0%) |
Household Income by Mortgage Status in North Eastham
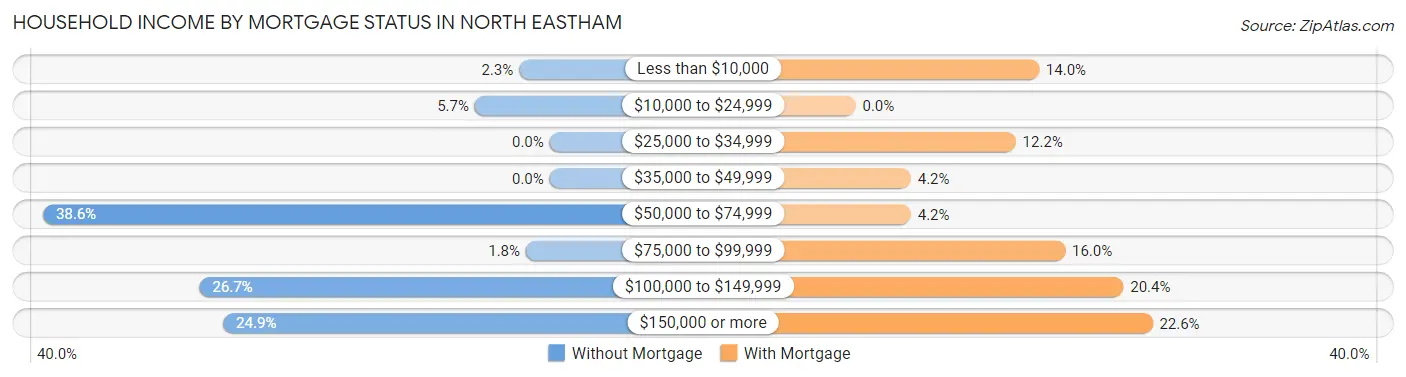
| Household Income | Without Mortgage | With Mortgage |
| Less than $10,000 | 9 (2.3%) | 63 (14.0%) |
| $10,000 to $24,999 | 22 (5.7%) | 0 (0.0%) |
| $25,000 to $34,999 | 0 (0.0%) | 55 (12.2%) |
| $35,000 to $49,999 | 0 (0.0%) | 19 (4.2%) |
| $50,000 to $74,999 | 149 (38.6%) | 19 (4.2%) |
| $75,000 to $99,999 | 7 (1.8%) | 72 (16.0%) |
| $100,000 to $149,999 | 103 (26.7%) | 92 (20.4%) |
| $150,000 or more | 96 (24.9%) | 102 (22.6%) |
| Total | 386 (100.0%) | 451 (100.0%) |
Property Value to Household Income Ratio in North Eastham
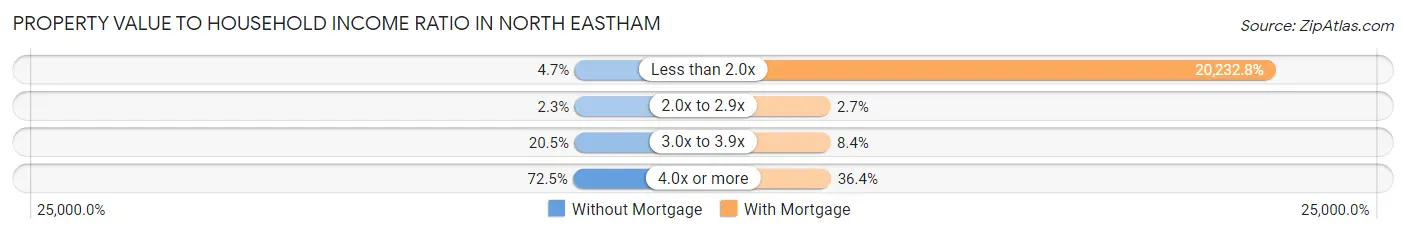
| Value-to-Income Ratio | Without Mortgage | With Mortgage |
| Less than 2.0x | 18 (4.7%) | 91,250 (20,232.8%) |
| 2.0x to 2.9x | 9 (2.3%) | 12 (2.7%) |
| 3.0x to 3.9x | 79 (20.5%) | 38 (8.4%) |
| 4.0x or more | 280 (72.5%) | 164 (36.4%) |
| Total | 386 (100.0%) | 451 (100.0%) |
Real Estate Taxes by Mortgage Status in North Eastham
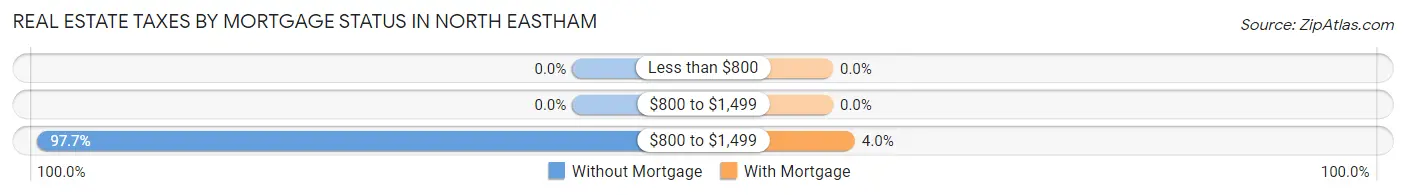
| Property Taxes | Without Mortgage | With Mortgage |
| Less than $800 | 0 (0.0%) | 0 (0.0%) |
| $800 to $1,499 | 0 (0.0%) | 0 (0.0%) |
| $800 to $1,499 | 377 (97.7%) | 18 (4.0%) |
| Total | 386 (100.0%) | 451 (100.0%) |
Health & Disability in North Eastham
Health Insurance Coverage by Age in North Eastham
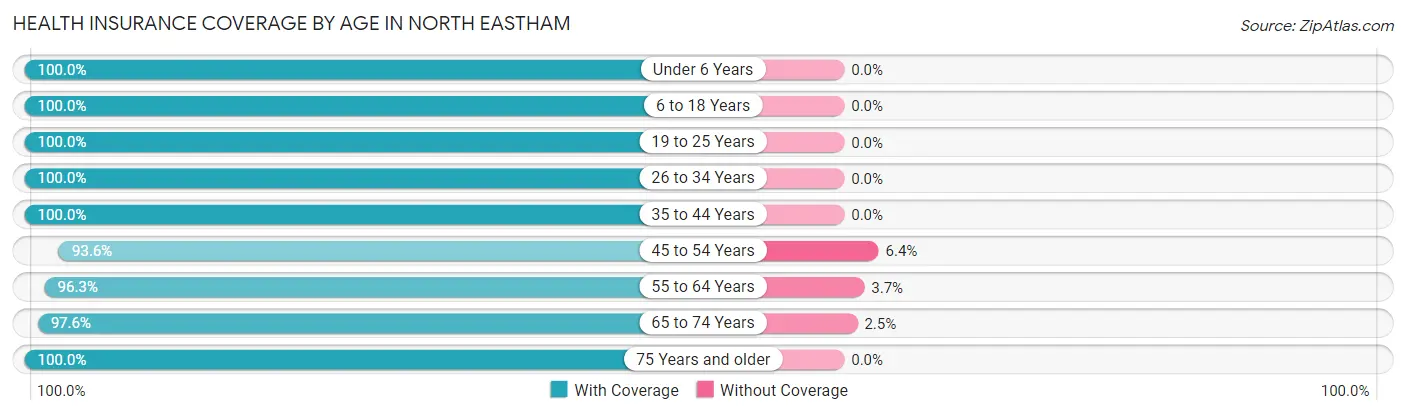
| Age Bracket | With Coverage | Without Coverage |
| Under 6 Years | 132 (100.0%) | 0 (0.0%) |
| 6 to 18 Years | 120 (100.0%) | 0 (0.0%) |
| 19 to 25 Years | 103 (100.0%) | 0 (0.0%) |
| 26 to 34 Years | 81 (100.0%) | 0 (0.0%) |
| 35 to 44 Years | 188 (100.0%) | 0 (0.0%) |
| 45 to 54 Years | 161 (93.6%) | 11 (6.4%) |
| 55 to 64 Years | 283 (96.3%) | 11 (3.7%) |
| 65 to 74 Years | 557 (97.6%) | 14 (2.5%) |
| 75 Years and older | 310 (100.0%) | 0 (0.0%) |
| Total | 1,935 (98.2%) | 36 (1.8%) |
Health Insurance Coverage by Citizenship Status in North Eastham
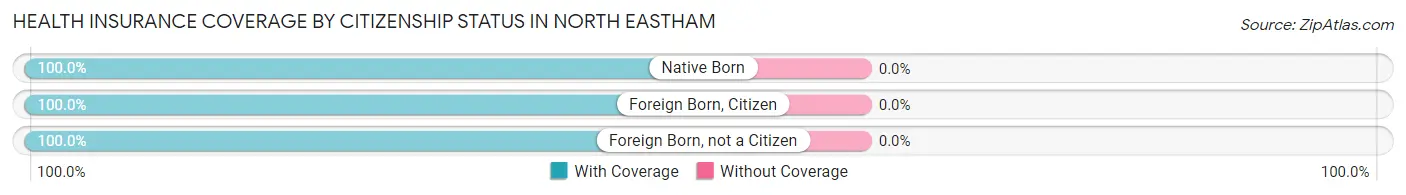
| Citizenship Status | With Coverage | Without Coverage |
| Native Born | 132 (100.0%) | 0 (0.0%) |
| Foreign Born, Citizen | 120 (100.0%) | 0 (0.0%) |
| Foreign Born, not a Citizen | 103 (100.0%) | 0 (0.0%) |
Health Insurance Coverage by Household Income in North Eastham
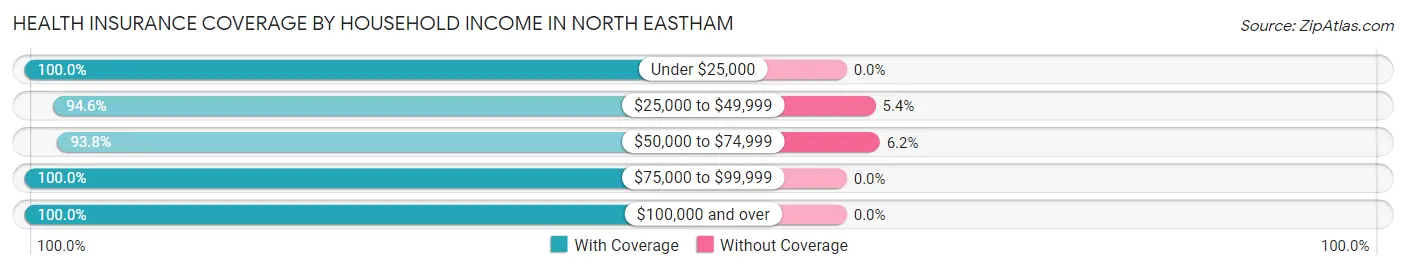
| Household Income | With Coverage | Without Coverage |
| Under $25,000 | 159 (100.0%) | 0 (0.0%) |
| $25,000 to $49,999 | 193 (94.6%) | 11 (5.4%) |
| $50,000 to $74,999 | 380 (93.8%) | 25 (6.2%) |
| $75,000 to $99,999 | 271 (100.0%) | 0 (0.0%) |
| $100,000 and over | 932 (100.0%) | 0 (0.0%) |
Public vs Private Health Insurance Coverage by Age in North Eastham
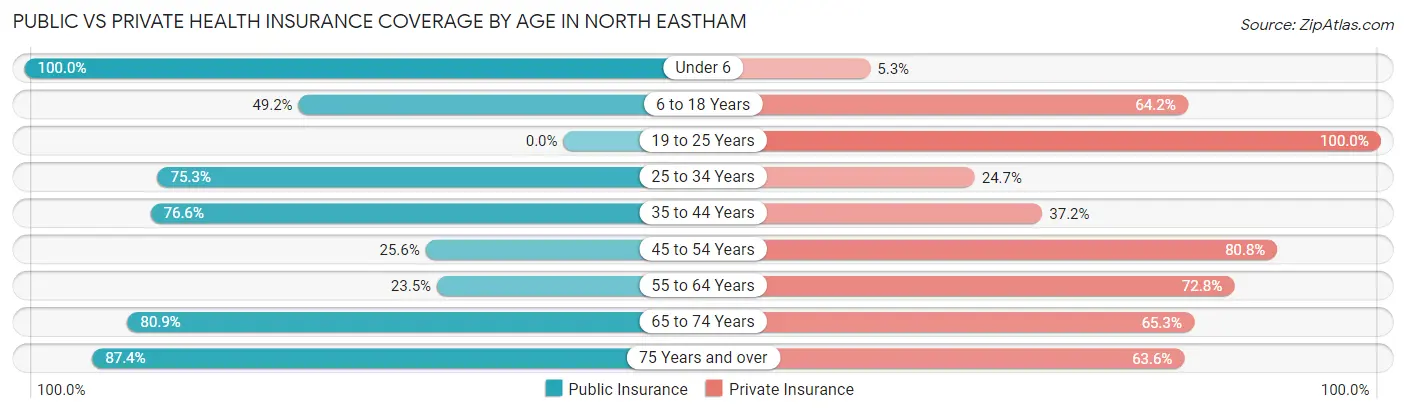
| Age Bracket | Public Insurance | Private Insurance |
| Under 6 | 132 (100.0%) | 7 (5.3%) |
| 6 to 18 Years | 59 (49.2%) | 77 (64.2%) |
| 19 to 25 Years | 0 (0.0%) | 103 (100.0%) |
| 25 to 34 Years | 61 (75.3%) | 20 (24.7%) |
| 35 to 44 Years | 144 (76.6%) | 70 (37.2%) |
| 45 to 54 Years | 44 (25.6%) | 139 (80.8%) |
| 55 to 64 Years | 69 (23.5%) | 214 (72.8%) |
| 65 to 74 Years | 462 (80.9%) | 373 (65.3%) |
| 75 Years and over | 271 (87.4%) | 197 (63.5%) |
| Total | 1,242 (63.0%) | 1,200 (60.9%) |
Disability Status by Sex by Age in North Eastham
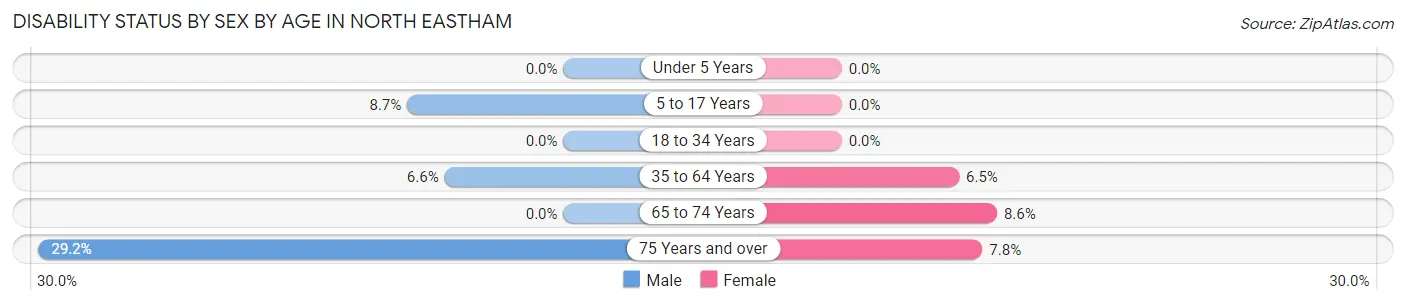
| Age Bracket | Male | Female |
| Under 5 Years | 0 (0.0%) | 0 (0.0%) |
| 5 to 17 Years | 8 (8.7%) | 0 (0.0%) |
| 18 to 34 Years | 0 (0.0%) | 0 (0.0%) |
| 35 to 64 Years | 20 (6.6%) | 23 (6.5%) |
| 65 to 74 Years | 0 (0.0%) | 33 (8.6%) |
| 75 Years and over | 57 (29.2%) | 9 (7.8%) |
Disability Class by Sex by Age in North Eastham
Disability Class: Hearing Difficulty
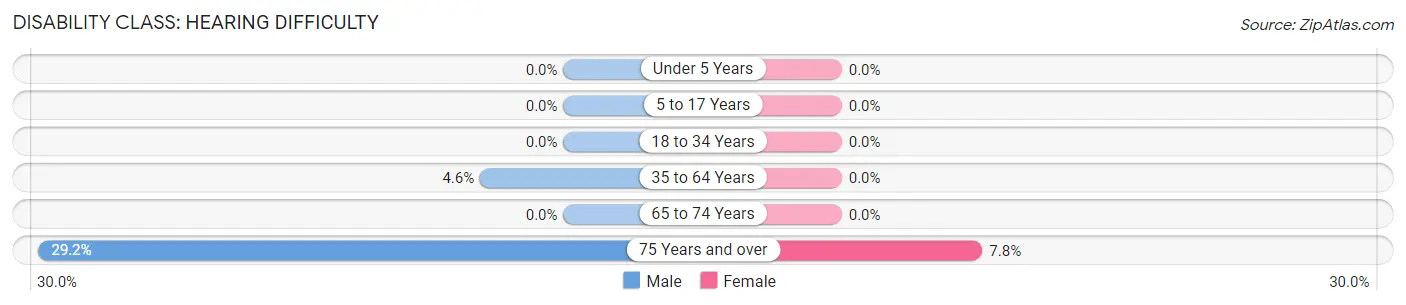
| Age Bracket | Male | Female |
| Under 5 Years | 0 (0.0%) | 0 (0.0%) |
| 5 to 17 Years | 0 (0.0%) | 0 (0.0%) |
| 18 to 34 Years | 0 (0.0%) | 0 (0.0%) |
| 35 to 64 Years | 14 (4.6%) | 0 (0.0%) |
| 65 to 74 Years | 0 (0.0%) | 0 (0.0%) |
| 75 Years and over | 57 (29.2%) | 9 (7.8%) |
Disability Class: Vision Difficulty
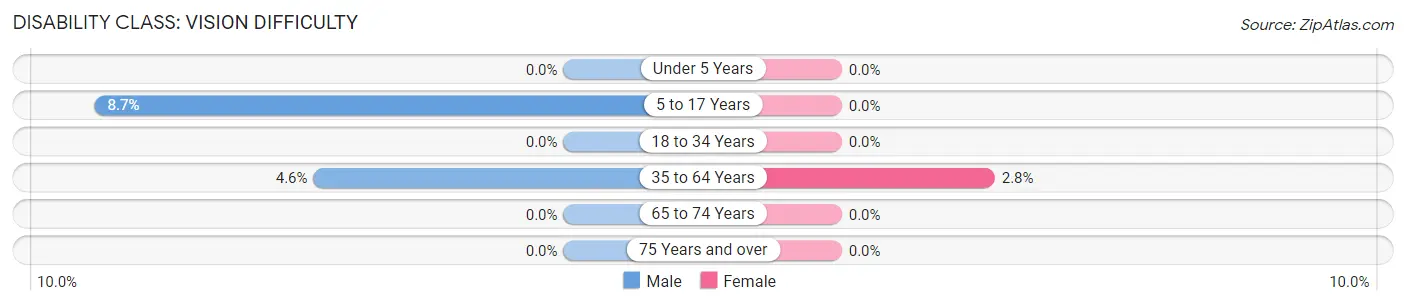
| Age Bracket | Male | Female |
| Under 5 Years | 0 (0.0%) | 0 (0.0%) |
| 5 to 17 Years | 8 (8.7%) | 0 (0.0%) |
| 18 to 34 Years | 0 (0.0%) | 0 (0.0%) |
| 35 to 64 Years | 14 (4.6%) | 10 (2.8%) |
| 65 to 74 Years | 0 (0.0%) | 0 (0.0%) |
| 75 Years and over | 0 (0.0%) | 0 (0.0%) |
Disability Class: Cognitive Difficulty
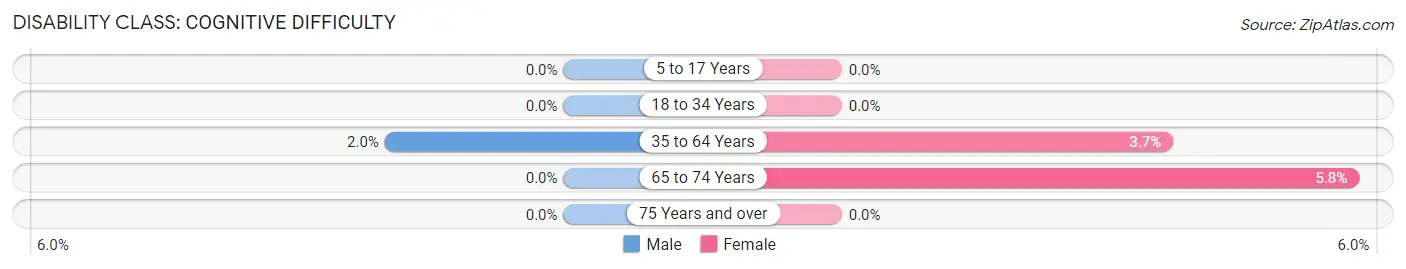
| Age Bracket | Male | Female |
| 5 to 17 Years | 0 (0.0%) | 0 (0.0%) |
| 18 to 34 Years | 0 (0.0%) | 0 (0.0%) |
| 35 to 64 Years | 6 (2.0%) | 13 (3.7%) |
| 65 to 74 Years | 0 (0.0%) | 22 (5.8%) |
| 75 Years and over | 0 (0.0%) | 0 (0.0%) |
Disability Class: Ambulatory Difficulty
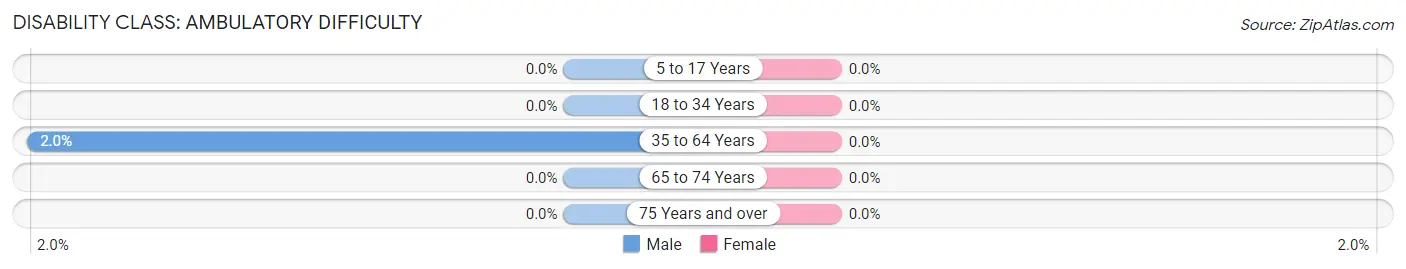
| Age Bracket | Male | Female |
| 5 to 17 Years | 0 (0.0%) | 0 (0.0%) |
| 18 to 34 Years | 0 (0.0%) | 0 (0.0%) |
| 35 to 64 Years | 6 (2.0%) | 0 (0.0%) |
| 65 to 74 Years | 0 (0.0%) | 0 (0.0%) |
| 75 Years and over | 0 (0.0%) | 0 (0.0%) |
Disability Class: Self-Care Difficulty
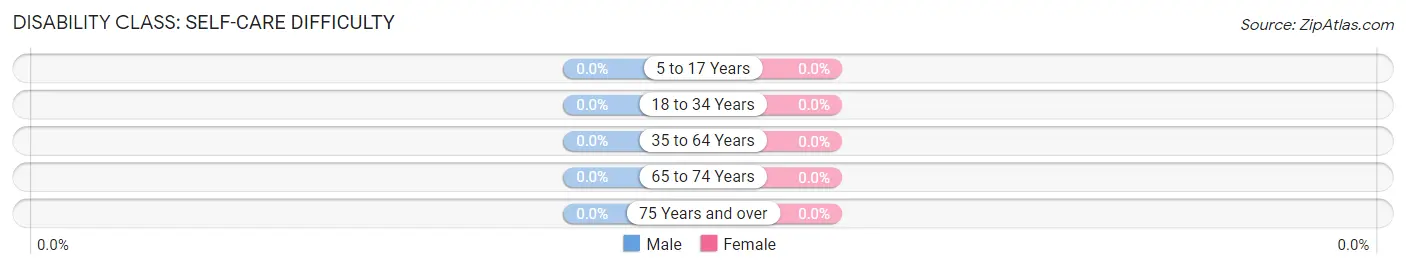
| Age Bracket | Male | Female |
| 5 to 17 Years | 0 (0.0%) | 0 (0.0%) |
| 18 to 34 Years | 0 (0.0%) | 0 (0.0%) |
| 35 to 64 Years | 0 (0.0%) | 0 (0.0%) |
| 65 to 74 Years | 0 (0.0%) | 0 (0.0%) |
| 75 Years and over | 0 (0.0%) | 0 (0.0%) |
Technology Access in North Eastham
Computing Device Access in North Eastham
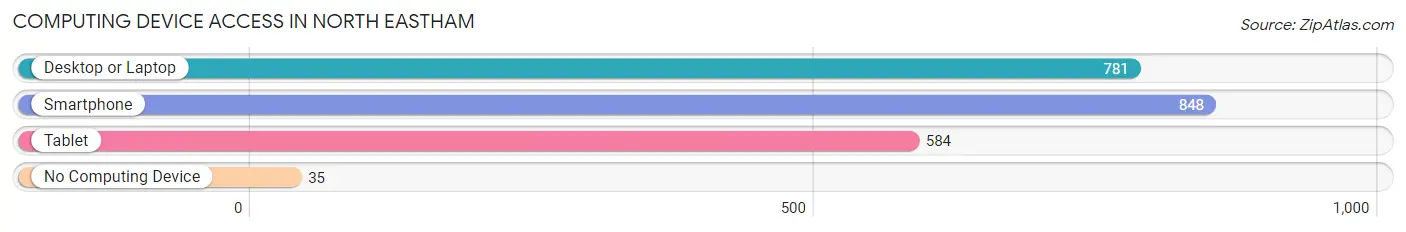
| Device Type | # Households | % Households |
| Desktop or Laptop | 781 | 84.2% |
| Smartphone | 848 | 91.4% |
| Tablet | 584 | 62.9% |
| No Computing Device | 35 | 3.8% |
| Total | 928 | 100.0% |
Internet Access in North Eastham
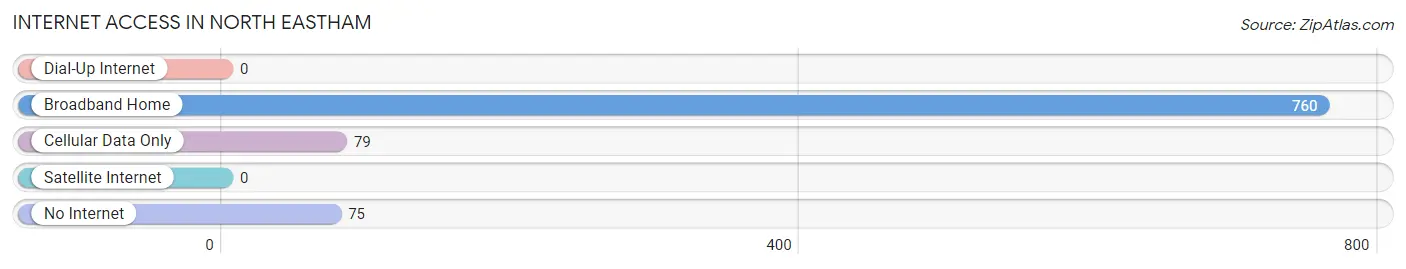
| Internet Type | # Households | % Households |
| Dial-Up Internet | 0 | 0.0% |
| Broadband Home | 760 | 81.9% |
| Cellular Data Only | 79 | 8.5% |
| Satellite Internet | 0 | 0.0% |
| No Internet | 75 | 8.1% |
| Total | 928 | 100.0% |
North Eastham Summary
North Eastham is a small town located in the Outer Cape region of Massachusetts. It is part of the town of Eastham, which is located on the northern tip of Cape Cod. North Eastham is a popular tourist destination, known for its beautiful beaches, quaint shops, and historic sites.
History
North Eastham was first settled in 1644 by a group of English settlers from Plymouth. The town was originally part of the town of Eastham, but was separated in 1763. The town was officially incorporated in 1793.
In the 19th century, North Eastham was a popular summer destination for wealthy families from Boston and New York. The town was known for its beautiful beaches and scenic views.
In the early 20th century, North Eastham became a popular destination for tourists from all over the country. The town was known for its quaint shops, art galleries, and historic sites.
Geography
North Eastham is located on the northern tip of Cape Cod. The town is bordered by the towns of Wellfleet to the north, Truro to the east, and Eastham to the south. The town is located approximately 50 miles south of Boston.
The town is situated on a peninsula, with the Atlantic Ocean to the east and Cape Cod Bay to the west. The town is home to several beaches, including Nauset Beach, Coast Guard Beach, and First Encounter Beach.
Economy
The economy of North Eastham is largely based on tourism. The town is home to several hotels, restaurants, and shops that cater to tourists. The town is also home to several art galleries and historic sites.
The town is also home to several businesses that provide services to the local community. These include a grocery store, a hardware store, and a post office.
Demographics
As of the 2010 census, the population of North Eastham was 2,255. The median age of the population was 48.7 years. The median household income was $63,750.
The racial makeup of the town was 97.2% White, 0.7% African American, 0.3% Native American, 0.4% Asian, 0.1% Pacific Islander, 0.3% from other races, and 1.0% from two or more races. Hispanic or Latino of any race were 1.2% of the population.
Conclusion
North Eastham is a small town located in the Outer Cape region of Massachusetts. It is a popular tourist destination, known for its beautiful beaches, quaint shops, and historic sites. The town has a long history, dating back to the 17th century. The economy of North Eastham is largely based on tourism, with several hotels, restaurants, and shops catering to tourists. The population of North Eastham is predominantly white, with a median age of 48.7 years and a median household income of $63,750.
Common Questions
What is Per Capita Income in North Eastham?
Per Capita income in North Eastham is $48,505.
What is the Median Family Income in North Eastham?
Median Family Income in North Eastham is $96,845.
What is the Median Household income in North Eastham?
Median Household Income in North Eastham is $81,544.
What is Income or Wage Gap in North Eastham?
Income or Wage Gap in North Eastham is 30.5%.
Women in North Eastham earn 69.5 cents for every dollar earned by a man.
What is Inequality or Gini Index in North Eastham?
Inequality or Gini Index in North Eastham is 0.37.
What is the Total Population of North Eastham?
Total Population of North Eastham is 1,971.
What is the Total Male Population of North Eastham?
Total Male Population of North Eastham is 941.
What is the Total Female Population of North Eastham?
Total Female Population of North Eastham is 1,030.
What is the Ratio of Males per 100 Females in North Eastham?
There are 91.36 Males per 100 Females in North Eastham.
What is the Ratio of Females per 100 Males in North Eastham?
There are 109.46 Females per 100 Males in North Eastham.
What is the Median Population Age in North Eastham?
Median Population Age in North Eastham is 62.5 Years.
What is the Average Family Size in North Eastham
Average Family Size in North Eastham is 2.5 People.
What is the Average Household Size in North Eastham
Average Household Size in North Eastham is 2.1 People.
How Large is the Labor Force in North Eastham?
There are 859 People in the Labor Forcein in North Eastham.
What is the Percentage of People in the Labor Force in North Eastham?
48.3% of People are in the Labor Force in North Eastham.
What is the Unemployment Rate in North Eastham?
Unemployment Rate in North Eastham is 10.5%.