Deerfield, MA Map & Demographics
Deerfield Map
Deerfield Overview
$42,805
PER CAPITA INCOME
$158,125
AVG FAMILY INCOME
9.6%
WAGE / INCOME GAP [ % ]
90.4¢/ $1
WAGE / INCOME GAP [ $ ]
0.35
INEQUALITY / GINI INDEX
486
TOTAL POPULATION
267
MALE POPULATION
219
FEMALE POPULATION
121.92
MALES / 100 FEMALES
82.02
FEMALES / 100 MALES
38.7
MEDIAN AGE
2.9
AVG FAMILY SIZE
2.7
AVG HOUSEHOLD SIZE
310
LABOR FORCE [ PEOPLE ]
75.6%
PERCENT IN LABOR FORCE
7.4%
UNEMPLOYMENT RATE
Deerfield Zip Codes
Deerfield Area Codes
Income in Deerfield
Income Overview in Deerfield
| Characteristic | Number | Measure |
| Per Capita Income | 486 | $42,805 |
| Median Family Income | 123 | $158,125 |
| Mean Family Income | 123 | $125,443 |
| Median Household Income | 136 | $0 |
| Mean Household Income | 136 | $114,659 |
| Income Deficit | 123 | $0 |
| Wage / Income Gap (%) | 486 | 9.58% |
| Wage / Income Gap ($) | 486 | 90.42¢ per $1 |
| Gini / Inequality Index | 486 | 0.35 |
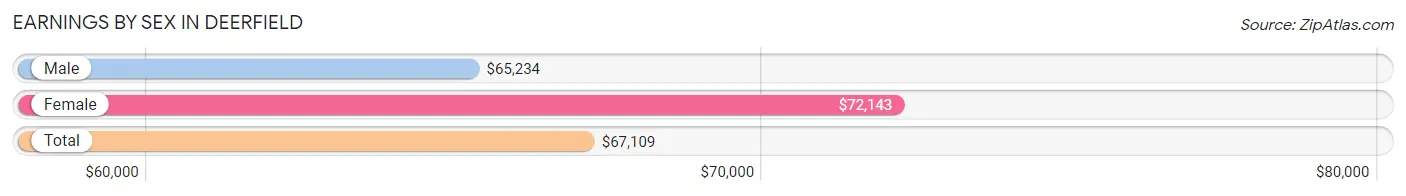
Earnings by Sex in Deerfield
Average Earnings in Deerfield are $67,109, $65,234 for men and $72,143 for women, a difference of 9.6%.
| Sex | Number | Average Earnings |
| Male | 197 (58.5%) | $65,234 |
| Female | 140 (41.5%) | $72,143 |
| Total | 337 (100.0%) | $67,109 |
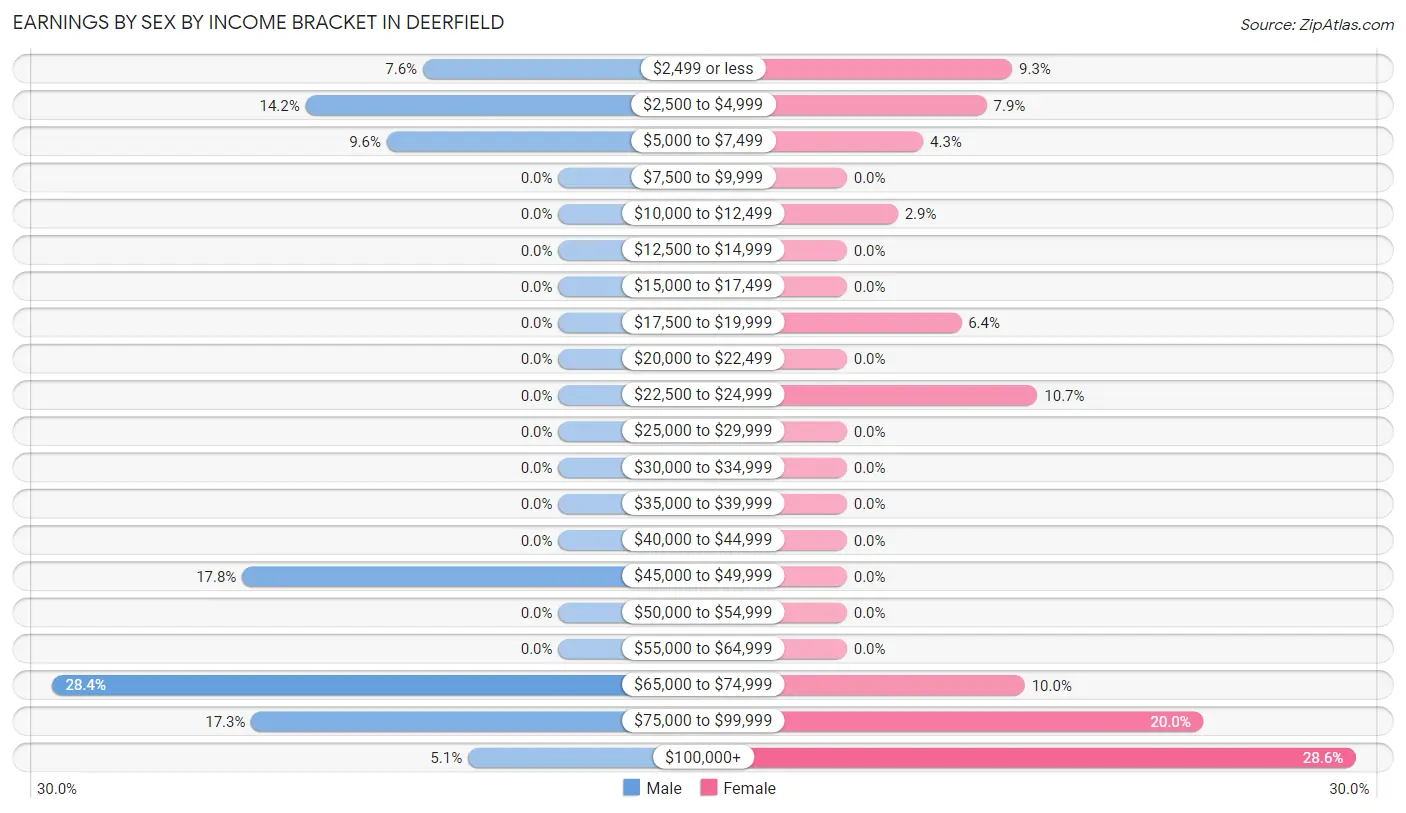
Earnings by Sex by Income Bracket in Deerfield
The most common earnings brackets in Deerfield are $65,000 to $74,999 for men (56 | 28.4%) and $100,000+ for women (40 | 28.6%).
| Income | Male | Female |
| $2,499 or less | 15 (7.6%) | 13 (9.3%) |
| $2,500 to $4,999 | 28 (14.2%) | 11 (7.9%) |
| $5,000 to $7,499 | 19 (9.6%) | 6 (4.3%) |
| $7,500 to $9,999 | 0 (0.0%) | 0 (0.0%) |
| $10,000 to $12,499 | 0 (0.0%) | 4 (2.9%) |
| $12,500 to $14,999 | 0 (0.0%) | 0 (0.0%) |
| $15,000 to $17,499 | 0 (0.0%) | 0 (0.0%) |
| $17,500 to $19,999 | 0 (0.0%) | 9 (6.4%) |
| $20,000 to $22,499 | 0 (0.0%) | 0 (0.0%) |
| $22,500 to $24,999 | 0 (0.0%) | 15 (10.7%) |
| $25,000 to $29,999 | 0 (0.0%) | 0 (0.0%) |
| $30,000 to $34,999 | 0 (0.0%) | 0 (0.0%) |
| $35,000 to $39,999 | 0 (0.0%) | 0 (0.0%) |
| $40,000 to $44,999 | 0 (0.0%) | 0 (0.0%) |
| $45,000 to $49,999 | 35 (17.8%) | 0 (0.0%) |
| $50,000 to $54,999 | 0 (0.0%) | 0 (0.0%) |
| $55,000 to $64,999 | 0 (0.0%) | 0 (0.0%) |
| $65,000 to $74,999 | 56 (28.4%) | 14 (10.0%) |
| $75,000 to $99,999 | 34 (17.3%) | 28 (20.0%) |
| $100,000+ | 10 (5.1%) | 40 (28.6%) |
| Total | 197 (100.0%) | 140 (100.0%) |
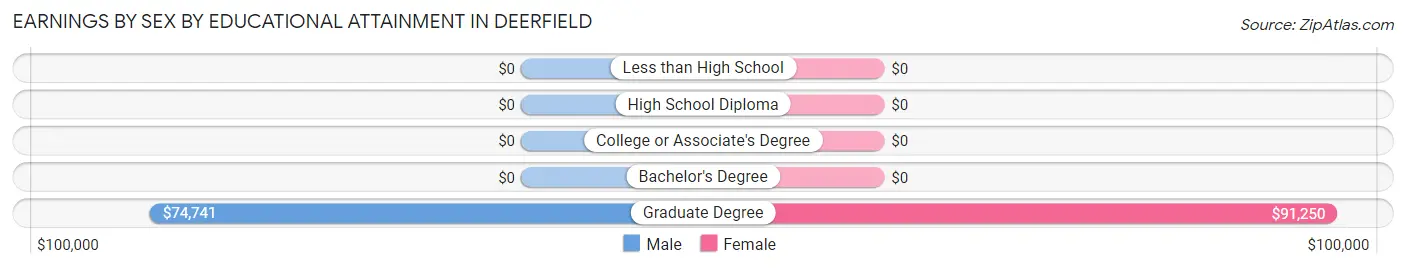
Earnings by Sex by Educational Attainment in Deerfield
Average earnings in Deerfield are $72,974 for men and $77,159 for women, a difference of 5.4%. Men with an educational attainment of graduate degree enjoy the highest average annual earnings of $74,741, while those with graduate degree education earn the least with $74,741. Women with an educational attainment of graduate degree earn the most with the average annual earnings of $91,250, while those with graduate degree education have the smallest earnings of $91,250.
| Educational Attainment | Male Income | Female Income |
| Less than High School | - | - |
| High School Diploma | - | - |
| College or Associate's Degree | - | - |
| Bachelor's Degree | - | - |
| Graduate Degree | $74,741 | $91,250 |
| Total | $72,974 | $77,159 |
Family Income in Deerfield
Family Income Brackets in Deerfield
According to the Deerfield family income data, there are 49 families falling into the $150,000 to $199,999 income range, which is the most common income bracket and makes up 39.8% of all families.
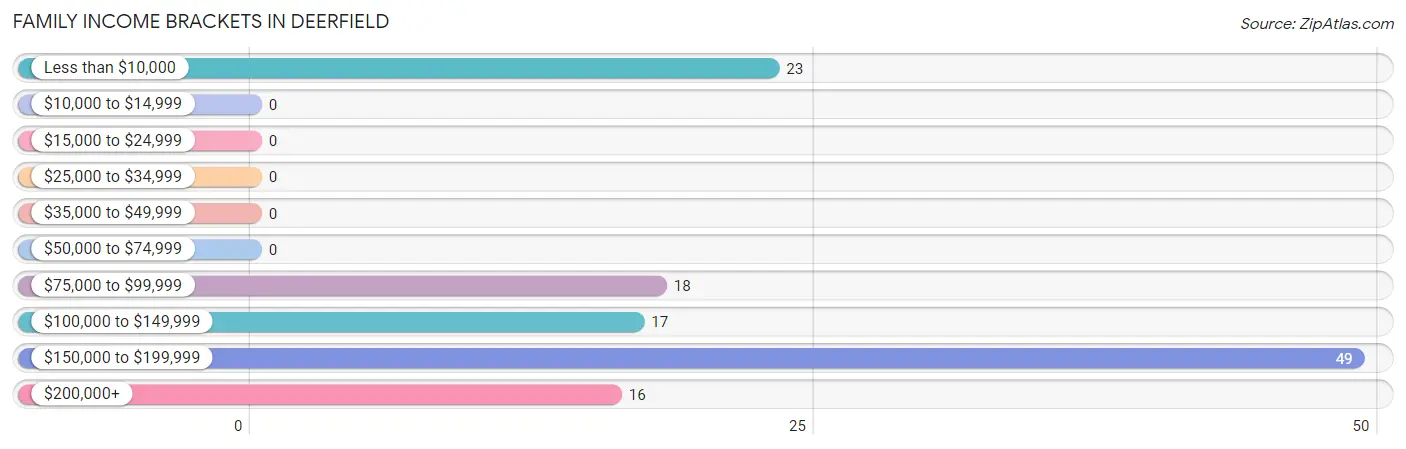
| Income Bracket | # Families | % Families |
| Less than $10,000 | 23 | 18.7% |
| $10,000 to $14,999 | 0 | 0.0% |
| $15,000 to $24,999 | 0 | 0.0% |
| $25,000 to $34,999 | 0 | 0.0% |
| $35,000 to $49,999 | 0 | 0.0% |
| $50,000 to $74,999 | 0 | 0.0% |
| $75,000 to $99,999 | 18 | 14.6% |
| $100,000 to $149,999 | 17 | 13.8% |
| $150,000 to $199,999 | 49 | 39.8% |
| $200,000+ | 16 | 13.0% |
Family Income by Famaliy Size in Deerfield
2-person families (74 | 60.2%) account for the highest median family income in Deerfield with $177,900 per family, while 2-person families (74 | 60.2%) have the highest median income of $88,950 per family member.
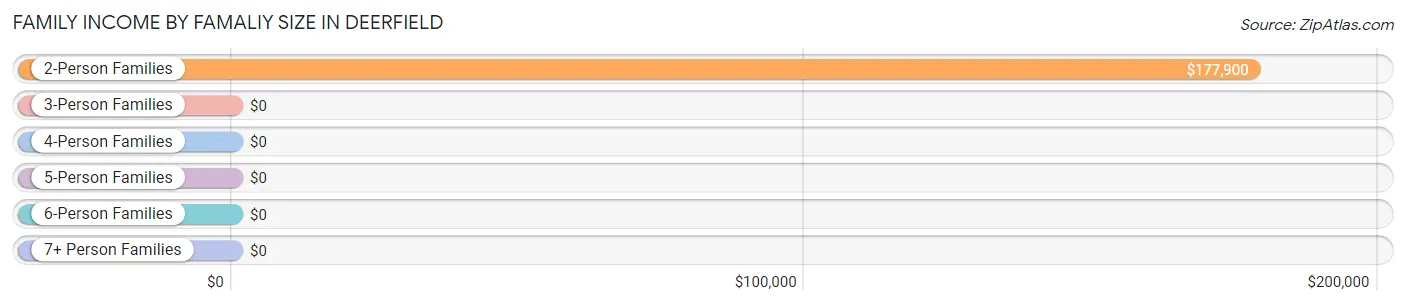
| Income Bracket | # Families | Median Income |
| 2-Person Families | 74 (60.2%) | $177,900 |
| 3-Person Families | 17 (13.8%) | $0 |
| 4-Person Families | 14 (11.4%) | $0 |
| 5-Person Families | 0 (0.0%) | $0 |
| 6-Person Families | 18 (14.6%) | $0 |
| 7+ Person Families | 0 (0.0%) | $0 |
| Total | 123 (100.0%) | $158,125 |
Family Income by Number of Earners in Deerfield
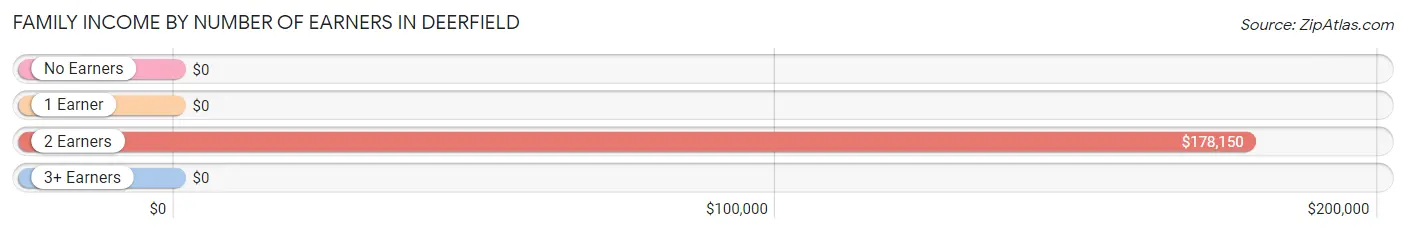
| Number of Earners | # Families | Median Income |
| No Earners | 23 (18.7%) | $0 |
| 1 Earner | 0 (0.0%) | $0 |
| 2 Earners | 69 (56.1%) | $178,150 |
| 3+ Earners | 31 (25.2%) | $0 |
| Total | 123 (100.0%) | $158,125 |
Household Income in Deerfield
Household Income Brackets in Deerfield
With 49 households falling in the category, the $150,000 to $199,999 income range is the most frequent in Deerfield, accounting for 36.0% of all households.
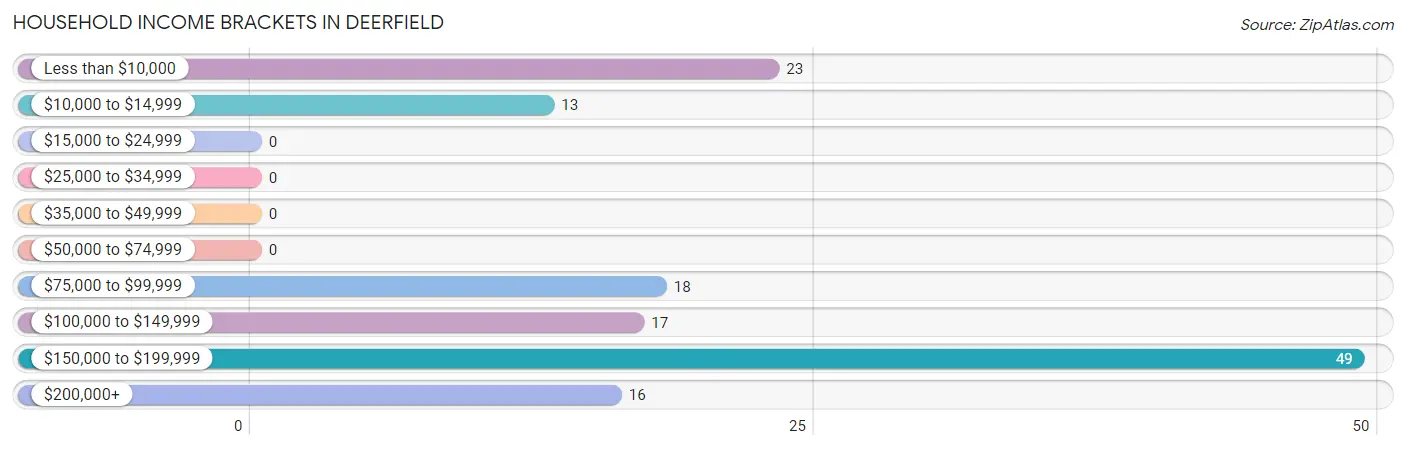
| Income Bracket | # Households | % Households |
| Less than $10,000 | 23 | 16.9% |
| $10,000 to $14,999 | 13 | 9.6% |
| $15,000 to $24,999 | 0 | 0.0% |
| $25,000 to $34,999 | 0 | 0.0% |
| $35,000 to $49,999 | 0 | 0.0% |
| $50,000 to $74,999 | 0 | 0.0% |
| $75,000 to $99,999 | 18 | 13.2% |
| $100,000 to $149,999 | 17 | 12.5% |
| $150,000 to $199,999 | 49 | 36.0% |
| $200,000+ | 16 | 11.8% |
Household Income by Householder Age in Deerfield
The median household income in Deerfield is $0, with the highest median household income of $130,000 found in the 45 to 64 years age bracket for the primary householder. A total of 60 households (44.1%) fall into this category.
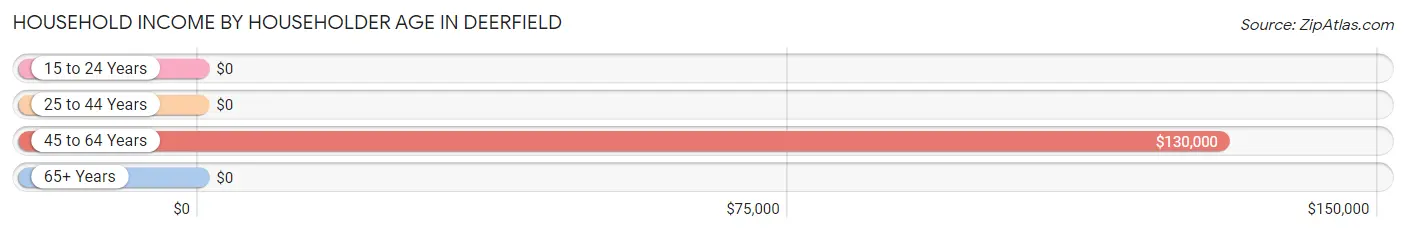
| Income Bracket | # Households | Median Income |
| 15 to 24 Years | 0 (0.0%) | $0 |
| 25 to 44 Years | 43 (31.6%) | $0 |
| 45 to 64 Years | 60 (44.1%) | $130,000 |
| 65+ Years | 33 (24.3%) | $0 |
| Total | 136 (100.0%) | $0 |
Poverty in Deerfield
Income Below Poverty by Sex and Age in Deerfield
With 9.6% poverty level for males and 18.3% for females among the residents of Deerfield, 65 to 74 year old males and 55 to 64 year old females are the most vulnerable to poverty, with 23 males (69.7%) and 34 females (51.5%) in their respective age groups living below the poverty level.
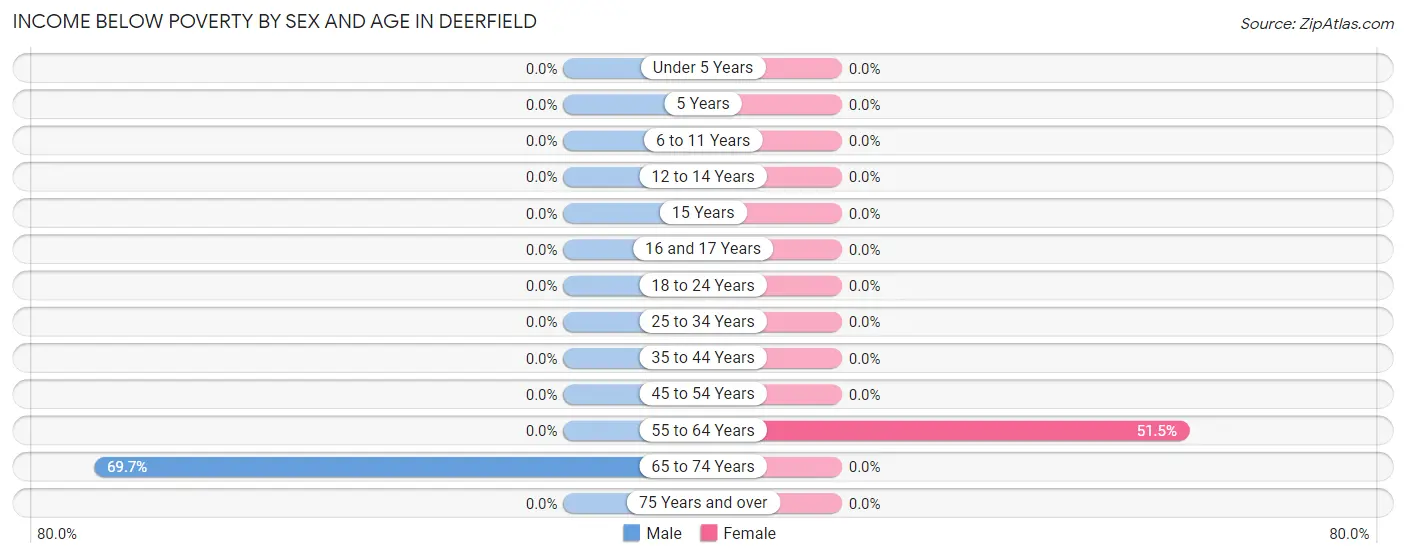
| Age Bracket | Male | Female |
| Under 5 Years | 0 (0.0%) | 0 (0.0%) |
| 5 Years | 0 (0.0%) | 0 (0.0%) |
| 6 to 11 Years | 0 (0.0%) | 0 (0.0%) |
| 12 to 14 Years | 0 (0.0%) | 0 (0.0%) |
| 15 Years | 0 (0.0%) | 0 (0.0%) |
| 16 and 17 Years | 0 (0.0%) | 0 (0.0%) |
| 18 to 24 Years | 0 (0.0%) | 0 (0.0%) |
| 25 to 34 Years | 0 (0.0%) | 0 (0.0%) |
| 35 to 44 Years | 0 (0.0%) | 0 (0.0%) |
| 45 to 54 Years | 0 (0.0%) | 0 (0.0%) |
| 55 to 64 Years | 0 (0.0%) | 34 (51.5%) |
| 65 to 74 Years | 23 (69.7%) | 0 (0.0%) |
| 75 Years and over | 0 (0.0%) | 0 (0.0%) |
| Total | 23 (9.6%) | 34 (18.3%) |
Income Above Poverty by Sex and Age in Deerfield
According to the poverty statistics in Deerfield, males aged 6 to 11 years and females aged under 5 years are the age groups that are most secure financially, with 100.0% of males and 100.0% of females in these age groups living above the poverty line.
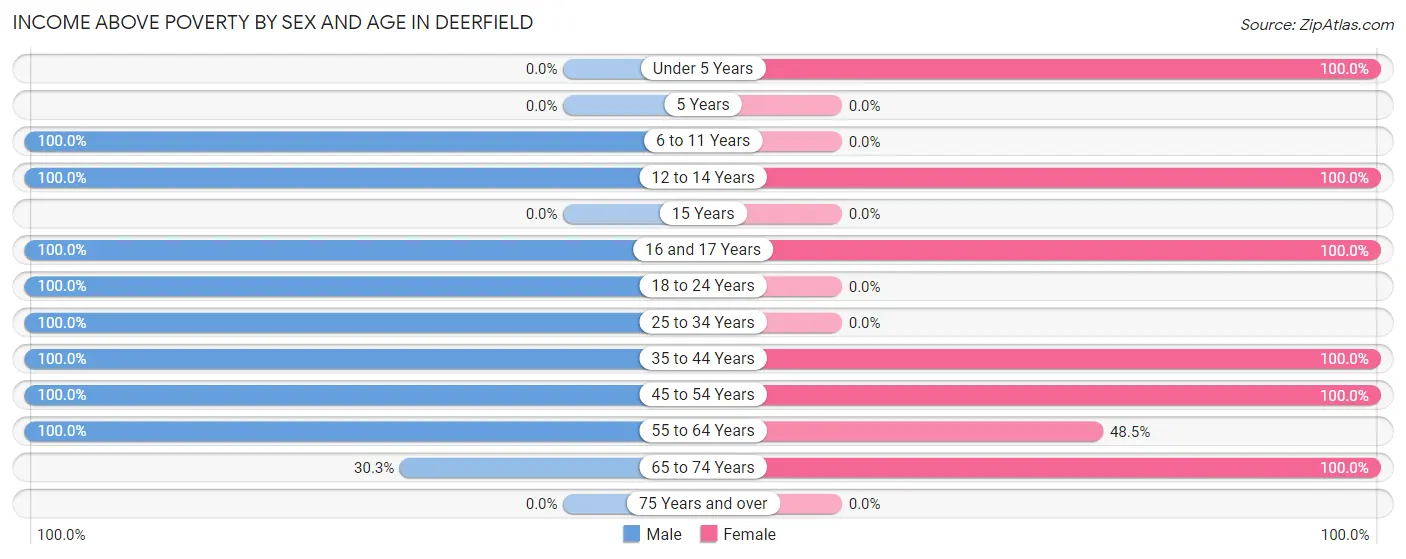
| Age Bracket | Male | Female |
| Under 5 Years | 0 (0.0%) | 14 (100.0%) |
| 5 Years | 0 (0.0%) | 0 (0.0%) |
| 6 to 11 Years | 31 (100.0%) | 0 (0.0%) |
| 12 to 14 Years | 15 (100.0%) | 16 (100.0%) |
| 15 Years | 0 (0.0%) | 0 (0.0%) |
| 16 and 17 Years | 17 (100.0%) | 5 (100.0%) |
| 18 to 24 Years | 19 (100.0%) | 0 (0.0%) |
| 25 to 34 Years | 11 (100.0%) | 0 (0.0%) |
| 35 to 44 Years | 64 (100.0%) | 62 (100.0%) |
| 45 to 54 Years | 34 (100.0%) | 14 (100.0%) |
| 55 to 64 Years | 16 (100.0%) | 32 (48.5%) |
| 65 to 74 Years | 10 (30.3%) | 9 (100.0%) |
| 75 Years and over | 0 (0.0%) | 0 (0.0%) |
| Total | 217 (90.4%) | 152 (81.7%) |
Income Below Poverty Among Married-Couple Families in Deerfield
The poverty statistics for married-couple families in Deerfield show that 21.7% or 23 of the total 106 families live below the poverty line. Families with no children have the highest poverty rate of 31.1%, comprising of 23 families. On the other hand, families with 1 or 2 children have the lowest poverty rate of 0.0%, which includes 0 families.
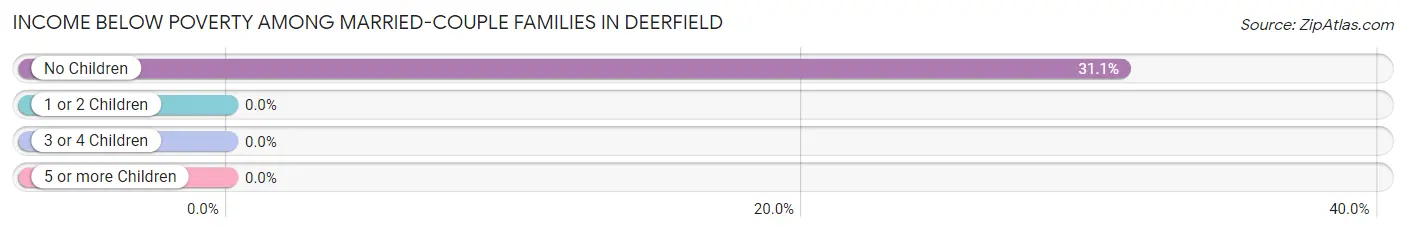
| Children | Above Poverty | Below Poverty |
| No Children | 51 (68.9%) | 23 (31.1%) |
| 1 or 2 Children | 14 (100.0%) | 0 (0.0%) |
| 3 or 4 Children | 18 (100.0%) | 0 (0.0%) |
| 5 or more Children | 0 (0.0%) | 0 (0.0%) |
| Total | 83 (78.3%) | 23 (21.7%) |
Income Below Poverty Among Single-Parent Households in Deerfield
| Children | Single Father | Single Mother |
| No Children | 0 (0.0%) | 0 (0.0%) |
| 1 or 2 Children | 0 (0.0%) | 0 (0.0%) |
| 3 or 4 Children | 0 (0.0%) | 0 (0.0%) |
| 5 or more Children | 0 (0.0%) | 0 (0.0%) |
| Total | 0 (0.0%) | 0 (0.0%) |
Income Below Poverty Among Married-Couple vs Single-Parent Households in Deerfield
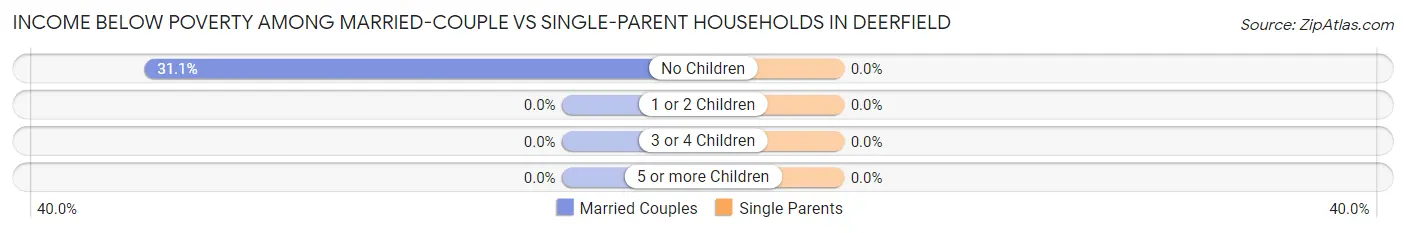
| Children | Married-Couple Families | Single-Parent Households |
| No Children | 23 (31.1%) | 0 (0.0%) |
| 1 or 2 Children | 0 (0.0%) | 0 (0.0%) |
| 3 or 4 Children | 0 (0.0%) | 0 (0.0%) |
| 5 or more Children | 0 (0.0%) | 0 (0.0%) |
| Total | 23 (21.7%) | 0 (0.0%) |
Race in Deerfield
The most populous races in Deerfield are White / Caucasian (376 | 77.4%), Two or more Races (98 | 20.2%), and Hispanic or Latino (11 | 2.3%).
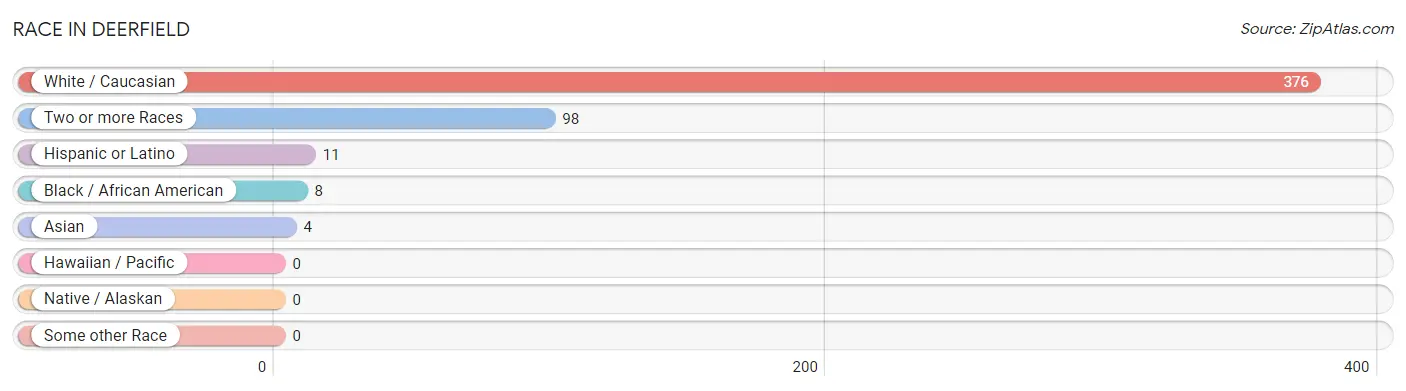
| Race | # Population | % Population |
| Asian | 4 | 0.8% |
| Black / African American | 8 | 1.7% |
| Hawaiian / Pacific | 0 | 0.0% |
| Hispanic or Latino | 11 | 2.3% |
| Native / Alaskan | 0 | 0.0% |
| White / Caucasian | 376 | 77.4% |
| Two or more Races | 98 | 20.2% |
| Some other Race | 0 | 0.0% |
| Total | 486 | 100.0% |
Ancestry in Deerfield
The most populous ancestries reported in Deerfield are English (135 | 27.8%), German (132 | 27.2%), Irish (106 | 21.8%), Scotch-Irish (72 | 14.8%), and European (60 | 12.3%), together accounting for 103.9% of all Deerfield residents.
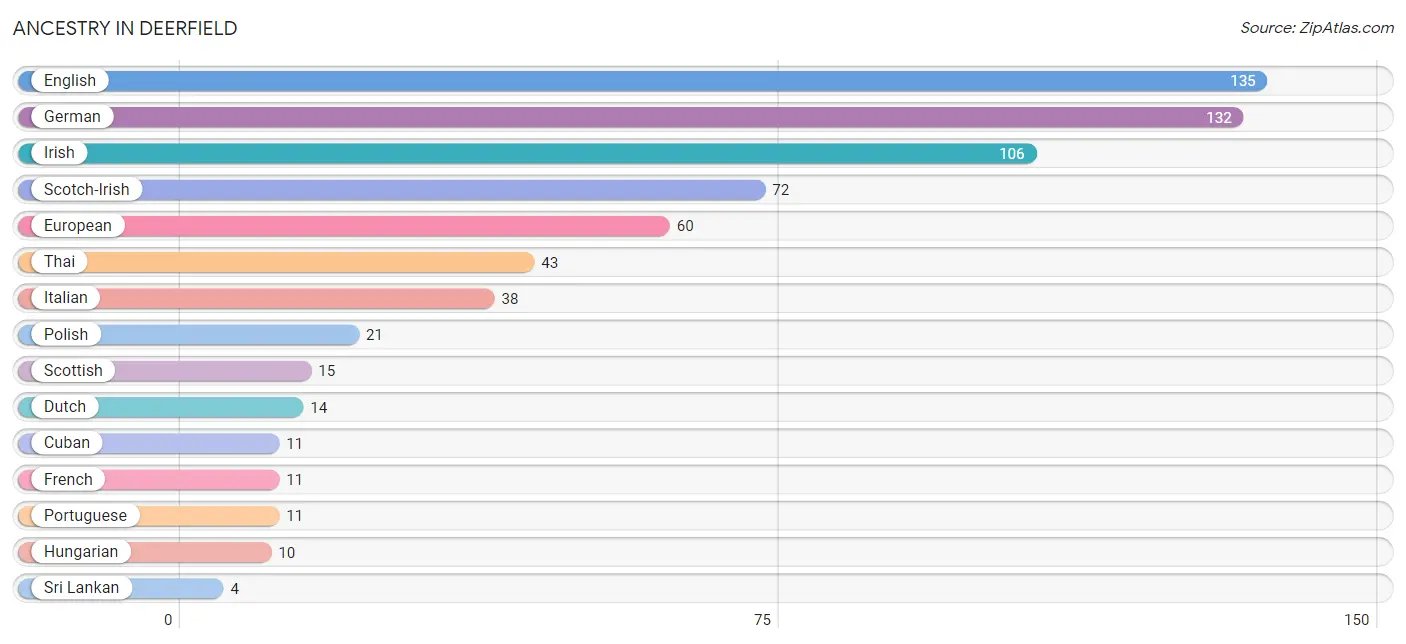
| Ancestry | # Population | % Population |
| Cuban | 11 | 2.3% |
| Dutch | 14 | 2.9% |
| English | 135 | 27.8% |
| European | 60 | 12.3% |
| French | 11 | 2.3% |
| German | 132 | 27.2% |
| Hungarian | 10 | 2.1% |
| Irish | 106 | 21.8% |
| Italian | 38 | 7.8% |
| Polish | 21 | 4.3% |
| Portuguese | 11 | 2.3% |
| Russian | 1 | 0.2% |
| Scotch-Irish | 72 | 14.8% |
| Scottish | 15 | 3.1% |
| Sri Lankan | 4 | 0.8% |
| Thai | 43 | 8.8% | View All 16 Rows |
Immigrants in Deerfield
The most numerous immigrant groups reported in Deerfield came from Canada (23 | 4.7%), Caribbean (11 | 2.3%), Cuba (11 | 2.3%), and Latin America (11 | 2.3%), together accounting for 11.5% of all Deerfield residents.
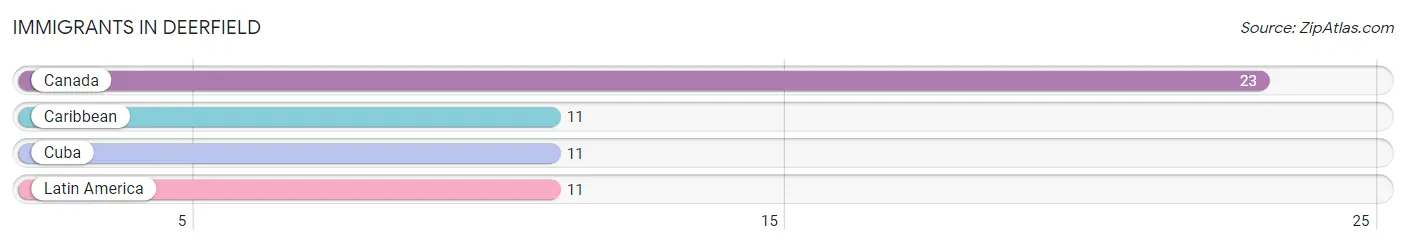
| Immigration Origin | # Population | % Population |
| Canada | 23 | 4.7% |
| Caribbean | 11 | 2.3% |
| Cuba | 11 | 2.3% |
| Latin America | 11 | 2.3% | View All 4 Rows |
Sex and Age in Deerfield
Sex and Age in Deerfield
The most populous age groups in Deerfield are 40 to 44 Years (53 | 19.9%) for men and 35 to 39 Years (62 | 28.3%) for women.
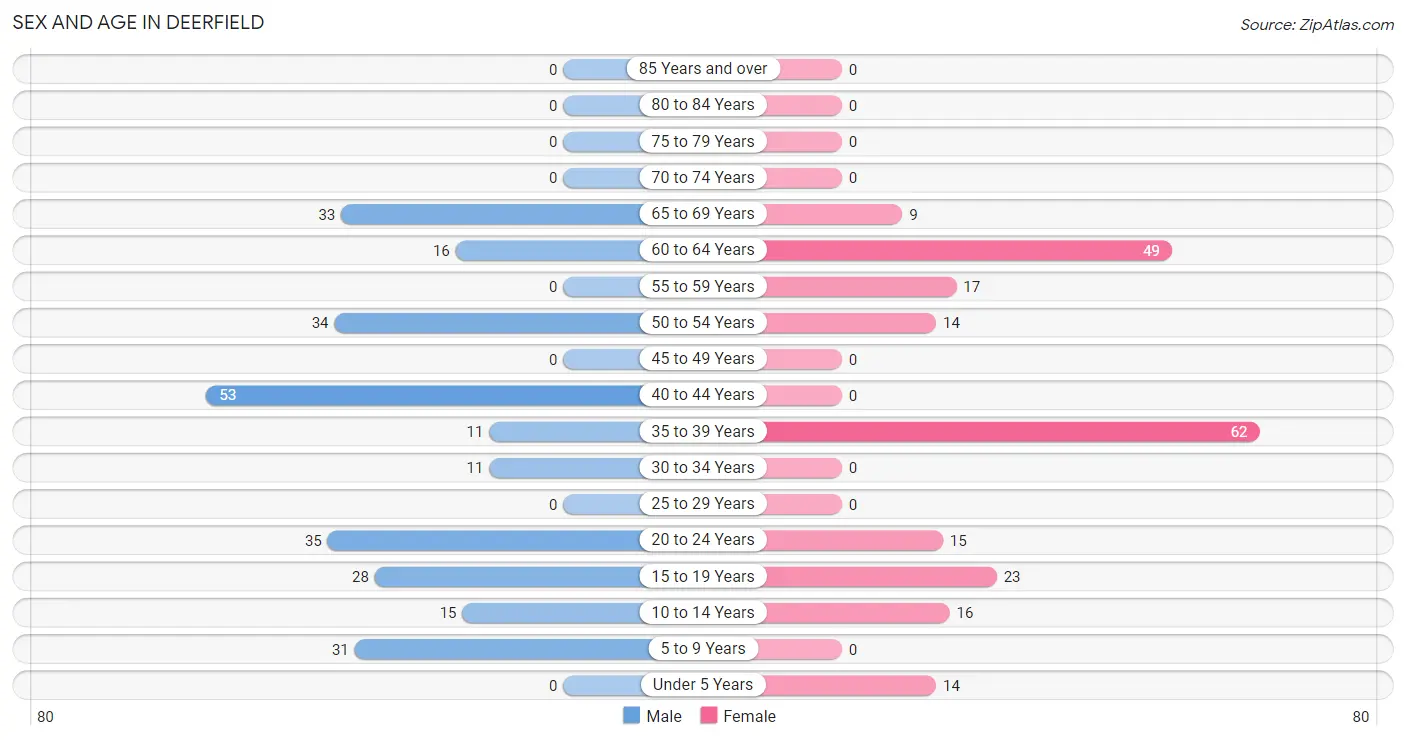
| Age Bracket | Male | Female |
| Under 5 Years | 0 (0.0%) | 14 (6.4%) |
| 5 to 9 Years | 31 (11.6%) | 0 (0.0%) |
| 10 to 14 Years | 15 (5.6%) | 16 (7.3%) |
| 15 to 19 Years | 28 (10.5%) | 23 (10.5%) |
| 20 to 24 Years | 35 (13.1%) | 15 (6.9%) |
| 25 to 29 Years | 0 (0.0%) | 0 (0.0%) |
| 30 to 34 Years | 11 (4.1%) | 0 (0.0%) |
| 35 to 39 Years | 11 (4.1%) | 62 (28.3%) |
| 40 to 44 Years | 53 (19.9%) | 0 (0.0%) |
| 45 to 49 Years | 0 (0.0%) | 0 (0.0%) |
| 50 to 54 Years | 34 (12.7%) | 14 (6.4%) |
| 55 to 59 Years | 0 (0.0%) | 17 (7.8%) |
| 60 to 64 Years | 16 (6.0%) | 49 (22.4%) |
| 65 to 69 Years | 33 (12.4%) | 9 (4.1%) |
| 70 to 74 Years | 0 (0.0%) | 0 (0.0%) |
| 75 to 79 Years | 0 (0.0%) | 0 (0.0%) |
| 80 to 84 Years | 0 (0.0%) | 0 (0.0%) |
| 85 Years and over | 0 (0.0%) | 0 (0.0%) |
| Total | 267 (100.0%) | 219 (100.0%) |
Families and Households in Deerfield
Median Family Size in Deerfield
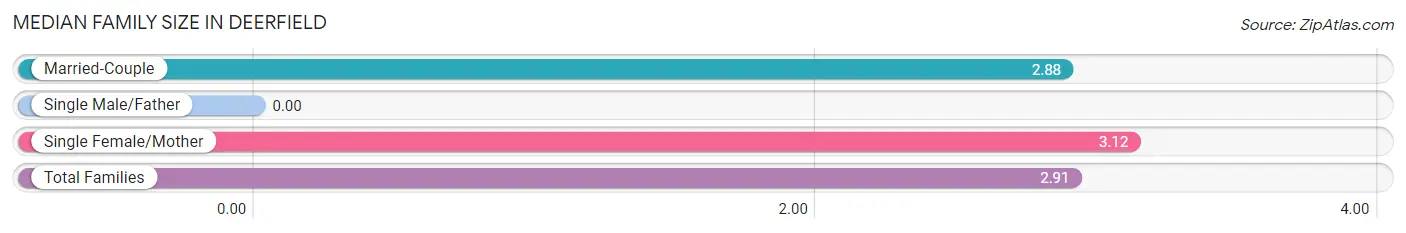
| Family Type | # Families | Family Size |
| Married-Couple | 106 (86.2%) | 2.88 |
| Single Male/Father | 0 (0.0%) | - |
| Single Female/Mother | 17 (13.8%) | 3.12 |
| Total Families | 123 (100.0%) | 2.91 |
Median Household Size in Deerfield
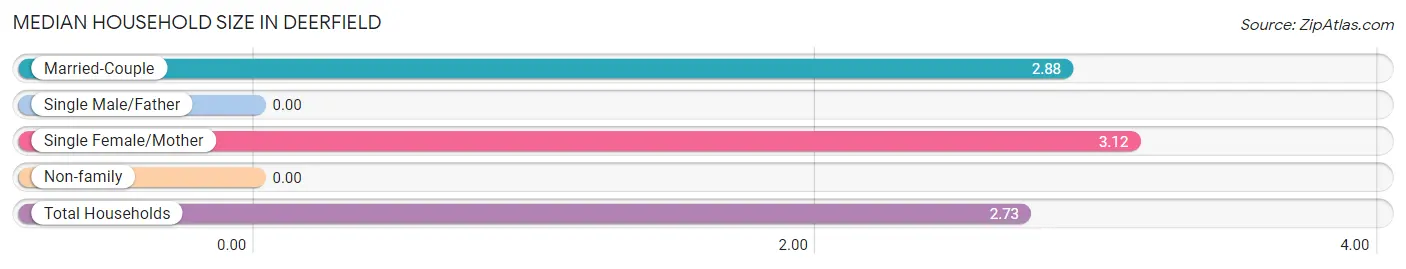
| Household Type | # Households | Household Size |
| Married-Couple | 106 (77.9%) | 2.88 |
| Single Male/Father | 0 (0.0%) | - |
| Single Female/Mother | 17 (12.5%) | 3.12 |
| Non-family | 13 (9.6%) | - |
| Total Households | 136 (100.0%) | 2.73 |
Household Size by Marriage Status in Deerfield
Out of a total of 136 households in Deerfield, 123 (90.4%) are family households, while 13 (9.6%) are nonfamily households. The most numerous type of family households are 2-person households, comprising 74, and the most common type of nonfamily households are 1-person households, comprising 13.
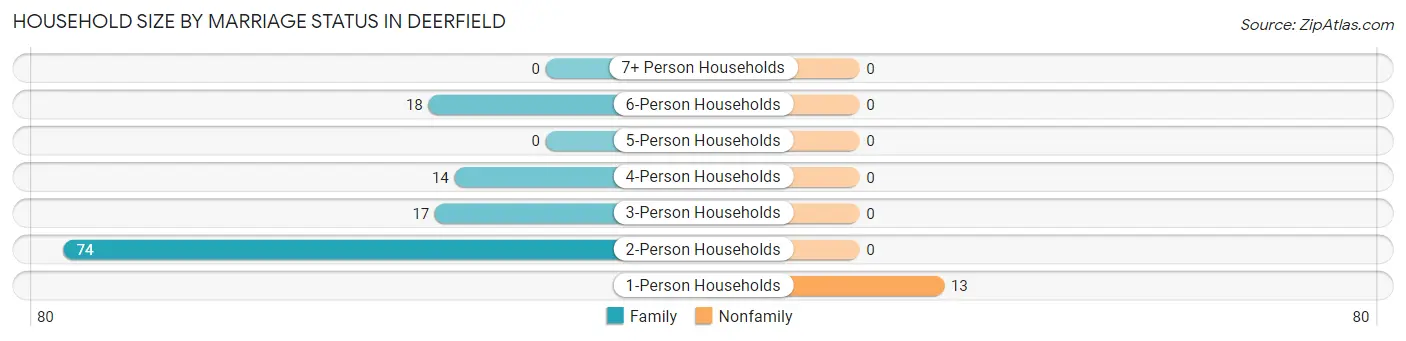
| Household Size | Family Households | Nonfamily Households |
| 1-Person Households | - | 13 (9.6%) |
| 2-Person Households | 74 (54.4%) | 0 (0.0%) |
| 3-Person Households | 17 (12.5%) | 0 (0.0%) |
| 4-Person Households | 14 (10.3%) | 0 (0.0%) |
| 5-Person Households | 0 (0.0%) | 0 (0.0%) |
| 6-Person Households | 18 (13.2%) | 0 (0.0%) |
| 7+ Person Households | 0 (0.0%) | 0 (0.0%) |
| Total | 123 (90.4%) | 13 (9.6%) |
Female Fertility in Deerfield
Fertility by Age in Deerfield
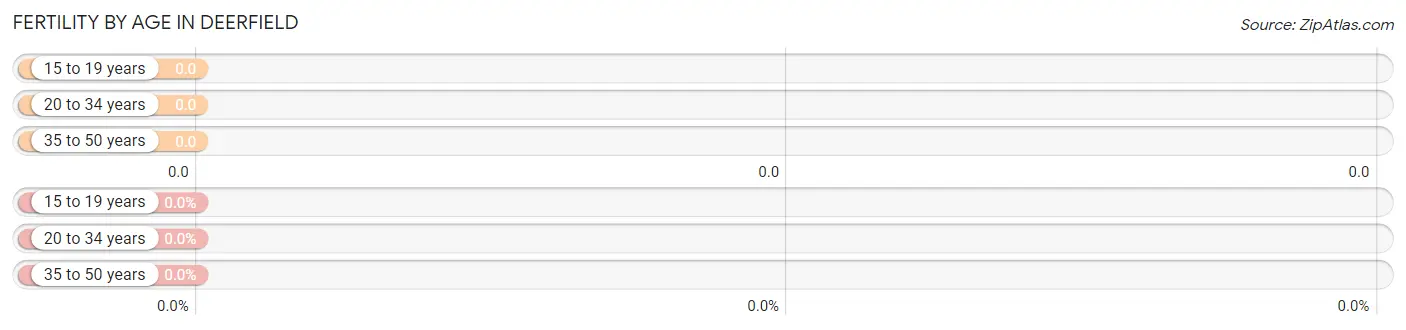
| Age Bracket | Women with Births | Births / 1,000 Women |
| 15 to 19 years | 0 (0.0%) | 0.0 |
| 20 to 34 years | 0 (0.0%) | 0.0 |
| 35 to 50 years | 0 (0.0%) | 0.0 |
| Total | 0 (0.0%) | 0.0 |
Fertility by Age by Marriage Status in Deerfield
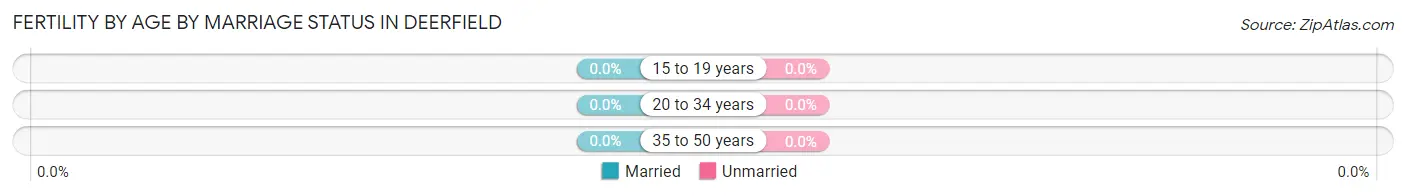
| Age Bracket | Married | Unmarried |
| 15 to 19 years | 0 (0.0%) | 0 (0.0%) |
| 20 to 34 years | 0 (0.0%) | 0 (0.0%) |
| 35 to 50 years | 0 (0.0%) | 0 (0.0%) |
| Total | 0 (0.0%) | 0 (0.0%) |
Fertility by Education in Deerfield
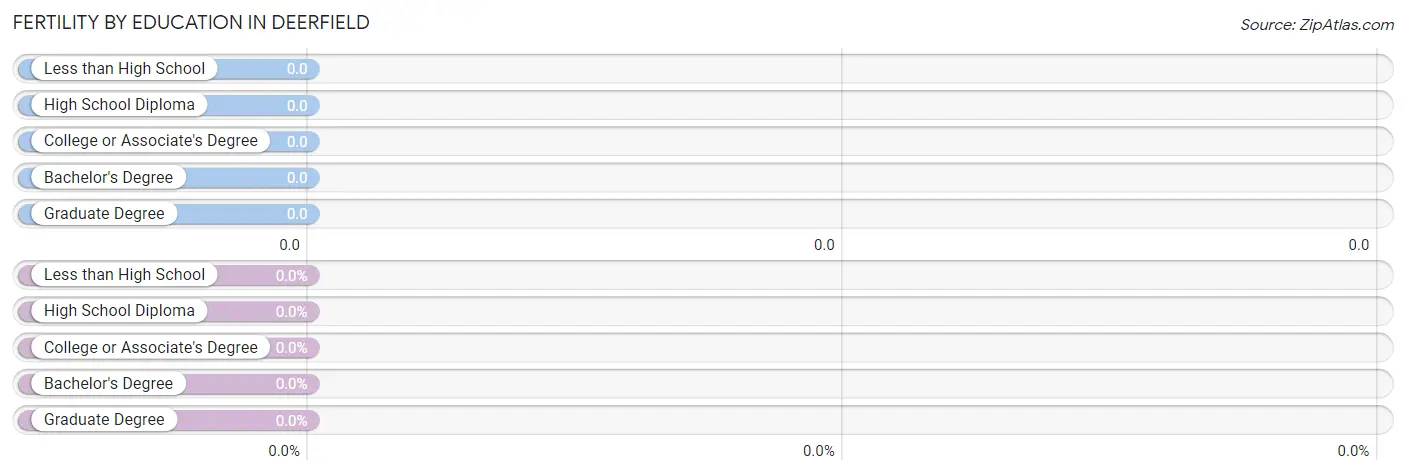
| Educational Attainment | Women with Births | Births / 1,000 Women |
| Less than High School | 0 (0.0%) | 0.0 |
| High School Diploma | 0 (0.0%) | 0.0 |
| College or Associate's Degree | 0 (0.0%) | 0.0 |
| Bachelor's Degree | 0 (0.0%) | 0.0 |
| Graduate Degree | 0 (0.0%) | 0.0 |
| Total | 0 (0.0%) | 0.0 |
Fertility by Education by Marriage Status in Deerfield
| Educational Attainment | Married | Unmarried |
| Less than High School | 0 (0.0%) | 0 (0.0%) |
| High School Diploma | 0 (0.0%) | 0 (0.0%) |
| College or Associate's Degree | 0 (0.0%) | 0 (0.0%) |
| Bachelor's Degree | 0 (0.0%) | 0 (0.0%) |
| Graduate Degree | 0 (0.0%) | 0 (0.0%) |
| Total | 0 (0.0%) | 0 (0.0%) |
Employment Characteristics in Deerfield
Employment by Class of Employer in Deerfield
Among the 287 employed individuals in Deerfield, not-for-profit organizations (172 | 59.9%), private company employees (100 | 34.8%), and local government employees (15 | 5.2%) make up the most common classes of employment.
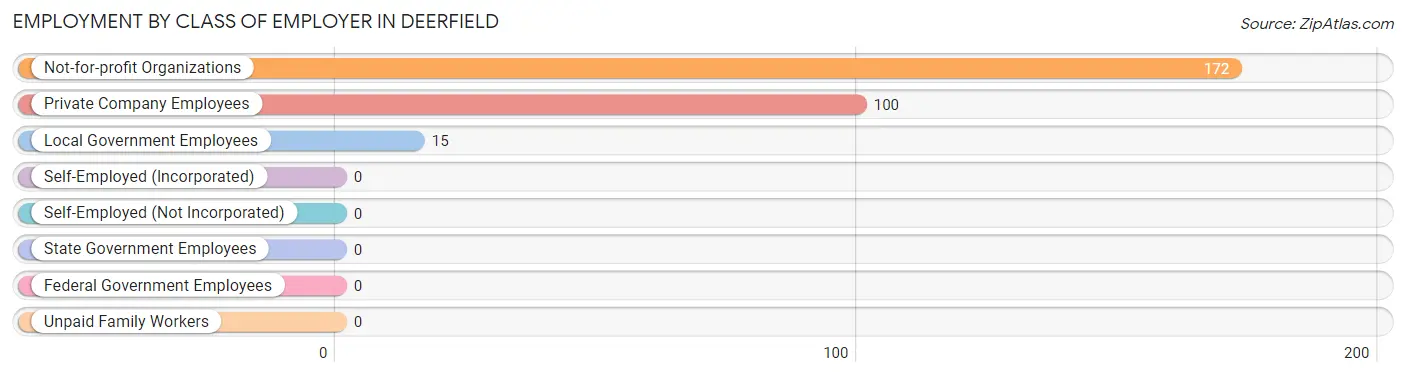
| Employer Class | # Employees | % Employees |
| Private Company Employees | 100 | 34.8% |
| Self-Employed (Incorporated) | 0 | 0.0% |
| Self-Employed (Not Incorporated) | 0 | 0.0% |
| Not-for-profit Organizations | 172 | 59.9% |
| Local Government Employees | 15 | 5.2% |
| State Government Employees | 0 | 0.0% |
| Federal Government Employees | 0 | 0.0% |
| Unpaid Family Workers | 0 | 0.0% |
| Total | 287 | 100.0% |
Employment Status by Age in Deerfield
According to the labor force statistics for Deerfield, out of the total population over 16 years of age (410), 75.6% or 310 individuals are in the labor force, with 7.4% or 23 of them unemployed. The age group with the highest labor force participation rate is 30 to 34 years, with 100.0% or 11 individuals in the labor force. Within the labor force, the 20 to 24 years age range has the highest percentage of unemployed individuals, with 38.6% or 17 of them being unemployed.

| Age Bracket | In Labor Force | Unemployed |
| 16 to 19 Years | 34 (66.7%) | 6 (17.6%) |
| 20 to 24 Years | 44 (88.0%) | 17 (38.6%) |
| 25 to 29 Years | 0 (0.0%) | 0 (0.0%) |
| 30 to 34 Years | 11 (100.0%) | 0 (0.0%) |
| 35 to 44 Years | 115 (91.3%) | 0 (0.0%) |
| 45 to 54 Years | 48 (100.0%) | 0 (0.0%) |
| 55 to 59 Years | 17 (100.0%) | 0 (0.0%) |
| 60 to 64 Years | 31 (47.7%) | 0 (0.0%) |
| 65 to 74 Years | 10 (23.8%) | 0 (0.0%) |
| 75 Years and over | 0 (0.0%) | 0 (0.0%) |
| Total | 310 (75.6%) | 23 (7.4%) |
Employment Status by Educational Attainment in Deerfield
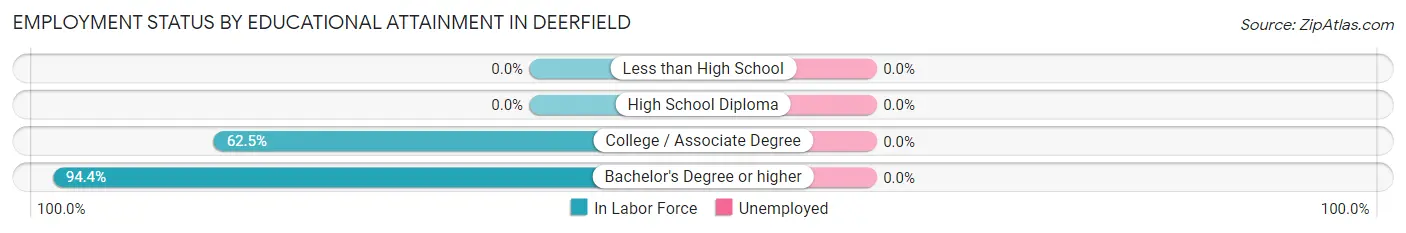
| Educational Attainment | In Labor Force | Unemployed |
| Less than High School | 0 (0.0%) | 0 (0.0%) |
| High School Diploma | 0 (0.0%) | 0 (0.0%) |
| College / Associate Degree | 35 (62.5%) | 0 (0.0%) |
| Bachelor's Degree or higher | 187 (94.4%) | 0 (0.0%) |
| Total | 222 (83.1%) | 0 (0.0%) |
Employment Occupations by Sex in Deerfield
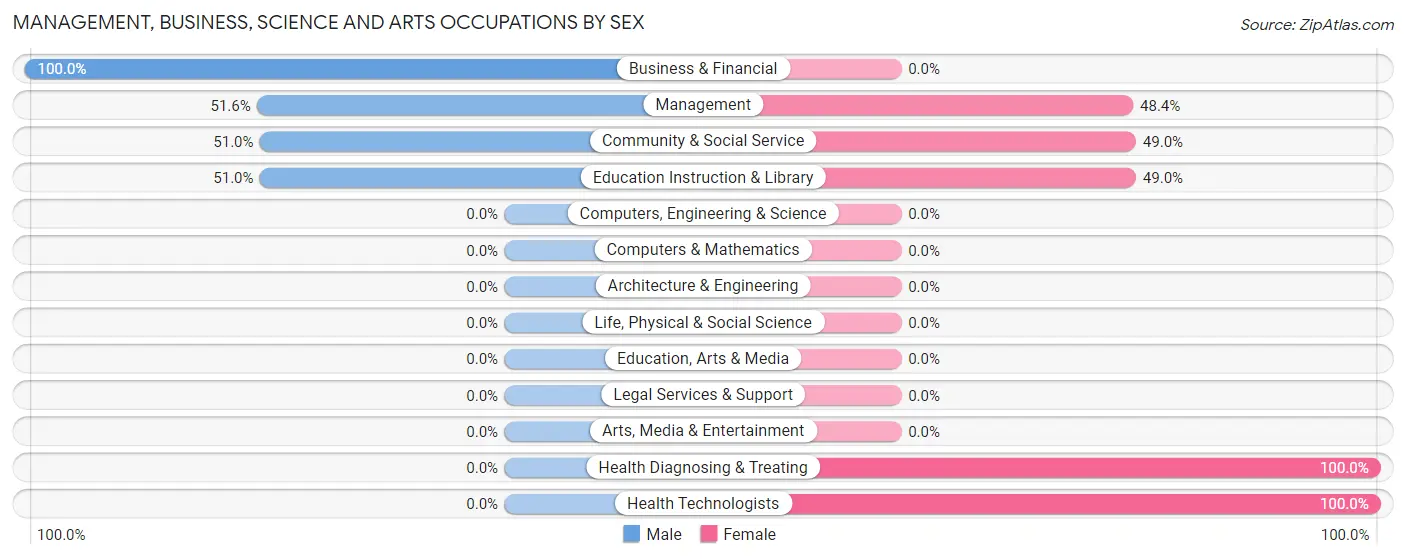
Management, Business, Science and Arts Occupations
The most common Management, Business, Science and Arts occupations in Deerfield are Community & Social Service (145 | 50.5%), Education Instruction & Library (145 | 50.5%), Management (31 | 10.8%), Health Diagnosing & Treating (11 | 3.8%), and Health Technologists (11 | 3.8%).
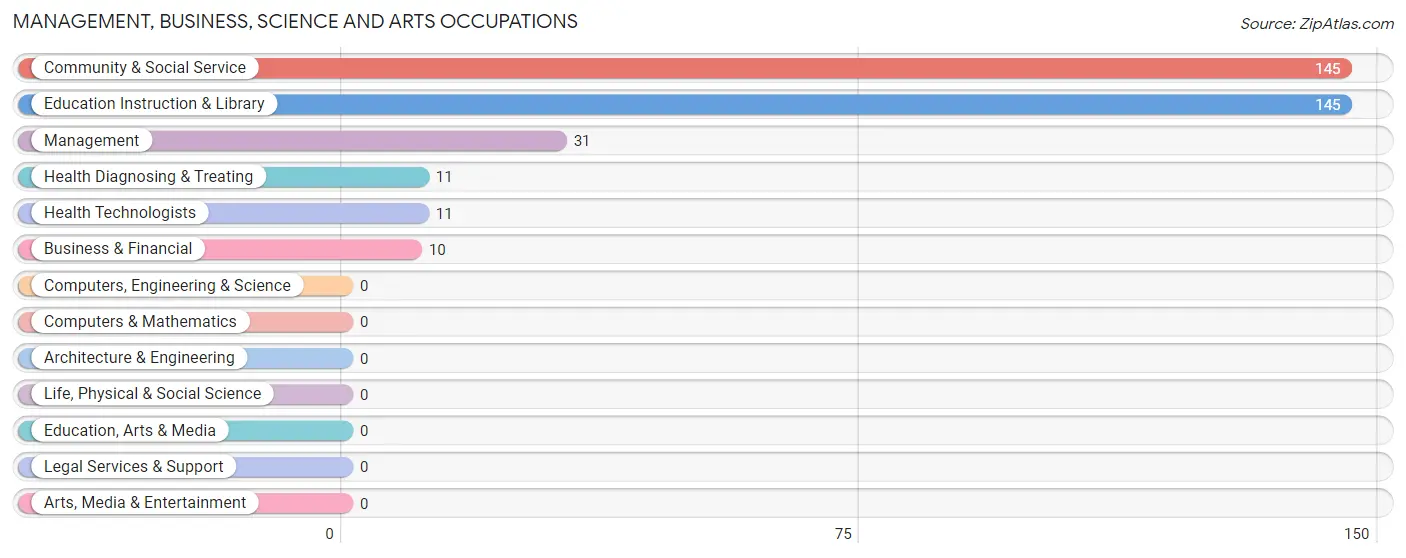
Management, Business, Science and Arts Occupations by Sex
Within the Management, Business, Science and Arts occupations in Deerfield, the most male-oriented occupations are Business & Financial (100.0%), Management (51.6%), and Community & Social Service (51.0%), while the most female-oriented occupations are Health Diagnosing & Treating (100.0%), Health Technologists (100.0%), and Community & Social Service (49.0%).
| Occupation | Male | Female |
| Management | 16 (51.6%) | 15 (48.4%) |
| Business & Financial | 10 (100.0%) | 0 (0.0%) |
| Computers, Engineering & Science | 0 (0.0%) | 0 (0.0%) |
| Computers & Mathematics | 0 (0.0%) | 0 (0.0%) |
| Architecture & Engineering | 0 (0.0%) | 0 (0.0%) |
| Life, Physical & Social Science | 0 (0.0%) | 0 (0.0%) |
| Community & Social Service | 74 (51.0%) | 71 (49.0%) |
| Education, Arts & Media | 0 (0.0%) | 0 (0.0%) |
| Legal Services & Support | 0 (0.0%) | 0 (0.0%) |
| Education Instruction & Library | 74 (51.0%) | 71 (49.0%) |
| Arts, Media & Entertainment | 0 (0.0%) | 0 (0.0%) |
| Health Diagnosing & Treating | 0 (0.0%) | 11 (100.0%) |
| Health Technologists | 0 (0.0%) | 11 (100.0%) |
| Total (Category) | 100 (50.8%) | 97 (49.2%) |
| Total (Overall) | 190 (66.2%) | 97 (33.8%) |
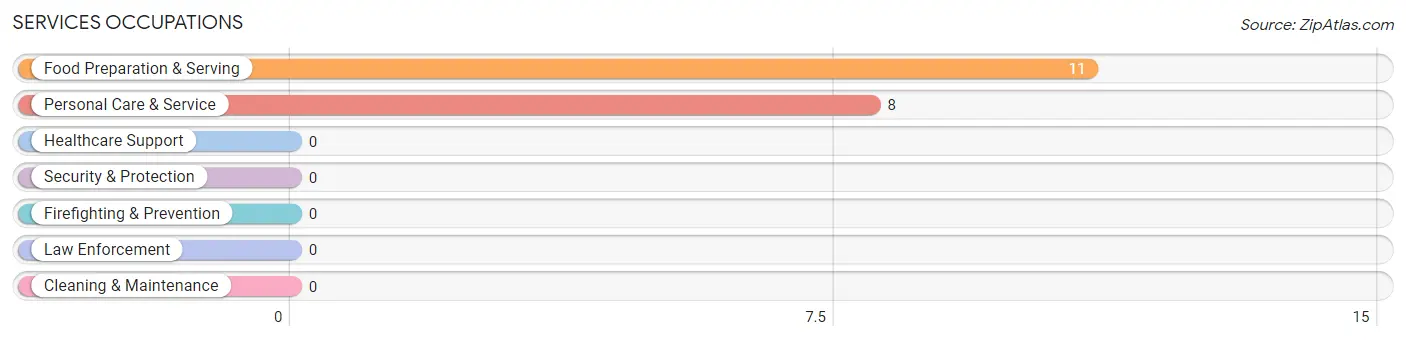
Services Occupations
The most common Services occupations in Deerfield are Food Preparation & Serving (11 | 3.8%), and Personal Care & Service (8 | 2.8%).
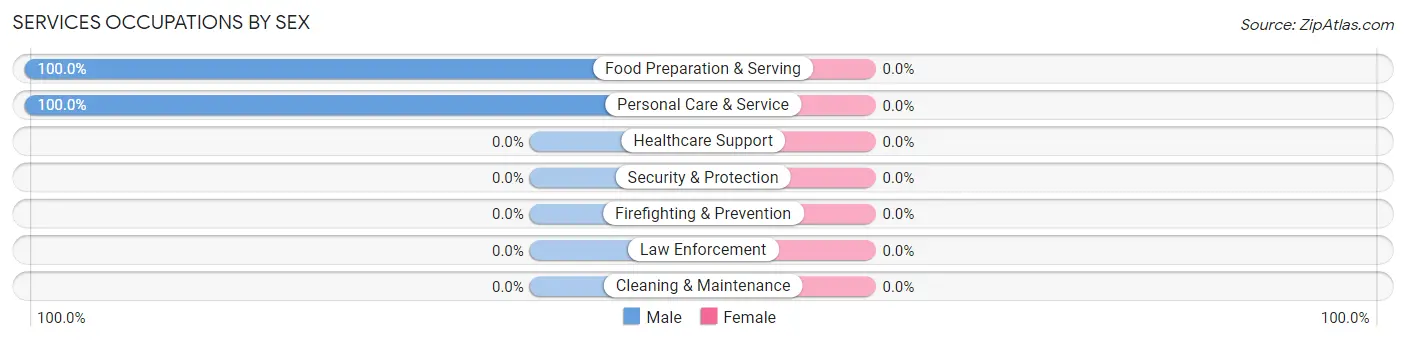
Services Occupations by Sex
| Occupation | Male | Female |
| Healthcare Support | 0 (0.0%) | 0 (0.0%) |
| Security & Protection | 0 (0.0%) | 0 (0.0%) |
| Firefighting & Prevention | 0 (0.0%) | 0 (0.0%) |
| Law Enforcement | 0 (0.0%) | 0 (0.0%) |
| Food Preparation & Serving | 11 (100.0%) | 0 (0.0%) |
| Cleaning & Maintenance | 0 (0.0%) | 0 (0.0%) |
| Personal Care & Service | 8 (100.0%) | 0 (0.0%) |
| Total (Category) | 19 (100.0%) | 0 (0.0%) |
| Total (Overall) | 190 (66.2%) | 97 (33.8%) |
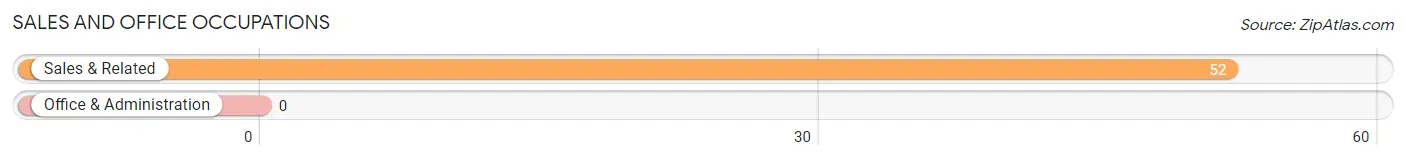
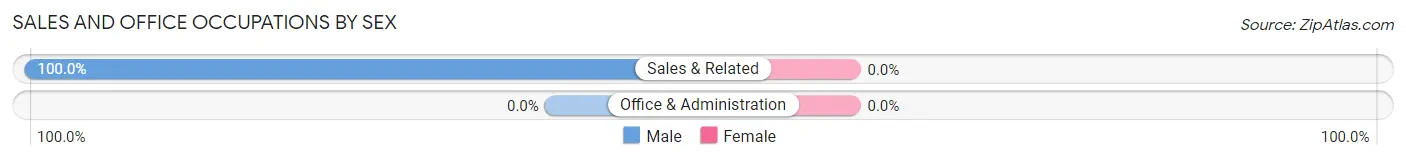
Sales and Office Occupations
The most common Sales and Office occupations in Deerfield are , and Sales & Related (52 | 18.1%).
Sales and Office Occupations by Sex
| Occupation | Male | Female |
| Sales & Related | 52 (100.0%) | 0 (0.0%) |
| Office & Administration | 0 (0.0%) | 0 (0.0%) |
| Total (Category) | 52 (100.0%) | 0 (0.0%) |
| Total (Overall) | 190 (66.2%) | 97 (33.8%) |
Natural Resources, Construction and Maintenance Occupations
The most common Natural Resources, Construction and Maintenance occupations in Deerfield are , and Construction & Extraction (19 | 6.6%).
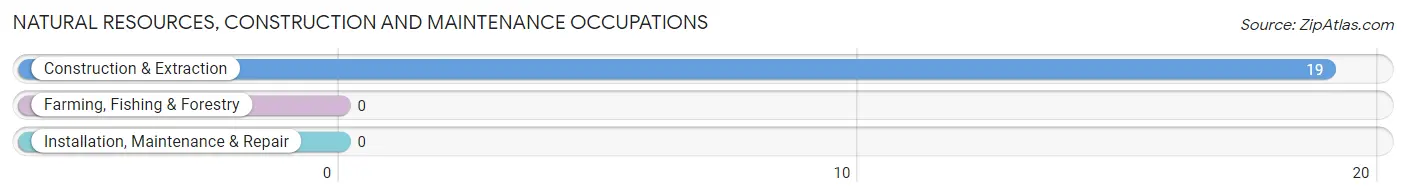
Natural Resources, Construction and Maintenance Occupations by Sex
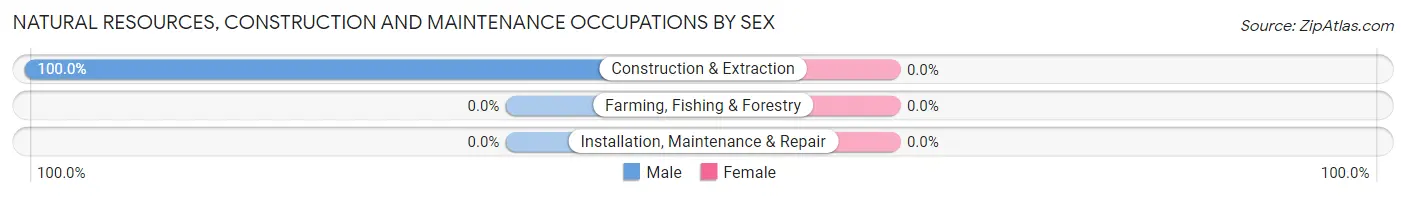
| Occupation | Male | Female |
| Farming, Fishing & Forestry | 0 (0.0%) | 0 (0.0%) |
| Construction & Extraction | 19 (100.0%) | 0 (0.0%) |
| Installation, Maintenance & Repair | 0 (0.0%) | 0 (0.0%) |
| Total (Category) | 19 (100.0%) | 0 (0.0%) |
| Total (Overall) | 190 (66.2%) | 97 (33.8%) |
Production, Transportation and Moving Occupations
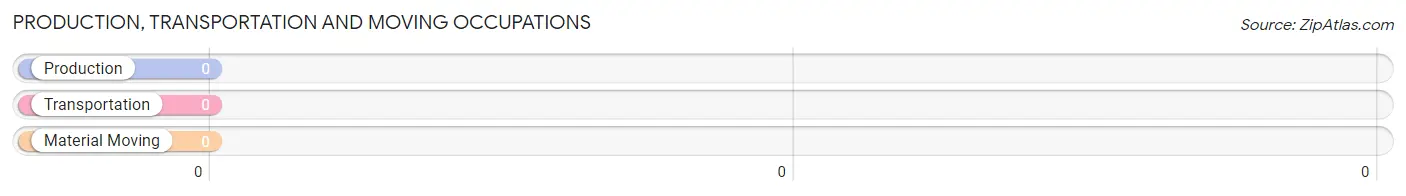
Production, Transportation and Moving Occupations by Sex
| Occupation | Male | Female |
| Production | 0 (0.0%) | 0 (0.0%) |
| Transportation | 0 (0.0%) | 0 (0.0%) |
| Material Moving | 0 (0.0%) | 0 (0.0%) |
| Total (Category) | 0 (0.0%) | 0 (0.0%) |
| Total (Overall) | 190 (66.2%) | 97 (33.8%) |
Employment Industries by Sex in Deerfield
Employment Industries in Deerfield
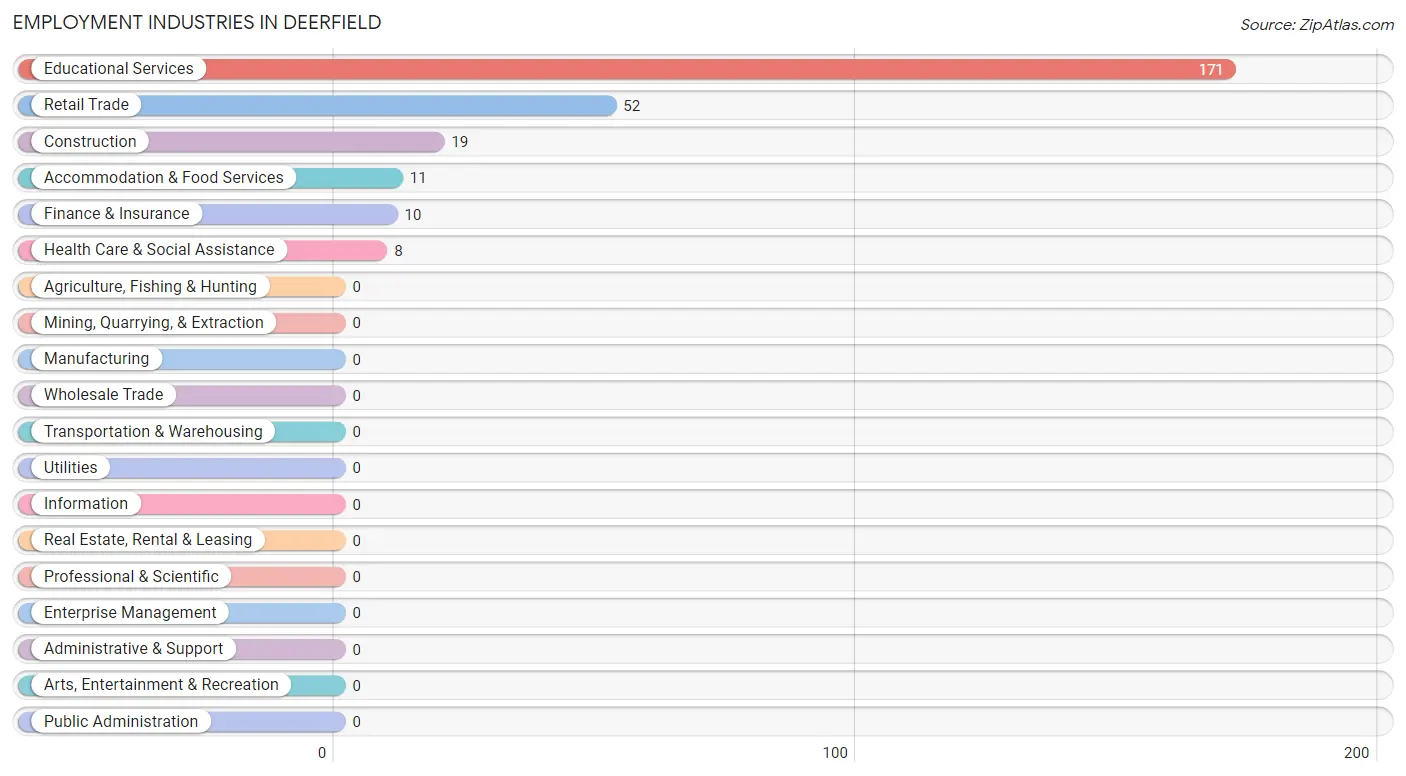
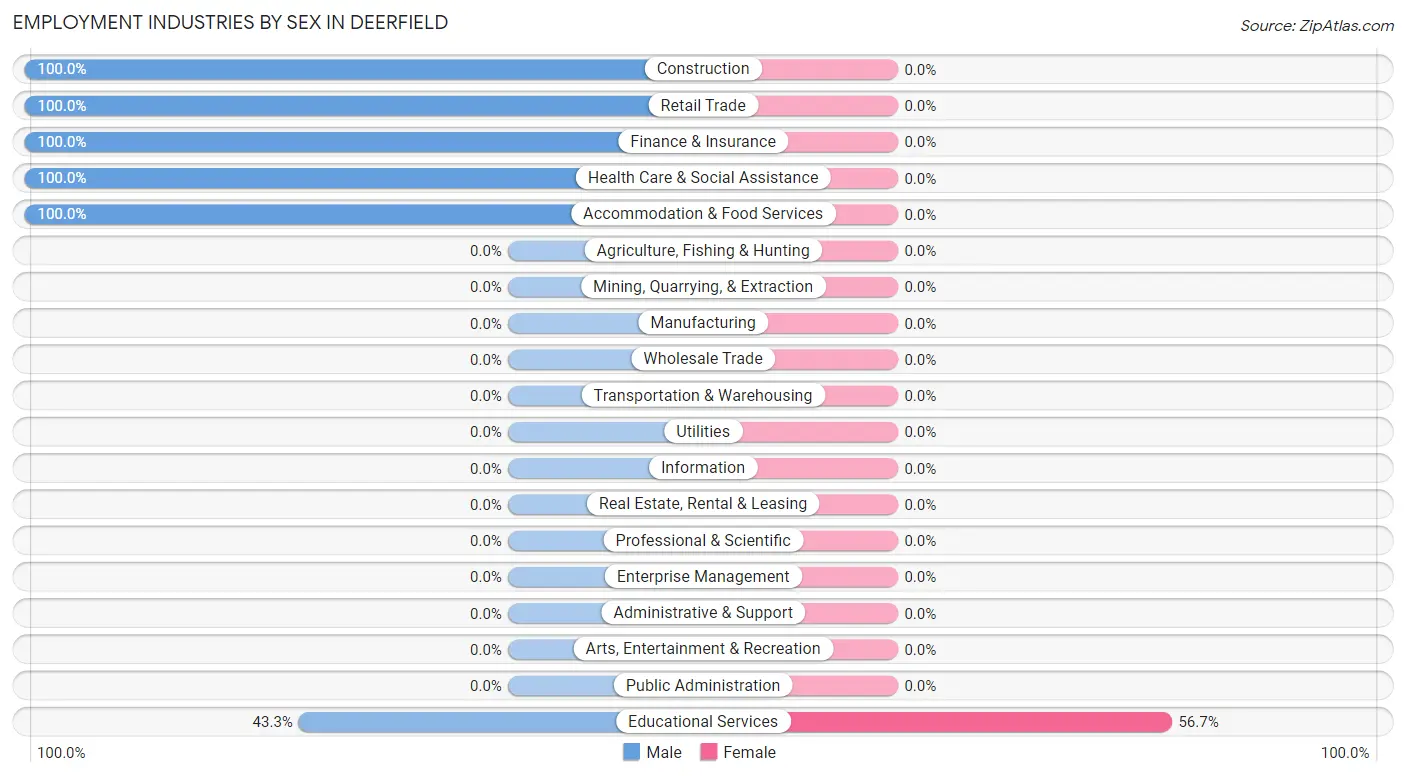
The major employment industries in Deerfield include Educational Services (171 | 59.6%), Retail Trade (52 | 18.1%), Construction (19 | 6.6%), Accommodation & Food Services (11 | 3.8%), and Finance & Insurance (10 | 3.5%).
Employment Industries by Sex in Deerfield
| Industry | Male | Female |
| Agriculture, Fishing & Hunting | 0 (0.0%) | 0 (0.0%) |
| Mining, Quarrying, & Extraction | 0 (0.0%) | 0 (0.0%) |
| Construction | 19 (100.0%) | 0 (0.0%) |
| Manufacturing | 0 (0.0%) | 0 (0.0%) |
| Wholesale Trade | 0 (0.0%) | 0 (0.0%) |
| Retail Trade | 52 (100.0%) | 0 (0.0%) |
| Transportation & Warehousing | 0 (0.0%) | 0 (0.0%) |
| Utilities | 0 (0.0%) | 0 (0.0%) |
| Information | 0 (0.0%) | 0 (0.0%) |
| Finance & Insurance | 10 (100.0%) | 0 (0.0%) |
| Real Estate, Rental & Leasing | 0 (0.0%) | 0 (0.0%) |
| Professional & Scientific | 0 (0.0%) | 0 (0.0%) |
| Enterprise Management | 0 (0.0%) | 0 (0.0%) |
| Administrative & Support | 0 (0.0%) | 0 (0.0%) |
| Educational Services | 74 (43.3%) | 97 (56.7%) |
| Health Care & Social Assistance | 8 (100.0%) | 0 (0.0%) |
| Arts, Entertainment & Recreation | 0 (0.0%) | 0 (0.0%) |
| Accommodation & Food Services | 11 (100.0%) | 0 (0.0%) |
| Public Administration | 0 (0.0%) | 0 (0.0%) |
| Total | 190 (66.2%) | 97 (33.8%) |
Education in Deerfield
School Enrollment in Deerfield
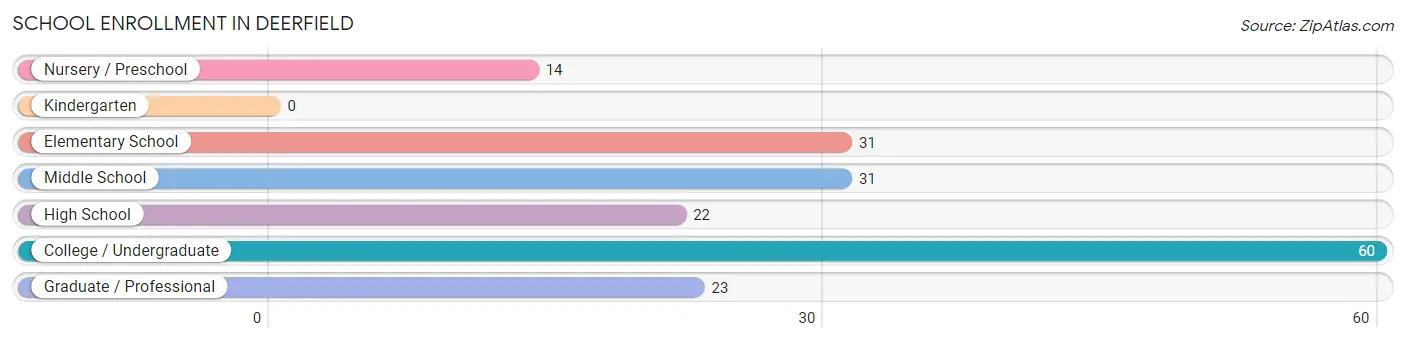
The most common levels of schooling among the 181 students in Deerfield are college / undergraduate (60 | 33.2%), elementary school (31 | 17.1%), and middle school (31 | 17.1%).
| School Level | # Students | % Students |
| Nursery / Preschool | 14 | 7.7% |
| Kindergarten | 0 | 0.0% |
| Elementary School | 31 | 17.1% |
| Middle School | 31 | 17.1% |
| High School | 22 | 12.1% |
| College / Undergraduate | 60 | 33.2% |
| Graduate / Professional | 23 | 12.7% |
| Total | 181 | 100.0% |
School Enrollment by Age by Funding Source in Deerfield
Out of a total of 181 students who are enrolled in schools in Deerfield, 125 (69.1%) attend a private institution, while the remaining 56 (30.9%) are enrolled in public schools. The age group of 3 to 4 year olds has the highest likelihood of being enrolled in private schools, with 14 (100.0% in the age bracket) enrolled. Conversely, the age group of 15 to 17 year olds has the lowest likelihood of being enrolled in a private school, with 22 (100.0% in the age bracket) attending a public institution.
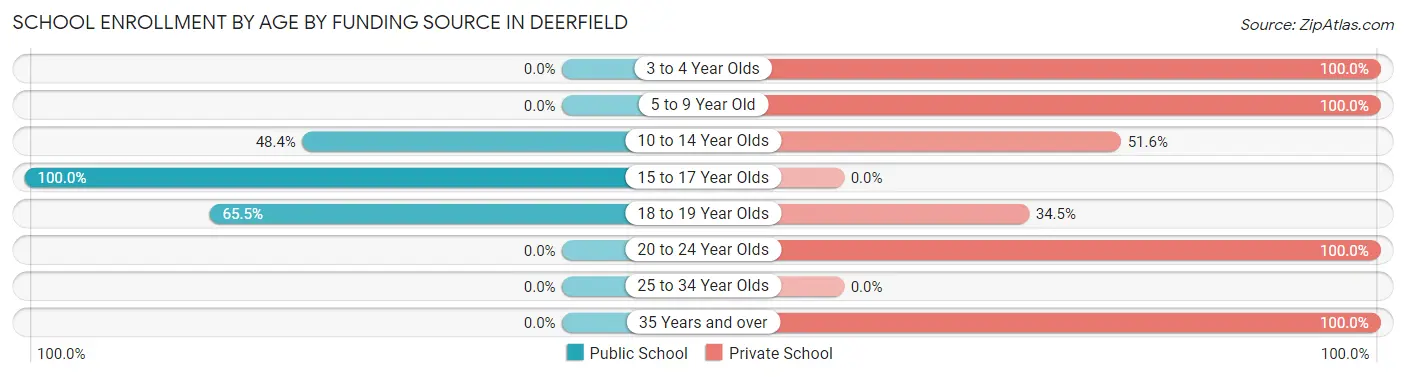
| Age Bracket | Public School | Private School |
| 3 to 4 Year Olds | 0 (0.0%) | 14 (100.0%) |
| 5 to 9 Year Old | 0 (0.0%) | 31 (100.0%) |
| 10 to 14 Year Olds | 15 (48.4%) | 16 (51.6%) |
| 15 to 17 Year Olds | 22 (100.0%) | 0 (0.0%) |
| 18 to 19 Year Olds | 19 (65.5%) | 10 (34.5%) |
| 20 to 24 Year Olds | 0 (0.0%) | 31 (100.0%) |
| 25 to 34 Year Olds | 0 (0.0%) | 0 (0.0%) |
| 35 Years and over | 0 (0.0%) | 23 (100.0%) |
| Total | 56 (30.9%) | 125 (69.1%) |
Educational Attainment by Field of Study in Deerfield
Literature & languages (72 | 27.4%), science & technology (49 | 18.6%), physical & health sciences (48 | 18.2%), liberal arts & history (48 | 18.2%), and visual & performing arts (20 | 7.6%) are the most common fields of study among 263 individuals in Deerfield who have obtained a bachelor's degree or higher.
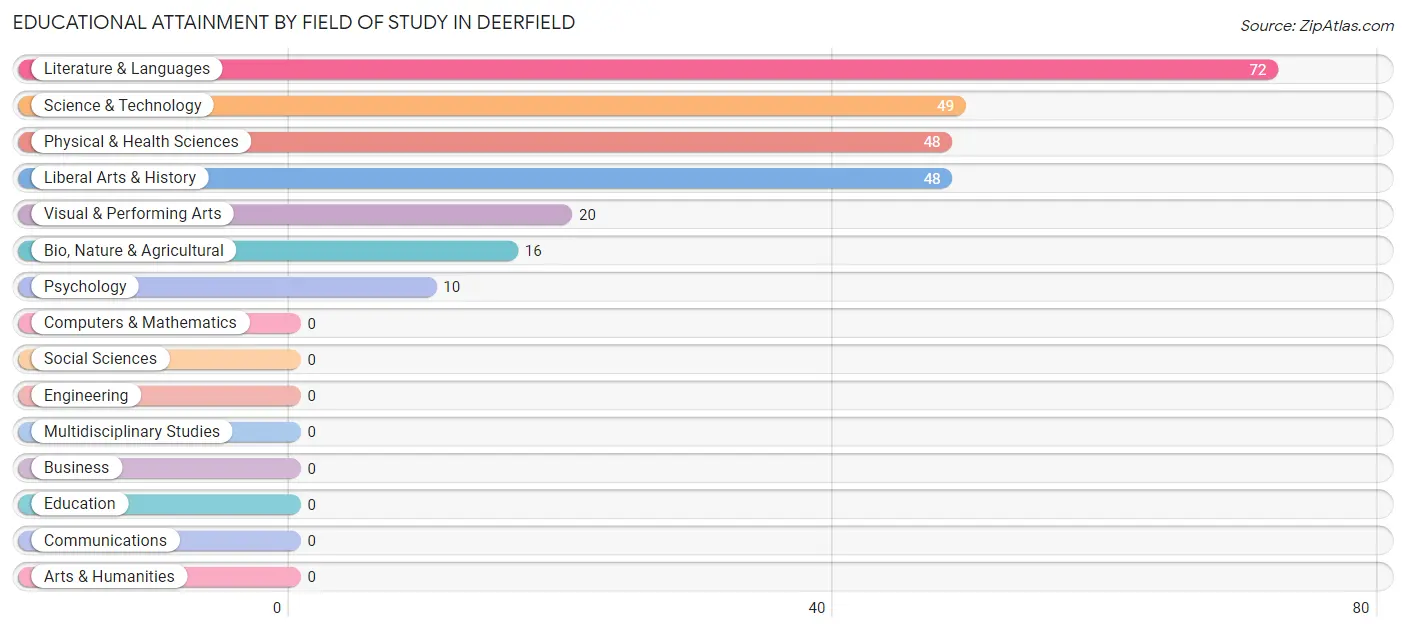
| Field of Study | # Graduates | % Graduates |
| Computers & Mathematics | 0 | 0.0% |
| Bio, Nature & Agricultural | 16 | 6.1% |
| Physical & Health Sciences | 48 | 18.2% |
| Psychology | 10 | 3.8% |
| Social Sciences | 0 | 0.0% |
| Engineering | 0 | 0.0% |
| Multidisciplinary Studies | 0 | 0.0% |
| Science & Technology | 49 | 18.6% |
| Business | 0 | 0.0% |
| Education | 0 | 0.0% |
| Literature & Languages | 72 | 27.4% |
| Liberal Arts & History | 48 | 18.2% |
| Visual & Performing Arts | 20 | 7.6% |
| Communications | 0 | 0.0% |
| Arts & Humanities | 0 | 0.0% |
| Total | 263 | 100.0% |
Transportation & Commute in Deerfield
Vehicle Availability by Sex in Deerfield
The most prevalent vehicle ownership categories in Deerfield are males with 2 vehicles (97, accounting for 70.3%) and females with 2 vehicles (57, making up 112.8%).
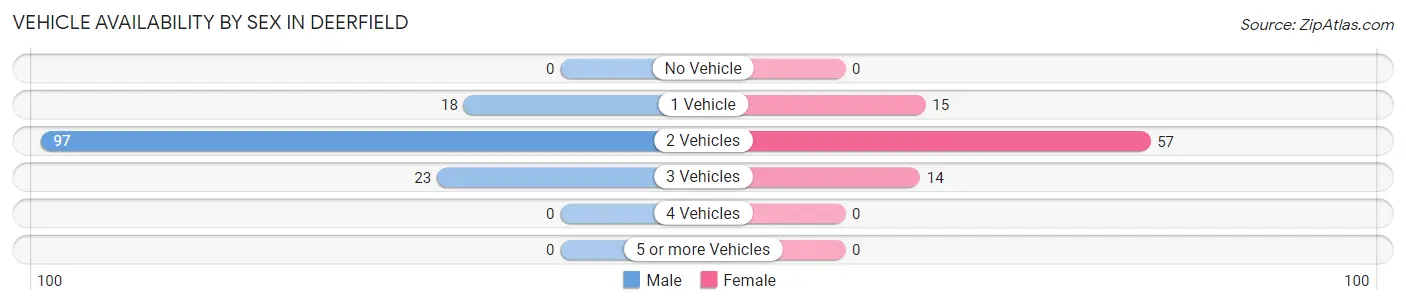
| Vehicles Available | Male | Female |
| No Vehicle | 0 (0.0%) | 0 (0.0%) |
| 1 Vehicle | 18 (13.0%) | 15 (17.4%) |
| 2 Vehicles | 97 (70.3%) | 57 (66.3%) |
| 3 Vehicles | 23 (16.7%) | 14 (16.3%) |
| 4 Vehicles | 0 (0.0%) | 0 (0.0%) |
| 5 or more Vehicles | 0 (0.0%) | 0 (0.0%) |
| Total | 138 (100.0%) | 86 (100.0%) |
Commute Time in Deerfield
The most frequently occuring commute durations in Deerfield are 5 to 9 minutes (147 commuters, 58.8%), less than 5 minutes (46 commuters, 18.4%), and 10 to 14 minutes (27 commuters, 10.8%).
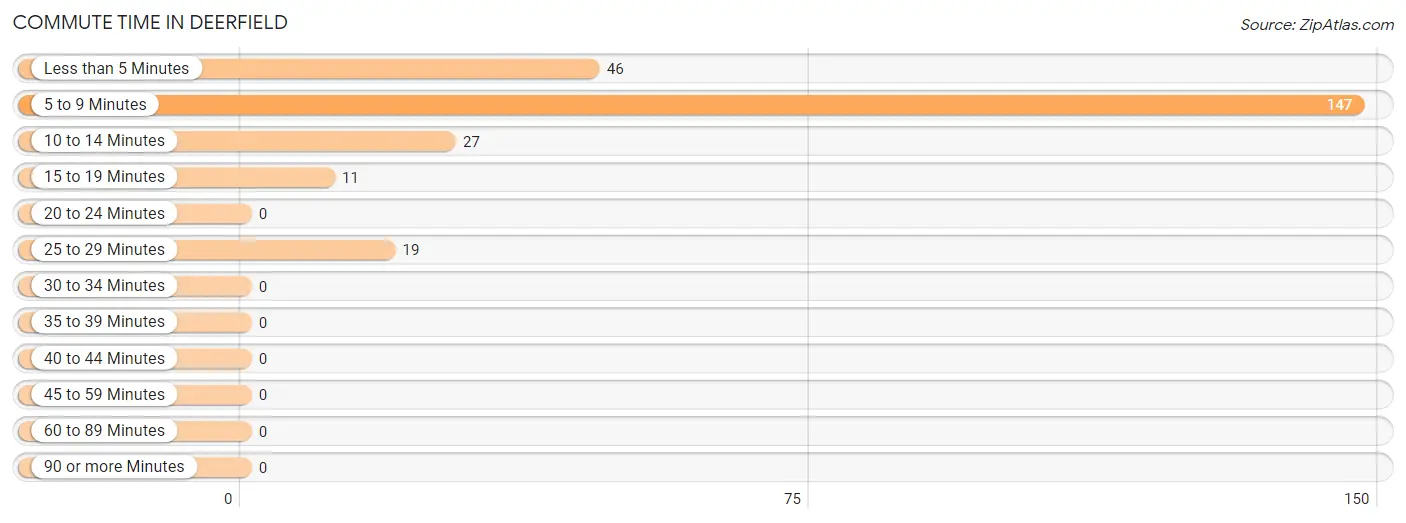
| Commute Time | # Commuters | % Commuters |
| Less than 5 Minutes | 46 | 18.4% |
| 5 to 9 Minutes | 147 | 58.8% |
| 10 to 14 Minutes | 27 | 10.8% |
| 15 to 19 Minutes | 11 | 4.4% |
| 20 to 24 Minutes | 0 | 0.0% |
| 25 to 29 Minutes | 19 | 7.6% |
| 30 to 34 Minutes | 0 | 0.0% |
| 35 to 39 Minutes | 0 | 0.0% |
| 40 to 44 Minutes | 0 | 0.0% |
| 45 to 59 Minutes | 0 | 0.0% |
| 60 to 89 Minutes | 0 | 0.0% |
| 90 or more Minutes | 0 | 0.0% |
Commute Time by Sex in Deerfield
The most common commute times in Deerfield are 5 to 9 minutes (65 commuters, 38.7%) for males and 5 to 9 minutes (82 commuters, 100.0%) for females.
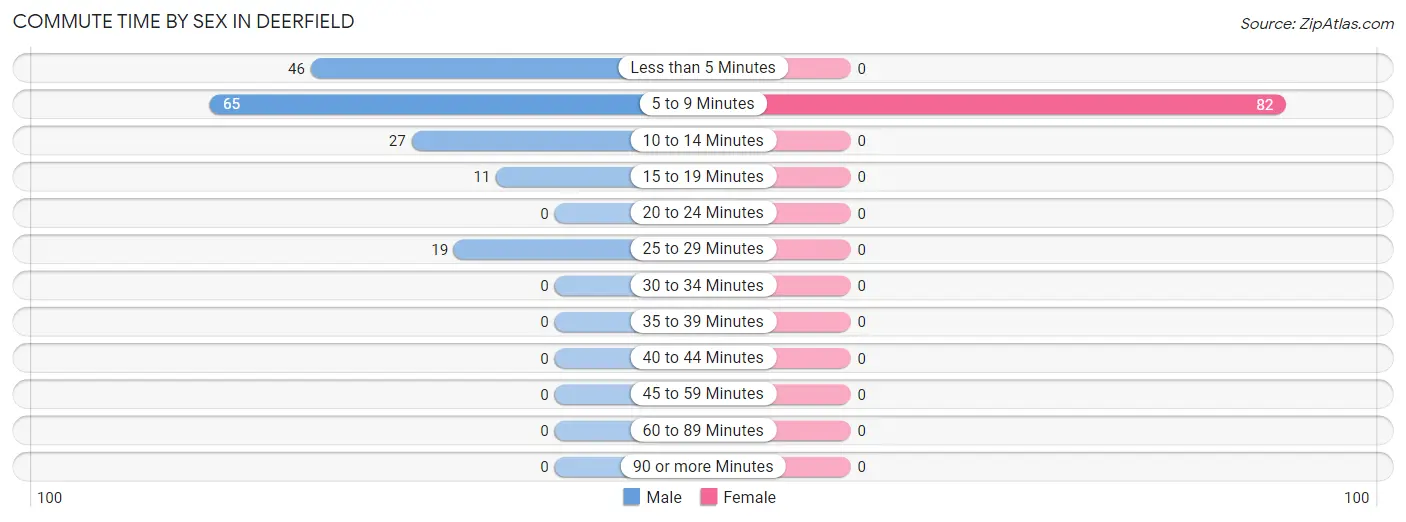
| Commute Time | Male | Female |
| Less than 5 Minutes | 46 (27.4%) | 0 (0.0%) |
| 5 to 9 Minutes | 65 (38.7%) | 82 (100.0%) |
| 10 to 14 Minutes | 27 (16.1%) | 0 (0.0%) |
| 15 to 19 Minutes | 11 (6.6%) | 0 (0.0%) |
| 20 to 24 Minutes | 0 (0.0%) | 0 (0.0%) |
| 25 to 29 Minutes | 19 (11.3%) | 0 (0.0%) |
| 30 to 34 Minutes | 0 (0.0%) | 0 (0.0%) |
| 35 to 39 Minutes | 0 (0.0%) | 0 (0.0%) |
| 40 to 44 Minutes | 0 (0.0%) | 0 (0.0%) |
| 45 to 59 Minutes | 0 (0.0%) | 0 (0.0%) |
| 60 to 89 Minutes | 0 (0.0%) | 0 (0.0%) |
| 90 or more Minutes | 0 (0.0%) | 0 (0.0%) |
Time of Departure to Work by Sex in Deerfield
The most frequent times of departure to work in Deerfield are 9:00 AM to 9:59 AM (46, 27.4%) for males and 8:30 AM to 8:59 AM (26, 31.7%) for females.
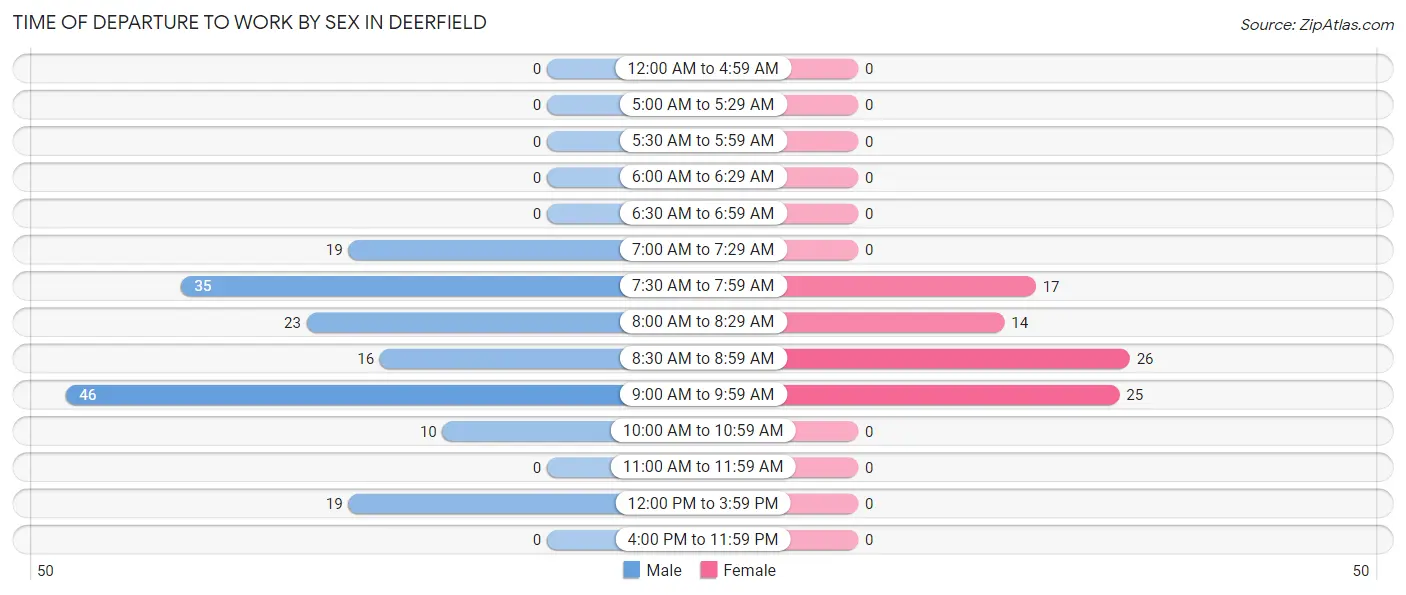
| Time of Departure | Male | Female |
| 12:00 AM to 4:59 AM | 0 (0.0%) | 0 (0.0%) |
| 5:00 AM to 5:29 AM | 0 (0.0%) | 0 (0.0%) |
| 5:30 AM to 5:59 AM | 0 (0.0%) | 0 (0.0%) |
| 6:00 AM to 6:29 AM | 0 (0.0%) | 0 (0.0%) |
| 6:30 AM to 6:59 AM | 0 (0.0%) | 0 (0.0%) |
| 7:00 AM to 7:29 AM | 19 (11.3%) | 0 (0.0%) |
| 7:30 AM to 7:59 AM | 35 (20.8%) | 17 (20.7%) |
| 8:00 AM to 8:29 AM | 23 (13.7%) | 14 (17.1%) |
| 8:30 AM to 8:59 AM | 16 (9.5%) | 26 (31.7%) |
| 9:00 AM to 9:59 AM | 46 (27.4%) | 25 (30.5%) |
| 10:00 AM to 10:59 AM | 10 (5.9%) | 0 (0.0%) |
| 11:00 AM to 11:59 AM | 0 (0.0%) | 0 (0.0%) |
| 12:00 PM to 3:59 PM | 19 (11.3%) | 0 (0.0%) |
| 4:00 PM to 11:59 PM | 0 (0.0%) | 0 (0.0%) |
| Total | 168 (100.0%) | 82 (100.0%) |
Housing Occupancy in Deerfield
Occupancy by Ownership in Deerfield
Of the total 136 dwellings in Deerfield, owner-occupied units account for 46 (33.8%), while renter-occupied units make up 90 (66.2%).
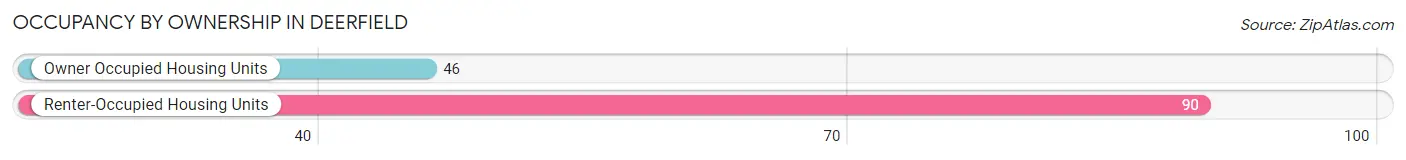
| Occupancy | # Housing Units | % Housing Units |
| Owner Occupied Housing Units | 46 | 33.8% |
| Renter-Occupied Housing Units | 90 | 66.2% |
| Total Occupied Housing Units | 136 | 100.0% |
Occupancy by Household Size in Deerfield
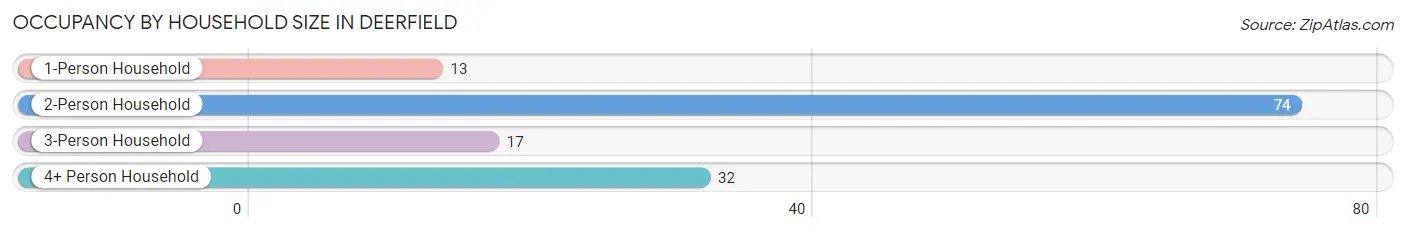
| Household Size | # Housing Units | % Housing Units |
| 1-Person Household | 13 | 9.6% |
| 2-Person Household | 74 | 54.4% |
| 3-Person Household | 17 | 12.5% |
| 4+ Person Household | 32 | 23.5% |
| Total Housing Units | 136 | 100.0% |
Occupancy by Ownership by Household Size in Deerfield
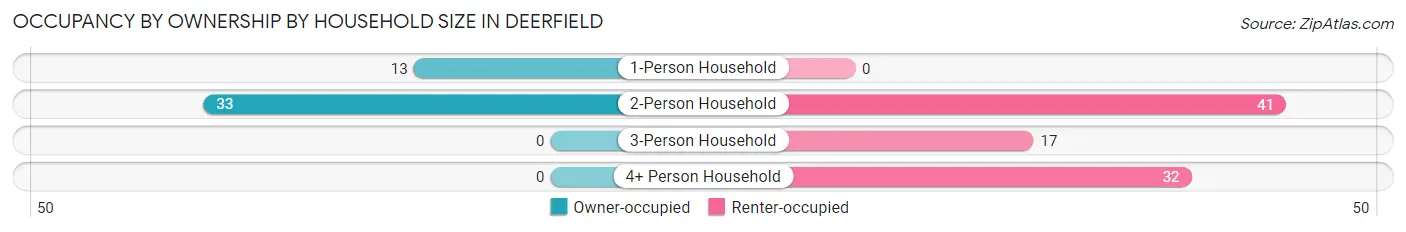
| Household Size | Owner-occupied | Renter-occupied |
| 1-Person Household | 13 (100.0%) | 0 (0.0%) |
| 2-Person Household | 33 (44.6%) | 41 (55.4%) |
| 3-Person Household | 0 (0.0%) | 17 (100.0%) |
| 4+ Person Household | 0 (0.0%) | 32 (100.0%) |
| Total Housing Units | 46 (33.8%) | 90 (66.2%) |
Occupancy by Educational Attainment in Deerfield
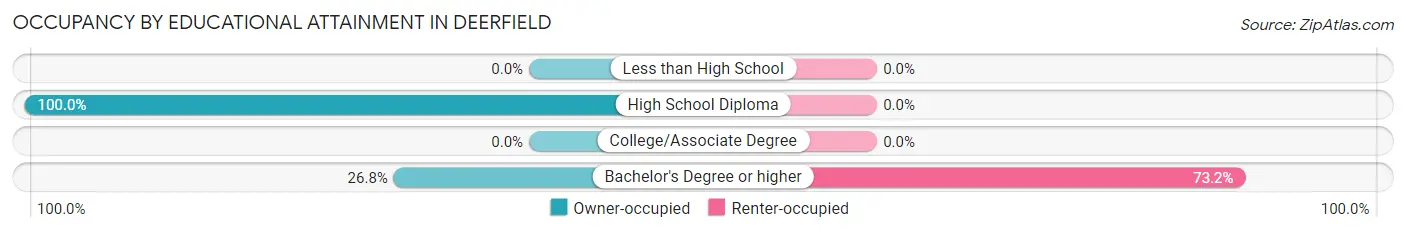
| Household Size | Owner-occupied | Renter-occupied |
| Less than High School | 0 (0.0%) | 0 (0.0%) |
| High School Diploma | 13 (100.0%) | 0 (0.0%) |
| College/Associate Degree | 0 (0.0%) | 0 (0.0%) |
| Bachelor's Degree or higher | 33 (26.8%) | 90 (73.2%) |
Occupancy by Age of Householder in Deerfield
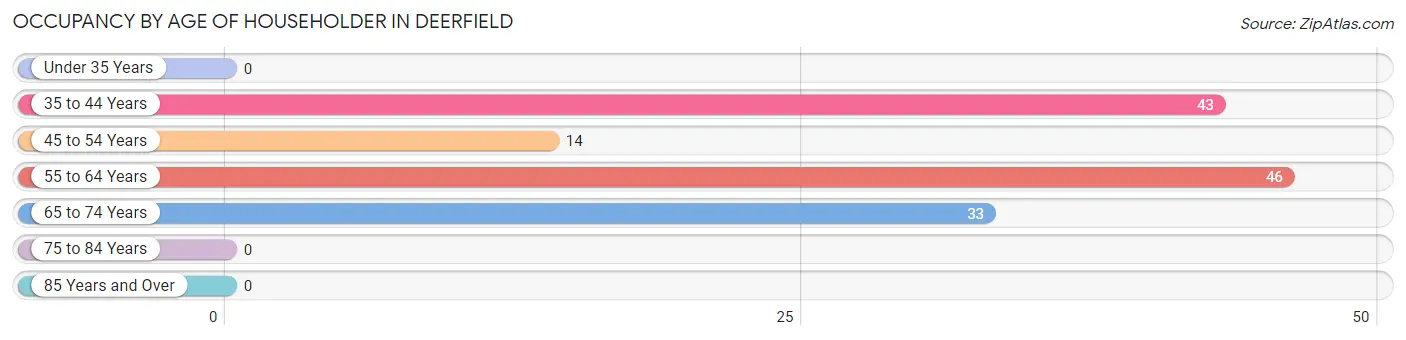
| Age Bracket | # Households | % Households |
| Under 35 Years | 0 | 0.0% |
| 35 to 44 Years | 43 | 31.6% |
| 45 to 54 Years | 14 | 10.3% |
| 55 to 64 Years | 46 | 33.8% |
| 65 to 74 Years | 33 | 24.3% |
| 75 to 84 Years | 0 | 0.0% |
| 85 Years and Over | 0 | 0.0% |
| Total | 136 | 100.0% |
Housing Finances in Deerfield
Median Income by Occupancy in Deerfield
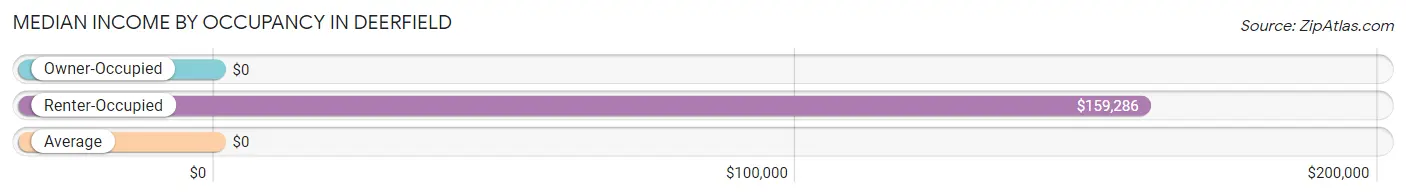
| Occupancy Type | # Households | Median Income |
| Owner-Occupied | 46 (33.8%) | $0 |
| Renter-Occupied | 90 (66.2%) | $159,286 |
| Average | 136 (100.0%) | $0 |
Occupancy by Householder Income Bracket in Deerfield
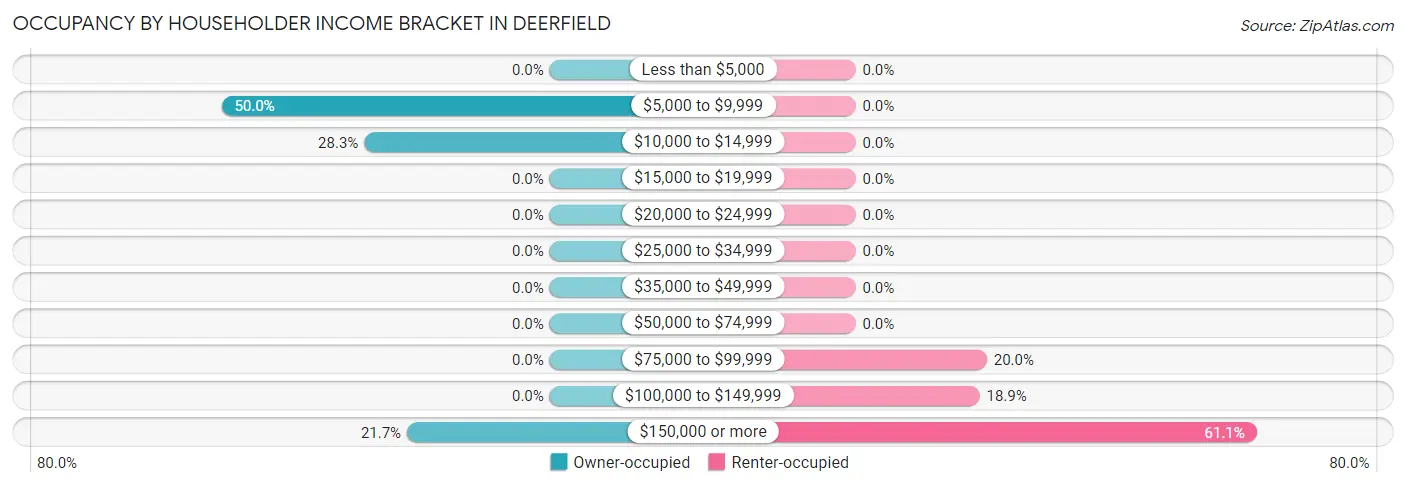
| Income Bracket | Owner-occupied | Renter-occupied |
| Less than $5,000 | 0 (0.0%) | 0 (0.0%) |
| $5,000 to $9,999 | 23 (50.0%) | 0 (0.0%) |
| $10,000 to $14,999 | 13 (28.3%) | 0 (0.0%) |
| $15,000 to $19,999 | 0 (0.0%) | 0 (0.0%) |
| $20,000 to $24,999 | 0 (0.0%) | 0 (0.0%) |
| $25,000 to $34,999 | 0 (0.0%) | 0 (0.0%) |
| $35,000 to $49,999 | 0 (0.0%) | 0 (0.0%) |
| $50,000 to $74,999 | 0 (0.0%) | 0 (0.0%) |
| $75,000 to $99,999 | 0 (0.0%) | 18 (20.0%) |
| $100,000 to $149,999 | 0 (0.0%) | 17 (18.9%) |
| $150,000 or more | 10 (21.7%) | 55 (61.1%) |
| Total | 46 (100.0%) | 90 (100.0%) |
Monthly Housing Cost Tiers in Deerfield
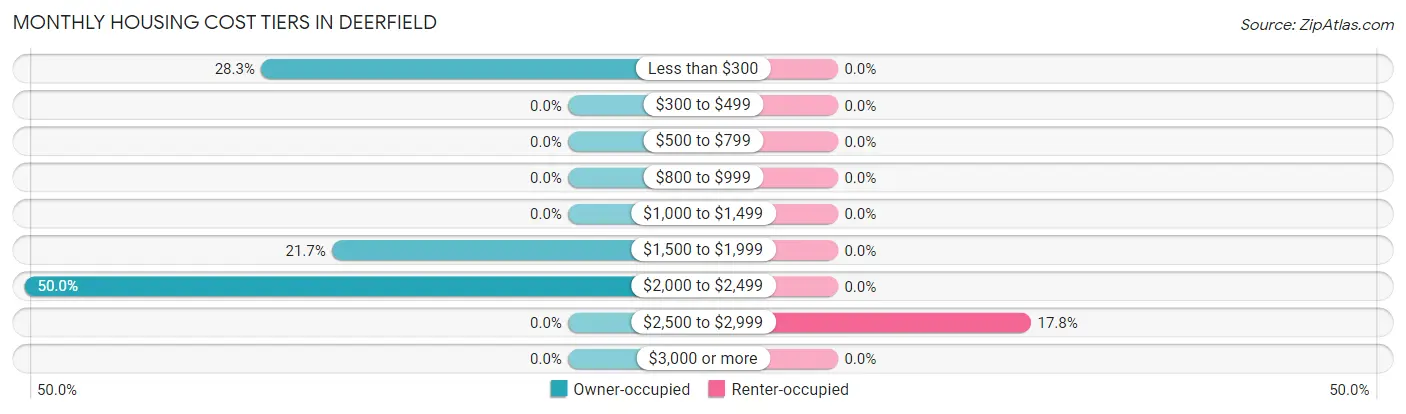
| Monthly Cost | Owner-occupied | Renter-occupied |
| Less than $300 | 13 (28.3%) | 0 (0.0%) |
| $300 to $499 | 0 (0.0%) | 0 (0.0%) |
| $500 to $799 | 0 (0.0%) | 0 (0.0%) |
| $800 to $999 | 0 (0.0%) | 0 (0.0%) |
| $1,000 to $1,499 | 0 (0.0%) | 0 (0.0%) |
| $1,500 to $1,999 | 10 (21.7%) | 0 (0.0%) |
| $2,000 to $2,499 | 23 (50.0%) | 0 (0.0%) |
| $2,500 to $2,999 | 0 (0.0%) | 16 (17.8%) |
| $3,000 or more | 0 (0.0%) | 0 (0.0%) |
| Total | 46 (100.0%) | 90 (100.0%) |
Physical Housing Characteristics in Deerfield
Housing Structures in Deerfield
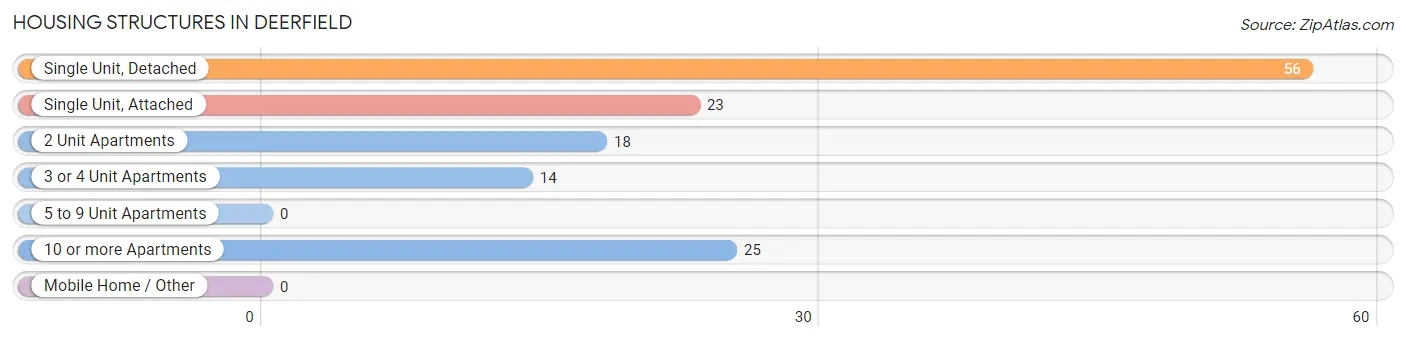
| Structure Type | # Housing Units | % Housing Units |
| Single Unit, Detached | 56 | 41.2% |
| Single Unit, Attached | 23 | 16.9% |
| 2 Unit Apartments | 18 | 13.2% |
| 3 or 4 Unit Apartments | 14 | 10.3% |
| 5 to 9 Unit Apartments | 0 | 0.0% |
| 10 or more Apartments | 25 | 18.4% |
| Mobile Home / Other | 0 | 0.0% |
| Total | 136 | 100.0% |
Housing Structures by Occupancy in Deerfield
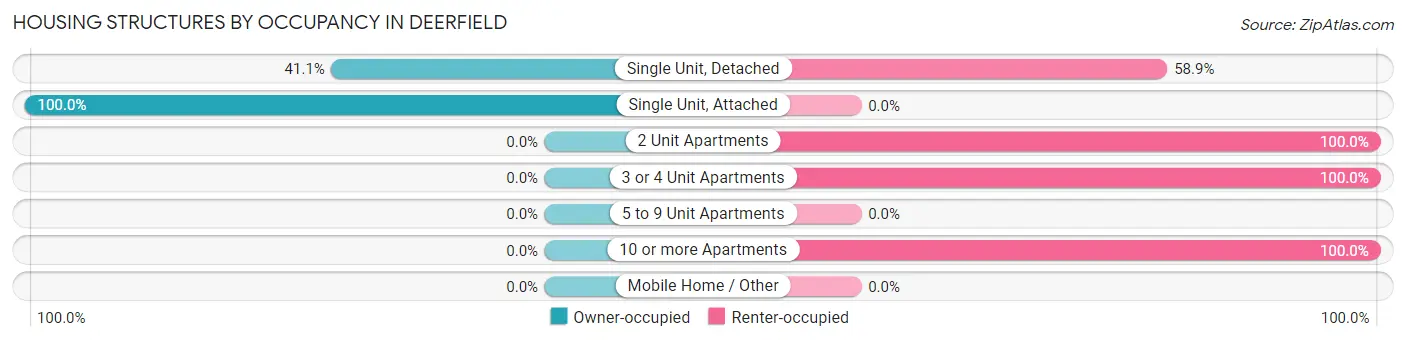
| Structure Type | Owner-occupied | Renter-occupied |
| Single Unit, Detached | 23 (41.1%) | 33 (58.9%) |
| Single Unit, Attached | 23 (100.0%) | 0 (0.0%) |
| 2 Unit Apartments | 0 (0.0%) | 18 (100.0%) |
| 3 or 4 Unit Apartments | 0 (0.0%) | 14 (100.0%) |
| 5 to 9 Unit Apartments | 0 (0.0%) | 0 (0.0%) |
| 10 or more Apartments | 0 (0.0%) | 25 (100.0%) |
| Mobile Home / Other | 0 (0.0%) | 0 (0.0%) |
| Total | 46 (33.8%) | 90 (66.2%) |
Housing Structures by Number of Rooms in Deerfield
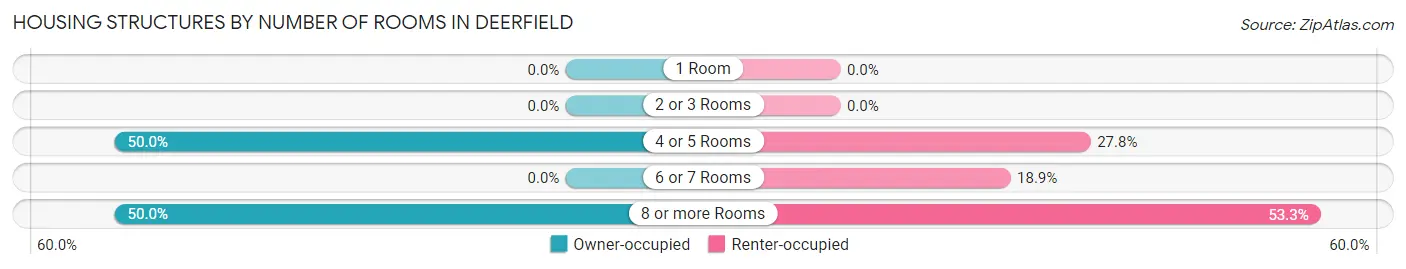
| Number of Rooms | Owner-occupied | Renter-occupied |
| 1 Room | 0 (0.0%) | 0 (0.0%) |
| 2 or 3 Rooms | 0 (0.0%) | 0 (0.0%) |
| 4 or 5 Rooms | 23 (50.0%) | 25 (27.8%) |
| 6 or 7 Rooms | 0 (0.0%) | 17 (18.9%) |
| 8 or more Rooms | 23 (50.0%) | 48 (53.3%) |
| Total | 46 (100.0%) | 90 (100.0%) |
Housing Structure by Heating Type in Deerfield
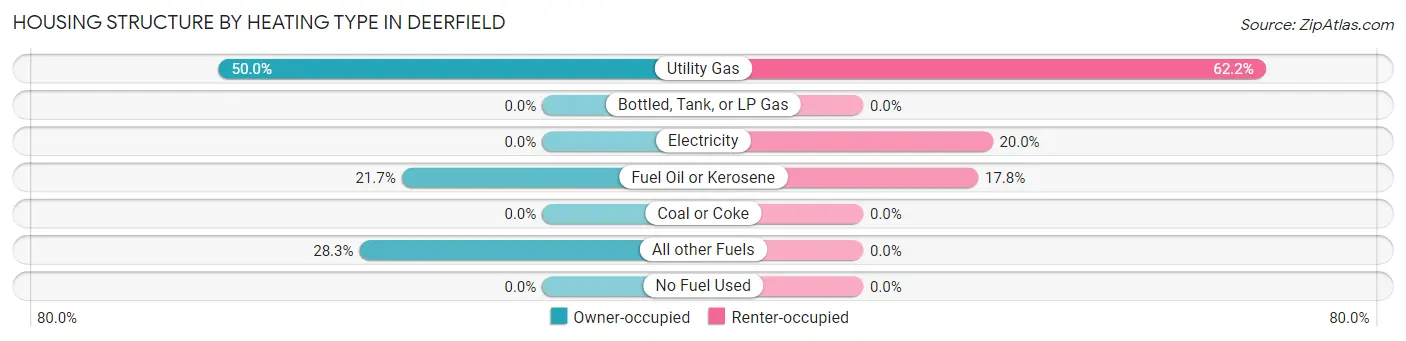
| Heating Type | Owner-occupied | Renter-occupied |
| Utility Gas | 23 (50.0%) | 56 (62.2%) |
| Bottled, Tank, or LP Gas | 0 (0.0%) | 0 (0.0%) |
| Electricity | 0 (0.0%) | 18 (20.0%) |
| Fuel Oil or Kerosene | 10 (21.7%) | 16 (17.8%) |
| Coal or Coke | 0 (0.0%) | 0 (0.0%) |
| All other Fuels | 13 (28.3%) | 0 (0.0%) |
| No Fuel Used | 0 (0.0%) | 0 (0.0%) |
| Total | 46 (100.0%) | 90 (100.0%) |
Household Vehicle Usage in Deerfield
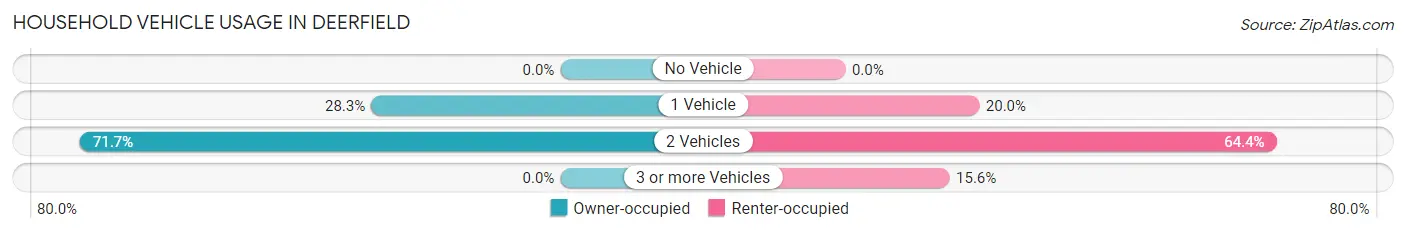
| Vehicles per Household | Owner-occupied | Renter-occupied |
| No Vehicle | 0 (0.0%) | 0 (0.0%) |
| 1 Vehicle | 13 (28.3%) | 18 (20.0%) |
| 2 Vehicles | 33 (71.7%) | 58 (64.4%) |
| 3 or more Vehicles | 0 (0.0%) | 14 (15.6%) |
| Total | 46 (100.0%) | 90 (100.0%) |
Real Estate & Mortgages in Deerfield
Real Estate and Mortgage Overview in Deerfield
| Characteristic | Without Mortgage | With Mortgage |
| Housing Units | 36 | 10 |
| Median Property Value | - | - |
| Median Household Income | - | - |
| Monthly Housing Costs | - | - |
| Real Estate Taxes | - | - |
Property Value by Mortgage Status in Deerfield
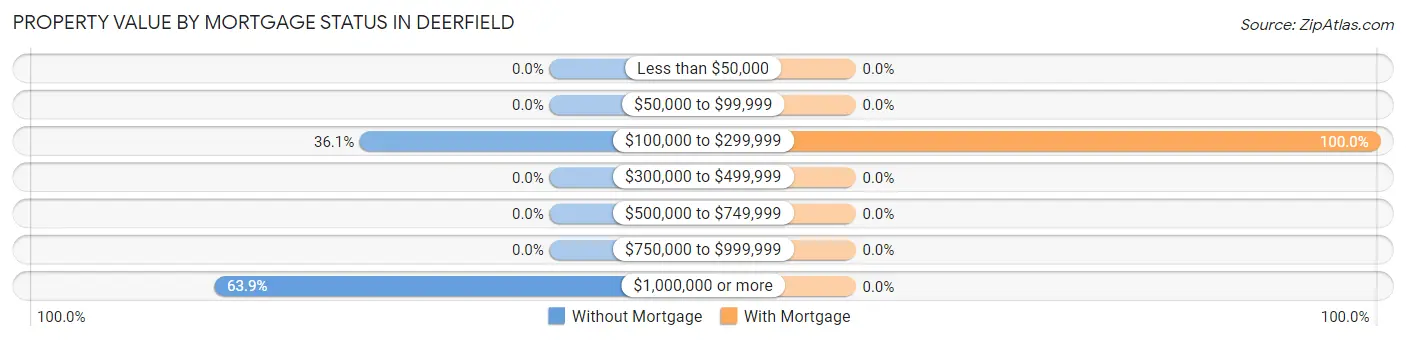
| Property Value | Without Mortgage | With Mortgage |
| Less than $50,000 | 0 (0.0%) | 0 (0.0%) |
| $50,000 to $99,999 | 0 (0.0%) | 0 (0.0%) |
| $100,000 to $299,999 | 13 (36.1%) | 10 (100.0%) |
| $300,000 to $499,999 | 0 (0.0%) | 0 (0.0%) |
| $500,000 to $749,999 | 0 (0.0%) | 0 (0.0%) |
| $750,000 to $999,999 | 0 (0.0%) | 0 (0.0%) |
| $1,000,000 or more | 23 (63.9%) | 0 (0.0%) |
| Total | 36 (100.0%) | 10 (100.0%) |
Household Income by Mortgage Status in Deerfield
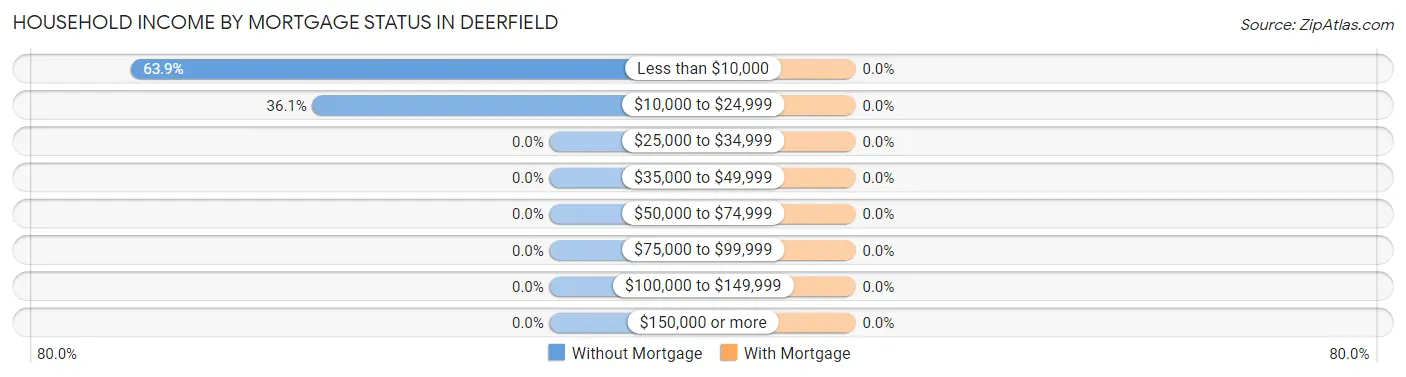
| Household Income | Without Mortgage | With Mortgage |
| Less than $10,000 | 23 (63.9%) | 0 (0.0%) |
| $10,000 to $24,999 | 13 (36.1%) | 0 (0.0%) |
| $25,000 to $34,999 | 0 (0.0%) | 0 (0.0%) |
| $35,000 to $49,999 | 0 (0.0%) | 0 (0.0%) |
| $50,000 to $74,999 | 0 (0.0%) | 0 (0.0%) |
| $75,000 to $99,999 | 0 (0.0%) | 0 (0.0%) |
| $100,000 to $149,999 | 0 (0.0%) | 0 (0.0%) |
| $150,000 or more | 0 (0.0%) | 0 (0.0%) |
| Total | 36 (100.0%) | 10 (100.0%) |
Property Value to Household Income Ratio in Deerfield
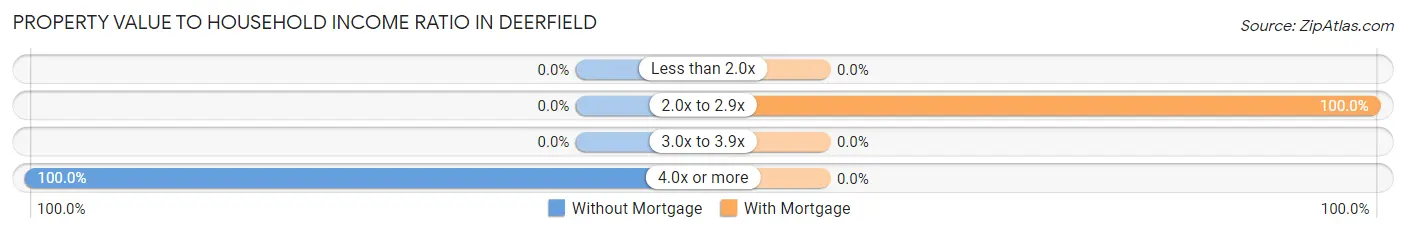
| Value-to-Income Ratio | Without Mortgage | With Mortgage |
| Less than 2.0x | 0 (0.0%) | 0 (0.0%) |
| 2.0x to 2.9x | 0 (0.0%) | 10 (100.0%) |
| 3.0x to 3.9x | 0 (0.0%) | 0 (0.0%) |
| 4.0x or more | 36 (100.0%) | 0 (0.0%) |
| Total | 36 (100.0%) | 10 (100.0%) |
Real Estate Taxes by Mortgage Status in Deerfield
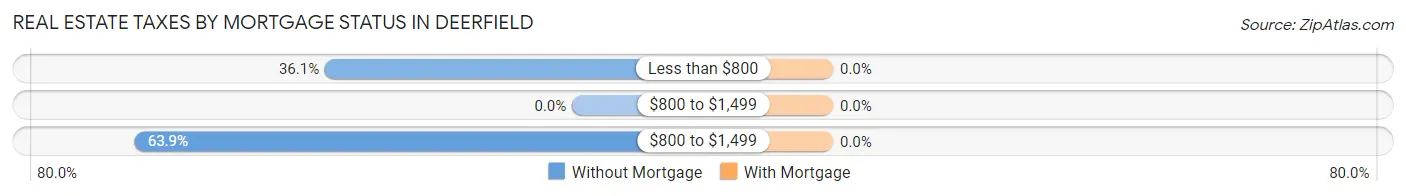
| Property Taxes | Without Mortgage | With Mortgage |
| Less than $800 | 13 (36.1%) | 0 (0.0%) |
| $800 to $1,499 | 0 (0.0%) | 0 (0.0%) |
| $800 to $1,499 | 23 (63.9%) | 0 (0.0%) |
| Total | 36 (100.0%) | 10 (100.0%) |
Health & Disability in Deerfield
Health Insurance Coverage by Age in Deerfield
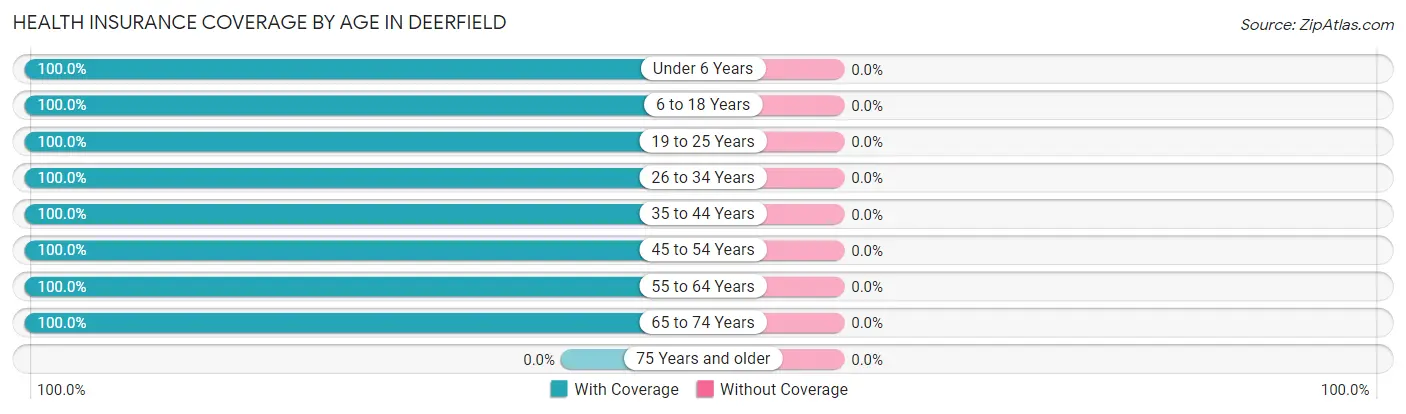
| Age Bracket | With Coverage | Without Coverage |
| Under 6 Years | 14 (100.0%) | 0 (0.0%) |
| 6 to 18 Years | 102 (100.0%) | 0 (0.0%) |
| 19 to 25 Years | 61 (100.0%) | 0 (0.0%) |
| 26 to 34 Years | 11 (100.0%) | 0 (0.0%) |
| 35 to 44 Years | 126 (100.0%) | 0 (0.0%) |
| 45 to 54 Years | 48 (100.0%) | 0 (0.0%) |
| 55 to 64 Years | 82 (100.0%) | 0 (0.0%) |
| 65 to 74 Years | 42 (100.0%) | 0 (0.0%) |
| 75 Years and older | 0 (0.0%) | 0 (0.0%) |
| Total | 486 (100.0%) | 0 (0.0%) |
Health Insurance Coverage by Citizenship Status in Deerfield
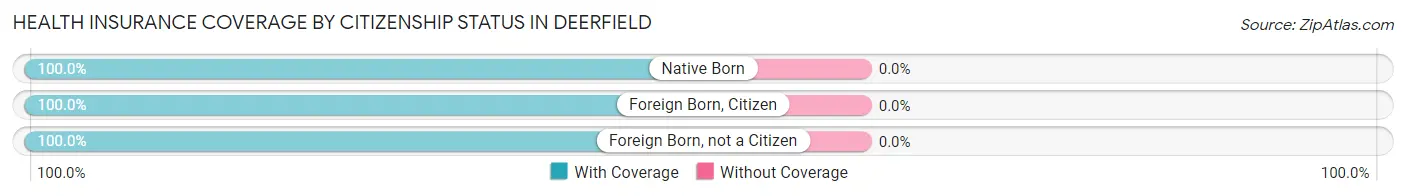
| Citizenship Status | With Coverage | Without Coverage |
| Native Born | 14 (100.0%) | 0 (0.0%) |
| Foreign Born, Citizen | 102 (100.0%) | 0 (0.0%) |
| Foreign Born, not a Citizen | 61 (100.0%) | 0 (0.0%) |
Health Insurance Coverage by Household Income in Deerfield
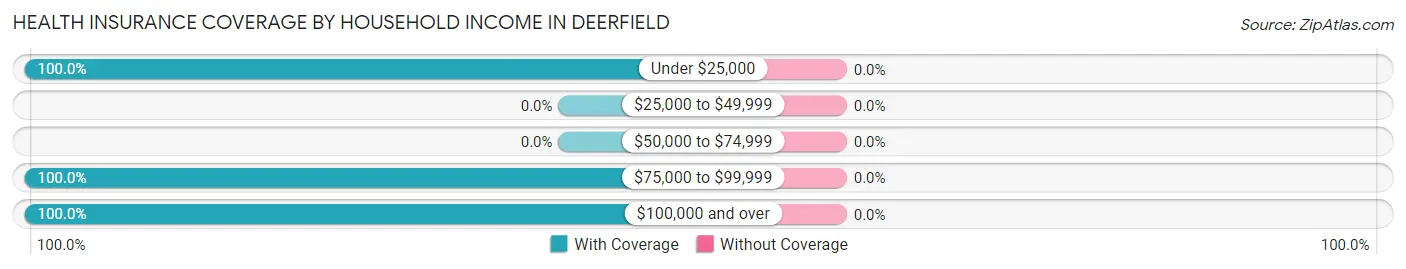
| Household Income | With Coverage | Without Coverage |
| Under $25,000 | 57 (100.0%) | 0 (0.0%) |
| $25,000 to $49,999 | 0 (0.0%) | 0 (0.0%) |
| $50,000 to $74,999 | 0 (0.0%) | 0 (0.0%) |
| $75,000 to $99,999 | 94 (100.0%) | 0 (0.0%) |
| $100,000 and over | 220 (100.0%) | 0 (0.0%) |
Public vs Private Health Insurance Coverage by Age in Deerfield
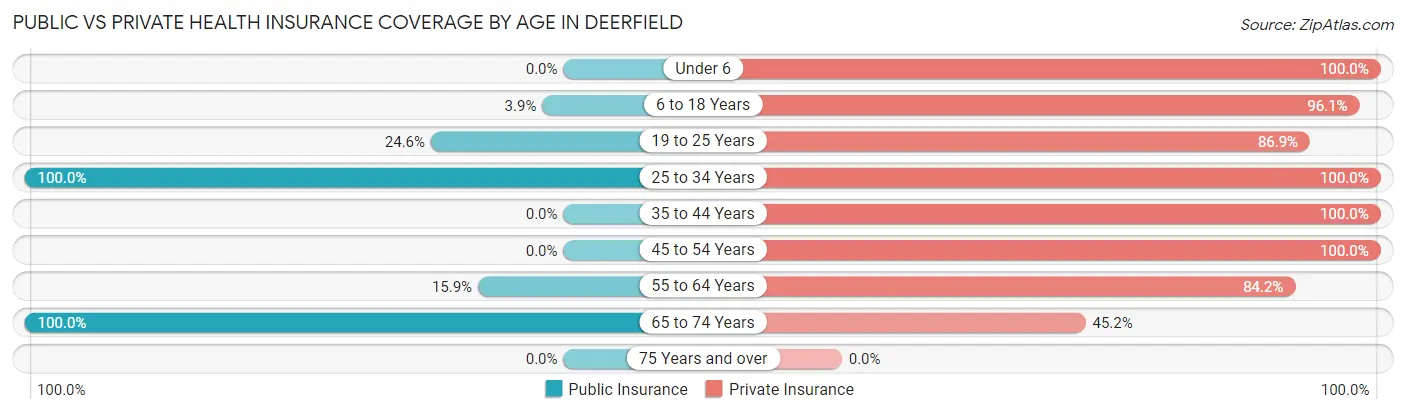
| Age Bracket | Public Insurance | Private Insurance |
| Under 6 | 0 (0.0%) | 14 (100.0%) |
| 6 to 18 Years | 4 (3.9%) | 98 (96.1%) |
| 19 to 25 Years | 15 (24.6%) | 53 (86.9%) |
| 25 to 34 Years | 11 (100.0%) | 11 (100.0%) |
| 35 to 44 Years | 0 (0.0%) | 126 (100.0%) |
| 45 to 54 Years | 0 (0.0%) | 48 (100.0%) |
| 55 to 64 Years | 13 (15.9%) | 69 (84.2%) |
| 65 to 74 Years | 42 (100.0%) | 19 (45.2%) |
| 75 Years and over | 0 (0.0%) | 0 (0.0%) |
| Total | 85 (17.5%) | 438 (90.1%) |
Disability Status by Sex by Age in Deerfield
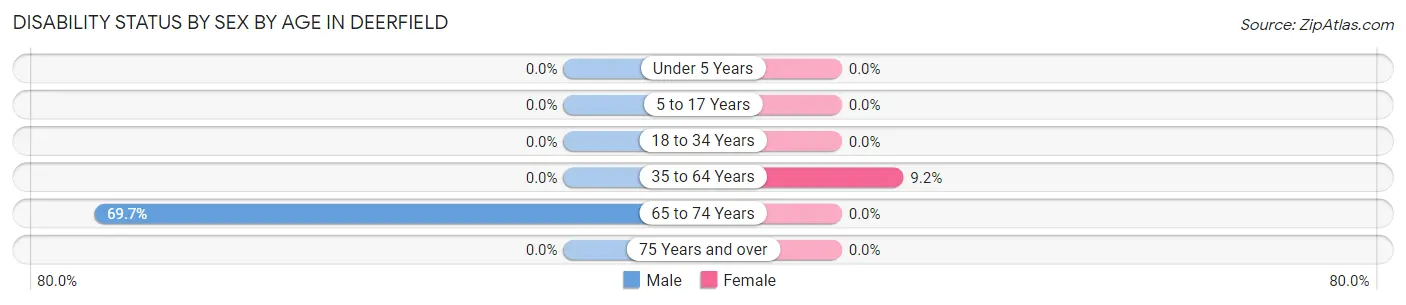
| Age Bracket | Male | Female |
| Under 5 Years | 0 (0.0%) | 0 (0.0%) |
| 5 to 17 Years | 0 (0.0%) | 0 (0.0%) |
| 18 to 34 Years | 0 (0.0%) | 0 (0.0%) |
| 35 to 64 Years | 0 (0.0%) | 13 (9.1%) |
| 65 to 74 Years | 23 (69.7%) | 0 (0.0%) |
| 75 Years and over | 0 (0.0%) | 0 (0.0%) |
Disability Class by Sex by Age in Deerfield
Disability Class: Hearing Difficulty
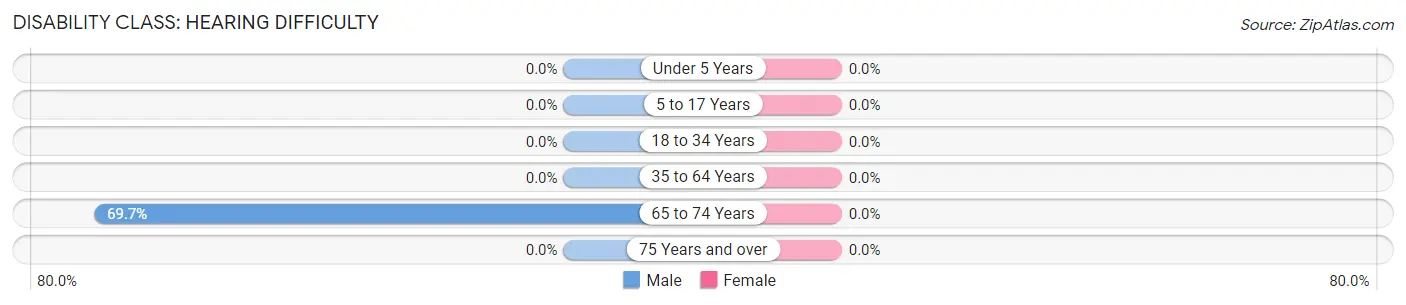
| Age Bracket | Male | Female |
| Under 5 Years | 0 (0.0%) | 0 (0.0%) |
| 5 to 17 Years | 0 (0.0%) | 0 (0.0%) |
| 18 to 34 Years | 0 (0.0%) | 0 (0.0%) |
| 35 to 64 Years | 0 (0.0%) | 0 (0.0%) |
| 65 to 74 Years | 23 (69.7%) | 0 (0.0%) |
| 75 Years and over | 0 (0.0%) | 0 (0.0%) |
Disability Class: Vision Difficulty
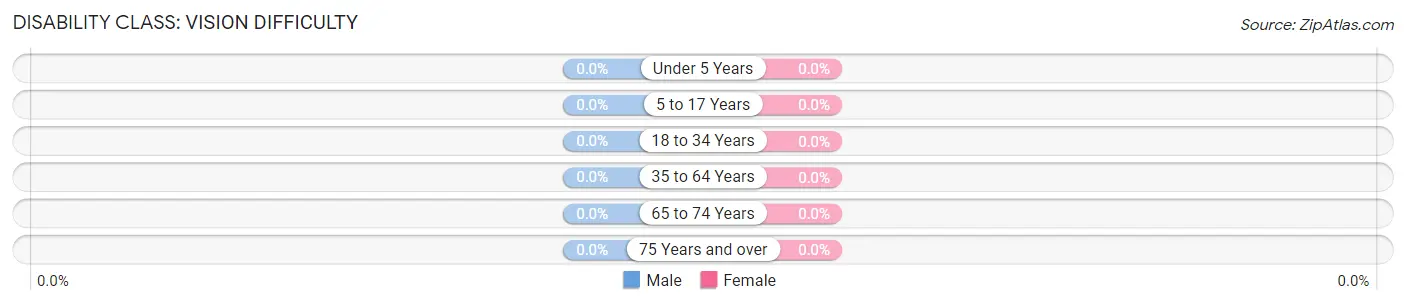
| Age Bracket | Male | Female |
| Under 5 Years | 0 (0.0%) | 0 (0.0%) |
| 5 to 17 Years | 0 (0.0%) | 0 (0.0%) |
| 18 to 34 Years | 0 (0.0%) | 0 (0.0%) |
| 35 to 64 Years | 0 (0.0%) | 0 (0.0%) |
| 65 to 74 Years | 0 (0.0%) | 0 (0.0%) |
| 75 Years and over | 0 (0.0%) | 0 (0.0%) |
Disability Class: Cognitive Difficulty
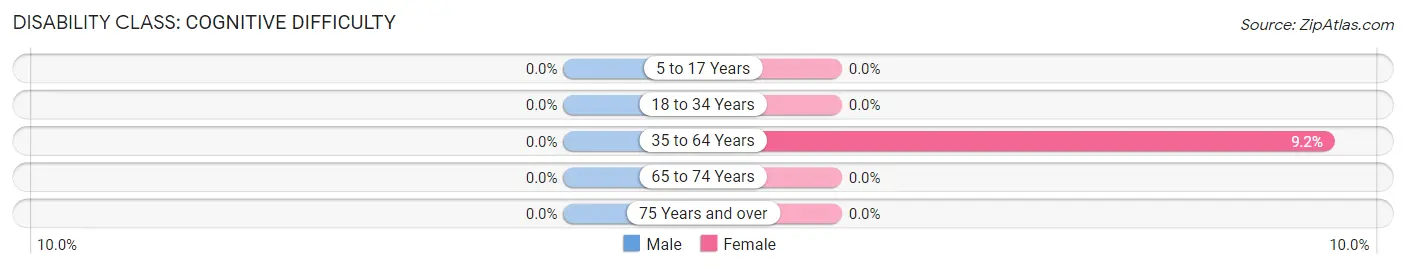
| Age Bracket | Male | Female |
| 5 to 17 Years | 0 (0.0%) | 0 (0.0%) |
| 18 to 34 Years | 0 (0.0%) | 0 (0.0%) |
| 35 to 64 Years | 0 (0.0%) | 13 (9.1%) |
| 65 to 74 Years | 0 (0.0%) | 0 (0.0%) |
| 75 Years and over | 0 (0.0%) | 0 (0.0%) |
Disability Class: Ambulatory Difficulty
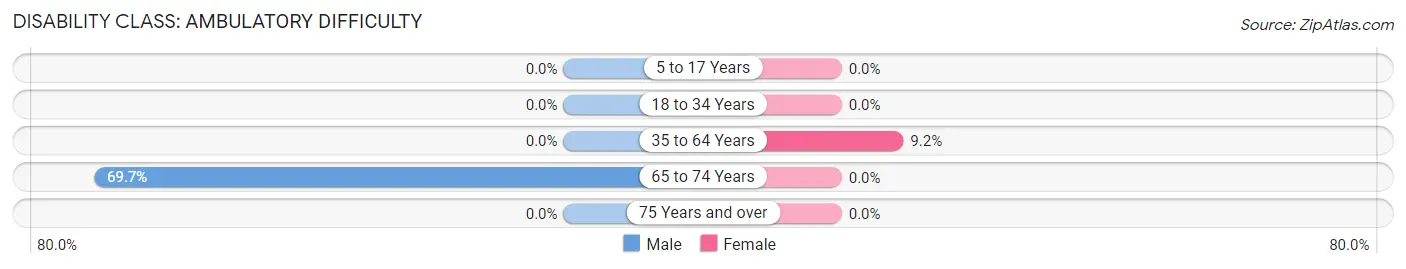
| Age Bracket | Male | Female |
| 5 to 17 Years | 0 (0.0%) | 0 (0.0%) |
| 18 to 34 Years | 0 (0.0%) | 0 (0.0%) |
| 35 to 64 Years | 0 (0.0%) | 13 (9.1%) |
| 65 to 74 Years | 23 (69.7%) | 0 (0.0%) |
| 75 Years and over | 0 (0.0%) | 0 (0.0%) |
Disability Class: Self-Care Difficulty
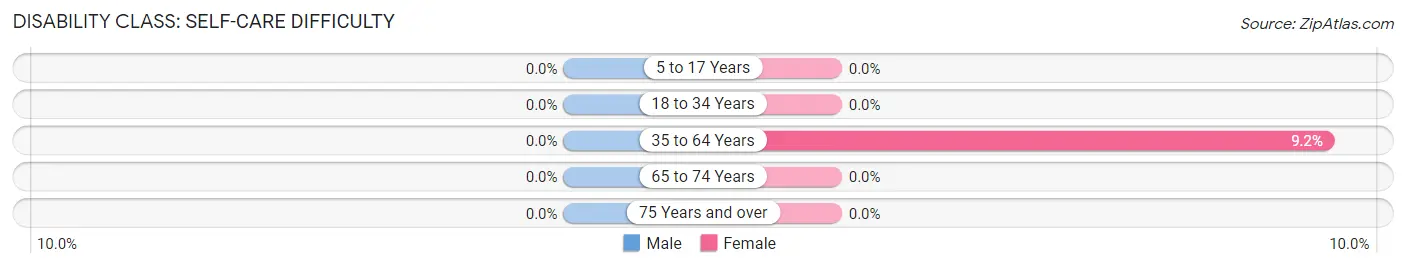
| Age Bracket | Male | Female |
| 5 to 17 Years | 0 (0.0%) | 0 (0.0%) |
| 18 to 34 Years | 0 (0.0%) | 0 (0.0%) |
| 35 to 64 Years | 0 (0.0%) | 13 (9.1%) |
| 65 to 74 Years | 0 (0.0%) | 0 (0.0%) |
| 75 Years and over | 0 (0.0%) | 0 (0.0%) |
Technology Access in Deerfield
Computing Device Access in Deerfield
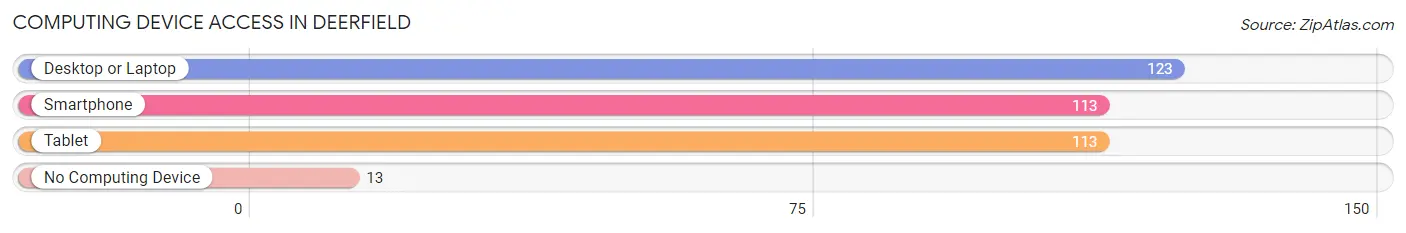
| Device Type | # Households | % Households |
| Desktop or Laptop | 123 | 90.4% |
| Smartphone | 113 | 83.1% |
| Tablet | 113 | 83.1% |
| No Computing Device | 13 | 9.6% |
| Total | 136 | 100.0% |
Internet Access in Deerfield
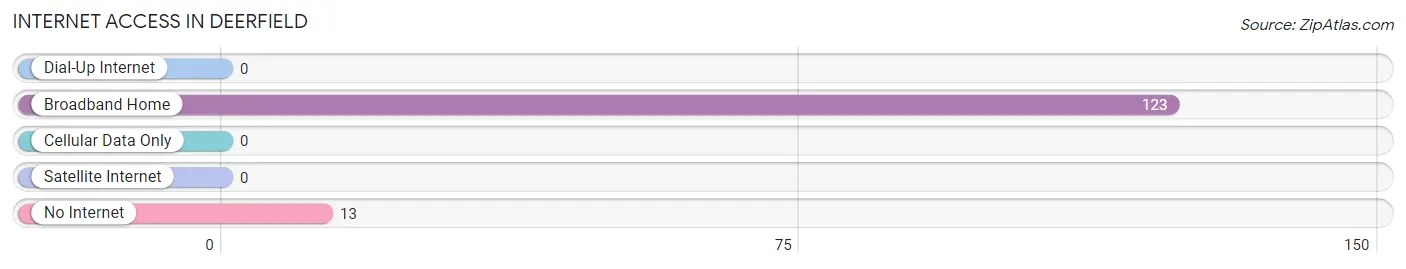
| Internet Type | # Households | % Households |
| Dial-Up Internet | 0 | 0.0% |
| Broadband Home | 123 | 90.4% |
| Cellular Data Only | 0 | 0.0% |
| Satellite Internet | 0 | 0.0% |
| No Internet | 13 | 9.6% |
| Total | 136 | 100.0% |
Deerfield Summary
Deerfield, Massachusetts is a small town located in Franklin County in the western part of the state. It is bordered by the towns of Conway, Whately, Sunderland, and Montague. The town has a population of about 5,000 people and covers an area of about 28 square miles.
History
Deerfield was first settled in 1673 by a group of English settlers from Dedham, Massachusetts. The town was originally called “Deerfield Plantation” and was part of the Connecticut Colony. The town was officially incorporated in 1753 and was named after the abundance of deer in the area.
During the French and Indian War, Deerfield was the site of a major battle in 1704. The town was attacked by a combined force of French and Native American forces, and the town was burned to the ground. The town was rebuilt after the war and continued to grow.
In the 19th century, Deerfield was an important center for the wool industry. The town was home to several mills and factories that produced woolen goods. The town also had a thriving agricultural industry, with dairy farms and apple orchards.
Geography
Deerfield is located in the western part of Massachusetts, in Franklin County. The town is bordered by the towns of Conway, Whately, Sunderland, and Montague. The town is located in the Connecticut River Valley, and the town is bisected by the Deerfield River. The town is mostly rural, with rolling hills and forests.
The town has several small lakes, including Lake Wyola, Lake Warner, and Lake Whalom. The town also has several parks, including the Deerfield River Park and the Deerfield State Forest.
Economy
Deerfield’s economy is largely based on agriculture and tourism. The town is home to several dairy farms and apple orchards, and the town is also home to several wineries and breweries. The town is also home to several small businesses, including restaurants, shops, and art galleries.
The town is also home to several educational institutions, including Deerfield Academy, a private boarding school, and the University of Massachusetts Amherst.
Demographics
As of the 2010 census, the population of Deerfield was 5,125. The racial makeup of the town was 94.3% White, 1.2% African American, 0.4% Native American, 1.2% Asian, 0.1% Pacific Islander, 1.2% from other races, and 1.6% from two or more races. Hispanic or Latino of any race were 2.7% of the population.
The median income for a household in the town was $68,750, and the median income for a family was $77,917. The per capita income for the town was $31,945. About 4.3% of families and 5.7% of the population were below the poverty line, including 6.3% of those under age 18 and 4.2% of those age 65 or over.
Common Questions
What is Per Capita Income in Deerfield?
Per Capita income in Deerfield is $42,805.
What is the Median Family Income in Deerfield?
Median Family Income in Deerfield is $158,125.
What is Income or Wage Gap in Deerfield?
Income or Wage Gap in Deerfield is 9.6%.
Women in Deerfield earn 90.4 cents for every dollar earned by a man.
What is Inequality or Gini Index in Deerfield?
Inequality or Gini Index in Deerfield is 0.35.
What is the Total Population of Deerfield?
Total Population of Deerfield is 486.
What is the Total Male Population of Deerfield?
Total Male Population of Deerfield is 267.
What is the Total Female Population of Deerfield?
Total Female Population of Deerfield is 219.
What is the Ratio of Males per 100 Females in Deerfield?
There are 121.92 Males per 100 Females in Deerfield.
What is the Ratio of Females per 100 Males in Deerfield?
There are 82.02 Females per 100 Males in Deerfield.
What is the Median Population Age in Deerfield?
Median Population Age in Deerfield is 38.7 Years.
What is the Average Family Size in Deerfield
Average Family Size in Deerfield is 2.9 People.
What is the Average Household Size in Deerfield
Average Household Size in Deerfield is 2.7 People.
How Large is the Labor Force in Deerfield?
There are 310 People in the Labor Forcein in Deerfield.
What is the Percentage of People in the Labor Force in Deerfield?
75.6% of People are in the Labor Force in Deerfield.
What is the Unemployment Rate in Deerfield?
Unemployment Rate in Deerfield is 7.4%.