Atwood, IL Map & Demographics
Atwood Map
Atwood Overview
$31,535
PER CAPITA INCOME
$63,295
AVG FAMILY INCOME
$56,563
AVG HOUSEHOLD INCOME
33.3%
WAGE / INCOME GAP [ % ]
66.7¢/ $1
WAGE / INCOME GAP [ $ ]
0.46
INEQUALITY / GINI INDEX
979
TOTAL POPULATION
394
MALE POPULATION
585
FEMALE POPULATION
67.35
MALES / 100 FEMALES
148.48
FEMALES / 100 MALES
41.3
MEDIAN AGE
2.8
AVG FAMILY SIZE
2.3
AVG HOUSEHOLD SIZE
419
LABOR FORCE [ PEOPLE ]
53.4%
PERCENT IN LABOR FORCE
2.4%
UNEMPLOYMENT RATE
Atwood Zip Codes
Atwood Area Codes
Income in Atwood
Income Overview in Atwood
Per Capita Income in Atwood is $31,535, while median incomes of families and households are $63,295 and $56,563 respectively.
| Characteristic | Number | Measure |
| Per Capita Income | 979 | $31,535 |
| Median Family Income | 295 | $63,295 |
| Mean Family Income | 295 | $92,661 |
| Median Household Income | 428 | $56,563 |
| Mean Household Income | 428 | $73,837 |
| Income Deficit | 295 | $0 |
| Wage / Income Gap (%) | 979 | 33.32% |
| Wage / Income Gap ($) | 979 | 66.68¢ per $1 |
| Gini / Inequality Index | 979 | 0.46 |
Earnings by Sex in Atwood
Average Earnings in Atwood are $51,212, $56,094 for men and $37,404 for women, a difference of 33.3%.
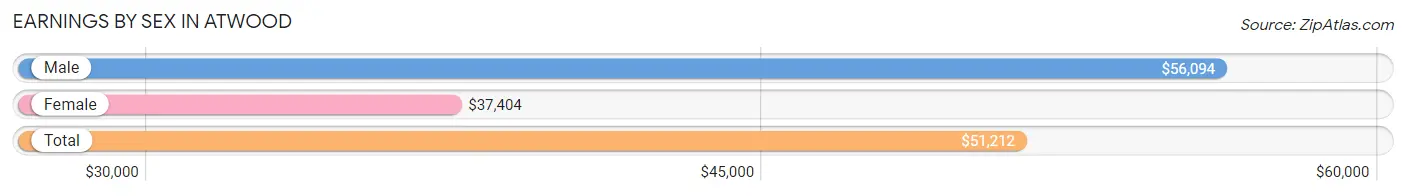
| Sex | Number | Average Earnings |
| Male | 216 (49.5%) | $56,094 |
| Female | 220 (50.5%) | $37,404 |
| Total | 436 (100.0%) | $51,212 |
Earnings by Sex by Income Bracket in Atwood
The most common earnings brackets in Atwood are $100,000+ for men (48 | 22.2%) and $35,000 to $39,999 for women (30 | 13.6%).
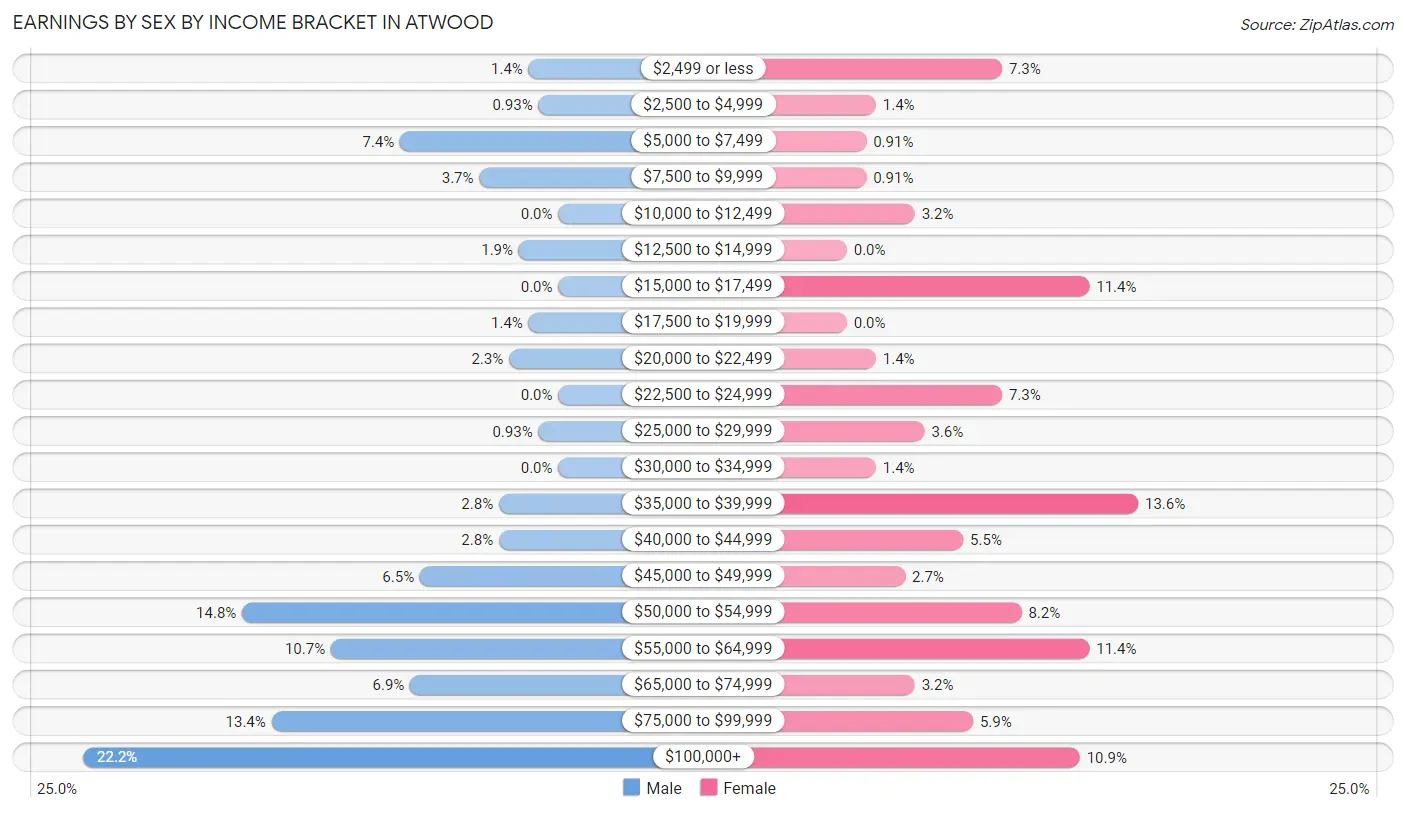
| Income | Male | Female |
| $2,499 or less | 3 (1.4%) | 16 (7.3%) |
| $2,500 to $4,999 | 2 (0.9%) | 3 (1.4%) |
| $5,000 to $7,499 | 16 (7.4%) | 2 (0.9%) |
| $7,500 to $9,999 | 8 (3.7%) | 2 (0.9%) |
| $10,000 to $12,499 | 0 (0.0%) | 7 (3.2%) |
| $12,500 to $14,999 | 4 (1.8%) | 0 (0.0%) |
| $15,000 to $17,499 | 0 (0.0%) | 25 (11.4%) |
| $17,500 to $19,999 | 3 (1.4%) | 0 (0.0%) |
| $20,000 to $22,499 | 5 (2.3%) | 3 (1.4%) |
| $22,500 to $24,999 | 0 (0.0%) | 16 (7.3%) |
| $25,000 to $29,999 | 2 (0.9%) | 8 (3.6%) |
| $30,000 to $34,999 | 0 (0.0%) | 3 (1.4%) |
| $35,000 to $39,999 | 6 (2.8%) | 30 (13.6%) |
| $40,000 to $44,999 | 6 (2.8%) | 12 (5.4%) |
| $45,000 to $49,999 | 14 (6.5%) | 6 (2.7%) |
| $50,000 to $54,999 | 32 (14.8%) | 18 (8.2%) |
| $55,000 to $64,999 | 23 (10.6%) | 25 (11.4%) |
| $65,000 to $74,999 | 15 (6.9%) | 7 (3.2%) |
| $75,000 to $99,999 | 29 (13.4%) | 13 (5.9%) |
| $100,000+ | 48 (22.2%) | 24 (10.9%) |
| Total | 216 (100.0%) | 220 (100.0%) |
Earnings by Sex by Educational Attainment in Atwood
Average earnings in Atwood are $56,641 for men and $37,452 for women, a difference of 33.9%. Men with an educational attainment of college or associate's degree enjoy the highest average annual earnings of $67,083, while those with high school diploma education earn the least with $52,344. Women with an educational attainment of graduate degree earn the most with the average annual earnings of $100,469, while those with college or associate's degree education have the smallest earnings of $48,333.
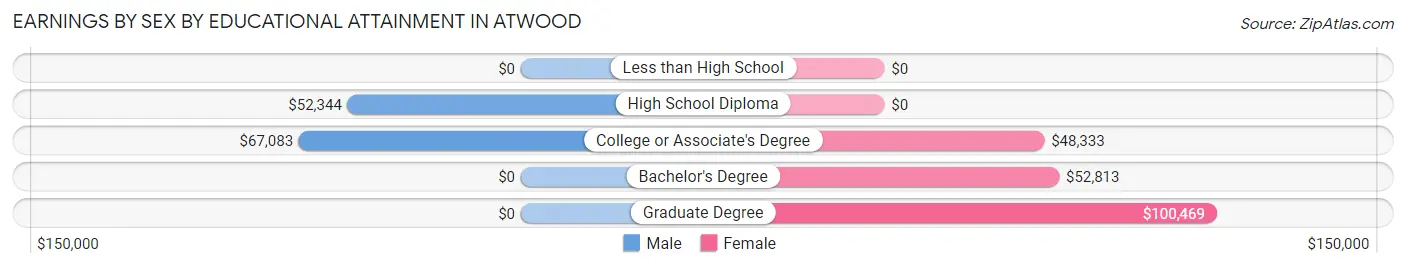
| Educational Attainment | Male Income | Female Income |
| Less than High School | - | - |
| High School Diploma | $52,344 | $0 |
| College or Associate's Degree | $67,083 | $48,333 |
| Bachelor's Degree | - | - |
| Graduate Degree | - | - |
| Total | $56,641 | $37,452 |
Family Income in Atwood
Family Income Brackets in Atwood
According to the Atwood family income data, there are 89 families falling into the $50,000 to $74,999 income range, which is the most common income bracket and makes up 30.2% of all families.
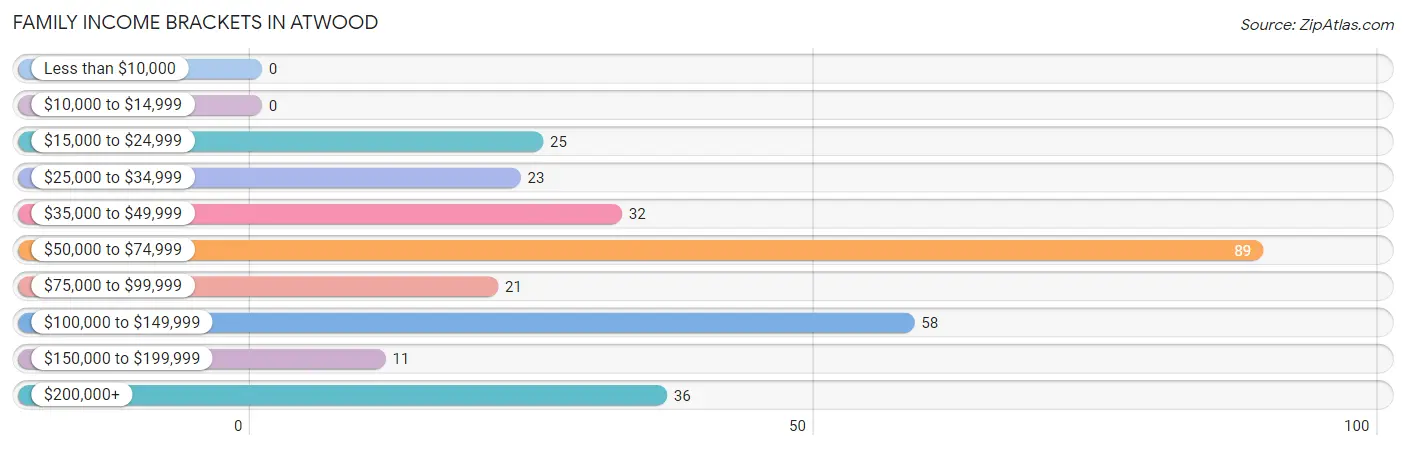
| Income Bracket | # Families | % Families |
| Less than $10,000 | 0 | 0.0% |
| $10,000 to $14,999 | 0 | 0.0% |
| $15,000 to $24,999 | 25 | 8.5% |
| $25,000 to $34,999 | 23 | 7.8% |
| $35,000 to $49,999 | 32 | 10.8% |
| $50,000 to $74,999 | 89 | 30.2% |
| $75,000 to $99,999 | 21 | 7.1% |
| $100,000 to $149,999 | 58 | 19.7% |
| $150,000 to $199,999 | 11 | 3.7% |
| $200,000+ | 36 | 12.2% |
Family Income by Famaliy Size in Atwood
4-person families (28 | 9.5%) account for the highest median family income in Atwood with $106,250 per family, while 2-person families (145 | 49.1%) have the highest median income of $29,554 per family member.
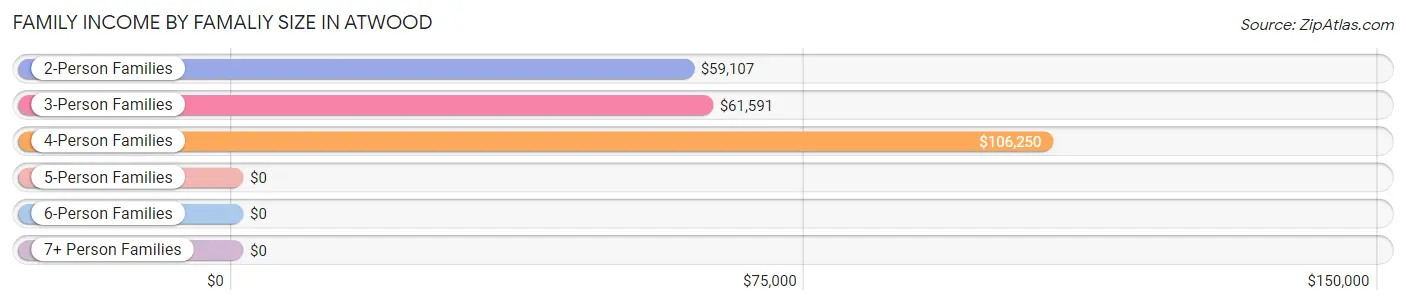
| Income Bracket | # Families | Median Income |
| 2-Person Families | 145 (49.1%) | $59,107 |
| 3-Person Families | 106 (35.9%) | $61,591 |
| 4-Person Families | 28 (9.5%) | $106,250 |
| 5-Person Families | 12 (4.1%) | $0 |
| 6-Person Families | 4 (1.4%) | $0 |
| 7+ Person Families | 0 (0.0%) | $0 |
| Total | 295 (100.0%) | $63,295 |
Family Income by Number of Earners in Atwood
The median family income in Atwood is $63,295, with families comprising 2 earners (93) having the highest median family income of $135,536, while families with no earners (55) have the lowest median family income of $32,813, accounting for 31.5% and 18.6% of families, respectively.
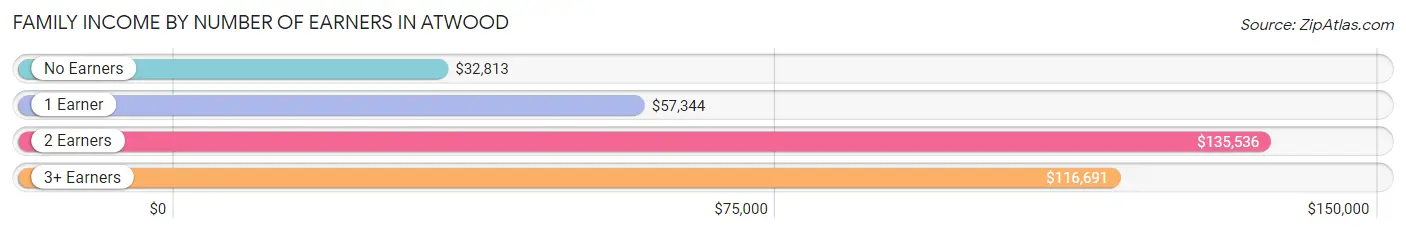
| Number of Earners | # Families | Median Income |
| No Earners | 55 (18.6%) | $32,813 |
| 1 Earner | 116 (39.3%) | $57,344 |
| 2 Earners | 93 (31.5%) | $135,536 |
| 3+ Earners | 31 (10.5%) | $116,691 |
| Total | 295 (100.0%) | $63,295 |
Household Income in Atwood
Household Income Brackets in Atwood
With 106 households falling in the category, the $50,000 to $74,999 income range is the most frequent in Atwood, accounting for 24.8% of all households. In contrast, only 11 households (2.6%) fall into the $150,000 to $199,999 income bracket, making it the least populous group.
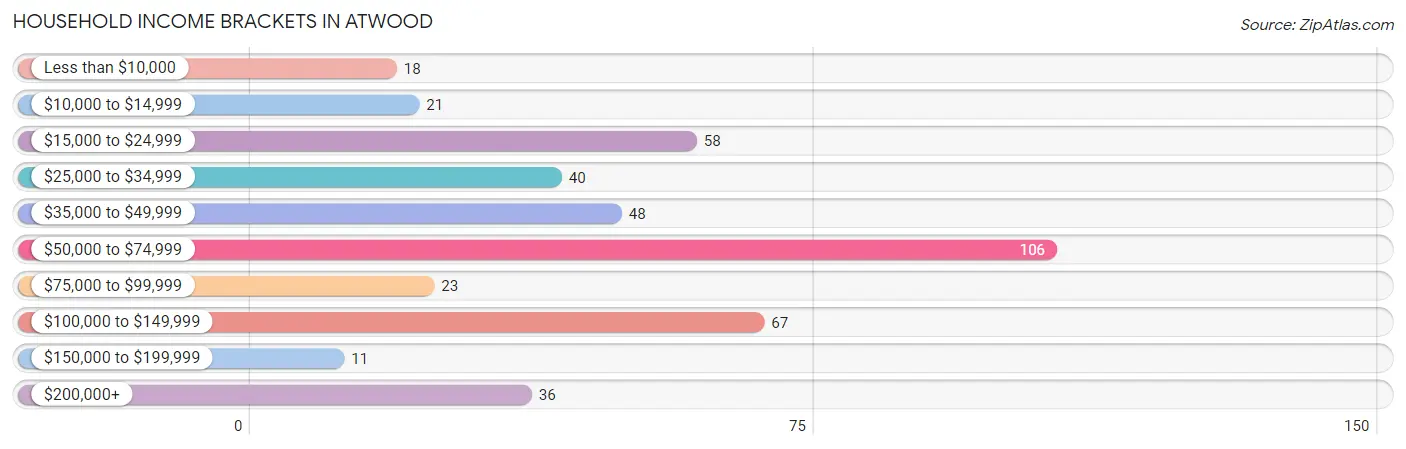
| Income Bracket | # Households | % Households |
| Less than $10,000 | 18 | 4.2% |
| $10,000 to $14,999 | 21 | 4.9% |
| $15,000 to $24,999 | 58 | 13.6% |
| $25,000 to $34,999 | 40 | 9.3% |
| $35,000 to $49,999 | 48 | 11.2% |
| $50,000 to $74,999 | 106 | 24.8% |
| $75,000 to $99,999 | 23 | 5.4% |
| $100,000 to $149,999 | 67 | 15.7% |
| $150,000 to $199,999 | 11 | 2.6% |
| $200,000+ | 36 | 8.4% |
Household Income by Householder Age in Atwood
The median household income in Atwood is $56,563, with the highest median household income of $67,500 found in the 45 to 64 years age bracket for the primary householder. A total of 158 households (36.9%) fall into this category. Meanwhile, the 15 to 24 years age bracket for the primary householder has the lowest median household income of $0, with 10 households (2.3%) in this group.
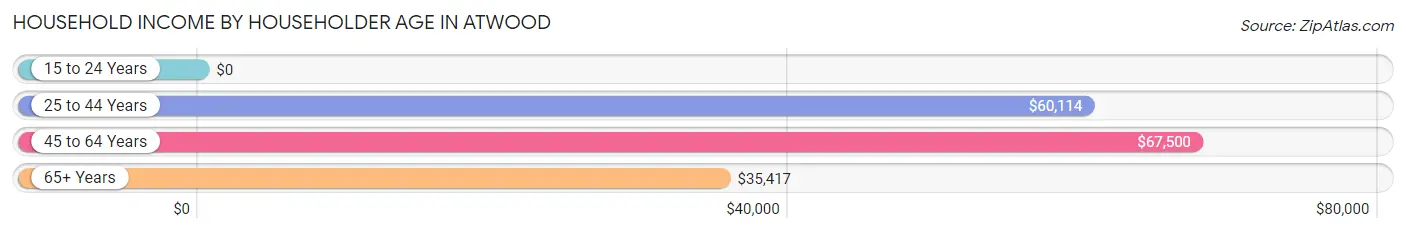
| Income Bracket | # Households | Median Income |
| 15 to 24 Years | 10 (2.3%) | $0 |
| 25 to 44 Years | 142 (33.2%) | $60,114 |
| 45 to 64 Years | 158 (36.9%) | $67,500 |
| 65+ Years | 118 (27.6%) | $35,417 |
| Total | 428 (100.0%) | $56,563 |
Poverty in Atwood
Income Below Poverty by Sex and Age in Atwood
With 7.9% poverty level for males and 10.6% for females among the residents of Atwood, 18 to 24 year old males and 18 to 24 year old females are the most vulnerable to poverty, with 10 males (22.7%) and 11 females (47.8%) in their respective age groups living below the poverty level.
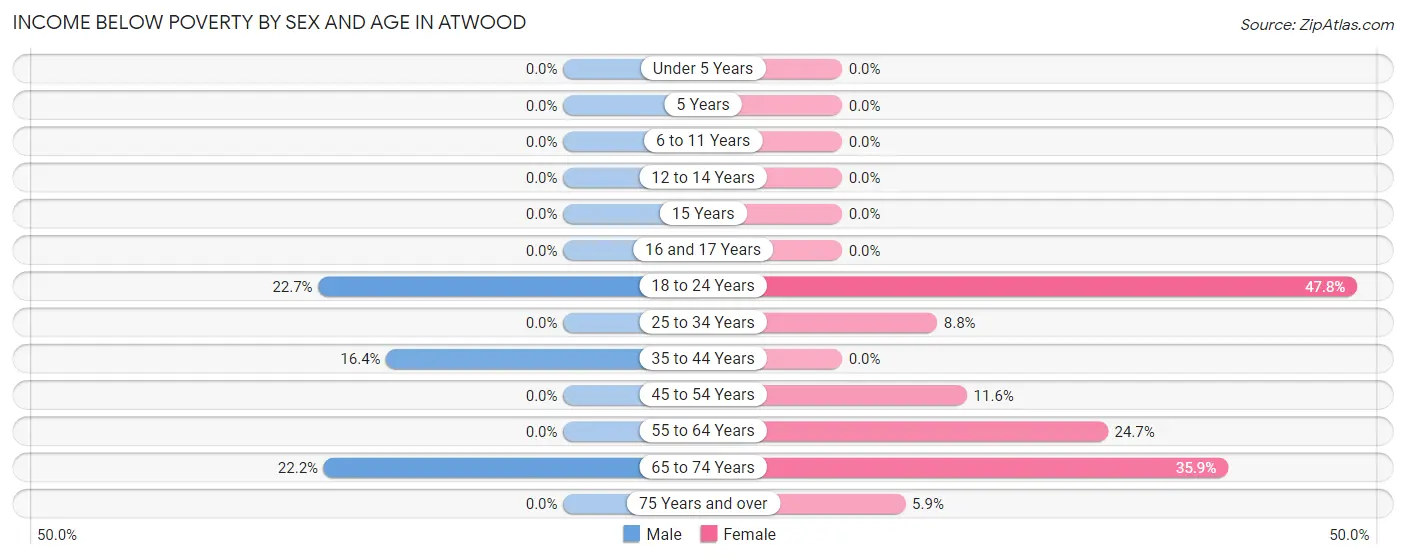
| Age Bracket | Male | Female |
| Under 5 Years | 0 (0.0%) | 0 (0.0%) |
| 5 Years | 0 (0.0%) | 0 (0.0%) |
| 6 to 11 Years | 0 (0.0%) | 0 (0.0%) |
| 12 to 14 Years | 0 (0.0%) | 0 (0.0%) |
| 15 Years | 0 (0.0%) | 0 (0.0%) |
| 16 and 17 Years | 0 (0.0%) | 0 (0.0%) |
| 18 to 24 Years | 10 (22.7%) | 11 (47.8%) |
| 25 to 34 Years | 0 (0.0%) | 3 (8.8%) |
| 35 to 44 Years | 11 (16.4%) | 0 (0.0%) |
| 45 to 54 Years | 0 (0.0%) | 8 (11.6%) |
| 55 to 64 Years | 0 (0.0%) | 18 (24.7%) |
| 65 to 74 Years | 10 (22.2%) | 19 (35.8%) |
| 75 Years and over | 0 (0.0%) | 3 (5.9%) |
| Total | 31 (7.9%) | 62 (10.6%) |
Income Above Poverty by Sex and Age in Atwood
According to the poverty statistics in Atwood, males aged under 5 years and females aged under 5 years are the age groups that are most secure financially, with 100.0% of males and 100.0% of females in these age groups living above the poverty line.
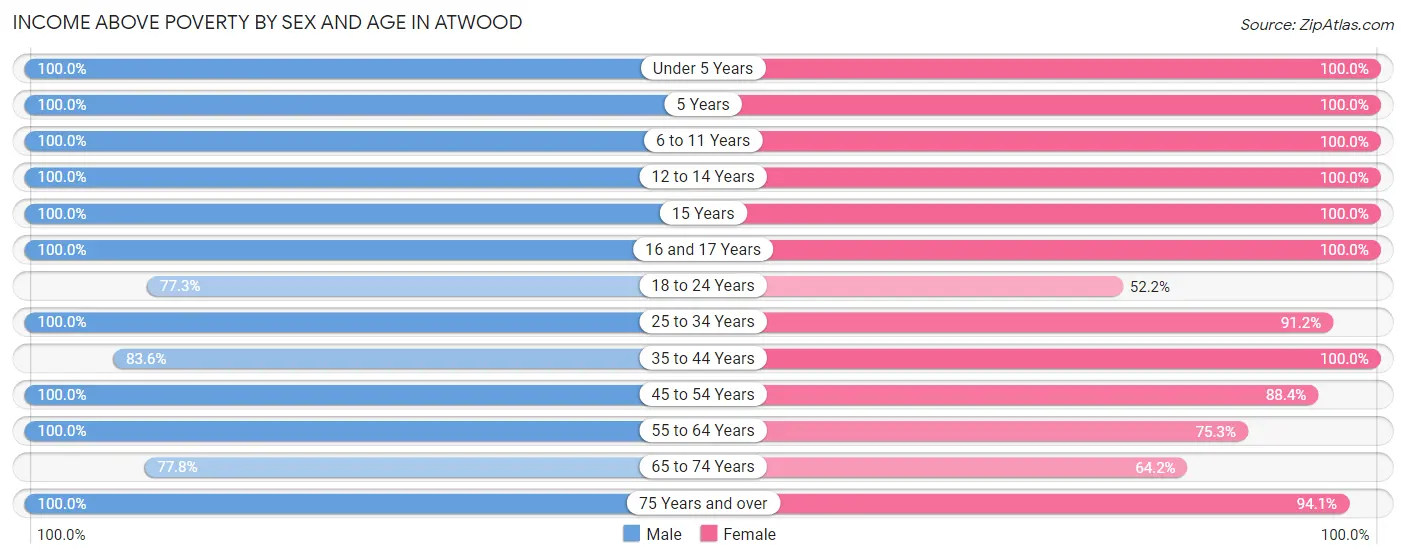
| Age Bracket | Male | Female |
| Under 5 Years | 6 (100.0%) | 38 (100.0%) |
| 5 Years | 3 (100.0%) | 14 (100.0%) |
| 6 to 11 Years | 29 (100.0%) | 24 (100.0%) |
| 12 to 14 Years | 5 (100.0%) | 49 (100.0%) |
| 15 Years | 10 (100.0%) | 13 (100.0%) |
| 16 and 17 Years | 11 (100.0%) | 25 (100.0%) |
| 18 to 24 Years | 34 (77.3%) | 12 (52.2%) |
| 25 to 34 Years | 21 (100.0%) | 31 (91.2%) |
| 35 to 44 Years | 56 (83.6%) | 116 (100.0%) |
| 45 to 54 Years | 54 (100.0%) | 61 (88.4%) |
| 55 to 64 Years | 52 (100.0%) | 55 (75.3%) |
| 65 to 74 Years | 35 (77.8%) | 34 (64.1%) |
| 75 Years and over | 47 (100.0%) | 48 (94.1%) |
| Total | 363 (92.1%) | 520 (89.3%) |
Income Below Poverty Among Married-Couple Families in Atwood
The poverty statistics for married-couple families in Atwood show that 4.4% or 11 of the total 247 families live below the poverty line. Families with no children have the highest poverty rate of 6.7%, comprising of 11 families. On the other hand, families with 1 or 2 children have the lowest poverty rate of 0.0%, which includes 0 families.
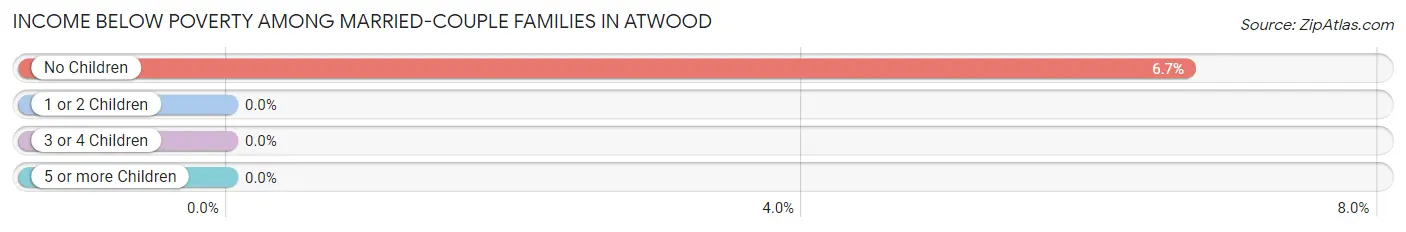
| Children | Above Poverty | Below Poverty |
| No Children | 154 (93.3%) | 11 (6.7%) |
| 1 or 2 Children | 71 (100.0%) | 0 (0.0%) |
| 3 or 4 Children | 11 (100.0%) | 0 (0.0%) |
| 5 or more Children | 0 (0.0%) | 0 (0.0%) |
| Total | 236 (95.6%) | 11 (4.4%) |
Income Below Poverty Among Single-Parent Households in Atwood
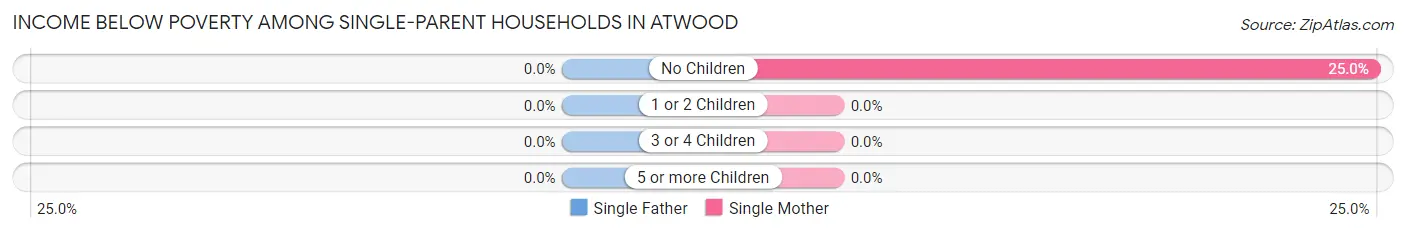
| Children | Single Father | Single Mother |
| No Children | 0 (0.0%) | 2 (25.0%) |
| 1 or 2 Children | 0 (0.0%) | 0 (0.0%) |
| 3 or 4 Children | 0 (0.0%) | 0 (0.0%) |
| 5 or more Children | 0 (0.0%) | 0 (0.0%) |
| Total | 0 (0.0%) | 2 (5.9%) |
Income Below Poverty Among Married-Couple vs Single-Parent Households in Atwood
The poverty data for Atwood shows that 11 of the married-couple family households (4.4%) and 2 of the single-parent households (4.2%) are living below the poverty level. Within the married-couple family households, those with no children have the highest poverty rate, with 11 households (6.7%) falling below the poverty line. Among the single-parent households, those with no children have the highest poverty rate, with 2 household (18.2%) living below poverty.
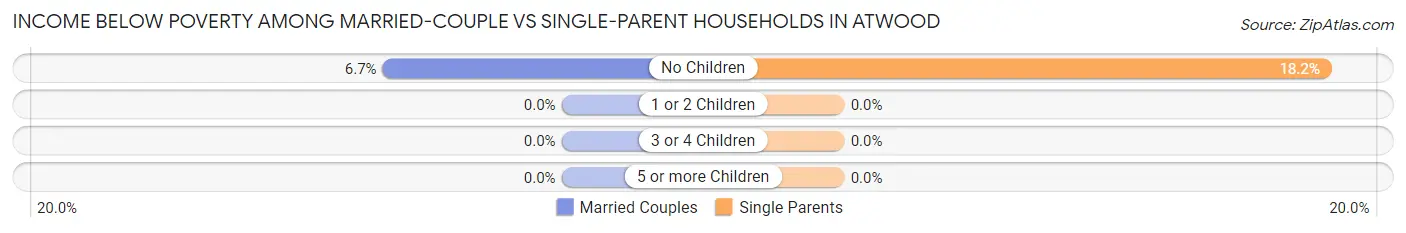
| Children | Married-Couple Families | Single-Parent Households |
| No Children | 11 (6.7%) | 2 (18.2%) |
| 1 or 2 Children | 0 (0.0%) | 0 (0.0%) |
| 3 or 4 Children | 0 (0.0%) | 0 (0.0%) |
| 5 or more Children | 0 (0.0%) | 0 (0.0%) |
| Total | 11 (4.4%) | 2 (4.2%) |
Race in Atwood
The most populous races in Atwood are White / Caucasian (967 | 98.8%), Two or more Races (7 | 0.7%), and Asian (5 | 0.5%).
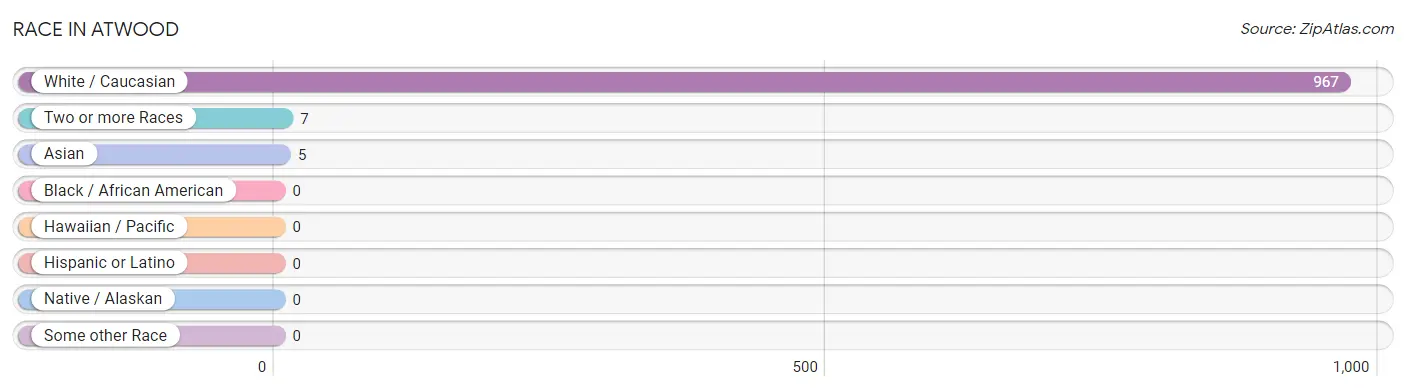
| Race | # Population | % Population |
| Asian | 5 | 0.5% |
| Black / African American | 0 | 0.0% |
| Hawaiian / Pacific | 0 | 0.0% |
| Hispanic or Latino | 0 | 0.0% |
| Native / Alaskan | 0 | 0.0% |
| White / Caucasian | 967 | 98.8% |
| Two or more Races | 7 | 0.7% |
| Some other Race | 0 | 0.0% |
| Total | 979 | 100.0% |
Ancestry in Atwood
The most populous ancestries reported in Atwood are German (222 | 22.7%), Irish (126 | 12.9%), English (83 | 8.5%), American (62 | 6.3%), and Welsh (20 | 2.0%), together accounting for 52.4% of all Atwood residents.
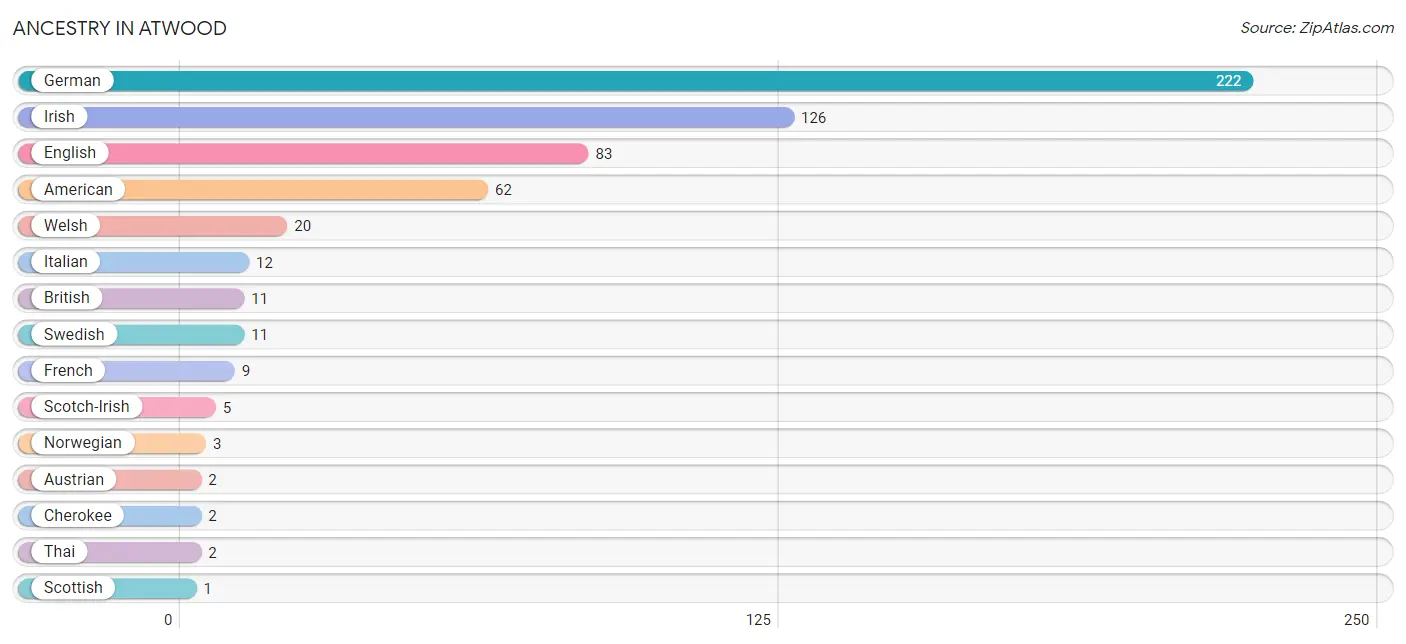
| Ancestry | # Population | % Population |
| American | 62 | 6.3% |
| Austrian | 2 | 0.2% |
| British | 11 | 1.1% |
| Cherokee | 2 | 0.2% |
| English | 83 | 8.5% |
| French | 9 | 0.9% |
| German | 222 | 22.7% |
| Irish | 126 | 12.9% |
| Italian | 12 | 1.2% |
| Norwegian | 3 | 0.3% |
| Scotch-Irish | 5 | 0.5% |
| Scottish | 1 | 0.1% |
| Swedish | 11 | 1.1% |
| Thai | 2 | 0.2% |
| Welsh | 20 | 2.0% | View All 15 Rows |
Immigrants in Atwood
The most numerous immigrant groups reported in Atwood came from Asia (5 | 0.5%), South Central Asia (5 | 0.5%), Belgium (3 | 0.3%), Europe (3 | 0.3%), and Pakistan (3 | 0.3%), together accounting for 1.9% of all Atwood residents.
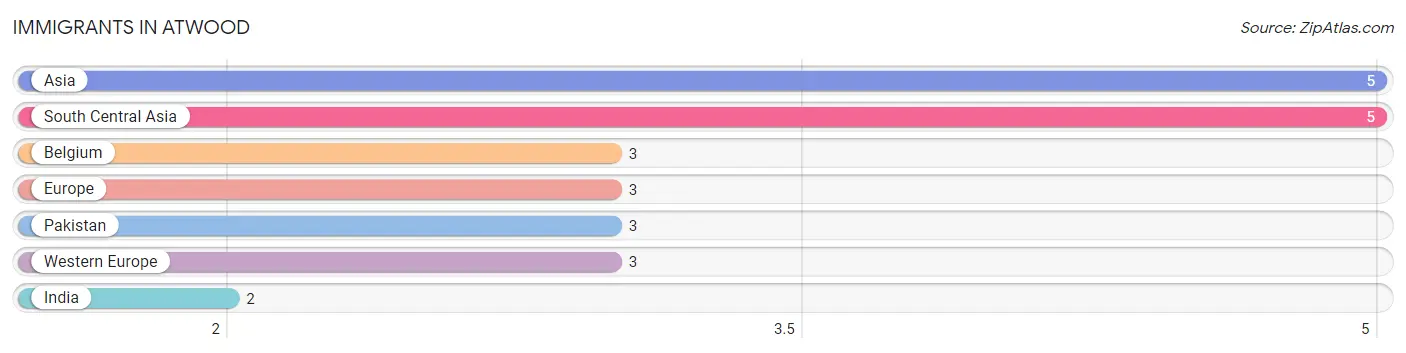
| Immigration Origin | # Population | % Population |
| Asia | 5 | 0.5% |
| Belgium | 3 | 0.3% |
| Europe | 3 | 0.3% |
| India | 2 | 0.2% |
| Pakistan | 3 | 0.3% |
| South Central Asia | 5 | 0.5% |
| Western Europe | 3 | 0.3% | View All 7 Rows |
Sex and Age in Atwood
Sex and Age in Atwood
The most populous age groups in Atwood are 50 to 54 Years (43 | 10.9%) for men and 35 to 39 Years (81 | 13.9%) for women.
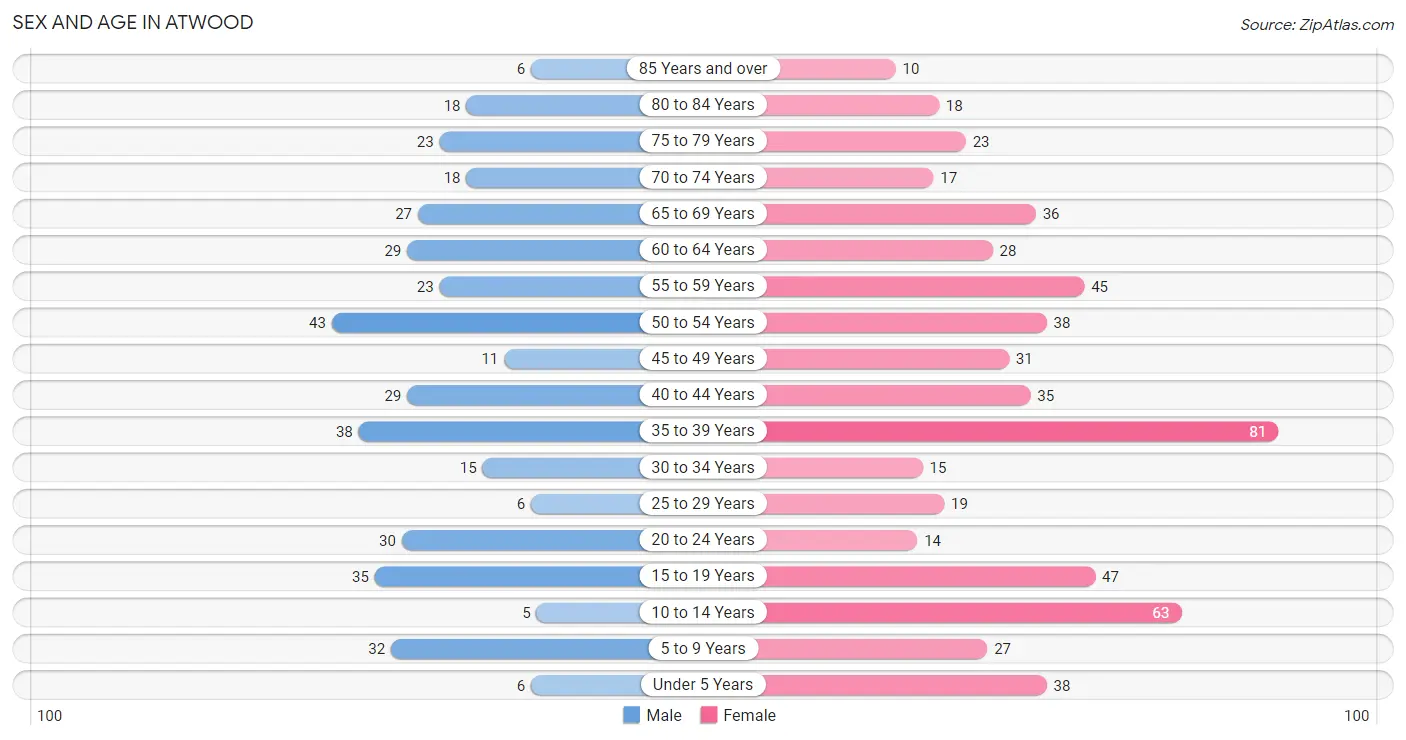
| Age Bracket | Male | Female |
| Under 5 Years | 6 (1.5%) | 38 (6.5%) |
| 5 to 9 Years | 32 (8.1%) | 27 (4.6%) |
| 10 to 14 Years | 5 (1.3%) | 63 (10.8%) |
| 15 to 19 Years | 35 (8.9%) | 47 (8.0%) |
| 20 to 24 Years | 30 (7.6%) | 14 (2.4%) |
| 25 to 29 Years | 6 (1.5%) | 19 (3.3%) |
| 30 to 34 Years | 15 (3.8%) | 15 (2.6%) |
| 35 to 39 Years | 38 (9.6%) | 81 (13.9%) |
| 40 to 44 Years | 29 (7.4%) | 35 (6.0%) |
| 45 to 49 Years | 11 (2.8%) | 31 (5.3%) |
| 50 to 54 Years | 43 (10.9%) | 38 (6.5%) |
| 55 to 59 Years | 23 (5.8%) | 45 (7.7%) |
| 60 to 64 Years | 29 (7.4%) | 28 (4.8%) |
| 65 to 69 Years | 27 (6.9%) | 36 (6.1%) |
| 70 to 74 Years | 18 (4.6%) | 17 (2.9%) |
| 75 to 79 Years | 23 (5.8%) | 23 (3.9%) |
| 80 to 84 Years | 18 (4.6%) | 18 (3.1%) |
| 85 Years and over | 6 (1.5%) | 10 (1.7%) |
| Total | 394 (100.0%) | 585 (100.0%) |
Families and Households in Atwood
Median Family Size in Atwood
The median family size in Atwood is 2.81 persons per family, with single male/father families (14 | 4.8%) accounting for the largest median family size of 3.93 persons per family. On the other hand, single female/mother families (34 | 11.5%) represent the smallest median family size with 2.74 persons per family.
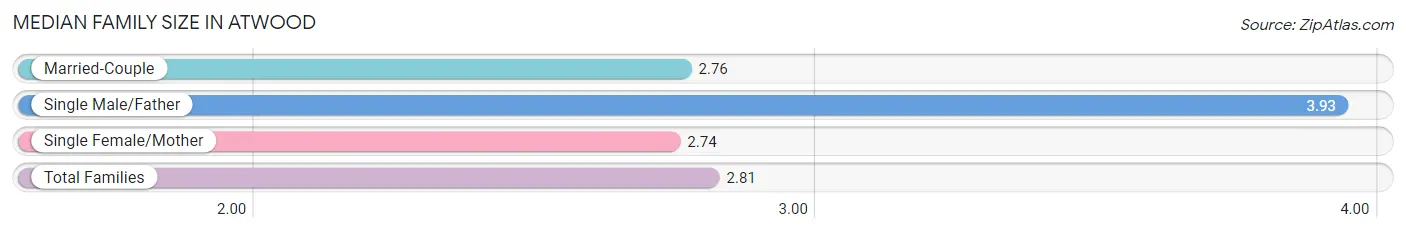
| Family Type | # Families | Family Size |
| Married-Couple | 247 (83.7%) | 2.76 |
| Single Male/Father | 14 (4.8%) | 3.93 |
| Single Female/Mother | 34 (11.5%) | 2.74 |
| Total Families | 295 (100.0%) | 2.81 |
Median Household Size in Atwood
The median household size in Atwood is 2.29 persons per household, with single male/father households (14 | 3.3%) accounting for the largest median household size of 4.5 persons per household. non-family households (133 | 31.1%) represent the smallest median household size with 1.06 persons per household.
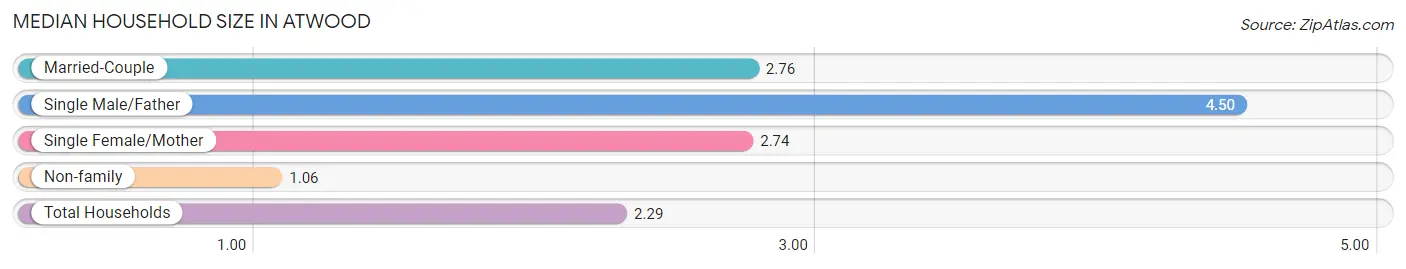
| Household Type | # Households | Household Size |
| Married-Couple | 247 (57.7%) | 2.76 |
| Single Male/Father | 14 (3.3%) | 4.50 |
| Single Female/Mother | 34 (7.9%) | 2.74 |
| Non-family | 133 (31.1%) | 1.06 |
| Total Households | 428 (100.0%) | 2.29 |
Household Size by Marriage Status in Atwood
Out of a total of 428 households in Atwood, 295 (68.9%) are family households, while 133 (31.1%) are nonfamily households. The most numerous type of family households are 2-person households, comprising 141, and the most common type of nonfamily households are 1-person households, comprising 128.
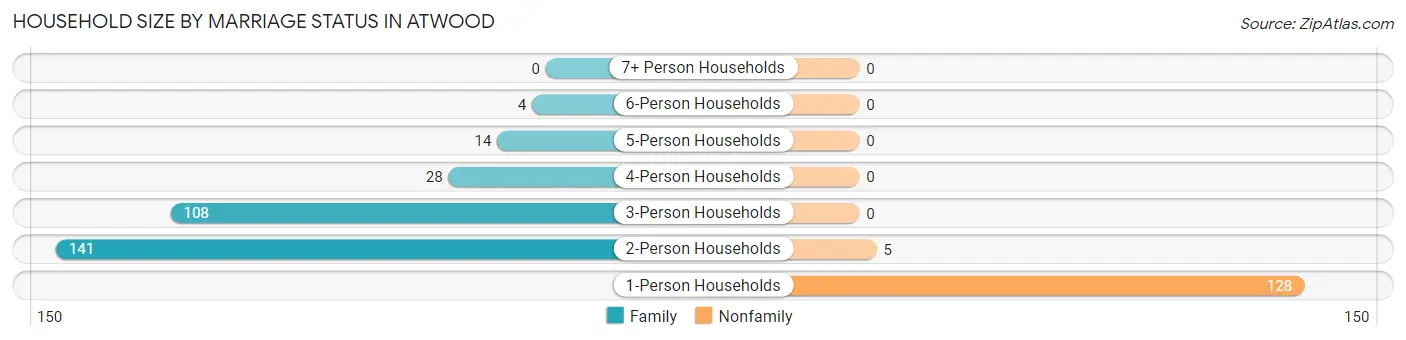
| Household Size | Family Households | Nonfamily Households |
| 1-Person Households | - | 128 (29.9%) |
| 2-Person Households | 141 (32.9%) | 5 (1.2%) |
| 3-Person Households | 108 (25.2%) | 0 (0.0%) |
| 4-Person Households | 28 (6.5%) | 0 (0.0%) |
| 5-Person Households | 14 (3.3%) | 0 (0.0%) |
| 6-Person Households | 4 (0.9%) | 0 (0.0%) |
| 7+ Person Households | 0 (0.0%) | 0 (0.0%) |
| Total | 295 (68.9%) | 133 (31.1%) |
Female Fertility in Atwood
Fertility by Age in Atwood
Average fertility rate in Atwood is 17.0 births per 1,000 women. Women in the age bracket of 35 to 50 years have the highest fertility rate with 27.0 births per 1,000 women. Women in the age bracket of 35 to 50 years acount for 100.0% of all women with births.
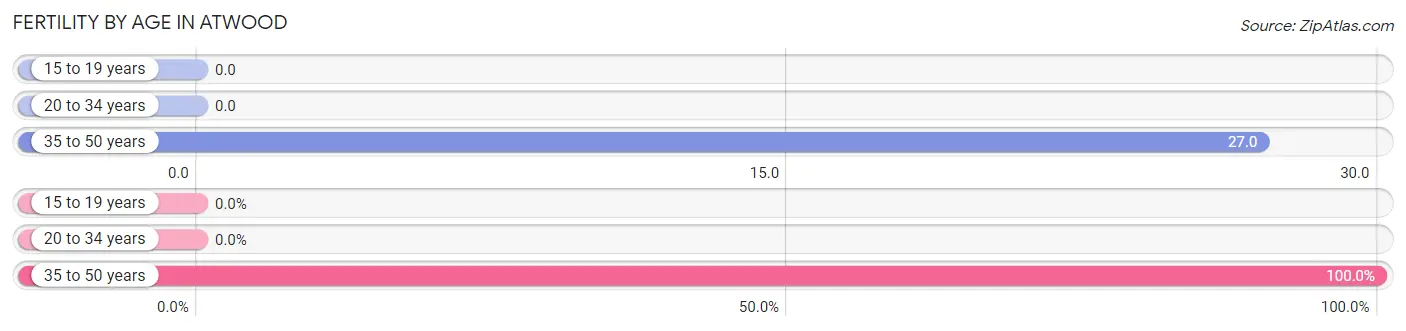
| Age Bracket | Women with Births | Births / 1,000 Women |
| 15 to 19 years | 0 (0.0%) | 0.0 |
| 20 to 34 years | 0 (0.0%) | 0.0 |
| 35 to 50 years | 4 (100.0%) | 27.0 |
| Total | 4 (100.0%) | 17.0 |
Fertility by Age by Marriage Status in Atwood
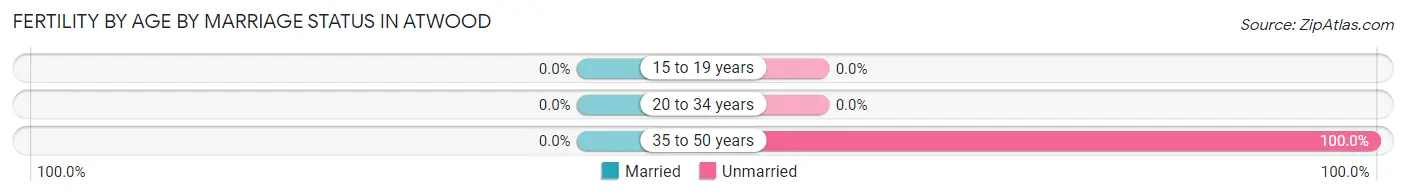
| Age Bracket | Married | Unmarried |
| 15 to 19 years | 0 (0.0%) | 0 (0.0%) |
| 20 to 34 years | 0 (0.0%) | 0 (0.0%) |
| 35 to 50 years | 0 (0.0%) | 4 (100.0%) |
| Total | 0 (0.0%) | 4 (100.0%) |
Fertility by Education in Atwood
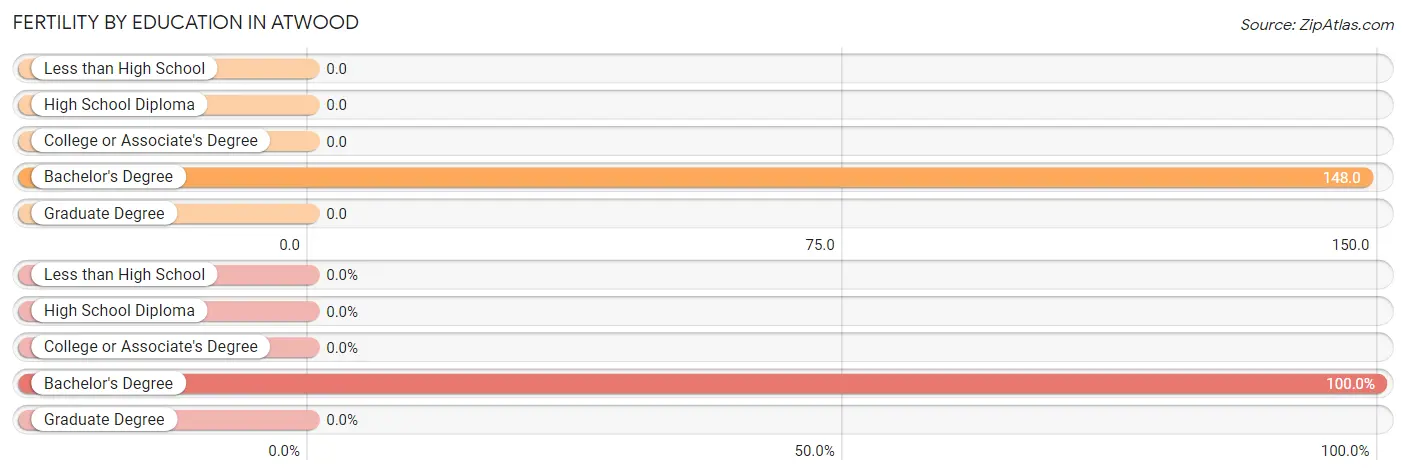
| Educational Attainment | Women with Births | Births / 1,000 Women |
| Less than High School | 0 (0.0%) | 0.0 |
| High School Diploma | 0 (0.0%) | 0.0 |
| College or Associate's Degree | 0 (0.0%) | 0.0 |
| Bachelor's Degree | 4 (100.0%) | 148.0 |
| Graduate Degree | 0 (0.0%) | 0.0 |
| Total | 4 (100.0%) | 17.0 |
Fertility by Education by Marriage Status in Atwood
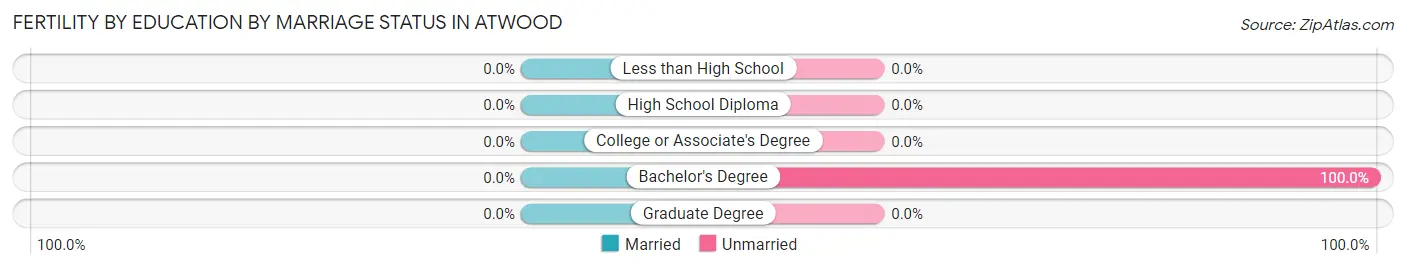
| Educational Attainment | Married | Unmarried |
| Less than High School | 0 (0.0%) | 0 (0.0%) |
| High School Diploma | 0 (0.0%) | 0 (0.0%) |
| College or Associate's Degree | 0 (0.0%) | 0 (0.0%) |
| Bachelor's Degree | 0 (0.0%) | 4 (100.0%) |
| Graduate Degree | 0 (0.0%) | 0 (0.0%) |
| Total | 0 (0.0%) | 4 (100.0%) |
Employment Characteristics in Atwood
Employment by Class of Employer in Atwood
Among the 404 employed individuals in Atwood, private company employees (329 | 81.4%), self-employed (not incorporated) (36 | 8.9%), and state government employees (20 | 5.0%) make up the most common classes of employment.
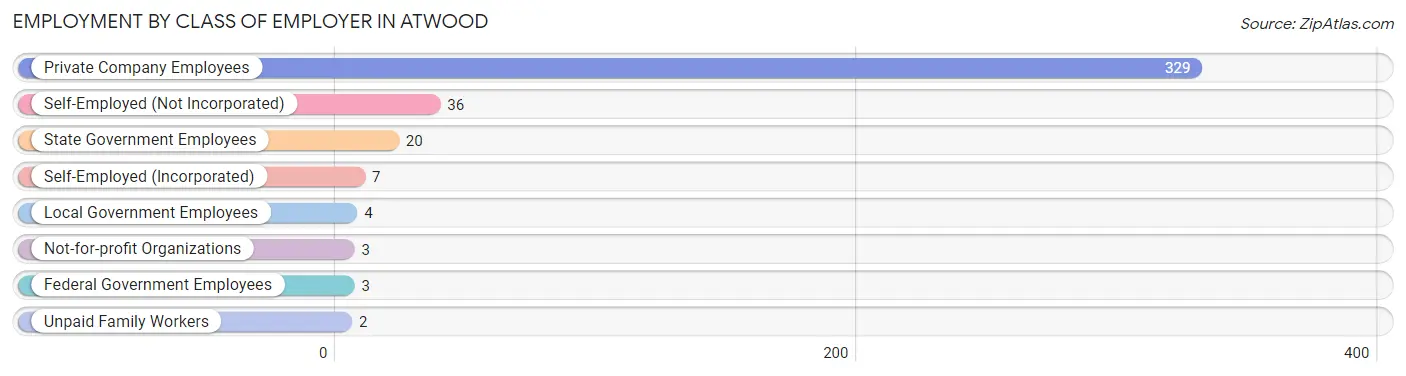
| Employer Class | # Employees | % Employees |
| Private Company Employees | 329 | 81.4% |
| Self-Employed (Incorporated) | 7 | 1.7% |
| Self-Employed (Not Incorporated) | 36 | 8.9% |
| Not-for-profit Organizations | 3 | 0.7% |
| Local Government Employees | 4 | 1.0% |
| State Government Employees | 20 | 5.0% |
| Federal Government Employees | 3 | 0.7% |
| Unpaid Family Workers | 2 | 0.5% |
| Total | 404 | 100.0% |
Employment Status by Age in Atwood
According to the labor force statistics for Atwood, out of the total population over 16 years of age (785), 53.4% or 419 individuals are in the labor force, with 2.4% or 10 of them unemployed. The age group with the highest labor force participation rate is 30 to 34 years, with 100.0% or 30 individuals in the labor force. Within the labor force, the 20 to 24 years age range has the highest percentage of unemployed individuals, with 23.8% or 10 of them being unemployed.
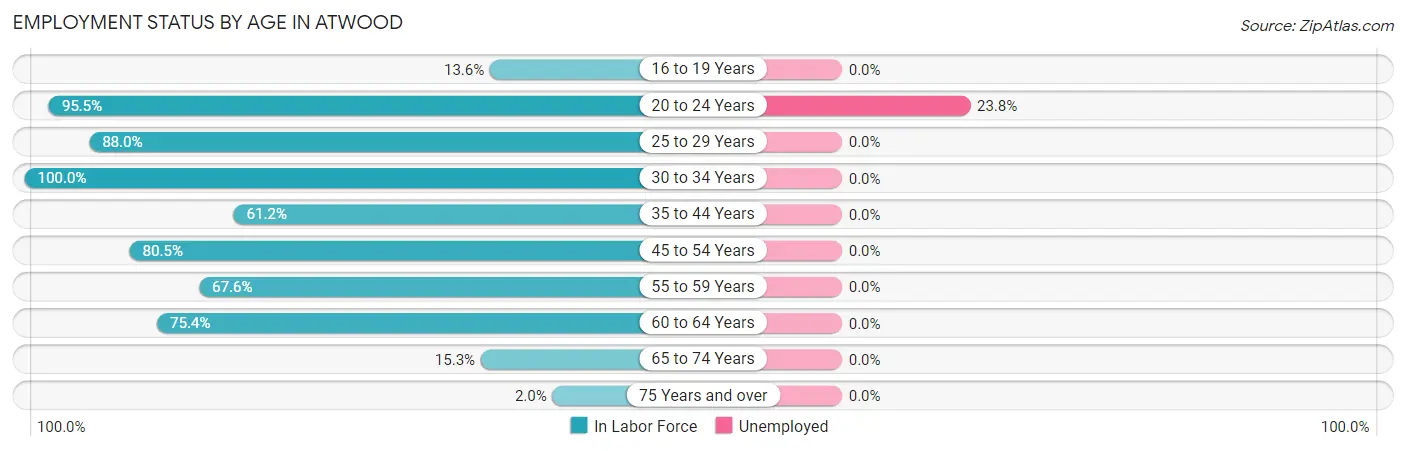
| Age Bracket | In Labor Force | Unemployed |
| 16 to 19 Years | 8 (13.6%) | 0 (0.0%) |
| 20 to 24 Years | 42 (95.5%) | 10 (23.8%) |
| 25 to 29 Years | 22 (88.0%) | 0 (0.0%) |
| 30 to 34 Years | 30 (100.0%) | 0 (0.0%) |
| 35 to 44 Years | 112 (61.2%) | 0 (0.0%) |
| 45 to 54 Years | 99 (80.5%) | 0 (0.0%) |
| 55 to 59 Years | 46 (67.6%) | 0 (0.0%) |
| 60 to 64 Years | 43 (75.4%) | 0 (0.0%) |
| 65 to 74 Years | 15 (15.3%) | 0 (0.0%) |
| 75 Years and over | 2 (2.0%) | 0 (0.0%) |
| Total | 419 (53.4%) | 10 (2.4%) |
Employment Status by Educational Attainment in Atwood
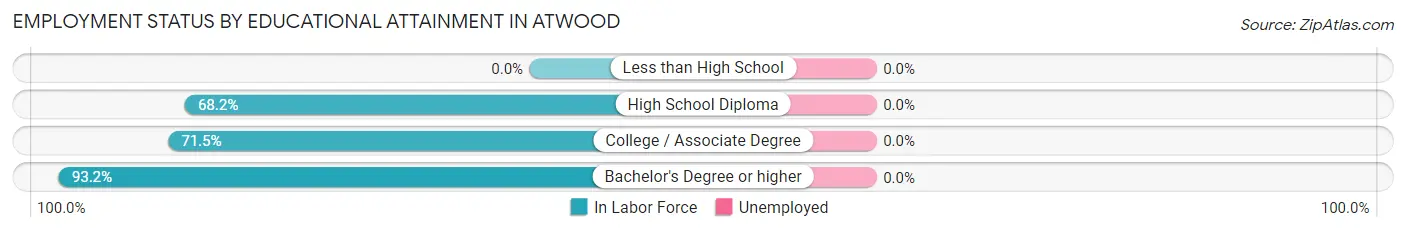
| Educational Attainment | In Labor Force | Unemployed |
| Less than High School | 0 (0.0%) | 0 (0.0%) |
| High School Diploma | 180 (68.2%) | 0 (0.0%) |
| College / Associate Degree | 103 (71.5%) | 0 (0.0%) |
| Bachelor's Degree or higher | 69 (93.2%) | 0 (0.0%) |
| Total | 352 (72.4%) | 0 (0.0%) |
Employment Occupations by Sex in Atwood
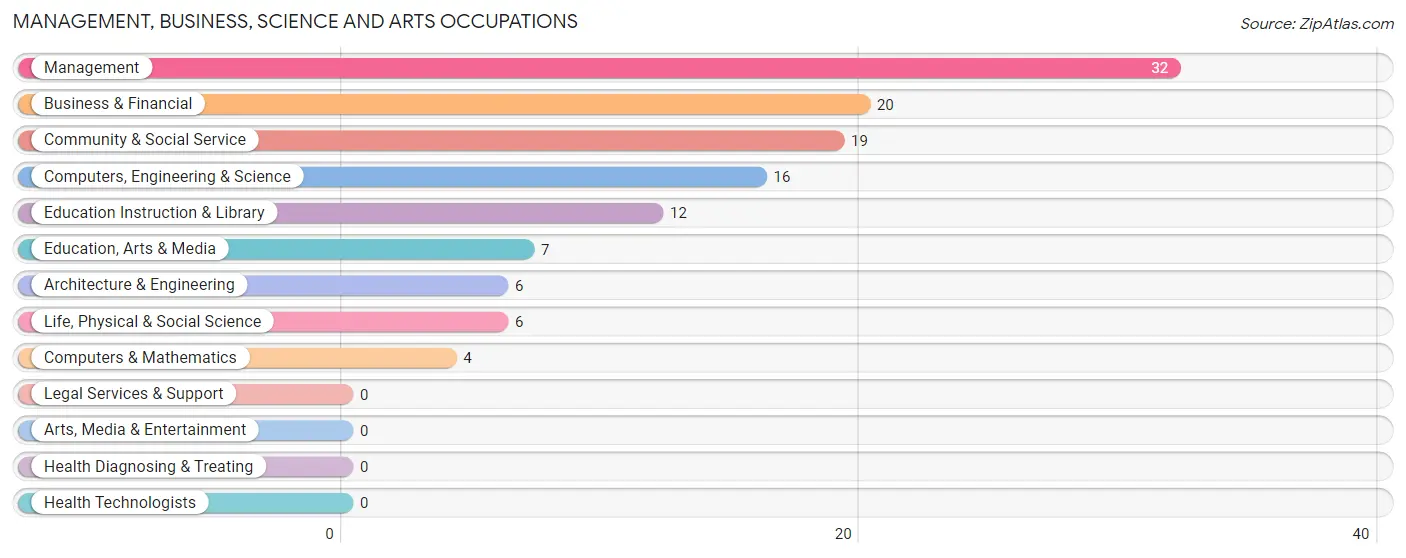
Management, Business, Science and Arts Occupations
The most common Management, Business, Science and Arts occupations in Atwood are Management (32 | 7.8%), Business & Financial (20 | 4.9%), Community & Social Service (19 | 4.6%), Computers, Engineering & Science (16 | 3.9%), and Education Instruction & Library (12 | 2.9%).
Management, Business, Science and Arts Occupations by Sex
Within the Management, Business, Science and Arts occupations in Atwood, the most male-oriented occupations are Architecture & Engineering (100.0%), Life, Physical & Social Science (100.0%), and Computers, Engineering & Science (75.0%), while the most female-oriented occupations are Computers & Mathematics (100.0%), Education Instruction & Library (100.0%), and Community & Social Service (78.9%).
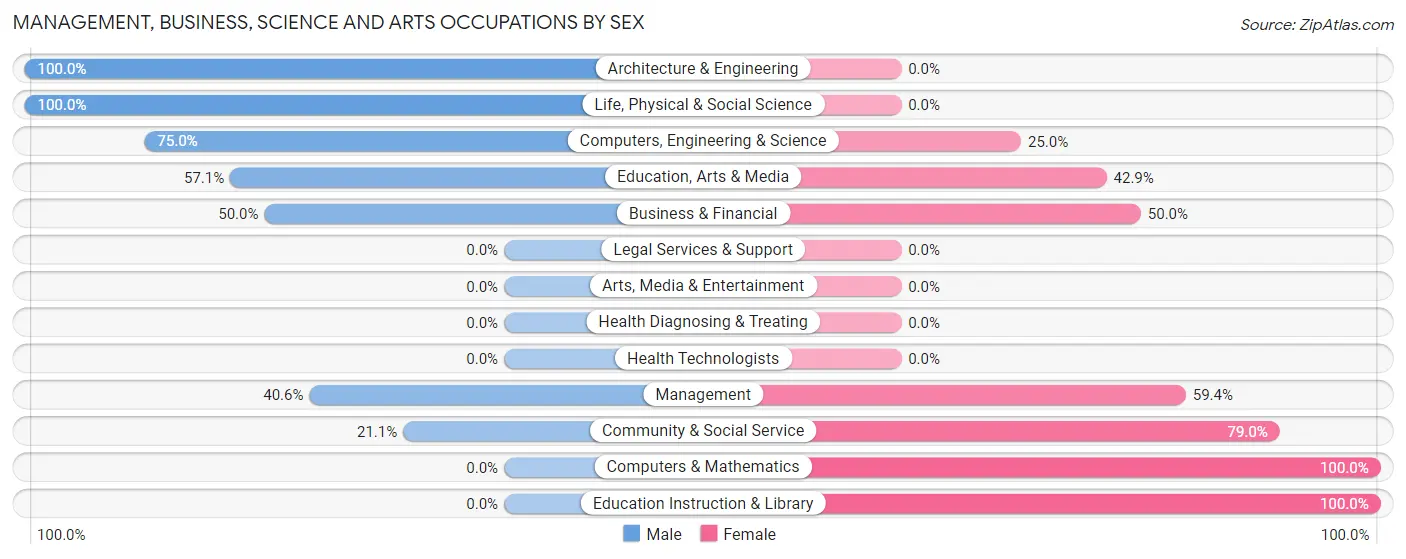
| Occupation | Male | Female |
| Management | 13 (40.6%) | 19 (59.4%) |
| Business & Financial | 10 (50.0%) | 10 (50.0%) |
| Computers, Engineering & Science | 12 (75.0%) | 4 (25.0%) |
| Computers & Mathematics | 0 (0.0%) | 4 (100.0%) |
| Architecture & Engineering | 6 (100.0%) | 0 (0.0%) |
| Life, Physical & Social Science | 6 (100.0%) | 0 (0.0%) |
| Community & Social Service | 4 (21.0%) | 15 (78.9%) |
| Education, Arts & Media | 4 (57.1%) | 3 (42.9%) |
| Legal Services & Support | 0 (0.0%) | 0 (0.0%) |
| Education Instruction & Library | 0 (0.0%) | 12 (100.0%) |
| Arts, Media & Entertainment | 0 (0.0%) | 0 (0.0%) |
| Health Diagnosing & Treating | 0 (0.0%) | 0 (0.0%) |
| Health Technologists | 0 (0.0%) | 0 (0.0%) |
| Total (Category) | 39 (44.8%) | 48 (55.2%) |
| Total (Overall) | 204 (49.9%) | 205 (50.1%) |
Services Occupations
The most common Services occupations in Atwood are Food Preparation & Serving (32 | 7.8%), Cleaning & Maintenance (28 | 6.9%), Healthcare Support (10 | 2.4%), and Personal Care & Service (5 | 1.2%).
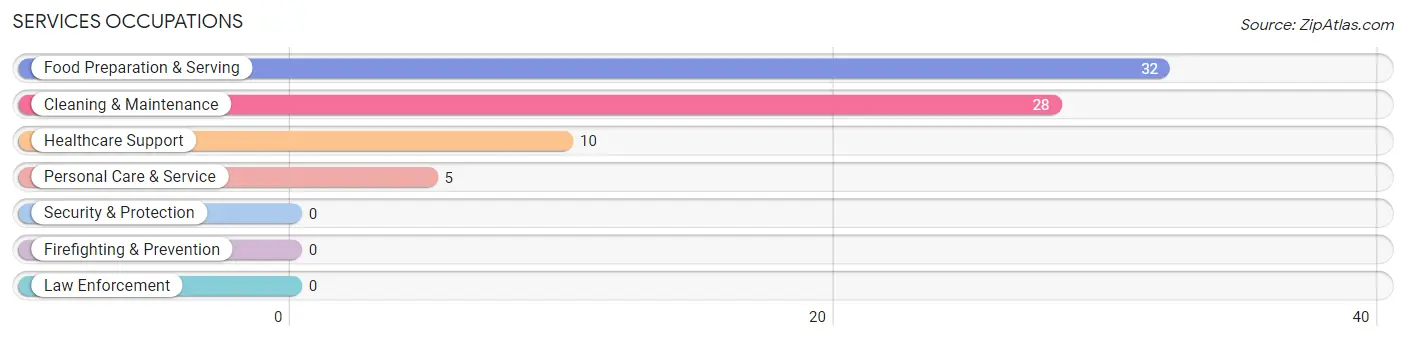
Services Occupations by Sex
Within the Services occupations in Atwood, the most male-oriented occupations are Cleaning & Maintenance (39.3%), and Food Preparation & Serving (12.5%), while the most female-oriented occupations are Healthcare Support (100.0%), Personal Care & Service (100.0%), and Food Preparation & Serving (87.5%).
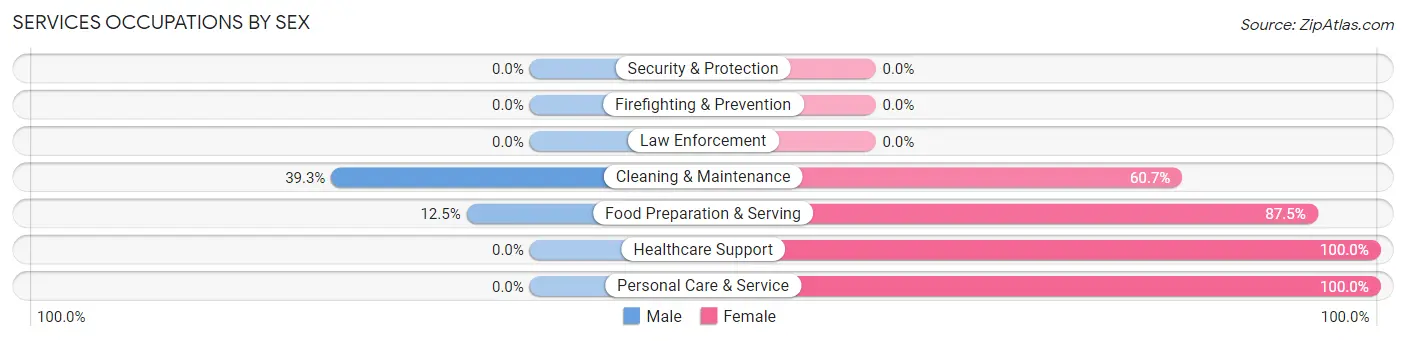
| Occupation | Male | Female |
| Healthcare Support | 0 (0.0%) | 10 (100.0%) |
| Security & Protection | 0 (0.0%) | 0 (0.0%) |
| Firefighting & Prevention | 0 (0.0%) | 0 (0.0%) |
| Law Enforcement | 0 (0.0%) | 0 (0.0%) |
| Food Preparation & Serving | 4 (12.5%) | 28 (87.5%) |
| Cleaning & Maintenance | 11 (39.3%) | 17 (60.7%) |
| Personal Care & Service | 0 (0.0%) | 5 (100.0%) |
| Total (Category) | 15 (20.0%) | 60 (80.0%) |
| Total (Overall) | 204 (49.9%) | 205 (50.1%) |
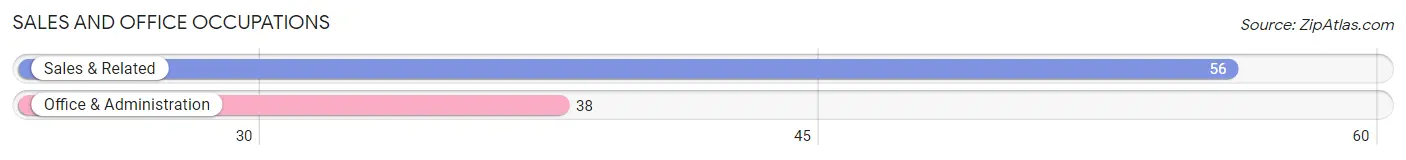
Sales and Office Occupations
The most common Sales and Office occupations in Atwood are Sales & Related (56 | 13.7%), and Office & Administration (38 | 9.3%).
Sales and Office Occupations by Sex
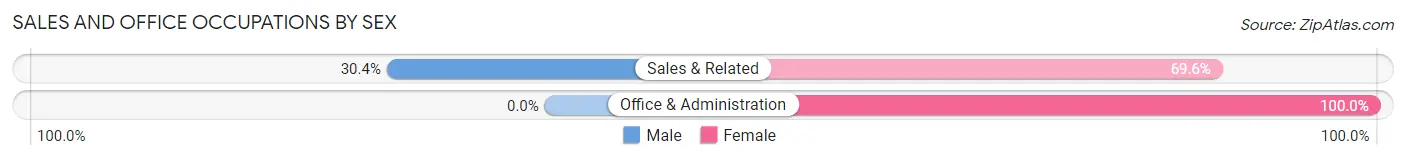
| Occupation | Male | Female |
| Sales & Related | 17 (30.4%) | 39 (69.6%) |
| Office & Administration | 0 (0.0%) | 38 (100.0%) |
| Total (Category) | 17 (18.1%) | 77 (81.9%) |
| Total (Overall) | 204 (49.9%) | 205 (50.1%) |
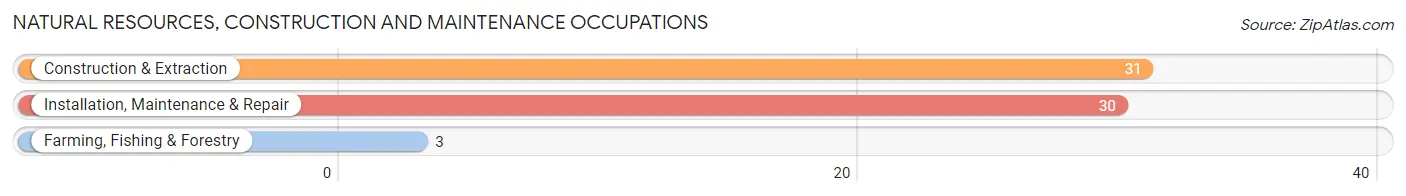
Natural Resources, Construction and Maintenance Occupations
The most common Natural Resources, Construction and Maintenance occupations in Atwood are Construction & Extraction (31 | 7.6%), Installation, Maintenance & Repair (30 | 7.3%), and Farming, Fishing & Forestry (3 | 0.7%).
Natural Resources, Construction and Maintenance Occupations by Sex
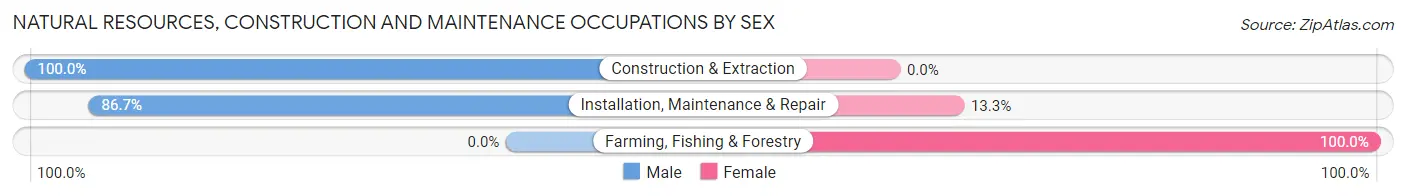
| Occupation | Male | Female |
| Farming, Fishing & Forestry | 0 (0.0%) | 3 (100.0%) |
| Construction & Extraction | 31 (100.0%) | 0 (0.0%) |
| Installation, Maintenance & Repair | 26 (86.7%) | 4 (13.3%) |
| Total (Category) | 57 (89.1%) | 7 (10.9%) |
| Total (Overall) | 204 (49.9%) | 205 (50.1%) |
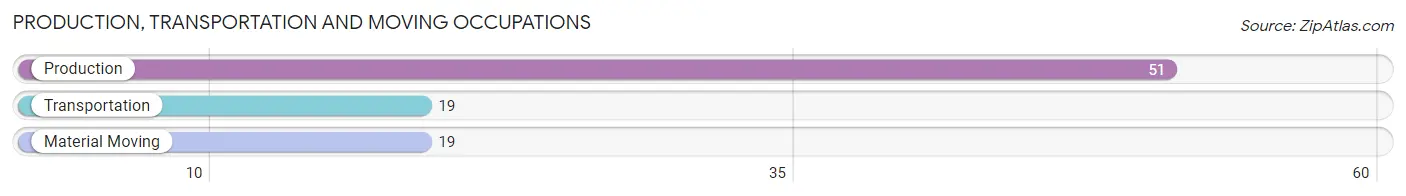
Production, Transportation and Moving Occupations
The most common Production, Transportation and Moving occupations in Atwood are Production (51 | 12.5%), Transportation (19 | 4.6%), and Material Moving (19 | 4.6%).
Production, Transportation and Moving Occupations by Sex
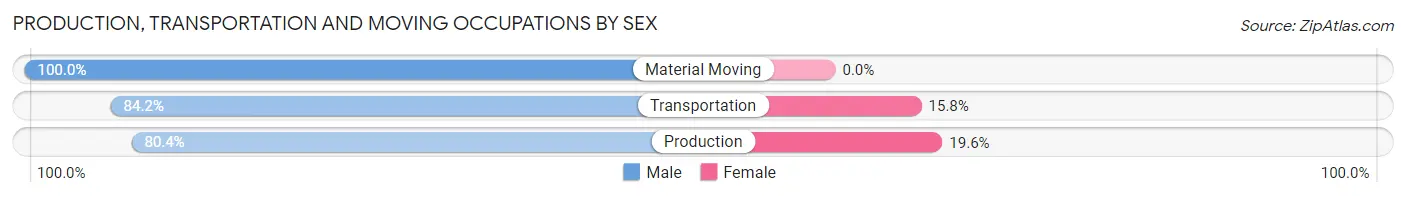
| Occupation | Male | Female |
| Production | 41 (80.4%) | 10 (19.6%) |
| Transportation | 16 (84.2%) | 3 (15.8%) |
| Material Moving | 19 (100.0%) | 0 (0.0%) |
| Total (Category) | 76 (85.4%) | 13 (14.6%) |
| Total (Overall) | 204 (49.9%) | 205 (50.1%) |
Employment Industries by Sex in Atwood
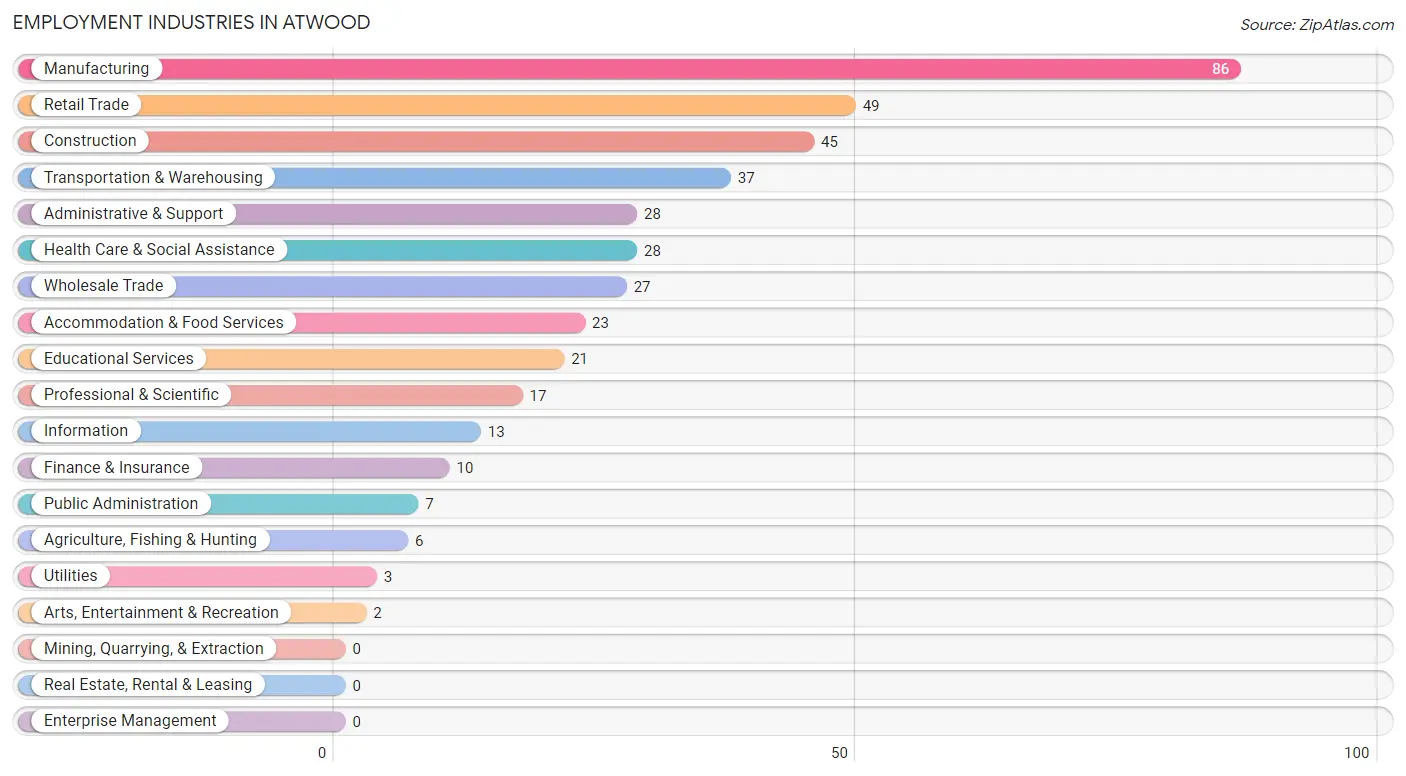
Employment Industries in Atwood
The major employment industries in Atwood include Manufacturing (86 | 21.0%), Retail Trade (49 | 12.0%), Construction (45 | 11.0%), Transportation & Warehousing (37 | 9.0%), and Administrative & Support (28 | 6.9%).
Employment Industries by Sex in Atwood
The Atwood industries that see more men than women are Arts, Entertainment & Recreation (100.0%), Construction (93.3%), and Transportation & Warehousing (91.9%), whereas the industries that tend to have a higher number of women are Agriculture, Fishing & Hunting (100.0%), Utilities (100.0%), and Information (100.0%).
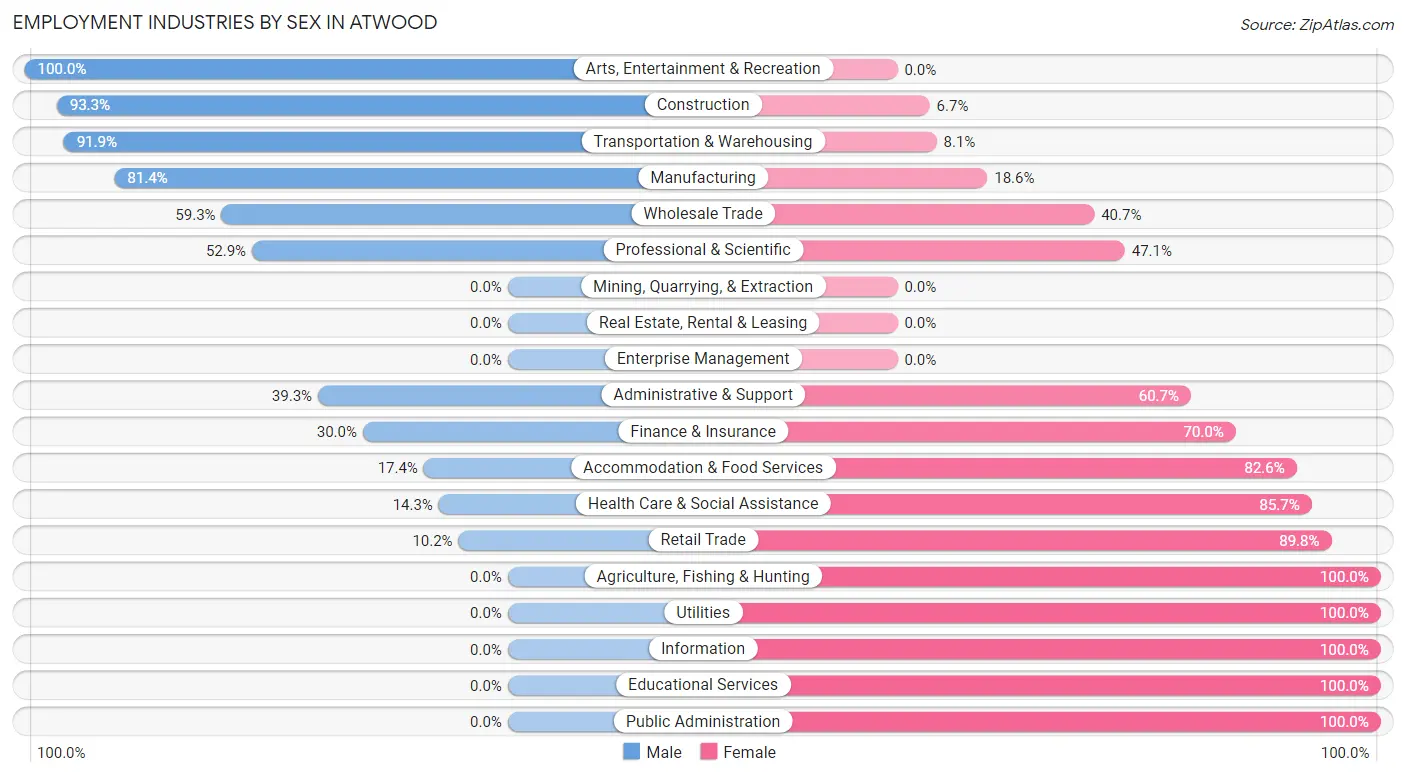
| Industry | Male | Female |
| Agriculture, Fishing & Hunting | 0 (0.0%) | 6 (100.0%) |
| Mining, Quarrying, & Extraction | 0 (0.0%) | 0 (0.0%) |
| Construction | 42 (93.3%) | 3 (6.7%) |
| Manufacturing | 70 (81.4%) | 16 (18.6%) |
| Wholesale Trade | 16 (59.3%) | 11 (40.7%) |
| Retail Trade | 5 (10.2%) | 44 (89.8%) |
| Transportation & Warehousing | 34 (91.9%) | 3 (8.1%) |
| Utilities | 0 (0.0%) | 3 (100.0%) |
| Information | 0 (0.0%) | 13 (100.0%) |
| Finance & Insurance | 3 (30.0%) | 7 (70.0%) |
| Real Estate, Rental & Leasing | 0 (0.0%) | 0 (0.0%) |
| Professional & Scientific | 9 (52.9%) | 8 (47.1%) |
| Enterprise Management | 0 (0.0%) | 0 (0.0%) |
| Administrative & Support | 11 (39.3%) | 17 (60.7%) |
| Educational Services | 0 (0.0%) | 21 (100.0%) |
| Health Care & Social Assistance | 4 (14.3%) | 24 (85.7%) |
| Arts, Entertainment & Recreation | 2 (100.0%) | 0 (0.0%) |
| Accommodation & Food Services | 4 (17.4%) | 19 (82.6%) |
| Public Administration | 0 (0.0%) | 7 (100.0%) |
| Total | 204 (49.9%) | 205 (50.1%) |
Education in Atwood
School Enrollment in Atwood
The most common levels of schooling among the 220 students in Atwood are high school (68 | 30.9%), middle school (63 | 28.6%), and elementary school (44 | 20.0%).
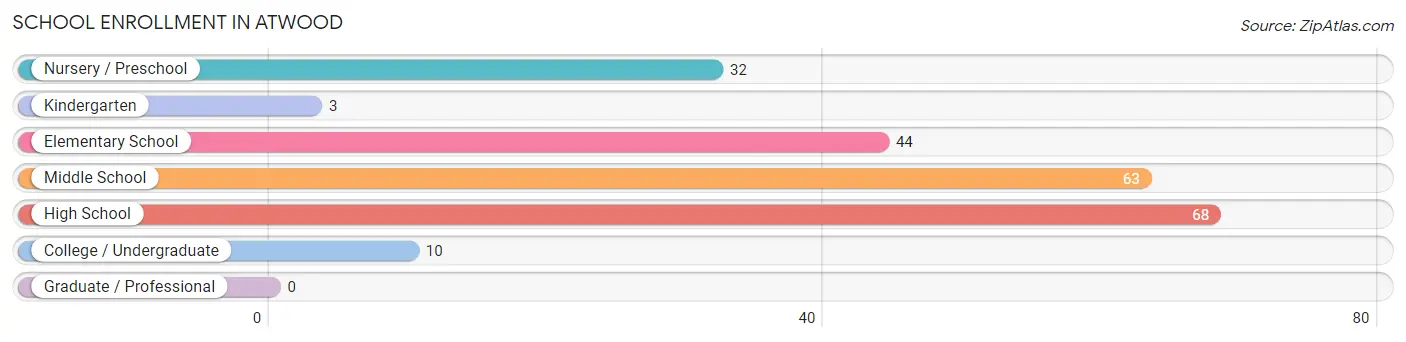
| School Level | # Students | % Students |
| Nursery / Preschool | 32 | 14.5% |
| Kindergarten | 3 | 1.4% |
| Elementary School | 44 | 20.0% |
| Middle School | 63 | 28.6% |
| High School | 68 | 30.9% |
| College / Undergraduate | 10 | 4.5% |
| Graduate / Professional | 0 | 0.0% |
| Total | 220 | 100.0% |
School Enrollment by Age by Funding Source in Atwood
Out of a total of 220 students who are enrolled in schools in Atwood, 5 (2.3%) attend a private institution, while the remaining 215 (97.7%) are enrolled in public schools. The age group of 3 to 4 year olds has the highest likelihood of being enrolled in private schools, with 5 (33.3% in the age bracket) enrolled. Conversely, the age group of 5 to 9 year old has the lowest likelihood of being enrolled in a private school, with 59 (100.0% in the age bracket) attending a public institution.
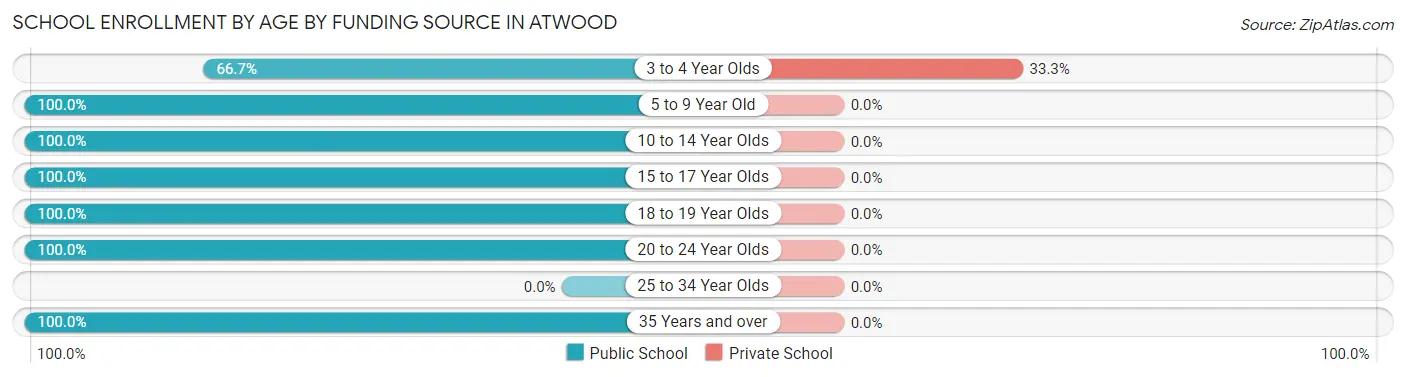
| Age Bracket | Public School | Private School |
| 3 to 4 Year Olds | 10 (66.7%) | 5 (33.3%) |
| 5 to 9 Year Old | 59 (100.0%) | 0 (0.0%) |
| 10 to 14 Year Olds | 68 (100.0%) | 0 (0.0%) |
| 15 to 17 Year Olds | 59 (100.0%) | 0 (0.0%) |
| 18 to 19 Year Olds | 9 (100.0%) | 0 (0.0%) |
| 20 to 24 Year Olds | 2 (100.0%) | 0 (0.0%) |
| 25 to 34 Year Olds | 0 (0.0%) | 0 (0.0%) |
| 35 Years and over | 8 (100.0%) | 0 (0.0%) |
| Total | 215 (97.7%) | 5 (2.3%) |
Educational Attainment by Field of Study in Atwood
Education (21 | 21.2%), business (19 | 19.2%), science & technology (17 | 17.2%), bio, nature & agricultural (14 | 14.1%), and psychology (12 | 12.1%) are the most common fields of study among 99 individuals in Atwood who have obtained a bachelor's degree or higher.
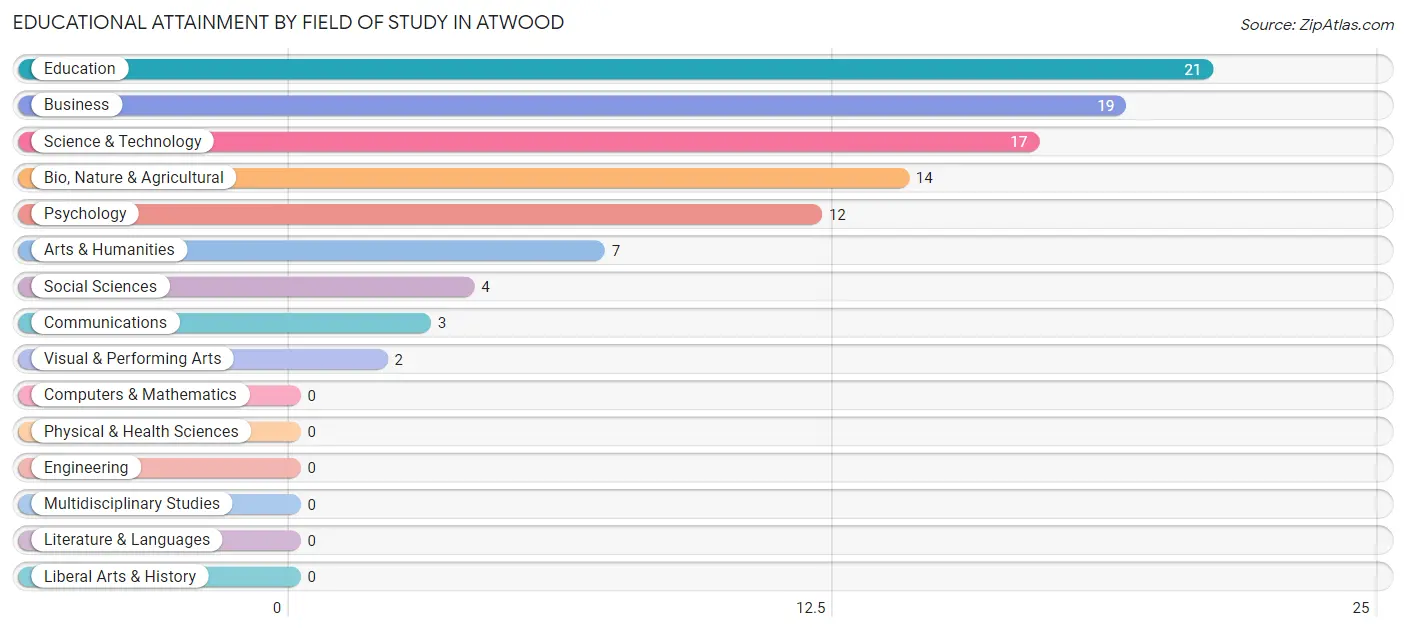
| Field of Study | # Graduates | % Graduates |
| Computers & Mathematics | 0 | 0.0% |
| Bio, Nature & Agricultural | 14 | 14.1% |
| Physical & Health Sciences | 0 | 0.0% |
| Psychology | 12 | 12.1% |
| Social Sciences | 4 | 4.0% |
| Engineering | 0 | 0.0% |
| Multidisciplinary Studies | 0 | 0.0% |
| Science & Technology | 17 | 17.2% |
| Business | 19 | 19.2% |
| Education | 21 | 21.2% |
| Literature & Languages | 0 | 0.0% |
| Liberal Arts & History | 0 | 0.0% |
| Visual & Performing Arts | 2 | 2.0% |
| Communications | 3 | 3.0% |
| Arts & Humanities | 7 | 7.1% |
| Total | 99 | 100.0% |
Transportation & Commute in Atwood
Vehicle Availability by Sex in Atwood
The most prevalent vehicle ownership categories in Atwood are males with 3 vehicles (101, accounting for 49.5%) and females with 3 vehicles (59, making up 50.5%).
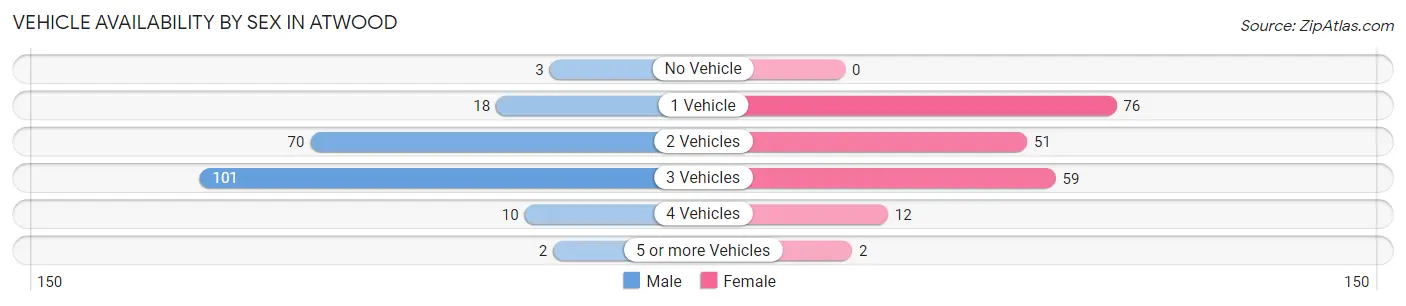
| Vehicles Available | Male | Female |
| No Vehicle | 3 (1.5%) | 0 (0.0%) |
| 1 Vehicle | 18 (8.8%) | 76 (38.0%) |
| 2 Vehicles | 70 (34.3%) | 51 (25.5%) |
| 3 Vehicles | 101 (49.5%) | 59 (29.5%) |
| 4 Vehicles | 10 (4.9%) | 12 (6.0%) |
| 5 or more Vehicles | 2 (1.0%) | 2 (1.0%) |
| Total | 204 (100.0%) | 200 (100.0%) |
Commute Time in Atwood
The most frequently occuring commute durations in Atwood are 10 to 14 minutes (86 commuters, 23.3%), 5 to 9 minutes (52 commuters, 14.1%), and 15 to 19 minutes (52 commuters, 14.1%).
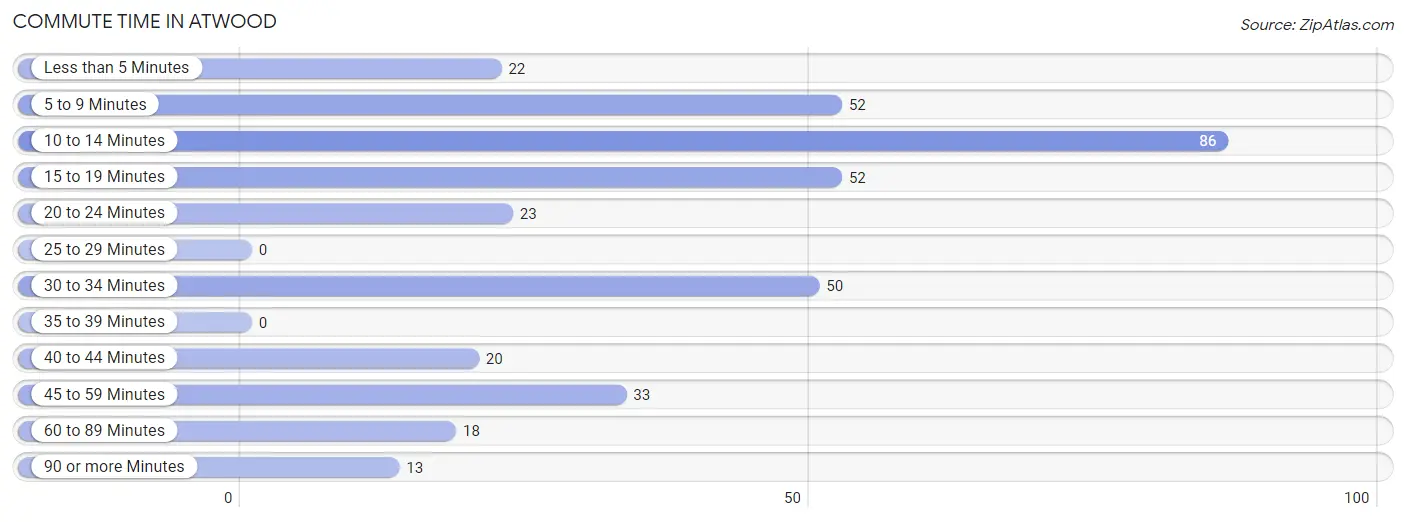
| Commute Time | # Commuters | % Commuters |
| Less than 5 Minutes | 22 | 6.0% |
| 5 to 9 Minutes | 52 | 14.1% |
| 10 to 14 Minutes | 86 | 23.3% |
| 15 to 19 Minutes | 52 | 14.1% |
| 20 to 24 Minutes | 23 | 6.2% |
| 25 to 29 Minutes | 0 | 0.0% |
| 30 to 34 Minutes | 50 | 13.6% |
| 35 to 39 Minutes | 0 | 0.0% |
| 40 to 44 Minutes | 20 | 5.4% |
| 45 to 59 Minutes | 33 | 8.9% |
| 60 to 89 Minutes | 18 | 4.9% |
| 90 or more Minutes | 13 | 3.5% |
Commute Time by Sex in Atwood
The most common commute times in Atwood are 10 to 14 minutes (50 commuters, 25.9%) for males and 15 to 19 minutes (41 commuters, 23.3%) for females.
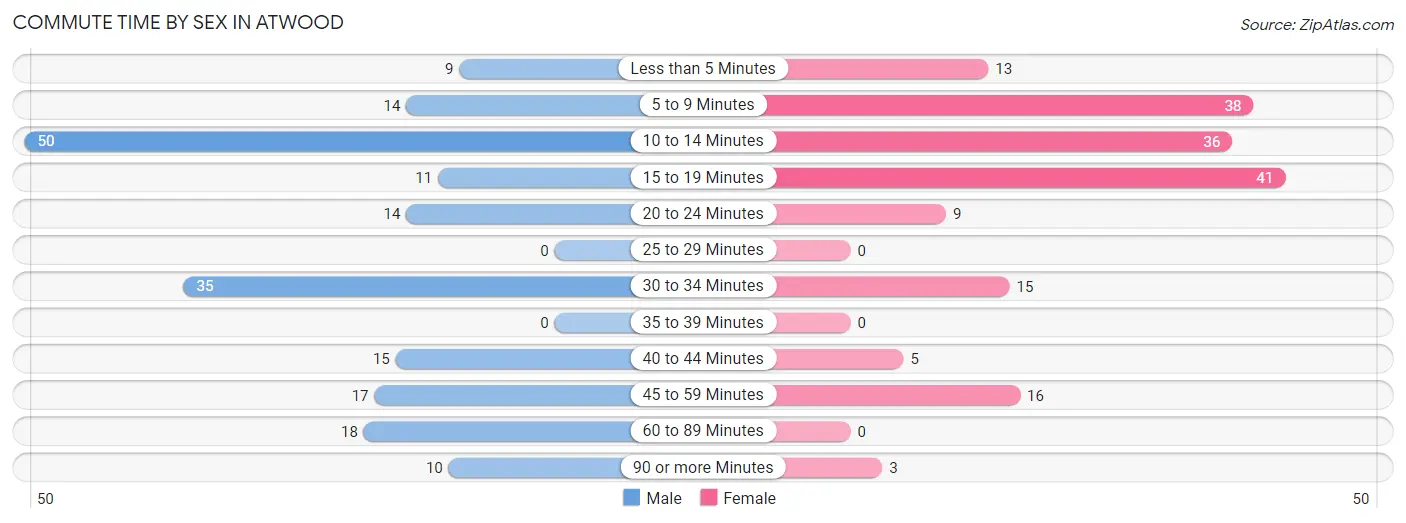
| Commute Time | Male | Female |
| Less than 5 Minutes | 9 (4.7%) | 13 (7.4%) |
| 5 to 9 Minutes | 14 (7.2%) | 38 (21.6%) |
| 10 to 14 Minutes | 50 (25.9%) | 36 (20.4%) |
| 15 to 19 Minutes | 11 (5.7%) | 41 (23.3%) |
| 20 to 24 Minutes | 14 (7.2%) | 9 (5.1%) |
| 25 to 29 Minutes | 0 (0.0%) | 0 (0.0%) |
| 30 to 34 Minutes | 35 (18.1%) | 15 (8.5%) |
| 35 to 39 Minutes | 0 (0.0%) | 0 (0.0%) |
| 40 to 44 Minutes | 15 (7.8%) | 5 (2.8%) |
| 45 to 59 Minutes | 17 (8.8%) | 16 (9.1%) |
| 60 to 89 Minutes | 18 (9.3%) | 0 (0.0%) |
| 90 or more Minutes | 10 (5.2%) | 3 (1.7%) |
Time of Departure to Work by Sex in Atwood
The most frequent times of departure to work in Atwood are 6:00 AM to 6:29 AM (56, 29.0%) for males and 7:00 AM to 7:29 AM (29, 16.5%) for females.
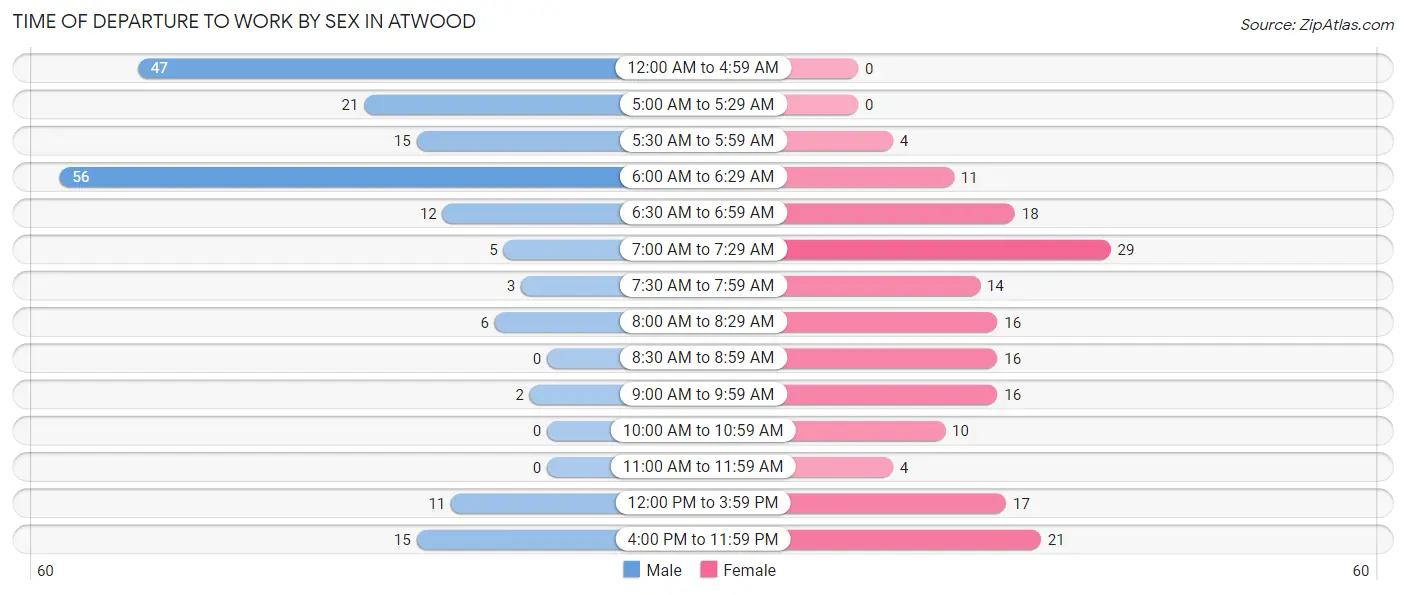
| Time of Departure | Male | Female |
| 12:00 AM to 4:59 AM | 47 (24.3%) | 0 (0.0%) |
| 5:00 AM to 5:29 AM | 21 (10.9%) | 0 (0.0%) |
| 5:30 AM to 5:59 AM | 15 (7.8%) | 4 (2.3%) |
| 6:00 AM to 6:29 AM | 56 (29.0%) | 11 (6.2%) |
| 6:30 AM to 6:59 AM | 12 (6.2%) | 18 (10.2%) |
| 7:00 AM to 7:29 AM | 5 (2.6%) | 29 (16.5%) |
| 7:30 AM to 7:59 AM | 3 (1.5%) | 14 (8.0%) |
| 8:00 AM to 8:29 AM | 6 (3.1%) | 16 (9.1%) |
| 8:30 AM to 8:59 AM | 0 (0.0%) | 16 (9.1%) |
| 9:00 AM to 9:59 AM | 2 (1.0%) | 16 (9.1%) |
| 10:00 AM to 10:59 AM | 0 (0.0%) | 10 (5.7%) |
| 11:00 AM to 11:59 AM | 0 (0.0%) | 4 (2.3%) |
| 12:00 PM to 3:59 PM | 11 (5.7%) | 17 (9.7%) |
| 4:00 PM to 11:59 PM | 15 (7.8%) | 21 (11.9%) |
| Total | 193 (100.0%) | 176 (100.0%) |
Housing Occupancy in Atwood
Occupancy by Ownership in Atwood
Of the total 428 dwellings in Atwood, owner-occupied units account for 359 (83.9%), while renter-occupied units make up 69 (16.1%).
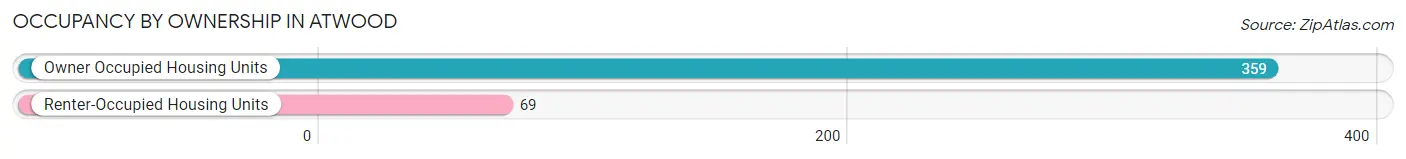
| Occupancy | # Housing Units | % Housing Units |
| Owner Occupied Housing Units | 359 | 83.9% |
| Renter-Occupied Housing Units | 69 | 16.1% |
| Total Occupied Housing Units | 428 | 100.0% |
Occupancy by Household Size in Atwood
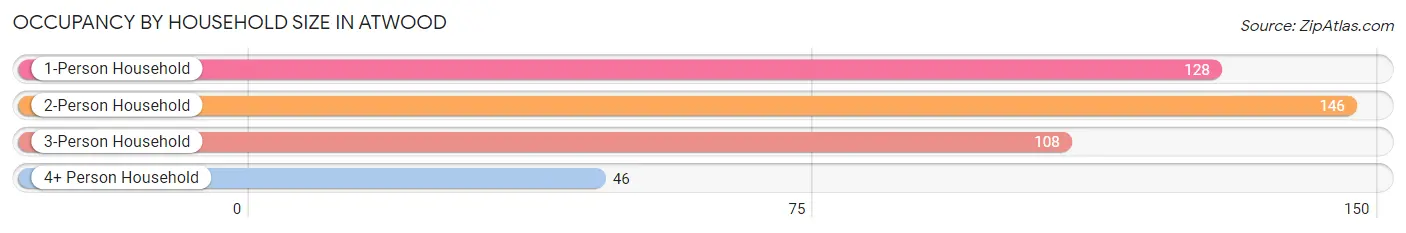
| Household Size | # Housing Units | % Housing Units |
| 1-Person Household | 128 | 29.9% |
| 2-Person Household | 146 | 34.1% |
| 3-Person Household | 108 | 25.2% |
| 4+ Person Household | 46 | 10.7% |
| Total Housing Units | 428 | 100.0% |
Occupancy by Ownership by Household Size in Atwood
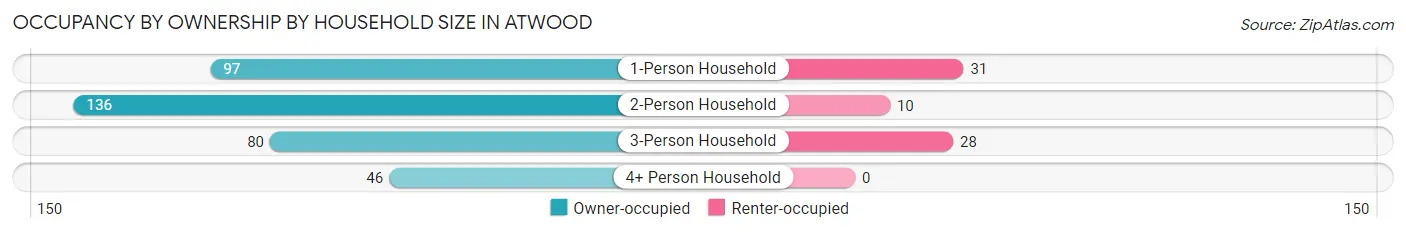
| Household Size | Owner-occupied | Renter-occupied |
| 1-Person Household | 97 (75.8%) | 31 (24.2%) |
| 2-Person Household | 136 (93.1%) | 10 (6.9%) |
| 3-Person Household | 80 (74.1%) | 28 (25.9%) |
| 4+ Person Household | 46 (100.0%) | 0 (0.0%) |
| Total Housing Units | 359 (83.9%) | 69 (16.1%) |
Occupancy by Educational Attainment in Atwood
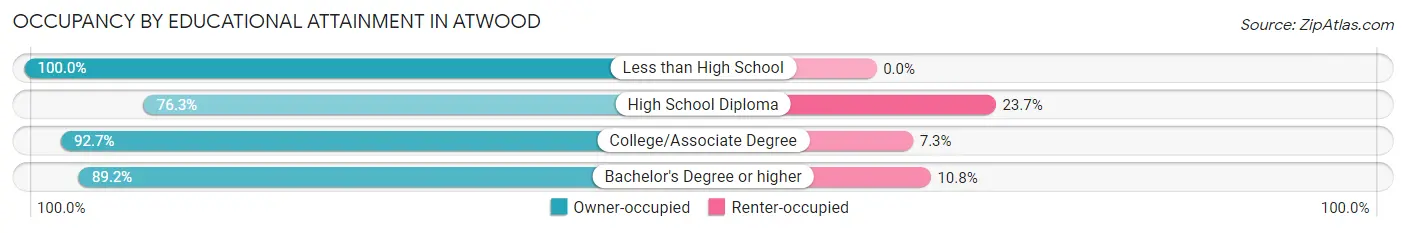
| Household Size | Owner-occupied | Renter-occupied |
| Less than High School | 15 (100.0%) | 0 (0.0%) |
| High School Diploma | 171 (76.3%) | 53 (23.7%) |
| College/Associate Degree | 115 (92.7%) | 9 (7.3%) |
| Bachelor's Degree or higher | 58 (89.2%) | 7 (10.8%) |
Occupancy by Age of Householder in Atwood
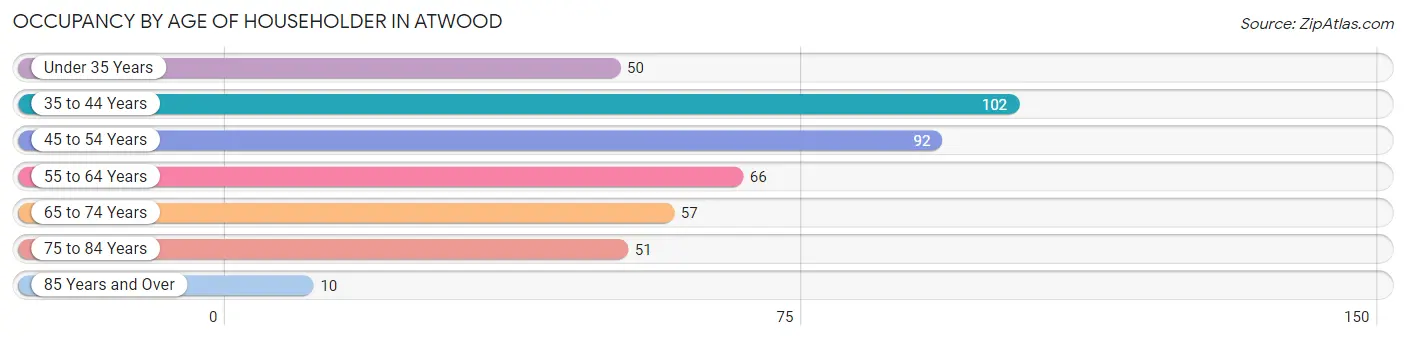
| Age Bracket | # Households | % Households |
| Under 35 Years | 50 | 11.7% |
| 35 to 44 Years | 102 | 23.8% |
| 45 to 54 Years | 92 | 21.5% |
| 55 to 64 Years | 66 | 15.4% |
| 65 to 74 Years | 57 | 13.3% |
| 75 to 84 Years | 51 | 11.9% |
| 85 Years and Over | 10 | 2.3% |
| Total | 428 | 100.0% |
Housing Finances in Atwood
Median Income by Occupancy in Atwood
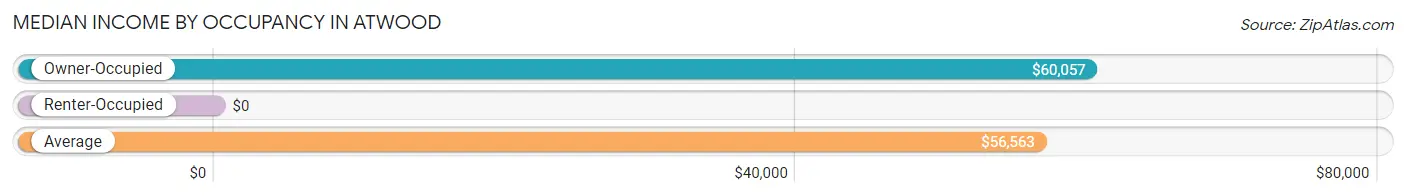
| Occupancy Type | # Households | Median Income |
| Owner-Occupied | 359 (83.9%) | $60,057 |
| Renter-Occupied | 69 (16.1%) | $0 |
| Average | 428 (100.0%) | $56,563 |
Occupancy by Householder Income Bracket in Atwood
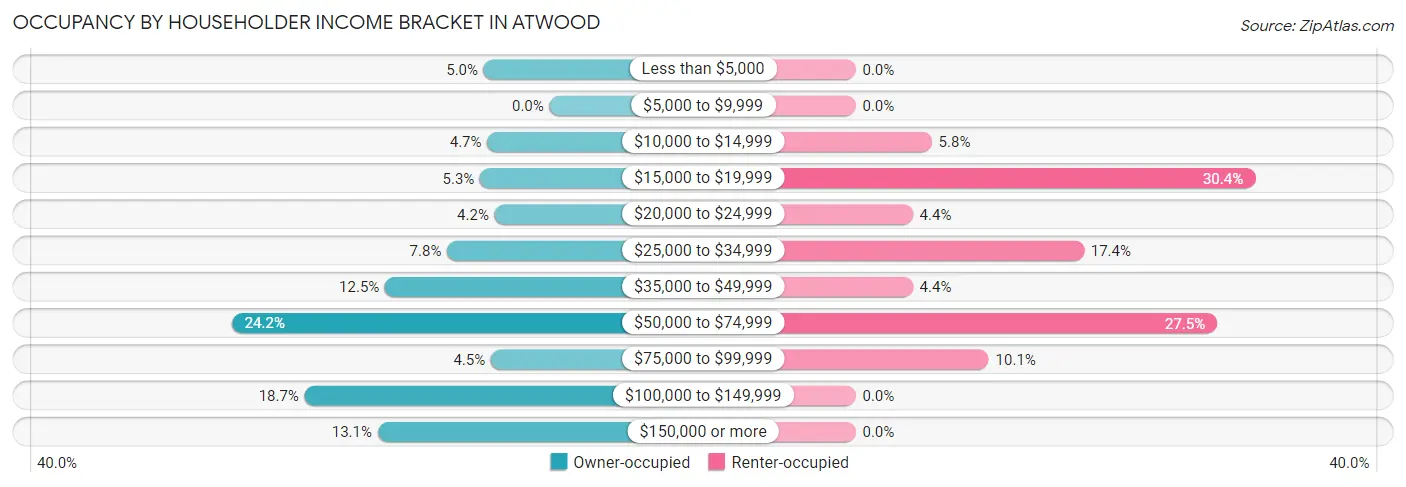
| Income Bracket | Owner-occupied | Renter-occupied |
| Less than $5,000 | 18 (5.0%) | 0 (0.0%) |
| $5,000 to $9,999 | 0 (0.0%) | 0 (0.0%) |
| $10,000 to $14,999 | 17 (4.7%) | 4 (5.8%) |
| $15,000 to $19,999 | 19 (5.3%) | 21 (30.4%) |
| $20,000 to $24,999 | 15 (4.2%) | 3 (4.3%) |
| $25,000 to $34,999 | 28 (7.8%) | 12 (17.4%) |
| $35,000 to $49,999 | 45 (12.5%) | 3 (4.3%) |
| $50,000 to $74,999 | 87 (24.2%) | 19 (27.5%) |
| $75,000 to $99,999 | 16 (4.5%) | 7 (10.1%) |
| $100,000 to $149,999 | 67 (18.7%) | 0 (0.0%) |
| $150,000 or more | 47 (13.1%) | 0 (0.0%) |
| Total | 359 (100.0%) | 69 (100.0%) |
Monthly Housing Cost Tiers in Atwood
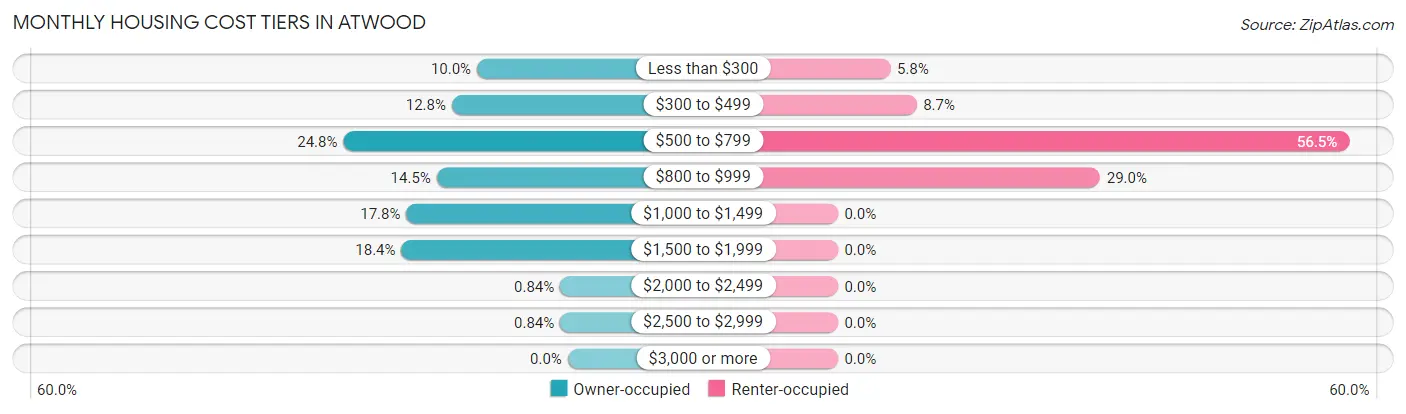
| Monthly Cost | Owner-occupied | Renter-occupied |
| Less than $300 | 36 (10.0%) | 4 (5.8%) |
| $300 to $499 | 46 (12.8%) | 6 (8.7%) |
| $500 to $799 | 89 (24.8%) | 39 (56.5%) |
| $800 to $999 | 52 (14.5%) | 20 (29.0%) |
| $1,000 to $1,499 | 64 (17.8%) | 0 (0.0%) |
| $1,500 to $1,999 | 66 (18.4%) | 0 (0.0%) |
| $2,000 to $2,499 | 3 (0.8%) | 0 (0.0%) |
| $2,500 to $2,999 | 3 (0.8%) | 0 (0.0%) |
| $3,000 or more | 0 (0.0%) | 0 (0.0%) |
| Total | 359 (100.0%) | 69 (100.0%) |
Physical Housing Characteristics in Atwood
Housing Structures in Atwood
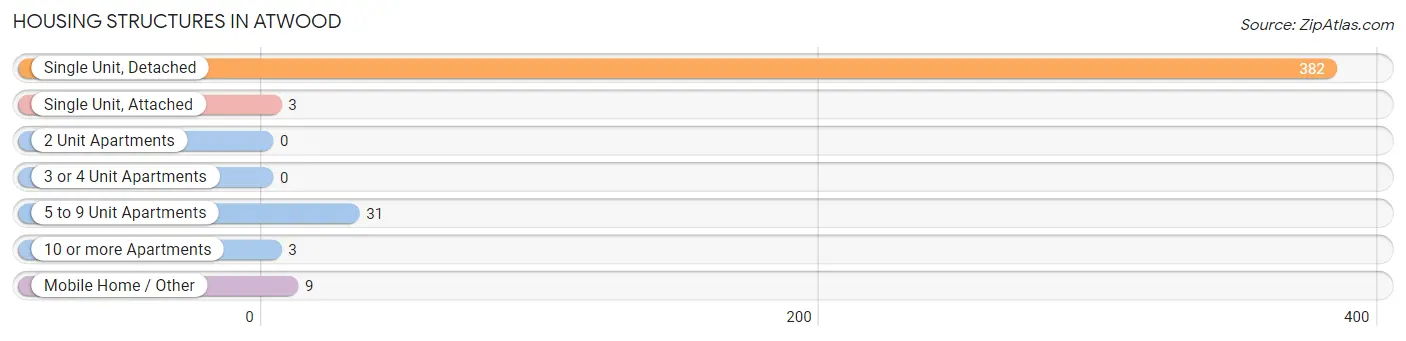
| Structure Type | # Housing Units | % Housing Units |
| Single Unit, Detached | 382 | 89.2% |
| Single Unit, Attached | 3 | 0.7% |
| 2 Unit Apartments | 0 | 0.0% |
| 3 or 4 Unit Apartments | 0 | 0.0% |
| 5 to 9 Unit Apartments | 31 | 7.2% |
| 10 or more Apartments | 3 | 0.7% |
| Mobile Home / Other | 9 | 2.1% |
| Total | 428 | 100.0% |
Housing Structures by Occupancy in Atwood
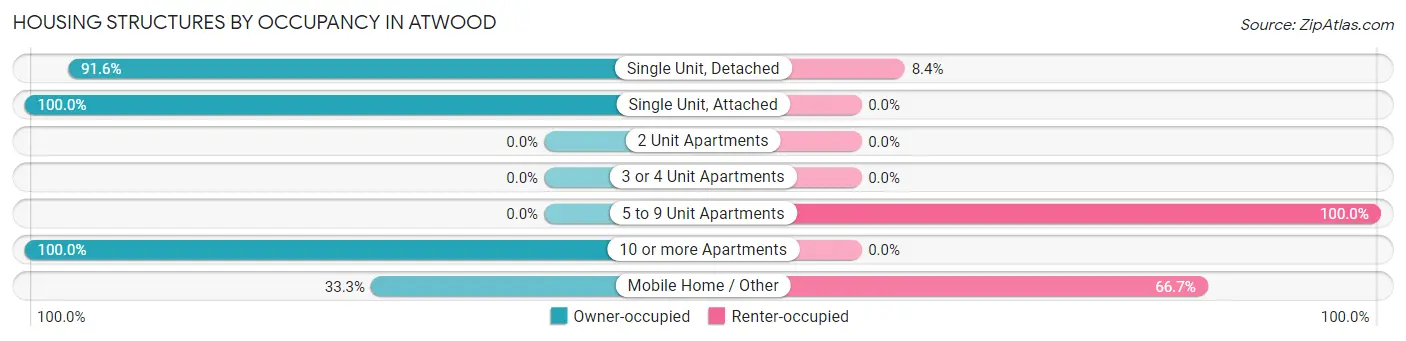
| Structure Type | Owner-occupied | Renter-occupied |
| Single Unit, Detached | 350 (91.6%) | 32 (8.4%) |
| Single Unit, Attached | 3 (100.0%) | 0 (0.0%) |
| 2 Unit Apartments | 0 (0.0%) | 0 (0.0%) |
| 3 or 4 Unit Apartments | 0 (0.0%) | 0 (0.0%) |
| 5 to 9 Unit Apartments | 0 (0.0%) | 31 (100.0%) |
| 10 or more Apartments | 3 (100.0%) | 0 (0.0%) |
| Mobile Home / Other | 3 (33.3%) | 6 (66.7%) |
| Total | 359 (83.9%) | 69 (16.1%) |
Housing Structures by Number of Rooms in Atwood
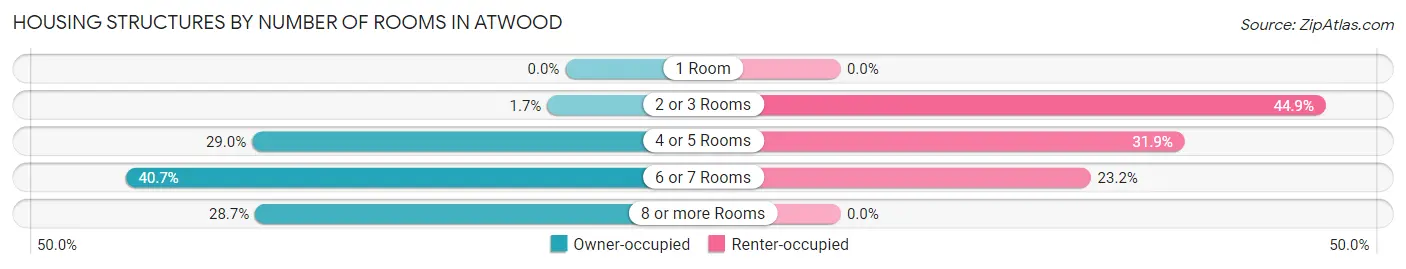
| Number of Rooms | Owner-occupied | Renter-occupied |
| 1 Room | 0 (0.0%) | 0 (0.0%) |
| 2 or 3 Rooms | 6 (1.7%) | 31 (44.9%) |
| 4 or 5 Rooms | 104 (29.0%) | 22 (31.9%) |
| 6 or 7 Rooms | 146 (40.7%) | 16 (23.2%) |
| 8 or more Rooms | 103 (28.7%) | 0 (0.0%) |
| Total | 359 (100.0%) | 69 (100.0%) |
Housing Structure by Heating Type in Atwood
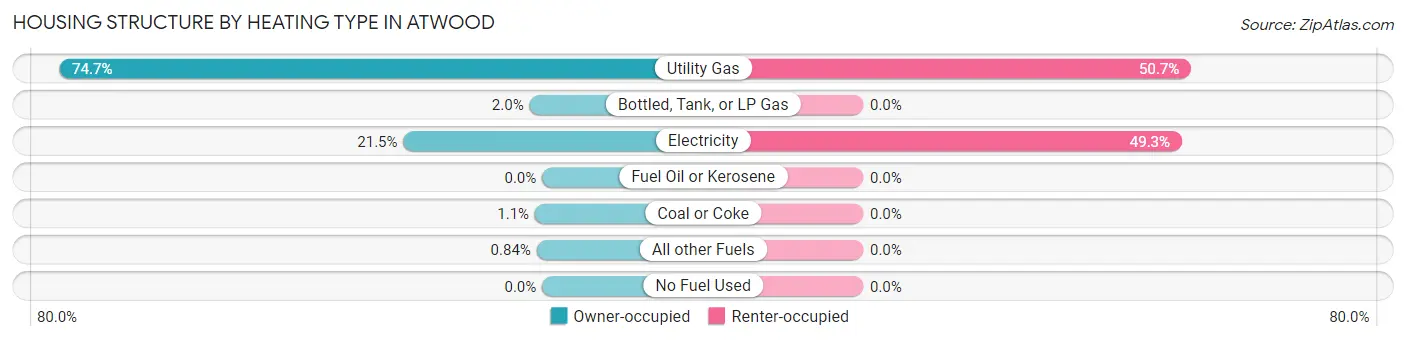
| Heating Type | Owner-occupied | Renter-occupied |
| Utility Gas | 268 (74.7%) | 35 (50.7%) |
| Bottled, Tank, or LP Gas | 7 (1.9%) | 0 (0.0%) |
| Electricity | 77 (21.4%) | 34 (49.3%) |
| Fuel Oil or Kerosene | 0 (0.0%) | 0 (0.0%) |
| Coal or Coke | 4 (1.1%) | 0 (0.0%) |
| All other Fuels | 3 (0.8%) | 0 (0.0%) |
| No Fuel Used | 0 (0.0%) | 0 (0.0%) |
| Total | 359 (100.0%) | 69 (100.0%) |
Household Vehicle Usage in Atwood
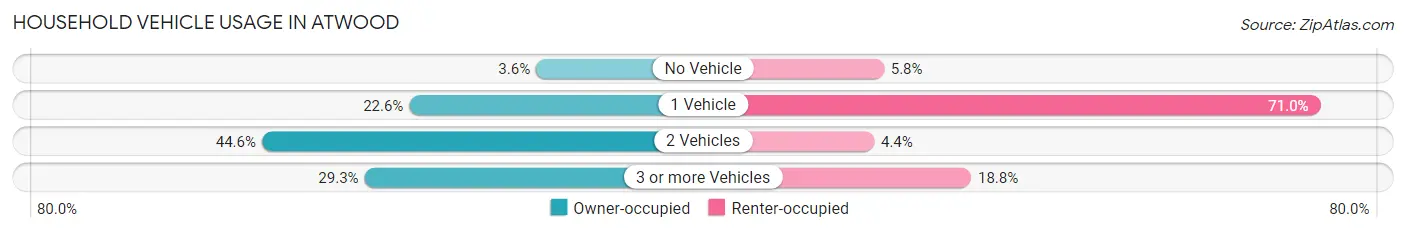
| Vehicles per Household | Owner-occupied | Renter-occupied |
| No Vehicle | 13 (3.6%) | 4 (5.8%) |
| 1 Vehicle | 81 (22.6%) | 49 (71.0%) |
| 2 Vehicles | 160 (44.6%) | 3 (4.3%) |
| 3 or more Vehicles | 105 (29.2%) | 13 (18.8%) |
| Total | 359 (100.0%) | 69 (100.0%) |
Real Estate & Mortgages in Atwood
Real Estate and Mortgage Overview in Atwood
| Characteristic | Without Mortgage | With Mortgage |
| Housing Units | 171 | 188 |
| Median Property Value | $96,100 | $129,300 |
| Median Household Income | $35,694 | $21 |
| Monthly Housing Costs | $506 | $0 |
| Real Estate Taxes | $2,049 | $0 |
Property Value by Mortgage Status in Atwood
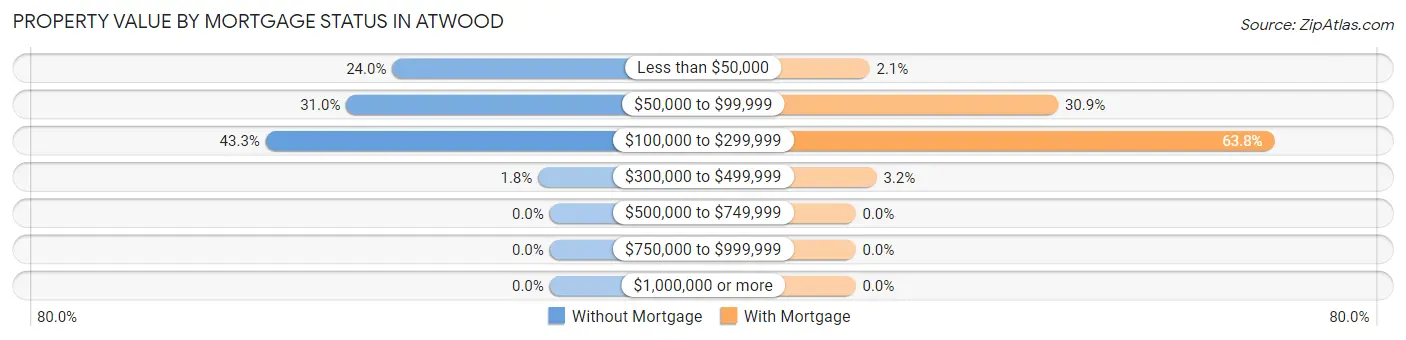
| Property Value | Without Mortgage | With Mortgage |
| Less than $50,000 | 41 (24.0%) | 4 (2.1%) |
| $50,000 to $99,999 | 53 (31.0%) | 58 (30.8%) |
| $100,000 to $299,999 | 74 (43.3%) | 120 (63.8%) |
| $300,000 to $499,999 | 3 (1.8%) | 6 (3.2%) |
| $500,000 to $749,999 | 0 (0.0%) | 0 (0.0%) |
| $750,000 to $999,999 | 0 (0.0%) | 0 (0.0%) |
| $1,000,000 or more | 0 (0.0%) | 0 (0.0%) |
| Total | 171 (100.0%) | 188 (100.0%) |
Household Income by Mortgage Status in Atwood
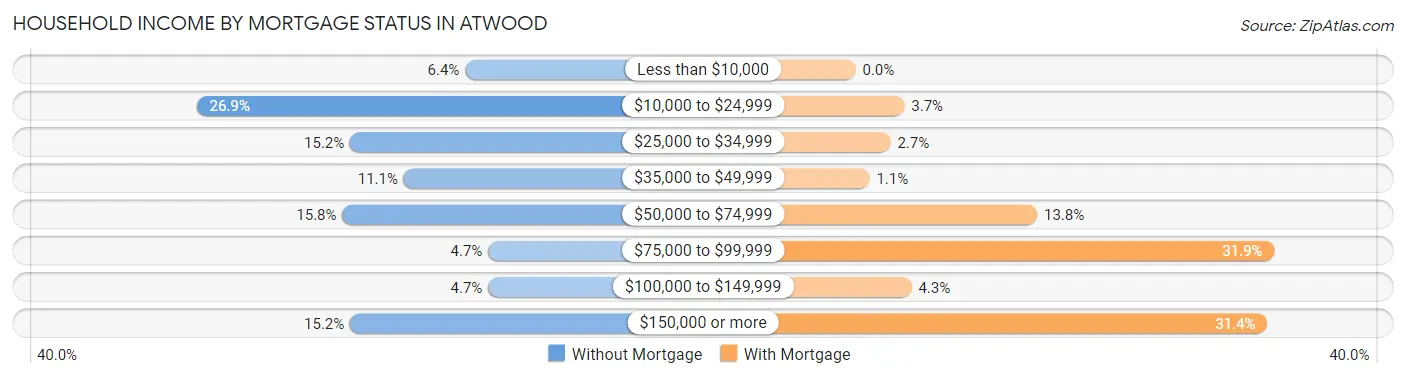
| Household Income | Without Mortgage | With Mortgage |
| Less than $10,000 | 11 (6.4%) | 0 (0.0%) |
| $10,000 to $24,999 | 46 (26.9%) | 7 (3.7%) |
| $25,000 to $34,999 | 26 (15.2%) | 5 (2.7%) |
| $35,000 to $49,999 | 19 (11.1%) | 2 (1.1%) |
| $50,000 to $74,999 | 27 (15.8%) | 26 (13.8%) |
| $75,000 to $99,999 | 8 (4.7%) | 60 (31.9%) |
| $100,000 to $149,999 | 8 (4.7%) | 8 (4.3%) |
| $150,000 or more | 26 (15.2%) | 59 (31.4%) |
| Total | 171 (100.0%) | 188 (100.0%) |
Property Value to Household Income Ratio in Atwood
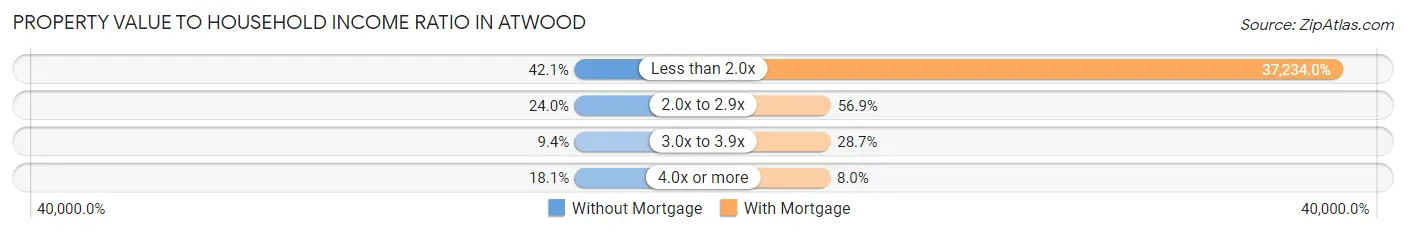
| Value-to-Income Ratio | Without Mortgage | With Mortgage |
| Less than 2.0x | 72 (42.1%) | 70,000 (37,234.0%) |
| 2.0x to 2.9x | 41 (24.0%) | 107 (56.9%) |
| 3.0x to 3.9x | 16 (9.4%) | 54 (28.7%) |
| 4.0x or more | 31 (18.1%) | 15 (8.0%) |
| Total | 171 (100.0%) | 188 (100.0%) |
Real Estate Taxes by Mortgage Status in Atwood
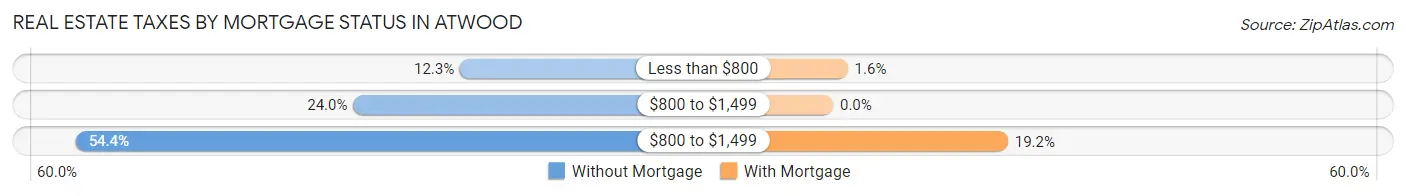
| Property Taxes | Without Mortgage | With Mortgage |
| Less than $800 | 21 (12.3%) | 3 (1.6%) |
| $800 to $1,499 | 41 (24.0%) | 0 (0.0%) |
| $800 to $1,499 | 93 (54.4%) | 36 (19.2%) |
| Total | 171 (100.0%) | 188 (100.0%) |
Health & Disability in Atwood
Health Insurance Coverage by Age in Atwood
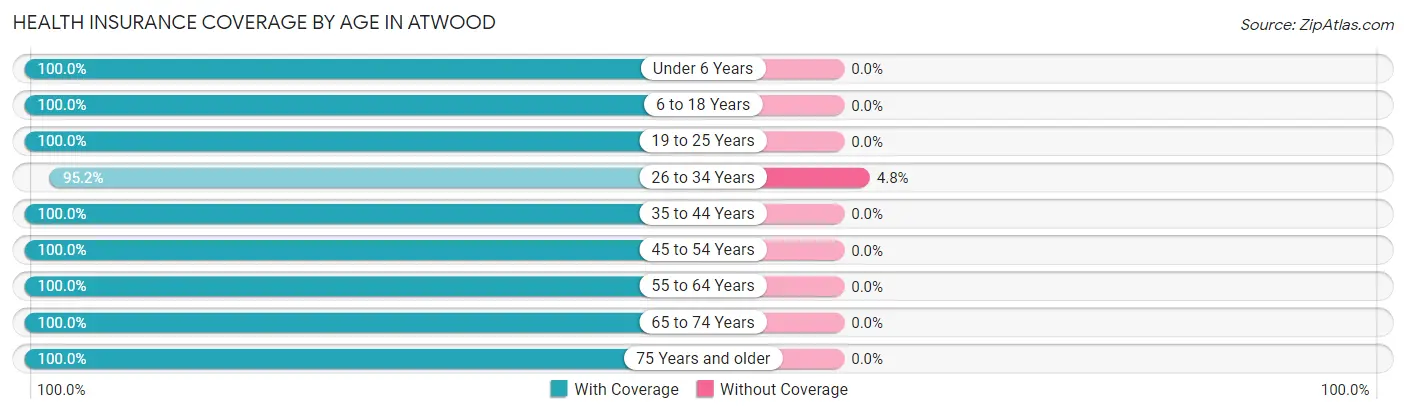
| Age Bracket | With Coverage | Without Coverage |
| Under 6 Years | 61 (100.0%) | 0 (0.0%) |
| 6 to 18 Years | 169 (100.0%) | 0 (0.0%) |
| 19 to 25 Years | 80 (100.0%) | 0 (0.0%) |
| 26 to 34 Years | 40 (95.2%) | 2 (4.8%) |
| 35 to 44 Years | 183 (100.0%) | 0 (0.0%) |
| 45 to 54 Years | 123 (100.0%) | 0 (0.0%) |
| 55 to 64 Years | 125 (100.0%) | 0 (0.0%) |
| 65 to 74 Years | 98 (100.0%) | 0 (0.0%) |
| 75 Years and older | 98 (100.0%) | 0 (0.0%) |
| Total | 977 (99.8%) | 2 (0.2%) |
Health Insurance Coverage by Citizenship Status in Atwood
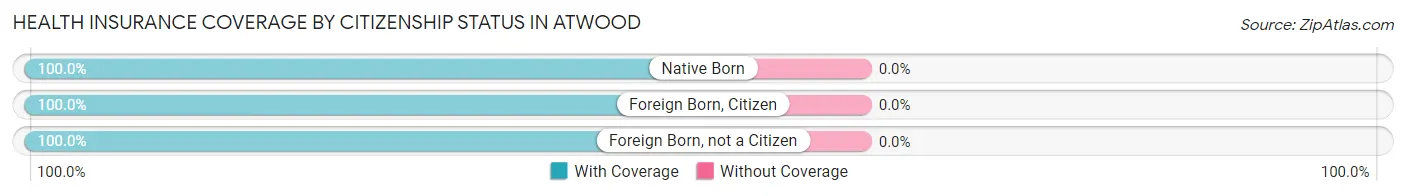
| Citizenship Status | With Coverage | Without Coverage |
| Native Born | 61 (100.0%) | 0 (0.0%) |
| Foreign Born, Citizen | 169 (100.0%) | 0 (0.0%) |
| Foreign Born, not a Citizen | 80 (100.0%) | 0 (0.0%) |
Health Insurance Coverage by Household Income in Atwood
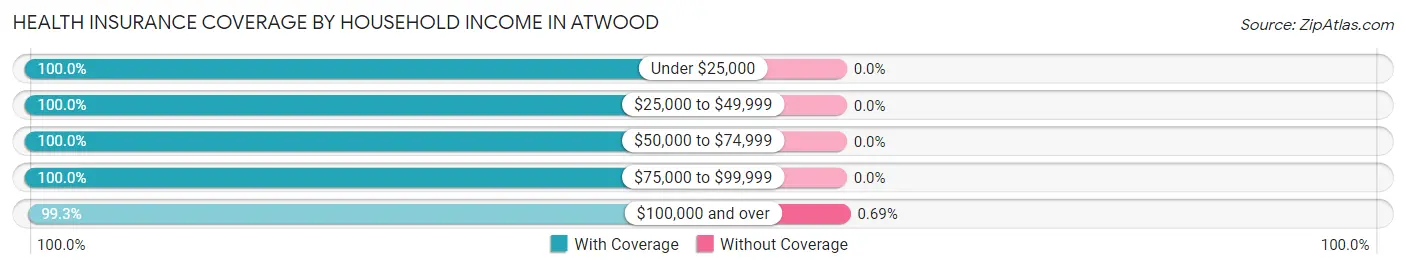
| Household Income | With Coverage | Without Coverage |
| Under $25,000 | 139 (100.0%) | 0 (0.0%) |
| $25,000 to $49,999 | 174 (100.0%) | 0 (0.0%) |
| $50,000 to $74,999 | 312 (100.0%) | 0 (0.0%) |
| $75,000 to $99,999 | 65 (100.0%) | 0 (0.0%) |
| $100,000 and over | 287 (99.3%) | 2 (0.7%) |
Public vs Private Health Insurance Coverage by Age in Atwood
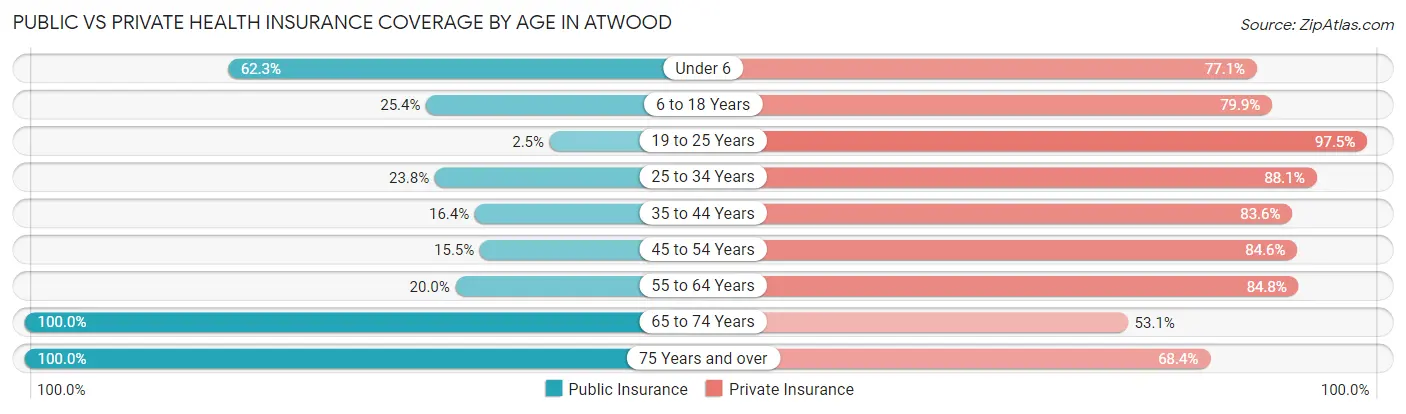
| Age Bracket | Public Insurance | Private Insurance |
| Under 6 | 38 (62.3%) | 47 (77.0%) |
| 6 to 18 Years | 43 (25.4%) | 135 (79.9%) |
| 19 to 25 Years | 2 (2.5%) | 78 (97.5%) |
| 25 to 34 Years | 10 (23.8%) | 37 (88.1%) |
| 35 to 44 Years | 30 (16.4%) | 153 (83.6%) |
| 45 to 54 Years | 19 (15.4%) | 104 (84.6%) |
| 55 to 64 Years | 25 (20.0%) | 106 (84.8%) |
| 65 to 74 Years | 98 (100.0%) | 52 (53.1%) |
| 75 Years and over | 98 (100.0%) | 67 (68.4%) |
| Total | 363 (37.1%) | 779 (79.6%) |
Disability Status by Sex by Age in Atwood
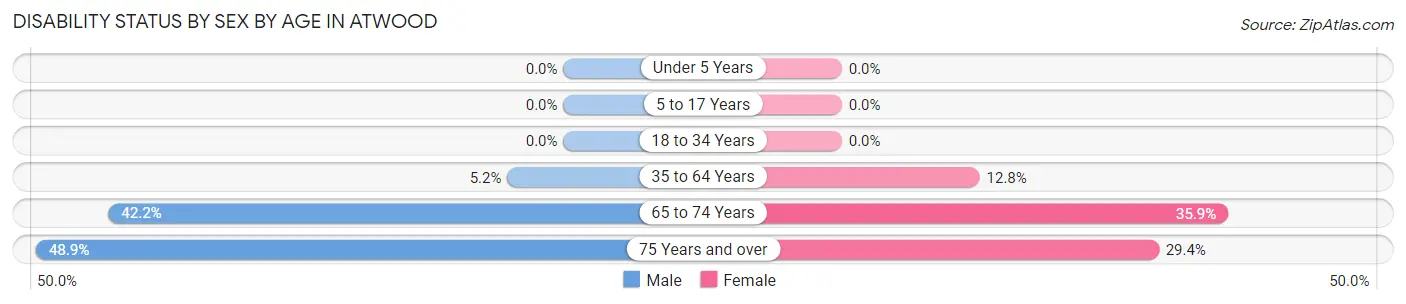
| Age Bracket | Male | Female |
| Under 5 Years | 0 (0.0%) | 0 (0.0%) |
| 5 to 17 Years | 0 (0.0%) | 0 (0.0%) |
| 18 to 34 Years | 0 (0.0%) | 0 (0.0%) |
| 35 to 64 Years | 9 (5.2%) | 33 (12.8%) |
| 65 to 74 Years | 19 (42.2%) | 19 (35.8%) |
| 75 Years and over | 23 (48.9%) | 15 (29.4%) |
Disability Class by Sex by Age in Atwood
Disability Class: Hearing Difficulty
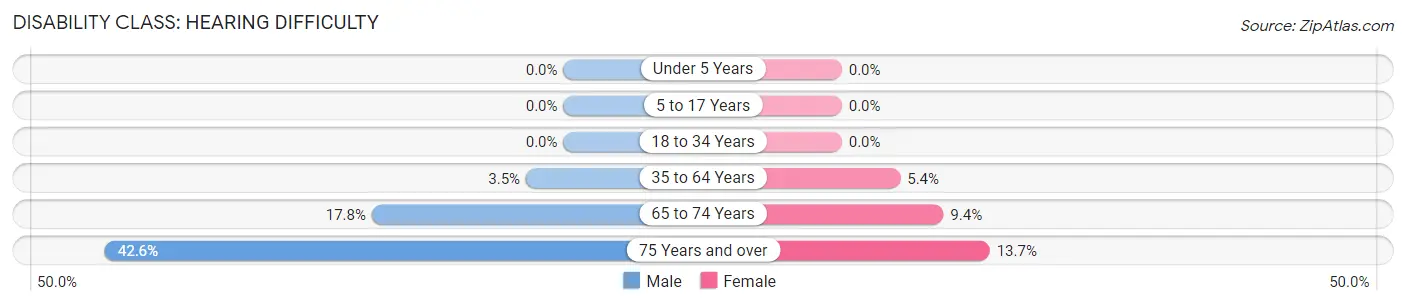
| Age Bracket | Male | Female |
| Under 5 Years | 0 (0.0%) | 0 (0.0%) |
| 5 to 17 Years | 0 (0.0%) | 0 (0.0%) |
| 18 to 34 Years | 0 (0.0%) | 0 (0.0%) |
| 35 to 64 Years | 6 (3.5%) | 14 (5.4%) |
| 65 to 74 Years | 8 (17.8%) | 5 (9.4%) |
| 75 Years and over | 20 (42.5%) | 7 (13.7%) |
Disability Class: Vision Difficulty
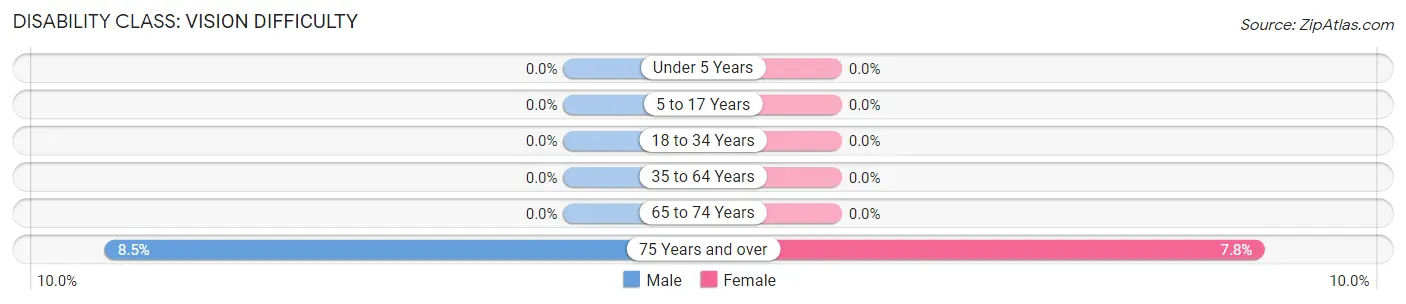
| Age Bracket | Male | Female |
| Under 5 Years | 0 (0.0%) | 0 (0.0%) |
| 5 to 17 Years | 0 (0.0%) | 0 (0.0%) |
| 18 to 34 Years | 0 (0.0%) | 0 (0.0%) |
| 35 to 64 Years | 0 (0.0%) | 0 (0.0%) |
| 65 to 74 Years | 0 (0.0%) | 0 (0.0%) |
| 75 Years and over | 4 (8.5%) | 4 (7.8%) |
Disability Class: Cognitive Difficulty
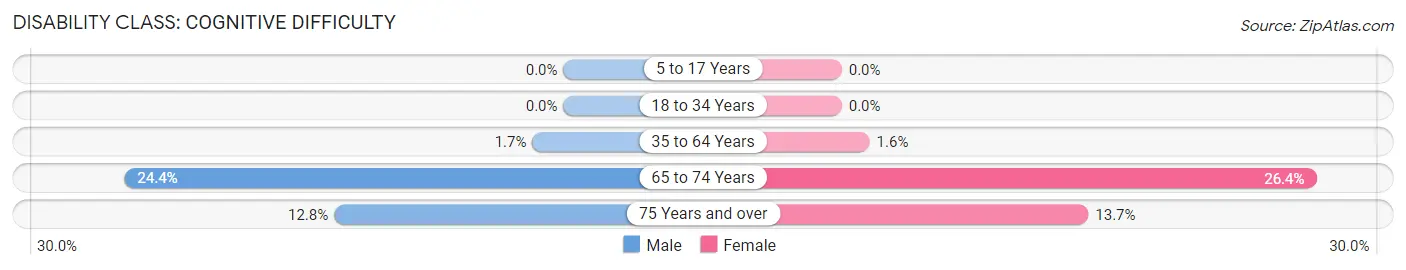
| Age Bracket | Male | Female |
| 5 to 17 Years | 0 (0.0%) | 0 (0.0%) |
| 18 to 34 Years | 0 (0.0%) | 0 (0.0%) |
| 35 to 64 Years | 3 (1.7%) | 4 (1.5%) |
| 65 to 74 Years | 11 (24.4%) | 14 (26.4%) |
| 75 Years and over | 6 (12.8%) | 7 (13.7%) |
Disability Class: Ambulatory Difficulty
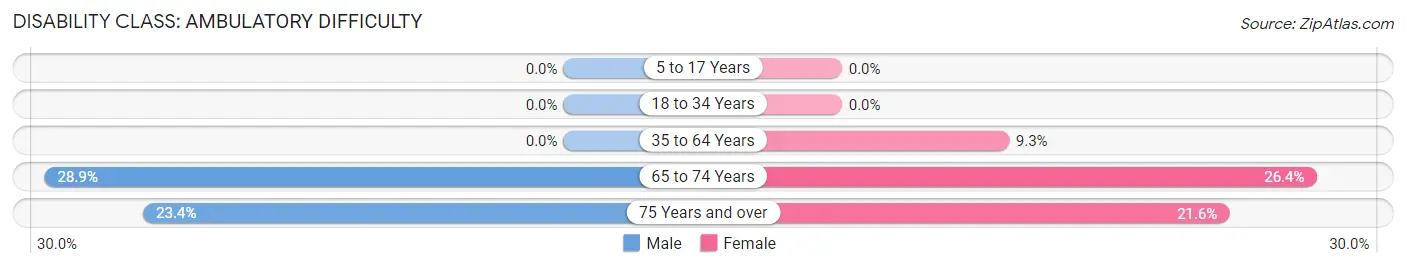
| Age Bracket | Male | Female |
| 5 to 17 Years | 0 (0.0%) | 0 (0.0%) |
| 18 to 34 Years | 0 (0.0%) | 0 (0.0%) |
| 35 to 64 Years | 0 (0.0%) | 24 (9.3%) |
| 65 to 74 Years | 13 (28.9%) | 14 (26.4%) |
| 75 Years and over | 11 (23.4%) | 11 (21.6%) |
Disability Class: Self-Care Difficulty
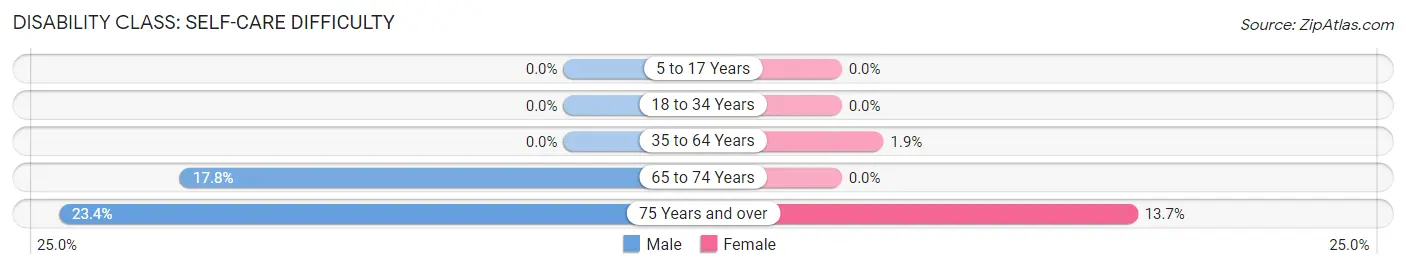
| Age Bracket | Male | Female |
| 5 to 17 Years | 0 (0.0%) | 0 (0.0%) |
| 18 to 34 Years | 0 (0.0%) | 0 (0.0%) |
| 35 to 64 Years | 0 (0.0%) | 5 (1.9%) |
| 65 to 74 Years | 8 (17.8%) | 0 (0.0%) |
| 75 Years and over | 11 (23.4%) | 7 (13.7%) |
Technology Access in Atwood
Computing Device Access in Atwood
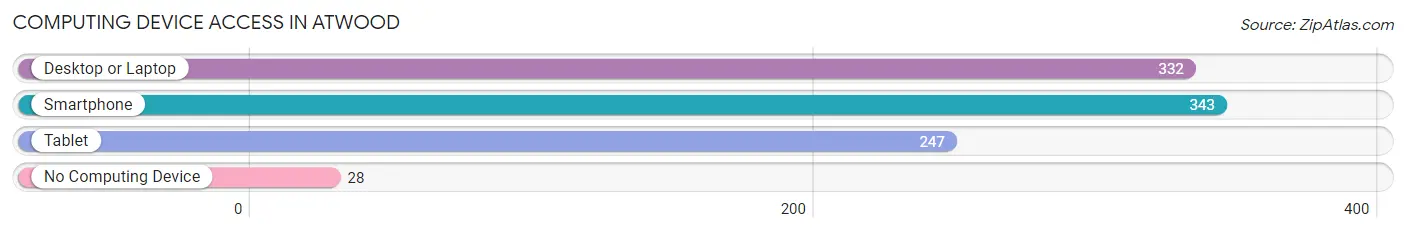
| Device Type | # Households | % Households |
| Desktop or Laptop | 332 | 77.6% |
| Smartphone | 343 | 80.1% |
| Tablet | 247 | 57.7% |
| No Computing Device | 28 | 6.5% |
| Total | 428 | 100.0% |
Internet Access in Atwood
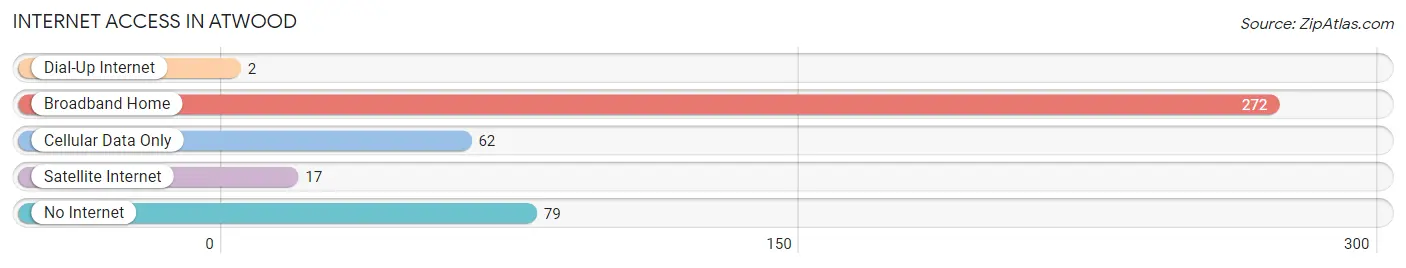
| Internet Type | # Households | % Households |
| Dial-Up Internet | 2 | 0.5% |
| Broadband Home | 272 | 63.5% |
| Cellular Data Only | 62 | 14.5% |
| Satellite Internet | 17 | 4.0% |
| No Internet | 79 | 18.5% |
| Total | 428 | 100.0% |
Atwood Summary
Atwood is a small village located in Douglas County, Illinois. It is situated in the east-central part of the state, about 25 miles south of Champaign and about 30 miles north of Decatur. The village has a population of approximately 1,000 people and covers an area of 0.6 square miles.
Atwood was founded in 1854 by a group of settlers from Ohio. The village was named after one of the settlers, William Atwood. The first post office was established in 1856 and the village was incorporated in 1872.
Atwood is located in the heart of the Illinois prairie. The terrain is mostly flat, with some rolling hills in the area. The climate is humid continental, with hot summers and cold winters. The average annual temperature is around 50 degrees Fahrenheit.
The economy of Atwood is largely based on agriculture. The village is home to several farms, which produce corn, soybeans, wheat, and other crops. There are also several businesses in the village, including a grocery store, a hardware store, and a few restaurants.
Atwood is served by the Atwood-Hammond Community Unit School District. The district consists of two elementary schools, one middle school, and one high school. The village also has a public library and a few churches.
Atwood has a diverse population. According to the 2010 census, the village had a population of 1,000 people, with a median age of 37.7 years. The racial makeup of the village was 97.2% White, 0.7% African American, 0.3% Native American, 0.2% Asian, 0.1% Pacific Islander, and 1.5% from other races. The median household income was $45,000, and the median family income was $50,000.
Atwood is a small village with a rich history and a diverse population. It is a great place to live and work, and offers a variety of activities and amenities for its residents. The village is a great place to raise a family, and offers a safe and friendly environment.
Common Questions
What is Per Capita Income in Atwood?
Per Capita income in Atwood is $31,535.
What is the Median Family Income in Atwood?
Median Family Income in Atwood is $63,295.
What is the Median Household income in Atwood?
Median Household Income in Atwood is $56,563.
What is Income or Wage Gap in Atwood?
Income or Wage Gap in Atwood is 33.3%.
Women in Atwood earn 66.7 cents for every dollar earned by a man.
What is Inequality or Gini Index in Atwood?
Inequality or Gini Index in Atwood is 0.46.
What is the Total Population of Atwood?
Total Population of Atwood is 979.
What is the Total Male Population of Atwood?
Total Male Population of Atwood is 394.
What is the Total Female Population of Atwood?
Total Female Population of Atwood is 585.
What is the Ratio of Males per 100 Females in Atwood?
There are 67.35 Males per 100 Females in Atwood.
What is the Ratio of Females per 100 Males in Atwood?
There are 148.48 Females per 100 Males in Atwood.
What is the Median Population Age in Atwood?
Median Population Age in Atwood is 41.3 Years.
What is the Average Family Size in Atwood
Average Family Size in Atwood is 2.8 People.
What is the Average Household Size in Atwood
Average Household Size in Atwood is 2.3 People.
How Large is the Labor Force in Atwood?
There are 419 People in the Labor Forcein in Atwood.
What is the Percentage of People in the Labor Force in Atwood?
53.4% of People are in the Labor Force in Atwood.
What is the Unemployment Rate in Atwood?
Unemployment Rate in Atwood is 2.4%.