New Athens, IL Map & Demographics
New Athens Map
New Athens Overview
$32,603
PER CAPITA INCOME
$80,184
AVG FAMILY INCOME
$62,639
AVG HOUSEHOLD INCOME
48.3%
WAGE / INCOME GAP [ % ]
51.7¢/ $1
WAGE / INCOME GAP [ $ ]
0.39
INEQUALITY / GINI INDEX
1,951
TOTAL POPULATION
926
MALE POPULATION
1,025
FEMALE POPULATION
90.34
MALES / 100 FEMALES
110.69
FEMALES / 100 MALES
41.6
MEDIAN AGE
2.9
AVG FAMILY SIZE
2.4
AVG HOUSEHOLD SIZE
958
LABOR FORCE [ PEOPLE ]
61.0%
PERCENT IN LABOR FORCE
5.2%
UNEMPLOYMENT RATE
New Athens Zip Codes
New Athens Area Codes
Income in New Athens
Income Overview in New Athens
Per Capita Income in New Athens is $32,603, while median incomes of families and households are $80,184 and $62,639 respectively.
| Characteristic | Number | Measure |
| Per Capita Income | 1,951 | $32,603 |
| Median Family Income | 559 | $80,184 |
| Mean Family Income | 559 | $93,224 |
| Median Household Income | 793 | $62,639 |
| Mean Household Income | 793 | $80,219 |
| Income Deficit | 559 | $0 |
| Wage / Income Gap (%) | 1,951 | 48.35% |
| Wage / Income Gap ($) | 1,951 | 51.65¢ per $1 |
| Gini / Inequality Index | 1,951 | 0.39 |
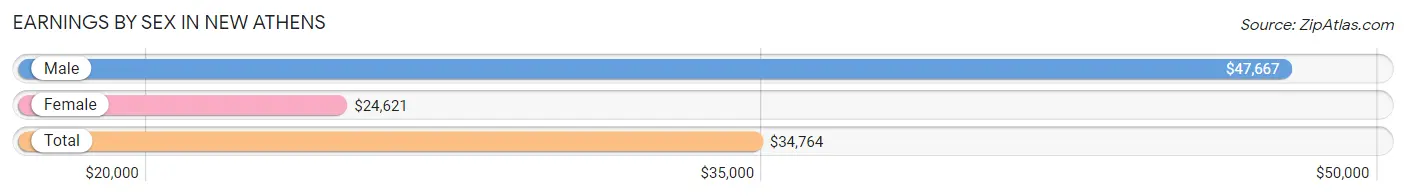
Earnings by Sex in New Athens
Average Earnings in New Athens are $34,764, $47,667 for men and $24,621 for women, a difference of 48.3%.
| Sex | Number | Average Earnings |
| Male | 560 (52.4%) | $47,667 |
| Female | 508 (47.6%) | $24,621 |
| Total | 1,068 (100.0%) | $34,764 |
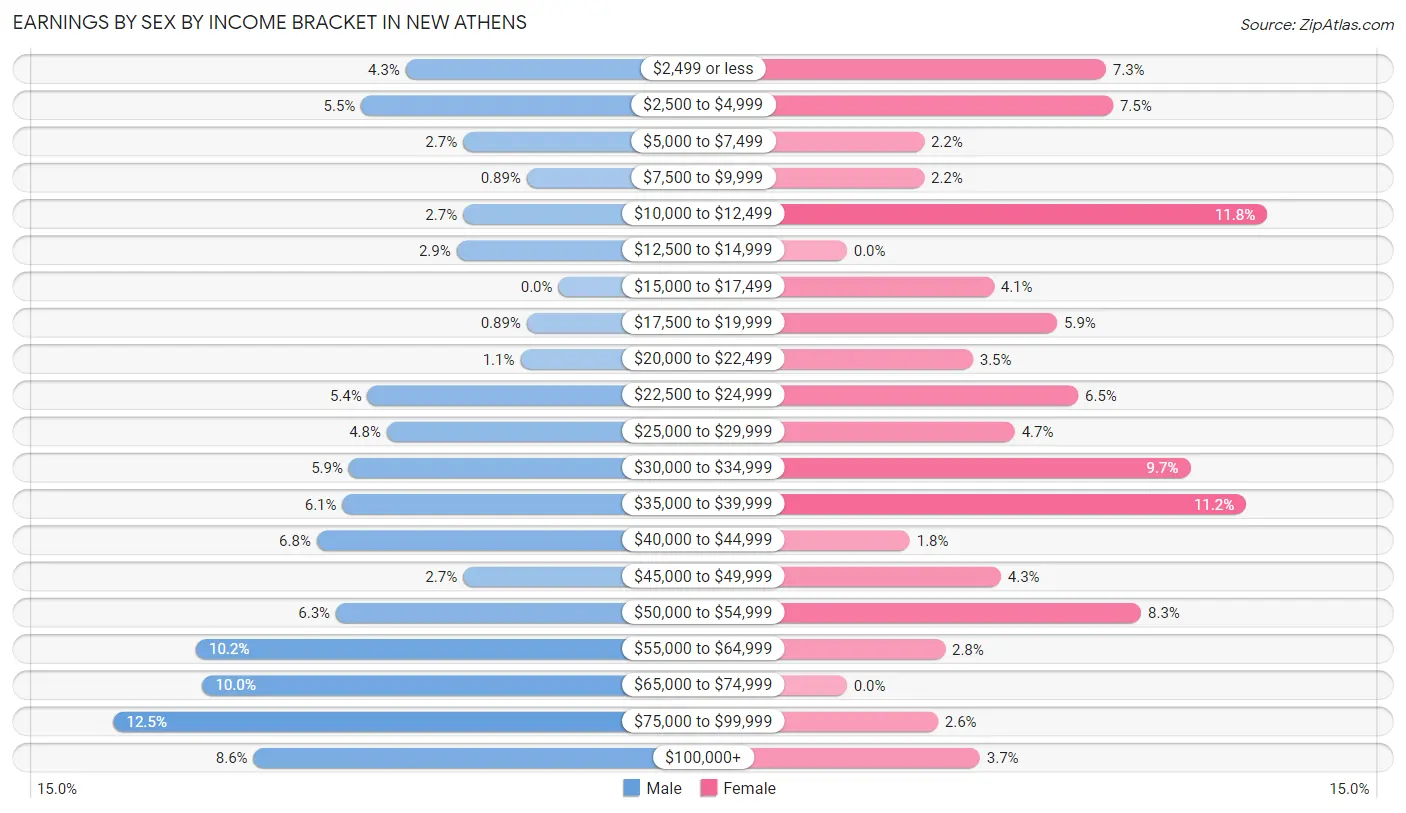
Earnings by Sex by Income Bracket in New Athens
The most common earnings brackets in New Athens are $75,000 to $99,999 for men (70 | 12.5%) and $10,000 to $12,499 for women (60 | 11.8%).
| Income | Male | Female |
| $2,499 or less | 24 (4.3%) | 37 (7.3%) |
| $2,500 to $4,999 | 31 (5.5%) | 38 (7.5%) |
| $5,000 to $7,499 | 15 (2.7%) | 11 (2.2%) |
| $7,500 to $9,999 | 5 (0.9%) | 11 (2.2%) |
| $10,000 to $12,499 | 15 (2.7%) | 60 (11.8%) |
| $12,500 to $14,999 | 16 (2.9%) | 0 (0.0%) |
| $15,000 to $17,499 | 0 (0.0%) | 21 (4.1%) |
| $17,500 to $19,999 | 5 (0.9%) | 30 (5.9%) |
| $20,000 to $22,499 | 6 (1.1%) | 18 (3.5%) |
| $22,500 to $24,999 | 30 (5.4%) | 33 (6.5%) |
| $25,000 to $29,999 | 27 (4.8%) | 24 (4.7%) |
| $30,000 to $34,999 | 33 (5.9%) | 49 (9.7%) |
| $35,000 to $39,999 | 34 (6.1%) | 57 (11.2%) |
| $40,000 to $44,999 | 38 (6.8%) | 9 (1.8%) |
| $45,000 to $49,999 | 15 (2.7%) | 22 (4.3%) |
| $50,000 to $54,999 | 35 (6.2%) | 42 (8.3%) |
| $55,000 to $64,999 | 57 (10.2%) | 14 (2.8%) |
| $65,000 to $74,999 | 56 (10.0%) | 0 (0.0%) |
| $75,000 to $99,999 | 70 (12.5%) | 13 (2.6%) |
| $100,000+ | 48 (8.6%) | 19 (3.7%) |
| Total | 560 (100.0%) | 508 (100.0%) |
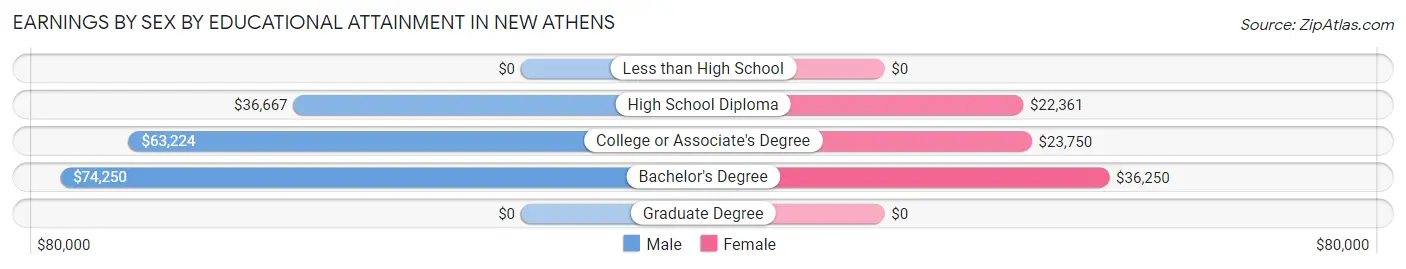
Earnings by Sex by Educational Attainment in New Athens
Average earnings in New Athens are $52,260 for men and $27,500 for women, a difference of 47.4%. Men with an educational attainment of bachelor's degree enjoy the highest average annual earnings of $74,250, while those with high school diploma education earn the least with $36,667. Women with an educational attainment of bachelor's degree earn the most with the average annual earnings of $36,250, while those with high school diploma education have the smallest earnings of $22,361.
| Educational Attainment | Male Income | Female Income |
| Less than High School | - | - |
| High School Diploma | $36,667 | $22,361 |
| College or Associate's Degree | $63,224 | $23,750 |
| Bachelor's Degree | $74,250 | $36,250 |
| Graduate Degree | - | - |
| Total | $52,260 | $27,500 |
Family Income in New Athens
Family Income Brackets in New Athens
According to the New Athens family income data, there are 103 families falling into the $100,000 to $149,999 income range, which is the most common income bracket and makes up 18.4% of all families.
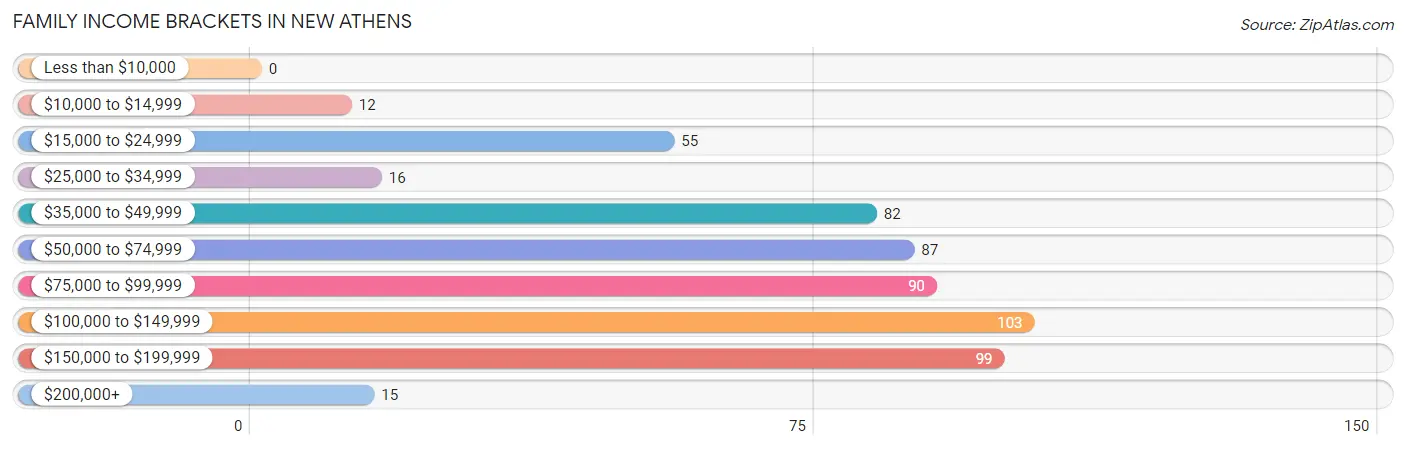
| Income Bracket | # Families | % Families |
| Less than $10,000 | 0 | 0.0% |
| $10,000 to $14,999 | 12 | 2.1% |
| $15,000 to $24,999 | 55 | 9.8% |
| $25,000 to $34,999 | 16 | 2.9% |
| $35,000 to $49,999 | 82 | 14.7% |
| $50,000 to $74,999 | 87 | 15.6% |
| $75,000 to $99,999 | 90 | 16.1% |
| $100,000 to $149,999 | 103 | 18.4% |
| $150,000 to $199,999 | 99 | 17.7% |
| $200,000+ | 15 | 2.7% |
Family Income by Famaliy Size in New Athens
5-person families (39 | 7.0%) account for the highest median family income in New Athens with $124,063 per family, while 3-person families (104 | 18.6%) have the highest median income of $36,333 per family member.
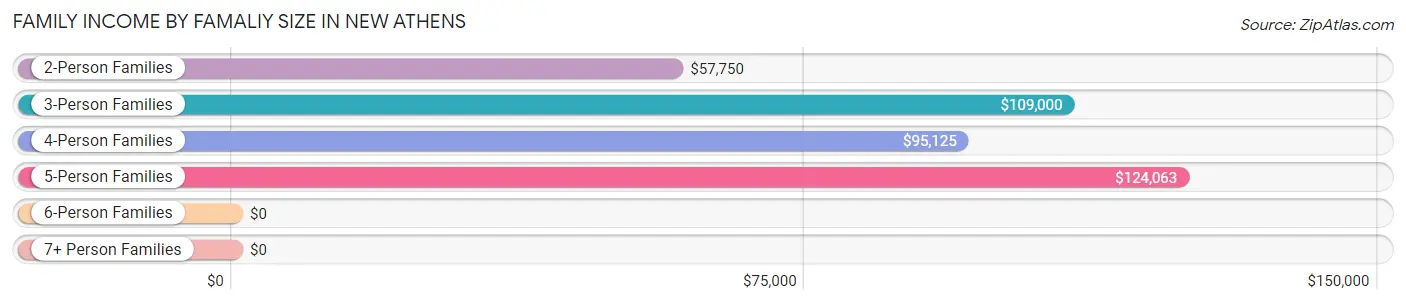
| Income Bracket | # Families | Median Income |
| 2-Person Families | 324 (58.0%) | $57,750 |
| 3-Person Families | 104 (18.6%) | $109,000 |
| 4-Person Families | 63 (11.3%) | $95,125 |
| 5-Person Families | 39 (7.0%) | $124,063 |
| 6-Person Families | 10 (1.8%) | $0 |
| 7+ Person Families | 19 (3.4%) | $0 |
| Total | 559 (100.0%) | $80,184 |
Family Income by Number of Earners in New Athens
The median family income in New Athens is $80,184, with families comprising 3+ earners (60) having the highest median family income of $106,071, while families with 1 earner (121) have the lowest median family income of $42,750, accounting for 10.7% and 21.6% of families, respectively.
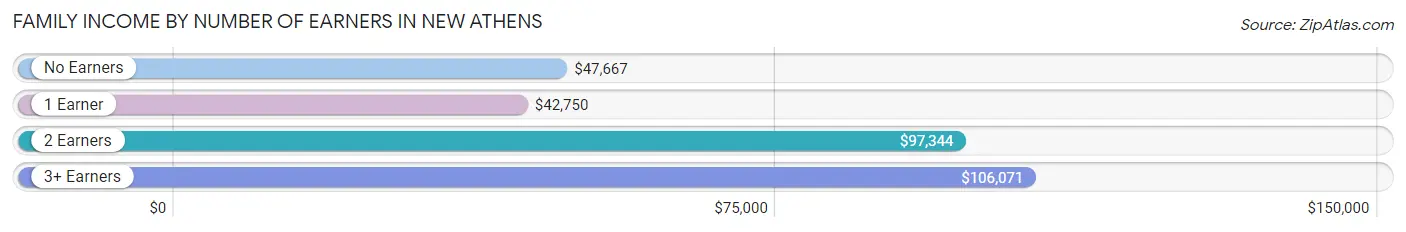
| Number of Earners | # Families | Median Income |
| No Earners | 104 (18.6%) | $47,667 |
| 1 Earner | 121 (21.6%) | $42,750 |
| 2 Earners | 274 (49.0%) | $97,344 |
| 3+ Earners | 60 (10.7%) | $106,071 |
| Total | 559 (100.0%) | $80,184 |
Household Income in New Athens
Household Income Brackets in New Athens
With 140 households falling in the category, the $35,000 to $49,999 income range is the most frequent in New Athens, accounting for 17.6% of all households. In contrast, only 15 households (1.9%) fall into the $200,000+ income bracket, making it the least populous group.
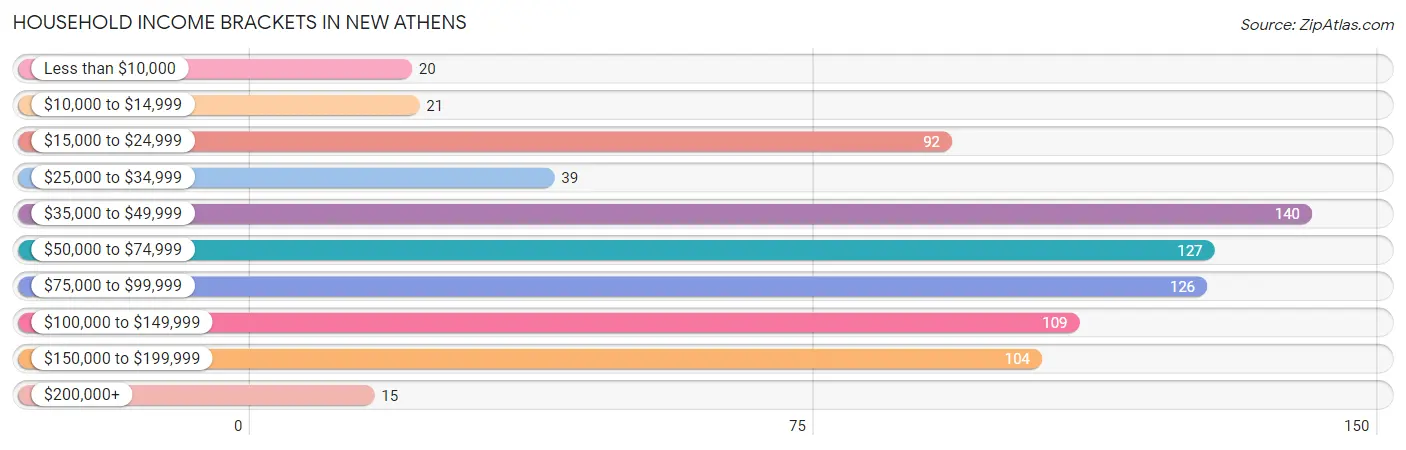
| Income Bracket | # Households | % Households |
| Less than $10,000 | 20 | 2.5% |
| $10,000 to $14,999 | 21 | 2.6% |
| $15,000 to $24,999 | 92 | 11.6% |
| $25,000 to $34,999 | 39 | 4.9% |
| $35,000 to $49,999 | 140 | 17.7% |
| $50,000 to $74,999 | 127 | 16.0% |
| $75,000 to $99,999 | 126 | 15.9% |
| $100,000 to $149,999 | 109 | 13.7% |
| $150,000 to $199,999 | 104 | 13.1% |
| $200,000+ | 15 | 1.9% |
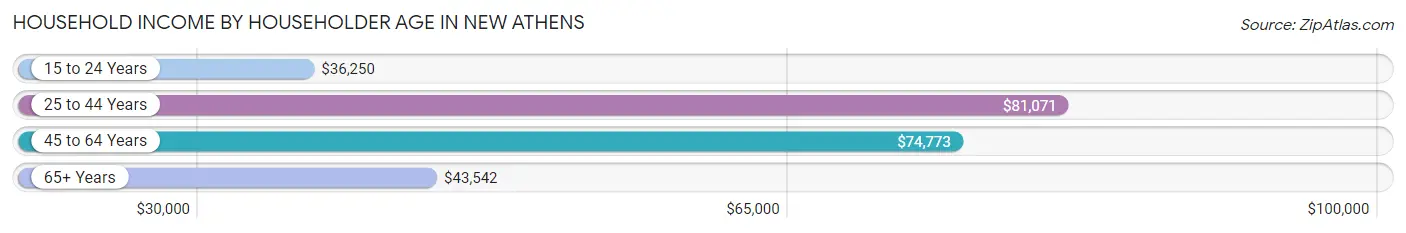
Household Income by Householder Age in New Athens
The median household income in New Athens is $62,639, with the highest median household income of $81,071 found in the 25 to 44 years age bracket for the primary householder. A total of 274 households (34.5%) fall into this category. Meanwhile, the 15 to 24 years age bracket for the primary householder has the lowest median household income of $36,250, with 24 households (3.0%) in this group.
| Income Bracket | # Households | Median Income |
| 15 to 24 Years | 24 (3.0%) | $36,250 |
| 25 to 44 Years | 274 (34.5%) | $81,071 |
| 45 to 64 Years | 248 (31.3%) | $74,773 |
| 65+ Years | 247 (31.1%) | $43,542 |
| Total | 793 (100.0%) | $62,639 |
Poverty in New Athens
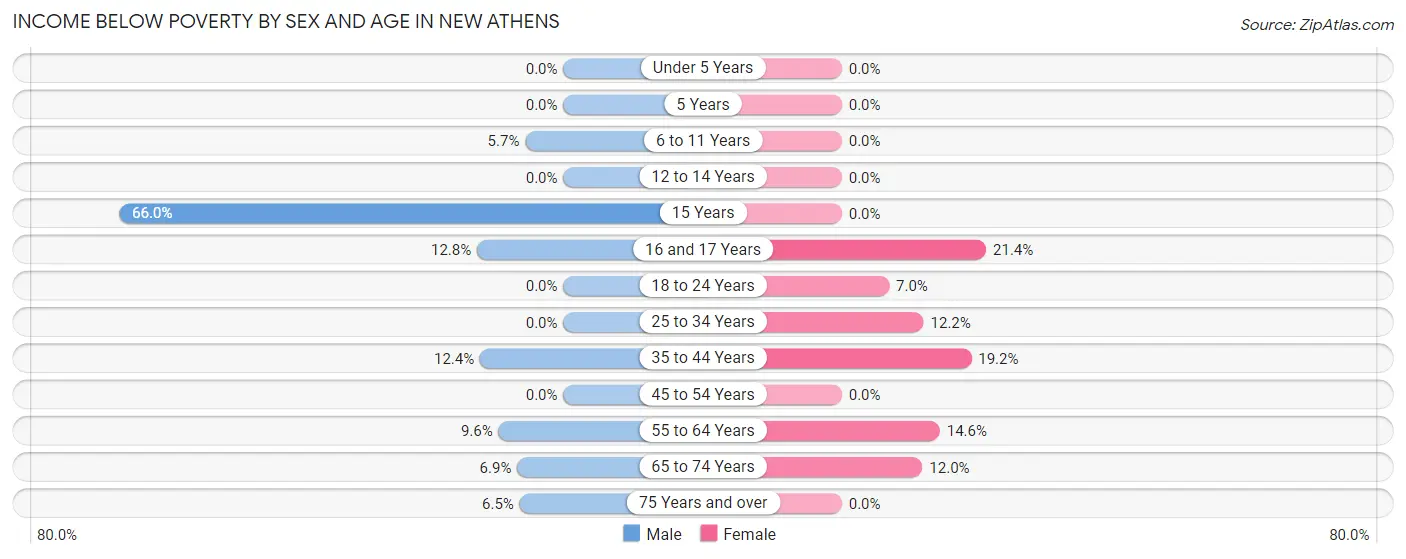
Income Below Poverty by Sex and Age in New Athens
With 9.1% poverty level for males and 9.1% for females among the residents of New Athens, 15 year old males and 16 and 17 year old females are the most vulnerable to poverty, with 31 males (66.0%) and 6 females (21.4%) in their respective age groups living below the poverty level.
| Age Bracket | Male | Female |
| Under 5 Years | 0 (0.0%) | 0 (0.0%) |
| 5 Years | 0 (0.0%) | 0 (0.0%) |
| 6 to 11 Years | 3 (5.7%) | 0 (0.0%) |
| 12 to 14 Years | 0 (0.0%) | 0 (0.0%) |
| 15 Years | 31 (66.0%) | 0 (0.0%) |
| 16 and 17 Years | 5 (12.8%) | 6 (21.4%) |
| 18 to 24 Years | 0 (0.0%) | 4 (7.0%) |
| 25 to 34 Years | 0 (0.0%) | 13 (12.1%) |
| 35 to 44 Years | 23 (12.4%) | 30 (19.2%) |
| 45 to 54 Years | 0 (0.0%) | 0 (0.0%) |
| 55 to 64 Years | 10 (9.6%) | 24 (14.5%) |
| 65 to 74 Years | 5 (6.9%) | 14 (12.0%) |
| 75 Years and over | 5 (6.5%) | 0 (0.0%) |
| Total | 82 (9.1%) | 91 (9.1%) |
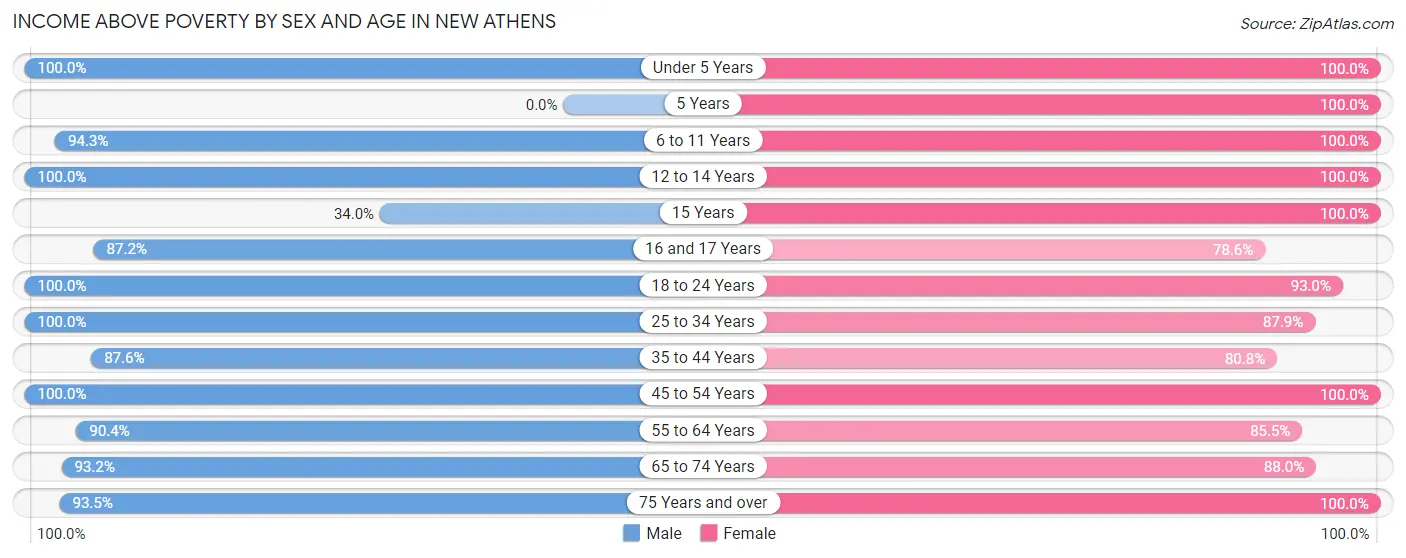
Income Above Poverty by Sex and Age in New Athens
According to the poverty statistics in New Athens, males aged under 5 years and females aged under 5 years are the age groups that are most secure financially, with 100.0% of males and 100.0% of females in these age groups living above the poverty line.
| Age Bracket | Male | Female |
| Under 5 Years | 71 (100.0%) | 40 (100.0%) |
| 5 Years | 0 (0.0%) | 22 (100.0%) |
| 6 to 11 Years | 50 (94.3%) | 85 (100.0%) |
| 12 to 14 Years | 13 (100.0%) | 28 (100.0%) |
| 15 Years | 16 (34.0%) | 17 (100.0%) |
| 16 and 17 Years | 34 (87.2%) | 22 (78.6%) |
| 18 to 24 Years | 67 (100.0%) | 53 (93.0%) |
| 25 to 34 Years | 63 (100.0%) | 94 (87.8%) |
| 35 to 44 Years | 163 (87.6%) | 126 (80.8%) |
| 45 to 54 Years | 112 (100.0%) | 65 (100.0%) |
| 55 to 64 Years | 94 (90.4%) | 141 (85.5%) |
| 65 to 74 Years | 68 (93.1%) | 103 (88.0%) |
| 75 Years and over | 72 (93.5%) | 112 (100.0%) |
| Total | 823 (90.9%) | 908 (90.9%) |
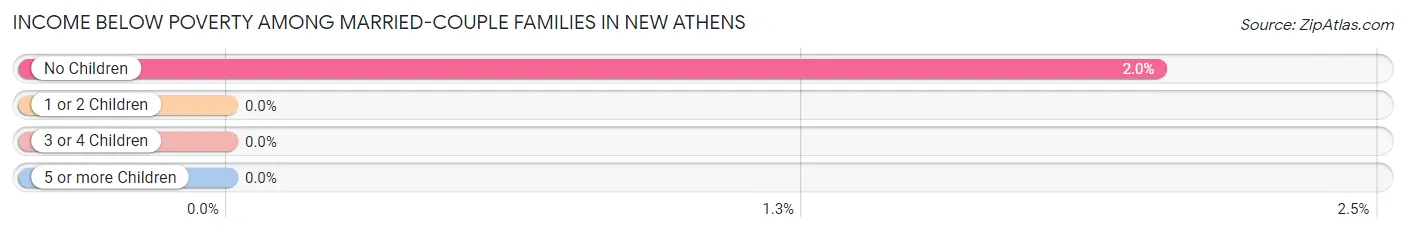
Income Below Poverty Among Married-Couple Families in New Athens
The poverty statistics for married-couple families in New Athens show that 1.1% or 5 of the total 436 families live below the poverty line. Families with no children have the highest poverty rate of 2.0%, comprising of 5 families. On the other hand, families with 1 or 2 children have the lowest poverty rate of 0.0%, which includes 0 families.
| Children | Above Poverty | Below Poverty |
| No Children | 243 (98.0%) | 5 (2.0%) |
| 1 or 2 Children | 150 (100.0%) | 0 (0.0%) |
| 3 or 4 Children | 19 (100.0%) | 0 (0.0%) |
| 5 or more Children | 19 (100.0%) | 0 (0.0%) |
| Total | 431 (98.9%) | 5 (1.1%) |
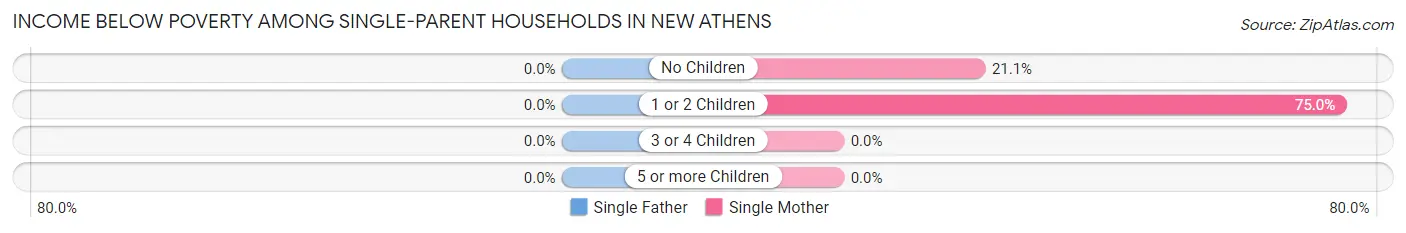
Income Below Poverty Among Single-Parent Households in New Athens
| Children | Single Father | Single Mother |
| No Children | 0 (0.0%) | 12 (21.0%) |
| 1 or 2 Children | 0 (0.0%) | 30 (75.0%) |
| 3 or 4 Children | 0 (0.0%) | 0 (0.0%) |
| 5 or more Children | 0 (0.0%) | 0 (0.0%) |
| Total | 0 (0.0%) | 42 (41.6%) |
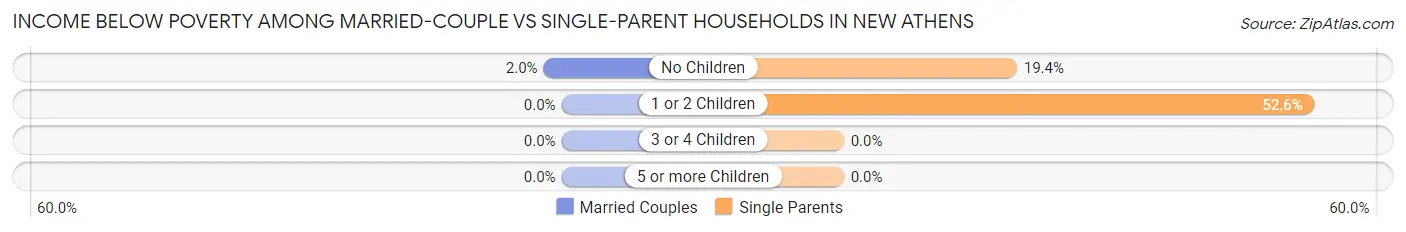
Income Below Poverty Among Married-Couple vs Single-Parent Households in New Athens
The poverty data for New Athens shows that 5 of the married-couple family households (1.1%) and 42 of the single-parent households (34.2%) are living below the poverty level. Within the married-couple family households, those with no children have the highest poverty rate, with 5 households (2.0%) falling below the poverty line. Among the single-parent households, those with 1 or 2 children have the highest poverty rate, with 30 household (52.6%) living below poverty.
| Children | Married-Couple Families | Single-Parent Households |
| No Children | 5 (2.0%) | 12 (19.4%) |
| 1 or 2 Children | 0 (0.0%) | 30 (52.6%) |
| 3 or 4 Children | 0 (0.0%) | 0 (0.0%) |
| 5 or more Children | 0 (0.0%) | 0 (0.0%) |
| Total | 5 (1.1%) | 42 (34.2%) |
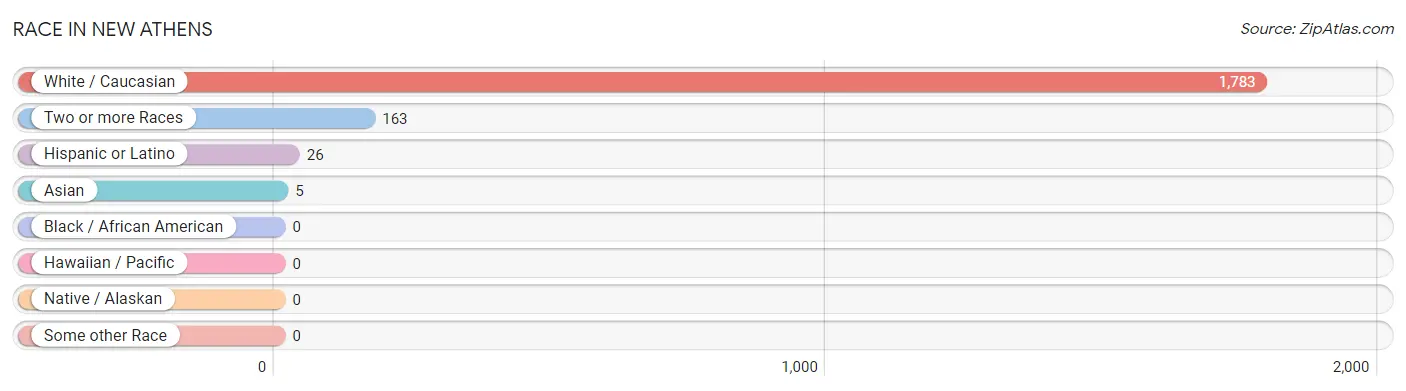
Race in New Athens
The most populous races in New Athens are White / Caucasian (1,783 | 91.4%), Two or more Races (163 | 8.4%), and Hispanic or Latino (26 | 1.3%).
| Race | # Population | % Population |
| Asian | 5 | 0.3% |
| Black / African American | 0 | 0.0% |
| Hawaiian / Pacific | 0 | 0.0% |
| Hispanic or Latino | 26 | 1.3% |
| Native / Alaskan | 0 | 0.0% |
| White / Caucasian | 1,783 | 91.4% |
| Two or more Races | 163 | 8.4% |
| Some other Race | 0 | 0.0% |
| Total | 1,951 | 100.0% |
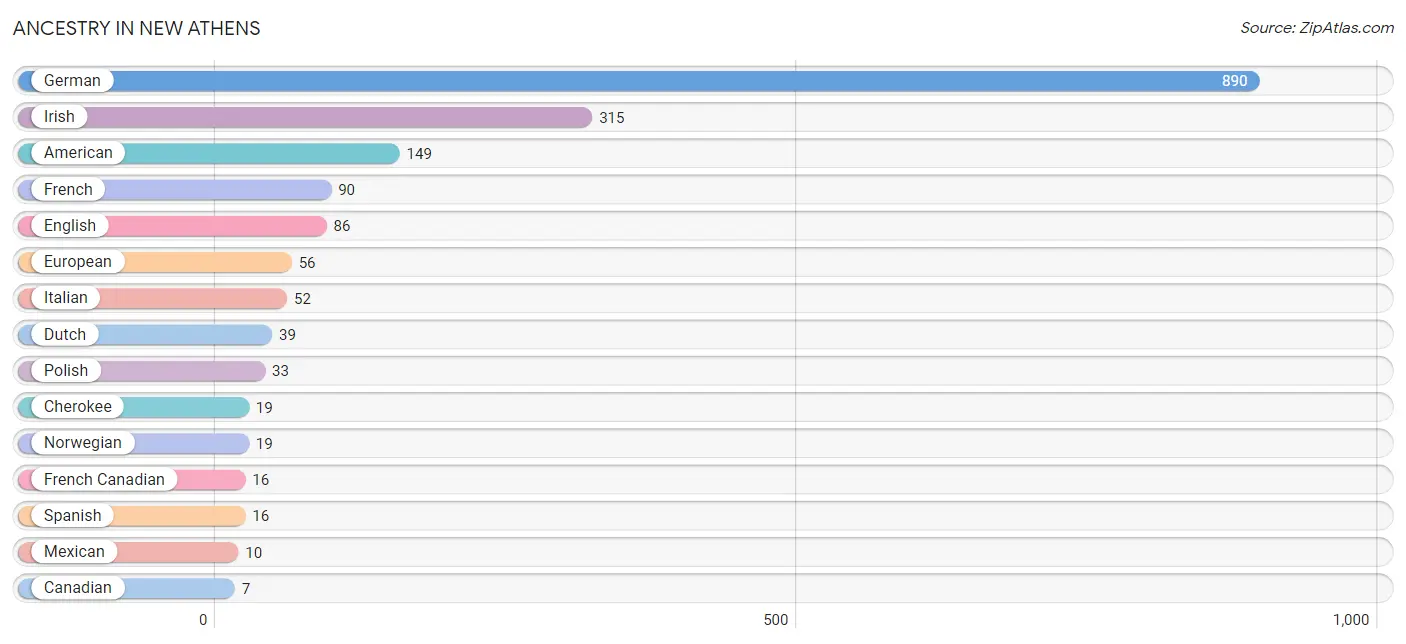
Ancestry in New Athens
The most populous ancestries reported in New Athens are German (890 | 45.6%), Irish (315 | 16.2%), American (149 | 7.6%), French (90 | 4.6%), and English (86 | 4.4%), together accounting for 78.4% of all New Athens residents.
| Ancestry | # Population | % Population |
| American | 149 | 7.6% |
| Armenian | 4 | 0.2% |
| Canadian | 7 | 0.4% |
| Cherokee | 19 | 1.0% |
| Dutch | 39 | 2.0% |
| Eastern European | 4 | 0.2% |
| English | 86 | 4.4% |
| European | 56 | 2.9% |
| French | 90 | 4.6% |
| French Canadian | 16 | 0.8% |
| German | 890 | 45.6% |
| Hungarian | 6 | 0.3% |
| Irish | 315 | 16.2% |
| Italian | 52 | 2.7% |
| Korean | 4 | 0.2% |
| Mexican | 10 | 0.5% |
| Norwegian | 19 | 1.0% |
| Polish | 33 | 1.7% |
| Spanish | 16 | 0.8% |
| Sri Lankan | 5 | 0.3% |
| Swedish | 7 | 0.4% |
| Welsh | 5 | 0.3% |
| Yugoslavian | 5 | 0.3% | View All 23 Rows |
Immigrants in New Athens

| Immigration Origin | # Population | % Population | View All 0 Rows |
Sex and Age in New Athens
Sex and Age in New Athens
The most populous age groups in New Athens are 35 to 39 Years (110 | 11.9%) for men and 55 to 59 Years (83 | 8.1%) for women.
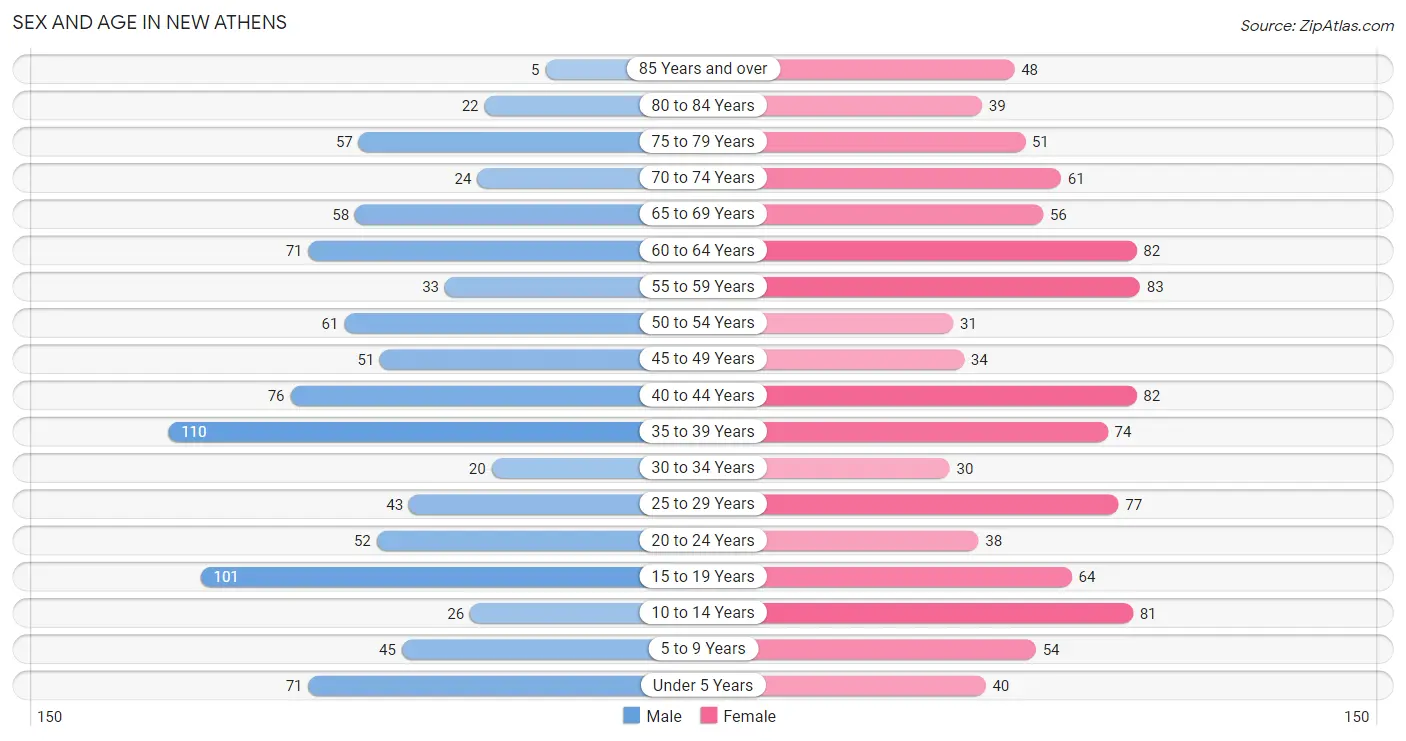
| Age Bracket | Male | Female |
| Under 5 Years | 71 (7.7%) | 40 (3.9%) |
| 5 to 9 Years | 45 (4.9%) | 54 (5.3%) |
| 10 to 14 Years | 26 (2.8%) | 81 (7.9%) |
| 15 to 19 Years | 101 (10.9%) | 64 (6.2%) |
| 20 to 24 Years | 52 (5.6%) | 38 (3.7%) |
| 25 to 29 Years | 43 (4.6%) | 77 (7.5%) |
| 30 to 34 Years | 20 (2.2%) | 30 (2.9%) |
| 35 to 39 Years | 110 (11.9%) | 74 (7.2%) |
| 40 to 44 Years | 76 (8.2%) | 82 (8.0%) |
| 45 to 49 Years | 51 (5.5%) | 34 (3.3%) |
| 50 to 54 Years | 61 (6.6%) | 31 (3.0%) |
| 55 to 59 Years | 33 (3.6%) | 83 (8.1%) |
| 60 to 64 Years | 71 (7.7%) | 82 (8.0%) |
| 65 to 69 Years | 58 (6.3%) | 56 (5.5%) |
| 70 to 74 Years | 24 (2.6%) | 61 (5.9%) |
| 75 to 79 Years | 57 (6.2%) | 51 (5.0%) |
| 80 to 84 Years | 22 (2.4%) | 39 (3.8%) |
| 85 Years and over | 5 (0.5%) | 48 (4.7%) |
| Total | 926 (100.0%) | 1,025 (100.0%) |
Families and Households in New Athens
Median Family Size in New Athens
The median family size in New Athens is 2.85 persons per family, with married-couple families (436 | 78.0%) accounting for the largest median family size of 2.97 persons per family. On the other hand, single male/father families (22 | 3.9%) represent the smallest median family size with 2.32 persons per family.
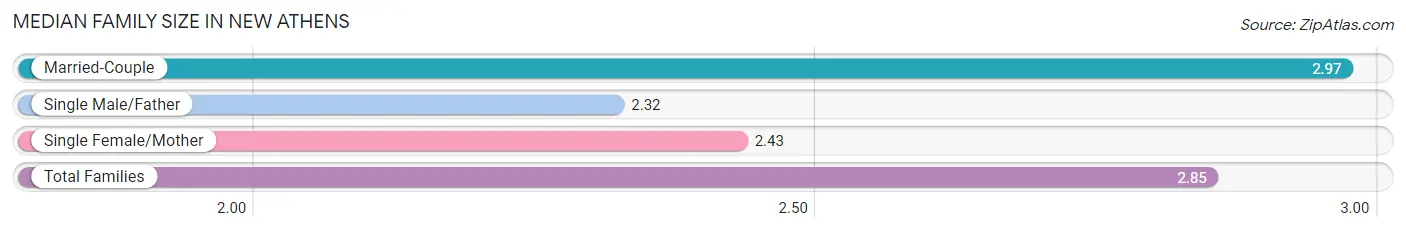
| Family Type | # Families | Family Size |
| Married-Couple | 436 (78.0%) | 2.97 |
| Single Male/Father | 22 (3.9%) | 2.32 |
| Single Female/Mother | 101 (18.1%) | 2.43 |
| Total Families | 559 (100.0%) | 2.85 |
Median Household Size in New Athens
The median household size in New Athens is 2.41 persons per household, with single male/father households (22 | 2.8%) accounting for the largest median household size of 3.36 persons per household. non-family households (234 | 29.5%) represent the smallest median household size with 1.14 persons per household.
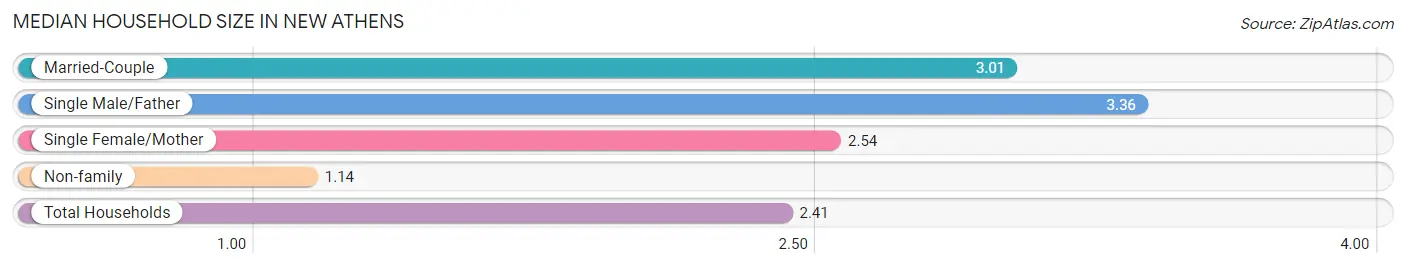
| Household Type | # Households | Household Size |
| Married-Couple | 436 (55.0%) | 3.01 |
| Single Male/Father | 22 (2.8%) | 3.36 |
| Single Female/Mother | 101 (12.7%) | 2.54 |
| Non-family | 234 (29.5%) | 1.14 |
| Total Households | 793 (100.0%) | 2.41 |
Household Size by Marriage Status in New Athens
Out of a total of 793 households in New Athens, 559 (70.5%) are family households, while 234 (29.5%) are nonfamily households. The most numerous type of family households are 2-person households, comprising 302, and the most common type of nonfamily households are 1-person households, comprising 203.
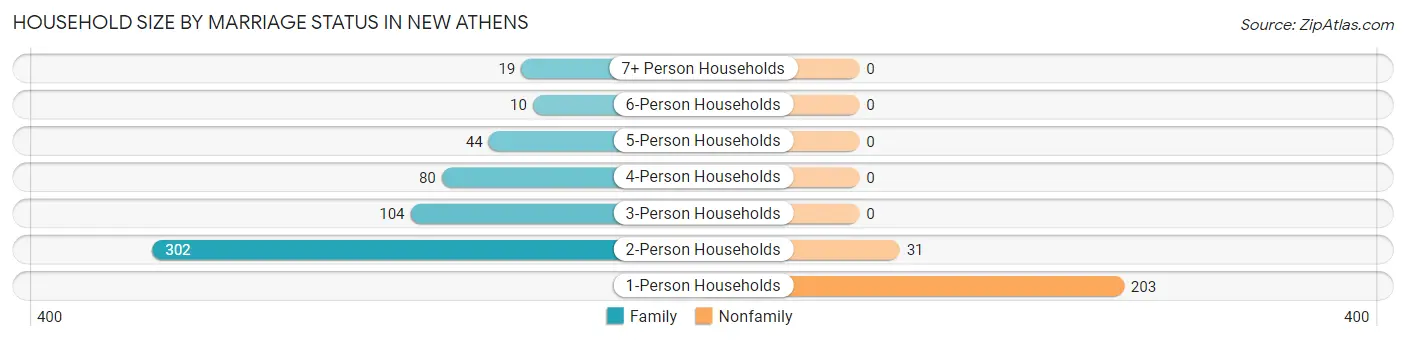
| Household Size | Family Households | Nonfamily Households |
| 1-Person Households | - | 203 (25.6%) |
| 2-Person Households | 302 (38.1%) | 31 (3.9%) |
| 3-Person Households | 104 (13.1%) | 0 (0.0%) |
| 4-Person Households | 80 (10.1%) | 0 (0.0%) |
| 5-Person Households | 44 (5.6%) | 0 (0.0%) |
| 6-Person Households | 10 (1.3%) | 0 (0.0%) |
| 7+ Person Households | 19 (2.4%) | 0 (0.0%) |
| Total | 559 (70.5%) | 234 (29.5%) |
Female Fertility in New Athens
Fertility by Age in New Athens
Average fertility rate in New Athens is 112.0 births per 1,000 women. Women in the age bracket of 20 to 34 years have the highest fertility rate with 262.0 births per 1,000 women. Women in the age bracket of 20 to 34 years acount for 84.4% of all women with births.
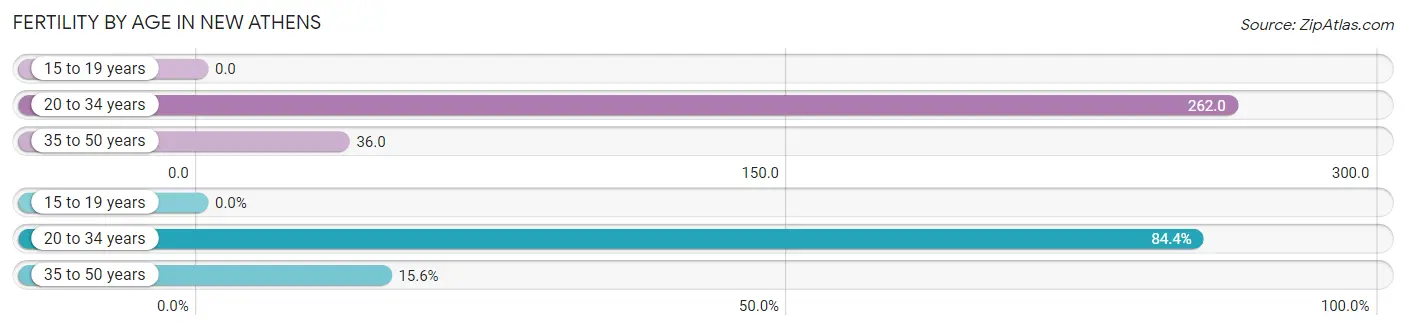
| Age Bracket | Women with Births | Births / 1,000 Women |
| 15 to 19 years | 0 (0.0%) | 0.0 |
| 20 to 34 years | 38 (84.4%) | 262.0 |
| 35 to 50 years | 7 (15.6%) | 36.0 |
| Total | 45 (100.0%) | 112.0 |
Fertility by Age by Marriage Status in New Athens
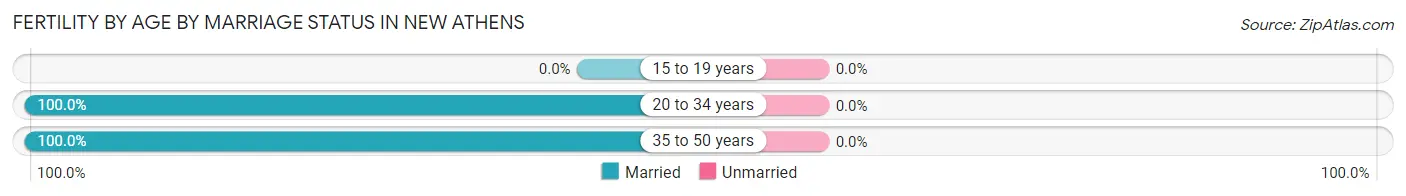
| Age Bracket | Married | Unmarried |
| 15 to 19 years | 0 (0.0%) | 0 (0.0%) |
| 20 to 34 years | 38 (100.0%) | 0 (0.0%) |
| 35 to 50 years | 7 (100.0%) | 0 (0.0%) |
| Total | 45 (100.0%) | 0 (0.0%) |
Fertility by Education in New Athens
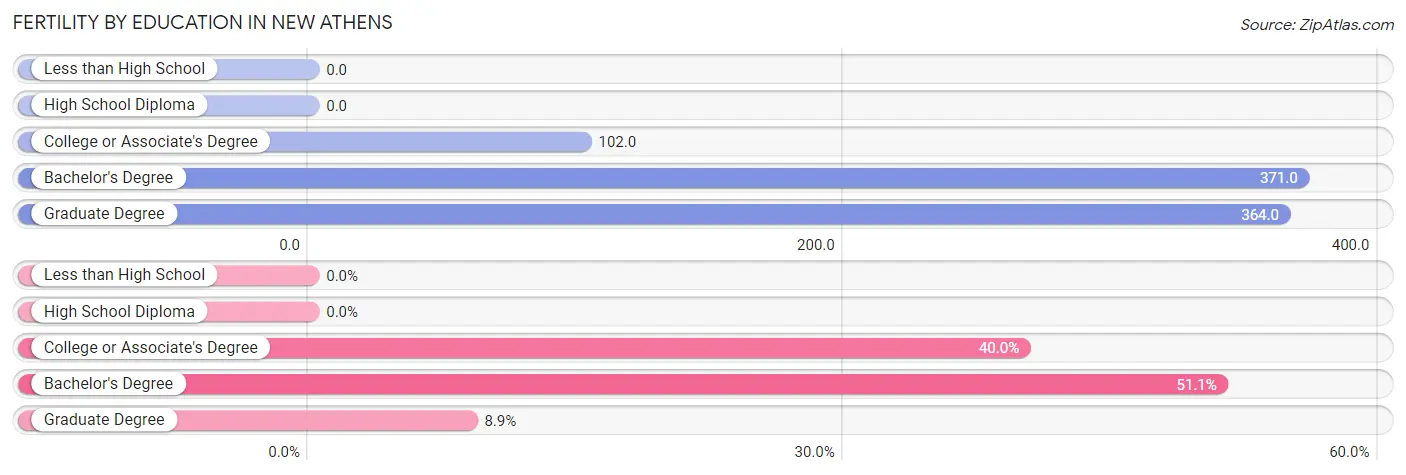
| Educational Attainment | Women with Births | Births / 1,000 Women |
| Less than High School | 0 (0.0%) | 0.0 |
| High School Diploma | 0 (0.0%) | 0.0 |
| College or Associate's Degree | 18 (40.0%) | 102.0 |
| Bachelor's Degree | 23 (51.1%) | 371.0 |
| Graduate Degree | 4 (8.9%) | 364.0 |
| Total | 45 (100.0%) | 112.0 |
Fertility by Education by Marriage Status in New Athens
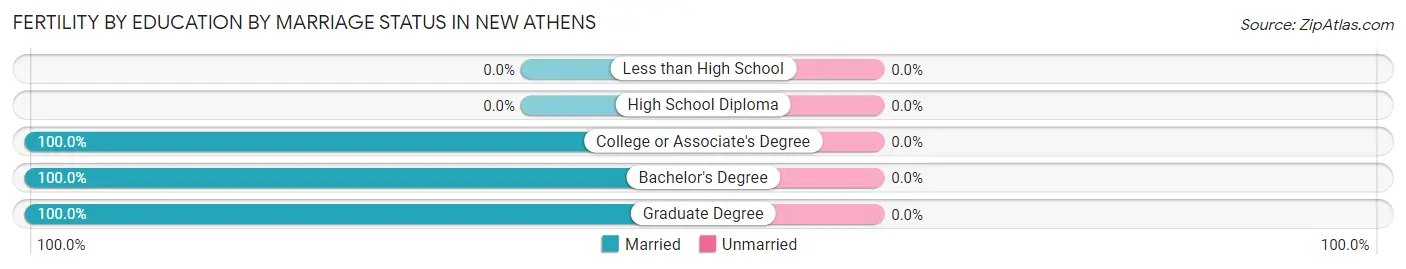
| Educational Attainment | Married | Unmarried |
| Less than High School | 0 (0.0%) | 0 (0.0%) |
| High School Diploma | 0 (0.0%) | 0 (0.0%) |
| College or Associate's Degree | 18 (100.0%) | 0 (0.0%) |
| Bachelor's Degree | 23 (100.0%) | 0 (0.0%) |
| Graduate Degree | 4 (100.0%) | 0 (0.0%) |
| Total | 45 (100.0%) | 0 (0.0%) |
Employment Characteristics in New Athens
Employment by Class of Employer in New Athens
Among the 873 employed individuals in New Athens, private company employees (656 | 75.1%), not-for-profit organizations (56 | 6.4%), and local government employees (50 | 5.7%) make up the most common classes of employment.
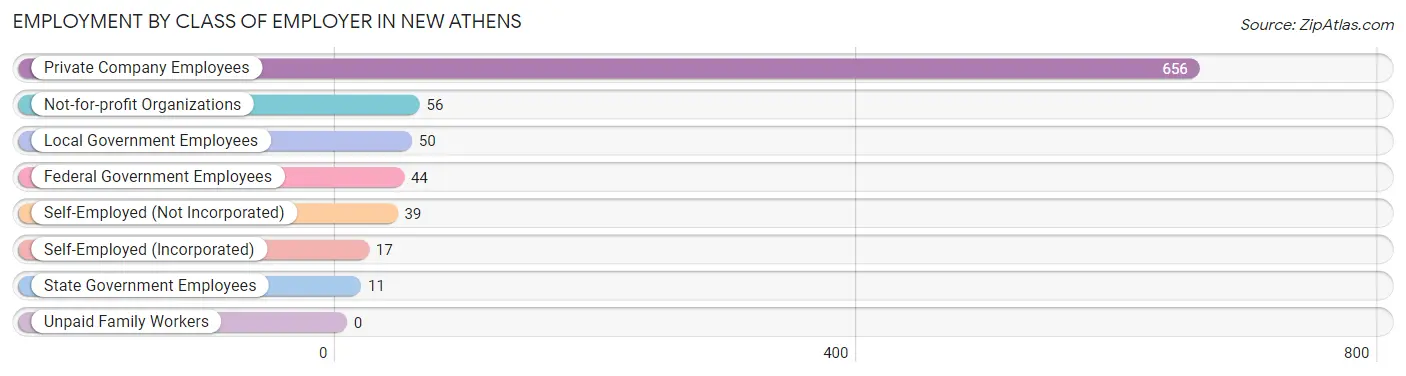
| Employer Class | # Employees | % Employees |
| Private Company Employees | 656 | 75.1% |
| Self-Employed (Incorporated) | 17 | 1.9% |
| Self-Employed (Not Incorporated) | 39 | 4.5% |
| Not-for-profit Organizations | 56 | 6.4% |
| Local Government Employees | 50 | 5.7% |
| State Government Employees | 11 | 1.3% |
| Federal Government Employees | 44 | 5.0% |
| Unpaid Family Workers | 0 | 0.0% |
| Total | 873 | 100.0% |
Employment Status by Age in New Athens
According to the labor force statistics for New Athens, out of the total population over 16 years of age (1,570), 61.0% or 958 individuals are in the labor force, with 5.2% or 50 of them unemployed. The age group with the highest labor force participation rate is 30 to 34 years, with 100.0% or 50 individuals in the labor force. Within the labor force, the 65 to 74 years age range has the highest percentage of unemployed individuals, with 17.6% or 9 of them being unemployed.
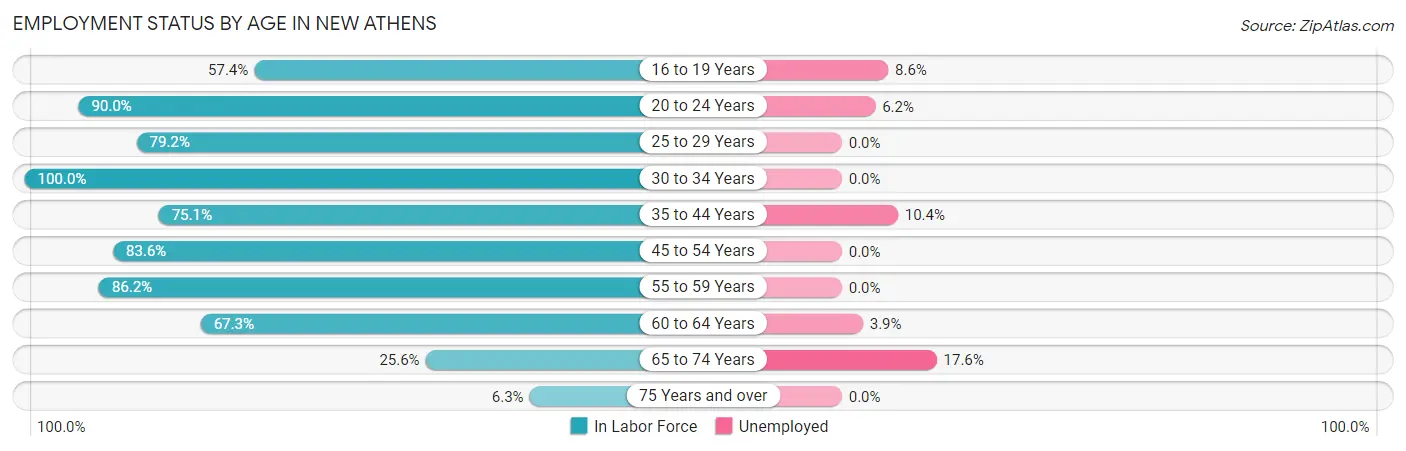
| Age Bracket | In Labor Force | Unemployed |
| 16 to 19 Years | 58 (57.4%) | 5 (8.6%) |
| 20 to 24 Years | 81 (90.0%) | 5 (6.2%) |
| 25 to 29 Years | 95 (79.2%) | 0 (0.0%) |
| 30 to 34 Years | 50 (100.0%) | 0 (0.0%) |
| 35 to 44 Years | 257 (75.1%) | 27 (10.4%) |
| 45 to 54 Years | 148 (83.6%) | 0 (0.0%) |
| 55 to 59 Years | 100 (86.2%) | 0 (0.0%) |
| 60 to 64 Years | 103 (67.3%) | 4 (3.9%) |
| 65 to 74 Years | 51 (25.6%) | 9 (17.6%) |
| 75 Years and over | 14 (6.3%) | 0 (0.0%) |
| Total | 958 (61.0%) | 50 (5.2%) |
Employment Status by Educational Attainment in New Athens
According to labor force statistics for New Athens, 78.6% of individuals (753) out of the total population between 25 and 64 years of age (958) are in the labor force, with 4.0% or 30 of them being unemployed. The group with the highest labor force participation rate are those with the educational attainment of bachelor's degree or higher, with 87.4% or 153 individuals in the labor force. Within the labor force, individuals with college / associate degree education have the highest percentage of unemployment, with 8.5% or 26 of them being unemployed.
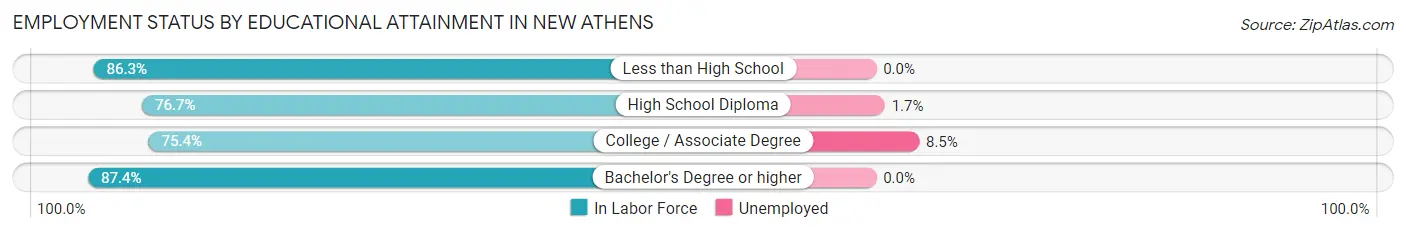
| Educational Attainment | In Labor Force | Unemployed |
| Less than High School | 44 (86.3%) | 0 (0.0%) |
| High School Diploma | 250 (76.7%) | 6 (1.7%) |
| College / Associate Degree | 306 (75.4%) | 35 (8.5%) |
| Bachelor's Degree or higher | 153 (87.4%) | 0 (0.0%) |
| Total | 753 (78.6%) | 38 (4.0%) |
Employment Occupations by Sex in New Athens
Management, Business, Science and Arts Occupations
The most common Management, Business, Science and Arts occupations in New Athens are Management (104 | 11.6%), Community & Social Service (84 | 9.3%), Education Instruction & Library (56 | 6.2%), Business & Financial (26 | 2.9%), and Arts, Media & Entertainment (19 | 2.1%).
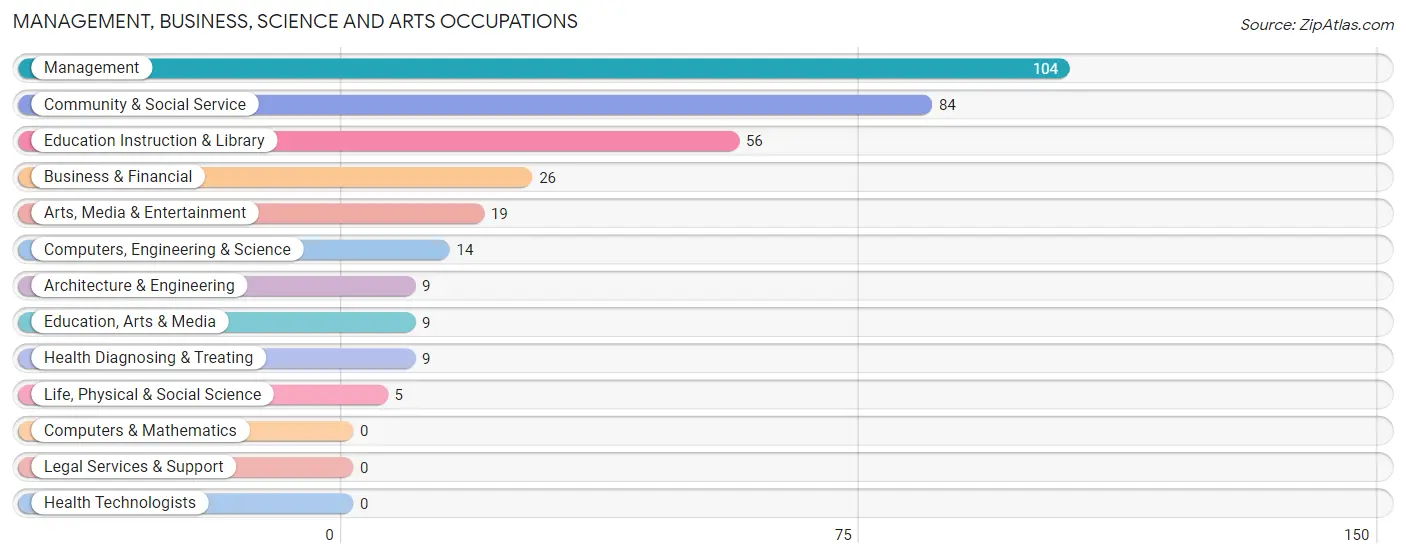
Management, Business, Science and Arts Occupations by Sex
Within the Management, Business, Science and Arts occupations in New Athens, the most male-oriented occupations are Life, Physical & Social Science (100.0%), Business & Financial (76.9%), and Management (56.7%), while the most female-oriented occupations are Architecture & Engineering (100.0%), Education, Arts & Media (100.0%), and Arts, Media & Entertainment (100.0%).
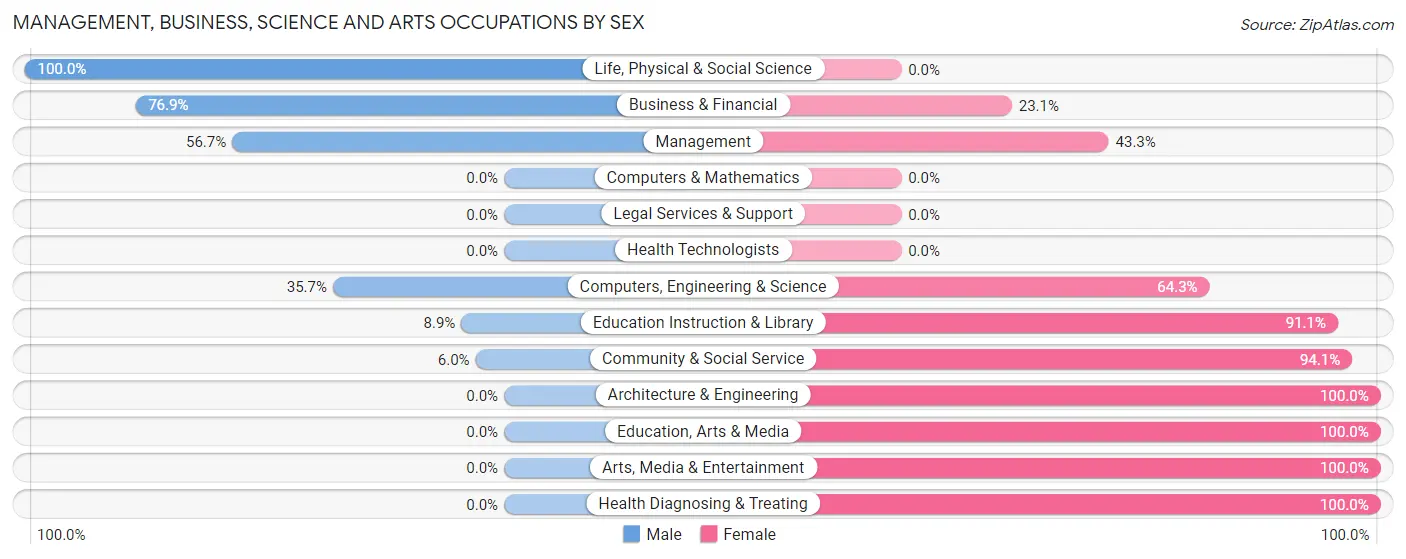
| Occupation | Male | Female |
| Management | 59 (56.7%) | 45 (43.3%) |
| Business & Financial | 20 (76.9%) | 6 (23.1%) |
| Computers, Engineering & Science | 5 (35.7%) | 9 (64.3%) |
| Computers & Mathematics | 0 (0.0%) | 0 (0.0%) |
| Architecture & Engineering | 0 (0.0%) | 9 (100.0%) |
| Life, Physical & Social Science | 5 (100.0%) | 0 (0.0%) |
| Community & Social Service | 5 (5.9%) | 79 (94.1%) |
| Education, Arts & Media | 0 (0.0%) | 9 (100.0%) |
| Legal Services & Support | 0 (0.0%) | 0 (0.0%) |
| Education Instruction & Library | 5 (8.9%) | 51 (91.1%) |
| Arts, Media & Entertainment | 0 (0.0%) | 19 (100.0%) |
| Health Diagnosing & Treating | 0 (0.0%) | 9 (100.0%) |
| Health Technologists | 0 (0.0%) | 0 (0.0%) |
| Total (Category) | 89 (37.6%) | 148 (62.5%) |
| Total (Overall) | 485 (53.9%) | 415 (46.1%) |
Services Occupations
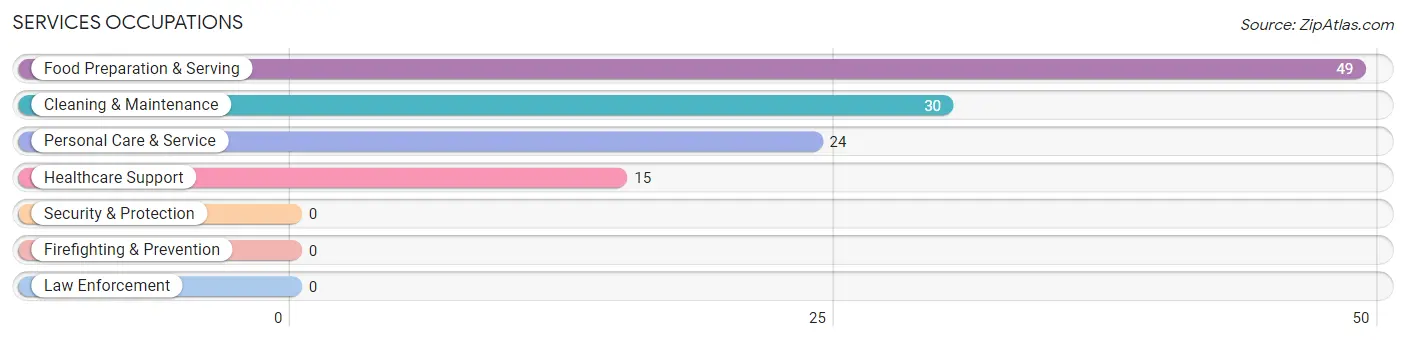
The most common Services occupations in New Athens are Food Preparation & Serving (49 | 5.4%), Cleaning & Maintenance (30 | 3.3%), Personal Care & Service (24 | 2.7%), and Healthcare Support (15 | 1.7%).
Services Occupations by Sex
Within the Services occupations in New Athens, the most male-oriented occupations are Cleaning & Maintenance (83.3%), and Food Preparation & Serving (42.9%), while the most female-oriented occupations are Healthcare Support (100.0%), Personal Care & Service (100.0%), and Food Preparation & Serving (57.1%).
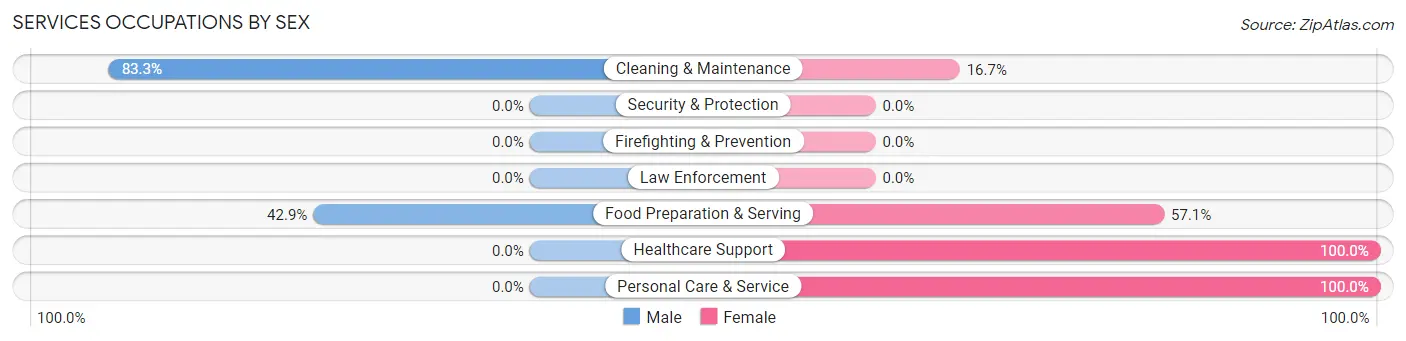
| Occupation | Male | Female |
| Healthcare Support | 0 (0.0%) | 15 (100.0%) |
| Security & Protection | 0 (0.0%) | 0 (0.0%) |
| Firefighting & Prevention | 0 (0.0%) | 0 (0.0%) |
| Law Enforcement | 0 (0.0%) | 0 (0.0%) |
| Food Preparation & Serving | 21 (42.9%) | 28 (57.1%) |
| Cleaning & Maintenance | 25 (83.3%) | 5 (16.7%) |
| Personal Care & Service | 0 (0.0%) | 24 (100.0%) |
| Total (Category) | 46 (39.0%) | 72 (61.0%) |
| Total (Overall) | 485 (53.9%) | 415 (46.1%) |
Sales and Office Occupations
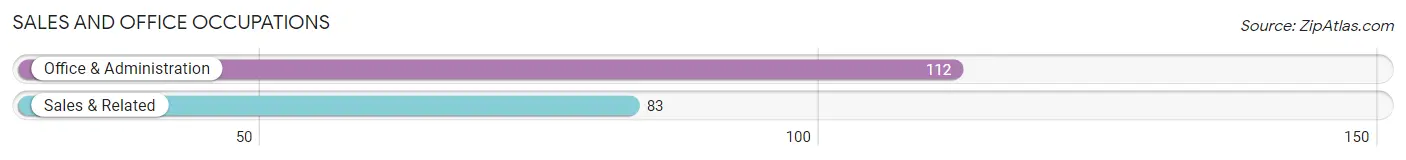
The most common Sales and Office occupations in New Athens are Office & Administration (112 | 12.4%), and Sales & Related (83 | 9.2%).
Sales and Office Occupations by Sex
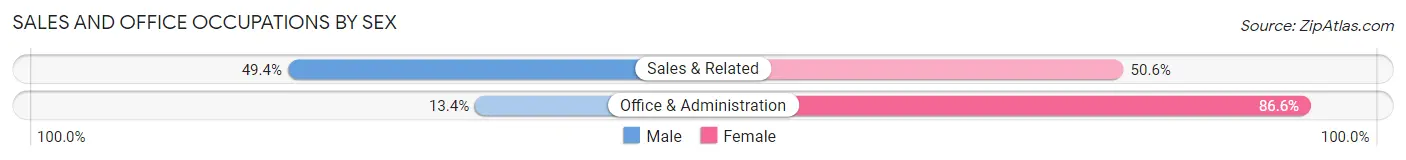
| Occupation | Male | Female |
| Sales & Related | 41 (49.4%) | 42 (50.6%) |
| Office & Administration | 15 (13.4%) | 97 (86.6%) |
| Total (Category) | 56 (28.7%) | 139 (71.3%) |
| Total (Overall) | 485 (53.9%) | 415 (46.1%) |
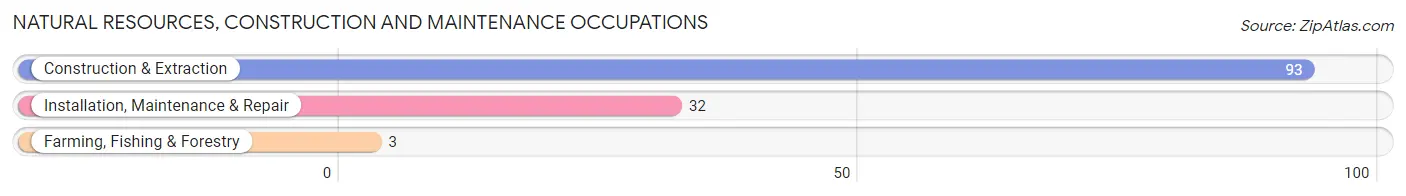
Natural Resources, Construction and Maintenance Occupations
The most common Natural Resources, Construction and Maintenance occupations in New Athens are Construction & Extraction (93 | 10.3%), Installation, Maintenance & Repair (32 | 3.6%), and Farming, Fishing & Forestry (3 | 0.3%).
Natural Resources, Construction and Maintenance Occupations by Sex
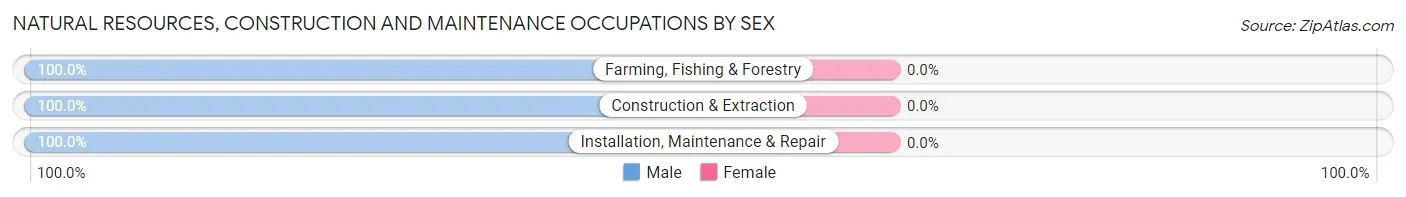
| Occupation | Male | Female |
| Farming, Fishing & Forestry | 3 (100.0%) | 0 (0.0%) |
| Construction & Extraction | 93 (100.0%) | 0 (0.0%) |
| Installation, Maintenance & Repair | 32 (100.0%) | 0 (0.0%) |
| Total (Category) | 128 (100.0%) | 0 (0.0%) |
| Total (Overall) | 485 (53.9%) | 415 (46.1%) |
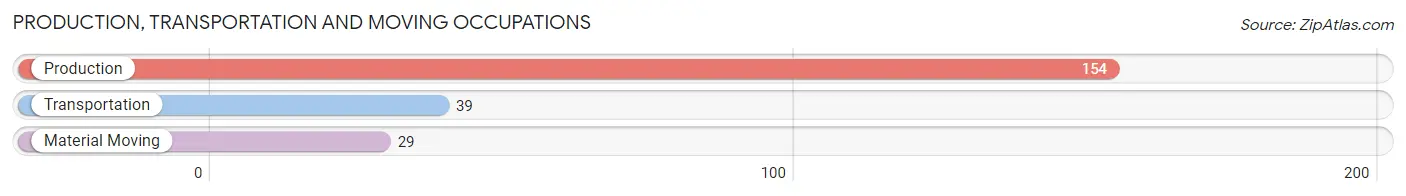
Production, Transportation and Moving Occupations
The most common Production, Transportation and Moving occupations in New Athens are Production (154 | 17.1%), Transportation (39 | 4.3%), and Material Moving (29 | 3.2%).
Production, Transportation and Moving Occupations by Sex
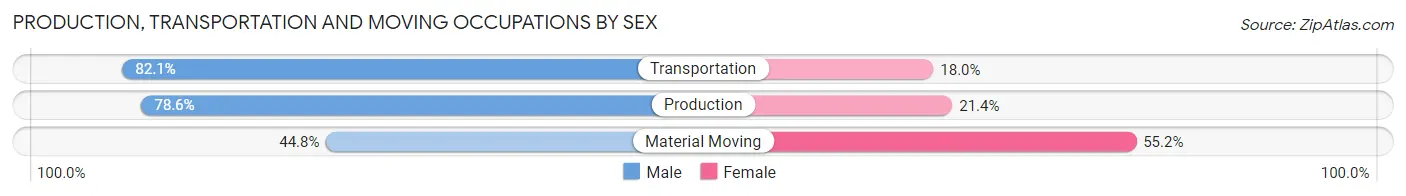
| Occupation | Male | Female |
| Production | 121 (78.6%) | 33 (21.4%) |
| Transportation | 32 (82.1%) | 7 (17.9%) |
| Material Moving | 13 (44.8%) | 16 (55.2%) |
| Total (Category) | 166 (74.8%) | 56 (25.2%) |
| Total (Overall) | 485 (53.9%) | 415 (46.1%) |
Employment Industries by Sex in New Athens
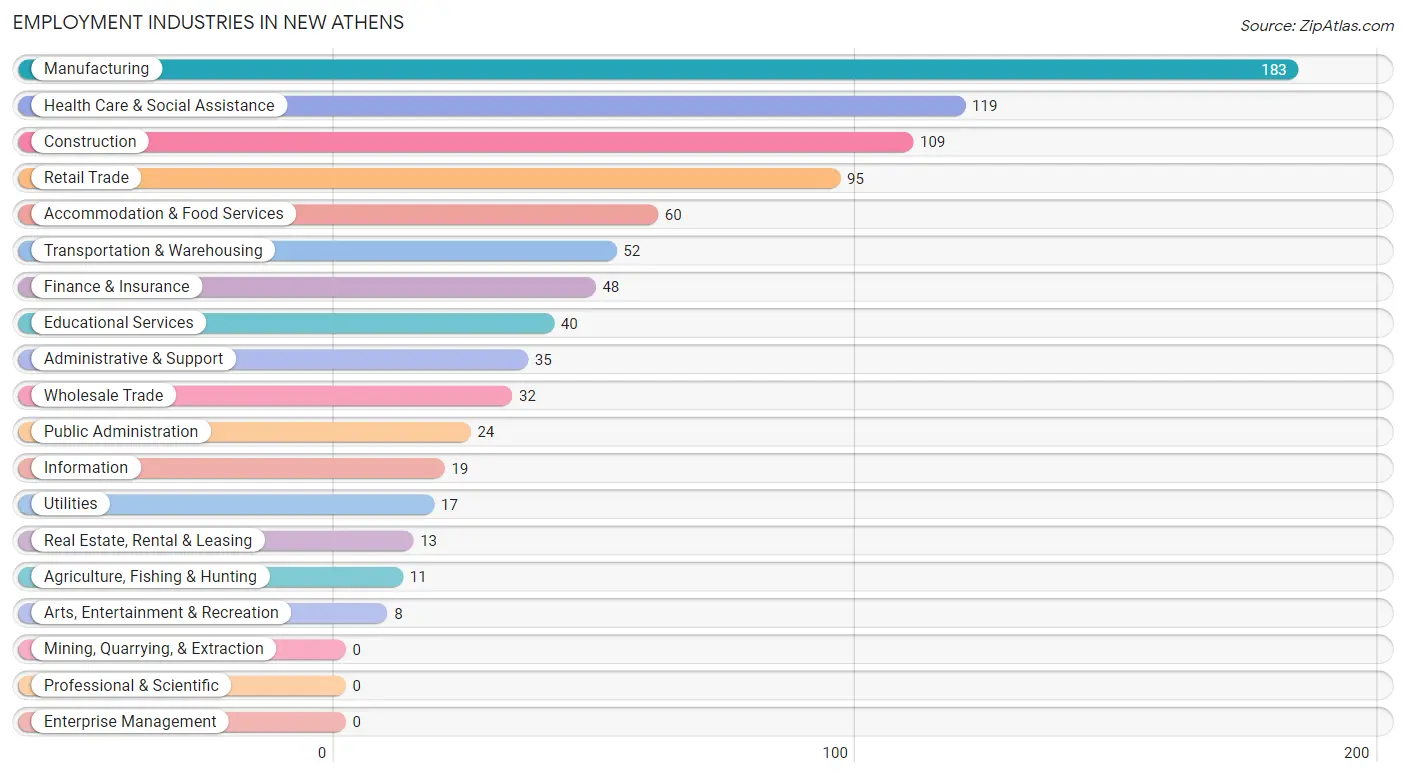
Employment Industries in New Athens
The major employment industries in New Athens include Manufacturing (183 | 20.3%), Health Care & Social Assistance (119 | 13.2%), Construction (109 | 12.1%), Retail Trade (95 | 10.6%), and Accommodation & Food Services (60 | 6.7%).
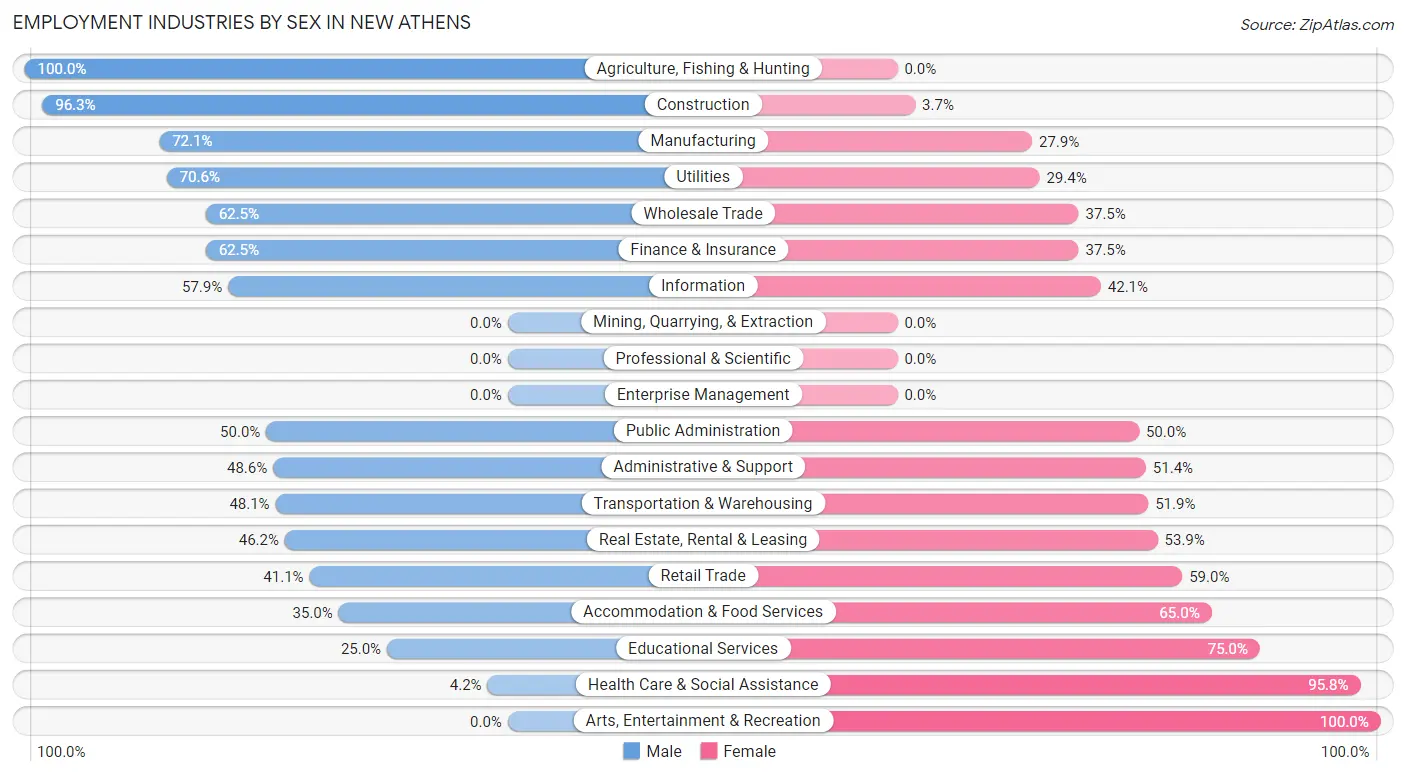
Employment Industries by Sex in New Athens
The New Athens industries that see more men than women are Agriculture, Fishing & Hunting (100.0%), Construction (96.3%), and Manufacturing (72.1%), whereas the industries that tend to have a higher number of women are Arts, Entertainment & Recreation (100.0%), Health Care & Social Assistance (95.8%), and Educational Services (75.0%).
| Industry | Male | Female |
| Agriculture, Fishing & Hunting | 11 (100.0%) | 0 (0.0%) |
| Mining, Quarrying, & Extraction | 0 (0.0%) | 0 (0.0%) |
| Construction | 105 (96.3%) | 4 (3.7%) |
| Manufacturing | 132 (72.1%) | 51 (27.9%) |
| Wholesale Trade | 20 (62.5%) | 12 (37.5%) |
| Retail Trade | 39 (41.0%) | 56 (59.0%) |
| Transportation & Warehousing | 25 (48.1%) | 27 (51.9%) |
| Utilities | 12 (70.6%) | 5 (29.4%) |
| Information | 11 (57.9%) | 8 (42.1%) |
| Finance & Insurance | 30 (62.5%) | 18 (37.5%) |
| Real Estate, Rental & Leasing | 6 (46.2%) | 7 (53.8%) |
| Professional & Scientific | 0 (0.0%) | 0 (0.0%) |
| Enterprise Management | 0 (0.0%) | 0 (0.0%) |
| Administrative & Support | 17 (48.6%) | 18 (51.4%) |
| Educational Services | 10 (25.0%) | 30 (75.0%) |
| Health Care & Social Assistance | 5 (4.2%) | 114 (95.8%) |
| Arts, Entertainment & Recreation | 0 (0.0%) | 8 (100.0%) |
| Accommodation & Food Services | 21 (35.0%) | 39 (65.0%) |
| Public Administration | 12 (50.0%) | 12 (50.0%) |
| Total | 485 (53.9%) | 415 (46.1%) |
Education in New Athens
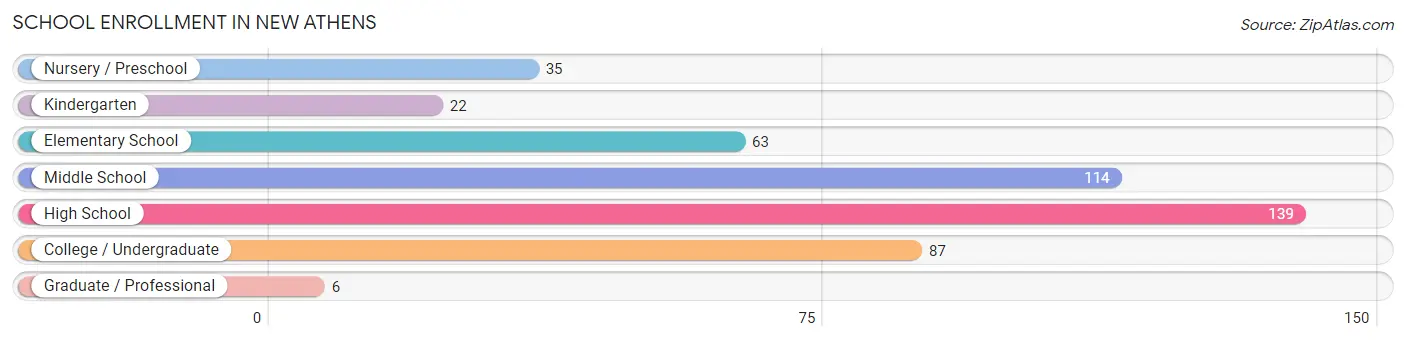
School Enrollment in New Athens
The most common levels of schooling among the 466 students in New Athens are high school (139 | 29.8%), middle school (114 | 24.5%), and college / undergraduate (87 | 18.7%).
| School Level | # Students | % Students |
| Nursery / Preschool | 35 | 7.5% |
| Kindergarten | 22 | 4.7% |
| Elementary School | 63 | 13.5% |
| Middle School | 114 | 24.5% |
| High School | 139 | 29.8% |
| College / Undergraduate | 87 | 18.7% |
| Graduate / Professional | 6 | 1.3% |
| Total | 466 | 100.0% |
School Enrollment by Age by Funding Source in New Athens
Out of a total of 466 students who are enrolled in schools in New Athens, 65 (13.9%) attend a private institution, while the remaining 401 (86.1%) are enrolled in public schools. The age group of 3 to 4 year olds has the highest likelihood of being enrolled in private schools, with 16 (100.0% in the age bracket) enrolled. Conversely, the age group of 18 to 19 year olds has the lowest likelihood of being enrolled in a private school, with 27 (100.0% in the age bracket) attending a public institution.
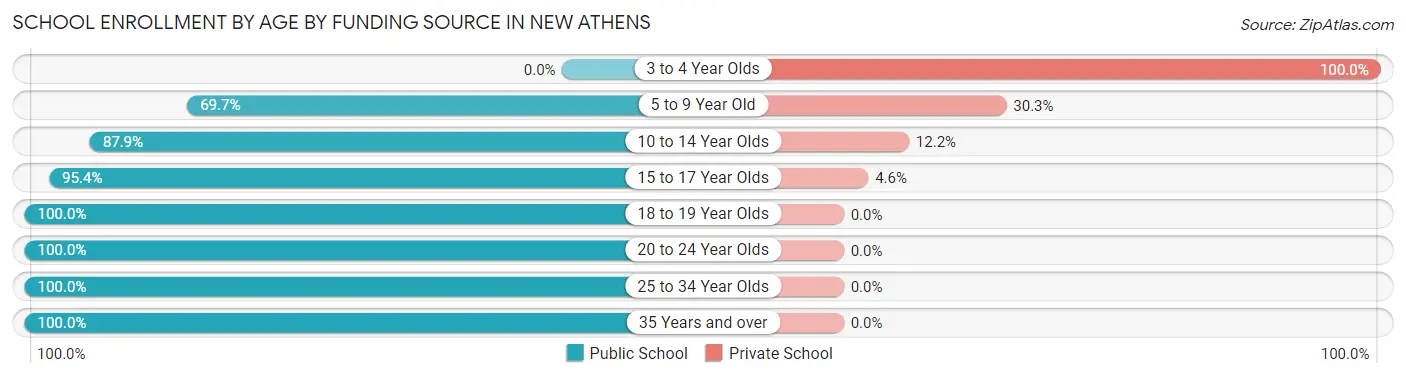
| Age Bracket | Public School | Private School |
| 3 to 4 Year Olds | 0 (0.0%) | 16 (100.0%) |
| 5 to 9 Year Old | 69 (69.7%) | 30 (30.3%) |
| 10 to 14 Year Olds | 94 (87.8%) | 13 (12.1%) |
| 15 to 17 Year Olds | 125 (95.4%) | 6 (4.6%) |
| 18 to 19 Year Olds | 27 (100.0%) | 0 (0.0%) |
| 20 to 24 Year Olds | 34 (100.0%) | 0 (0.0%) |
| 25 to 34 Year Olds | 21 (100.0%) | 0 (0.0%) |
| 35 Years and over | 31 (100.0%) | 0 (0.0%) |
| Total | 401 (86.1%) | 65 (13.9%) |
Educational Attainment by Field of Study in New Athens
Business (76 | 25.6%), education (61 | 20.5%), science & technology (24 | 8.1%), liberal arts & history (23 | 7.7%), and bio, nature & agricultural (21 | 7.1%) are the most common fields of study among 297 individuals in New Athens who have obtained a bachelor's degree or higher.
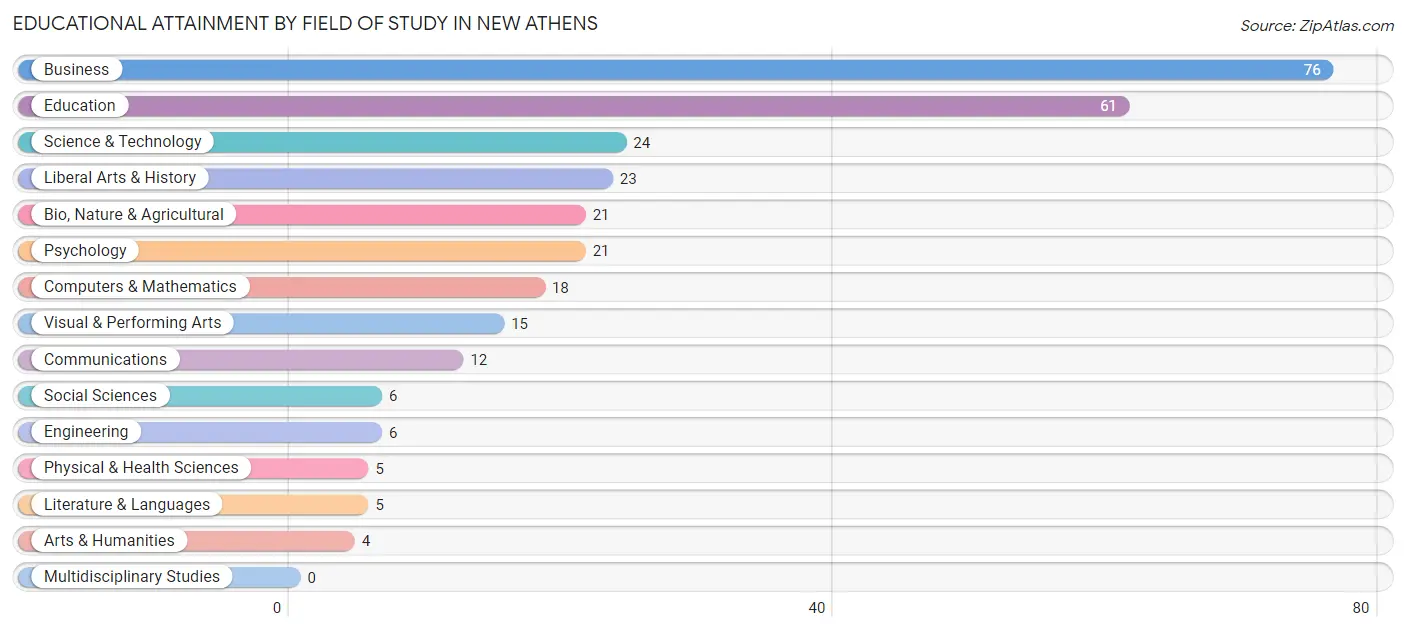
| Field of Study | # Graduates | % Graduates |
| Computers & Mathematics | 18 | 6.1% |
| Bio, Nature & Agricultural | 21 | 7.1% |
| Physical & Health Sciences | 5 | 1.7% |
| Psychology | 21 | 7.1% |
| Social Sciences | 6 | 2.0% |
| Engineering | 6 | 2.0% |
| Multidisciplinary Studies | 0 | 0.0% |
| Science & Technology | 24 | 8.1% |
| Business | 76 | 25.6% |
| Education | 61 | 20.5% |
| Literature & Languages | 5 | 1.7% |
| Liberal Arts & History | 23 | 7.7% |
| Visual & Performing Arts | 15 | 5.1% |
| Communications | 12 | 4.0% |
| Arts & Humanities | 4 | 1.3% |
| Total | 297 | 100.0% |
Transportation & Commute in New Athens
Vehicle Availability by Sex in New Athens
The most prevalent vehicle ownership categories in New Athens are males with 2 vehicles (165, accounting for 35.6%) and females with 2 vehicles (143, making up 40.2%).
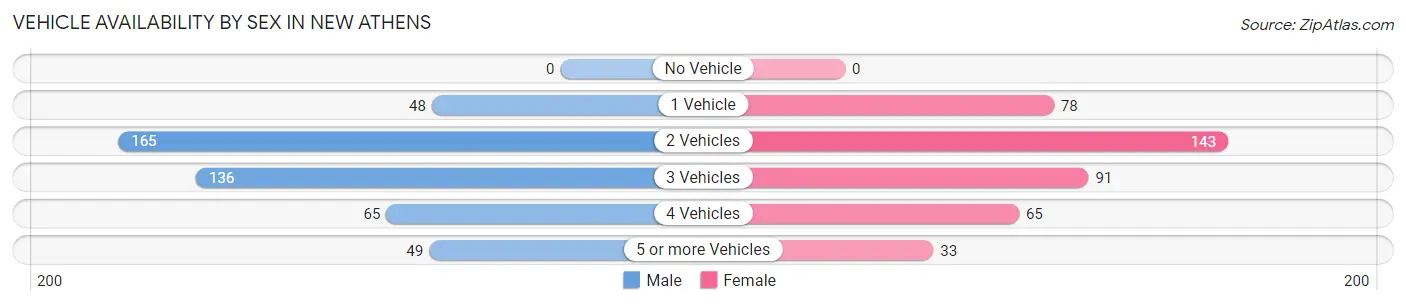
| Vehicles Available | Male | Female |
| No Vehicle | 0 (0.0%) | 0 (0.0%) |
| 1 Vehicle | 48 (10.4%) | 78 (19.0%) |
| 2 Vehicles | 165 (35.6%) | 143 (34.9%) |
| 3 Vehicles | 136 (29.4%) | 91 (22.2%) |
| 4 Vehicles | 65 (14.0%) | 65 (15.9%) |
| 5 or more Vehicles | 49 (10.6%) | 33 (8.1%) |
| Total | 463 (100.0%) | 410 (100.0%) |
Commute Time in New Athens
The most frequently occuring commute durations in New Athens are 20 to 24 minutes (163 commuters, 18.9%), 25 to 29 minutes (145 commuters, 16.8%), and 60 to 89 minutes (110 commuters, 12.8%).
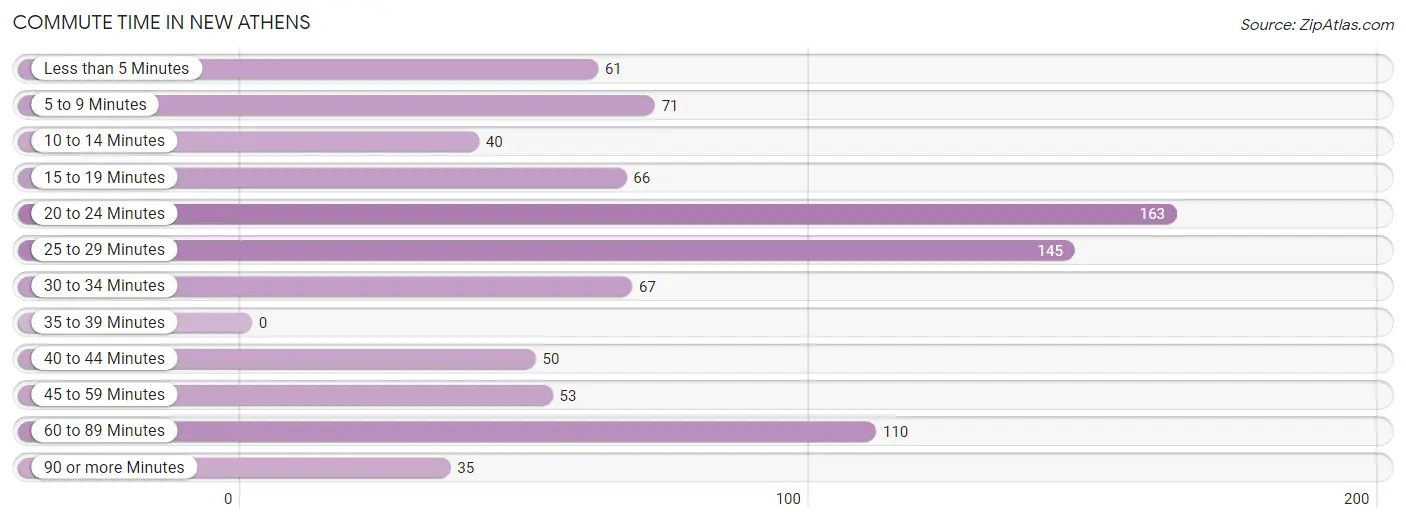
| Commute Time | # Commuters | % Commuters |
| Less than 5 Minutes | 61 | 7.1% |
| 5 to 9 Minutes | 71 | 8.3% |
| 10 to 14 Minutes | 40 | 4.6% |
| 15 to 19 Minutes | 66 | 7.7% |
| 20 to 24 Minutes | 163 | 18.9% |
| 25 to 29 Minutes | 145 | 16.8% |
| 30 to 34 Minutes | 67 | 7.8% |
| 35 to 39 Minutes | 0 | 0.0% |
| 40 to 44 Minutes | 50 | 5.8% |
| 45 to 59 Minutes | 53 | 6.2% |
| 60 to 89 Minutes | 110 | 12.8% |
| 90 or more Minutes | 35 | 4.1% |
Commute Time by Sex in New Athens
The most common commute times in New Athens are 20 to 24 minutes (121 commuters, 26.5%) for males and 25 to 29 minutes (82 commuters, 20.3%) for females.
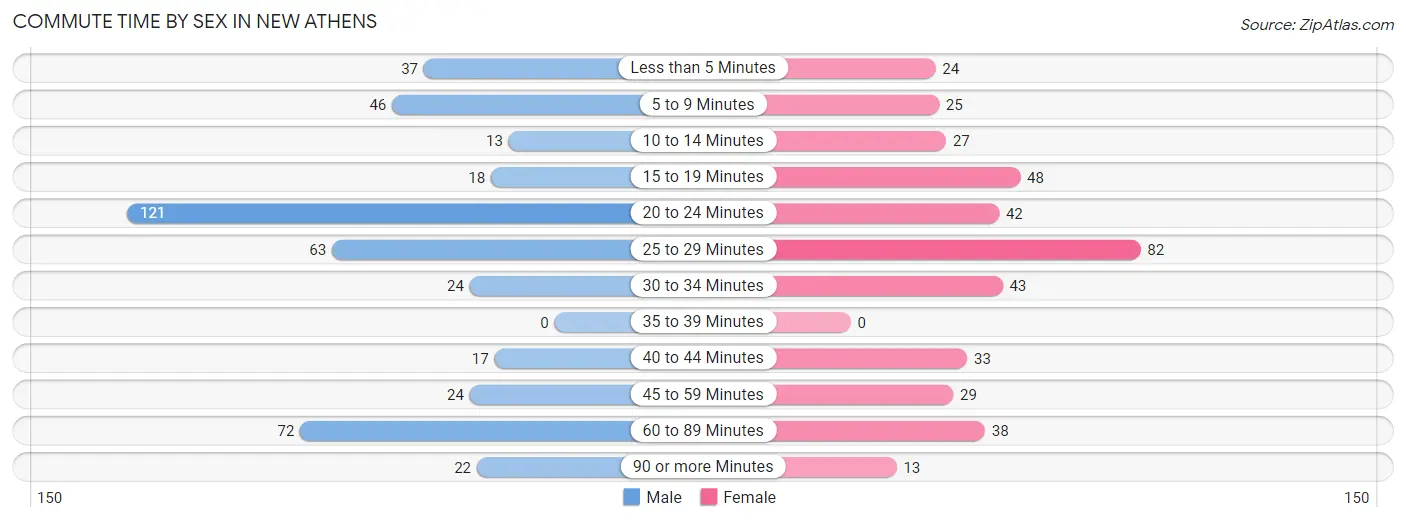
| Commute Time | Male | Female |
| Less than 5 Minutes | 37 (8.1%) | 24 (5.9%) |
| 5 to 9 Minutes | 46 (10.1%) | 25 (6.2%) |
| 10 to 14 Minutes | 13 (2.8%) | 27 (6.7%) |
| 15 to 19 Minutes | 18 (3.9%) | 48 (11.9%) |
| 20 to 24 Minutes | 121 (26.5%) | 42 (10.4%) |
| 25 to 29 Minutes | 63 (13.8%) | 82 (20.3%) |
| 30 to 34 Minutes | 24 (5.2%) | 43 (10.6%) |
| 35 to 39 Minutes | 0 (0.0%) | 0 (0.0%) |
| 40 to 44 Minutes | 17 (3.7%) | 33 (8.2%) |
| 45 to 59 Minutes | 24 (5.2%) | 29 (7.2%) |
| 60 to 89 Minutes | 72 (15.8%) | 38 (9.4%) |
| 90 or more Minutes | 22 (4.8%) | 13 (3.2%) |
Time of Departure to Work by Sex in New Athens
The most frequent times of departure to work in New Athens are 6:30 AM to 6:59 AM (76, 16.6%) for males and 7:30 AM to 7:59 AM (96, 23.8%) for females.
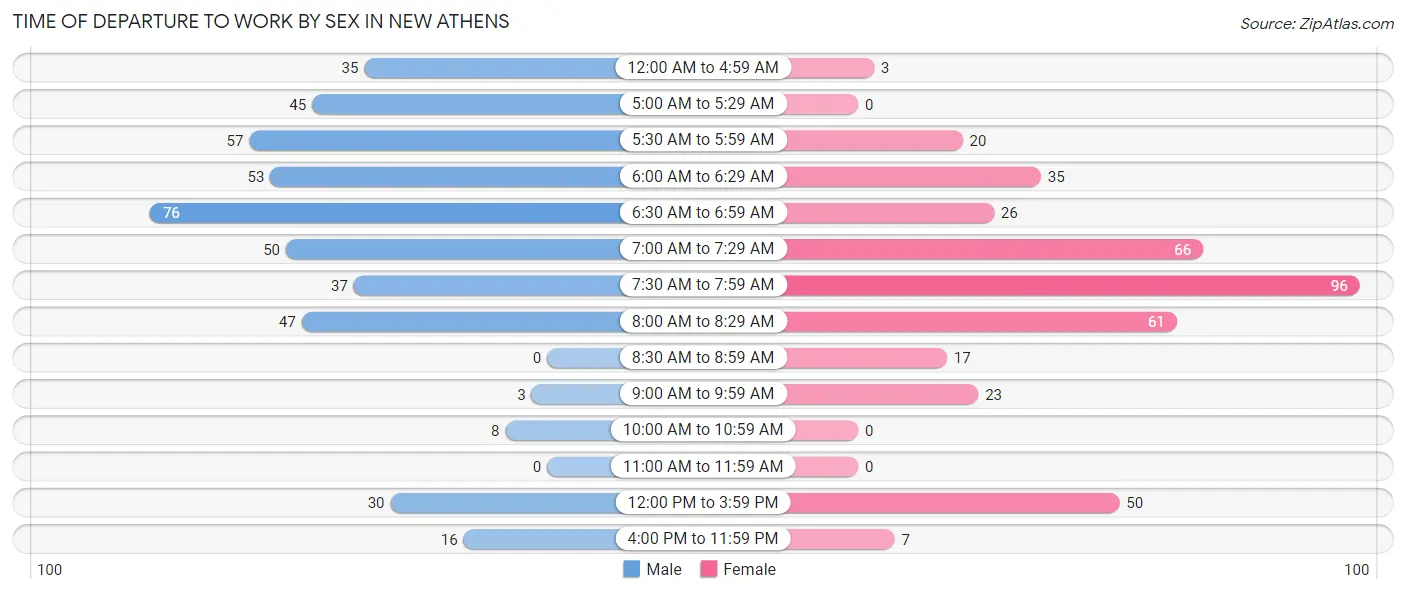
| Time of Departure | Male | Female |
| 12:00 AM to 4:59 AM | 35 (7.7%) | 3 (0.7%) |
| 5:00 AM to 5:29 AM | 45 (9.9%) | 0 (0.0%) |
| 5:30 AM to 5:59 AM | 57 (12.5%) | 20 (5.0%) |
| 6:00 AM to 6:29 AM | 53 (11.6%) | 35 (8.7%) |
| 6:30 AM to 6:59 AM | 76 (16.6%) | 26 (6.4%) |
| 7:00 AM to 7:29 AM | 50 (10.9%) | 66 (16.3%) |
| 7:30 AM to 7:59 AM | 37 (8.1%) | 96 (23.8%) |
| 8:00 AM to 8:29 AM | 47 (10.3%) | 61 (15.1%) |
| 8:30 AM to 8:59 AM | 0 (0.0%) | 17 (4.2%) |
| 9:00 AM to 9:59 AM | 3 (0.7%) | 23 (5.7%) |
| 10:00 AM to 10:59 AM | 8 (1.8%) | 0 (0.0%) |
| 11:00 AM to 11:59 AM | 0 (0.0%) | 0 (0.0%) |
| 12:00 PM to 3:59 PM | 30 (6.6%) | 50 (12.4%) |
| 4:00 PM to 11:59 PM | 16 (3.5%) | 7 (1.7%) |
| Total | 457 (100.0%) | 404 (100.0%) |
Housing Occupancy in New Athens
Occupancy by Ownership in New Athens
Of the total 793 dwellings in New Athens, owner-occupied units account for 658 (83.0%), while renter-occupied units make up 135 (17.0%).
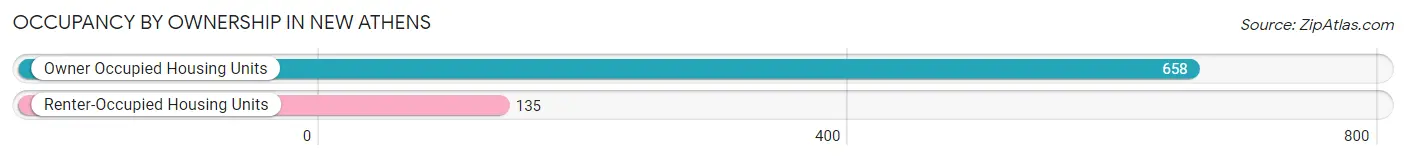
| Occupancy | # Housing Units | % Housing Units |
| Owner Occupied Housing Units | 658 | 83.0% |
| Renter-Occupied Housing Units | 135 | 17.0% |
| Total Occupied Housing Units | 793 | 100.0% |
Occupancy by Household Size in New Athens
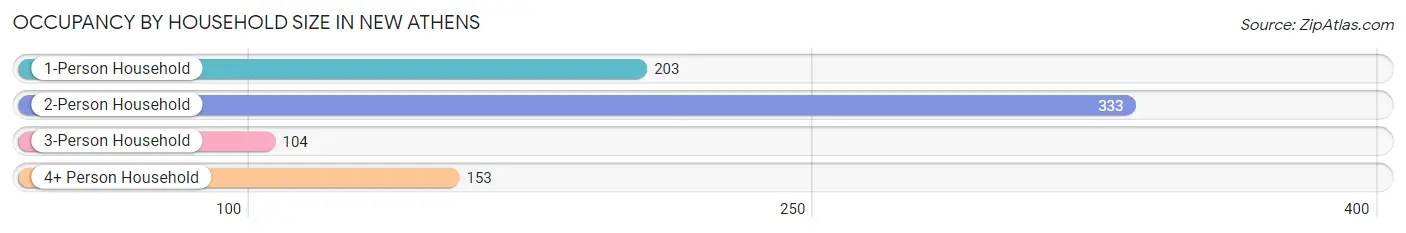
| Household Size | # Housing Units | % Housing Units |
| 1-Person Household | 203 | 25.6% |
| 2-Person Household | 333 | 42.0% |
| 3-Person Household | 104 | 13.1% |
| 4+ Person Household | 153 | 19.3% |
| Total Housing Units | 793 | 100.0% |
Occupancy by Ownership by Household Size in New Athens
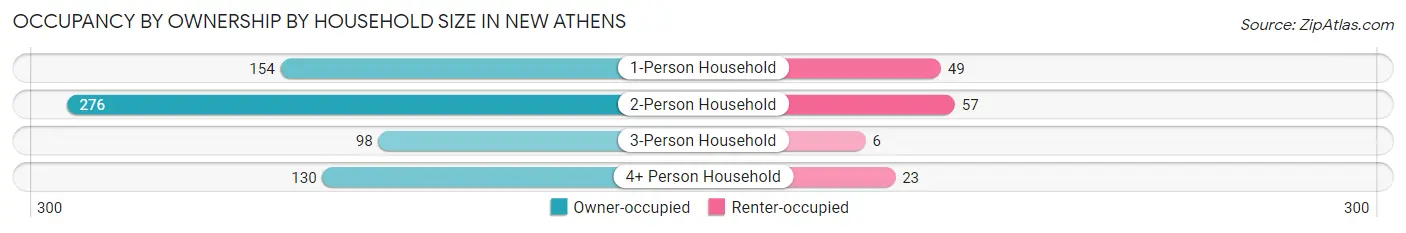
| Household Size | Owner-occupied | Renter-occupied |
| 1-Person Household | 154 (75.9%) | 49 (24.1%) |
| 2-Person Household | 276 (82.9%) | 57 (17.1%) |
| 3-Person Household | 98 (94.2%) | 6 (5.8%) |
| 4+ Person Household | 130 (85.0%) | 23 (15.0%) |
| Total Housing Units | 658 (83.0%) | 135 (17.0%) |
Occupancy by Educational Attainment in New Athens
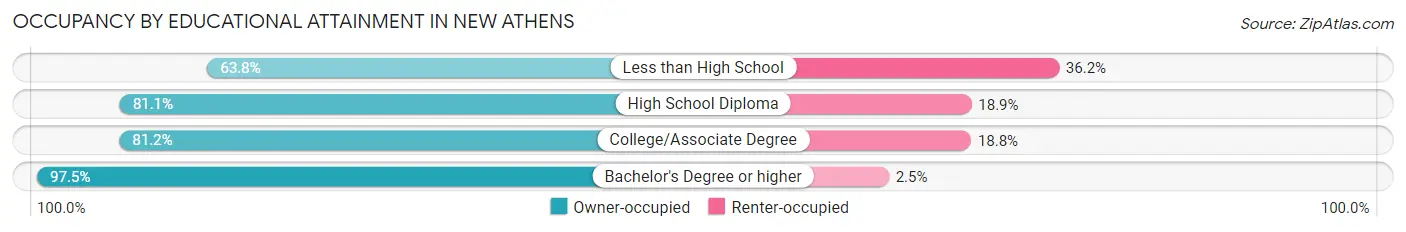
| Household Size | Owner-occupied | Renter-occupied |
| Less than High School | 44 (63.8%) | 25 (36.2%) |
| High School Diploma | 215 (81.1%) | 50 (18.9%) |
| College/Associate Degree | 242 (81.2%) | 56 (18.8%) |
| Bachelor's Degree or higher | 157 (97.5%) | 4 (2.5%) |
Occupancy by Age of Householder in New Athens
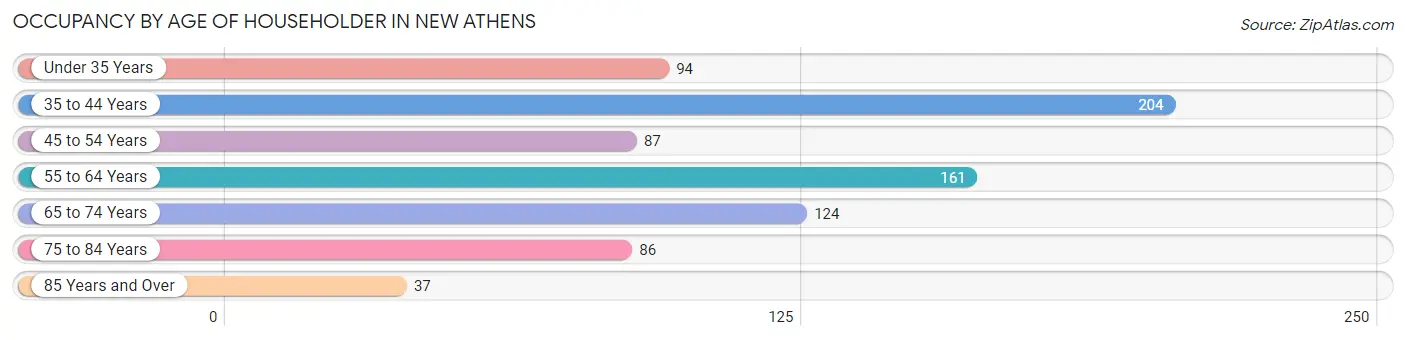
| Age Bracket | # Households | % Households |
| Under 35 Years | 94 | 11.8% |
| 35 to 44 Years | 204 | 25.7% |
| 45 to 54 Years | 87 | 11.0% |
| 55 to 64 Years | 161 | 20.3% |
| 65 to 74 Years | 124 | 15.6% |
| 75 to 84 Years | 86 | 10.8% |
| 85 Years and Over | 37 | 4.7% |
| Total | 793 | 100.0% |
Housing Finances in New Athens
Median Income by Occupancy in New Athens
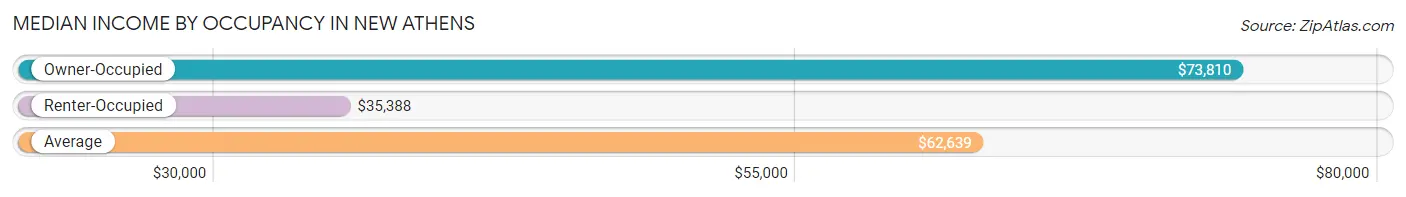
| Occupancy Type | # Households | Median Income |
| Owner-Occupied | 658 (83.0%) | $73,810 |
| Renter-Occupied | 135 (17.0%) | $35,388 |
| Average | 793 (100.0%) | $62,639 |
Occupancy by Householder Income Bracket in New Athens
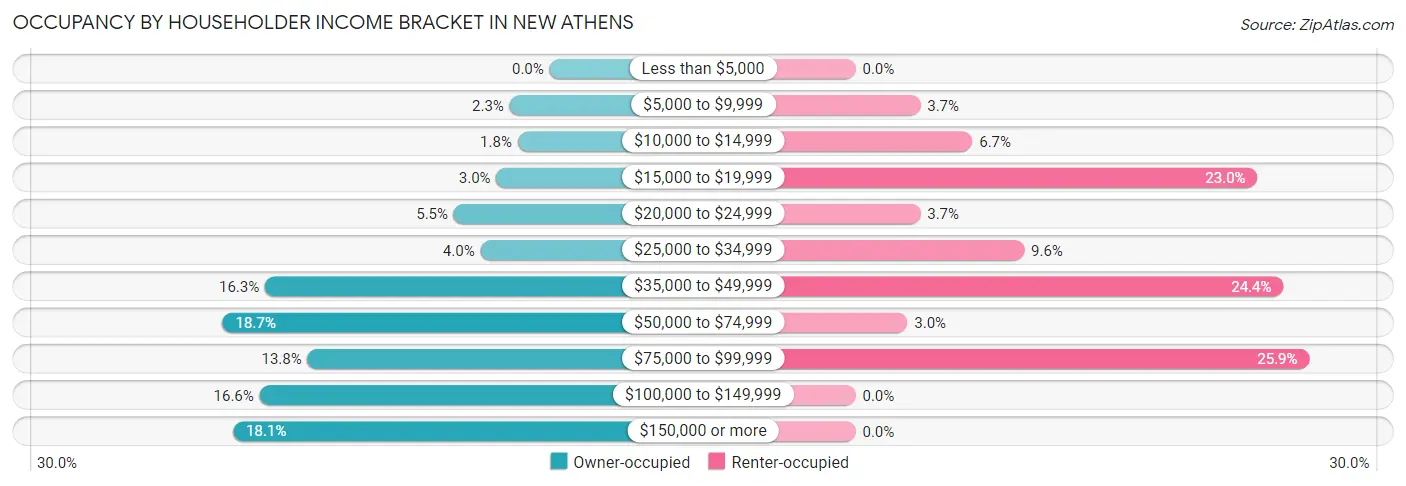
| Income Bracket | Owner-occupied | Renter-occupied |
| Less than $5,000 | 0 (0.0%) | 0 (0.0%) |
| $5,000 to $9,999 | 15 (2.3%) | 5 (3.7%) |
| $10,000 to $14,999 | 12 (1.8%) | 9 (6.7%) |
| $15,000 to $19,999 | 20 (3.0%) | 31 (23.0%) |
| $20,000 to $24,999 | 36 (5.5%) | 5 (3.7%) |
| $25,000 to $34,999 | 26 (4.0%) | 13 (9.6%) |
| $35,000 to $49,999 | 107 (16.3%) | 33 (24.4%) |
| $50,000 to $74,999 | 123 (18.7%) | 4 (3.0%) |
| $75,000 to $99,999 | 91 (13.8%) | 35 (25.9%) |
| $100,000 to $149,999 | 109 (16.6%) | 0 (0.0%) |
| $150,000 or more | 119 (18.1%) | 0 (0.0%) |
| Total | 658 (100.0%) | 135 (100.0%) |
Monthly Housing Cost Tiers in New Athens
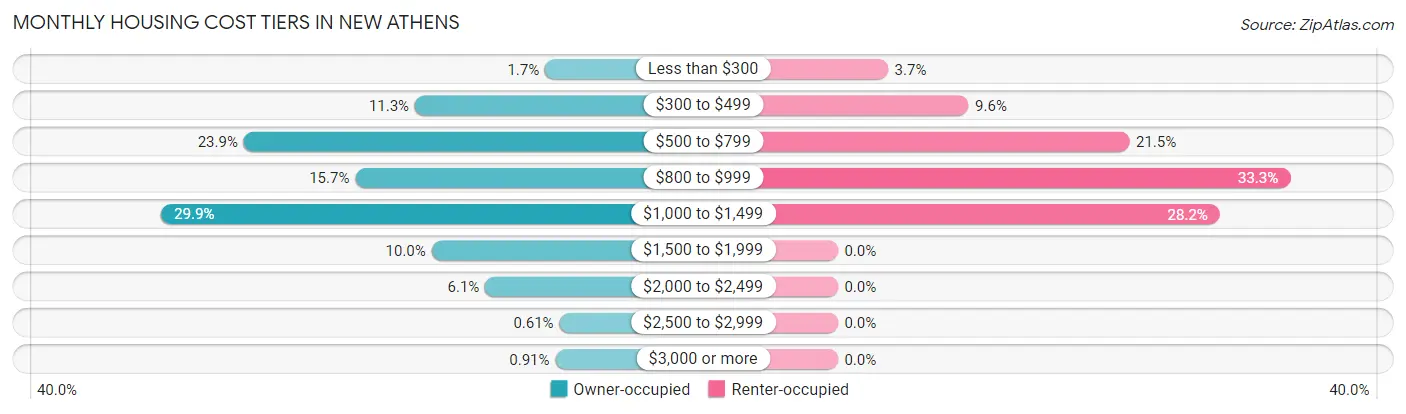
| Monthly Cost | Owner-occupied | Renter-occupied |
| Less than $300 | 11 (1.7%) | 5 (3.7%) |
| $300 to $499 | 74 (11.3%) | 13 (9.6%) |
| $500 to $799 | 157 (23.9%) | 29 (21.5%) |
| $800 to $999 | 103 (15.7%) | 45 (33.3%) |
| $1,000 to $1,499 | 197 (29.9%) | 38 (28.1%) |
| $1,500 to $1,999 | 66 (10.0%) | 0 (0.0%) |
| $2,000 to $2,499 | 40 (6.1%) | 0 (0.0%) |
| $2,500 to $2,999 | 4 (0.6%) | 0 (0.0%) |
| $3,000 or more | 6 (0.9%) | 0 (0.0%) |
| Total | 658 (100.0%) | 135 (100.0%) |
Physical Housing Characteristics in New Athens
Housing Structures in New Athens
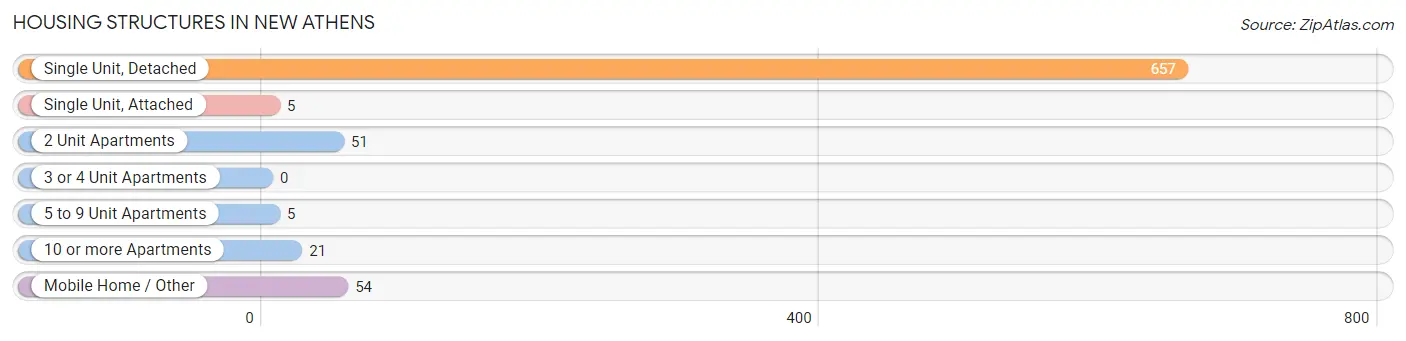
| Structure Type | # Housing Units | % Housing Units |
| Single Unit, Detached | 657 | 82.9% |
| Single Unit, Attached | 5 | 0.6% |
| 2 Unit Apartments | 51 | 6.4% |
| 3 or 4 Unit Apartments | 0 | 0.0% |
| 5 to 9 Unit Apartments | 5 | 0.6% |
| 10 or more Apartments | 21 | 2.6% |
| Mobile Home / Other | 54 | 6.8% |
| Total | 793 | 100.0% |
Housing Structures by Occupancy in New Athens
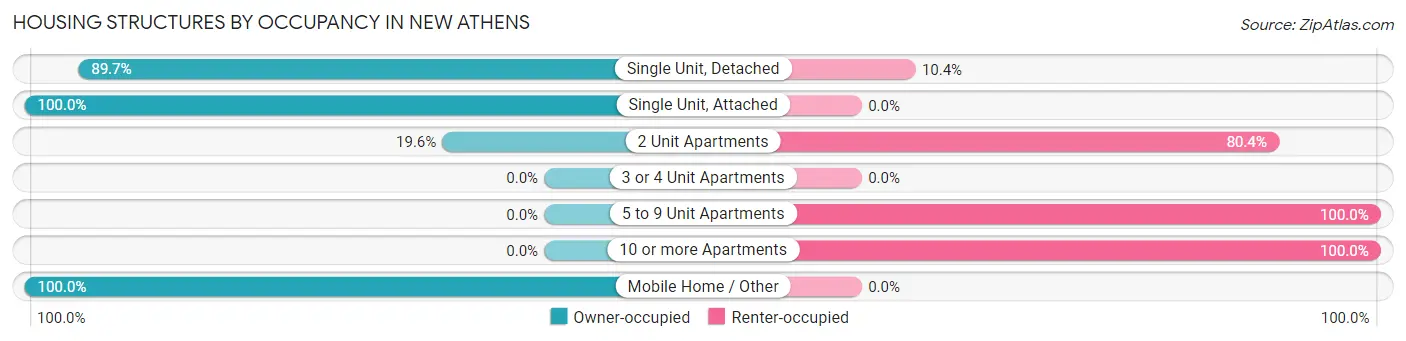
| Structure Type | Owner-occupied | Renter-occupied |
| Single Unit, Detached | 589 (89.6%) | 68 (10.3%) |
| Single Unit, Attached | 5 (100.0%) | 0 (0.0%) |
| 2 Unit Apartments | 10 (19.6%) | 41 (80.4%) |
| 3 or 4 Unit Apartments | 0 (0.0%) | 0 (0.0%) |
| 5 to 9 Unit Apartments | 0 (0.0%) | 5 (100.0%) |
| 10 or more Apartments | 0 (0.0%) | 21 (100.0%) |
| Mobile Home / Other | 54 (100.0%) | 0 (0.0%) |
| Total | 658 (83.0%) | 135 (17.0%) |
Housing Structures by Number of Rooms in New Athens
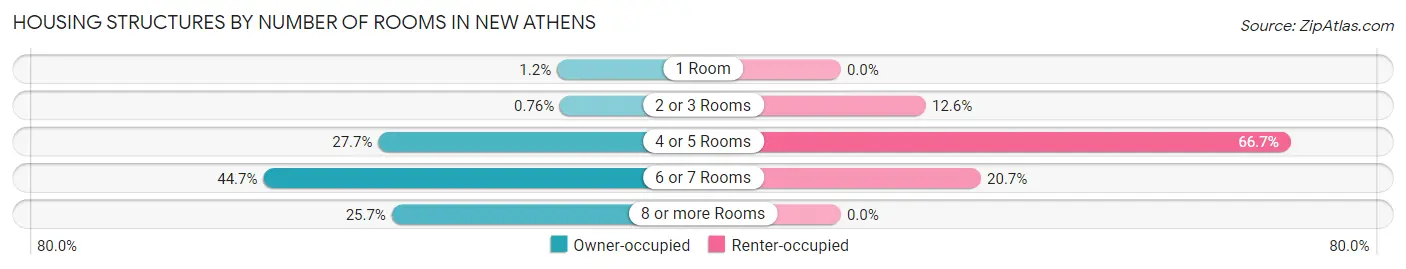
| Number of Rooms | Owner-occupied | Renter-occupied |
| 1 Room | 8 (1.2%) | 0 (0.0%) |
| 2 or 3 Rooms | 5 (0.8%) | 17 (12.6%) |
| 4 or 5 Rooms | 182 (27.7%) | 90 (66.7%) |
| 6 or 7 Rooms | 294 (44.7%) | 28 (20.7%) |
| 8 or more Rooms | 169 (25.7%) | 0 (0.0%) |
| Total | 658 (100.0%) | 135 (100.0%) |
Housing Structure by Heating Type in New Athens
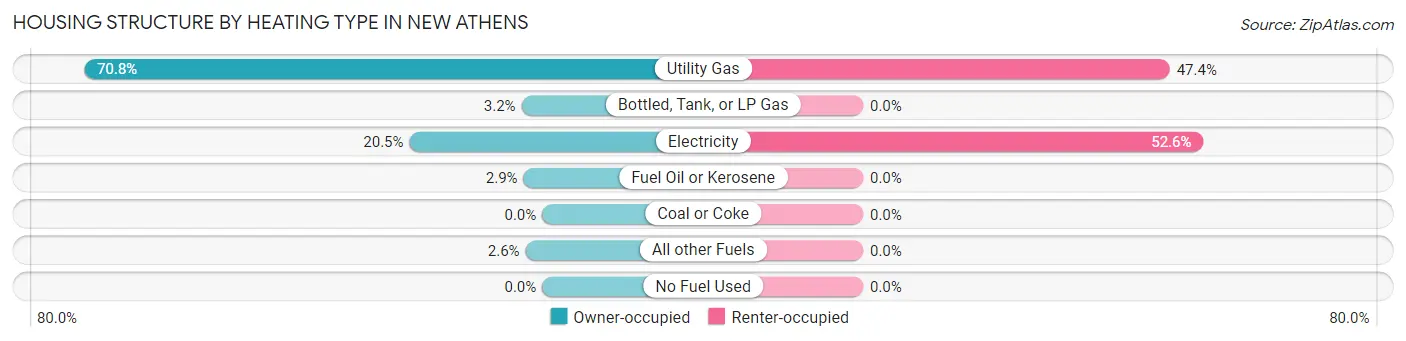
| Heating Type | Owner-occupied | Renter-occupied |
| Utility Gas | 466 (70.8%) | 64 (47.4%) |
| Bottled, Tank, or LP Gas | 21 (3.2%) | 0 (0.0%) |
| Electricity | 135 (20.5%) | 71 (52.6%) |
| Fuel Oil or Kerosene | 19 (2.9%) | 0 (0.0%) |
| Coal or Coke | 0 (0.0%) | 0 (0.0%) |
| All other Fuels | 17 (2.6%) | 0 (0.0%) |
| No Fuel Used | 0 (0.0%) | 0 (0.0%) |
| Total | 658 (100.0%) | 135 (100.0%) |
Household Vehicle Usage in New Athens
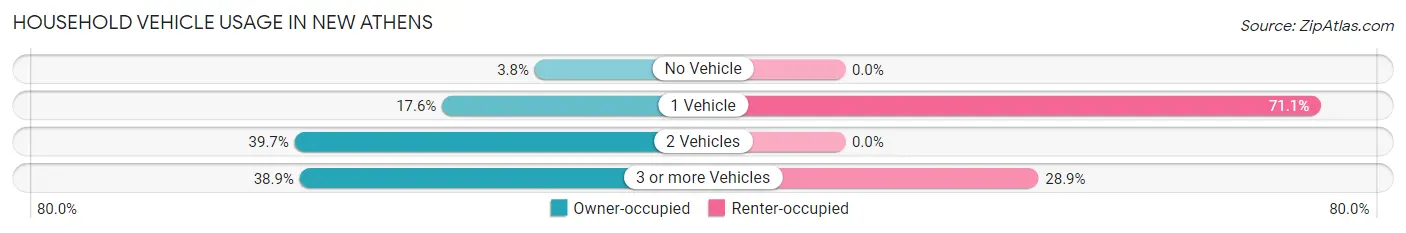
| Vehicles per Household | Owner-occupied | Renter-occupied |
| No Vehicle | 25 (3.8%) | 0 (0.0%) |
| 1 Vehicle | 116 (17.6%) | 96 (71.1%) |
| 2 Vehicles | 261 (39.7%) | 0 (0.0%) |
| 3 or more Vehicles | 256 (38.9%) | 39 (28.9%) |
| Total | 658 (100.0%) | 135 (100.0%) |
Real Estate & Mortgages in New Athens
Real Estate and Mortgage Overview in New Athens
| Characteristic | Without Mortgage | With Mortgage |
| Housing Units | 272 | 386 |
| Median Property Value | $131,400 | $112,300 |
| Median Household Income | $54,643 | $78 |
| Monthly Housing Costs | $600 | $6 |
| Real Estate Taxes | $3,043 | $0 |
Property Value by Mortgage Status in New Athens
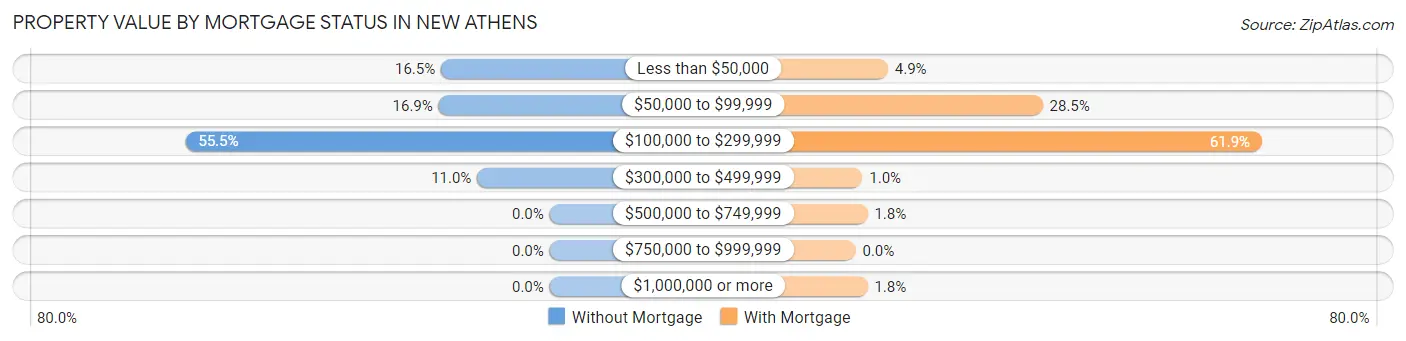
| Property Value | Without Mortgage | With Mortgage |
| Less than $50,000 | 45 (16.5%) | 19 (4.9%) |
| $50,000 to $99,999 | 46 (16.9%) | 110 (28.5%) |
| $100,000 to $299,999 | 151 (55.5%) | 239 (61.9%) |
| $300,000 to $499,999 | 30 (11.0%) | 4 (1.0%) |
| $500,000 to $749,999 | 0 (0.0%) | 7 (1.8%) |
| $750,000 to $999,999 | 0 (0.0%) | 0 (0.0%) |
| $1,000,000 or more | 0 (0.0%) | 7 (1.8%) |
| Total | 272 (100.0%) | 386 (100.0%) |
Household Income by Mortgage Status in New Athens
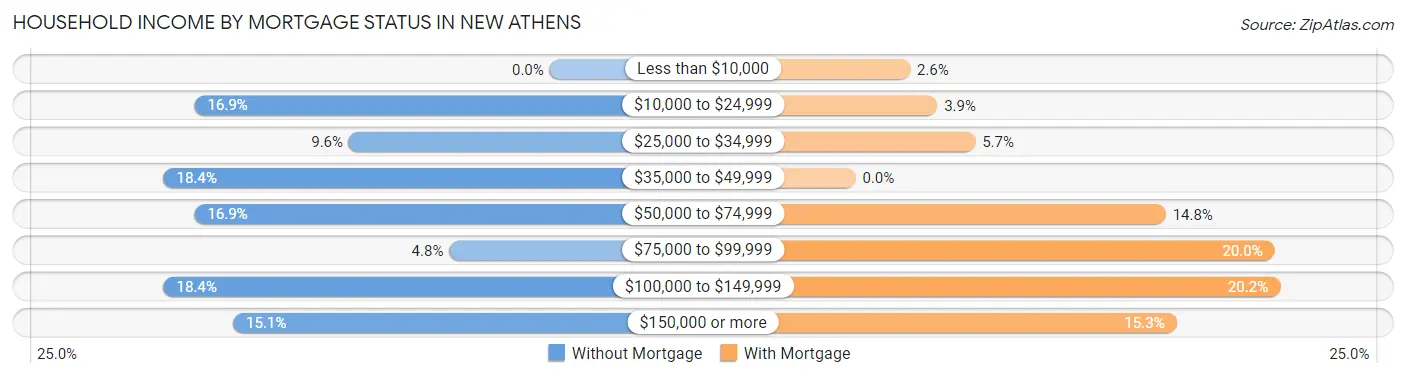
| Household Income | Without Mortgage | With Mortgage |
| Less than $10,000 | 0 (0.0%) | 10 (2.6%) |
| $10,000 to $24,999 | 46 (16.9%) | 15 (3.9%) |
| $25,000 to $34,999 | 26 (9.6%) | 22 (5.7%) |
| $35,000 to $49,999 | 50 (18.4%) | 0 (0.0%) |
| $50,000 to $74,999 | 46 (16.9%) | 57 (14.8%) |
| $75,000 to $99,999 | 13 (4.8%) | 77 (20.0%) |
| $100,000 to $149,999 | 50 (18.4%) | 78 (20.2%) |
| $150,000 or more | 41 (15.1%) | 59 (15.3%) |
| Total | 272 (100.0%) | 386 (100.0%) |
Property Value to Household Income Ratio in New Athens
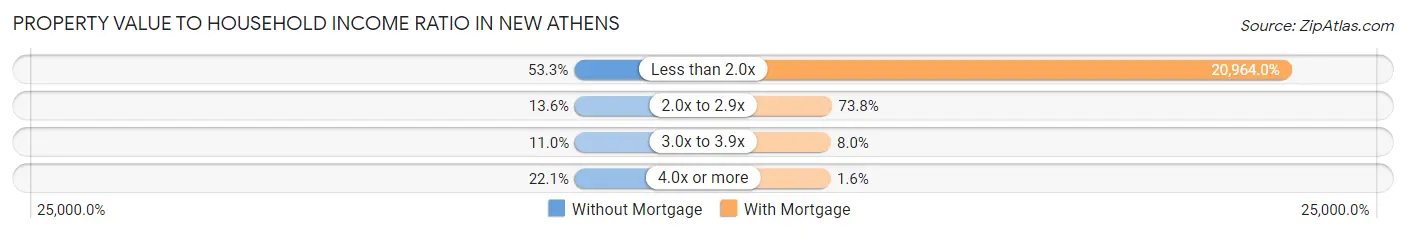
| Value-to-Income Ratio | Without Mortgage | With Mortgage |
| Less than 2.0x | 145 (53.3%) | 80,921 (20,964.0%) |
| 2.0x to 2.9x | 37 (13.6%) | 285 (73.8%) |
| 3.0x to 3.9x | 30 (11.0%) | 31 (8.0%) |
| 4.0x or more | 60 (22.1%) | 6 (1.5%) |
| Total | 272 (100.0%) | 386 (100.0%) |
Real Estate Taxes by Mortgage Status in New Athens
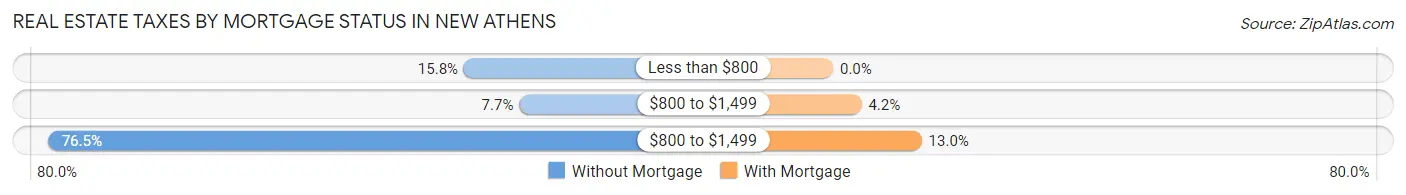
| Property Taxes | Without Mortgage | With Mortgage |
| Less than $800 | 43 (15.8%) | 0 (0.0%) |
| $800 to $1,499 | 21 (7.7%) | 16 (4.2%) |
| $800 to $1,499 | 208 (76.5%) | 50 (13.0%) |
| Total | 272 (100.0%) | 386 (100.0%) |
Health & Disability in New Athens
Health Insurance Coverage by Age in New Athens
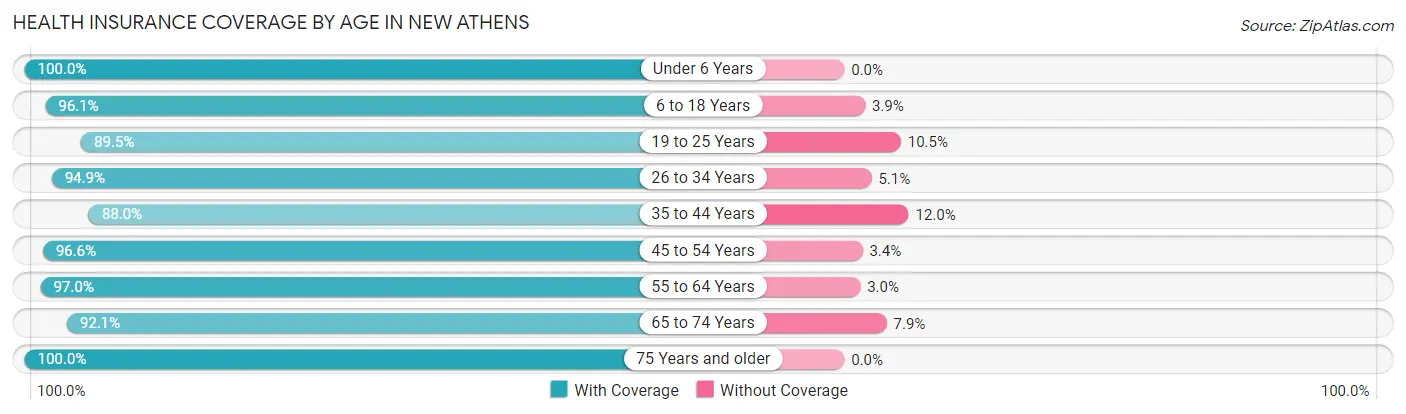
| Age Bracket | With Coverage | Without Coverage |
| Under 6 Years | 133 (100.0%) | 0 (0.0%) |
| 6 to 18 Years | 324 (96.1%) | 13 (3.9%) |
| 19 to 25 Years | 102 (89.5%) | 12 (10.5%) |
| 26 to 34 Years | 150 (94.9%) | 8 (5.1%) |
| 35 to 44 Years | 294 (88.0%) | 40 (12.0%) |
| 45 to 54 Years | 171 (96.6%) | 6 (3.4%) |
| 55 to 64 Years | 261 (97.0%) | 8 (3.0%) |
| 65 to 74 Years | 175 (92.1%) | 15 (7.9%) |
| 75 Years and older | 189 (100.0%) | 0 (0.0%) |
| Total | 1,799 (94.6%) | 102 (5.4%) |
Health Insurance Coverage by Citizenship Status in New Athens
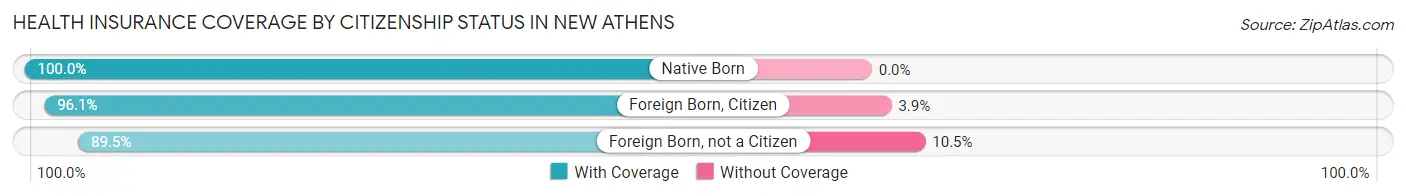
| Citizenship Status | With Coverage | Without Coverage |
| Native Born | 133 (100.0%) | 0 (0.0%) |
| Foreign Born, Citizen | 324 (96.1%) | 13 (3.9%) |
| Foreign Born, not a Citizen | 102 (89.5%) | 12 (10.5%) |
Health Insurance Coverage by Household Income in New Athens
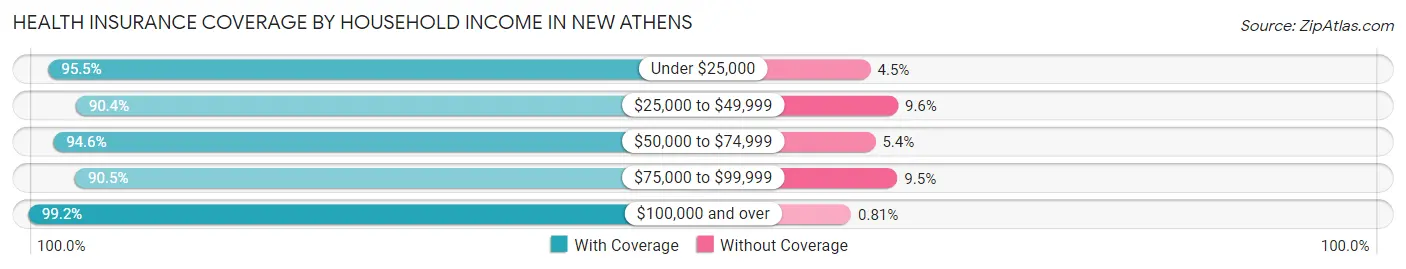
| Household Income | With Coverage | Without Coverage |
| Under $25,000 | 214 (95.5%) | 10 (4.5%) |
| $25,000 to $49,999 | 292 (90.4%) | 31 (9.6%) |
| $50,000 to $74,999 | 317 (94.6%) | 18 (5.4%) |
| $75,000 to $99,999 | 363 (90.5%) | 38 (9.5%) |
| $100,000 and over | 613 (99.2%) | 5 (0.8%) |
Public vs Private Health Insurance Coverage by Age in New Athens
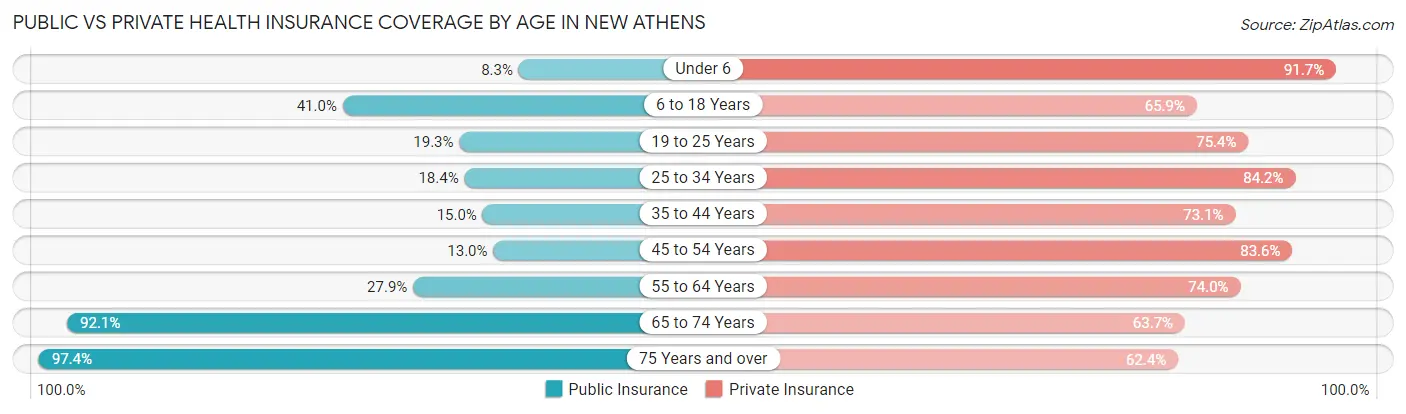
| Age Bracket | Public Insurance | Private Insurance |
| Under 6 | 11 (8.3%) | 122 (91.7%) |
| 6 to 18 Years | 138 (40.9%) | 222 (65.9%) |
| 19 to 25 Years | 22 (19.3%) | 86 (75.4%) |
| 25 to 34 Years | 29 (18.3%) | 133 (84.2%) |
| 35 to 44 Years | 50 (15.0%) | 244 (73.1%) |
| 45 to 54 Years | 23 (13.0%) | 148 (83.6%) |
| 55 to 64 Years | 75 (27.9%) | 199 (74.0%) |
| 65 to 74 Years | 175 (92.1%) | 121 (63.7%) |
| 75 Years and over | 184 (97.4%) | 118 (62.4%) |
| Total | 707 (37.2%) | 1,393 (73.3%) |
Disability Status by Sex by Age in New Athens
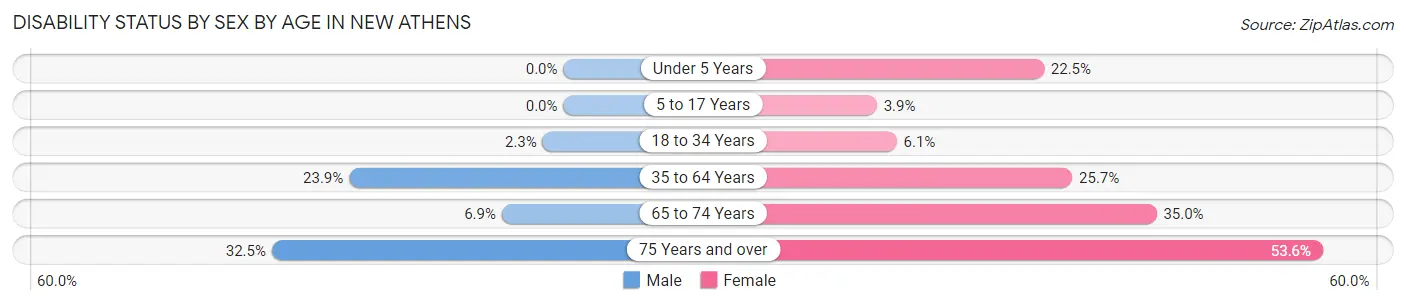
| Age Bracket | Male | Female |
| Under 5 Years | 0 (0.0%) | 9 (22.5%) |
| 5 to 17 Years | 0 (0.0%) | 7 (3.9%) |
| 18 to 34 Years | 3 (2.3%) | 10 (6.1%) |
| 35 to 64 Years | 94 (23.9%) | 99 (25.7%) |
| 65 to 74 Years | 5 (6.9%) | 41 (35.0%) |
| 75 Years and over | 25 (32.5%) | 60 (53.6%) |
Disability Class by Sex by Age in New Athens
Disability Class: Hearing Difficulty
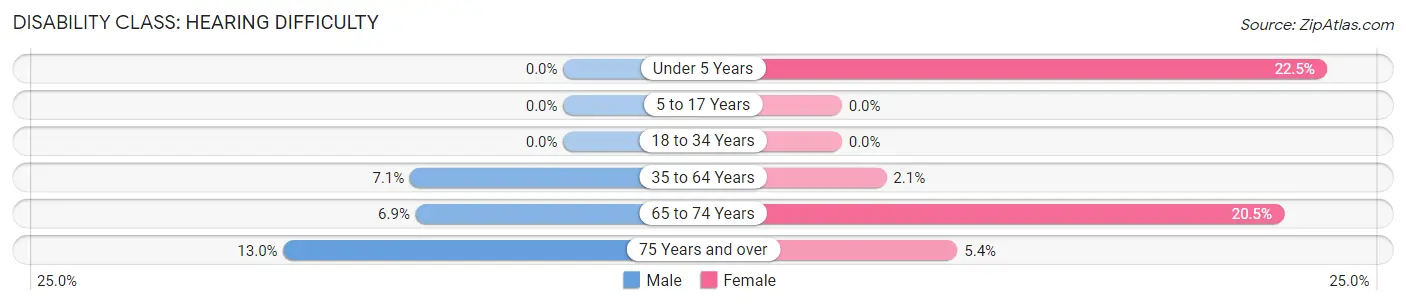
| Age Bracket | Male | Female |
| Under 5 Years | 0 (0.0%) | 9 (22.5%) |
| 5 to 17 Years | 0 (0.0%) | 0 (0.0%) |
| 18 to 34 Years | 0 (0.0%) | 0 (0.0%) |
| 35 to 64 Years | 28 (7.1%) | 8 (2.1%) |
| 65 to 74 Years | 5 (6.9%) | 24 (20.5%) |
| 75 Years and over | 10 (13.0%) | 6 (5.4%) |
Disability Class: Vision Difficulty
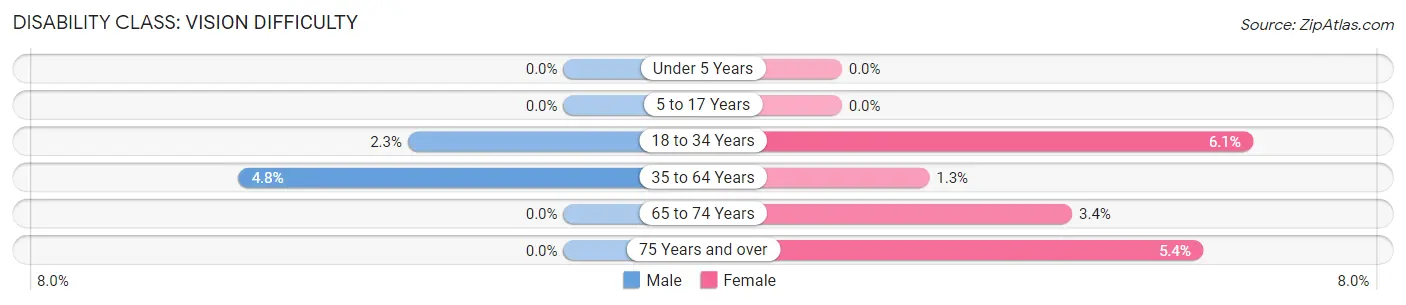
| Age Bracket | Male | Female |
| Under 5 Years | 0 (0.0%) | 0 (0.0%) |
| 5 to 17 Years | 0 (0.0%) | 0 (0.0%) |
| 18 to 34 Years | 3 (2.3%) | 10 (6.1%) |
| 35 to 64 Years | 19 (4.8%) | 5 (1.3%) |
| 65 to 74 Years | 0 (0.0%) | 4 (3.4%) |
| 75 Years and over | 0 (0.0%) | 6 (5.4%) |
Disability Class: Cognitive Difficulty
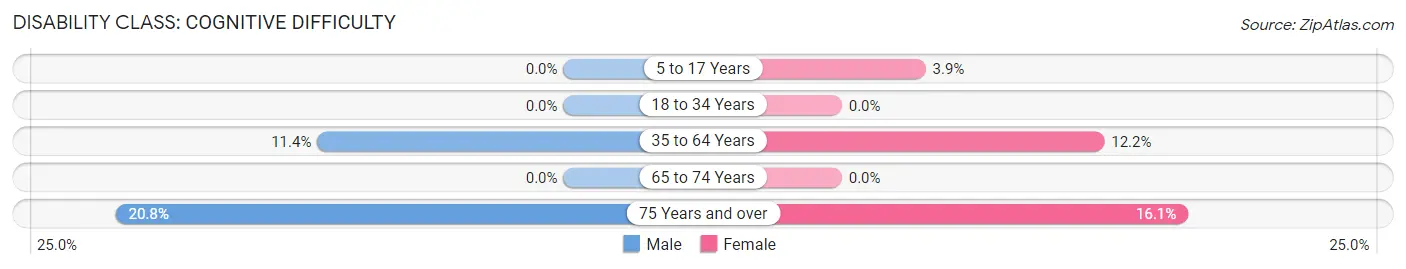
| Age Bracket | Male | Female |
| 5 to 17 Years | 0 (0.0%) | 7 (3.9%) |
| 18 to 34 Years | 0 (0.0%) | 0 (0.0%) |
| 35 to 64 Years | 45 (11.4%) | 47 (12.2%) |
| 65 to 74 Years | 0 (0.0%) | 0 (0.0%) |
| 75 Years and over | 16 (20.8%) | 18 (16.1%) |
Disability Class: Ambulatory Difficulty
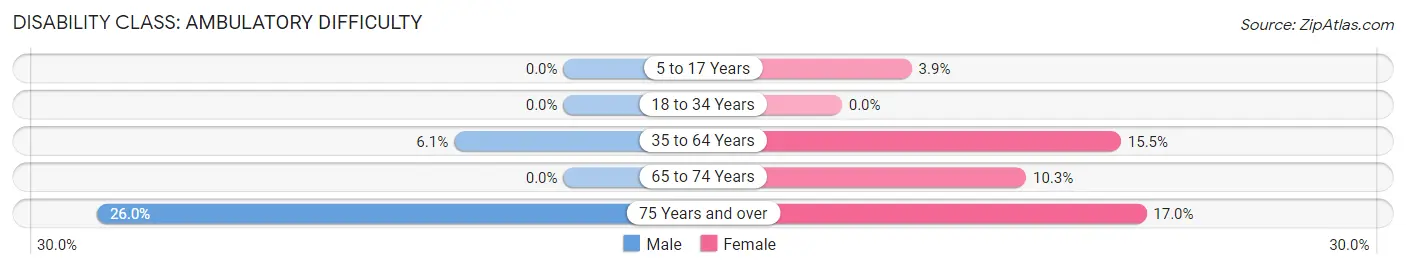
| Age Bracket | Male | Female |
| 5 to 17 Years | 0 (0.0%) | 7 (3.9%) |
| 18 to 34 Years | 0 (0.0%) | 0 (0.0%) |
| 35 to 64 Years | 24 (6.1%) | 60 (15.5%) |
| 65 to 74 Years | 0 (0.0%) | 12 (10.3%) |
| 75 Years and over | 20 (26.0%) | 19 (17.0%) |
Disability Class: Self-Care Difficulty

| Age Bracket | Male | Female |
| 5 to 17 Years | 0 (0.0%) | 0 (0.0%) |
| 18 to 34 Years | 0 (0.0%) | 0 (0.0%) |
| 35 to 64 Years | 0 (0.0%) | 6 (1.5%) |
| 65 to 74 Years | 0 (0.0%) | 4 (3.4%) |
| 75 Years and over | 5 (6.5%) | 9 (8.0%) |
Technology Access in New Athens
Computing Device Access in New Athens
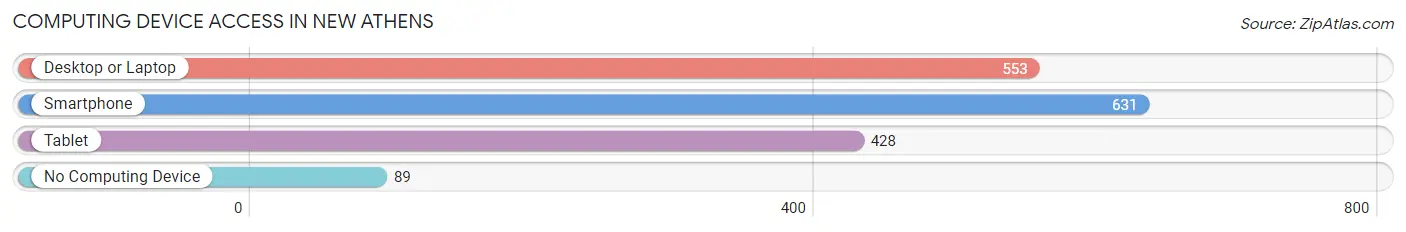
| Device Type | # Households | % Households |
| Desktop or Laptop | 553 | 69.7% |
| Smartphone | 631 | 79.6% |
| Tablet | 428 | 54.0% |
| No Computing Device | 89 | 11.2% |
| Total | 793 | 100.0% |
Internet Access in New Athens
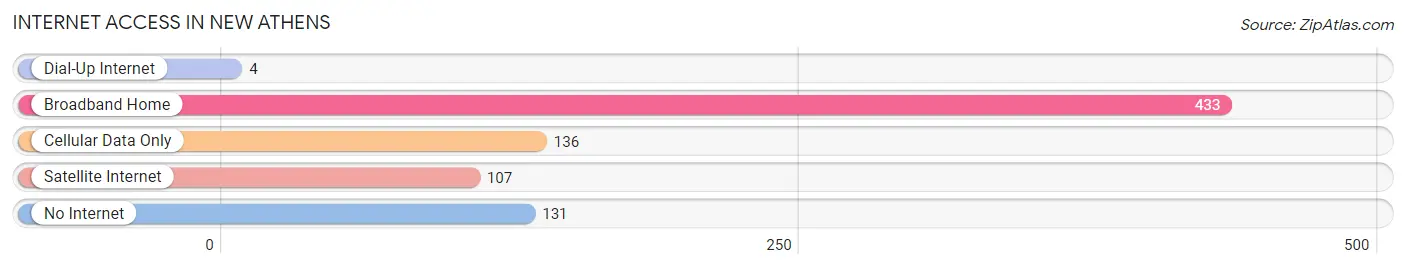
| Internet Type | # Households | % Households |
| Dial-Up Internet | 4 | 0.5% |
| Broadband Home | 433 | 54.6% |
| Cellular Data Only | 136 | 17.2% |
| Satellite Internet | 107 | 13.5% |
| No Internet | 131 | 16.5% |
| Total | 793 | 100.0% |
New Athens Summary
New Athens, Illinois is a small village located in St. Clair County, Illinois. It is situated about 25 miles east of St. Louis, Missouri and is part of the Metro-East region of the Greater St. Louis metropolitan area. The village has a population of 1,717 people, according to the 2010 census.
History
New Athens was founded in 1819 by a group of German immigrants led by John Jacoby. The village was originally named “New Athens” after the ancient Greek city of Athens. The village was incorporated in 1836 and was the first village in St. Clair County to be incorporated.
The village was a major center of German culture in the 19th century. Many of the original settlers were of German descent and the village was home to several German-language newspapers. The village was also home to a large number of German-American churches.
Geography
New Athens is located in the southwestern corner of St. Clair County, Illinois. It is situated about 25 miles east of St. Louis, Missouri and is part of the Metro-East region of the Greater St. Louis metropolitan area. The village is located on the banks of the Kaskaskia River and is surrounded by rolling hills and farmland.
The village has a total area of 1.2 square miles, all of which is land. The village is located at an elevation of 645 feet above sea level.
Economy
The economy of New Athens is largely based on agriculture and manufacturing. The village is home to several small businesses, including a grocery store, a hardware store, and a few restaurants. The village is also home to several small manufacturing companies, including a metal fabrication plant and a plastics manufacturing plant.
The village is also home to a number of small farms, which produce a variety of crops, including corn, soybeans, and wheat. The village is also home to a number of wineries, which produce a variety of wines.
Demographics
As of the 2010 census, the village had a population of 1,717 people. The racial makeup of the village was 97.2% White, 0.7% African American, 0.2% Native American, 0.2% Asian, 0.1% Pacific Islander, 0.7% from other races, and 0.9% from two or more races. Hispanic or Latino of any race were 1.7% of the population.
The median income for a household in the village was $45,938, and the median income for a family was $51,250. The per capita income for the village was $20,945. About 8.2% of families and 10.2% of the population were below the poverty line, including 14.2% of those under age 18 and 5.2% of those age 65 or over.
New Athens is a small village with a rich history and a strong sense of community. The village is home to a variety of businesses and industries, and is a great place to live and work. The village is also home to a number of wineries, which produce a variety of wines. The village is a great place to visit and explore, and is a great place to call home.
Common Questions
What is Per Capita Income in New Athens?
Per Capita income in New Athens is $32,603.
What is the Median Family Income in New Athens?
Median Family Income in New Athens is $80,184.
What is the Median Household income in New Athens?
Median Household Income in New Athens is $62,639.
What is Income or Wage Gap in New Athens?
Income or Wage Gap in New Athens is 48.3%.
Women in New Athens earn 51.7 cents for every dollar earned by a man.
What is Inequality or Gini Index in New Athens?
Inequality or Gini Index in New Athens is 0.39.
What is the Total Population of New Athens?
Total Population of New Athens is 1,951.
What is the Total Male Population of New Athens?
Total Male Population of New Athens is 926.
What is the Total Female Population of New Athens?
Total Female Population of New Athens is 1,025.
What is the Ratio of Males per 100 Females in New Athens?
There are 90.34 Males per 100 Females in New Athens.
What is the Ratio of Females per 100 Males in New Athens?
There are 110.69 Females per 100 Males in New Athens.
What is the Median Population Age in New Athens?
Median Population Age in New Athens is 41.6 Years.
What is the Average Family Size in New Athens
Average Family Size in New Athens is 2.9 People.
What is the Average Household Size in New Athens
Average Household Size in New Athens is 2.4 People.
How Large is the Labor Force in New Athens?
There are 958 People in the Labor Forcein in New Athens.
What is the Percentage of People in the Labor Force in New Athens?
61.0% of People are in the Labor Force in New Athens.
What is the Unemployment Rate in New Athens?
Unemployment Rate in New Athens is 5.2%.