Jerseyville, IL Map & Demographics
Jerseyville Map
Jerseyville Overview
$32,577
PER CAPITA INCOME
$88,426
AVG FAMILY INCOME
$65,736
AVG HOUSEHOLD INCOME
30.3%
WAGE / INCOME GAP [ % ]
69.7¢/ $1
WAGE / INCOME GAP [ $ ]
0.42
INEQUALITY / GINI INDEX
7,623
TOTAL POPULATION
3,364
MALE POPULATION
4,259
FEMALE POPULATION
78.99
MALES / 100 FEMALES
126.61
FEMALES / 100 MALES
42.2
MEDIAN AGE
3.2
AVG FAMILY SIZE
2.5
AVG HOUSEHOLD SIZE
3,400
LABOR FORCE [ PEOPLE ]
55.8%
PERCENT IN LABOR FORCE
2.7%
UNEMPLOYMENT RATE
Jerseyville Zip Codes
Jerseyville Area Codes
Income in Jerseyville
Income Overview in Jerseyville
Per Capita Income in Jerseyville is $32,577, while median incomes of families and households are $88,426 and $65,736 respectively.
| Characteristic | Number | Measure |
| Per Capita Income | 7,623 | $32,577 |
| Median Family Income | 1,743 | $88,426 |
| Mean Family Income | 1,743 | $104,332 |
| Median Household Income | 2,921 | $65,736 |
| Mean Household Income | 2,921 | $81,879 |
| Income Deficit | 1,743 | $0 |
| Wage / Income Gap (%) | 7,623 | 30.28% |
| Wage / Income Gap ($) | 7,623 | 69.72¢ per $1 |
| Gini / Inequality Index | 7,623 | 0.42 |
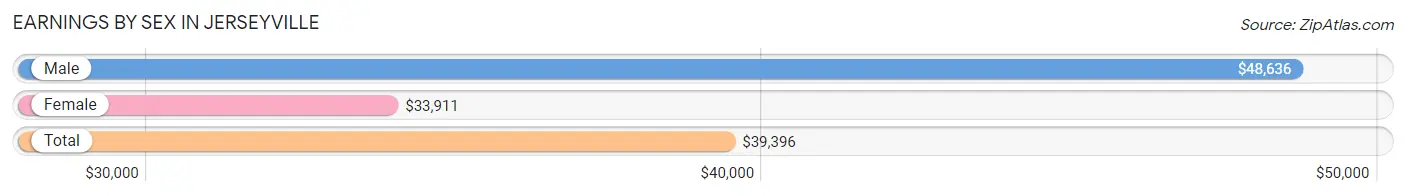
Earnings by Sex in Jerseyville
Average Earnings in Jerseyville are $39,396, $48,636 for men and $33,911 for women, a difference of 30.3%.
| Sex | Number | Average Earnings |
| Male | 1,896 (50.8%) | $48,636 |
| Female | 1,839 (49.2%) | $33,911 |
| Total | 3,735 (100.0%) | $39,396 |
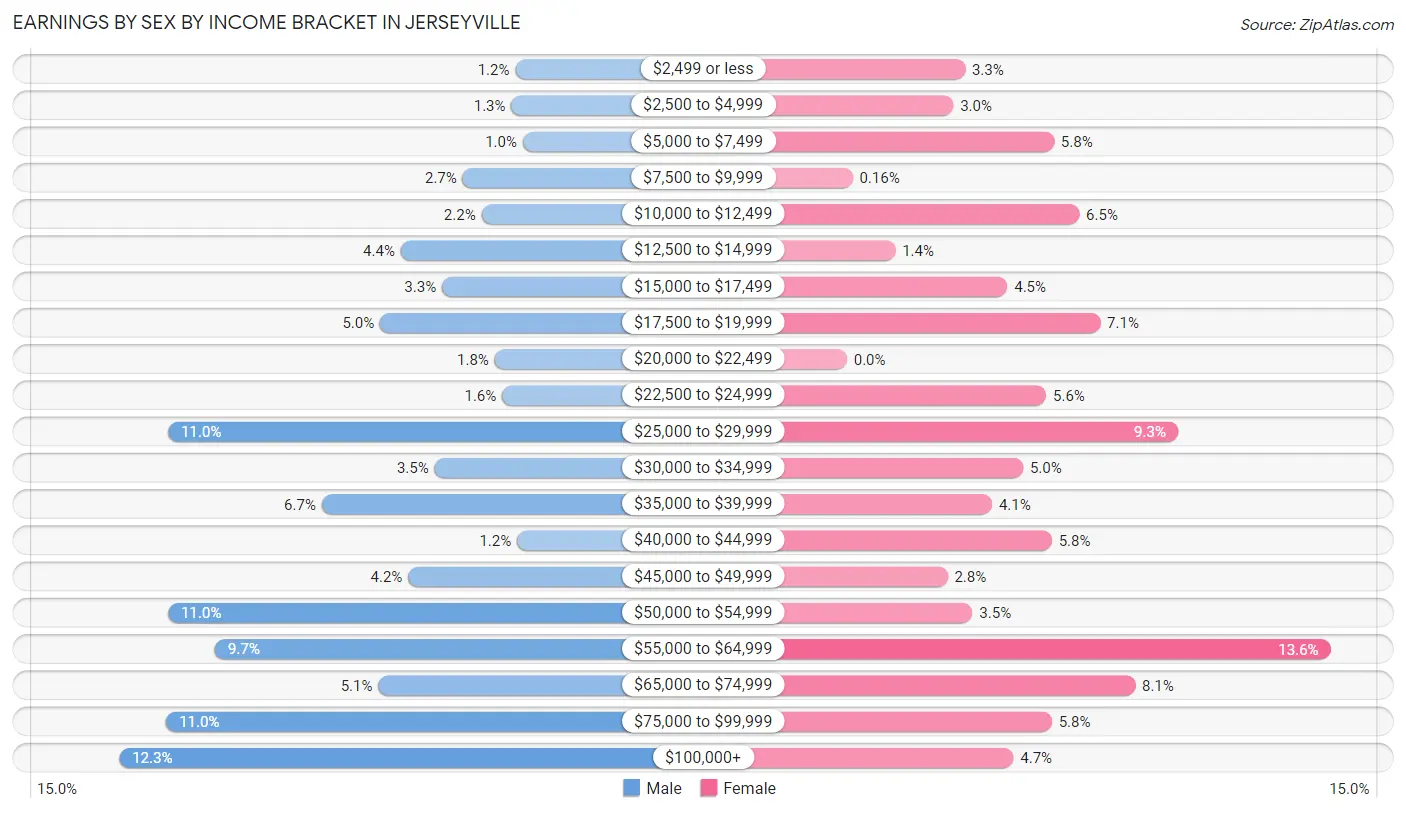
Earnings by Sex by Income Bracket in Jerseyville
The most common earnings brackets in Jerseyville are $100,000+ for men (234 | 12.3%) and $55,000 to $64,999 for women (250 | 13.6%).
| Income | Male | Female |
| $2,499 or less | 23 (1.2%) | 61 (3.3%) |
| $2,500 to $4,999 | 25 (1.3%) | 55 (3.0%) |
| $5,000 to $7,499 | 19 (1.0%) | 107 (5.8%) |
| $7,500 to $9,999 | 51 (2.7%) | 3 (0.2%) |
| $10,000 to $12,499 | 41 (2.2%) | 120 (6.5%) |
| $12,500 to $14,999 | 84 (4.4%) | 25 (1.4%) |
| $15,000 to $17,499 | 62 (3.3%) | 83 (4.5%) |
| $17,500 to $19,999 | 95 (5.0%) | 131 (7.1%) |
| $20,000 to $22,499 | 34 (1.8%) | 0 (0.0%) |
| $22,500 to $24,999 | 30 (1.6%) | 103 (5.6%) |
| $25,000 to $29,999 | 208 (11.0%) | 171 (9.3%) |
| $30,000 to $34,999 | 66 (3.5%) | 91 (5.0%) |
| $35,000 to $39,999 | 126 (6.7%) | 75 (4.1%) |
| $40,000 to $44,999 | 22 (1.2%) | 106 (5.8%) |
| $45,000 to $49,999 | 80 (4.2%) | 52 (2.8%) |
| $50,000 to $54,999 | 208 (11.0%) | 65 (3.5%) |
| $55,000 to $64,999 | 183 (9.7%) | 250 (13.6%) |
| $65,000 to $74,999 | 96 (5.1%) | 149 (8.1%) |
| $75,000 to $99,999 | 209 (11.0%) | 106 (5.8%) |
| $100,000+ | 234 (12.3%) | 86 (4.7%) |
| Total | 1,896 (100.0%) | 1,839 (100.0%) |
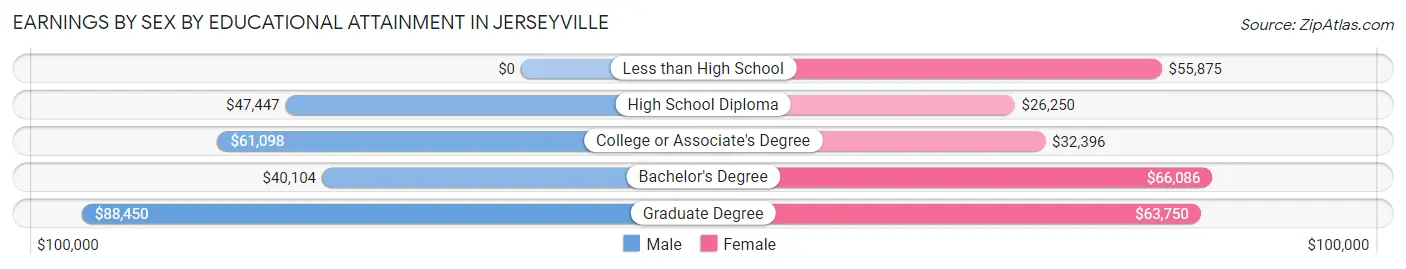
Earnings by Sex by Educational Attainment in Jerseyville
Average earnings in Jerseyville are $53,871 for men and $37,139 for women, a difference of 31.1%. Men with an educational attainment of graduate degree enjoy the highest average annual earnings of $88,450, while those with bachelor's degree education earn the least with $40,104. Women with an educational attainment of bachelor's degree earn the most with the average annual earnings of $66,086, while those with high school diploma education have the smallest earnings of $26,250.
| Educational Attainment | Male Income | Female Income |
| Less than High School | - | - |
| High School Diploma | $47,447 | $26,250 |
| College or Associate's Degree | $61,098 | $32,396 |
| Bachelor's Degree | $40,104 | $66,086 |
| Graduate Degree | $88,450 | $63,750 |
| Total | $53,871 | $37,139 |
Family Income in Jerseyville
Family Income Brackets in Jerseyville
According to the Jerseyville family income data, there are 390 families falling into the $100,000 to $149,999 income range, which is the most common income bracket and makes up 22.4% of all families.
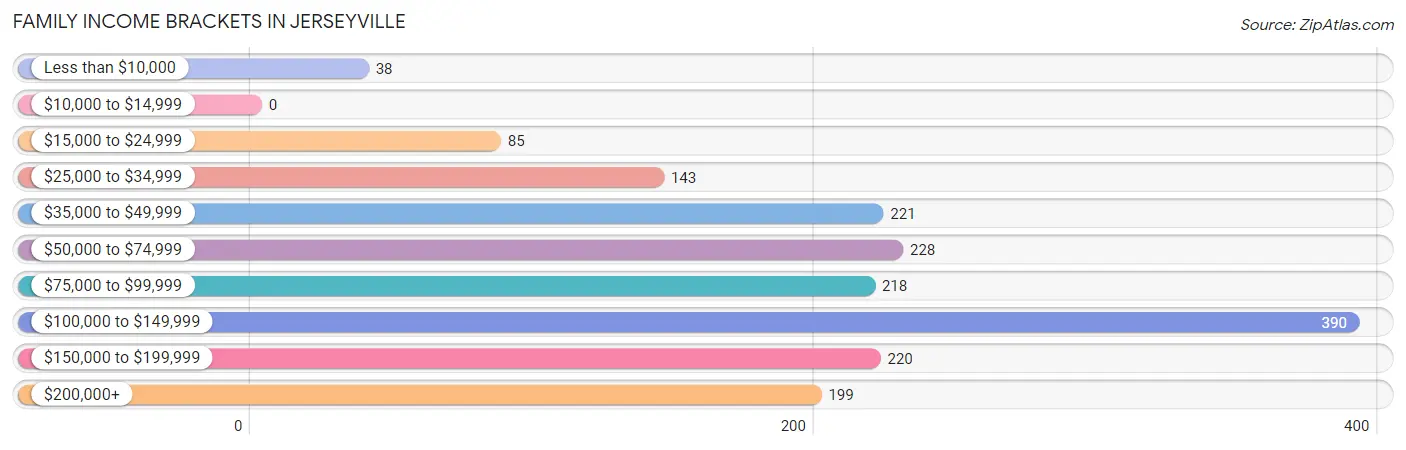
| Income Bracket | # Families | % Families |
| Less than $10,000 | 38 | 2.2% |
| $10,000 to $14,999 | 0 | 0.0% |
| $15,000 to $24,999 | 85 | 4.9% |
| $25,000 to $34,999 | 143 | 8.2% |
| $35,000 to $49,999 | 221 | 12.7% |
| $50,000 to $74,999 | 228 | 13.1% |
| $75,000 to $99,999 | 218 | 12.5% |
| $100,000 to $149,999 | 390 | 22.4% |
| $150,000 to $199,999 | 220 | 12.6% |
| $200,000+ | 199 | 11.4% |
Family Income by Famaliy Size in Jerseyville
6-person families (77 | 4.4%) account for the highest median family income in Jerseyville with $250,001 per family, while 6-person families (77 | 4.4%) have the highest median income of $41,667 per family member.
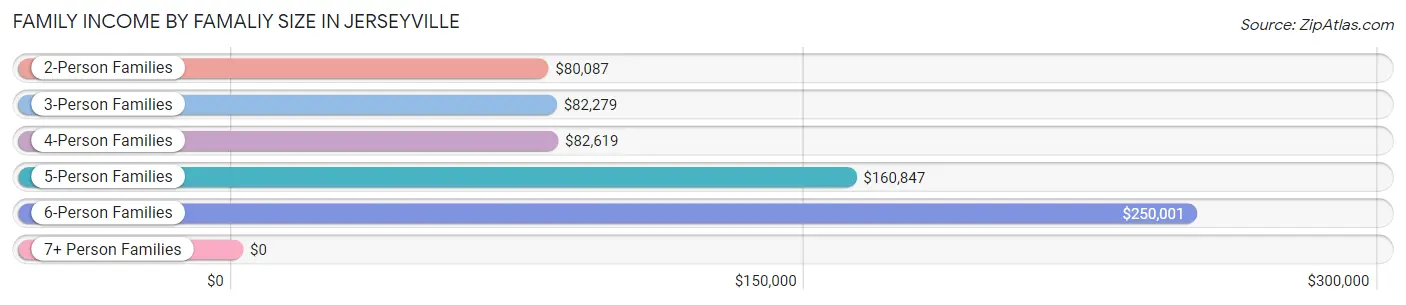
| Income Bracket | # Families | Median Income |
| 2-Person Families | 851 (48.8%) | $80,087 |
| 3-Person Families | 397 (22.8%) | $82,279 |
| 4-Person Families | 220 (12.6%) | $82,619 |
| 5-Person Families | 198 (11.4%) | $160,847 |
| 6-Person Families | 77 (4.4%) | $250,001 |
| 7+ Person Families | 0 (0.0%) | $0 |
| Total | 1,743 (100.0%) | $88,426 |
Family Income by Number of Earners in Jerseyville
The median family income in Jerseyville is $88,426, with families comprising 3+ earners (152) having the highest median family income of $245,735, while families with no earners (269) have the lowest median family income of $56,066, accounting for 8.7% and 15.4% of families, respectively.
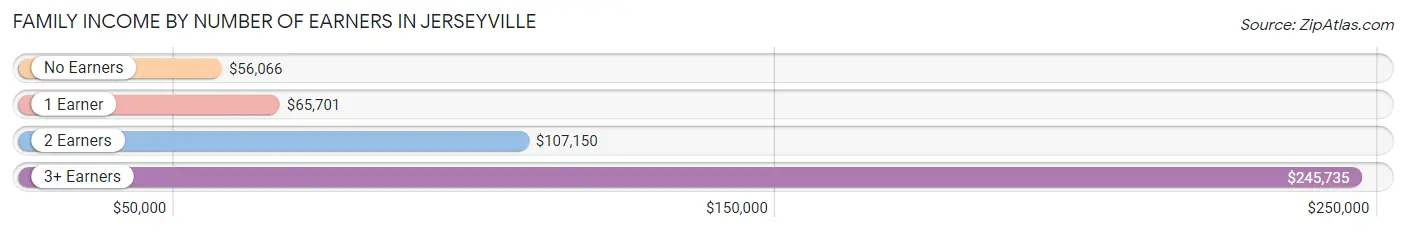
| Number of Earners | # Families | Median Income |
| No Earners | 269 (15.4%) | $56,066 |
| 1 Earner | 646 (37.1%) | $65,701 |
| 2 Earners | 676 (38.8%) | $107,150 |
| 3+ Earners | 152 (8.7%) | $245,735 |
| Total | 1,743 (100.0%) | $88,426 |
Household Income in Jerseyville
Household Income Brackets in Jerseyville
With 535 households falling in the category, the $50,000 to $74,999 income range is the most frequent in Jerseyville, accounting for 18.3% of all households. In contrast, only 47 households (1.6%) fall into the $10,000 to $14,999 income bracket, making it the least populous group.
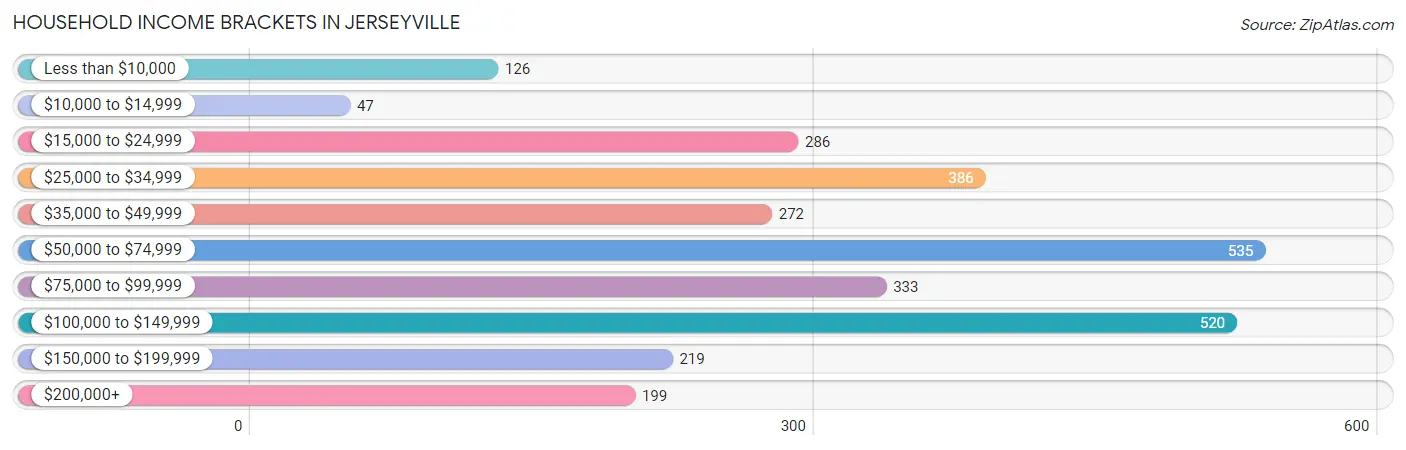
| Income Bracket | # Households | % Households |
| Less than $10,000 | 126 | 4.3% |
| $10,000 to $14,999 | 47 | 1.6% |
| $15,000 to $24,999 | 286 | 9.8% |
| $25,000 to $34,999 | 386 | 13.2% |
| $35,000 to $49,999 | 272 | 9.3% |
| $50,000 to $74,999 | 535 | 18.3% |
| $75,000 to $99,999 | 333 | 11.4% |
| $100,000 to $149,999 | 520 | 17.8% |
| $150,000 to $199,999 | 219 | 7.5% |
| $200,000+ | 199 | 6.8% |
Household Income by Householder Age in Jerseyville
The median household income in Jerseyville is $65,736, with the highest median household income of $71,914 found in the 25 to 44 years age bracket for the primary householder. A total of 841 households (28.8%) fall into this category. Meanwhile, the 65+ years age bracket for the primary householder has the lowest median household income of $46,842, with 892 households (30.5%) in this group.
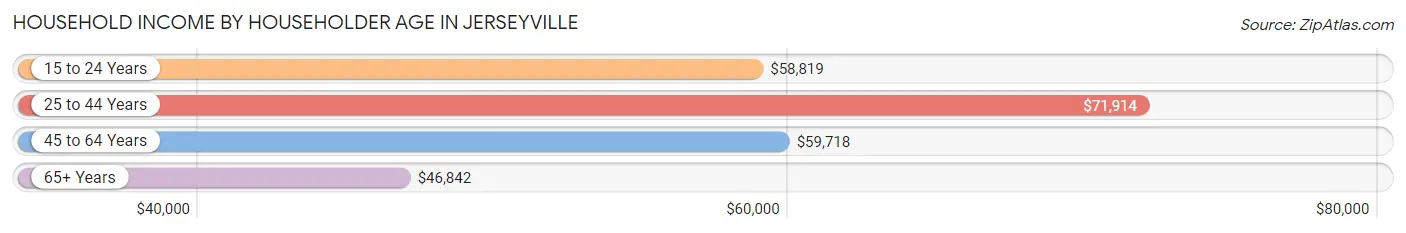
| Income Bracket | # Households | Median Income |
| 15 to 24 Years | 98 (3.4%) | $58,819 |
| 25 to 44 Years | 841 (28.8%) | $71,914 |
| 45 to 64 Years | 1,090 (37.3%) | $59,718 |
| 65+ Years | 892 (30.5%) | $46,842 |
| Total | 2,921 (100.0%) | $65,736 |
Poverty in Jerseyville
Income Below Poverty by Sex and Age in Jerseyville
With 7.7% poverty level for males and 9.9% for females among the residents of Jerseyville, under 5 year old males and 15 year old females are the most vulnerable to poverty, with 88 males (49.2%) and 20 females (62.5%) in their respective age groups living below the poverty level.
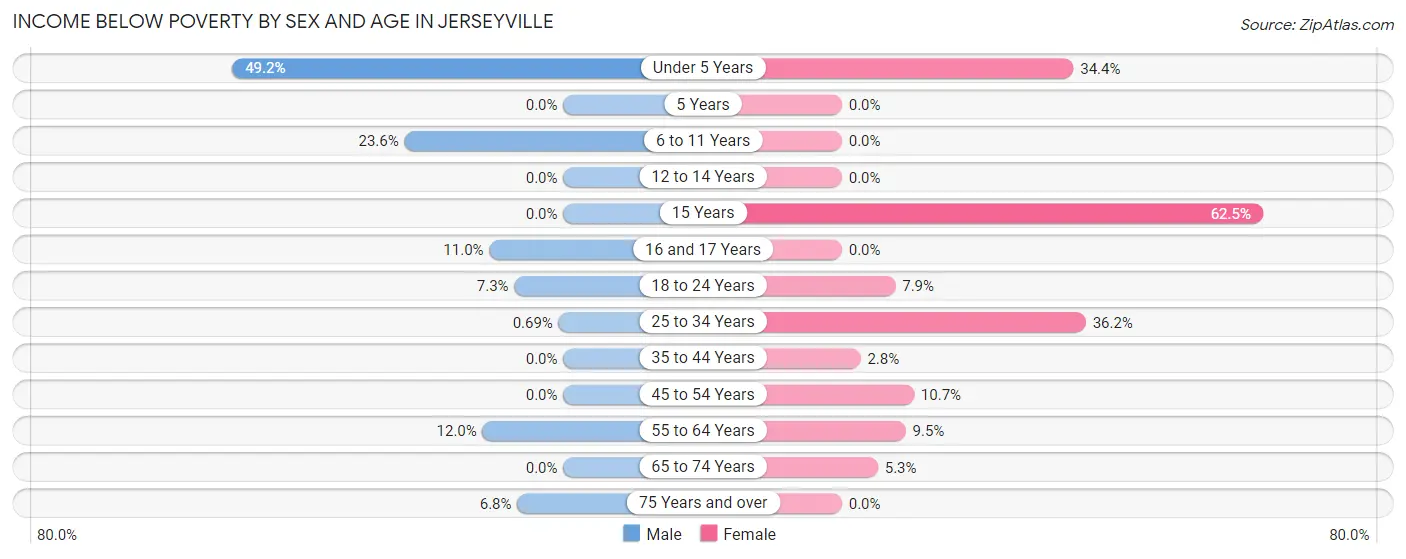
| Age Bracket | Male | Female |
| Under 5 Years | 88 (49.2%) | 66 (34.4%) |
| 5 Years | 0 (0.0%) | 0 (0.0%) |
| 6 to 11 Years | 54 (23.6%) | 0 (0.0%) |
| 12 to 14 Years | 0 (0.0%) | 0 (0.0%) |
| 15 Years | 0 (0.0%) | 20 (62.5%) |
| 16 and 17 Years | 9 (11.0%) | 0 (0.0%) |
| 18 to 24 Years | 22 (7.3%) | 25 (7.9%) |
| 25 to 34 Years | 3 (0.7%) | 138 (36.2%) |
| 35 to 44 Years | 0 (0.0%) | 13 (2.8%) |
| 45 to 54 Years | 0 (0.0%) | 63 (10.7%) |
| 55 to 64 Years | 56 (12.0%) | 57 (9.5%) |
| 65 to 74 Years | 0 (0.0%) | 19 (5.3%) |
| 75 Years and over | 17 (6.8%) | 0 (0.0%) |
| Total | 249 (7.7%) | 401 (9.9%) |
Income Above Poverty by Sex and Age in Jerseyville
According to the poverty statistics in Jerseyville, males aged 5 years and females aged 5 years are the age groups that are most secure financially, with 100.0% of males and 100.0% of females in these age groups living above the poverty line.
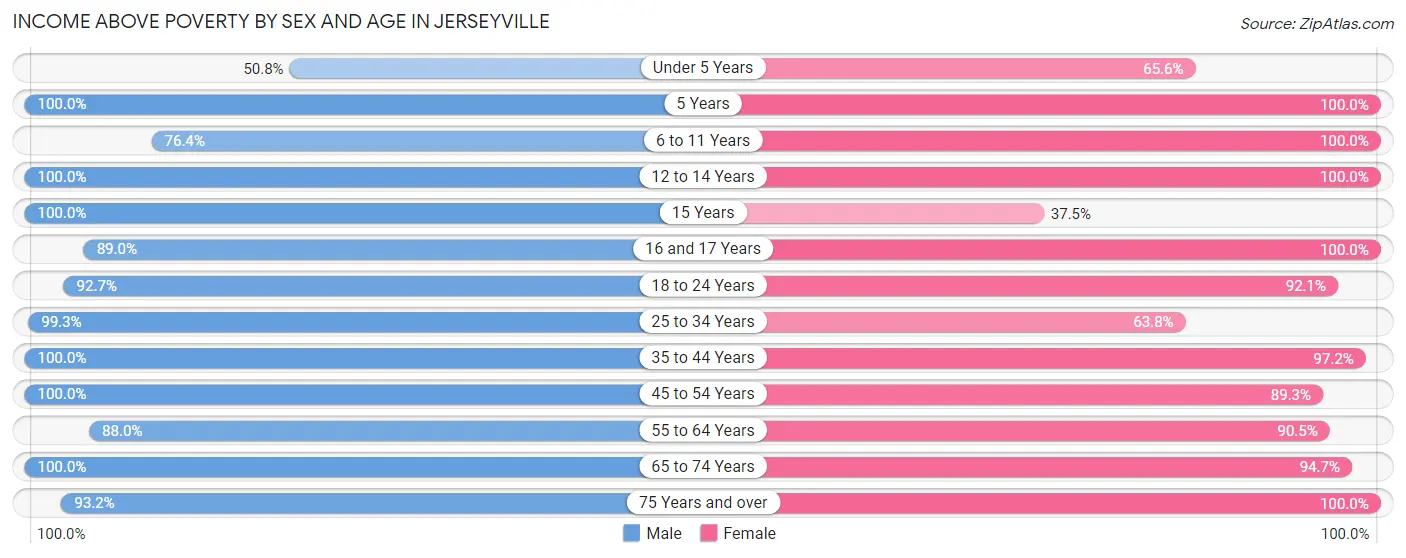
| Age Bracket | Male | Female |
| Under 5 Years | 91 (50.8%) | 126 (65.6%) |
| 5 Years | 23 (100.0%) | 88 (100.0%) |
| 6 to 11 Years | 175 (76.4%) | 246 (100.0%) |
| 12 to 14 Years | 149 (100.0%) | 265 (100.0%) |
| 15 Years | 66 (100.0%) | 12 (37.5%) |
| 16 and 17 Years | 73 (89.0%) | 92 (100.0%) |
| 18 to 24 Years | 281 (92.7%) | 290 (92.1%) |
| 25 to 34 Years | 434 (99.3%) | 243 (63.8%) |
| 35 to 44 Years | 420 (100.0%) | 457 (97.2%) |
| 45 to 54 Years | 341 (100.0%) | 525 (89.3%) |
| 55 to 64 Years | 411 (88.0%) | 544 (90.5%) |
| 65 to 74 Years | 272 (100.0%) | 337 (94.7%) |
| 75 Years and over | 232 (93.2%) | 426 (100.0%) |
| Total | 2,968 (92.3%) | 3,651 (90.1%) |
Income Below Poverty Among Married-Couple Families in Jerseyville
The poverty statistics for married-couple families in Jerseyville show that 1.3% or 16 of the total 1,223 families live below the poverty line. Families with no children have the highest poverty rate of 2.1%, comprising of 16 families. On the other hand, families with 1 or 2 children have the lowest poverty rate of 0.0%, which includes 0 families.
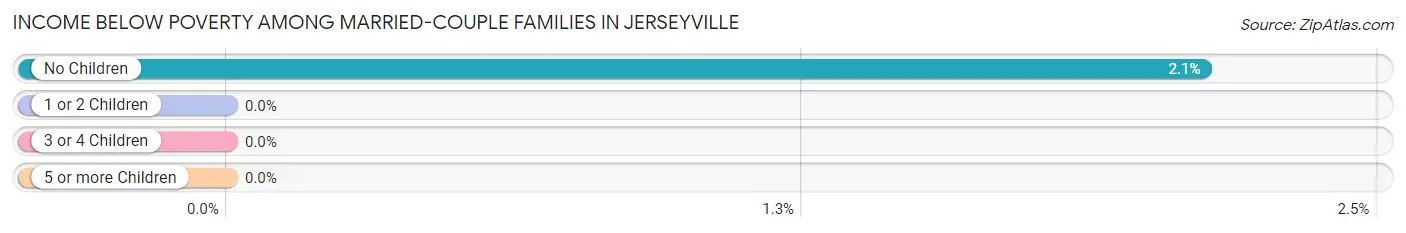
| Children | Above Poverty | Below Poverty |
| No Children | 740 (97.9%) | 16 (2.1%) |
| 1 or 2 Children | 320 (100.0%) | 0 (0.0%) |
| 3 or 4 Children | 147 (100.0%) | 0 (0.0%) |
| 5 or more Children | 0 (0.0%) | 0 (0.0%) |
| Total | 1,207 (98.7%) | 16 (1.3%) |
Income Below Poverty Among Single-Parent Households in Jerseyville
According to the poverty data in Jerseyville, 11.5% or 11 single-father households and 17.7% or 75 single-mother households are living below the poverty line. Among single-father households, those with 1 or 2 children have the highest poverty rate, with 11 households (14.7%) experiencing poverty. Likewise, among single-mother households, those with 3 or 4 children have the highest poverty rate, with 51 households (100.0%) falling below the poverty line.
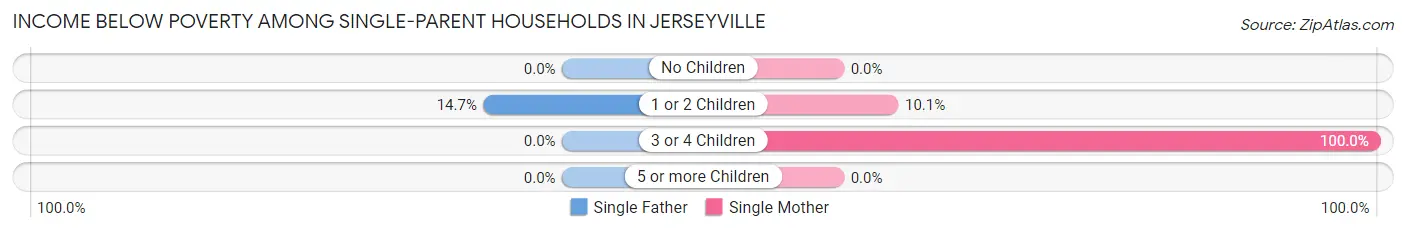
| Children | Single Father | Single Mother |
| No Children | 0 (0.0%) | 0 (0.0%) |
| 1 or 2 Children | 11 (14.7%) | 24 (10.1%) |
| 3 or 4 Children | 0 (0.0%) | 51 (100.0%) |
| 5 or more Children | 0 (0.0%) | 0 (0.0%) |
| Total | 11 (11.5%) | 75 (17.7%) |
Income Below Poverty Among Married-Couple vs Single-Parent Households in Jerseyville
The poverty data for Jerseyville shows that 16 of the married-couple family households (1.3%) and 86 of the single-parent households (16.5%) are living below the poverty level. Within the married-couple family households, those with no children have the highest poverty rate, with 16 households (2.1%) falling below the poverty line. Among the single-parent households, those with 3 or 4 children have the highest poverty rate, with 51 household (100.0%) living below poverty.
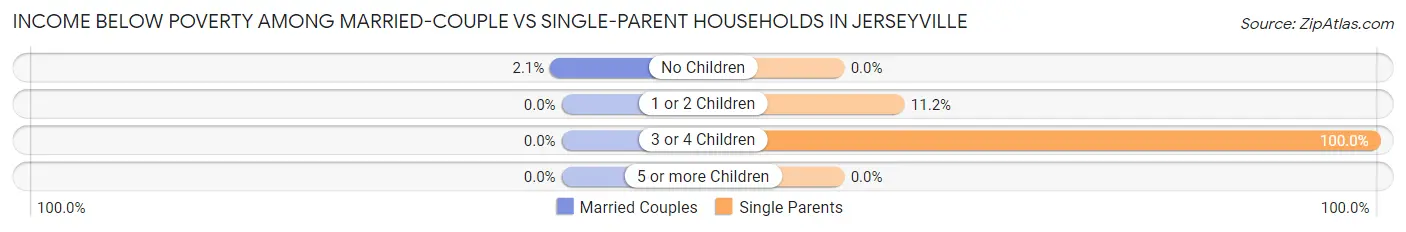
| Children | Married-Couple Families | Single-Parent Households |
| No Children | 16 (2.1%) | 0 (0.0%) |
| 1 or 2 Children | 0 (0.0%) | 35 (11.2%) |
| 3 or 4 Children | 0 (0.0%) | 51 (100.0%) |
| 5 or more Children | 0 (0.0%) | 0 (0.0%) |
| Total | 16 (1.3%) | 86 (16.5%) |
Race in Jerseyville
The most populous races in Jerseyville are White / Caucasian (7,281 | 95.5%), Two or more Races (223 | 2.9%), and Hispanic or Latino (107 | 1.4%).
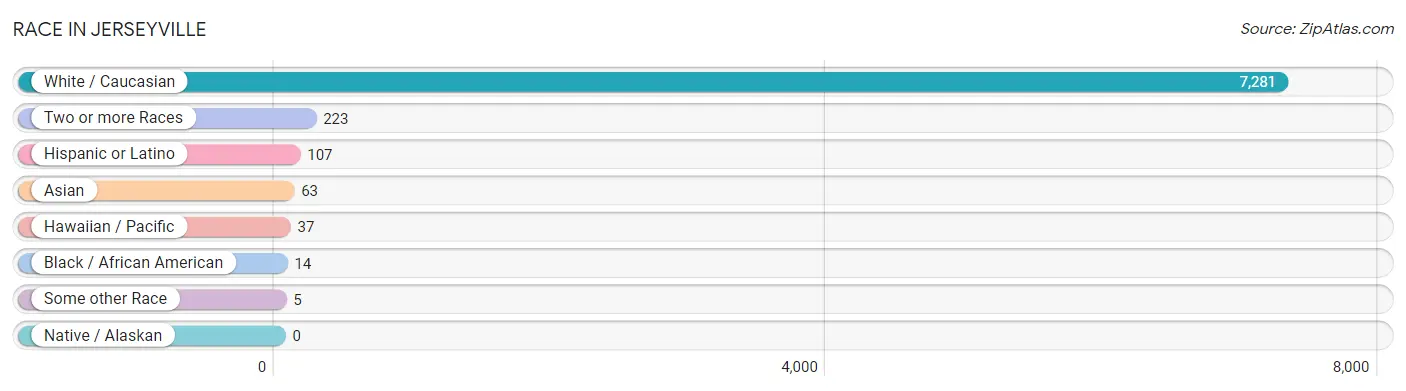
| Race | # Population | % Population |
| Asian | 63 | 0.8% |
| Black / African American | 14 | 0.2% |
| Hawaiian / Pacific | 37 | 0.5% |
| Hispanic or Latino | 107 | 1.4% |
| Native / Alaskan | 0 | 0.0% |
| White / Caucasian | 7,281 | 95.5% |
| Two or more Races | 223 | 2.9% |
| Some other Race | 5 | 0.1% |
| Total | 7,623 | 100.0% |
Ancestry in Jerseyville
The most populous ancestries reported in Jerseyville are German (3,020 | 39.6%), Irish (1,306 | 17.1%), English (589 | 7.7%), Italian (571 | 7.5%), and American (409 | 5.4%), together accounting for 77.3% of all Jerseyville residents.
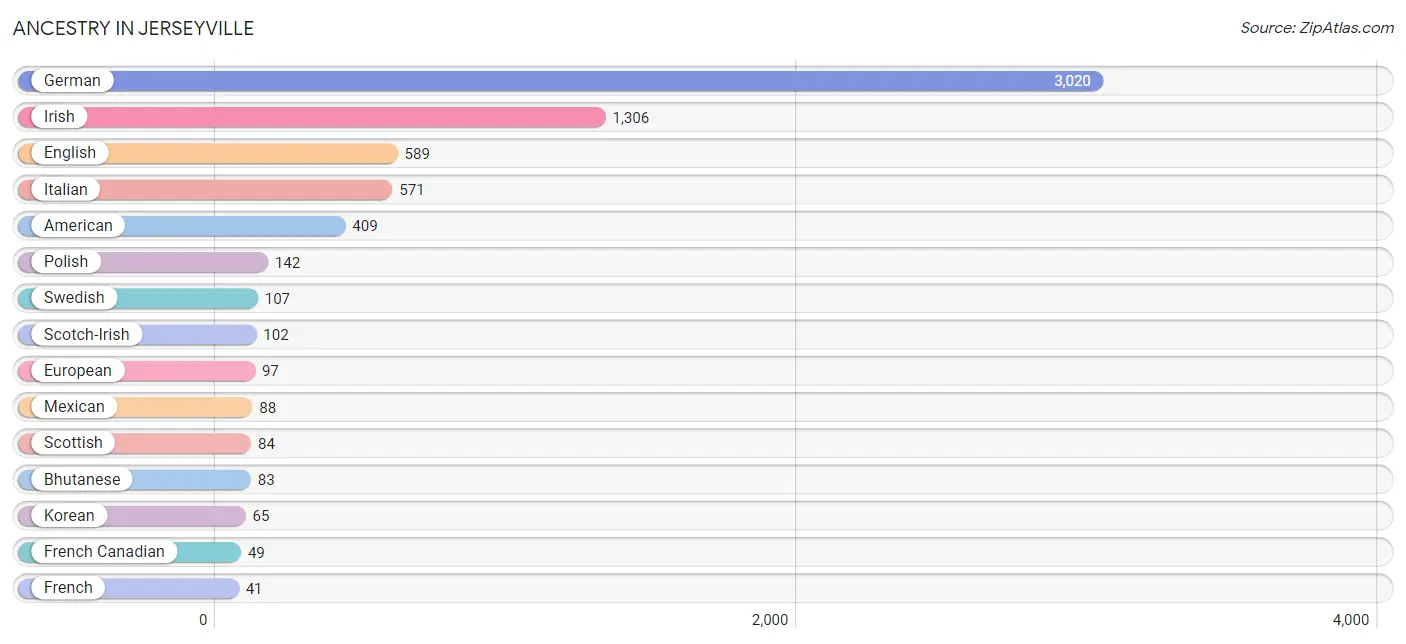
| Ancestry | # Population | % Population |
| American | 409 | 5.4% |
| Austrian | 7 | 0.1% |
| Bhutanese | 83 | 1.1% |
| British | 18 | 0.2% |
| Croatian | 7 | 0.1% |
| Czech | 36 | 0.5% |
| Danish | 10 | 0.1% |
| Dutch | 19 | 0.3% |
| English | 589 | 7.7% |
| European | 97 | 1.3% |
| French | 41 | 0.5% |
| French Canadian | 49 | 0.6% |
| German | 3,020 | 39.6% |
| Hungarian | 19 | 0.3% |
| Irish | 1,306 | 17.1% |
| Italian | 571 | 7.5% |
| Korean | 65 | 0.9% |
| Mexican | 88 | 1.1% |
| Norwegian | 13 | 0.2% |
| Polish | 142 | 1.9% |
| Puerto Rican | 5 | 0.1% |
| Russian | 21 | 0.3% |
| Samoan | 37 | 0.5% |
| Scandinavian | 11 | 0.1% |
| Scotch-Irish | 102 | 1.3% |
| Scottish | 84 | 1.1% |
| Slovene | 28 | 0.4% |
| Swedish | 107 | 1.4% | View All 28 Rows |
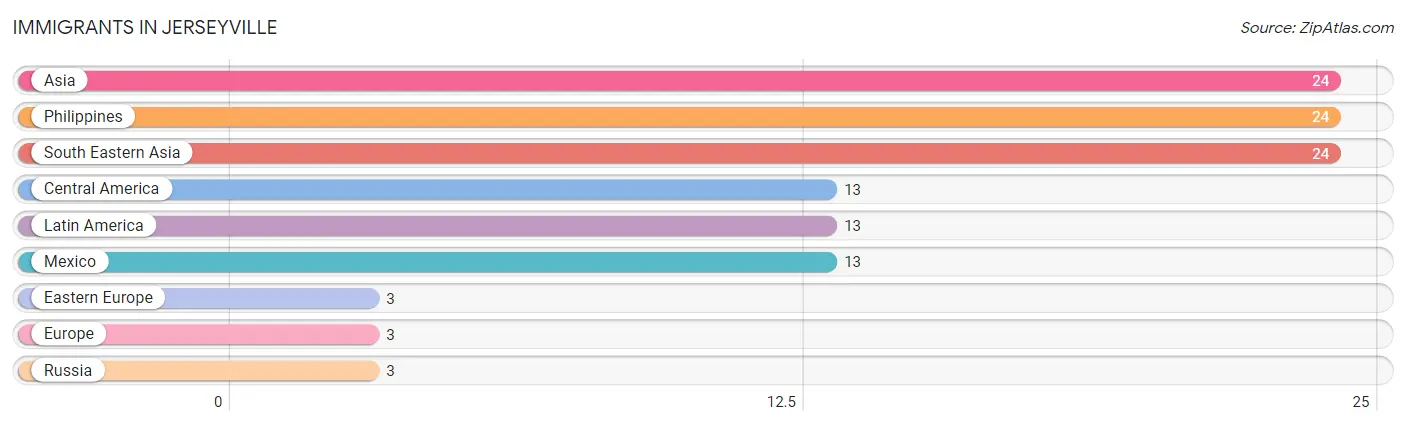
Immigrants in Jerseyville
The most numerous immigrant groups reported in Jerseyville came from Asia (24 | 0.3%), Philippines (24 | 0.3%), South Eastern Asia (24 | 0.3%), Central America (13 | 0.2%), and Latin America (13 | 0.2%), together accounting for 1.3% of all Jerseyville residents.
| Immigration Origin | # Population | % Population |
| Asia | 24 | 0.3% |
| Central America | 13 | 0.2% |
| Eastern Europe | 3 | 0.0% |
| Europe | 3 | 0.0% |
| Latin America | 13 | 0.2% |
| Mexico | 13 | 0.2% |
| Philippines | 24 | 0.3% |
| Russia | 3 | 0.0% |
| South Eastern Asia | 24 | 0.3% | View All 9 Rows |
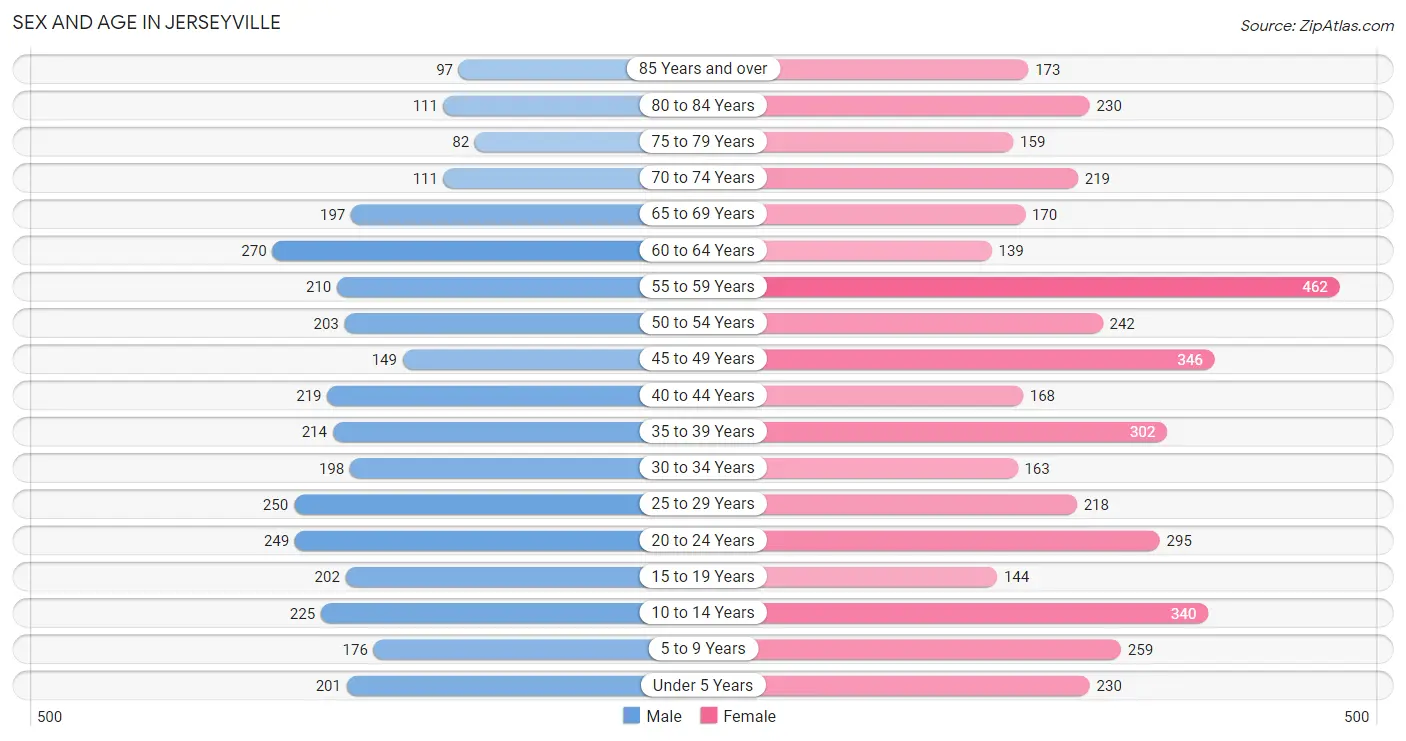
Sex and Age in Jerseyville
Sex and Age in Jerseyville
The most populous age groups in Jerseyville are 60 to 64 Years (270 | 8.0%) for men and 55 to 59 Years (462 | 10.8%) for women.
| Age Bracket | Male | Female |
| Under 5 Years | 201 (6.0%) | 230 (5.4%) |
| 5 to 9 Years | 176 (5.2%) | 259 (6.1%) |
| 10 to 14 Years | 225 (6.7%) | 340 (8.0%) |
| 15 to 19 Years | 202 (6.0%) | 144 (3.4%) |
| 20 to 24 Years | 249 (7.4%) | 295 (6.9%) |
| 25 to 29 Years | 250 (7.4%) | 218 (5.1%) |
| 30 to 34 Years | 198 (5.9%) | 163 (3.8%) |
| 35 to 39 Years | 214 (6.4%) | 302 (7.1%) |
| 40 to 44 Years | 219 (6.5%) | 168 (3.9%) |
| 45 to 49 Years | 149 (4.4%) | 346 (8.1%) |
| 50 to 54 Years | 203 (6.0%) | 242 (5.7%) |
| 55 to 59 Years | 210 (6.2%) | 462 (10.8%) |
| 60 to 64 Years | 270 (8.0%) | 139 (3.3%) |
| 65 to 69 Years | 197 (5.9%) | 170 (4.0%) |
| 70 to 74 Years | 111 (3.3%) | 219 (5.1%) |
| 75 to 79 Years | 82 (2.4%) | 159 (3.7%) |
| 80 to 84 Years | 111 (3.3%) | 230 (5.4%) |
| 85 Years and over | 97 (2.9%) | 173 (4.1%) |
| Total | 3,364 (100.0%) | 4,259 (100.0%) |
Families and Households in Jerseyville
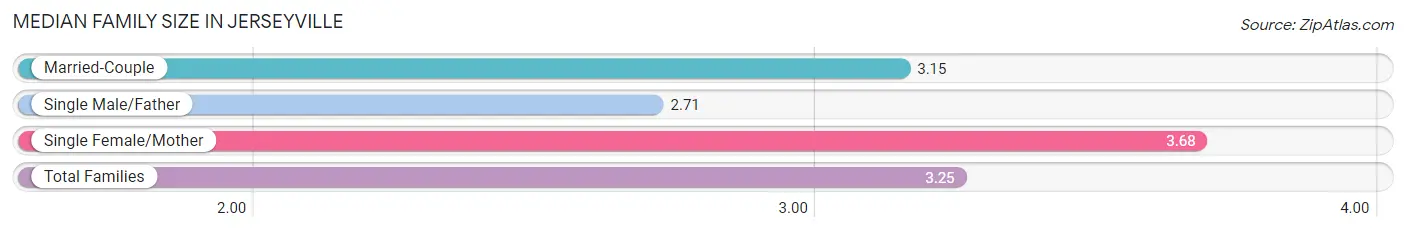
Median Family Size in Jerseyville
The median family size in Jerseyville is 3.25 persons per family, with single female/mother families (424 | 24.3%) accounting for the largest median family size of 3.68 persons per family. On the other hand, single male/father families (96 | 5.5%) represent the smallest median family size with 2.71 persons per family.
| Family Type | # Families | Family Size |
| Married-Couple | 1,223 (70.2%) | 3.15 |
| Single Male/Father | 96 (5.5%) | 2.71 |
| Single Female/Mother | 424 (24.3%) | 3.68 |
| Total Families | 1,743 (100.0%) | 3.25 |
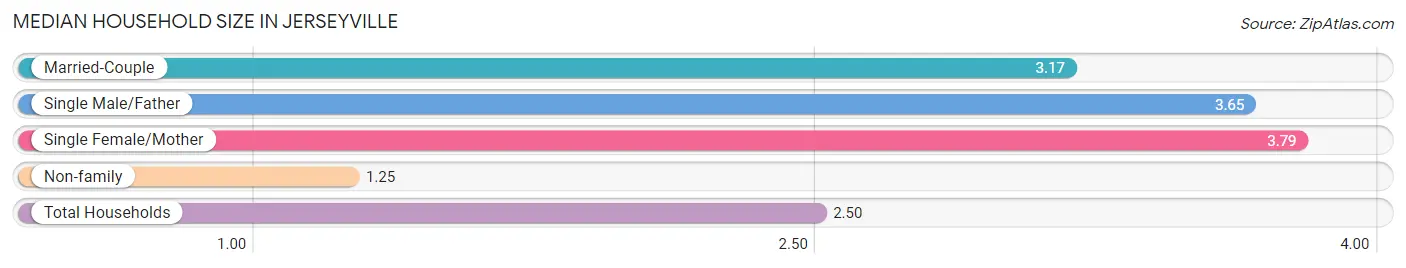
Median Household Size in Jerseyville
The median household size in Jerseyville is 2.50 persons per household, with single female/mother households (424 | 14.5%) accounting for the largest median household size of 3.79 persons per household. non-family households (1,178 | 40.3%) represent the smallest median household size with 1.25 persons per household.
| Household Type | # Households | Household Size |
| Married-Couple | 1,223 (41.9%) | 3.17 |
| Single Male/Father | 96 (3.3%) | 3.65 |
| Single Female/Mother | 424 (14.5%) | 3.79 |
| Non-family | 1,178 (40.3%) | 1.25 |
| Total Households | 2,921 (100.0%) | 2.50 |
Household Size by Marriage Status in Jerseyville
Out of a total of 2,921 households in Jerseyville, 1,743 (59.7%) are family households, while 1,178 (40.3%) are nonfamily households. The most numerous type of family households are 2-person households, comprising 769, and the most common type of nonfamily households are 1-person households, comprising 973.
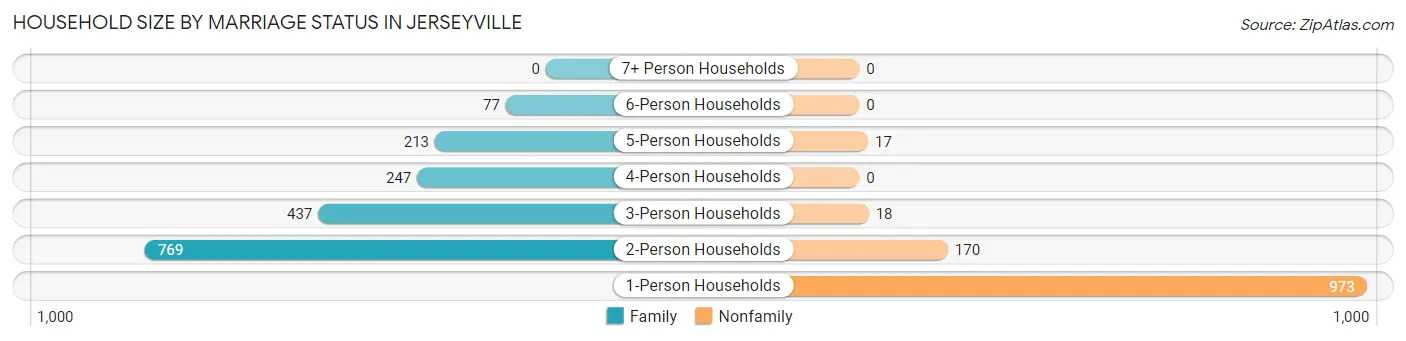
| Household Size | Family Households | Nonfamily Households |
| 1-Person Households | - | 973 (33.3%) |
| 2-Person Households | 769 (26.3%) | 170 (5.8%) |
| 3-Person Households | 437 (15.0%) | 18 (0.6%) |
| 4-Person Households | 247 (8.5%) | 0 (0.0%) |
| 5-Person Households | 213 (7.3%) | 17 (0.6%) |
| 6-Person Households | 77 (2.6%) | 0 (0.0%) |
| 7+ Person Households | 0 (0.0%) | 0 (0.0%) |
| Total | 1,743 (59.7%) | 1,178 (40.3%) |
Female Fertility in Jerseyville
Fertility by Age in Jerseyville
Average fertility rate in Jerseyville is 53.0 births per 1,000 women. Women in the age bracket of 20 to 34 years have the highest fertility rate with 136.0 births per 1,000 women. Women in the age bracket of 20 to 34 years acount for 100.0% of all women with births.
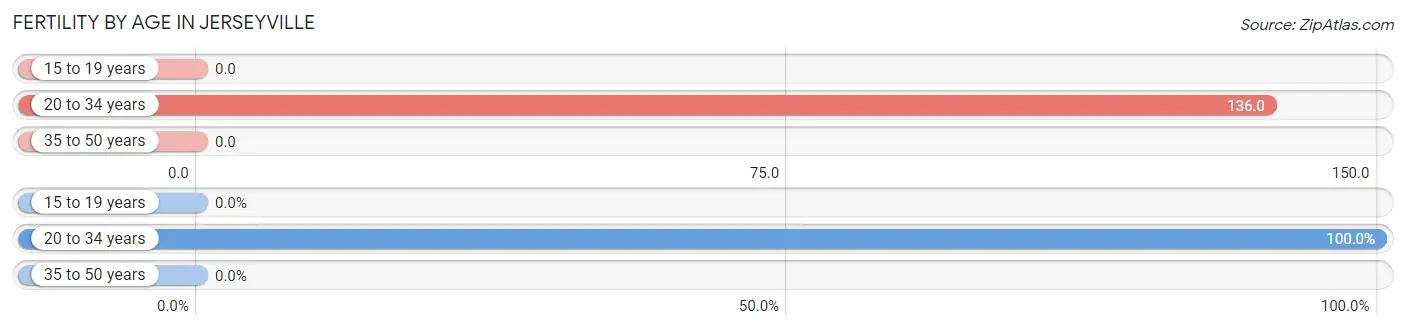
| Age Bracket | Women with Births | Births / 1,000 Women |
| 15 to 19 years | 0 (0.0%) | 0.0 |
| 20 to 34 years | 92 (100.0%) | 136.0 |
| 35 to 50 years | 0 (0.0%) | 0.0 |
| Total | 92 (100.0%) | 53.0 |
Fertility by Age by Marriage Status in Jerseyville
96.7% of women with births (92) in Jerseyville are married. The highest percentage of unmarried women with births falls into 20 to 34 years age bracket with 3.3% of them unmarried at the time of birth, while the lowest percentage of unmarried women with births belong to 20 to 34 years age bracket with 3.3% of them unmarried.
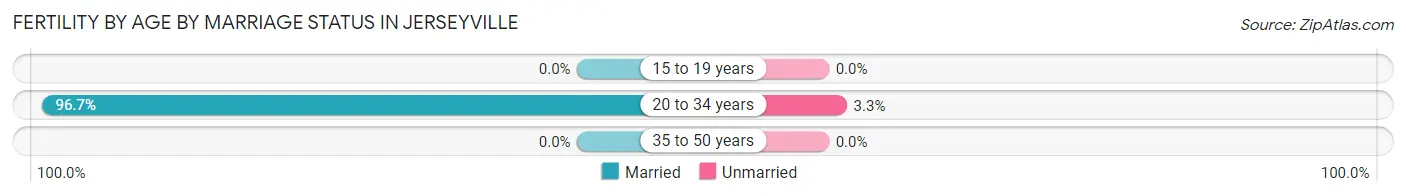
| Age Bracket | Married | Unmarried |
| 15 to 19 years | 0 (0.0%) | 0 (0.0%) |
| 20 to 34 years | 89 (96.7%) | 3 (3.3%) |
| 35 to 50 years | 0 (0.0%) | 0 (0.0%) |
| Total | 89 (96.7%) | 3 (3.3%) |
Fertility by Education in Jerseyville
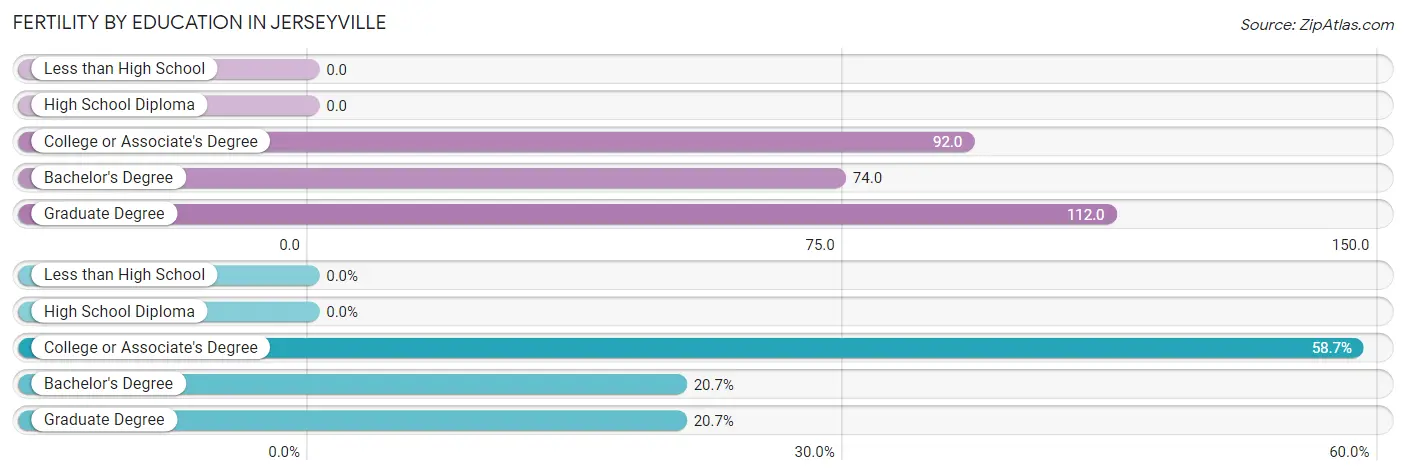
| Educational Attainment | Women with Births | Births / 1,000 Women |
| Less than High School | 0 (0.0%) | 0.0 |
| High School Diploma | 0 (0.0%) | 0.0 |
| College or Associate's Degree | 54 (58.7%) | 92.0 |
| Bachelor's Degree | 19 (20.6%) | 74.0 |
| Graduate Degree | 19 (20.6%) | 112.0 |
| Total | 92 (100.0%) | 53.0 |
Fertility by Education by Marriage Status in Jerseyville
3.3% of women with births in Jerseyville are unmarried. Women with the educational attainment of bachelor's degree are most likely to be married with 100.0% of them married at childbirth, while women with the educational attainment of college or associate's degree are least likely to be married with 5.6% of them unmarried at childbirth.
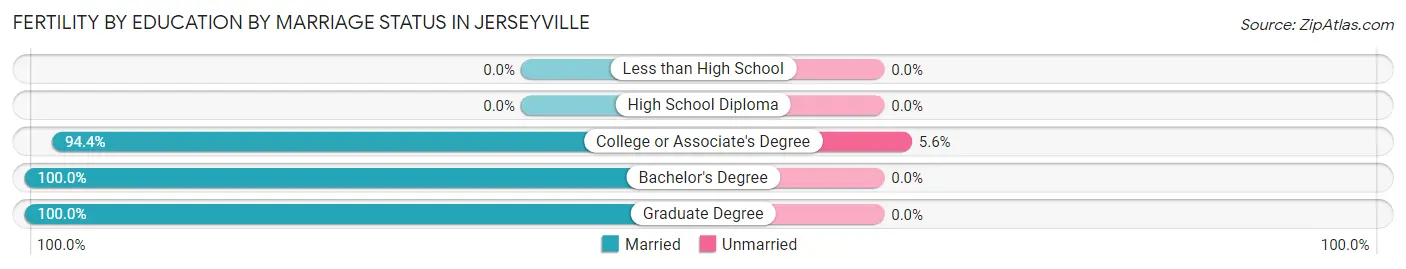
| Educational Attainment | Married | Unmarried |
| Less than High School | 0 (0.0%) | 0 (0.0%) |
| High School Diploma | 0 (0.0%) | 0 (0.0%) |
| College or Associate's Degree | 51 (94.4%) | 3 (5.6%) |
| Bachelor's Degree | 19 (100.0%) | 0 (0.0%) |
| Graduate Degree | 19 (100.0%) | 0 (0.0%) |
| Total | 89 (96.7%) | 3 (3.3%) |
Employment Characteristics in Jerseyville
Employment by Class of Employer in Jerseyville
Among the 3,272 employed individuals in Jerseyville, private company employees (2,330 | 71.2%), local government employees (273 | 8.3%), and not-for-profit organizations (244 | 7.5%) make up the most common classes of employment.
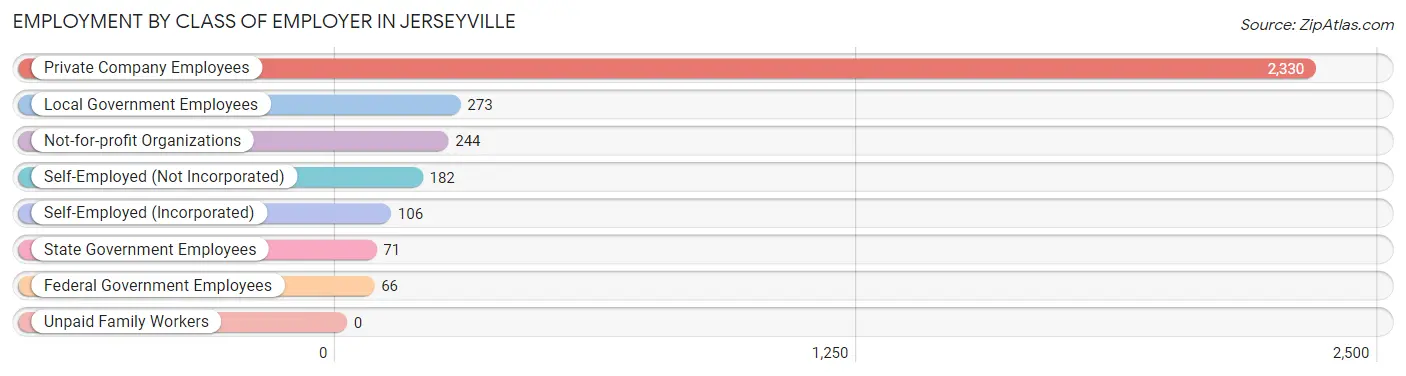
| Employer Class | # Employees | % Employees |
| Private Company Employees | 2,330 | 71.2% |
| Self-Employed (Incorporated) | 106 | 3.2% |
| Self-Employed (Not Incorporated) | 182 | 5.6% |
| Not-for-profit Organizations | 244 | 7.5% |
| Local Government Employees | 273 | 8.3% |
| State Government Employees | 71 | 2.2% |
| Federal Government Employees | 66 | 2.0% |
| Unpaid Family Workers | 0 | 0.0% |
| Total | 3,272 | 100.0% |
Employment Status by Age in Jerseyville
According to the labor force statistics for Jerseyville, out of the total population over 16 years of age (6,094), 55.8% or 3,400 individuals are in the labor force, with 2.7% or 92 of them unemployed. The age group with the highest labor force participation rate is 25 to 29 years, with 90.2% or 422 individuals in the labor force. Within the labor force, the 45 to 54 years age range has the highest percentage of unemployed individuals, with 7.8% or 45 of them being unemployed.
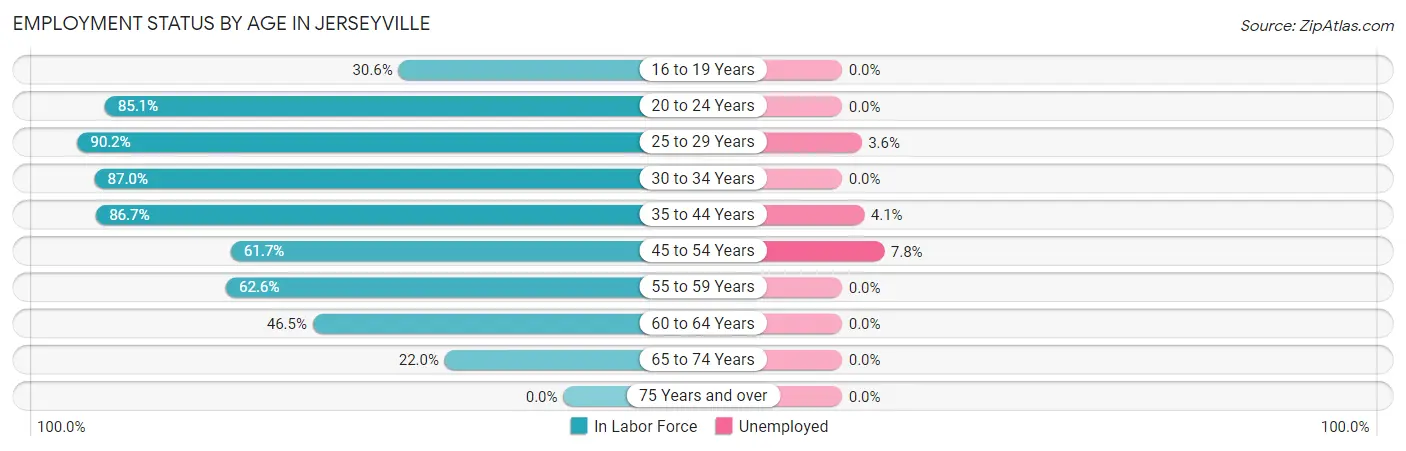
| Age Bracket | In Labor Force | Unemployed |
| 16 to 19 Years | 76 (30.6%) | 0 (0.0%) |
| 20 to 24 Years | 463 (85.1%) | 0 (0.0%) |
| 25 to 29 Years | 422 (90.2%) | 15 (3.6%) |
| 30 to 34 Years | 314 (87.0%) | 0 (0.0%) |
| 35 to 44 Years | 783 (86.7%) | 32 (4.1%) |
| 45 to 54 Years | 580 (61.7%) | 45 (7.8%) |
| 55 to 59 Years | 421 (62.6%) | 0 (0.0%) |
| 60 to 64 Years | 190 (46.5%) | 0 (0.0%) |
| 65 to 74 Years | 153 (22.0%) | 0 (0.0%) |
| 75 Years and over | 0 (0.0%) | 0 (0.0%) |
| Total | 3,400 (55.8%) | 92 (2.7%) |
Employment Status by Educational Attainment in Jerseyville
According to labor force statistics for Jerseyville, 72.2% of individuals (2,710) out of the total population between 25 and 64 years of age (3,753) are in the labor force, with 3.4% or 92 of them being unemployed. The group with the highest labor force participation rate are those with the educational attainment of bachelor's degree or higher, with 94.6% or 871 individuals in the labor force. Within the labor force, individuals with high school diploma education have the highest percentage of unemployment, with 5.6% or 45 of them being unemployed.
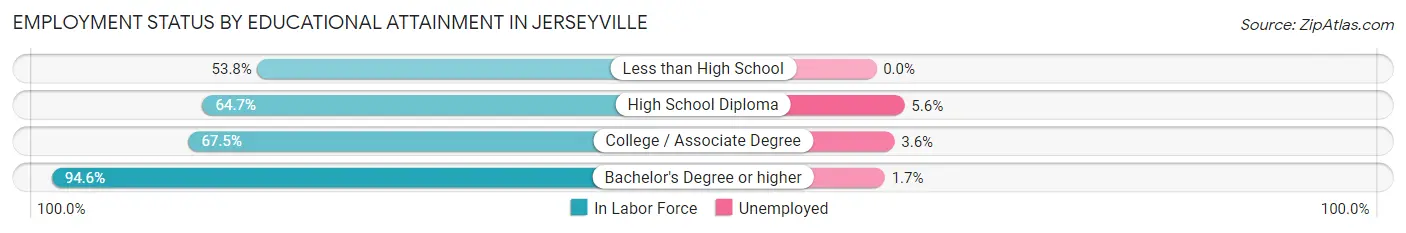
| Educational Attainment | In Labor Force | Unemployed |
| Less than High School | 148 (53.8%) | 0 (0.0%) |
| High School Diploma | 807 (64.7%) | 70 (5.6%) |
| College / Associate Degree | 884 (67.5%) | 47 (3.6%) |
| Bachelor's Degree or higher | 871 (94.6%) | 16 (1.7%) |
| Total | 2,710 (72.2%) | 128 (3.4%) |
Employment Occupations by Sex in Jerseyville
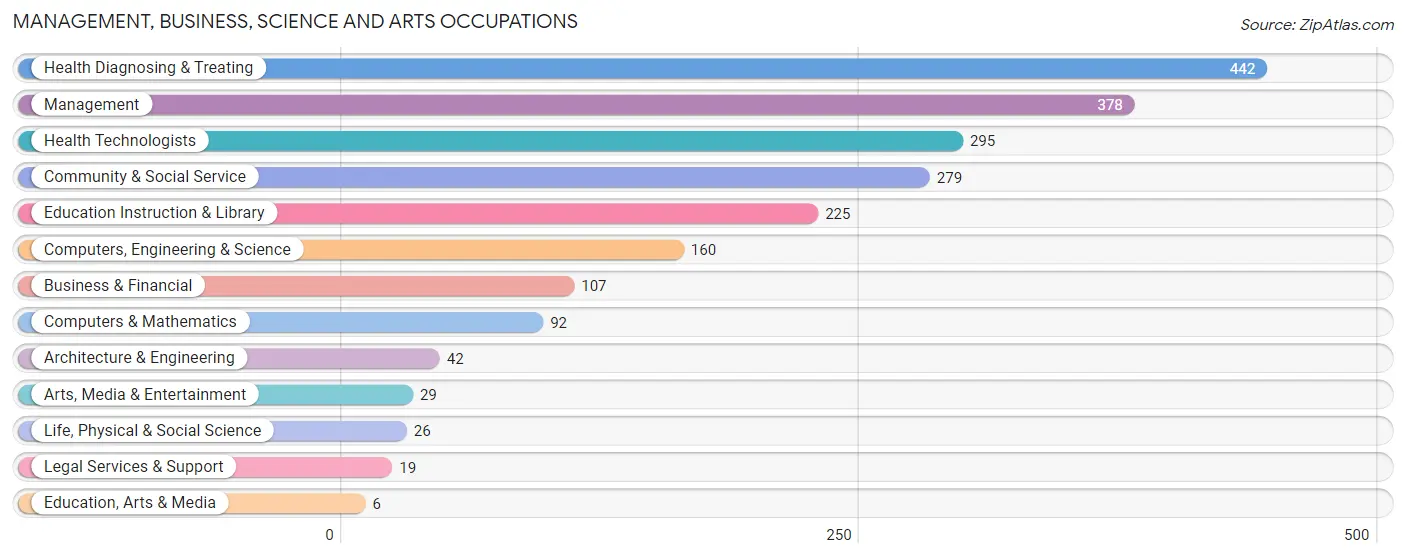
Management, Business, Science and Arts Occupations
The most common Management, Business, Science and Arts occupations in Jerseyville are Health Diagnosing & Treating (442 | 13.4%), Management (378 | 11.4%), Health Technologists (295 | 8.9%), Community & Social Service (279 | 8.4%), and Education Instruction & Library (225 | 6.8%).
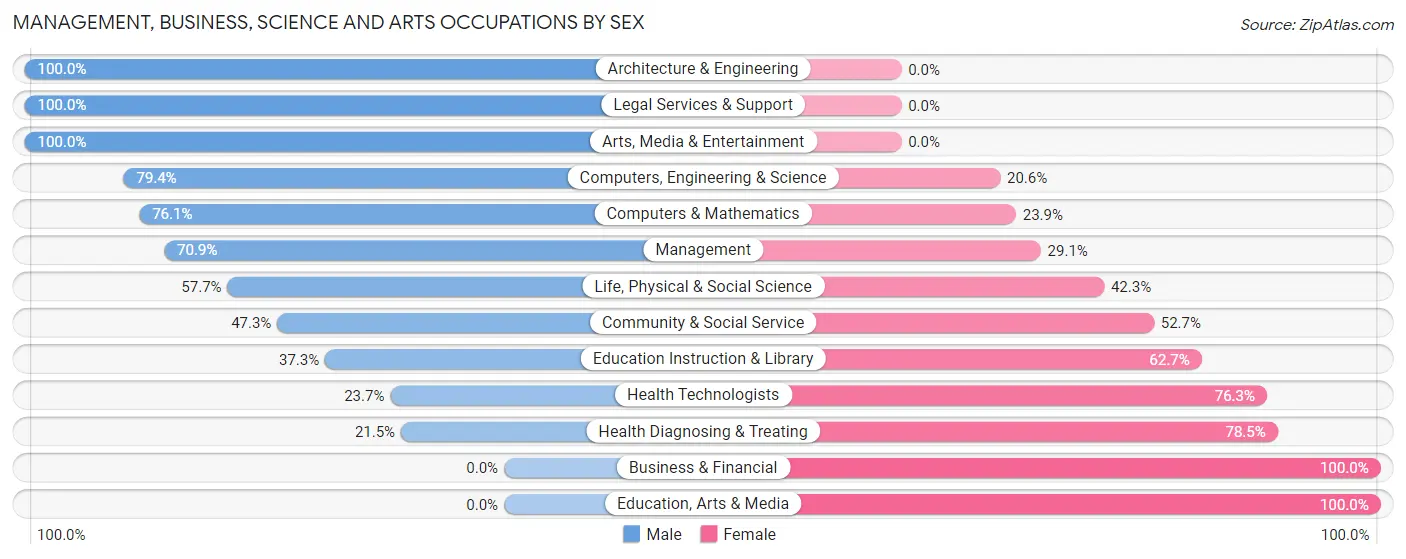
Management, Business, Science and Arts Occupations by Sex
Within the Management, Business, Science and Arts occupations in Jerseyville, the most male-oriented occupations are Architecture & Engineering (100.0%), Legal Services & Support (100.0%), and Arts, Media & Entertainment (100.0%), while the most female-oriented occupations are Business & Financial (100.0%), Education, Arts & Media (100.0%), and Health Diagnosing & Treating (78.5%).
| Occupation | Male | Female |
| Management | 268 (70.9%) | 110 (29.1%) |
| Business & Financial | 0 (0.0%) | 107 (100.0%) |
| Computers, Engineering & Science | 127 (79.4%) | 33 (20.6%) |
| Computers & Mathematics | 70 (76.1%) | 22 (23.9%) |
| Architecture & Engineering | 42 (100.0%) | 0 (0.0%) |
| Life, Physical & Social Science | 15 (57.7%) | 11 (42.3%) |
| Community & Social Service | 132 (47.3%) | 147 (52.7%) |
| Education, Arts & Media | 0 (0.0%) | 6 (100.0%) |
| Legal Services & Support | 19 (100.0%) | 0 (0.0%) |
| Education Instruction & Library | 84 (37.3%) | 141 (62.7%) |
| Arts, Media & Entertainment | 29 (100.0%) | 0 (0.0%) |
| Health Diagnosing & Treating | 95 (21.5%) | 347 (78.5%) |
| Health Technologists | 70 (23.7%) | 225 (76.3%) |
| Total (Category) | 622 (45.5%) | 744 (54.5%) |
| Total (Overall) | 1,735 (52.4%) | 1,575 (47.6%) |
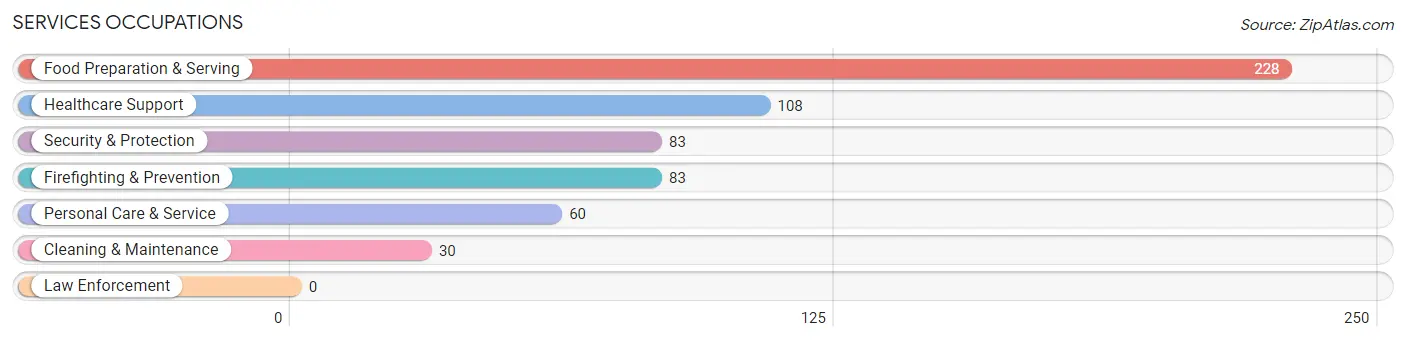
Services Occupations
The most common Services occupations in Jerseyville are Food Preparation & Serving (228 | 6.9%), Healthcare Support (108 | 3.3%), Security & Protection (83 | 2.5%), Firefighting & Prevention (83 | 2.5%), and Personal Care & Service (60 | 1.8%).
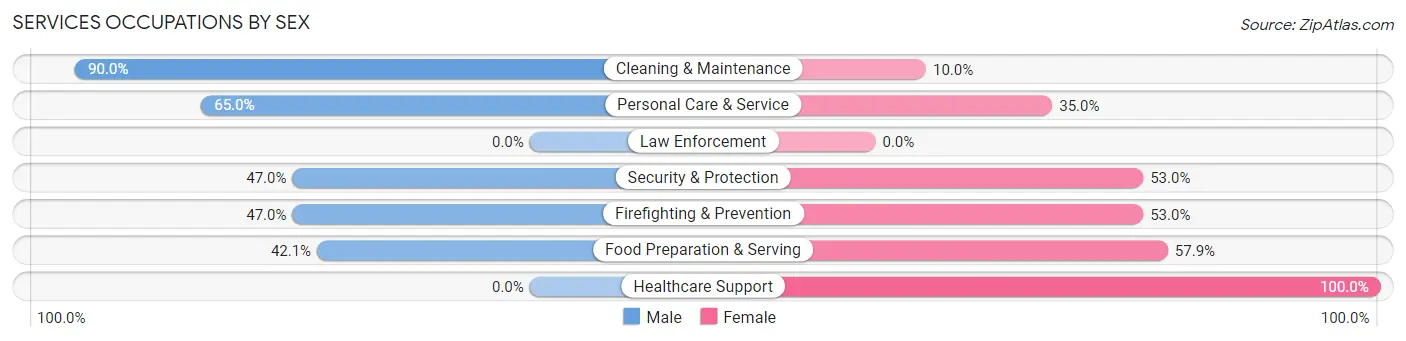
Services Occupations by Sex
Within the Services occupations in Jerseyville, the most male-oriented occupations are Cleaning & Maintenance (90.0%), Personal Care & Service (65.0%), and Security & Protection (47.0%), while the most female-oriented occupations are Healthcare Support (100.0%), Food Preparation & Serving (57.9%), and Security & Protection (53.0%).
| Occupation | Male | Female |
| Healthcare Support | 0 (0.0%) | 108 (100.0%) |
| Security & Protection | 39 (47.0%) | 44 (53.0%) |
| Firefighting & Prevention | 39 (47.0%) | 44 (53.0%) |
| Law Enforcement | 0 (0.0%) | 0 (0.0%) |
| Food Preparation & Serving | 96 (42.1%) | 132 (57.9%) |
| Cleaning & Maintenance | 27 (90.0%) | 3 (10.0%) |
| Personal Care & Service | 39 (65.0%) | 21 (35.0%) |
| Total (Category) | 201 (39.5%) | 308 (60.5%) |
| Total (Overall) | 1,735 (52.4%) | 1,575 (47.6%) |
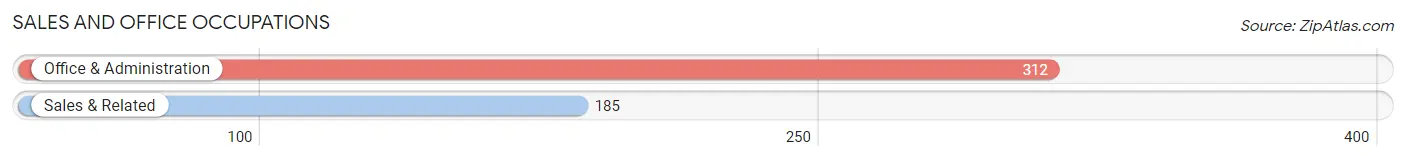
Sales and Office Occupations
The most common Sales and Office occupations in Jerseyville are Office & Administration (312 | 9.4%), and Sales & Related (185 | 5.6%).
Sales and Office Occupations by Sex
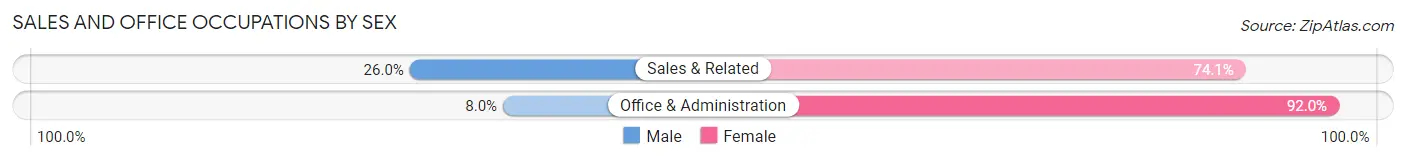
| Occupation | Male | Female |
| Sales & Related | 48 (26.0%) | 137 (74.1%) |
| Office & Administration | 25 (8.0%) | 287 (92.0%) |
| Total (Category) | 73 (14.7%) | 424 (85.3%) |
| Total (Overall) | 1,735 (52.4%) | 1,575 (47.6%) |
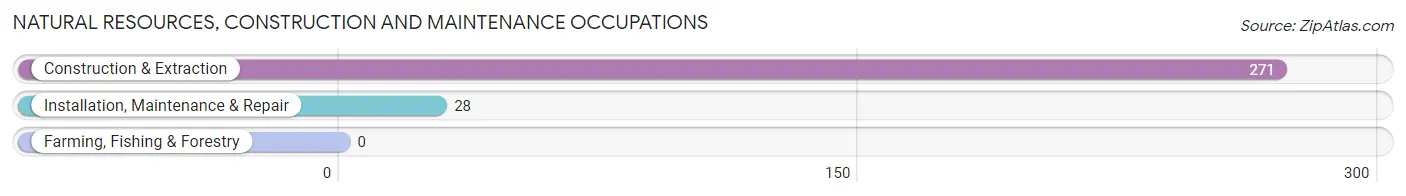
Natural Resources, Construction and Maintenance Occupations
The most common Natural Resources, Construction and Maintenance occupations in Jerseyville are Construction & Extraction (271 | 8.2%), and Installation, Maintenance & Repair (28 | 0.9%).
Natural Resources, Construction and Maintenance Occupations by Sex
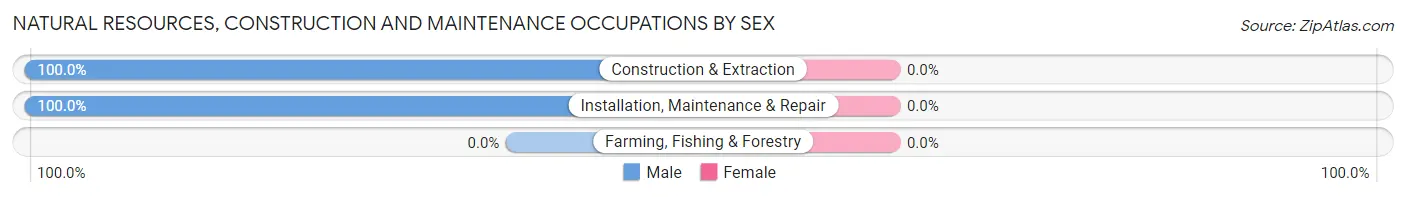
| Occupation | Male | Female |
| Farming, Fishing & Forestry | 0 (0.0%) | 0 (0.0%) |
| Construction & Extraction | 271 (100.0%) | 0 (0.0%) |
| Installation, Maintenance & Repair | 28 (100.0%) | 0 (0.0%) |
| Total (Category) | 299 (100.0%) | 0 (0.0%) |
| Total (Overall) | 1,735 (52.4%) | 1,575 (47.6%) |
Production, Transportation and Moving Occupations
The most common Production, Transportation and Moving occupations in Jerseyville are Production (223 | 6.7%), Material Moving (222 | 6.7%), and Transportation (194 | 5.9%).
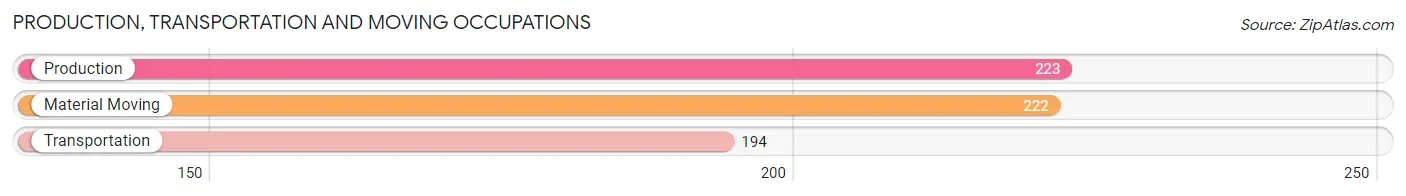
Production, Transportation and Moving Occupations by Sex
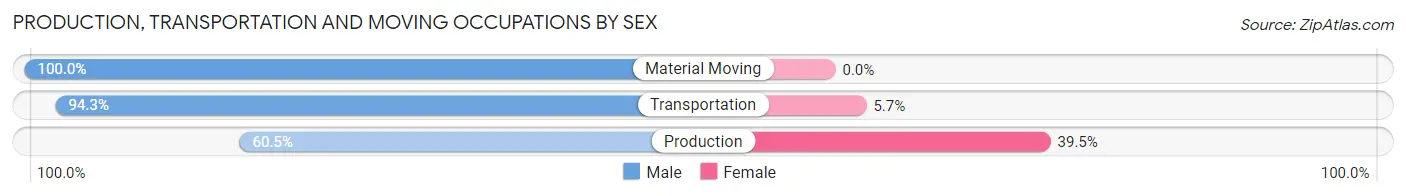
| Occupation | Male | Female |
| Production | 135 (60.5%) | 88 (39.5%) |
| Transportation | 183 (94.3%) | 11 (5.7%) |
| Material Moving | 222 (100.0%) | 0 (0.0%) |
| Total (Category) | 540 (84.5%) | 99 (15.5%) |
| Total (Overall) | 1,735 (52.4%) | 1,575 (47.6%) |
Employment Industries by Sex in Jerseyville
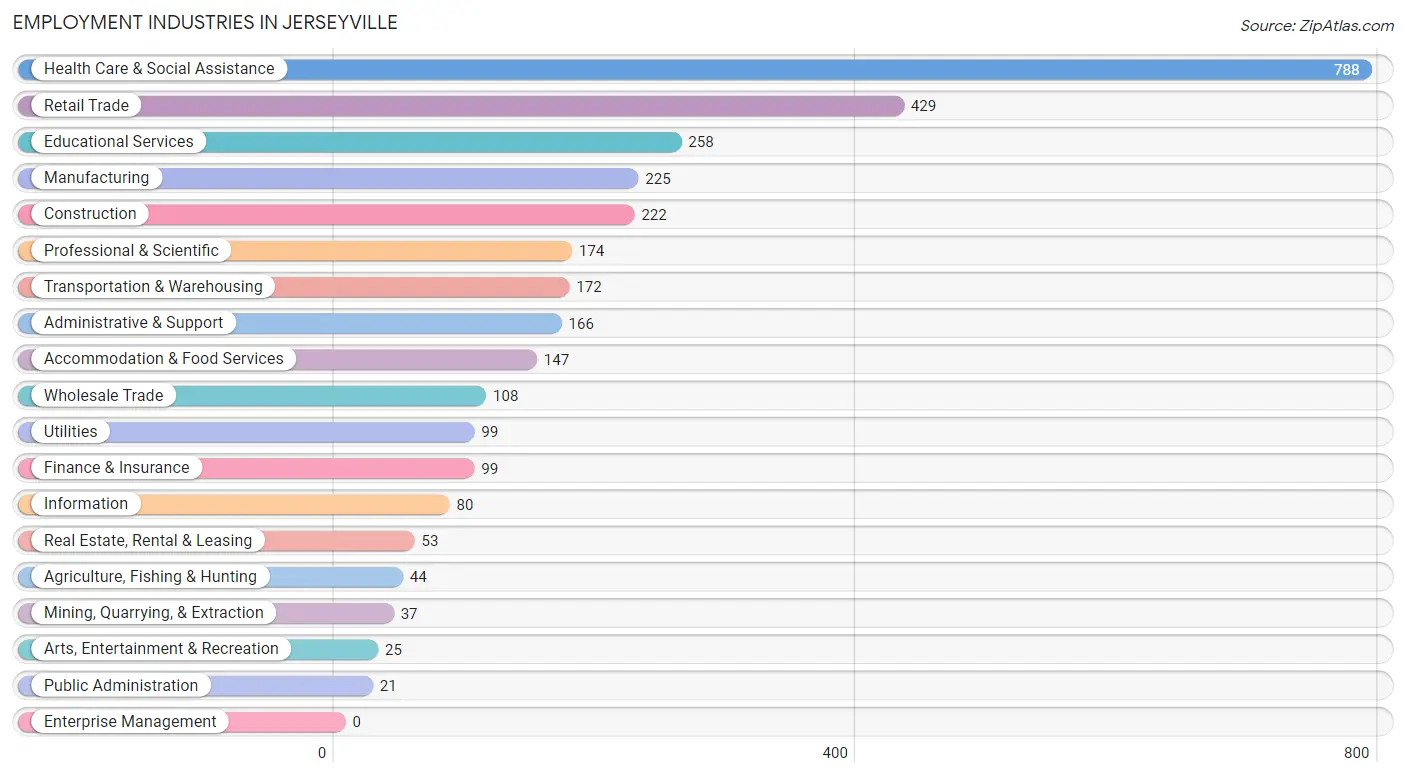
Employment Industries in Jerseyville
The major employment industries in Jerseyville include Health Care & Social Assistance (788 | 23.8%), Retail Trade (429 | 13.0%), Educational Services (258 | 7.8%), Manufacturing (225 | 6.8%), and Construction (222 | 6.7%).
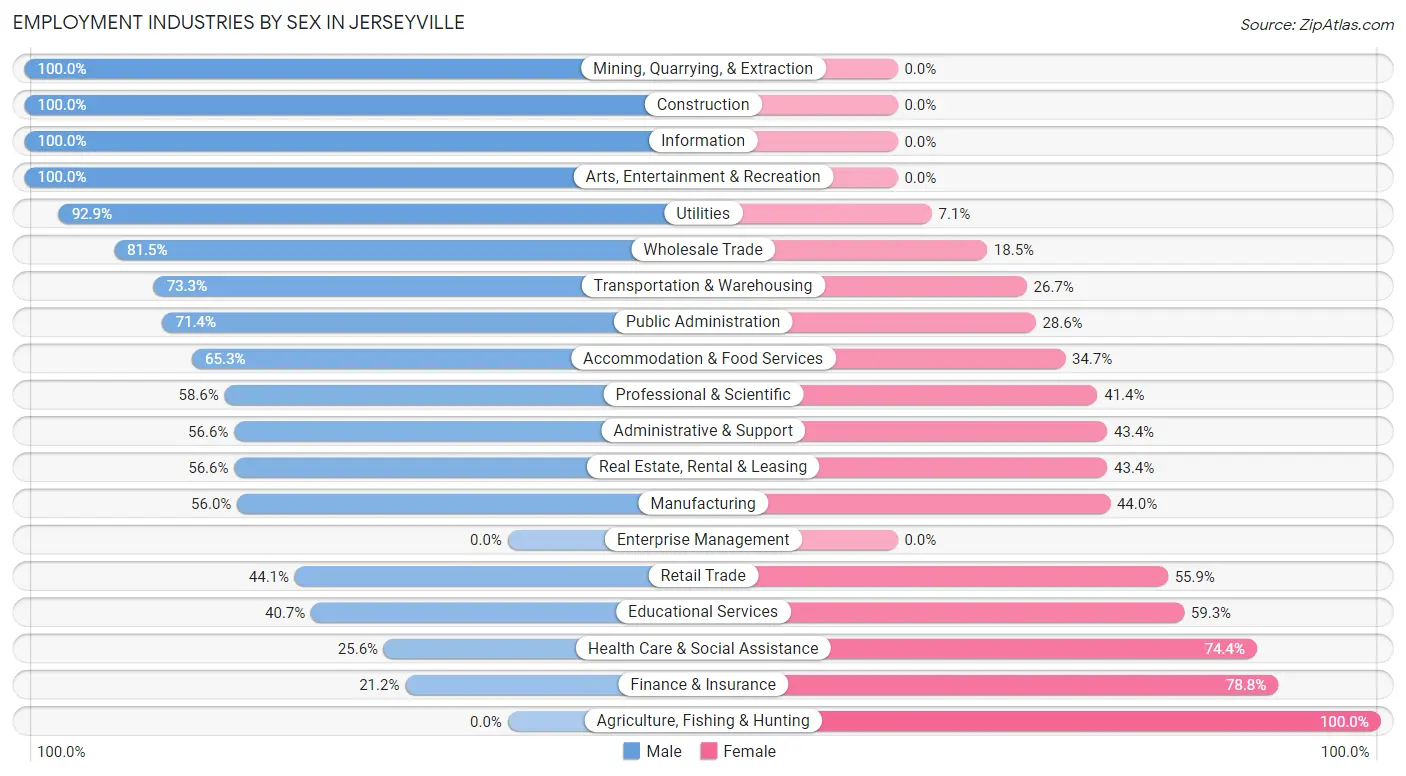
Employment Industries by Sex in Jerseyville
The Jerseyville industries that see more men than women are Mining, Quarrying, & Extraction (100.0%), Construction (100.0%), and Information (100.0%), whereas the industries that tend to have a higher number of women are Agriculture, Fishing & Hunting (100.0%), Finance & Insurance (78.8%), and Health Care & Social Assistance (74.4%).
| Industry | Male | Female |
| Agriculture, Fishing & Hunting | 0 (0.0%) | 44 (100.0%) |
| Mining, Quarrying, & Extraction | 37 (100.0%) | 0 (0.0%) |
| Construction | 222 (100.0%) | 0 (0.0%) |
| Manufacturing | 126 (56.0%) | 99 (44.0%) |
| Wholesale Trade | 88 (81.5%) | 20 (18.5%) |
| Retail Trade | 189 (44.1%) | 240 (55.9%) |
| Transportation & Warehousing | 126 (73.3%) | 46 (26.7%) |
| Utilities | 92 (92.9%) | 7 (7.1%) |
| Information | 80 (100.0%) | 0 (0.0%) |
| Finance & Insurance | 21 (21.2%) | 78 (78.8%) |
| Real Estate, Rental & Leasing | 30 (56.6%) | 23 (43.4%) |
| Professional & Scientific | 102 (58.6%) | 72 (41.4%) |
| Enterprise Management | 0 (0.0%) | 0 (0.0%) |
| Administrative & Support | 94 (56.6%) | 72 (43.4%) |
| Educational Services | 105 (40.7%) | 153 (59.3%) |
| Health Care & Social Assistance | 202 (25.6%) | 586 (74.4%) |
| Arts, Entertainment & Recreation | 25 (100.0%) | 0 (0.0%) |
| Accommodation & Food Services | 96 (65.3%) | 51 (34.7%) |
| Public Administration | 15 (71.4%) | 6 (28.6%) |
| Total | 1,735 (52.4%) | 1,575 (47.6%) |
Education in Jerseyville
School Enrollment in Jerseyville
The most common levels of schooling among the 1,493 students in Jerseyville are middle school (383 | 25.7%), high school (324 | 21.7%), and elementary school (311 | 20.8%).
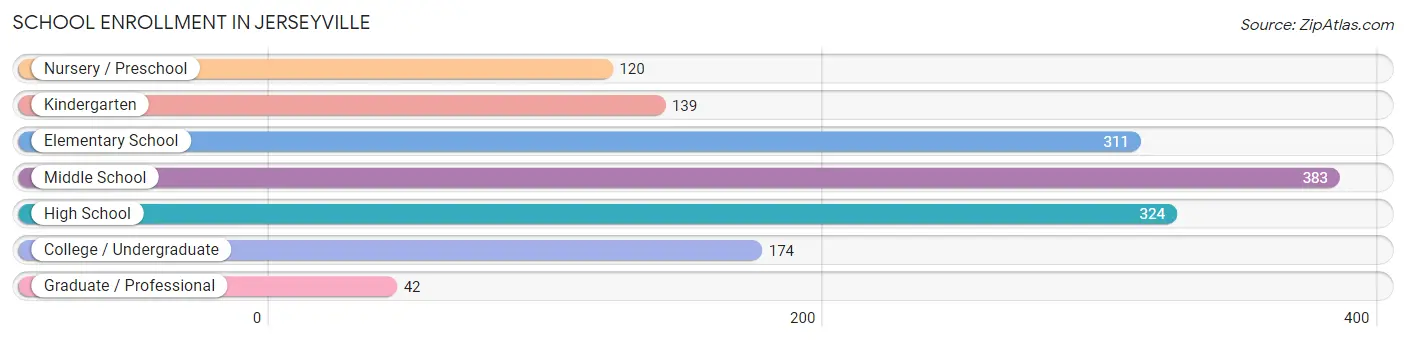
| School Level | # Students | % Students |
| Nursery / Preschool | 120 | 8.0% |
| Kindergarten | 139 | 9.3% |
| Elementary School | 311 | 20.8% |
| Middle School | 383 | 25.7% |
| High School | 324 | 21.7% |
| College / Undergraduate | 174 | 11.7% |
| Graduate / Professional | 42 | 2.8% |
| Total | 1,493 | 100.0% |
School Enrollment by Age by Funding Source in Jerseyville
Out of a total of 1,493 students who are enrolled in schools in Jerseyville, 243 (16.3%) attend a private institution, while the remaining 1,250 (83.7%) are enrolled in public schools. The age group of 3 to 4 year olds has the highest likelihood of being enrolled in private schools, with 55 (52.9% in the age bracket) enrolled. Conversely, the age group of 15 to 17 year olds has the lowest likelihood of being enrolled in a private school, with 228 (100.0% in the age bracket) attending a public institution.
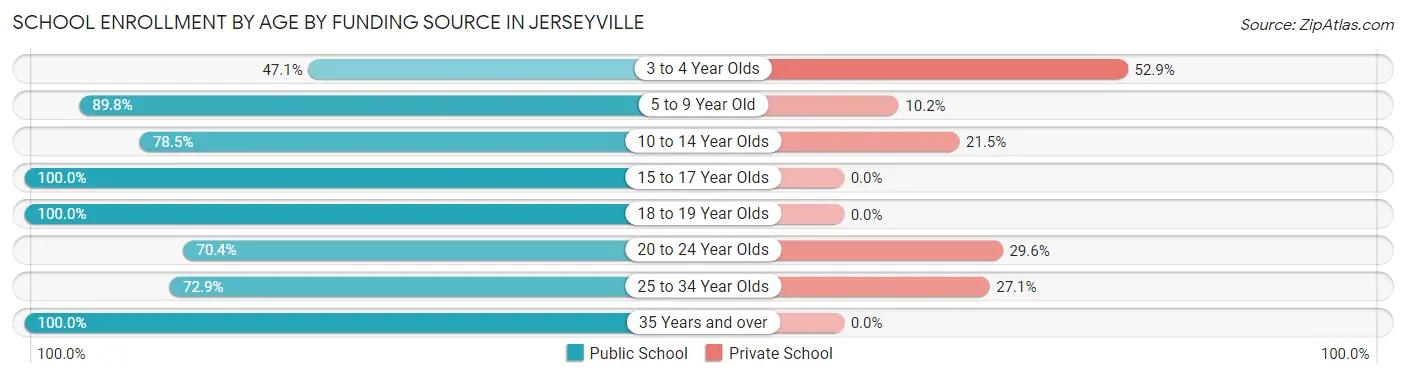
| Age Bracket | Public School | Private School |
| 3 to 4 Year Olds | 49 (47.1%) | 55 (52.9%) |
| 5 to 9 Year Old | 370 (89.8%) | 42 (10.2%) |
| 10 to 14 Year Olds | 398 (78.5%) | 109 (21.5%) |
| 15 to 17 Year Olds | 228 (100.0%) | 0 (0.0%) |
| 18 to 19 Year Olds | 70 (100.0%) | 0 (0.0%) |
| 20 to 24 Year Olds | 50 (70.4%) | 21 (29.6%) |
| 25 to 34 Year Olds | 43 (72.9%) | 16 (27.1%) |
| 35 Years and over | 42 (100.0%) | 0 (0.0%) |
| Total | 1,250 (83.7%) | 243 (16.3%) |
Educational Attainment by Field of Study in Jerseyville
Education (249 | 20.7%), business (233 | 19.4%), science & technology (202 | 16.8%), arts & humanities (167 | 13.9%), and psychology (121 | 10.1%) are the most common fields of study among 1,203 individuals in Jerseyville who have obtained a bachelor's degree or higher.
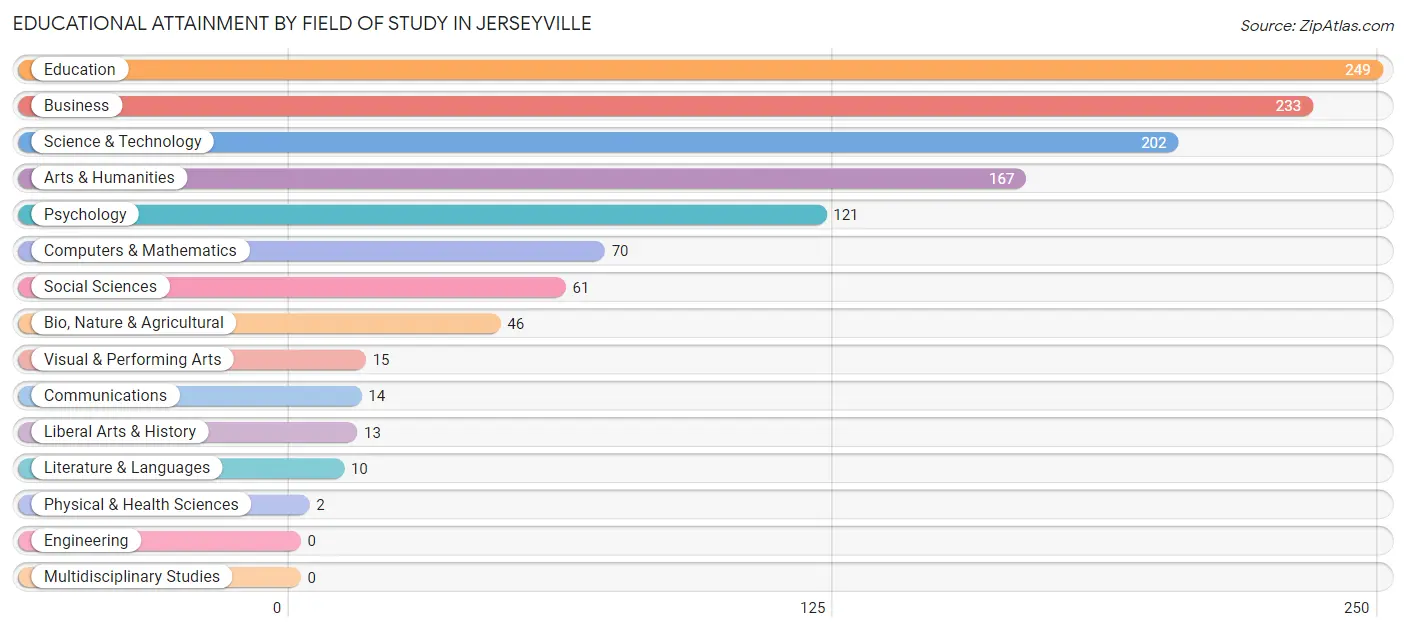
| Field of Study | # Graduates | % Graduates |
| Computers & Mathematics | 70 | 5.8% |
| Bio, Nature & Agricultural | 46 | 3.8% |
| Physical & Health Sciences | 2 | 0.2% |
| Psychology | 121 | 10.1% |
| Social Sciences | 61 | 5.1% |
| Engineering | 0 | 0.0% |
| Multidisciplinary Studies | 0 | 0.0% |
| Science & Technology | 202 | 16.8% |
| Business | 233 | 19.4% |
| Education | 249 | 20.7% |
| Literature & Languages | 10 | 0.8% |
| Liberal Arts & History | 13 | 1.1% |
| Visual & Performing Arts | 15 | 1.3% |
| Communications | 14 | 1.2% |
| Arts & Humanities | 167 | 13.9% |
| Total | 1,203 | 100.0% |
Transportation & Commute in Jerseyville
Vehicle Availability by Sex in Jerseyville
The most prevalent vehicle ownership categories in Jerseyville are males with 2 vehicles (763, accounting for 45.1%) and females with 2 vehicles (681, making up 48.5%).
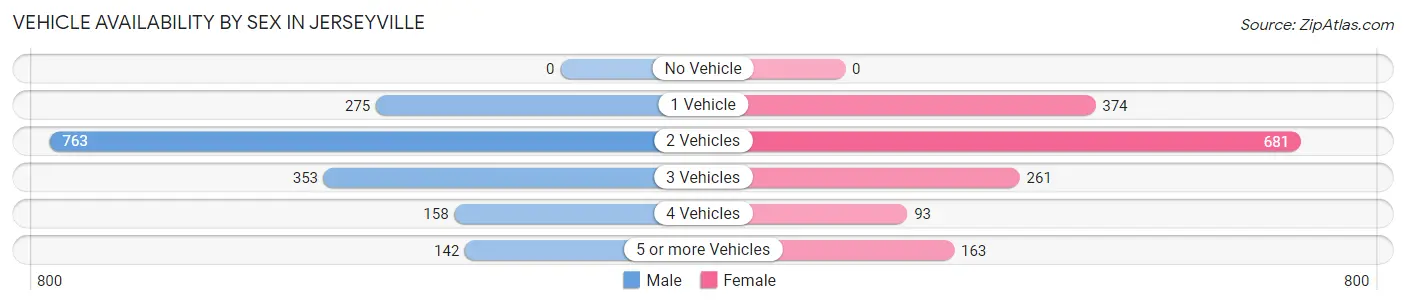
| Vehicles Available | Male | Female |
| No Vehicle | 0 (0.0%) | 0 (0.0%) |
| 1 Vehicle | 275 (16.3%) | 374 (23.8%) |
| 2 Vehicles | 763 (45.1%) | 681 (43.3%) |
| 3 Vehicles | 353 (20.9%) | 261 (16.6%) |
| 4 Vehicles | 158 (9.3%) | 93 (5.9%) |
| 5 or more Vehicles | 142 (8.4%) | 163 (10.4%) |
| Total | 1,691 (100.0%) | 1,572 (100.0%) |
Commute Time in Jerseyville
The most frequently occuring commute durations in Jerseyville are 5 to 9 minutes (580 commuters, 19.8%), less than 5 minutes (441 commuters, 15.1%), and 30 to 34 minutes (414 commuters, 14.1%).
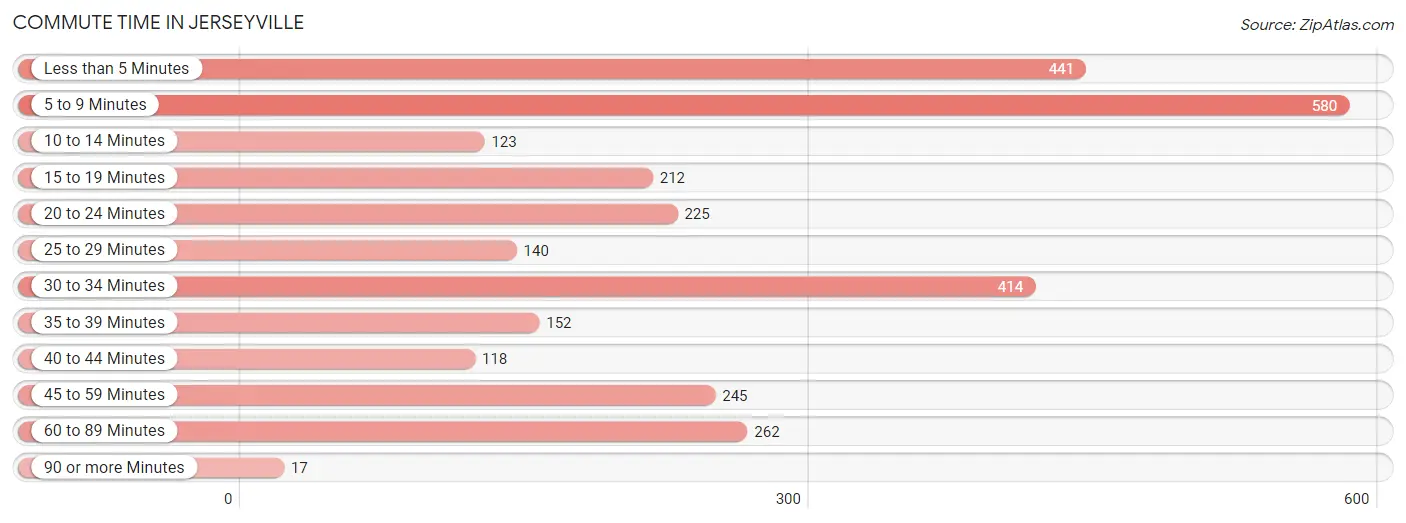
| Commute Time | # Commuters | % Commuters |
| Less than 5 Minutes | 441 | 15.1% |
| 5 to 9 Minutes | 580 | 19.8% |
| 10 to 14 Minutes | 123 | 4.2% |
| 15 to 19 Minutes | 212 | 7.2% |
| 20 to 24 Minutes | 225 | 7.7% |
| 25 to 29 Minutes | 140 | 4.8% |
| 30 to 34 Minutes | 414 | 14.1% |
| 35 to 39 Minutes | 152 | 5.2% |
| 40 to 44 Minutes | 118 | 4.0% |
| 45 to 59 Minutes | 245 | 8.4% |
| 60 to 89 Minutes | 262 | 8.9% |
| 90 or more Minutes | 17 | 0.6% |
Commute Time by Sex in Jerseyville
The most common commute times in Jerseyville are less than 5 minutes (267 commuters, 18.2%) for males and 5 to 9 minutes (407 commuters, 27.8%) for females.
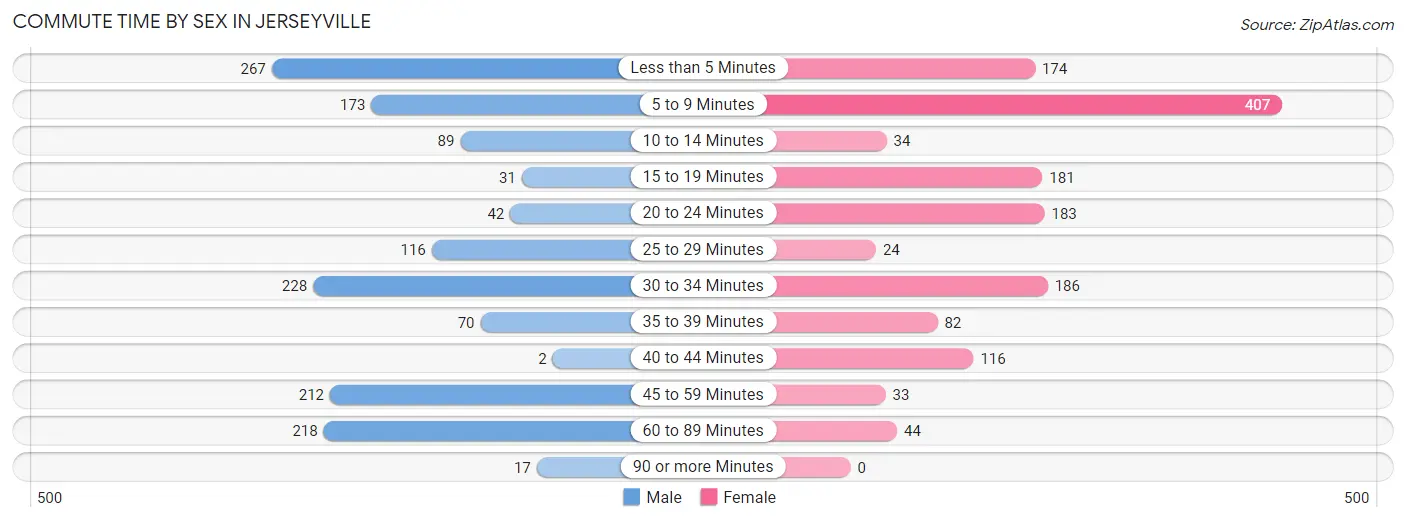
| Commute Time | Male | Female |
| Less than 5 Minutes | 267 (18.2%) | 174 (11.9%) |
| 5 to 9 Minutes | 173 (11.8%) | 407 (27.8%) |
| 10 to 14 Minutes | 89 (6.1%) | 34 (2.3%) |
| 15 to 19 Minutes | 31 (2.1%) | 181 (12.4%) |
| 20 to 24 Minutes | 42 (2.9%) | 183 (12.5%) |
| 25 to 29 Minutes | 116 (7.9%) | 24 (1.6%) |
| 30 to 34 Minutes | 228 (15.6%) | 186 (12.7%) |
| 35 to 39 Minutes | 70 (4.8%) | 82 (5.6%) |
| 40 to 44 Minutes | 2 (0.1%) | 116 (7.9%) |
| 45 to 59 Minutes | 212 (14.5%) | 33 (2.2%) |
| 60 to 89 Minutes | 218 (14.9%) | 44 (3.0%) |
| 90 or more Minutes | 17 (1.2%) | 0 (0.0%) |
Time of Departure to Work by Sex in Jerseyville
The most frequent times of departure to work in Jerseyville are 6:00 AM to 6:29 AM (322, 22.0%) for males and 7:30 AM to 7:59 AM (285, 19.5%) for females.
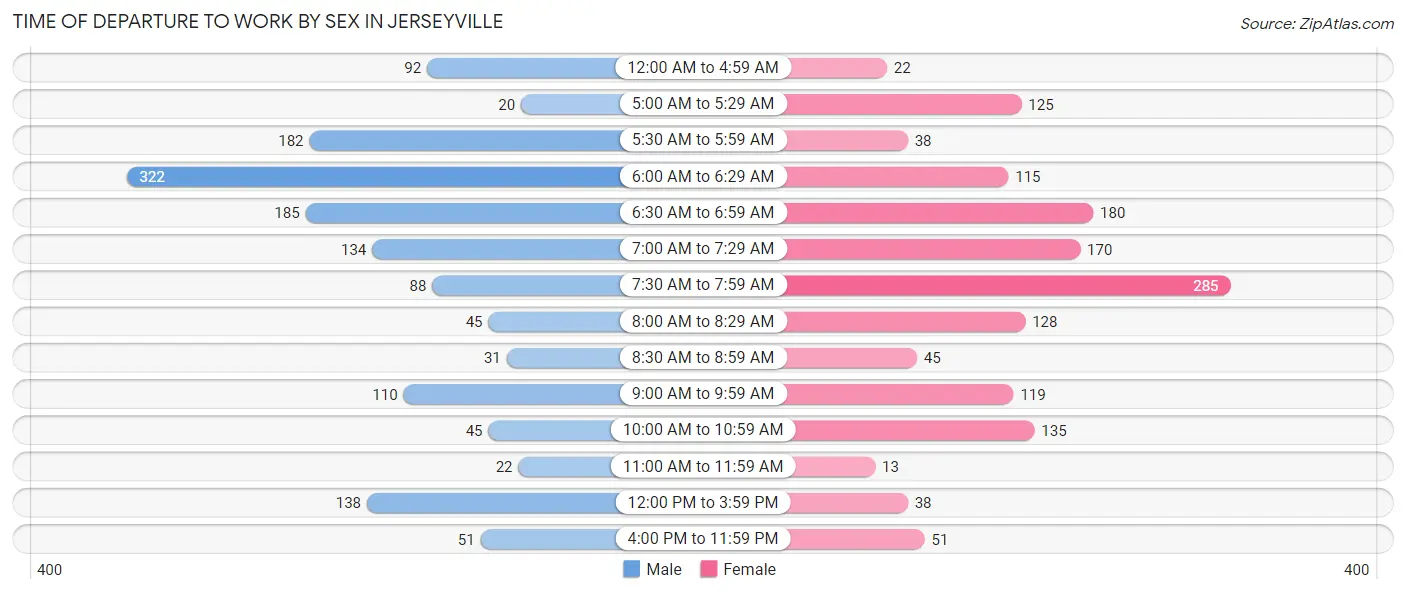
| Time of Departure | Male | Female |
| 12:00 AM to 4:59 AM | 92 (6.3%) | 22 (1.5%) |
| 5:00 AM to 5:29 AM | 20 (1.4%) | 125 (8.5%) |
| 5:30 AM to 5:59 AM | 182 (12.4%) | 38 (2.6%) |
| 6:00 AM to 6:29 AM | 322 (22.0%) | 115 (7.9%) |
| 6:30 AM to 6:59 AM | 185 (12.6%) | 180 (12.3%) |
| 7:00 AM to 7:29 AM | 134 (9.1%) | 170 (11.6%) |
| 7:30 AM to 7:59 AM | 88 (6.0%) | 285 (19.5%) |
| 8:00 AM to 8:29 AM | 45 (3.1%) | 128 (8.7%) |
| 8:30 AM to 8:59 AM | 31 (2.1%) | 45 (3.1%) |
| 9:00 AM to 9:59 AM | 110 (7.5%) | 119 (8.1%) |
| 10:00 AM to 10:59 AM | 45 (3.1%) | 135 (9.2%) |
| 11:00 AM to 11:59 AM | 22 (1.5%) | 13 (0.9%) |
| 12:00 PM to 3:59 PM | 138 (9.4%) | 38 (2.6%) |
| 4:00 PM to 11:59 PM | 51 (3.5%) | 51 (3.5%) |
| Total | 1,465 (100.0%) | 1,464 (100.0%) |
Housing Occupancy in Jerseyville
Occupancy by Ownership in Jerseyville
Of the total 2,921 dwellings in Jerseyville, owner-occupied units account for 1,976 (67.6%), while renter-occupied units make up 945 (32.4%).
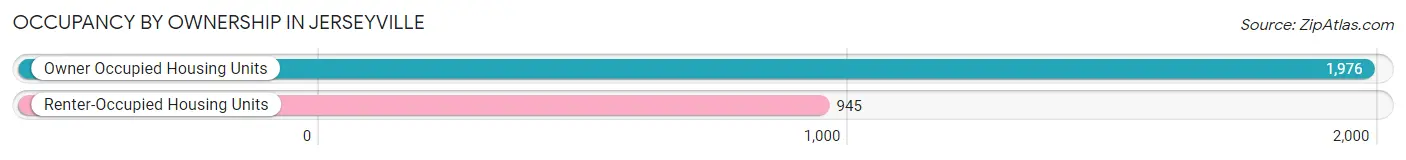
| Occupancy | # Housing Units | % Housing Units |
| Owner Occupied Housing Units | 1,976 | 67.6% |
| Renter-Occupied Housing Units | 945 | 32.4% |
| Total Occupied Housing Units | 2,921 | 100.0% |
Occupancy by Household Size in Jerseyville
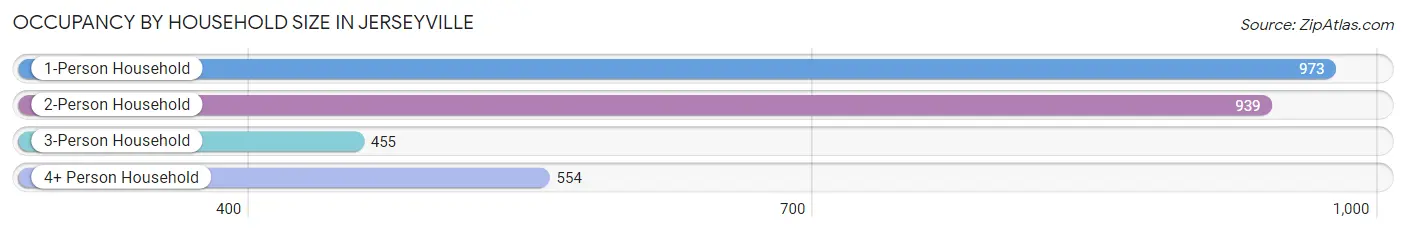
| Household Size | # Housing Units | % Housing Units |
| 1-Person Household | 973 | 33.3% |
| 2-Person Household | 939 | 32.2% |
| 3-Person Household | 455 | 15.6% |
| 4+ Person Household | 554 | 19.0% |
| Total Housing Units | 2,921 | 100.0% |
Occupancy by Ownership by Household Size in Jerseyville
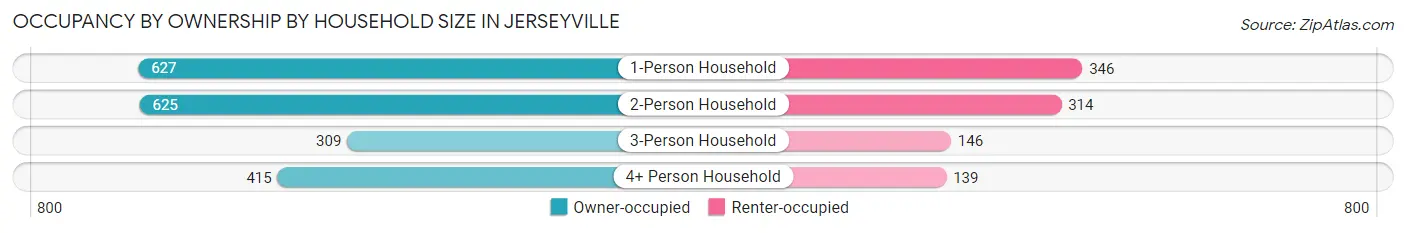
| Household Size | Owner-occupied | Renter-occupied |
| 1-Person Household | 627 (64.4%) | 346 (35.6%) |
| 2-Person Household | 625 (66.6%) | 314 (33.4%) |
| 3-Person Household | 309 (67.9%) | 146 (32.1%) |
| 4+ Person Household | 415 (74.9%) | 139 (25.1%) |
| Total Housing Units | 1,976 (67.6%) | 945 (32.4%) |
Occupancy by Educational Attainment in Jerseyville
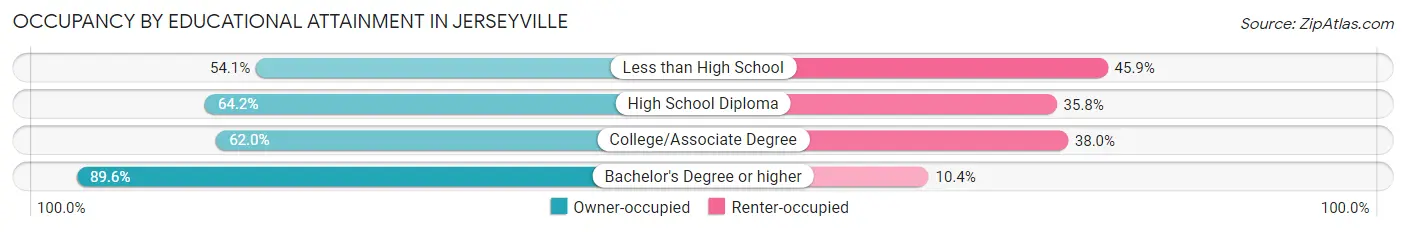
| Household Size | Owner-occupied | Renter-occupied |
| Less than High School | 158 (54.1%) | 134 (45.9%) |
| High School Diploma | 668 (64.2%) | 372 (35.8%) |
| College/Associate Degree | 615 (62.0%) | 377 (38.0%) |
| Bachelor's Degree or higher | 535 (89.6%) | 62 (10.4%) |
Occupancy by Age of Householder in Jerseyville
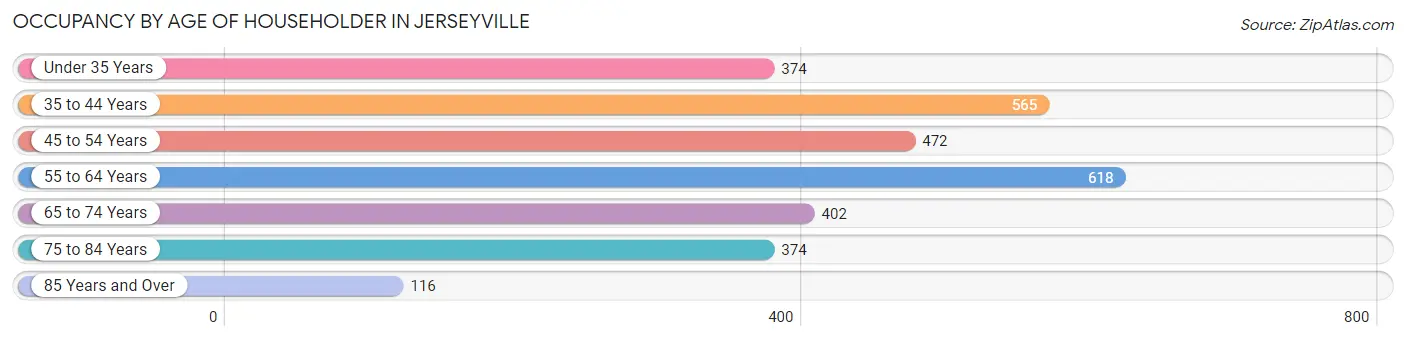
| Age Bracket | # Households | % Households |
| Under 35 Years | 374 | 12.8% |
| 35 to 44 Years | 565 | 19.3% |
| 45 to 54 Years | 472 | 16.2% |
| 55 to 64 Years | 618 | 21.2% |
| 65 to 74 Years | 402 | 13.8% |
| 75 to 84 Years | 374 | 12.8% |
| 85 Years and Over | 116 | 4.0% |
| Total | 2,921 | 100.0% |
Housing Finances in Jerseyville
Median Income by Occupancy in Jerseyville
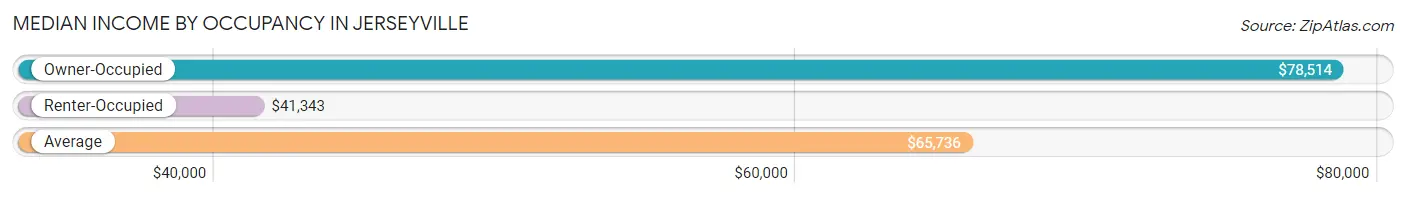
| Occupancy Type | # Households | Median Income |
| Owner-Occupied | 1,976 (67.6%) | $78,514 |
| Renter-Occupied | 945 (32.4%) | $41,343 |
| Average | 2,921 (100.0%) | $65,736 |
Occupancy by Householder Income Bracket in Jerseyville
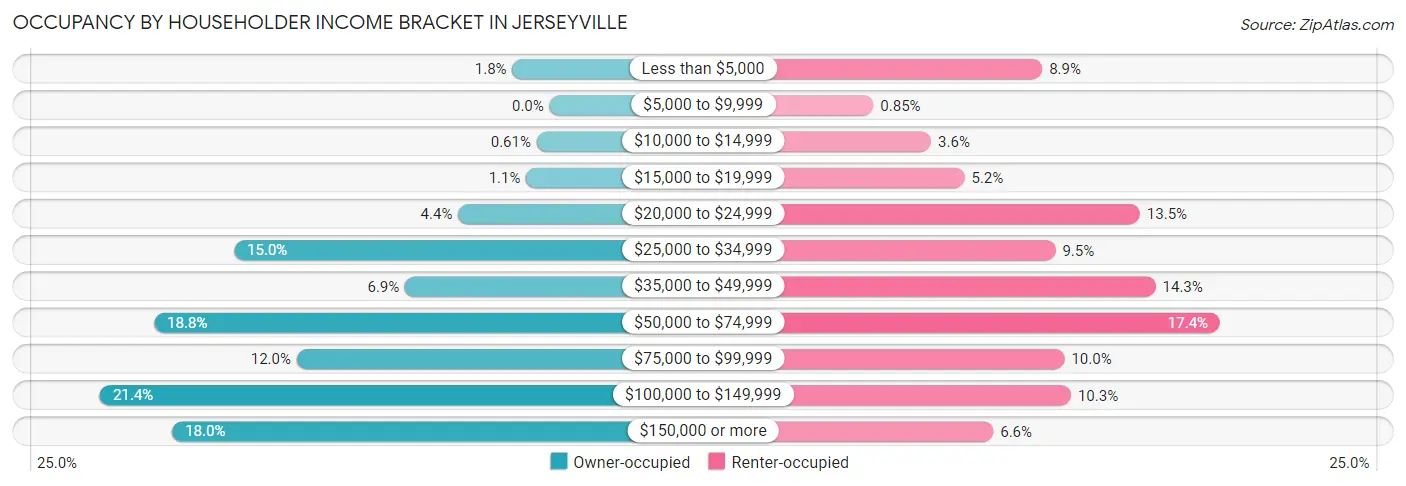
| Income Bracket | Owner-occupied | Renter-occupied |
| Less than $5,000 | 35 (1.8%) | 84 (8.9%) |
| $5,000 to $9,999 | 0 (0.0%) | 8 (0.9%) |
| $10,000 to $14,999 | 12 (0.6%) | 34 (3.6%) |
| $15,000 to $19,999 | 22 (1.1%) | 49 (5.2%) |
| $20,000 to $24,999 | 86 (4.3%) | 128 (13.5%) |
| $25,000 to $34,999 | 297 (15.0%) | 90 (9.5%) |
| $35,000 to $49,999 | 136 (6.9%) | 135 (14.3%) |
| $50,000 to $74,999 | 372 (18.8%) | 164 (17.3%) |
| $75,000 to $99,999 | 238 (12.0%) | 94 (10.0%) |
| $100,000 to $149,999 | 423 (21.4%) | 97 (10.3%) |
| $150,000 or more | 355 (18.0%) | 62 (6.6%) |
| Total | 1,976 (100.0%) | 945 (100.0%) |
Monthly Housing Cost Tiers in Jerseyville
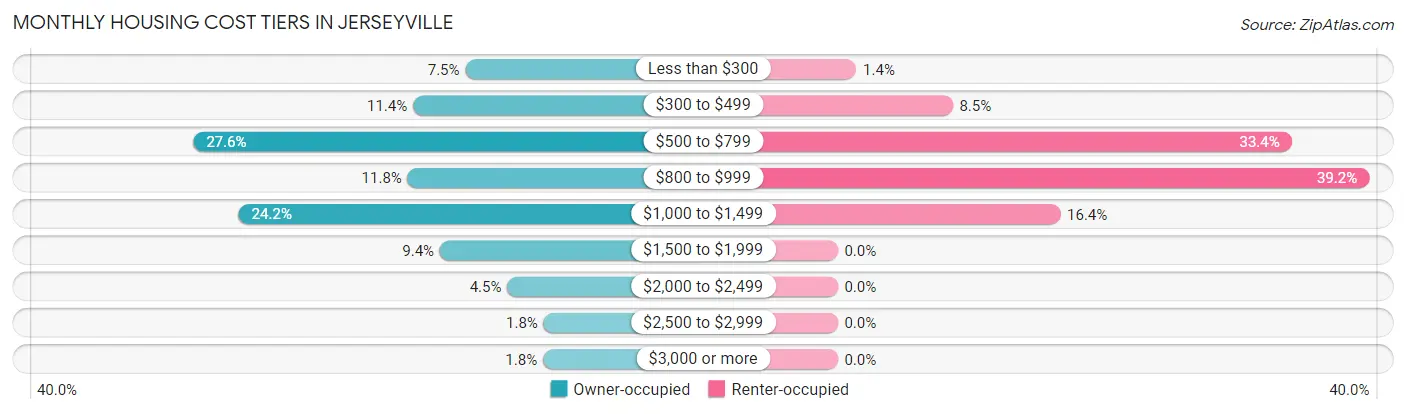
| Monthly Cost | Owner-occupied | Renter-occupied |
| Less than $300 | 149 (7.5%) | 13 (1.4%) |
| $300 to $499 | 225 (11.4%) | 80 (8.5%) |
| $500 to $799 | 545 (27.6%) | 316 (33.4%) |
| $800 to $999 | 233 (11.8%) | 370 (39.2%) |
| $1,000 to $1,499 | 479 (24.2%) | 155 (16.4%) |
| $1,500 to $1,999 | 186 (9.4%) | 0 (0.0%) |
| $2,000 to $2,499 | 88 (4.4%) | 0 (0.0%) |
| $2,500 to $2,999 | 35 (1.8%) | 0 (0.0%) |
| $3,000 or more | 36 (1.8%) | 0 (0.0%) |
| Total | 1,976 (100.0%) | 945 (100.0%) |
Physical Housing Characteristics in Jerseyville
Housing Structures in Jerseyville
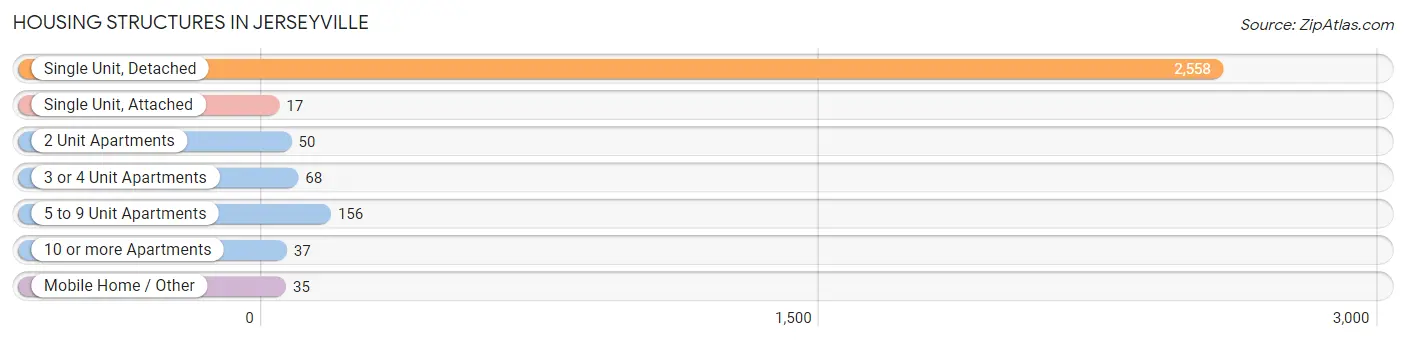
| Structure Type | # Housing Units | % Housing Units |
| Single Unit, Detached | 2,558 | 87.6% |
| Single Unit, Attached | 17 | 0.6% |
| 2 Unit Apartments | 50 | 1.7% |
| 3 or 4 Unit Apartments | 68 | 2.3% |
| 5 to 9 Unit Apartments | 156 | 5.3% |
| 10 or more Apartments | 37 | 1.3% |
| Mobile Home / Other | 35 | 1.2% |
| Total | 2,921 | 100.0% |
Housing Structures by Occupancy in Jerseyville
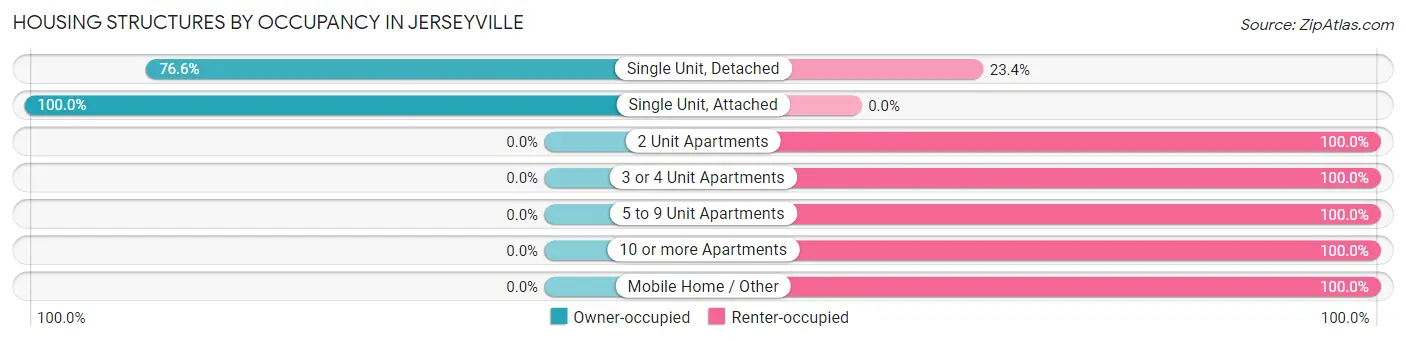
| Structure Type | Owner-occupied | Renter-occupied |
| Single Unit, Detached | 1,959 (76.6%) | 599 (23.4%) |
| Single Unit, Attached | 17 (100.0%) | 0 (0.0%) |
| 2 Unit Apartments | 0 (0.0%) | 50 (100.0%) |
| 3 or 4 Unit Apartments | 0 (0.0%) | 68 (100.0%) |
| 5 to 9 Unit Apartments | 0 (0.0%) | 156 (100.0%) |
| 10 or more Apartments | 0 (0.0%) | 37 (100.0%) |
| Mobile Home / Other | 0 (0.0%) | 35 (100.0%) |
| Total | 1,976 (67.6%) | 945 (32.4%) |
Housing Structures by Number of Rooms in Jerseyville
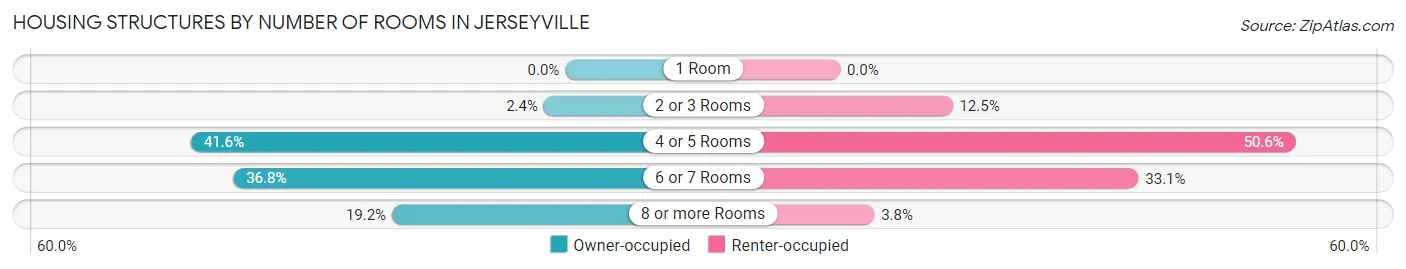
| Number of Rooms | Owner-occupied | Renter-occupied |
| 1 Room | 0 (0.0%) | 0 (0.0%) |
| 2 or 3 Rooms | 47 (2.4%) | 118 (12.5%) |
| 4 or 5 Rooms | 821 (41.5%) | 478 (50.6%) |
| 6 or 7 Rooms | 728 (36.8%) | 313 (33.1%) |
| 8 or more Rooms | 380 (19.2%) | 36 (3.8%) |
| Total | 1,976 (100.0%) | 945 (100.0%) |
Housing Structure by Heating Type in Jerseyville
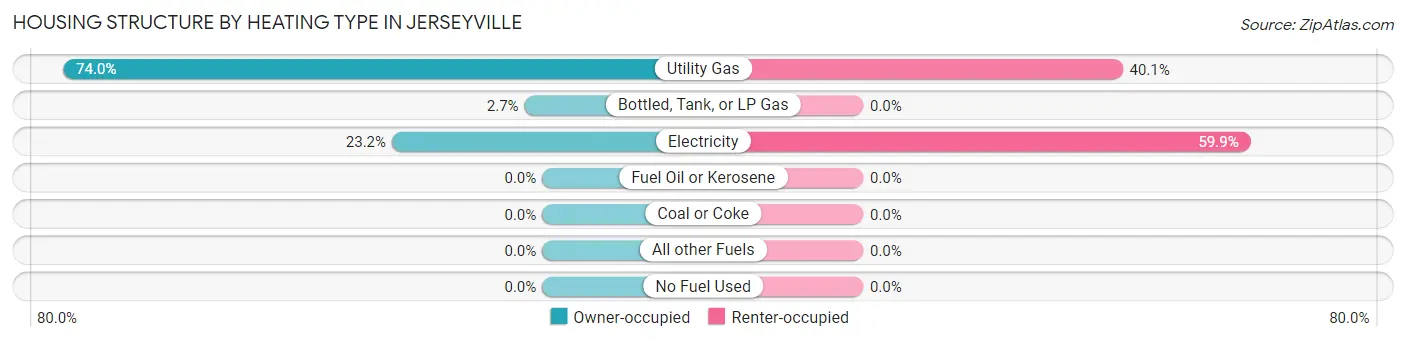
| Heating Type | Owner-occupied | Renter-occupied |
| Utility Gas | 1,463 (74.0%) | 379 (40.1%) |
| Bottled, Tank, or LP Gas | 54 (2.7%) | 0 (0.0%) |
| Electricity | 459 (23.2%) | 566 (59.9%) |
| Fuel Oil or Kerosene | 0 (0.0%) | 0 (0.0%) |
| Coal or Coke | 0 (0.0%) | 0 (0.0%) |
| All other Fuels | 0 (0.0%) | 0 (0.0%) |
| No Fuel Used | 0 (0.0%) | 0 (0.0%) |
| Total | 1,976 (100.0%) | 945 (100.0%) |
Household Vehicle Usage in Jerseyville
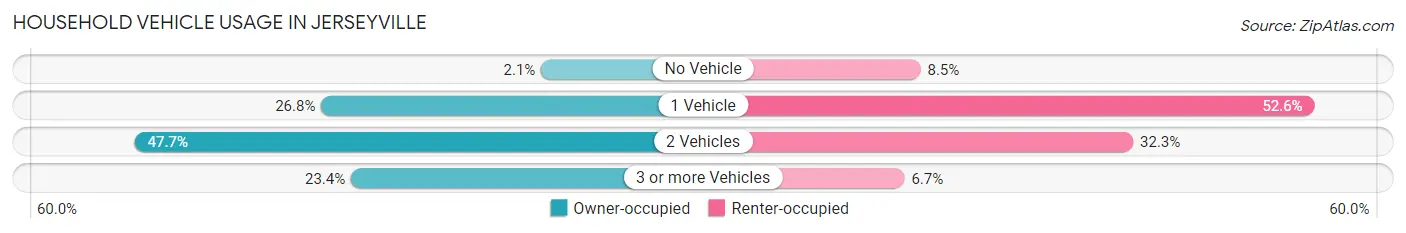
| Vehicles per Household | Owner-occupied | Renter-occupied |
| No Vehicle | 42 (2.1%) | 80 (8.5%) |
| 1 Vehicle | 529 (26.8%) | 497 (52.6%) |
| 2 Vehicles | 942 (47.7%) | 305 (32.3%) |
| 3 or more Vehicles | 463 (23.4%) | 63 (6.7%) |
| Total | 1,976 (100.0%) | 945 (100.0%) |
Real Estate & Mortgages in Jerseyville
Real Estate and Mortgage Overview in Jerseyville
| Characteristic | Without Mortgage | With Mortgage |
| Housing Units | 814 | 1,162 |
| Median Property Value | $114,900 | $119,300 |
| Median Household Income | $56,905 | $298 |
| Monthly Housing Costs | $538 | $36 |
| Real Estate Taxes | $1,998 | $0 |
Property Value by Mortgage Status in Jerseyville
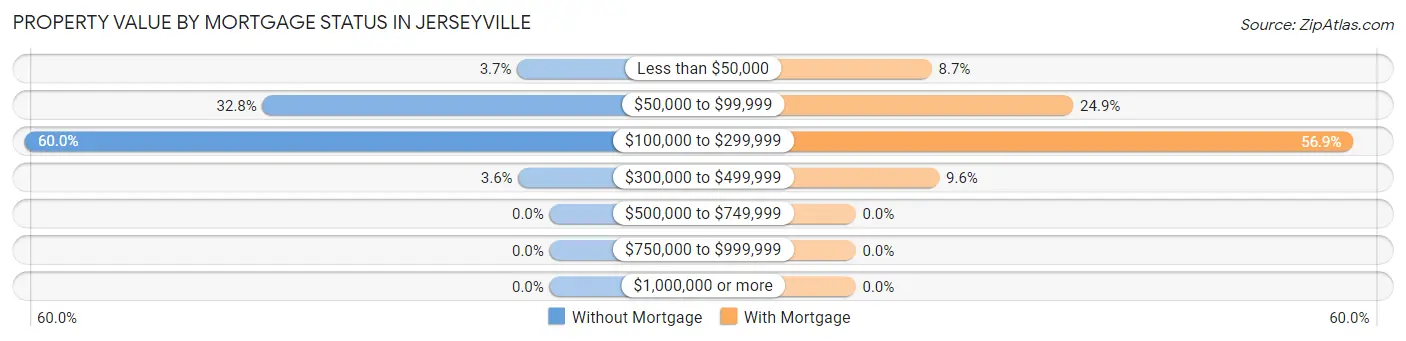
| Property Value | Without Mortgage | With Mortgage |
| Less than $50,000 | 30 (3.7%) | 101 (8.7%) |
| $50,000 to $99,999 | 267 (32.8%) | 289 (24.9%) |
| $100,000 to $299,999 | 488 (60.0%) | 661 (56.9%) |
| $300,000 to $499,999 | 29 (3.6%) | 111 (9.6%) |
| $500,000 to $749,999 | 0 (0.0%) | 0 (0.0%) |
| $750,000 to $999,999 | 0 (0.0%) | 0 (0.0%) |
| $1,000,000 or more | 0 (0.0%) | 0 (0.0%) |
| Total | 814 (100.0%) | 1,162 (100.0%) |
Household Income by Mortgage Status in Jerseyville
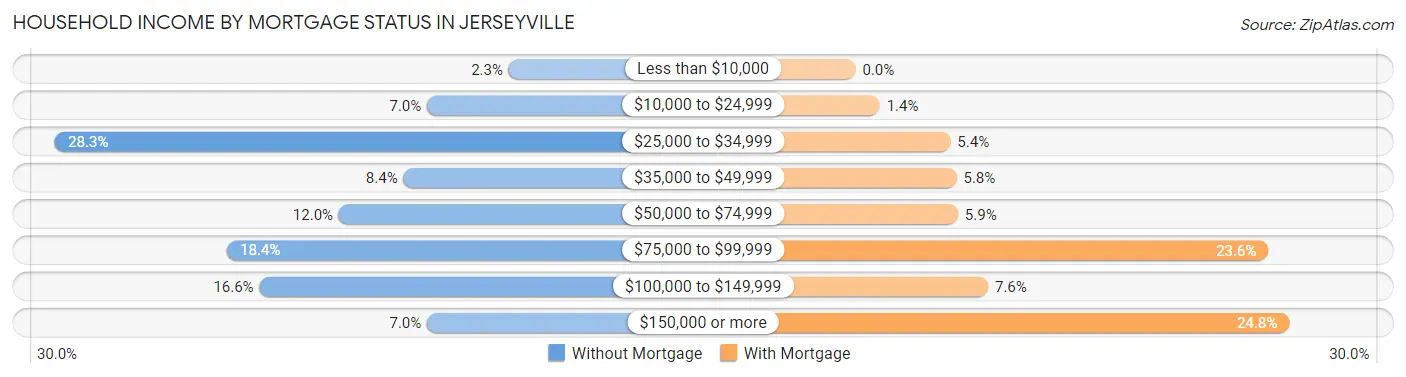
| Household Income | Without Mortgage | With Mortgage |
| Less than $10,000 | 19 (2.3%) | 0 (0.0%) |
| $10,000 to $24,999 | 57 (7.0%) | 16 (1.4%) |
| $25,000 to $34,999 | 230 (28.3%) | 63 (5.4%) |
| $35,000 to $49,999 | 68 (8.4%) | 67 (5.8%) |
| $50,000 to $74,999 | 98 (12.0%) | 68 (5.9%) |
| $75,000 to $99,999 | 150 (18.4%) | 274 (23.6%) |
| $100,000 to $149,999 | 135 (16.6%) | 88 (7.6%) |
| $150,000 or more | 57 (7.0%) | 288 (24.8%) |
| Total | 814 (100.0%) | 1,162 (100.0%) |
Property Value to Household Income Ratio in Jerseyville
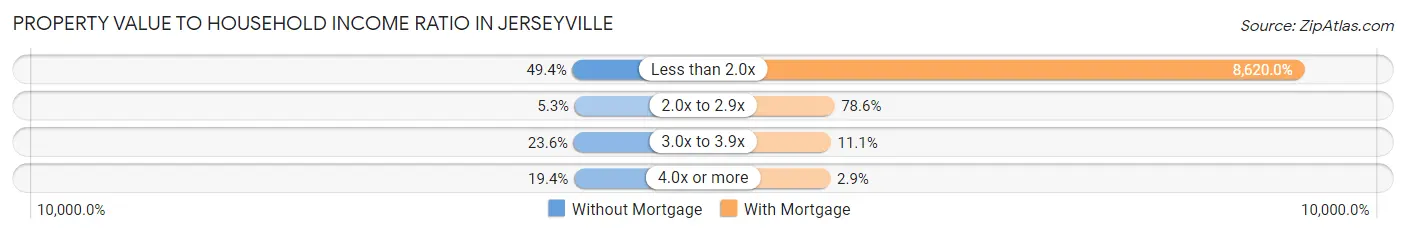
| Value-to-Income Ratio | Without Mortgage | With Mortgage |
| Less than 2.0x | 402 (49.4%) | 100,164 (8,620.0%) |
| 2.0x to 2.9x | 43 (5.3%) | 913 (78.6%) |
| 3.0x to 3.9x | 192 (23.6%) | 129 (11.1%) |
| 4.0x or more | 158 (19.4%) | 34 (2.9%) |
| Total | 814 (100.0%) | 1,162 (100.0%) |
Real Estate Taxes by Mortgage Status in Jerseyville
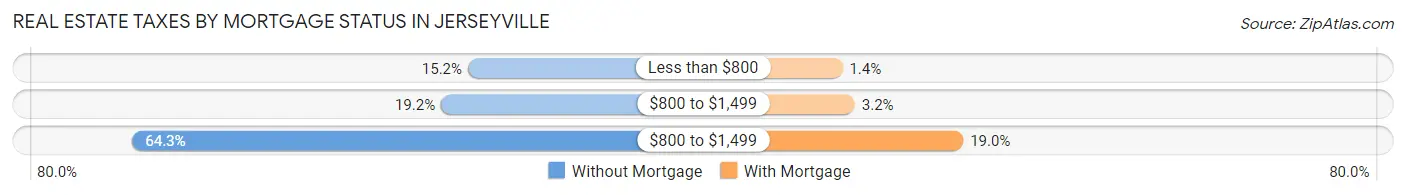
| Property Taxes | Without Mortgage | With Mortgage |
| Less than $800 | 124 (15.2%) | 16 (1.4%) |
| $800 to $1,499 | 156 (19.2%) | 37 (3.2%) |
| $800 to $1,499 | 523 (64.2%) | 221 (19.0%) |
| Total | 814 (100.0%) | 1,162 (100.0%) |
Health & Disability in Jerseyville
Health Insurance Coverage by Age in Jerseyville
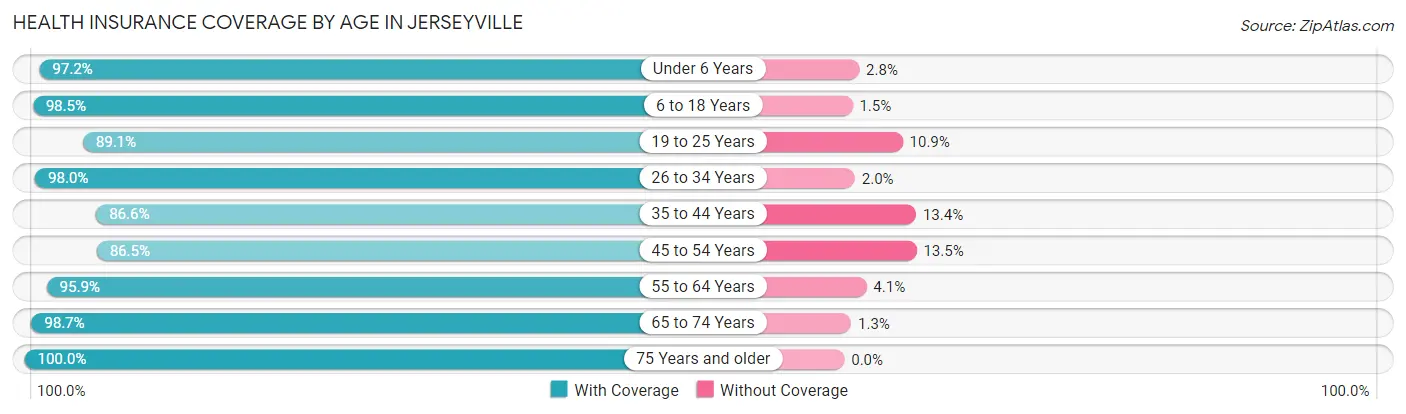
| Age Bracket | With Coverage | Without Coverage |
| Under 6 Years | 527 (97.2%) | 15 (2.8%) |
| 6 to 18 Years | 1,169 (98.5%) | 18 (1.5%) |
| 19 to 25 Years | 533 (89.1%) | 65 (10.9%) |
| 26 to 34 Years | 796 (98.0%) | 16 (2.0%) |
| 35 to 44 Years | 771 (86.6%) | 119 (13.4%) |
| 45 to 54 Years | 804 (86.5%) | 125 (13.5%) |
| 55 to 64 Years | 1,024 (95.9%) | 44 (4.1%) |
| 65 to 74 Years | 620 (98.7%) | 8 (1.3%) |
| 75 Years and older | 675 (100.0%) | 0 (0.0%) |
| Total | 6,919 (94.4%) | 410 (5.6%) |
Health Insurance Coverage by Citizenship Status in Jerseyville
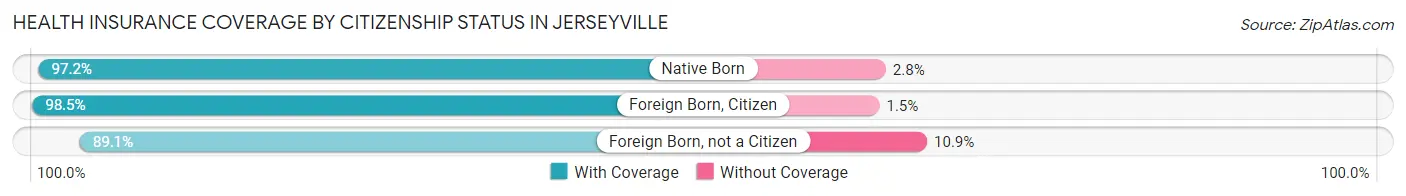
| Citizenship Status | With Coverage | Without Coverage |
| Native Born | 527 (97.2%) | 15 (2.8%) |
| Foreign Born, Citizen | 1,169 (98.5%) | 18 (1.5%) |
| Foreign Born, not a Citizen | 533 (89.1%) | 65 (10.9%) |
Health Insurance Coverage by Household Income in Jerseyville
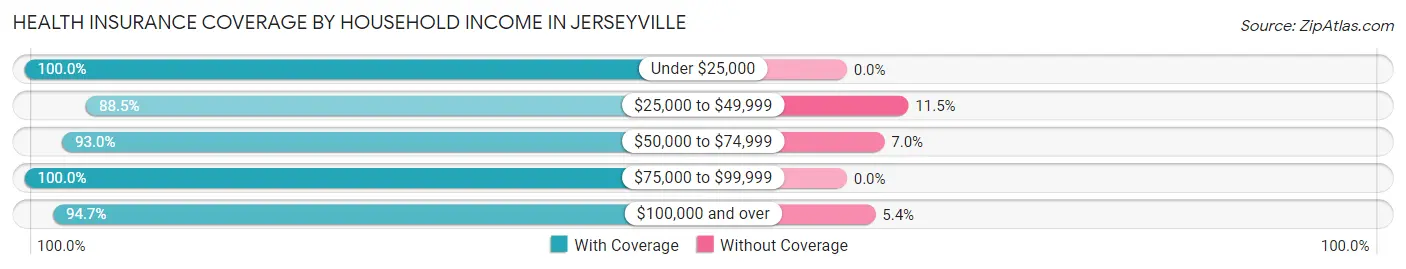
| Household Income | With Coverage | Without Coverage |
| Under $25,000 | 750 (100.0%) | 0 (0.0%) |
| $25,000 to $49,999 | 1,142 (88.5%) | 149 (11.5%) |
| $50,000 to $74,999 | 1,098 (93.0%) | 83 (7.0%) |
| $75,000 to $99,999 | 762 (100.0%) | 0 (0.0%) |
| $100,000 and over | 3,150 (94.7%) | 178 (5.3%) |
Public vs Private Health Insurance Coverage by Age in Jerseyville
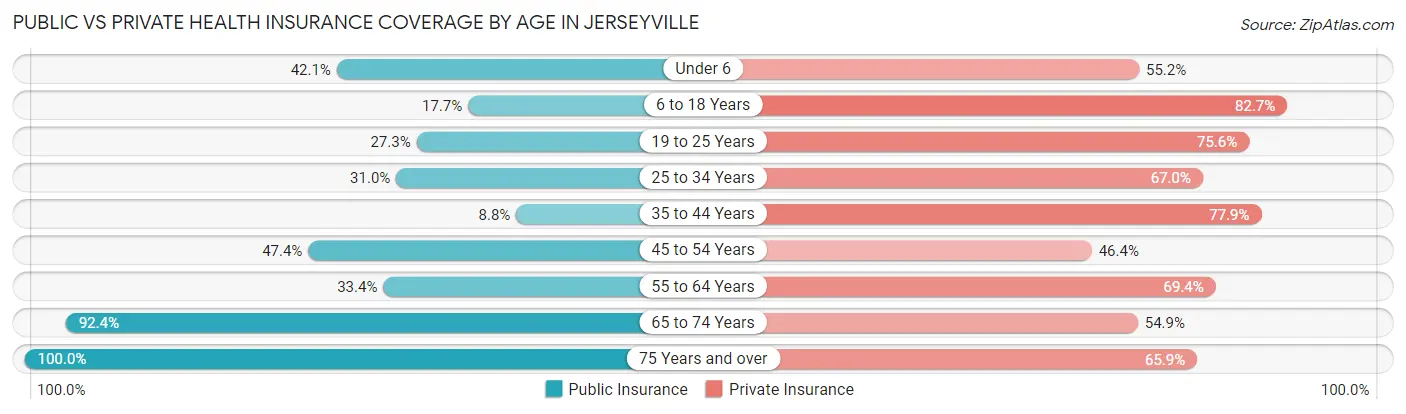
| Age Bracket | Public Insurance | Private Insurance |
| Under 6 | 228 (42.1%) | 299 (55.2%) |
| 6 to 18 Years | 210 (17.7%) | 981 (82.7%) |
| 19 to 25 Years | 163 (27.3%) | 452 (75.6%) |
| 25 to 34 Years | 252 (31.0%) | 544 (67.0%) |
| 35 to 44 Years | 78 (8.8%) | 693 (77.9%) |
| 45 to 54 Years | 440 (47.4%) | 431 (46.4%) |
| 55 to 64 Years | 357 (33.4%) | 741 (69.4%) |
| 65 to 74 Years | 580 (92.4%) | 345 (54.9%) |
| 75 Years and over | 675 (100.0%) | 445 (65.9%) |
| Total | 2,983 (40.7%) | 4,931 (67.3%) |
Disability Status by Sex by Age in Jerseyville
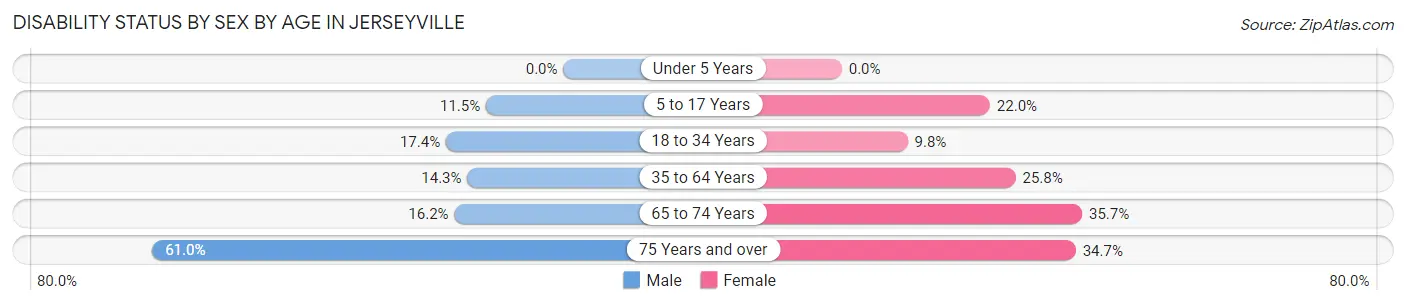
| Age Bracket | Male | Female |
| Under 5 Years | 0 (0.0%) | 0 (0.0%) |
| 5 to 17 Years | 63 (11.5%) | 159 (22.0%) |
| 18 to 34 Years | 129 (17.4%) | 68 (9.8%) |
| 35 to 64 Years | 175 (14.2%) | 428 (25.8%) |
| 65 to 74 Years | 44 (16.2%) | 127 (35.7%) |
| 75 Years and over | 152 (61.0%) | 148 (34.7%) |
Disability Class by Sex by Age in Jerseyville
Disability Class: Hearing Difficulty
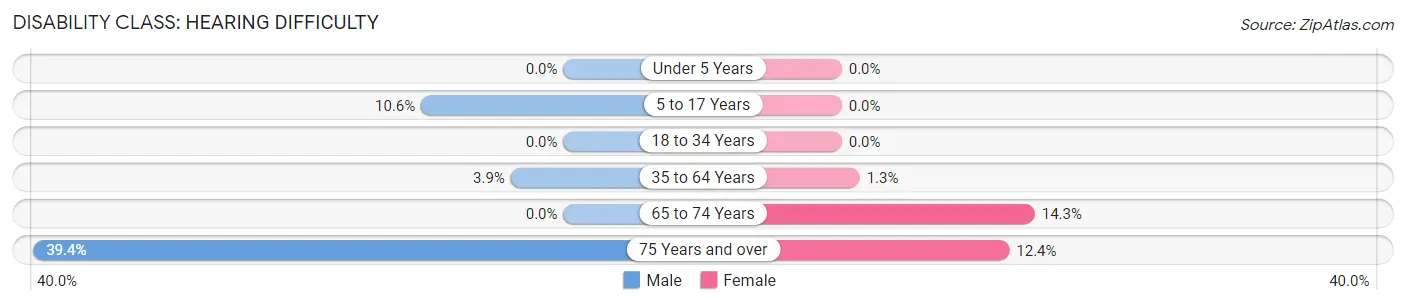
| Age Bracket | Male | Female |
| Under 5 Years | 0 (0.0%) | 0 (0.0%) |
| 5 to 17 Years | 58 (10.6%) | 0 (0.0%) |
| 18 to 34 Years | 0 (0.0%) | 0 (0.0%) |
| 35 to 64 Years | 48 (3.9%) | 22 (1.3%) |
| 65 to 74 Years | 0 (0.0%) | 51 (14.3%) |
| 75 Years and over | 98 (39.4%) | 53 (12.4%) |
Disability Class: Vision Difficulty
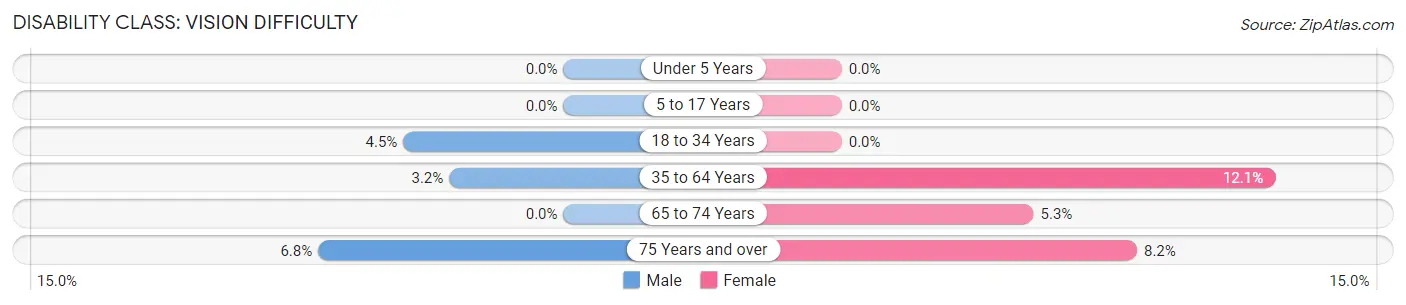
| Age Bracket | Male | Female |
| Under 5 Years | 0 (0.0%) | 0 (0.0%) |
| 5 to 17 Years | 0 (0.0%) | 0 (0.0%) |
| 18 to 34 Years | 33 (4.5%) | 0 (0.0%) |
| 35 to 64 Years | 39 (3.2%) | 200 (12.1%) |
| 65 to 74 Years | 0 (0.0%) | 19 (5.3%) |
| 75 Years and over | 17 (6.8%) | 35 (8.2%) |
Disability Class: Cognitive Difficulty
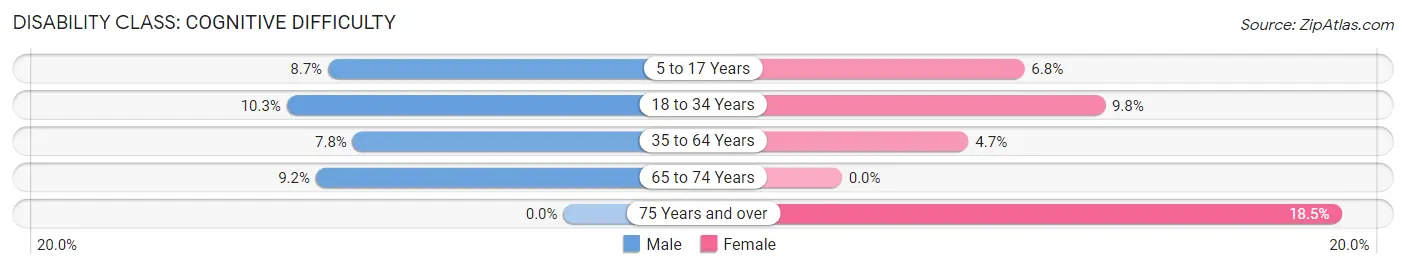
| Age Bracket | Male | Female |
| 5 to 17 Years | 48 (8.7%) | 49 (6.8%) |
| 18 to 34 Years | 76 (10.3%) | 68 (9.8%) |
| 35 to 64 Years | 96 (7.8%) | 78 (4.7%) |
| 65 to 74 Years | 25 (9.2%) | 0 (0.0%) |
| 75 Years and over | 0 (0.0%) | 79 (18.5%) |
Disability Class: Ambulatory Difficulty
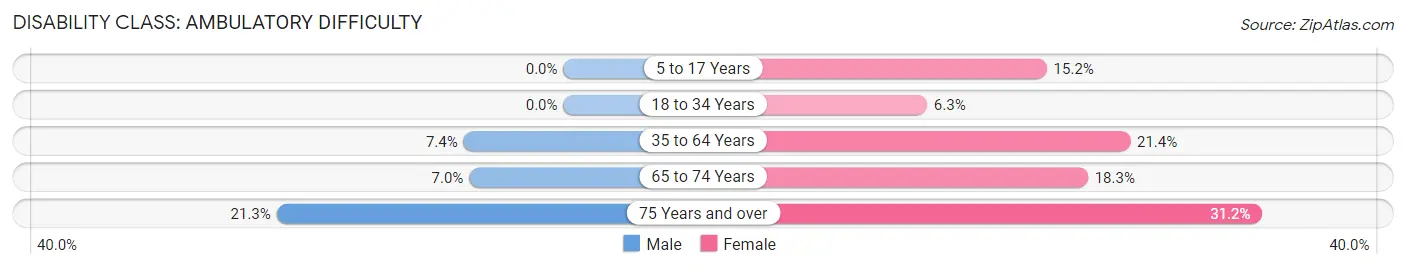
| Age Bracket | Male | Female |
| 5 to 17 Years | 0 (0.0%) | 110 (15.2%) |
| 18 to 34 Years | 0 (0.0%) | 44 (6.3%) |
| 35 to 64 Years | 91 (7.4%) | 355 (21.4%) |
| 65 to 74 Years | 19 (7.0%) | 65 (18.3%) |
| 75 Years and over | 53 (21.3%) | 133 (31.2%) |
Disability Class: Self-Care Difficulty
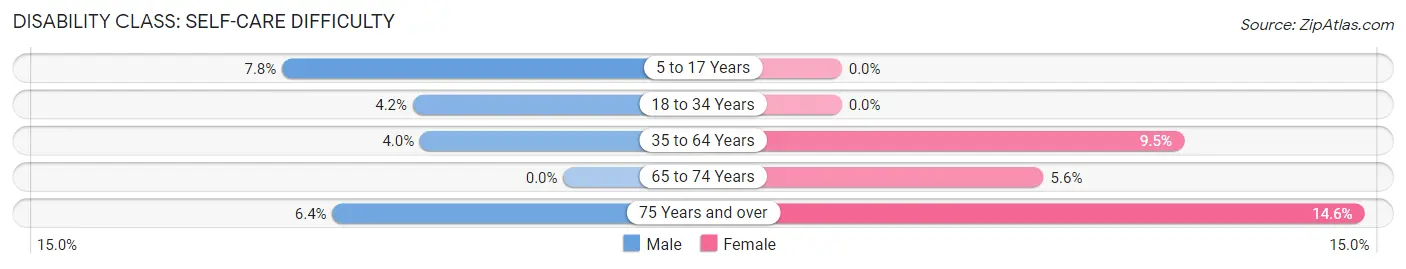
| Age Bracket | Male | Female |
| 5 to 17 Years | 43 (7.8%) | 0 (0.0%) |
| 18 to 34 Years | 31 (4.2%) | 0 (0.0%) |
| 35 to 64 Years | 49 (4.0%) | 158 (9.5%) |
| 65 to 74 Years | 0 (0.0%) | 20 (5.6%) |
| 75 Years and over | 16 (6.4%) | 62 (14.5%) |
Technology Access in Jerseyville
Computing Device Access in Jerseyville
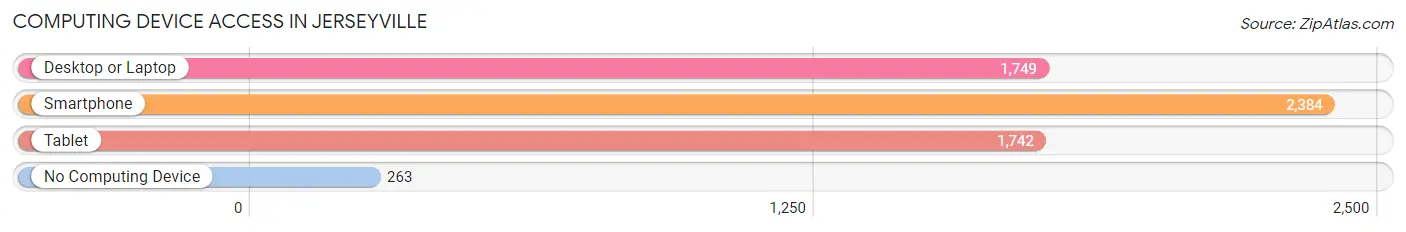
| Device Type | # Households | % Households |
| Desktop or Laptop | 1,749 | 59.9% |
| Smartphone | 2,384 | 81.6% |
| Tablet | 1,742 | 59.6% |
| No Computing Device | 263 | 9.0% |
| Total | 2,921 | 100.0% |
Internet Access in Jerseyville
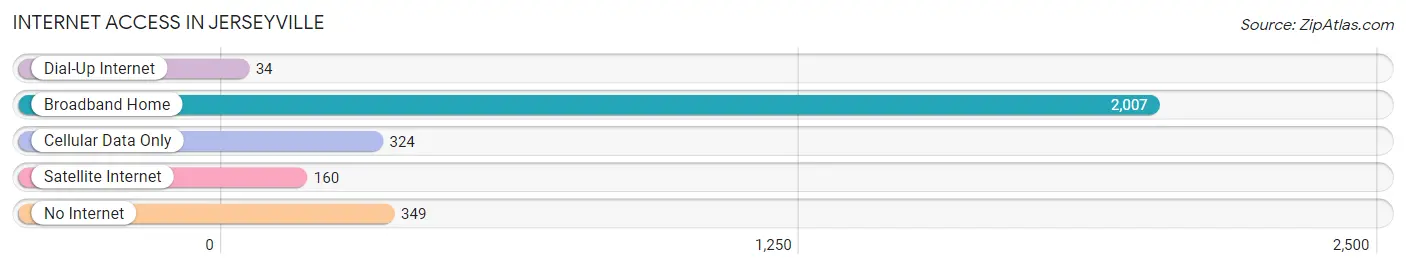
| Internet Type | # Households | % Households |
| Dial-Up Internet | 34 | 1.2% |
| Broadband Home | 2,007 | 68.7% |
| Cellular Data Only | 324 | 11.1% |
| Satellite Internet | 160 | 5.5% |
| No Internet | 349 | 11.9% |
| Total | 2,921 | 100.0% |
Jerseyville Summary
Jerseyville, Illinois is a small city located in the southwestern corner of the state, about 40 miles north of St. Louis, Missouri. It is the county seat of Jersey County and has a population of 8,465 as of the 2010 census. The city is situated along the banks of the Mississippi River and is home to a variety of businesses, industries, and recreational activities.
History
The area that is now Jerseyville was first settled in 1819 by a group of pioneers from New Jersey. The city was officially incorporated in 1839 and was named after the state of New Jersey. The city was an important stop on the Underground Railroad, and many escaped slaves found refuge in Jerseyville.
During the Civil War, Jerseyville was a major supply center for the Union Army. The city was also the site of a major battle in 1862, when Confederate forces attempted to capture the city. The Union forces were successful in defending the city and the Confederate forces were forced to retreat.
Geography
Jerseyville is located in the southwestern corner of Illinois, about 40 miles north of St. Louis, Missouri. The city is situated along the banks of the Mississippi River and is surrounded by rolling hills and farmland. The city has a total area of 4.2 square miles, all of which is land.
Climate
Jerseyville has a humid continental climate, with hot, humid summers and cold, snowy winters. The average temperature in the summer is around 80 degrees Fahrenheit, while the average temperature in the winter is around 30 degrees Fahrenheit. The city receives an average of 40 inches of precipitation per year, with most of it falling in the spring and summer months.
Economy
The economy of Jerseyville is largely based on agriculture and manufacturing. The city is home to several large agricultural companies, including Monsanto, Cargill, and ADM. The city is also home to several manufacturing companies, including a paper mill, a plastics factory, and a metal fabrication plant.
In addition to agriculture and manufacturing, Jerseyville is also home to a variety of retail stores, restaurants, and other businesses. The city is also home to a number of medical facilities, including a hospital, a nursing home, and several clinics.
Demographics
As of the 2010 census, Jerseyville had a population of 8,465. The racial makeup of the city was 95.3% White, 1.2% African American, 0.4% Native American, 0.7% Asian, 0.1% Pacific Islander, 0.7% from other races, and 1.6% from two or more races. Hispanic or Latino of any race were 2.2% of the population.
The median household income in Jerseyville was $45,945, and the median family income was $54,945. The per capita income for the city was $21,945. About 11.2% of families and 14.2% of the population were below the poverty line, including 19.2% of those under age 18 and 8.2% of those age 65 or over.
Conclusion
Jerseyville, Illinois is a small city located in the southwestern corner of the state, about 40 miles north of St. Louis, Missouri. It is the county seat of Jersey County and has a population of 8,465 as of the 2010 census. The city is situated along the banks of the Mississippi River and is home to a variety of businesses, industries, and recreational activities. The economy of Jerseyville is largely based on agriculture and manufacturing, and the city is home to a variety of retail stores, restaurants, and other businesses. The racial makeup of the city is 95.3% White, 1.2% African American, 0.4% Native American, 0.7% Asian, 0.1% Pacific Islander, 0.7% from other races, and 1.6% from two or more races. The median household income in Jerseyville was $45,945, and the median family income was $54,945. Jerseyville is a vibrant city with a rich history and a bright future.
Common Questions
What is Per Capita Income in Jerseyville?
Per Capita income in Jerseyville is $32,577.
What is the Median Family Income in Jerseyville?
Median Family Income in Jerseyville is $88,426.
What is the Median Household income in Jerseyville?
Median Household Income in Jerseyville is $65,736.
What is Income or Wage Gap in Jerseyville?
Income or Wage Gap in Jerseyville is 30.3%.
Women in Jerseyville earn 69.7 cents for every dollar earned by a man.
What is Inequality or Gini Index in Jerseyville?
Inequality or Gini Index in Jerseyville is 0.42.
What is the Total Population of Jerseyville?
Total Population of Jerseyville is 7,623.
What is the Total Male Population of Jerseyville?
Total Male Population of Jerseyville is 3,364.
What is the Total Female Population of Jerseyville?
Total Female Population of Jerseyville is 4,259.
What is the Ratio of Males per 100 Females in Jerseyville?
There are 78.99 Males per 100 Females in Jerseyville.
What is the Ratio of Females per 100 Males in Jerseyville?
There are 126.61 Females per 100 Males in Jerseyville.
What is the Median Population Age in Jerseyville?
Median Population Age in Jerseyville is 42.2 Years.
What is the Average Family Size in Jerseyville
Average Family Size in Jerseyville is 3.2 People.
What is the Average Household Size in Jerseyville
Average Household Size in Jerseyville is 2.5 People.
How Large is the Labor Force in Jerseyville?
There are 3,400 People in the Labor Forcein in Jerseyville.
What is the Percentage of People in the Labor Force in Jerseyville?
55.8% of People are in the Labor Force in Jerseyville.
What is the Unemployment Rate in Jerseyville?
Unemployment Rate in Jerseyville is 2.7%.