Savanna, IL Map & Demographics
Savanna Map
Savanna Overview
$29,396
PER CAPITA INCOME
$54,886
AVG FAMILY INCOME
$45,474
AVG HOUSEHOLD INCOME
4.1%
WAGE / INCOME GAP [ % ]
95.9¢/ $1
WAGE / INCOME GAP [ $ ]
0.49
INEQUALITY / GINI INDEX
2,783
TOTAL POPULATION
1,413
MALE POPULATION
1,370
FEMALE POPULATION
103.14
MALES / 100 FEMALES
96.96
FEMALES / 100 MALES
47.3
MEDIAN AGE
3.2
AVG FAMILY SIZE
2.1
AVG HOUSEHOLD SIZE
1,240
LABOR FORCE [ PEOPLE ]
51.5%
PERCENT IN LABOR FORCE
6.1%
UNEMPLOYMENT RATE
Savanna Zip Codes
Savanna Area Codes
Income in Savanna
Income Overview in Savanna
Per Capita Income in Savanna is $29,396, while median incomes of families and households are $54,886 and $45,474 respectively.
| Characteristic | Number | Measure |
| Per Capita Income | 2,783 | $29,396 |
| Median Family Income | 575 | $54,886 |
| Mean Family Income | 575 | $63,806 |
| Median Household Income | 1,319 | $45,474 |
| Mean Household Income | 1,319 | $61,099 |
| Income Deficit | 575 | $0 |
| Wage / Income Gap (%) | 2,783 | 4.06% |
| Wage / Income Gap ($) | 2,783 | 95.94¢ per $1 |
| Gini / Inequality Index | 2,783 | 0.49 |
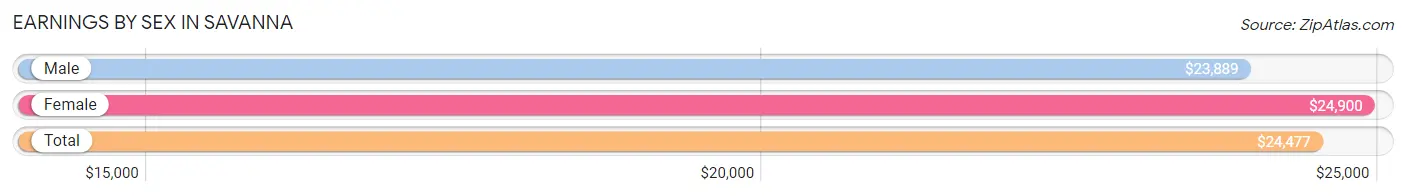
Earnings by Sex in Savanna
Average Earnings in Savanna are $24,477, $23,889 for men and $24,900 for women, a difference of 4.1%.
| Sex | Number | Average Earnings |
| Male | 878 (66.0%) | $23,889 |
| Female | 452 (34.0%) | $24,900 |
| Total | 1,330 (100.0%) | $24,477 |
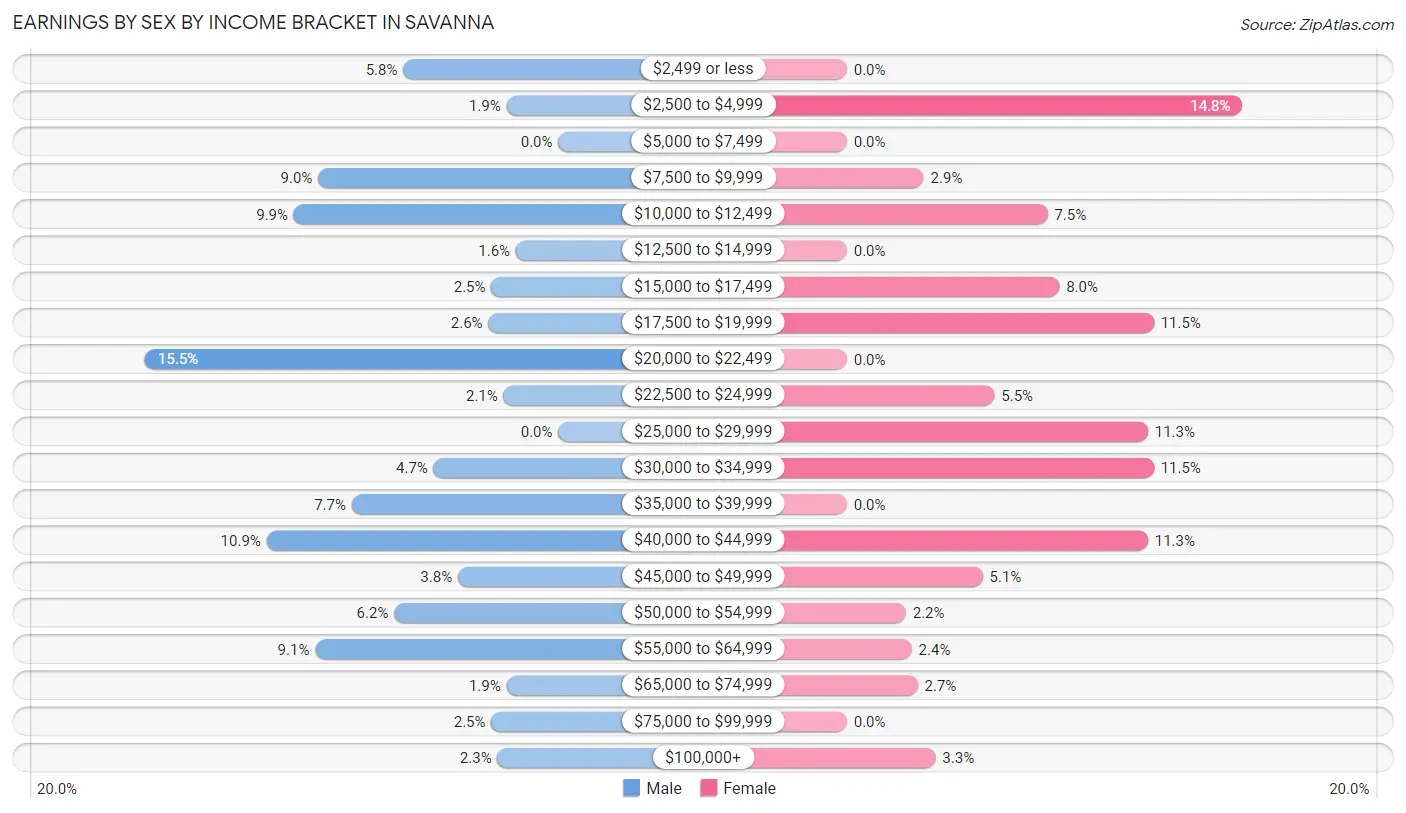
Earnings by Sex by Income Bracket in Savanna
The most common earnings brackets in Savanna are $20,000 to $22,499 for men (136 | 15.5%) and $2,500 to $4,999 for women (67 | 14.8%).
| Income | Male | Female |
| $2,499 or less | 51 (5.8%) | 0 (0.0%) |
| $2,500 to $4,999 | 17 (1.9%) | 67 (14.8%) |
| $5,000 to $7,499 | 0 (0.0%) | 0 (0.0%) |
| $7,500 to $9,999 | 79 (9.0%) | 13 (2.9%) |
| $10,000 to $12,499 | 87 (9.9%) | 34 (7.5%) |
| $12,500 to $14,999 | 14 (1.6%) | 0 (0.0%) |
| $15,000 to $17,499 | 22 (2.5%) | 36 (8.0%) |
| $17,500 to $19,999 | 23 (2.6%) | 52 (11.5%) |
| $20,000 to $22,499 | 136 (15.5%) | 0 (0.0%) |
| $22,500 to $24,999 | 18 (2.1%) | 25 (5.5%) |
| $25,000 to $29,999 | 0 (0.0%) | 51 (11.3%) |
| $30,000 to $34,999 | 41 (4.7%) | 52 (11.5%) |
| $35,000 to $39,999 | 68 (7.7%) | 0 (0.0%) |
| $40,000 to $44,999 | 96 (10.9%) | 51 (11.3%) |
| $45,000 to $49,999 | 33 (3.8%) | 23 (5.1%) |
| $50,000 to $54,999 | 54 (6.1%) | 10 (2.2%) |
| $55,000 to $64,999 | 80 (9.1%) | 11 (2.4%) |
| $65,000 to $74,999 | 17 (1.9%) | 12 (2.6%) |
| $75,000 to $99,999 | 22 (2.5%) | 0 (0.0%) |
| $100,000+ | 20 (2.3%) | 15 (3.3%) |
| Total | 878 (100.0%) | 452 (100.0%) |
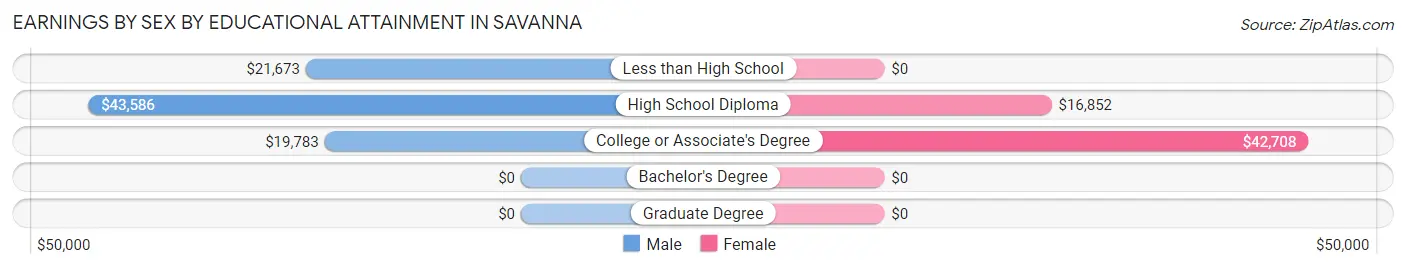
Earnings by Sex by Educational Attainment in Savanna
Average earnings in Savanna are $22,335 for men and $30,341 for women, a difference of 26.4%. Men with an educational attainment of high school diploma enjoy the highest average annual earnings of $43,586, while those with college or associate's degree education earn the least with $19,783. Women with an educational attainment of college or associate's degree earn the most with the average annual earnings of $42,708, while those with high school diploma education have the smallest earnings of $16,852.
| Educational Attainment | Male Income | Female Income |
| Less than High School | $21,673 | $0 |
| High School Diploma | $43,586 | $16,852 |
| College or Associate's Degree | $19,783 | $42,708 |
| Bachelor's Degree | - | - |
| Graduate Degree | - | - |
| Total | $22,335 | $30,341 |
Family Income in Savanna
Family Income Brackets in Savanna
According to the Savanna family income data, there are 217 families falling into the $50,000 to $74,999 income range, which is the most common income bracket and makes up 37.7% of all families.
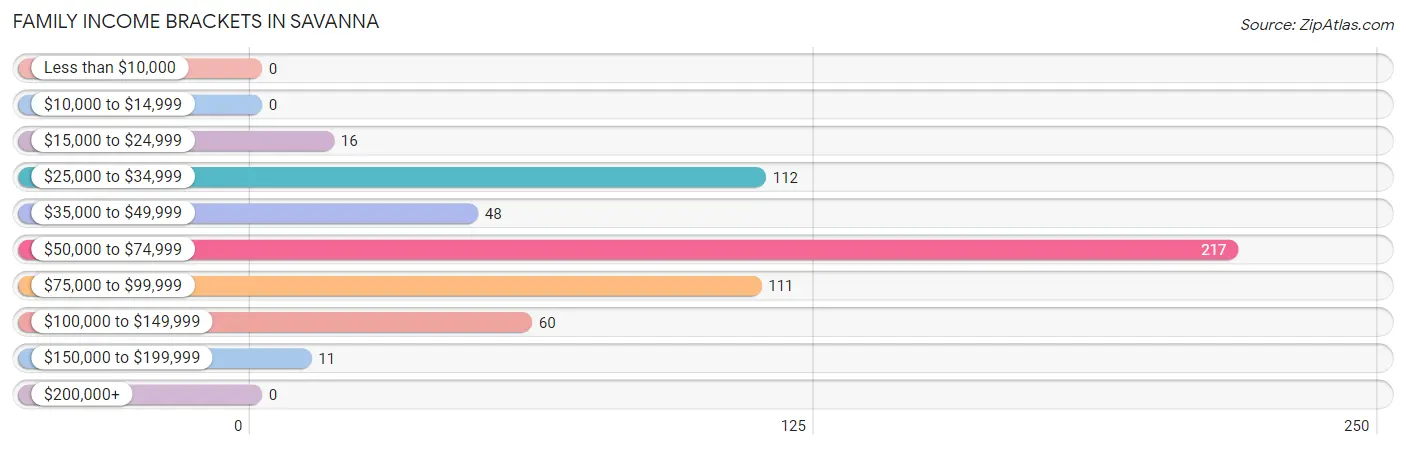
| Income Bracket | # Families | % Families |
| Less than $10,000 | 0 | 0.0% |
| $10,000 to $14,999 | 0 | 0.0% |
| $15,000 to $24,999 | 16 | 2.8% |
| $25,000 to $34,999 | 112 | 19.5% |
| $35,000 to $49,999 | 48 | 8.3% |
| $50,000 to $74,999 | 217 | 37.7% |
| $75,000 to $99,999 | 111 | 19.3% |
| $100,000 to $149,999 | 60 | 10.4% |
| $150,000 to $199,999 | 11 | 1.9% |
| $200,000+ | 0 | 0.0% |
Family Income by Famaliy Size in Savanna
5-person families (41 | 7.1%) account for the highest median family income in Savanna with $115,602 per family, while 2-person families (319 | 55.5%) have the highest median income of $27,032 per family member.
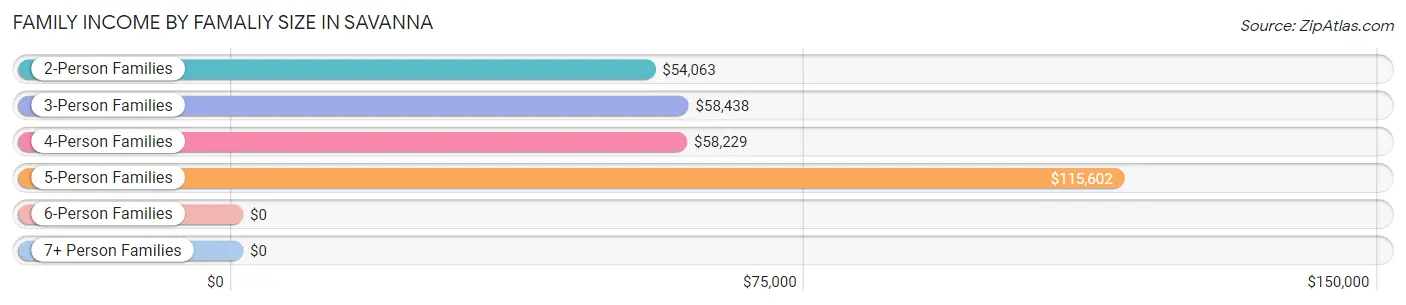
| Income Bracket | # Families | Median Income |
| 2-Person Families | 319 (55.5%) | $54,063 |
| 3-Person Families | 57 (9.9%) | $58,438 |
| 4-Person Families | 115 (20.0%) | $58,229 |
| 5-Person Families | 41 (7.1%) | $115,602 |
| 6-Person Families | 0 (0.0%) | $0 |
| 7+ Person Families | 43 (7.5%) | $0 |
| Total | 575 (100.0%) | $54,886 |
Family Income by Number of Earners in Savanna
The median family income in Savanna is $54,886, with families comprising 3+ earners (70) having the highest median family income of $77,303, while families with no earners (84) have the lowest median family income of $49,167, accounting for 12.2% and 14.6% of families, respectively.
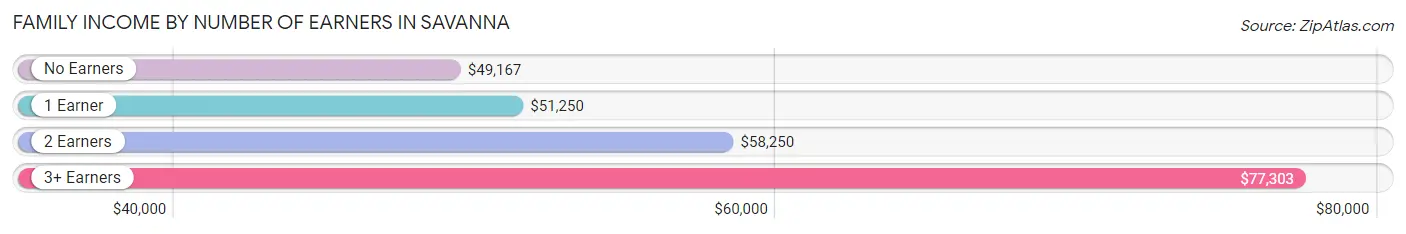
| Number of Earners | # Families | Median Income |
| No Earners | 84 (14.6%) | $49,167 |
| 1 Earner | 258 (44.9%) | $51,250 |
| 2 Earners | 163 (28.3%) | $58,250 |
| 3+ Earners | 70 (12.2%) | $77,303 |
| Total | 575 (100.0%) | $54,886 |
Household Income in Savanna
Household Income Brackets in Savanna
With 336 households falling in the category, the $50,000 to $74,999 income range is the most frequent in Savanna, accounting for 25.5% of all households. In contrast, only 11 households (0.8%) fall into the $150,000 to $199,999 income bracket, making it the least populous group.
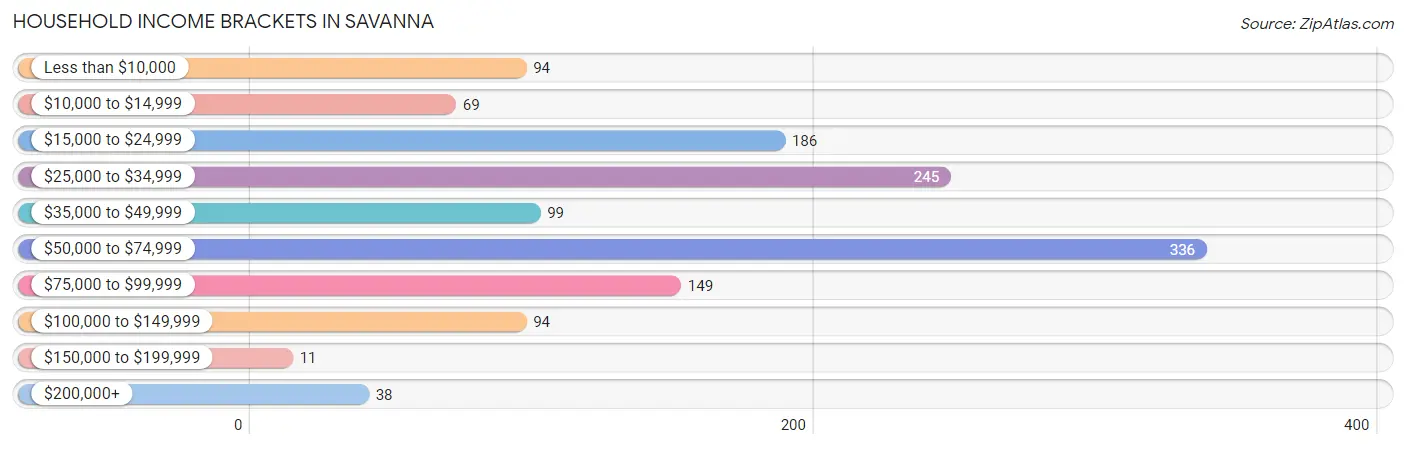
| Income Bracket | # Households | % Households |
| Less than $10,000 | 94 | 7.1% |
| $10,000 to $14,999 | 69 | 5.2% |
| $15,000 to $24,999 | 186 | 14.1% |
| $25,000 to $34,999 | 245 | 18.6% |
| $35,000 to $49,999 | 99 | 7.5% |
| $50,000 to $74,999 | 336 | 25.5% |
| $75,000 to $99,999 | 149 | 11.3% |
| $100,000 to $149,999 | 94 | 7.1% |
| $150,000 to $199,999 | 11 | 0.8% |
| $200,000+ | 38 | 2.9% |
Household Income by Householder Age in Savanna
The median household income in Savanna is $45,474, with the highest median household income of $53,343 found in the 25 to 44 years age bracket for the primary householder. A total of 363 households (27.5%) fall into this category. Meanwhile, the 15 to 24 years age bracket for the primary householder has the lowest median household income of $26,438, with 64 households (4.9%) in this group.
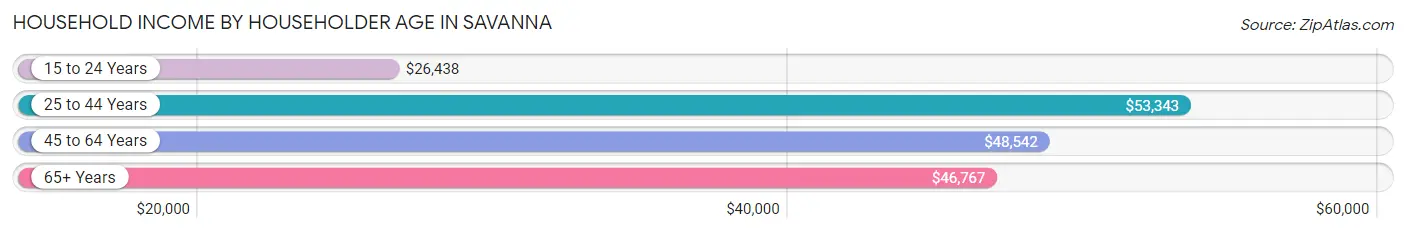
| Income Bracket | # Households | Median Income |
| 15 to 24 Years | 64 (4.9%) | $26,438 |
| 25 to 44 Years | 363 (27.5%) | $53,343 |
| 45 to 64 Years | 449 (34.0%) | $48,542 |
| 65+ Years | 443 (33.6%) | $46,767 |
| Total | 1,319 (100.0%) | $45,474 |
Poverty in Savanna
Income Below Poverty by Sex and Age in Savanna
With 6.4% poverty level for males and 12.3% for females among the residents of Savanna, 45 to 54 year old males and 55 to 64 year old females are the most vulnerable to poverty, with 31 males (14.5%) and 84 females (38.5%) in their respective age groups living below the poverty level.
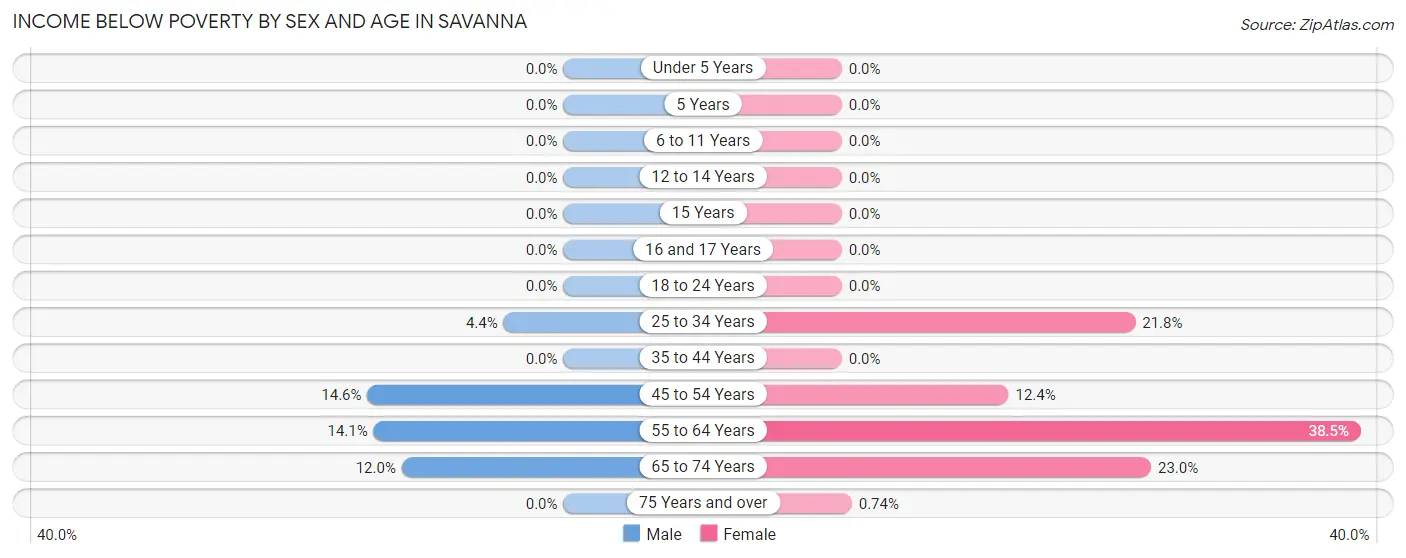
| Age Bracket | Male | Female |
| Under 5 Years | 0 (0.0%) | 0 (0.0%) |
| 5 Years | 0 (0.0%) | 0 (0.0%) |
| 6 to 11 Years | 0 (0.0%) | 0 (0.0%) |
| 12 to 14 Years | 0 (0.0%) | 0 (0.0%) |
| 15 Years | 0 (0.0%) | 0 (0.0%) |
| 16 and 17 Years | 0 (0.0%) | 0 (0.0%) |
| 18 to 24 Years | 0 (0.0%) | 0 (0.0%) |
| 25 to 34 Years | 10 (4.4%) | 17 (21.8%) |
| 35 to 44 Years | 0 (0.0%) | 0 (0.0%) |
| 45 to 54 Years | 31 (14.5%) | 13 (12.4%) |
| 55 to 64 Years | 31 (14.1%) | 84 (38.5%) |
| 65 to 74 Years | 18 (12.0%) | 45 (23.0%) |
| 75 Years and over | 0 (0.0%) | 1 (0.7%) |
| Total | 90 (6.4%) | 160 (12.3%) |
Income Above Poverty by Sex and Age in Savanna
According to the poverty statistics in Savanna, males aged under 5 years and females aged 5 years are the age groups that are most secure financially, with 100.0% of males and 100.0% of females in these age groups living above the poverty line.
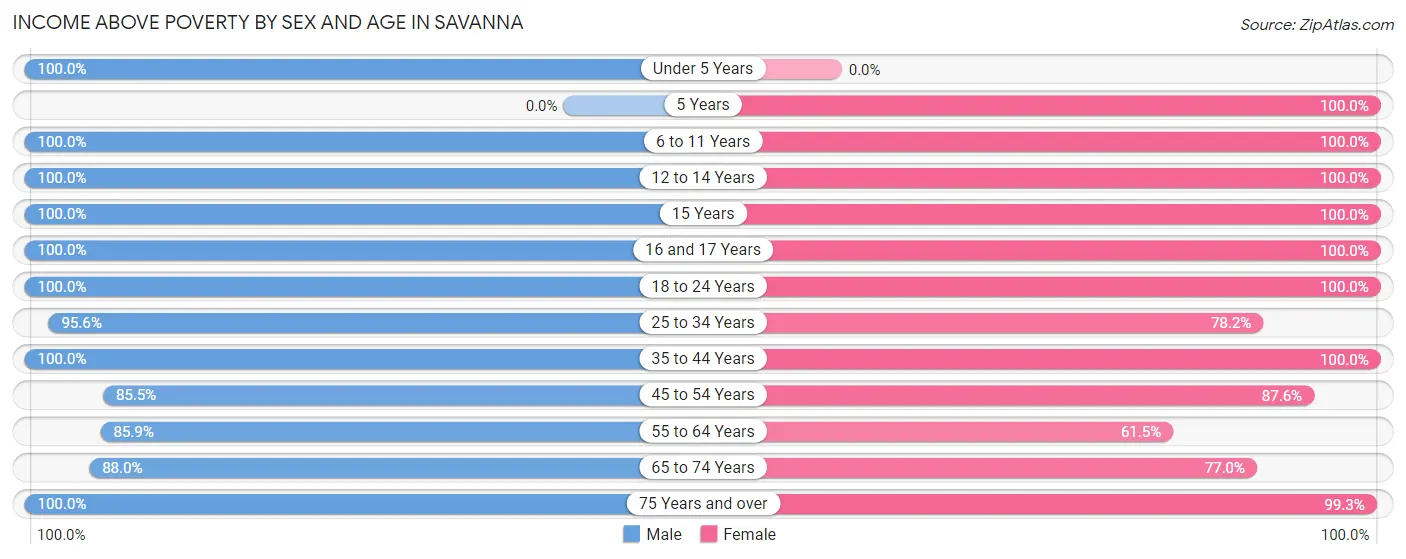
| Age Bracket | Male | Female |
| Under 5 Years | 56 (100.0%) | 0 (0.0%) |
| 5 Years | 0 (0.0%) | 16 (100.0%) |
| 6 to 11 Years | 94 (100.0%) | 61 (100.0%) |
| 12 to 14 Years | 14 (100.0%) | 88 (100.0%) |
| 15 Years | 12 (100.0%) | 11 (100.0%) |
| 16 and 17 Years | 10 (100.0%) | 88 (100.0%) |
| 18 to 24 Years | 52 (100.0%) | 127 (100.0%) |
| 25 to 34 Years | 215 (95.6%) | 61 (78.2%) |
| 35 to 44 Years | 221 (100.0%) | 173 (100.0%) |
| 45 to 54 Years | 182 (85.5%) | 92 (87.6%) |
| 55 to 64 Years | 189 (85.9%) | 134 (61.5%) |
| 65 to 74 Years | 132 (88.0%) | 151 (77.0%) |
| 75 Years and over | 134 (100.0%) | 135 (99.3%) |
| Total | 1,311 (93.6%) | 1,137 (87.7%) |
Income Below Poverty Among Married-Couple Families in Savanna
The poverty statistics for married-couple families in Savanna show that 4.8% or 16 of the total 333 families live below the poverty line. Families with no children have the highest poverty rate of 7.4%, comprising of 16 families. On the other hand, families with 1 or 2 children have the lowest poverty rate of 0.0%, which includes 0 families.
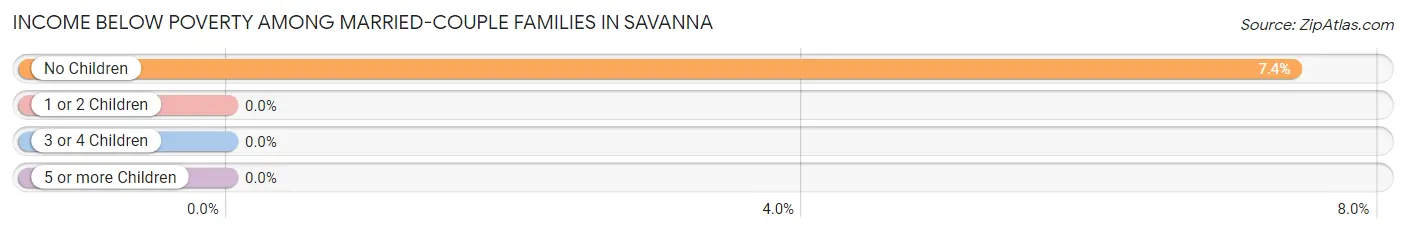
| Children | Above Poverty | Below Poverty |
| No Children | 200 (92.6%) | 16 (7.4%) |
| 1 or 2 Children | 103 (100.0%) | 0 (0.0%) |
| 3 or 4 Children | 14 (100.0%) | 0 (0.0%) |
| 5 or more Children | 0 (0.0%) | 0 (0.0%) |
| Total | 317 (95.2%) | 16 (4.8%) |
Income Below Poverty Among Single-Parent Households in Savanna
| Children | Single Father | Single Mother |
| No Children | 0 (0.0%) | 0 (0.0%) |
| 1 or 2 Children | 0 (0.0%) | 0 (0.0%) |
| 3 or 4 Children | 0 (0.0%) | 0 (0.0%) |
| 5 or more Children | 0 (0.0%) | 0 (0.0%) |
| Total | 0 (0.0%) | 0 (0.0%) |
Income Below Poverty Among Married-Couple vs Single-Parent Households in Savanna
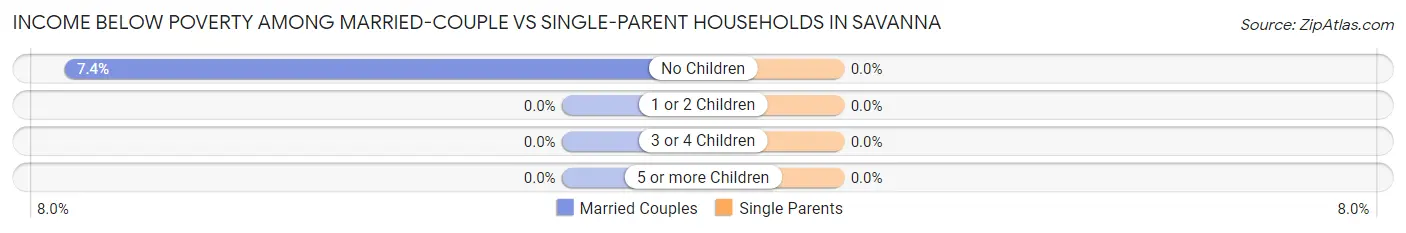
| Children | Married-Couple Families | Single-Parent Households |
| No Children | 16 (7.4%) | 0 (0.0%) |
| 1 or 2 Children | 0 (0.0%) | 0 (0.0%) |
| 3 or 4 Children | 0 (0.0%) | 0 (0.0%) |
| 5 or more Children | 0 (0.0%) | 0 (0.0%) |
| Total | 16 (4.8%) | 0 (0.0%) |
Race in Savanna
The most populous races in Savanna are White / Caucasian (2,446 | 87.9%), Two or more Races (248 | 8.9%), and Hispanic or Latino (228 | 8.2%).
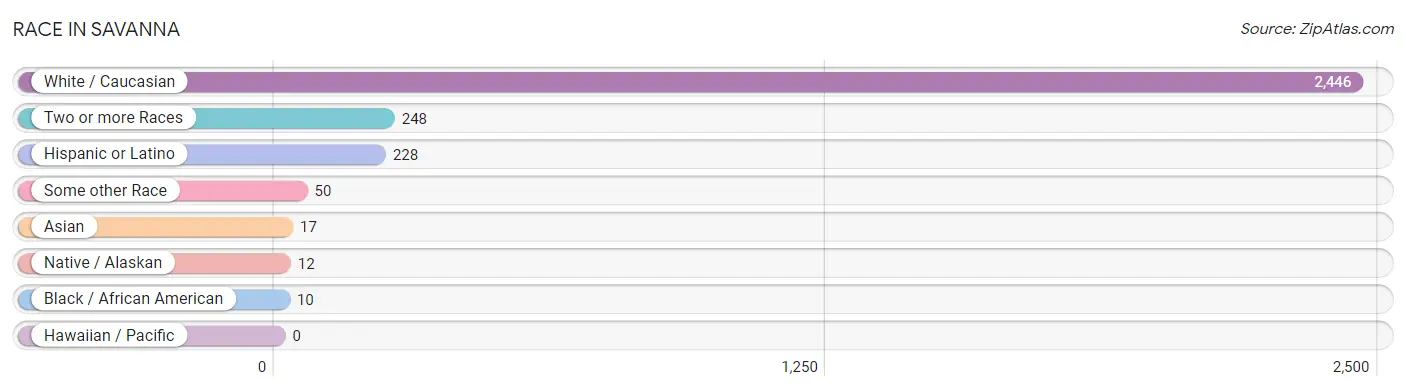
| Race | # Population | % Population |
| Asian | 17 | 0.6% |
| Black / African American | 10 | 0.4% |
| Hawaiian / Pacific | 0 | 0.0% |
| Hispanic or Latino | 228 | 8.2% |
| Native / Alaskan | 12 | 0.4% |
| White / Caucasian | 2,446 | 87.9% |
| Two or more Races | 248 | 8.9% |
| Some other Race | 50 | 1.8% |
| Total | 2,783 | 100.0% |
Ancestry in Savanna
The most populous ancestries reported in Savanna are German (846 | 30.4%), American (503 | 18.1%), Irish (431 | 15.5%), English (267 | 9.6%), and Mexican (188 | 6.8%), together accounting for 80.3% of all Savanna residents.
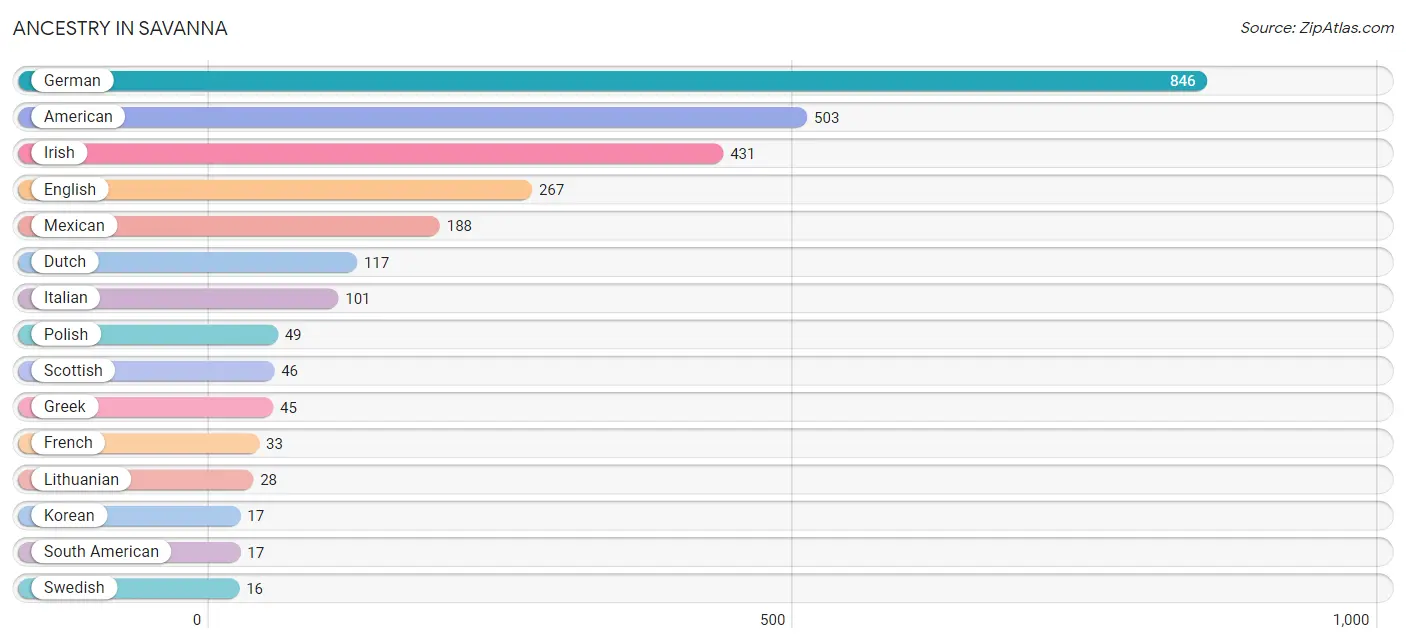
| Ancestry | # Population | % Population |
| American | 503 | 18.1% |
| Cherokee | 6 | 0.2% |
| Colombian | 7 | 0.3% |
| Danish | 5 | 0.2% |
| Dutch | 117 | 4.2% |
| Ecuadorian | 10 | 0.4% |
| English | 267 | 9.6% |
| European | 6 | 0.2% |
| French | 33 | 1.2% |
| French Canadian | 15 | 0.5% |
| German | 846 | 30.4% |
| Greek | 45 | 1.6% |
| Hungarian | 13 | 0.5% |
| Irish | 431 | 15.5% |
| Italian | 101 | 3.6% |
| Korean | 17 | 0.6% |
| Lithuanian | 28 | 1.0% |
| Mexican | 188 | 6.8% |
| Norwegian | 5 | 0.2% |
| Polish | 49 | 1.8% |
| Pueblo | 5 | 0.2% |
| Scotch-Irish | 15 | 0.5% |
| Scottish | 46 | 1.7% |
| Sioux | 1 | 0.0% |
| South American | 17 | 0.6% |
| Swedish | 16 | 0.6% |
| Swiss | 8 | 0.3% | View All 27 Rows |
Immigrants in Savanna
The most numerous immigrant groups reported in Savanna came from Europe (54 | 1.9%), Germany (51 | 1.8%), Western Europe (51 | 1.8%), Latin America (27 | 1.0%), and Central America (20 | 0.7%), together accounting for 7.3% of all Savanna residents.
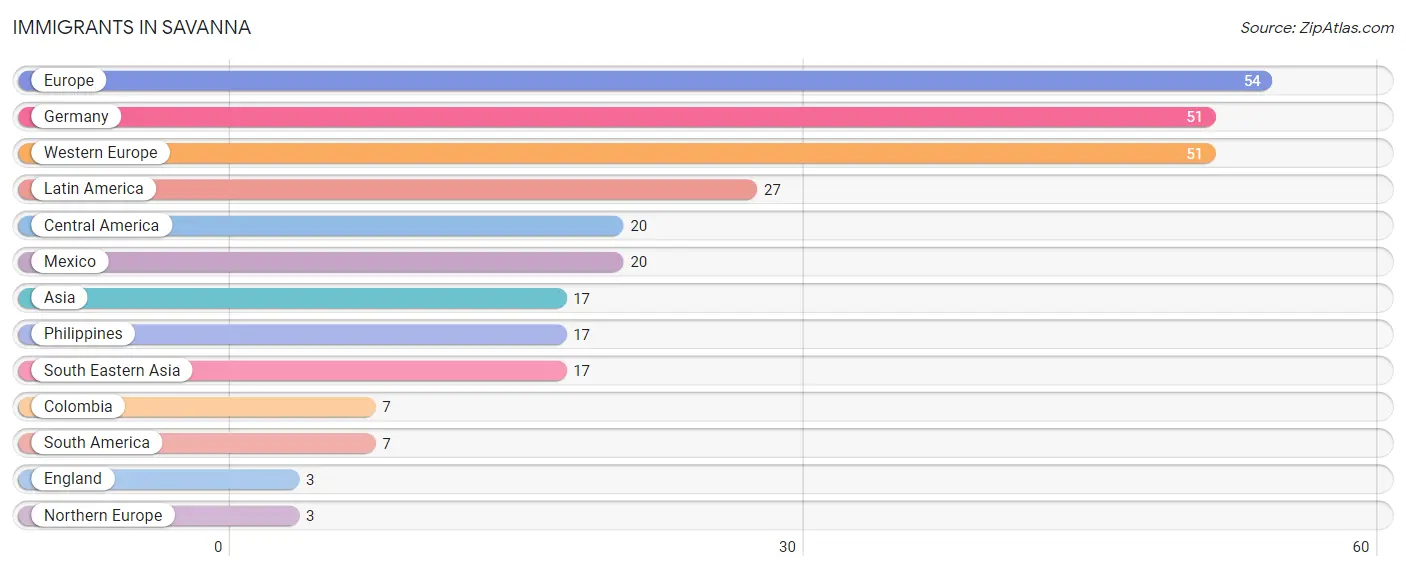
| Immigration Origin | # Population | % Population |
| Asia | 17 | 0.6% |
| Central America | 20 | 0.7% |
| Colombia | 7 | 0.3% |
| England | 3 | 0.1% |
| Europe | 54 | 1.9% |
| Germany | 51 | 1.8% |
| Latin America | 27 | 1.0% |
| Mexico | 20 | 0.7% |
| Northern Europe | 3 | 0.1% |
| Philippines | 17 | 0.6% |
| South America | 7 | 0.3% |
| South Eastern Asia | 17 | 0.6% |
| Western Europe | 51 | 1.8% | View All 13 Rows |
Sex and Age in Savanna
Sex and Age in Savanna
The most populous age groups in Savanna are 45 to 49 Years (126 | 8.9%) for men and 60 to 64 Years (158 | 11.5%) for women.
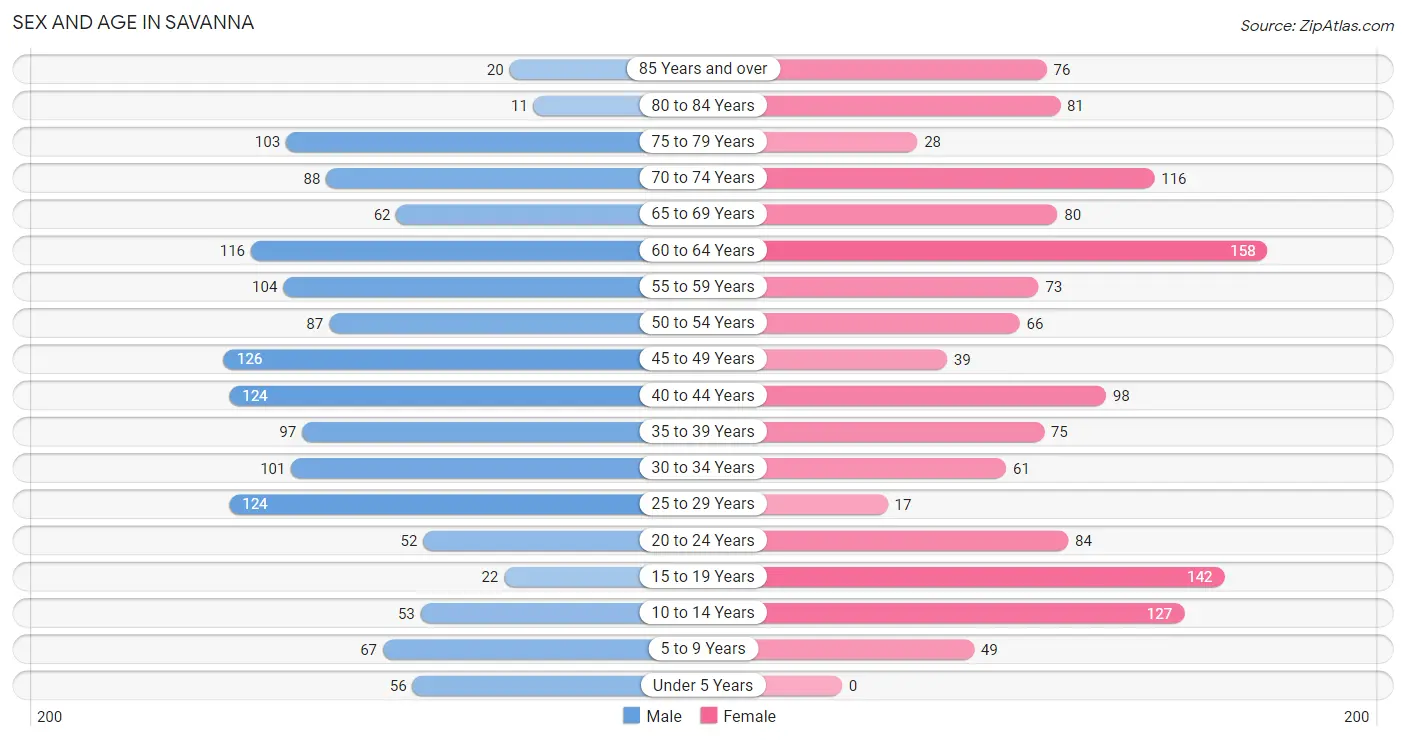
| Age Bracket | Male | Female |
| Under 5 Years | 56 (4.0%) | 0 (0.0%) |
| 5 to 9 Years | 67 (4.7%) | 49 (3.6%) |
| 10 to 14 Years | 53 (3.7%) | 127 (9.3%) |
| 15 to 19 Years | 22 (1.6%) | 142 (10.4%) |
| 20 to 24 Years | 52 (3.7%) | 84 (6.1%) |
| 25 to 29 Years | 124 (8.8%) | 17 (1.2%) |
| 30 to 34 Years | 101 (7.1%) | 61 (4.4%) |
| 35 to 39 Years | 97 (6.9%) | 75 (5.5%) |
| 40 to 44 Years | 124 (8.8%) | 98 (7.1%) |
| 45 to 49 Years | 126 (8.9%) | 39 (2.9%) |
| 50 to 54 Years | 87 (6.2%) | 66 (4.8%) |
| 55 to 59 Years | 104 (7.4%) | 73 (5.3%) |
| 60 to 64 Years | 116 (8.2%) | 158 (11.5%) |
| 65 to 69 Years | 62 (4.4%) | 80 (5.8%) |
| 70 to 74 Years | 88 (6.2%) | 116 (8.5%) |
| 75 to 79 Years | 103 (7.3%) | 28 (2.0%) |
| 80 to 84 Years | 11 (0.8%) | 81 (5.9%) |
| 85 Years and over | 20 (1.4%) | 76 (5.6%) |
| Total | 1,413 (100.0%) | 1,370 (100.0%) |
Families and Households in Savanna
Median Family Size in Savanna
The median family size in Savanna is 3.17 persons per family, with single female/mother families (102 | 17.7%) accounting for the largest median family size of 3.23 persons per family. On the other hand, married-couple families (333 | 57.9%) represent the smallest median family size with 3.14 persons per family.
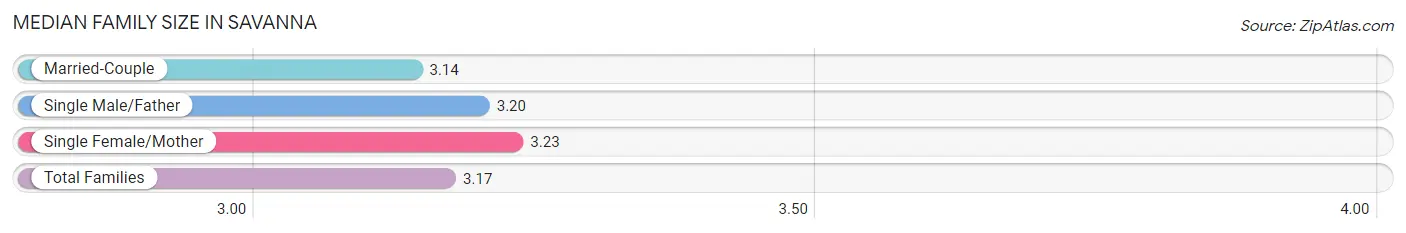
| Family Type | # Families | Family Size |
| Married-Couple | 333 (57.9%) | 3.14 |
| Single Male/Father | 140 (24.3%) | 3.20 |
| Single Female/Mother | 102 (17.7%) | 3.23 |
| Total Families | 575 (100.0%) | 3.17 |
Median Household Size in Savanna
The median household size in Savanna is 2.06 persons per household, with single male/father households (140 | 10.6%) accounting for the largest median household size of 3.51 persons per household. non-family households (744 | 56.4%) represent the smallest median household size with 1.15 persons per household.
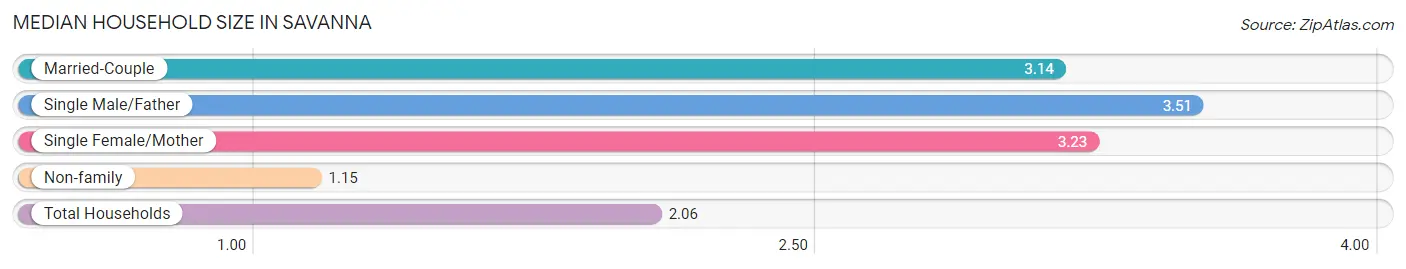
| Household Type | # Households | Household Size |
| Married-Couple | 333 (25.3%) | 3.14 |
| Single Male/Father | 140 (10.6%) | 3.51 |
| Single Female/Mother | 102 (7.7%) | 3.23 |
| Non-family | 744 (56.4%) | 1.15 |
| Total Households | 1,319 (100.0%) | 2.06 |
Household Size by Marriage Status in Savanna
Out of a total of 1,319 households in Savanna, 575 (43.6%) are family households, while 744 (56.4%) are nonfamily households. The most numerous type of family households are 2-person households, comprising 294, and the most common type of nonfamily households are 1-person households, comprising 653.
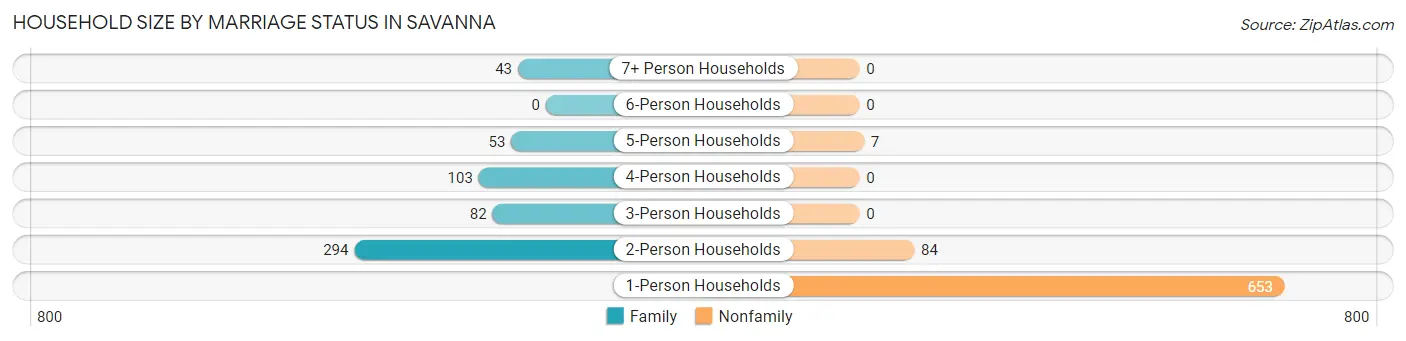
| Household Size | Family Households | Nonfamily Households |
| 1-Person Households | - | 653 (49.5%) |
| 2-Person Households | 294 (22.3%) | 84 (6.4%) |
| 3-Person Households | 82 (6.2%) | 0 (0.0%) |
| 4-Person Households | 103 (7.8%) | 0 (0.0%) |
| 5-Person Households | 53 (4.0%) | 7 (0.5%) |
| 6-Person Households | 0 (0.0%) | 0 (0.0%) |
| 7+ Person Households | 43 (3.3%) | 0 (0.0%) |
| Total | 575 (43.6%) | 744 (56.4%) |
Female Fertility in Savanna
Fertility by Age in Savanna
| Age Bracket | Women with Births | Births / 1,000 Women |
| 15 to 19 years | 0 (0.0%) | 0.0 |
| 20 to 34 years | 0 (0.0%) | 0.0 |
| 35 to 50 years | 0 (0.0%) | 0.0 |
| Total | 0 (0.0%) | 0.0 |
Fertility by Age by Marriage Status in Savanna
| Age Bracket | Married | Unmarried |
| 15 to 19 years | 0 (0.0%) | 0 (0.0%) |
| 20 to 34 years | 0 (0.0%) | 0 (0.0%) |
| 35 to 50 years | 0 (0.0%) | 0 (0.0%) |
| Total | 0 (0.0%) | 0 (0.0%) |
Fertility by Education in Savanna
| Educational Attainment | Women with Births | Births / 1,000 Women |
| Less than High School | 0 (0.0%) | 0.0 |
| High School Diploma | 0 (0.0%) | 0.0 |
| College or Associate's Degree | 0 (0.0%) | 0.0 |
| Bachelor's Degree | 0 (0.0%) | 0.0 |
| Graduate Degree | 0 (0.0%) | 0.0 |
| Total | 0 (0.0%) | 0.0 |
Fertility by Education by Marriage Status in Savanna
| Educational Attainment | Married | Unmarried |
| Less than High School | 0 (0.0%) | 0 (0.0%) |
| High School Diploma | 0 (0.0%) | 0 (0.0%) |
| College or Associate's Degree | 0 (0.0%) | 0 (0.0%) |
| Bachelor's Degree | 0 (0.0%) | 0 (0.0%) |
| Graduate Degree | 0 (0.0%) | 0 (0.0%) |
| Total | 0 (0.0%) | 0 (0.0%) |
Employment Characteristics in Savanna
Employment by Class of Employer in Savanna
Among the 1,154 employed individuals in Savanna, private company employees (942 | 81.6%), federal government employees (67 | 5.8%), and not-for-profit organizations (61 | 5.3%) make up the most common classes of employment.
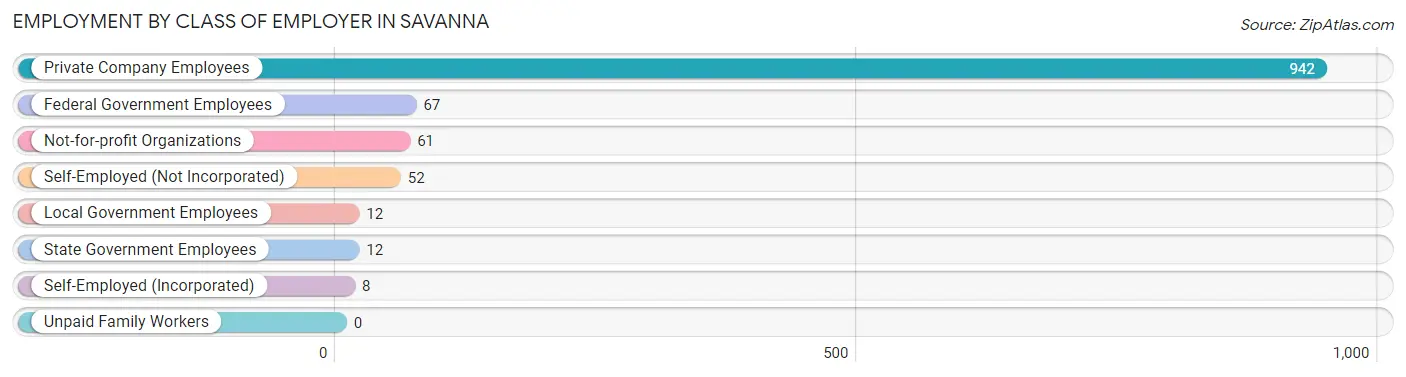
| Employer Class | # Employees | % Employees |
| Private Company Employees | 942 | 81.6% |
| Self-Employed (Incorporated) | 8 | 0.7% |
| Self-Employed (Not Incorporated) | 52 | 4.5% |
| Not-for-profit Organizations | 61 | 5.3% |
| Local Government Employees | 12 | 1.0% |
| State Government Employees | 12 | 1.0% |
| Federal Government Employees | 67 | 5.8% |
| Unpaid Family Workers | 0 | 0.0% |
| Total | 1,154 | 100.0% |
Employment Status by Age in Savanna
According to the labor force statistics for Savanna, out of the total population over 16 years of age (2,408), 51.5% or 1,240 individuals are in the labor force, with 6.1% or 76 of them unemployed. The age group with the highest labor force participation rate is 25 to 29 years, with 100.0% or 141 individuals in the labor force. Within the labor force, the 60 to 64 years age range has the highest percentage of unemployed individuals, with 13.8% or 11 of them being unemployed.
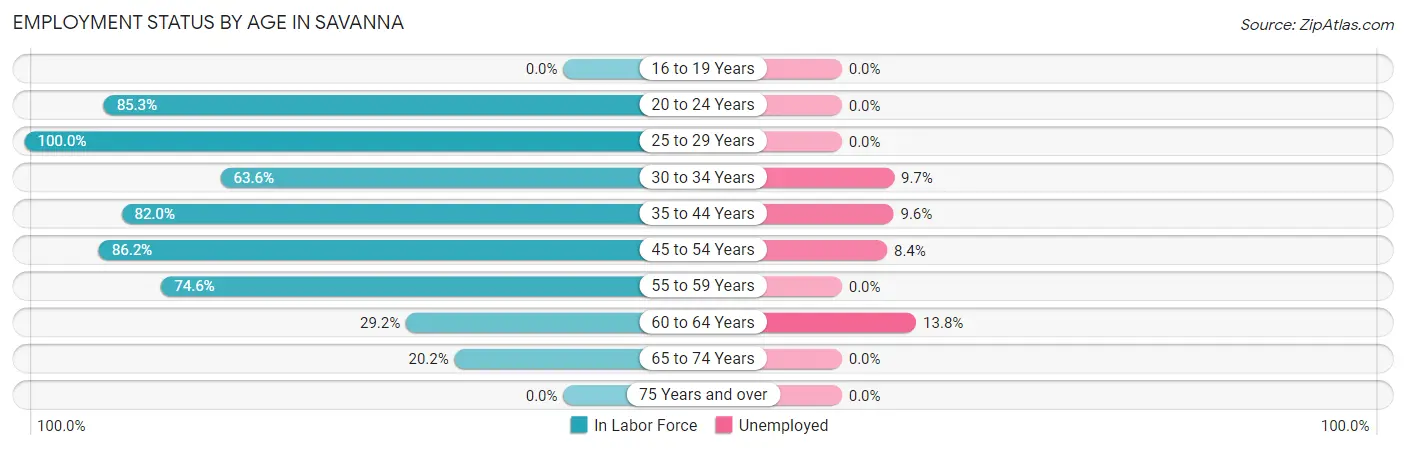
| Age Bracket | In Labor Force | Unemployed |
| 16 to 19 Years | 0 (0.0%) | 0 (0.0%) |
| 20 to 24 Years | 116 (85.3%) | 0 (0.0%) |
| 25 to 29 Years | 141 (100.0%) | 0 (0.0%) |
| 30 to 34 Years | 103 (63.6%) | 10 (9.7%) |
| 35 to 44 Years | 323 (82.0%) | 31 (9.6%) |
| 45 to 54 Years | 274 (86.2%) | 23 (8.4%) |
| 55 to 59 Years | 132 (74.6%) | 0 (0.0%) |
| 60 to 64 Years | 80 (29.2%) | 11 (13.8%) |
| 65 to 74 Years | 70 (20.2%) | 0 (0.0%) |
| 75 Years and over | 0 (0.0%) | 0 (0.0%) |
| Total | 1,240 (51.5%) | 76 (6.1%) |
Employment Status by Educational Attainment in Savanna
According to labor force statistics for Savanna, 71.8% of individuals (1,053) out of the total population between 25 and 64 years of age (1,466) are in the labor force, with 7.1% or 75 of them being unemployed. The group with the highest labor force participation rate are those with the educational attainment of bachelor's degree or higher, with 80.5% or 136 individuals in the labor force. Within the labor force, individuals with bachelor's degree or higher education have the highest percentage of unemployment, with 30.1% or 41 of them being unemployed.
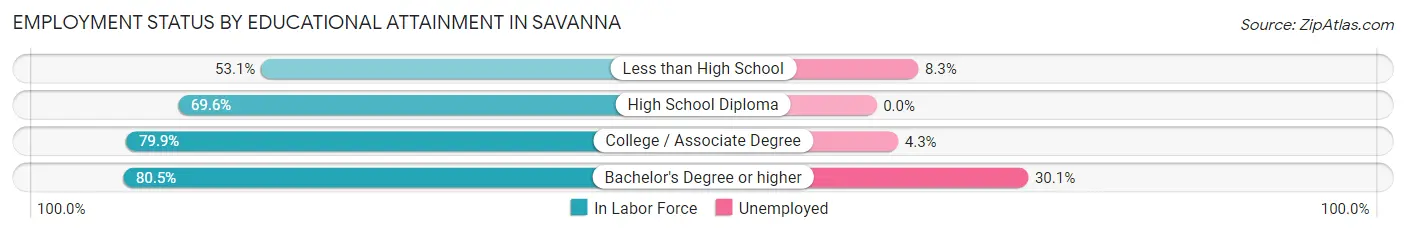
| Educational Attainment | In Labor Force | Unemployed |
| Less than High School | 156 (53.1%) | 24 (8.3%) |
| High School Diploma | 272 (69.6%) | 0 (0.0%) |
| College / Associate Degree | 489 (79.9%) | 26 (4.3%) |
| Bachelor's Degree or higher | 136 (80.5%) | 51 (30.1%) |
| Total | 1,053 (71.8%) | 104 (7.1%) |
Employment Occupations by Sex in Savanna
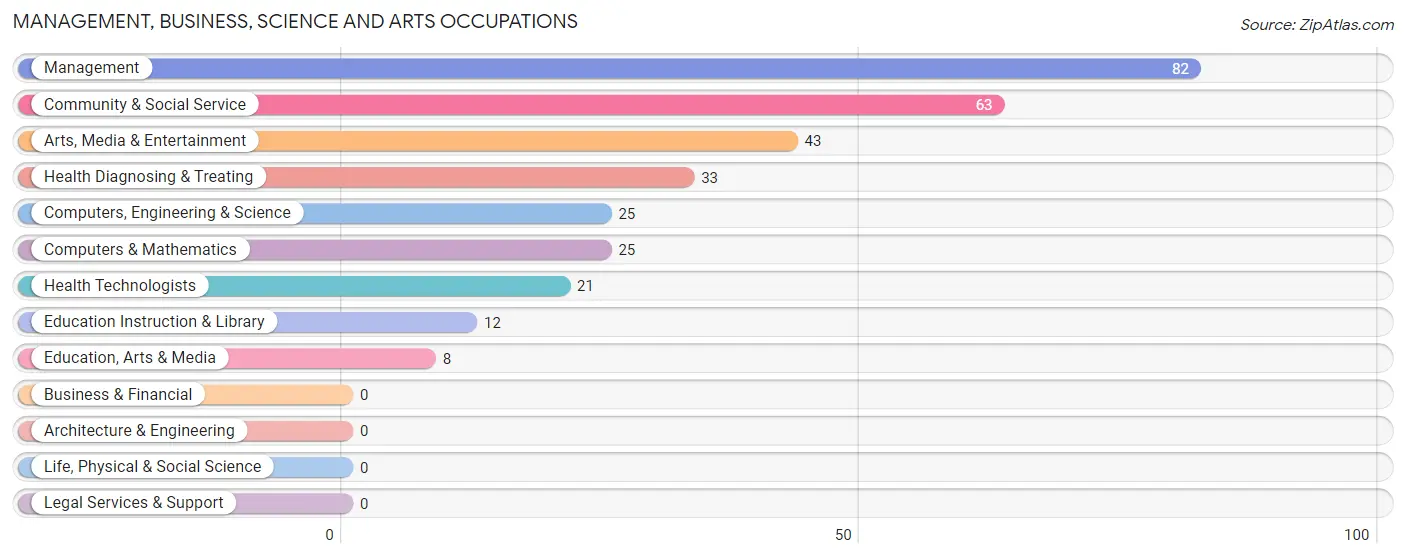
Management, Business, Science and Arts Occupations
The most common Management, Business, Science and Arts occupations in Savanna are Management (82 | 7.0%), Community & Social Service (63 | 5.4%), Arts, Media & Entertainment (43 | 3.7%), Health Diagnosing & Treating (33 | 2.8%), and Computers, Engineering & Science (25 | 2.1%).
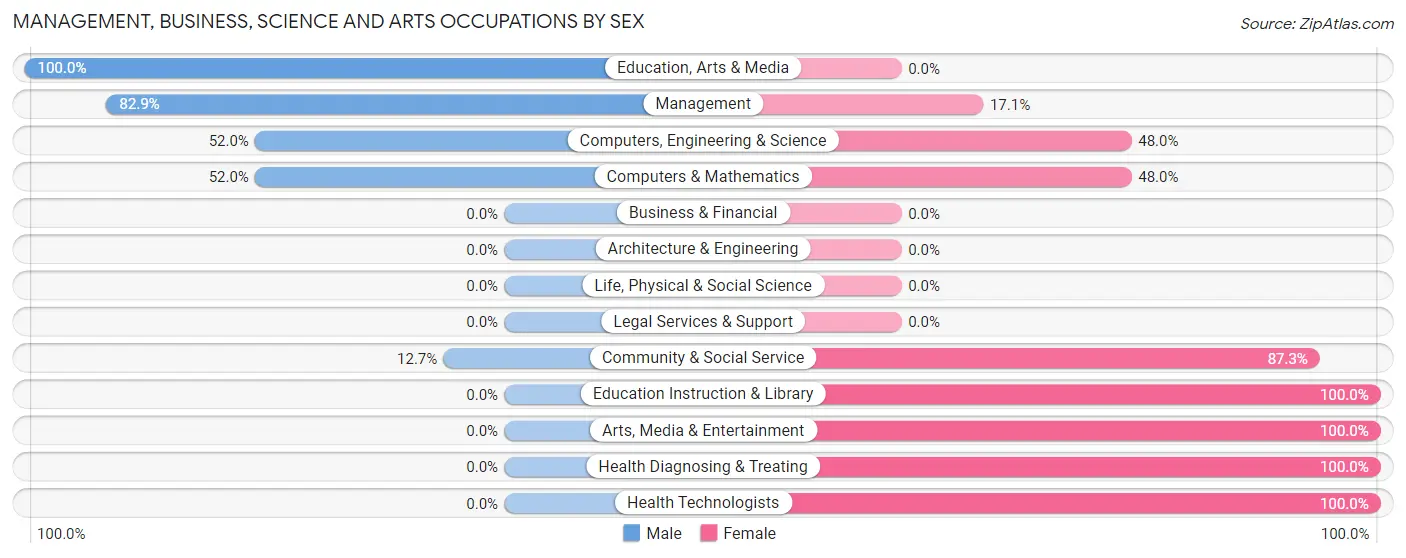
Management, Business, Science and Arts Occupations by Sex
Within the Management, Business, Science and Arts occupations in Savanna, the most male-oriented occupations are Education, Arts & Media (100.0%), Management (82.9%), and Computers, Engineering & Science (52.0%), while the most female-oriented occupations are Education Instruction & Library (100.0%), Arts, Media & Entertainment (100.0%), and Health Diagnosing & Treating (100.0%).
| Occupation | Male | Female |
| Management | 68 (82.9%) | 14 (17.1%) |
| Business & Financial | 0 (0.0%) | 0 (0.0%) |
| Computers, Engineering & Science | 13 (52.0%) | 12 (48.0%) |
| Computers & Mathematics | 13 (52.0%) | 12 (48.0%) |
| Architecture & Engineering | 0 (0.0%) | 0 (0.0%) |
| Life, Physical & Social Science | 0 (0.0%) | 0 (0.0%) |
| Community & Social Service | 8 (12.7%) | 55 (87.3%) |
| Education, Arts & Media | 8 (100.0%) | 0 (0.0%) |
| Legal Services & Support | 0 (0.0%) | 0 (0.0%) |
| Education Instruction & Library | 0 (0.0%) | 12 (100.0%) |
| Arts, Media & Entertainment | 0 (0.0%) | 43 (100.0%) |
| Health Diagnosing & Treating | 0 (0.0%) | 33 (100.0%) |
| Health Technologists | 0 (0.0%) | 21 (100.0%) |
| Total (Category) | 89 (43.8%) | 114 (56.2%) |
| Total (Overall) | 791 (68.0%) | 373 (32.0%) |
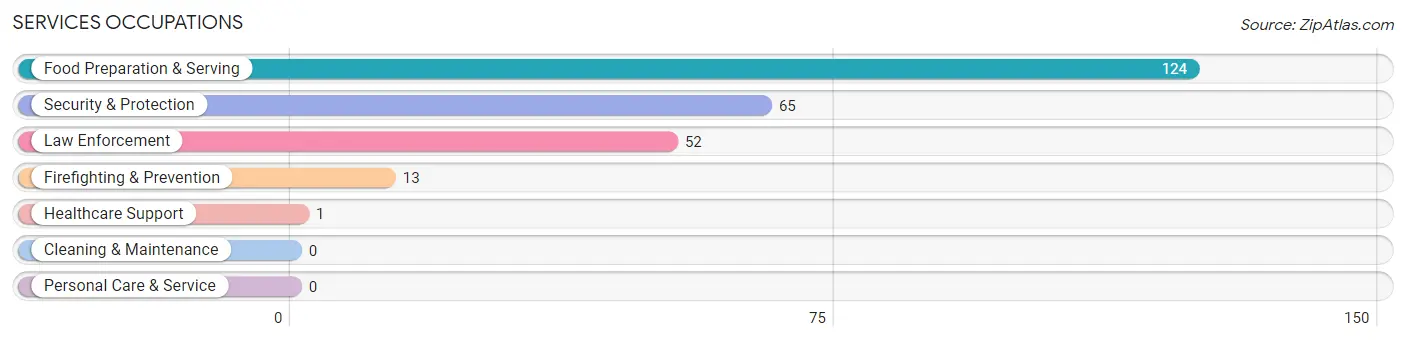
Services Occupations
The most common Services occupations in Savanna are Food Preparation & Serving (124 | 10.6%), Security & Protection (65 | 5.6%), Law Enforcement (52 | 4.5%), Firefighting & Prevention (13 | 1.1%), and Healthcare Support (1 | 0.1%).
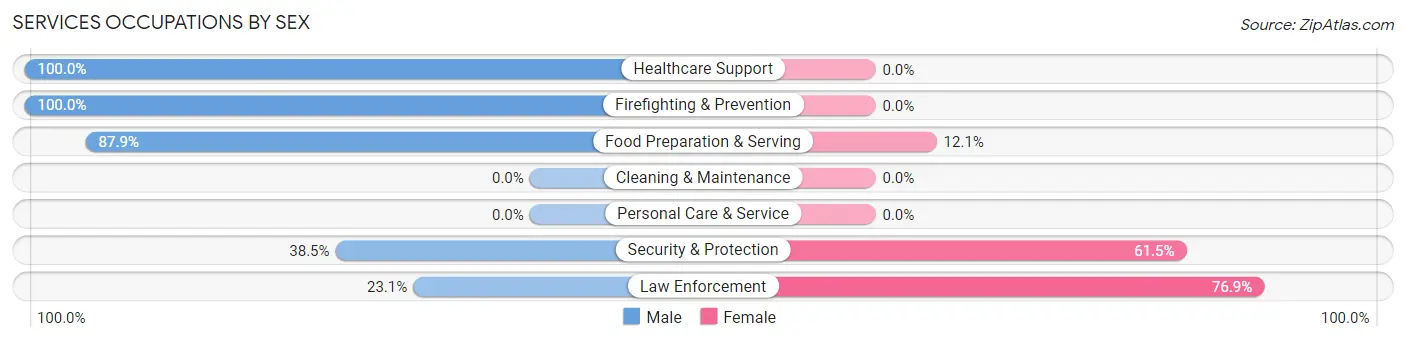
Services Occupations by Sex
Within the Services occupations in Savanna, the most male-oriented occupations are Healthcare Support (100.0%), Firefighting & Prevention (100.0%), and Food Preparation & Serving (87.9%), while the most female-oriented occupations are Law Enforcement (76.9%), Security & Protection (61.5%), and Food Preparation & Serving (12.1%).
| Occupation | Male | Female |
| Healthcare Support | 1 (100.0%) | 0 (0.0%) |
| Security & Protection | 25 (38.5%) | 40 (61.5%) |
| Firefighting & Prevention | 13 (100.0%) | 0 (0.0%) |
| Law Enforcement | 12 (23.1%) | 40 (76.9%) |
| Food Preparation & Serving | 109 (87.9%) | 15 (12.1%) |
| Cleaning & Maintenance | 0 (0.0%) | 0 (0.0%) |
| Personal Care & Service | 0 (0.0%) | 0 (0.0%) |
| Total (Category) | 135 (71.1%) | 55 (28.9%) |
| Total (Overall) | 791 (68.0%) | 373 (32.0%) |
Sales and Office Occupations
The most common Sales and Office occupations in Savanna are Office & Administration (191 | 16.4%), and Sales & Related (112 | 9.6%).
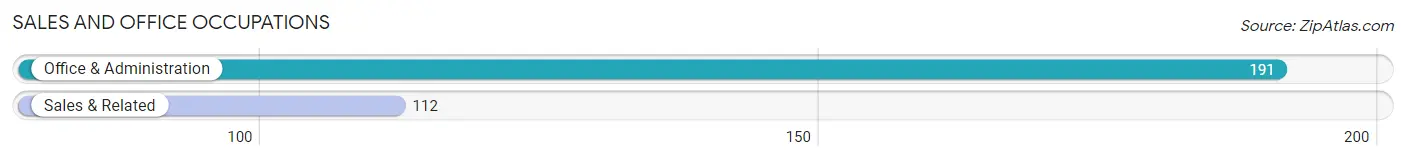
Sales and Office Occupations by Sex
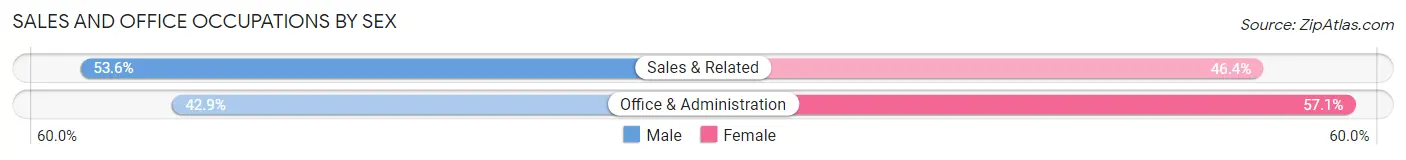
| Occupation | Male | Female |
| Sales & Related | 60 (53.6%) | 52 (46.4%) |
| Office & Administration | 82 (42.9%) | 109 (57.1%) |
| Total (Category) | 142 (46.9%) | 161 (53.1%) |
| Total (Overall) | 791 (68.0%) | 373 (32.0%) |
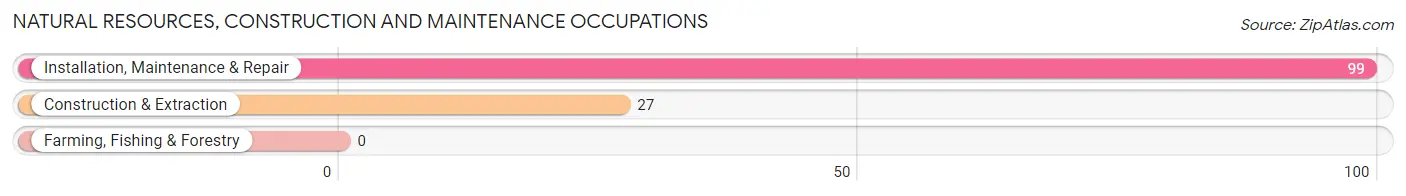
Natural Resources, Construction and Maintenance Occupations
The most common Natural Resources, Construction and Maintenance occupations in Savanna are Installation, Maintenance & Repair (99 | 8.5%), and Construction & Extraction (27 | 2.3%).
Natural Resources, Construction and Maintenance Occupations by Sex
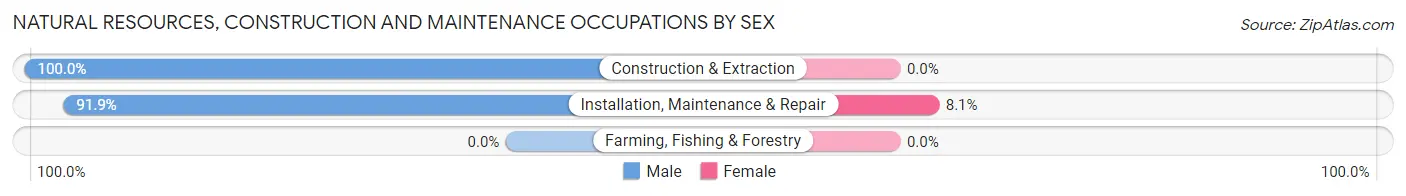
| Occupation | Male | Female |
| Farming, Fishing & Forestry | 0 (0.0%) | 0 (0.0%) |
| Construction & Extraction | 27 (100.0%) | 0 (0.0%) |
| Installation, Maintenance & Repair | 91 (91.9%) | 8 (8.1%) |
| Total (Category) | 118 (93.6%) | 8 (6.4%) |
| Total (Overall) | 791 (68.0%) | 373 (32.0%) |
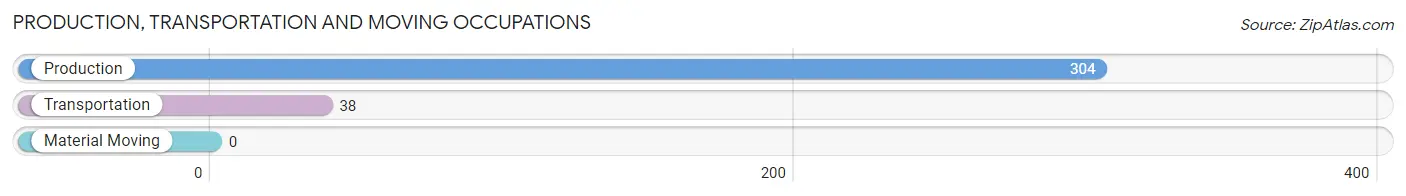
Production, Transportation and Moving Occupations
The most common Production, Transportation and Moving occupations in Savanna are Production (304 | 26.1%), and Transportation (38 | 3.3%).
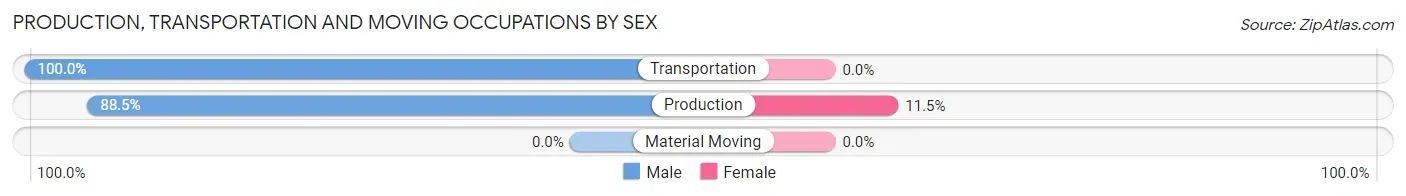
Production, Transportation and Moving Occupations by Sex
| Occupation | Male | Female |
| Production | 269 (88.5%) | 35 (11.5%) |
| Transportation | 38 (100.0%) | 0 (0.0%) |
| Material Moving | 0 (0.0%) | 0 (0.0%) |
| Total (Category) | 307 (89.8%) | 35 (10.2%) |
| Total (Overall) | 791 (68.0%) | 373 (32.0%) |
Employment Industries by Sex in Savanna
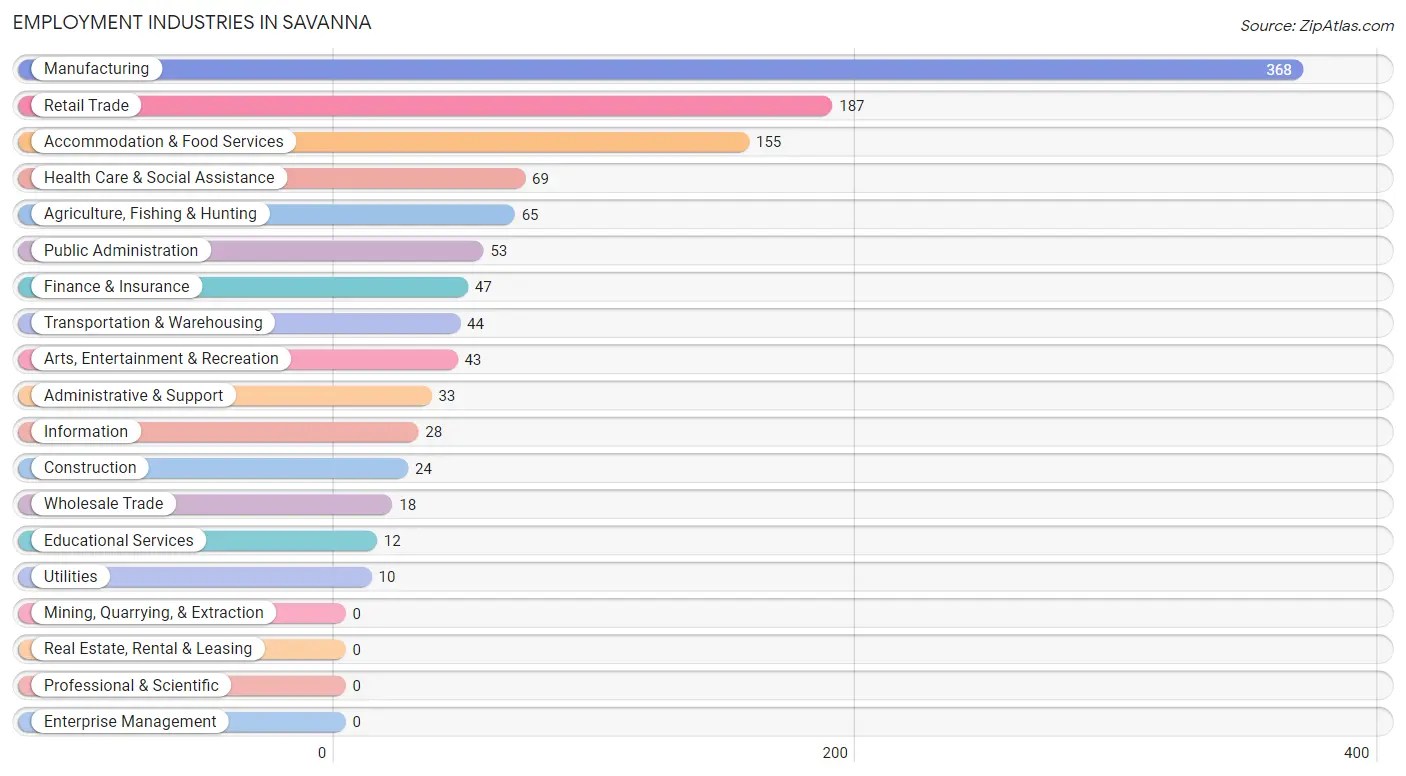
Employment Industries in Savanna
The major employment industries in Savanna include Manufacturing (368 | 31.6%), Retail Trade (187 | 16.1%), Accommodation & Food Services (155 | 13.3%), Health Care & Social Assistance (69 | 5.9%), and Agriculture, Fishing & Hunting (65 | 5.6%).
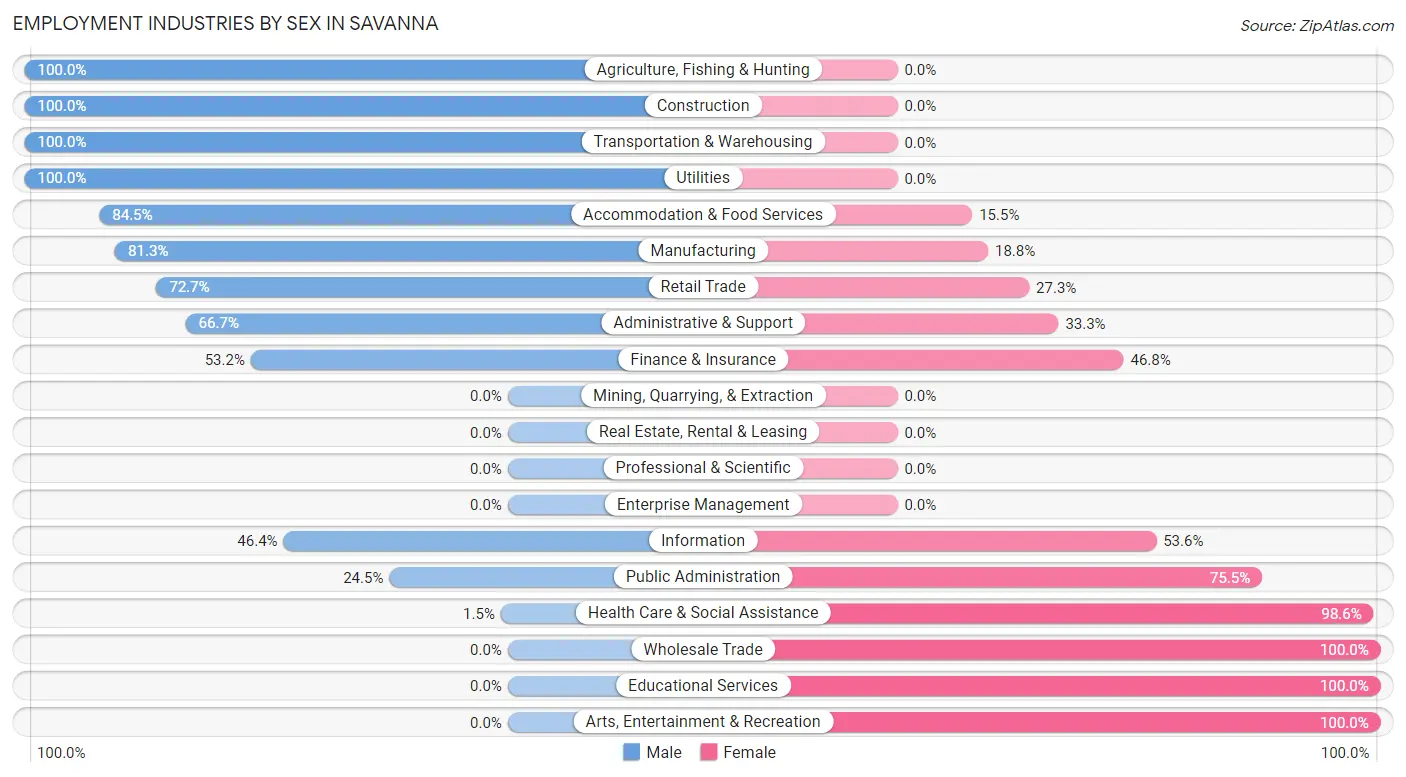
Employment Industries by Sex in Savanna
The Savanna industries that see more men than women are Agriculture, Fishing & Hunting (100.0%), Construction (100.0%), and Transportation & Warehousing (100.0%), whereas the industries that tend to have a higher number of women are Wholesale Trade (100.0%), Educational Services (100.0%), and Arts, Entertainment & Recreation (100.0%).
| Industry | Male | Female |
| Agriculture, Fishing & Hunting | 65 (100.0%) | 0 (0.0%) |
| Mining, Quarrying, & Extraction | 0 (0.0%) | 0 (0.0%) |
| Construction | 24 (100.0%) | 0 (0.0%) |
| Manufacturing | 299 (81.2%) | 69 (18.8%) |
| Wholesale Trade | 0 (0.0%) | 18 (100.0%) |
| Retail Trade | 136 (72.7%) | 51 (27.3%) |
| Transportation & Warehousing | 44 (100.0%) | 0 (0.0%) |
| Utilities | 10 (100.0%) | 0 (0.0%) |
| Information | 13 (46.4%) | 15 (53.6%) |
| Finance & Insurance | 25 (53.2%) | 22 (46.8%) |
| Real Estate, Rental & Leasing | 0 (0.0%) | 0 (0.0%) |
| Professional & Scientific | 0 (0.0%) | 0 (0.0%) |
| Enterprise Management | 0 (0.0%) | 0 (0.0%) |
| Administrative & Support | 22 (66.7%) | 11 (33.3%) |
| Educational Services | 0 (0.0%) | 12 (100.0%) |
| Health Care & Social Assistance | 1 (1.5%) | 68 (98.6%) |
| Arts, Entertainment & Recreation | 0 (0.0%) | 43 (100.0%) |
| Accommodation & Food Services | 131 (84.5%) | 24 (15.5%) |
| Public Administration | 13 (24.5%) | 40 (75.5%) |
| Total | 791 (68.0%) | 373 (32.0%) |
Education in Savanna
School Enrollment in Savanna
The most common levels of schooling among the 555 students in Savanna are high school (148 | 26.7%), middle school (139 | 25.1%), and college / undergraduate (115 | 20.7%).
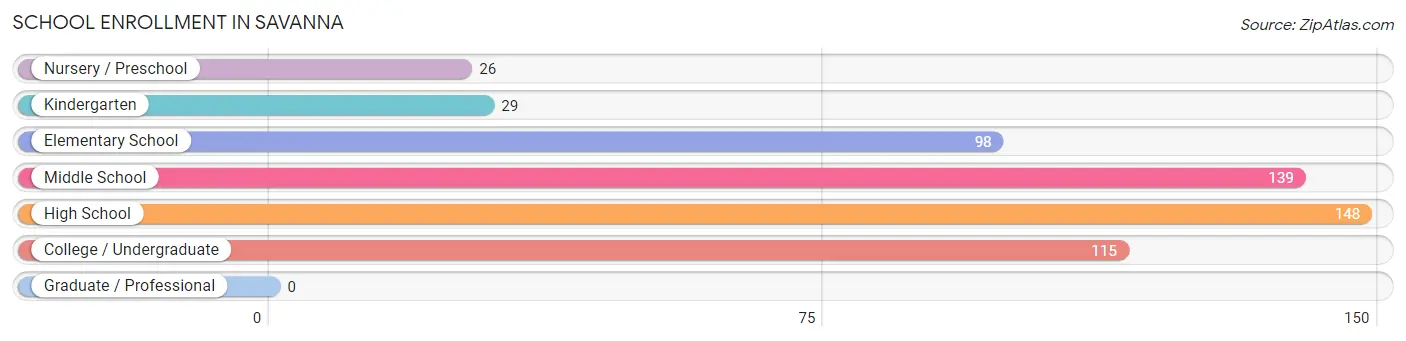
| School Level | # Students | % Students |
| Nursery / Preschool | 26 | 4.7% |
| Kindergarten | 29 | 5.2% |
| Elementary School | 98 | 17.7% |
| Middle School | 139 | 25.1% |
| High School | 148 | 26.7% |
| College / Undergraduate | 115 | 20.7% |
| Graduate / Professional | 0 | 0.0% |
| Total | 555 | 100.0% |
School Enrollment by Age by Funding Source in Savanna
Out of a total of 555 students who are enrolled in schools in Savanna, 37 (6.7%) attend a private institution, while the remaining 518 (93.3%) are enrolled in public schools. The age group of 5 to 9 year old has the highest likelihood of being enrolled in private schools, with 13 (11.2% in the age bracket) enrolled. Conversely, the age group of 3 to 4 year olds has the lowest likelihood of being enrolled in a private school, with 12 (100.0% in the age bracket) attending a public institution.
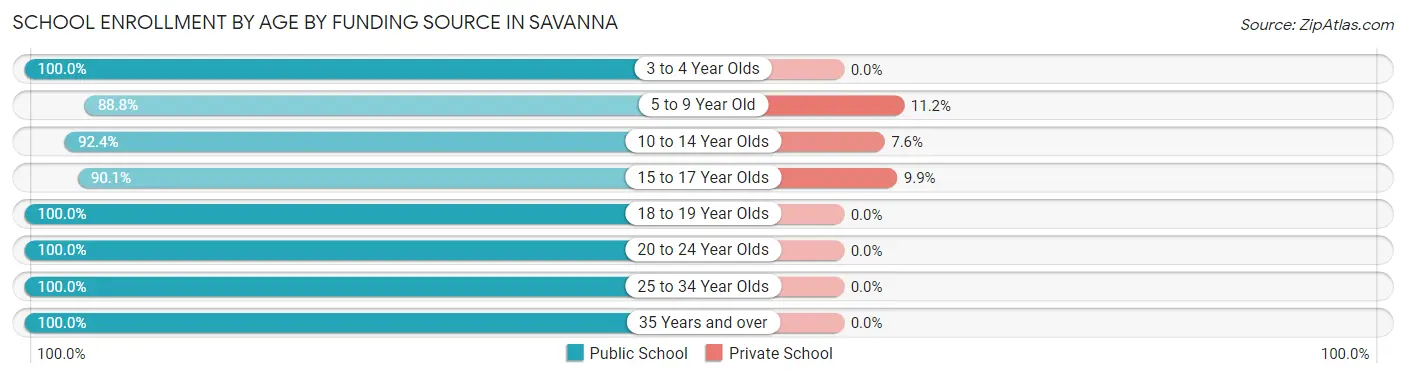
| Age Bracket | Public School | Private School |
| 3 to 4 Year Olds | 12 (100.0%) | 0 (0.0%) |
| 5 to 9 Year Old | 103 (88.8%) | 13 (11.2%) |
| 10 to 14 Year Olds | 159 (92.4%) | 13 (7.6%) |
| 15 to 17 Year Olds | 100 (90.1%) | 11 (9.9%) |
| 18 to 19 Year Olds | 43 (100.0%) | 0 (0.0%) |
| 20 to 24 Year Olds | 49 (100.0%) | 0 (0.0%) |
| 25 to 34 Year Olds | 40 (100.0%) | 0 (0.0%) |
| 35 Years and over | 12 (100.0%) | 0 (0.0%) |
| Total | 518 (93.3%) | 37 (6.7%) |
Educational Attainment by Field of Study in Savanna
Business (76 | 24.4%), education (55 | 17.6%), communications (39 | 12.5%), visual & performing arts (30 | 9.6%), and arts & humanities (23 | 7.4%) are the most common fields of study among 312 individuals in Savanna who have obtained a bachelor's degree or higher.
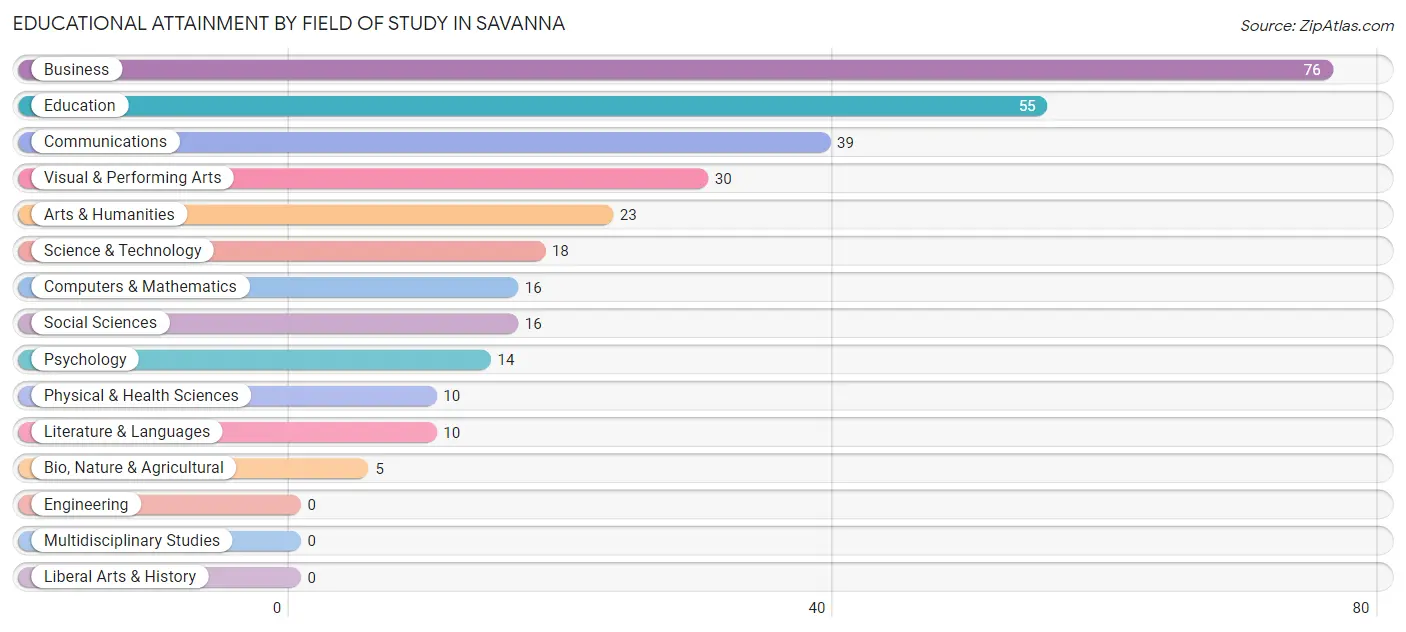
| Field of Study | # Graduates | % Graduates |
| Computers & Mathematics | 16 | 5.1% |
| Bio, Nature & Agricultural | 5 | 1.6% |
| Physical & Health Sciences | 10 | 3.2% |
| Psychology | 14 | 4.5% |
| Social Sciences | 16 | 5.1% |
| Engineering | 0 | 0.0% |
| Multidisciplinary Studies | 0 | 0.0% |
| Science & Technology | 18 | 5.8% |
| Business | 76 | 24.4% |
| Education | 55 | 17.6% |
| Literature & Languages | 10 | 3.2% |
| Liberal Arts & History | 0 | 0.0% |
| Visual & Performing Arts | 30 | 9.6% |
| Communications | 39 | 12.5% |
| Arts & Humanities | 23 | 7.4% |
| Total | 312 | 100.0% |
Transportation & Commute in Savanna
Vehicle Availability by Sex in Savanna
The most prevalent vehicle ownership categories in Savanna are males with 1 vehicle (410, accounting for 52.5%) and females with 1 vehicle (124, making up 109.9%).
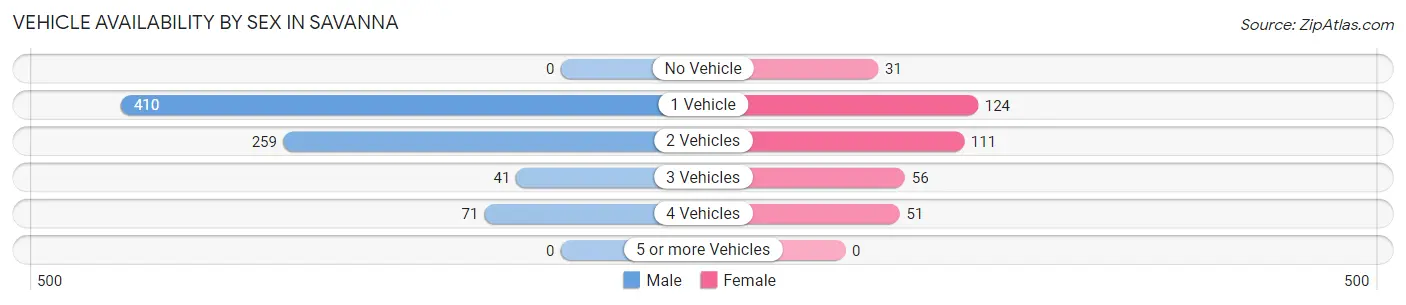
| Vehicles Available | Male | Female |
| No Vehicle | 0 (0.0%) | 31 (8.3%) |
| 1 Vehicle | 410 (52.5%) | 124 (33.2%) |
| 2 Vehicles | 259 (33.2%) | 111 (29.8%) |
| 3 Vehicles | 41 (5.2%) | 56 (15.0%) |
| 4 Vehicles | 71 (9.1%) | 51 (13.7%) |
| 5 or more Vehicles | 0 (0.0%) | 0 (0.0%) |
| Total | 781 (100.0%) | 373 (100.0%) |
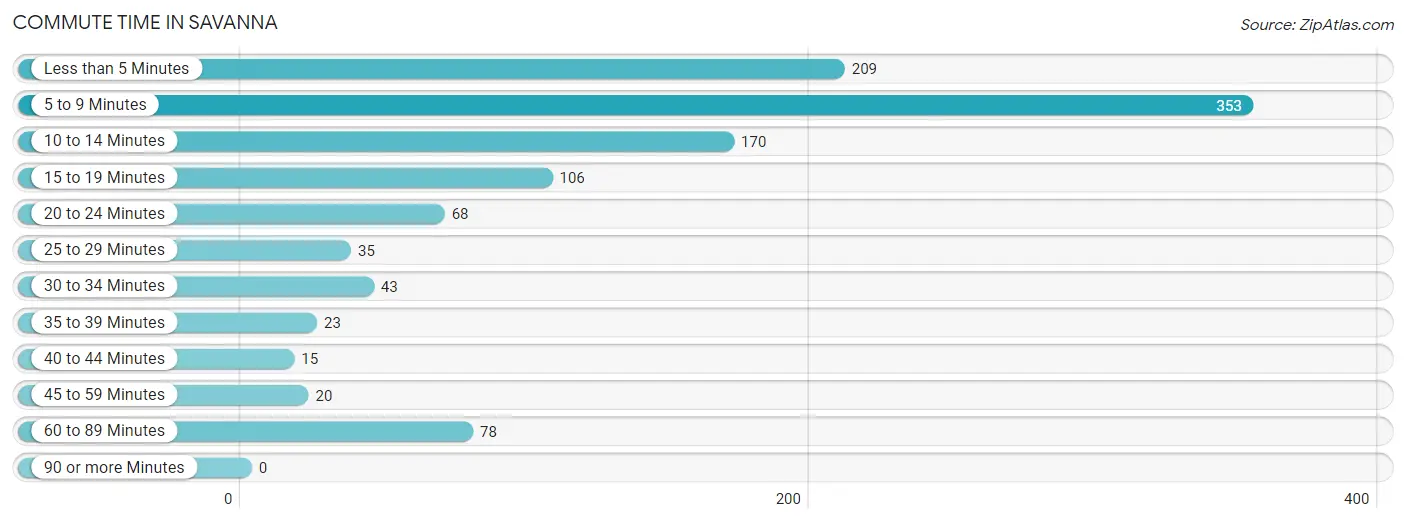
Commute Time in Savanna
The most frequently occuring commute durations in Savanna are 5 to 9 minutes (353 commuters, 31.5%), less than 5 minutes (209 commuters, 18.7%), and 10 to 14 minutes (170 commuters, 15.2%).
| Commute Time | # Commuters | % Commuters |
| Less than 5 Minutes | 209 | 18.7% |
| 5 to 9 Minutes | 353 | 31.5% |
| 10 to 14 Minutes | 170 | 15.2% |
| 15 to 19 Minutes | 106 | 9.5% |
| 20 to 24 Minutes | 68 | 6.1% |
| 25 to 29 Minutes | 35 | 3.1% |
| 30 to 34 Minutes | 43 | 3.8% |
| 35 to 39 Minutes | 23 | 2.1% |
| 40 to 44 Minutes | 15 | 1.3% |
| 45 to 59 Minutes | 20 | 1.8% |
| 60 to 89 Minutes | 78 | 7.0% |
| 90 or more Minutes | 0 | 0.0% |
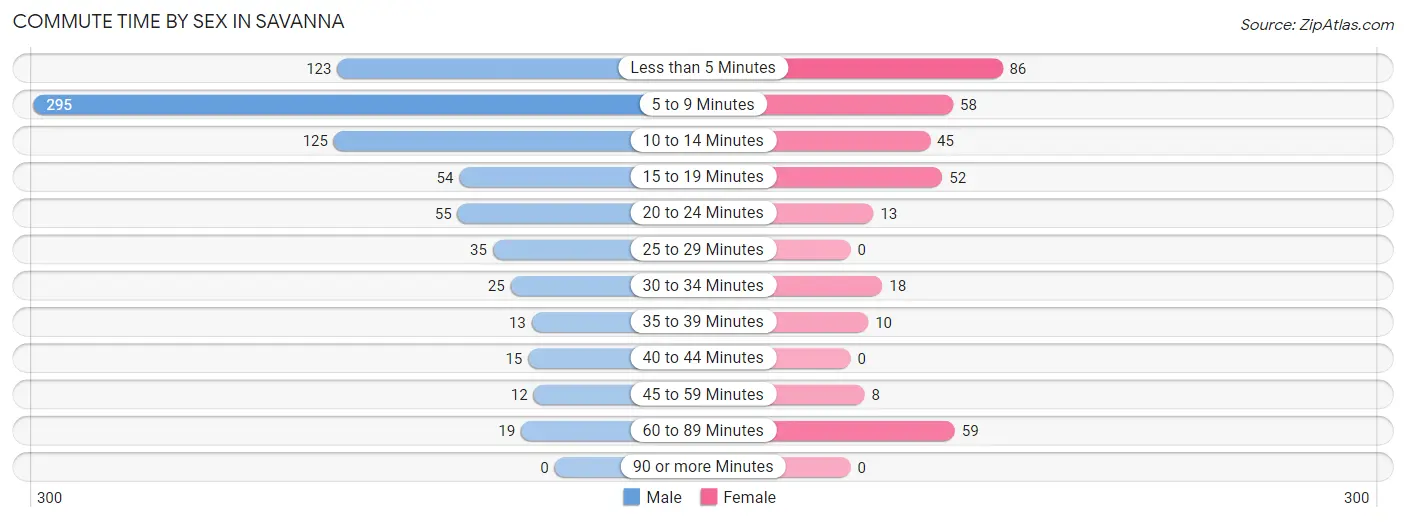
Commute Time by Sex in Savanna
The most common commute times in Savanna are 5 to 9 minutes (295 commuters, 38.3%) for males and less than 5 minutes (86 commuters, 24.6%) for females.
| Commute Time | Male | Female |
| Less than 5 Minutes | 123 (16.0%) | 86 (24.6%) |
| 5 to 9 Minutes | 295 (38.3%) | 58 (16.6%) |
| 10 to 14 Minutes | 125 (16.2%) | 45 (12.9%) |
| 15 to 19 Minutes | 54 (7.0%) | 52 (14.9%) |
| 20 to 24 Minutes | 55 (7.1%) | 13 (3.7%) |
| 25 to 29 Minutes | 35 (4.5%) | 0 (0.0%) |
| 30 to 34 Minutes | 25 (3.2%) | 18 (5.2%) |
| 35 to 39 Minutes | 13 (1.7%) | 10 (2.9%) |
| 40 to 44 Minutes | 15 (1.9%) | 0 (0.0%) |
| 45 to 59 Minutes | 12 (1.6%) | 8 (2.3%) |
| 60 to 89 Minutes | 19 (2.5%) | 59 (16.9%) |
| 90 or more Minutes | 0 (0.0%) | 0 (0.0%) |
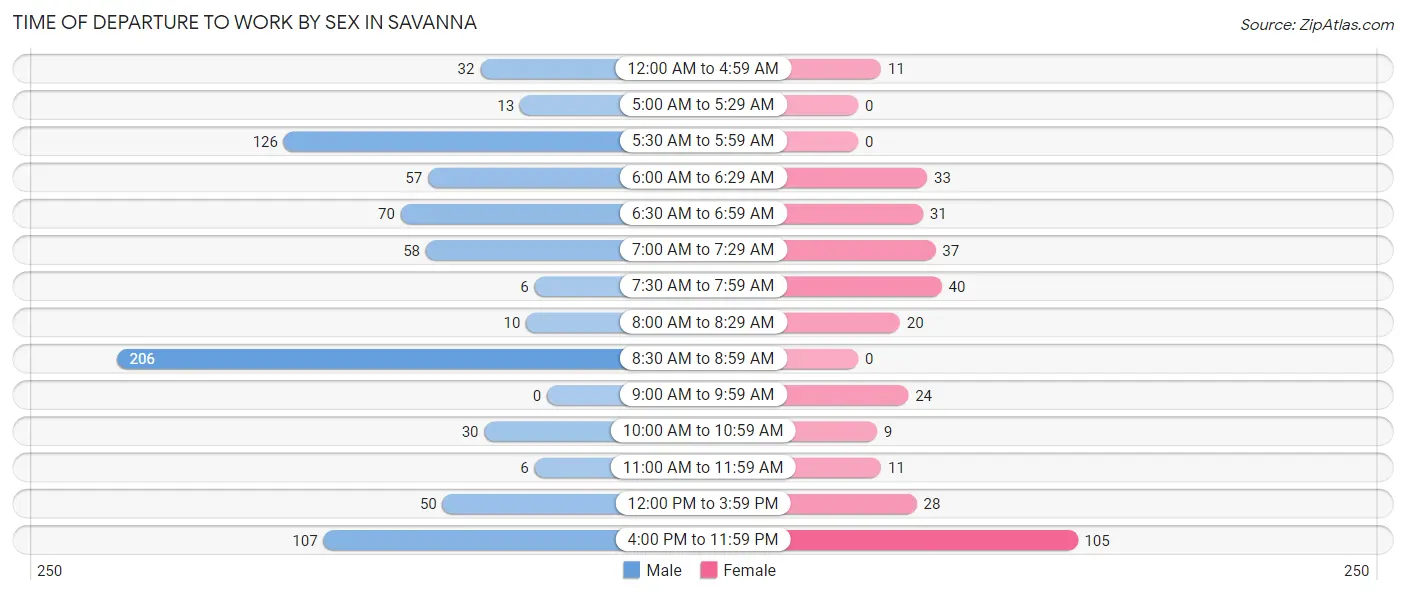
Time of Departure to Work by Sex in Savanna
The most frequent times of departure to work in Savanna are 8:30 AM to 8:59 AM (206, 26.7%) for males and 4:00 PM to 11:59 PM (105, 30.1%) for females.
| Time of Departure | Male | Female |
| 12:00 AM to 4:59 AM | 32 (4.2%) | 11 (3.2%) |
| 5:00 AM to 5:29 AM | 13 (1.7%) | 0 (0.0%) |
| 5:30 AM to 5:59 AM | 126 (16.3%) | 0 (0.0%) |
| 6:00 AM to 6:29 AM | 57 (7.4%) | 33 (9.5%) |
| 6:30 AM to 6:59 AM | 70 (9.1%) | 31 (8.9%) |
| 7:00 AM to 7:29 AM | 58 (7.5%) | 37 (10.6%) |
| 7:30 AM to 7:59 AM | 6 (0.8%) | 40 (11.5%) |
| 8:00 AM to 8:29 AM | 10 (1.3%) | 20 (5.7%) |
| 8:30 AM to 8:59 AM | 206 (26.7%) | 0 (0.0%) |
| 9:00 AM to 9:59 AM | 0 (0.0%) | 24 (6.9%) |
| 10:00 AM to 10:59 AM | 30 (3.9%) | 9 (2.6%) |
| 11:00 AM to 11:59 AM | 6 (0.8%) | 11 (3.2%) |
| 12:00 PM to 3:59 PM | 50 (6.5%) | 28 (8.0%) |
| 4:00 PM to 11:59 PM | 107 (13.9%) | 105 (30.1%) |
| Total | 771 (100.0%) | 349 (100.0%) |
Housing Occupancy in Savanna
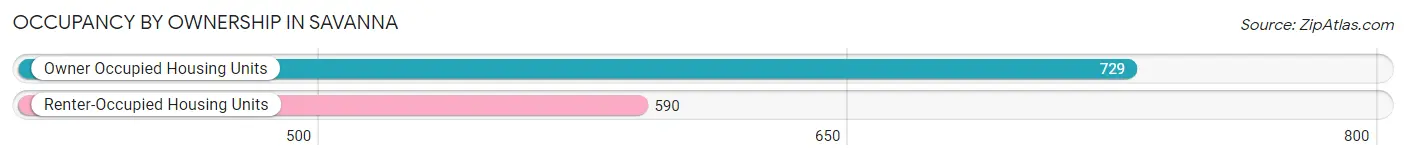
Occupancy by Ownership in Savanna
Of the total 1,319 dwellings in Savanna, owner-occupied units account for 729 (55.3%), while renter-occupied units make up 590 (44.7%).
| Occupancy | # Housing Units | % Housing Units |
| Owner Occupied Housing Units | 729 | 55.3% |
| Renter-Occupied Housing Units | 590 | 44.7% |
| Total Occupied Housing Units | 1,319 | 100.0% |
Occupancy by Household Size in Savanna
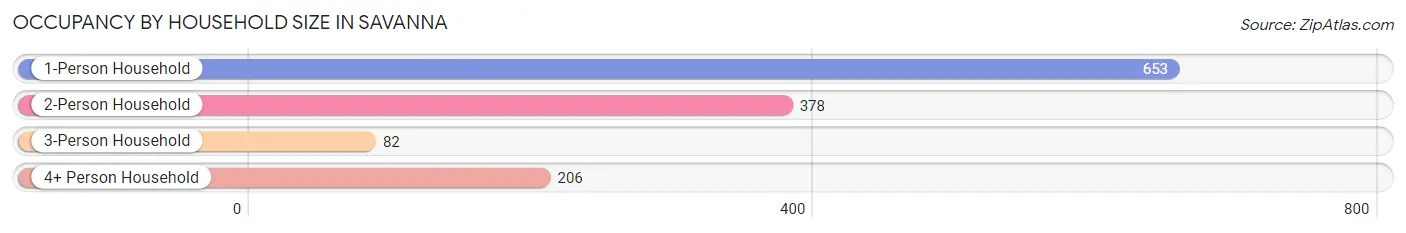
| Household Size | # Housing Units | % Housing Units |
| 1-Person Household | 653 | 49.5% |
| 2-Person Household | 378 | 28.7% |
| 3-Person Household | 82 | 6.2% |
| 4+ Person Household | 206 | 15.6% |
| Total Housing Units | 1,319 | 100.0% |
Occupancy by Ownership by Household Size in Savanna
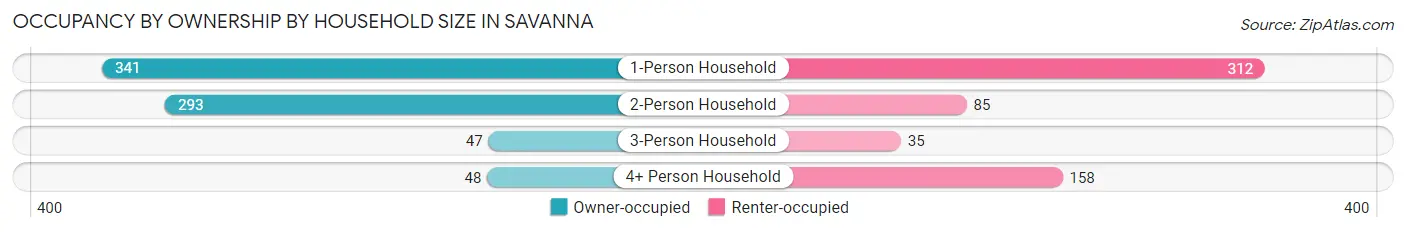
| Household Size | Owner-occupied | Renter-occupied |
| 1-Person Household | 341 (52.2%) | 312 (47.8%) |
| 2-Person Household | 293 (77.5%) | 85 (22.5%) |
| 3-Person Household | 47 (57.3%) | 35 (42.7%) |
| 4+ Person Household | 48 (23.3%) | 158 (76.7%) |
| Total Housing Units | 729 (55.3%) | 590 (44.7%) |
Occupancy by Educational Attainment in Savanna
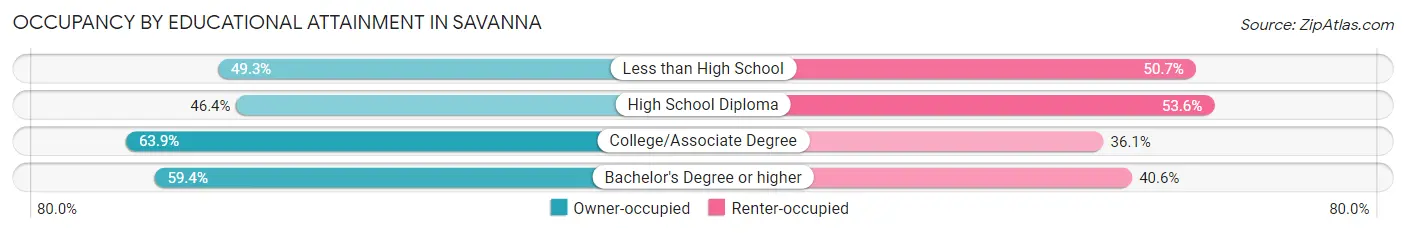
| Household Size | Owner-occupied | Renter-occupied |
| Less than High School | 74 (49.3%) | 76 (50.7%) |
| High School Diploma | 213 (46.4%) | 246 (53.6%) |
| College/Associate Degree | 287 (63.9%) | 162 (36.1%) |
| Bachelor's Degree or higher | 155 (59.4%) | 106 (40.6%) |
Occupancy by Age of Householder in Savanna
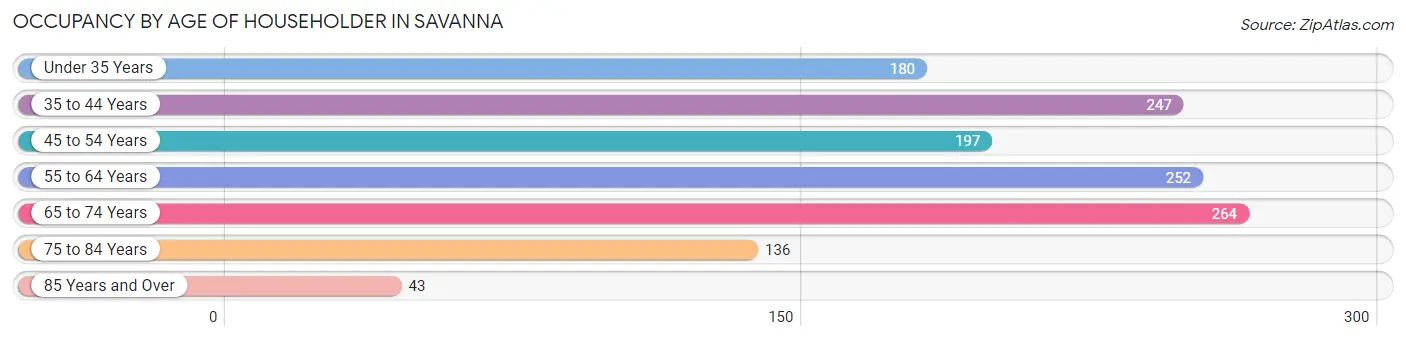
| Age Bracket | # Households | % Households |
| Under 35 Years | 180 | 13.7% |
| 35 to 44 Years | 247 | 18.7% |
| 45 to 54 Years | 197 | 14.9% |
| 55 to 64 Years | 252 | 19.1% |
| 65 to 74 Years | 264 | 20.0% |
| 75 to 84 Years | 136 | 10.3% |
| 85 Years and Over | 43 | 3.3% |
| Total | 1,319 | 100.0% |
Housing Finances in Savanna
Median Income by Occupancy in Savanna
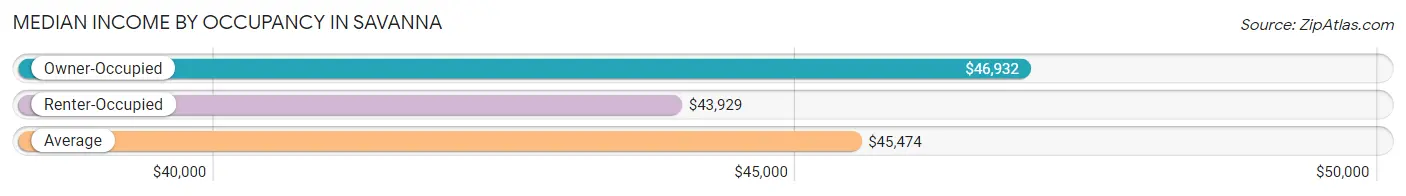
| Occupancy Type | # Households | Median Income |
| Owner-Occupied | 729 (55.3%) | $46,932 |
| Renter-Occupied | 590 (44.7%) | $43,929 |
| Average | 1,319 (100.0%) | $45,474 |
Occupancy by Householder Income Bracket in Savanna
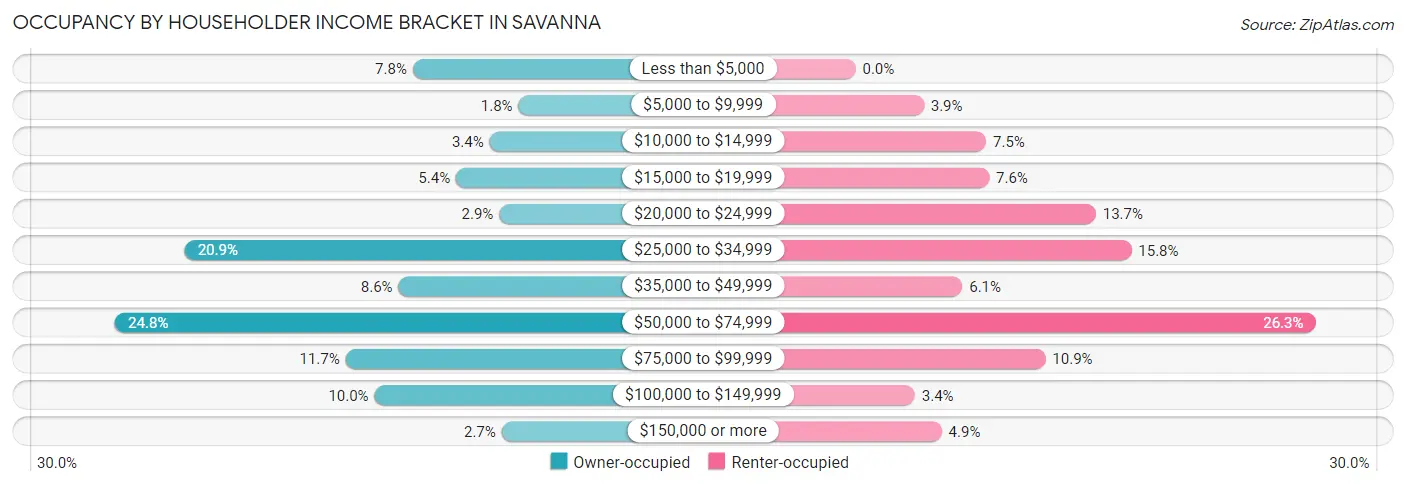
| Income Bracket | Owner-occupied | Renter-occupied |
| Less than $5,000 | 57 (7.8%) | 0 (0.0%) |
| $5,000 to $9,999 | 13 (1.8%) | 23 (3.9%) |
| $10,000 to $14,999 | 25 (3.4%) | 44 (7.5%) |
| $15,000 to $19,999 | 39 (5.3%) | 45 (7.6%) |
| $20,000 to $24,999 | 21 (2.9%) | 81 (13.7%) |
| $25,000 to $34,999 | 152 (20.8%) | 93 (15.8%) |
| $35,000 to $49,999 | 63 (8.6%) | 36 (6.1%) |
| $50,000 to $74,999 | 181 (24.8%) | 155 (26.3%) |
| $75,000 to $99,999 | 85 (11.7%) | 64 (10.8%) |
| $100,000 to $149,999 | 73 (10.0%) | 20 (3.4%) |
| $150,000 or more | 20 (2.7%) | 29 (4.9%) |
| Total | 729 (100.0%) | 590 (100.0%) |
Monthly Housing Cost Tiers in Savanna
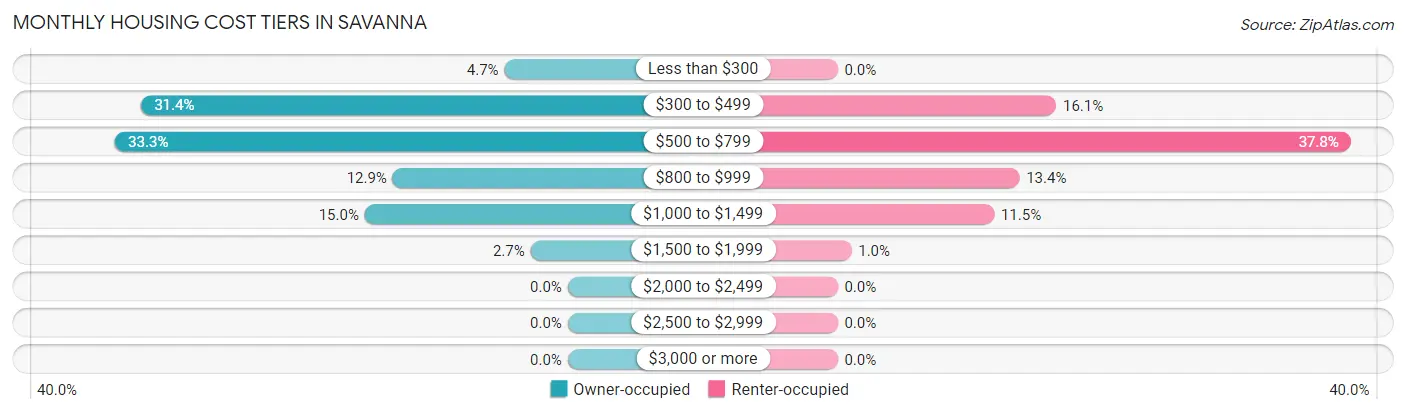
| Monthly Cost | Owner-occupied | Renter-occupied |
| Less than $300 | 34 (4.7%) | 0 (0.0%) |
| $300 to $499 | 229 (31.4%) | 95 (16.1%) |
| $500 to $799 | 243 (33.3%) | 223 (37.8%) |
| $800 to $999 | 94 (12.9%) | 79 (13.4%) |
| $1,000 to $1,499 | 109 (14.9%) | 68 (11.5%) |
| $1,500 to $1,999 | 20 (2.7%) | 6 (1.0%) |
| $2,000 to $2,499 | 0 (0.0%) | 0 (0.0%) |
| $2,500 to $2,999 | 0 (0.0%) | 0 (0.0%) |
| $3,000 or more | 0 (0.0%) | 0 (0.0%) |
| Total | 729 (100.0%) | 590 (100.0%) |
Physical Housing Characteristics in Savanna
Housing Structures in Savanna
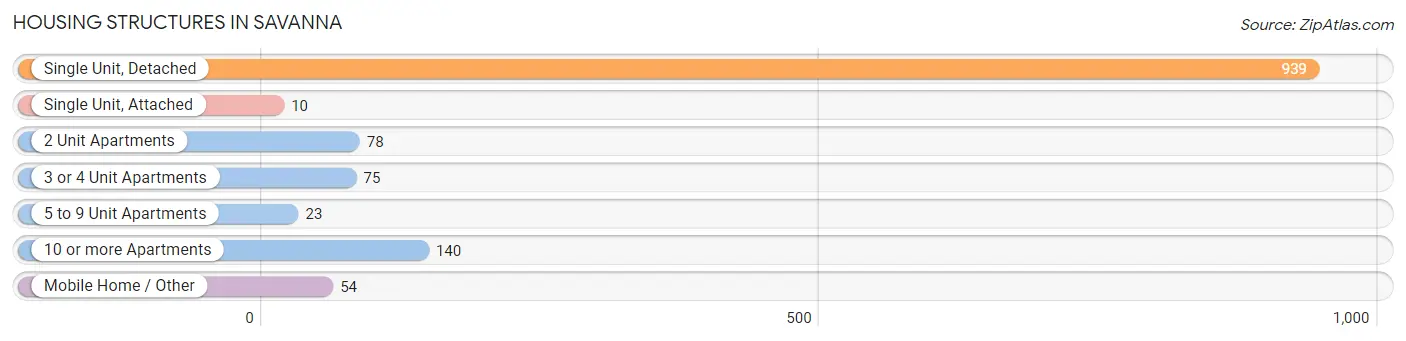
| Structure Type | # Housing Units | % Housing Units |
| Single Unit, Detached | 939 | 71.2% |
| Single Unit, Attached | 10 | 0.8% |
| 2 Unit Apartments | 78 | 5.9% |
| 3 or 4 Unit Apartments | 75 | 5.7% |
| 5 to 9 Unit Apartments | 23 | 1.7% |
| 10 or more Apartments | 140 | 10.6% |
| Mobile Home / Other | 54 | 4.1% |
| Total | 1,319 | 100.0% |
Housing Structures by Occupancy in Savanna
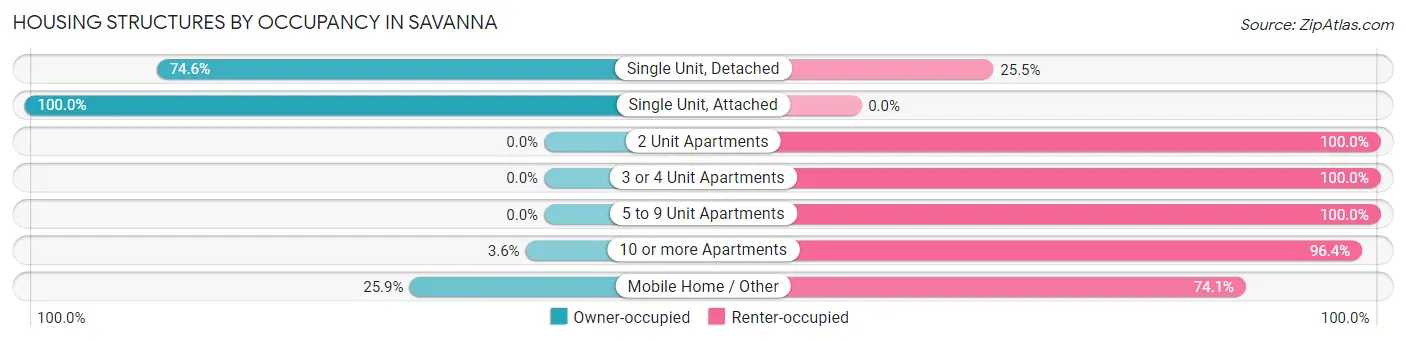
| Structure Type | Owner-occupied | Renter-occupied |
| Single Unit, Detached | 700 (74.6%) | 239 (25.5%) |
| Single Unit, Attached | 10 (100.0%) | 0 (0.0%) |
| 2 Unit Apartments | 0 (0.0%) | 78 (100.0%) |
| 3 or 4 Unit Apartments | 0 (0.0%) | 75 (100.0%) |
| 5 to 9 Unit Apartments | 0 (0.0%) | 23 (100.0%) |
| 10 or more Apartments | 5 (3.6%) | 135 (96.4%) |
| Mobile Home / Other | 14 (25.9%) | 40 (74.1%) |
| Total | 729 (55.3%) | 590 (44.7%) |
Housing Structures by Number of Rooms in Savanna
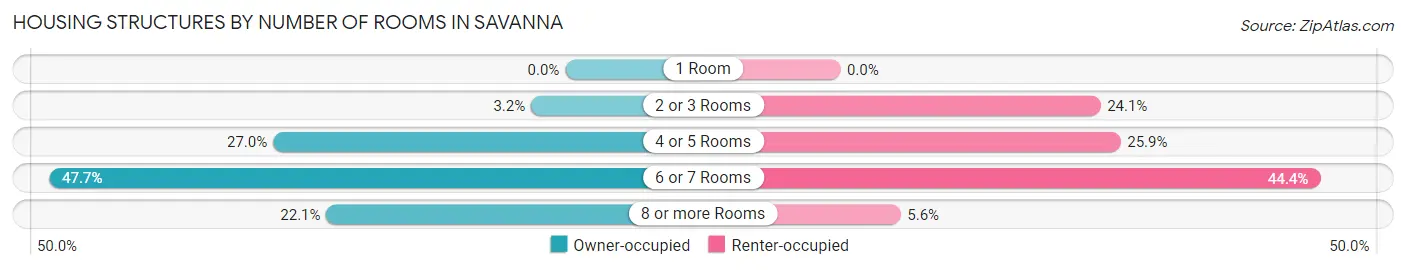
| Number of Rooms | Owner-occupied | Renter-occupied |
| 1 Room | 0 (0.0%) | 0 (0.0%) |
| 2 or 3 Rooms | 23 (3.2%) | 142 (24.1%) |
| 4 or 5 Rooms | 197 (27.0%) | 153 (25.9%) |
| 6 or 7 Rooms | 348 (47.7%) | 262 (44.4%) |
| 8 or more Rooms | 161 (22.1%) | 33 (5.6%) |
| Total | 729 (100.0%) | 590 (100.0%) |
Housing Structure by Heating Type in Savanna
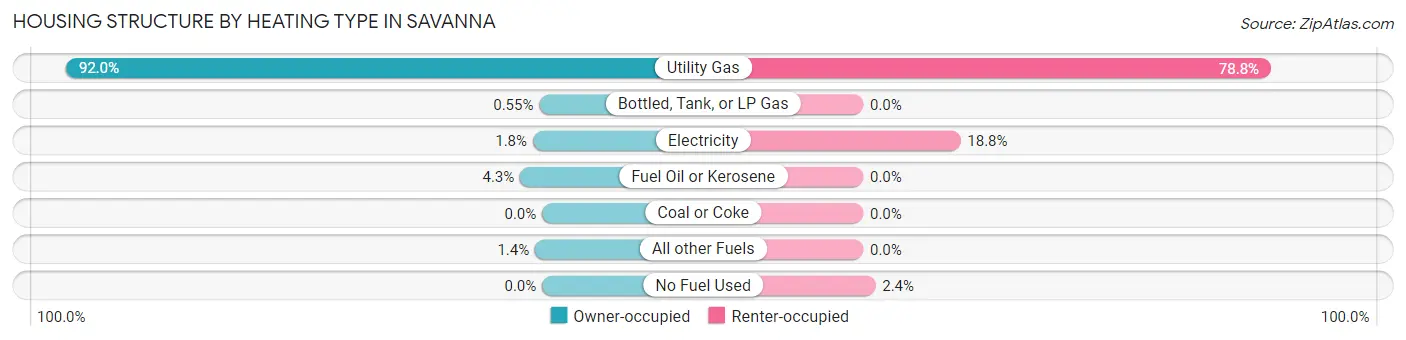
| Heating Type | Owner-occupied | Renter-occupied |
| Utility Gas | 671 (92.0%) | 465 (78.8%) |
| Bottled, Tank, or LP Gas | 4 (0.5%) | 0 (0.0%) |
| Electricity | 13 (1.8%) | 111 (18.8%) |
| Fuel Oil or Kerosene | 31 (4.3%) | 0 (0.0%) |
| Coal or Coke | 0 (0.0%) | 0 (0.0%) |
| All other Fuels | 10 (1.4%) | 0 (0.0%) |
| No Fuel Used | 0 (0.0%) | 14 (2.4%) |
| Total | 729 (100.0%) | 590 (100.0%) |
Household Vehicle Usage in Savanna
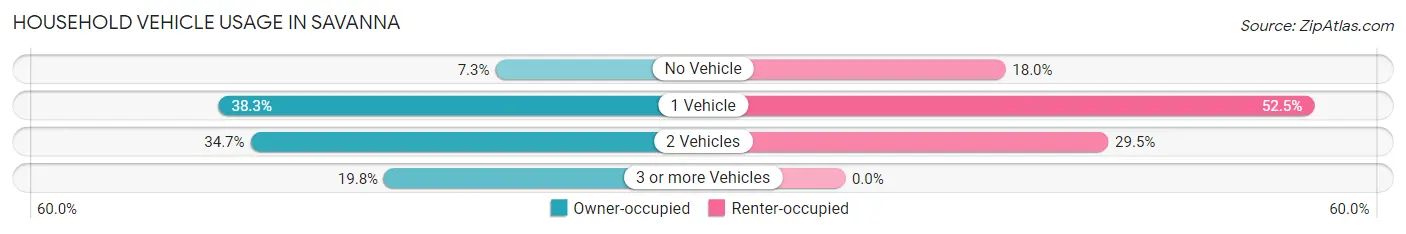
| Vehicles per Household | Owner-occupied | Renter-occupied |
| No Vehicle | 53 (7.3%) | 106 (18.0%) |
| 1 Vehicle | 279 (38.3%) | 310 (52.5%) |
| 2 Vehicles | 253 (34.7%) | 174 (29.5%) |
| 3 or more Vehicles | 144 (19.8%) | 0 (0.0%) |
| Total | 729 (100.0%) | 590 (100.0%) |
Real Estate & Mortgages in Savanna
Real Estate and Mortgage Overview in Savanna
| Characteristic | Without Mortgage | With Mortgage |
| Housing Units | 434 | 295 |
| Median Property Value | $57,300 | $72,000 |
| Median Household Income | $42,778 | $9 |
| Monthly Housing Costs | $473 | $0 |
| Real Estate Taxes | $929 | $0 |
Property Value by Mortgage Status in Savanna
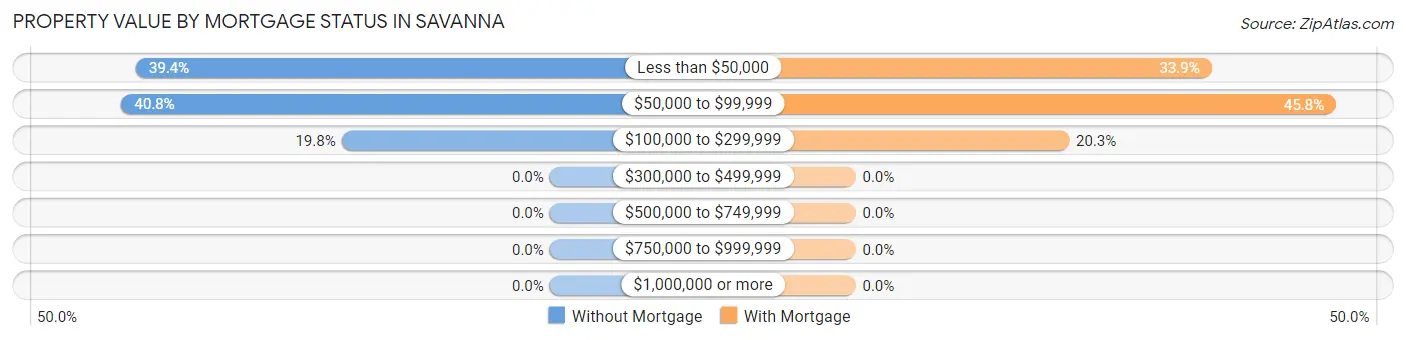
| Property Value | Without Mortgage | With Mortgage |
| Less than $50,000 | 171 (39.4%) | 100 (33.9%) |
| $50,000 to $99,999 | 177 (40.8%) | 135 (45.8%) |
| $100,000 to $299,999 | 86 (19.8%) | 60 (20.3%) |
| $300,000 to $499,999 | 0 (0.0%) | 0 (0.0%) |
| $500,000 to $749,999 | 0 (0.0%) | 0 (0.0%) |
| $750,000 to $999,999 | 0 (0.0%) | 0 (0.0%) |
| $1,000,000 or more | 0 (0.0%) | 0 (0.0%) |
| Total | 434 (100.0%) | 295 (100.0%) |
Household Income by Mortgage Status in Savanna
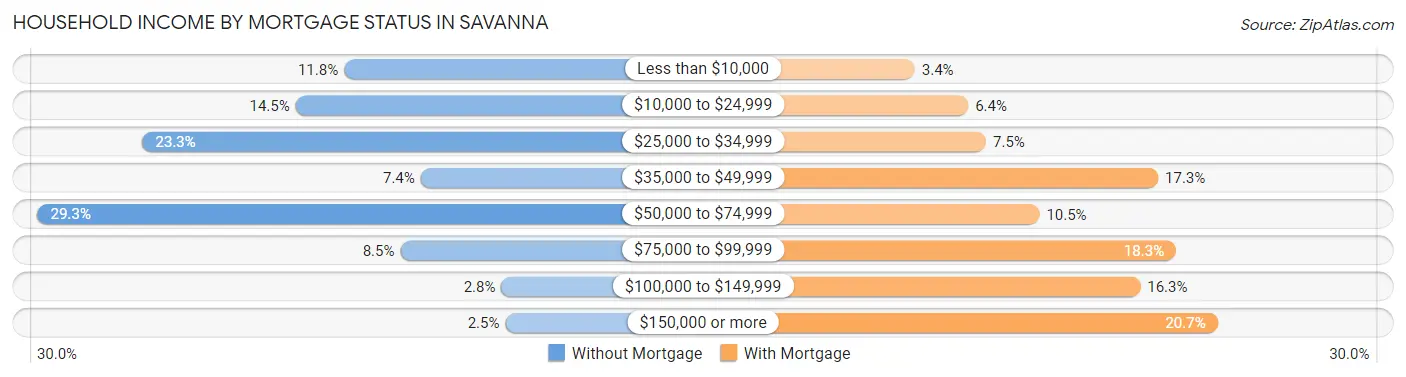
| Household Income | Without Mortgage | With Mortgage |
| Less than $10,000 | 51 (11.7%) | 10 (3.4%) |
| $10,000 to $24,999 | 63 (14.5%) | 19 (6.4%) |
| $25,000 to $34,999 | 101 (23.3%) | 22 (7.5%) |
| $35,000 to $49,999 | 32 (7.4%) | 51 (17.3%) |
| $50,000 to $74,999 | 127 (29.3%) | 31 (10.5%) |
| $75,000 to $99,999 | 37 (8.5%) | 54 (18.3%) |
| $100,000 to $149,999 | 12 (2.8%) | 48 (16.3%) |
| $150,000 or more | 11 (2.5%) | 61 (20.7%) |
| Total | 434 (100.0%) | 295 (100.0%) |
Property Value to Household Income Ratio in Savanna
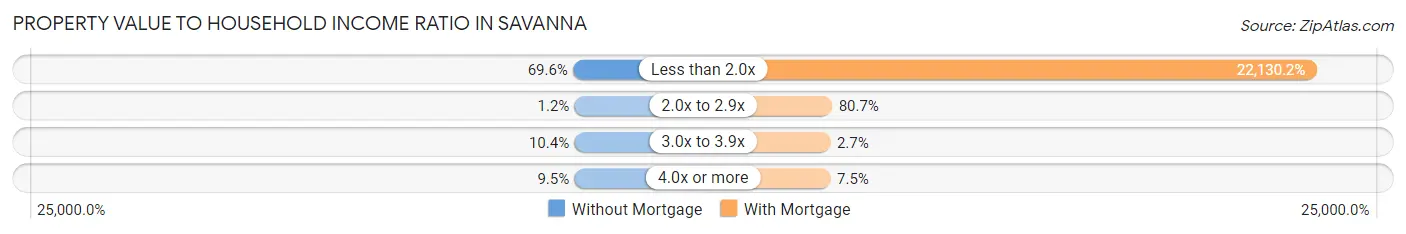
| Value-to-Income Ratio | Without Mortgage | With Mortgage |
| Less than 2.0x | 302 (69.6%) | 65,284 (22,130.2%) |
| 2.0x to 2.9x | 5 (1.1%) | 238 (80.7%) |
| 3.0x to 3.9x | 45 (10.4%) | 8 (2.7%) |
| 4.0x or more | 41 (9.5%) | 22 (7.5%) |
| Total | 434 (100.0%) | 295 (100.0%) |
Real Estate Taxes by Mortgage Status in Savanna
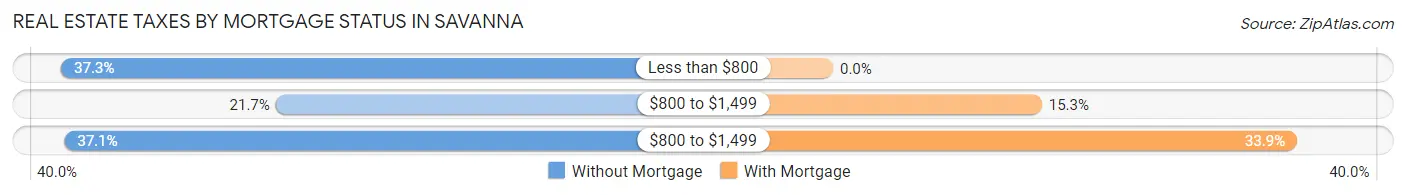
| Property Taxes | Without Mortgage | With Mortgage |
| Less than $800 | 162 (37.3%) | 0 (0.0%) |
| $800 to $1,499 | 94 (21.7%) | 45 (15.2%) |
| $800 to $1,499 | 161 (37.1%) | 100 (33.9%) |
| Total | 434 (100.0%) | 295 (100.0%) |
Health & Disability in Savanna
Health Insurance Coverage by Age in Savanna
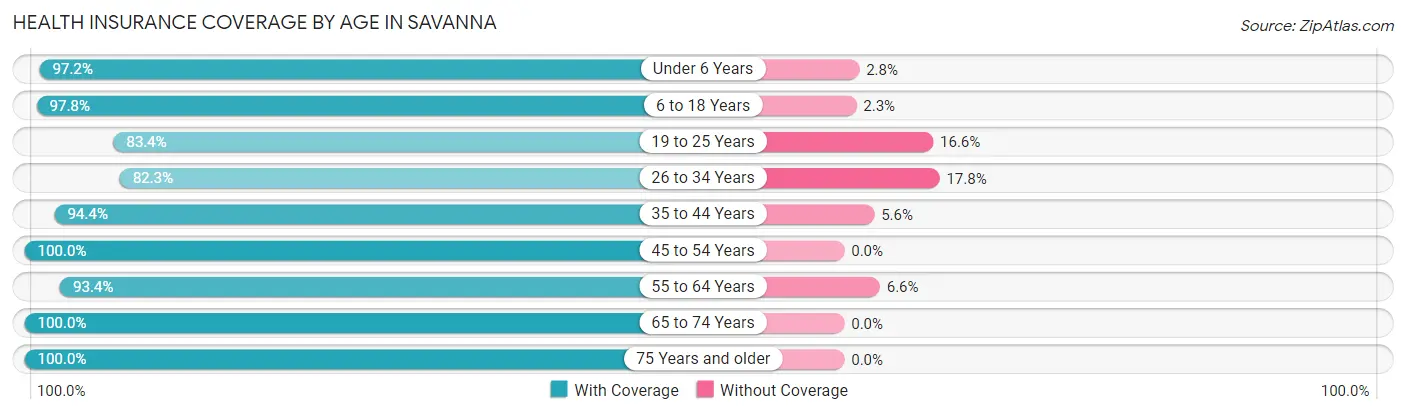
| Age Bracket | With Coverage | Without Coverage |
| Under 6 Years | 70 (97.2%) | 2 (2.8%) |
| 6 to 18 Years | 434 (97.8%) | 10 (2.2%) |
| 19 to 25 Years | 136 (83.4%) | 27 (16.6%) |
| 26 to 34 Years | 227 (82.3%) | 49 (17.7%) |
| 35 to 44 Years | 372 (94.4%) | 22 (5.6%) |
| 45 to 54 Years | 318 (100.0%) | 0 (0.0%) |
| 55 to 64 Years | 409 (93.4%) | 29 (6.6%) |
| 65 to 74 Years | 346 (100.0%) | 0 (0.0%) |
| 75 Years and older | 270 (100.0%) | 0 (0.0%) |
| Total | 2,582 (94.9%) | 139 (5.1%) |
Health Insurance Coverage by Citizenship Status in Savanna
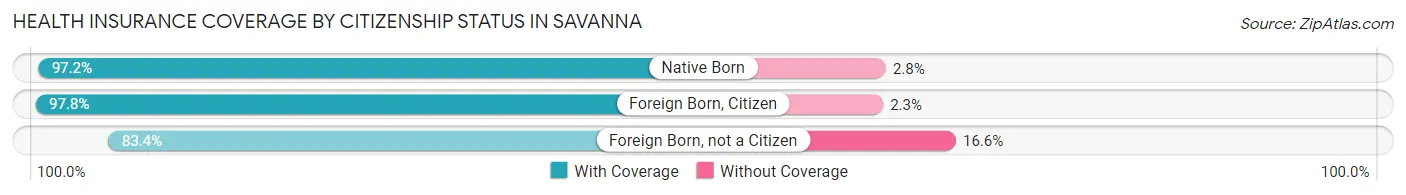
| Citizenship Status | With Coverage | Without Coverage |
| Native Born | 70 (97.2%) | 2 (2.8%) |
| Foreign Born, Citizen | 434 (97.8%) | 10 (2.2%) |
| Foreign Born, not a Citizen | 136 (83.4%) | 27 (16.6%) |
Health Insurance Coverage by Household Income in Savanna
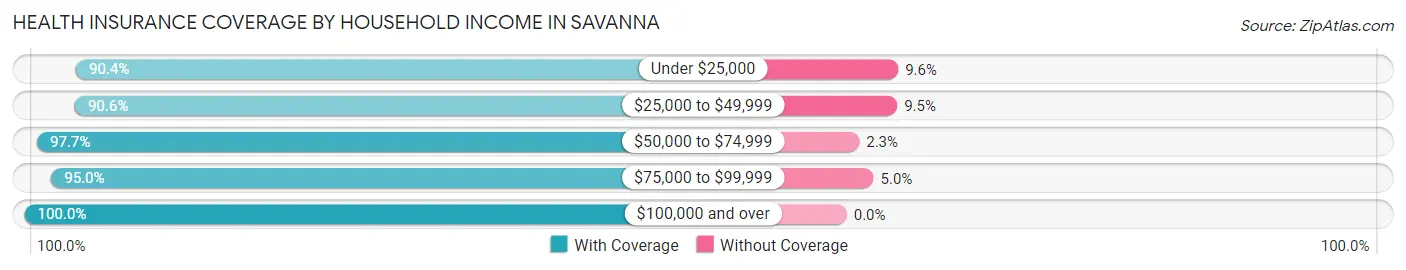
| Household Income | With Coverage | Without Coverage |
| Under $25,000 | 356 (90.4%) | 38 (9.6%) |
| $25,000 to $49,999 | 527 (90.5%) | 55 (9.5%) |
| $50,000 to $74,999 | 878 (97.7%) | 21 (2.3%) |
| $75,000 to $99,999 | 473 (95.0%) | 25 (5.0%) |
| $100,000 and over | 348 (100.0%) | 0 (0.0%) |
Public vs Private Health Insurance Coverage by Age in Savanna
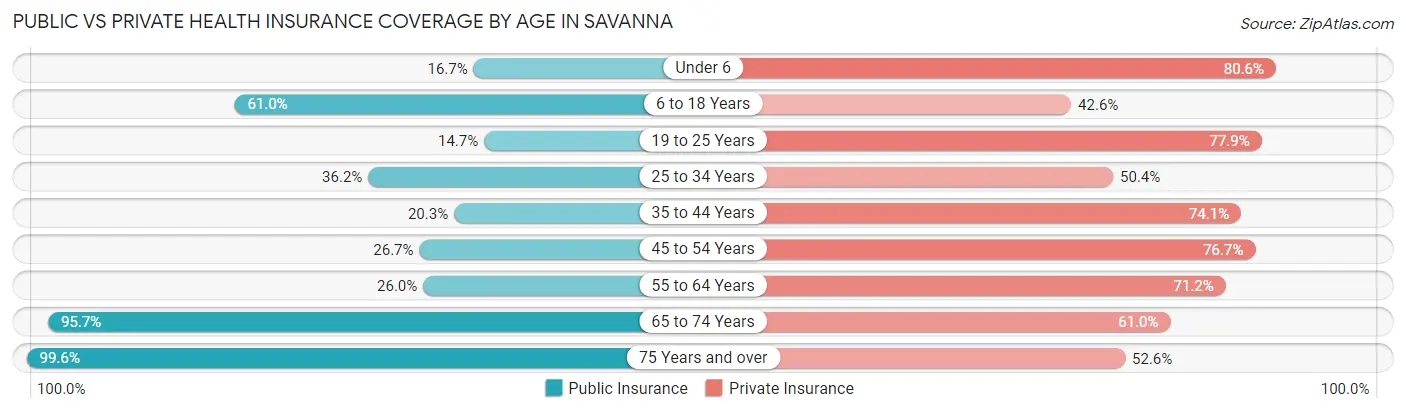
| Age Bracket | Public Insurance | Private Insurance |
| Under 6 | 12 (16.7%) | 58 (80.6%) |
| 6 to 18 Years | 271 (61.0%) | 189 (42.6%) |
| 19 to 25 Years | 24 (14.7%) | 127 (77.9%) |
| 25 to 34 Years | 100 (36.2%) | 139 (50.4%) |
| 35 to 44 Years | 80 (20.3%) | 292 (74.1%) |
| 45 to 54 Years | 85 (26.7%) | 244 (76.7%) |
| 55 to 64 Years | 114 (26.0%) | 312 (71.2%) |
| 65 to 74 Years | 331 (95.7%) | 211 (61.0%) |
| 75 Years and over | 269 (99.6%) | 142 (52.6%) |
| Total | 1,286 (47.3%) | 1,714 (63.0%) |
Disability Status by Sex by Age in Savanna
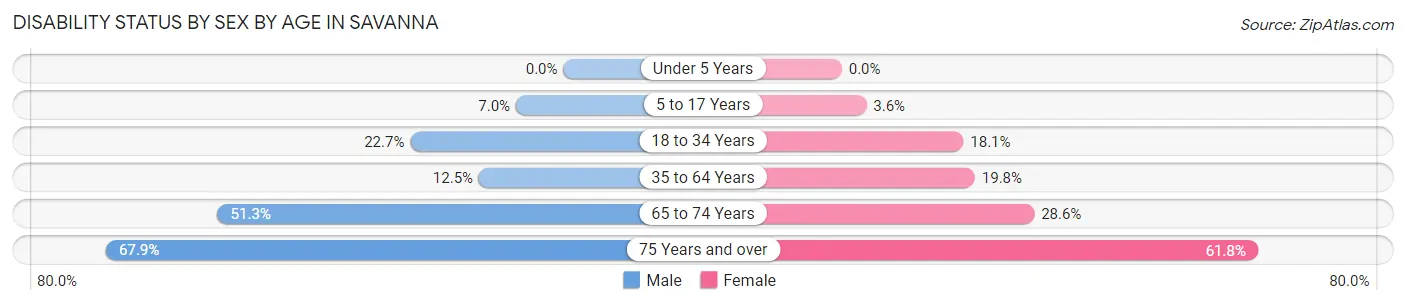
| Age Bracket | Male | Female |
| Under 5 Years | 0 (0.0%) | 0 (0.0%) |
| 5 to 17 Years | 10 (7.0%) | 10 (3.6%) |
| 18 to 34 Years | 63 (22.7%) | 37 (18.0%) |
| 35 to 64 Years | 82 (12.5%) | 98 (19.8%) |
| 65 to 74 Years | 77 (51.3%) | 56 (28.6%) |
| 75 Years and over | 91 (67.9%) | 84 (61.8%) |
Disability Class by Sex by Age in Savanna
Disability Class: Hearing Difficulty
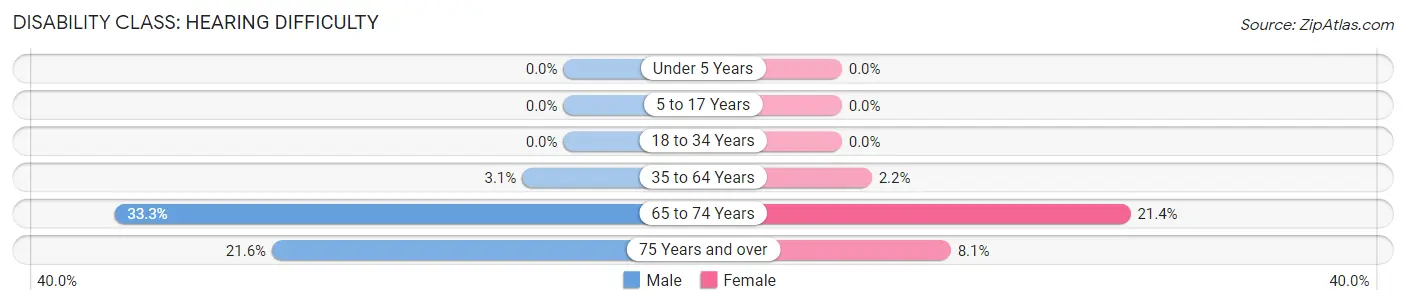
| Age Bracket | Male | Female |
| Under 5 Years | 0 (0.0%) | 0 (0.0%) |
| 5 to 17 Years | 0 (0.0%) | 0 (0.0%) |
| 18 to 34 Years | 0 (0.0%) | 0 (0.0%) |
| 35 to 64 Years | 20 (3.1%) | 11 (2.2%) |
| 65 to 74 Years | 50 (33.3%) | 42 (21.4%) |
| 75 Years and over | 29 (21.6%) | 11 (8.1%) |
Disability Class: Vision Difficulty
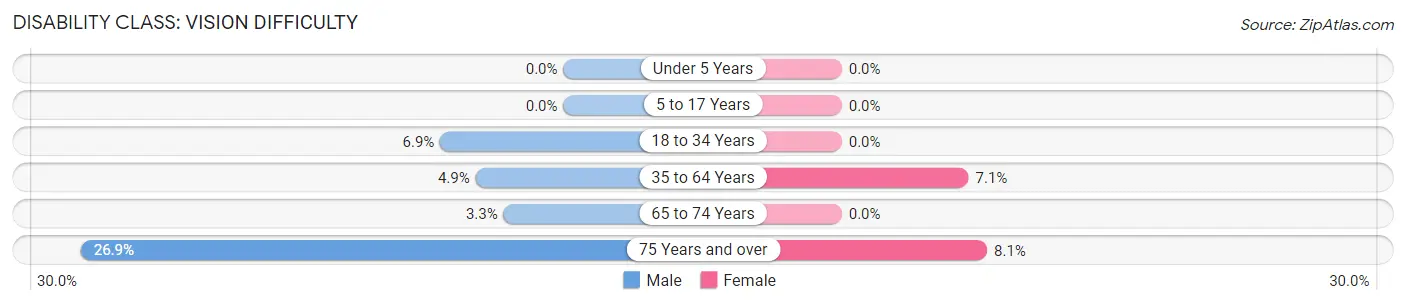
| Age Bracket | Male | Female |
| Under 5 Years | 0 (0.0%) | 0 (0.0%) |
| 5 to 17 Years | 0 (0.0%) | 0 (0.0%) |
| 18 to 34 Years | 19 (6.9%) | 0 (0.0%) |
| 35 to 64 Years | 32 (4.9%) | 35 (7.1%) |
| 65 to 74 Years | 5 (3.3%) | 0 (0.0%) |
| 75 Years and over | 36 (26.9%) | 11 (8.1%) |
Disability Class: Cognitive Difficulty
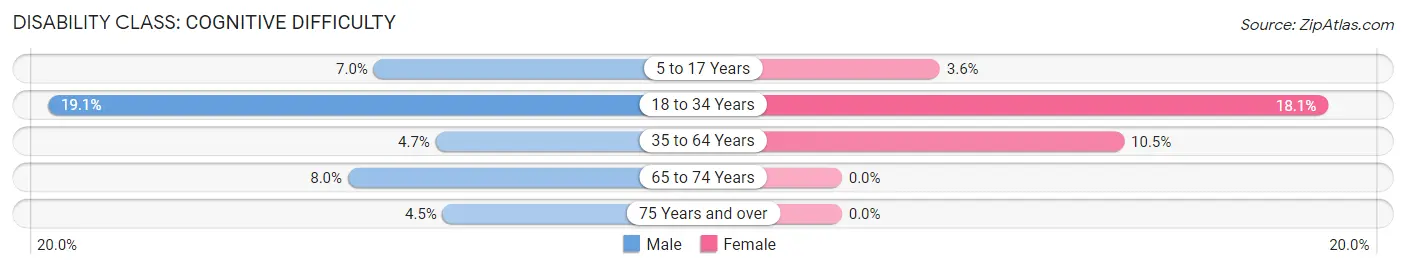
| Age Bracket | Male | Female |
| 5 to 17 Years | 10 (7.0%) | 10 (3.6%) |
| 18 to 34 Years | 53 (19.1%) | 37 (18.0%) |
| 35 to 64 Years | 31 (4.7%) | 52 (10.5%) |
| 65 to 74 Years | 12 (8.0%) | 0 (0.0%) |
| 75 Years and over | 6 (4.5%) | 0 (0.0%) |
Disability Class: Ambulatory Difficulty
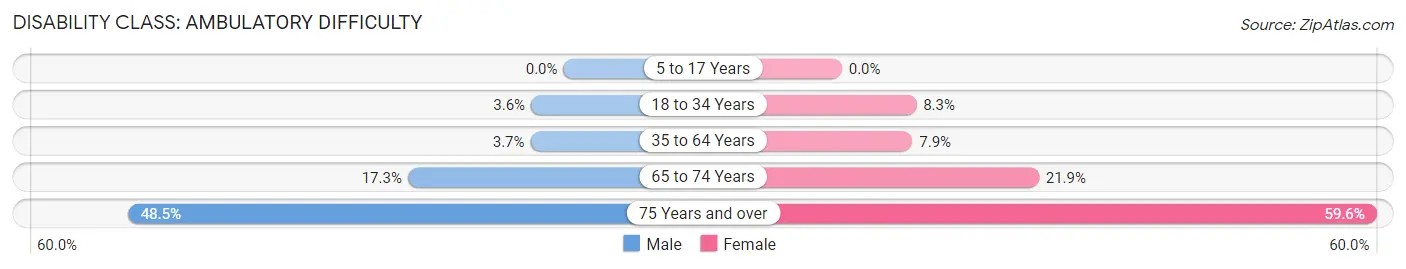
| Age Bracket | Male | Female |
| 5 to 17 Years | 0 (0.0%) | 0 (0.0%) |
| 18 to 34 Years | 10 (3.6%) | 17 (8.3%) |
| 35 to 64 Years | 24 (3.7%) | 39 (7.9%) |
| 65 to 74 Years | 26 (17.3%) | 43 (21.9%) |
| 75 Years and over | 65 (48.5%) | 81 (59.6%) |
Disability Class: Self-Care Difficulty
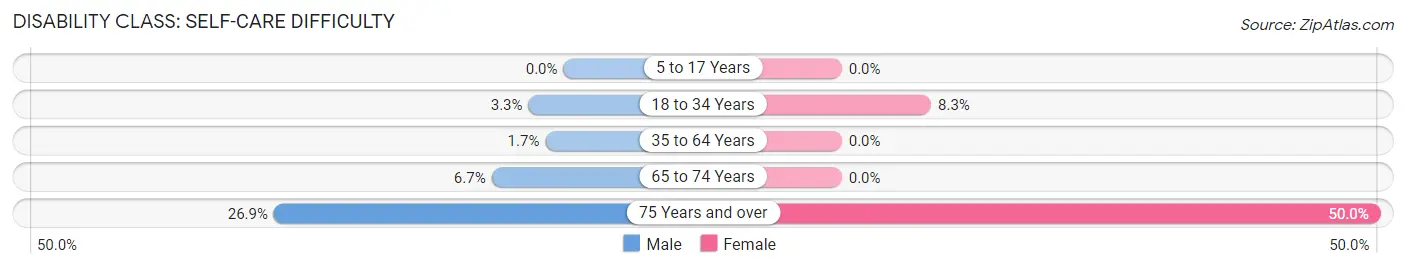
| Age Bracket | Male | Female |
| 5 to 17 Years | 0 (0.0%) | 0 (0.0%) |
| 18 to 34 Years | 9 (3.3%) | 17 (8.3%) |
| 35 to 64 Years | 11 (1.7%) | 0 (0.0%) |
| 65 to 74 Years | 10 (6.7%) | 0 (0.0%) |
| 75 Years and over | 36 (26.9%) | 68 (50.0%) |
Technology Access in Savanna
Computing Device Access in Savanna
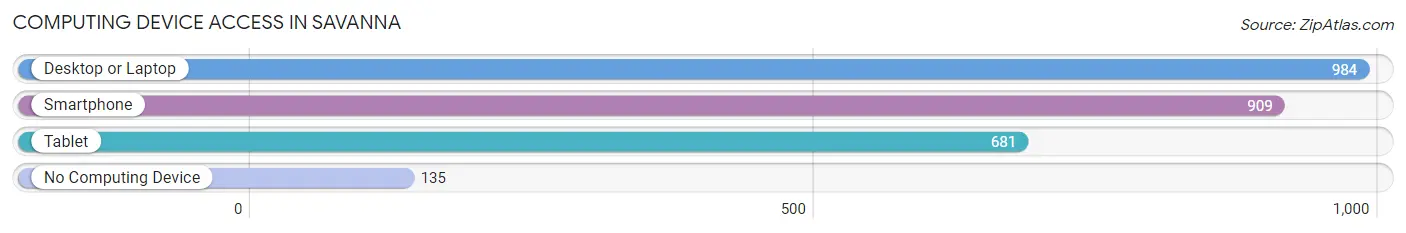
| Device Type | # Households | % Households |
| Desktop or Laptop | 984 | 74.6% |
| Smartphone | 909 | 68.9% |
| Tablet | 681 | 51.6% |
| No Computing Device | 135 | 10.2% |
| Total | 1,319 | 100.0% |
Internet Access in Savanna
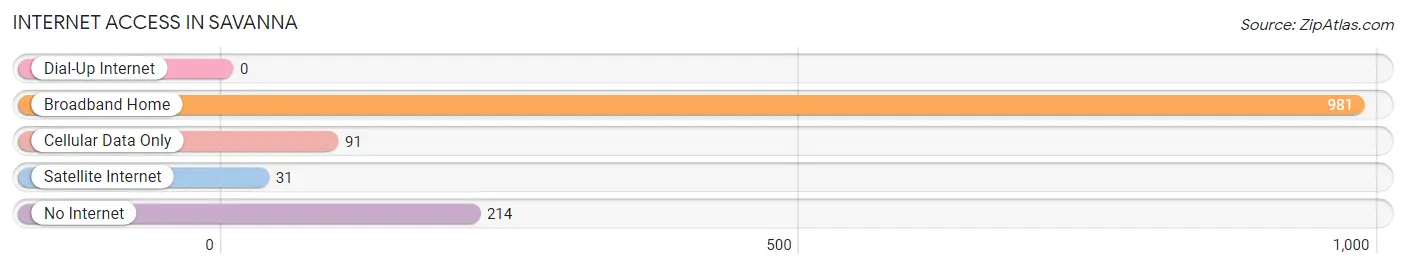
| Internet Type | # Households | % Households |
| Dial-Up Internet | 0 | 0.0% |
| Broadband Home | 981 | 74.4% |
| Cellular Data Only | 91 | 6.9% |
| Satellite Internet | 31 | 2.4% |
| No Internet | 214 | 16.2% |
| Total | 1,319 | 100.0% |
Savanna Summary
Savanna, Illinois is a small city located in the northwest corner of the state, along the Mississippi River. It is the county seat of Carroll County and is part of the Quad Cities metropolitan area. The city has a population of 3,719 as of the 2010 census, and is the second-largest city in the county.
Geography
Savanna is located at 42°7′17″N 90°17′17″W (42.1214, -90.2881). According to the 2010 census, the city has a total area of 2.2 square miles (5.7 km2), all land.
The city is situated on the Mississippi River, and is bordered by the towns of Thomson to the north, Elizabeth to the east, and Mount Carroll to the south. The city is also located near the Mississippi Palisades State Park, which is a popular destination for outdoor recreation.
History
Savanna was founded in 1836 by settlers from New York and Pennsylvania. The city was named after the nearby Savanna River, which was named after the Spanish word for “meadow”. The city was incorporated in 1854, and the first post office was established in 1855.
The city was an important port on the Mississippi River, and was a major hub for the lumber industry. The city was also home to several manufacturing plants, including a paper mill, a flour mill, and a furniture factory.
The city was also home to the Savanna Army Depot, which was established in 1941 and served as a major supply depot for the U.S. Army during World War II. The depot was closed in 1967, and the land was sold to the city in 1971.
Economy
The economy of Savanna is largely based on agriculture and manufacturing. The city is home to several manufacturing plants, including a paper mill, a flour mill, and a furniture factory. The city is also home to several agricultural businesses, including a dairy farm, a hog farm, and a grain elevator.
The city is also home to several retail businesses, including a grocery store, a hardware store, and a variety of restaurants. The city is also home to several banks, including the First National Bank of Savanna.
Demographics
As of the 2010 census, there were 3,719 people, 1,541 households, and 990 families residing in the city. The population density was 1,711.2 people per square mile (661.2/km2). There were 1,741 housing units at an average density of 790.2 per square mile (305.7/km2). The racial makeup of the city was 97.2% White, 0.3% African American, 0.3% Native American, 0.3% Asian, 0.2% from other races, and 1.7% from two or more races. Hispanic or Latino of any race were 1.2% of the population.
There were 1,541 households, out of which 28.2% had children under the age of 18 living with them, 48.2% were married couples living together, 11.2% had a female householder with no husband present, and 36.3% were non-families. 32.2% of all households were made up of individuals, and 16.2% had someone living alone who was 65 years of age or older. The average household size was 2.35 and the average family size was 2.94.
In the city, the population was spread out, with 24.2% under the age of 18, 7.7% from 18 to 24, 25.2% from 25 to 44, 22.7% from 45 to 64, and 20.2% who were 65 years of age or older. The median age was 40 years. For every 100 females, there were 90.2 males. For every 100 females age 18 and over, there were 86.2 males.
The median income for a household in the city was $35,938, and the median income for a family was $45,000. Males had a median income of $32,917 versus $22,500 for females. The per capita income for the city was $18,845. About 8.2% of families and 11.2% of the population were below the poverty line, including 15.2% of those under age 18 and 8.2% of those age 65 or over.
Common Questions
What is Per Capita Income in Savanna?
Per Capita income in Savanna is $29,396.
What is the Median Family Income in Savanna?
Median Family Income in Savanna is $54,886.
What is the Median Household income in Savanna?
Median Household Income in Savanna is $45,474.
What is Income or Wage Gap in Savanna?
Income or Wage Gap in Savanna is 4.1%.
Women in Savanna earn 95.9 cents for every dollar earned by a man.
What is Inequality or Gini Index in Savanna?
Inequality or Gini Index in Savanna is 0.49.
What is the Total Population of Savanna?
Total Population of Savanna is 2,783.
What is the Total Male Population of Savanna?
Total Male Population of Savanna is 1,413.
What is the Total Female Population of Savanna?
Total Female Population of Savanna is 1,370.
What is the Ratio of Males per 100 Females in Savanna?
There are 103.14 Males per 100 Females in Savanna.
What is the Ratio of Females per 100 Males in Savanna?
There are 96.96 Females per 100 Males in Savanna.
What is the Median Population Age in Savanna?
Median Population Age in Savanna is 47.3 Years.
What is the Average Family Size in Savanna
Average Family Size in Savanna is 3.2 People.
What is the Average Household Size in Savanna
Average Household Size in Savanna is 2.1 People.
How Large is the Labor Force in Savanna?
There are 1,240 People in the Labor Forcein in Savanna.
What is the Percentage of People in the Labor Force in Savanna?
51.5% of People are in the Labor Force in Savanna.
What is the Unemployment Rate in Savanna?
Unemployment Rate in Savanna is 6.1%.