Oswego, IL Map & Demographics
Oswego Map
Oswego Overview
$44,340
PER CAPITA INCOME
$118,151
AVG FAMILY INCOME
$112,109
AVG HOUSEHOLD INCOME
24.0%
WAGE / INCOME GAP [ % ]
76.0¢/ $1
WAGE / INCOME GAP [ $ ]
0.35
INEQUALITY / GINI INDEX
34,810
TOTAL POPULATION
17,097
MALE POPULATION
17,713
FEMALE POPULATION
96.52
MALES / 100 FEMALES
103.60
FEMALES / 100 MALES
39.6
MEDIAN AGE
3.2
AVG FAMILY SIZE
2.9
AVG HOUSEHOLD SIZE
18,488
LABOR FORCE [ PEOPLE ]
69.4%
PERCENT IN LABOR FORCE
2.9%
UNEMPLOYMENT RATE
Oswego Zip Codes
Income in Oswego
Income Overview in Oswego
Per Capita Income in Oswego is $44,340, while median incomes of families and households are $118,151 and $112,109 respectively.
| Characteristic | Number | Measure |
| Per Capita Income | 34,810 | $44,340 |
| Median Family Income | 9,843 | $118,151 |
| Mean Family Income | 9,843 | $137,659 |
| Median Household Income | 12,203 | $112,109 |
| Mean Household Income | 12,203 | $127,171 |
| Income Deficit | 9,843 | $0 |
| Wage / Income Gap (%) | 34,810 | 24.01% |
| Wage / Income Gap ($) | 34,810 | 75.99¢ per $1 |
| Gini / Inequality Index | 34,810 | 0.35 |
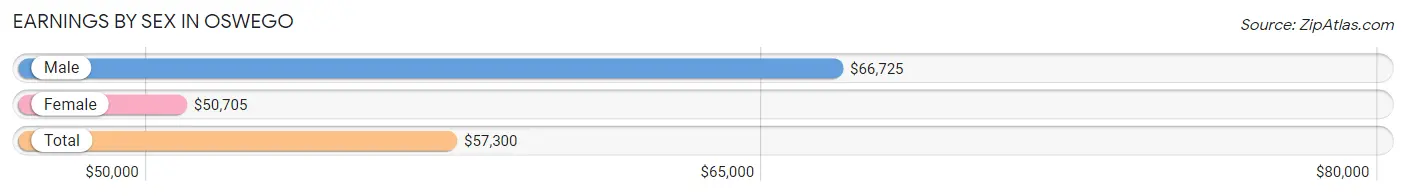
Earnings by Sex in Oswego
Average Earnings in Oswego are $57,300, $66,725 for men and $50,705 for women, a difference of 24.0%.
| Sex | Number | Average Earnings |
| Male | 10,339 (54.3%) | $66,725 |
| Female | 8,698 (45.7%) | $50,705 |
| Total | 19,037 (100.0%) | $57,300 |
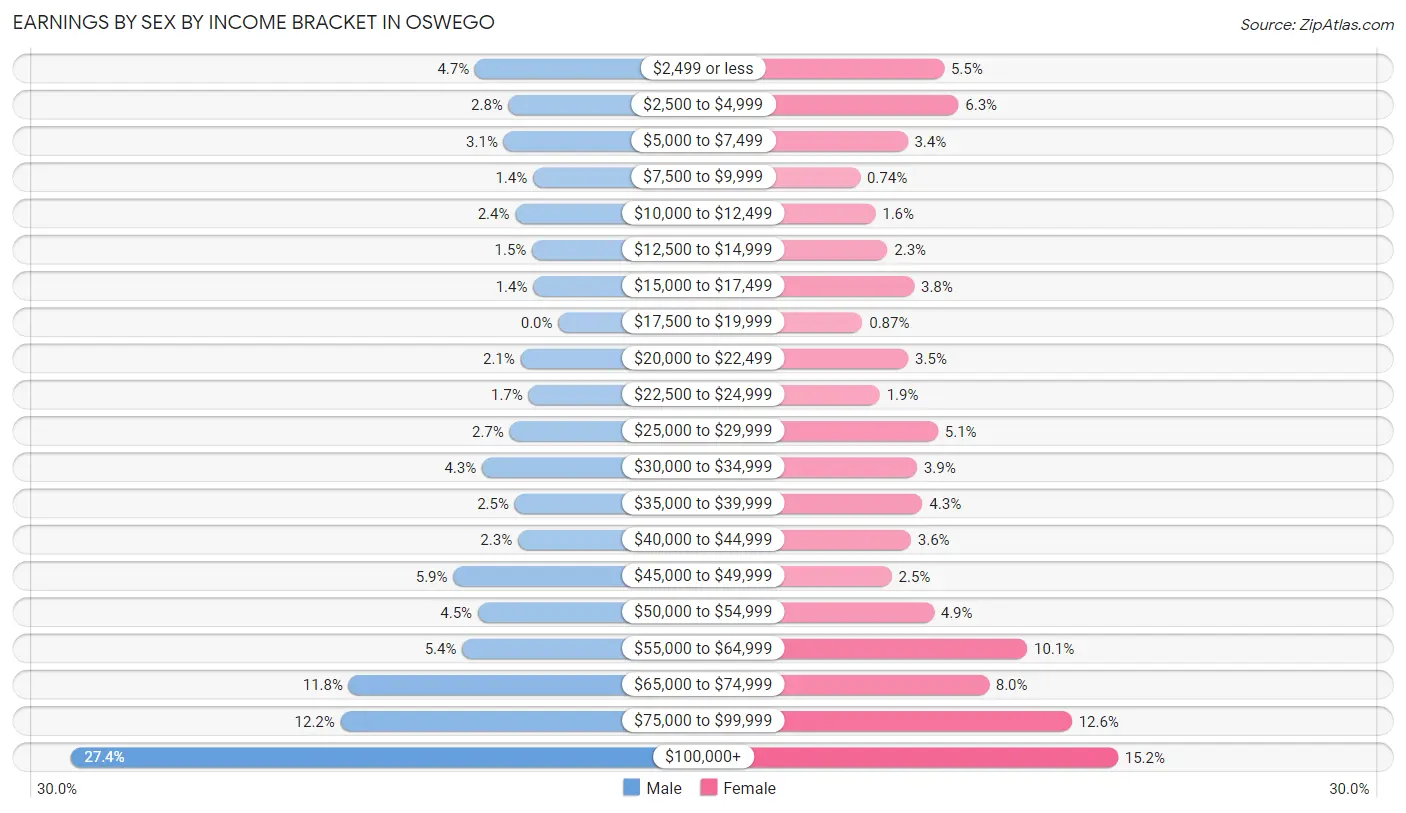
Earnings by Sex by Income Bracket in Oswego
The most common earnings brackets in Oswego are $100,000+ for men (2,830 | 27.4%) and $100,000+ for women (1,325 | 15.2%).
| Income | Male | Female |
| $2,499 or less | 484 (4.7%) | 475 (5.5%) |
| $2,500 to $4,999 | 288 (2.8%) | 545 (6.3%) |
| $5,000 to $7,499 | 317 (3.1%) | 297 (3.4%) |
| $7,500 to $9,999 | 147 (1.4%) | 64 (0.7%) |
| $10,000 to $12,499 | 250 (2.4%) | 139 (1.6%) |
| $12,500 to $14,999 | 152 (1.5%) | 198 (2.3%) |
| $15,000 to $17,499 | 146 (1.4%) | 329 (3.8%) |
| $17,500 to $19,999 | 0 (0.0%) | 76 (0.9%) |
| $20,000 to $22,499 | 219 (2.1%) | 300 (3.5%) |
| $22,500 to $24,999 | 173 (1.7%) | 161 (1.8%) |
| $25,000 to $29,999 | 283 (2.7%) | 445 (5.1%) |
| $30,000 to $34,999 | 444 (4.3%) | 343 (3.9%) |
| $35,000 to $39,999 | 253 (2.5%) | 370 (4.3%) |
| $40,000 to $44,999 | 235 (2.3%) | 313 (3.6%) |
| $45,000 to $49,999 | 610 (5.9%) | 219 (2.5%) |
| $50,000 to $54,999 | 467 (4.5%) | 425 (4.9%) |
| $55,000 to $64,999 | 558 (5.4%) | 881 (10.1%) |
| $65,000 to $74,999 | 1,218 (11.8%) | 694 (8.0%) |
| $75,000 to $99,999 | 1,265 (12.2%) | 1,099 (12.6%) |
| $100,000+ | 2,830 (27.4%) | 1,325 (15.2%) |
| Total | 10,339 (100.0%) | 8,698 (100.0%) |
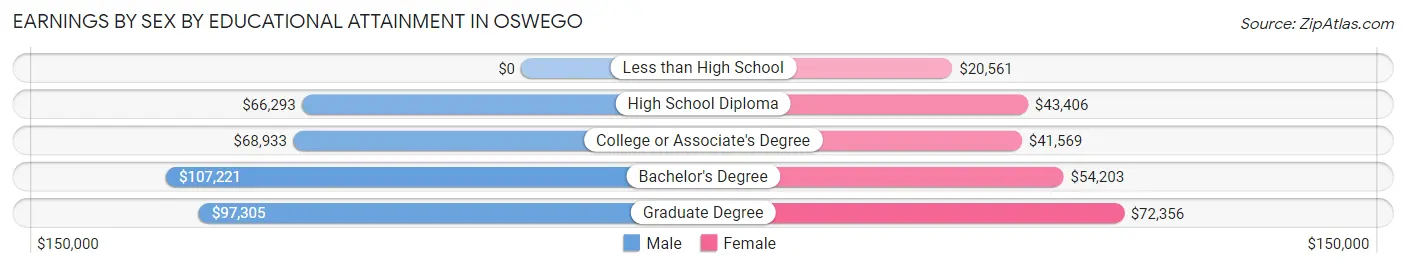
Earnings by Sex by Educational Attainment in Oswego
Average earnings in Oswego are $71,311 for men and $55,779 for women, a difference of 21.8%. Men with an educational attainment of bachelor's degree enjoy the highest average annual earnings of $107,221, while those with high school diploma education earn the least with $66,293. Women with an educational attainment of graduate degree earn the most with the average annual earnings of $72,356, while those with less than high school education have the smallest earnings of $20,561.
| Educational Attainment | Male Income | Female Income |
| Less than High School | - | - |
| High School Diploma | $66,293 | $43,406 |
| College or Associate's Degree | $68,933 | $41,569 |
| Bachelor's Degree | $107,221 | $54,203 |
| Graduate Degree | $97,305 | $72,356 |
| Total | $71,311 | $55,779 |
Family Income in Oswego
Family Income Brackets in Oswego
According to the Oswego family income data, there are 2,963 families falling into the $100,000 to $149,999 income range, which is the most common income bracket and makes up 30.1% of all families. Conversely, the less than $10,000 income bracket is the least frequent group with only 30 families (0.3%) belonging to this category.
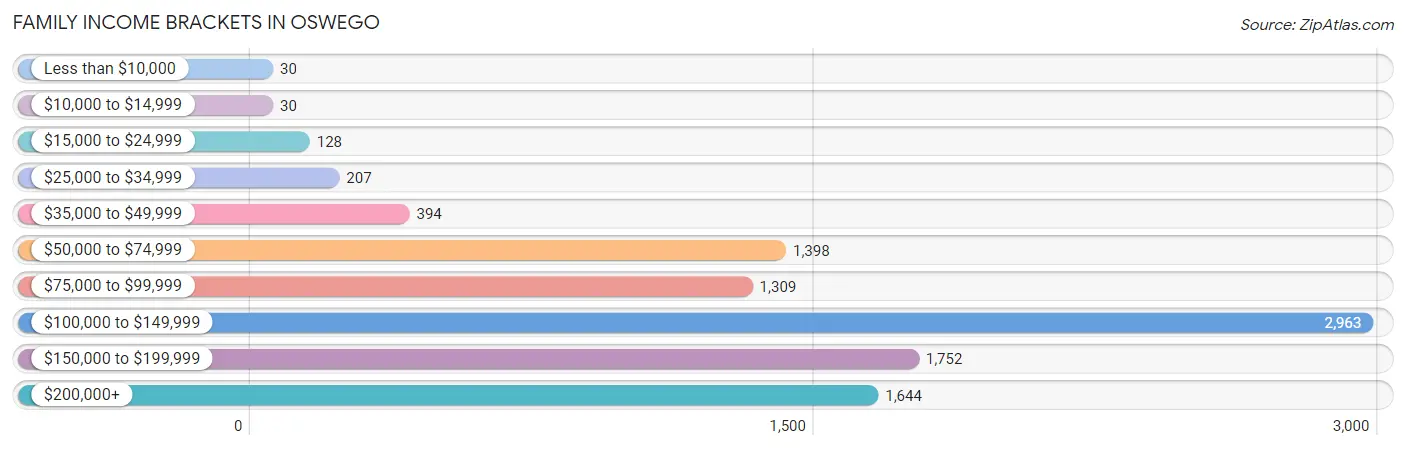
| Income Bracket | # Families | % Families |
| Less than $10,000 | 30 | 0.3% |
| $10,000 to $14,999 | 30 | 0.3% |
| $15,000 to $24,999 | 128 | 1.3% |
| $25,000 to $34,999 | 207 | 2.1% |
| $35,000 to $49,999 | 394 | 4.0% |
| $50,000 to $74,999 | 1,398 | 14.2% |
| $75,000 to $99,999 | 1,309 | 13.3% |
| $100,000 to $149,999 | 2,963 | 30.1% |
| $150,000 to $199,999 | 1,752 | 17.8% |
| $200,000+ | 1,644 | 16.7% |
Family Income by Famaliy Size in Oswego
4-person families (1,870 | 19.0%) account for the highest median family income in Oswego with $149,958 per family, while 2-person families (3,652 | 37.1%) have the highest median income of $54,579 per family member.
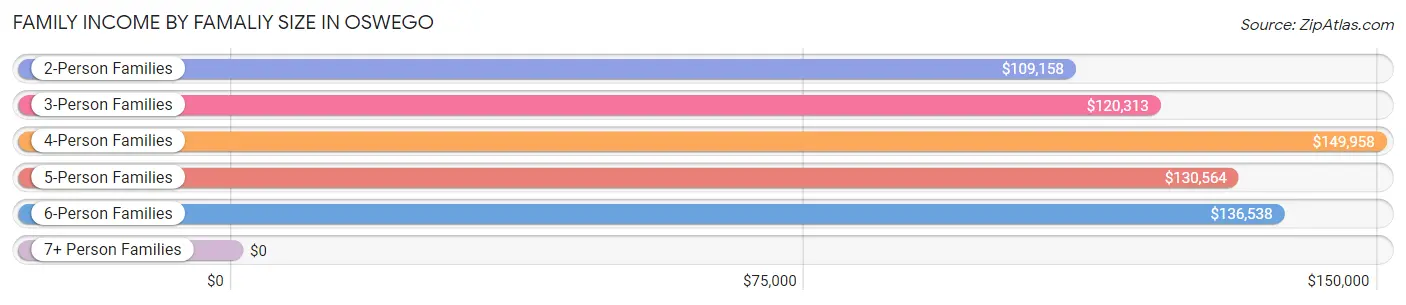
| Income Bracket | # Families | Median Income |
| 2-Person Families | 3,652 (37.1%) | $109,158 |
| 3-Person Families | 2,414 (24.5%) | $120,313 |
| 4-Person Families | 1,870 (19.0%) | $149,958 |
| 5-Person Families | 1,613 (16.4%) | $130,564 |
| 6-Person Families | 294 (3.0%) | $136,538 |
| 7+ Person Families | 0 (0.0%) | $0 |
| Total | 9,843 (100.0%) | $118,151 |
Family Income by Number of Earners in Oswego
The median family income in Oswego is $118,151, with families comprising 3+ earners (1,473) having the highest median family income of $155,115, while families with no earners (747) have the lowest median family income of $72,583, accounting for 15.0% and 7.6% of families, respectively.
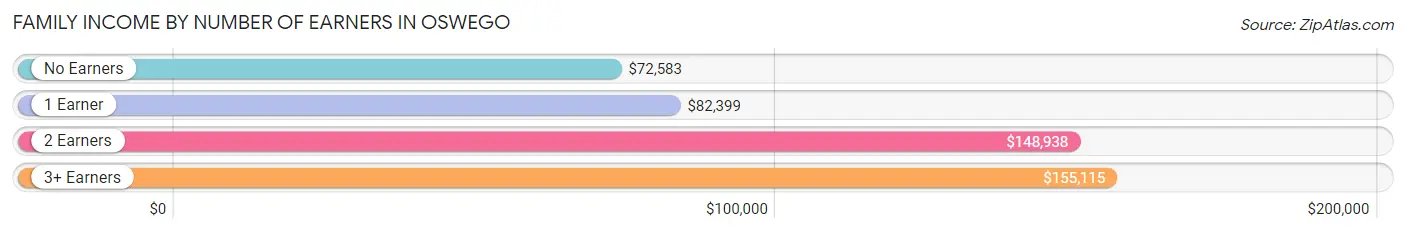
| Number of Earners | # Families | Median Income |
| No Earners | 747 (7.6%) | $72,583 |
| 1 Earner | 3,283 (33.4%) | $82,399 |
| 2 Earners | 4,340 (44.1%) | $148,938 |
| 3+ Earners | 1,473 (15.0%) | $155,115 |
| Total | 9,843 (100.0%) | $118,151 |
Household Income in Oswego
Household Income Brackets in Oswego
With 3,307 households falling in the category, the $100,000 to $149,999 income range is the most frequent in Oswego, accounting for 27.1% of all households. In contrast, only 98 households (0.8%) fall into the $10,000 to $14,999 income bracket, making it the least populous group.
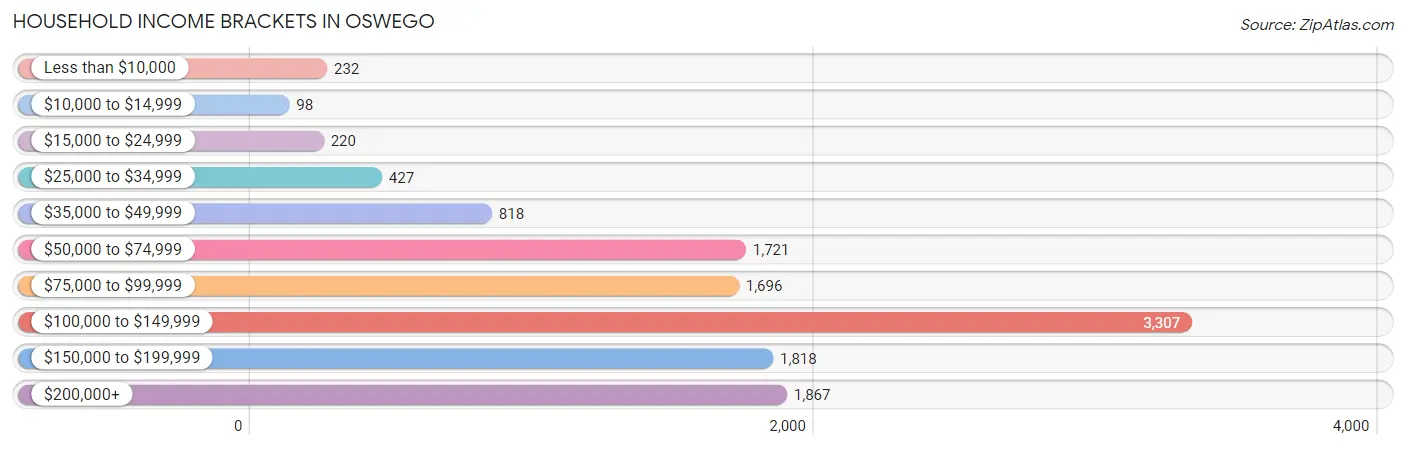
| Income Bracket | # Households | % Households |
| Less than $10,000 | 232 | 1.9% |
| $10,000 to $14,999 | 98 | 0.8% |
| $15,000 to $24,999 | 220 | 1.8% |
| $25,000 to $34,999 | 427 | 3.5% |
| $35,000 to $49,999 | 818 | 6.7% |
| $50,000 to $74,999 | 1,721 | 14.1% |
| $75,000 to $99,999 | 1,696 | 13.9% |
| $100,000 to $149,999 | 3,307 | 27.1% |
| $150,000 to $199,999 | 1,818 | 14.9% |
| $200,000+ | 1,867 | 15.3% |
Household Income by Householder Age in Oswego
The median household income in Oswego is $112,109, with the highest median household income of $121,284 found in the 45 to 64 years age bracket for the primary householder. A total of 5,126 households (42.0%) fall into this category. Meanwhile, the 65+ years age bracket for the primary householder has the lowest median household income of $58,052, with 2,191 households (17.9%) in this group.
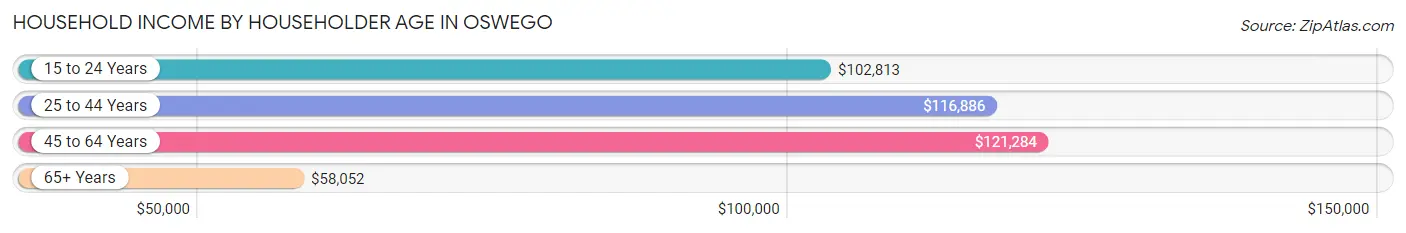
| Income Bracket | # Households | Median Income |
| 15 to 24 Years | 171 (1.4%) | $102,813 |
| 25 to 44 Years | 4,715 (38.6%) | $116,886 |
| 45 to 64 Years | 5,126 (42.0%) | $121,284 |
| 65+ Years | 2,191 (17.9%) | $58,052 |
| Total | 12,203 (100.0%) | $112,109 |
Poverty in Oswego
Income Below Poverty by Sex and Age in Oswego
With 1.7% poverty level for males and 2.4% for females among the residents of Oswego, 15 year old males and 65 to 74 year old females are the most vulnerable to poverty, with 28 males (11.1%) and 119 females (8.8%) in their respective age groups living below the poverty level.
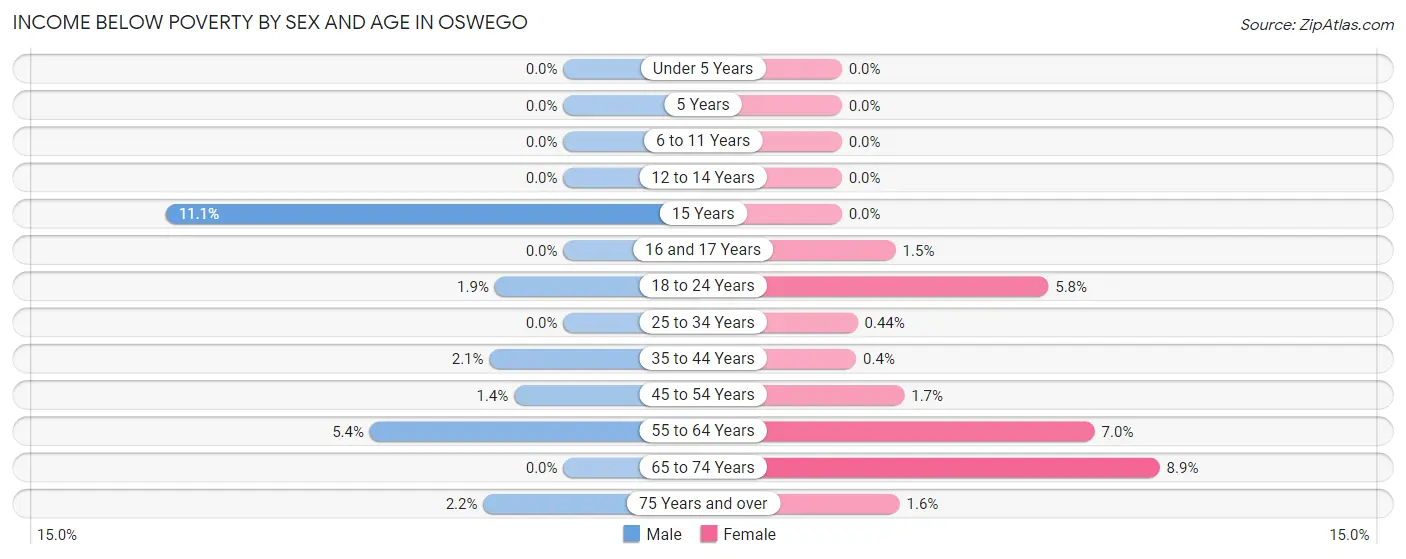
| Age Bracket | Male | Female |
| Under 5 Years | 0 (0.0%) | 0 (0.0%) |
| 5 Years | 0 (0.0%) | 0 (0.0%) |
| 6 to 11 Years | 0 (0.0%) | 0 (0.0%) |
| 12 to 14 Years | 0 (0.0%) | 0 (0.0%) |
| 15 Years | 28 (11.1%) | 0 (0.0%) |
| 16 and 17 Years | 0 (0.0%) | 11 (1.5%) |
| 18 to 24 Years | 32 (1.9%) | 64 (5.8%) |
| 25 to 34 Years | 0 (0.0%) | 8 (0.4%) |
| 35 to 44 Years | 50 (2.1%) | 12 (0.4%) |
| 45 to 54 Years | 37 (1.4%) | 44 (1.7%) |
| 55 to 64 Years | 123 (5.4%) | 144 (7.0%) |
| 65 to 74 Years | 0 (0.0%) | 119 (8.8%) |
| 75 Years and over | 17 (2.2%) | 15 (1.6%) |
| Total | 287 (1.7%) | 417 (2.4%) |
Income Above Poverty by Sex and Age in Oswego
According to the poverty statistics in Oswego, males aged under 5 years and females aged under 5 years are the age groups that are most secure financially, with 100.0% of males and 100.0% of females in these age groups living above the poverty line.
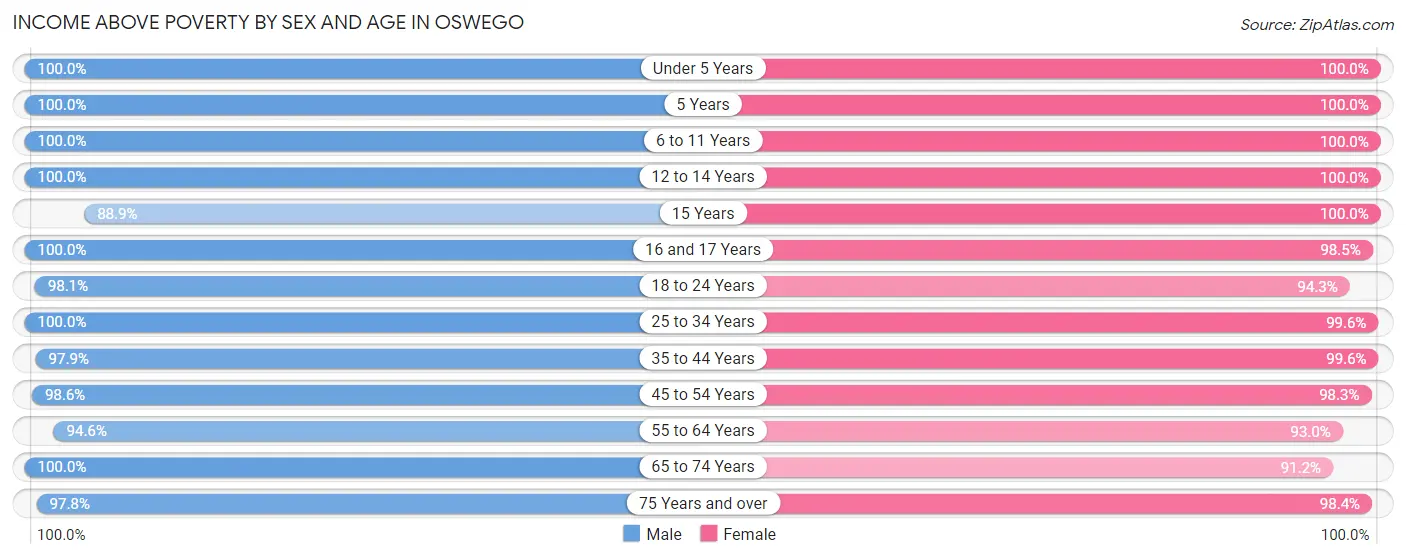
| Age Bracket | Male | Female |
| Under 5 Years | 884 (100.0%) | 1,021 (100.0%) |
| 5 Years | 106 (100.0%) | 160 (100.0%) |
| 6 to 11 Years | 1,822 (100.0%) | 1,382 (100.0%) |
| 12 to 14 Years | 964 (100.0%) | 1,093 (100.0%) |
| 15 Years | 225 (88.9%) | 431 (100.0%) |
| 16 and 17 Years | 570 (100.0%) | 720 (98.5%) |
| 18 to 24 Years | 1,642 (98.1%) | 1,050 (94.3%) |
| 25 to 34 Years | 1,527 (100.0%) | 1,825 (99.6%) |
| 35 to 44 Years | 2,380 (97.9%) | 3,000 (99.6%) |
| 45 to 54 Years | 2,660 (98.6%) | 2,492 (98.3%) |
| 55 to 64 Years | 2,159 (94.6%) | 1,902 (93.0%) |
| 65 to 74 Years | 1,074 (100.0%) | 1,225 (91.1%) |
| 75 Years and over | 744 (97.8%) | 914 (98.4%) |
| Total | 16,757 (98.3%) | 17,215 (97.6%) |
Income Below Poverty Among Married-Couple Families in Oswego
The poverty statistics for married-couple families in Oswego show that 0.3% or 21 of the total 7,699 families live below the poverty line. Families with no children have the highest poverty rate of 0.5%, comprising of 21 families. On the other hand, families with 1 or 2 children have the lowest poverty rate of 0.0%, which includes 0 families.
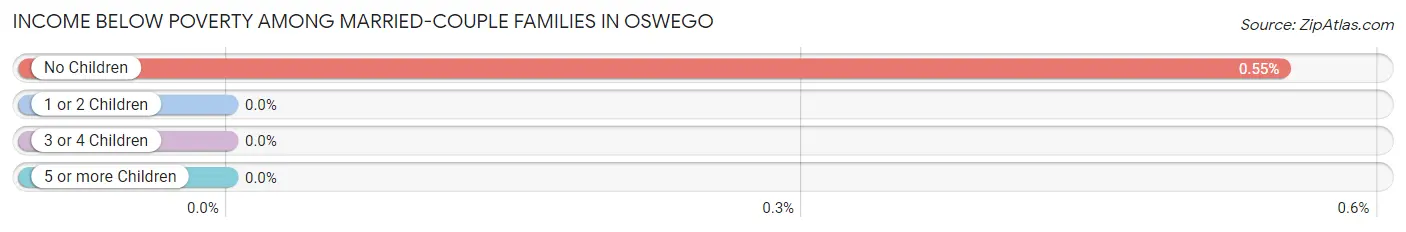
| Children | Above Poverty | Below Poverty |
| No Children | 3,828 (99.5%) | 21 (0.5%) |
| 1 or 2 Children | 3,118 (100.0%) | 0 (0.0%) |
| 3 or 4 Children | 732 (100.0%) | 0 (0.0%) |
| 5 or more Children | 0 (0.0%) | 0 (0.0%) |
| Total | 7,678 (99.7%) | 21 (0.3%) |
Income Below Poverty Among Single-Parent Households in Oswego
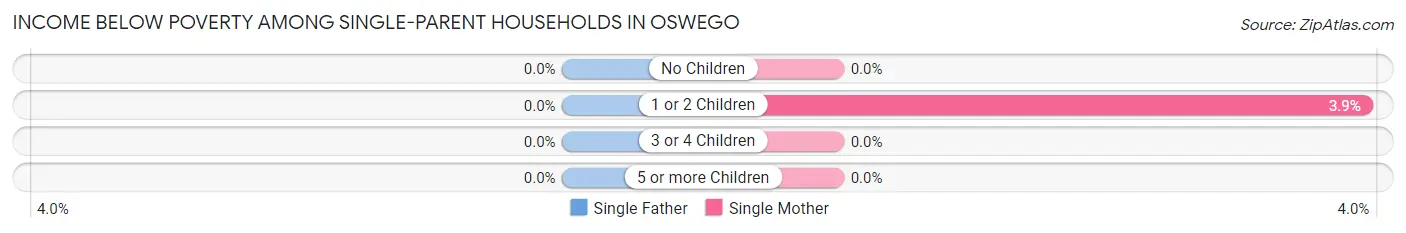
| Children | Single Father | Single Mother |
| No Children | 0 (0.0%) | 0 (0.0%) |
| 1 or 2 Children | 0 (0.0%) | 37 (3.9%) |
| 3 or 4 Children | 0 (0.0%) | 0 (0.0%) |
| 5 or more Children | 0 (0.0%) | 0 (0.0%) |
| Total | 0 (0.0%) | 37 (2.8%) |
Income Below Poverty Among Married-Couple vs Single-Parent Households in Oswego
The poverty data for Oswego shows that 21 of the married-couple family households (0.3%) and 37 of the single-parent households (1.7%) are living below the poverty level. Within the married-couple family households, those with no children have the highest poverty rate, with 21 households (0.5%) falling below the poverty line. Among the single-parent households, those with 1 or 2 children have the highest poverty rate, with 37 household (3.3%) living below poverty.
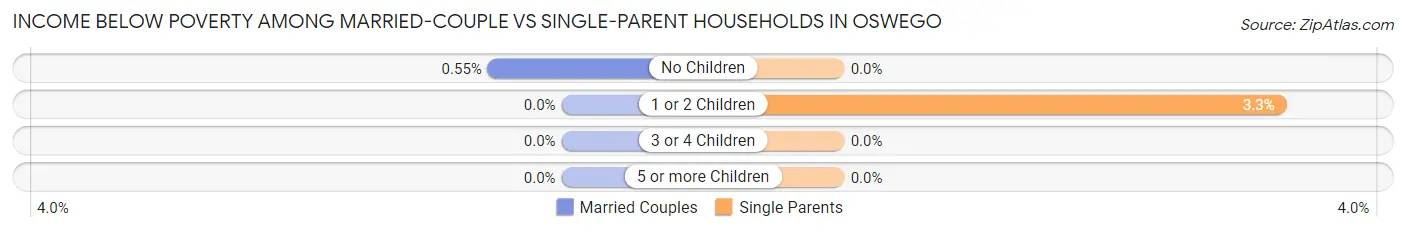
| Children | Married-Couple Families | Single-Parent Households |
| No Children | 21 (0.5%) | 0 (0.0%) |
| 1 or 2 Children | 0 (0.0%) | 37 (3.3%) |
| 3 or 4 Children | 0 (0.0%) | 0 (0.0%) |
| 5 or more Children | 0 (0.0%) | 0 (0.0%) |
| Total | 21 (0.3%) | 37 (1.7%) |
Race in Oswego
The most populous races in Oswego are White / Caucasian (25,227 | 72.5%), Hispanic or Latino (6,106 | 17.5%), and Two or more Races (3,938 | 11.3%).
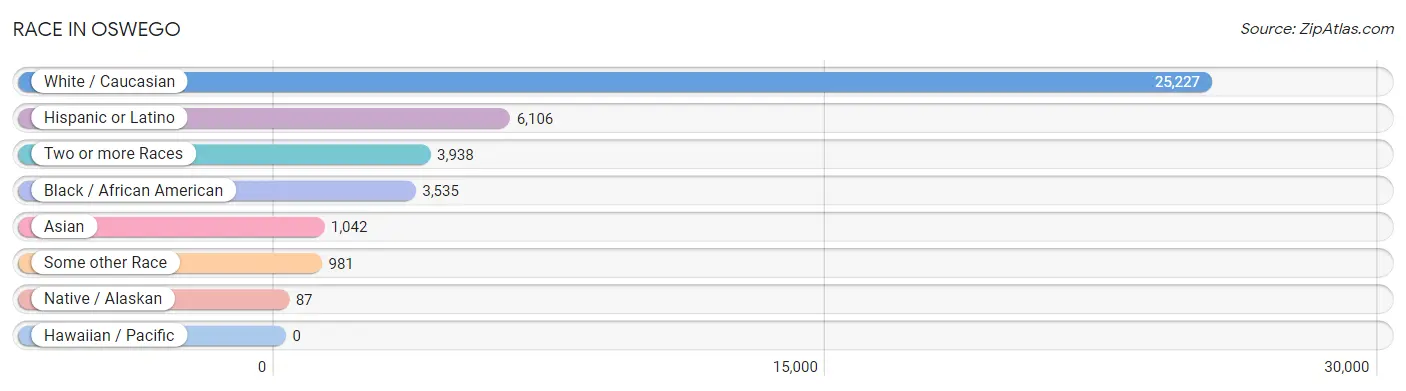
| Race | # Population | % Population |
| Asian | 1,042 | 3.0% |
| Black / African American | 3,535 | 10.2% |
| Hawaiian / Pacific | 0 | 0.0% |
| Hispanic or Latino | 6,106 | 17.5% |
| Native / Alaskan | 87 | 0.3% |
| White / Caucasian | 25,227 | 72.5% |
| Two or more Races | 3,938 | 11.3% |
| Some other Race | 981 | 2.8% |
| Total | 34,810 | 100.0% |
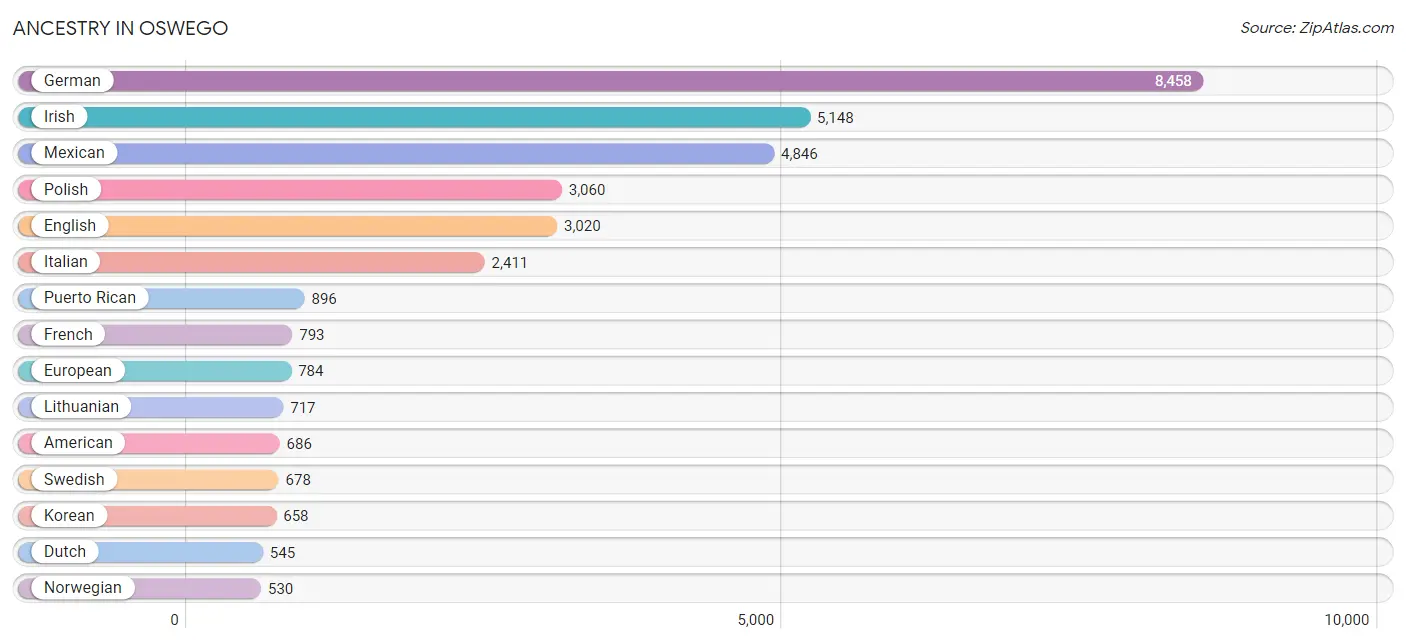
Ancestry in Oswego
The most populous ancestries reported in Oswego are German (8,458 | 24.3%), Irish (5,148 | 14.8%), Mexican (4,846 | 13.9%), Polish (3,060 | 8.8%), and English (3,020 | 8.7%), together accounting for 70.5% of all Oswego residents.
| Ancestry | # Population | % Population |
| African | 101 | 0.3% |
| Albanian | 183 | 0.5% |
| American | 686 | 2.0% |
| Apache | 22 | 0.1% |
| Arab | 226 | 0.6% |
| Austrian | 69 | 0.2% |
| Belgian | 20 | 0.1% |
| Bhutanese | 54 | 0.2% |
| British | 176 | 0.5% |
| Burmese | 249 | 0.7% |
| Canadian | 68 | 0.2% |
| Central American | 57 | 0.2% |
| Central American Indian | 16 | 0.1% |
| Cherokee | 20 | 0.1% |
| Colombian | 6 | 0.0% |
| Croatian | 320 | 0.9% |
| Cuban | 37 | 0.1% |
| Czech | 444 | 1.3% |
| Czechoslovakian | 43 | 0.1% |
| Danish | 219 | 0.6% |
| Dutch | 545 | 1.6% |
| Eastern European | 50 | 0.1% |
| Ecuadorian | 192 | 0.5% |
| English | 3,020 | 8.7% |
| European | 784 | 2.2% |
| Finnish | 11 | 0.0% |
| French | 793 | 2.3% |
| French Canadian | 16 | 0.1% |
| German | 8,458 | 24.3% |
| Greek | 200 | 0.6% |
| Honduran | 44 | 0.1% |
| Hungarian | 118 | 0.3% |
| Indian (Asian) | 201 | 0.6% |
| Irish | 5,148 | 14.8% |
| Italian | 2,411 | 6.9% |
| Korean | 658 | 1.9% |
| Latvian | 22 | 0.1% |
| Lithuanian | 717 | 2.1% |
| Luxembourger | 14 | 0.0% |
| Mexican | 4,846 | 13.9% |
| Native Hawaiian | 125 | 0.4% |
| Nicaraguan | 13 | 0.0% |
| Northern European | 41 | 0.1% |
| Norwegian | 530 | 1.5% |
| Peruvian | 24 | 0.1% |
| Polish | 3,060 | 8.8% |
| Portuguese | 53 | 0.2% |
| Puerto Rican | 896 | 2.6% |
| Romanian | 82 | 0.2% |
| Russian | 55 | 0.2% |
| Scotch-Irish | 87 | 0.3% |
| Scottish | 358 | 1.0% |
| Serbian | 58 | 0.2% |
| Slovak | 125 | 0.4% |
| South American | 270 | 0.8% |
| Subsaharan African | 101 | 0.3% |
| Swedish | 678 | 1.9% |
| Swiss | 78 | 0.2% |
| Thai | 347 | 1.0% |
| Ukrainian | 30 | 0.1% |
| Venezuelan | 48 | 0.1% |
| Welsh | 112 | 0.3% |
| West Indian | 16 | 0.1% | View All 63 Rows |
Immigrants in Oswego
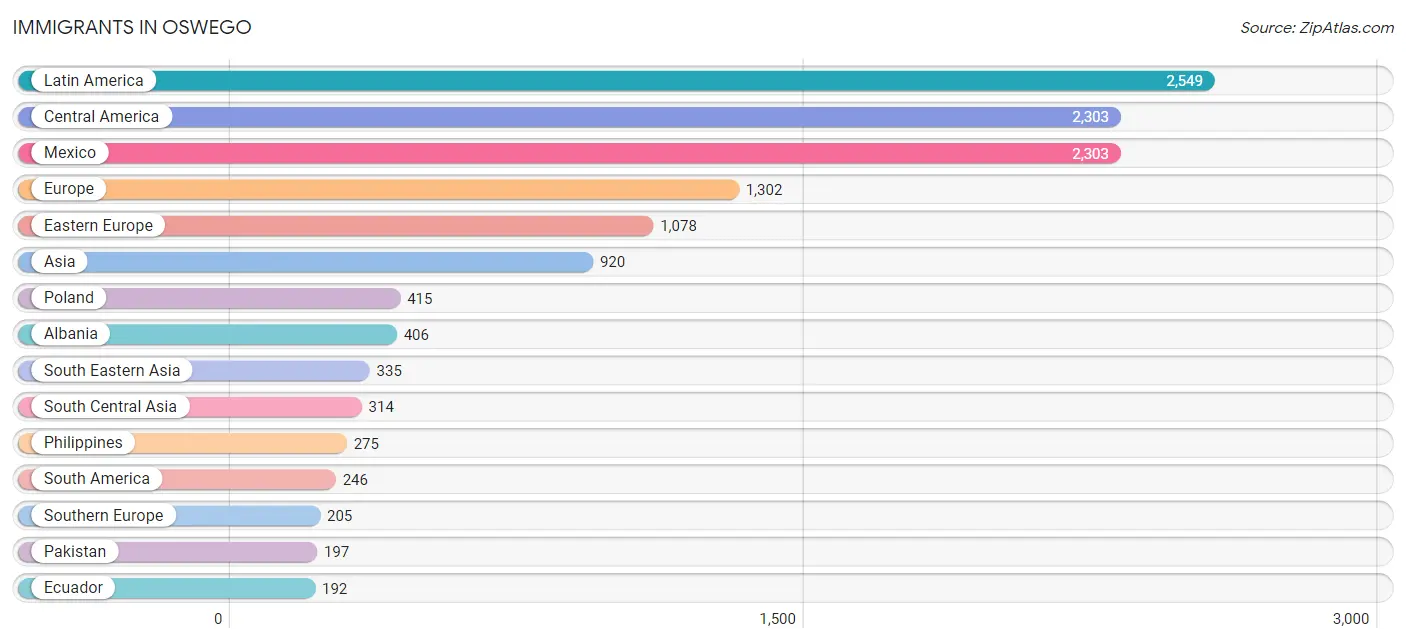
The most numerous immigrant groups reported in Oswego came from Latin America (2,549 | 7.3%), Central America (2,303 | 6.6%), Mexico (2,303 | 6.6%), Europe (1,302 | 3.7%), and Eastern Europe (1,078 | 3.1%), together accounting for 27.4% of all Oswego residents.
| Immigration Origin | # Population | % Population |
| Albania | 406 | 1.2% |
| Asia | 920 | 2.6% |
| Canada | 31 | 0.1% |
| Central America | 2,303 | 6.6% |
| Colombia | 6 | 0.0% |
| Eastern Asia | 125 | 0.4% |
| Eastern Europe | 1,078 | 3.1% |
| Ecuador | 192 | 0.5% |
| England | 19 | 0.1% |
| Europe | 1,302 | 3.7% |
| Greece | 26 | 0.1% |
| India | 117 | 0.3% |
| Iraq | 132 | 0.4% |
| Italy | 179 | 0.5% |
| Japan | 14 | 0.0% |
| Jordan | 14 | 0.0% |
| Korea | 111 | 0.3% |
| Latin America | 2,549 | 7.3% |
| Lithuania | 31 | 0.1% |
| Malaysia | 60 | 0.2% |
| Mexico | 2,303 | 6.6% |
| Moldova | 39 | 0.1% |
| Northern Europe | 19 | 0.1% |
| Pakistan | 197 | 0.6% |
| Philippines | 275 | 0.8% |
| Poland | 415 | 1.2% |
| Romania | 10 | 0.0% |
| Russia | 85 | 0.2% |
| South America | 246 | 0.7% |
| South Central Asia | 314 | 0.9% |
| South Eastern Asia | 335 | 1.0% |
| Southern Europe | 205 | 0.6% |
| Ukraine | 92 | 0.3% |
| Venezuela | 48 | 0.1% |
| Western Asia | 146 | 0.4% | View All 35 Rows |
Sex and Age in Oswego
Sex and Age in Oswego
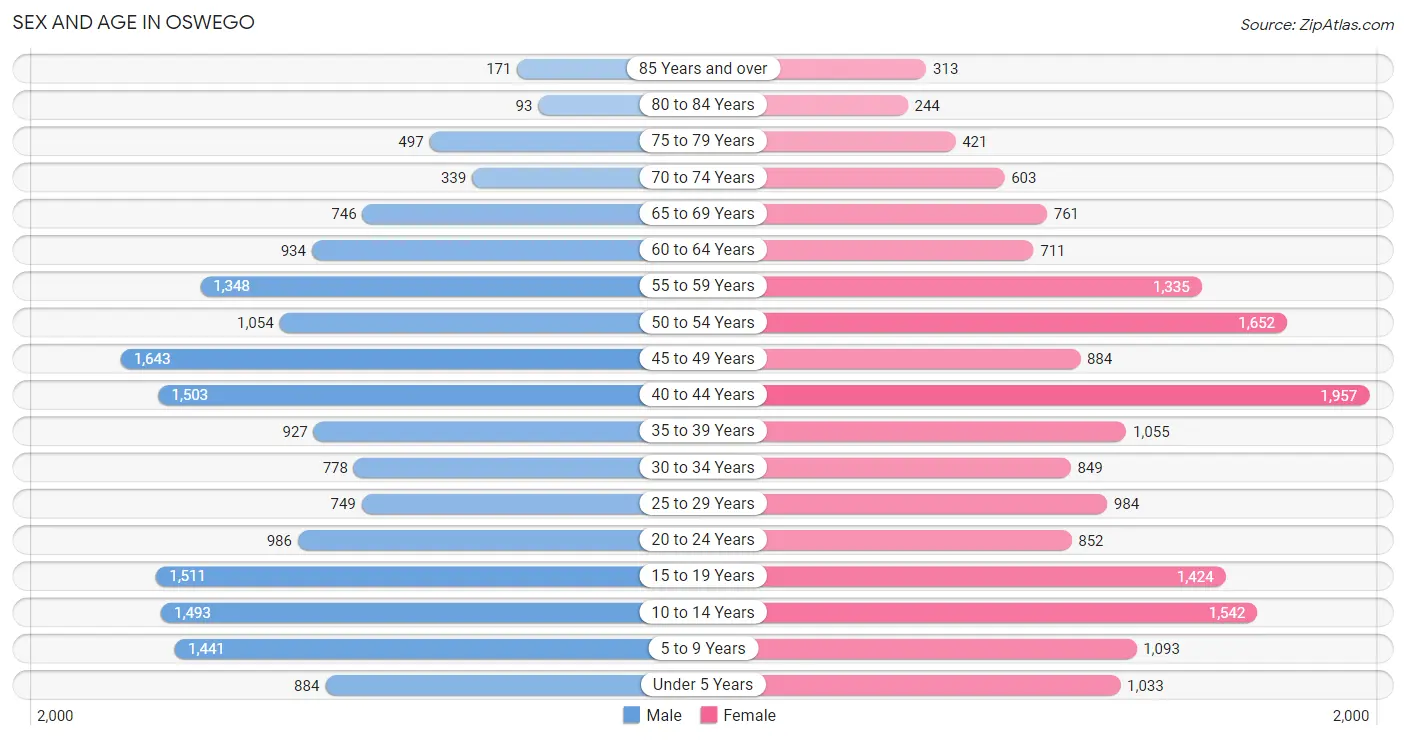
The most populous age groups in Oswego are 45 to 49 Years (1,643 | 9.6%) for men and 40 to 44 Years (1,957 | 11.1%) for women.
| Age Bracket | Male | Female |
| Under 5 Years | 884 (5.2%) | 1,033 (5.8%) |
| 5 to 9 Years | 1,441 (8.4%) | 1,093 (6.2%) |
| 10 to 14 Years | 1,493 (8.7%) | 1,542 (8.7%) |
| 15 to 19 Years | 1,511 (8.8%) | 1,424 (8.0%) |
| 20 to 24 Years | 986 (5.8%) | 852 (4.8%) |
| 25 to 29 Years | 749 (4.4%) | 984 (5.6%) |
| 30 to 34 Years | 778 (4.5%) | 849 (4.8%) |
| 35 to 39 Years | 927 (5.4%) | 1,055 (6.0%) |
| 40 to 44 Years | 1,503 (8.8%) | 1,957 (11.1%) |
| 45 to 49 Years | 1,643 (9.6%) | 884 (5.0%) |
| 50 to 54 Years | 1,054 (6.2%) | 1,652 (9.3%) |
| 55 to 59 Years | 1,348 (7.9%) | 1,335 (7.5%) |
| 60 to 64 Years | 934 (5.5%) | 711 (4.0%) |
| 65 to 69 Years | 746 (4.4%) | 761 (4.3%) |
| 70 to 74 Years | 339 (2.0%) | 603 (3.4%) |
| 75 to 79 Years | 497 (2.9%) | 421 (2.4%) |
| 80 to 84 Years | 93 (0.5%) | 244 (1.4%) |
| 85 Years and over | 171 (1.0%) | 313 (1.8%) |
| Total | 17,097 (100.0%) | 17,713 (100.0%) |
Families and Households in Oswego
Median Family Size in Oswego
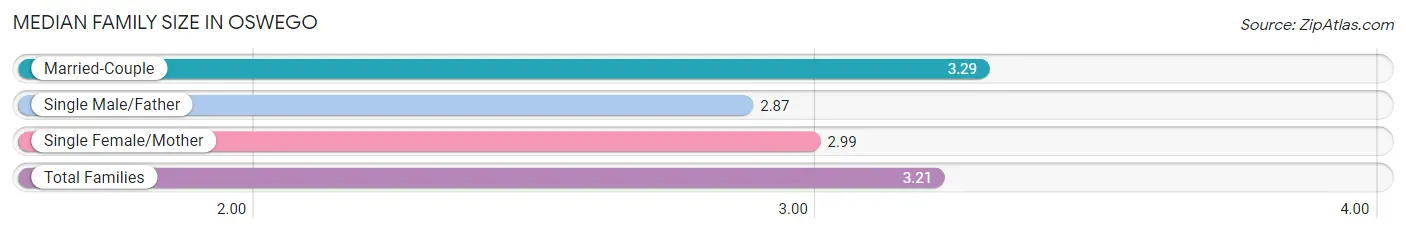
The median family size in Oswego is 3.21 persons per family, with married-couple families (7,699 | 78.2%) accounting for the largest median family size of 3.29 persons per family. On the other hand, single male/father families (830 | 8.4%) represent the smallest median family size with 2.87 persons per family.
| Family Type | # Families | Family Size |
| Married-Couple | 7,699 (78.2%) | 3.29 |
| Single Male/Father | 830 (8.4%) | 2.87 |
| Single Female/Mother | 1,314 (13.4%) | 2.99 |
| Total Families | 9,843 (100.0%) | 3.21 |
Median Household Size in Oswego
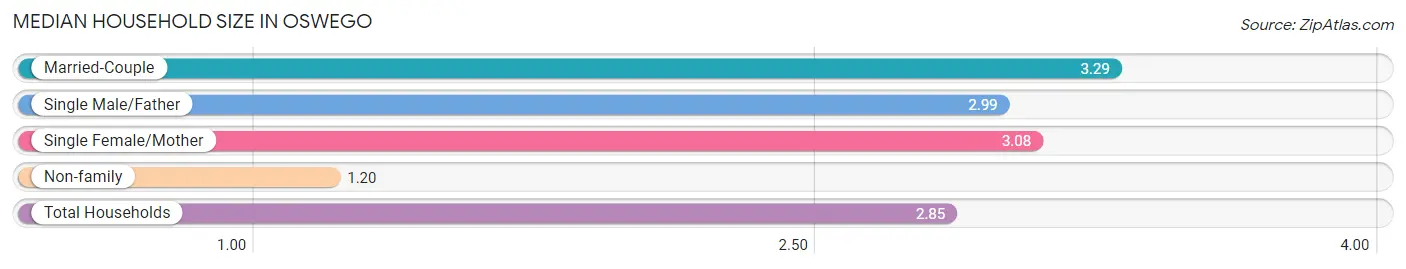
The median household size in Oswego is 2.85 persons per household, with married-couple households (7,699 | 63.1%) accounting for the largest median household size of 3.29 persons per household. non-family households (2,360 | 19.3%) represent the smallest median household size with 1.20 persons per household.
| Household Type | # Households | Household Size |
| Married-Couple | 7,699 (63.1%) | 3.29 |
| Single Male/Father | 830 (6.8%) | 2.99 |
| Single Female/Mother | 1,314 (10.8%) | 3.08 |
| Non-family | 2,360 (19.3%) | 1.20 |
| Total Households | 12,203 (100.0%) | 2.85 |
Household Size by Marriage Status in Oswego
Out of a total of 12,203 households in Oswego, 9,843 (80.7%) are family households, while 2,360 (19.3%) are nonfamily households. The most numerous type of family households are 2-person households, comprising 3,549, and the most common type of nonfamily households are 1-person households, comprising 1,935.
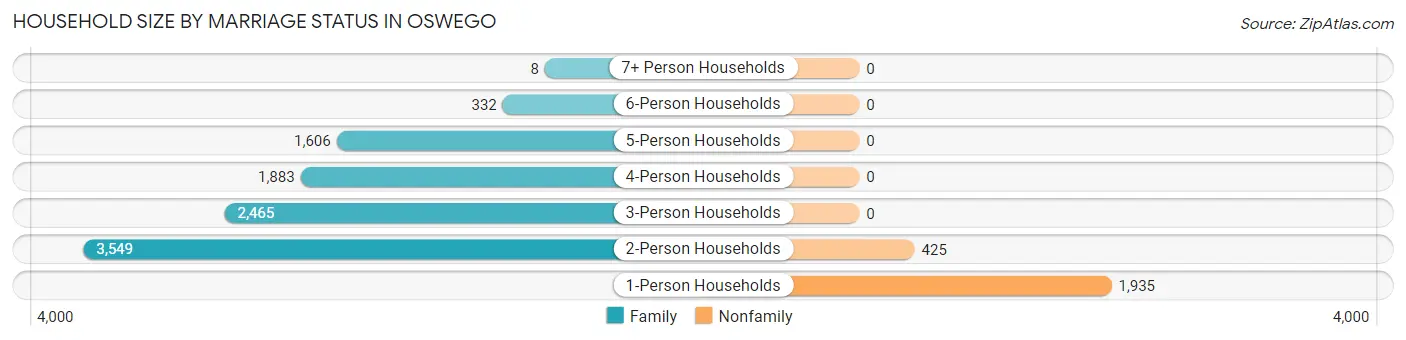
| Household Size | Family Households | Nonfamily Households |
| 1-Person Households | - | 1,935 (15.9%) |
| 2-Person Households | 3,549 (29.1%) | 425 (3.5%) |
| 3-Person Households | 2,465 (20.2%) | 0 (0.0%) |
| 4-Person Households | 1,883 (15.4%) | 0 (0.0%) |
| 5-Person Households | 1,606 (13.2%) | 0 (0.0%) |
| 6-Person Households | 332 (2.7%) | 0 (0.0%) |
| 7+ Person Households | 8 (0.1%) | 0 (0.0%) |
| Total | 9,843 (80.7%) | 2,360 (19.3%) |
Female Fertility in Oswego
Fertility by Age in Oswego
Average fertility rate in Oswego is 46.0 births per 1,000 women. Women in the age bracket of 20 to 34 years have the highest fertility rate with 86.0 births per 1,000 women. Women in the age bracket of 20 to 34 years acount for 58.6% of all women with births.
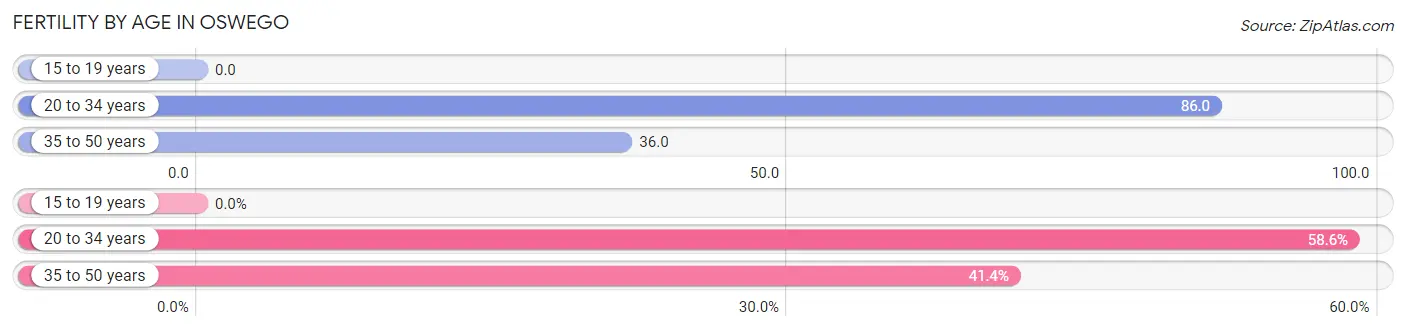
| Age Bracket | Women with Births | Births / 1,000 Women |
| 15 to 19 years | 0 (0.0%) | 0.0 |
| 20 to 34 years | 231 (58.6%) | 86.0 |
| 35 to 50 years | 163 (41.4%) | 36.0 |
| Total | 394 (100.0%) | 46.0 |
Fertility by Age by Marriage Status in Oswego
88.1% of women with births (394) in Oswego are married. The highest percentage of unmarried women with births falls into 20 to 34 years age bracket with 20.3% of them unmarried at the time of birth, while the lowest percentage of unmarried women with births belong to 35 to 50 years age bracket with 0.0% of them unmarried.
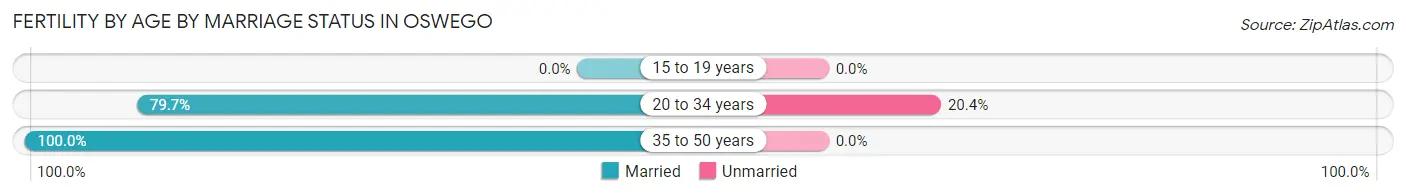
| Age Bracket | Married | Unmarried |
| 15 to 19 years | 0 (0.0%) | 0 (0.0%) |
| 20 to 34 years | 184 (79.6%) | 47 (20.3%) |
| 35 to 50 years | 163 (100.0%) | 0 (0.0%) |
| Total | 347 (88.1%) | 47 (11.9%) |
Fertility by Education in Oswego
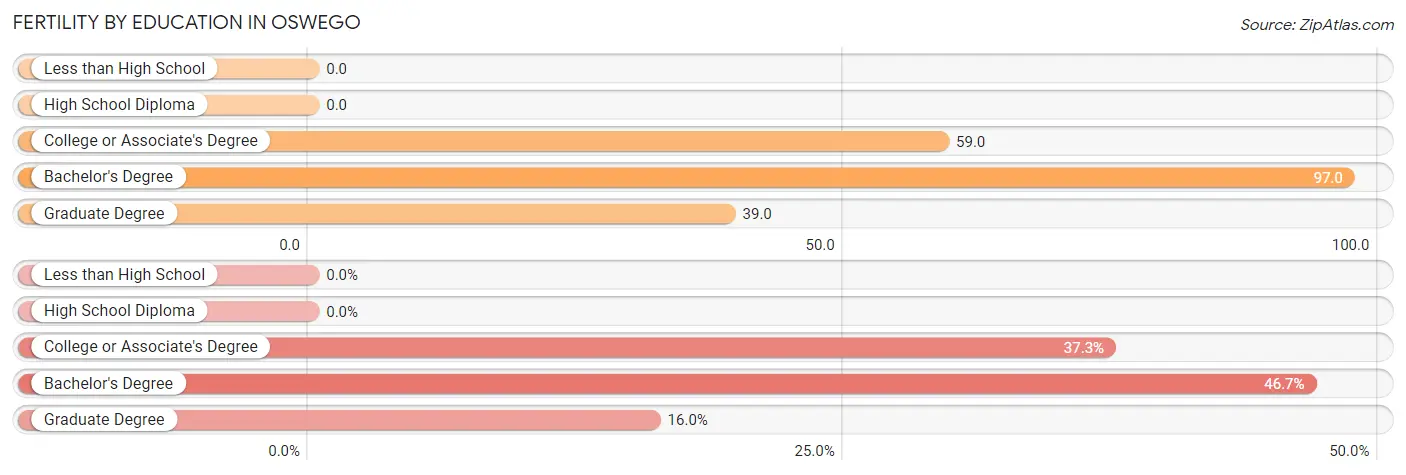
| Educational Attainment | Women with Births | Births / 1,000 Women |
| Less than High School | 0 (0.0%) | 0.0 |
| High School Diploma | 0 (0.0%) | 0.0 |
| College or Associate's Degree | 147 (37.3%) | 59.0 |
| Bachelor's Degree | 184 (46.7%) | 97.0 |
| Graduate Degree | 63 (16.0%) | 39.0 |
| Total | 394 (100.0%) | 46.0 |
Fertility by Education by Marriage Status in Oswego
11.9% of women with births in Oswego are unmarried. Women with the educational attainment of college or associate's degree are most likely to be married with 100.0% of them married at childbirth, while women with the educational attainment of bachelor's degree are least likely to be married with 25.5% of them unmarried at childbirth.
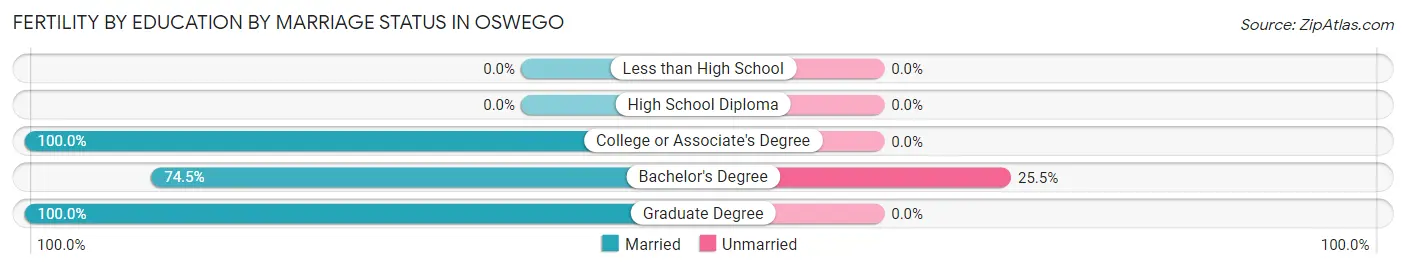
| Educational Attainment | Married | Unmarried |
| Less than High School | 0 (0.0%) | 0 (0.0%) |
| High School Diploma | 0 (0.0%) | 0 (0.0%) |
| College or Associate's Degree | 147 (100.0%) | 0 (0.0%) |
| Bachelor's Degree | 137 (74.5%) | 47 (25.5%) |
| Graduate Degree | 63 (100.0%) | 0 (0.0%) |
| Total | 347 (88.1%) | 47 (11.9%) |
Employment Characteristics in Oswego
Employment by Class of Employer in Oswego
Among the 17,576 employed individuals in Oswego, private company employees (11,840 | 67.4%), local government employees (2,173 | 12.4%), and not-for-profit organizations (1,292 | 7.3%) make up the most common classes of employment.
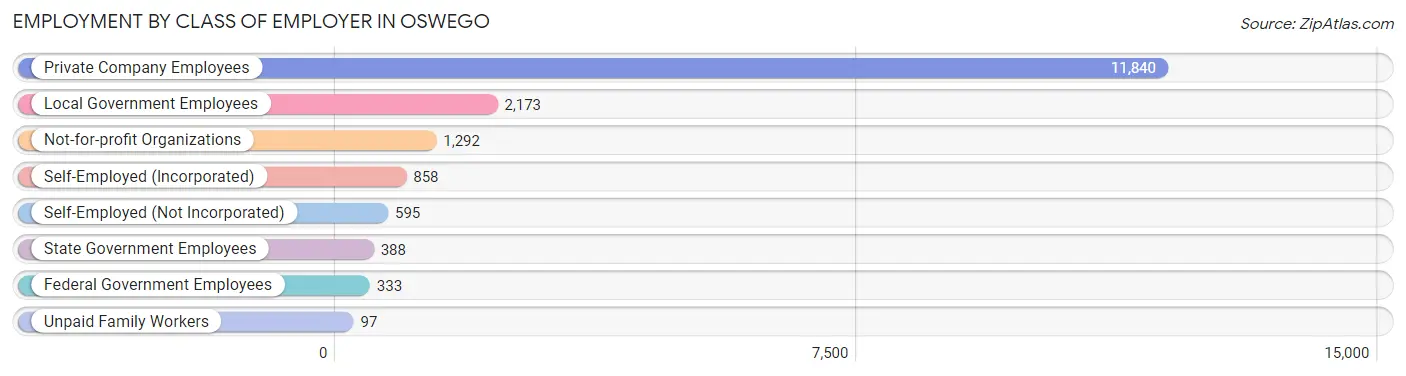
| Employer Class | # Employees | % Employees |
| Private Company Employees | 11,840 | 67.4% |
| Self-Employed (Incorporated) | 858 | 4.9% |
| Self-Employed (Not Incorporated) | 595 | 3.4% |
| Not-for-profit Organizations | 1,292 | 7.3% |
| Local Government Employees | 2,173 | 12.4% |
| State Government Employees | 388 | 2.2% |
| Federal Government Employees | 333 | 1.9% |
| Unpaid Family Workers | 97 | 0.5% |
| Total | 17,576 | 100.0% |
Employment Status by Age in Oswego
According to the labor force statistics for Oswego, out of the total population over 16 years of age (26,640), 69.4% or 18,488 individuals are in the labor force, with 2.9% or 536 of them unemployed. The age group with the highest labor force participation rate is 30 to 34 years, with 95.8% or 1,559 individuals in the labor force. Within the labor force, the 16 to 19 years age range has the highest percentage of unemployed individuals, with 27.2% or 254 of them being unemployed.
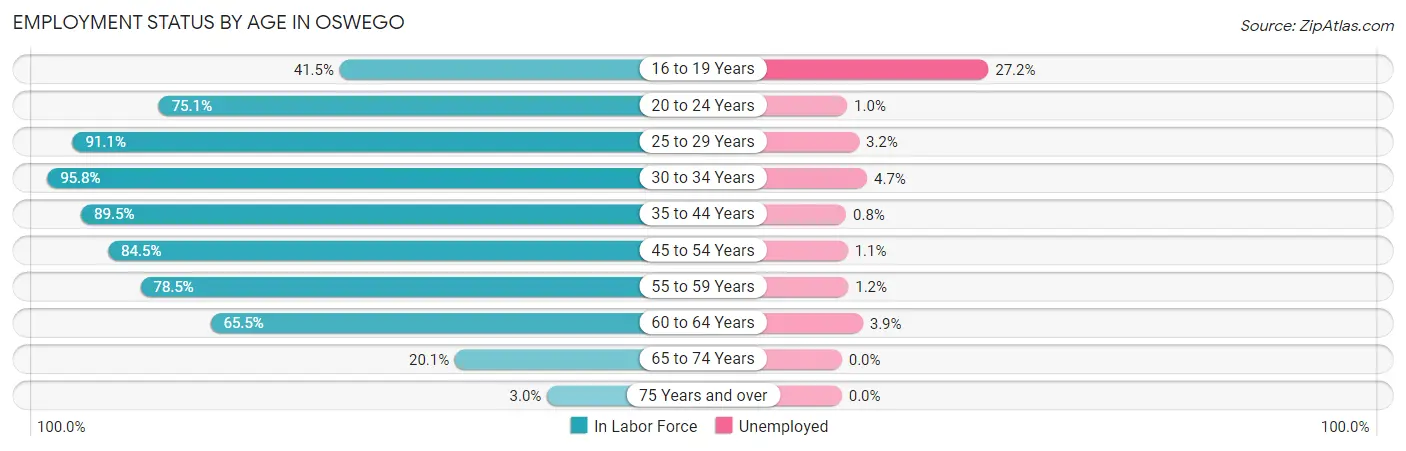
| Age Bracket | In Labor Force | Unemployed |
| 16 to 19 Years | 934 (41.5%) | 254 (27.2%) |
| 20 to 24 Years | 1,380 (75.1%) | 14 (1.0%) |
| 25 to 29 Years | 1,579 (91.1%) | 51 (3.2%) |
| 30 to 34 Years | 1,559 (95.8%) | 73 (4.7%) |
| 35 to 44 Years | 4,871 (89.5%) | 39 (0.8%) |
| 45 to 54 Years | 4,422 (84.5%) | 49 (1.1%) |
| 55 to 59 Years | 2,106 (78.5%) | 25 (1.2%) |
| 60 to 64 Years | 1,077 (65.5%) | 42 (3.9%) |
| 65 to 74 Years | 492 (20.1%) | 0 (0.0%) |
| 75 Years and over | 52 (3.0%) | 0 (0.0%) |
| Total | 18,488 (69.4%) | 536 (2.9%) |
Employment Status by Educational Attainment in Oswego
According to labor force statistics for Oswego, 85.0% of individuals (15,609) out of the total population between 25 and 64 years of age (18,363) are in the labor force, with 1.8% or 281 of them being unemployed. The group with the highest labor force participation rate are those with the educational attainment of bachelor's degree or higher, with 88.2% or 7,488 individuals in the labor force. Within the labor force, individuals with less than high school education have the highest percentage of unemployment, with 6.9% or 38 of them being unemployed.
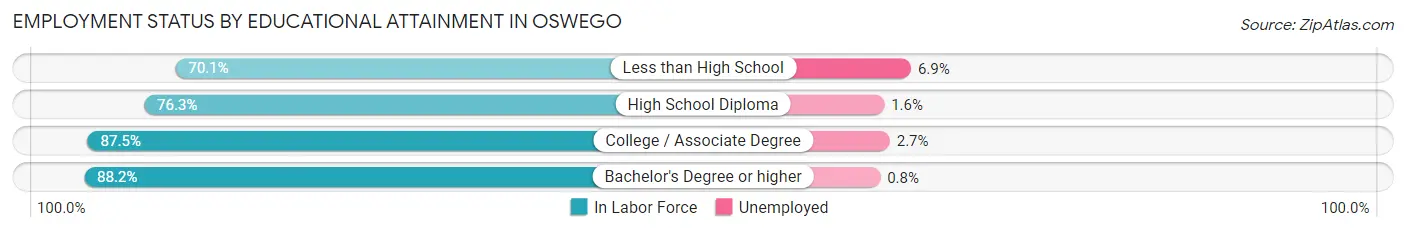
| Educational Attainment | In Labor Force | Unemployed |
| Less than High School | 552 (70.1%) | 54 (6.9%) |
| High School Diploma | 2,574 (76.3%) | 54 (1.6%) |
| College / Associate Degree | 4,998 (87.5%) | 154 (2.7%) |
| Bachelor's Degree or higher | 7,488 (88.2%) | 68 (0.8%) |
| Total | 15,609 (85.0%) | 331 (1.8%) |
Employment Occupations by Sex in Oswego
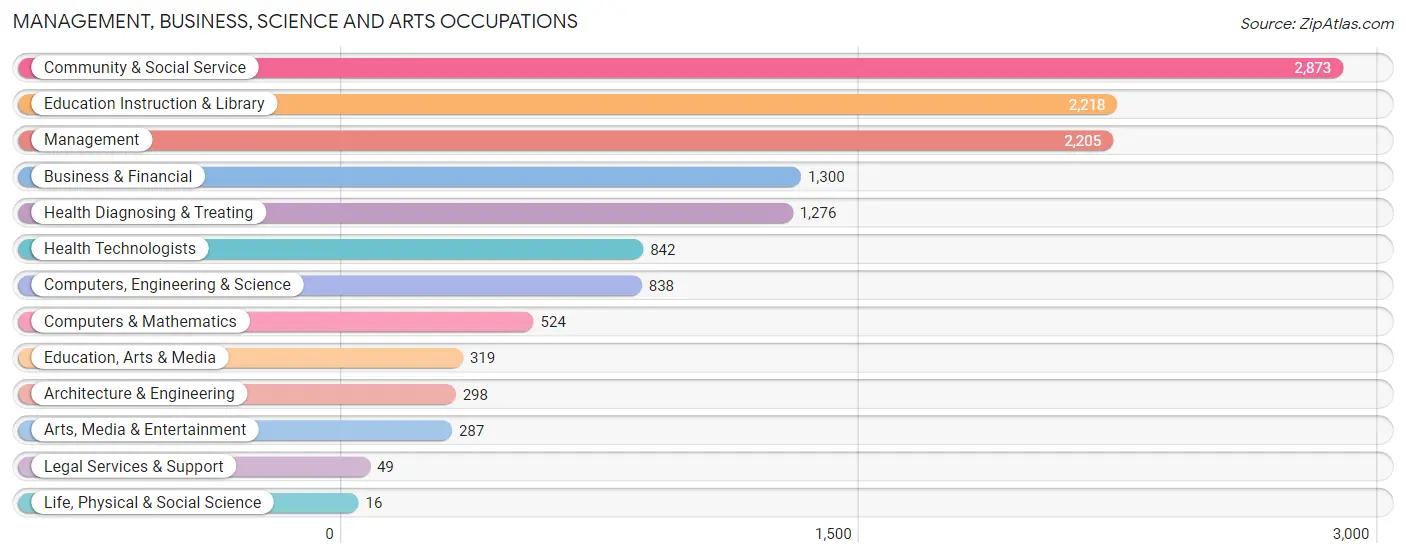
Management, Business, Science and Arts Occupations
The most common Management, Business, Science and Arts occupations in Oswego are Community & Social Service (2,873 | 16.0%), Education Instruction & Library (2,218 | 12.4%), Management (2,205 | 12.3%), Business & Financial (1,300 | 7.2%), and Health Diagnosing & Treating (1,276 | 7.1%).
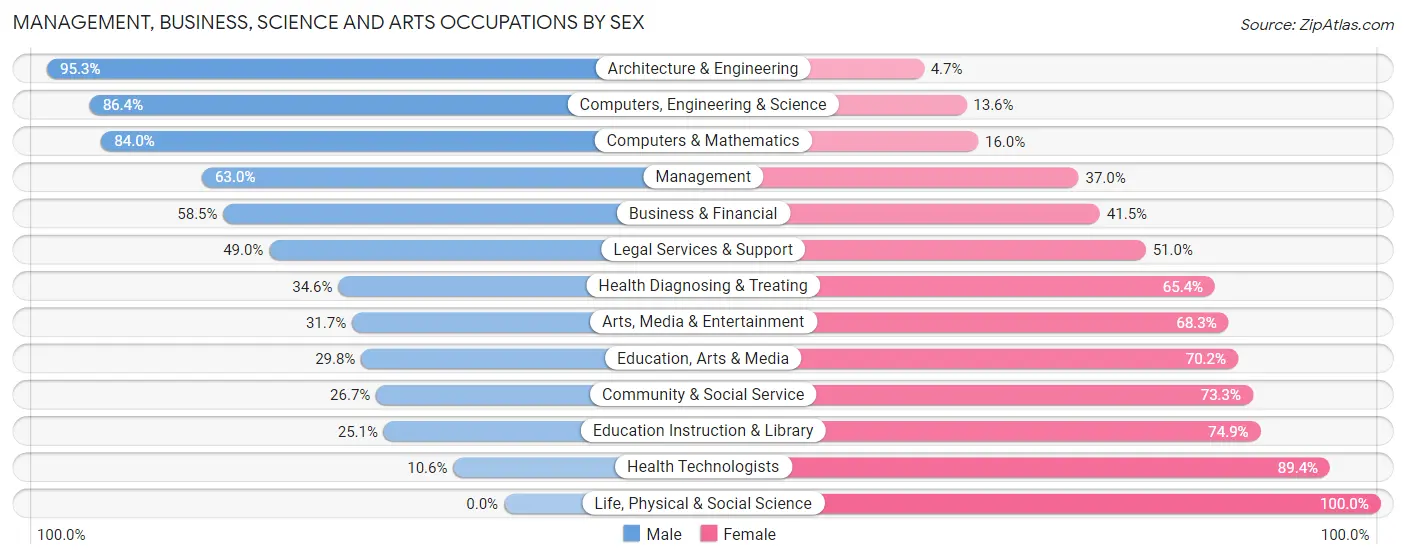
Management, Business, Science and Arts Occupations by Sex
Within the Management, Business, Science and Arts occupations in Oswego, the most male-oriented occupations are Architecture & Engineering (95.3%), Computers, Engineering & Science (86.4%), and Computers & Mathematics (84.0%), while the most female-oriented occupations are Life, Physical & Social Science (100.0%), Health Technologists (89.4%), and Education Instruction & Library (74.9%).
| Occupation | Male | Female |
| Management | 1,389 (63.0%) | 816 (37.0%) |
| Business & Financial | 761 (58.5%) | 539 (41.5%) |
| Computers, Engineering & Science | 724 (86.4%) | 114 (13.6%) |
| Computers & Mathematics | 440 (84.0%) | 84 (16.0%) |
| Architecture & Engineering | 284 (95.3%) | 14 (4.7%) |
| Life, Physical & Social Science | 0 (0.0%) | 16 (100.0%) |
| Community & Social Service | 766 (26.7%) | 2,107 (73.3%) |
| Education, Arts & Media | 95 (29.8%) | 224 (70.2%) |
| Legal Services & Support | 24 (49.0%) | 25 (51.0%) |
| Education Instruction & Library | 556 (25.1%) | 1,662 (74.9%) |
| Arts, Media & Entertainment | 91 (31.7%) | 196 (68.3%) |
| Health Diagnosing & Treating | 441 (34.6%) | 835 (65.4%) |
| Health Technologists | 89 (10.6%) | 753 (89.4%) |
| Total (Category) | 4,081 (48.1%) | 4,411 (51.9%) |
| Total (Overall) | 9,889 (55.1%) | 8,041 (44.9%) |
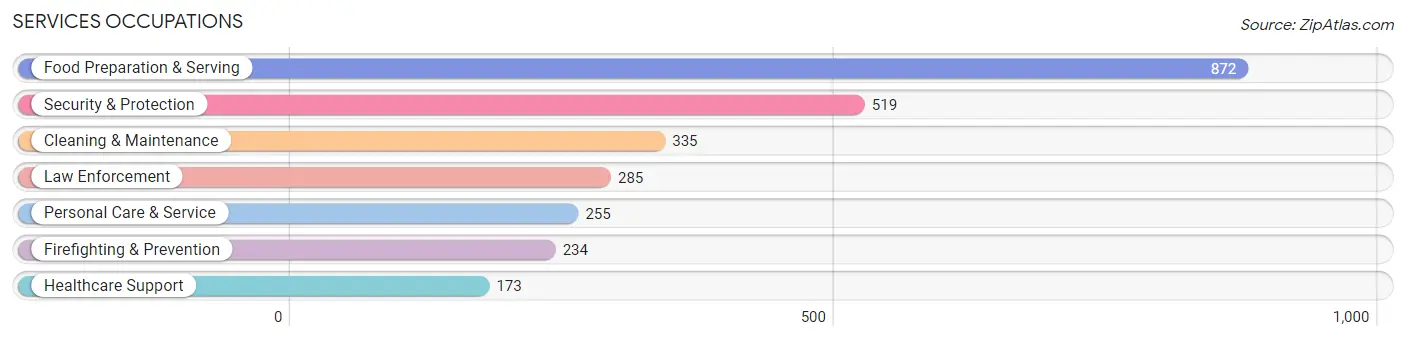
Services Occupations
The most common Services occupations in Oswego are Food Preparation & Serving (872 | 4.9%), Security & Protection (519 | 2.9%), Cleaning & Maintenance (335 | 1.9%), Law Enforcement (285 | 1.6%), and Personal Care & Service (255 | 1.4%).
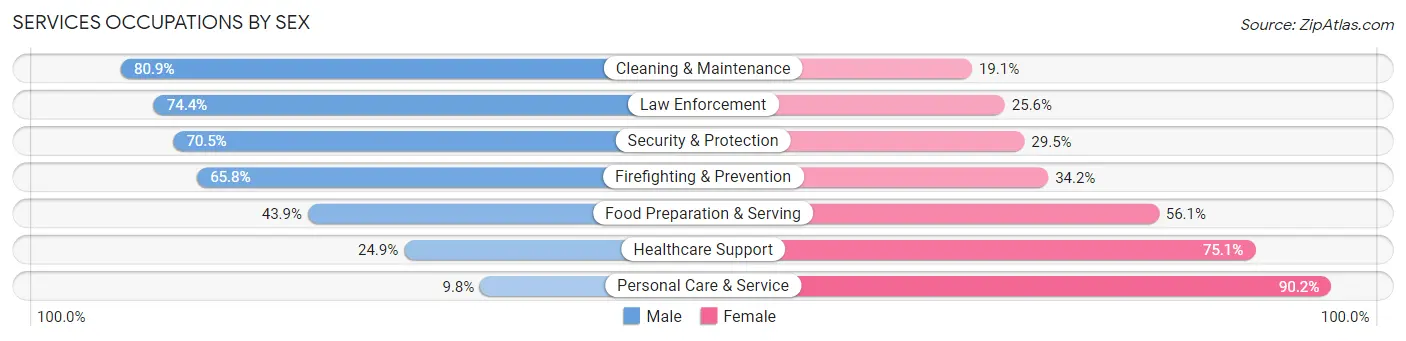
Services Occupations by Sex
Within the Services occupations in Oswego, the most male-oriented occupations are Cleaning & Maintenance (80.9%), Law Enforcement (74.4%), and Security & Protection (70.5%), while the most female-oriented occupations are Personal Care & Service (90.2%), Healthcare Support (75.1%), and Food Preparation & Serving (56.1%).
| Occupation | Male | Female |
| Healthcare Support | 43 (24.9%) | 130 (75.1%) |
| Security & Protection | 366 (70.5%) | 153 (29.5%) |
| Firefighting & Prevention | 154 (65.8%) | 80 (34.2%) |
| Law Enforcement | 212 (74.4%) | 73 (25.6%) |
| Food Preparation & Serving | 383 (43.9%) | 489 (56.1%) |
| Cleaning & Maintenance | 271 (80.9%) | 64 (19.1%) |
| Personal Care & Service | 25 (9.8%) | 230 (90.2%) |
| Total (Category) | 1,088 (50.5%) | 1,066 (49.5%) |
| Total (Overall) | 9,889 (55.1%) | 8,041 (44.9%) |
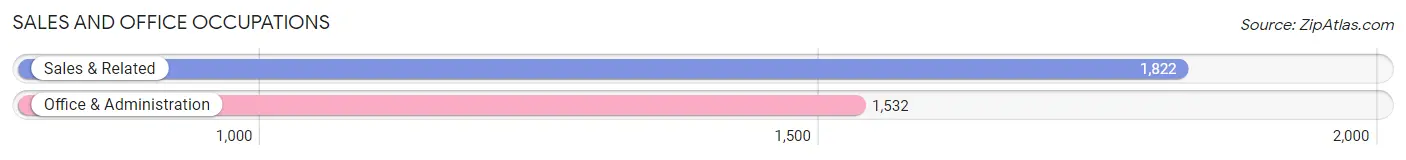
Sales and Office Occupations
The most common Sales and Office occupations in Oswego are Sales & Related (1,822 | 10.2%), and Office & Administration (1,532 | 8.5%).
Sales and Office Occupations by Sex
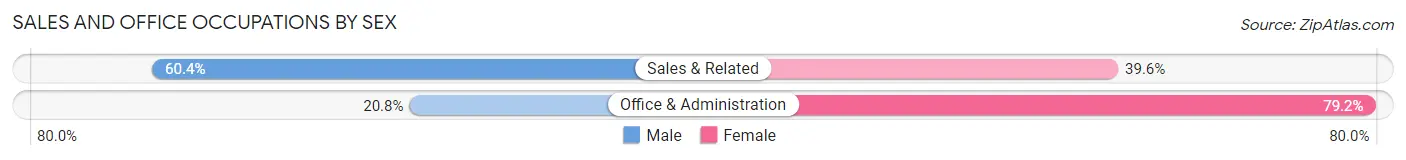
| Occupation | Male | Female |
| Sales & Related | 1,100 (60.4%) | 722 (39.6%) |
| Office & Administration | 319 (20.8%) | 1,213 (79.2%) |
| Total (Category) | 1,419 (42.3%) | 1,935 (57.7%) |
| Total (Overall) | 9,889 (55.1%) | 8,041 (44.9%) |
Natural Resources, Construction and Maintenance Occupations
The most common Natural Resources, Construction and Maintenance occupations in Oswego are Construction & Extraction (1,153 | 6.4%), and Installation, Maintenance & Repair (290 | 1.6%).

Natural Resources, Construction and Maintenance Occupations by Sex

| Occupation | Male | Female |
| Farming, Fishing & Forestry | 0 (0.0%) | 0 (0.0%) |
| Construction & Extraction | 827 (71.7%) | 326 (28.3%) |
| Installation, Maintenance & Repair | 290 (100.0%) | 0 (0.0%) |
| Total (Category) | 1,117 (77.4%) | 326 (22.6%) |
| Total (Overall) | 9,889 (55.1%) | 8,041 (44.9%) |
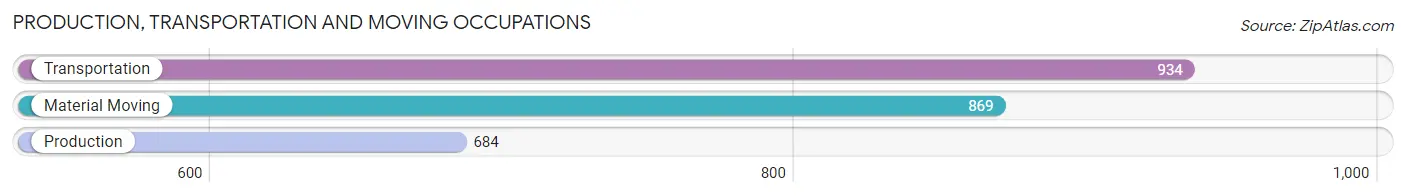
Production, Transportation and Moving Occupations
The most common Production, Transportation and Moving occupations in Oswego are Transportation (934 | 5.2%), Material Moving (869 | 4.9%), and Production (684 | 3.8%).
Production, Transportation and Moving Occupations by Sex
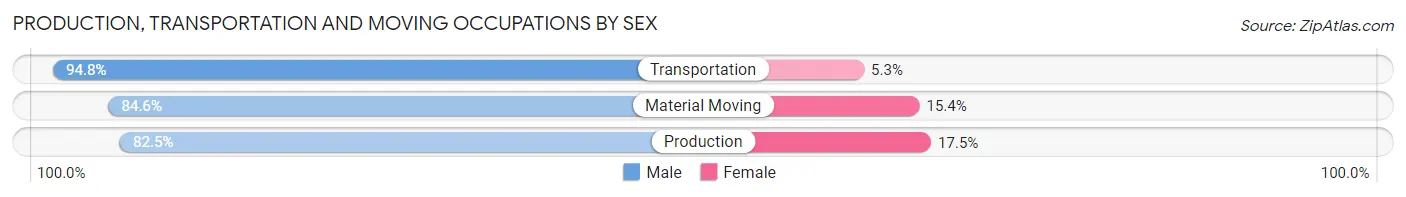
| Occupation | Male | Female |
| Production | 564 (82.5%) | 120 (17.5%) |
| Transportation | 885 (94.8%) | 49 (5.2%) |
| Material Moving | 735 (84.6%) | 134 (15.4%) |
| Total (Category) | 2,184 (87.8%) | 303 (12.2%) |
| Total (Overall) | 9,889 (55.1%) | 8,041 (44.9%) |
Employment Industries by Sex in Oswego
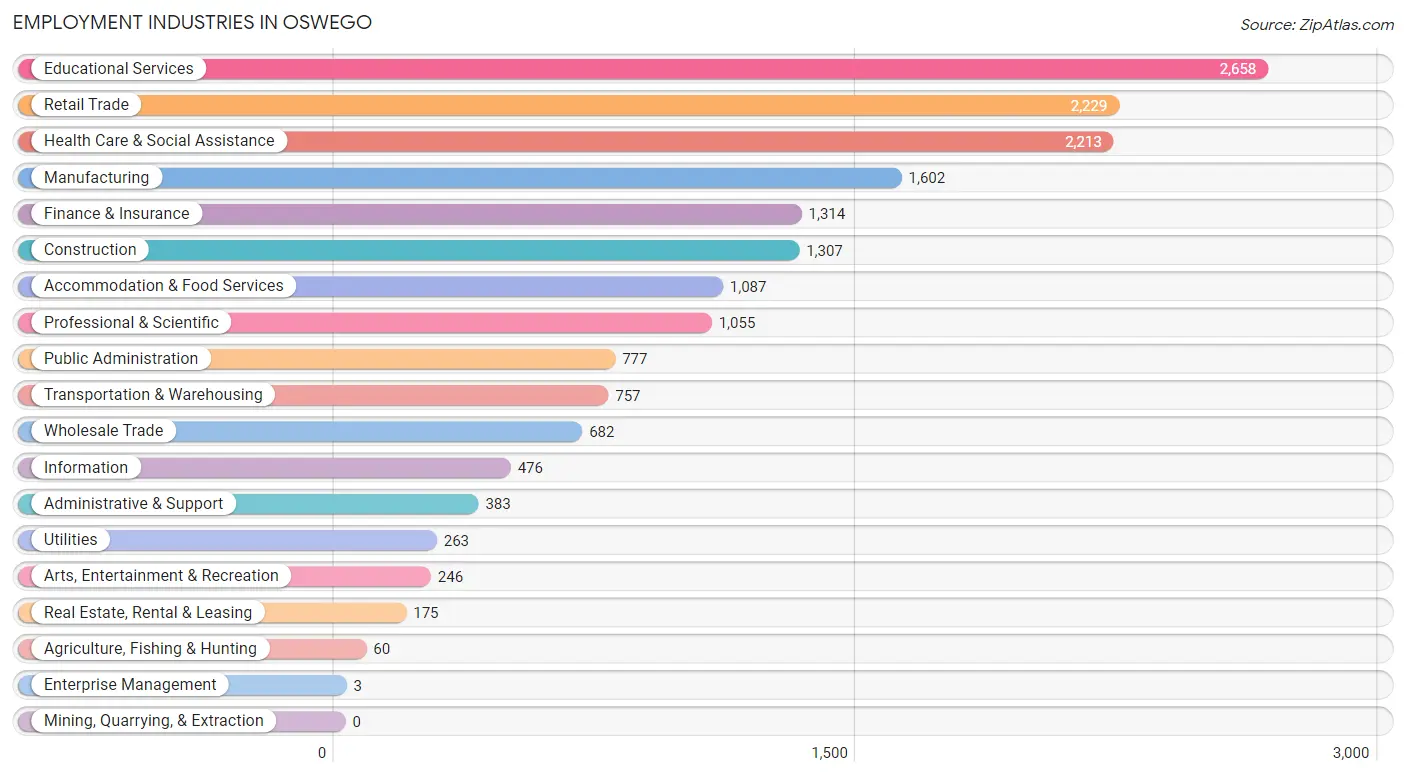
Employment Industries in Oswego
The major employment industries in Oswego include Educational Services (2,658 | 14.8%), Retail Trade (2,229 | 12.4%), Health Care & Social Assistance (2,213 | 12.3%), Manufacturing (1,602 | 8.9%), and Finance & Insurance (1,314 | 7.3%).
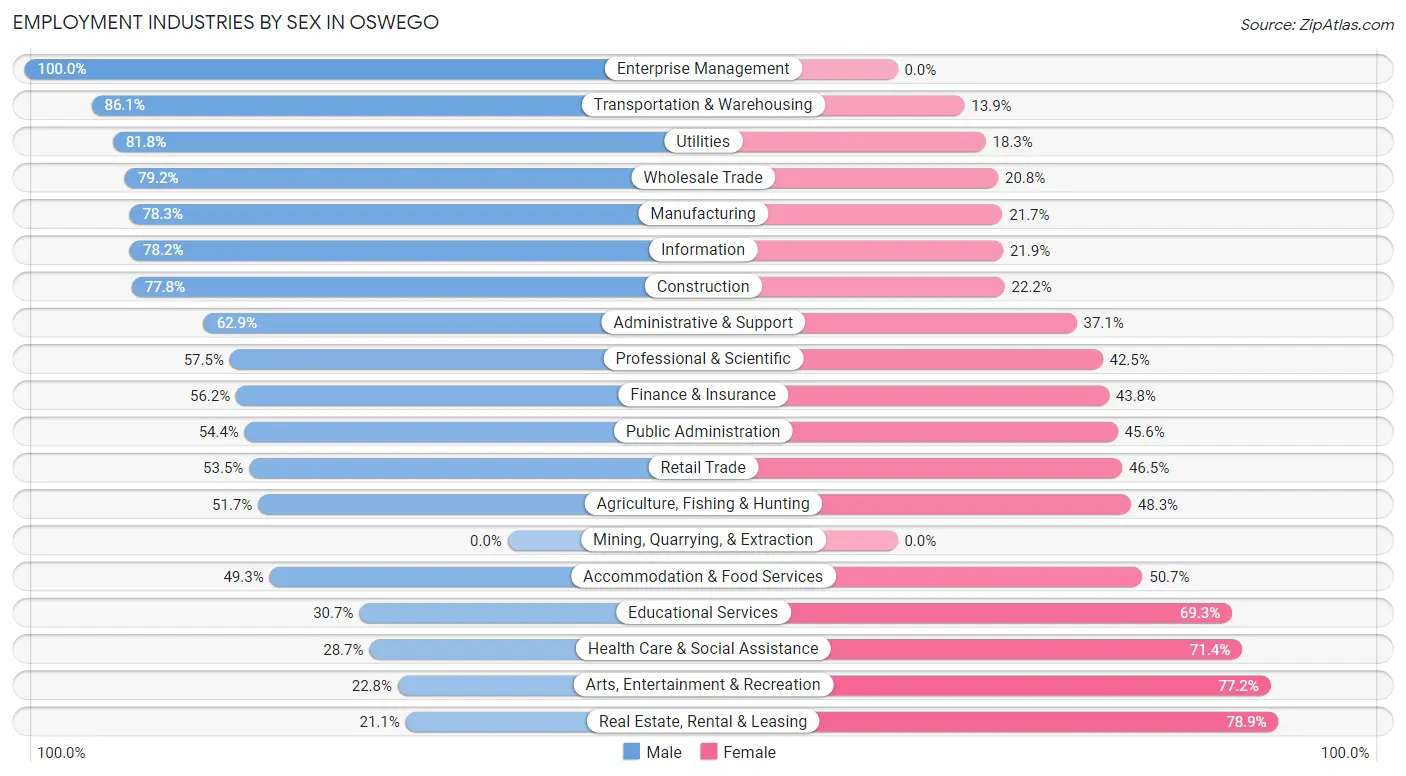
Employment Industries by Sex in Oswego
The Oswego industries that see more men than women are Enterprise Management (100.0%), Transportation & Warehousing (86.1%), and Utilities (81.8%), whereas the industries that tend to have a higher number of women are Real Estate, Rental & Leasing (78.9%), Arts, Entertainment & Recreation (77.2%), and Health Care & Social Assistance (71.4%).
| Industry | Male | Female |
| Agriculture, Fishing & Hunting | 31 (51.7%) | 29 (48.3%) |
| Mining, Quarrying, & Extraction | 0 (0.0%) | 0 (0.0%) |
| Construction | 1,017 (77.8%) | 290 (22.2%) |
| Manufacturing | 1,254 (78.3%) | 348 (21.7%) |
| Wholesale Trade | 540 (79.2%) | 142 (20.8%) |
| Retail Trade | 1,193 (53.5%) | 1,036 (46.5%) |
| Transportation & Warehousing | 652 (86.1%) | 105 (13.9%) |
| Utilities | 215 (81.8%) | 48 (18.2%) |
| Information | 372 (78.1%) | 104 (21.8%) |
| Finance & Insurance | 739 (56.2%) | 575 (43.8%) |
| Real Estate, Rental & Leasing | 37 (21.1%) | 138 (78.9%) |
| Professional & Scientific | 607 (57.5%) | 448 (42.5%) |
| Enterprise Management | 3 (100.0%) | 0 (0.0%) |
| Administrative & Support | 241 (62.9%) | 142 (37.1%) |
| Educational Services | 817 (30.7%) | 1,841 (69.3%) |
| Health Care & Social Assistance | 634 (28.6%) | 1,579 (71.4%) |
| Arts, Entertainment & Recreation | 56 (22.8%) | 190 (77.2%) |
| Accommodation & Food Services | 536 (49.3%) | 551 (50.7%) |
| Public Administration | 423 (54.4%) | 354 (45.6%) |
| Total | 9,889 (55.1%) | 8,041 (44.9%) |
Education in Oswego
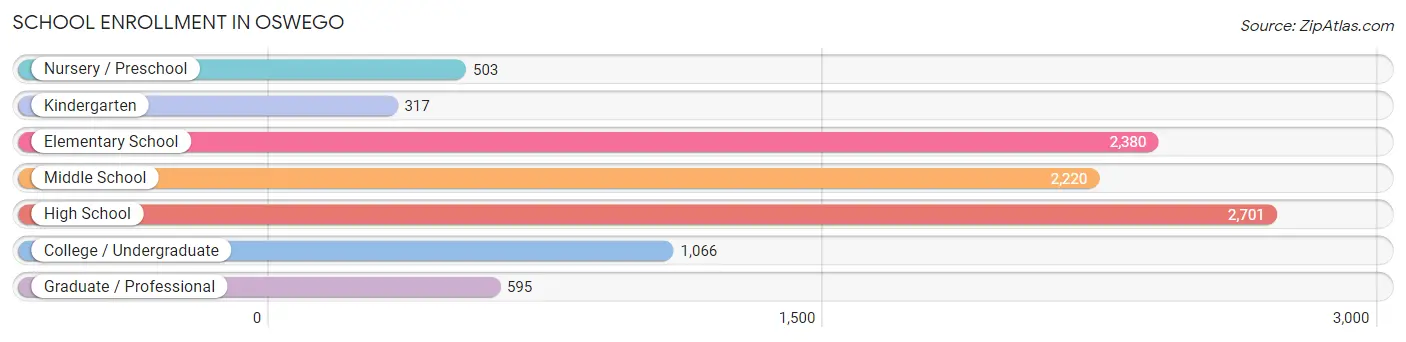
School Enrollment in Oswego
The most common levels of schooling among the 9,782 students in Oswego are high school (2,701 | 27.6%), elementary school (2,380 | 24.3%), and middle school (2,220 | 22.7%).
| School Level | # Students | % Students |
| Nursery / Preschool | 503 | 5.1% |
| Kindergarten | 317 | 3.2% |
| Elementary School | 2,380 | 24.3% |
| Middle School | 2,220 | 22.7% |
| High School | 2,701 | 27.6% |
| College / Undergraduate | 1,066 | 10.9% |
| Graduate / Professional | 595 | 6.1% |
| Total | 9,782 | 100.0% |
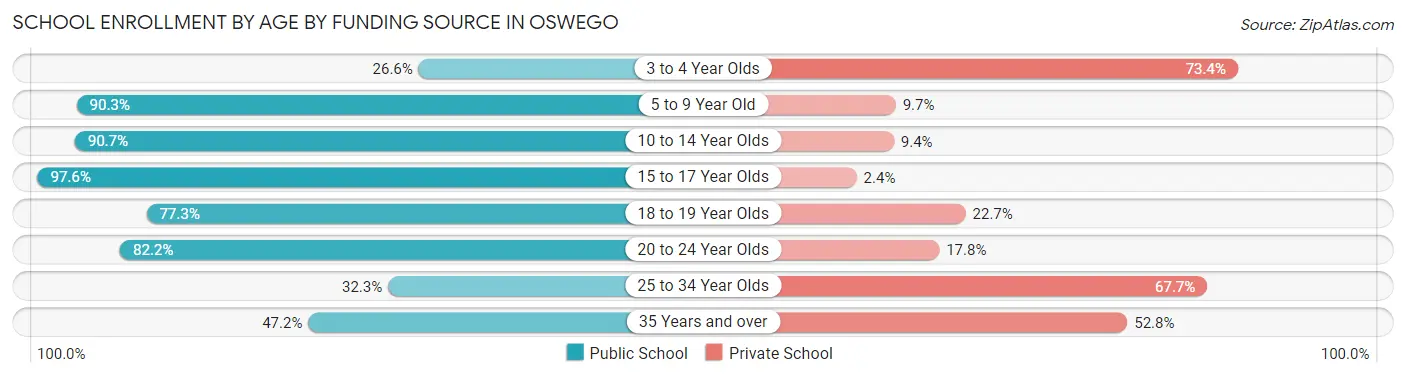
School Enrollment by Age by Funding Source in Oswego
Out of a total of 9,782 students who are enrolled in schools in Oswego, 1,516 (15.5%) attend a private institution, while the remaining 8,266 (84.5%) are enrolled in public schools. The age group of 3 to 4 year olds has the highest likelihood of being enrolled in private schools, with 251 (73.4% in the age bracket) enrolled. Conversely, the age group of 15 to 17 year olds has the lowest likelihood of being enrolled in a private school, with 1,937 (97.6% in the age bracket) attending a public institution.
| Age Bracket | Public School | Private School |
| 3 to 4 Year Olds | 91 (26.6%) | 251 (73.4%) |
| 5 to 9 Year Old | 2,266 (90.3%) | 243 (9.7%) |
| 10 to 14 Year Olds | 2,716 (90.6%) | 280 (9.3%) |
| 15 to 17 Year Olds | 1,937 (97.6%) | 48 (2.4%) |
| 18 to 19 Year Olds | 439 (77.3%) | 129 (22.7%) |
| 20 to 24 Year Olds | 471 (82.2%) | 102 (17.8%) |
| 25 to 34 Year Olds | 73 (32.3%) | 153 (67.7%) |
| 35 Years and over | 275 (47.2%) | 308 (52.8%) |
| Total | 8,266 (84.5%) | 1,516 (15.5%) |
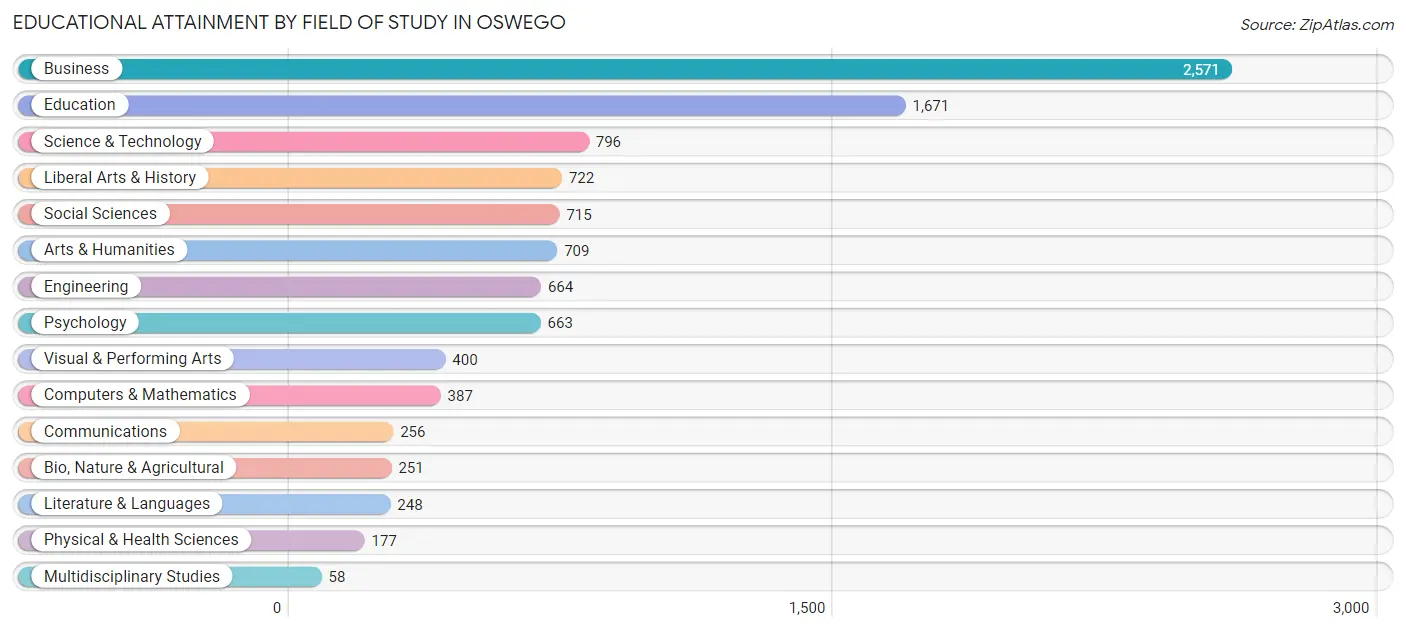
Educational Attainment by Field of Study in Oswego
Business (2,571 | 25.0%), education (1,671 | 16.2%), science & technology (796 | 7.7%), liberal arts & history (722 | 7.0%), and social sciences (715 | 7.0%) are the most common fields of study among 10,288 individuals in Oswego who have obtained a bachelor's degree or higher.
| Field of Study | # Graduates | % Graduates |
| Computers & Mathematics | 387 | 3.8% |
| Bio, Nature & Agricultural | 251 | 2.4% |
| Physical & Health Sciences | 177 | 1.7% |
| Psychology | 663 | 6.4% |
| Social Sciences | 715 | 7.0% |
| Engineering | 664 | 6.5% |
| Multidisciplinary Studies | 58 | 0.6% |
| Science & Technology | 796 | 7.7% |
| Business | 2,571 | 25.0% |
| Education | 1,671 | 16.2% |
| Literature & Languages | 248 | 2.4% |
| Liberal Arts & History | 722 | 7.0% |
| Visual & Performing Arts | 400 | 3.9% |
| Communications | 256 | 2.5% |
| Arts & Humanities | 709 | 6.9% |
| Total | 10,288 | 100.0% |
Transportation & Commute in Oswego
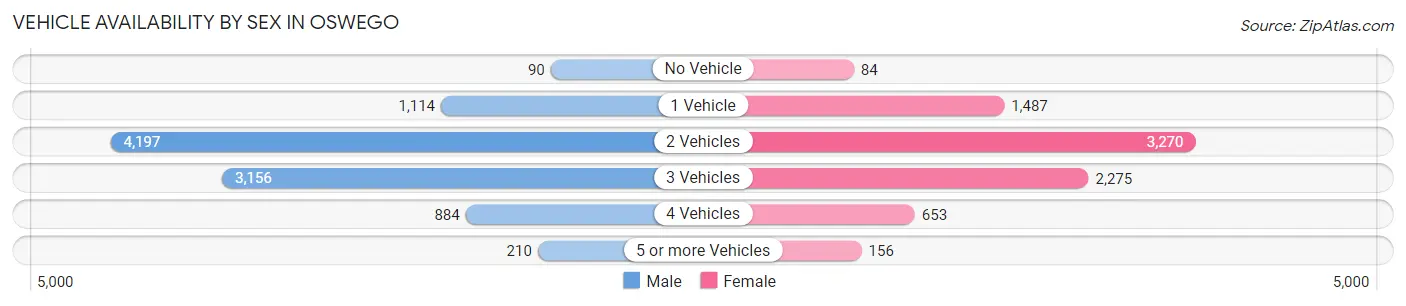
Vehicle Availability by Sex in Oswego
The most prevalent vehicle ownership categories in Oswego are males with 2 vehicles (4,197, accounting for 43.5%) and females with 2 vehicles (3,270, making up 53.0%).
| Vehicles Available | Male | Female |
| No Vehicle | 90 (0.9%) | 84 (1.1%) |
| 1 Vehicle | 1,114 (11.5%) | 1,487 (18.8%) |
| 2 Vehicles | 4,197 (43.5%) | 3,270 (41.3%) |
| 3 Vehicles | 3,156 (32.7%) | 2,275 (28.7%) |
| 4 Vehicles | 884 (9.2%) | 653 (8.2%) |
| 5 or more Vehicles | 210 (2.2%) | 156 (2.0%) |
| Total | 9,651 (100.0%) | 7,925 (100.0%) |
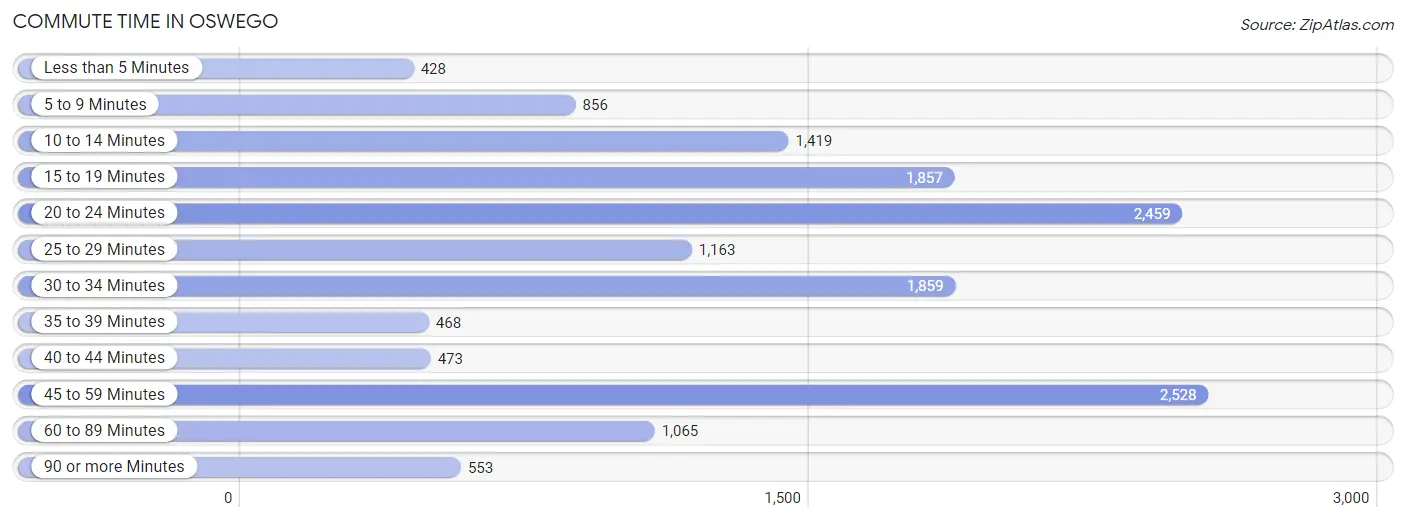
Commute Time in Oswego
The most frequently occuring commute durations in Oswego are 45 to 59 minutes (2,528 commuters, 16.7%), 20 to 24 minutes (2,459 commuters, 16.3%), and 30 to 34 minutes (1,859 commuters, 12.3%).
| Commute Time | # Commuters | % Commuters |
| Less than 5 Minutes | 428 | 2.8% |
| 5 to 9 Minutes | 856 | 5.7% |
| 10 to 14 Minutes | 1,419 | 9.4% |
| 15 to 19 Minutes | 1,857 | 12.3% |
| 20 to 24 Minutes | 2,459 | 16.3% |
| 25 to 29 Minutes | 1,163 | 7.7% |
| 30 to 34 Minutes | 1,859 | 12.3% |
| 35 to 39 Minutes | 468 | 3.1% |
| 40 to 44 Minutes | 473 | 3.1% |
| 45 to 59 Minutes | 2,528 | 16.7% |
| 60 to 89 Minutes | 1,065 | 7.0% |
| 90 or more Minutes | 553 | 3.7% |
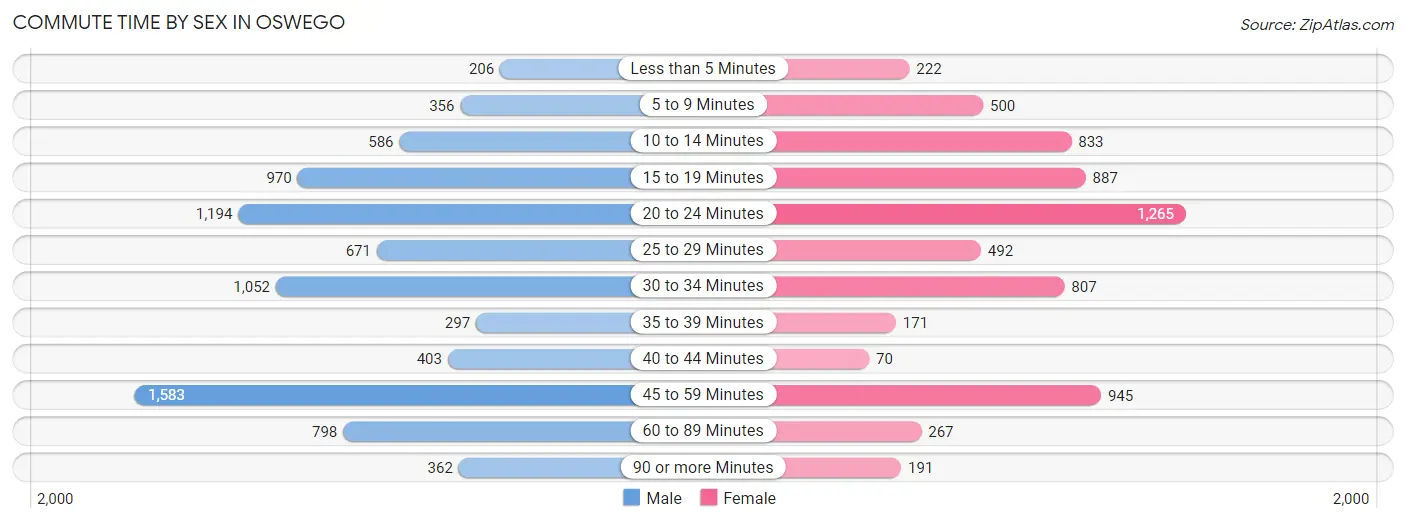
Commute Time by Sex in Oswego
The most common commute times in Oswego are 45 to 59 minutes (1,583 commuters, 18.7%) for males and 20 to 24 minutes (1,265 commuters, 19.0%) for females.
| Commute Time | Male | Female |
| Less than 5 Minutes | 206 (2.4%) | 222 (3.3%) |
| 5 to 9 Minutes | 356 (4.2%) | 500 (7.5%) |
| 10 to 14 Minutes | 586 (6.9%) | 833 (12.5%) |
| 15 to 19 Minutes | 970 (11.4%) | 887 (13.3%) |
| 20 to 24 Minutes | 1,194 (14.1%) | 1,265 (19.0%) |
| 25 to 29 Minutes | 671 (7.9%) | 492 (7.4%) |
| 30 to 34 Minutes | 1,052 (12.4%) | 807 (12.1%) |
| 35 to 39 Minutes | 297 (3.5%) | 171 (2.6%) |
| 40 to 44 Minutes | 403 (4.8%) | 70 (1.1%) |
| 45 to 59 Minutes | 1,583 (18.7%) | 945 (14.2%) |
| 60 to 89 Minutes | 798 (9.4%) | 267 (4.0%) |
| 90 or more Minutes | 362 (4.3%) | 191 (2.9%) |
Time of Departure to Work by Sex in Oswego
The most frequent times of departure to work in Oswego are 6:00 AM to 6:29 AM (1,393, 16.4%) for males and 7:00 AM to 7:29 AM (1,246, 18.7%) for females.
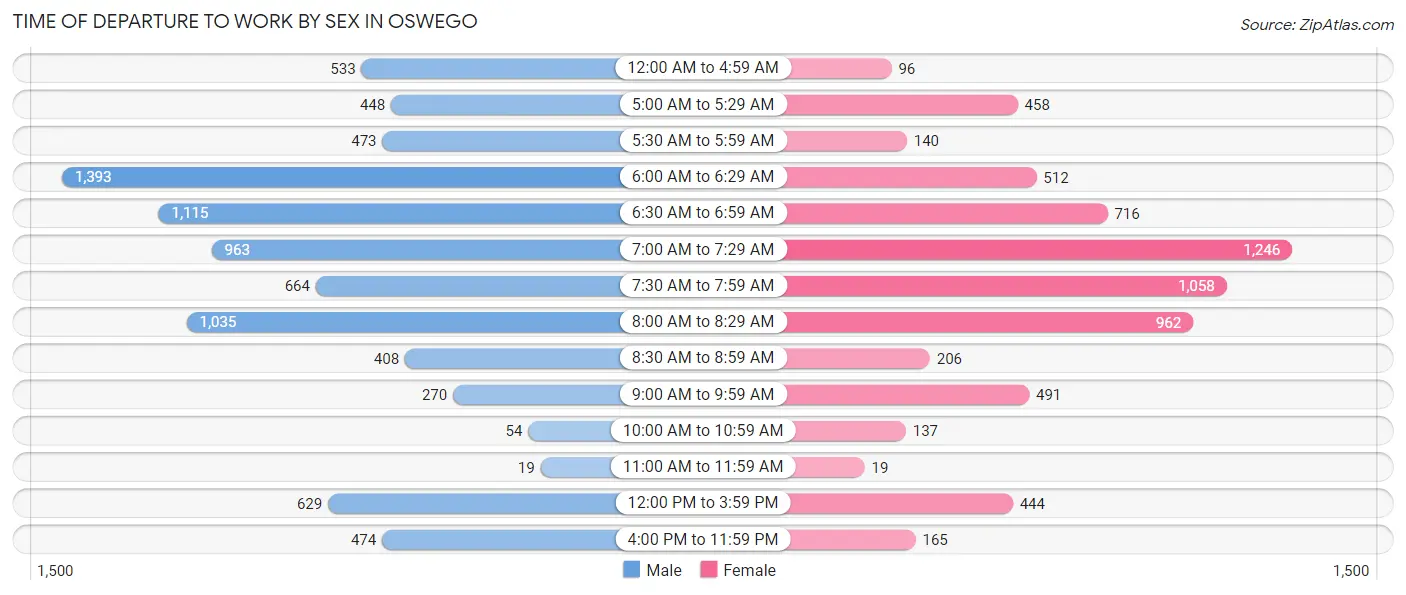
| Time of Departure | Male | Female |
| 12:00 AM to 4:59 AM | 533 (6.3%) | 96 (1.4%) |
| 5:00 AM to 5:29 AM | 448 (5.3%) | 458 (6.9%) |
| 5:30 AM to 5:59 AM | 473 (5.6%) | 140 (2.1%) |
| 6:00 AM to 6:29 AM | 1,393 (16.4%) | 512 (7.7%) |
| 6:30 AM to 6:59 AM | 1,115 (13.2%) | 716 (10.8%) |
| 7:00 AM to 7:29 AM | 963 (11.4%) | 1,246 (18.7%) |
| 7:30 AM to 7:59 AM | 664 (7.8%) | 1,058 (15.9%) |
| 8:00 AM to 8:29 AM | 1,035 (12.2%) | 962 (14.5%) |
| 8:30 AM to 8:59 AM | 408 (4.8%) | 206 (3.1%) |
| 9:00 AM to 9:59 AM | 270 (3.2%) | 491 (7.4%) |
| 10:00 AM to 10:59 AM | 54 (0.6%) | 137 (2.1%) |
| 11:00 AM to 11:59 AM | 19 (0.2%) | 19 (0.3%) |
| 12:00 PM to 3:59 PM | 629 (7.4%) | 444 (6.7%) |
| 4:00 PM to 11:59 PM | 474 (5.6%) | 165 (2.5%) |
| Total | 8,478 (100.0%) | 6,650 (100.0%) |
Housing Occupancy in Oswego
Occupancy by Ownership in Oswego
Of the total 12,203 dwellings in Oswego, owner-occupied units account for 10,784 (88.4%), while renter-occupied units make up 1,419 (11.6%).
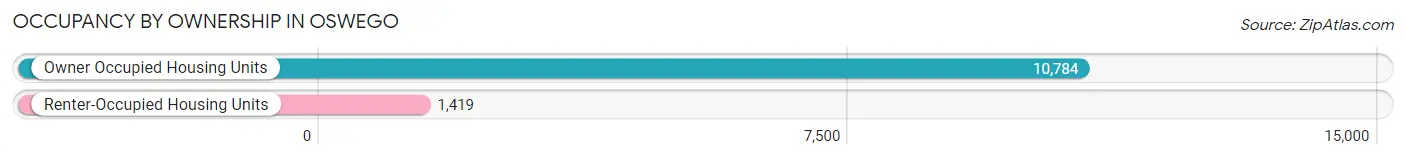
| Occupancy | # Housing Units | % Housing Units |
| Owner Occupied Housing Units | 10,784 | 88.4% |
| Renter-Occupied Housing Units | 1,419 | 11.6% |
| Total Occupied Housing Units | 12,203 | 100.0% |
Occupancy by Household Size in Oswego
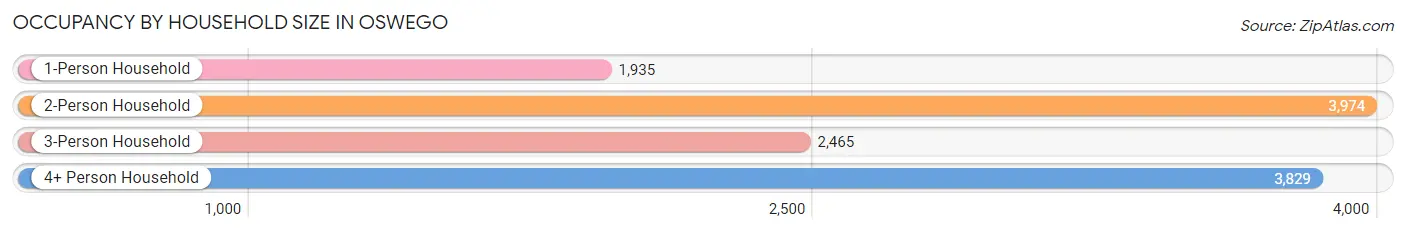
| Household Size | # Housing Units | % Housing Units |
| 1-Person Household | 1,935 | 15.9% |
| 2-Person Household | 3,974 | 32.6% |
| 3-Person Household | 2,465 | 20.2% |
| 4+ Person Household | 3,829 | 31.4% |
| Total Housing Units | 12,203 | 100.0% |
Occupancy by Ownership by Household Size in Oswego
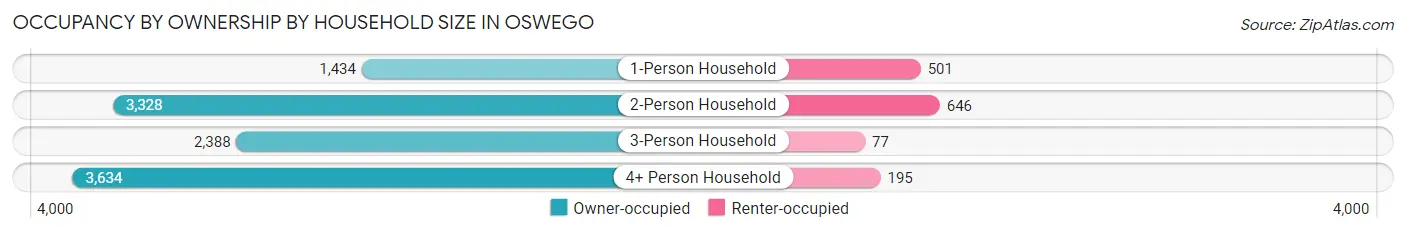
| Household Size | Owner-occupied | Renter-occupied |
| 1-Person Household | 1,434 (74.1%) | 501 (25.9%) |
| 2-Person Household | 3,328 (83.7%) | 646 (16.3%) |
| 3-Person Household | 2,388 (96.9%) | 77 (3.1%) |
| 4+ Person Household | 3,634 (94.9%) | 195 (5.1%) |
| Total Housing Units | 10,784 (88.4%) | 1,419 (11.6%) |
Occupancy by Educational Attainment in Oswego
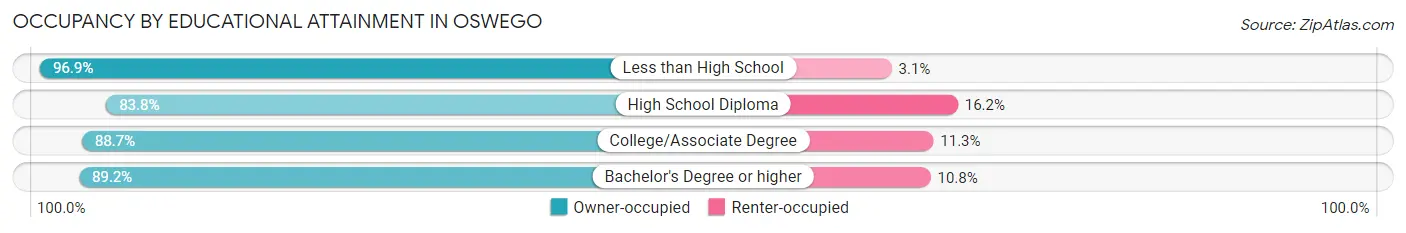
| Household Size | Owner-occupied | Renter-occupied |
| Less than High School | 349 (96.9%) | 11 (3.1%) |
| High School Diploma | 1,651 (83.8%) | 319 (16.2%) |
| College/Associate Degree | 3,941 (88.7%) | 504 (11.3%) |
| Bachelor's Degree or higher | 4,843 (89.2%) | 585 (10.8%) |
Occupancy by Age of Householder in Oswego
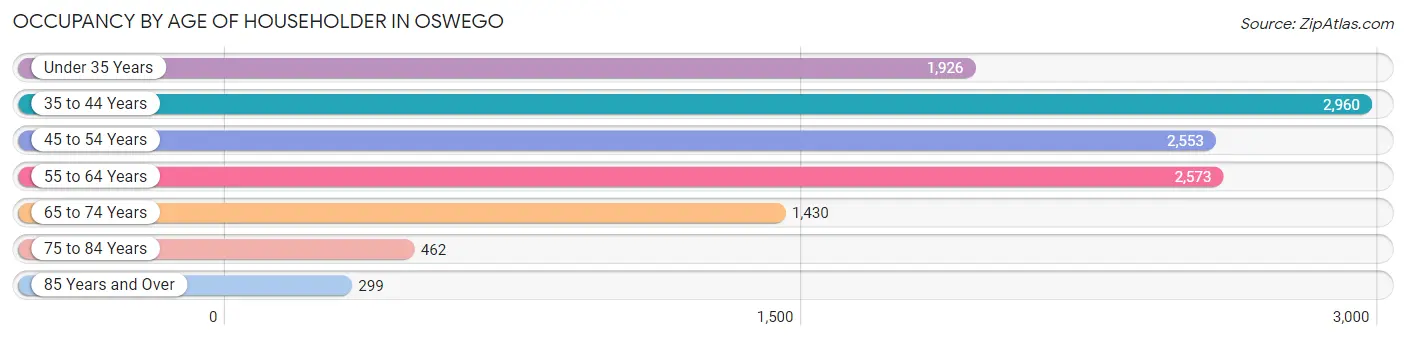
| Age Bracket | # Households | % Households |
| Under 35 Years | 1,926 | 15.8% |
| 35 to 44 Years | 2,960 | 24.3% |
| 45 to 54 Years | 2,553 | 20.9% |
| 55 to 64 Years | 2,573 | 21.1% |
| 65 to 74 Years | 1,430 | 11.7% |
| 75 to 84 Years | 462 | 3.8% |
| 85 Years and Over | 299 | 2.5% |
| Total | 12,203 | 100.0% |
Housing Finances in Oswego
Median Income by Occupancy in Oswego
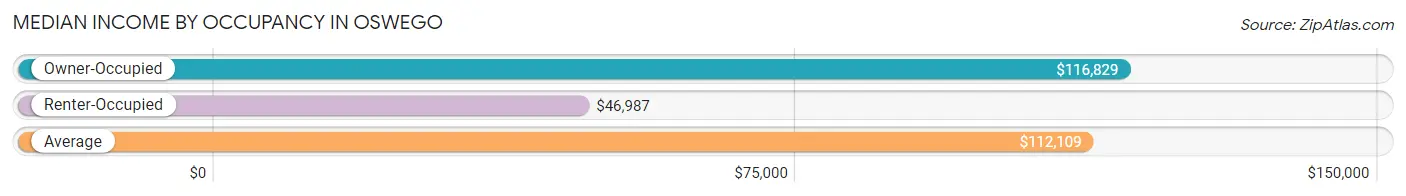
| Occupancy Type | # Households | Median Income |
| Owner-Occupied | 10,784 (88.4%) | $116,829 |
| Renter-Occupied | 1,419 (11.6%) | $46,987 |
| Average | 12,203 (100.0%) | $112,109 |
Occupancy by Householder Income Bracket in Oswego
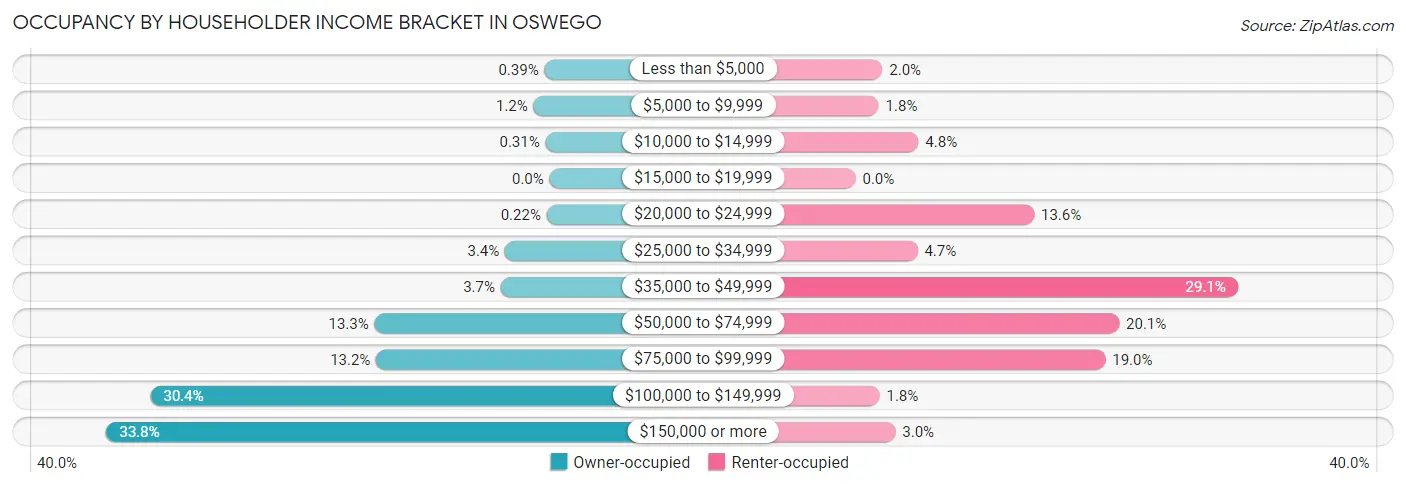
| Income Bracket | Owner-occupied | Renter-occupied |
| Less than $5,000 | 42 (0.4%) | 29 (2.0%) |
| $5,000 to $9,999 | 132 (1.2%) | 25 (1.8%) |
| $10,000 to $14,999 | 33 (0.3%) | 68 (4.8%) |
| $15,000 to $19,999 | 0 (0.0%) | 0 (0.0%) |
| $20,000 to $24,999 | 24 (0.2%) | 193 (13.6%) |
| $25,000 to $34,999 | 366 (3.4%) | 67 (4.7%) |
| $35,000 to $49,999 | 401 (3.7%) | 413 (29.1%) |
| $50,000 to $74,999 | 1,439 (13.3%) | 285 (20.1%) |
| $75,000 to $99,999 | 1,425 (13.2%) | 270 (19.0%) |
| $100,000 to $149,999 | 3,280 (30.4%) | 26 (1.8%) |
| $150,000 or more | 3,642 (33.8%) | 43 (3.0%) |
| Total | 10,784 (100.0%) | 1,419 (100.0%) |
Monthly Housing Cost Tiers in Oswego
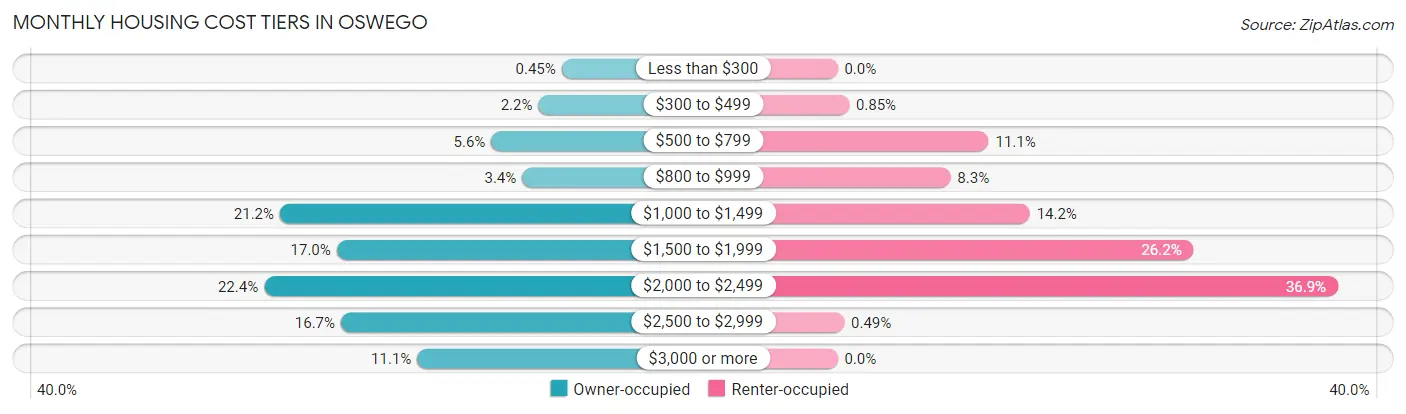
| Monthly Cost | Owner-occupied | Renter-occupied |
| Less than $300 | 49 (0.4%) | 0 (0.0%) |
| $300 to $499 | 234 (2.2%) | 12 (0.9%) |
| $500 to $799 | 608 (5.6%) | 158 (11.1%) |
| $800 to $999 | 362 (3.4%) | 118 (8.3%) |
| $1,000 to $1,499 | 2,286 (21.2%) | 201 (14.2%) |
| $1,500 to $1,999 | 1,835 (17.0%) | 372 (26.2%) |
| $2,000 to $2,499 | 2,412 (22.4%) | 523 (36.9%) |
| $2,500 to $2,999 | 1,802 (16.7%) | 7 (0.5%) |
| $3,000 or more | 1,196 (11.1%) | 0 (0.0%) |
| Total | 10,784 (100.0%) | 1,419 (100.0%) |
Physical Housing Characteristics in Oswego
Housing Structures in Oswego
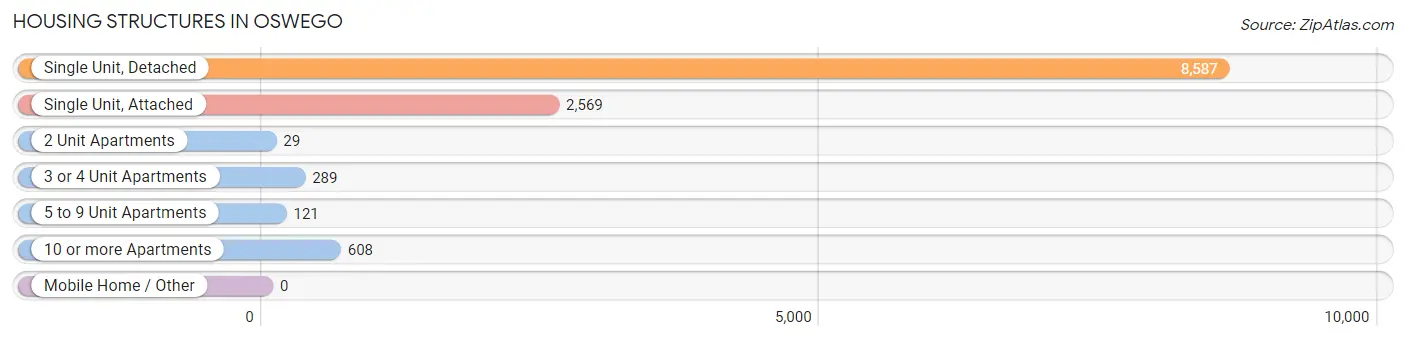
| Structure Type | # Housing Units | % Housing Units |
| Single Unit, Detached | 8,587 | 70.4% |
| Single Unit, Attached | 2,569 | 21.0% |
| 2 Unit Apartments | 29 | 0.2% |
| 3 or 4 Unit Apartments | 289 | 2.4% |
| 5 to 9 Unit Apartments | 121 | 1.0% |
| 10 or more Apartments | 608 | 5.0% |
| Mobile Home / Other | 0 | 0.0% |
| Total | 12,203 | 100.0% |
Housing Structures by Occupancy in Oswego
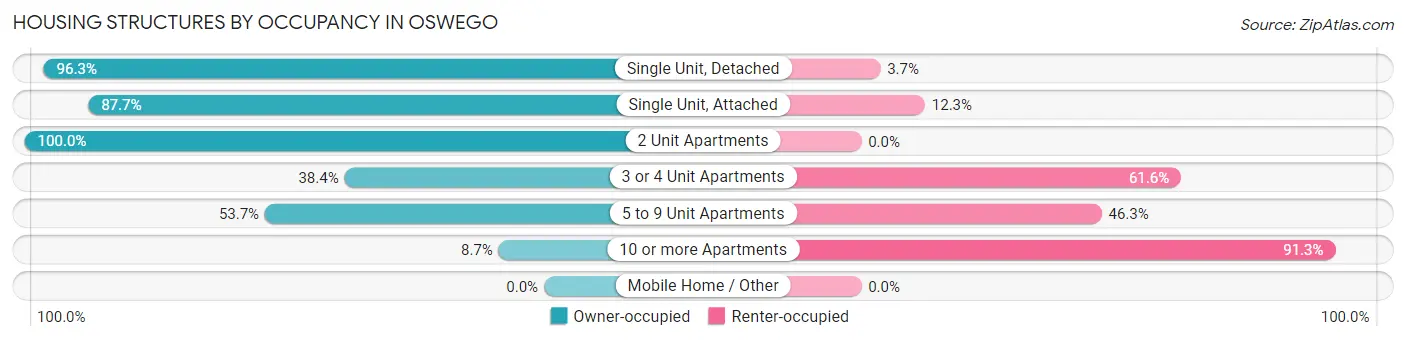
| Structure Type | Owner-occupied | Renter-occupied |
| Single Unit, Detached | 8,272 (96.3%) | 315 (3.7%) |
| Single Unit, Attached | 2,254 (87.7%) | 315 (12.3%) |
| 2 Unit Apartments | 29 (100.0%) | 0 (0.0%) |
| 3 or 4 Unit Apartments | 111 (38.4%) | 178 (61.6%) |
| 5 to 9 Unit Apartments | 65 (53.7%) | 56 (46.3%) |
| 10 or more Apartments | 53 (8.7%) | 555 (91.3%) |
| Mobile Home / Other | 0 (0.0%) | 0 (0.0%) |
| Total | 10,784 (88.4%) | 1,419 (11.6%) |
Housing Structures by Number of Rooms in Oswego
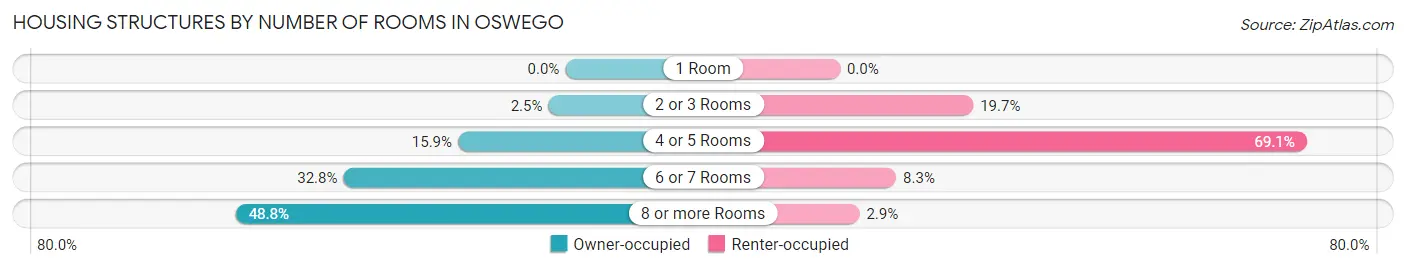
| Number of Rooms | Owner-occupied | Renter-occupied |
| 1 Room | 0 (0.0%) | 0 (0.0%) |
| 2 or 3 Rooms | 271 (2.5%) | 280 (19.7%) |
| 4 or 5 Rooms | 1,714 (15.9%) | 980 (69.1%) |
| 6 or 7 Rooms | 3,541 (32.8%) | 118 (8.3%) |
| 8 or more Rooms | 5,258 (48.8%) | 41 (2.9%) |
| Total | 10,784 (100.0%) | 1,419 (100.0%) |
Housing Structure by Heating Type in Oswego
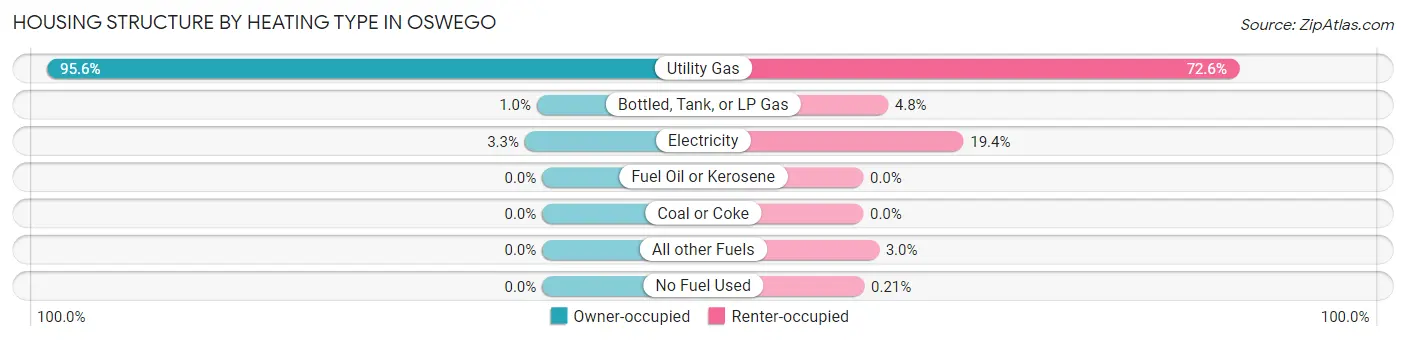
| Heating Type | Owner-occupied | Renter-occupied |
| Utility Gas | 10,313 (95.6%) | 1,030 (72.6%) |
| Bottled, Tank, or LP Gas | 111 (1.0%) | 68 (4.8%) |
| Electricity | 360 (3.3%) | 275 (19.4%) |
| Fuel Oil or Kerosene | 0 (0.0%) | 0 (0.0%) |
| Coal or Coke | 0 (0.0%) | 0 (0.0%) |
| All other Fuels | 0 (0.0%) | 43 (3.0%) |
| No Fuel Used | 0 (0.0%) | 3 (0.2%) |
| Total | 10,784 (100.0%) | 1,419 (100.0%) |
Household Vehicle Usage in Oswego
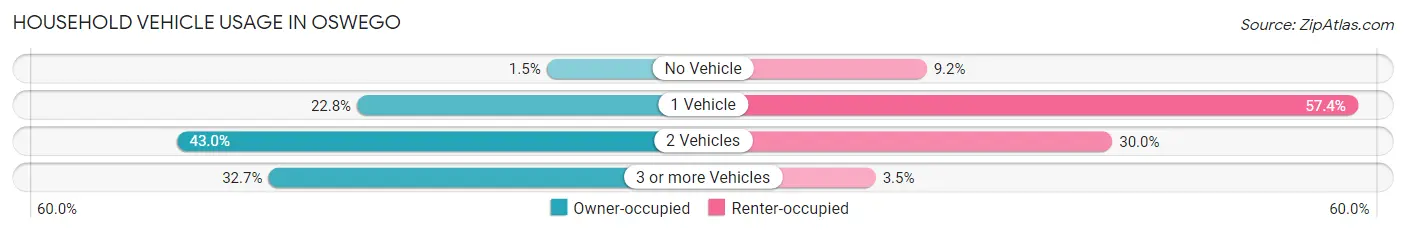
| Vehicles per Household | Owner-occupied | Renter-occupied |
| No Vehicle | 166 (1.5%) | 130 (9.2%) |
| 1 Vehicle | 2,456 (22.8%) | 815 (57.4%) |
| 2 Vehicles | 4,635 (43.0%) | 425 (29.9%) |
| 3 or more Vehicles | 3,527 (32.7%) | 49 (3.5%) |
| Total | 10,784 (100.0%) | 1,419 (100.0%) |
Real Estate & Mortgages in Oswego
Real Estate and Mortgage Overview in Oswego
| Characteristic | Without Mortgage | With Mortgage |
| Housing Units | 2,218 | 8,566 |
| Median Property Value | $298,100 | $301,000 |
| Median Household Income | $105,532 | $3,191 |
| Monthly Housing Costs | $962 | $1,170 |
| Real Estate Taxes | $7,677 | $9 |
Property Value by Mortgage Status in Oswego
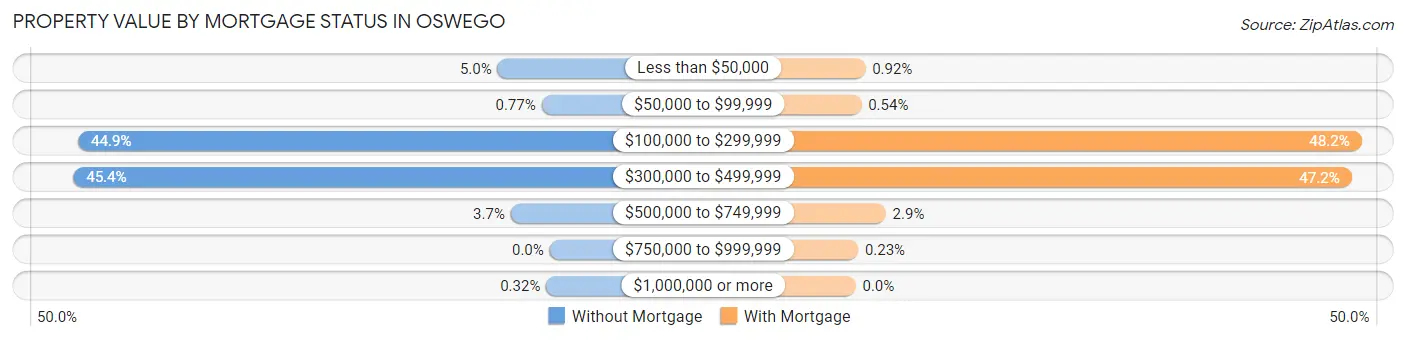
| Property Value | Without Mortgage | With Mortgage |
| Less than $50,000 | 110 (5.0%) | 79 (0.9%) |
| $50,000 to $99,999 | 17 (0.8%) | 46 (0.5%) |
| $100,000 to $299,999 | 996 (44.9%) | 4,128 (48.2%) |
| $300,000 to $499,999 | 1,006 (45.4%) | 4,047 (47.2%) |
| $500,000 to $749,999 | 82 (3.7%) | 246 (2.9%) |
| $750,000 to $999,999 | 0 (0.0%) | 20 (0.2%) |
| $1,000,000 or more | 7 (0.3%) | 0 (0.0%) |
| Total | 2,218 (100.0%) | 8,566 (100.0%) |
Household Income by Mortgage Status in Oswego
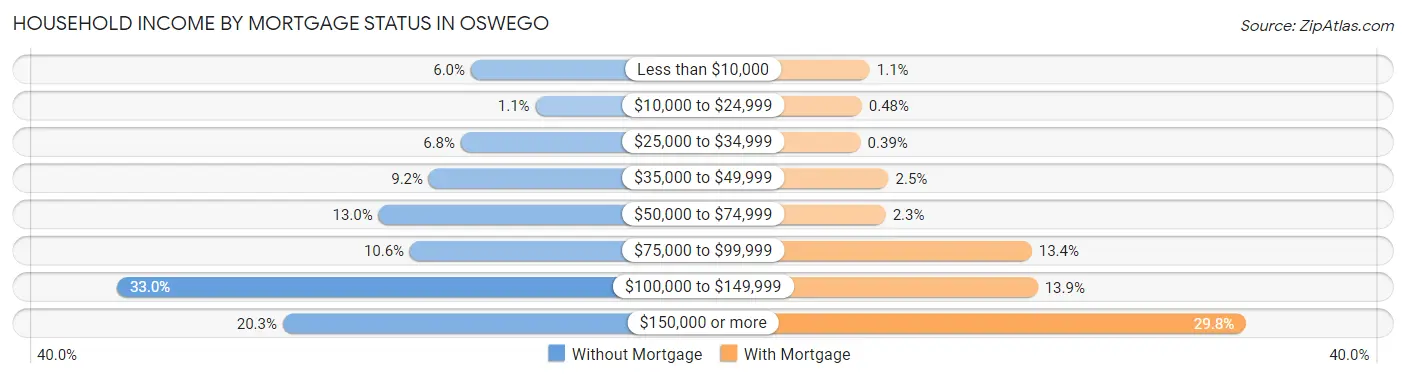
| Household Income | Without Mortgage | With Mortgage |
| Less than $10,000 | 133 (6.0%) | 93 (1.1%) |
| $10,000 to $24,999 | 24 (1.1%) | 41 (0.5%) |
| $25,000 to $34,999 | 150 (6.8%) | 33 (0.4%) |
| $35,000 to $49,999 | 204 (9.2%) | 216 (2.5%) |
| $50,000 to $74,999 | 289 (13.0%) | 197 (2.3%) |
| $75,000 to $99,999 | 236 (10.6%) | 1,150 (13.4%) |
| $100,000 to $149,999 | 731 (33.0%) | 1,189 (13.9%) |
| $150,000 or more | 451 (20.3%) | 2,549 (29.8%) |
| Total | 2,218 (100.0%) | 8,566 (100.0%) |
Property Value to Household Income Ratio in Oswego
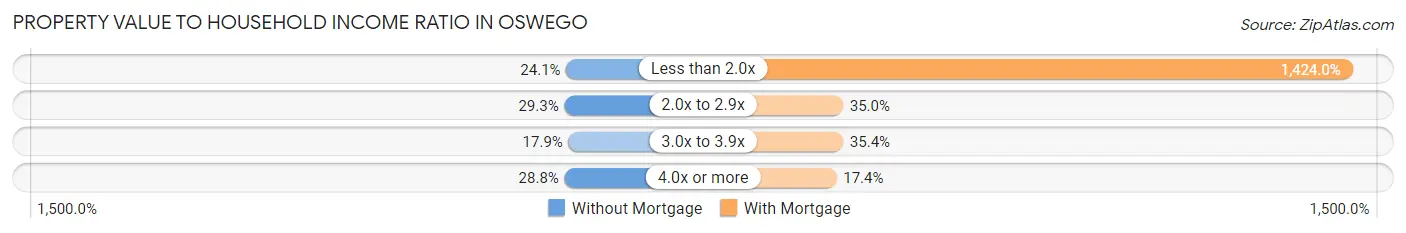
| Value-to-Income Ratio | Without Mortgage | With Mortgage |
| Less than 2.0x | 534 (24.1%) | 121,981 (1,424.0%) |
| 2.0x to 2.9x | 649 (29.3%) | 2,997 (35.0%) |
| 3.0x to 3.9x | 396 (17.8%) | 3,034 (35.4%) |
| 4.0x or more | 639 (28.8%) | 1,489 (17.4%) |
| Total | 2,218 (100.0%) | 8,566 (100.0%) |
Real Estate Taxes by Mortgage Status in Oswego
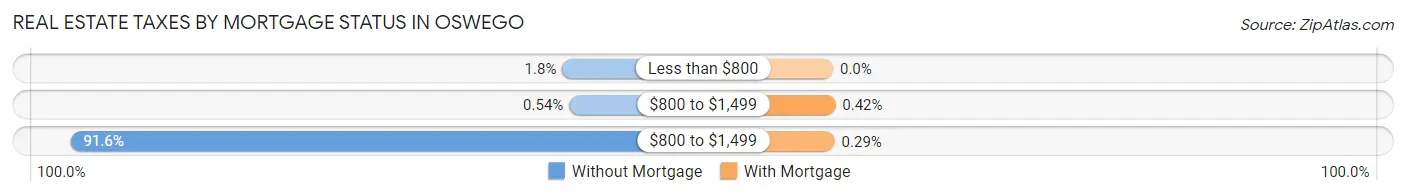
| Property Taxes | Without Mortgage | With Mortgage |
| Less than $800 | 40 (1.8%) | 0 (0.0%) |
| $800 to $1,499 | 12 (0.5%) | 36 (0.4%) |
| $800 to $1,499 | 2,032 (91.6%) | 25 (0.3%) |
| Total | 2,218 (100.0%) | 8,566 (100.0%) |
Health & Disability in Oswego
Health Insurance Coverage by Age in Oswego
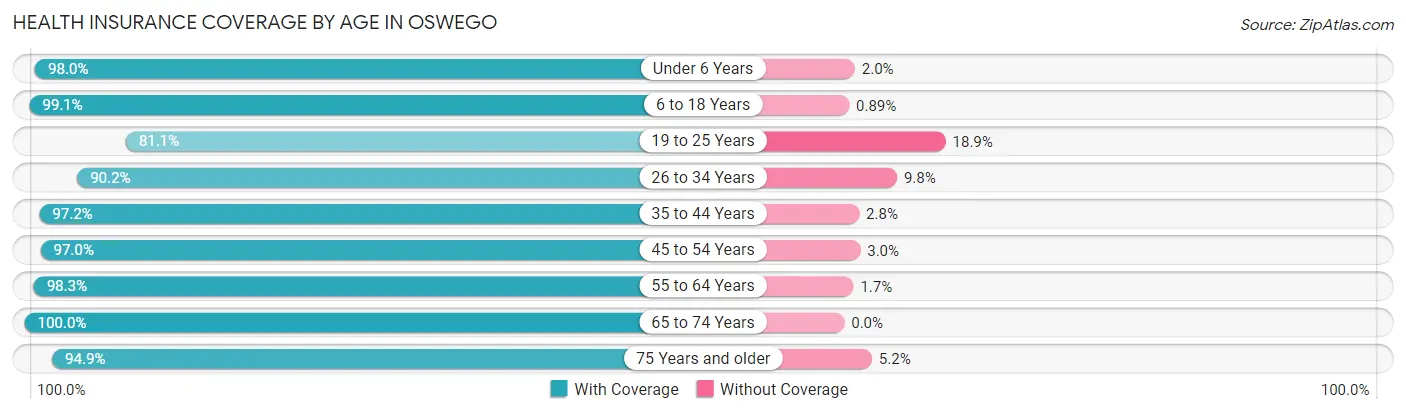
| Age Bracket | With Coverage | Without Coverage |
| Under 6 Years | 2,140 (98.0%) | 43 (2.0%) |
| 6 to 18 Years | 7,771 (99.1%) | 70 (0.9%) |
| 19 to 25 Years | 2,010 (81.1%) | 468 (18.9%) |
| 26 to 34 Years | 2,811 (90.2%) | 306 (9.8%) |
| 35 to 44 Years | 5,291 (97.2%) | 151 (2.8%) |
| 45 to 54 Years | 5,077 (97.0%) | 156 (3.0%) |
| 55 to 64 Years | 4,254 (98.3%) | 74 (1.7%) |
| 65 to 74 Years | 2,418 (100.0%) | 0 (0.0%) |
| 75 Years and older | 1,603 (94.9%) | 87 (5.1%) |
| Total | 33,375 (96.1%) | 1,355 (3.9%) |
Health Insurance Coverage by Citizenship Status in Oswego
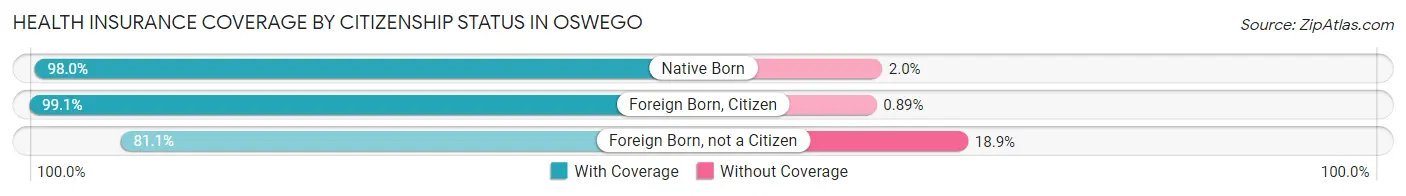
| Citizenship Status | With Coverage | Without Coverage |
| Native Born | 2,140 (98.0%) | 43 (2.0%) |
| Foreign Born, Citizen | 7,771 (99.1%) | 70 (0.9%) |
| Foreign Born, not a Citizen | 2,010 (81.1%) | 468 (18.9%) |
Health Insurance Coverage by Household Income in Oswego
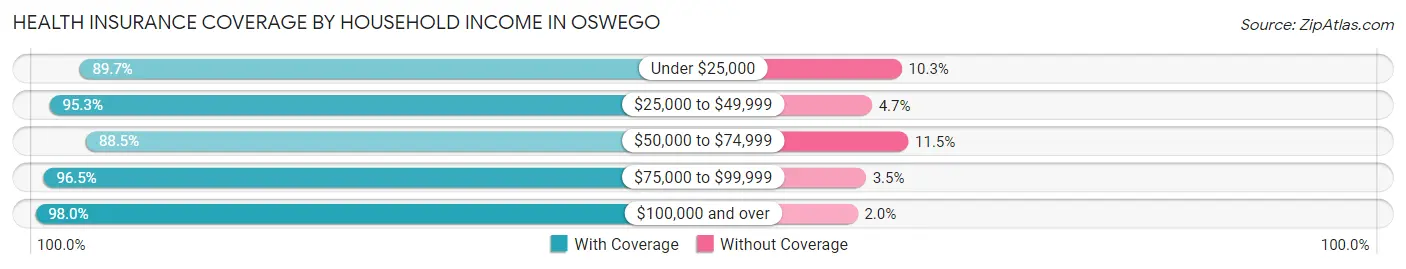
| Household Income | With Coverage | Without Coverage |
| Under $25,000 | 759 (89.7%) | 87 (10.3%) |
| $25,000 to $49,999 | 2,104 (95.3%) | 103 (4.7%) |
| $50,000 to $74,999 | 4,261 (88.5%) | 553 (11.5%) |
| $75,000 to $99,999 | 4,685 (96.5%) | 172 (3.5%) |
| $100,000 and over | 21,564 (98.0%) | 440 (2.0%) |
Public vs Private Health Insurance Coverage by Age in Oswego
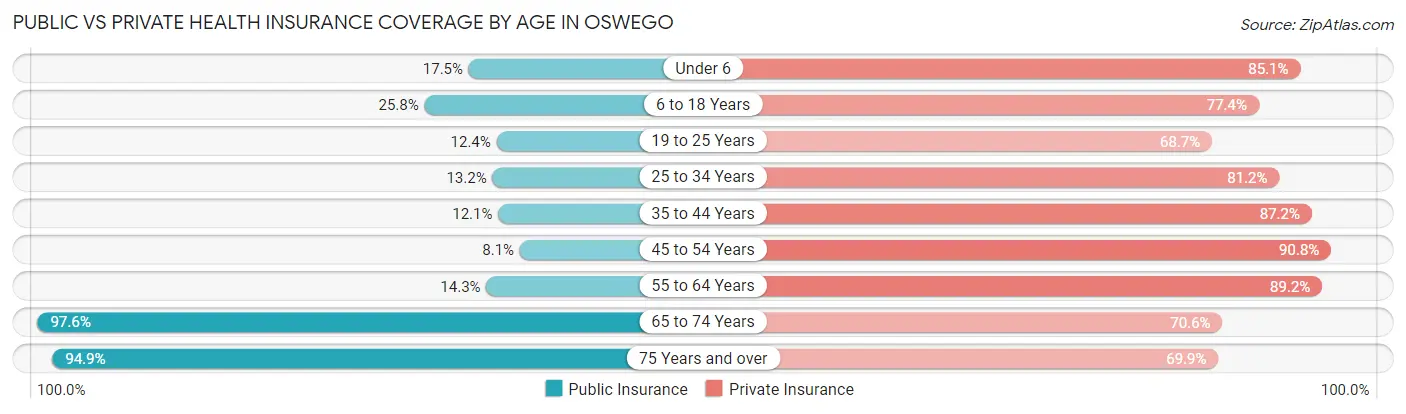
| Age Bracket | Public Insurance | Private Insurance |
| Under 6 | 383 (17.5%) | 1,858 (85.1%) |
| 6 to 18 Years | 2,020 (25.8%) | 6,069 (77.4%) |
| 19 to 25 Years | 307 (12.4%) | 1,703 (68.7%) |
| 25 to 34 Years | 410 (13.2%) | 2,531 (81.2%) |
| 35 to 44 Years | 657 (12.1%) | 4,747 (87.2%) |
| 45 to 54 Years | 422 (8.1%) | 4,753 (90.8%) |
| 55 to 64 Years | 618 (14.3%) | 3,859 (89.2%) |
| 65 to 74 Years | 2,360 (97.6%) | 1,708 (70.6%) |
| 75 Years and over | 1,603 (94.9%) | 1,181 (69.9%) |
| Total | 8,780 (25.3%) | 28,409 (81.8%) |
Disability Status by Sex by Age in Oswego
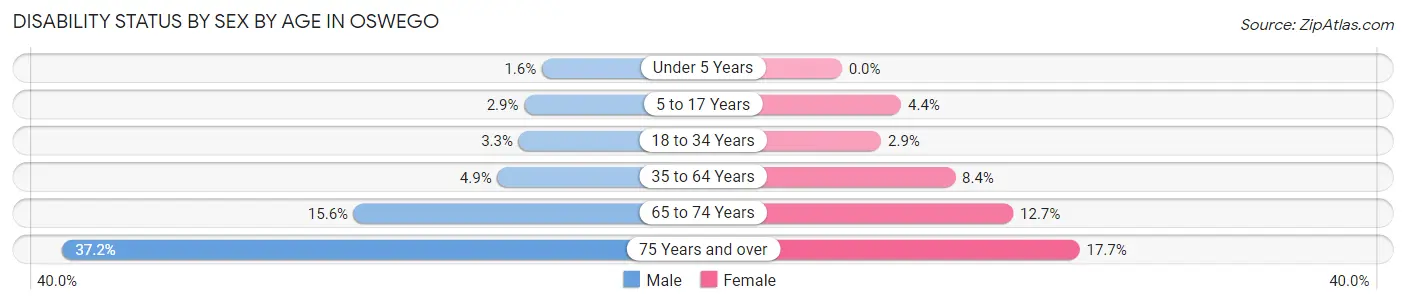
| Age Bracket | Male | Female |
| Under 5 Years | 14 (1.6%) | 0 (0.0%) |
| 5 to 17 Years | 109 (2.9%) | 167 (4.4%) |
| 18 to 34 Years | 106 (3.3%) | 86 (2.9%) |
| 35 to 64 Years | 362 (4.9%) | 639 (8.4%) |
| 65 to 74 Years | 167 (15.5%) | 171 (12.7%) |
| 75 Years and over | 283 (37.2%) | 164 (17.6%) |
Disability Class by Sex by Age in Oswego
Disability Class: Hearing Difficulty
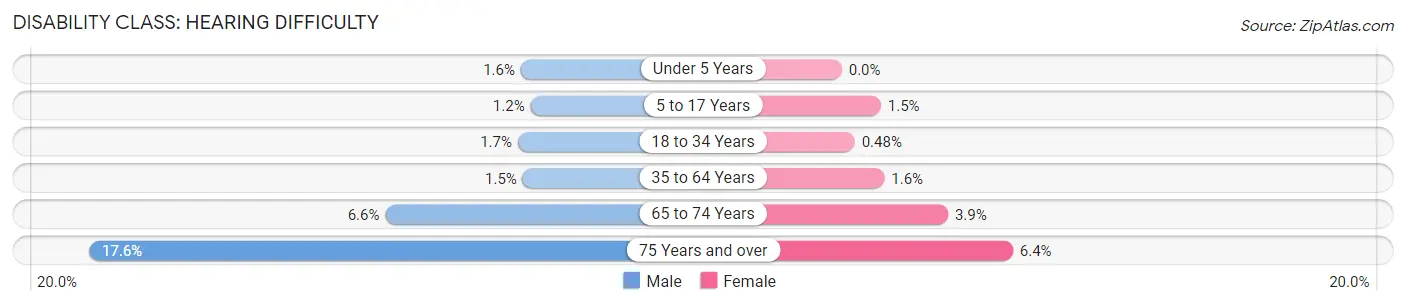
| Age Bracket | Male | Female |
| Under 5 Years | 14 (1.6%) | 0 (0.0%) |
| 5 to 17 Years | 46 (1.2%) | 55 (1.5%) |
| 18 to 34 Years | 54 (1.7%) | 14 (0.5%) |
| 35 to 64 Years | 112 (1.5%) | 120 (1.6%) |
| 65 to 74 Years | 71 (6.6%) | 53 (3.9%) |
| 75 Years and over | 134 (17.6%) | 59 (6.4%) |
Disability Class: Vision Difficulty
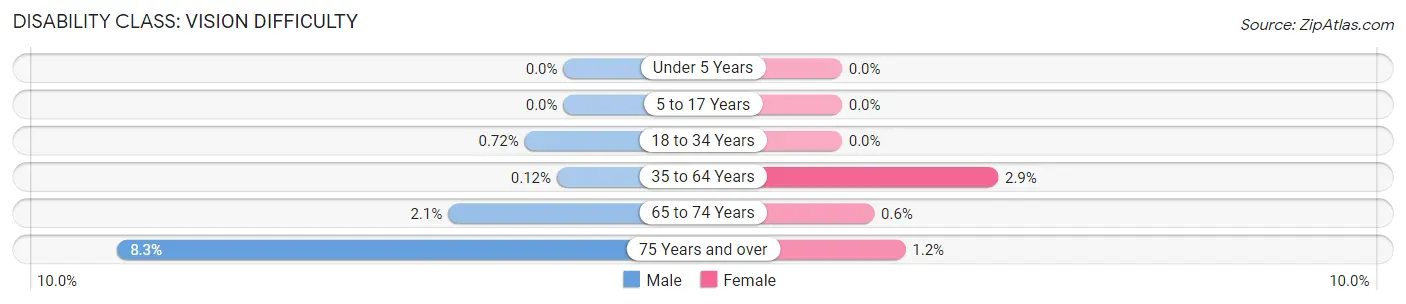
| Age Bracket | Male | Female |
| Under 5 Years | 0 (0.0%) | 0 (0.0%) |
| 5 to 17 Years | 0 (0.0%) | 0 (0.0%) |
| 18 to 34 Years | 23 (0.7%) | 0 (0.0%) |
| 35 to 64 Years | 9 (0.1%) | 220 (2.9%) |
| 65 to 74 Years | 23 (2.1%) | 8 (0.6%) |
| 75 Years and over | 63 (8.3%) | 11 (1.2%) |
Disability Class: Cognitive Difficulty
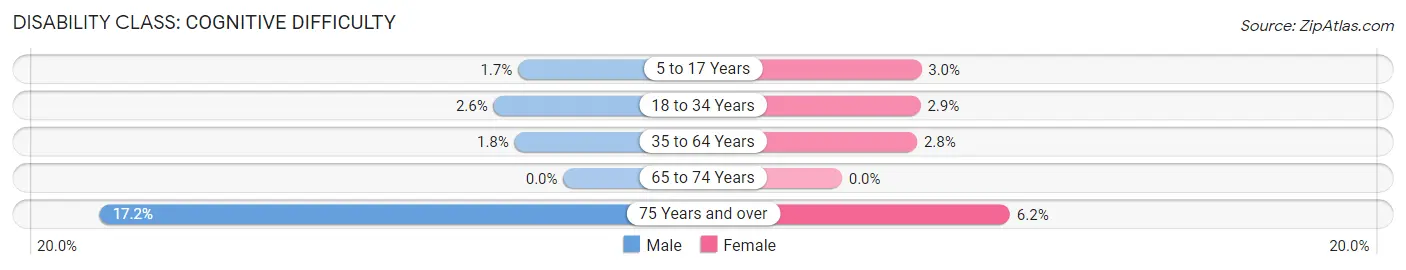
| Age Bracket | Male | Female |
| 5 to 17 Years | 63 (1.7%) | 112 (2.9%) |
| 18 to 34 Years | 83 (2.6%) | 86 (2.9%) |
| 35 to 64 Years | 134 (1.8%) | 212 (2.8%) |
| 65 to 74 Years | 0 (0.0%) | 0 (0.0%) |
| 75 Years and over | 131 (17.2%) | 58 (6.2%) |
Disability Class: Ambulatory Difficulty
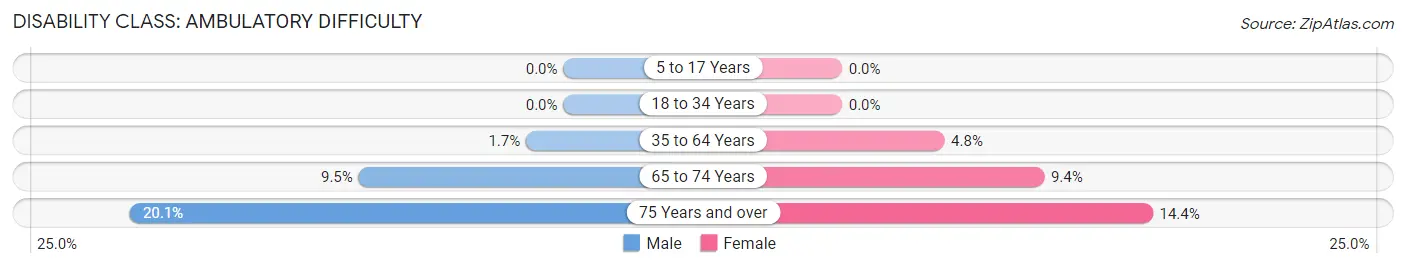
| Age Bracket | Male | Female |
| 5 to 17 Years | 0 (0.0%) | 0 (0.0%) |
| 18 to 34 Years | 0 (0.0%) | 0 (0.0%) |
| 35 to 64 Years | 128 (1.7%) | 361 (4.8%) |
| 65 to 74 Years | 102 (9.5%) | 126 (9.4%) |
| 75 Years and over | 153 (20.1%) | 134 (14.4%) |
Disability Class: Self-Care Difficulty
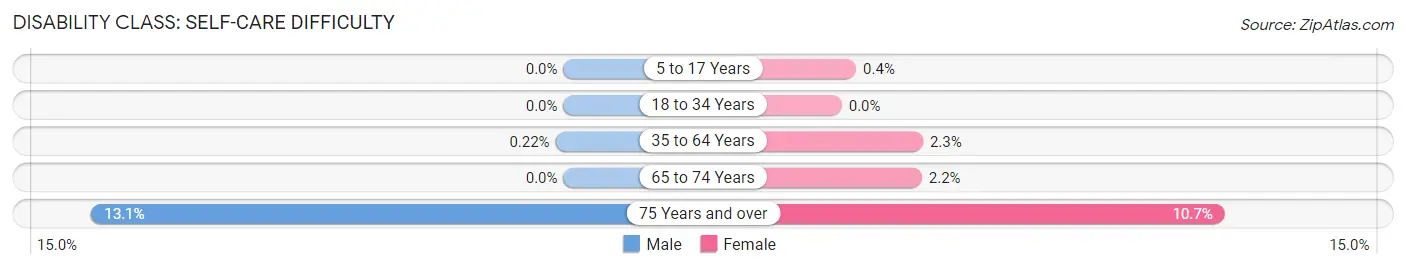
| Age Bracket | Male | Female |
| 5 to 17 Years | 0 (0.0%) | 15 (0.4%) |
| 18 to 34 Years | 0 (0.0%) | 0 (0.0%) |
| 35 to 64 Years | 16 (0.2%) | 172 (2.3%) |
| 65 to 74 Years | 0 (0.0%) | 30 (2.2%) |
| 75 Years and over | 100 (13.1%) | 99 (10.7%) |
Technology Access in Oswego
Computing Device Access in Oswego
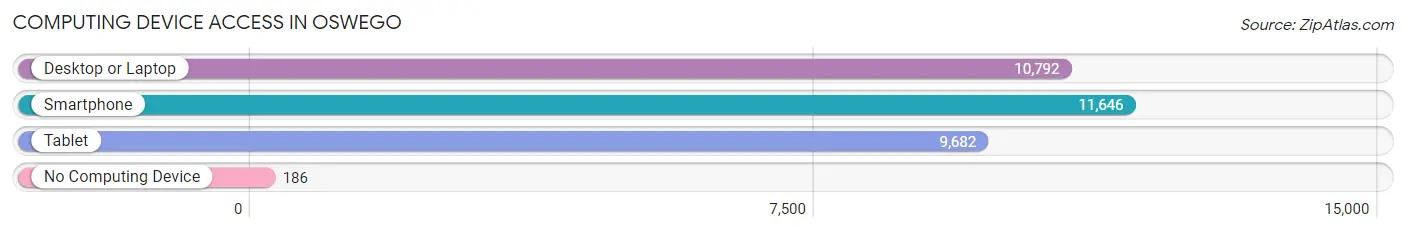
| Device Type | # Households | % Households |
| Desktop or Laptop | 10,792 | 88.4% |
| Smartphone | 11,646 | 95.4% |
| Tablet | 9,682 | 79.3% |
| No Computing Device | 186 | 1.5% |
| Total | 12,203 | 100.0% |
Internet Access in Oswego
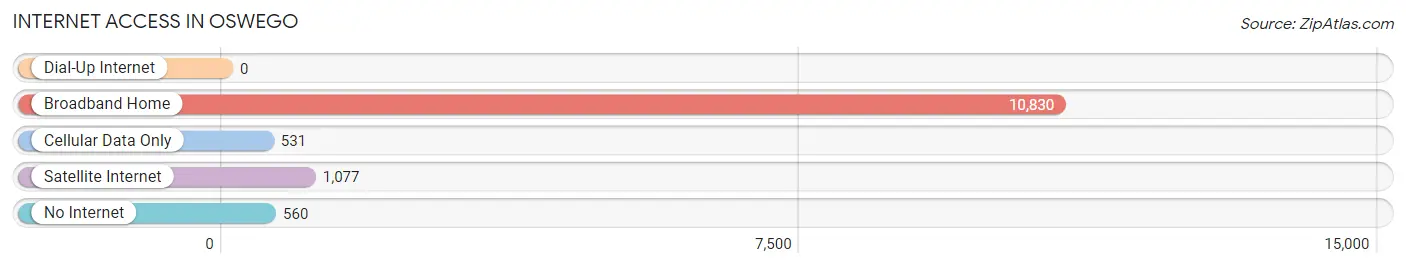
| Internet Type | # Households | % Households |
| Dial-Up Internet | 0 | 0.0% |
| Broadband Home | 10,830 | 88.7% |
| Cellular Data Only | 531 | 4.3% |
| Satellite Internet | 1,077 | 8.8% |
| No Internet | 560 | 4.6% |
| Total | 12,203 | 100.0% |
Oswego Summary
Oswego, IL is a village located in Kendall County, Illinois, United States. The population was 30,355 at the 2010 census, making it the largest village in Illinois. Oswego is a rapidly growing community located approximately 35 miles southwest of Chicago.
History
Oswego was first settled in 1833 by settlers from New York. The village was originally known as Hudson, but was renamed Oswego in 1837. The name Oswego is derived from the Iroquois word for “pouring out”, referring to the falls on the Fox River.
The village was incorporated in 1852 and was home to a variety of industries, including a flour mill, a sawmill, a grist mill, and a brickyard. The village also had a railroad station, which was a major factor in its growth.
In the late 19th century, Oswego was a popular summer resort destination for Chicagoans. The village was home to several resorts, including the Oswego Hotel, which was built in 1872 and was the largest hotel in the area.
Geography
Oswego is located in Kendall County, Illinois, approximately 35 miles southwest of Chicago. The village is situated on the Fox River, which flows through the village and is a major source of recreation for the area.
Oswego is bordered by the villages of Montgomery to the north, Yorkville to the east, and Plainfield to the south. The village is also bordered by unincorporated areas of Kendall County to the west.
The village has a total area of 8.9 square miles, of which 8.7 square miles is land and 0.2 square miles is water.
Economy
Oswego’s economy is largely based on manufacturing and retail. The village is home to several large manufacturing companies, including Caterpillar, Inc., which has a large manufacturing facility in the village.
Oswego is also home to several retail stores, including a Walmart Supercenter, a Target, and a Kohl’s. The village also has a variety of restaurants, including several fast food chains and several local restaurants.
Demographics
As of the 2010 census, there were 30,355 people, 10,945 households, and 8,072 families residing in the village. The population density was 3,457.3 people per square mile. The racial makeup of the village was 87.2% White, 4.3% African American, 0.3% Native American, 3.2% Asian, 0.1% Pacific Islander, 2.7% from other races, and 2.3% from two or more races. Hispanic or Latino of any race were 8.3% of the population.
The median income for a household in the village was $77,837, and the median income for a family was $90,945. The per capita income for the village was $32,945. About 3.2% of families and 4.7% of the population were below the poverty line, including 5.3% of those under age 18 and 4.2% of those age 65 or over.
Common Questions
What is Per Capita Income in Oswego?
Per Capita income in Oswego is $44,340.
What is the Median Family Income in Oswego?
Median Family Income in Oswego is $118,151.
What is the Median Household income in Oswego?
Median Household Income in Oswego is $112,109.
What is Income or Wage Gap in Oswego?
Income or Wage Gap in Oswego is 24.0%.
Women in Oswego earn 76.0 cents for every dollar earned by a man.
What is Inequality or Gini Index in Oswego?
Inequality or Gini Index in Oswego is 0.35.
What is the Total Population of Oswego?
Total Population of Oswego is 34,810.
What is the Total Male Population of Oswego?
Total Male Population of Oswego is 17,097.
What is the Total Female Population of Oswego?
Total Female Population of Oswego is 17,713.
What is the Ratio of Males per 100 Females in Oswego?
There are 96.52 Males per 100 Females in Oswego.
What is the Ratio of Females per 100 Males in Oswego?
There are 103.60 Females per 100 Males in Oswego.
What is the Median Population Age in Oswego?
Median Population Age in Oswego is 39.6 Years.
What is the Average Family Size in Oswego
Average Family Size in Oswego is 3.2 People.
What is the Average Household Size in Oswego
Average Household Size in Oswego is 2.9 People.
How Large is the Labor Force in Oswego?
There are 18,488 People in the Labor Forcein in Oswego.
What is the Percentage of People in the Labor Force in Oswego?
69.4% of People are in the Labor Force in Oswego.
What is the Unemployment Rate in Oswego?
Unemployment Rate in Oswego is 2.9%.