Blue Mound, IL Map & Demographics
Blue Mound Map
Blue Mound Overview
$33,249
PER CAPITA INCOME
$75,250
AVG FAMILY INCOME
$57,097
AVG HOUSEHOLD INCOME
48.2%
WAGE / INCOME GAP [ % ]
51.8¢/ $1
WAGE / INCOME GAP [ $ ]
0.34
INEQUALITY / GINI INDEX
934
TOTAL POPULATION
411
MALE POPULATION
523
FEMALE POPULATION
78.59
MALES / 100 FEMALES
127.25
FEMALES / 100 MALES
50.7
MEDIAN AGE
2.8
AVG FAMILY SIZE
2.1
AVG HOUSEHOLD SIZE
440
LABOR FORCE [ PEOPLE ]
56.8%
PERCENT IN LABOR FORCE
1.1%
UNEMPLOYMENT RATE
Blue Mound Zip Codes
Blue Mound Area Codes
Income in Blue Mound
Income Overview in Blue Mound
Per Capita Income in Blue Mound is $33,249, while median incomes of families and households are $75,250 and $57,097 respectively.
| Characteristic | Number | Measure |
| Per Capita Income | 934 | $33,249 |
| Median Family Income | 252 | $75,250 |
| Mean Family Income | 252 | $82,450 |
| Median Household Income | 450 | $57,097 |
| Mean Household Income | 450 | $69,777 |
| Income Deficit | 252 | $0 |
| Wage / Income Gap (%) | 934 | 48.24% |
| Wage / Income Gap ($) | 934 | 51.76¢ per $1 |
| Gini / Inequality Index | 934 | 0.34 |
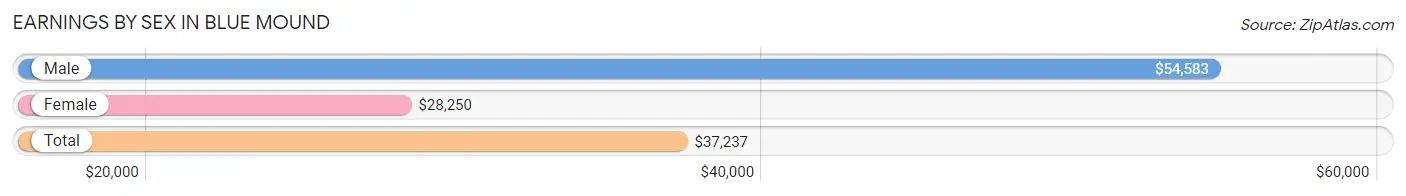
Earnings by Sex in Blue Mound
Average Earnings in Blue Mound are $37,237, $54,583 for men and $28,250 for women, a difference of 48.2%.
| Sex | Number | Average Earnings |
| Male | 208 (44.3%) | $54,583 |
| Female | 262 (55.7%) | $28,250 |
| Total | 470 (100.0%) | $37,237 |
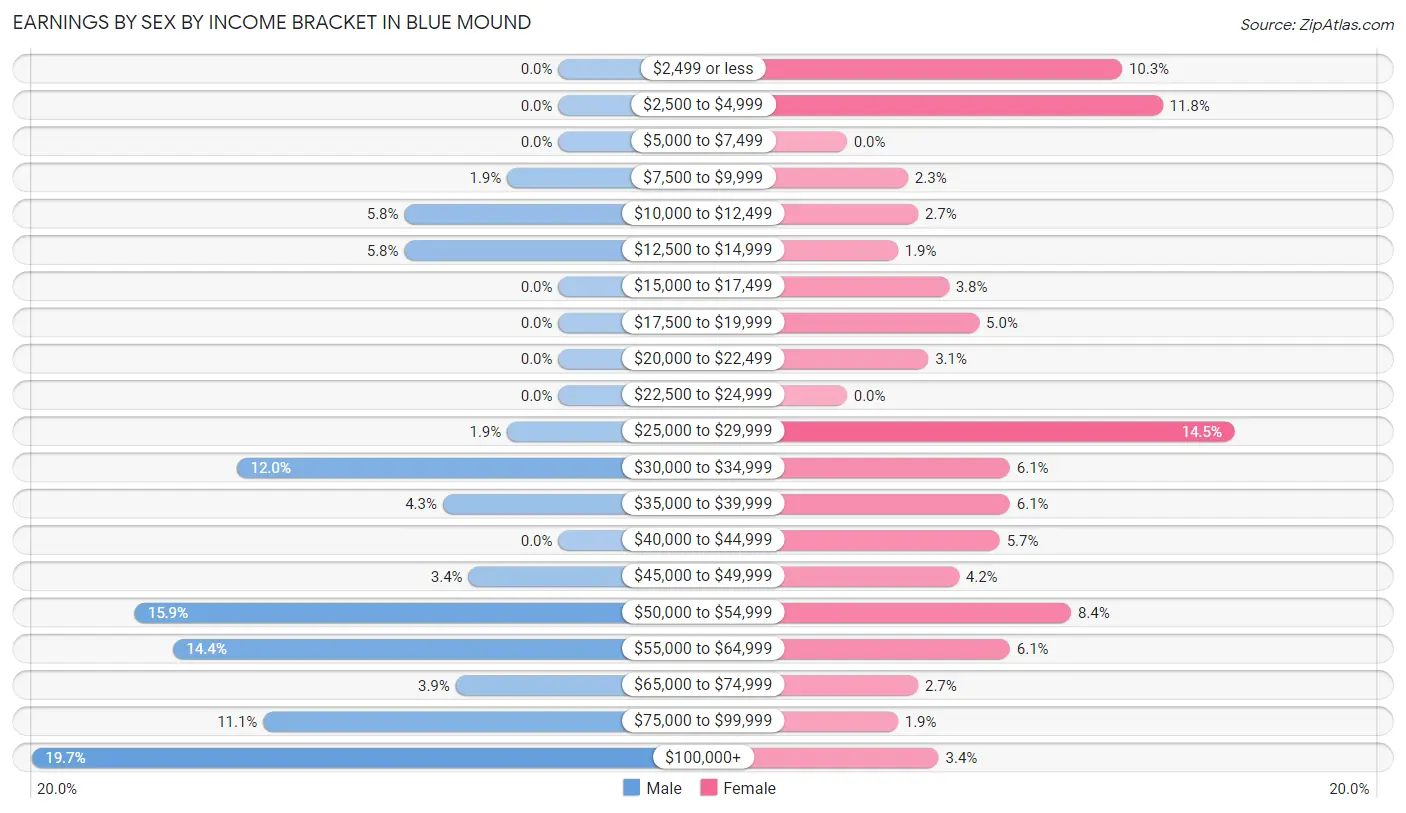
Earnings by Sex by Income Bracket in Blue Mound
The most common earnings brackets in Blue Mound are $100,000+ for men (41 | 19.7%) and $25,000 to $29,999 for women (38 | 14.5%).
| Income | Male | Female |
| $2,499 or less | 0 (0.0%) | 27 (10.3%) |
| $2,500 to $4,999 | 0 (0.0%) | 31 (11.8%) |
| $5,000 to $7,499 | 0 (0.0%) | 0 (0.0%) |
| $7,500 to $9,999 | 4 (1.9%) | 6 (2.3%) |
| $10,000 to $12,499 | 12 (5.8%) | 7 (2.7%) |
| $12,500 to $14,999 | 12 (5.8%) | 5 (1.9%) |
| $15,000 to $17,499 | 0 (0.0%) | 10 (3.8%) |
| $17,500 to $19,999 | 0 (0.0%) | 13 (5.0%) |
| $20,000 to $22,499 | 0 (0.0%) | 8 (3.0%) |
| $22,500 to $24,999 | 0 (0.0%) | 0 (0.0%) |
| $25,000 to $29,999 | 4 (1.9%) | 38 (14.5%) |
| $30,000 to $34,999 | 25 (12.0%) | 16 (6.1%) |
| $35,000 to $39,999 | 9 (4.3%) | 16 (6.1%) |
| $40,000 to $44,999 | 0 (0.0%) | 15 (5.7%) |
| $45,000 to $49,999 | 7 (3.4%) | 11 (4.2%) |
| $50,000 to $54,999 | 33 (15.9%) | 22 (8.4%) |
| $55,000 to $64,999 | 30 (14.4%) | 16 (6.1%) |
| $65,000 to $74,999 | 8 (3.8%) | 7 (2.7%) |
| $75,000 to $99,999 | 23 (11.1%) | 5 (1.9%) |
| $100,000+ | 41 (19.7%) | 9 (3.4%) |
| Total | 208 (100.0%) | 262 (100.0%) |
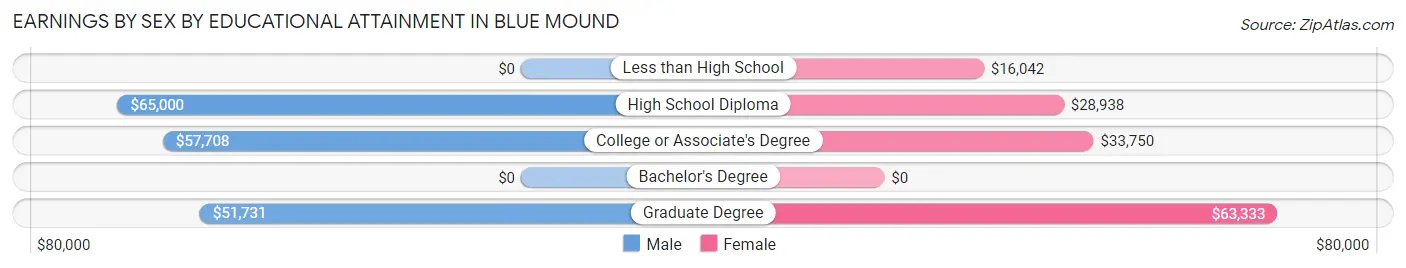
Earnings by Sex by Educational Attainment in Blue Mound
Average earnings in Blue Mound are $55,625 for men and $29,313 for women, a difference of 47.3%. Men with an educational attainment of high school diploma enjoy the highest average annual earnings of $65,000, while those with graduate degree education earn the least with $51,731. Women with an educational attainment of graduate degree earn the most with the average annual earnings of $63,333, while those with less than high school education have the smallest earnings of $16,042.
| Educational Attainment | Male Income | Female Income |
| Less than High School | - | - |
| High School Diploma | $65,000 | $28,938 |
| College or Associate's Degree | $57,708 | $33,750 |
| Bachelor's Degree | - | - |
| Graduate Degree | $51,731 | $63,333 |
| Total | $55,625 | $29,313 |
Family Income in Blue Mound
Family Income Brackets in Blue Mound
According to the Blue Mound family income data, there are 64 families falling into the $50,000 to $74,999 income range, which is the most common income bracket and makes up 25.4% of all families.
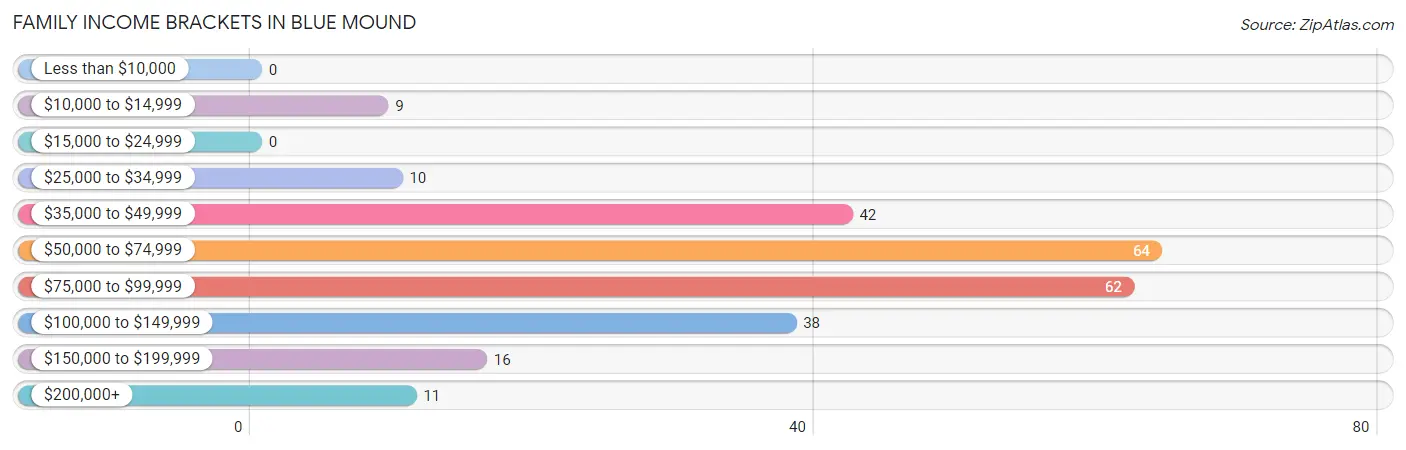
| Income Bracket | # Families | % Families |
| Less than $10,000 | 0 | 0.0% |
| $10,000 to $14,999 | 9 | 3.6% |
| $15,000 to $24,999 | 0 | 0.0% |
| $25,000 to $34,999 | 10 | 4.0% |
| $35,000 to $49,999 | 42 | 16.7% |
| $50,000 to $74,999 | 64 | 25.4% |
| $75,000 to $99,999 | 62 | 24.6% |
| $100,000 to $149,999 | 38 | 15.1% |
| $150,000 to $199,999 | 16 | 6.3% |
| $200,000+ | 11 | 4.4% |
Family Income by Famaliy Size in Blue Mound
4-person families (62 | 24.6%) account for the highest median family income in Blue Mound with $77,778 per family, while 2-person families (136 | 54.0%) have the highest median income of $33,500 per family member.
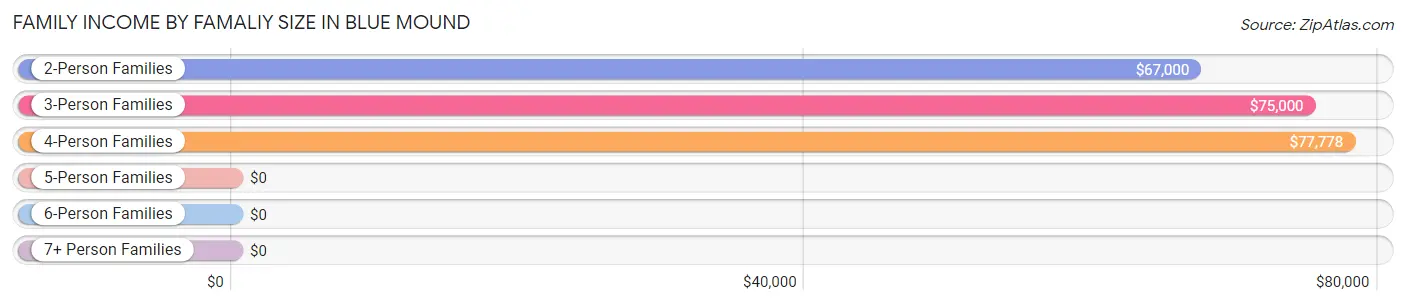
| Income Bracket | # Families | Median Income |
| 2-Person Families | 136 (54.0%) | $67,000 |
| 3-Person Families | 48 (19.1%) | $75,000 |
| 4-Person Families | 62 (24.6%) | $77,778 |
| 5-Person Families | 5 (2.0%) | $0 |
| 6-Person Families | 1 (0.4%) | $0 |
| 7+ Person Families | 0 (0.0%) | $0 |
| Total | 252 (100.0%) | $75,250 |
Family Income by Number of Earners in Blue Mound
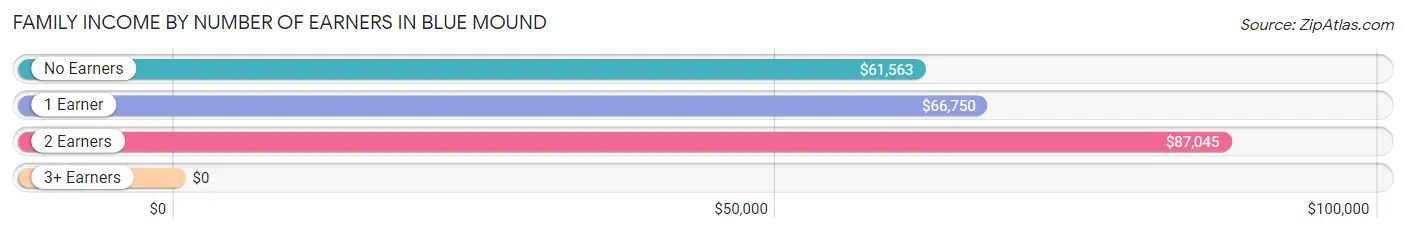
| Number of Earners | # Families | Median Income |
| No Earners | 61 (24.2%) | $61,563 |
| 1 Earner | 83 (32.9%) | $66,750 |
| 2 Earners | 100 (39.7%) | $87,045 |
| 3+ Earners | 8 (3.2%) | $0 |
| Total | 252 (100.0%) | $75,250 |
Household Income in Blue Mound
Household Income Brackets in Blue Mound
With 118 households falling in the category, the $50,000 to $74,999 income range is the most frequent in Blue Mound, accounting for 26.2% of all households. In contrast, only 8 households (1.8%) fall into the less than $10,000 income bracket, making it the least populous group.
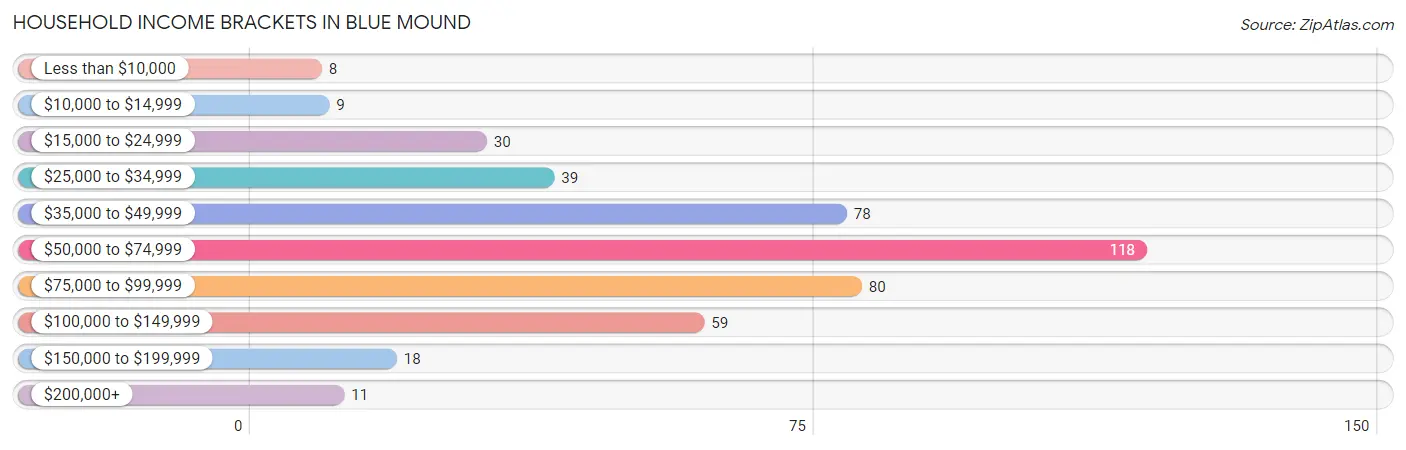
| Income Bracket | # Households | % Households |
| Less than $10,000 | 8 | 1.8% |
| $10,000 to $14,999 | 9 | 2.0% |
| $15,000 to $24,999 | 30 | 6.7% |
| $25,000 to $34,999 | 39 | 8.7% |
| $35,000 to $49,999 | 78 | 17.3% |
| $50,000 to $74,999 | 118 | 26.2% |
| $75,000 to $99,999 | 80 | 17.8% |
| $100,000 to $149,999 | 59 | 13.1% |
| $150,000 to $199,999 | 18 | 4.0% |
| $200,000+ | 11 | 2.4% |
Household Income by Householder Age in Blue Mound
The median household income in Blue Mound is $57,097, with the highest median household income of $75,156 found in the 45 to 64 years age bracket for the primary householder. A total of 143 households (31.8%) fall into this category. Meanwhile, the 15 to 24 years age bracket for the primary householder has the lowest median household income of $0, with 24 households (5.3%) in this group.
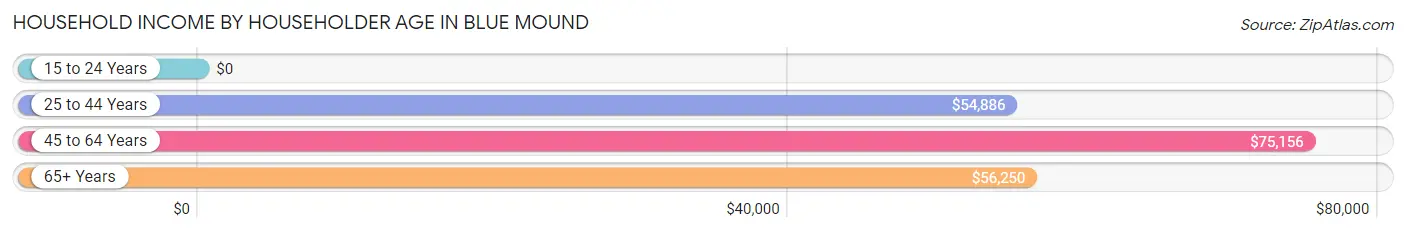
| Income Bracket | # Households | Median Income |
| 15 to 24 Years | 24 (5.3%) | $0 |
| 25 to 44 Years | 101 (22.4%) | $54,886 |
| 45 to 64 Years | 143 (31.8%) | $75,156 |
| 65+ Years | 182 (40.4%) | $56,250 |
| Total | 450 (100.0%) | $57,097 |
Poverty in Blue Mound
Income Below Poverty by Sex and Age in Blue Mound
With 8.8% poverty level for males and 8.0% for females among the residents of Blue Mound, 25 to 34 year old males and 18 to 24 year old females are the most vulnerable to poverty, with 14 males (28.0%) and 14 females (30.4%) in their respective age groups living below the poverty level.
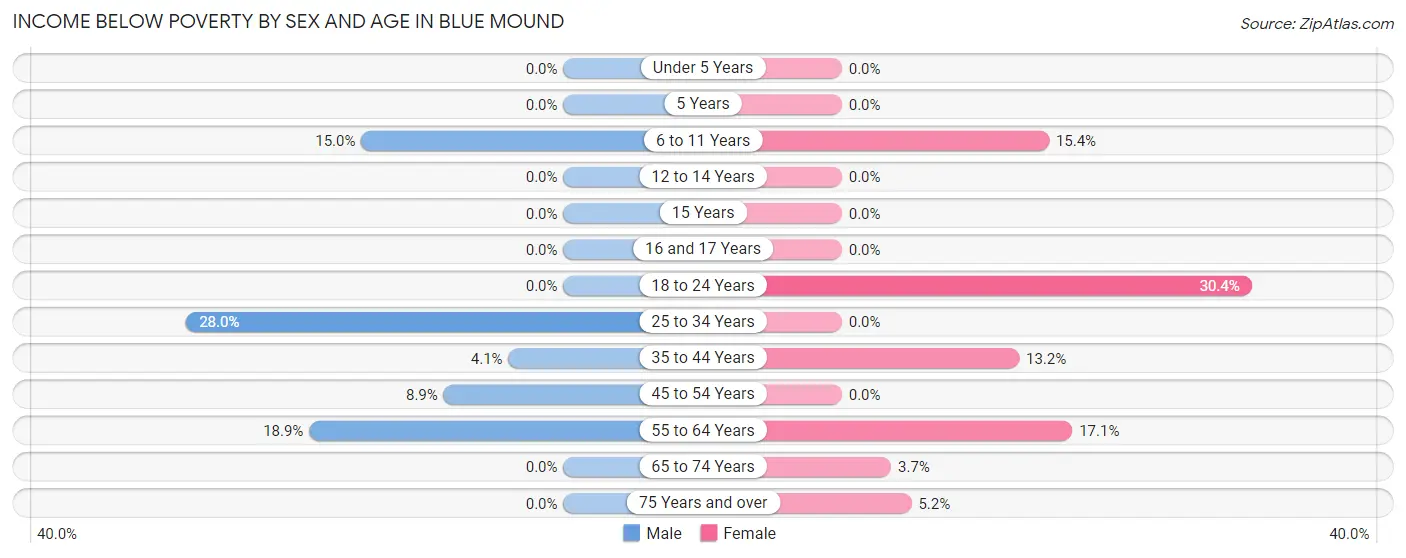
| Age Bracket | Male | Female |
| Under 5 Years | 0 (0.0%) | 0 (0.0%) |
| 5 Years | 0 (0.0%) | 0 (0.0%) |
| 6 to 11 Years | 6 (15.0%) | 4 (15.4%) |
| 12 to 14 Years | 0 (0.0%) | 0 (0.0%) |
| 15 Years | 0 (0.0%) | 0 (0.0%) |
| 16 and 17 Years | 0 (0.0%) | 0 (0.0%) |
| 18 to 24 Years | 0 (0.0%) | 14 (30.4%) |
| 25 to 34 Years | 14 (28.0%) | 0 (0.0%) |
| 35 to 44 Years | 2 (4.1%) | 5 (13.2%) |
| 45 to 54 Years | 4 (8.9%) | 0 (0.0%) |
| 55 to 64 Years | 10 (18.9%) | 13 (17.1%) |
| 65 to 74 Years | 0 (0.0%) | 3 (3.7%) |
| 75 Years and over | 0 (0.0%) | 3 (5.2%) |
| Total | 36 (8.8%) | 42 (8.0%) |
Income Above Poverty by Sex and Age in Blue Mound
According to the poverty statistics in Blue Mound, males aged under 5 years and females aged under 5 years are the age groups that are most secure financially, with 100.0% of males and 100.0% of females in these age groups living above the poverty line.
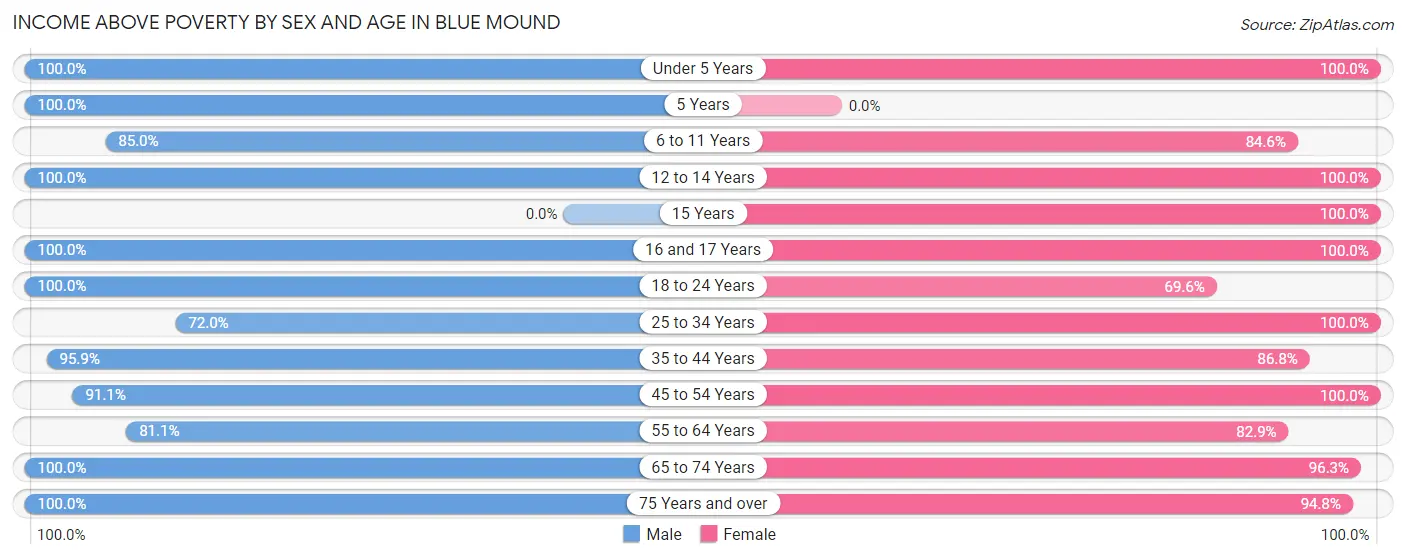
| Age Bracket | Male | Female |
| Under 5 Years | 3 (100.0%) | 41 (100.0%) |
| 5 Years | 21 (100.0%) | 0 (0.0%) |
| 6 to 11 Years | 34 (85.0%) | 22 (84.6%) |
| 12 to 14 Years | 17 (100.0%) | 9 (100.0%) |
| 15 Years | 0 (0.0%) | 3 (100.0%) |
| 16 and 17 Years | 11 (100.0%) | 8 (100.0%) |
| 18 to 24 Years | 6 (100.0%) | 32 (69.6%) |
| 25 to 34 Years | 36 (72.0%) | 57 (100.0%) |
| 35 to 44 Years | 47 (95.9%) | 33 (86.8%) |
| 45 to 54 Years | 41 (91.1%) | 79 (100.0%) |
| 55 to 64 Years | 43 (81.1%) | 63 (82.9%) |
| 65 to 74 Years | 67 (100.0%) | 79 (96.3%) |
| 75 Years and over | 49 (100.0%) | 55 (94.8%) |
| Total | 375 (91.2%) | 481 (92.0%) |
Income Below Poverty Among Married-Couple Families in Blue Mound
The poverty statistics for married-couple families in Blue Mound show that 5.9% or 13 of the total 219 families live below the poverty line. Families with no children have the highest poverty rate of 6.7%, comprising of 9 families. On the other hand, families with 3 or 4 children have the lowest poverty rate of 0.0%, which includes 0 families.
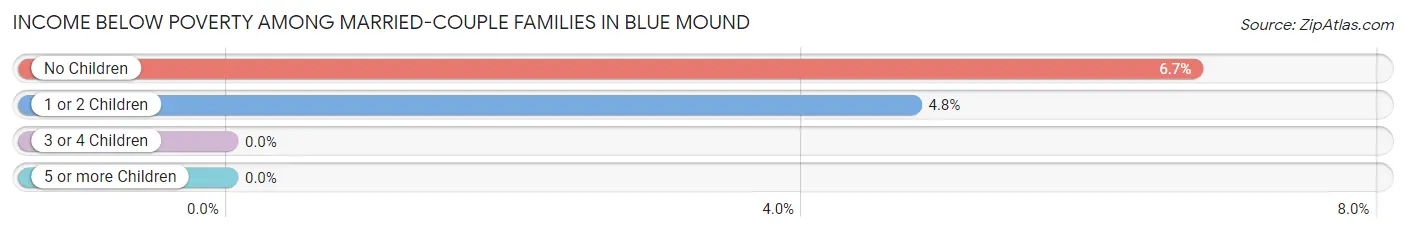
| Children | Above Poverty | Below Poverty |
| No Children | 125 (93.3%) | 9 (6.7%) |
| 1 or 2 Children | 80 (95.2%) | 4 (4.8%) |
| 3 or 4 Children | 1 (100.0%) | 0 (0.0%) |
| 5 or more Children | 0 (0.0%) | 0 (0.0%) |
| Total | 206 (94.1%) | 13 (5.9%) |
Income Below Poverty Among Single-Parent Households in Blue Mound
| Children | Single Father | Single Mother |
| No Children | 0 (0.0%) | 0 (0.0%) |
| 1 or 2 Children | 0 (0.0%) | 0 (0.0%) |
| 3 or 4 Children | 0 (0.0%) | 0 (0.0%) |
| 5 or more Children | 0 (0.0%) | 0 (0.0%) |
| Total | 0 (0.0%) | 0 (0.0%) |
Income Below Poverty Among Married-Couple vs Single-Parent Households in Blue Mound
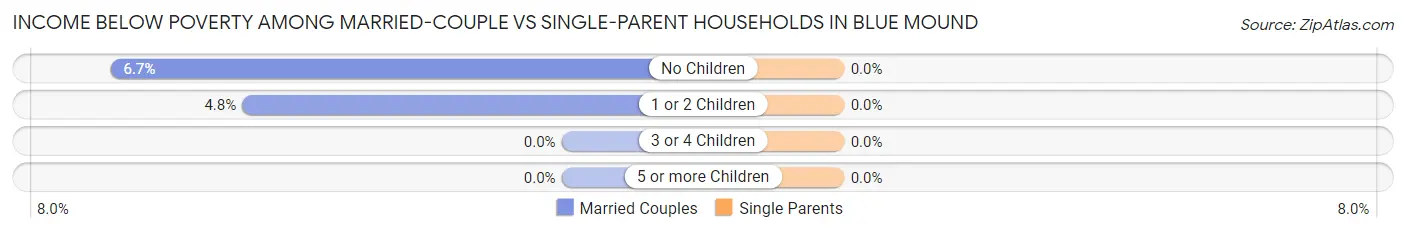
| Children | Married-Couple Families | Single-Parent Households |
| No Children | 9 (6.7%) | 0 (0.0%) |
| 1 or 2 Children | 4 (4.8%) | 0 (0.0%) |
| 3 or 4 Children | 0 (0.0%) | 0 (0.0%) |
| 5 or more Children | 0 (0.0%) | 0 (0.0%) |
| Total | 13 (5.9%) | 0 (0.0%) |
Race in Blue Mound
The most populous races in Blue Mound are White / Caucasian (841 | 90.0%), Two or more Races (66 | 7.1%), and Hispanic or Latino (33 | 3.5%).
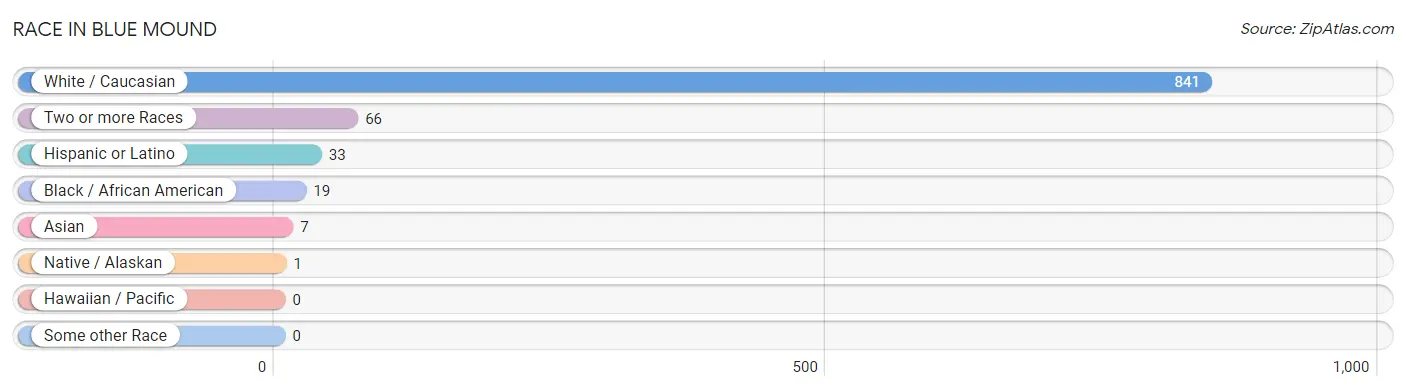
| Race | # Population | % Population |
| Asian | 7 | 0.7% |
| Black / African American | 19 | 2.0% |
| Hawaiian / Pacific | 0 | 0.0% |
| Hispanic or Latino | 33 | 3.5% |
| Native / Alaskan | 1 | 0.1% |
| White / Caucasian | 841 | 90.0% |
| Two or more Races | 66 | 7.1% |
| Some other Race | 0 | 0.0% |
| Total | 934 | 100.0% |
Ancestry in Blue Mound
The most populous ancestries reported in Blue Mound are German (209 | 22.4%), English (195 | 20.9%), Irish (121 | 13.0%), American (51 | 5.5%), and French (39 | 4.2%), together accounting for 65.9% of all Blue Mound residents.
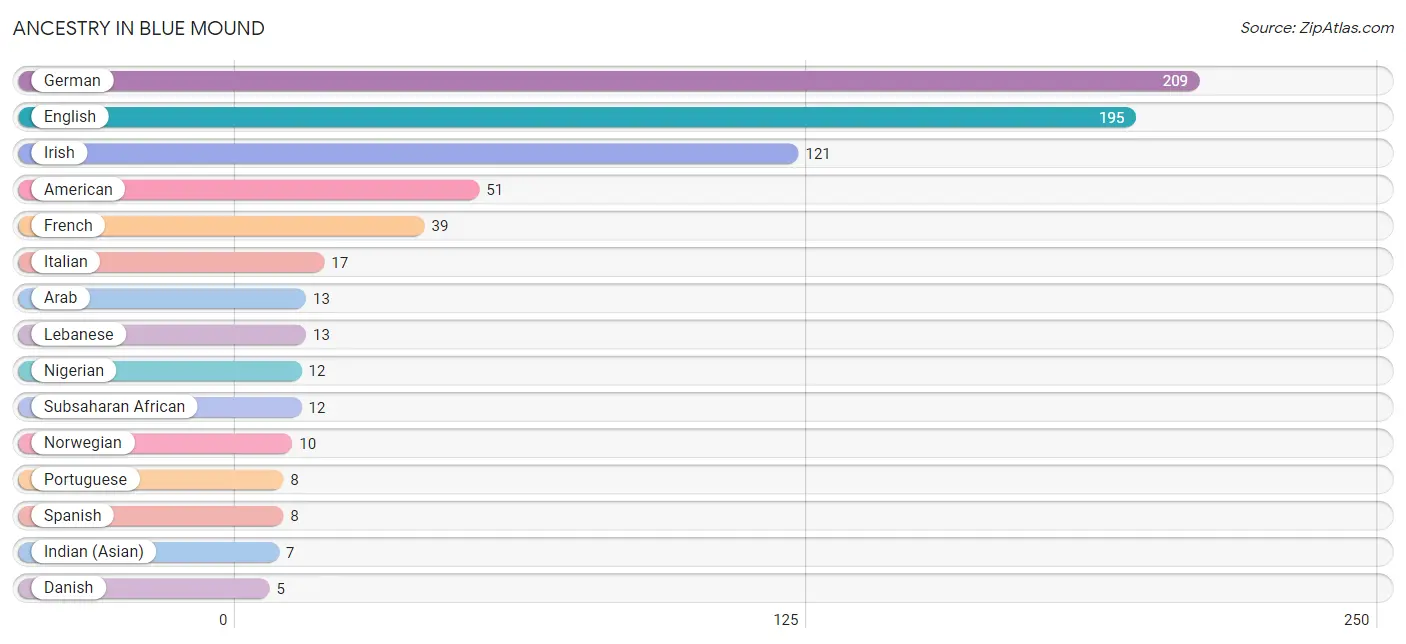
| Ancestry | # Population | % Population |
| American | 51 | 5.5% |
| Arab | 13 | 1.4% |
| Cherokee | 1 | 0.1% |
| Chippewa | 1 | 0.1% |
| Choctaw | 1 | 0.1% |
| Danish | 5 | 0.5% |
| Dutch | 4 | 0.4% |
| English | 195 | 20.9% |
| French | 39 | 4.2% |
| German | 209 | 22.4% |
| Indian (Asian) | 7 | 0.7% |
| Irish | 121 | 13.0% |
| Italian | 17 | 1.8% |
| Lebanese | 13 | 1.4% |
| Nigerian | 12 | 1.3% |
| Norwegian | 10 | 1.1% |
| Pennsylvania German | 2 | 0.2% |
| Polish | 4 | 0.4% |
| Portuguese | 8 | 0.9% |
| Scotch-Irish | 5 | 0.5% |
| Scottish | 5 | 0.5% |
| Spanish | 8 | 0.9% |
| Subsaharan African | 12 | 1.3% |
| Swiss | 3 | 0.3% |
| Welsh | 2 | 0.2% | View All 25 Rows |
Immigrants in Blue Mound
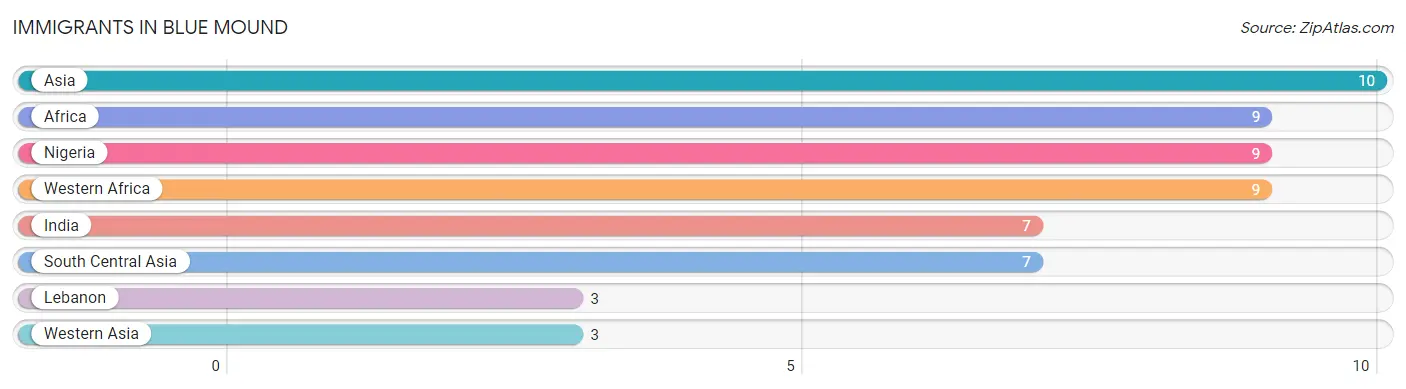
The most numerous immigrant groups reported in Blue Mound came from Asia (10 | 1.1%), Africa (9 | 1.0%), Nigeria (9 | 1.0%), Western Africa (9 | 1.0%), and India (7 | 0.7%), together accounting for 4.7% of all Blue Mound residents.
| Immigration Origin | # Population | % Population |
| Africa | 9 | 1.0% |
| Asia | 10 | 1.1% |
| India | 7 | 0.7% |
| Lebanon | 3 | 0.3% |
| Nigeria | 9 | 1.0% |
| South Central Asia | 7 | 0.7% |
| Western Africa | 9 | 1.0% |
| Western Asia | 3 | 0.3% | View All 8 Rows |
Sex and Age in Blue Mound
Sex and Age in Blue Mound
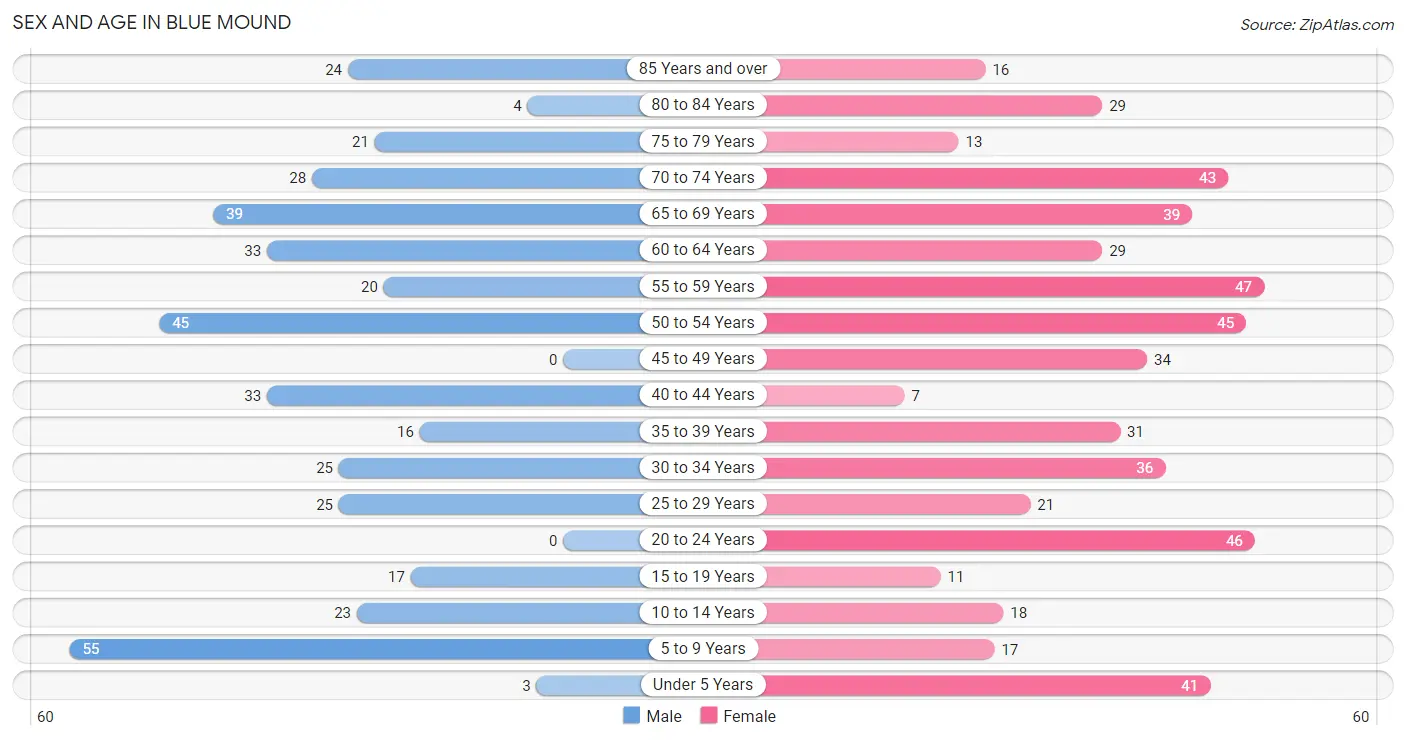
The most populous age groups in Blue Mound are 5 to 9 Years (55 | 13.4%) for men and 55 to 59 Years (47 | 9.0%) for women.
| Age Bracket | Male | Female |
| Under 5 Years | 3 (0.7%) | 41 (7.8%) |
| 5 to 9 Years | 55 (13.4%) | 17 (3.3%) |
| 10 to 14 Years | 23 (5.6%) | 18 (3.4%) |
| 15 to 19 Years | 17 (4.1%) | 11 (2.1%) |
| 20 to 24 Years | 0 (0.0%) | 46 (8.8%) |
| 25 to 29 Years | 25 (6.1%) | 21 (4.0%) |
| 30 to 34 Years | 25 (6.1%) | 36 (6.9%) |
| 35 to 39 Years | 16 (3.9%) | 31 (5.9%) |
| 40 to 44 Years | 33 (8.0%) | 7 (1.3%) |
| 45 to 49 Years | 0 (0.0%) | 34 (6.5%) |
| 50 to 54 Years | 45 (11.0%) | 45 (8.6%) |
| 55 to 59 Years | 20 (4.9%) | 47 (9.0%) |
| 60 to 64 Years | 33 (8.0%) | 29 (5.5%) |
| 65 to 69 Years | 39 (9.5%) | 39 (7.5%) |
| 70 to 74 Years | 28 (6.8%) | 43 (8.2%) |
| 75 to 79 Years | 21 (5.1%) | 13 (2.5%) |
| 80 to 84 Years | 4 (1.0%) | 29 (5.5%) |
| 85 Years and over | 24 (5.8%) | 16 (3.1%) |
| Total | 411 (100.0%) | 523 (100.0%) |
Families and Households in Blue Mound
Median Family Size in Blue Mound
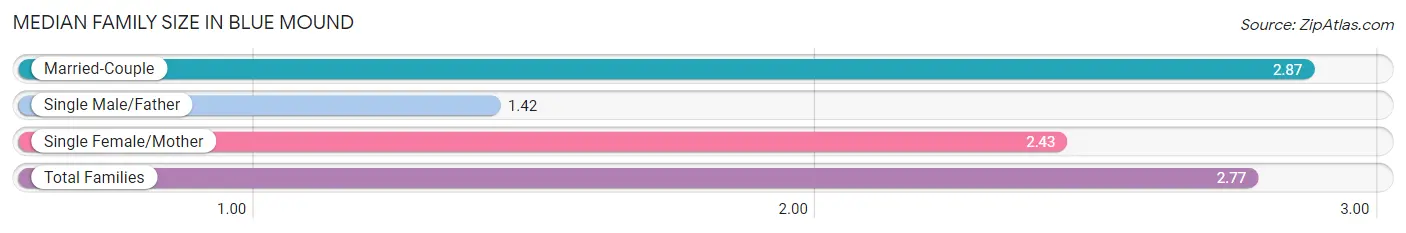
The median family size in Blue Mound is 2.77 persons per family, with married-couple families (219 | 86.9%) accounting for the largest median family size of 2.87 persons per family. On the other hand, single male/father families (12 | 4.8%) represent the smallest median family size with 1.42 persons per family.
| Family Type | # Families | Family Size |
| Married-Couple | 219 (86.9%) | 2.87 |
| Single Male/Father | 12 (4.8%) | 1.42 |
| Single Female/Mother | 21 (8.3%) | 2.43 |
| Total Families | 252 (100.0%) | 2.77 |
Median Household Size in Blue Mound
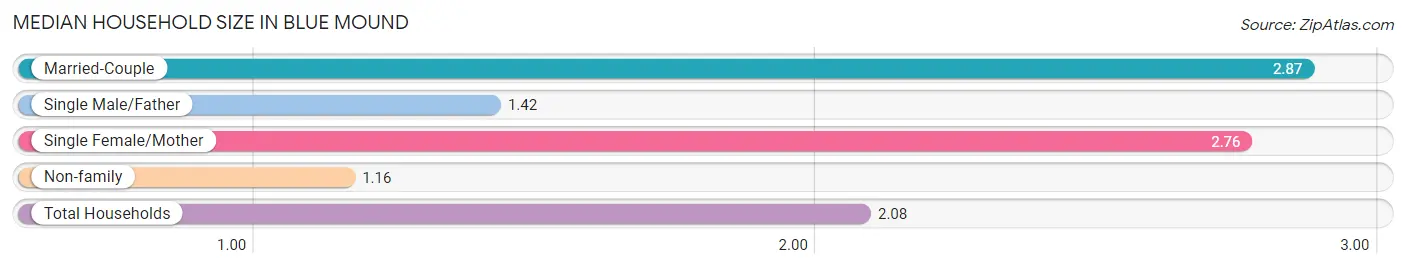
The median household size in Blue Mound is 2.08 persons per household, with married-couple households (219 | 48.7%) accounting for the largest median household size of 2.87 persons per household. non-family households (198 | 44.0%) represent the smallest median household size with 1.16 persons per household.
| Household Type | # Households | Household Size |
| Married-Couple | 219 (48.7%) | 2.87 |
| Single Male/Father | 12 (2.7%) | 1.42 |
| Single Female/Mother | 21 (4.7%) | 2.76 |
| Non-family | 198 (44.0%) | 1.16 |
| Total Households | 450 (100.0%) | 2.08 |
Household Size by Marriage Status in Blue Mound
Out of a total of 450 households in Blue Mound, 252 (56.0%) are family households, while 198 (44.0%) are nonfamily households. The most numerous type of family households are 2-person households, comprising 133, and the most common type of nonfamily households are 1-person households, comprising 185.
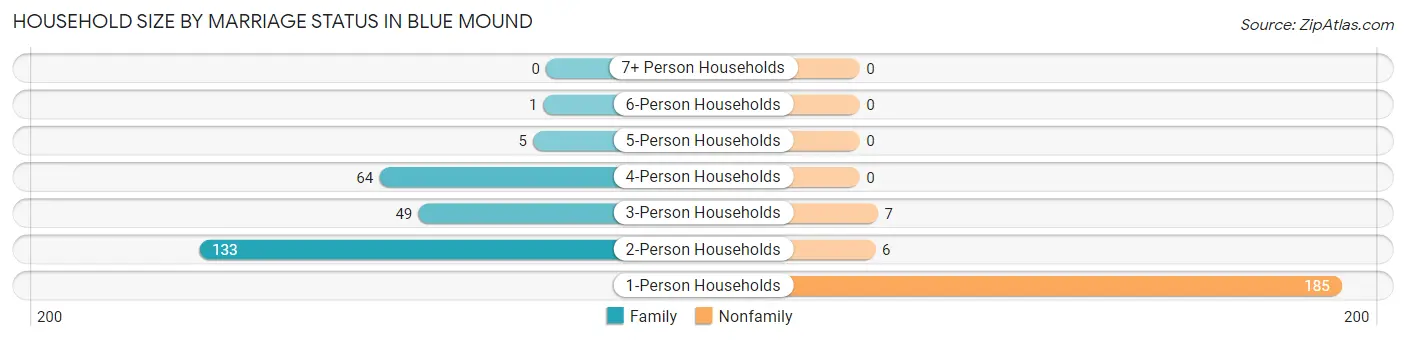
| Household Size | Family Households | Nonfamily Households |
| 1-Person Households | - | 185 (41.1%) |
| 2-Person Households | 133 (29.6%) | 6 (1.3%) |
| 3-Person Households | 49 (10.9%) | 7 (1.6%) |
| 4-Person Households | 64 (14.2%) | 0 (0.0%) |
| 5-Person Households | 5 (1.1%) | 0 (0.0%) |
| 6-Person Households | 1 (0.2%) | 0 (0.0%) |
| 7+ Person Households | 0 (0.0%) | 0 (0.0%) |
| Total | 252 (56.0%) | 198 (44.0%) |
Female Fertility in Blue Mound
Fertility by Age in Blue Mound
| Age Bracket | Women with Births | Births / 1,000 Women |
| 15 to 19 years | 0 (0.0%) | 0.0 |
| 20 to 34 years | 0 (0.0%) | 0.0 |
| 35 to 50 years | 0 (0.0%) | 0.0 |
| Total | 0 (0.0%) | 0.0 |
Fertility by Age by Marriage Status in Blue Mound
| Age Bracket | Married | Unmarried |
| 15 to 19 years | 0 (0.0%) | 0 (0.0%) |
| 20 to 34 years | 0 (0.0%) | 0 (0.0%) |
| 35 to 50 years | 0 (0.0%) | 0 (0.0%) |
| Total | 0 (0.0%) | 0 (0.0%) |
Fertility by Education in Blue Mound
| Educational Attainment | Women with Births | Births / 1,000 Women |
| Less than High School | 0 (0.0%) | 0.0 |
| High School Diploma | 0 (0.0%) | 0.0 |
| College or Associate's Degree | 0 (0.0%) | 0.0 |
| Bachelor's Degree | 0 (0.0%) | 0.0 |
| Graduate Degree | 0 (0.0%) | 0.0 |
| Total | 0 (0.0%) | 0.0 |
Fertility by Education by Marriage Status in Blue Mound
| Educational Attainment | Married | Unmarried |
| Less than High School | 0 (0.0%) | 0 (0.0%) |
| High School Diploma | 0 (0.0%) | 0 (0.0%) |
| College or Associate's Degree | 0 (0.0%) | 0 (0.0%) |
| Bachelor's Degree | 0 (0.0%) | 0 (0.0%) |
| Graduate Degree | 0 (0.0%) | 0 (0.0%) |
| Total | 0 (0.0%) | 0 (0.0%) |
Employment Characteristics in Blue Mound
Employment by Class of Employer in Blue Mound
Among the 431 employed individuals in Blue Mound, private company employees (265 | 61.5%), not-for-profit organizations (75 | 17.4%), and local government employees (42 | 9.7%) make up the most common classes of employment.
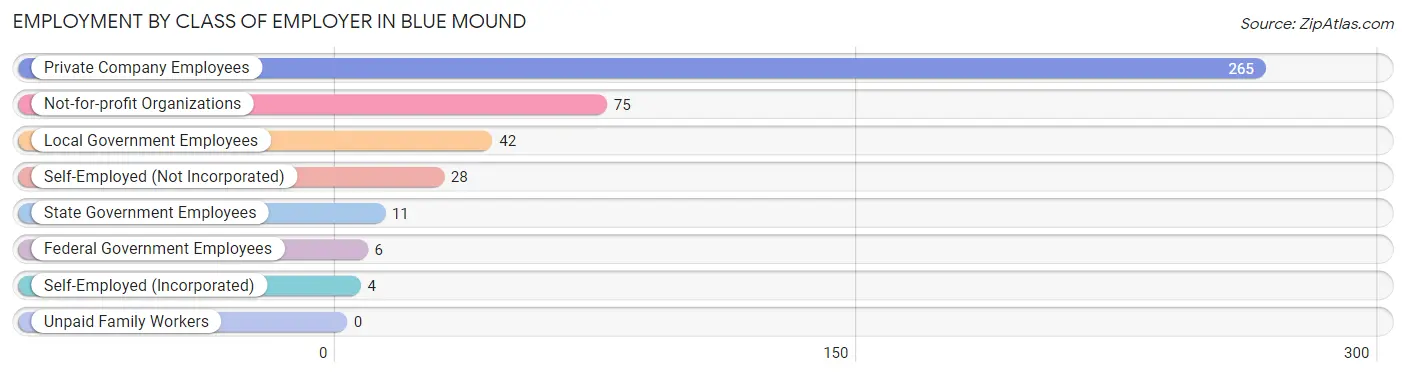
| Employer Class | # Employees | % Employees |
| Private Company Employees | 265 | 61.5% |
| Self-Employed (Incorporated) | 4 | 0.9% |
| Self-Employed (Not Incorporated) | 28 | 6.5% |
| Not-for-profit Organizations | 75 | 17.4% |
| Local Government Employees | 42 | 9.7% |
| State Government Employees | 11 | 2.5% |
| Federal Government Employees | 6 | 1.4% |
| Unpaid Family Workers | 0 | 0.0% |
| Total | 431 | 100.0% |
Employment Status by Age in Blue Mound
According to the labor force statistics for Blue Mound, out of the total population over 16 years of age (774), 56.8% or 440 individuals are in the labor force, with 1.1% or 5 of them unemployed. The age group with the highest labor force participation rate is 25 to 29 years, with 89.1% or 41 individuals in the labor force. Within the labor force, the 35 to 44 years age range has the highest percentage of unemployed individuals, with 7.0% or 5 of them being unemployed.
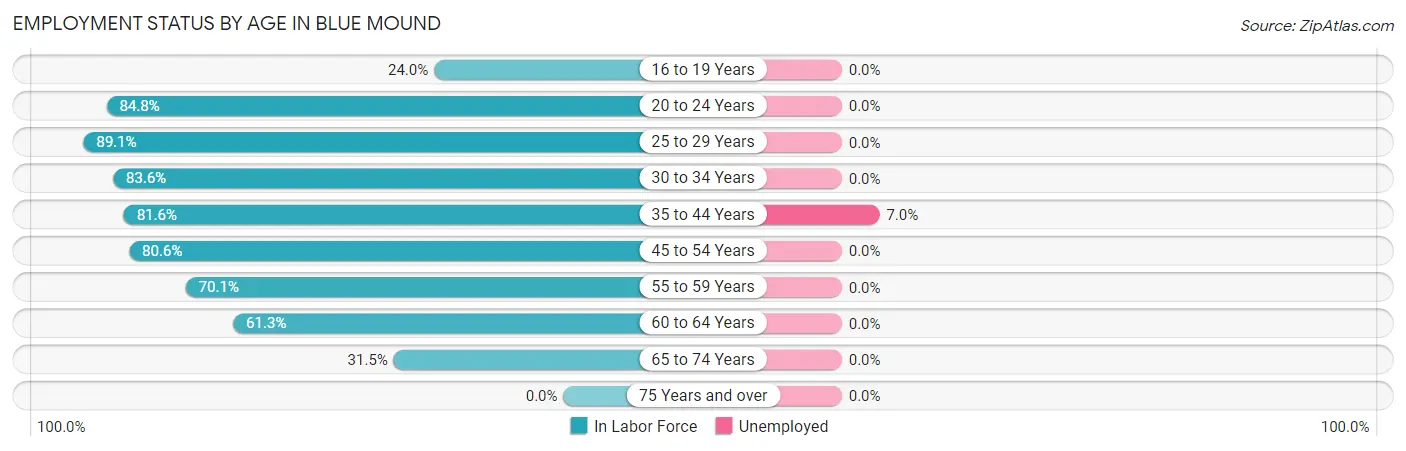
| Age Bracket | In Labor Force | Unemployed |
| 16 to 19 Years | 6 (24.0%) | 0 (0.0%) |
| 20 to 24 Years | 39 (84.8%) | 0 (0.0%) |
| 25 to 29 Years | 41 (89.1%) | 0 (0.0%) |
| 30 to 34 Years | 51 (83.6%) | 0 (0.0%) |
| 35 to 44 Years | 71 (81.6%) | 5 (7.0%) |
| 45 to 54 Years | 100 (80.6%) | 0 (0.0%) |
| 55 to 59 Years | 47 (70.1%) | 0 (0.0%) |
| 60 to 64 Years | 38 (61.3%) | 0 (0.0%) |
| 65 to 74 Years | 47 (31.5%) | 0 (0.0%) |
| 75 Years and over | 0 (0.0%) | 0 (0.0%) |
| Total | 440 (56.8%) | 5 (1.1%) |
Employment Status by Educational Attainment in Blue Mound
According to labor force statistics for Blue Mound, 77.9% of individuals (348) out of the total population between 25 and 64 years of age (447) are in the labor force, with 1.4% or 5 of them being unemployed. The group with the highest labor force participation rate are those with the educational attainment of bachelor's degree or higher, with 83.3% or 85 individuals in the labor force. Within the labor force, individuals with college / associate degree education have the highest percentage of unemployment, with 2.6% or 3 of them being unemployed.
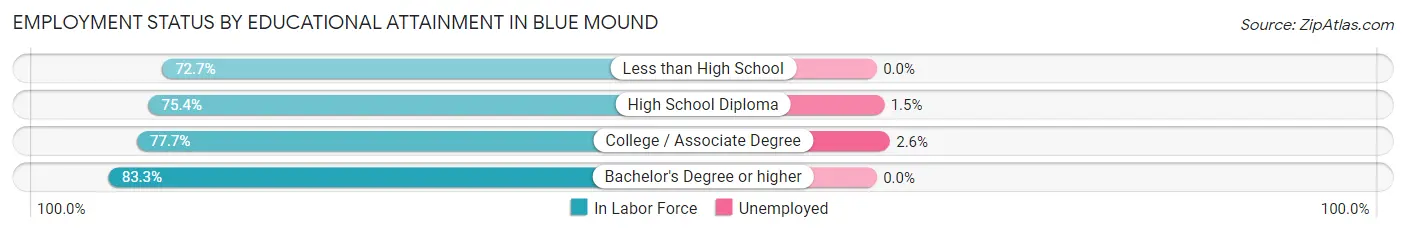
| Educational Attainment | In Labor Force | Unemployed |
| Less than High School | 16 (72.7%) | 0 (0.0%) |
| High School Diploma | 132 (75.4%) | 3 (1.5%) |
| College / Associate Degree | 115 (77.7%) | 4 (2.6%) |
| Bachelor's Degree or higher | 85 (83.3%) | 0 (0.0%) |
| Total | 348 (77.9%) | 6 (1.4%) |
Employment Occupations by Sex in Blue Mound
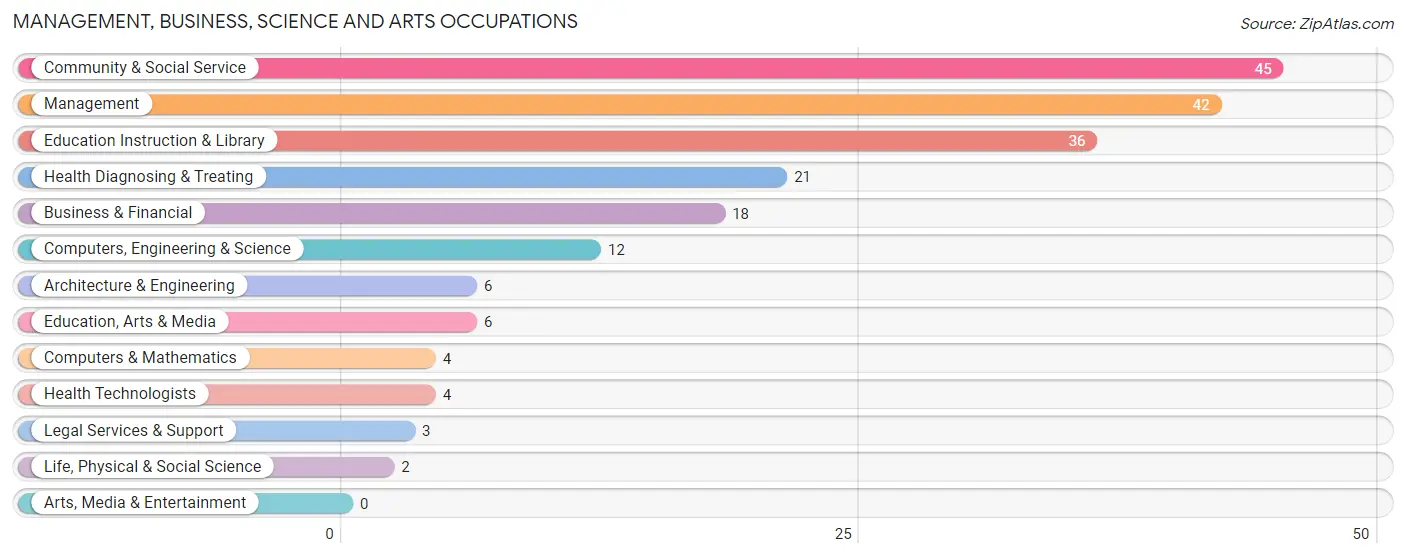
Management, Business, Science and Arts Occupations
The most common Management, Business, Science and Arts occupations in Blue Mound are Community & Social Service (45 | 10.3%), Management (42 | 9.7%), Education Instruction & Library (36 | 8.3%), Health Diagnosing & Treating (21 | 4.8%), and Business & Financial (18 | 4.1%).
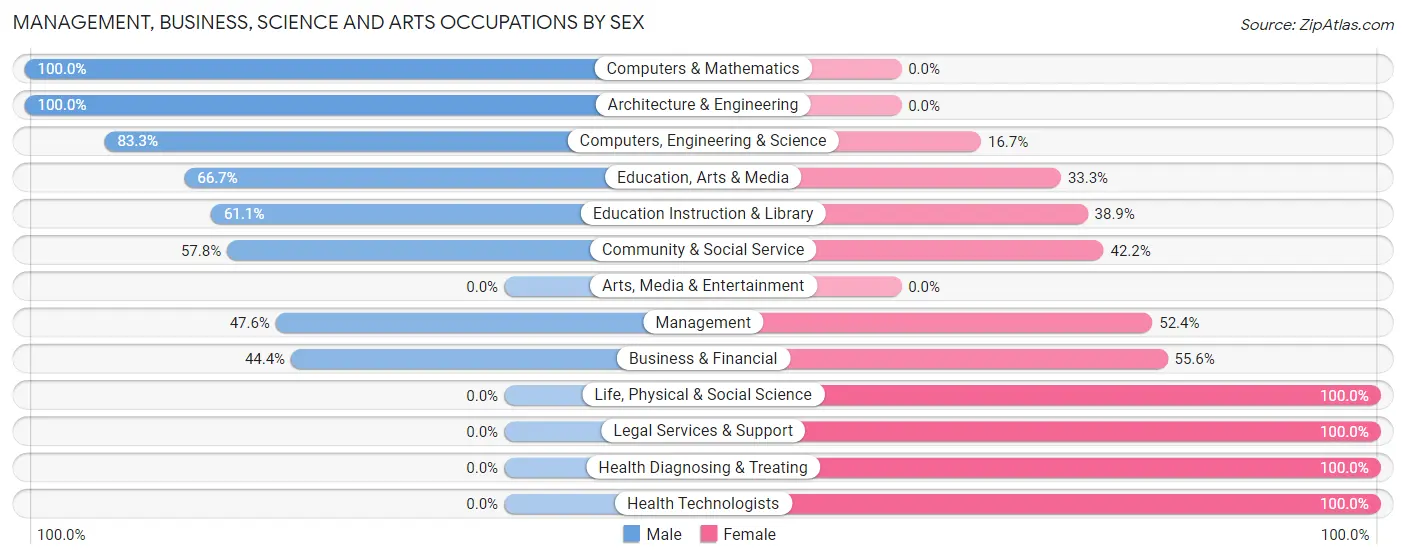
Management, Business, Science and Arts Occupations by Sex
Within the Management, Business, Science and Arts occupations in Blue Mound, the most male-oriented occupations are Computers & Mathematics (100.0%), Architecture & Engineering (100.0%), and Computers, Engineering & Science (83.3%), while the most female-oriented occupations are Life, Physical & Social Science (100.0%), Legal Services & Support (100.0%), and Health Diagnosing & Treating (100.0%).
| Occupation | Male | Female |
| Management | 20 (47.6%) | 22 (52.4%) |
| Business & Financial | 8 (44.4%) | 10 (55.6%) |
| Computers, Engineering & Science | 10 (83.3%) | 2 (16.7%) |
| Computers & Mathematics | 4 (100.0%) | 0 (0.0%) |
| Architecture & Engineering | 6 (100.0%) | 0 (0.0%) |
| Life, Physical & Social Science | 0 (0.0%) | 2 (100.0%) |
| Community & Social Service | 26 (57.8%) | 19 (42.2%) |
| Education, Arts & Media | 4 (66.7%) | 2 (33.3%) |
| Legal Services & Support | 0 (0.0%) | 3 (100.0%) |
| Education Instruction & Library | 22 (61.1%) | 14 (38.9%) |
| Arts, Media & Entertainment | 0 (0.0%) | 0 (0.0%) |
| Health Diagnosing & Treating | 0 (0.0%) | 21 (100.0%) |
| Health Technologists | 0 (0.0%) | 4 (100.0%) |
| Total (Category) | 64 (46.4%) | 74 (53.6%) |
| Total (Overall) | 187 (43.0%) | 248 (57.0%) |
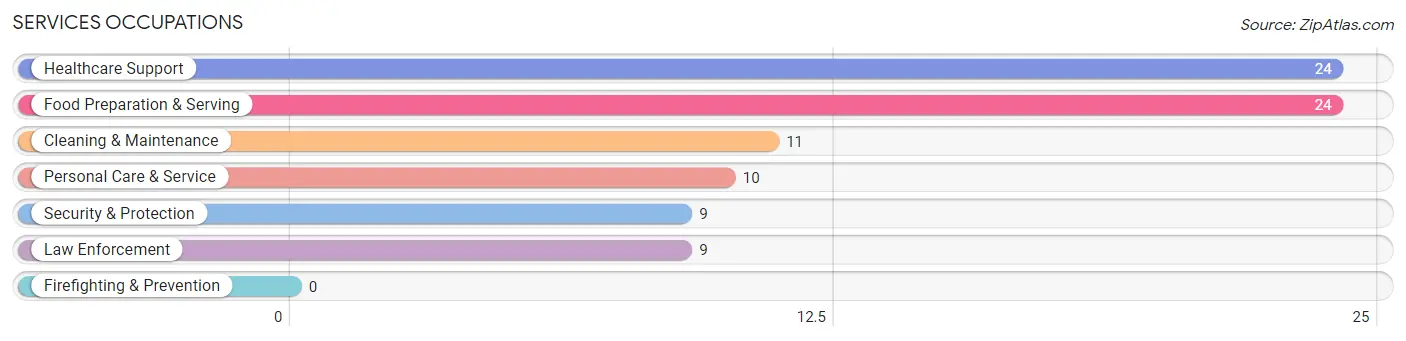
Services Occupations
The most common Services occupations in Blue Mound are Healthcare Support (24 | 5.5%), Food Preparation & Serving (24 | 5.5%), Cleaning & Maintenance (11 | 2.5%), Personal Care & Service (10 | 2.3%), and Security & Protection (9 | 2.1%).
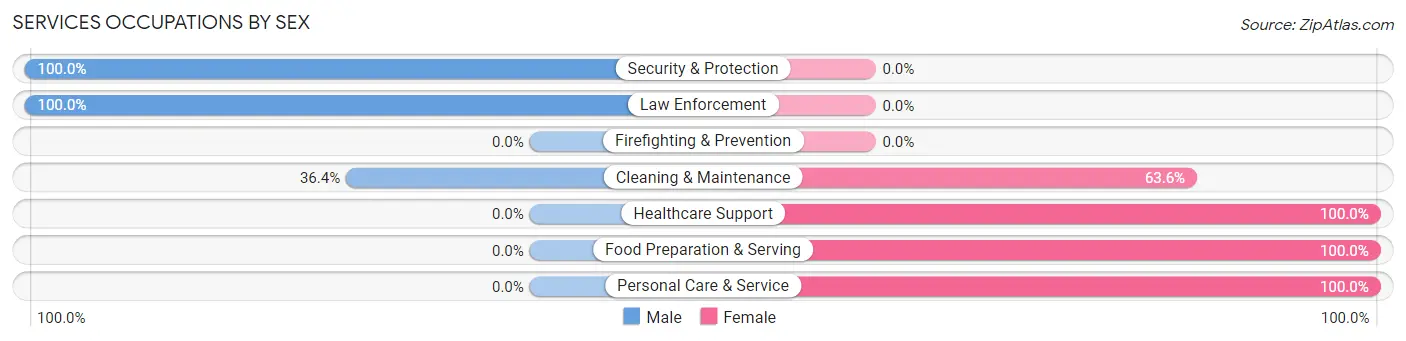
Services Occupations by Sex
Within the Services occupations in Blue Mound, the most male-oriented occupations are Security & Protection (100.0%), Law Enforcement (100.0%), and Cleaning & Maintenance (36.4%), while the most female-oriented occupations are Healthcare Support (100.0%), Food Preparation & Serving (100.0%), and Personal Care & Service (100.0%).
| Occupation | Male | Female |
| Healthcare Support | 0 (0.0%) | 24 (100.0%) |
| Security & Protection | 9 (100.0%) | 0 (0.0%) |
| Firefighting & Prevention | 0 (0.0%) | 0 (0.0%) |
| Law Enforcement | 9 (100.0%) | 0 (0.0%) |
| Food Preparation & Serving | 0 (0.0%) | 24 (100.0%) |
| Cleaning & Maintenance | 4 (36.4%) | 7 (63.6%) |
| Personal Care & Service | 0 (0.0%) | 10 (100.0%) |
| Total (Category) | 13 (16.7%) | 65 (83.3%) |
| Total (Overall) | 187 (43.0%) | 248 (57.0%) |
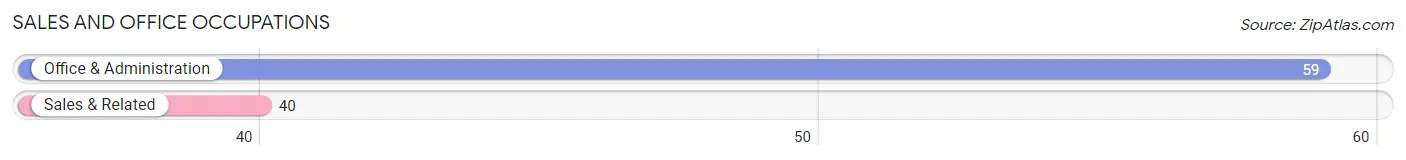
Sales and Office Occupations
The most common Sales and Office occupations in Blue Mound are Office & Administration (59 | 13.6%), and Sales & Related (40 | 9.2%).
Sales and Office Occupations by Sex
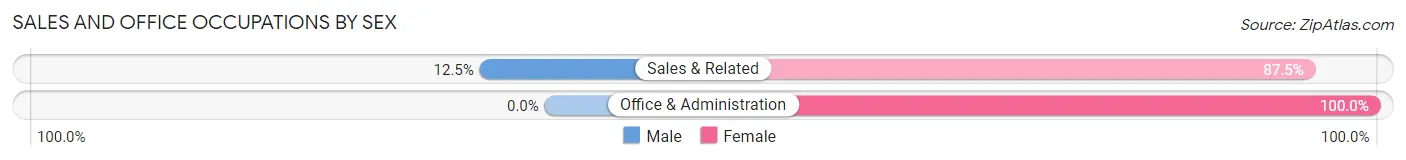
| Occupation | Male | Female |
| Sales & Related | 5 (12.5%) | 35 (87.5%) |
| Office & Administration | 0 (0.0%) | 59 (100.0%) |
| Total (Category) | 5 (5.1%) | 94 (95.0%) |
| Total (Overall) | 187 (43.0%) | 248 (57.0%) |
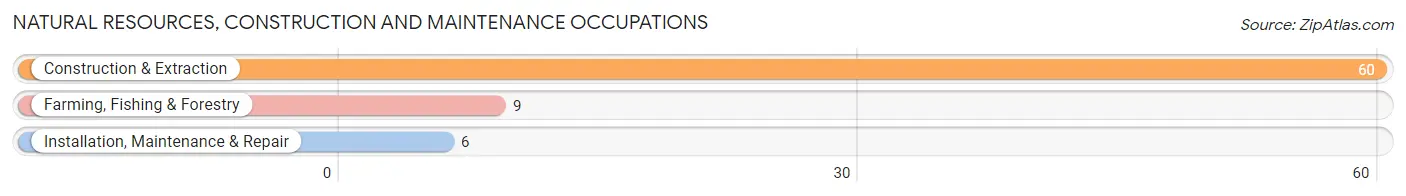
Natural Resources, Construction and Maintenance Occupations
The most common Natural Resources, Construction and Maintenance occupations in Blue Mound are Construction & Extraction (60 | 13.8%), Farming, Fishing & Forestry (9 | 2.1%), and Installation, Maintenance & Repair (6 | 1.4%).
Natural Resources, Construction and Maintenance Occupations by Sex
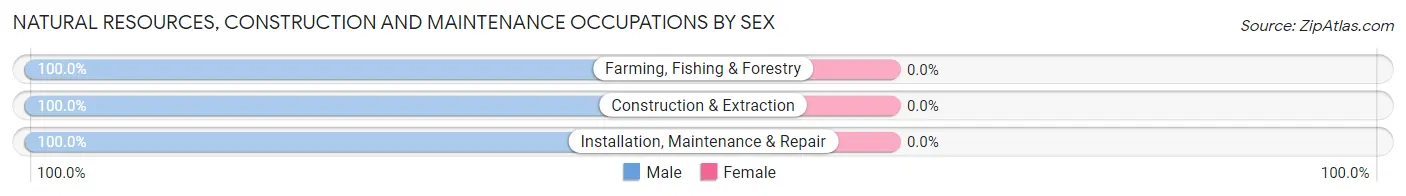
| Occupation | Male | Female |
| Farming, Fishing & Forestry | 9 (100.0%) | 0 (0.0%) |
| Construction & Extraction | 60 (100.0%) | 0 (0.0%) |
| Installation, Maintenance & Repair | 6 (100.0%) | 0 (0.0%) |
| Total (Category) | 75 (100.0%) | 0 (0.0%) |
| Total (Overall) | 187 (43.0%) | 248 (57.0%) |
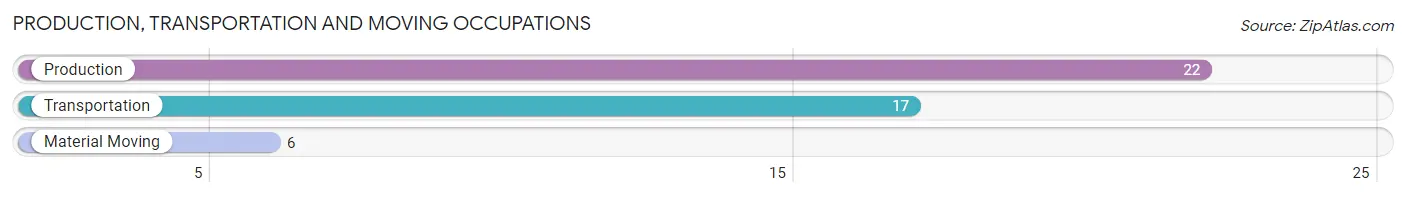
Production, Transportation and Moving Occupations
The most common Production, Transportation and Moving occupations in Blue Mound are Production (22 | 5.1%), Transportation (17 | 3.9%), and Material Moving (6 | 1.4%).
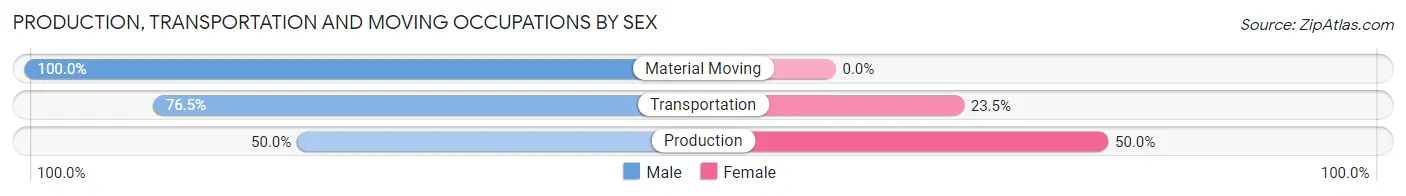
Production, Transportation and Moving Occupations by Sex
| Occupation | Male | Female |
| Production | 11 (50.0%) | 11 (50.0%) |
| Transportation | 13 (76.5%) | 4 (23.5%) |
| Material Moving | 6 (100.0%) | 0 (0.0%) |
| Total (Category) | 30 (66.7%) | 15 (33.3%) |
| Total (Overall) | 187 (43.0%) | 248 (57.0%) |
Employment Industries by Sex in Blue Mound
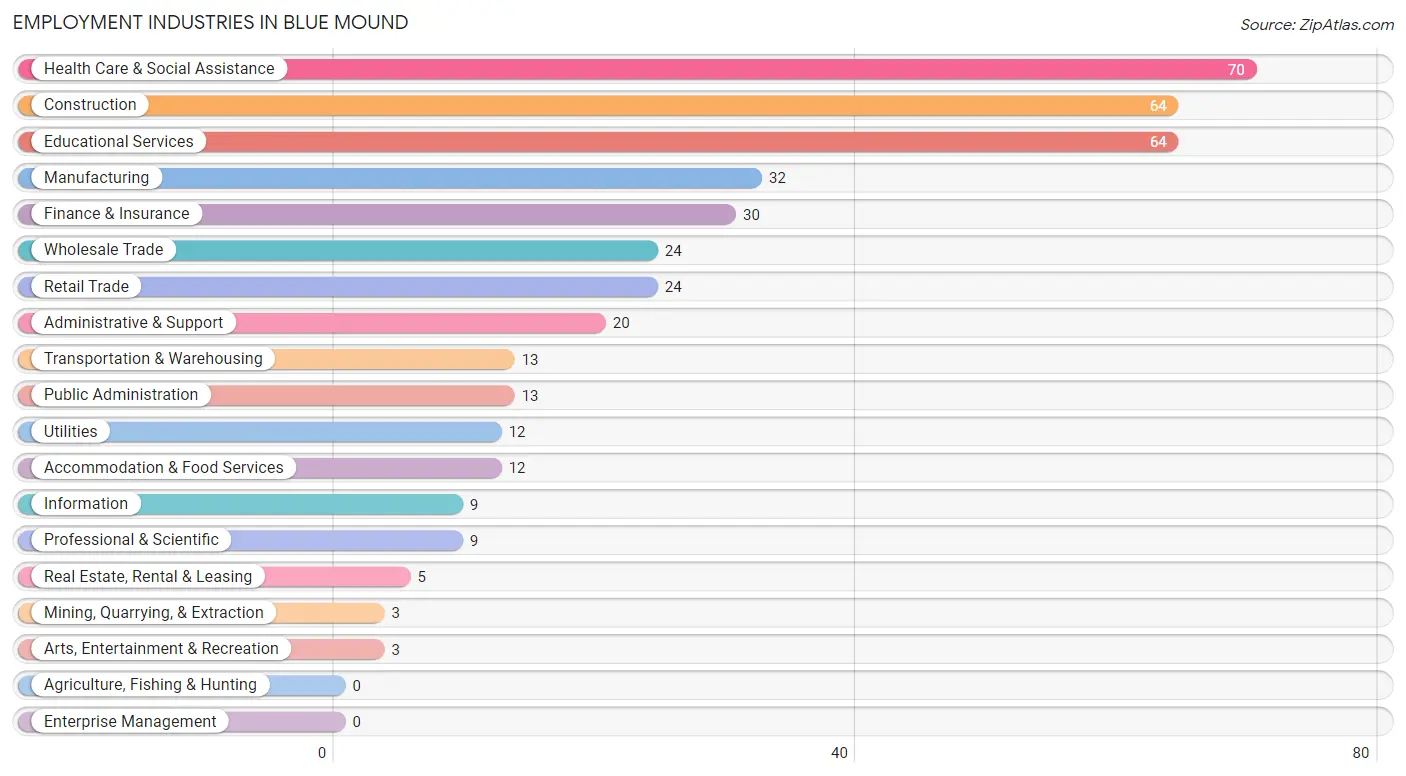
Employment Industries in Blue Mound
The major employment industries in Blue Mound include Health Care & Social Assistance (70 | 16.1%), Construction (64 | 14.7%), Educational Services (64 | 14.7%), Manufacturing (32 | 7.4%), and Finance & Insurance (30 | 6.9%).
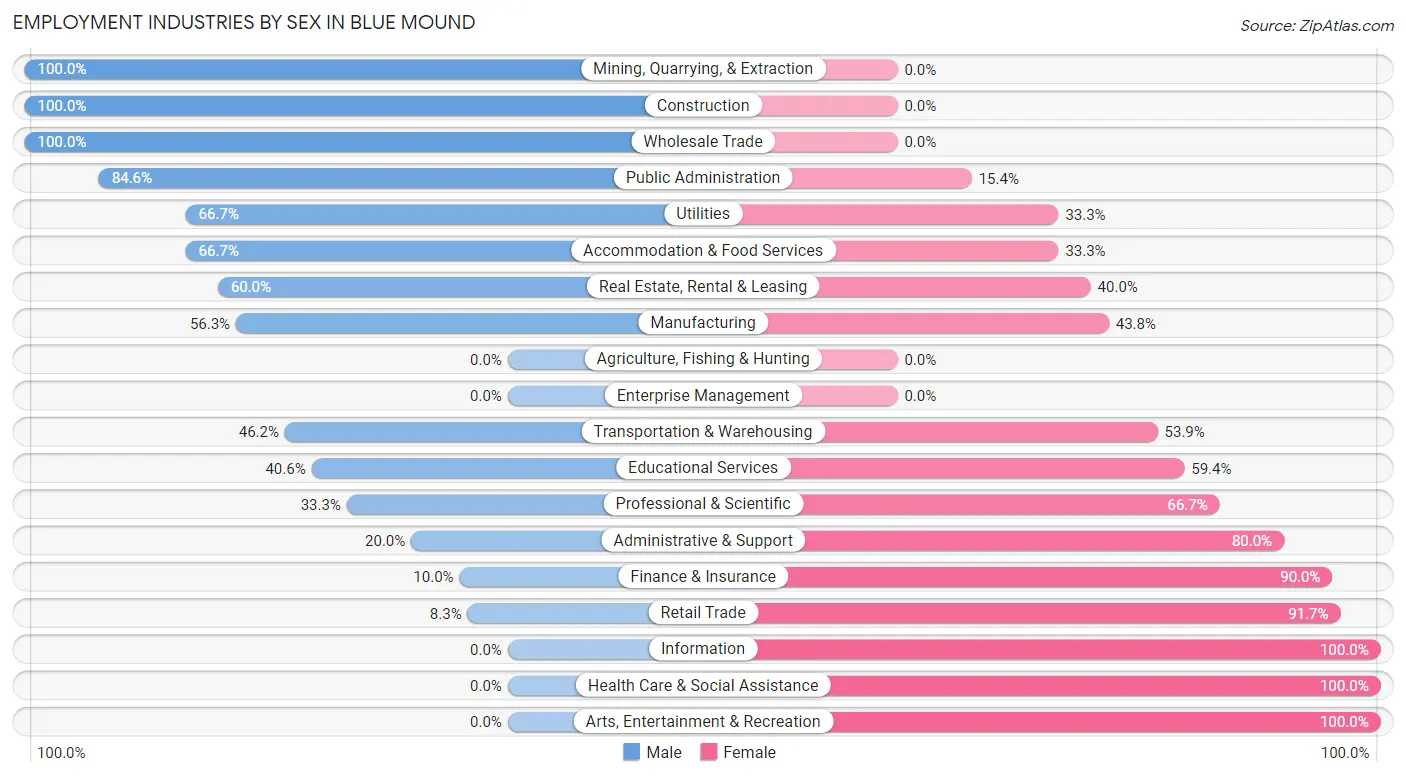
Employment Industries by Sex in Blue Mound
The Blue Mound industries that see more men than women are Mining, Quarrying, & Extraction (100.0%), Construction (100.0%), and Wholesale Trade (100.0%), whereas the industries that tend to have a higher number of women are Information (100.0%), Health Care & Social Assistance (100.0%), and Arts, Entertainment & Recreation (100.0%).
| Industry | Male | Female |
| Agriculture, Fishing & Hunting | 0 (0.0%) | 0 (0.0%) |
| Mining, Quarrying, & Extraction | 3 (100.0%) | 0 (0.0%) |
| Construction | 64 (100.0%) | 0 (0.0%) |
| Manufacturing | 18 (56.2%) | 14 (43.8%) |
| Wholesale Trade | 24 (100.0%) | 0 (0.0%) |
| Retail Trade | 2 (8.3%) | 22 (91.7%) |
| Transportation & Warehousing | 6 (46.2%) | 7 (53.8%) |
| Utilities | 8 (66.7%) | 4 (33.3%) |
| Information | 0 (0.0%) | 9 (100.0%) |
| Finance & Insurance | 3 (10.0%) | 27 (90.0%) |
| Real Estate, Rental & Leasing | 3 (60.0%) | 2 (40.0%) |
| Professional & Scientific | 3 (33.3%) | 6 (66.7%) |
| Enterprise Management | 0 (0.0%) | 0 (0.0%) |
| Administrative & Support | 4 (20.0%) | 16 (80.0%) |
| Educational Services | 26 (40.6%) | 38 (59.4%) |
| Health Care & Social Assistance | 0 (0.0%) | 70 (100.0%) |
| Arts, Entertainment & Recreation | 0 (0.0%) | 3 (100.0%) |
| Accommodation & Food Services | 8 (66.7%) | 4 (33.3%) |
| Public Administration | 11 (84.6%) | 2 (15.4%) |
| Total | 187 (43.0%) | 248 (57.0%) |
Education in Blue Mound
School Enrollment in Blue Mound
The most common levels of schooling among the 179 students in Blue Mound are elementary school (49 | 27.4%), high school (33 | 18.4%), and kindergarten (31 | 17.3%).
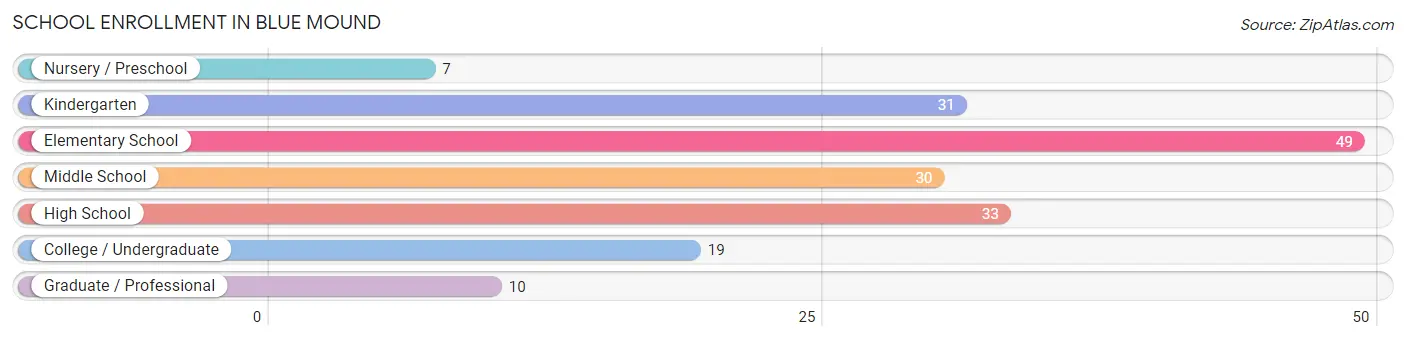
| School Level | # Students | % Students |
| Nursery / Preschool | 7 | 3.9% |
| Kindergarten | 31 | 17.3% |
| Elementary School | 49 | 27.4% |
| Middle School | 30 | 16.8% |
| High School | 33 | 18.4% |
| College / Undergraduate | 19 | 10.6% |
| Graduate / Professional | 10 | 5.6% |
| Total | 179 | 100.0% |
School Enrollment by Age by Funding Source in Blue Mound
Out of a total of 179 students who are enrolled in schools in Blue Mound, 28 (15.6%) attend a private institution, while the remaining 151 (84.4%) are enrolled in public schools. The age group of 35 years and over has the highest likelihood of being enrolled in private schools, with 6 (85.7% in the age bracket) enrolled. Conversely, the age group of 3 to 4 year olds has the lowest likelihood of being enrolled in a private school, with 15 (100.0% in the age bracket) attending a public institution.
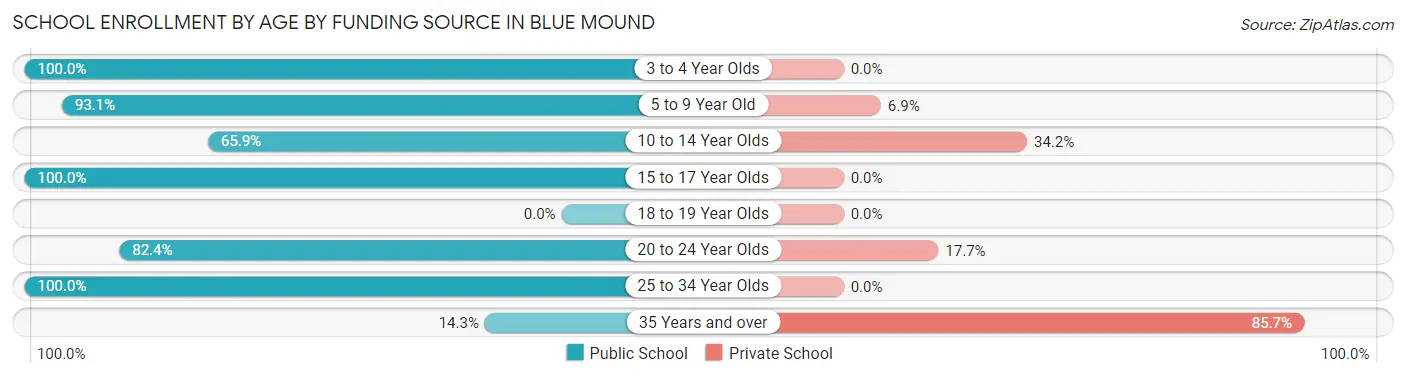
| Age Bracket | Public School | Private School |
| 3 to 4 Year Olds | 15 (100.0%) | 0 (0.0%) |
| 5 to 9 Year Old | 67 (93.1%) | 5 (6.9%) |
| 10 to 14 Year Olds | 27 (65.8%) | 14 (34.2%) |
| 15 to 17 Year Olds | 22 (100.0%) | 0 (0.0%) |
| 18 to 19 Year Olds | 0 (0.0%) | 0 (0.0%) |
| 20 to 24 Year Olds | 14 (82.4%) | 3 (17.6%) |
| 25 to 34 Year Olds | 5 (100.0%) | 0 (0.0%) |
| 35 Years and over | 1 (14.3%) | 6 (85.7%) |
| Total | 151 (84.4%) | 28 (15.6%) |
Educational Attainment by Field of Study in Blue Mound
Education (45 | 31.7%), business (21 | 14.8%), science & technology (20 | 14.1%), bio, nature & agricultural (12 | 8.5%), and social sciences (12 | 8.5%) are the most common fields of study among 142 individuals in Blue Mound who have obtained a bachelor's degree or higher.
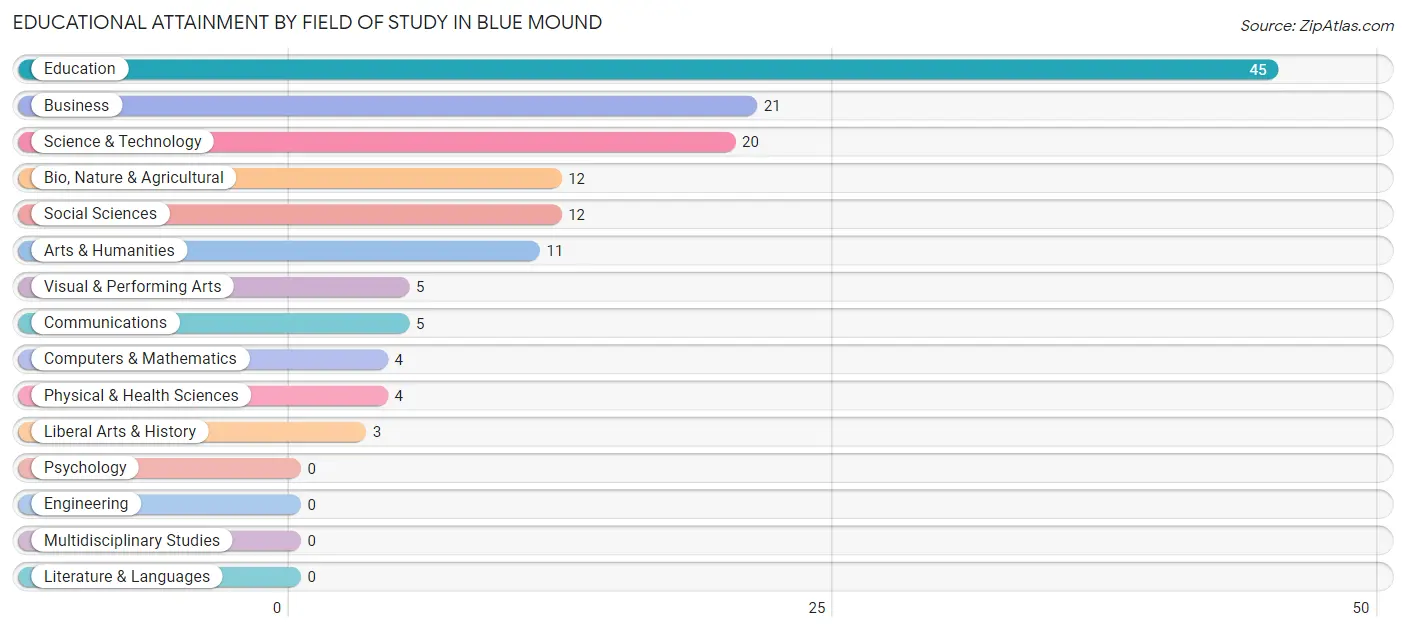
| Field of Study | # Graduates | % Graduates |
| Computers & Mathematics | 4 | 2.8% |
| Bio, Nature & Agricultural | 12 | 8.5% |
| Physical & Health Sciences | 4 | 2.8% |
| Psychology | 0 | 0.0% |
| Social Sciences | 12 | 8.5% |
| Engineering | 0 | 0.0% |
| Multidisciplinary Studies | 0 | 0.0% |
| Science & Technology | 20 | 14.1% |
| Business | 21 | 14.8% |
| Education | 45 | 31.7% |
| Literature & Languages | 0 | 0.0% |
| Liberal Arts & History | 3 | 2.1% |
| Visual & Performing Arts | 5 | 3.5% |
| Communications | 5 | 3.5% |
| Arts & Humanities | 11 | 7.7% |
| Total | 142 | 100.0% |
Transportation & Commute in Blue Mound
Vehicle Availability by Sex in Blue Mound
The most prevalent vehicle ownership categories in Blue Mound are males with 2 vehicles (103, accounting for 56.3%) and females with 2 vehicles (73, making up 41.5%).
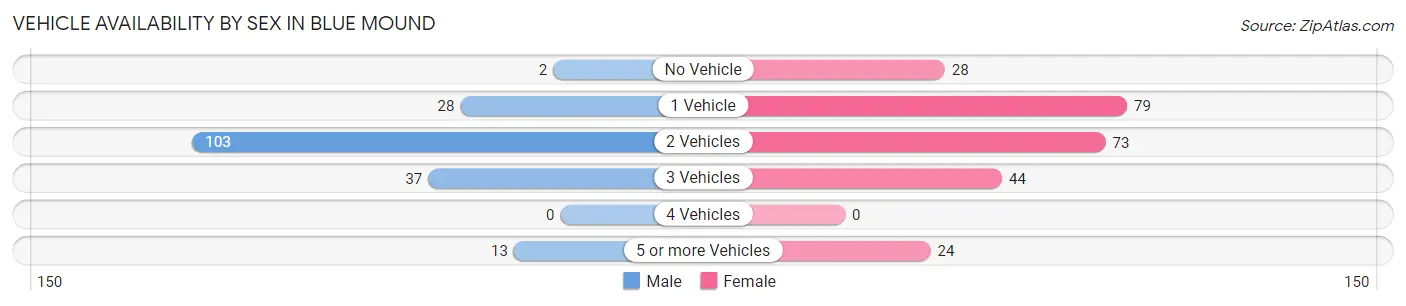
| Vehicles Available | Male | Female |
| No Vehicle | 2 (1.1%) | 28 (11.3%) |
| 1 Vehicle | 28 (15.3%) | 79 (31.9%) |
| 2 Vehicles | 103 (56.3%) | 73 (29.4%) |
| 3 Vehicles | 37 (20.2%) | 44 (17.7%) |
| 4 Vehicles | 0 (0.0%) | 0 (0.0%) |
| 5 or more Vehicles | 13 (7.1%) | 24 (9.7%) |
| Total | 183 (100.0%) | 248 (100.0%) |
Commute Time in Blue Mound
The most frequently occuring commute durations in Blue Mound are 30 to 34 minutes (114 commuters, 28.0%), 20 to 24 minutes (79 commuters, 19.4%), and 5 to 9 minutes (64 commuters, 15.7%).
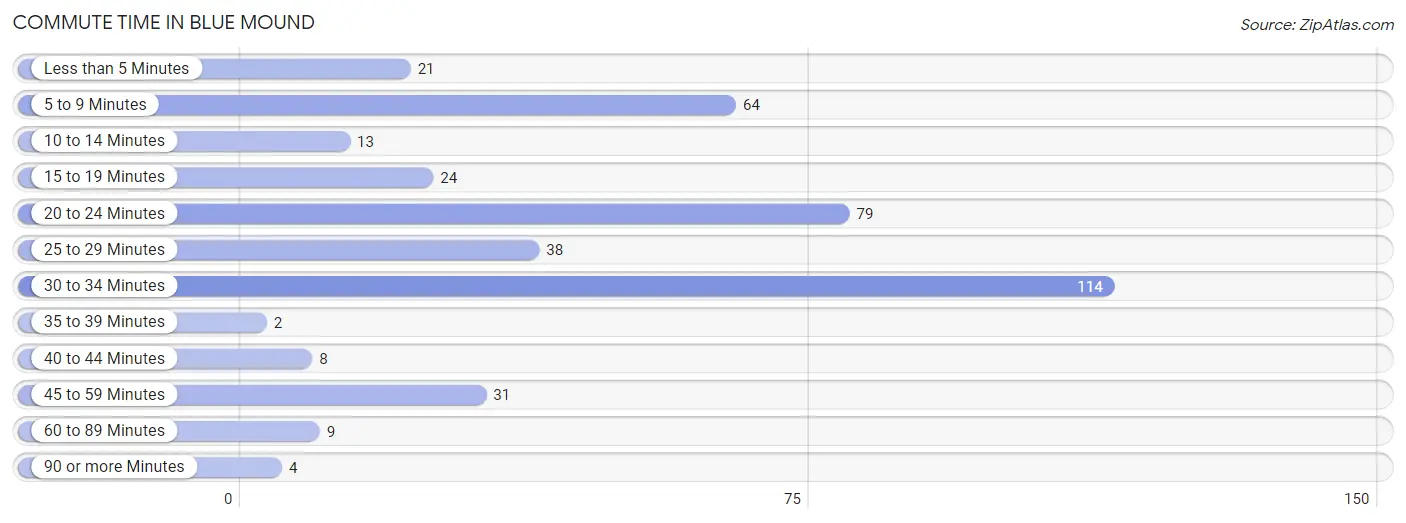
| Commute Time | # Commuters | % Commuters |
| Less than 5 Minutes | 21 | 5.2% |
| 5 to 9 Minutes | 64 | 15.7% |
| 10 to 14 Minutes | 13 | 3.2% |
| 15 to 19 Minutes | 24 | 5.9% |
| 20 to 24 Minutes | 79 | 19.4% |
| 25 to 29 Minutes | 38 | 9.3% |
| 30 to 34 Minutes | 114 | 28.0% |
| 35 to 39 Minutes | 2 | 0.5% |
| 40 to 44 Minutes | 8 | 2.0% |
| 45 to 59 Minutes | 31 | 7.6% |
| 60 to 89 Minutes | 9 | 2.2% |
| 90 or more Minutes | 4 | 1.0% |
Commute Time by Sex in Blue Mound
The most common commute times in Blue Mound are 30 to 34 minutes (61 commuters, 33.3%) for males and 5 to 9 minutes (55 commuters, 24.5%) for females.
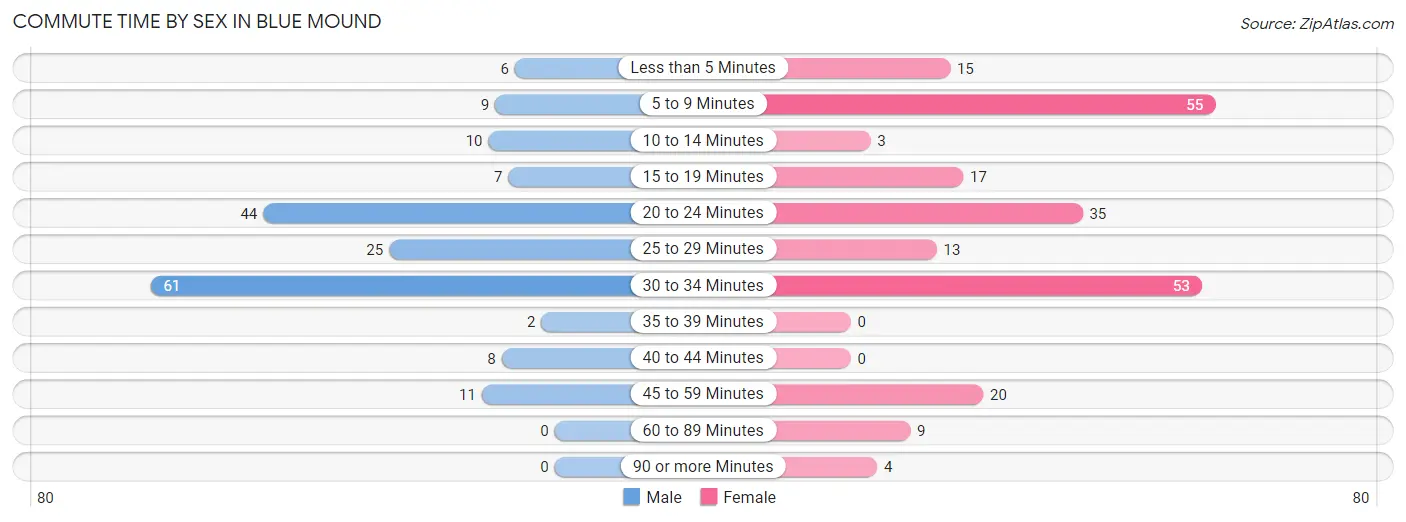
| Commute Time | Male | Female |
| Less than 5 Minutes | 6 (3.3%) | 15 (6.7%) |
| 5 to 9 Minutes | 9 (4.9%) | 55 (24.5%) |
| 10 to 14 Minutes | 10 (5.5%) | 3 (1.3%) |
| 15 to 19 Minutes | 7 (3.8%) | 17 (7.6%) |
| 20 to 24 Minutes | 44 (24.0%) | 35 (15.6%) |
| 25 to 29 Minutes | 25 (13.7%) | 13 (5.8%) |
| 30 to 34 Minutes | 61 (33.3%) | 53 (23.7%) |
| 35 to 39 Minutes | 2 (1.1%) | 0 (0.0%) |
| 40 to 44 Minutes | 8 (4.4%) | 0 (0.0%) |
| 45 to 59 Minutes | 11 (6.0%) | 20 (8.9%) |
| 60 to 89 Minutes | 0 (0.0%) | 9 (4.0%) |
| 90 or more Minutes | 0 (0.0%) | 4 (1.8%) |
Time of Departure to Work by Sex in Blue Mound
The most frequent times of departure to work in Blue Mound are 6:00 AM to 6:29 AM (45, 24.6%) for males and 7:00 AM to 7:29 AM (59, 26.3%) for females.
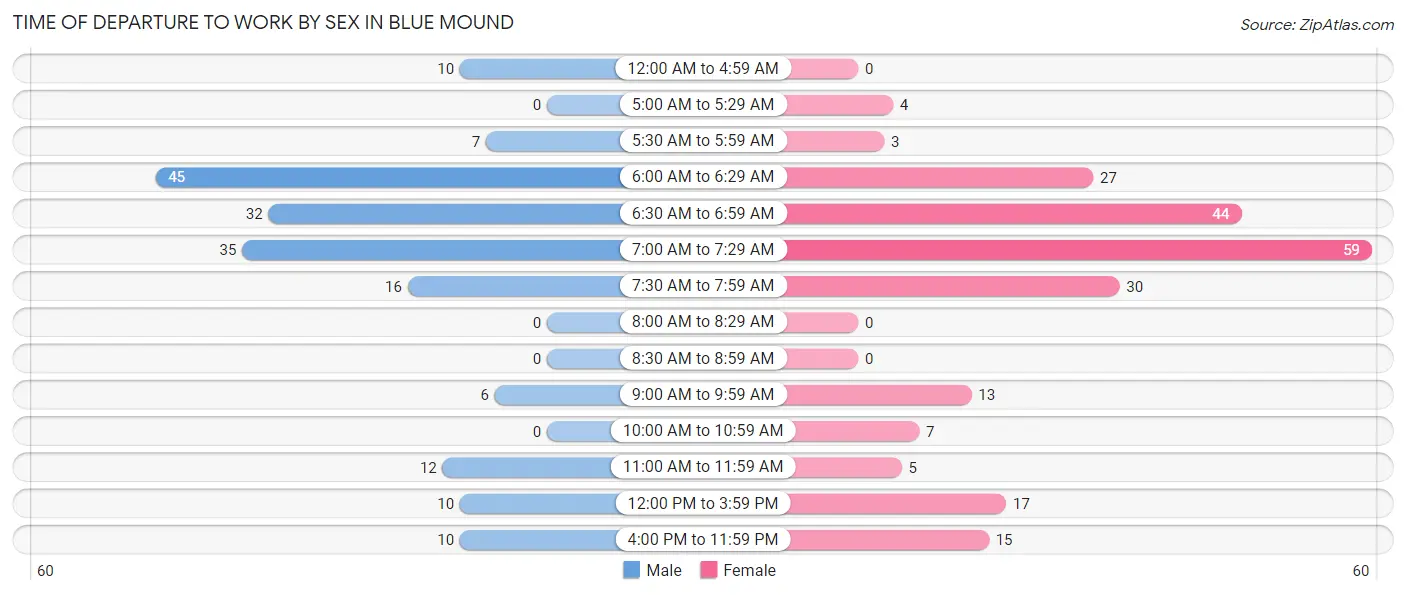
| Time of Departure | Male | Female |
| 12:00 AM to 4:59 AM | 10 (5.5%) | 0 (0.0%) |
| 5:00 AM to 5:29 AM | 0 (0.0%) | 4 (1.8%) |
| 5:30 AM to 5:59 AM | 7 (3.8%) | 3 (1.3%) |
| 6:00 AM to 6:29 AM | 45 (24.6%) | 27 (12.0%) |
| 6:30 AM to 6:59 AM | 32 (17.5%) | 44 (19.6%) |
| 7:00 AM to 7:29 AM | 35 (19.1%) | 59 (26.3%) |
| 7:30 AM to 7:59 AM | 16 (8.7%) | 30 (13.4%) |
| 8:00 AM to 8:29 AM | 0 (0.0%) | 0 (0.0%) |
| 8:30 AM to 8:59 AM | 0 (0.0%) | 0 (0.0%) |
| 9:00 AM to 9:59 AM | 6 (3.3%) | 13 (5.8%) |
| 10:00 AM to 10:59 AM | 0 (0.0%) | 7 (3.1%) |
| 11:00 AM to 11:59 AM | 12 (6.6%) | 5 (2.2%) |
| 12:00 PM to 3:59 PM | 10 (5.5%) | 17 (7.6%) |
| 4:00 PM to 11:59 PM | 10 (5.5%) | 15 (6.7%) |
| Total | 183 (100.0%) | 224 (100.0%) |
Housing Occupancy in Blue Mound
Occupancy by Ownership in Blue Mound
Of the total 450 dwellings in Blue Mound, owner-occupied units account for 367 (81.6%), while renter-occupied units make up 83 (18.4%).
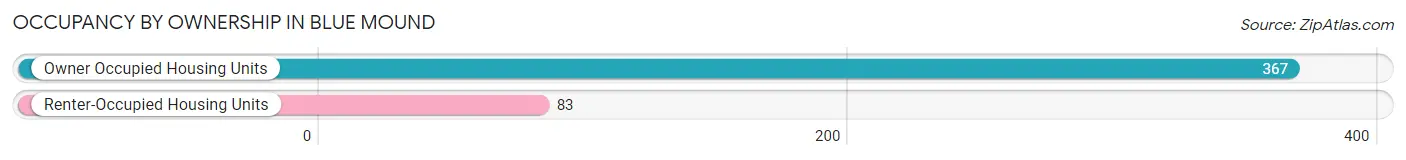
| Occupancy | # Housing Units | % Housing Units |
| Owner Occupied Housing Units | 367 | 81.6% |
| Renter-Occupied Housing Units | 83 | 18.4% |
| Total Occupied Housing Units | 450 | 100.0% |
Occupancy by Household Size in Blue Mound
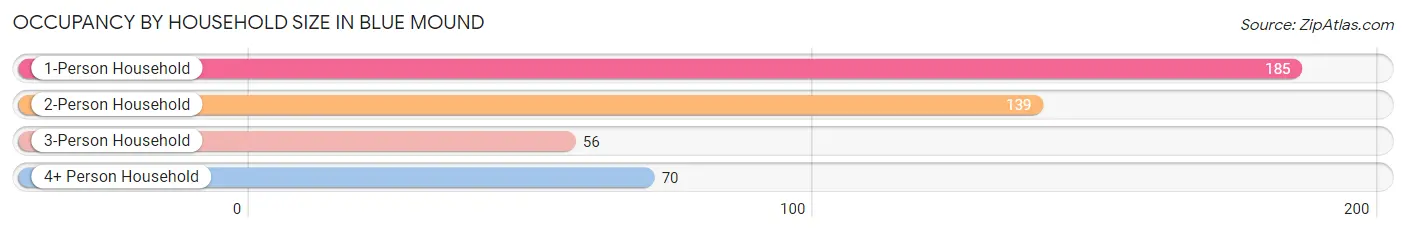
| Household Size | # Housing Units | % Housing Units |
| 1-Person Household | 185 | 41.1% |
| 2-Person Household | 139 | 30.9% |
| 3-Person Household | 56 | 12.4% |
| 4+ Person Household | 70 | 15.6% |
| Total Housing Units | 450 | 100.0% |
Occupancy by Ownership by Household Size in Blue Mound
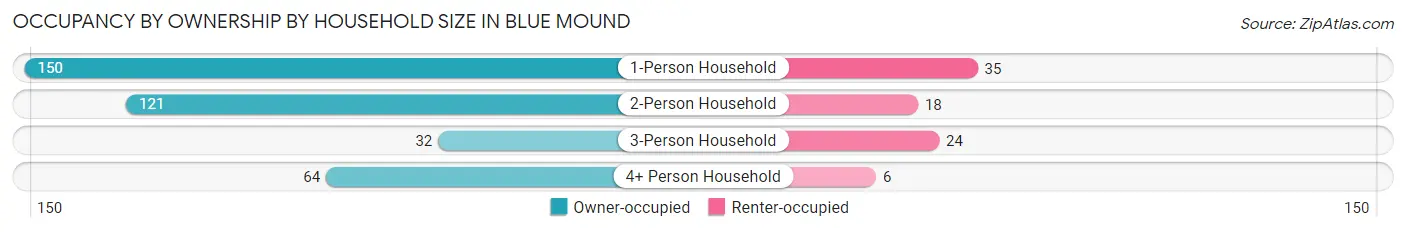
| Household Size | Owner-occupied | Renter-occupied |
| 1-Person Household | 150 (81.1%) | 35 (18.9%) |
| 2-Person Household | 121 (87.1%) | 18 (13.0%) |
| 3-Person Household | 32 (57.1%) | 24 (42.9%) |
| 4+ Person Household | 64 (91.4%) | 6 (8.6%) |
| Total Housing Units | 367 (81.6%) | 83 (18.4%) |
Occupancy by Educational Attainment in Blue Mound
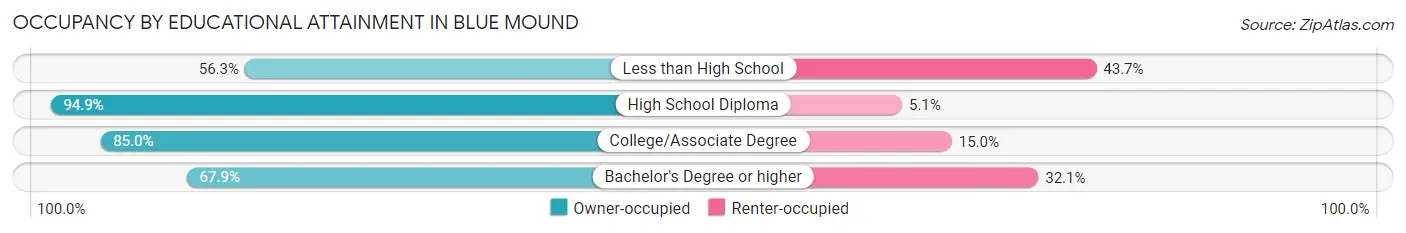
| Household Size | Owner-occupied | Renter-occupied |
| Less than High School | 40 (56.3%) | 31 (43.7%) |
| High School Diploma | 185 (94.9%) | 10 (5.1%) |
| College/Associate Degree | 85 (85.0%) | 15 (15.0%) |
| Bachelor's Degree or higher | 57 (67.9%) | 27 (32.1%) |
Occupancy by Age of Householder in Blue Mound
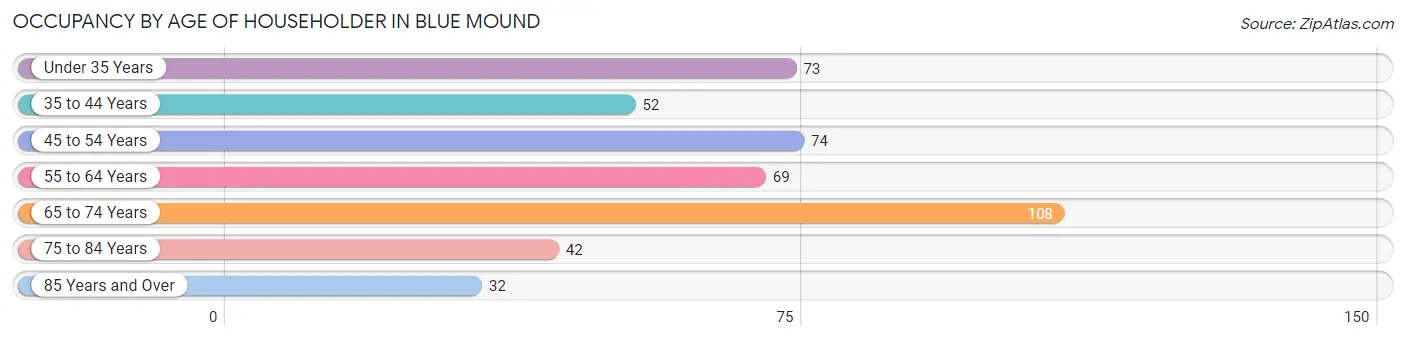
| Age Bracket | # Households | % Households |
| Under 35 Years | 73 | 16.2% |
| 35 to 44 Years | 52 | 11.6% |
| 45 to 54 Years | 74 | 16.4% |
| 55 to 64 Years | 69 | 15.3% |
| 65 to 74 Years | 108 | 24.0% |
| 75 to 84 Years | 42 | 9.3% |
| 85 Years and Over | 32 | 7.1% |
| Total | 450 | 100.0% |
Housing Finances in Blue Mound
Median Income by Occupancy in Blue Mound
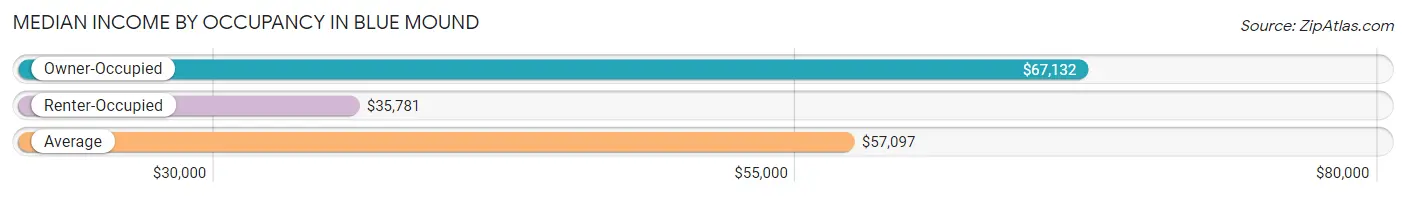
| Occupancy Type | # Households | Median Income |
| Owner-Occupied | 367 (81.6%) | $67,132 |
| Renter-Occupied | 83 (18.4%) | $35,781 |
| Average | 450 (100.0%) | $57,097 |
Occupancy by Householder Income Bracket in Blue Mound
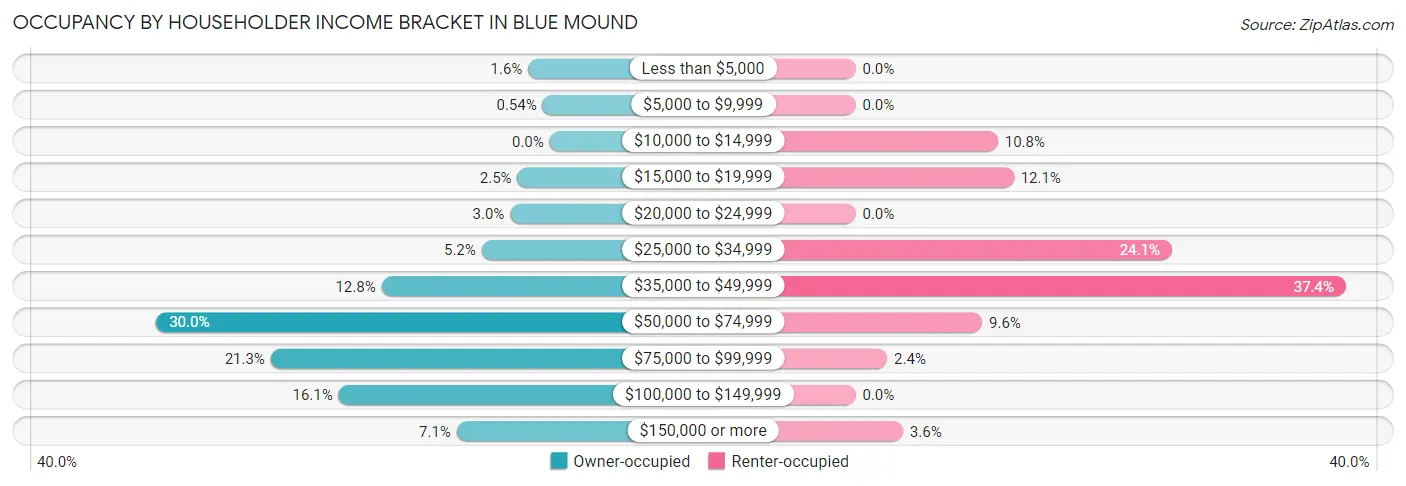
| Income Bracket | Owner-occupied | Renter-occupied |
| Less than $5,000 | 6 (1.6%) | 0 (0.0%) |
| $5,000 to $9,999 | 2 (0.5%) | 0 (0.0%) |
| $10,000 to $14,999 | 0 (0.0%) | 9 (10.8%) |
| $15,000 to $19,999 | 9 (2.5%) | 10 (12.0%) |
| $20,000 to $24,999 | 11 (3.0%) | 0 (0.0%) |
| $25,000 to $34,999 | 19 (5.2%) | 20 (24.1%) |
| $35,000 to $49,999 | 47 (12.8%) | 31 (37.3%) |
| $50,000 to $74,999 | 110 (30.0%) | 8 (9.6%) |
| $75,000 to $99,999 | 78 (21.2%) | 2 (2.4%) |
| $100,000 to $149,999 | 59 (16.1%) | 0 (0.0%) |
| $150,000 or more | 26 (7.1%) | 3 (3.6%) |
| Total | 367 (100.0%) | 83 (100.0%) |
Monthly Housing Cost Tiers in Blue Mound
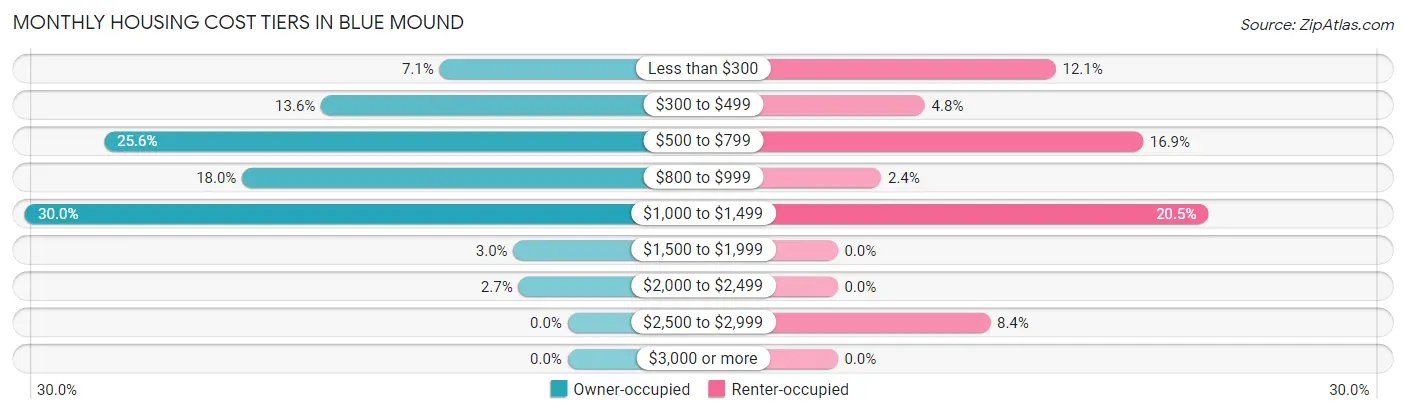
| Monthly Cost | Owner-occupied | Renter-occupied |
| Less than $300 | 26 (7.1%) | 10 (12.0%) |
| $300 to $499 | 50 (13.6%) | 4 (4.8%) |
| $500 to $799 | 94 (25.6%) | 14 (16.9%) |
| $800 to $999 | 66 (18.0%) | 2 (2.4%) |
| $1,000 to $1,499 | 110 (30.0%) | 17 (20.5%) |
| $1,500 to $1,999 | 11 (3.0%) | 0 (0.0%) |
| $2,000 to $2,499 | 10 (2.7%) | 0 (0.0%) |
| $2,500 to $2,999 | 0 (0.0%) | 7 (8.4%) |
| $3,000 or more | 0 (0.0%) | 0 (0.0%) |
| Total | 367 (100.0%) | 83 (100.0%) |
Physical Housing Characteristics in Blue Mound
Housing Structures in Blue Mound
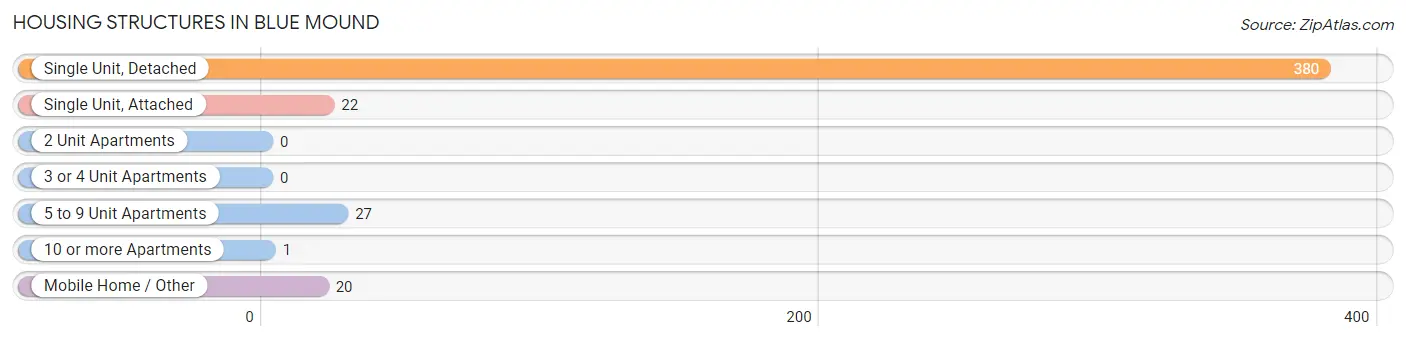
| Structure Type | # Housing Units | % Housing Units |
| Single Unit, Detached | 380 | 84.4% |
| Single Unit, Attached | 22 | 4.9% |
| 2 Unit Apartments | 0 | 0.0% |
| 3 or 4 Unit Apartments | 0 | 0.0% |
| 5 to 9 Unit Apartments | 27 | 6.0% |
| 10 or more Apartments | 1 | 0.2% |
| Mobile Home / Other | 20 | 4.4% |
| Total | 450 | 100.0% |
Housing Structures by Occupancy in Blue Mound
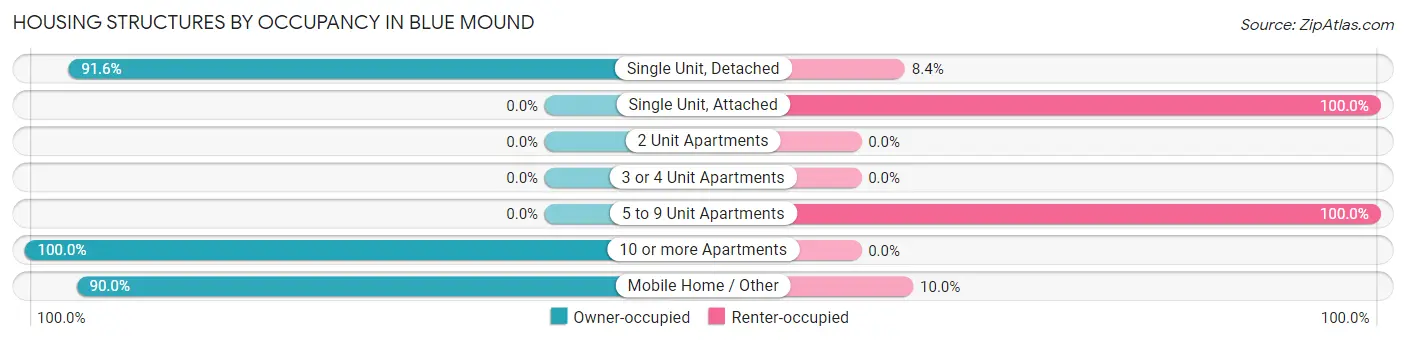
| Structure Type | Owner-occupied | Renter-occupied |
| Single Unit, Detached | 348 (91.6%) | 32 (8.4%) |
| Single Unit, Attached | 0 (0.0%) | 22 (100.0%) |
| 2 Unit Apartments | 0 (0.0%) | 0 (0.0%) |
| 3 or 4 Unit Apartments | 0 (0.0%) | 0 (0.0%) |
| 5 to 9 Unit Apartments | 0 (0.0%) | 27 (100.0%) |
| 10 or more Apartments | 1 (100.0%) | 0 (0.0%) |
| Mobile Home / Other | 18 (90.0%) | 2 (10.0%) |
| Total | 367 (81.6%) | 83 (18.4%) |
Housing Structures by Number of Rooms in Blue Mound
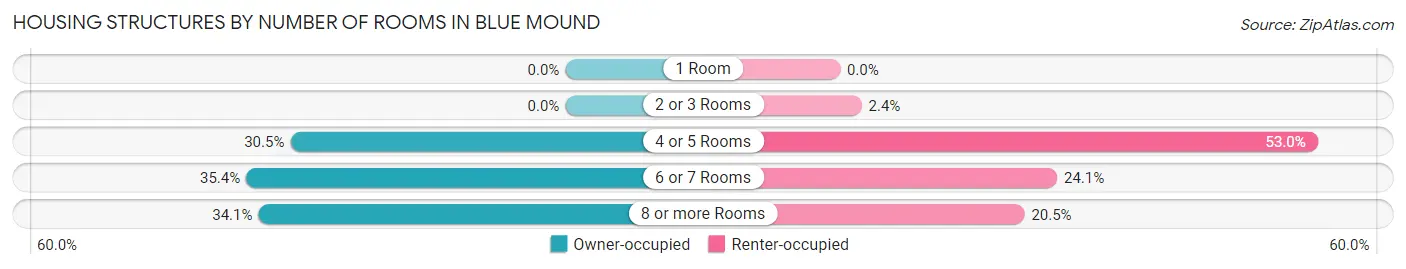
| Number of Rooms | Owner-occupied | Renter-occupied |
| 1 Room | 0 (0.0%) | 0 (0.0%) |
| 2 or 3 Rooms | 0 (0.0%) | 2 (2.4%) |
| 4 or 5 Rooms | 112 (30.5%) | 44 (53.0%) |
| 6 or 7 Rooms | 130 (35.4%) | 20 (24.1%) |
| 8 or more Rooms | 125 (34.1%) | 17 (20.5%) |
| Total | 367 (100.0%) | 83 (100.0%) |
Housing Structure by Heating Type in Blue Mound
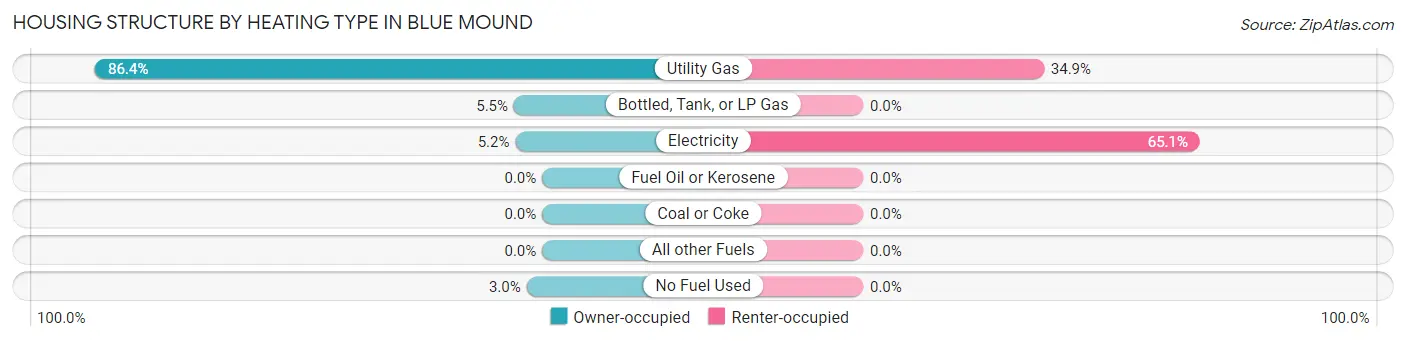
| Heating Type | Owner-occupied | Renter-occupied |
| Utility Gas | 317 (86.4%) | 29 (34.9%) |
| Bottled, Tank, or LP Gas | 20 (5.4%) | 0 (0.0%) |
| Electricity | 19 (5.2%) | 54 (65.1%) |
| Fuel Oil or Kerosene | 0 (0.0%) | 0 (0.0%) |
| Coal or Coke | 0 (0.0%) | 0 (0.0%) |
| All other Fuels | 0 (0.0%) | 0 (0.0%) |
| No Fuel Used | 11 (3.0%) | 0 (0.0%) |
| Total | 367 (100.0%) | 83 (100.0%) |
Household Vehicle Usage in Blue Mound
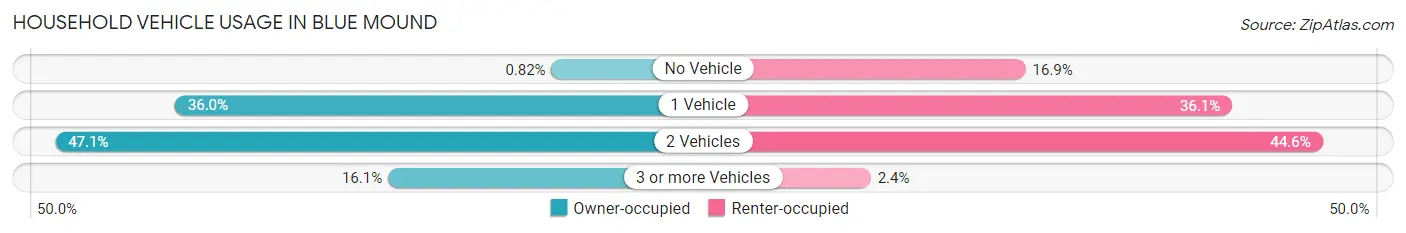
| Vehicles per Household | Owner-occupied | Renter-occupied |
| No Vehicle | 3 (0.8%) | 14 (16.9%) |
| 1 Vehicle | 132 (36.0%) | 30 (36.1%) |
| 2 Vehicles | 173 (47.1%) | 37 (44.6%) |
| 3 or more Vehicles | 59 (16.1%) | 2 (2.4%) |
| Total | 367 (100.0%) | 83 (100.0%) |
Real Estate & Mortgages in Blue Mound
Real Estate and Mortgage Overview in Blue Mound
| Characteristic | Without Mortgage | With Mortgage |
| Housing Units | 165 | 202 |
| Median Property Value | $92,300 | $107,700 |
| Median Household Income | $69,135 | $15 |
| Monthly Housing Costs | $518 | $0 |
| Real Estate Taxes | $2,245 | $0 |
Property Value by Mortgage Status in Blue Mound
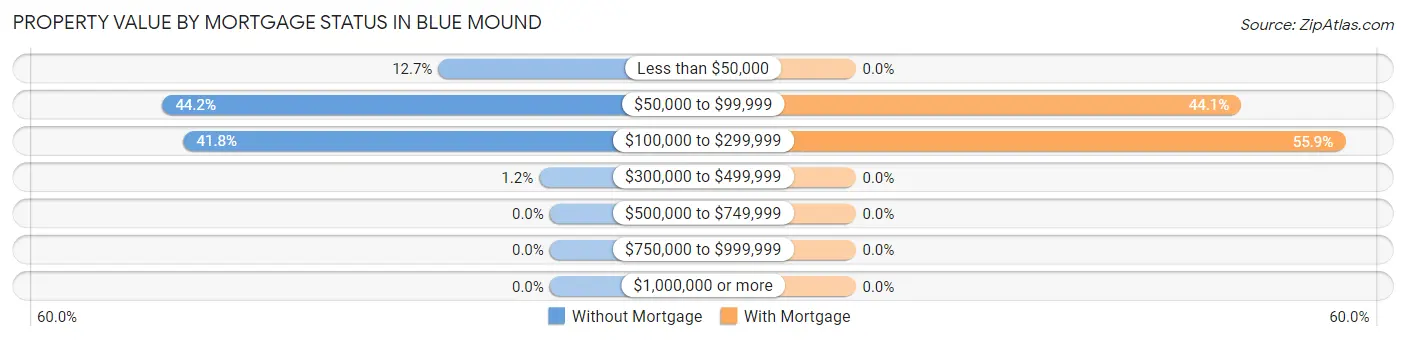
| Property Value | Without Mortgage | With Mortgage |
| Less than $50,000 | 21 (12.7%) | 0 (0.0%) |
| $50,000 to $99,999 | 73 (44.2%) | 89 (44.1%) |
| $100,000 to $299,999 | 69 (41.8%) | 113 (55.9%) |
| $300,000 to $499,999 | 2 (1.2%) | 0 (0.0%) |
| $500,000 to $749,999 | 0 (0.0%) | 0 (0.0%) |
| $750,000 to $999,999 | 0 (0.0%) | 0 (0.0%) |
| $1,000,000 or more | 0 (0.0%) | 0 (0.0%) |
| Total | 165 (100.0%) | 202 (100.0%) |
Household Income by Mortgage Status in Blue Mound
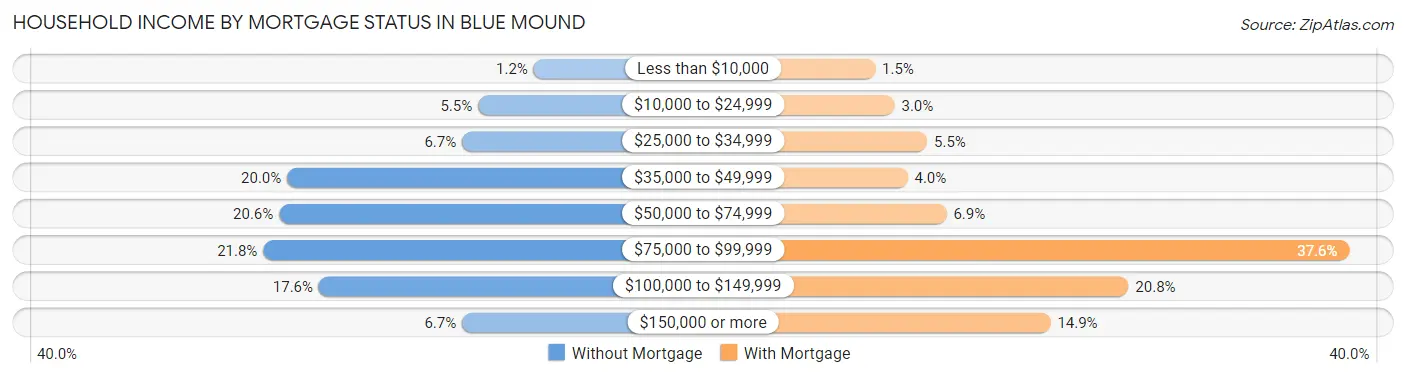
| Household Income | Without Mortgage | With Mortgage |
| Less than $10,000 | 2 (1.2%) | 3 (1.5%) |
| $10,000 to $24,999 | 9 (5.4%) | 6 (3.0%) |
| $25,000 to $34,999 | 11 (6.7%) | 11 (5.4%) |
| $35,000 to $49,999 | 33 (20.0%) | 8 (4.0%) |
| $50,000 to $74,999 | 34 (20.6%) | 14 (6.9%) |
| $75,000 to $99,999 | 36 (21.8%) | 76 (37.6%) |
| $100,000 to $149,999 | 29 (17.6%) | 42 (20.8%) |
| $150,000 or more | 11 (6.7%) | 30 (14.8%) |
| Total | 165 (100.0%) | 202 (100.0%) |
Property Value to Household Income Ratio in Blue Mound
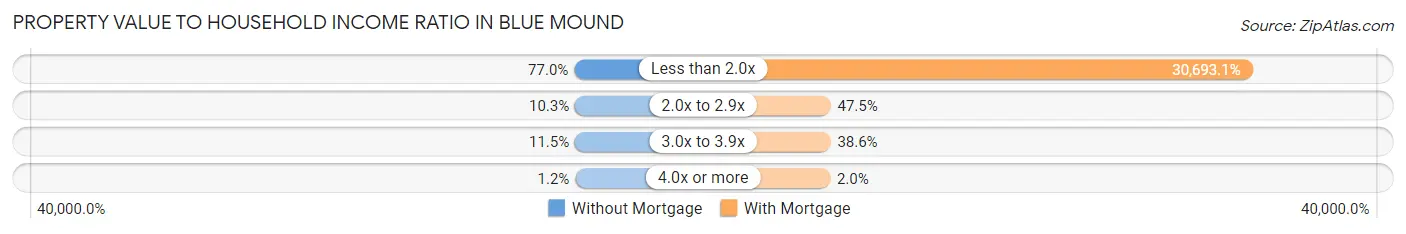
| Value-to-Income Ratio | Without Mortgage | With Mortgage |
| Less than 2.0x | 127 (77.0%) | 62,000 (30,693.1%) |
| 2.0x to 2.9x | 17 (10.3%) | 96 (47.5%) |
| 3.0x to 3.9x | 19 (11.5%) | 78 (38.6%) |
| 4.0x or more | 2 (1.2%) | 4 (2.0%) |
| Total | 165 (100.0%) | 202 (100.0%) |
Real Estate Taxes by Mortgage Status in Blue Mound
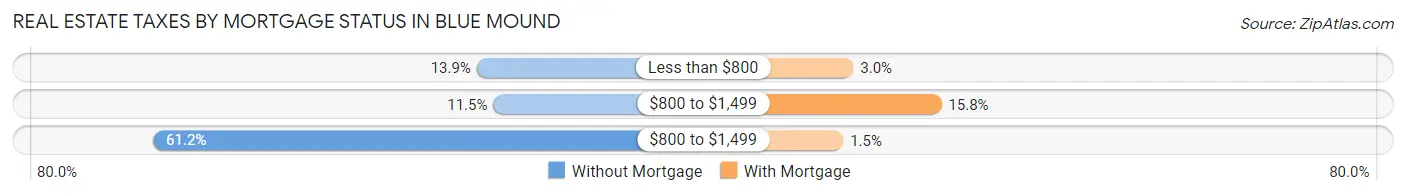
| Property Taxes | Without Mortgage | With Mortgage |
| Less than $800 | 23 (13.9%) | 6 (3.0%) |
| $800 to $1,499 | 19 (11.5%) | 32 (15.8%) |
| $800 to $1,499 | 101 (61.2%) | 3 (1.5%) |
| Total | 165 (100.0%) | 202 (100.0%) |
Health & Disability in Blue Mound
Health Insurance Coverage by Age in Blue Mound
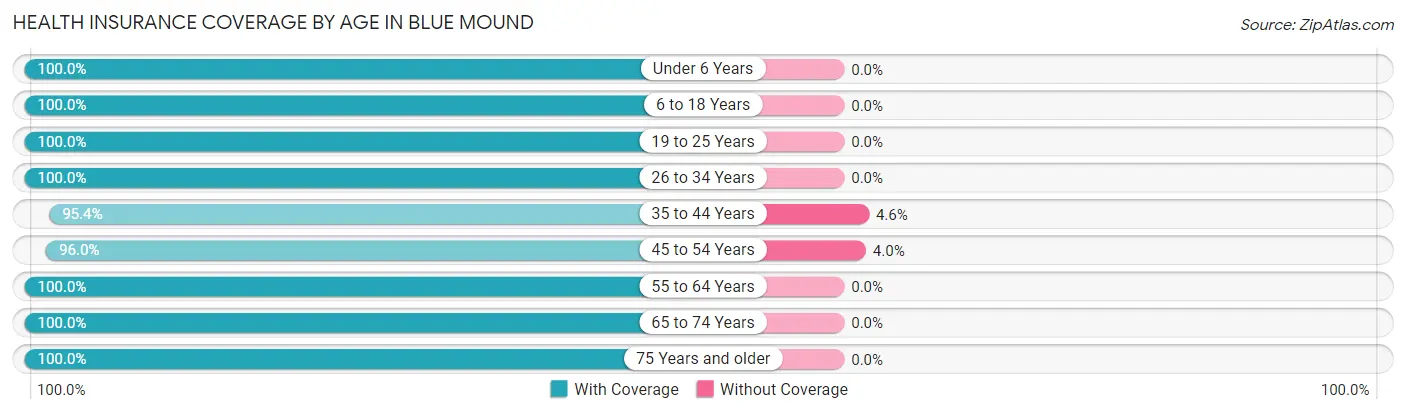
| Age Bracket | With Coverage | Without Coverage |
| Under 6 Years | 65 (100.0%) | 0 (0.0%) |
| 6 to 18 Years | 114 (100.0%) | 0 (0.0%) |
| 19 to 25 Years | 56 (100.0%) | 0 (0.0%) |
| 26 to 34 Years | 103 (100.0%) | 0 (0.0%) |
| 35 to 44 Years | 83 (95.4%) | 4 (4.6%) |
| 45 to 54 Years | 119 (96.0%) | 5 (4.0%) |
| 55 to 64 Years | 129 (100.0%) | 0 (0.0%) |
| 65 to 74 Years | 149 (100.0%) | 0 (0.0%) |
| 75 Years and older | 107 (100.0%) | 0 (0.0%) |
| Total | 925 (99.0%) | 9 (1.0%) |
Health Insurance Coverage by Citizenship Status in Blue Mound
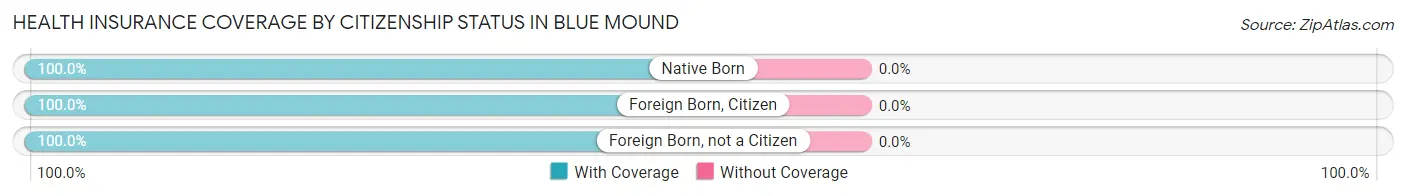
| Citizenship Status | With Coverage | Without Coverage |
| Native Born | 65 (100.0%) | 0 (0.0%) |
| Foreign Born, Citizen | 114 (100.0%) | 0 (0.0%) |
| Foreign Born, not a Citizen | 56 (100.0%) | 0 (0.0%) |
Health Insurance Coverage by Household Income in Blue Mound
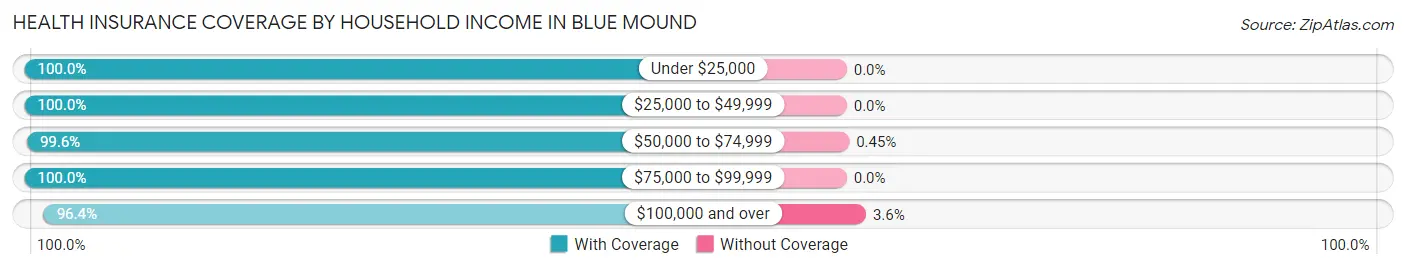
| Household Income | With Coverage | Without Coverage |
| Under $25,000 | 66 (100.0%) | 0 (0.0%) |
| $25,000 to $49,999 | 211 (100.0%) | 0 (0.0%) |
| $50,000 to $74,999 | 223 (99.6%) | 1 (0.4%) |
| $75,000 to $99,999 | 210 (100.0%) | 0 (0.0%) |
| $100,000 and over | 215 (96.4%) | 8 (3.6%) |
Public vs Private Health Insurance Coverage by Age in Blue Mound
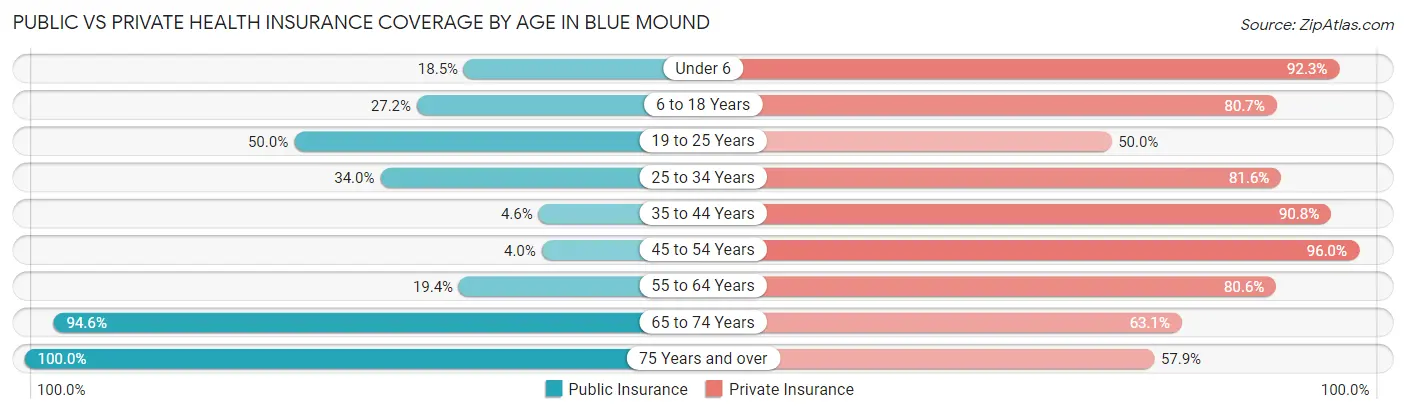
| Age Bracket | Public Insurance | Private Insurance |
| Under 6 | 12 (18.5%) | 60 (92.3%) |
| 6 to 18 Years | 31 (27.2%) | 92 (80.7%) |
| 19 to 25 Years | 28 (50.0%) | 28 (50.0%) |
| 25 to 34 Years | 35 (34.0%) | 84 (81.6%) |
| 35 to 44 Years | 4 (4.6%) | 79 (90.8%) |
| 45 to 54 Years | 5 (4.0%) | 119 (96.0%) |
| 55 to 64 Years | 25 (19.4%) | 104 (80.6%) |
| 65 to 74 Years | 141 (94.6%) | 94 (63.1%) |
| 75 Years and over | 107 (100.0%) | 62 (57.9%) |
| Total | 388 (41.5%) | 722 (77.3%) |
Disability Status by Sex by Age in Blue Mound
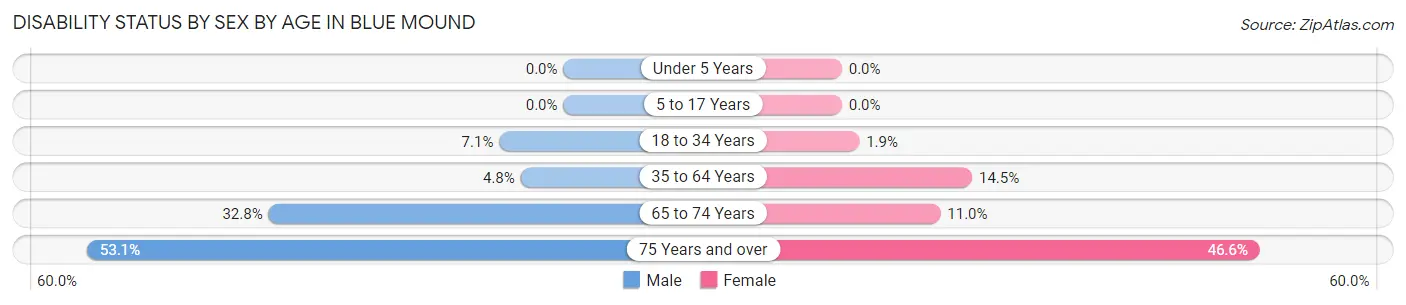
| Age Bracket | Male | Female |
| Under 5 Years | 0 (0.0%) | 0 (0.0%) |
| 5 to 17 Years | 0 (0.0%) | 0 (0.0%) |
| 18 to 34 Years | 4 (7.1%) | 2 (1.9%) |
| 35 to 64 Years | 7 (4.8%) | 28 (14.5%) |
| 65 to 74 Years | 22 (32.8%) | 9 (11.0%) |
| 75 Years and over | 26 (53.1%) | 27 (46.6%) |
Disability Class by Sex by Age in Blue Mound
Disability Class: Hearing Difficulty
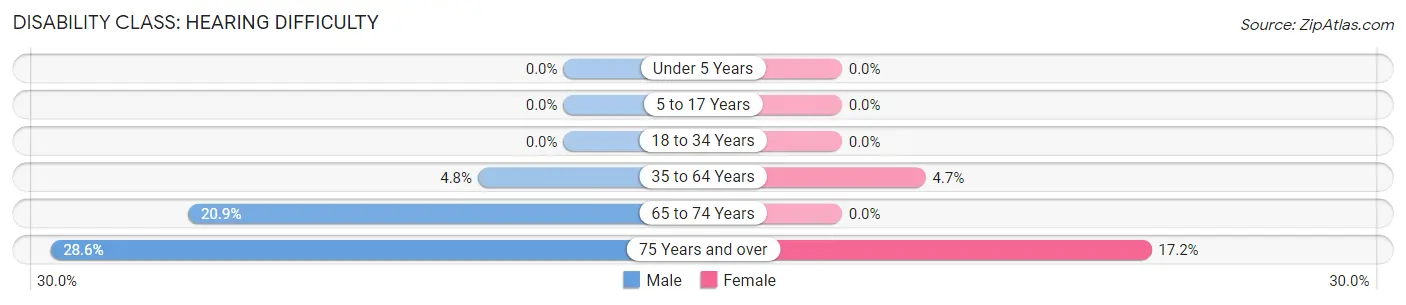
| Age Bracket | Male | Female |
| Under 5 Years | 0 (0.0%) | 0 (0.0%) |
| 5 to 17 Years | 0 (0.0%) | 0 (0.0%) |
| 18 to 34 Years | 0 (0.0%) | 0 (0.0%) |
| 35 to 64 Years | 7 (4.8%) | 9 (4.7%) |
| 65 to 74 Years | 14 (20.9%) | 0 (0.0%) |
| 75 Years and over | 14 (28.6%) | 10 (17.2%) |
Disability Class: Vision Difficulty
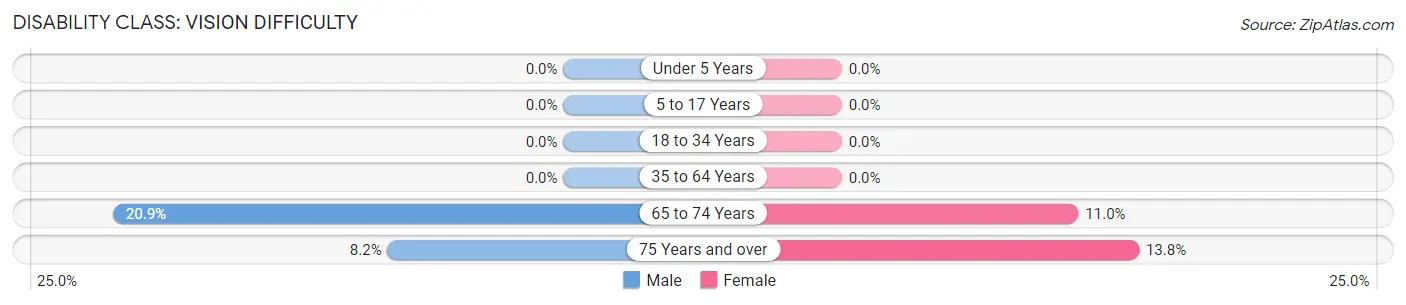
| Age Bracket | Male | Female |
| Under 5 Years | 0 (0.0%) | 0 (0.0%) |
| 5 to 17 Years | 0 (0.0%) | 0 (0.0%) |
| 18 to 34 Years | 0 (0.0%) | 0 (0.0%) |
| 35 to 64 Years | 0 (0.0%) | 0 (0.0%) |
| 65 to 74 Years | 14 (20.9%) | 9 (11.0%) |
| 75 Years and over | 4 (8.2%) | 8 (13.8%) |
Disability Class: Cognitive Difficulty
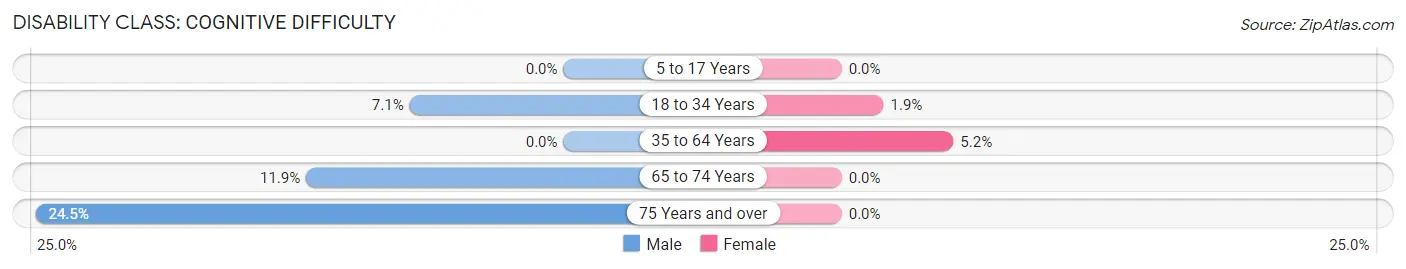
| Age Bracket | Male | Female |
| 5 to 17 Years | 0 (0.0%) | 0 (0.0%) |
| 18 to 34 Years | 4 (7.1%) | 2 (1.9%) |
| 35 to 64 Years | 0 (0.0%) | 10 (5.2%) |
| 65 to 74 Years | 8 (11.9%) | 0 (0.0%) |
| 75 Years and over | 12 (24.5%) | 0 (0.0%) |
Disability Class: Ambulatory Difficulty
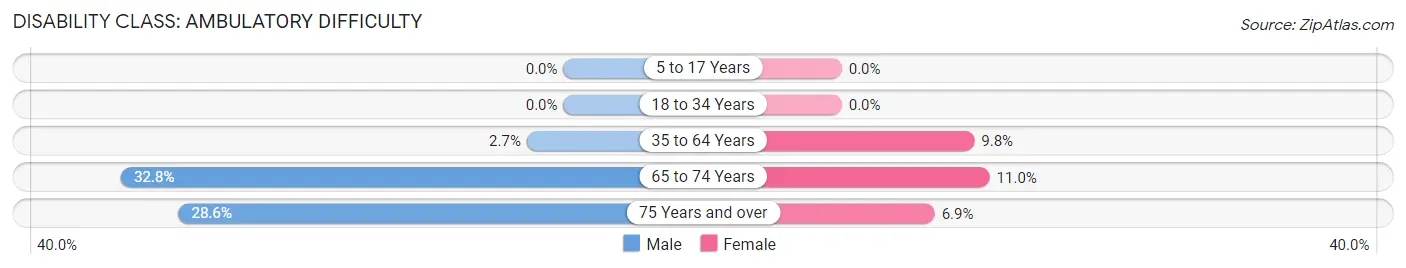
| Age Bracket | Male | Female |
| 5 to 17 Years | 0 (0.0%) | 0 (0.0%) |
| 18 to 34 Years | 0 (0.0%) | 0 (0.0%) |
| 35 to 64 Years | 4 (2.7%) | 19 (9.8%) |
| 65 to 74 Years | 22 (32.8%) | 9 (11.0%) |
| 75 Years and over | 14 (28.6%) | 4 (6.9%) |
Disability Class: Self-Care Difficulty
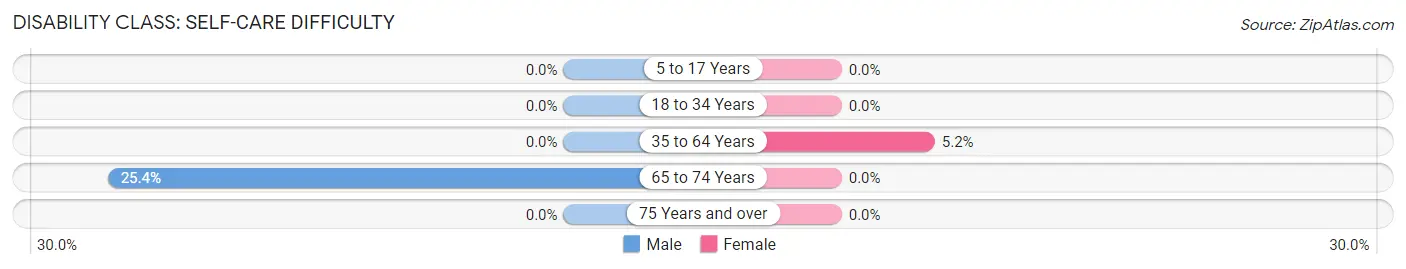
| Age Bracket | Male | Female |
| 5 to 17 Years | 0 (0.0%) | 0 (0.0%) |
| 18 to 34 Years | 0 (0.0%) | 0 (0.0%) |
| 35 to 64 Years | 0 (0.0%) | 10 (5.2%) |
| 65 to 74 Years | 17 (25.4%) | 0 (0.0%) |
| 75 Years and over | 0 (0.0%) | 0 (0.0%) |
Technology Access in Blue Mound
Computing Device Access in Blue Mound
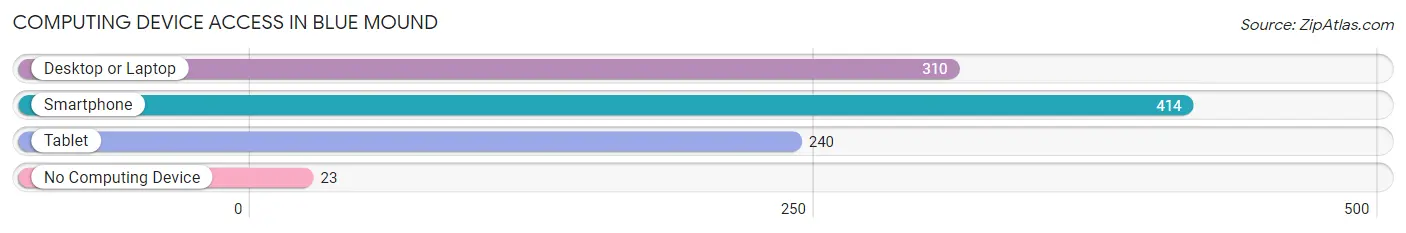
| Device Type | # Households | % Households |
| Desktop or Laptop | 310 | 68.9% |
| Smartphone | 414 | 92.0% |
| Tablet | 240 | 53.3% |
| No Computing Device | 23 | 5.1% |
| Total | 450 | 100.0% |
Internet Access in Blue Mound
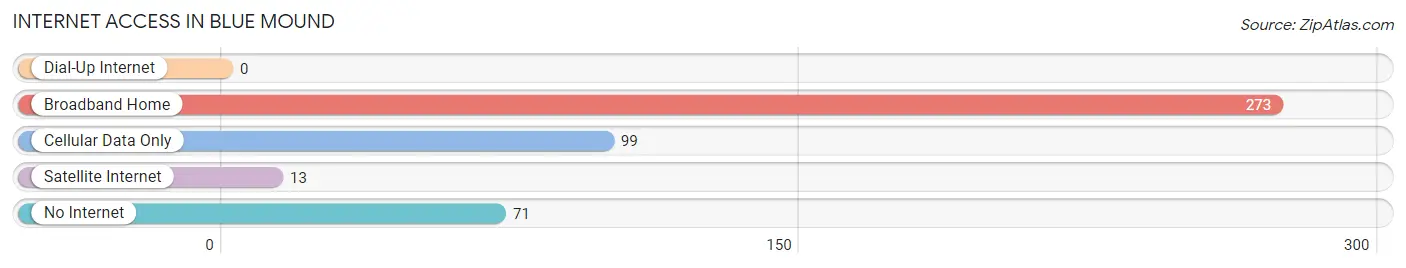
| Internet Type | # Households | % Households |
| Dial-Up Internet | 0 | 0.0% |
| Broadband Home | 273 | 60.7% |
| Cellular Data Only | 99 | 22.0% |
| Satellite Internet | 13 | 2.9% |
| No Internet | 71 | 15.8% |
| Total | 450 | 100.0% |
Blue Mound Summary
Blue Mound, Illinois is a small village located in Macon County, Illinois. It is situated in the heart of the state, about 25 miles south of Decatur and about 30 miles north of Springfield. The village has a population of 1,845 people, according to the 2010 census.
The history of Blue Mound dates back to the early 1800s when the area was first settled by pioneers. The village was officially incorporated in 1867 and was named after a nearby hill that was said to be blue in color. The village was a farming community for many years, but in the late 19th century, the railroad came through and the village began to grow. The railroad brought new businesses and industries to the area, and the village began to thrive.
The geography of Blue Mound is mostly flat, with some rolling hills in the area. The village is located in the Sangamon River Valley, and the Sangamon River runs through the village. The village is also located near the Macon County Conservation Area, which is a popular spot for outdoor activities.
The economy of Blue Mound is largely based on agriculture and manufacturing. The village is home to several large farms, and the surrounding area is known for its production of corn, soybeans, and other crops. The village also has several manufacturing plants, including a paper mill and a plastics factory.
The demographics of Blue Mound are mostly white, with a small percentage of African Americans and Hispanics. The median household income is $45,000, and the median home value is $90,000. The village has a low unemployment rate, and the majority of the population is employed in either agriculture or manufacturing.
Blue Mound is a small village with a rich history and a bright future. The village is home to a diverse population, and the economy is largely based on agriculture and manufacturing. The village is also located near several outdoor attractions, making it a great place to live and visit.
Common Questions
What is Per Capita Income in Blue Mound?
Per Capita income in Blue Mound is $33,249.
What is the Median Family Income in Blue Mound?
Median Family Income in Blue Mound is $75,250.
What is the Median Household income in Blue Mound?
Median Household Income in Blue Mound is $57,097.
What is Income or Wage Gap in Blue Mound?
Income or Wage Gap in Blue Mound is 48.2%.
Women in Blue Mound earn 51.8 cents for every dollar earned by a man.
What is Inequality or Gini Index in Blue Mound?
Inequality or Gini Index in Blue Mound is 0.34.
What is the Total Population of Blue Mound?
Total Population of Blue Mound is 934.
What is the Total Male Population of Blue Mound?
Total Male Population of Blue Mound is 411.
What is the Total Female Population of Blue Mound?
Total Female Population of Blue Mound is 523.
What is the Ratio of Males per 100 Females in Blue Mound?
There are 78.59 Males per 100 Females in Blue Mound.
What is the Ratio of Females per 100 Males in Blue Mound?
There are 127.25 Females per 100 Males in Blue Mound.
What is the Median Population Age in Blue Mound?
Median Population Age in Blue Mound is 50.7 Years.
What is the Average Family Size in Blue Mound
Average Family Size in Blue Mound is 2.8 People.
What is the Average Household Size in Blue Mound
Average Household Size in Blue Mound is 2.1 People.
How Large is the Labor Force in Blue Mound?
There are 440 People in the Labor Forcein in Blue Mound.
What is the Percentage of People in the Labor Force in Blue Mound?
56.8% of People are in the Labor Force in Blue Mound.
What is the Unemployment Rate in Blue Mound?
Unemployment Rate in Blue Mound is 1.1%.