North Aurora, IL Map & Demographics
North Aurora Map
North Aurora Overview
$49,621
PER CAPITA INCOME
$122,340
AVG FAMILY INCOME
$104,547
AVG HOUSEHOLD INCOME
37.7%
WAGE / INCOME GAP [ % ]
62.3¢/ $1
WAGE / INCOME GAP [ $ ]
0.39
INEQUALITY / GINI INDEX
17,750
TOTAL POPULATION
8,628
MALE POPULATION
9,122
FEMALE POPULATION
94.58
MALES / 100 FEMALES
105.73
FEMALES / 100 MALES
41.4
MEDIAN AGE
3.2
AVG FAMILY SIZE
2.6
AVG HOUSEHOLD SIZE
10,336
LABOR FORCE [ PEOPLE ]
71.7%
PERCENT IN LABOR FORCE
7.2%
UNEMPLOYMENT RATE
North Aurora Zip Codes
Income in North Aurora
Income Overview in North Aurora
Per Capita Income in North Aurora is $49,621, while median incomes of families and households are $122,340 and $104,547 respectively.
| Characteristic | Number | Measure |
| Per Capita Income | 17,750 | $49,621 |
| Median Family Income | 4,460 | $122,340 |
| Mean Family Income | 4,460 | $145,624 |
| Median Household Income | 6,841 | $104,547 |
| Mean Household Income | 6,841 | $129,724 |
| Income Deficit | 4,460 | $0 |
| Wage / Income Gap (%) | 17,750 | 37.74% |
| Wage / Income Gap ($) | 17,750 | 62.26¢ per $1 |
| Gini / Inequality Index | 17,750 | 0.39 |
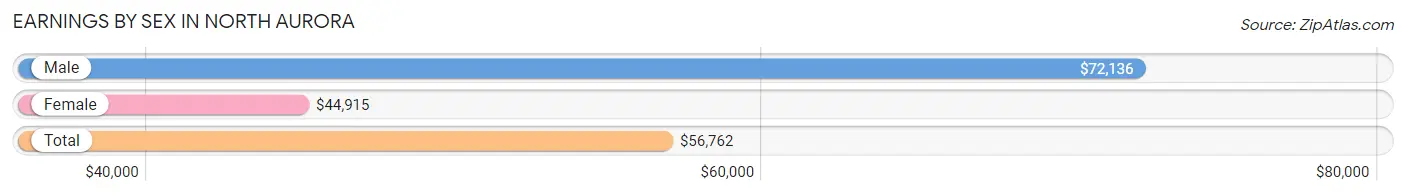
Earnings by Sex in North Aurora
Average Earnings in North Aurora are $56,762, $72,136 for men and $44,915 for women, a difference of 37.7%.
| Sex | Number | Average Earnings |
| Male | 5,321 (51.2%) | $72,136 |
| Female | 5,079 (48.8%) | $44,915 |
| Total | 10,400 (100.0%) | $56,762 |
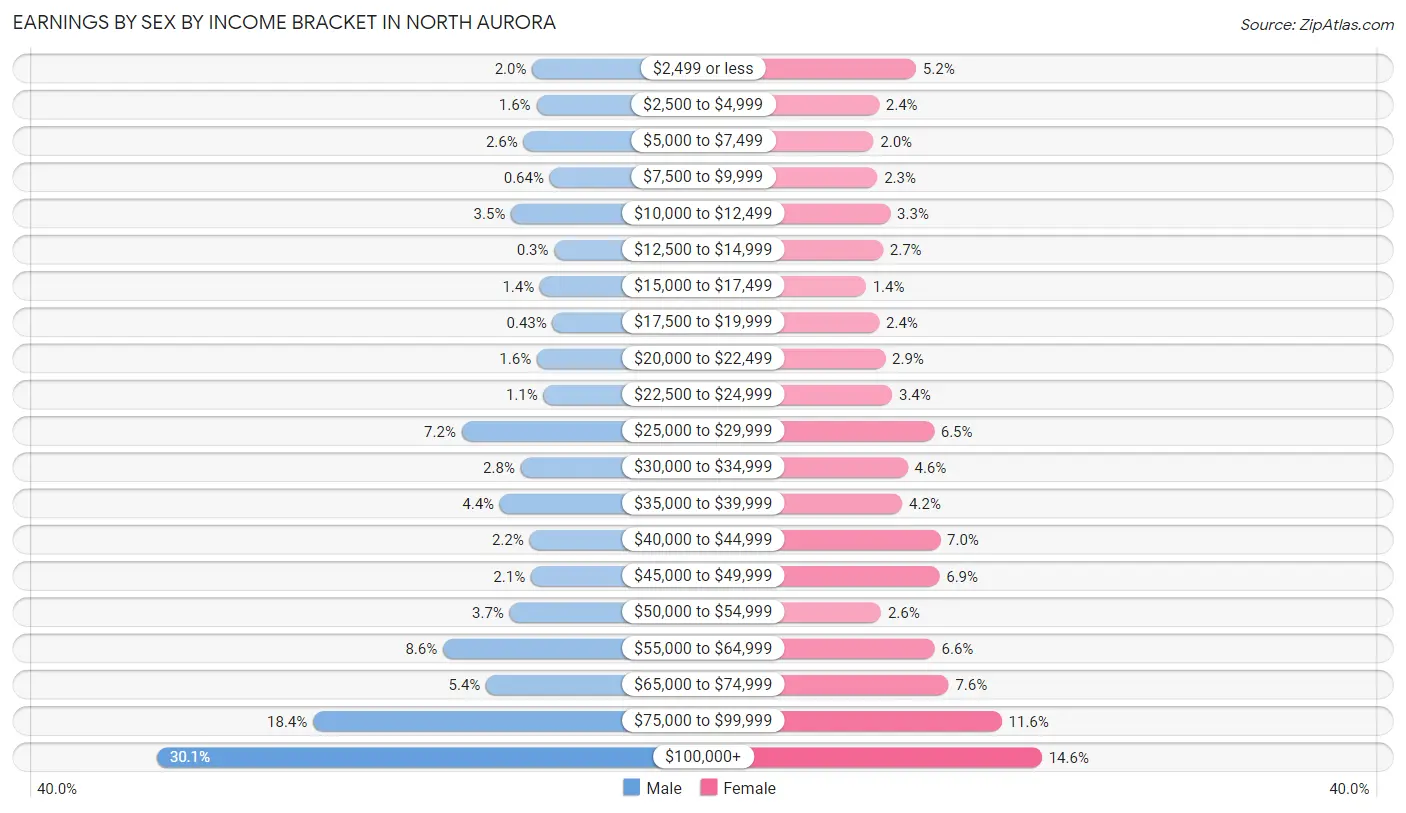
Earnings by Sex by Income Bracket in North Aurora
The most common earnings brackets in North Aurora are $100,000+ for men (1,601 | 30.1%) and $100,000+ for women (742 | 14.6%).
| Income | Male | Female |
| $2,499 or less | 104 (1.9%) | 263 (5.2%) |
| $2,500 to $4,999 | 87 (1.6%) | 122 (2.4%) |
| $5,000 to $7,499 | 139 (2.6%) | 101 (2.0%) |
| $7,500 to $9,999 | 34 (0.6%) | 116 (2.3%) |
| $10,000 to $12,499 | 188 (3.5%) | 165 (3.3%) |
| $12,500 to $14,999 | 16 (0.3%) | 137 (2.7%) |
| $15,000 to $17,499 | 73 (1.4%) | 72 (1.4%) |
| $17,500 to $19,999 | 23 (0.4%) | 123 (2.4%) |
| $20,000 to $22,499 | 85 (1.6%) | 146 (2.9%) |
| $22,500 to $24,999 | 59 (1.1%) | 172 (3.4%) |
| $25,000 to $29,999 | 385 (7.2%) | 331 (6.5%) |
| $30,000 to $34,999 | 150 (2.8%) | 231 (4.5%) |
| $35,000 to $39,999 | 233 (4.4%) | 211 (4.2%) |
| $40,000 to $44,999 | 115 (2.2%) | 355 (7.0%) |
| $45,000 to $49,999 | 109 (2.1%) | 352 (6.9%) |
| $50,000 to $54,999 | 194 (3.6%) | 130 (2.6%) |
| $55,000 to $64,999 | 460 (8.6%) | 334 (6.6%) |
| $65,000 to $74,999 | 288 (5.4%) | 387 (7.6%) |
| $75,000 to $99,999 | 978 (18.4%) | 589 (11.6%) |
| $100,000+ | 1,601 (30.1%) | 742 (14.6%) |
| Total | 5,321 (100.0%) | 5,079 (100.0%) |
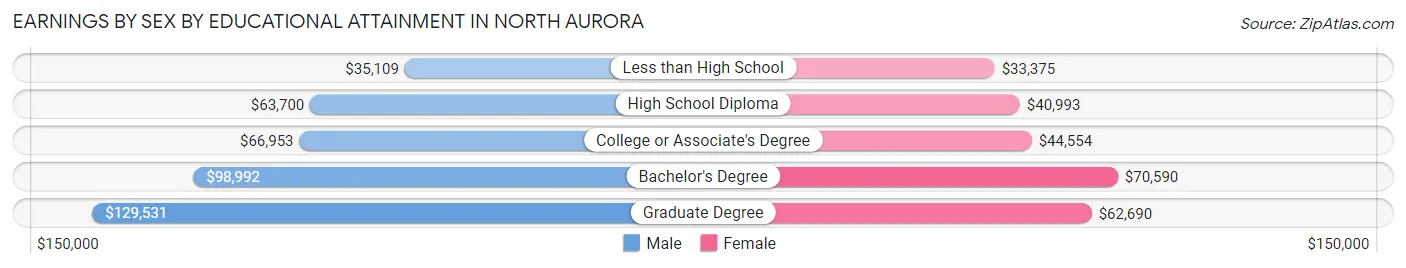
Earnings by Sex by Educational Attainment in North Aurora
Average earnings in North Aurora are $80,428 for men and $49,824 for women, a difference of 38.1%. Men with an educational attainment of graduate degree enjoy the highest average annual earnings of $129,531, while those with less than high school education earn the least with $35,109. Women with an educational attainment of bachelor's degree earn the most with the average annual earnings of $70,590, while those with less than high school education have the smallest earnings of $33,375.
| Educational Attainment | Male Income | Female Income |
| Less than High School | $35,109 | $33,375 |
| High School Diploma | $63,700 | $40,993 |
| College or Associate's Degree | $66,953 | $44,554 |
| Bachelor's Degree | $98,992 | $70,590 |
| Graduate Degree | $129,531 | $62,690 |
| Total | $80,428 | $49,824 |
Family Income in North Aurora
Family Income Brackets in North Aurora
According to the North Aurora family income data, there are 1,021 families falling into the $100,000 to $149,999 income range, which is the most common income bracket and makes up 22.9% of all families. Conversely, the $15,000 to $24,999 income bracket is the least frequent group with only 4 families (0.1%) belonging to this category.
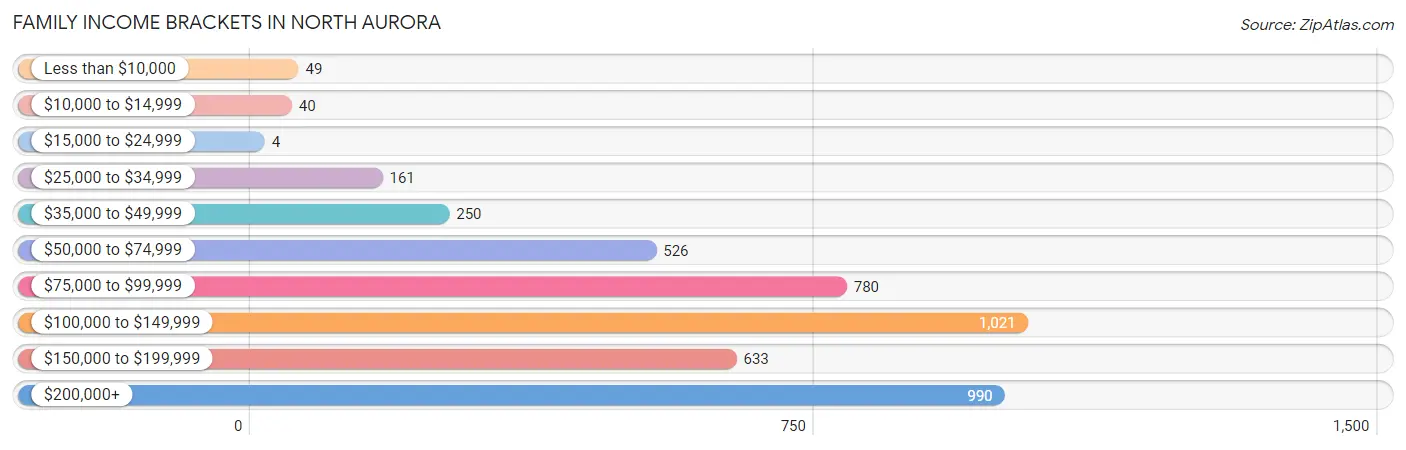
| Income Bracket | # Families | % Families |
| Less than $10,000 | 49 | 1.1% |
| $10,000 to $14,999 | 40 | 0.9% |
| $15,000 to $24,999 | 4 | 0.1% |
| $25,000 to $34,999 | 161 | 3.6% |
| $35,000 to $49,999 | 250 | 5.6% |
| $50,000 to $74,999 | 526 | 11.8% |
| $75,000 to $99,999 | 780 | 17.5% |
| $100,000 to $149,999 | 1,021 | 22.9% |
| $150,000 to $199,999 | 633 | 14.2% |
| $200,000+ | 990 | 22.2% |
Family Income by Famaliy Size in North Aurora
6-person families (93 | 2.1%) account for the highest median family income in North Aurora with $184,250 per family, while 2-person families (2,140 | 48.0%) have the highest median income of $55,280 per family member.
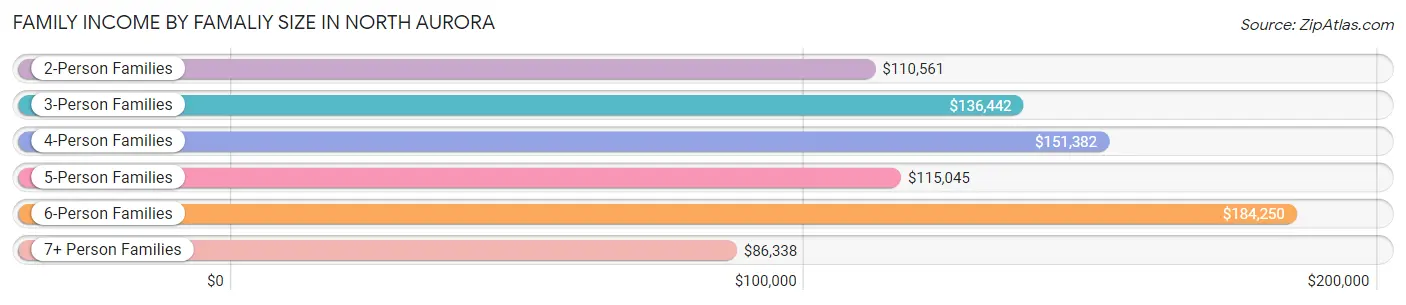
| Income Bracket | # Families | Median Income |
| 2-Person Families | 2,140 (48.0%) | $110,561 |
| 3-Person Families | 723 (16.2%) | $136,442 |
| 4-Person Families | 921 (20.6%) | $151,382 |
| 5-Person Families | 367 (8.2%) | $115,045 |
| 6-Person Families | 93 (2.1%) | $184,250 |
| 7+ Person Families | 216 (4.8%) | $86,338 |
| Total | 4,460 (100.0%) | $122,340 |
Family Income by Number of Earners in North Aurora
The median family income in North Aurora is $122,340, with families comprising 3+ earners (578) having the highest median family income of $183,802, while families with no earners (485) have the lowest median family income of $72,396, accounting for 13.0% and 10.9% of families, respectively.
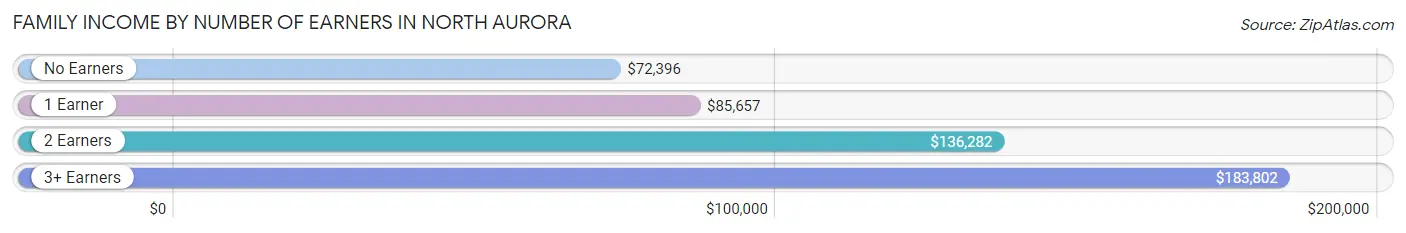
| Number of Earners | # Families | Median Income |
| No Earners | 485 (10.9%) | $72,396 |
| 1 Earner | 982 (22.0%) | $85,657 |
| 2 Earners | 2,415 (54.1%) | $136,282 |
| 3+ Earners | 578 (13.0%) | $183,802 |
| Total | 4,460 (100.0%) | $122,340 |
Household Income in North Aurora
Household Income Brackets in North Aurora
With 1,409 households falling in the category, the $200,000+ income range is the most frequent in North Aurora, accounting for 20.6% of all households. In contrast, only 75 households (1.1%) fall into the $10,000 to $14,999 income bracket, making it the least populous group.
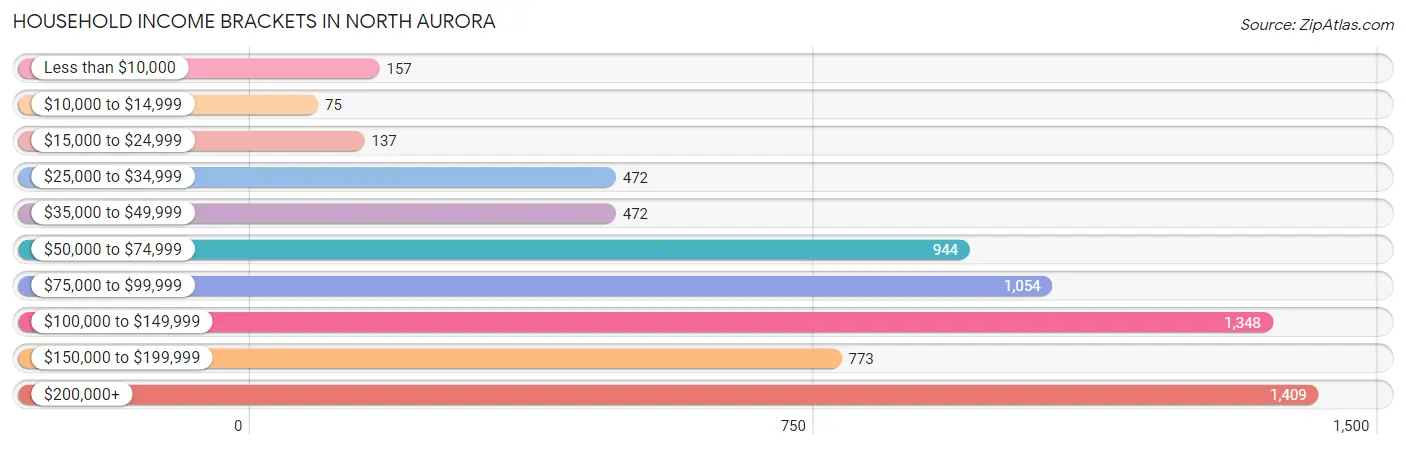
| Income Bracket | # Households | % Households |
| Less than $10,000 | 157 | 2.3% |
| $10,000 to $14,999 | 75 | 1.1% |
| $15,000 to $24,999 | 137 | 2.0% |
| $25,000 to $34,999 | 472 | 6.9% |
| $35,000 to $49,999 | 472 | 6.9% |
| $50,000 to $74,999 | 944 | 13.8% |
| $75,000 to $99,999 | 1,054 | 15.4% |
| $100,000 to $149,999 | 1,348 | 19.7% |
| $150,000 to $199,999 | 773 | 11.3% |
| $200,000+ | 1,409 | 20.6% |
Household Income by Householder Age in North Aurora
The median household income in North Aurora is $104,547, with the highest median household income of $121,389 found in the 45 to 64 years age bracket for the primary householder. A total of 3,344 households (48.9%) fall into this category. Meanwhile, the 65+ years age bracket for the primary householder has the lowest median household income of $70,378, with 1,427 households (20.9%) in this group.
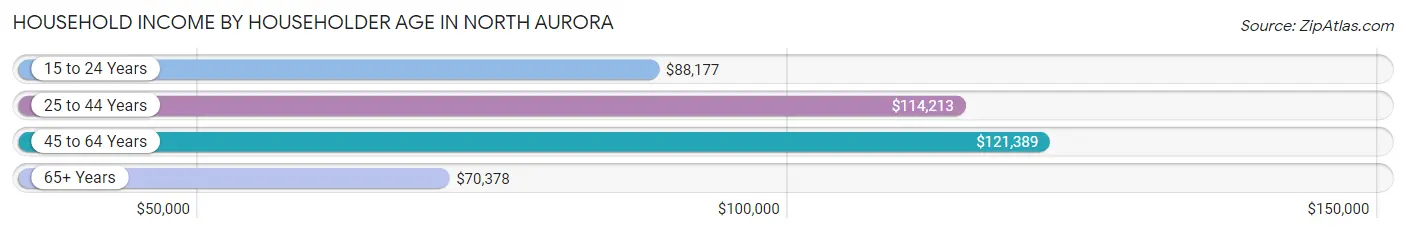
| Income Bracket | # Households | Median Income |
| 15 to 24 Years | 159 (2.3%) | $88,177 |
| 25 to 44 Years | 1,911 (27.9%) | $114,213 |
| 45 to 64 Years | 3,344 (48.9%) | $121,389 |
| 65+ Years | 1,427 (20.9%) | $70,378 |
| Total | 6,841 (100.0%) | $104,547 |
Poverty in North Aurora
Income Below Poverty by Sex and Age in North Aurora
With 6.3% poverty level for males and 5.5% for females among the residents of North Aurora, 5 year old males and 12 to 14 year old females are the most vulnerable to poverty, with 40 males (21.9%) and 76 females (27.2%) in their respective age groups living below the poverty level.
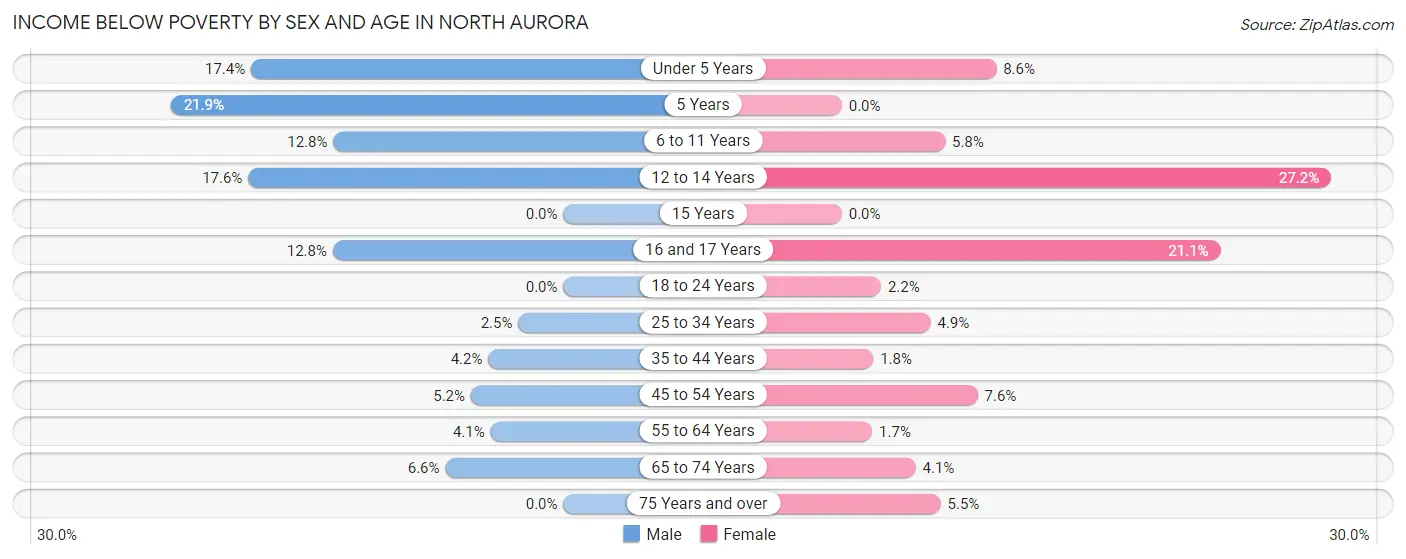
| Age Bracket | Male | Female |
| Under 5 Years | 76 (17.4%) | 46 (8.6%) |
| 5 Years | 40 (21.9%) | 0 (0.0%) |
| 6 to 11 Years | 77 (12.8%) | 38 (5.8%) |
| 12 to 14 Years | 56 (17.5%) | 76 (27.2%) |
| 15 Years | 0 (0.0%) | 0 (0.0%) |
| 16 and 17 Years | 33 (12.8%) | 43 (21.1%) |
| 18 to 24 Years | 0 (0.0%) | 15 (2.2%) |
| 25 to 34 Years | 29 (2.5%) | 68 (4.9%) |
| 35 to 44 Years | 40 (4.2%) | 19 (1.8%) |
| 45 to 54 Years | 77 (5.1%) | 105 (7.6%) |
| 55 to 64 Years | 59 (4.1%) | 22 (1.7%) |
| 65 to 74 Years | 48 (6.6%) | 28 (4.1%) |
| 75 Years and over | 0 (0.0%) | 34 (5.5%) |
| Total | 535 (6.3%) | 494 (5.5%) |
Income Above Poverty by Sex and Age in North Aurora
According to the poverty statistics in North Aurora, males aged 15 years and females aged 5 years are the age groups that are most secure financially, with 100.0% of males and 100.0% of females in these age groups living above the poverty line.
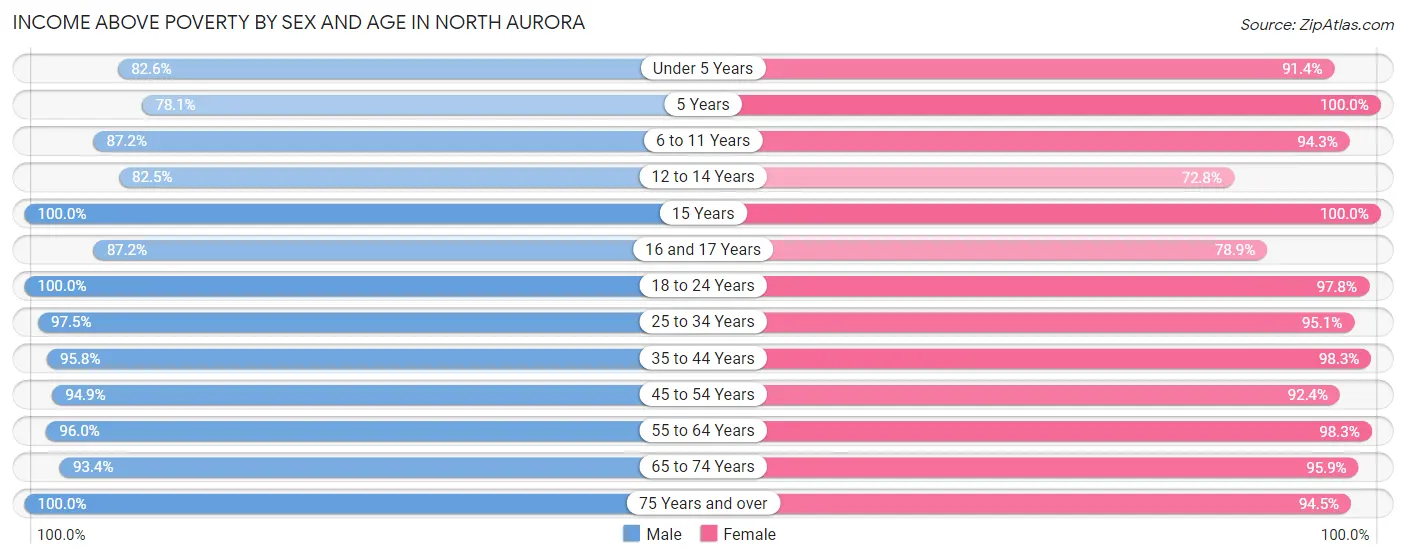
| Age Bracket | Male | Female |
| Under 5 Years | 361 (82.6%) | 489 (91.4%) |
| 5 Years | 143 (78.1%) | 134 (100.0%) |
| 6 to 11 Years | 524 (87.2%) | 623 (94.3%) |
| 12 to 14 Years | 263 (82.5%) | 203 (72.8%) |
| 15 Years | 91 (100.0%) | 35 (100.0%) |
| 16 and 17 Years | 224 (87.2%) | 161 (78.9%) |
| 18 to 24 Years | 503 (100.0%) | 672 (97.8%) |
| 25 to 34 Years | 1,127 (97.5%) | 1,308 (95.1%) |
| 35 to 44 Years | 916 (95.8%) | 1,064 (98.3%) |
| 45 to 54 Years | 1,418 (94.9%) | 1,283 (92.4%) |
| 55 to 64 Years | 1,398 (96.0%) | 1,279 (98.3%) |
| 65 to 74 Years | 683 (93.4%) | 654 (95.9%) |
| 75 Years and over | 316 (100.0%) | 584 (94.5%) |
| Total | 7,967 (93.7%) | 8,489 (94.5%) |
Income Below Poverty Among Married-Couple Families in North Aurora
The poverty statistics for married-couple families in North Aurora show that 1.6% or 56 of the total 3,591 families live below the poverty line. Families with 3 or 4 children have the highest poverty rate of 13.3%, comprising of 34 families. On the other hand, families with 1 or 2 children have the lowest poverty rate of 0.0%, which includes 0 families.
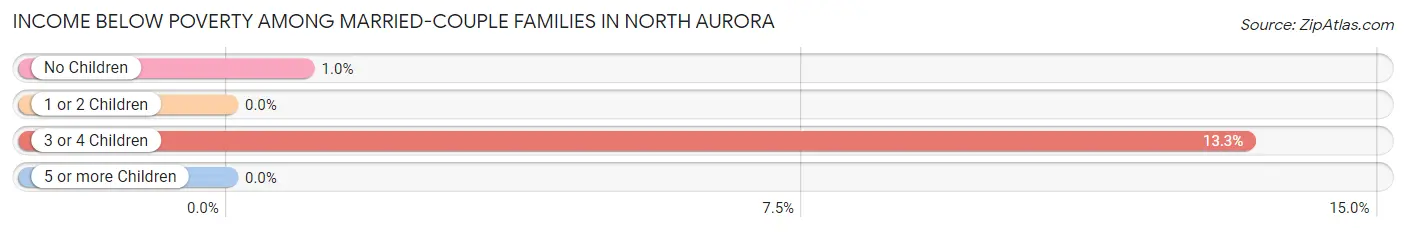
| Children | Above Poverty | Below Poverty |
| No Children | 2,181 (99.0%) | 22 (1.0%) |
| 1 or 2 Children | 1,117 (100.0%) | 0 (0.0%) |
| 3 or 4 Children | 222 (86.7%) | 34 (13.3%) |
| 5 or more Children | 15 (100.0%) | 0 (0.0%) |
| Total | 3,535 (98.4%) | 56 (1.6%) |
Income Below Poverty Among Single-Parent Households in North Aurora
According to the poverty data in North Aurora, 16.5% or 28 single-father households and 15.0% or 105 single-mother households are living below the poverty line. Among single-father households, those with 1 or 2 children have the highest poverty rate, with 28 households (31.5%) experiencing poverty. Likewise, among single-mother households, those with 5 or more children have the highest poverty rate, with 39 households (100.0%) falling below the poverty line.
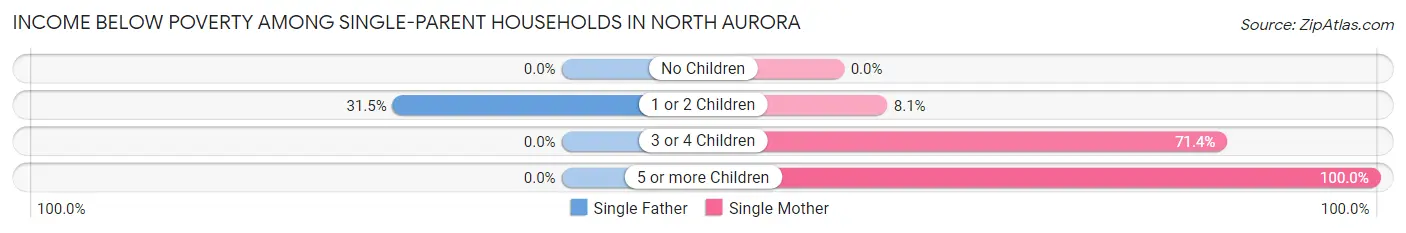
| Children | Single Father | Single Mother |
| No Children | 0 (0.0%) | 0 (0.0%) |
| 1 or 2 Children | 28 (31.5%) | 26 (8.1%) |
| 3 or 4 Children | 0 (0.0%) | 40 (71.4%) |
| 5 or more Children | 0 (0.0%) | 39 (100.0%) |
| Total | 28 (16.5%) | 105 (15.0%) |
Income Below Poverty Among Married-Couple vs Single-Parent Households in North Aurora
The poverty data for North Aurora shows that 56 of the married-couple family households (1.6%) and 133 of the single-parent households (15.3%) are living below the poverty level. Within the married-couple family households, those with 3 or 4 children have the highest poverty rate, with 34 households (13.3%) falling below the poverty line. Among the single-parent households, those with 5 or more children have the highest poverty rate, with 39 household (100.0%) living below poverty.
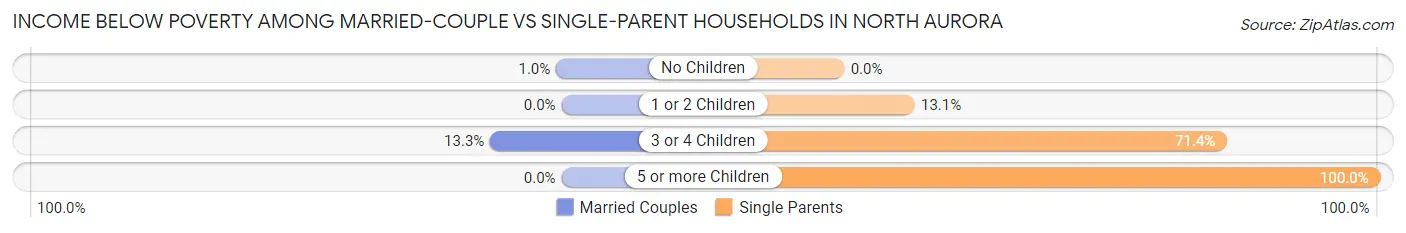
| Children | Married-Couple Families | Single-Parent Households |
| No Children | 22 (1.0%) | 0 (0.0%) |
| 1 or 2 Children | 0 (0.0%) | 54 (13.1%) |
| 3 or 4 Children | 34 (13.3%) | 40 (71.4%) |
| 5 or more Children | 0 (0.0%) | 39 (100.0%) |
| Total | 56 (1.6%) | 133 (15.3%) |
Race in North Aurora
The most populous races in North Aurora are White / Caucasian (13,692 | 77.1%), Hispanic or Latino (2,672 | 15.0%), and Black / African American (1,521 | 8.6%).
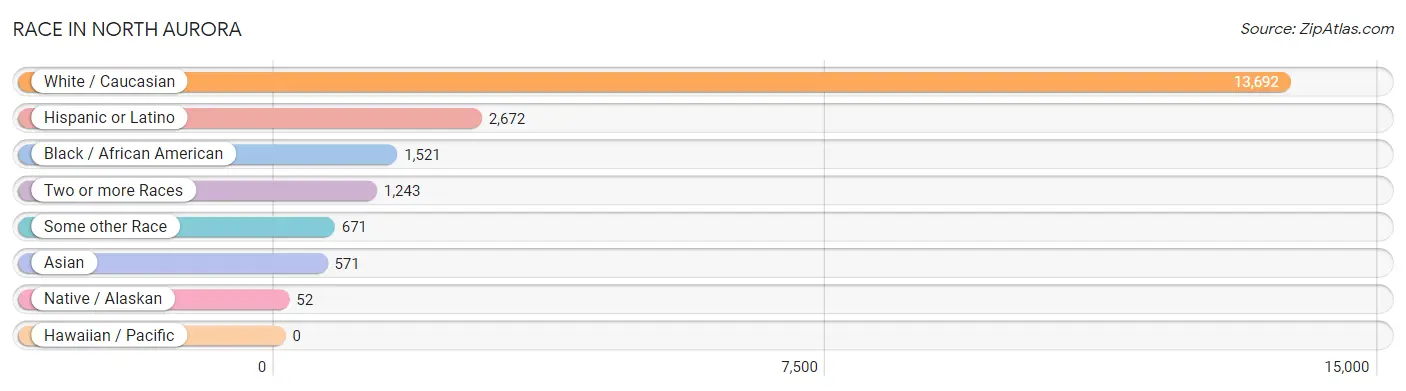
| Race | # Population | % Population |
| Asian | 571 | 3.2% |
| Black / African American | 1,521 | 8.6% |
| Hawaiian / Pacific | 0 | 0.0% |
| Hispanic or Latino | 2,672 | 15.0% |
| Native / Alaskan | 52 | 0.3% |
| White / Caucasian | 13,692 | 77.1% |
| Two or more Races | 1,243 | 7.0% |
| Some other Race | 671 | 3.8% |
| Total | 17,750 | 100.0% |
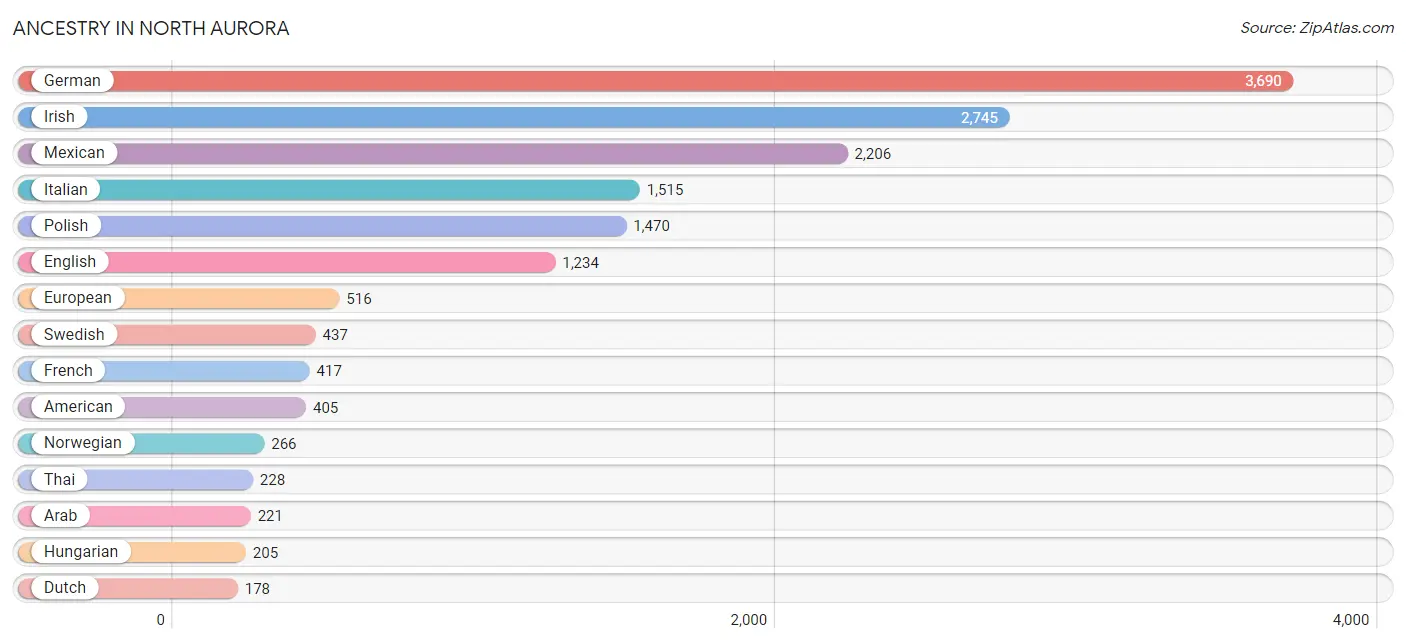
Ancestry in North Aurora
The most populous ancestries reported in North Aurora are German (3,690 | 20.8%), Irish (2,745 | 15.5%), Mexican (2,206 | 12.4%), Italian (1,515 | 8.5%), and Polish (1,470 | 8.3%), together accounting for 65.5% of all North Aurora residents.
| Ancestry | # Population | % Population |
| African | 104 | 0.6% |
| Albanian | 50 | 0.3% |
| Alsatian | 17 | 0.1% |
| American | 405 | 2.3% |
| Arab | 221 | 1.3% |
| Austrian | 39 | 0.2% |
| Belgian | 8 | 0.1% |
| Belizean | 17 | 0.1% |
| Bhutanese | 42 | 0.2% |
| Blackfeet | 54 | 0.3% |
| Brazilian | 10 | 0.1% |
| British | 86 | 0.5% |
| Canadian | 87 | 0.5% |
| Central American | 25 | 0.1% |
| Cherokee | 12 | 0.1% |
| Colombian | 18 | 0.1% |
| Costa Rican | 11 | 0.1% |
| Croatian | 171 | 1.0% |
| Cuban | 24 | 0.1% |
| Czech | 118 | 0.7% |
| Czechoslovakian | 14 | 0.1% |
| Danish | 104 | 0.6% |
| Dutch | 178 | 1.0% |
| Eastern European | 47 | 0.3% |
| Ecuadorian | 15 | 0.1% |
| English | 1,234 | 7.0% |
| Ethiopian | 13 | 0.1% |
| European | 516 | 2.9% |
| Finnish | 17 | 0.1% |
| French | 417 | 2.4% |
| French Canadian | 100 | 0.6% |
| German | 3,690 | 20.8% |
| Greek | 137 | 0.8% |
| Guatemalan | 14 | 0.1% |
| Hungarian | 205 | 1.1% |
| Indian (Asian) | 78 | 0.4% |
| Iraqi | 68 | 0.4% |
| Irish | 2,745 | 15.5% |
| Iroquois | 31 | 0.2% |
| Italian | 1,515 | 8.5% |
| Japanese | 12 | 0.1% |
| Korean | 136 | 0.8% |
| Lithuanian | 118 | 0.7% |
| Luxembourger | 37 | 0.2% |
| Malaysian | 114 | 0.6% |
| Mexican | 2,206 | 12.4% |
| Mexican American Indian | 10 | 0.1% |
| Nigerian | 1 | 0.0% |
| Northern European | 37 | 0.2% |
| Norwegian | 266 | 1.5% |
| Palestinian | 6 | 0.0% |
| Polish | 1,470 | 8.3% |
| Portuguese | 66 | 0.4% |
| Puerto Rican | 156 | 0.9% |
| Romanian | 83 | 0.5% |
| Russian | 149 | 0.8% |
| Scandinavian | 48 | 0.3% |
| Scotch-Irish | 29 | 0.2% |
| Scottish | 96 | 0.5% |
| Serbian | 47 | 0.3% |
| Sioux | 24 | 0.1% |
| Slavic | 35 | 0.2% |
| Slovak | 158 | 0.9% |
| Slovene | 8 | 0.1% |
| South American | 33 | 0.2% |
| Spaniard | 9 | 0.1% |
| Spanish | 34 | 0.2% |
| Sri Lankan | 9 | 0.1% |
| Subsaharan African | 118 | 0.7% |
| Swedish | 437 | 2.5% |
| Swiss | 16 | 0.1% |
| Syrian | 81 | 0.5% |
| Thai | 228 | 1.3% |
| Ukrainian | 77 | 0.4% |
| Welsh | 64 | 0.4% |
| Yugoslavian | 63 | 0.4% | View All 76 Rows |
Immigrants in North Aurora
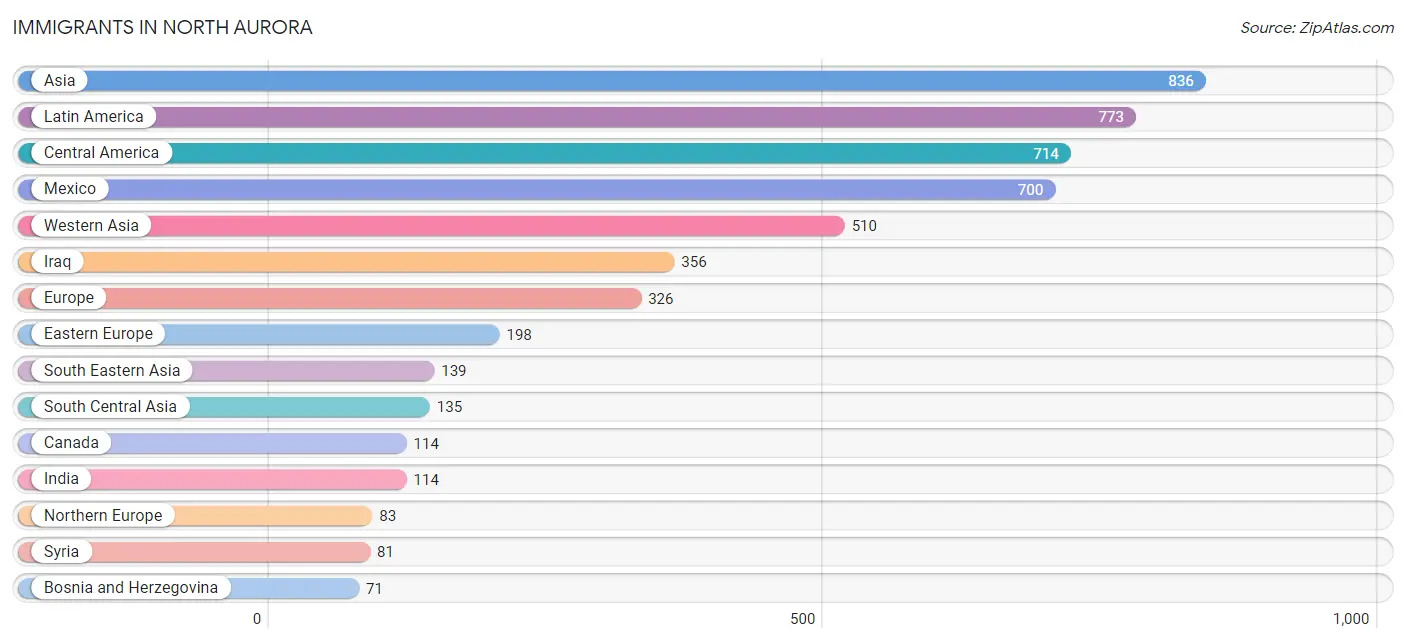
The most numerous immigrant groups reported in North Aurora came from Asia (836 | 4.7%), Latin America (773 | 4.3%), Central America (714 | 4.0%), Mexico (700 | 3.9%), and Western Asia (510 | 2.9%), together accounting for 19.9% of all North Aurora residents.
| Immigration Origin | # Population | % Population |
| Africa | 53 | 0.3% |
| Albania | 24 | 0.1% |
| Asia | 836 | 4.7% |
| Bosnia and Herzegovina | 71 | 0.4% |
| Cambodia | 12 | 0.1% |
| Canada | 114 | 0.6% |
| Caribbean | 13 | 0.1% |
| Central America | 714 | 4.0% |
| Chile | 13 | 0.1% |
| China | 43 | 0.2% |
| Colombia | 18 | 0.1% |
| Cuba | 13 | 0.1% |
| Eastern Africa | 52 | 0.3% |
| Eastern Asia | 52 | 0.3% |
| Eastern Europe | 198 | 1.1% |
| Ecuador | 15 | 0.1% |
| England | 26 | 0.2% |
| Europe | 326 | 1.8% |
| Greece | 18 | 0.1% |
| Guatemala | 14 | 0.1% |
| Hungary | 12 | 0.1% |
| India | 114 | 0.6% |
| Iraq | 356 | 2.0% |
| Ireland | 33 | 0.2% |
| Italy | 27 | 0.2% |
| Japan | 9 | 0.1% |
| Kenya | 52 | 0.3% |
| Laos | 47 | 0.3% |
| Latin America | 773 | 4.3% |
| Lithuania | 49 | 0.3% |
| Mexico | 700 | 3.9% |
| Nigeria | 1 | 0.0% |
| Northern Europe | 83 | 0.5% |
| Pakistan | 21 | 0.1% |
| Philippines | 71 | 0.4% |
| Poland | 8 | 0.1% |
| Romania | 21 | 0.1% |
| Russia | 13 | 0.1% |
| South America | 46 | 0.3% |
| South Central Asia | 135 | 0.8% |
| South Eastern Asia | 139 | 0.8% |
| Southern Europe | 45 | 0.3% |
| Syria | 81 | 0.5% |
| Vietnam | 9 | 0.1% |
| Western Africa | 1 | 0.0% |
| Western Asia | 510 | 2.9% | View All 46 Rows |
Sex and Age in North Aurora
Sex and Age in North Aurora
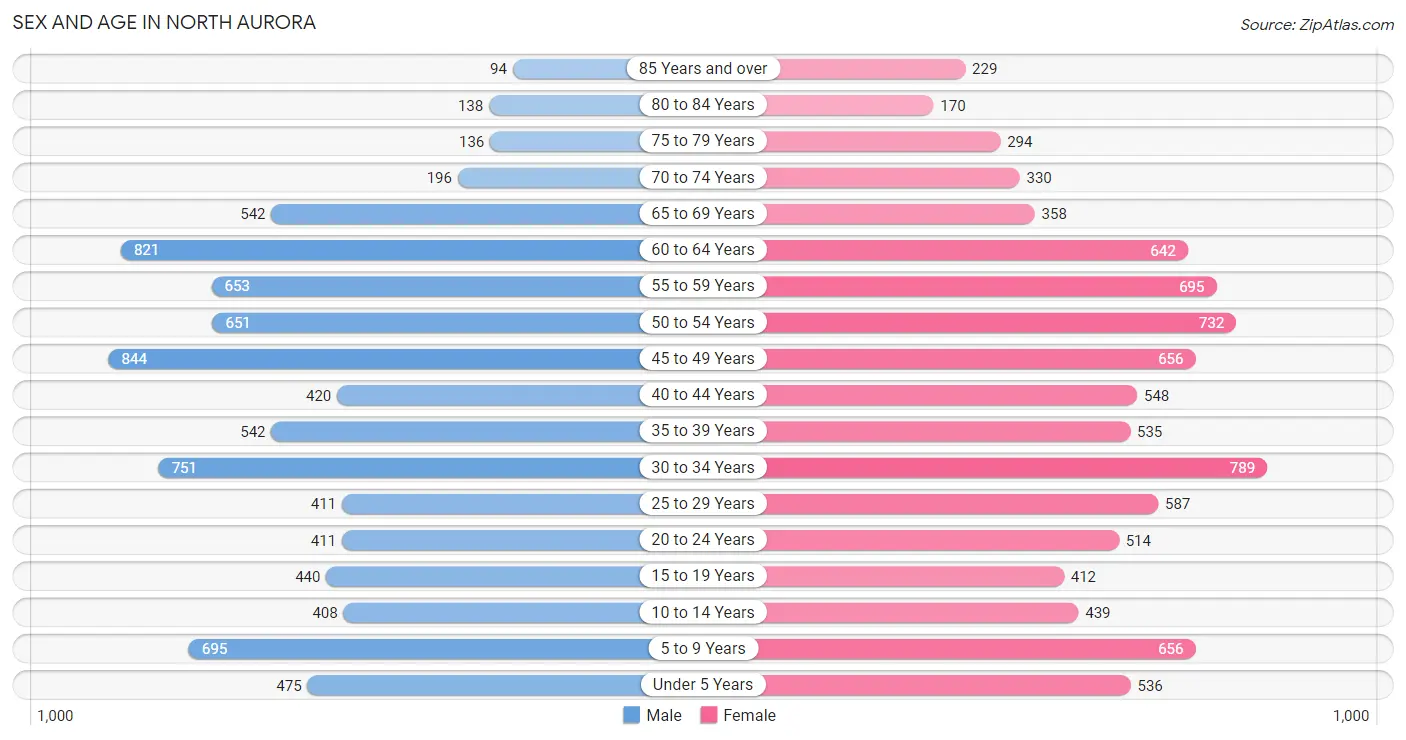
The most populous age groups in North Aurora are 45 to 49 Years (844 | 9.8%) for men and 30 to 34 Years (789 | 8.6%) for women.
| Age Bracket | Male | Female |
| Under 5 Years | 475 (5.5%) | 536 (5.9%) |
| 5 to 9 Years | 695 (8.1%) | 656 (7.2%) |
| 10 to 14 Years | 408 (4.7%) | 439 (4.8%) |
| 15 to 19 Years | 440 (5.1%) | 412 (4.5%) |
| 20 to 24 Years | 411 (4.8%) | 514 (5.6%) |
| 25 to 29 Years | 411 (4.8%) | 587 (6.4%) |
| 30 to 34 Years | 751 (8.7%) | 789 (8.6%) |
| 35 to 39 Years | 542 (6.3%) | 535 (5.9%) |
| 40 to 44 Years | 420 (4.9%) | 548 (6.0%) |
| 45 to 49 Years | 844 (9.8%) | 656 (7.2%) |
| 50 to 54 Years | 651 (7.5%) | 732 (8.0%) |
| 55 to 59 Years | 653 (7.6%) | 695 (7.6%) |
| 60 to 64 Years | 821 (9.5%) | 642 (7.0%) |
| 65 to 69 Years | 542 (6.3%) | 358 (3.9%) |
| 70 to 74 Years | 196 (2.3%) | 330 (3.6%) |
| 75 to 79 Years | 136 (1.6%) | 294 (3.2%) |
| 80 to 84 Years | 138 (1.6%) | 170 (1.9%) |
| 85 Years and over | 94 (1.1%) | 229 (2.5%) |
| Total | 8,628 (100.0%) | 9,122 (100.0%) |
Families and Households in North Aurora
Median Family Size in North Aurora
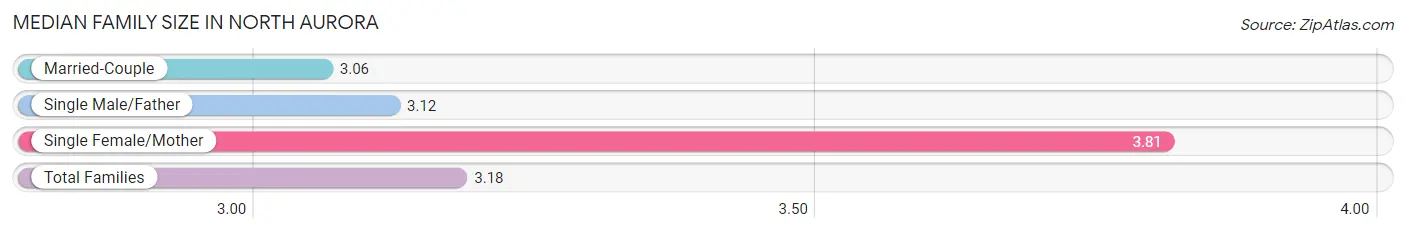
The median family size in North Aurora is 3.18 persons per family, with single female/mother families (699 | 15.7%) accounting for the largest median family size of 3.81 persons per family. On the other hand, married-couple families (3,591 | 80.5%) represent the smallest median family size with 3.06 persons per family.
| Family Type | # Families | Family Size |
| Married-Couple | 3,591 (80.5%) | 3.06 |
| Single Male/Father | 170 (3.8%) | 3.12 |
| Single Female/Mother | 699 (15.7%) | 3.81 |
| Total Families | 4,460 (100.0%) | 3.18 |
Median Household Size in North Aurora
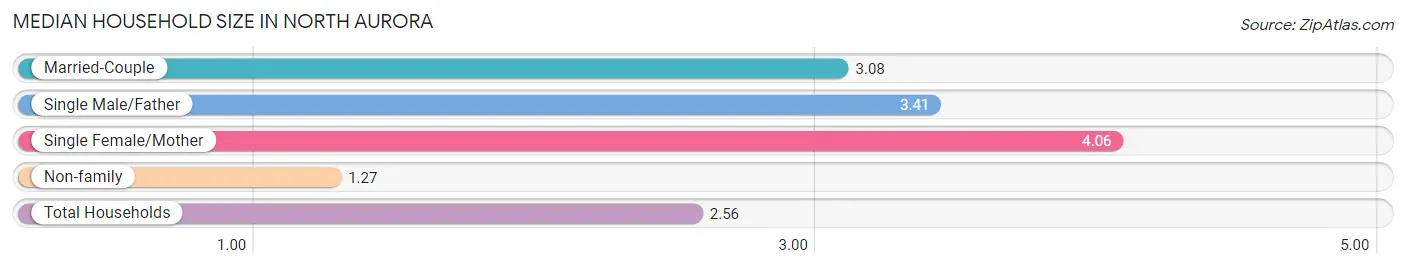
The median household size in North Aurora is 2.56 persons per household, with single female/mother households (699 | 10.2%) accounting for the largest median household size of 4.06 persons per household. non-family households (2,381 | 34.8%) represent the smallest median household size with 1.27 persons per household.
| Household Type | # Households | Household Size |
| Married-Couple | 3,591 (52.5%) | 3.08 |
| Single Male/Father | 170 (2.5%) | 3.41 |
| Single Female/Mother | 699 (10.2%) | 4.06 |
| Non-family | 2,381 (34.8%) | 1.27 |
| Total Households | 6,841 (100.0%) | 2.56 |
Household Size by Marriage Status in North Aurora
Out of a total of 6,841 households in North Aurora, 4,460 (65.2%) are family households, while 2,381 (34.8%) are nonfamily households. The most numerous type of family households are 2-person households, comprising 1,988, and the most common type of nonfamily households are 1-person households, comprising 1,668.
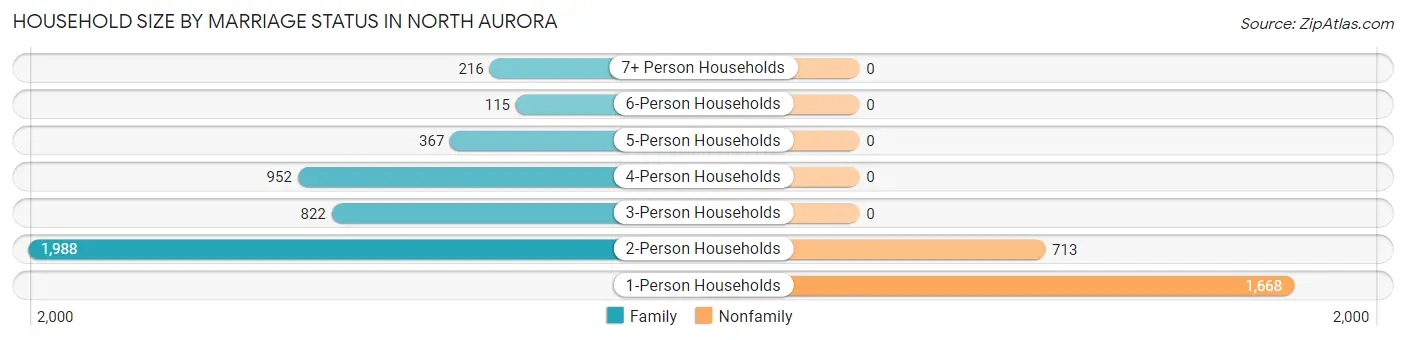
| Household Size | Family Households | Nonfamily Households |
| 1-Person Households | - | 1,668 (24.4%) |
| 2-Person Households | 1,988 (29.1%) | 713 (10.4%) |
| 3-Person Households | 822 (12.0%) | 0 (0.0%) |
| 4-Person Households | 952 (13.9%) | 0 (0.0%) |
| 5-Person Households | 367 (5.4%) | 0 (0.0%) |
| 6-Person Households | 115 (1.7%) | 0 (0.0%) |
| 7+ Person Households | 216 (3.2%) | 0 (0.0%) |
| Total | 4,460 (65.2%) | 2,381 (34.8%) |
Female Fertility in North Aurora
Fertility by Age in North Aurora
Average fertility rate in North Aurora is 63.0 births per 1,000 women. Women in the age bracket of 20 to 34 years have the highest fertility rate with 104.0 births per 1,000 women. Women in the age bracket of 20 to 34 years acount for 74.6% of all women with births.
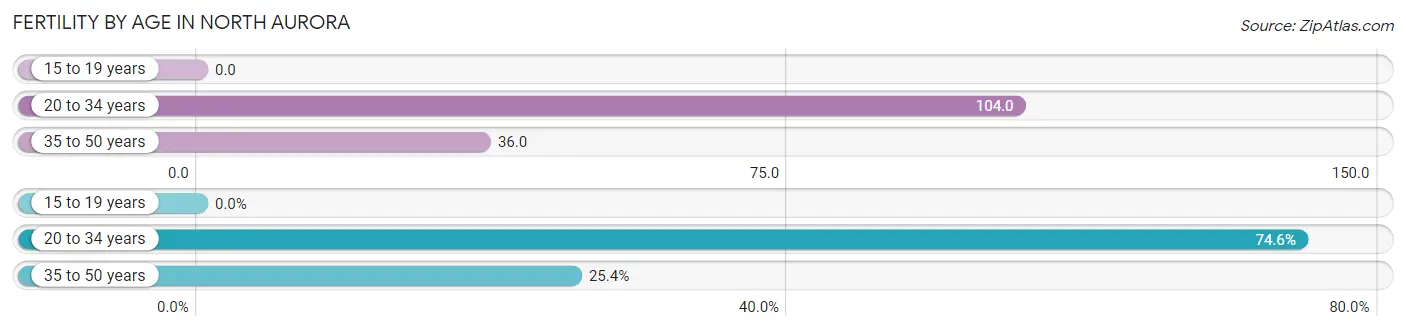
| Age Bracket | Women with Births | Births / 1,000 Women |
| 15 to 19 years | 0 (0.0%) | 0.0 |
| 20 to 34 years | 197 (74.6%) | 104.0 |
| 35 to 50 years | 67 (25.4%) | 36.0 |
| Total | 264 (100.0%) | 63.0 |
Fertility by Age by Marriage Status in North Aurora
73.1% of women with births (264) in North Aurora are married. The highest percentage of unmarried women with births falls into 35 to 50 years age bracket with 59.7% of them unmarried at the time of birth, while the lowest percentage of unmarried women with births belong to 20 to 34 years age bracket with 15.7% of them unmarried.
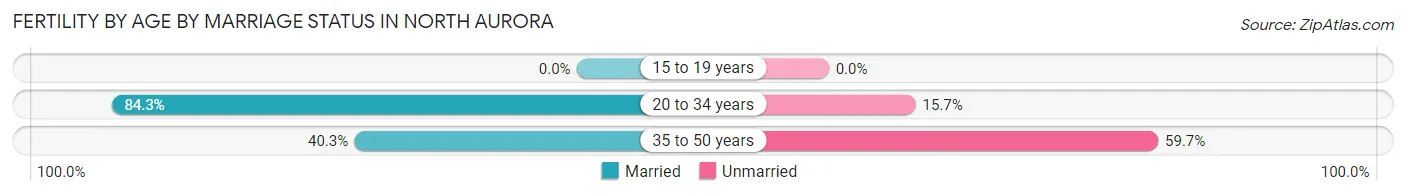
| Age Bracket | Married | Unmarried |
| 15 to 19 years | 0 (0.0%) | 0 (0.0%) |
| 20 to 34 years | 166 (84.3%) | 31 (15.7%) |
| 35 to 50 years | 27 (40.3%) | 40 (59.7%) |
| Total | 193 (73.1%) | 71 (26.9%) |
Fertility by Education in North Aurora
Average fertility rate in North Aurora is 63.0 births per 1,000 women. Women with the education attainment of graduate degree have the highest fertility rate of 99.0 births per 1,000 women, while women with the education attainment of bachelor's degree have the lowest fertility at 31.0 births per 1,000 women. Women with the education attainment of college or associate's degree represent 37.1% of all women with births.
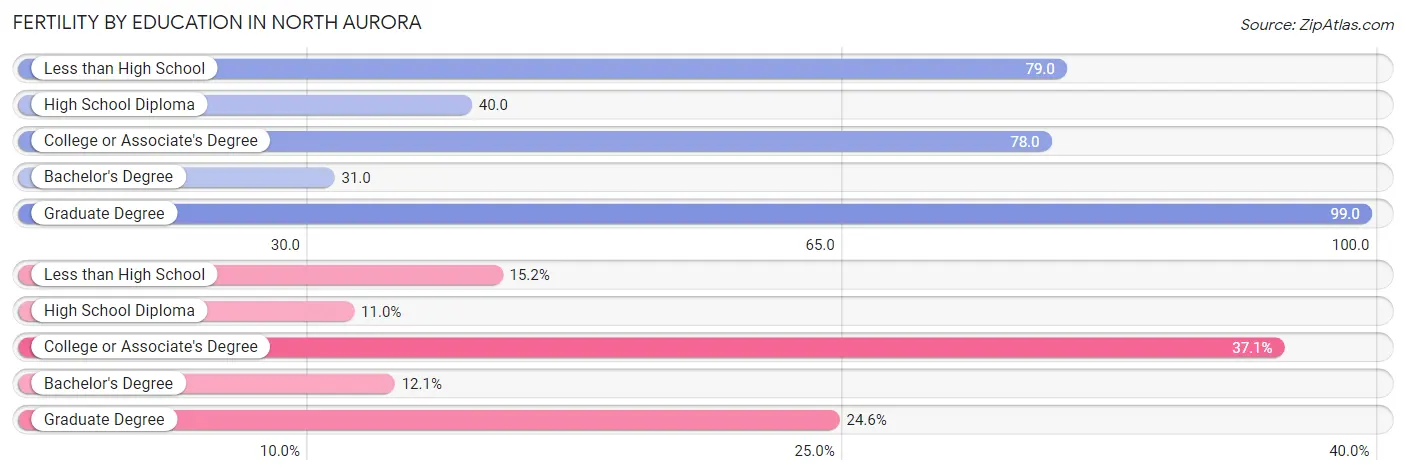
| Educational Attainment | Women with Births | Births / 1,000 Women |
| Less than High School | 40 (15.1%) | 79.0 |
| High School Diploma | 29 (11.0%) | 40.0 |
| College or Associate's Degree | 98 (37.1%) | 78.0 |
| Bachelor's Degree | 32 (12.1%) | 31.0 |
| Graduate Degree | 65 (24.6%) | 99.0 |
| Total | 264 (100.0%) | 63.0 |
Fertility by Education by Marriage Status in North Aurora
26.9% of women with births in North Aurora are unmarried. Women with the educational attainment of bachelor's degree are most likely to be married with 100.0% of them married at childbirth, while women with the educational attainment of less than high school are least likely to be married with 100.0% of them unmarried at childbirth.
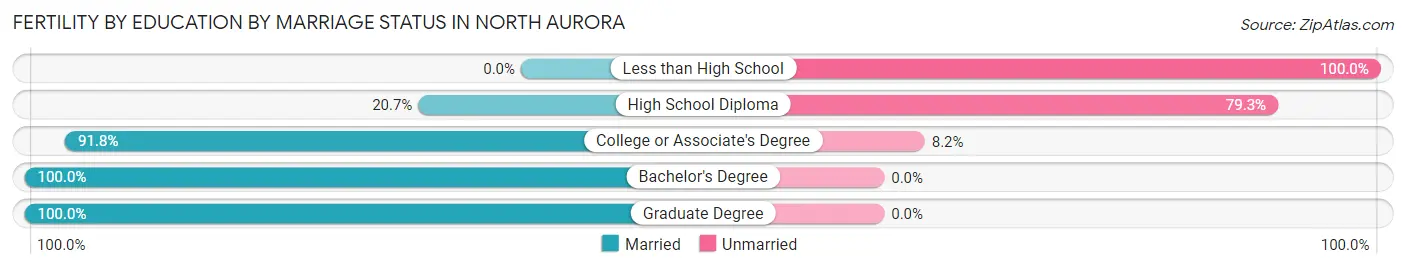
| Educational Attainment | Married | Unmarried |
| Less than High School | 0 (0.0%) | 40 (100.0%) |
| High School Diploma | 6 (20.7%) | 23 (79.3%) |
| College or Associate's Degree | 90 (91.8%) | 8 (8.2%) |
| Bachelor's Degree | 32 (100.0%) | 0 (0.0%) |
| Graduate Degree | 65 (100.0%) | 0 (0.0%) |
| Total | 193 (73.1%) | 71 (26.9%) |
Employment Characteristics in North Aurora
Employment by Class of Employer in North Aurora
Among the 9,424 employed individuals in North Aurora, private company employees (6,700 | 71.1%), not-for-profit organizations (980 | 10.4%), and local government employees (763 | 8.1%) make up the most common classes of employment.
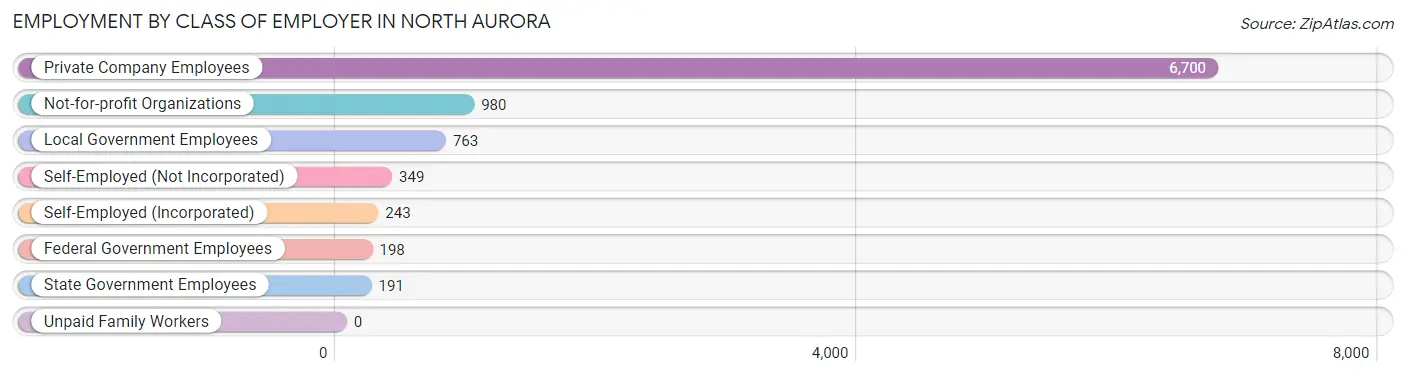
| Employer Class | # Employees | % Employees |
| Private Company Employees | 6,700 | 71.1% |
| Self-Employed (Incorporated) | 243 | 2.6% |
| Self-Employed (Not Incorporated) | 349 | 3.7% |
| Not-for-profit Organizations | 980 | 10.4% |
| Local Government Employees | 763 | 8.1% |
| State Government Employees | 191 | 2.0% |
| Federal Government Employees | 198 | 2.1% |
| Unpaid Family Workers | 0 | 0.0% |
| Total | 9,424 | 100.0% |
Employment Status by Age in North Aurora
According to the labor force statistics for North Aurora, out of the total population over 16 years of age (14,415), 71.7% or 10,336 individuals are in the labor force, with 7.2% or 744 of them unemployed. The age group with the highest labor force participation rate is 30 to 34 years, with 93.5% or 1,440 individuals in the labor force. Within the labor force, the 75 years and over age range has the highest percentage of unemployed individuals, with 21.8% or 22 of them being unemployed.
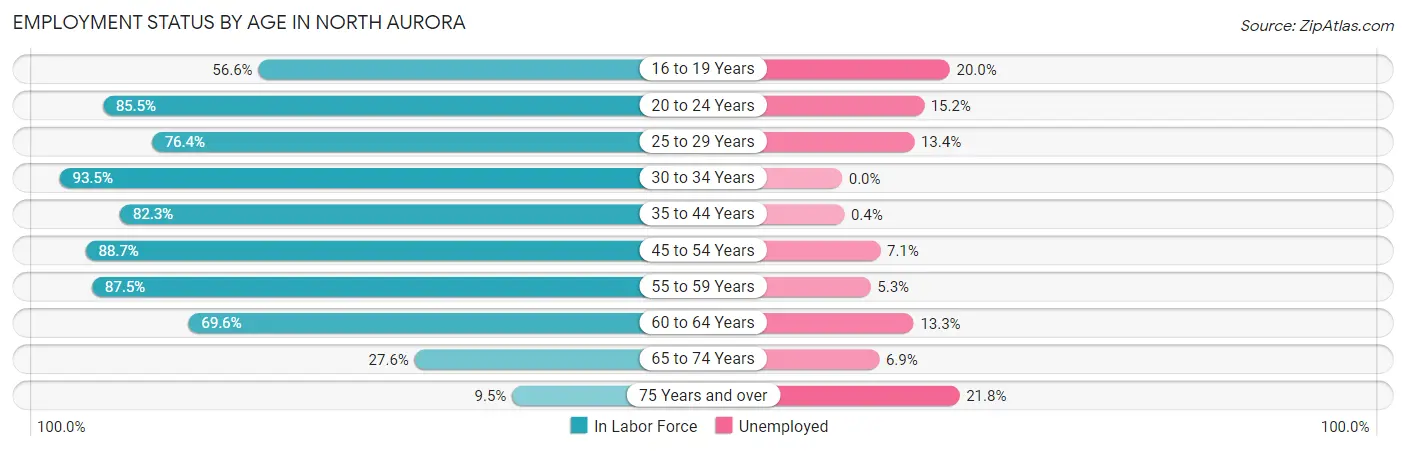
| Age Bracket | In Labor Force | Unemployed |
| 16 to 19 Years | 411 (56.6%) | 82 (20.0%) |
| 20 to 24 Years | 791 (85.5%) | 120 (15.2%) |
| 25 to 29 Years | 762 (76.4%) | 102 (13.4%) |
| 30 to 34 Years | 1,440 (93.5%) | 0 (0.0%) |
| 35 to 44 Years | 1,683 (82.3%) | 7 (0.4%) |
| 45 to 54 Years | 2,557 (88.7%) | 182 (7.1%) |
| 55 to 59 Years | 1,180 (87.5%) | 63 (5.3%) |
| 60 to 64 Years | 1,018 (69.6%) | 135 (13.3%) |
| 65 to 74 Years | 394 (27.6%) | 27 (6.9%) |
| 75 Years and over | 101 (9.5%) | 22 (21.8%) |
| Total | 10,336 (71.7%) | 744 (7.2%) |
Employment Status by Educational Attainment in North Aurora
According to labor force statistics for North Aurora, 84.1% of individuals (8,643) out of the total population between 25 and 64 years of age (10,277) are in the labor force, with 5.6% or 484 of them being unemployed. The group with the highest labor force participation rate are those with the educational attainment of college / associate degree, with 90.8% or 3,361 individuals in the labor force. Within the labor force, individuals with less than high school education have the highest percentage of unemployment, with 9.5% or 36 of them being unemployed.
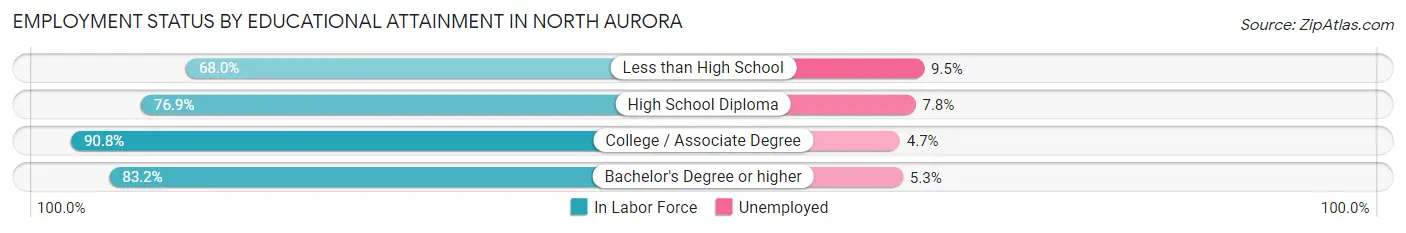
| Educational Attainment | In Labor Force | Unemployed |
| Less than High School | 380 (68.0%) | 53 (9.5%) |
| High School Diploma | 1,305 (76.9%) | 132 (7.8%) |
| College / Associate Degree | 3,361 (90.8%) | 174 (4.7%) |
| Bachelor's Degree or higher | 3,594 (83.2%) | 229 (5.3%) |
| Total | 8,643 (84.1%) | 576 (5.6%) |
Employment Occupations by Sex in North Aurora
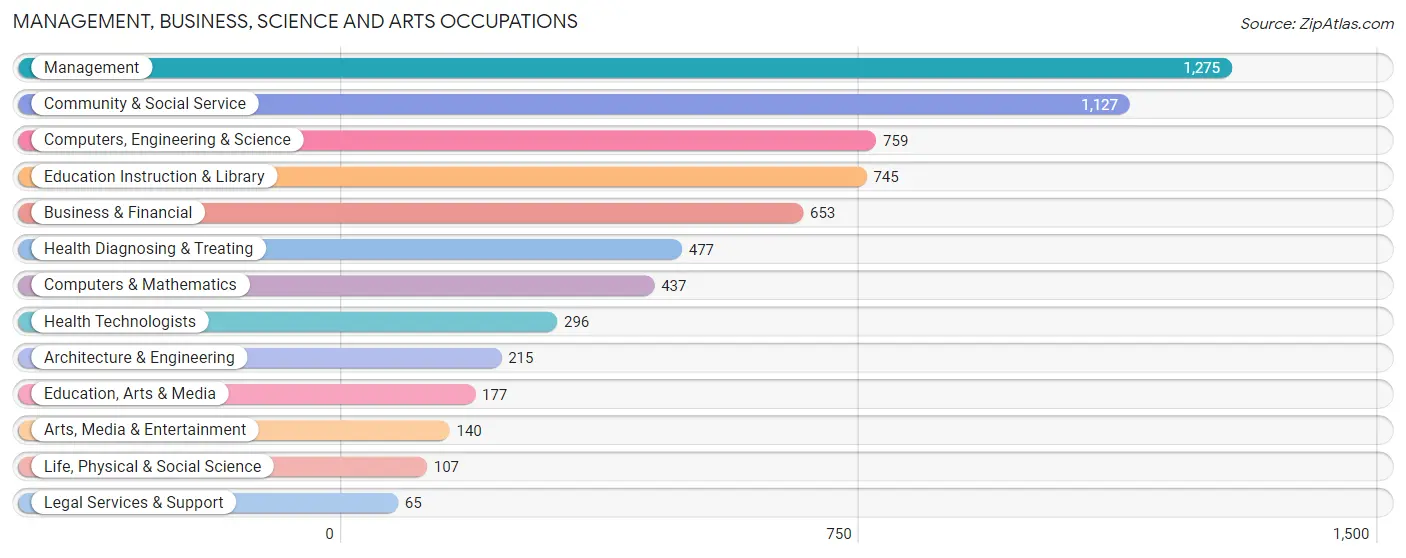
Management, Business, Science and Arts Occupations
The most common Management, Business, Science and Arts occupations in North Aurora are Management (1,275 | 13.3%), Community & Social Service (1,127 | 11.7%), Computers, Engineering & Science (759 | 7.9%), Education Instruction & Library (745 | 7.8%), and Business & Financial (653 | 6.8%).
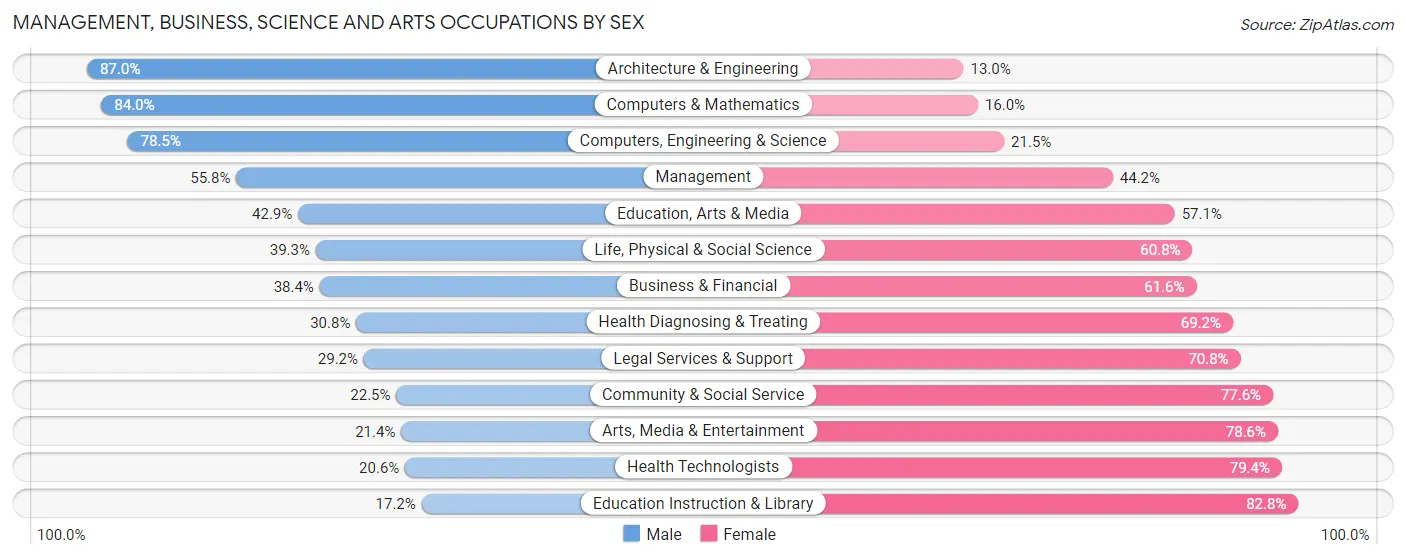
Management, Business, Science and Arts Occupations by Sex
Within the Management, Business, Science and Arts occupations in North Aurora, the most male-oriented occupations are Architecture & Engineering (87.0%), Computers & Mathematics (84.0%), and Computers, Engineering & Science (78.5%), while the most female-oriented occupations are Education Instruction & Library (82.8%), Health Technologists (79.4%), and Arts, Media & Entertainment (78.6%).
| Occupation | Male | Female |
| Management | 712 (55.8%) | 563 (44.2%) |
| Business & Financial | 251 (38.4%) | 402 (61.6%) |
| Computers, Engineering & Science | 596 (78.5%) | 163 (21.5%) |
| Computers & Mathematics | 367 (84.0%) | 70 (16.0%) |
| Architecture & Engineering | 187 (87.0%) | 28 (13.0%) |
| Life, Physical & Social Science | 42 (39.3%) | 65 (60.8%) |
| Community & Social Service | 253 (22.5%) | 874 (77.5%) |
| Education, Arts & Media | 76 (42.9%) | 101 (57.1%) |
| Legal Services & Support | 19 (29.2%) | 46 (70.8%) |
| Education Instruction & Library | 128 (17.2%) | 617 (82.8%) |
| Arts, Media & Entertainment | 30 (21.4%) | 110 (78.6%) |
| Health Diagnosing & Treating | 147 (30.8%) | 330 (69.2%) |
| Health Technologists | 61 (20.6%) | 235 (79.4%) |
| Total (Category) | 1,959 (45.7%) | 2,332 (54.3%) |
| Total (Overall) | 4,932 (51.4%) | 4,663 (48.6%) |
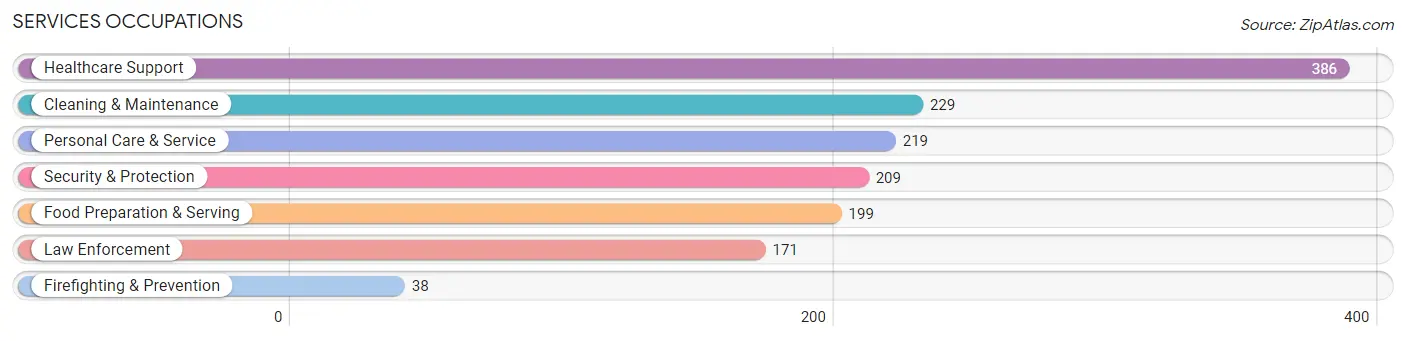
Services Occupations
The most common Services occupations in North Aurora are Healthcare Support (386 | 4.0%), Cleaning & Maintenance (229 | 2.4%), Personal Care & Service (219 | 2.3%), Security & Protection (209 | 2.2%), and Food Preparation & Serving (199 | 2.1%).
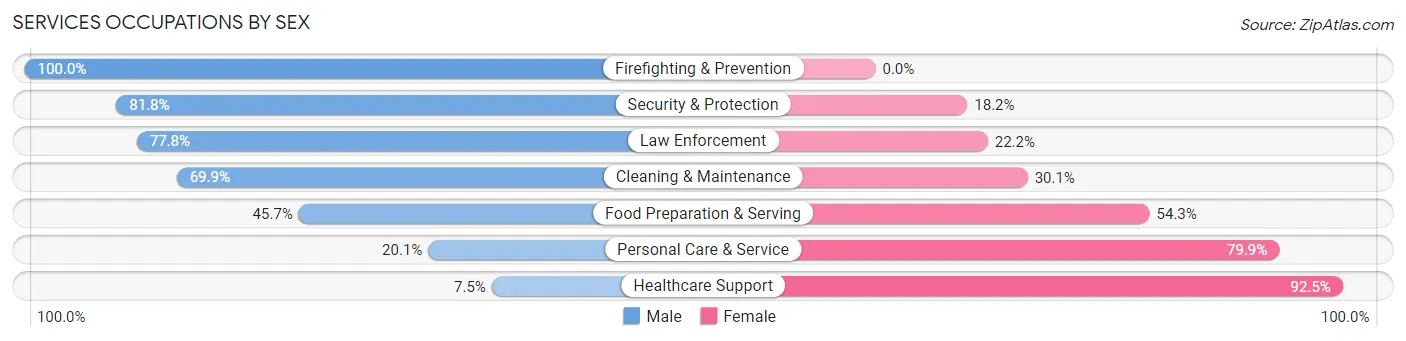
Services Occupations by Sex
Within the Services occupations in North Aurora, the most male-oriented occupations are Firefighting & Prevention (100.0%), Security & Protection (81.8%), and Law Enforcement (77.8%), while the most female-oriented occupations are Healthcare Support (92.5%), Personal Care & Service (79.9%), and Food Preparation & Serving (54.3%).
| Occupation | Male | Female |
| Healthcare Support | 29 (7.5%) | 357 (92.5%) |
| Security & Protection | 171 (81.8%) | 38 (18.2%) |
| Firefighting & Prevention | 38 (100.0%) | 0 (0.0%) |
| Law Enforcement | 133 (77.8%) | 38 (22.2%) |
| Food Preparation & Serving | 91 (45.7%) | 108 (54.3%) |
| Cleaning & Maintenance | 160 (69.9%) | 69 (30.1%) |
| Personal Care & Service | 44 (20.1%) | 175 (79.9%) |
| Total (Category) | 495 (39.9%) | 747 (60.1%) |
| Total (Overall) | 4,932 (51.4%) | 4,663 (48.6%) |
Sales and Office Occupations
The most common Sales and Office occupations in North Aurora are Office & Administration (1,109 | 11.6%), and Sales & Related (1,093 | 11.4%).
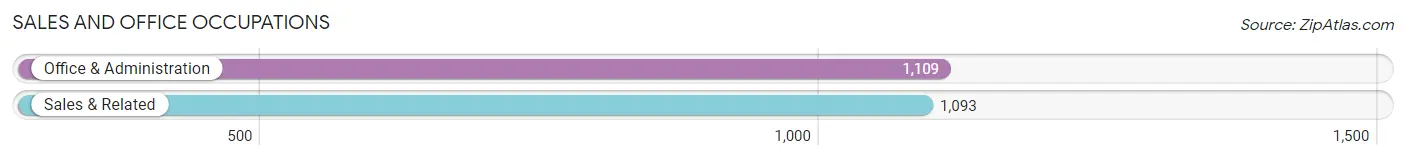
Sales and Office Occupations by Sex

| Occupation | Male | Female |
| Sales & Related | 723 (66.1%) | 370 (33.9%) |
| Office & Administration | 216 (19.5%) | 893 (80.5%) |
| Total (Category) | 939 (42.6%) | 1,263 (57.4%) |
| Total (Overall) | 4,932 (51.4%) | 4,663 (48.6%) |
Natural Resources, Construction and Maintenance Occupations
The most common Natural Resources, Construction and Maintenance occupations in North Aurora are Construction & Extraction (514 | 5.4%), and Installation, Maintenance & Repair (228 | 2.4%).
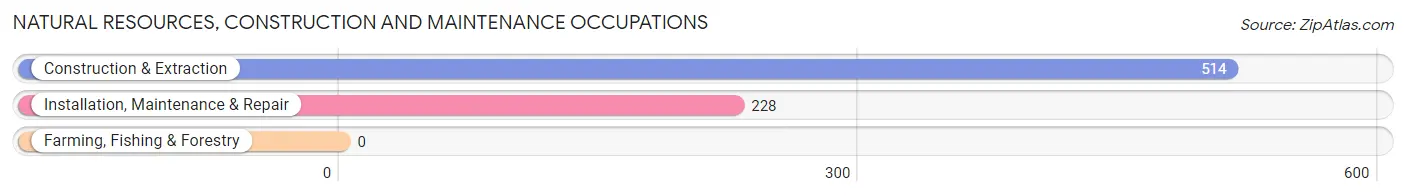
Natural Resources, Construction and Maintenance Occupations by Sex
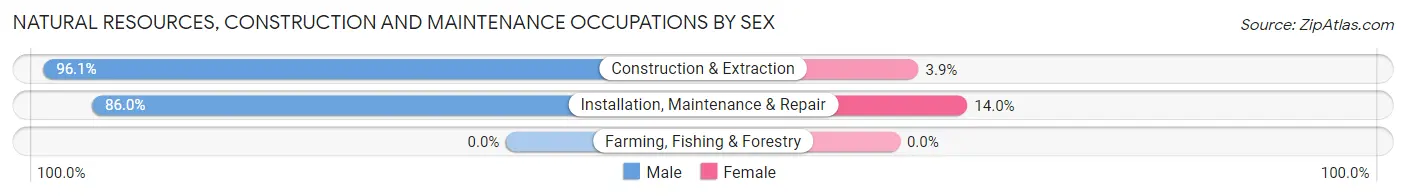
| Occupation | Male | Female |
| Farming, Fishing & Forestry | 0 (0.0%) | 0 (0.0%) |
| Construction & Extraction | 494 (96.1%) | 20 (3.9%) |
| Installation, Maintenance & Repair | 196 (86.0%) | 32 (14.0%) |
| Total (Category) | 690 (93.0%) | 52 (7.0%) |
| Total (Overall) | 4,932 (51.4%) | 4,663 (48.6%) |
Production, Transportation and Moving Occupations
The most common Production, Transportation and Moving occupations in North Aurora are Production (532 | 5.5%), Material Moving (314 | 3.3%), and Transportation (272 | 2.8%).
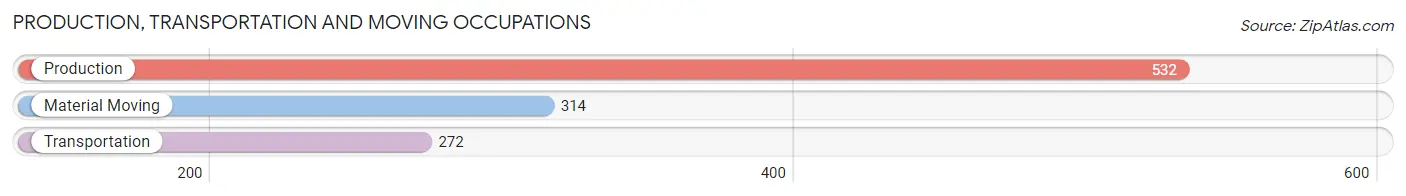
Production, Transportation and Moving Occupations by Sex
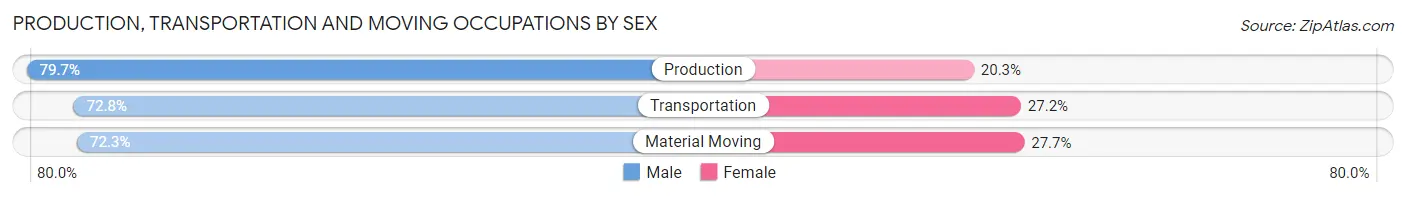
| Occupation | Male | Female |
| Production | 424 (79.7%) | 108 (20.3%) |
| Transportation | 198 (72.8%) | 74 (27.2%) |
| Material Moving | 227 (72.3%) | 87 (27.7%) |
| Total (Category) | 849 (75.9%) | 269 (24.1%) |
| Total (Overall) | 4,932 (51.4%) | 4,663 (48.6%) |
Employment Industries by Sex in North Aurora
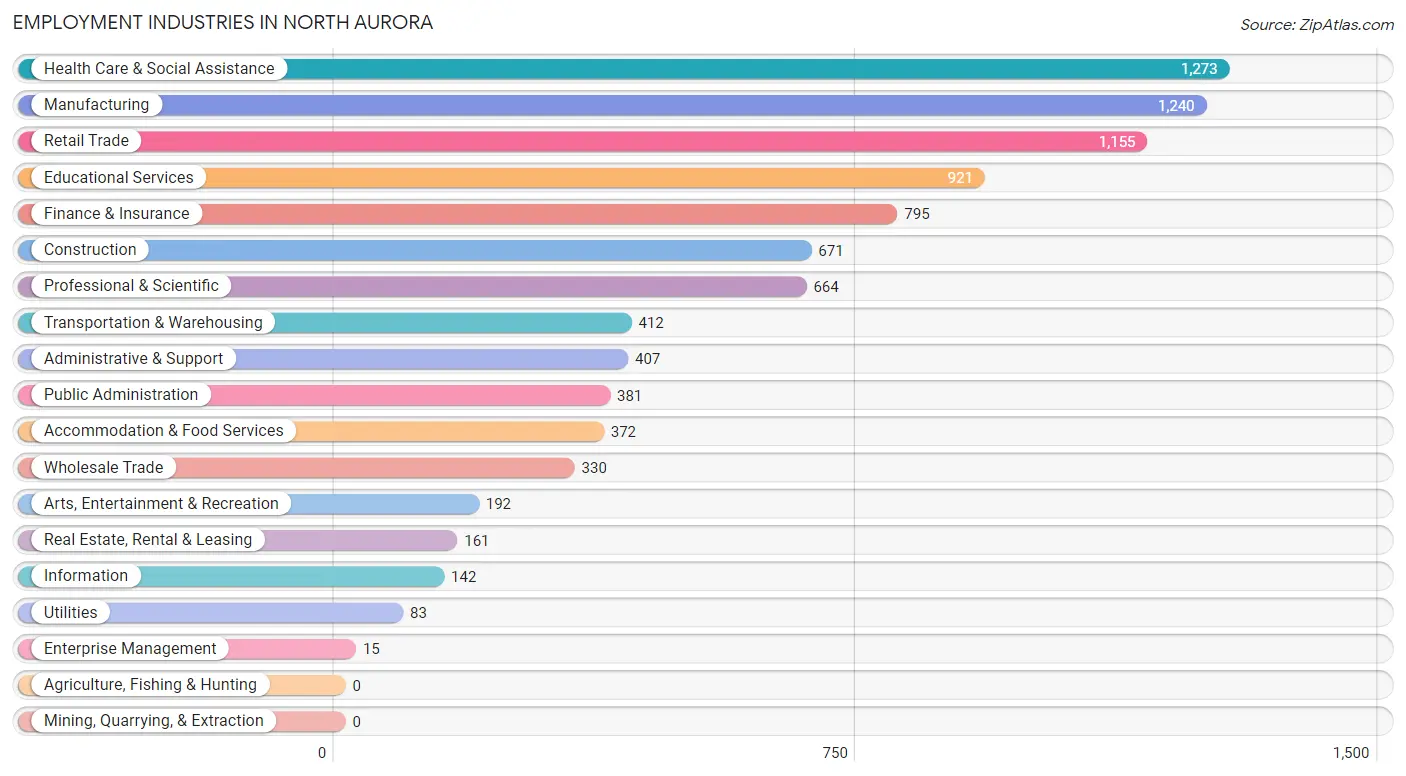
Employment Industries in North Aurora
The major employment industries in North Aurora include Health Care & Social Assistance (1,273 | 13.3%), Manufacturing (1,240 | 12.9%), Retail Trade (1,155 | 12.0%), Educational Services (921 | 9.6%), and Finance & Insurance (795 | 8.3%).
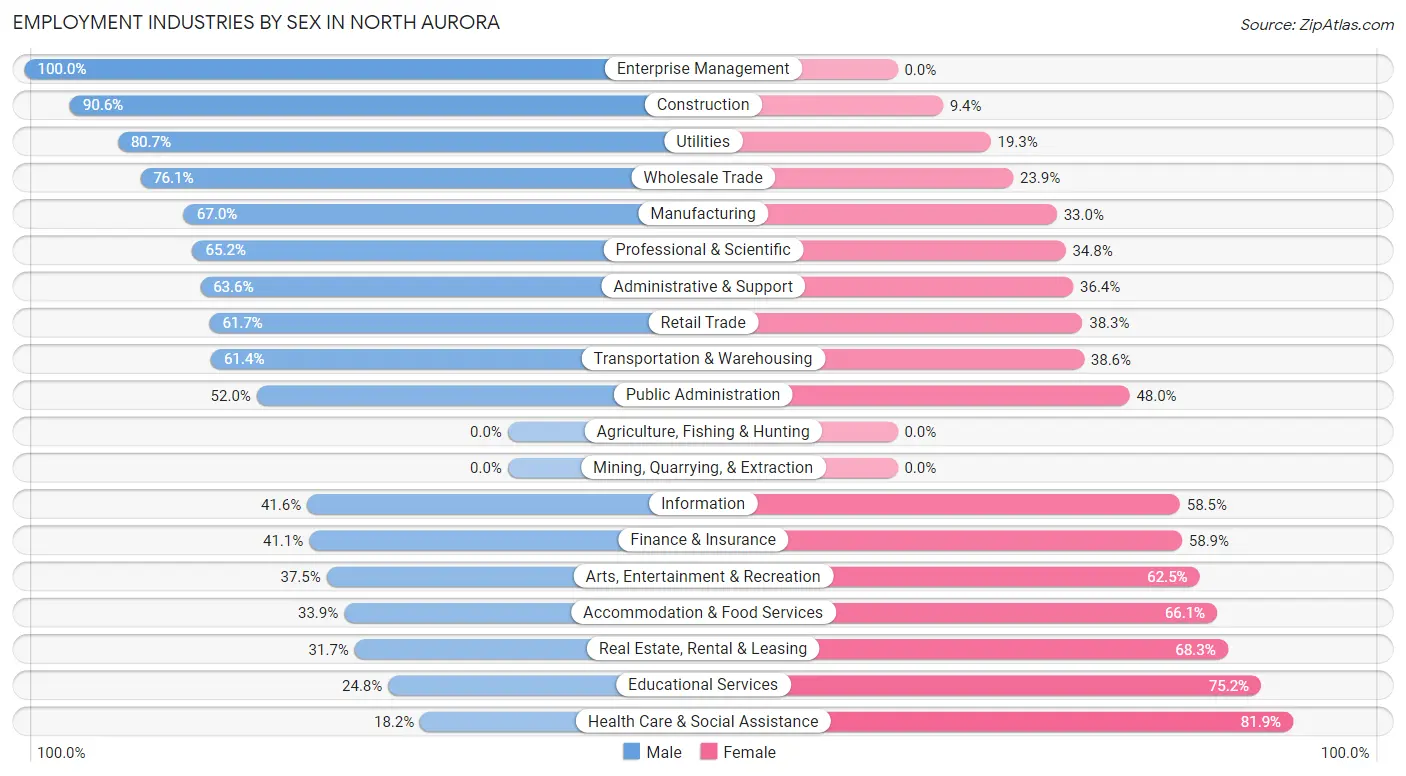
Employment Industries by Sex in North Aurora
The North Aurora industries that see more men than women are Enterprise Management (100.0%), Construction (90.6%), and Utilities (80.7%), whereas the industries that tend to have a higher number of women are Health Care & Social Assistance (81.9%), Educational Services (75.2%), and Real Estate, Rental & Leasing (68.3%).
| Industry | Male | Female |
| Agriculture, Fishing & Hunting | 0 (0.0%) | 0 (0.0%) |
| Mining, Quarrying, & Extraction | 0 (0.0%) | 0 (0.0%) |
| Construction | 608 (90.6%) | 63 (9.4%) |
| Manufacturing | 831 (67.0%) | 409 (33.0%) |
| Wholesale Trade | 251 (76.1%) | 79 (23.9%) |
| Retail Trade | 713 (61.7%) | 442 (38.3%) |
| Transportation & Warehousing | 253 (61.4%) | 159 (38.6%) |
| Utilities | 67 (80.7%) | 16 (19.3%) |
| Information | 59 (41.5%) | 83 (58.5%) |
| Finance & Insurance | 327 (41.1%) | 468 (58.9%) |
| Real Estate, Rental & Leasing | 51 (31.7%) | 110 (68.3%) |
| Professional & Scientific | 433 (65.2%) | 231 (34.8%) |
| Enterprise Management | 15 (100.0%) | 0 (0.0%) |
| Administrative & Support | 259 (63.6%) | 148 (36.4%) |
| Educational Services | 228 (24.8%) | 693 (75.2%) |
| Health Care & Social Assistance | 231 (18.1%) | 1,042 (81.9%) |
| Arts, Entertainment & Recreation | 72 (37.5%) | 120 (62.5%) |
| Accommodation & Food Services | 126 (33.9%) | 246 (66.1%) |
| Public Administration | 198 (52.0%) | 183 (48.0%) |
| Total | 4,932 (51.4%) | 4,663 (48.6%) |
Education in North Aurora
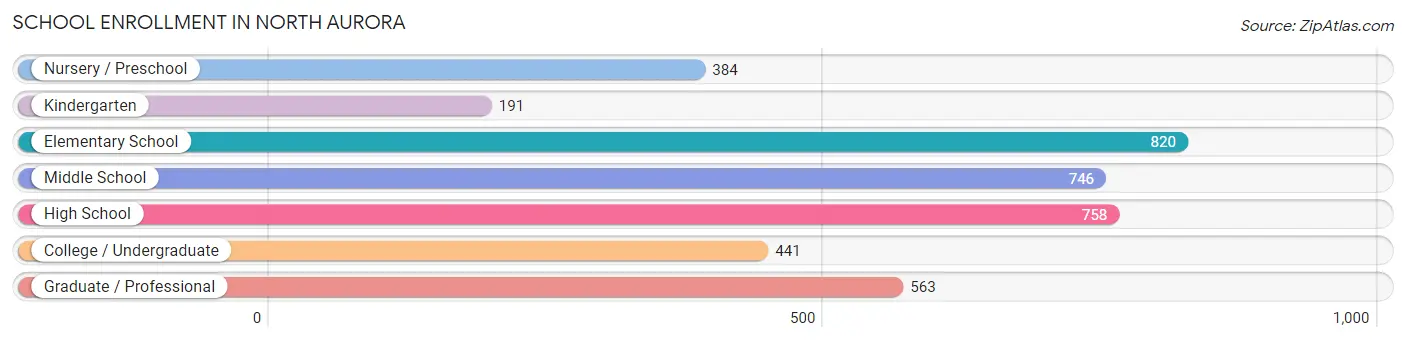
School Enrollment in North Aurora
The most common levels of schooling among the 3,903 students in North Aurora are elementary school (820 | 21.0%), high school (758 | 19.4%), and middle school (746 | 19.1%).
| School Level | # Students | % Students |
| Nursery / Preschool | 384 | 9.8% |
| Kindergarten | 191 | 4.9% |
| Elementary School | 820 | 21.0% |
| Middle School | 746 | 19.1% |
| High School | 758 | 19.4% |
| College / Undergraduate | 441 | 11.3% |
| Graduate / Professional | 563 | 14.4% |
| Total | 3,903 | 100.0% |
School Enrollment by Age by Funding Source in North Aurora
Out of a total of 3,903 students who are enrolled in schools in North Aurora, 999 (25.6%) attend a private institution, while the remaining 2,904 (74.4%) are enrolled in public schools. The age group of 35 years and over has the highest likelihood of being enrolled in private schools, with 249 (52.7% in the age bracket) enrolled. Conversely, the age group of 10 to 14 year olds has the lowest likelihood of being enrolled in a private school, with 748 (88.3% in the age bracket) attending a public institution.
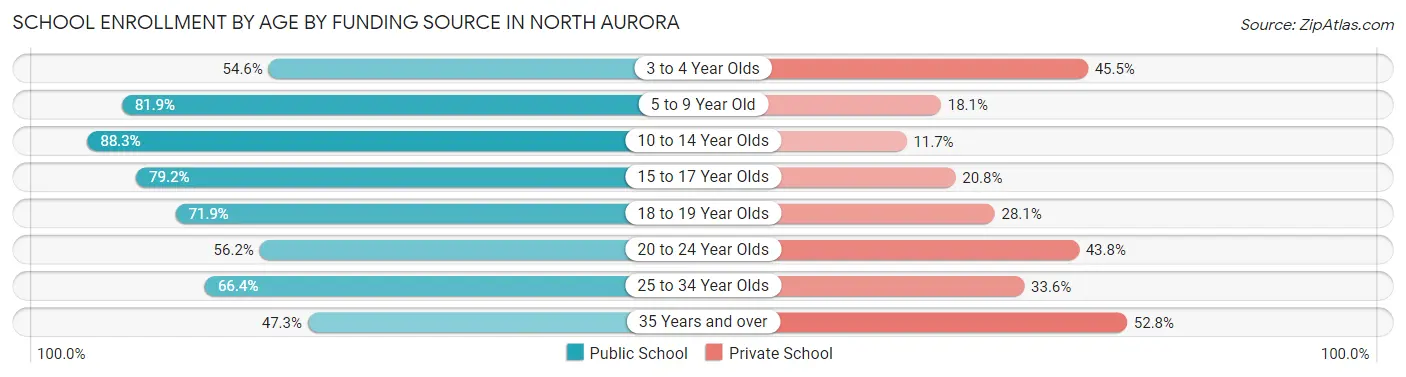
| Age Bracket | Public School | Private School |
| 3 to 4 Year Olds | 114 (54.5%) | 95 (45.5%) |
| 5 to 9 Year Old | 937 (81.9%) | 207 (18.1%) |
| 10 to 14 Year Olds | 748 (88.3%) | 99 (11.7%) |
| 15 to 17 Year Olds | 461 (79.2%) | 121 (20.8%) |
| 18 to 19 Year Olds | 151 (71.9%) | 59 (28.1%) |
| 20 to 24 Year Olds | 113 (56.2%) | 88 (43.8%) |
| 25 to 34 Year Olds | 158 (66.4%) | 80 (33.6%) |
| 35 Years and over | 223 (47.2%) | 249 (52.7%) |
| Total | 2,904 (74.4%) | 999 (25.6%) |
Educational Attainment by Field of Study in North Aurora
Business (1,018 | 18.9%), education (684 | 12.7%), science & technology (567 | 10.5%), communications (442 | 8.2%), and computers & mathematics (353 | 6.6%) are the most common fields of study among 5,382 individuals in North Aurora who have obtained a bachelor's degree or higher.
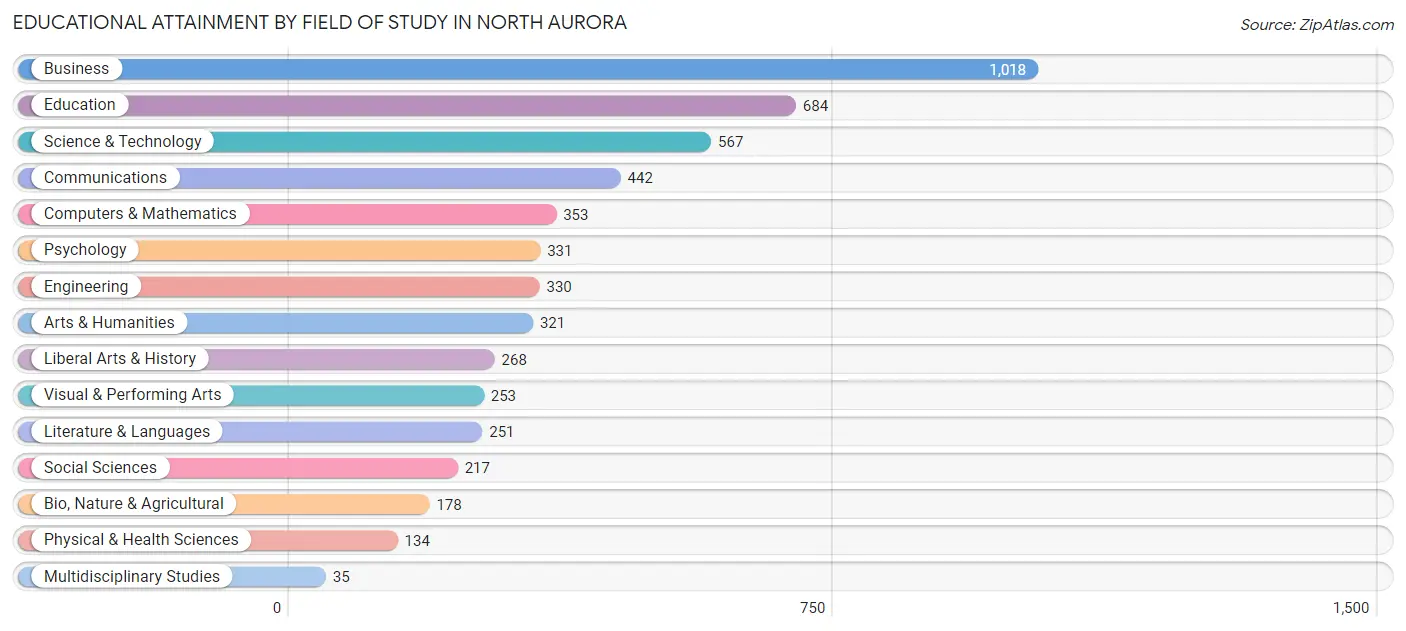
| Field of Study | # Graduates | % Graduates |
| Computers & Mathematics | 353 | 6.6% |
| Bio, Nature & Agricultural | 178 | 3.3% |
| Physical & Health Sciences | 134 | 2.5% |
| Psychology | 331 | 6.1% |
| Social Sciences | 217 | 4.0% |
| Engineering | 330 | 6.1% |
| Multidisciplinary Studies | 35 | 0.6% |
| Science & Technology | 567 | 10.5% |
| Business | 1,018 | 18.9% |
| Education | 684 | 12.7% |
| Literature & Languages | 251 | 4.7% |
| Liberal Arts & History | 268 | 5.0% |
| Visual & Performing Arts | 253 | 4.7% |
| Communications | 442 | 8.2% |
| Arts & Humanities | 321 | 6.0% |
| Total | 5,382 | 100.0% |
Transportation & Commute in North Aurora
Vehicle Availability by Sex in North Aurora
The most prevalent vehicle ownership categories in North Aurora are males with 2 vehicles (2,341, accounting for 47.6%) and females with 2 vehicles (2,352, making up 52.0%).
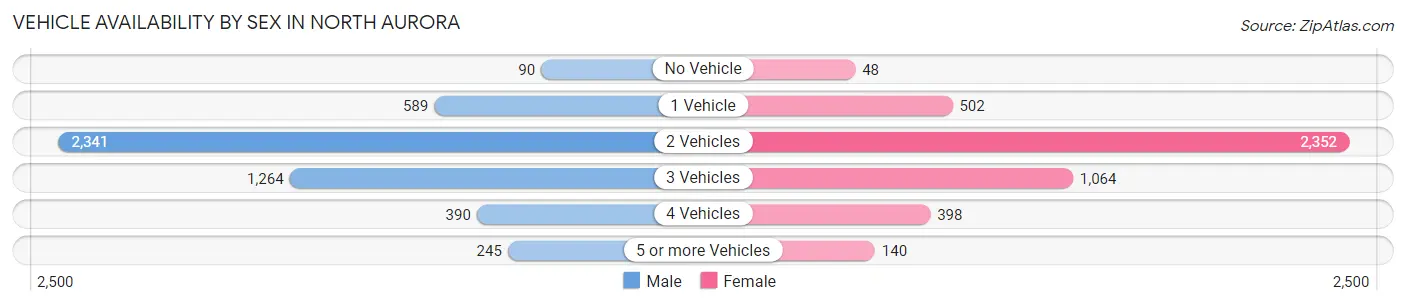
| Vehicles Available | Male | Female |
| No Vehicle | 90 (1.8%) | 48 (1.1%) |
| 1 Vehicle | 589 (12.0%) | 502 (11.2%) |
| 2 Vehicles | 2,341 (47.6%) | 2,352 (52.2%) |
| 3 Vehicles | 1,264 (25.7%) | 1,064 (23.6%) |
| 4 Vehicles | 390 (7.9%) | 398 (8.8%) |
| 5 or more Vehicles | 245 (5.0%) | 140 (3.1%) |
| Total | 4,919 (100.0%) | 4,504 (100.0%) |
Commute Time in North Aurora
The most frequently occuring commute durations in North Aurora are 15 to 19 minutes (1,376 commuters, 17.3%), 20 to 24 minutes (1,263 commuters, 15.9%), and 30 to 34 minutes (1,085 commuters, 13.7%).
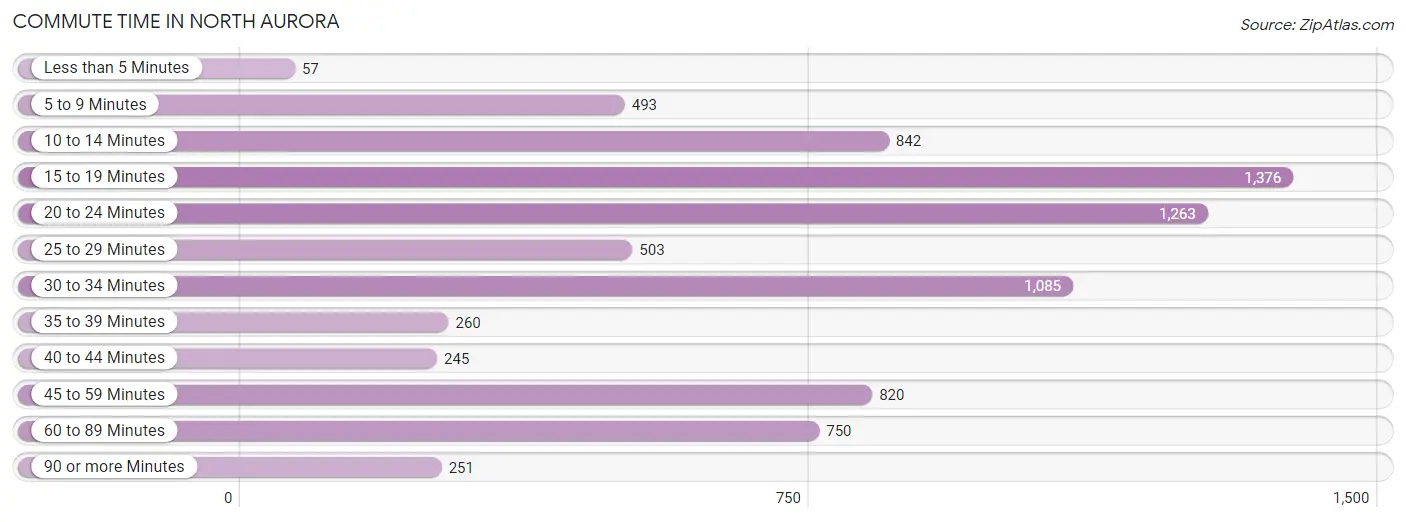
| Commute Time | # Commuters | % Commuters |
| Less than 5 Minutes | 57 | 0.7% |
| 5 to 9 Minutes | 493 | 6.2% |
| 10 to 14 Minutes | 842 | 10.6% |
| 15 to 19 Minutes | 1,376 | 17.3% |
| 20 to 24 Minutes | 1,263 | 15.9% |
| 25 to 29 Minutes | 503 | 6.3% |
| 30 to 34 Minutes | 1,085 | 13.7% |
| 35 to 39 Minutes | 260 | 3.3% |
| 40 to 44 Minutes | 245 | 3.1% |
| 45 to 59 Minutes | 820 | 10.3% |
| 60 to 89 Minutes | 750 | 9.4% |
| 90 or more Minutes | 251 | 3.2% |
Commute Time by Sex in North Aurora
The most common commute times in North Aurora are 20 to 24 minutes (744 commuters, 17.2%) for males and 15 to 19 minutes (667 commuters, 18.4%) for females.
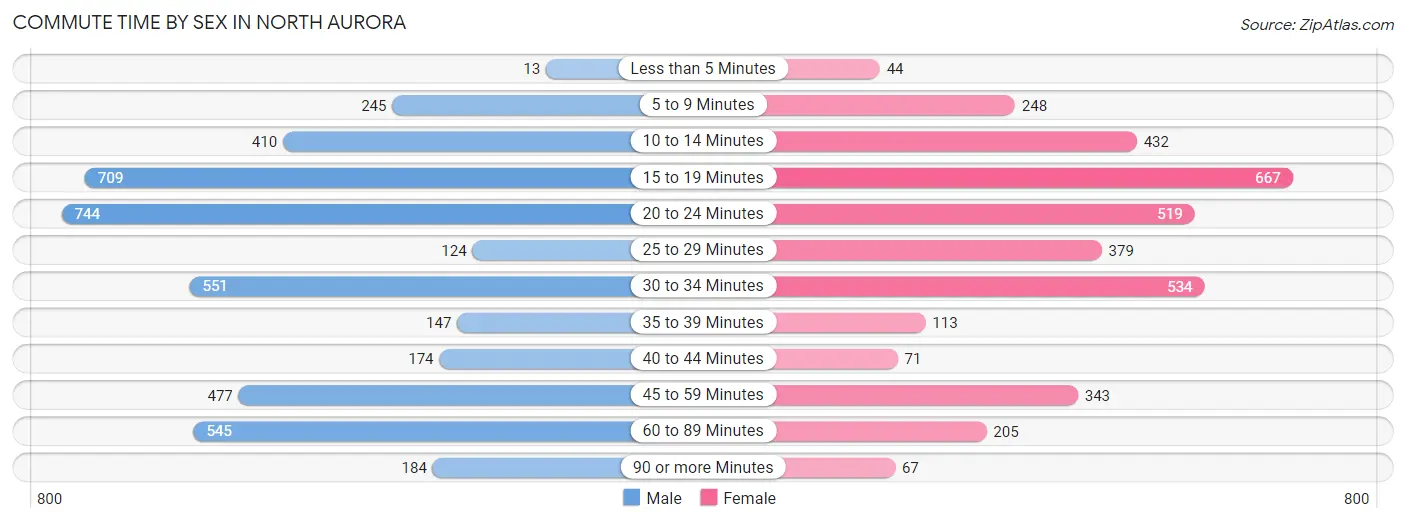
| Commute Time | Male | Female |
| Less than 5 Minutes | 13 (0.3%) | 44 (1.2%) |
| 5 to 9 Minutes | 245 (5.7%) | 248 (6.9%) |
| 10 to 14 Minutes | 410 (9.5%) | 432 (11.9%) |
| 15 to 19 Minutes | 709 (16.4%) | 667 (18.4%) |
| 20 to 24 Minutes | 744 (17.2%) | 519 (14.3%) |
| 25 to 29 Minutes | 124 (2.9%) | 379 (10.5%) |
| 30 to 34 Minutes | 551 (12.8%) | 534 (14.7%) |
| 35 to 39 Minutes | 147 (3.4%) | 113 (3.1%) |
| 40 to 44 Minutes | 174 (4.0%) | 71 (2.0%) |
| 45 to 59 Minutes | 477 (11.0%) | 343 (9.5%) |
| 60 to 89 Minutes | 545 (12.6%) | 205 (5.7%) |
| 90 or more Minutes | 184 (4.3%) | 67 (1.8%) |
Time of Departure to Work by Sex in North Aurora
The most frequent times of departure to work in North Aurora are 6:30 AM to 6:59 AM (667, 15.4%) for males and 7:30 AM to 7:59 AM (589, 16.3%) for females.
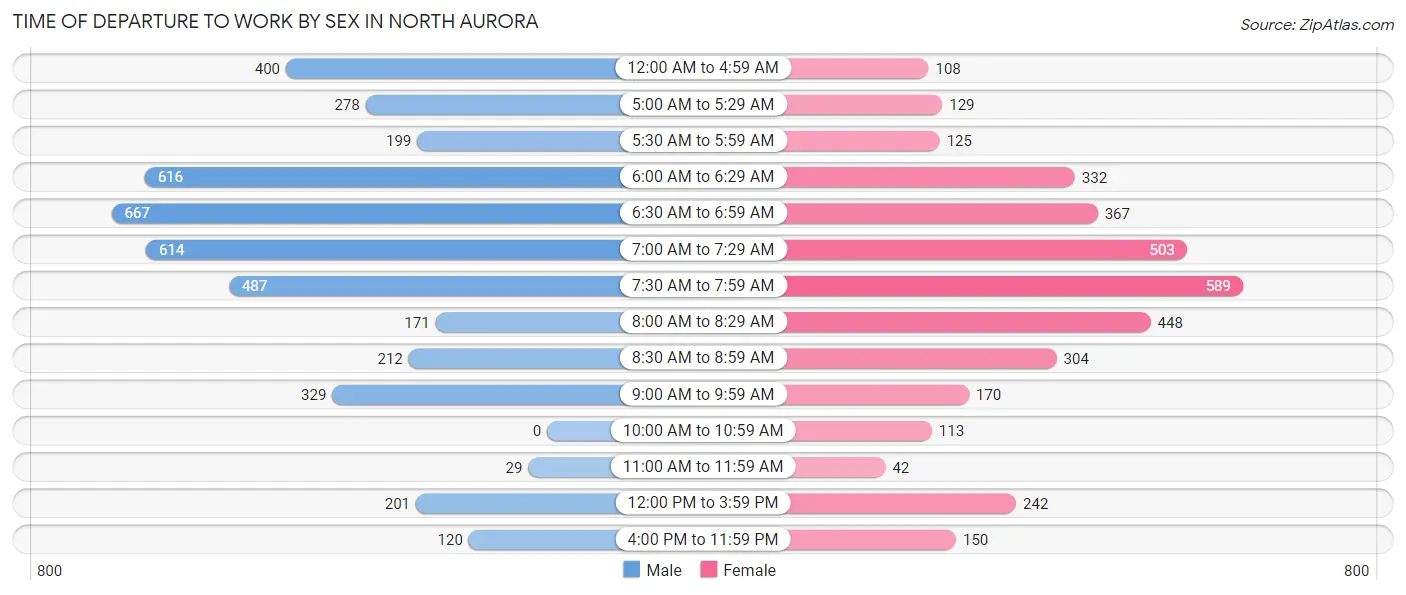
| Time of Departure | Male | Female |
| 12:00 AM to 4:59 AM | 400 (9.2%) | 108 (3.0%) |
| 5:00 AM to 5:29 AM | 278 (6.4%) | 129 (3.6%) |
| 5:30 AM to 5:59 AM | 199 (4.6%) | 125 (3.5%) |
| 6:00 AM to 6:29 AM | 616 (14.2%) | 332 (9.2%) |
| 6:30 AM to 6:59 AM | 667 (15.4%) | 367 (10.1%) |
| 7:00 AM to 7:29 AM | 614 (14.2%) | 503 (13.9%) |
| 7:30 AM to 7:59 AM | 487 (11.3%) | 589 (16.3%) |
| 8:00 AM to 8:29 AM | 171 (4.0%) | 448 (12.4%) |
| 8:30 AM to 8:59 AM | 212 (4.9%) | 304 (8.4%) |
| 9:00 AM to 9:59 AM | 329 (7.6%) | 170 (4.7%) |
| 10:00 AM to 10:59 AM | 0 (0.0%) | 113 (3.1%) |
| 11:00 AM to 11:59 AM | 29 (0.7%) | 42 (1.2%) |
| 12:00 PM to 3:59 PM | 201 (4.6%) | 242 (6.7%) |
| 4:00 PM to 11:59 PM | 120 (2.8%) | 150 (4.1%) |
| Total | 4,323 (100.0%) | 3,622 (100.0%) |
Housing Occupancy in North Aurora
Occupancy by Ownership in North Aurora
Of the total 6,841 dwellings in North Aurora, owner-occupied units account for 5,029 (73.5%), while renter-occupied units make up 1,812 (26.5%).
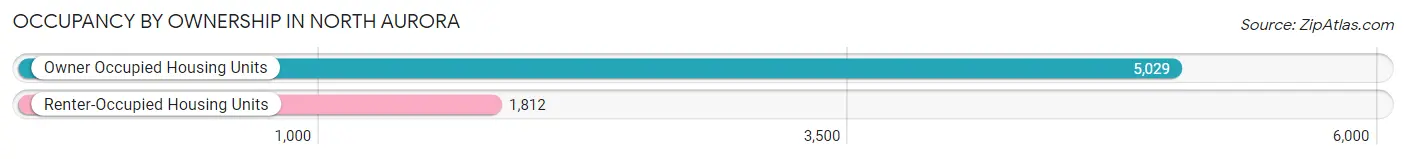
| Occupancy | # Housing Units | % Housing Units |
| Owner Occupied Housing Units | 5,029 | 73.5% |
| Renter-Occupied Housing Units | 1,812 | 26.5% |
| Total Occupied Housing Units | 6,841 | 100.0% |
Occupancy by Household Size in North Aurora
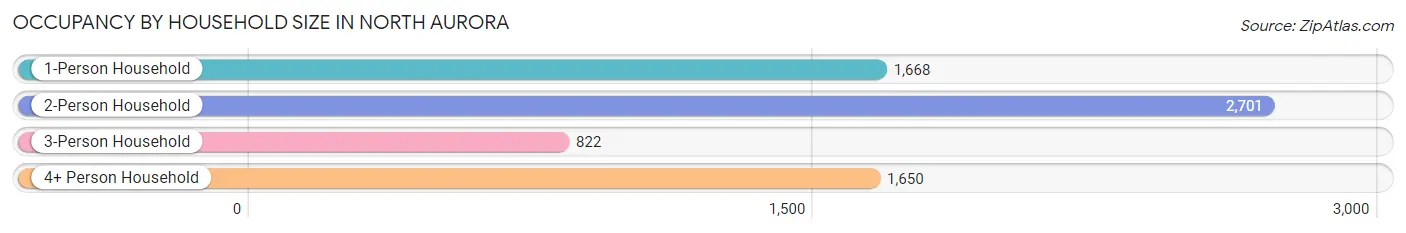
| Household Size | # Housing Units | % Housing Units |
| 1-Person Household | 1,668 | 24.4% |
| 2-Person Household | 2,701 | 39.5% |
| 3-Person Household | 822 | 12.0% |
| 4+ Person Household | 1,650 | 24.1% |
| Total Housing Units | 6,841 | 100.0% |
Occupancy by Ownership by Household Size in North Aurora
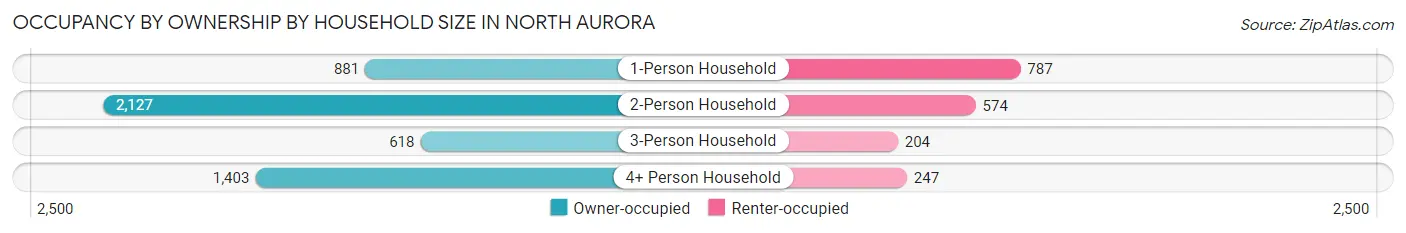
| Household Size | Owner-occupied | Renter-occupied |
| 1-Person Household | 881 (52.8%) | 787 (47.2%) |
| 2-Person Household | 2,127 (78.7%) | 574 (21.2%) |
| 3-Person Household | 618 (75.2%) | 204 (24.8%) |
| 4+ Person Household | 1,403 (85.0%) | 247 (15.0%) |
| Total Housing Units | 5,029 (73.5%) | 1,812 (26.5%) |
Occupancy by Educational Attainment in North Aurora
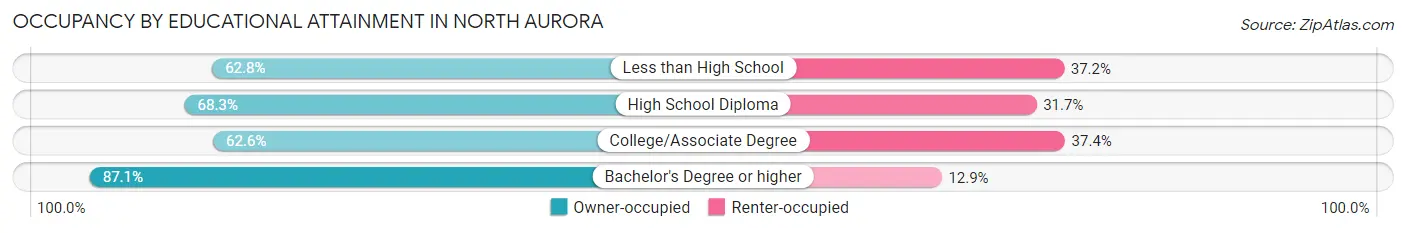
| Household Size | Owner-occupied | Renter-occupied |
| Less than High School | 184 (62.8%) | 109 (37.2%) |
| High School Diploma | 824 (68.3%) | 383 (31.7%) |
| College/Associate Degree | 1,612 (62.6%) | 962 (37.4%) |
| Bachelor's Degree or higher | 2,409 (87.1%) | 358 (12.9%) |
Occupancy by Age of Householder in North Aurora
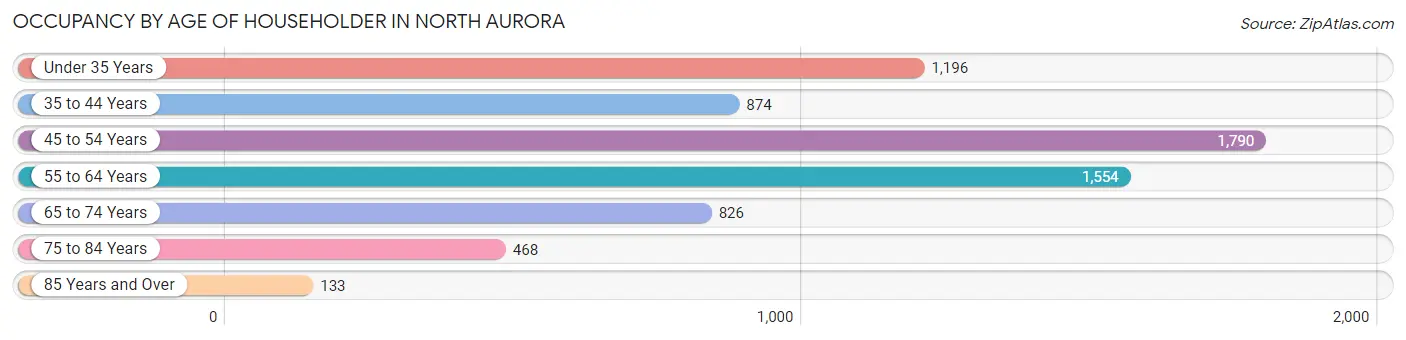
| Age Bracket | # Households | % Households |
| Under 35 Years | 1,196 | 17.5% |
| 35 to 44 Years | 874 | 12.8% |
| 45 to 54 Years | 1,790 | 26.2% |
| 55 to 64 Years | 1,554 | 22.7% |
| 65 to 74 Years | 826 | 12.1% |
| 75 to 84 Years | 468 | 6.8% |
| 85 Years and Over | 133 | 1.9% |
| Total | 6,841 | 100.0% |
Housing Finances in North Aurora
Median Income by Occupancy in North Aurora
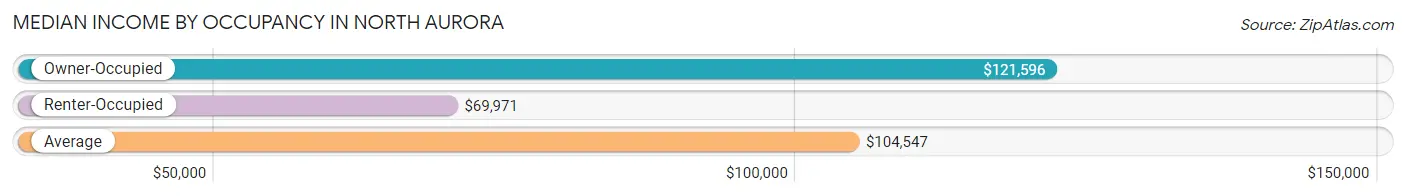
| Occupancy Type | # Households | Median Income |
| Owner-Occupied | 5,029 (73.5%) | $121,596 |
| Renter-Occupied | 1,812 (26.5%) | $69,971 |
| Average | 6,841 (100.0%) | $104,547 |
Occupancy by Householder Income Bracket in North Aurora
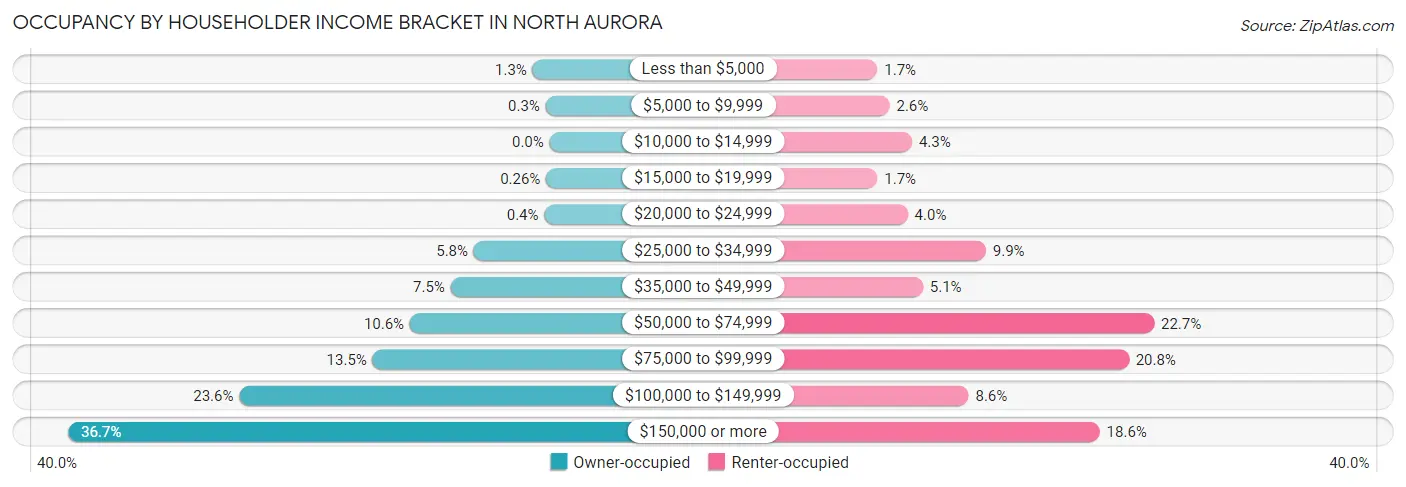
| Income Bracket | Owner-occupied | Renter-occupied |
| Less than $5,000 | 65 (1.3%) | 30 (1.7%) |
| $5,000 to $9,999 | 15 (0.3%) | 47 (2.6%) |
| $10,000 to $14,999 | 0 (0.0%) | 78 (4.3%) |
| $15,000 to $19,999 | 13 (0.3%) | 30 (1.7%) |
| $20,000 to $24,999 | 20 (0.4%) | 72 (4.0%) |
| $25,000 to $34,999 | 290 (5.8%) | 180 (9.9%) |
| $35,000 to $49,999 | 379 (7.5%) | 93 (5.1%) |
| $50,000 to $74,999 | 535 (10.6%) | 412 (22.7%) |
| $75,000 to $99,999 | 678 (13.5%) | 377 (20.8%) |
| $100,000 to $149,999 | 1,189 (23.6%) | 156 (8.6%) |
| $150,000 or more | 1,845 (36.7%) | 337 (18.6%) |
| Total | 5,029 (100.0%) | 1,812 (100.0%) |
Monthly Housing Cost Tiers in North Aurora
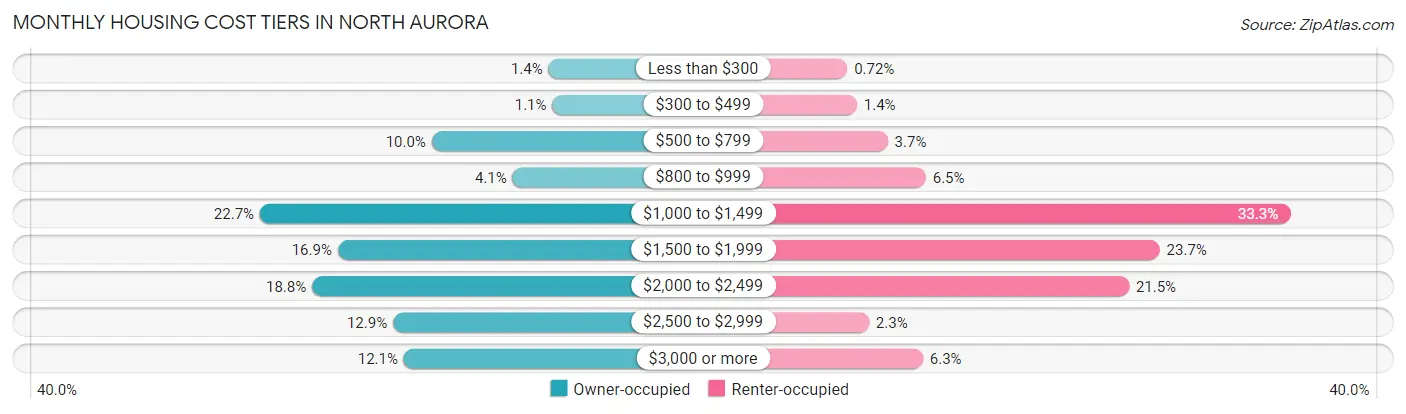
| Monthly Cost | Owner-occupied | Renter-occupied |
| Less than $300 | 71 (1.4%) | 13 (0.7%) |
| $300 to $499 | 57 (1.1%) | 26 (1.4%) |
| $500 to $799 | 504 (10.0%) | 67 (3.7%) |
| $800 to $999 | 204 (4.1%) | 118 (6.5%) |
| $1,000 to $1,499 | 1,140 (22.7%) | 604 (33.3%) |
| $1,500 to $1,999 | 852 (16.9%) | 430 (23.7%) |
| $2,000 to $2,499 | 947 (18.8%) | 389 (21.5%) |
| $2,500 to $2,999 | 647 (12.9%) | 42 (2.3%) |
| $3,000 or more | 607 (12.1%) | 114 (6.3%) |
| Total | 5,029 (100.0%) | 1,812 (100.0%) |
Physical Housing Characteristics in North Aurora
Housing Structures in North Aurora
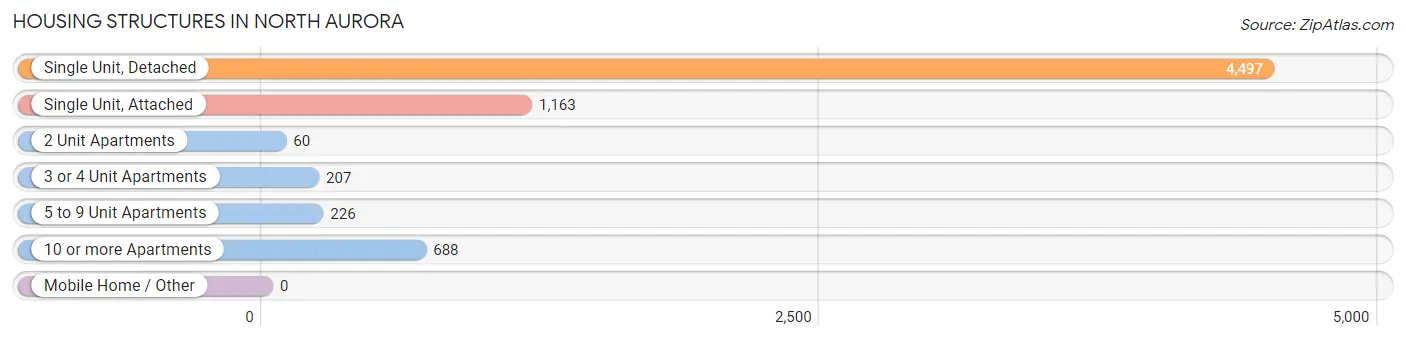
| Structure Type | # Housing Units | % Housing Units |
| Single Unit, Detached | 4,497 | 65.7% |
| Single Unit, Attached | 1,163 | 17.0% |
| 2 Unit Apartments | 60 | 0.9% |
| 3 or 4 Unit Apartments | 207 | 3.0% |
| 5 to 9 Unit Apartments | 226 | 3.3% |
| 10 or more Apartments | 688 | 10.1% |
| Mobile Home / Other | 0 | 0.0% |
| Total | 6,841 | 100.0% |
Housing Structures by Occupancy in North Aurora
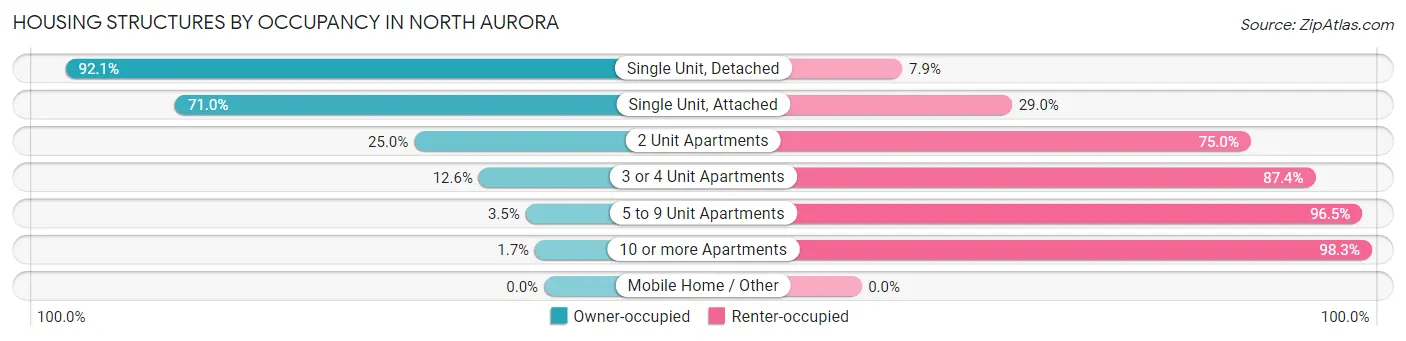
| Structure Type | Owner-occupied | Renter-occupied |
| Single Unit, Detached | 4,142 (92.1%) | 355 (7.9%) |
| Single Unit, Attached | 826 (71.0%) | 337 (29.0%) |
| 2 Unit Apartments | 15 (25.0%) | 45 (75.0%) |
| 3 or 4 Unit Apartments | 26 (12.6%) | 181 (87.4%) |
| 5 to 9 Unit Apartments | 8 (3.5%) | 218 (96.5%) |
| 10 or more Apartments | 12 (1.7%) | 676 (98.3%) |
| Mobile Home / Other | 0 (0.0%) | 0 (0.0%) |
| Total | 5,029 (73.5%) | 1,812 (26.5%) |
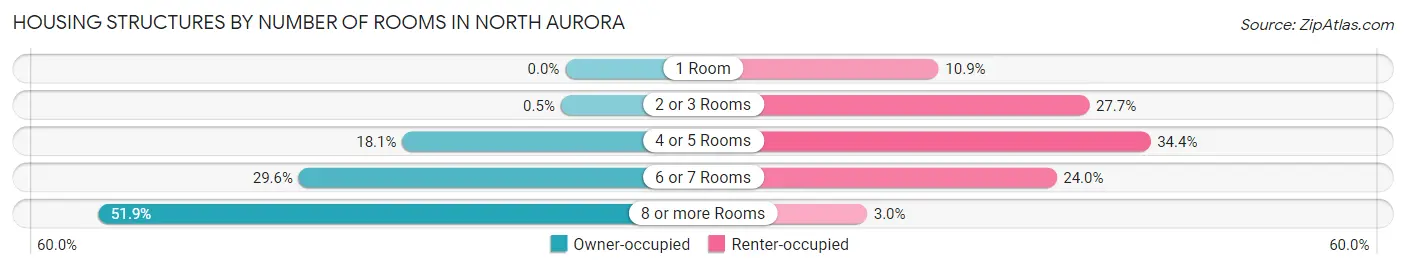
Housing Structures by Number of Rooms in North Aurora
| Number of Rooms | Owner-occupied | Renter-occupied |
| 1 Room | 0 (0.0%) | 198 (10.9%) |
| 2 or 3 Rooms | 25 (0.5%) | 501 (27.7%) |
| 4 or 5 Rooms | 909 (18.1%) | 624 (34.4%) |
| 6 or 7 Rooms | 1,487 (29.6%) | 435 (24.0%) |
| 8 or more Rooms | 2,608 (51.9%) | 54 (3.0%) |
| Total | 5,029 (100.0%) | 1,812 (100.0%) |
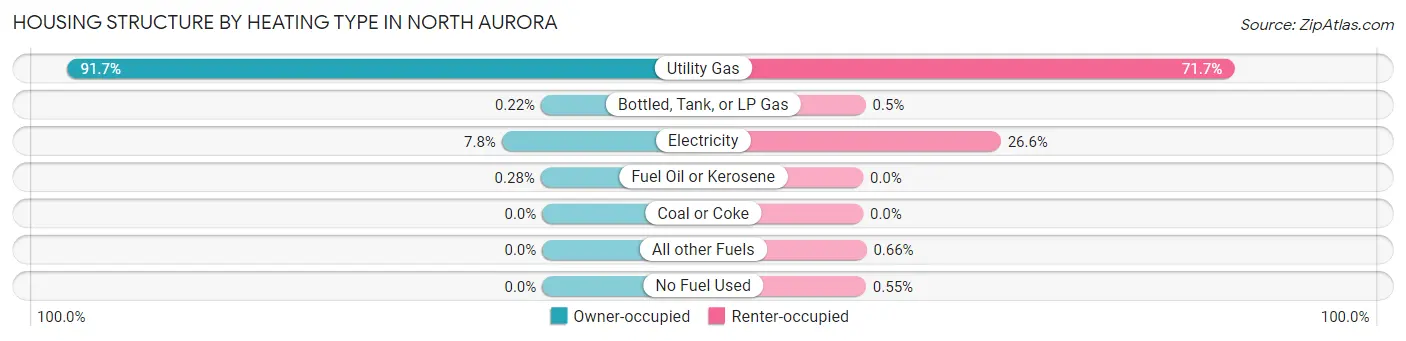
Housing Structure by Heating Type in North Aurora
| Heating Type | Owner-occupied | Renter-occupied |
| Utility Gas | 4,611 (91.7%) | 1,299 (71.7%) |
| Bottled, Tank, or LP Gas | 11 (0.2%) | 9 (0.5%) |
| Electricity | 393 (7.8%) | 482 (26.6%) |
| Fuel Oil or Kerosene | 14 (0.3%) | 0 (0.0%) |
| Coal or Coke | 0 (0.0%) | 0 (0.0%) |
| All other Fuels | 0 (0.0%) | 12 (0.7%) |
| No Fuel Used | 0 (0.0%) | 10 (0.5%) |
| Total | 5,029 (100.0%) | 1,812 (100.0%) |
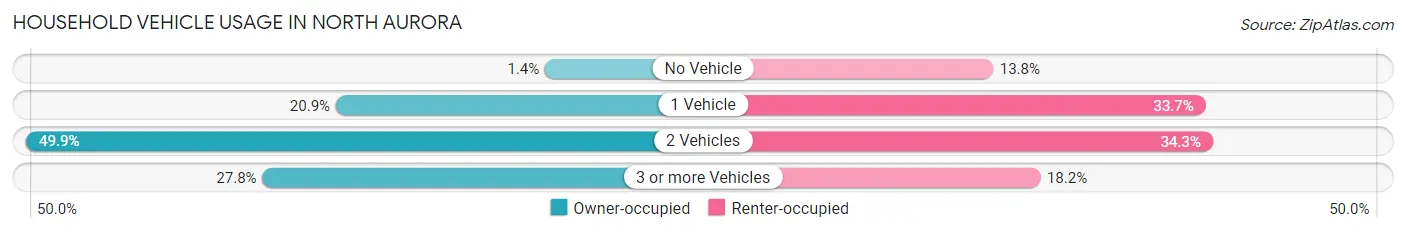
Household Vehicle Usage in North Aurora
| Vehicles per Household | Owner-occupied | Renter-occupied |
| No Vehicle | 71 (1.4%) | 250 (13.8%) |
| 1 Vehicle | 1,053 (20.9%) | 610 (33.7%) |
| 2 Vehicles | 2,507 (49.8%) | 622 (34.3%) |
| 3 or more Vehicles | 1,398 (27.8%) | 330 (18.2%) |
| Total | 5,029 (100.0%) | 1,812 (100.0%) |
Real Estate & Mortgages in North Aurora
Real Estate and Mortgage Overview in North Aurora
| Characteristic | Without Mortgage | With Mortgage |
| Housing Units | 1,427 | 3,602 |
| Median Property Value | $277,600 | $314,200 |
| Median Household Income | $87,123 | $1,537 |
| Monthly Housing Costs | $918 | $607 |
| Real Estate Taxes | $7,179 | $5 |
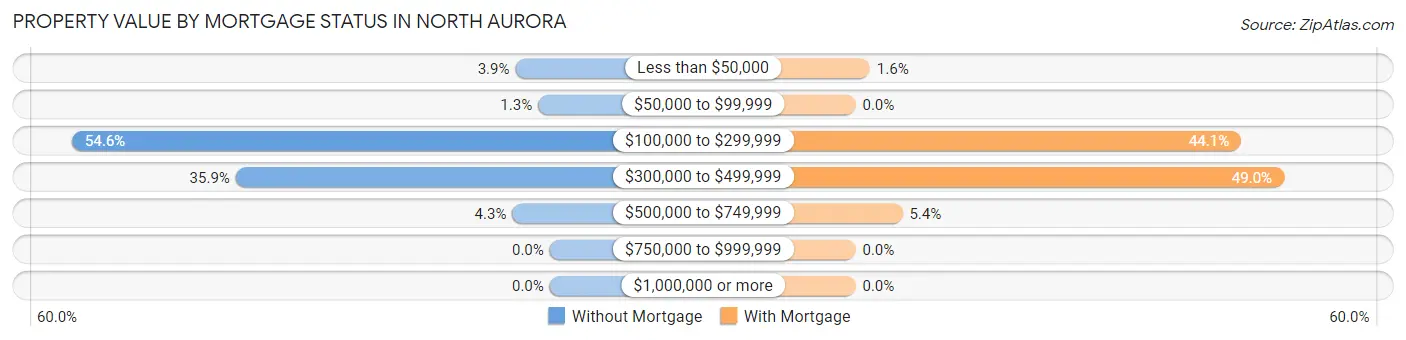
Property Value by Mortgage Status in North Aurora
| Property Value | Without Mortgage | With Mortgage |
| Less than $50,000 | 56 (3.9%) | 59 (1.6%) |
| $50,000 to $99,999 | 19 (1.3%) | 0 (0.0%) |
| $100,000 to $299,999 | 779 (54.6%) | 1,587 (44.1%) |
| $300,000 to $499,999 | 512 (35.9%) | 1,763 (48.9%) |
| $500,000 to $749,999 | 61 (4.3%) | 193 (5.4%) |
| $750,000 to $999,999 | 0 (0.0%) | 0 (0.0%) |
| $1,000,000 or more | 0 (0.0%) | 0 (0.0%) |
| Total | 1,427 (100.0%) | 3,602 (100.0%) |
Household Income by Mortgage Status in North Aurora
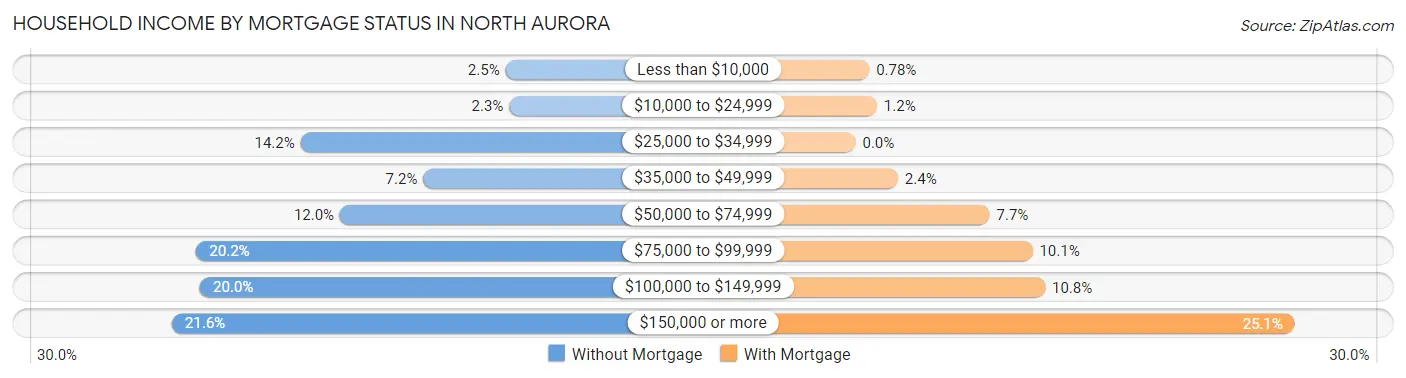
| Household Income | Without Mortgage | With Mortgage |
| Less than $10,000 | 36 (2.5%) | 28 (0.8%) |
| $10,000 to $24,999 | 33 (2.3%) | 44 (1.2%) |
| $25,000 to $34,999 | 203 (14.2%) | 0 (0.0%) |
| $35,000 to $49,999 | 103 (7.2%) | 87 (2.4%) |
| $50,000 to $74,999 | 171 (12.0%) | 276 (7.7%) |
| $75,000 to $99,999 | 288 (20.2%) | 364 (10.1%) |
| $100,000 to $149,999 | 285 (20.0%) | 390 (10.8%) |
| $150,000 or more | 308 (21.6%) | 904 (25.1%) |
| Total | 1,427 (100.0%) | 3,602 (100.0%) |
Property Value to Household Income Ratio in North Aurora
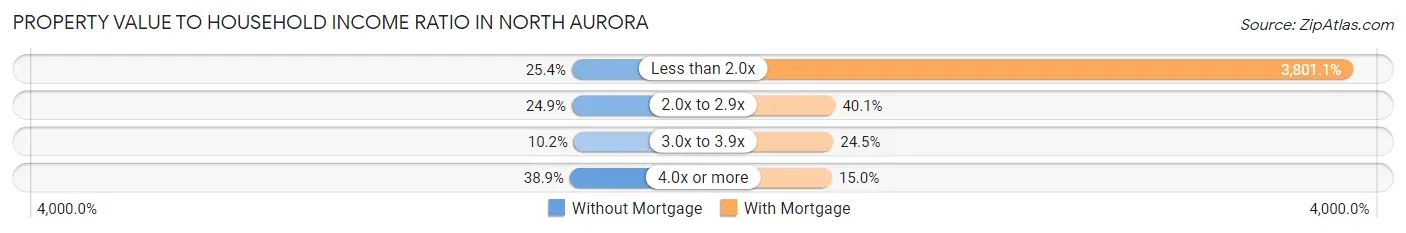
| Value-to-Income Ratio | Without Mortgage | With Mortgage |
| Less than 2.0x | 362 (25.4%) | 136,916 (3,801.1%) |
| 2.0x to 2.9x | 355 (24.9%) | 1,443 (40.1%) |
| 3.0x to 3.9x | 146 (10.2%) | 883 (24.5%) |
| 4.0x or more | 555 (38.9%) | 541 (15.0%) |
| Total | 1,427 (100.0%) | 3,602 (100.0%) |
Real Estate Taxes by Mortgage Status in North Aurora
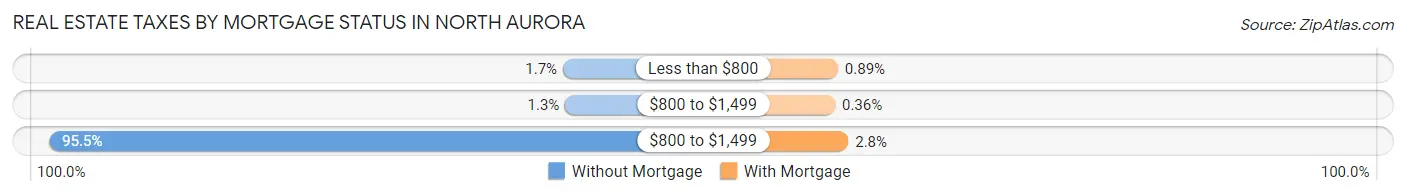
| Property Taxes | Without Mortgage | With Mortgage |
| Less than $800 | 24 (1.7%) | 32 (0.9%) |
| $800 to $1,499 | 18 (1.3%) | 13 (0.4%) |
| $800 to $1,499 | 1,363 (95.5%) | 100 (2.8%) |
| Total | 1,427 (100.0%) | 3,602 (100.0%) |
Health & Disability in North Aurora
Health Insurance Coverage by Age in North Aurora
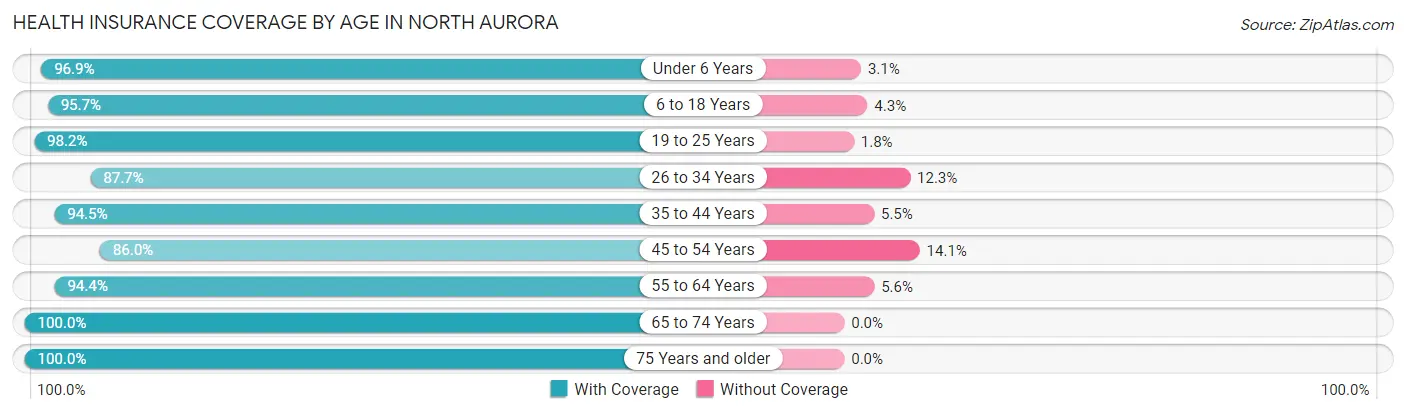
| Age Bracket | With Coverage | Without Coverage |
| Under 6 Years | 1,307 (96.9%) | 42 (3.1%) |
| 6 to 18 Years | 2,486 (95.7%) | 112 (4.3%) |
| 19 to 25 Years | 1,162 (98.2%) | 21 (1.8%) |
| 26 to 34 Years | 2,095 (87.7%) | 293 (12.3%) |
| 35 to 44 Years | 1,926 (94.5%) | 113 (5.5%) |
| 45 to 54 Years | 2,478 (86.0%) | 405 (14.1%) |
| 55 to 64 Years | 2,604 (94.4%) | 154 (5.6%) |
| 65 to 74 Years | 1,413 (100.0%) | 0 (0.0%) |
| 75 Years and older | 934 (100.0%) | 0 (0.0%) |
| Total | 16,405 (93.5%) | 1,140 (6.5%) |
Health Insurance Coverage by Citizenship Status in North Aurora
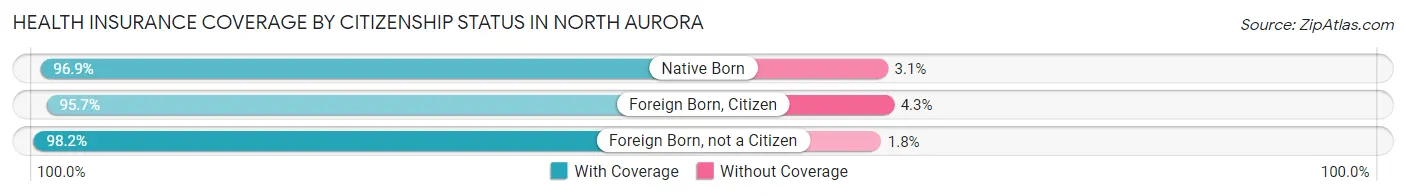
| Citizenship Status | With Coverage | Without Coverage |
| Native Born | 1,307 (96.9%) | 42 (3.1%) |
| Foreign Born, Citizen | 2,486 (95.7%) | 112 (4.3%) |
| Foreign Born, not a Citizen | 1,162 (98.2%) | 21 (1.8%) |
Health Insurance Coverage by Household Income in North Aurora
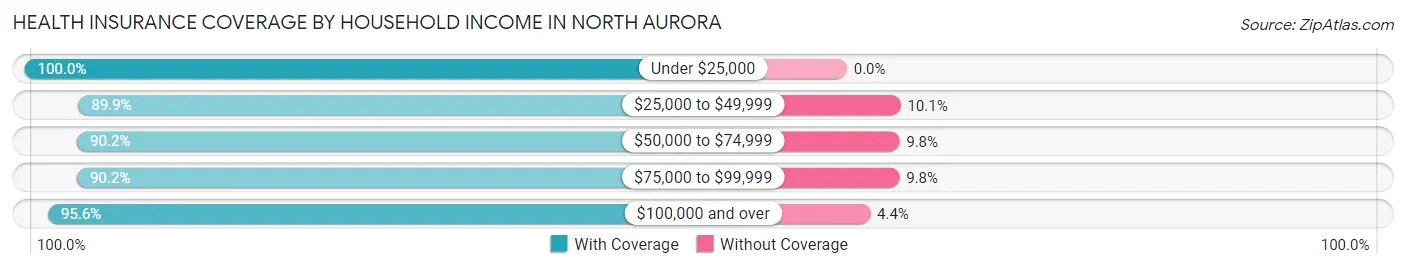
| Household Income | With Coverage | Without Coverage |
| Under $25,000 | 445 (100.0%) | 0 (0.0%) |
| $25,000 to $49,999 | 1,789 (89.9%) | 200 (10.1%) |
| $50,000 to $74,999 | 1,834 (90.2%) | 200 (9.8%) |
| $75,000 to $99,999 | 2,828 (90.2%) | 308 (9.8%) |
| $100,000 and over | 9,460 (95.6%) | 432 (4.4%) |
Public vs Private Health Insurance Coverage by Age in North Aurora
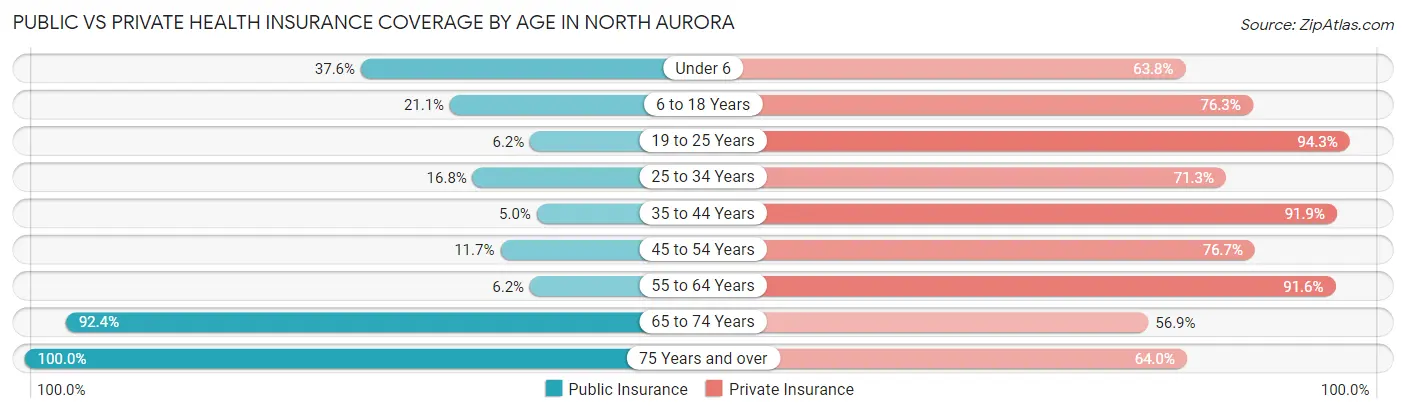
| Age Bracket | Public Insurance | Private Insurance |
| Under 6 | 507 (37.6%) | 860 (63.7%) |
| 6 to 18 Years | 547 (21.0%) | 1,981 (76.2%) |
| 19 to 25 Years | 73 (6.2%) | 1,115 (94.3%) |
| 25 to 34 Years | 402 (16.8%) | 1,702 (71.3%) |
| 35 to 44 Years | 101 (5.0%) | 1,873 (91.9%) |
| 45 to 54 Years | 338 (11.7%) | 2,210 (76.7%) |
| 55 to 64 Years | 171 (6.2%) | 2,526 (91.6%) |
| 65 to 74 Years | 1,305 (92.4%) | 804 (56.9%) |
| 75 Years and over | 934 (100.0%) | 598 (64.0%) |
| Total | 4,378 (24.9%) | 13,669 (77.9%) |
Disability Status by Sex by Age in North Aurora
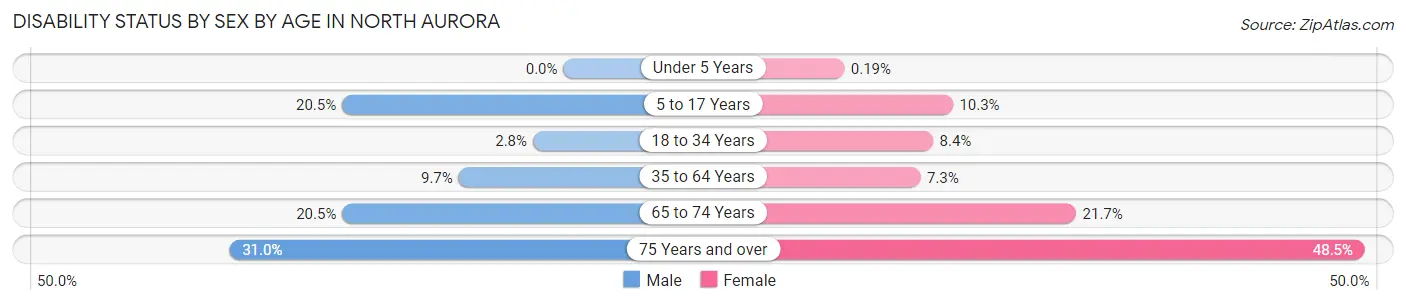
| Age Bracket | Male | Female |
| Under 5 Years | 0 (0.0%) | 1 (0.2%) |
| 5 to 17 Years | 298 (20.5%) | 137 (10.3%) |
| 18 to 34 Years | 47 (2.8%) | 174 (8.4%) |
| 35 to 64 Years | 380 (9.7%) | 274 (7.3%) |
| 65 to 74 Years | 150 (20.5%) | 148 (21.7%) |
| 75 Years and over | 98 (31.0%) | 300 (48.5%) |
Disability Class by Sex by Age in North Aurora
Disability Class: Hearing Difficulty
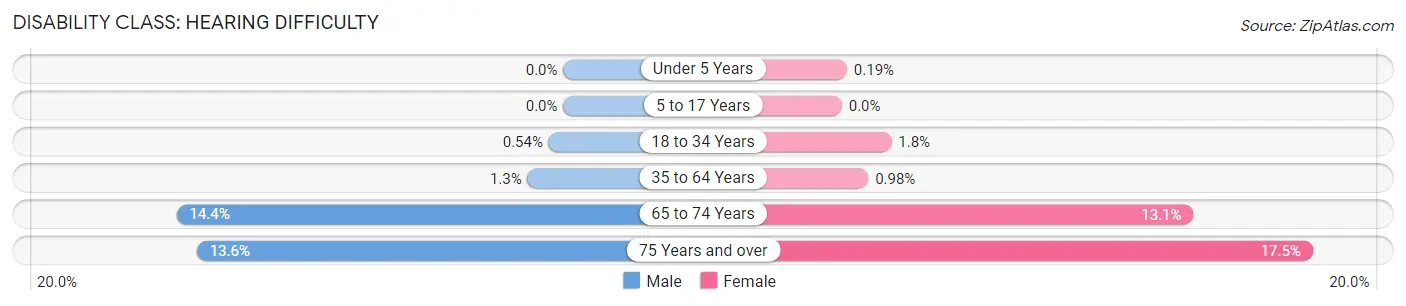
| Age Bracket | Male | Female |
| Under 5 Years | 0 (0.0%) | 1 (0.2%) |
| 5 to 17 Years | 0 (0.0%) | 0 (0.0%) |
| 18 to 34 Years | 9 (0.5%) | 38 (1.8%) |
| 35 to 64 Years | 52 (1.3%) | 37 (1.0%) |
| 65 to 74 Years | 105 (14.4%) | 89 (13.1%) |
| 75 Years and over | 43 (13.6%) | 108 (17.5%) |
Disability Class: Vision Difficulty
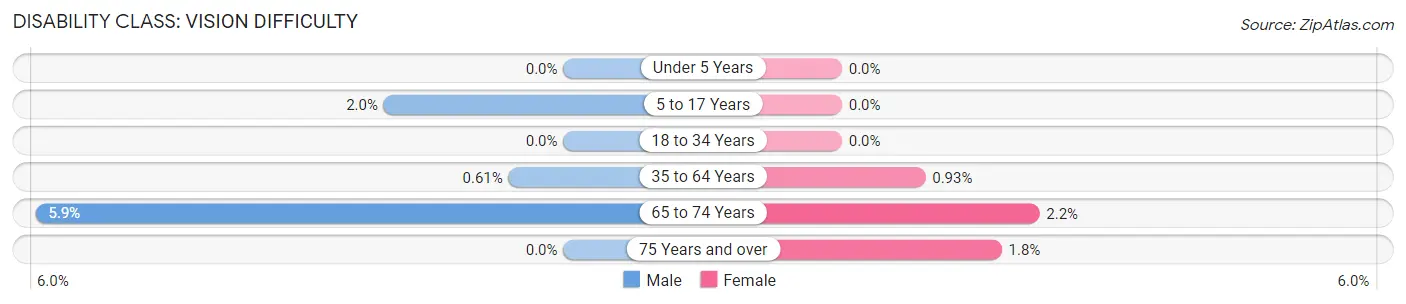
| Age Bracket | Male | Female |
| Under 5 Years | 0 (0.0%) | 0 (0.0%) |
| 5 to 17 Years | 29 (2.0%) | 0 (0.0%) |
| 18 to 34 Years | 0 (0.0%) | 0 (0.0%) |
| 35 to 64 Years | 24 (0.6%) | 35 (0.9%) |
| 65 to 74 Years | 43 (5.9%) | 15 (2.2%) |
| 75 Years and over | 0 (0.0%) | 11 (1.8%) |
Disability Class: Cognitive Difficulty
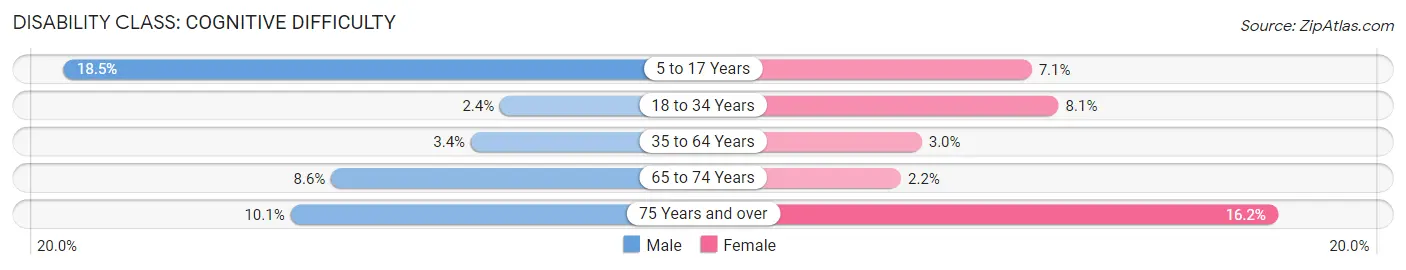
| Age Bracket | Male | Female |
| 5 to 17 Years | 269 (18.5%) | 94 (7.0%) |
| 18 to 34 Years | 39 (2.4%) | 166 (8.1%) |
| 35 to 64 Years | 134 (3.4%) | 112 (3.0%) |
| 65 to 74 Years | 63 (8.6%) | 15 (2.2%) |
| 75 Years and over | 32 (10.1%) | 100 (16.2%) |
Disability Class: Ambulatory Difficulty
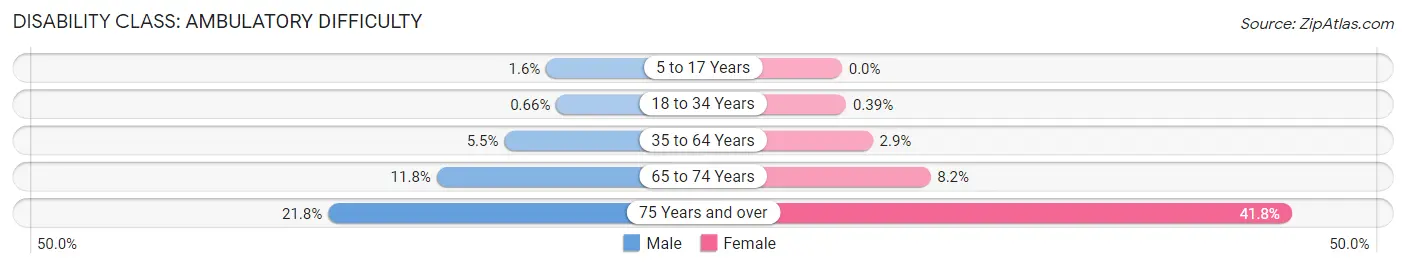
| Age Bracket | Male | Female |
| 5 to 17 Years | 23 (1.6%) | 0 (0.0%) |
| 18 to 34 Years | 11 (0.7%) | 8 (0.4%) |
| 35 to 64 Years | 214 (5.5%) | 108 (2.9%) |
| 65 to 74 Years | 86 (11.8%) | 56 (8.2%) |
| 75 Years and over | 69 (21.8%) | 258 (41.7%) |
Disability Class: Self-Care Difficulty
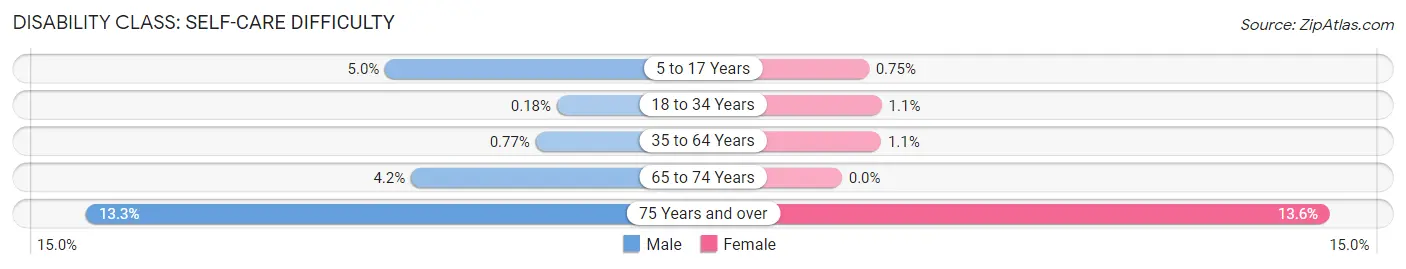
| Age Bracket | Male | Female |
| 5 to 17 Years | 72 (5.0%) | 10 (0.7%) |
| 18 to 34 Years | 3 (0.2%) | 23 (1.1%) |
| 35 to 64 Years | 30 (0.8%) | 41 (1.1%) |
| 65 to 74 Years | 31 (4.2%) | 0 (0.0%) |
| 75 Years and over | 42 (13.3%) | 84 (13.6%) |
Technology Access in North Aurora
Computing Device Access in North Aurora
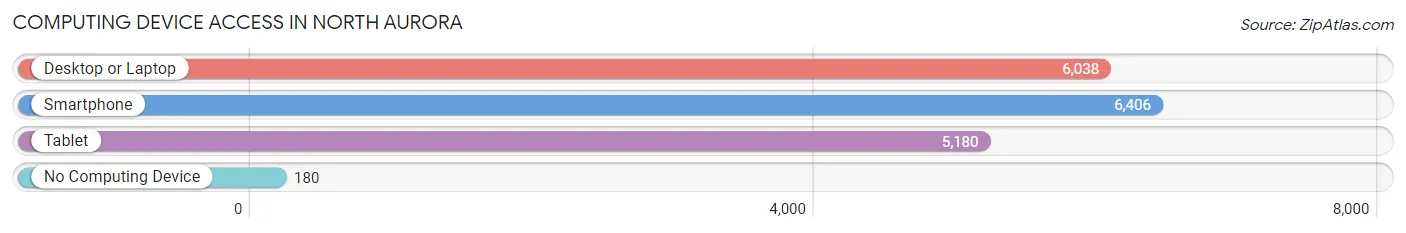
| Device Type | # Households | % Households |
| Desktop or Laptop | 6,038 | 88.3% |
| Smartphone | 6,406 | 93.6% |
| Tablet | 5,180 | 75.7% |
| No Computing Device | 180 | 2.6% |
| Total | 6,841 | 100.0% |
Internet Access in North Aurora
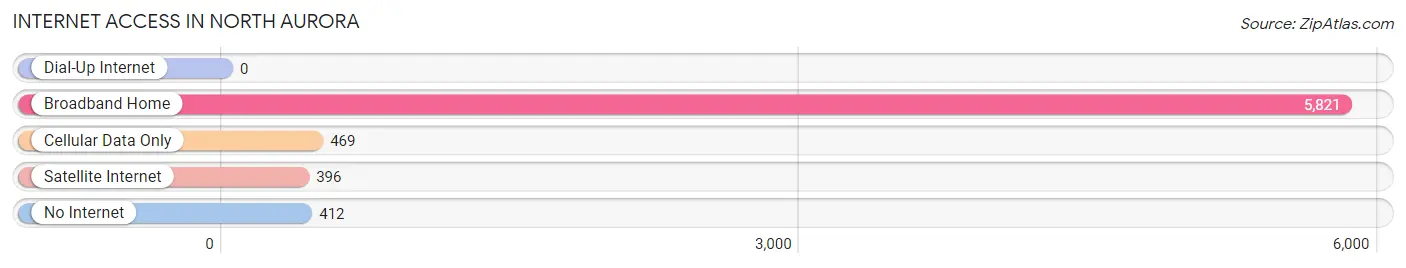
| Internet Type | # Households | % Households |
| Dial-Up Internet | 0 | 0.0% |
| Broadband Home | 5,821 | 85.1% |
| Cellular Data Only | 469 | 6.9% |
| Satellite Internet | 396 | 5.8% |
| No Internet | 412 | 6.0% |
| Total | 6,841 | 100.0% |
North Aurora Summary
History
North Aurora, Illinois is a village located in Kane and DuPage counties in the state of Illinois. It is a suburb of Chicago, located about 40 miles west of the city. The village was first settled in 1834 by settlers from New York and New England. The village was originally known as Schneider’s Mill, after the first settler, John Schneider. The village was renamed North Aurora in 1845, after the Aurora River, which flows through the area.
The village was incorporated in 1881 and has since grown to a population of over 17,000. The village is home to several businesses, including a large industrial park, and is a popular destination for commuters to Chicago.
Geography
North Aurora is located in the Fox River Valley, in the northeastern corner of Kane County and the southwestern corner of DuPage County. The village is bordered by the Fox River to the north, the village of Aurora to the east, the village of Montgomery to the south, and the village of Sugar Grove to the west. The village covers an area of 4.6 square miles, with a population density of 3,717 people per square mile.
The village is located in a temperate climate, with hot summers and cold winters. The average temperature in the summer is around 75 degrees Fahrenheit, and the average temperature in the winter is around 25 degrees Fahrenheit. The village receives an average of 36 inches of precipitation per year.
Economy
North Aurora’s economy is largely based on manufacturing and retail. The village is home to several large industrial parks, which are home to a variety of manufacturing companies. The village is also home to several retail stores, including a Walmart Supercenter, a Target, and a Kohl’s.
The village is also home to several restaurants, including a variety of fast food restaurants, as well as several local restaurants. The village is also home to several banks, including Bank of America, Chase, and Fifth Third Bank.
Demographics
As of the 2010 census, the population of North Aurora was 17,763. The racial makeup of the village was 87.3% White, 5.2% African American, 0.4% Native American, 2.2% Asian, 0.1% Pacific Islander, 2.3% from other races, and 2.5% from two or more races. Hispanic or Latino of any race were 8.2% of the population.
The median income for a household in the village was $67,917, and the median income for a family was $77,917. The per capita income for the village was $30,917. About 4.3% of families and 5.7% of the population were below the poverty line, including 8.2% of those under age 18 and 4.2% of those age 65 or over.
Common Questions
What is Per Capita Income in North Aurora?
Per Capita income in North Aurora is $49,621.
What is the Median Family Income in North Aurora?
Median Family Income in North Aurora is $122,340.
What is the Median Household income in North Aurora?
Median Household Income in North Aurora is $104,547.
What is Income or Wage Gap in North Aurora?
Income or Wage Gap in North Aurora is 37.7%.
Women in North Aurora earn 62.3 cents for every dollar earned by a man.
What is Inequality or Gini Index in North Aurora?
Inequality or Gini Index in North Aurora is 0.39.
What is the Total Population of North Aurora?
Total Population of North Aurora is 17,750.
What is the Total Male Population of North Aurora?
Total Male Population of North Aurora is 8,628.
What is the Total Female Population of North Aurora?
Total Female Population of North Aurora is 9,122.
What is the Ratio of Males per 100 Females in North Aurora?
There are 94.58 Males per 100 Females in North Aurora.
What is the Ratio of Females per 100 Males in North Aurora?
There are 105.73 Females per 100 Males in North Aurora.
What is the Median Population Age in North Aurora?
Median Population Age in North Aurora is 41.4 Years.
What is the Average Family Size in North Aurora
Average Family Size in North Aurora is 3.2 People.
What is the Average Household Size in North Aurora
Average Household Size in North Aurora is 2.6 People.
How Large is the Labor Force in North Aurora?
There are 10,336 People in the Labor Forcein in North Aurora.
What is the Percentage of People in the Labor Force in North Aurora?
71.7% of People are in the Labor Force in North Aurora.
What is the Unemployment Rate in North Aurora?
Unemployment Rate in North Aurora is 7.2%.