Jersey Shore borough, PA Map & Demographics
Jersey Shore borough Overview
$25,275
PER CAPITA INCOME
$80,308
AVG FAMILY INCOME
$65,286
AVG HOUSEHOLD INCOME
27.7%
WAGE / INCOME GAP [ % ]
72.3¢/ $1
WAGE / INCOME GAP [ $ ]
0.34
INEQUALITY / GINI INDEX
4,160
TOTAL POPULATION
2,258
MALE POPULATION
1,902
FEMALE POPULATION
118.72
MALES / 100 FEMALES
84.23
FEMALES / 100 MALES
38.1
MEDIAN AGE
3.3
AVG FAMILY SIZE
2.7
AVG HOUSEHOLD SIZE
1,731
LABOR FORCE [ PEOPLE ]
57.0%
PERCENT IN LABOR FORCE
4.9%
UNEMPLOYMENT RATE
Income in Jersey Shore borough
Income Overview in Jersey Shore borough
Per Capita Income in Jersey Shore borough is $25,275, while median incomes of families and households are $80,308 and $65,286 respectively.
| Characteristic | Number | Measure |
| Per Capita Income | 4,160 | $25,275 |
| Median Family Income | 1,041 | $80,308 |
| Mean Family Income | 1,041 | $80,669 |
| Median Household Income | 1,501 | $65,286 |
| Mean Household Income | 1,501 | $67,294 |
| Income Deficit | 1,041 | $0 |
| Wage / Income Gap (%) | 4,160 | 27.74% |
| Wage / Income Gap ($) | 4,160 | 72.26¢ per $1 |
| Gini / Inequality Index | 4,160 | 0.34 |
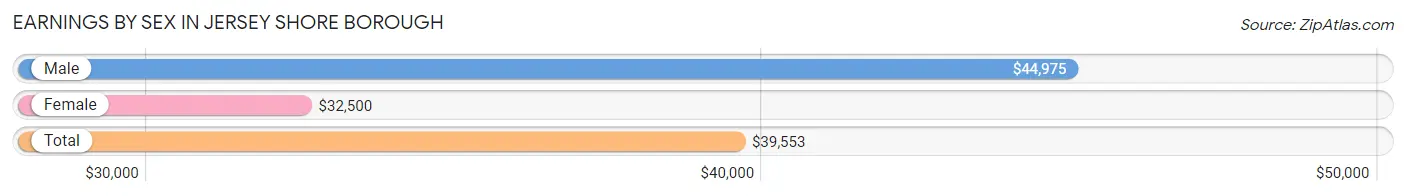
Earnings by Sex in Jersey Shore borough
Average Earnings in Jersey Shore borough are $39,553, $44,975 for men and $32,500 for women, a difference of 27.7%.
| Sex | Number | Average Earnings |
| Male | 1,146 (59.0%) | $44,975 |
| Female | 796 (41.0%) | $32,500 |
| Total | 1,942 (100.0%) | $39,553 |
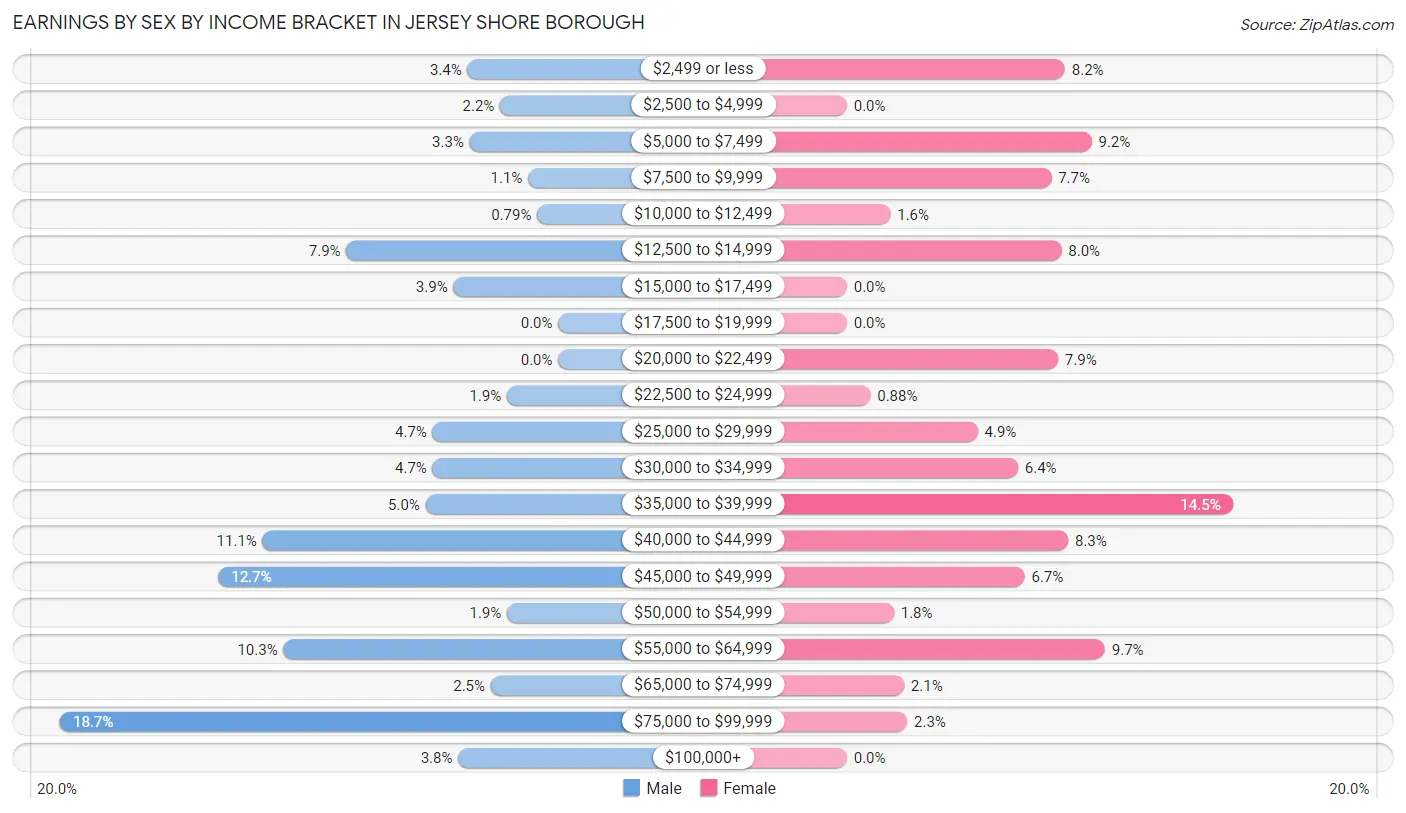
Earnings by Sex by Income Bracket in Jersey Shore borough
The most common earnings brackets in Jersey Shore borough are $75,000 to $99,999 for men (214 | 18.7%) and $35,000 to $39,999 for women (115 | 14.4%).
| Income | Male | Female |
| $2,499 or less | 39 (3.4%) | 65 (8.2%) |
| $2,500 to $4,999 | 25 (2.2%) | 0 (0.0%) |
| $5,000 to $7,499 | 38 (3.3%) | 73 (9.2%) |
| $7,500 to $9,999 | 13 (1.1%) | 61 (7.7%) |
| $10,000 to $12,499 | 9 (0.8%) | 13 (1.6%) |
| $12,500 to $14,999 | 91 (7.9%) | 64 (8.0%) |
| $15,000 to $17,499 | 45 (3.9%) | 0 (0.0%) |
| $17,500 to $19,999 | 0 (0.0%) | 0 (0.0%) |
| $20,000 to $22,499 | 0 (0.0%) | 63 (7.9%) |
| $22,500 to $24,999 | 22 (1.9%) | 7 (0.9%) |
| $25,000 to $29,999 | 54 (4.7%) | 39 (4.9%) |
| $30,000 to $34,999 | 54 (4.7%) | 51 (6.4%) |
| $35,000 to $39,999 | 57 (5.0%) | 115 (14.4%) |
| $40,000 to $44,999 | 127 (11.1%) | 66 (8.3%) |
| $45,000 to $49,999 | 146 (12.7%) | 53 (6.7%) |
| $50,000 to $54,999 | 22 (1.9%) | 14 (1.8%) |
| $55,000 to $64,999 | 118 (10.3%) | 77 (9.7%) |
| $65,000 to $74,999 | 29 (2.5%) | 17 (2.1%) |
| $75,000 to $99,999 | 214 (18.7%) | 18 (2.3%) |
| $100,000+ | 43 (3.7%) | 0 (0.0%) |
| Total | 1,146 (100.0%) | 796 (100.0%) |
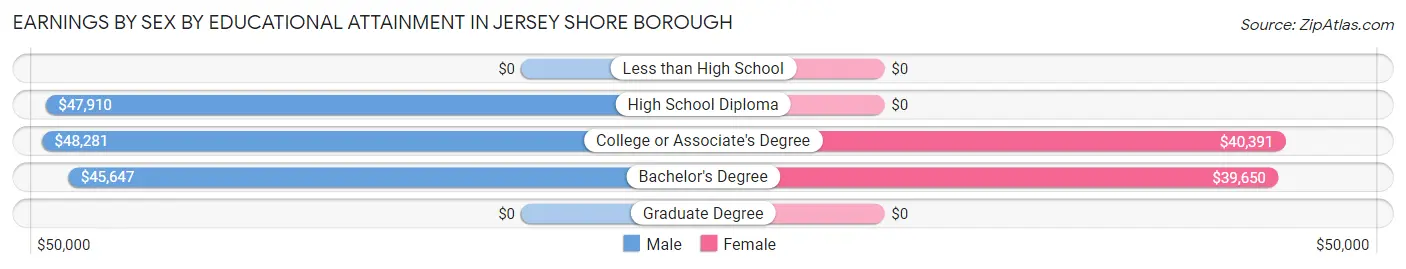
Earnings by Sex by Educational Attainment in Jersey Shore borough
Average earnings in Jersey Shore borough are $46,164 for men and $38,793 for women, a difference of 16.0%. Men with an educational attainment of college or associate's degree enjoy the highest average annual earnings of $48,281, while those with bachelor's degree education earn the least with $45,647. Women with an educational attainment of college or associate's degree earn the most with the average annual earnings of $40,391, while those with bachelor's degree education have the smallest earnings of $39,650.
| Educational Attainment | Male Income | Female Income |
| Less than High School | - | - |
| High School Diploma | $47,910 | $0 |
| College or Associate's Degree | $48,281 | $40,391 |
| Bachelor's Degree | $45,647 | $39,650 |
| Graduate Degree | - | - |
| Total | $46,164 | $38,793 |
Family Income in Jersey Shore borough
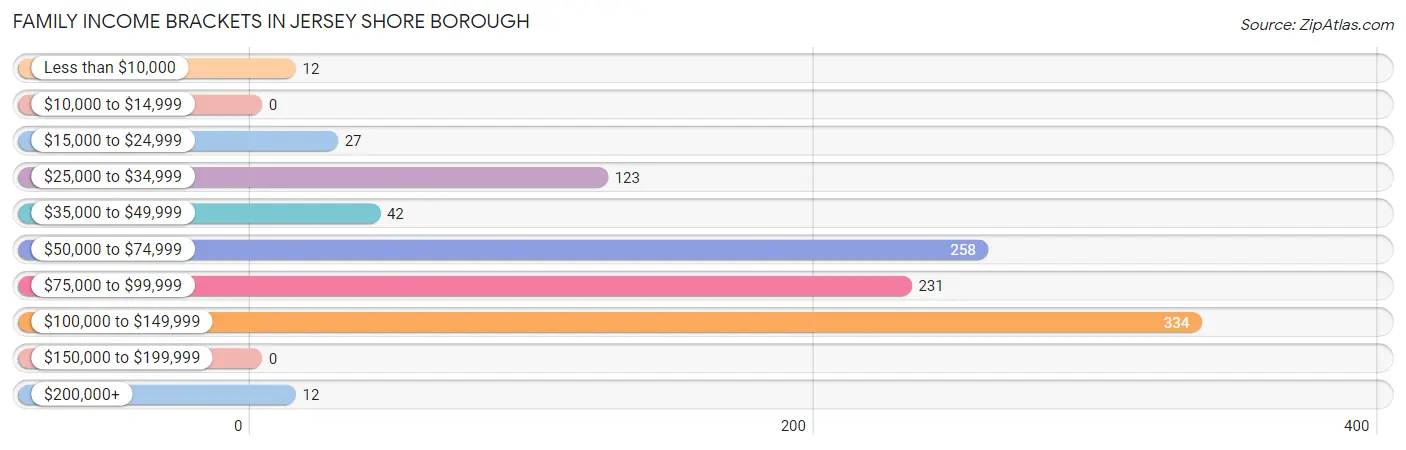
Family Income Brackets in Jersey Shore borough
According to the Jersey Shore borough family income data, there are 334 families falling into the $100,000 to $149,999 income range, which is the most common income bracket and makes up 32.1% of all families.
| Income Bracket | # Families | % Families |
| Less than $10,000 | 12 | 1.2% |
| $10,000 to $14,999 | 0 | 0.0% |
| $15,000 to $24,999 | 27 | 2.6% |
| $25,000 to $34,999 | 123 | 11.8% |
| $35,000 to $49,999 | 42 | 4.0% |
| $50,000 to $74,999 | 258 | 24.8% |
| $75,000 to $99,999 | 231 | 22.2% |
| $100,000 to $149,999 | 334 | 32.1% |
| $150,000 to $199,999 | 0 | 0.0% |
| $200,000+ | 12 | 1.2% |
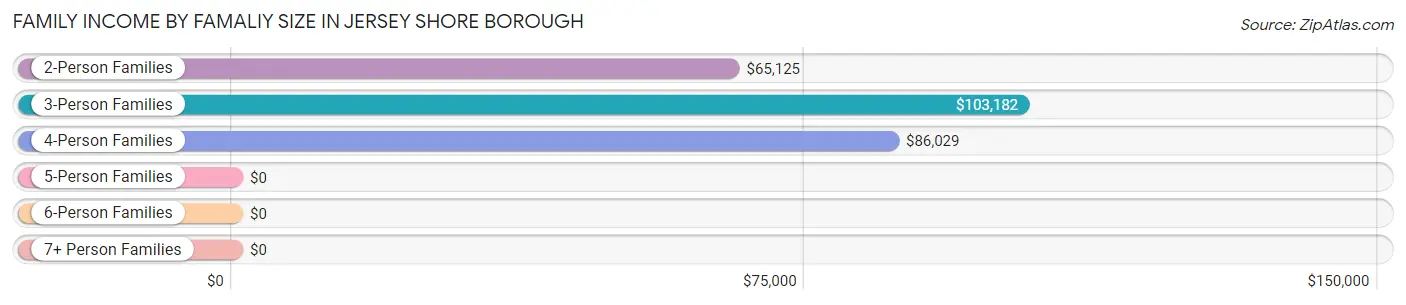
Family Income by Famaliy Size in Jersey Shore borough
3-person families (194 | 18.6%) account for the highest median family income in Jersey Shore borough with $103,182 per family, while 3-person families (194 | 18.6%) have the highest median income of $34,394 per family member.
| Income Bracket | # Families | Median Income |
| 2-Person Families | 377 (36.2%) | $65,125 |
| 3-Person Families | 194 (18.6%) | $103,182 |
| 4-Person Families | 400 (38.4%) | $86,029 |
| 5-Person Families | 70 (6.7%) | $0 |
| 6-Person Families | 0 (0.0%) | $0 |
| 7+ Person Families | 0 (0.0%) | $0 |
| Total | 1,041 (100.0%) | $80,308 |
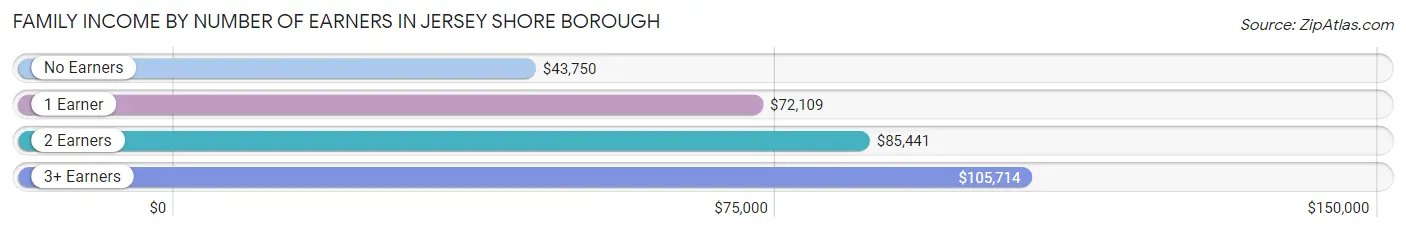
Family Income by Number of Earners in Jersey Shore borough
The median family income in Jersey Shore borough is $80,308, with families comprising 3+ earners (144) having the highest median family income of $105,714, while families with no earners (198) have the lowest median family income of $43,750, accounting for 13.8% and 19.0% of families, respectively.
| Number of Earners | # Families | Median Income |
| No Earners | 198 (19.0%) | $43,750 |
| 1 Earner | 235 (22.6%) | $72,109 |
| 2 Earners | 464 (44.6%) | $85,441 |
| 3+ Earners | 144 (13.8%) | $105,714 |
| Total | 1,041 (100.0%) | $80,308 |
Household Income in Jersey Shore borough
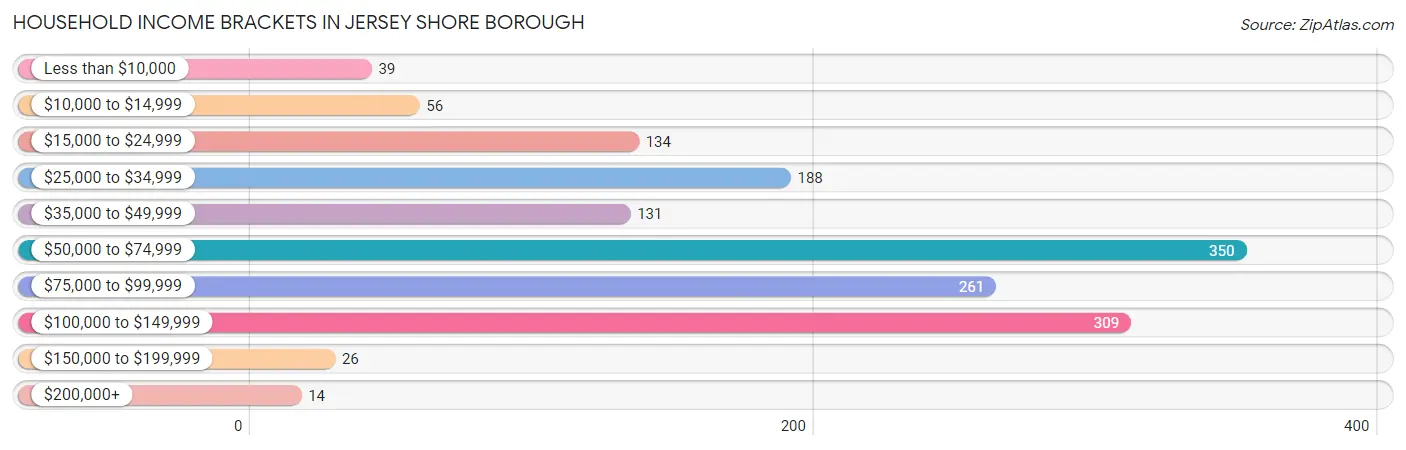
Household Income Brackets in Jersey Shore borough
With 350 households falling in the category, the $50,000 to $74,999 income range is the most frequent in Jersey Shore borough, accounting for 23.3% of all households. In contrast, only 14 households (0.9%) fall into the $200,000+ income bracket, making it the least populous group.
| Income Bracket | # Households | % Households |
| Less than $10,000 | 39 | 2.6% |
| $10,000 to $14,999 | 56 | 3.7% |
| $15,000 to $24,999 | 134 | 8.9% |
| $25,000 to $34,999 | 188 | 12.5% |
| $35,000 to $49,999 | 131 | 8.7% |
| $50,000 to $74,999 | 350 | 23.3% |
| $75,000 to $99,999 | 261 | 17.4% |
| $100,000 to $149,999 | 309 | 20.6% |
| $150,000 to $199,999 | 26 | 1.7% |
| $200,000+ | 14 | 0.9% |
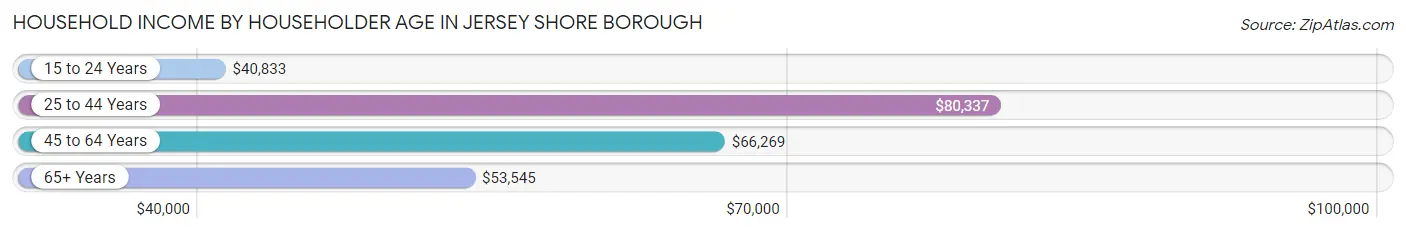
Household Income by Householder Age in Jersey Shore borough
The median household income in Jersey Shore borough is $65,286, with the highest median household income of $80,337 found in the 25 to 44 years age bracket for the primary householder. A total of 532 households (35.4%) fall into this category. Meanwhile, the 15 to 24 years age bracket for the primary householder has the lowest median household income of $40,833, with 68 households (4.5%) in this group.
| Income Bracket | # Households | Median Income |
| 15 to 24 Years | 68 (4.5%) | $40,833 |
| 25 to 44 Years | 532 (35.4%) | $80,337 |
| 45 to 64 Years | 521 (34.7%) | $66,269 |
| 65+ Years | 380 (25.3%) | $53,545 |
| Total | 1,501 (100.0%) | $65,286 |
Poverty in Jersey Shore borough
Income Below Poverty by Sex and Age in Jersey Shore borough
With 2.9% poverty level for males and 5.9% for females among the residents of Jersey Shore borough, 25 to 34 year old males and 25 to 34 year old females are the most vulnerable to poverty, with 25 males (11.5%) and 55 females (31.8%) in their respective age groups living below the poverty level.
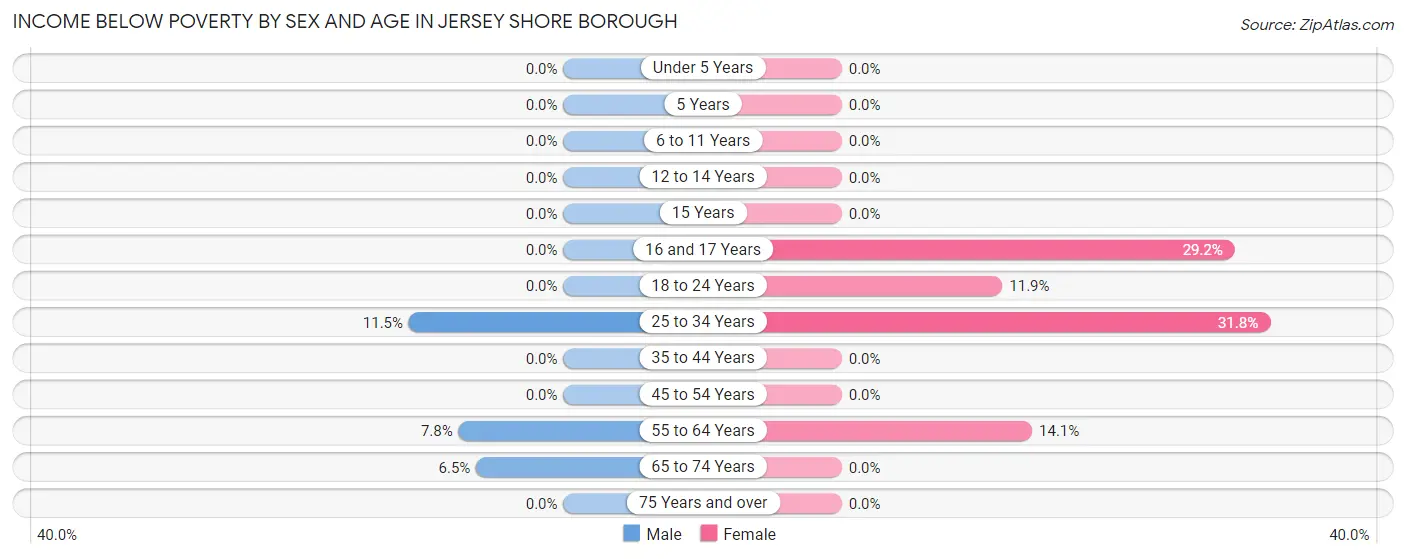
| Age Bracket | Male | Female |
| Under 5 Years | 0 (0.0%) | 0 (0.0%) |
| 5 Years | 0 (0.0%) | 0 (0.0%) |
| 6 to 11 Years | 0 (0.0%) | 0 (0.0%) |
| 12 to 14 Years | 0 (0.0%) | 0 (0.0%) |
| 15 Years | 0 (0.0%) | 0 (0.0%) |
| 16 and 17 Years | 0 (0.0%) | 14 (29.2%) |
| 18 to 24 Years | 0 (0.0%) | 23 (11.9%) |
| 25 to 34 Years | 25 (11.5%) | 55 (31.8%) |
| 35 to 44 Years | 0 (0.0%) | 0 (0.0%) |
| 45 to 54 Years | 0 (0.0%) | 0 (0.0%) |
| 55 to 64 Years | 26 (7.8%) | 13 (14.1%) |
| 65 to 74 Years | 13 (6.5%) | 0 (0.0%) |
| 75 Years and over | 0 (0.0%) | 0 (0.0%) |
| Total | 64 (2.9%) | 105 (5.9%) |
Income Above Poverty by Sex and Age in Jersey Shore borough
According to the poverty statistics in Jersey Shore borough, males aged under 5 years and females aged under 5 years are the age groups that are most secure financially, with 100.0% of males and 100.0% of females in these age groups living above the poverty line.
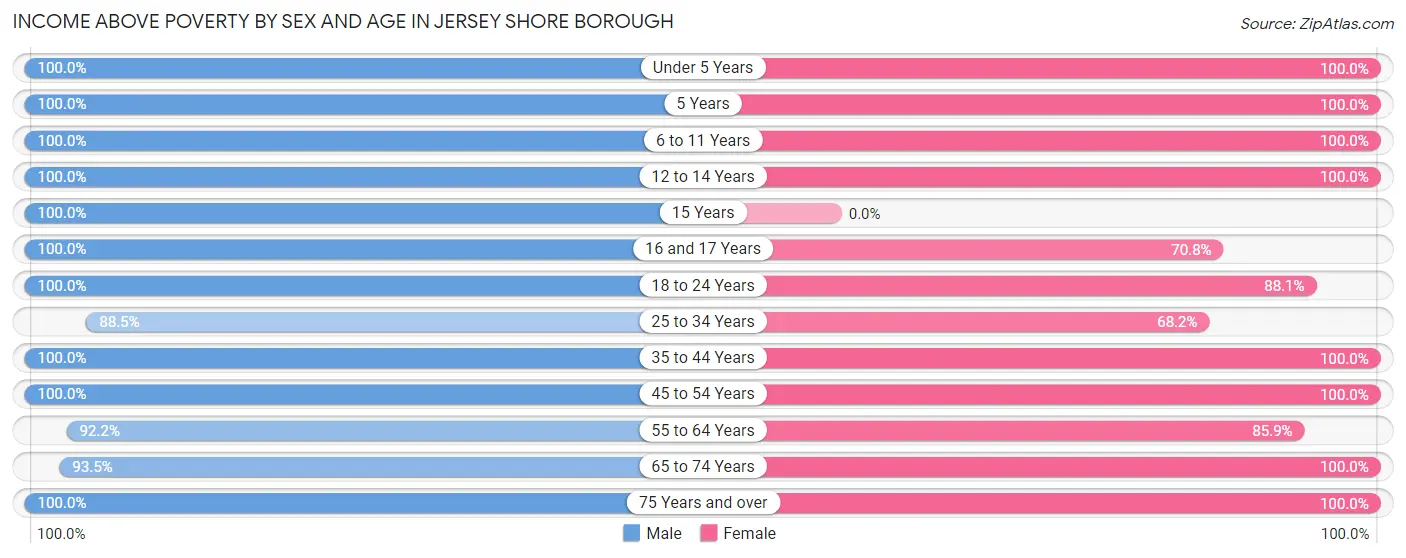
| Age Bracket | Male | Female |
| Under 5 Years | 99 (100.0%) | 134 (100.0%) |
| 5 Years | 69 (100.0%) | 17 (100.0%) |
| 6 to 11 Years | 251 (100.0%) | 161 (100.0%) |
| 12 to 14 Years | 169 (100.0%) | 169 (100.0%) |
| 15 Years | 11 (100.0%) | 0 (0.0%) |
| 16 and 17 Years | 13 (100.0%) | 34 (70.8%) |
| 18 to 24 Years | 144 (100.0%) | 170 (88.1%) |
| 25 to 34 Years | 193 (88.5%) | 118 (68.2%) |
| 35 to 44 Years | 359 (100.0%) | 308 (100.0%) |
| 45 to 54 Years | 239 (100.0%) | 192 (100.0%) |
| 55 to 64 Years | 308 (92.2%) | 79 (85.9%) |
| 65 to 74 Years | 188 (93.5%) | 116 (100.0%) |
| 75 Years and over | 106 (100.0%) | 179 (100.0%) |
| Total | 2,149 (97.1%) | 1,677 (94.1%) |
Income Below Poverty Among Married-Couple Families in Jersey Shore borough
The poverty statistics for married-couple families in Jersey Shore borough show that 1.6% or 13 of the total 806 families live below the poverty line. Families with 1 or 2 children have the highest poverty rate of 3.2%, comprising of 13 families. On the other hand, families with no children have the lowest poverty rate of 0.0%, which includes 0 families.
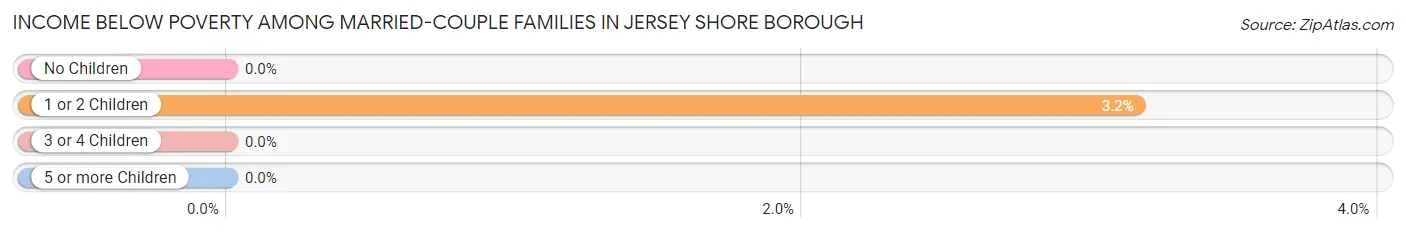
| Children | Above Poverty | Below Poverty |
| No Children | 342 (100.0%) | 0 (0.0%) |
| 1 or 2 Children | 399 (96.8%) | 13 (3.2%) |
| 3 or 4 Children | 52 (100.0%) | 0 (0.0%) |
| 5 or more Children | 0 (0.0%) | 0 (0.0%) |
| Total | 793 (98.4%) | 13 (1.6%) |
Income Below Poverty Among Single-Parent Households in Jersey Shore borough
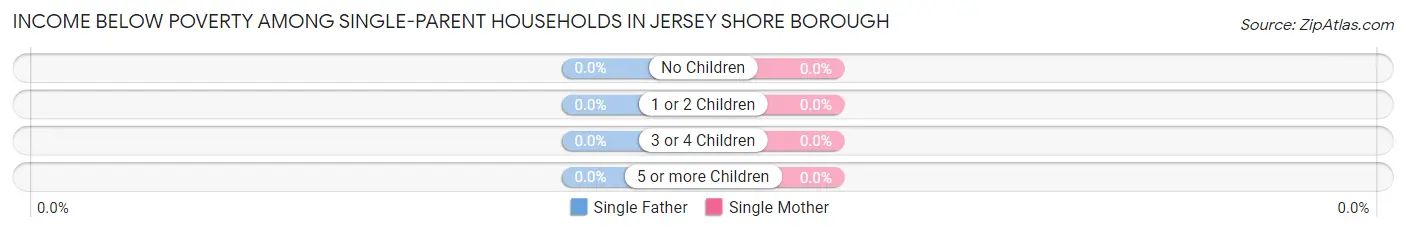
| Children | Single Father | Single Mother |
| No Children | 0 (0.0%) | 0 (0.0%) |
| 1 or 2 Children | 0 (0.0%) | 0 (0.0%) |
| 3 or 4 Children | 0 (0.0%) | 0 (0.0%) |
| 5 or more Children | 0 (0.0%) | 0 (0.0%) |
| Total | 0 (0.0%) | 0 (0.0%) |
Income Below Poverty Among Married-Couple vs Single-Parent Households in Jersey Shore borough
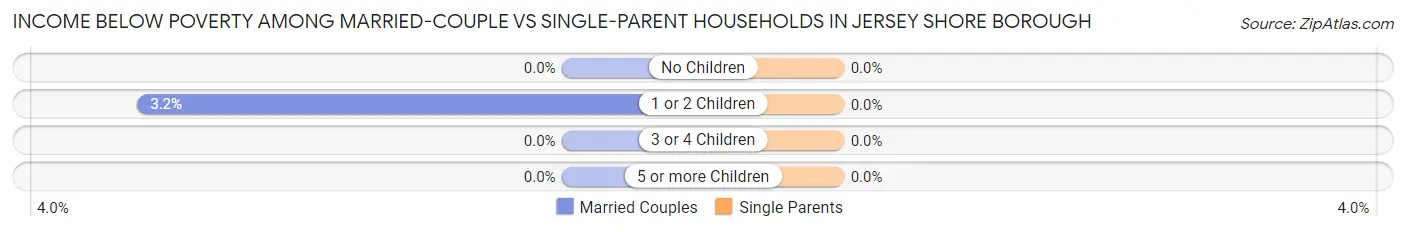
| Children | Married-Couple Families | Single-Parent Households |
| No Children | 0 (0.0%) | 0 (0.0%) |
| 1 or 2 Children | 13 (3.2%) | 0 (0.0%) |
| 3 or 4 Children | 0 (0.0%) | 0 (0.0%) |
| 5 or more Children | 0 (0.0%) | 0 (0.0%) |
| Total | 13 (1.6%) | 0 (0.0%) |
Race in Jersey Shore borough
The most populous races in Jersey Shore borough are White / Caucasian (4,124 | 99.1%), Hispanic or Latino (20 | 0.5%), and Native / Alaskan (20 | 0.5%).
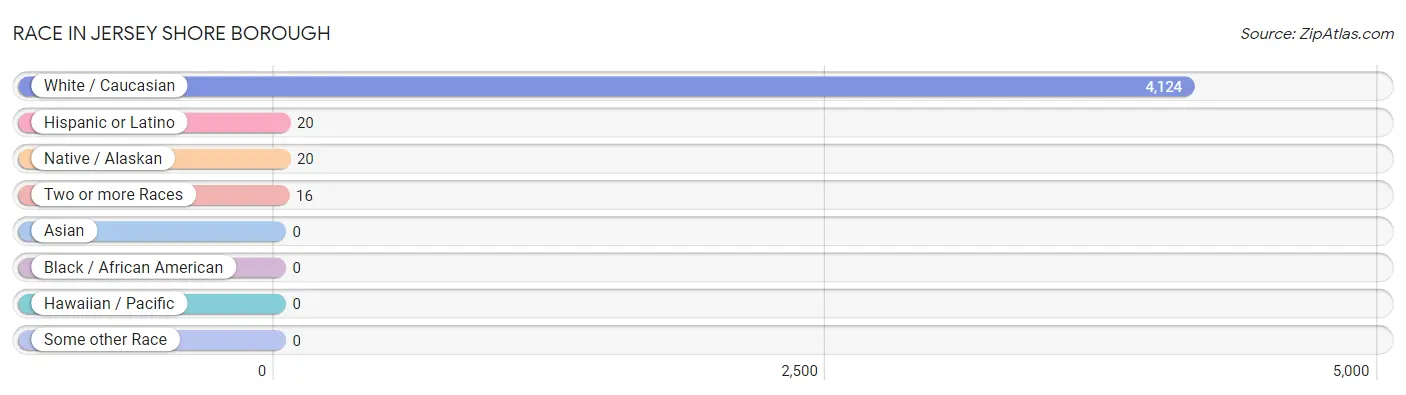
| Race | # Population | % Population |
| Asian | 0 | 0.0% |
| Black / African American | 0 | 0.0% |
| Hawaiian / Pacific | 0 | 0.0% |
| Hispanic or Latino | 20 | 0.5% |
| Native / Alaskan | 20 | 0.5% |
| White / Caucasian | 4,124 | 99.1% |
| Two or more Races | 16 | 0.4% |
| Some other Race | 0 | 0.0% |
| Total | 4,160 | 100.0% |
Ancestry in Jersey Shore borough
The most populous ancestries reported in Jersey Shore borough are German (1,177 | 28.3%), Irish (391 | 9.4%), American (224 | 5.4%), Italian (221 | 5.3%), and English (193 | 4.6%), together accounting for 53.0% of all Jersey Shore borough residents.
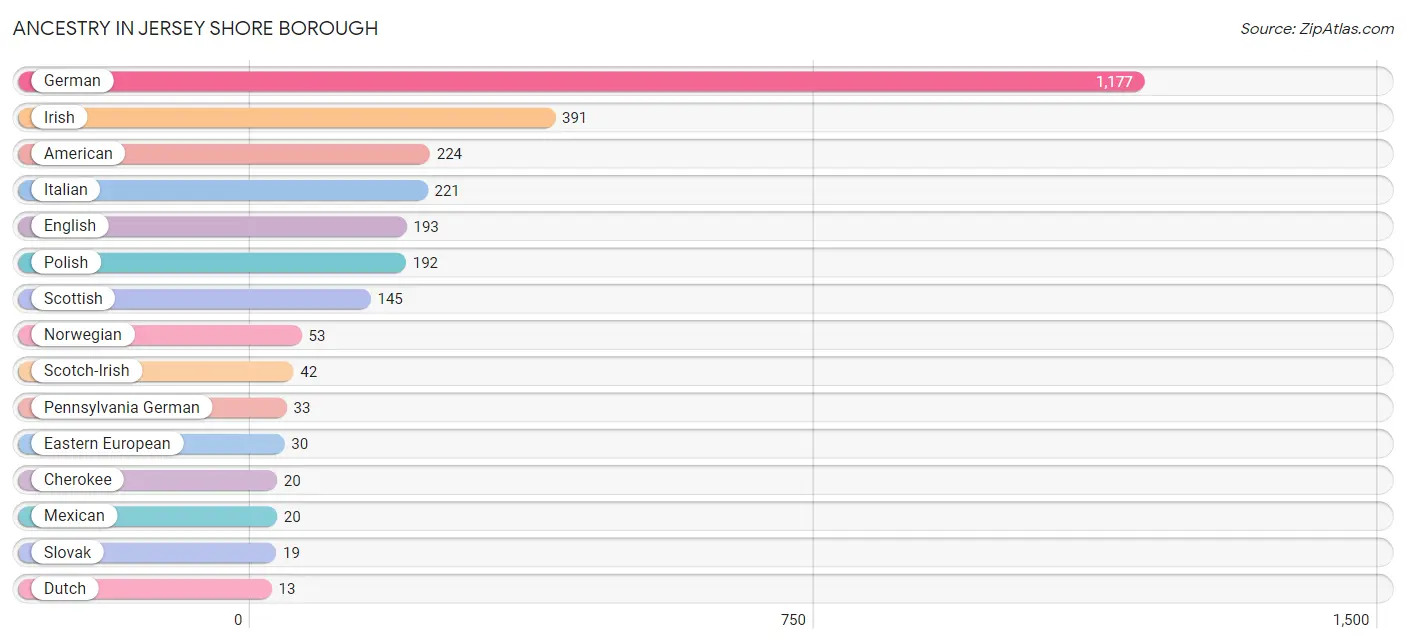
| Ancestry | # Population | % Population |
| American | 224 | 5.4% |
| Cherokee | 20 | 0.5% |
| Dutch | 13 | 0.3% |
| Eastern European | 30 | 0.7% |
| English | 193 | 4.6% |
| French | 7 | 0.2% |
| German | 1,177 | 28.3% |
| Irish | 391 | 9.4% |
| Italian | 221 | 5.3% |
| Mexican | 20 | 0.5% |
| Northern European | 13 | 0.3% |
| Norwegian | 53 | 1.3% |
| Pennsylvania German | 33 | 0.8% |
| Polish | 192 | 4.6% |
| Scotch-Irish | 42 | 1.0% |
| Scottish | 145 | 3.5% |
| Slovak | 19 | 0.5% |
| Swedish | 12 | 0.3% | View All 18 Rows |
Immigrants in Jersey Shore borough
The most numerous immigrant groups reported in Jersey Shore borough came from Europe (12 | 0.3%), Northern Europe (12 | 0.3%), and Sweden (12 | 0.3%), together accounting for 0.9% of all Jersey Shore borough residents.
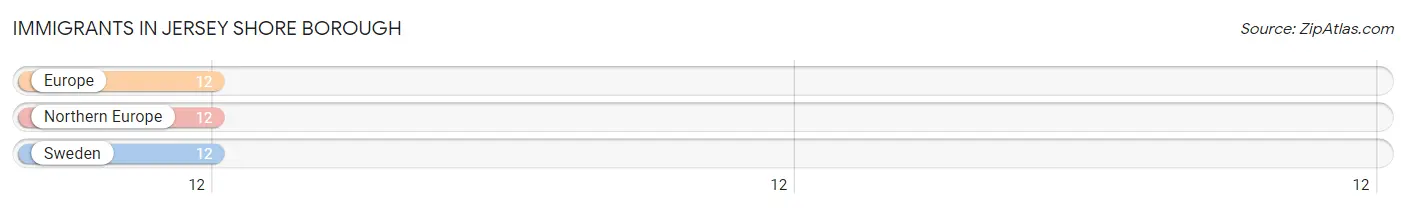
| Immigration Origin | # Population | % Population |
| Europe | 12 | 0.3% |
| Northern Europe | 12 | 0.3% |
| Sweden | 12 | 0.3% | View All 3 Rows |
Sex and Age in Jersey Shore borough
Sex and Age in Jersey Shore borough
The most populous age groups in Jersey Shore borough are 10 to 14 Years (292 | 12.9%) for men and 10 to 14 Years (224 | 11.8%) for women.
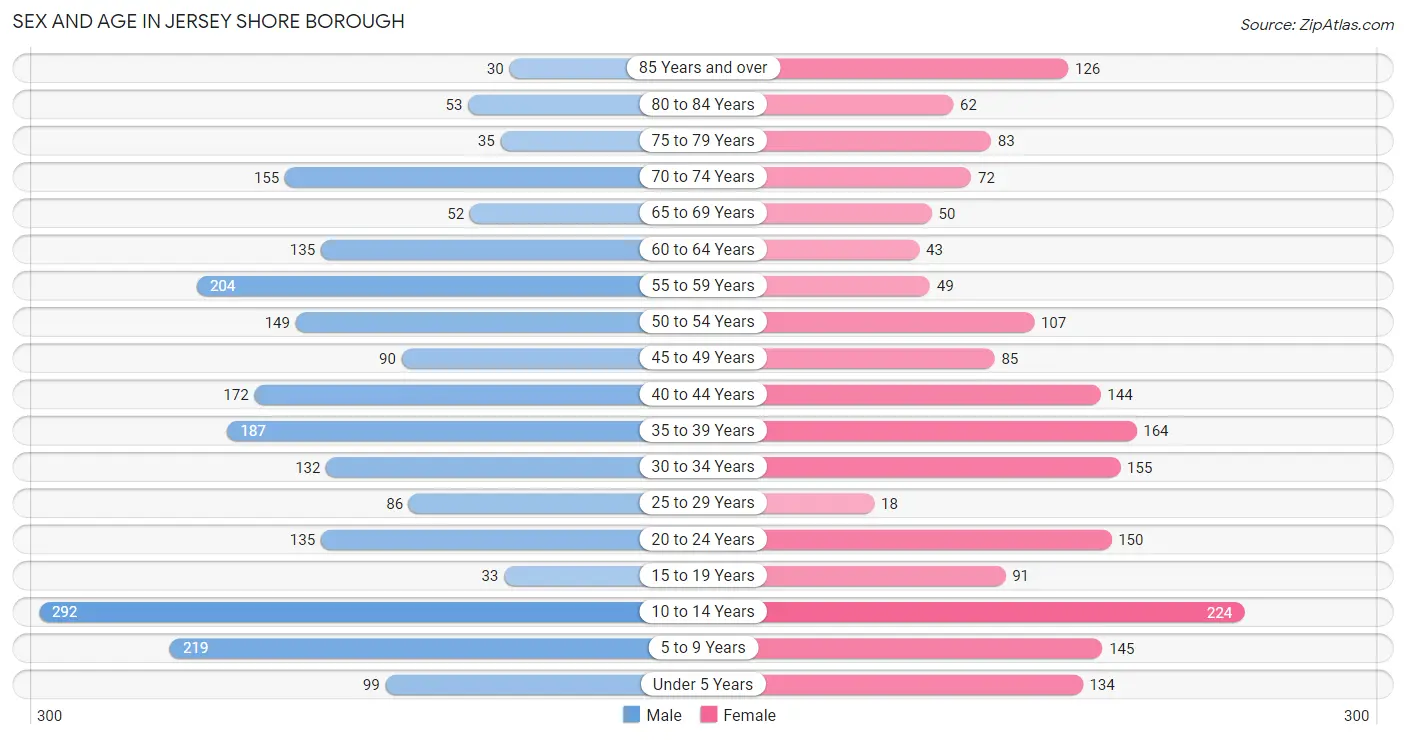
| Age Bracket | Male | Female |
| Under 5 Years | 99 (4.4%) | 134 (7.0%) |
| 5 to 9 Years | 219 (9.7%) | 145 (7.6%) |
| 10 to 14 Years | 292 (12.9%) | 224 (11.8%) |
| 15 to 19 Years | 33 (1.5%) | 91 (4.8%) |
| 20 to 24 Years | 135 (6.0%) | 150 (7.9%) |
| 25 to 29 Years | 86 (3.8%) | 18 (0.9%) |
| 30 to 34 Years | 132 (5.9%) | 155 (8.2%) |
| 35 to 39 Years | 187 (8.3%) | 164 (8.6%) |
| 40 to 44 Years | 172 (7.6%) | 144 (7.6%) |
| 45 to 49 Years | 90 (4.0%) | 85 (4.5%) |
| 50 to 54 Years | 149 (6.6%) | 107 (5.6%) |
| 55 to 59 Years | 204 (9.0%) | 49 (2.6%) |
| 60 to 64 Years | 135 (6.0%) | 43 (2.3%) |
| 65 to 69 Years | 52 (2.3%) | 50 (2.6%) |
| 70 to 74 Years | 155 (6.9%) | 72 (3.8%) |
| 75 to 79 Years | 35 (1.5%) | 83 (4.4%) |
| 80 to 84 Years | 53 (2.4%) | 62 (3.3%) |
| 85 Years and over | 30 (1.3%) | 126 (6.6%) |
| Total | 2,258 (100.0%) | 1,902 (100.0%) |
Families and Households in Jersey Shore borough
Median Family Size in Jersey Shore borough
The median family size in Jersey Shore borough is 3.27 persons per family, with married-couple families (806 | 77.4%) accounting for the largest median family size of 3.5 persons per family. On the other hand, single female/mother families (89 | 8.6%) represent the smallest median family size with 2.15 persons per family.
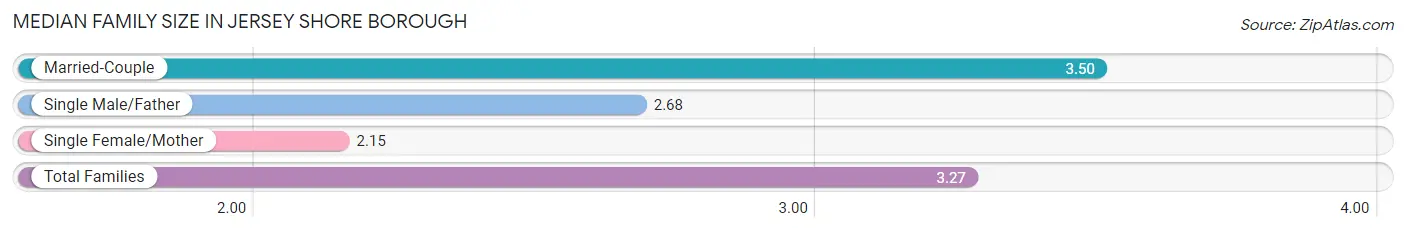
| Family Type | # Families | Family Size |
| Married-Couple | 806 (77.4%) | 3.50 |
| Single Male/Father | 146 (14.0%) | 2.68 |
| Single Female/Mother | 89 (8.6%) | 2.15 |
| Total Families | 1,041 (100.0%) | 3.27 |
Median Household Size in Jersey Shore borough
The median household size in Jersey Shore borough is 2.69 persons per household, with married-couple households (806 | 53.7%) accounting for the largest median household size of 3.53 persons per household. non-family households (460 | 30.6%) represent the smallest median household size with 1.10 persons per household.
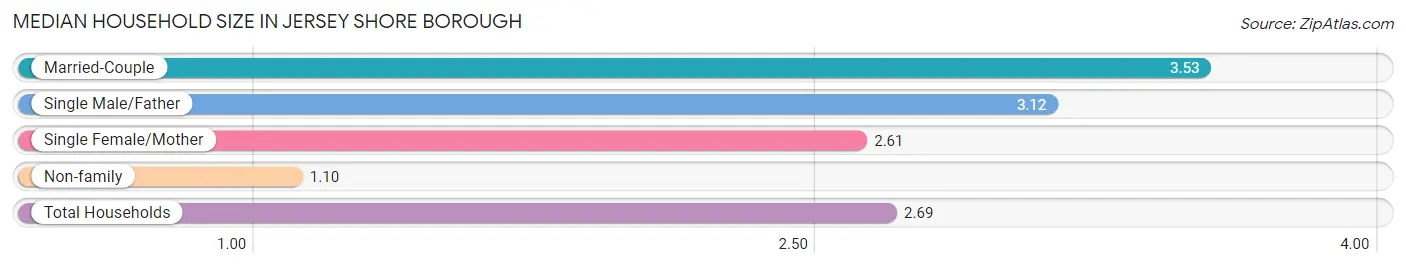
| Household Type | # Households | Household Size |
| Married-Couple | 806 (53.7%) | 3.53 |
| Single Male/Father | 146 (9.7%) | 3.12 |
| Single Female/Mother | 89 (5.9%) | 2.61 |
| Non-family | 460 (30.6%) | 1.10 |
| Total Households | 1,501 (100.0%) | 2.69 |
Household Size by Marriage Status in Jersey Shore borough
Out of a total of 1,501 households in Jersey Shore borough, 1,041 (69.4%) are family households, while 460 (30.6%) are nonfamily households. The most numerous type of family households are 4-person households, comprising 403, and the most common type of nonfamily households are 1-person households, comprising 419.
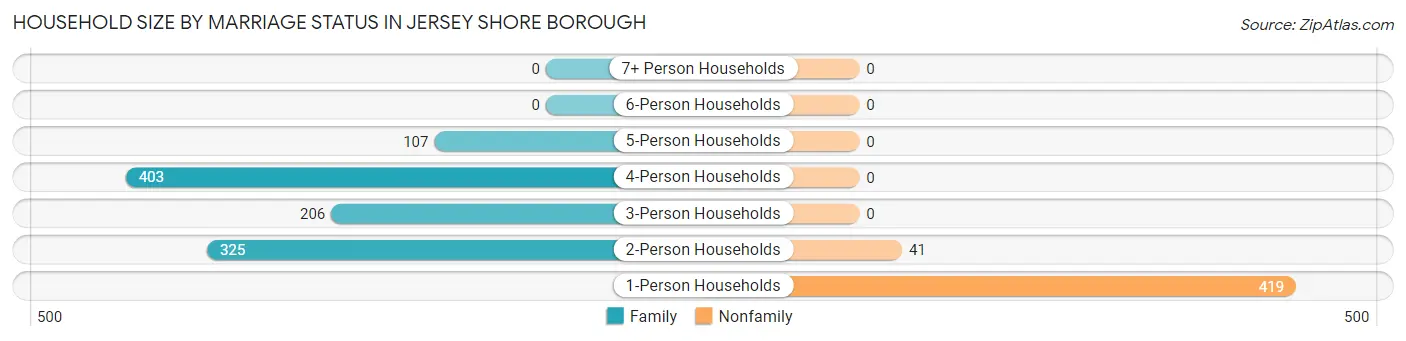
| Household Size | Family Households | Nonfamily Households |
| 1-Person Households | - | 419 (27.9%) |
| 2-Person Households | 325 (21.6%) | 41 (2.7%) |
| 3-Person Households | 206 (13.7%) | 0 (0.0%) |
| 4-Person Households | 403 (26.9%) | 0 (0.0%) |
| 5-Person Households | 107 (7.1%) | 0 (0.0%) |
| 6-Person Households | 0 (0.0%) | 0 (0.0%) |
| 7+ Person Households | 0 (0.0%) | 0 (0.0%) |
| Total | 1,041 (69.4%) | 460 (30.6%) |
Female Fertility in Jersey Shore borough
Fertility by Age in Jersey Shore borough
| Age Bracket | Women with Births | Births / 1,000 Women |
| 15 to 19 years | 0 (0.0%) | 0.0 |
| 20 to 34 years | 0 (0.0%) | 0.0 |
| 35 to 50 years | 0 (0.0%) | 0.0 |
| Total | 0 (0.0%) | 0.0 |
Fertility by Age by Marriage Status in Jersey Shore borough
| Age Bracket | Married | Unmarried |
| 15 to 19 years | 0 (0.0%) | 0 (0.0%) |
| 20 to 34 years | 0 (0.0%) | 0 (0.0%) |
| 35 to 50 years | 0 (0.0%) | 0 (0.0%) |
| Total | 0 (0.0%) | 0 (0.0%) |
Fertility by Education in Jersey Shore borough
| Educational Attainment | Women with Births | Births / 1,000 Women |
| Less than High School | 0 (0.0%) | 0.0 |
| High School Diploma | 0 (0.0%) | 0.0 |
| College or Associate's Degree | 0 (0.0%) | 0.0 |
| Bachelor's Degree | 0 (0.0%) | 0.0 |
| Graduate Degree | 0 (0.0%) | 0.0 |
| Total | 0 (0.0%) | 0.0 |
Fertility by Education by Marriage Status in Jersey Shore borough
| Educational Attainment | Married | Unmarried |
| Less than High School | 0 (0.0%) | 0 (0.0%) |
| High School Diploma | 0 (0.0%) | 0 (0.0%) |
| College or Associate's Degree | 0 (0.0%) | 0 (0.0%) |
| Bachelor's Degree | 0 (0.0%) | 0 (0.0%) |
| Graduate Degree | 0 (0.0%) | 0 (0.0%) |
| Total | 0 (0.0%) | 0 (0.0%) |
Employment Characteristics in Jersey Shore borough
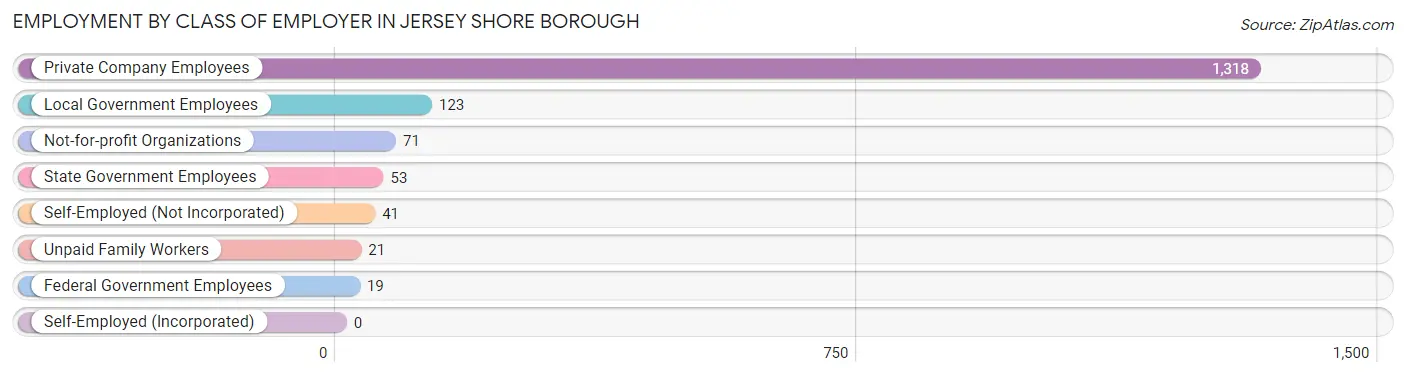
Employment by Class of Employer in Jersey Shore borough
Among the 1,646 employed individuals in Jersey Shore borough, private company employees (1,318 | 80.1%), local government employees (123 | 7.5%), and not-for-profit organizations (71 | 4.3%) make up the most common classes of employment.
| Employer Class | # Employees | % Employees |
| Private Company Employees | 1,318 | 80.1% |
| Self-Employed (Incorporated) | 0 | 0.0% |
| Self-Employed (Not Incorporated) | 41 | 2.5% |
| Not-for-profit Organizations | 71 | 4.3% |
| Local Government Employees | 123 | 7.5% |
| State Government Employees | 53 | 3.2% |
| Federal Government Employees | 19 | 1.1% |
| Unpaid Family Workers | 21 | 1.3% |
| Total | 1,646 | 100.0% |
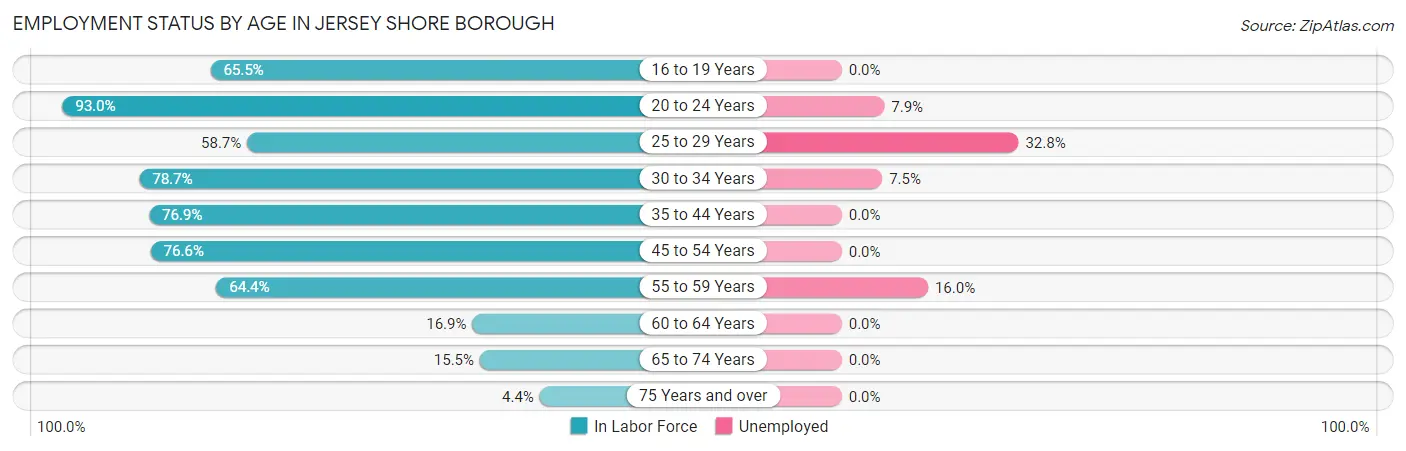
Employment Status by Age in Jersey Shore borough
According to the labor force statistics for Jersey Shore borough, out of the total population over 16 years of age (3,036), 57.0% or 1,731 individuals are in the labor force, with 4.9% or 85 of them unemployed. The age group with the highest labor force participation rate is 20 to 24 years, with 93.0% or 265 individuals in the labor force. Within the labor force, the 25 to 29 years age range has the highest percentage of unemployed individuals, with 32.8% or 20 of them being unemployed.
| Age Bracket | In Labor Force | Unemployed |
| 16 to 19 Years | 74 (65.5%) | 0 (0.0%) |
| 20 to 24 Years | 265 (93.0%) | 21 (7.9%) |
| 25 to 29 Years | 61 (58.7%) | 20 (32.8%) |
| 30 to 34 Years | 226 (78.7%) | 17 (7.5%) |
| 35 to 44 Years | 513 (76.9%) | 0 (0.0%) |
| 45 to 54 Years | 330 (76.6%) | 0 (0.0%) |
| 55 to 59 Years | 163 (64.4%) | 26 (16.0%) |
| 60 to 64 Years | 30 (16.9%) | 0 (0.0%) |
| 65 to 74 Years | 51 (15.5%) | 0 (0.0%) |
| 75 Years and over | 17 (4.4%) | 0 (0.0%) |
| Total | 1,731 (57.0%) | 85 (4.9%) |
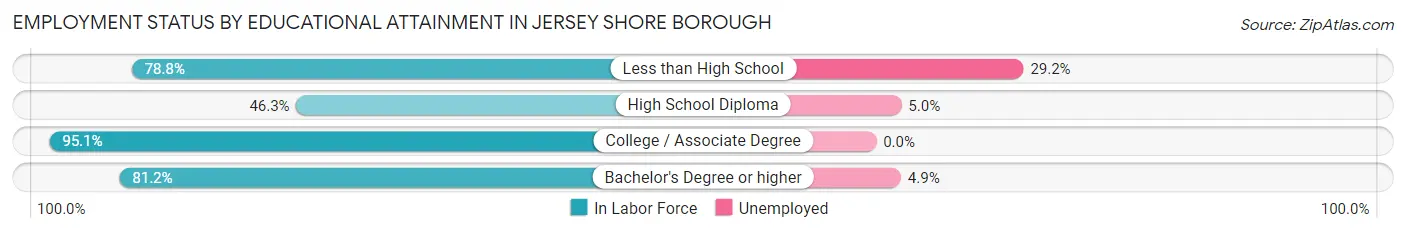
Employment Status by Educational Attainment in Jersey Shore borough
According to labor force statistics for Jersey Shore borough, 68.9% of individuals (1,323) out of the total population between 25 and 64 years of age (1,920) are in the labor force, with 4.8% or 64 of them being unemployed. The group with the highest labor force participation rate are those with the educational attainment of college / associate degree, with 95.1% or 484 individuals in the labor force. Within the labor force, individuals with less than high school education have the highest percentage of unemployment, with 29.2% or 26 of them being unemployed.
| Educational Attainment | In Labor Force | Unemployed |
| Less than High School | 89 (78.8%) | 33 (29.2%) |
| High School Diploma | 404 (46.3%) | 44 (5.0%) |
| College / Associate Degree | 484 (95.1%) | 0 (0.0%) |
| Bachelor's Degree or higher | 346 (81.2%) | 21 (4.9%) |
| Total | 1,323 (68.9%) | 92 (4.8%) |
Employment Occupations by Sex in Jersey Shore borough
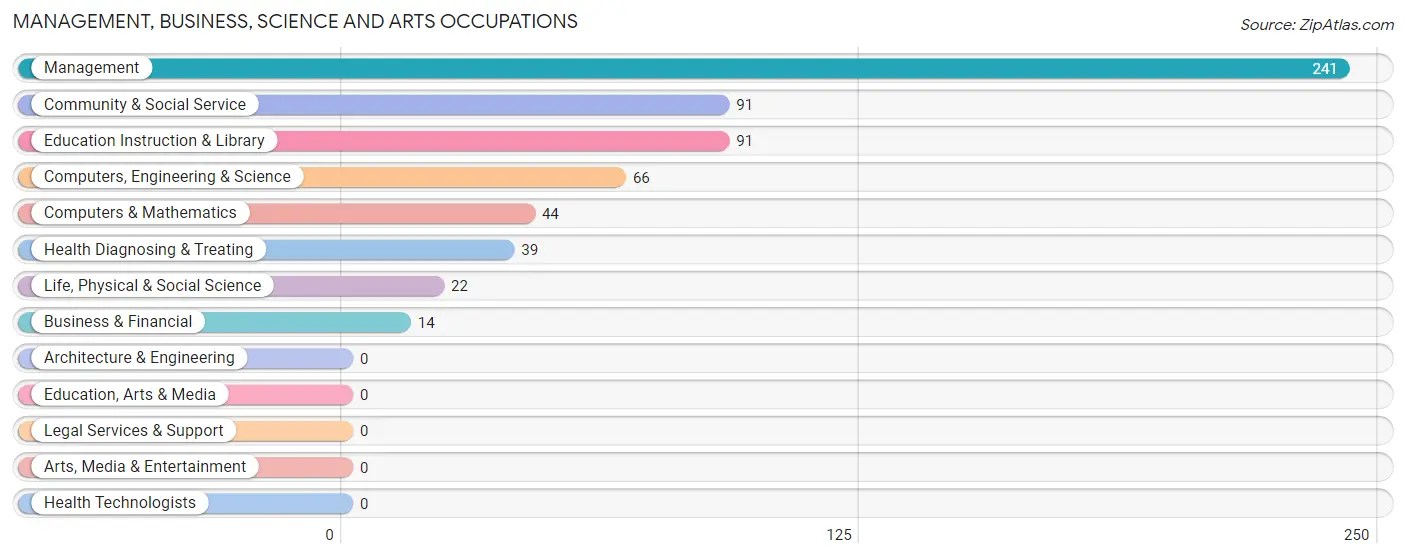
Management, Business, Science and Arts Occupations
The most common Management, Business, Science and Arts occupations in Jersey Shore borough are Management (241 | 14.6%), Community & Social Service (91 | 5.5%), Education Instruction & Library (91 | 5.5%), Computers, Engineering & Science (66 | 4.0%), and Computers & Mathematics (44 | 2.7%).
Management, Business, Science and Arts Occupations by Sex
Within the Management, Business, Science and Arts occupations in Jersey Shore borough, the most male-oriented occupations are Computers, Engineering & Science (100.0%), Computers & Mathematics (100.0%), and Life, Physical & Social Science (100.0%), while the most female-oriented occupations are Business & Financial (100.0%), Community & Social Service (100.0%), and Education Instruction & Library (100.0%).
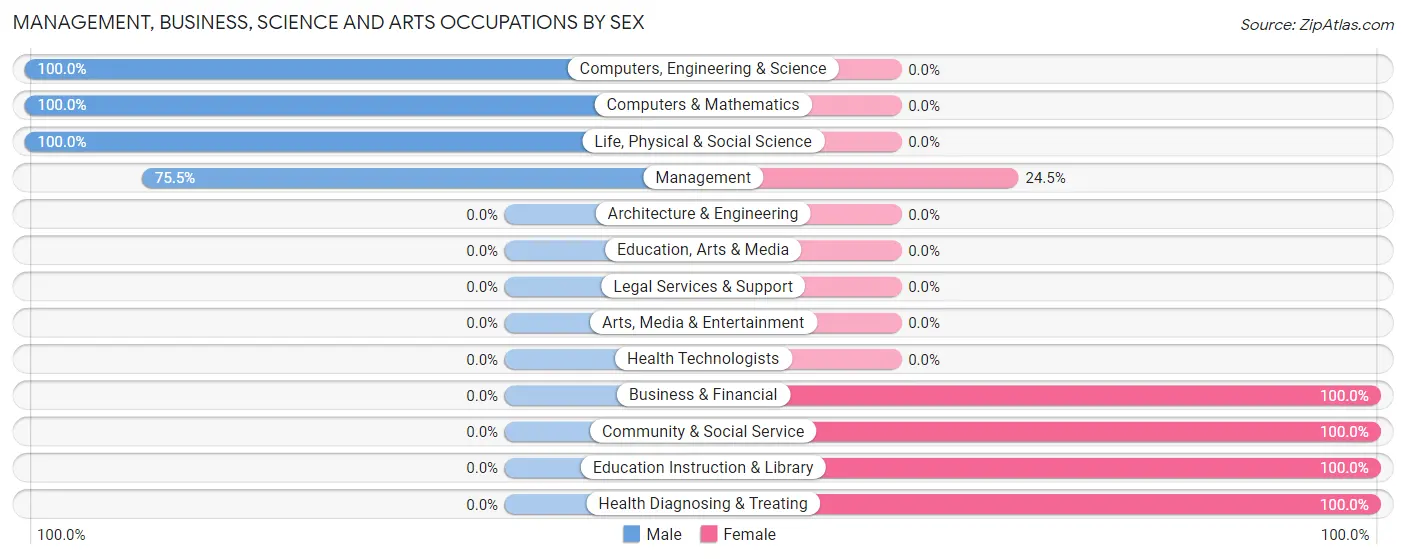
| Occupation | Male | Female |
| Management | 182 (75.5%) | 59 (24.5%) |
| Business & Financial | 0 (0.0%) | 14 (100.0%) |
| Computers, Engineering & Science | 66 (100.0%) | 0 (0.0%) |
| Computers & Mathematics | 44 (100.0%) | 0 (0.0%) |
| Architecture & Engineering | 0 (0.0%) | 0 (0.0%) |
| Life, Physical & Social Science | 22 (100.0%) | 0 (0.0%) |
| Community & Social Service | 0 (0.0%) | 91 (100.0%) |
| Education, Arts & Media | 0 (0.0%) | 0 (0.0%) |
| Legal Services & Support | 0 (0.0%) | 0 (0.0%) |
| Education Instruction & Library | 0 (0.0%) | 91 (100.0%) |
| Arts, Media & Entertainment | 0 (0.0%) | 0 (0.0%) |
| Health Diagnosing & Treating | 0 (0.0%) | 39 (100.0%) |
| Health Technologists | 0 (0.0%) | 0 (0.0%) |
| Total (Category) | 248 (55.0%) | 203 (45.0%) |
| Total (Overall) | 937 (56.9%) | 709 (43.1%) |
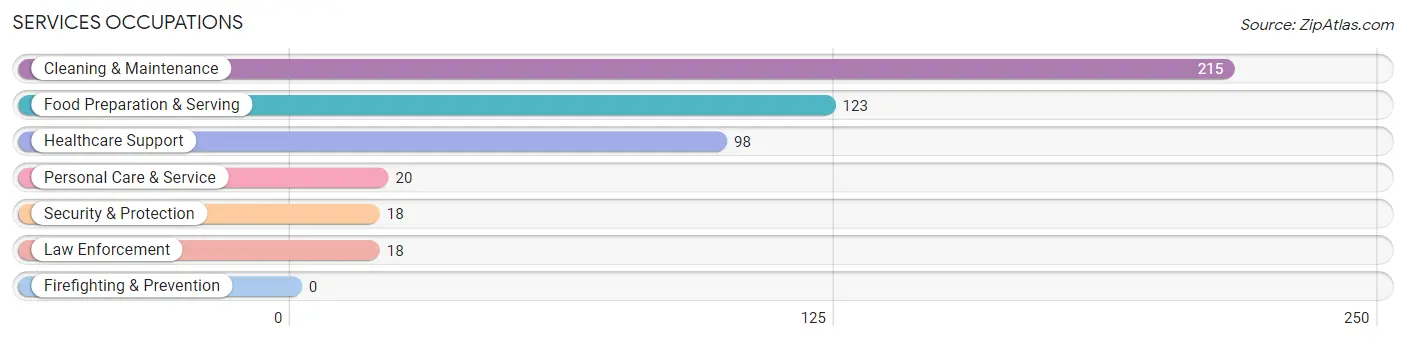
Services Occupations
The most common Services occupations in Jersey Shore borough are Cleaning & Maintenance (215 | 13.1%), Food Preparation & Serving (123 | 7.5%), Healthcare Support (98 | 5.9%), Personal Care & Service (20 | 1.2%), and Security & Protection (18 | 1.1%).
Services Occupations by Sex
Within the Services occupations in Jersey Shore borough, the most male-oriented occupations are Security & Protection (100.0%), Law Enforcement (100.0%), and Cleaning & Maintenance (78.1%), while the most female-oriented occupations are Healthcare Support (100.0%), Personal Care & Service (100.0%), and Food Preparation & Serving (82.1%).
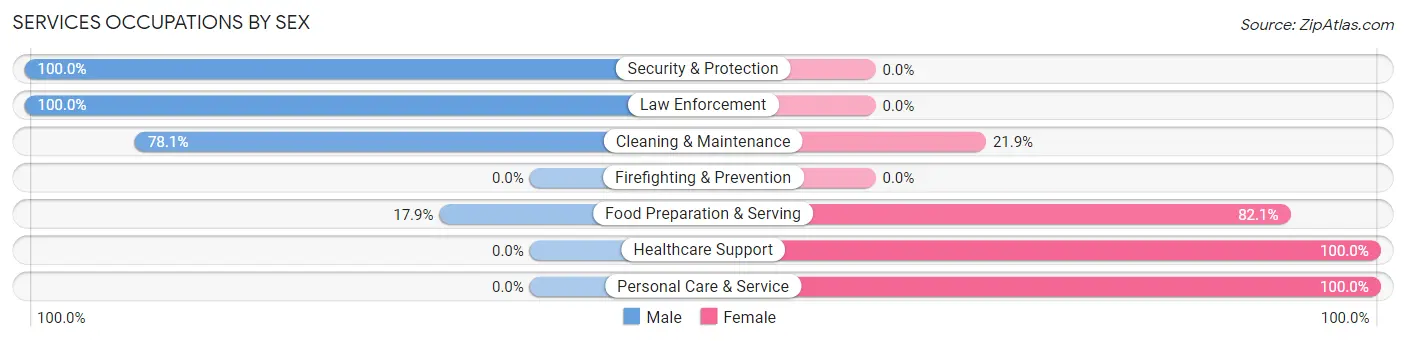
| Occupation | Male | Female |
| Healthcare Support | 0 (0.0%) | 98 (100.0%) |
| Security & Protection | 18 (100.0%) | 0 (0.0%) |
| Firefighting & Prevention | 0 (0.0%) | 0 (0.0%) |
| Law Enforcement | 18 (100.0%) | 0 (0.0%) |
| Food Preparation & Serving | 22 (17.9%) | 101 (82.1%) |
| Cleaning & Maintenance | 168 (78.1%) | 47 (21.9%) |
| Personal Care & Service | 0 (0.0%) | 20 (100.0%) |
| Total (Category) | 208 (43.9%) | 266 (56.1%) |
| Total (Overall) | 937 (56.9%) | 709 (43.1%) |
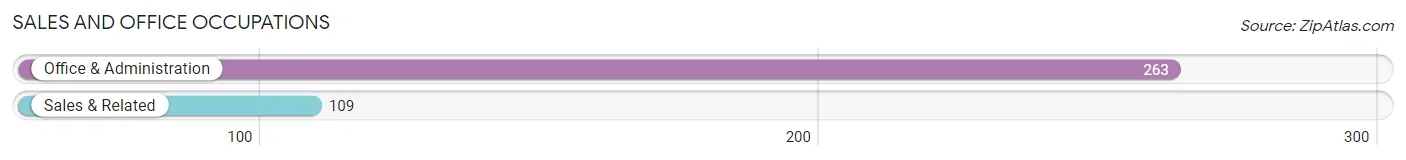
Sales and Office Occupations
The most common Sales and Office occupations in Jersey Shore borough are Office & Administration (263 | 16.0%), and Sales & Related (109 | 6.6%).
Sales and Office Occupations by Sex
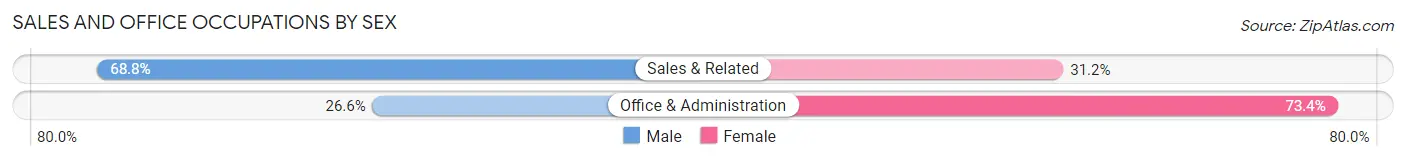
| Occupation | Male | Female |
| Sales & Related | 75 (68.8%) | 34 (31.2%) |
| Office & Administration | 70 (26.6%) | 193 (73.4%) |
| Total (Category) | 145 (39.0%) | 227 (61.0%) |
| Total (Overall) | 937 (56.9%) | 709 (43.1%) |
Natural Resources, Construction and Maintenance Occupations
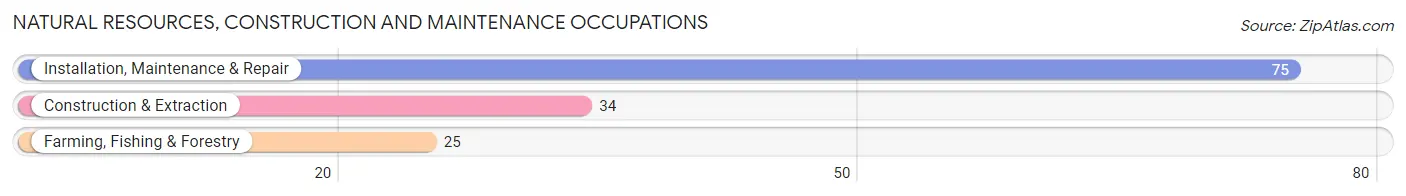
The most common Natural Resources, Construction and Maintenance occupations in Jersey Shore borough are Installation, Maintenance & Repair (75 | 4.6%), Construction & Extraction (34 | 2.1%), and Farming, Fishing & Forestry (25 | 1.5%).
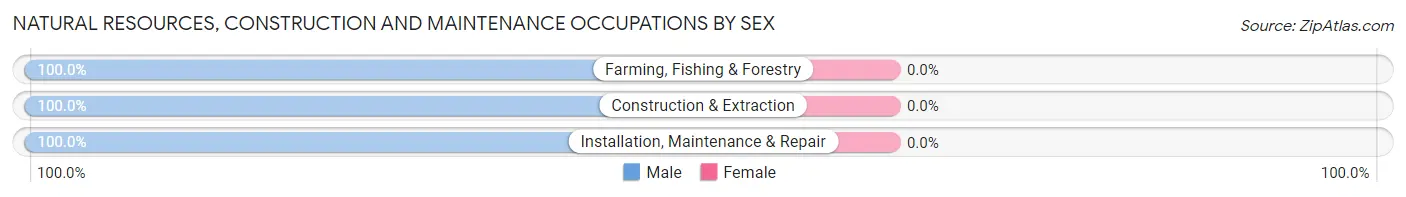
Natural Resources, Construction and Maintenance Occupations by Sex
| Occupation | Male | Female |
| Farming, Fishing & Forestry | 25 (100.0%) | 0 (0.0%) |
| Construction & Extraction | 34 (100.0%) | 0 (0.0%) |
| Installation, Maintenance & Repair | 75 (100.0%) | 0 (0.0%) |
| Total (Category) | 134 (100.0%) | 0 (0.0%) |
| Total (Overall) | 937 (56.9%) | 709 (43.1%) |
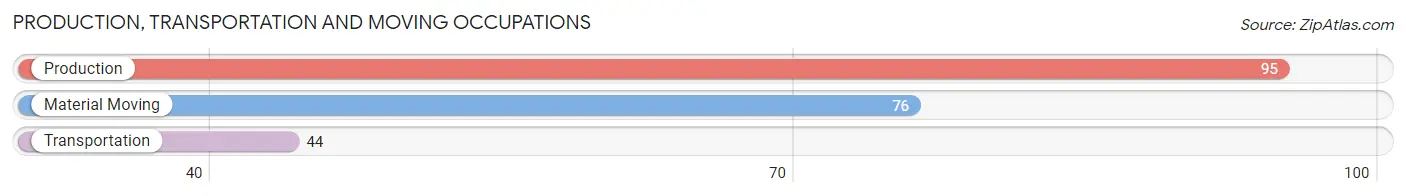
Production, Transportation and Moving Occupations
The most common Production, Transportation and Moving occupations in Jersey Shore borough are Production (95 | 5.8%), Material Moving (76 | 4.6%), and Transportation (44 | 2.7%).
Production, Transportation and Moving Occupations by Sex
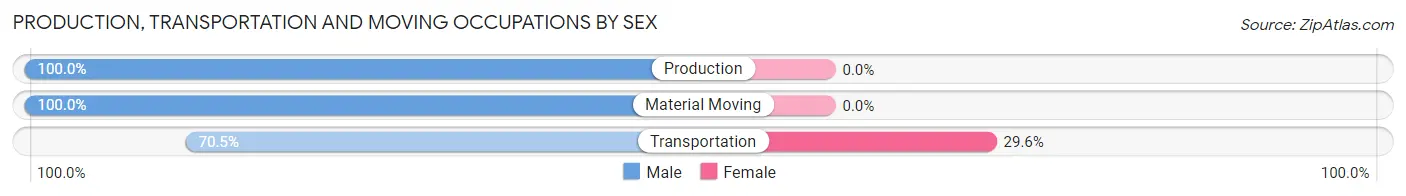
| Occupation | Male | Female |
| Production | 95 (100.0%) | 0 (0.0%) |
| Transportation | 31 (70.5%) | 13 (29.5%) |
| Material Moving | 76 (100.0%) | 0 (0.0%) |
| Total (Category) | 202 (94.0%) | 13 (6.0%) |
| Total (Overall) | 937 (56.9%) | 709 (43.1%) |
Employment Industries by Sex in Jersey Shore borough
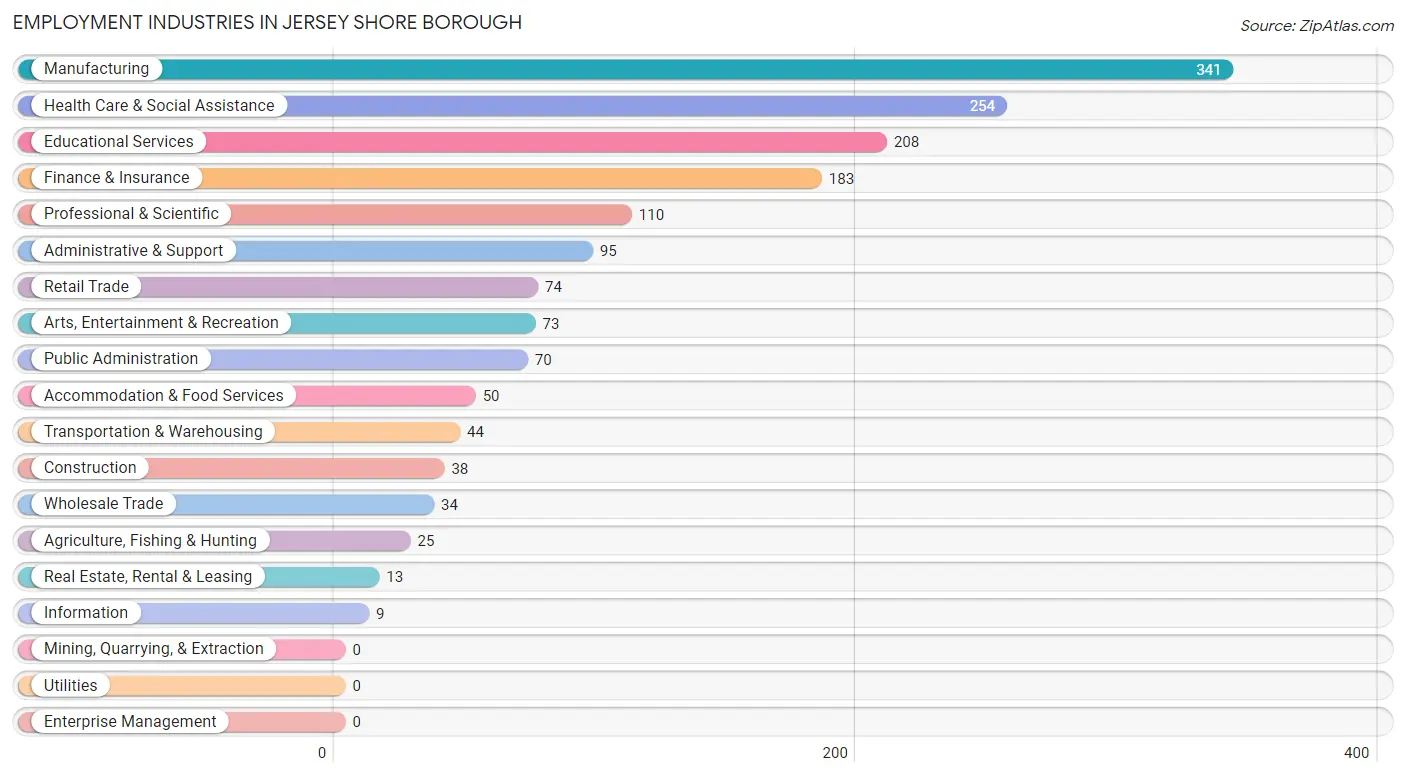
Employment Industries in Jersey Shore borough
The major employment industries in Jersey Shore borough include Manufacturing (341 | 20.7%), Health Care & Social Assistance (254 | 15.4%), Educational Services (208 | 12.6%), Finance & Insurance (183 | 11.1%), and Professional & Scientific (110 | 6.7%).
Employment Industries by Sex in Jersey Shore borough
The Jersey Shore borough industries that see more men than women are Agriculture, Fishing & Hunting (100.0%), Construction (100.0%), and Information (100.0%), whereas the industries that tend to have a higher number of women are Real Estate, Rental & Leasing (100.0%), Health Care & Social Assistance (100.0%), and Arts, Entertainment & Recreation (100.0%).
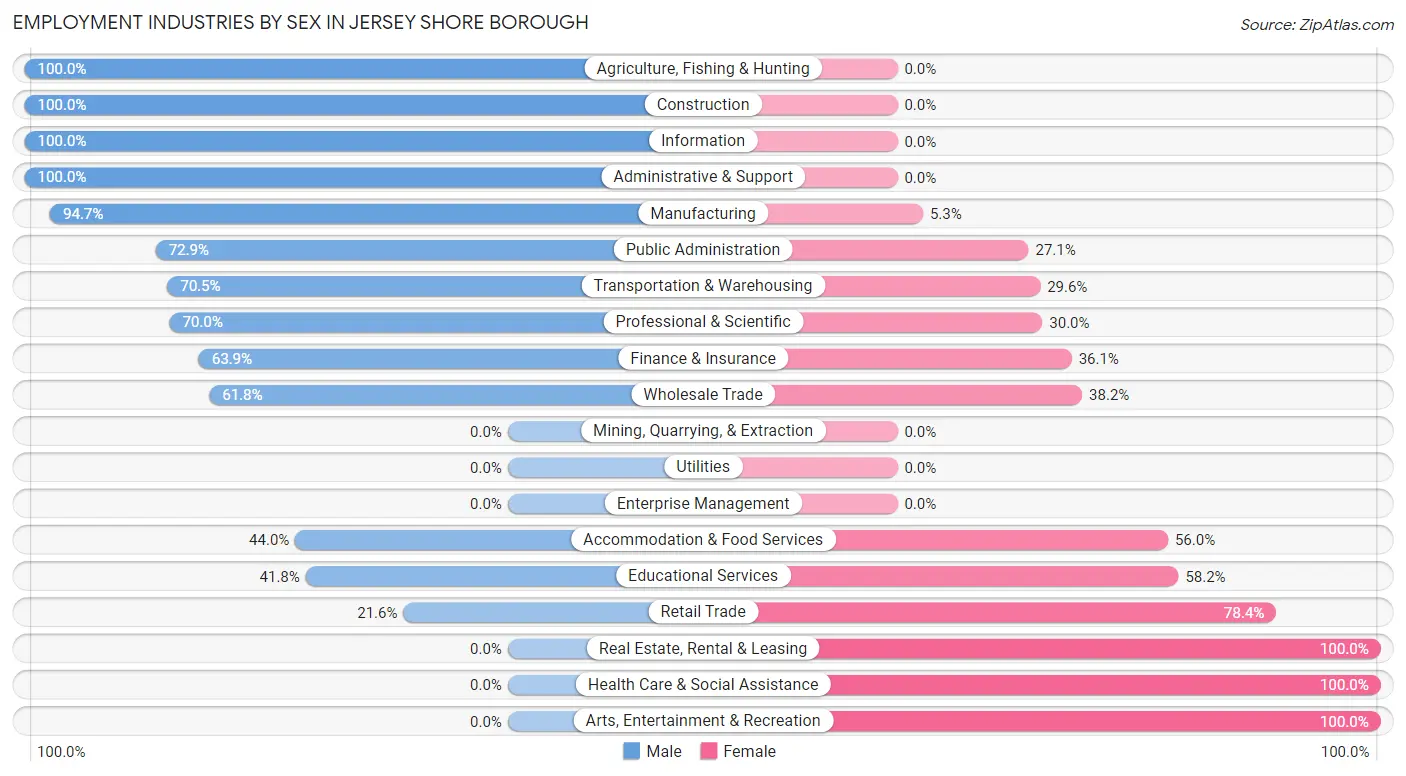
| Industry | Male | Female |
| Agriculture, Fishing & Hunting | 25 (100.0%) | 0 (0.0%) |
| Mining, Quarrying, & Extraction | 0 (0.0%) | 0 (0.0%) |
| Construction | 38 (100.0%) | 0 (0.0%) |
| Manufacturing | 323 (94.7%) | 18 (5.3%) |
| Wholesale Trade | 21 (61.8%) | 13 (38.2%) |
| Retail Trade | 16 (21.6%) | 58 (78.4%) |
| Transportation & Warehousing | 31 (70.5%) | 13 (29.5%) |
| Utilities | 0 (0.0%) | 0 (0.0%) |
| Information | 9 (100.0%) | 0 (0.0%) |
| Finance & Insurance | 117 (63.9%) | 66 (36.1%) |
| Real Estate, Rental & Leasing | 0 (0.0%) | 13 (100.0%) |
| Professional & Scientific | 77 (70.0%) | 33 (30.0%) |
| Enterprise Management | 0 (0.0%) | 0 (0.0%) |
| Administrative & Support | 95 (100.0%) | 0 (0.0%) |
| Educational Services | 87 (41.8%) | 121 (58.2%) |
| Health Care & Social Assistance | 0 (0.0%) | 254 (100.0%) |
| Arts, Entertainment & Recreation | 0 (0.0%) | 73 (100.0%) |
| Accommodation & Food Services | 22 (44.0%) | 28 (56.0%) |
| Public Administration | 51 (72.9%) | 19 (27.1%) |
| Total | 937 (56.9%) | 709 (43.1%) |
Education in Jersey Shore borough
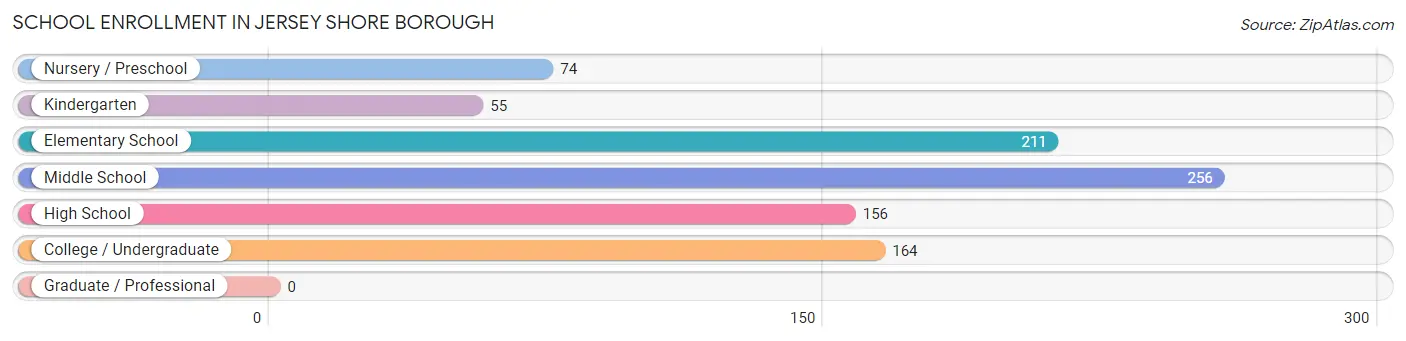
School Enrollment in Jersey Shore borough
The most common levels of schooling among the 916 students in Jersey Shore borough are middle school (256 | 28.0%), elementary school (211 | 23.0%), and college / undergraduate (164 | 17.9%).
| School Level | # Students | % Students |
| Nursery / Preschool | 74 | 8.1% |
| Kindergarten | 55 | 6.0% |
| Elementary School | 211 | 23.0% |
| Middle School | 256 | 28.0% |
| High School | 156 | 17.0% |
| College / Undergraduate | 164 | 17.9% |
| Graduate / Professional | 0 | 0.0% |
| Total | 916 | 100.0% |
School Enrollment by Age by Funding Source in Jersey Shore borough
Out of a total of 916 students who are enrolled in schools in Jersey Shore borough, 277 (30.2%) attend a private institution, while the remaining 639 (69.8%) are enrolled in public schools. The age group of 18 to 19 year olds has the highest likelihood of being enrolled in private schools, with 24 (100.0% in the age bracket) enrolled. Conversely, the age group of 5 to 9 year old has the lowest likelihood of being enrolled in a private school, with 216 (100.0% in the age bracket) attending a public institution.
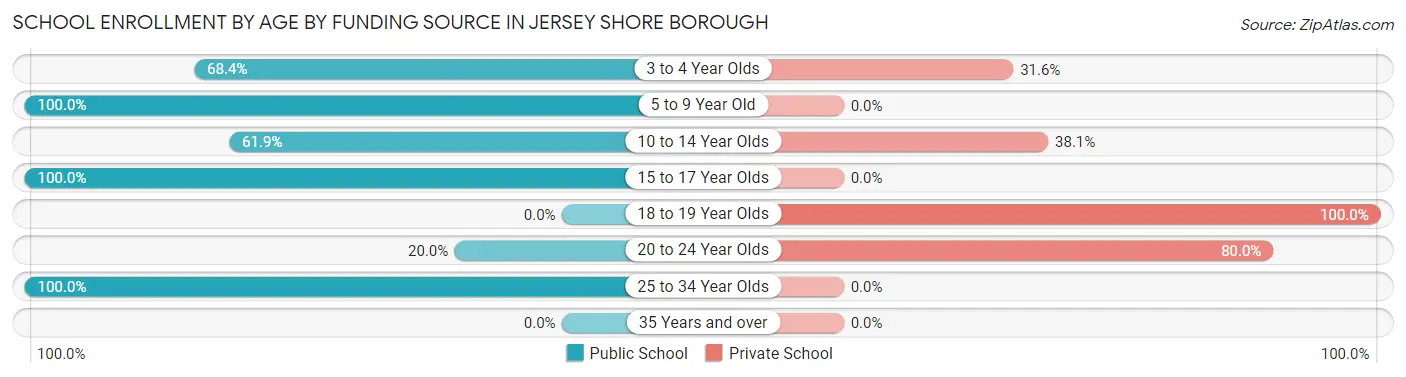
| Age Bracket | Public School | Private School |
| 3 to 4 Year Olds | 39 (68.4%) | 18 (31.6%) |
| 5 to 9 Year Old | 216 (100.0%) | 0 (0.0%) |
| 10 to 14 Year Olds | 252 (61.9%) | 155 (38.1%) |
| 15 to 17 Year Olds | 72 (100.0%) | 0 (0.0%) |
| 18 to 19 Year Olds | 0 (0.0%) | 24 (100.0%) |
| 20 to 24 Year Olds | 20 (20.0%) | 80 (80.0%) |
| 25 to 34 Year Olds | 40 (100.0%) | 0 (0.0%) |
| 35 Years and over | 0 (0.0%) | 0 (0.0%) |
| Total | 639 (69.8%) | 277 (30.2%) |
Educational Attainment by Field of Study in Jersey Shore borough
Education (206 | 30.9%), arts & humanities (118 | 17.7%), bio, nature & agricultural (99 | 14.9%), science & technology (58 | 8.7%), and liberal arts & history (53 | 8.0%) are the most common fields of study among 666 individuals in Jersey Shore borough who have obtained a bachelor's degree or higher.
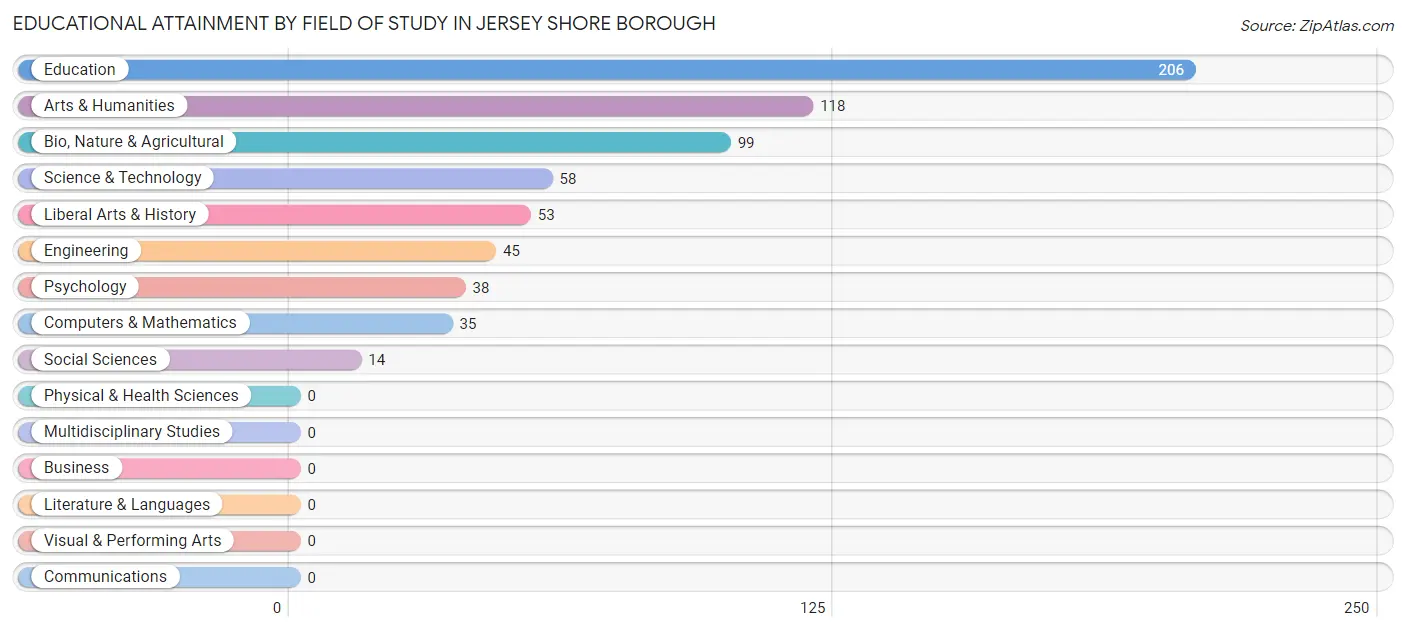
| Field of Study | # Graduates | % Graduates |
| Computers & Mathematics | 35 | 5.3% |
| Bio, Nature & Agricultural | 99 | 14.9% |
| Physical & Health Sciences | 0 | 0.0% |
| Psychology | 38 | 5.7% |
| Social Sciences | 14 | 2.1% |
| Engineering | 45 | 6.8% |
| Multidisciplinary Studies | 0 | 0.0% |
| Science & Technology | 58 | 8.7% |
| Business | 0 | 0.0% |
| Education | 206 | 30.9% |
| Literature & Languages | 0 | 0.0% |
| Liberal Arts & History | 53 | 8.0% |
| Visual & Performing Arts | 0 | 0.0% |
| Communications | 0 | 0.0% |
| Arts & Humanities | 118 | 17.7% |
| Total | 666 | 100.0% |
Transportation & Commute in Jersey Shore borough
Vehicle Availability by Sex in Jersey Shore borough
The most prevalent vehicle ownership categories in Jersey Shore borough are males with 2 vehicles (310, accounting for 33.1%) and females with 2 vehicles (211, making up 43.7%).
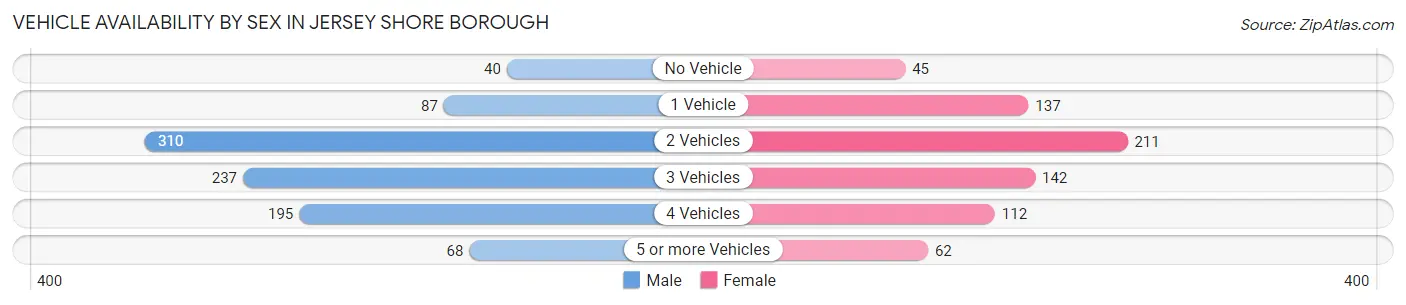
| Vehicles Available | Male | Female |
| No Vehicle | 40 (4.3%) | 45 (6.4%) |
| 1 Vehicle | 87 (9.3%) | 137 (19.3%) |
| 2 Vehicles | 310 (33.1%) | 211 (29.8%) |
| 3 Vehicles | 237 (25.3%) | 142 (20.0%) |
| 4 Vehicles | 195 (20.8%) | 112 (15.8%) |
| 5 or more Vehicles | 68 (7.3%) | 62 (8.7%) |
| Total | 937 (100.0%) | 709 (100.0%) |
Commute Time in Jersey Shore borough
The most frequently occuring commute durations in Jersey Shore borough are 20 to 24 minutes (350 commuters, 22.2%), 15 to 19 minutes (300 commuters, 19.0%), and 5 to 9 minutes (217 commuters, 13.8%).
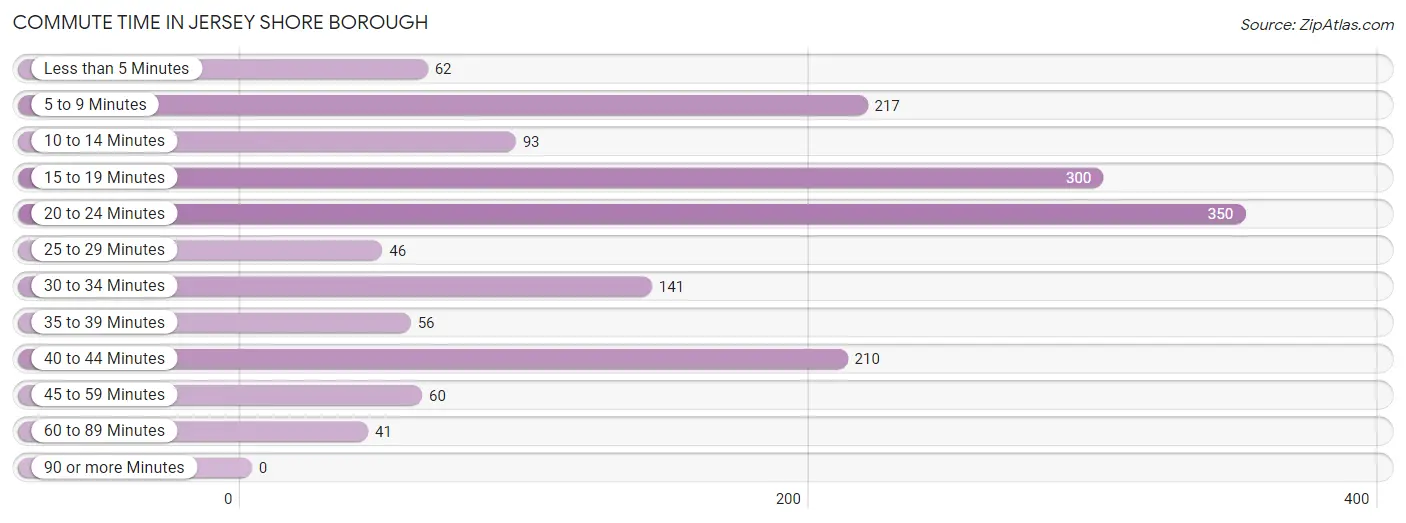
| Commute Time | # Commuters | % Commuters |
| Less than 5 Minutes | 62 | 3.9% |
| 5 to 9 Minutes | 217 | 13.8% |
| 10 to 14 Minutes | 93 | 5.9% |
| 15 to 19 Minutes | 300 | 19.0% |
| 20 to 24 Minutes | 350 | 22.2% |
| 25 to 29 Minutes | 46 | 2.9% |
| 30 to 34 Minutes | 141 | 8.9% |
| 35 to 39 Minutes | 56 | 3.5% |
| 40 to 44 Minutes | 210 | 13.3% |
| 45 to 59 Minutes | 60 | 3.8% |
| 60 to 89 Minutes | 41 | 2.6% |
| 90 or more Minutes | 0 | 0.0% |
Commute Time by Sex in Jersey Shore borough
The most common commute times in Jersey Shore borough are 15 to 19 minutes (208 commuters, 23.2%) for males and 20 to 24 minutes (204 commuters, 30.0%) for females.
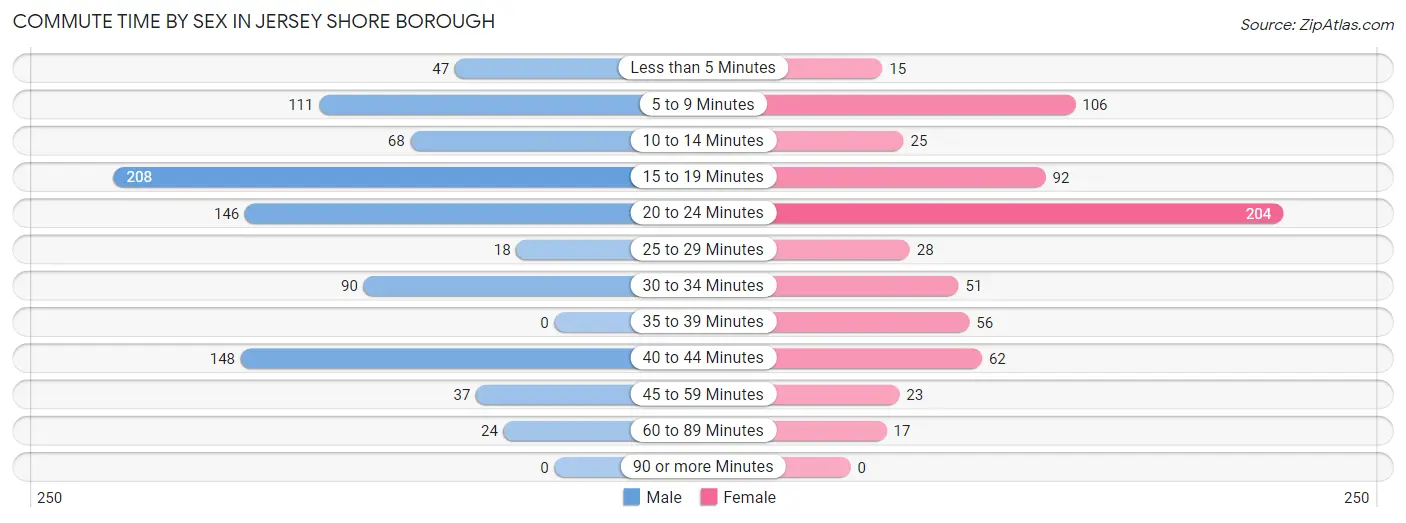
| Commute Time | Male | Female |
| Less than 5 Minutes | 47 (5.2%) | 15 (2.2%) |
| 5 to 9 Minutes | 111 (12.4%) | 106 (15.6%) |
| 10 to 14 Minutes | 68 (7.6%) | 25 (3.7%) |
| 15 to 19 Minutes | 208 (23.2%) | 92 (13.6%) |
| 20 to 24 Minutes | 146 (16.3%) | 204 (30.0%) |
| 25 to 29 Minutes | 18 (2.0%) | 28 (4.1%) |
| 30 to 34 Minutes | 90 (10.0%) | 51 (7.5%) |
| 35 to 39 Minutes | 0 (0.0%) | 56 (8.3%) |
| 40 to 44 Minutes | 148 (16.5%) | 62 (9.1%) |
| 45 to 59 Minutes | 37 (4.1%) | 23 (3.4%) |
| 60 to 89 Minutes | 24 (2.7%) | 17 (2.5%) |
| 90 or more Minutes | 0 (0.0%) | 0 (0.0%) |
Time of Departure to Work by Sex in Jersey Shore borough
The most frequent times of departure to work in Jersey Shore borough are 7:30 AM to 7:59 AM (328, 36.6%) for males and 6:00 AM to 6:29 AM (166, 24.4%) for females.
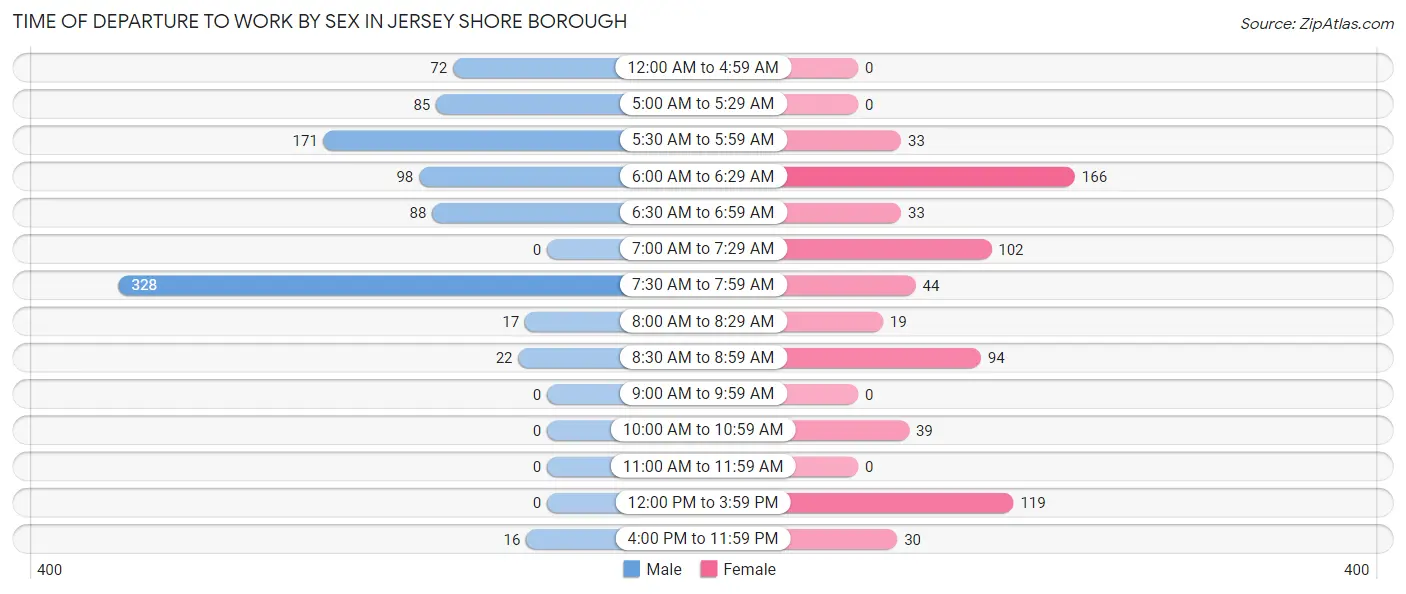
| Time of Departure | Male | Female |
| 12:00 AM to 4:59 AM | 72 (8.0%) | 0 (0.0%) |
| 5:00 AM to 5:29 AM | 85 (9.5%) | 0 (0.0%) |
| 5:30 AM to 5:59 AM | 171 (19.1%) | 33 (4.9%) |
| 6:00 AM to 6:29 AM | 98 (10.9%) | 166 (24.4%) |
| 6:30 AM to 6:59 AM | 88 (9.8%) | 33 (4.9%) |
| 7:00 AM to 7:29 AM | 0 (0.0%) | 102 (15.0%) |
| 7:30 AM to 7:59 AM | 328 (36.6%) | 44 (6.5%) |
| 8:00 AM to 8:29 AM | 17 (1.9%) | 19 (2.8%) |
| 8:30 AM to 8:59 AM | 22 (2.5%) | 94 (13.8%) |
| 9:00 AM to 9:59 AM | 0 (0.0%) | 0 (0.0%) |
| 10:00 AM to 10:59 AM | 0 (0.0%) | 39 (5.7%) |
| 11:00 AM to 11:59 AM | 0 (0.0%) | 0 (0.0%) |
| 12:00 PM to 3:59 PM | 0 (0.0%) | 119 (17.5%) |
| 4:00 PM to 11:59 PM | 16 (1.8%) | 30 (4.4%) |
| Total | 897 (100.0%) | 679 (100.0%) |
Housing Occupancy in Jersey Shore borough
Occupancy by Ownership in Jersey Shore borough
Of the total 1,501 dwellings in Jersey Shore borough, owner-occupied units account for 1,175 (78.3%), while renter-occupied units make up 326 (21.7%).
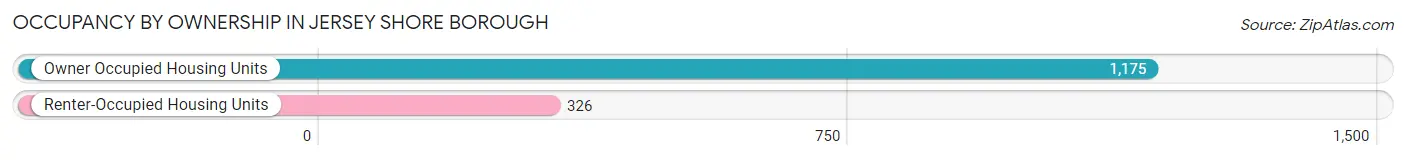
| Occupancy | # Housing Units | % Housing Units |
| Owner Occupied Housing Units | 1,175 | 78.3% |
| Renter-Occupied Housing Units | 326 | 21.7% |
| Total Occupied Housing Units | 1,501 | 100.0% |
Occupancy by Household Size in Jersey Shore borough
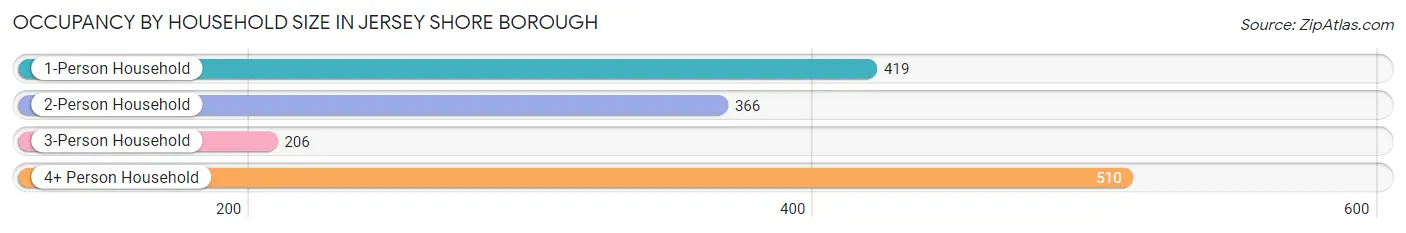
| Household Size | # Housing Units | % Housing Units |
| 1-Person Household | 419 | 27.9% |
| 2-Person Household | 366 | 24.4% |
| 3-Person Household | 206 | 13.7% |
| 4+ Person Household | 510 | 34.0% |
| Total Housing Units | 1,501 | 100.0% |
Occupancy by Ownership by Household Size in Jersey Shore borough
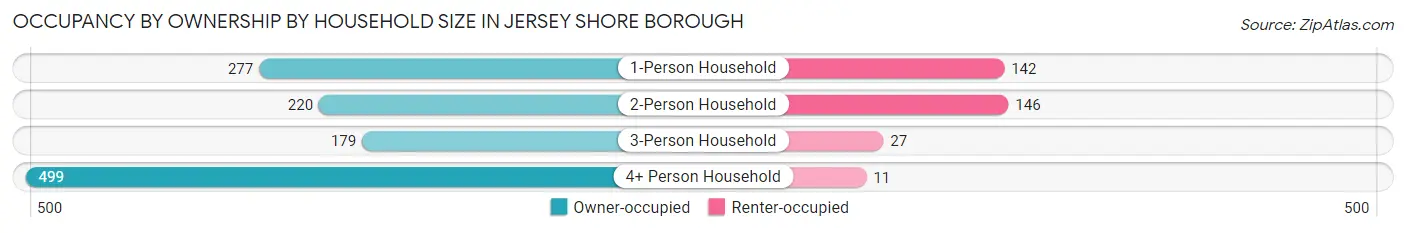
| Household Size | Owner-occupied | Renter-occupied |
| 1-Person Household | 277 (66.1%) | 142 (33.9%) |
| 2-Person Household | 220 (60.1%) | 146 (39.9%) |
| 3-Person Household | 179 (86.9%) | 27 (13.1%) |
| 4+ Person Household | 499 (97.8%) | 11 (2.2%) |
| Total Housing Units | 1,175 (78.3%) | 326 (21.7%) |
Occupancy by Educational Attainment in Jersey Shore borough
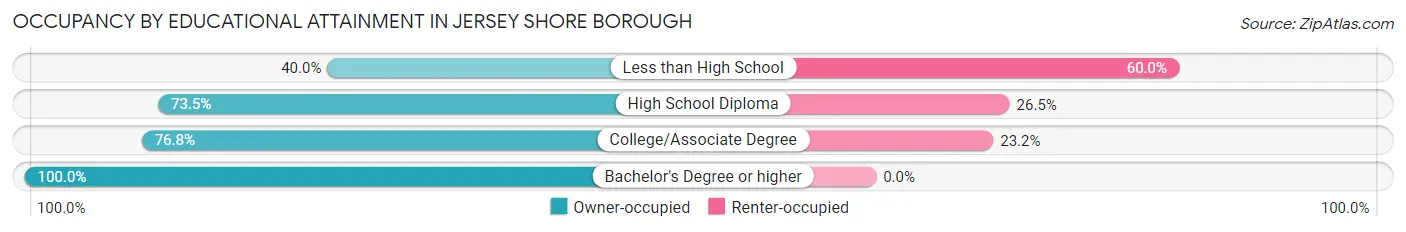
| Household Size | Owner-occupied | Renter-occupied |
| Less than High School | 30 (40.0%) | 45 (60.0%) |
| High School Diploma | 500 (73.5%) | 180 (26.5%) |
| College/Associate Degree | 334 (76.8%) | 101 (23.2%) |
| Bachelor's Degree or higher | 311 (100.0%) | 0 (0.0%) |
Occupancy by Age of Householder in Jersey Shore borough
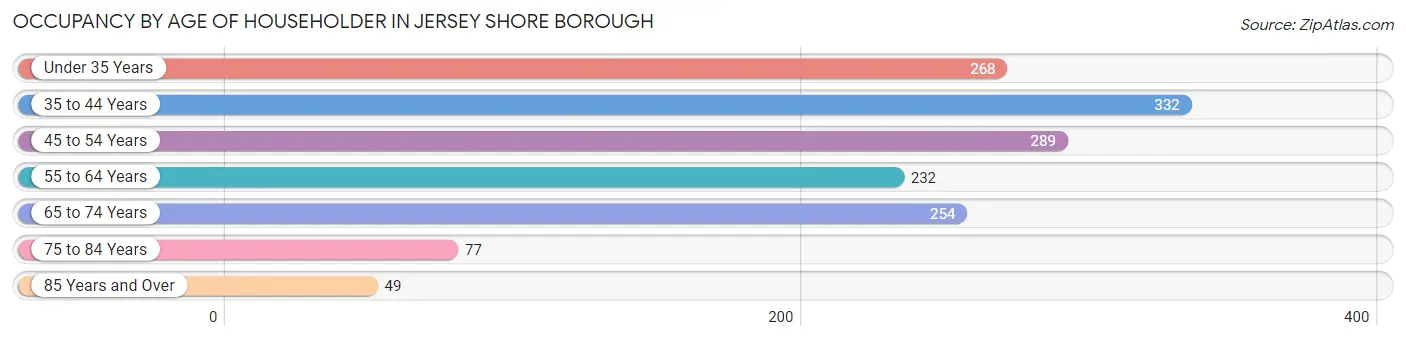
| Age Bracket | # Households | % Households |
| Under 35 Years | 268 | 17.8% |
| 35 to 44 Years | 332 | 22.1% |
| 45 to 54 Years | 289 | 19.3% |
| 55 to 64 Years | 232 | 15.5% |
| 65 to 74 Years | 254 | 16.9% |
| 75 to 84 Years | 77 | 5.1% |
| 85 Years and Over | 49 | 3.3% |
| Total | 1,501 | 100.0% |
Housing Finances in Jersey Shore borough
Median Income by Occupancy in Jersey Shore borough
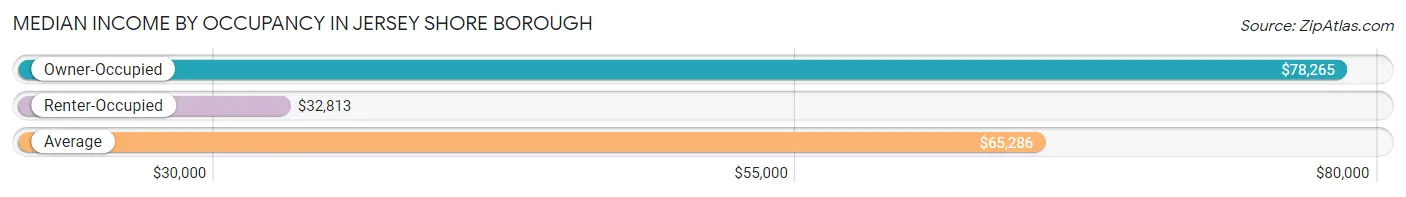
| Occupancy Type | # Households | Median Income |
| Owner-Occupied | 1,175 (78.3%) | $78,265 |
| Renter-Occupied | 326 (21.7%) | $32,813 |
| Average | 1,501 (100.0%) | $65,286 |
Occupancy by Householder Income Bracket in Jersey Shore borough
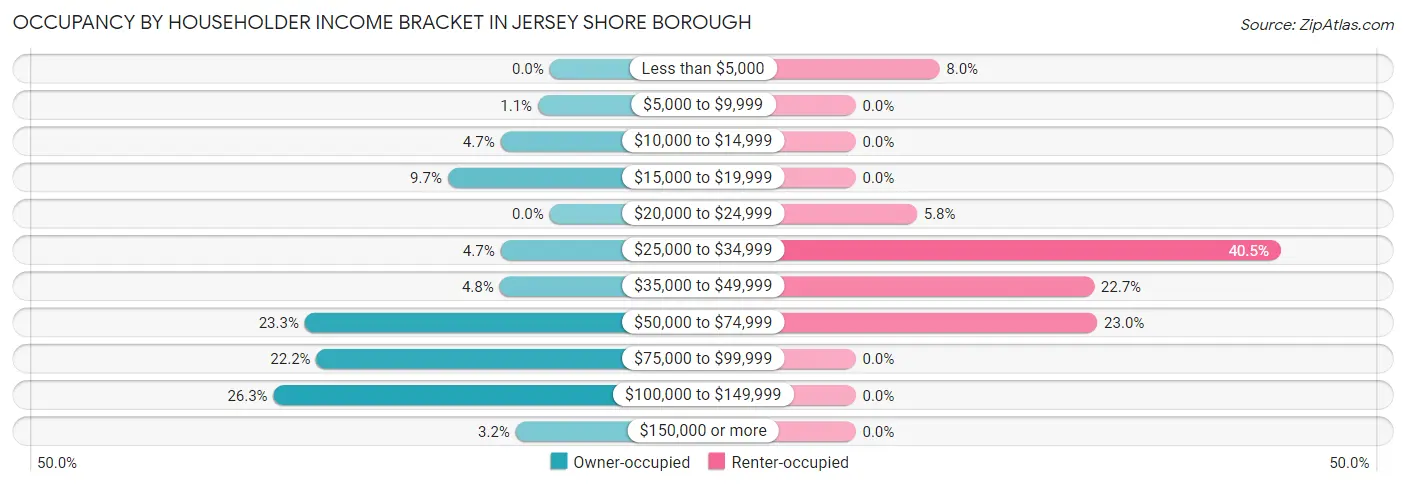
| Income Bracket | Owner-occupied | Renter-occupied |
| Less than $5,000 | 0 (0.0%) | 26 (8.0%) |
| $5,000 to $9,999 | 13 (1.1%) | 0 (0.0%) |
| $10,000 to $14,999 | 55 (4.7%) | 0 (0.0%) |
| $15,000 to $19,999 | 114 (9.7%) | 0 (0.0%) |
| $20,000 to $24,999 | 0 (0.0%) | 19 (5.8%) |
| $25,000 to $34,999 | 55 (4.7%) | 132 (40.5%) |
| $35,000 to $49,999 | 56 (4.8%) | 74 (22.7%) |
| $50,000 to $74,999 | 274 (23.3%) | 75 (23.0%) |
| $75,000 to $99,999 | 261 (22.2%) | 0 (0.0%) |
| $100,000 to $149,999 | 309 (26.3%) | 0 (0.0%) |
| $150,000 or more | 38 (3.2%) | 0 (0.0%) |
| Total | 1,175 (100.0%) | 326 (100.0%) |
Monthly Housing Cost Tiers in Jersey Shore borough
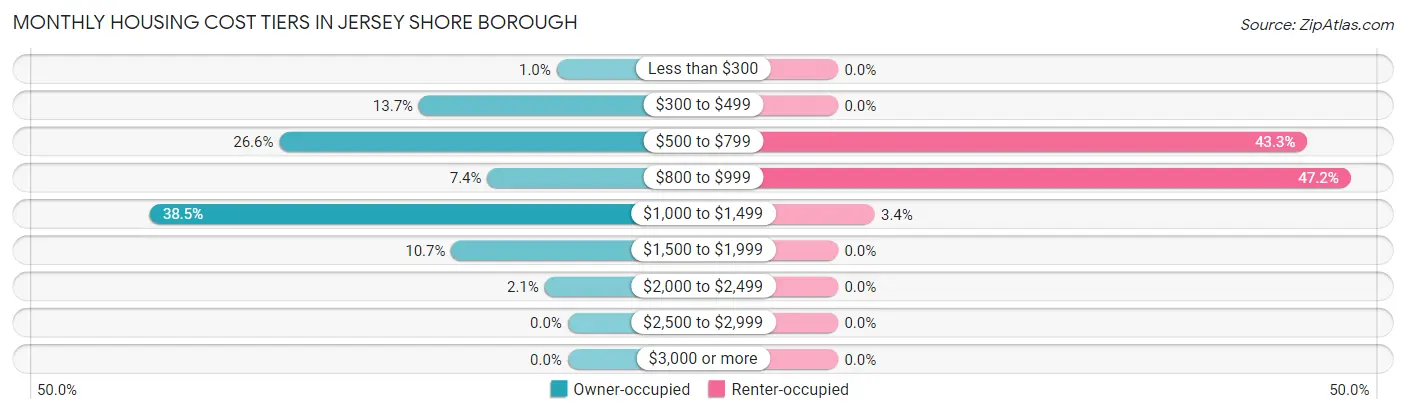
| Monthly Cost | Owner-occupied | Renter-occupied |
| Less than $300 | 12 (1.0%) | 0 (0.0%) |
| $300 to $499 | 161 (13.7%) | 0 (0.0%) |
| $500 to $799 | 312 (26.6%) | 141 (43.2%) |
| $800 to $999 | 87 (7.4%) | 154 (47.2%) |
| $1,000 to $1,499 | 452 (38.5%) | 11 (3.4%) |
| $1,500 to $1,999 | 126 (10.7%) | 0 (0.0%) |
| $2,000 to $2,499 | 25 (2.1%) | 0 (0.0%) |
| $2,500 to $2,999 | 0 (0.0%) | 0 (0.0%) |
| $3,000 or more | 0 (0.0%) | 0 (0.0%) |
| Total | 1,175 (100.0%) | 326 (100.0%) |
Physical Housing Characteristics in Jersey Shore borough
Housing Structures in Jersey Shore borough
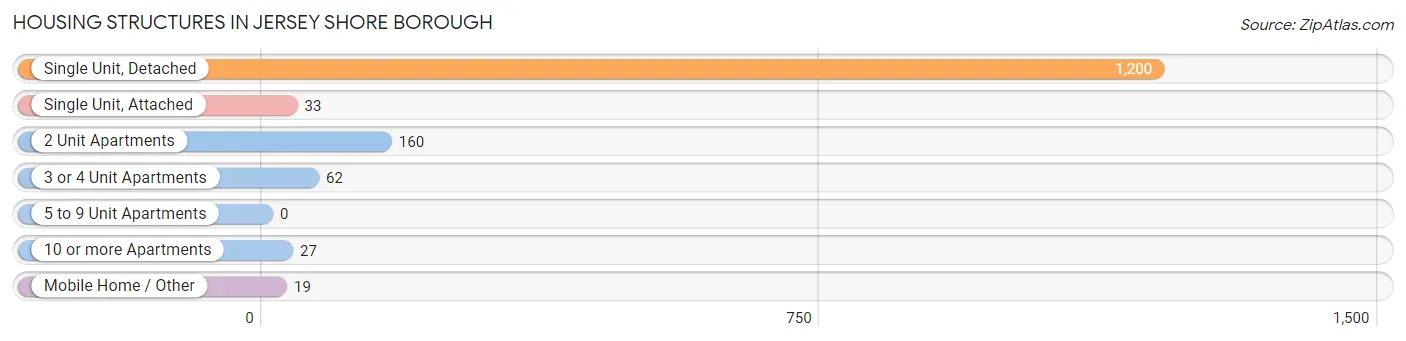
| Structure Type | # Housing Units | % Housing Units |
| Single Unit, Detached | 1,200 | 79.9% |
| Single Unit, Attached | 33 | 2.2% |
| 2 Unit Apartments | 160 | 10.7% |
| 3 or 4 Unit Apartments | 62 | 4.1% |
| 5 to 9 Unit Apartments | 0 | 0.0% |
| 10 or more Apartments | 27 | 1.8% |
| Mobile Home / Other | 19 | 1.3% |
| Total | 1,501 | 100.0% |
Housing Structures by Occupancy in Jersey Shore borough
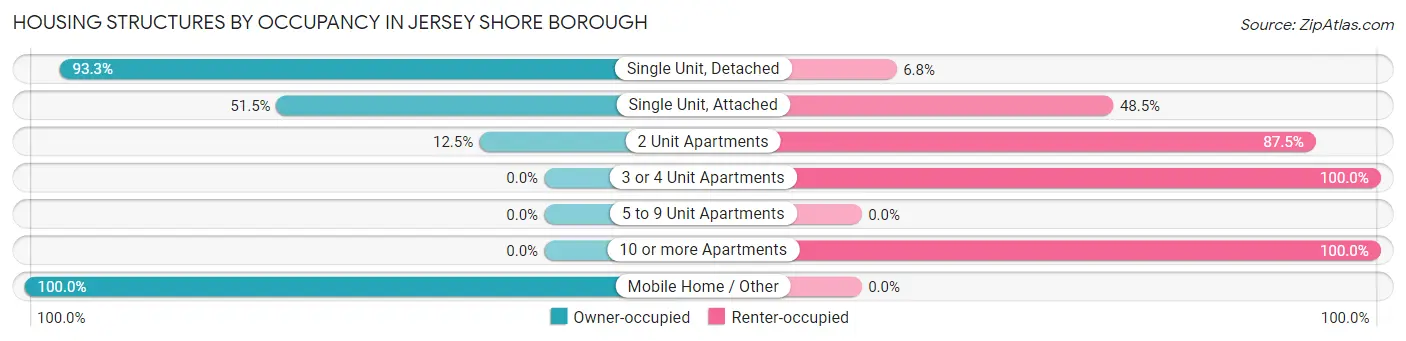
| Structure Type | Owner-occupied | Renter-occupied |
| Single Unit, Detached | 1,119 (93.2%) | 81 (6.8%) |
| Single Unit, Attached | 17 (51.5%) | 16 (48.5%) |
| 2 Unit Apartments | 20 (12.5%) | 140 (87.5%) |
| 3 or 4 Unit Apartments | 0 (0.0%) | 62 (100.0%) |
| 5 to 9 Unit Apartments | 0 (0.0%) | 0 (0.0%) |
| 10 or more Apartments | 0 (0.0%) | 27 (100.0%) |
| Mobile Home / Other | 19 (100.0%) | 0 (0.0%) |
| Total | 1,175 (78.3%) | 326 (21.7%) |
Housing Structures by Number of Rooms in Jersey Shore borough
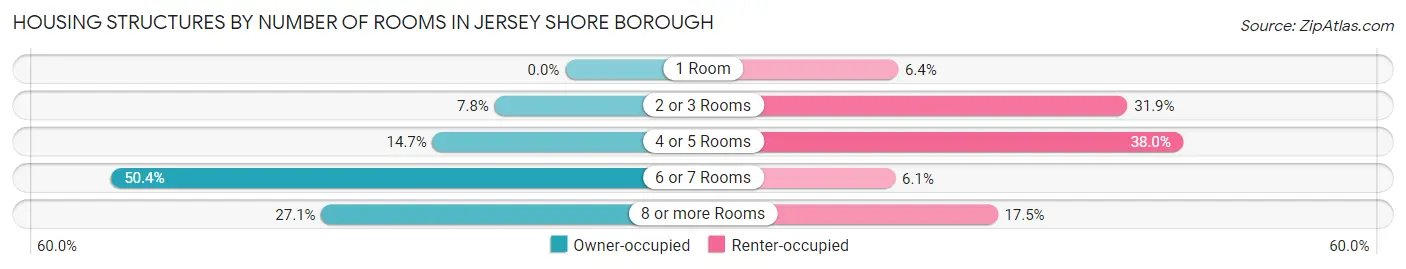
| Number of Rooms | Owner-occupied | Renter-occupied |
| 1 Room | 0 (0.0%) | 21 (6.4%) |
| 2 or 3 Rooms | 92 (7.8%) | 104 (31.9%) |
| 4 or 5 Rooms | 173 (14.7%) | 124 (38.0%) |
| 6 or 7 Rooms | 592 (50.4%) | 20 (6.1%) |
| 8 or more Rooms | 318 (27.1%) | 57 (17.5%) |
| Total | 1,175 (100.0%) | 326 (100.0%) |
Housing Structure by Heating Type in Jersey Shore borough
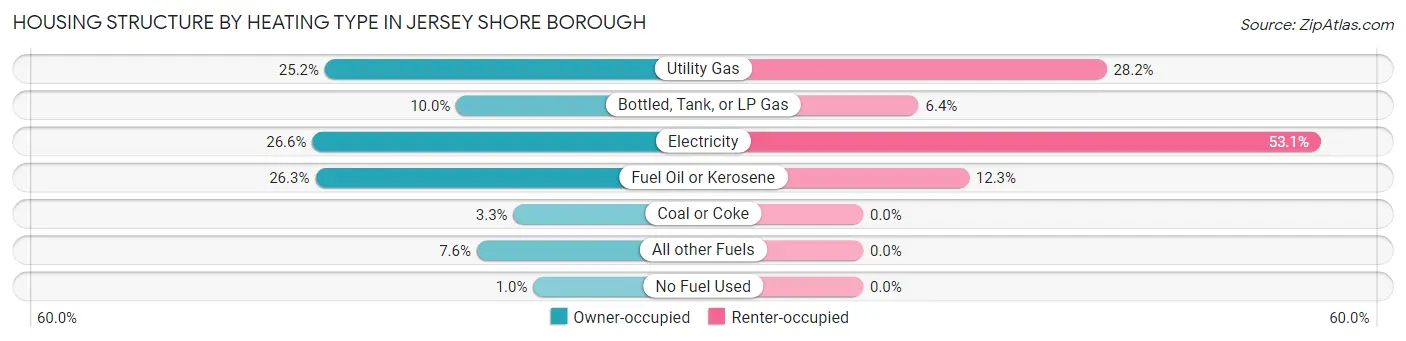
| Heating Type | Owner-occupied | Renter-occupied |
| Utility Gas | 296 (25.2%) | 92 (28.2%) |
| Bottled, Tank, or LP Gas | 117 (10.0%) | 21 (6.4%) |
| Electricity | 313 (26.6%) | 173 (53.1%) |
| Fuel Oil or Kerosene | 309 (26.3%) | 40 (12.3%) |
| Coal or Coke | 39 (3.3%) | 0 (0.0%) |
| All other Fuels | 89 (7.6%) | 0 (0.0%) |
| No Fuel Used | 12 (1.0%) | 0 (0.0%) |
| Total | 1,175 (100.0%) | 326 (100.0%) |
Household Vehicle Usage in Jersey Shore borough
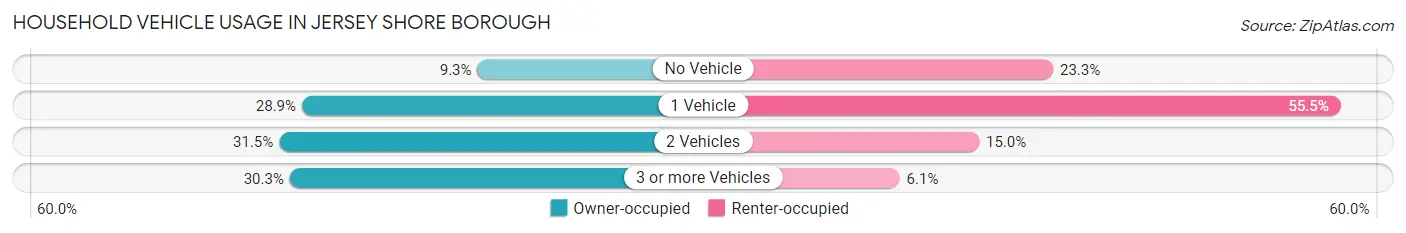
| Vehicles per Household | Owner-occupied | Renter-occupied |
| No Vehicle | 109 (9.3%) | 76 (23.3%) |
| 1 Vehicle | 340 (28.9%) | 181 (55.5%) |
| 2 Vehicles | 370 (31.5%) | 49 (15.0%) |
| 3 or more Vehicles | 356 (30.3%) | 20 (6.1%) |
| Total | 1,175 (100.0%) | 326 (100.0%) |
Real Estate & Mortgages in Jersey Shore borough
Real Estate and Mortgage Overview in Jersey Shore borough
| Characteristic | Without Mortgage | With Mortgage |
| Housing Units | 483 | 692 |
| Median Property Value | $156,900 | $142,300 |
| Median Household Income | $43,203 | $25 |
| Monthly Housing Costs | $534 | $0 |
| Real Estate Taxes | $2,683 | $0 |
Property Value by Mortgage Status in Jersey Shore borough
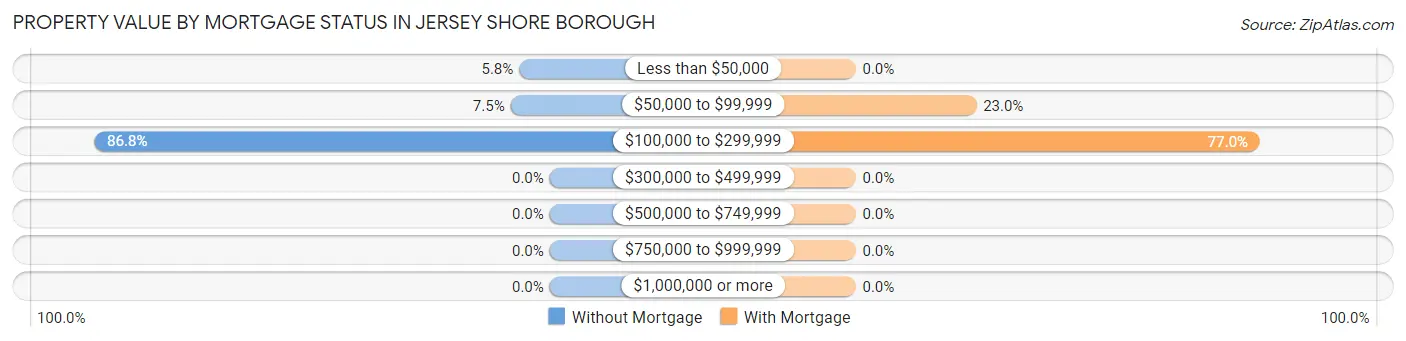
| Property Value | Without Mortgage | With Mortgage |
| Less than $50,000 | 28 (5.8%) | 0 (0.0%) |
| $50,000 to $99,999 | 36 (7.4%) | 159 (23.0%) |
| $100,000 to $299,999 | 419 (86.8%) | 533 (77.0%) |
| $300,000 to $499,999 | 0 (0.0%) | 0 (0.0%) |
| $500,000 to $749,999 | 0 (0.0%) | 0 (0.0%) |
| $750,000 to $999,999 | 0 (0.0%) | 0 (0.0%) |
| $1,000,000 or more | 0 (0.0%) | 0 (0.0%) |
| Total | 483 (100.0%) | 692 (100.0%) |
Household Income by Mortgage Status in Jersey Shore borough
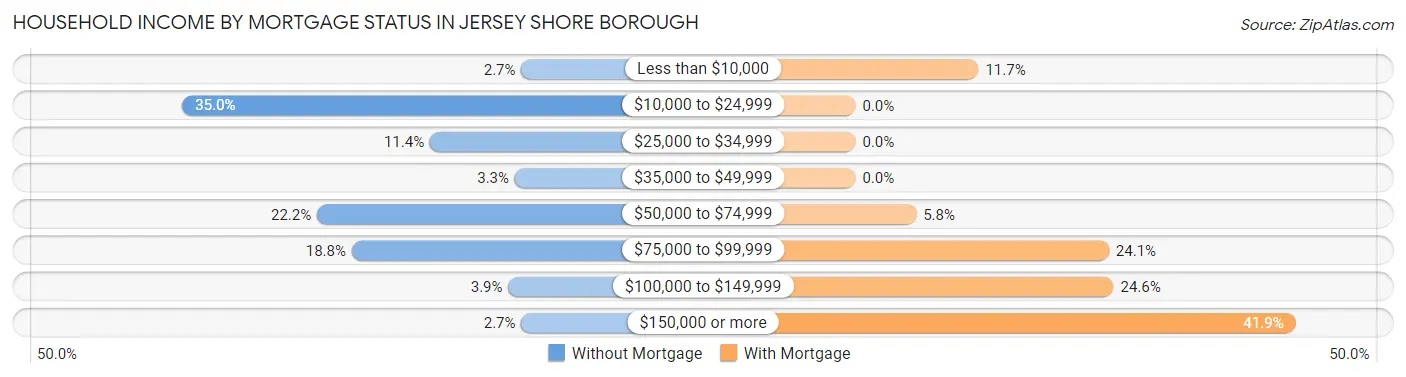
| Household Income | Without Mortgage | With Mortgage |
| Less than $10,000 | 13 (2.7%) | 81 (11.7%) |
| $10,000 to $24,999 | 169 (35.0%) | 0 (0.0%) |
| $25,000 to $34,999 | 55 (11.4%) | 0 (0.0%) |
| $35,000 to $49,999 | 16 (3.3%) | 0 (0.0%) |
| $50,000 to $74,999 | 107 (22.2%) | 40 (5.8%) |
| $75,000 to $99,999 | 91 (18.8%) | 167 (24.1%) |
| $100,000 to $149,999 | 19 (3.9%) | 170 (24.6%) |
| $150,000 or more | 13 (2.7%) | 290 (41.9%) |
| Total | 483 (100.0%) | 692 (100.0%) |
Property Value to Household Income Ratio in Jersey Shore borough
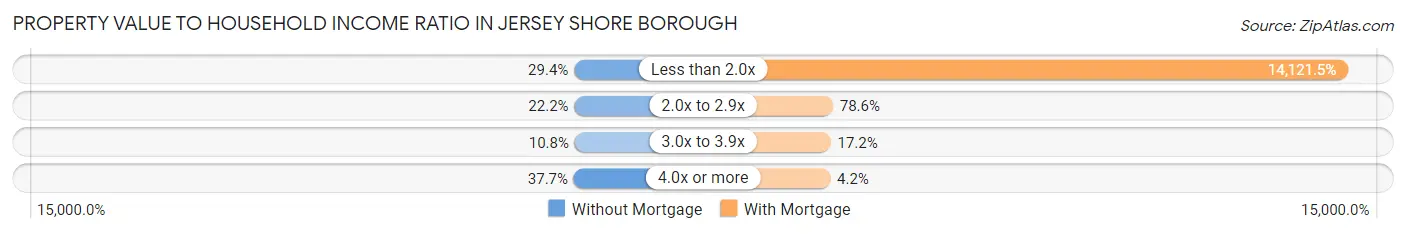
| Value-to-Income Ratio | Without Mortgage | With Mortgage |
| Less than 2.0x | 142 (29.4%) | 97,721 (14,121.5%) |
| 2.0x to 2.9x | 107 (22.2%) | 544 (78.6%) |
| 3.0x to 3.9x | 52 (10.8%) | 119 (17.2%) |
| 4.0x or more | 182 (37.7%) | 29 (4.2%) |
| Total | 483 (100.0%) | 692 (100.0%) |
Real Estate Taxes by Mortgage Status in Jersey Shore borough
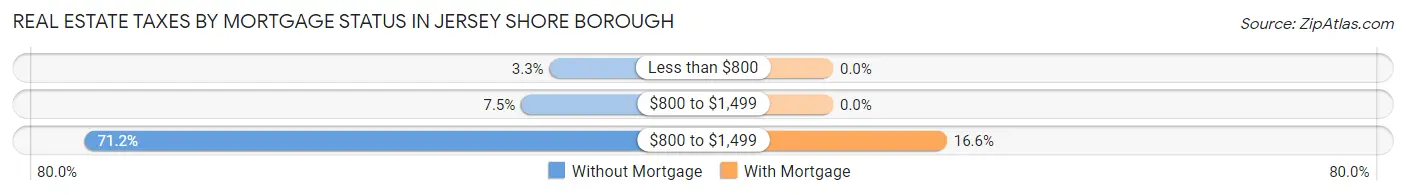
| Property Taxes | Without Mortgage | With Mortgage |
| Less than $800 | 16 (3.3%) | 0 (0.0%) |
| $800 to $1,499 | 36 (7.4%) | 0 (0.0%) |
| $800 to $1,499 | 344 (71.2%) | 115 (16.6%) |
| Total | 483 (100.0%) | 692 (100.0%) |
Health & Disability in Jersey Shore borough
Health Insurance Coverage by Age in Jersey Shore borough
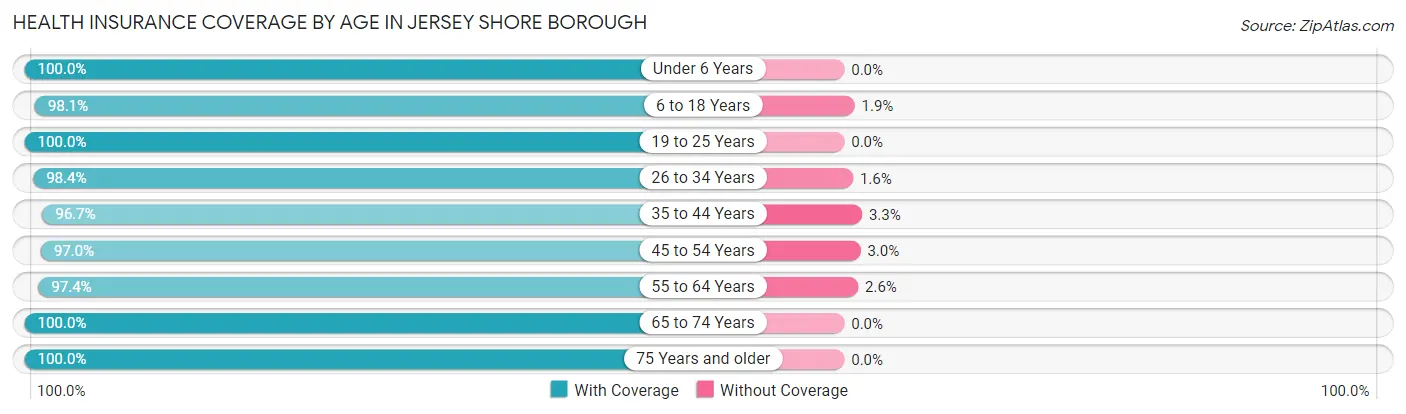
| Age Bracket | With Coverage | Without Coverage |
| Under 6 Years | 319 (100.0%) | 0 (0.0%) |
| 6 to 18 Years | 868 (98.1%) | 17 (1.9%) |
| 19 to 25 Years | 339 (100.0%) | 0 (0.0%) |
| 26 to 34 Years | 364 (98.4%) | 6 (1.6%) |
| 35 to 44 Years | 645 (96.7%) | 22 (3.3%) |
| 45 to 54 Years | 418 (97.0%) | 13 (3.0%) |
| 55 to 64 Years | 415 (97.4%) | 11 (2.6%) |
| 65 to 74 Years | 317 (100.0%) | 0 (0.0%) |
| 75 Years and older | 285 (100.0%) | 0 (0.0%) |
| Total | 3,970 (98.3%) | 69 (1.7%) |
Health Insurance Coverage by Citizenship Status in Jersey Shore borough
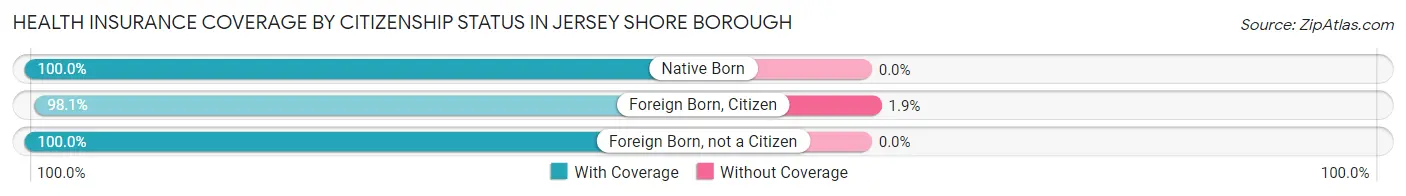
| Citizenship Status | With Coverage | Without Coverage |
| Native Born | 319 (100.0%) | 0 (0.0%) |
| Foreign Born, Citizen | 868 (98.1%) | 17 (1.9%) |
| Foreign Born, not a Citizen | 339 (100.0%) | 0 (0.0%) |
Health Insurance Coverage by Household Income in Jersey Shore borough
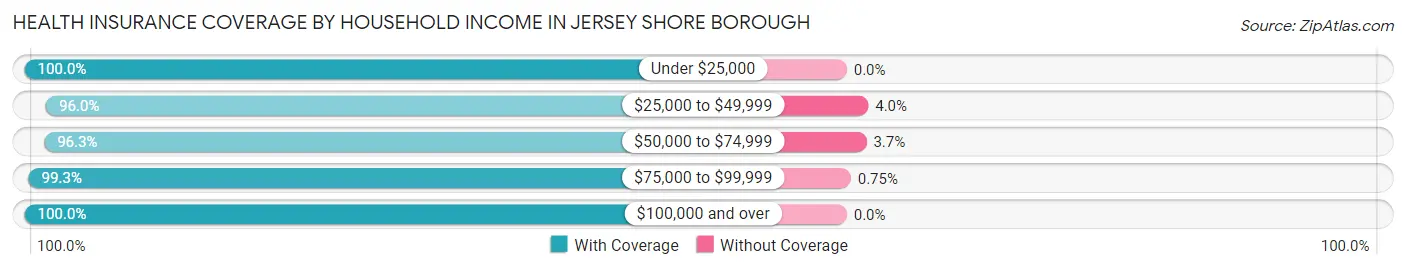
| Household Income | With Coverage | Without Coverage |
| Under $25,000 | 254 (100.0%) | 0 (0.0%) |
| $25,000 to $49,999 | 572 (96.0%) | 24 (4.0%) |
| $50,000 to $74,999 | 1,020 (96.3%) | 39 (3.7%) |
| $75,000 to $99,999 | 793 (99.3%) | 6 (0.7%) |
| $100,000 and over | 1,331 (100.0%) | 0 (0.0%) |
Public vs Private Health Insurance Coverage by Age in Jersey Shore borough
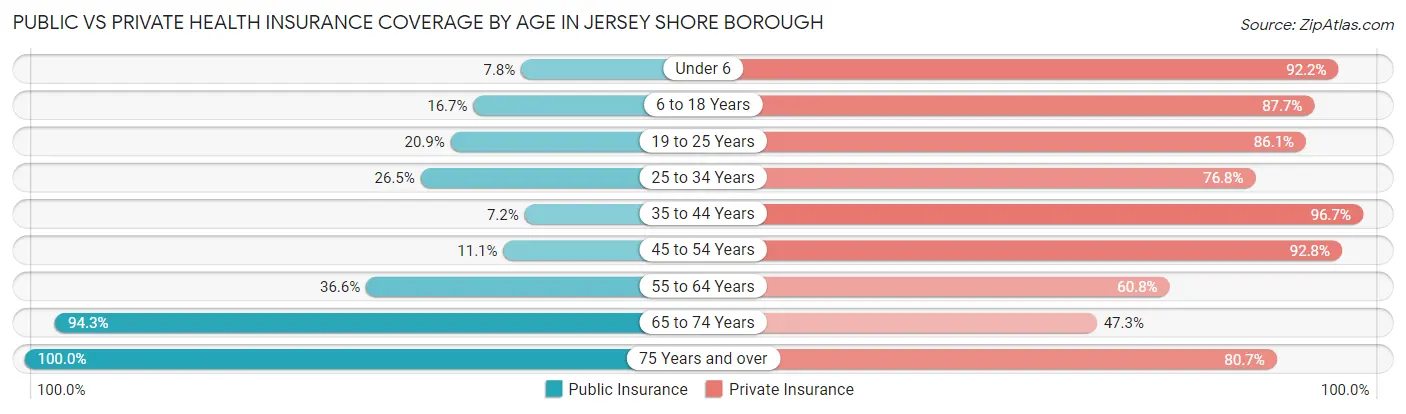
| Age Bracket | Public Insurance | Private Insurance |
| Under 6 | 25 (7.8%) | 294 (92.2%) |
| 6 to 18 Years | 148 (16.7%) | 776 (87.7%) |
| 19 to 25 Years | 71 (20.9%) | 292 (86.1%) |
| 25 to 34 Years | 98 (26.5%) | 284 (76.8%) |
| 35 to 44 Years | 48 (7.2%) | 645 (96.7%) |
| 45 to 54 Years | 48 (11.1%) | 400 (92.8%) |
| 55 to 64 Years | 156 (36.6%) | 259 (60.8%) |
| 65 to 74 Years | 299 (94.3%) | 150 (47.3%) |
| 75 Years and over | 285 (100.0%) | 230 (80.7%) |
| Total | 1,178 (29.2%) | 3,330 (82.5%) |
Disability Status by Sex by Age in Jersey Shore borough
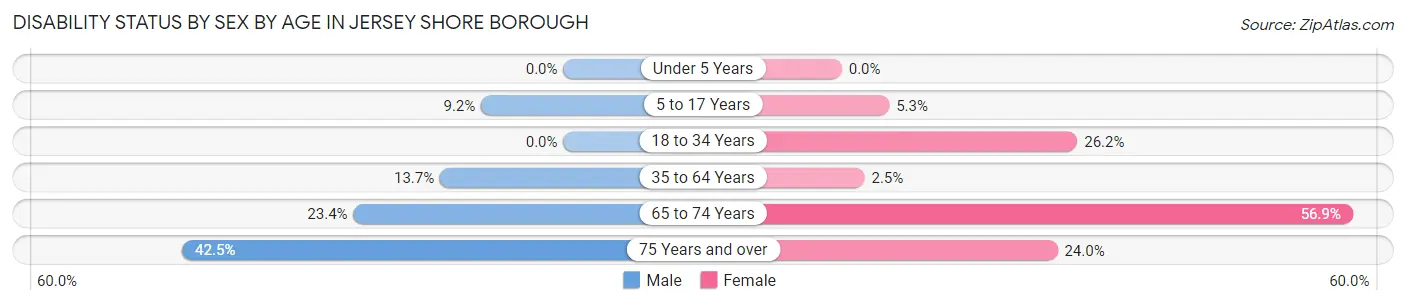
| Age Bracket | Male | Female |
| Under 5 Years | 0 (0.0%) | 0 (0.0%) |
| 5 to 17 Years | 49 (9.2%) | 22 (5.3%) |
| 18 to 34 Years | 0 (0.0%) | 96 (26.2%) |
| 35 to 64 Years | 128 (13.7%) | 15 (2.5%) |
| 65 to 74 Years | 47 (23.4%) | 66 (56.9%) |
| 75 Years and over | 45 (42.4%) | 43 (24.0%) |
Disability Class by Sex by Age in Jersey Shore borough
Disability Class: Hearing Difficulty
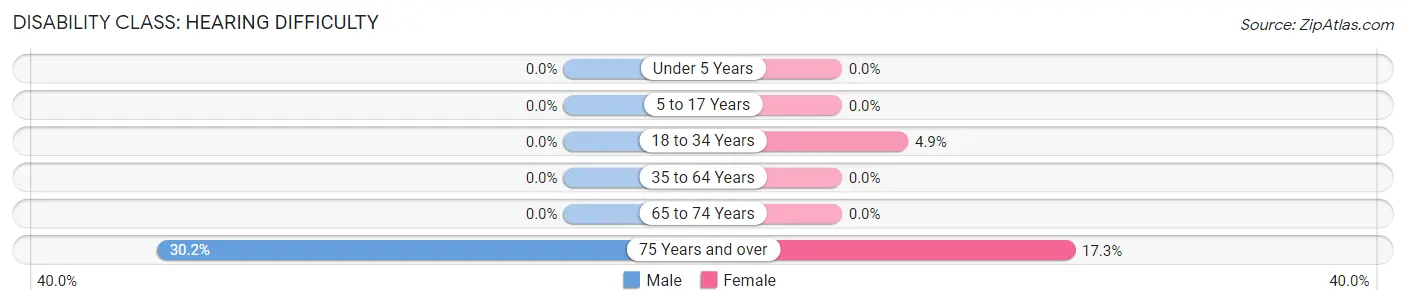
| Age Bracket | Male | Female |
| Under 5 Years | 0 (0.0%) | 0 (0.0%) |
| 5 to 17 Years | 0 (0.0%) | 0 (0.0%) |
| 18 to 34 Years | 0 (0.0%) | 18 (4.9%) |
| 35 to 64 Years | 0 (0.0%) | 0 (0.0%) |
| 65 to 74 Years | 0 (0.0%) | 0 (0.0%) |
| 75 Years and over | 32 (30.2%) | 31 (17.3%) |
Disability Class: Vision Difficulty
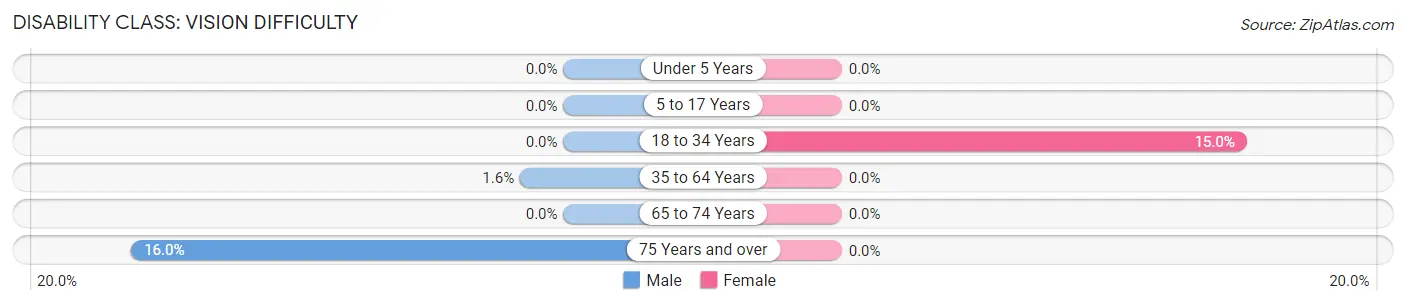
| Age Bracket | Male | Female |
| Under 5 Years | 0 (0.0%) | 0 (0.0%) |
| 5 to 17 Years | 0 (0.0%) | 0 (0.0%) |
| 18 to 34 Years | 0 (0.0%) | 55 (15.0%) |
| 35 to 64 Years | 15 (1.6%) | 0 (0.0%) |
| 65 to 74 Years | 0 (0.0%) | 0 (0.0%) |
| 75 Years and over | 17 (16.0%) | 0 (0.0%) |
Disability Class: Cognitive Difficulty
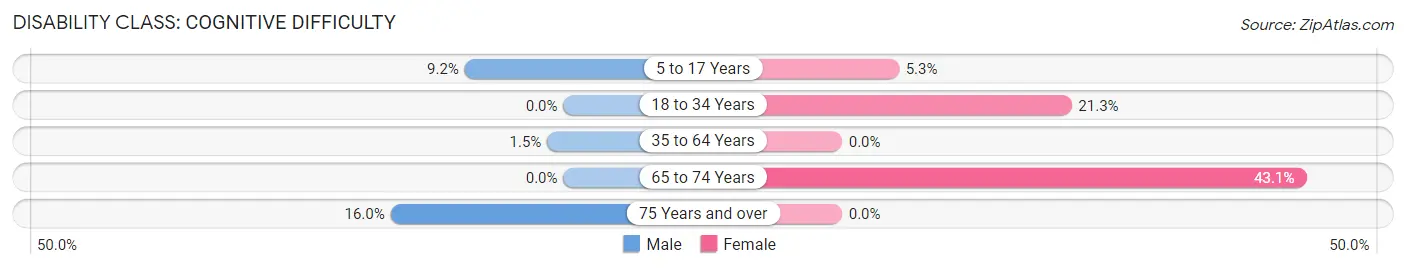
| Age Bracket | Male | Female |
| 5 to 17 Years | 49 (9.2%) | 22 (5.3%) |
| 18 to 34 Years | 0 (0.0%) | 78 (21.3%) |
| 35 to 64 Years | 14 (1.5%) | 0 (0.0%) |
| 65 to 74 Years | 0 (0.0%) | 50 (43.1%) |
| 75 Years and over | 17 (16.0%) | 0 (0.0%) |
Disability Class: Ambulatory Difficulty
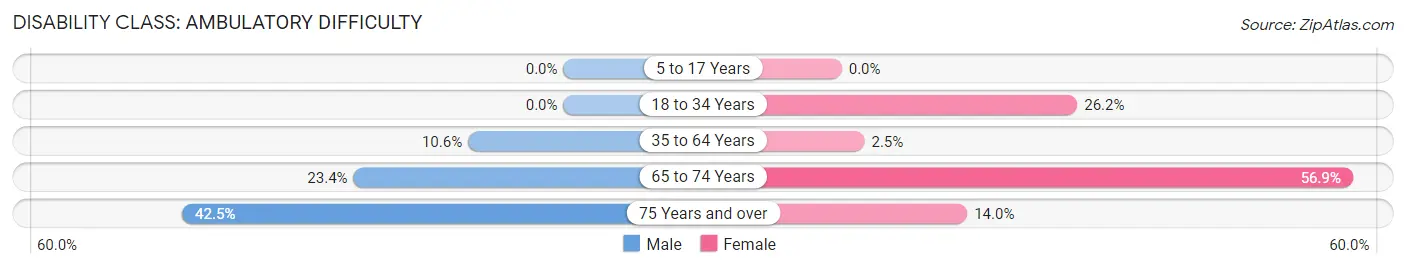
| Age Bracket | Male | Female |
| 5 to 17 Years | 0 (0.0%) | 0 (0.0%) |
| 18 to 34 Years | 0 (0.0%) | 96 (26.2%) |
| 35 to 64 Years | 99 (10.6%) | 15 (2.5%) |
| 65 to 74 Years | 47 (23.4%) | 66 (56.9%) |
| 75 Years and over | 45 (42.4%) | 25 (14.0%) |
Disability Class: Self-Care Difficulty
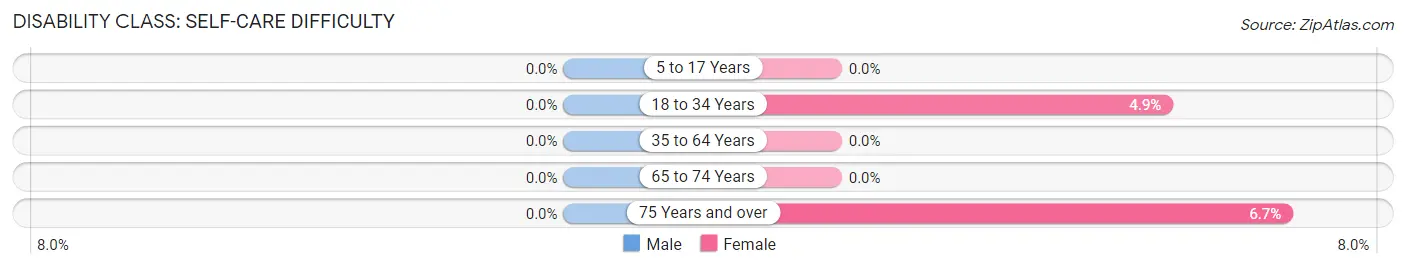
| Age Bracket | Male | Female |
| 5 to 17 Years | 0 (0.0%) | 0 (0.0%) |
| 18 to 34 Years | 0 (0.0%) | 18 (4.9%) |
| 35 to 64 Years | 0 (0.0%) | 0 (0.0%) |
| 65 to 74 Years | 0 (0.0%) | 0 (0.0%) |
| 75 Years and over | 0 (0.0%) | 12 (6.7%) |
Technology Access in Jersey Shore borough
Computing Device Access in Jersey Shore borough
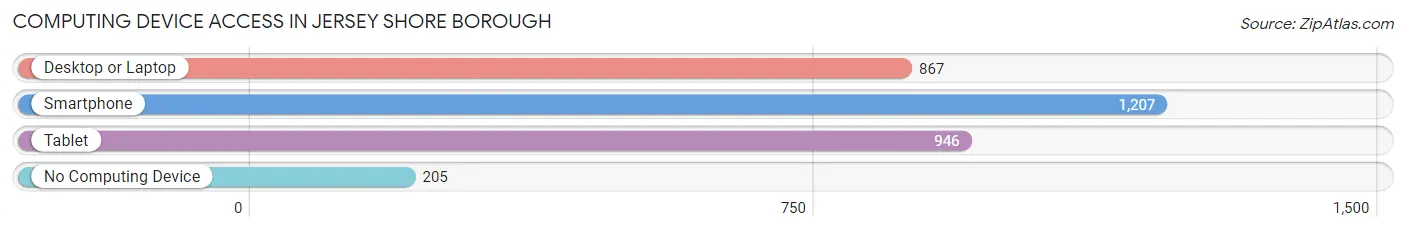
| Device Type | # Households | % Households |
| Desktop or Laptop | 867 | 57.8% |
| Smartphone | 1,207 | 80.4% |
| Tablet | 946 | 63.0% |
| No Computing Device | 205 | 13.7% |
| Total | 1,501 | 100.0% |
Internet Access in Jersey Shore borough
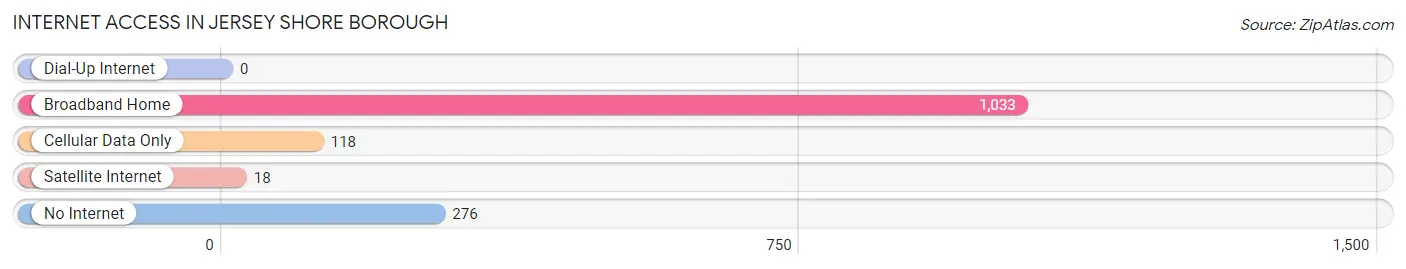
| Internet Type | # Households | % Households |
| Dial-Up Internet | 0 | 0.0% |
| Broadband Home | 1,033 | 68.8% |
| Cellular Data Only | 118 | 7.9% |
| Satellite Internet | 18 | 1.2% |
| No Internet | 276 | 18.4% |
| Total | 1,501 | 100.0% |
Jersey Shore borough Summary
Jersey Shore Borough is a small borough located in Lycoming County, Pennsylvania. It is situated along the West Branch of the Susquehanna River, approximately 10 miles north of Williamsport. The borough has a population of approximately 3,000 people and covers an area of 1.2 square miles.
History
The area that is now Jersey Shore Borough was first settled in the late 1700s by European settlers. The first settler was John McHenry, who arrived in 1795 and established a trading post. The area was originally part of Lycoming County, but was incorporated as a borough in 1864. The name of the borough was derived from the fact that the area was once a popular destination for vacationers from New Jersey.
The borough was an important transportation hub in the late 19th and early 20th centuries. The West Branch Canal, which ran through the borough, was an important transportation route for goods and passengers. The canal was eventually replaced by the Jersey Shore and Pine Creek Railroad, which ran through the borough until the 1950s.
Geography
Jersey Shore Borough is located in Lycoming County, Pennsylvania. It is situated along the West Branch of the Susquehanna River, approximately 10 miles north of Williamsport. The borough has a total area of 1.2 square miles, all of which is land. The borough is located in the Appalachian Mountains and is surrounded by forests and rolling hills.
The climate in Jersey Shore Borough is humid continental, with cold winters and hot, humid summers. The average annual temperature is 48°F, and the average annual precipitation is 40 inches.
Economy
The economy of Jersey Shore Borough is largely based on tourism and manufacturing. The borough is home to several tourist attractions, including the Jersey Shore Historical Society Museum, the Jersey Shore Arts Center, and the Jersey Shore Railroad Museum. The borough is also home to several manufacturing companies, including a paper mill, a plastics factory, and a metal fabrication plant.
Demographics
As of the 2010 census, the population of Jersey Shore Borough was 3,068. The racial makeup of the borough was 97.3% White, 0.7% African American, 0.3% Native American, 0.3% Asian, 0.2% from other races, and 1.2% from two or more races. Hispanic or Latino of any race were 1.2% of the population.
The median household income in Jersey Shore Borough was $37,917, and the median family income was $45,938. The per capita income was $19,945. About 11.2% of families and 14.2% of the population were below the poverty line, including 22.2% of those under age 18 and 8.2% of those age 65 or over.
Common Questions
What is Per Capita Income in Jersey Shore borough?
Per Capita income in Jersey Shore borough is $25,275.
What is the Median Family Income in Jersey Shore borough?
Median Family Income in Jersey Shore borough is $80,308.
What is the Median Household income in Jersey Shore borough?
Median Household Income in Jersey Shore borough is $65,286.
What is Income or Wage Gap in Jersey Shore borough?
Income or Wage Gap in Jersey Shore borough is 27.7%.
Women in Jersey Shore borough earn 72.3 cents for every dollar earned by a man.
What is Inequality or Gini Index in Jersey Shore borough?
Inequality or Gini Index in Jersey Shore borough is 0.34.
What is the Total Population of Jersey Shore borough?
Total Population of Jersey Shore borough is 4,160.
What is the Total Male Population of Jersey Shore borough?
Total Male Population of Jersey Shore borough is 2,258.
What is the Total Female Population of Jersey Shore borough?
Total Female Population of Jersey Shore borough is 1,902.
What is the Ratio of Males per 100 Females in Jersey Shore borough?
There are 118.72 Males per 100 Females in Jersey Shore borough.
What is the Ratio of Females per 100 Males in Jersey Shore borough?
There are 84.23 Females per 100 Males in Jersey Shore borough.
What is the Median Population Age in Jersey Shore borough?
Median Population Age in Jersey Shore borough is 38.1 Years.
What is the Average Family Size in Jersey Shore borough
Average Family Size in Jersey Shore borough is 3.3 People.
What is the Average Household Size in Jersey Shore borough
Average Household Size in Jersey Shore borough is 2.7 People.
How Large is the Labor Force in Jersey Shore borough?
There are 1,731 People in the Labor Forcein in Jersey Shore borough.
What is the Percentage of People in the Labor Force in Jersey Shore borough?
57.0% of People are in the Labor Force in Jersey Shore borough.
What is the Unemployment Rate in Jersey Shore borough?
Unemployment Rate in Jersey Shore borough is 4.9%.