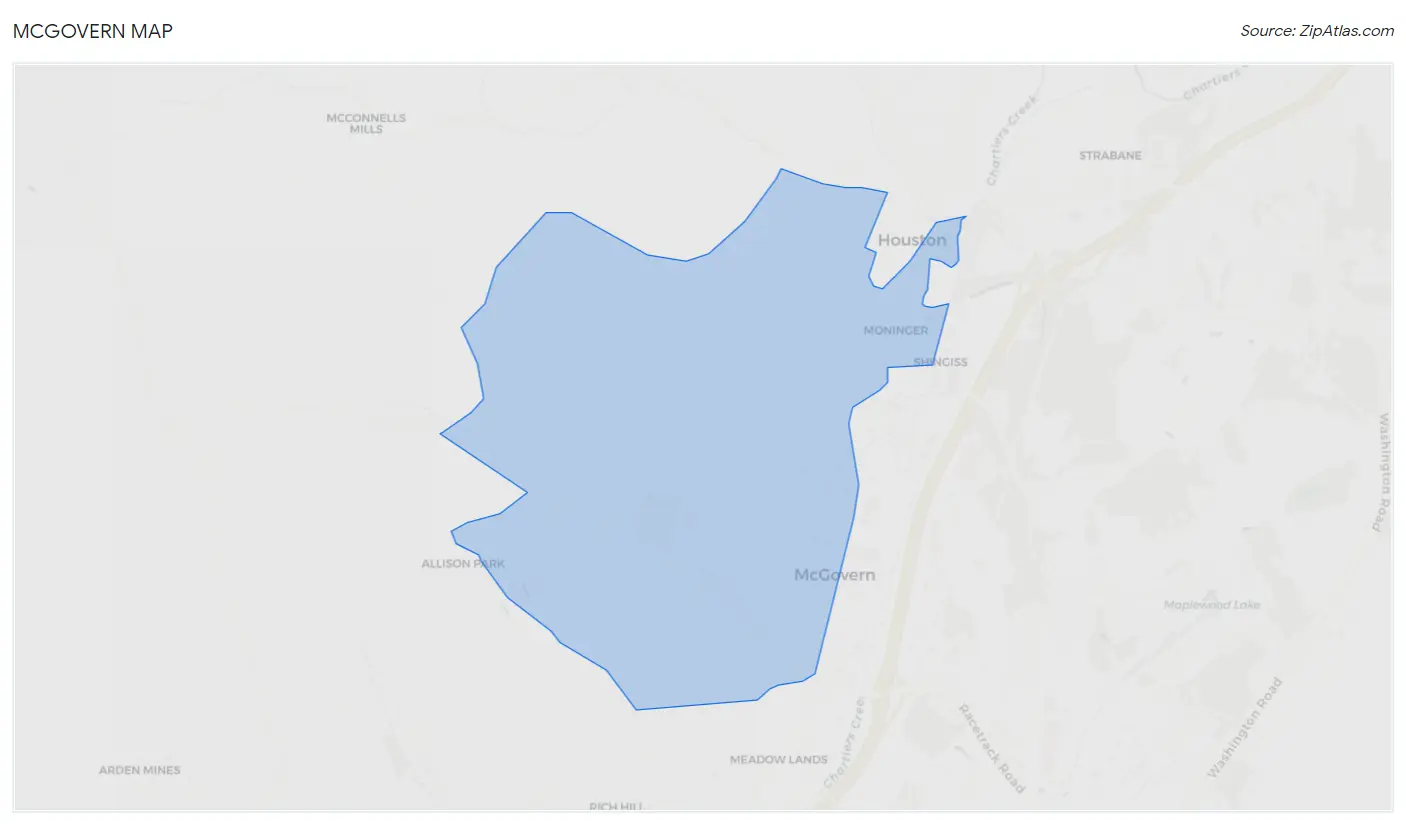
McGovern, PA Map & Demographics
McGovern Map
McGovern Overview
$56,370
PER CAPITA INCOME
$123,125
AVG FAMILY INCOME
$108,880
AVG HOUSEHOLD INCOME
31.0%
WAGE / INCOME GAP [ % ]
69.0¢/ $1
WAGE / INCOME GAP [ $ ]
0.37
INEQUALITY / GINI INDEX
4,194
TOTAL POPULATION
2,061
MALE POPULATION
2,133
FEMALE POPULATION
96.62
MALES / 100 FEMALES
103.49
FEMALES / 100 MALES
44.9
MEDIAN AGE
2.7
AVG FAMILY SIZE
2.4
AVG HOUSEHOLD SIZE
2,446
LABOR FORCE [ PEOPLE ]
69.2%
PERCENT IN LABOR FORCE
4.0%
UNEMPLOYMENT RATE
Income in McGovern
Income Overview in McGovern
Per Capita Income in McGovern is $56,370, while median incomes of families and households are $123,125 and $108,880 respectively.
| Characteristic | Number | Measure |
| Per Capita Income | 4,194 | $56,370 |
| Median Family Income | 1,388 | $123,125 |
| Mean Family Income | 1,388 | $152,377 |
| Median Household Income | 1,747 | $108,880 |
| Mean Household Income | 1,747 | $136,142 |
| Income Deficit | 1,388 | $0 |
| Wage / Income Gap (%) | 4,194 | 31.04% |
| Wage / Income Gap ($) | 4,194 | 68.96¢ per $1 |
| Gini / Inequality Index | 4,194 | 0.37 |
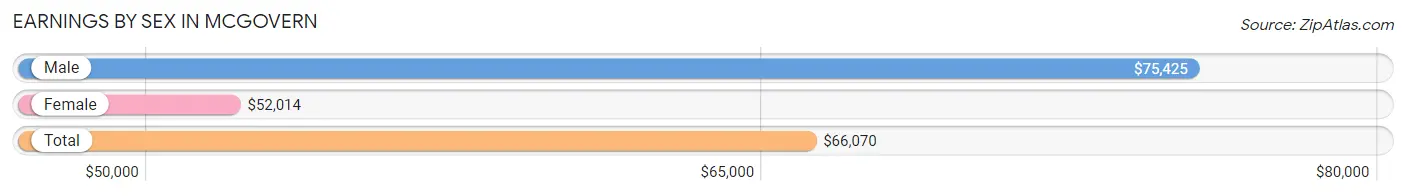
Earnings by Sex in McGovern
Average Earnings in McGovern are $66,070, $75,425 for men and $52,014 for women, a difference of 31.0%.
| Sex | Number | Average Earnings |
| Male | 1,324 (51.7%) | $75,425 |
| Female | 1,235 (48.3%) | $52,014 |
| Total | 2,559 (100.0%) | $66,070 |
Earnings by Sex by Income Bracket in McGovern
The most common earnings brackets in McGovern are $100,000+ for men (383 | 28.9%) and $100,000+ for women (247 | 20.0%).
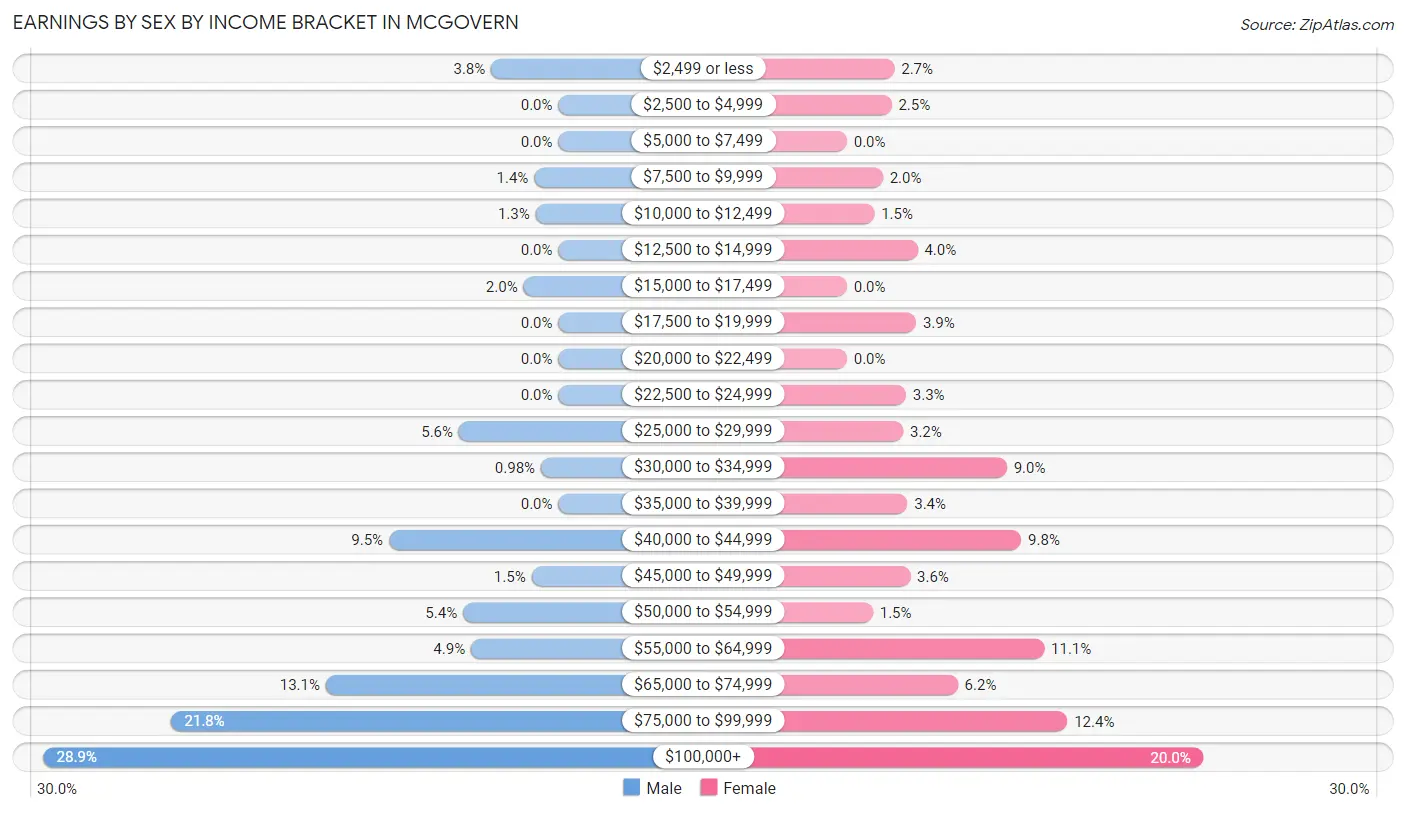
| Income | Male | Female |
| $2,499 or less | 50 (3.8%) | 33 (2.7%) |
| $2,500 to $4,999 | 0 (0.0%) | 31 (2.5%) |
| $5,000 to $7,499 | 0 (0.0%) | 0 (0.0%) |
| $7,500 to $9,999 | 18 (1.4%) | 25 (2.0%) |
| $10,000 to $12,499 | 17 (1.3%) | 19 (1.5%) |
| $12,500 to $14,999 | 0 (0.0%) | 49 (4.0%) |
| $15,000 to $17,499 | 26 (2.0%) | 0 (0.0%) |
| $17,500 to $19,999 | 0 (0.0%) | 48 (3.9%) |
| $20,000 to $22,499 | 0 (0.0%) | 0 (0.0%) |
| $22,500 to $24,999 | 0 (0.0%) | 41 (3.3%) |
| $25,000 to $29,999 | 74 (5.6%) | 39 (3.2%) |
| $30,000 to $34,999 | 13 (1.0%) | 111 (9.0%) |
| $35,000 to $39,999 | 0 (0.0%) | 42 (3.4%) |
| $40,000 to $44,999 | 126 (9.5%) | 121 (9.8%) |
| $45,000 to $49,999 | 20 (1.5%) | 44 (3.6%) |
| $50,000 to $54,999 | 71 (5.4%) | 18 (1.5%) |
| $55,000 to $64,999 | 65 (4.9%) | 137 (11.1%) |
| $65,000 to $74,999 | 173 (13.1%) | 77 (6.2%) |
| $75,000 to $99,999 | 288 (21.7%) | 153 (12.4%) |
| $100,000+ | 383 (28.9%) | 247 (20.0%) |
| Total | 1,324 (100.0%) | 1,235 (100.0%) |
Earnings by Sex by Educational Attainment in McGovern
Average earnings in McGovern are $77,907 for men and $56,182 for women, a difference of 27.9%. Men with an educational attainment of graduate degree enjoy the highest average annual earnings of $115,962, while those with high school diploma education earn the least with $66,250. Women with an educational attainment of bachelor's degree earn the most with the average annual earnings of $78,750, while those with high school diploma education have the smallest earnings of $17,891.
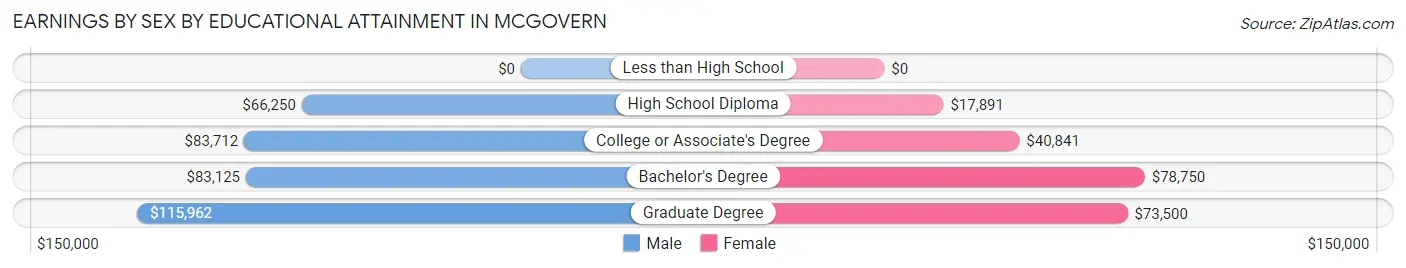
| Educational Attainment | Male Income | Female Income |
| Less than High School | - | - |
| High School Diploma | $66,250 | $17,891 |
| College or Associate's Degree | $83,712 | $40,841 |
| Bachelor's Degree | $83,125 | $78,750 |
| Graduate Degree | $115,962 | $73,500 |
| Total | $77,907 | $56,182 |
Family Income in McGovern
Family Income Brackets in McGovern
According to the McGovern family income data, there are 341 families falling into the $100,000 to $149,999 income range, which is the most common income bracket and makes up 24.6% of all families.
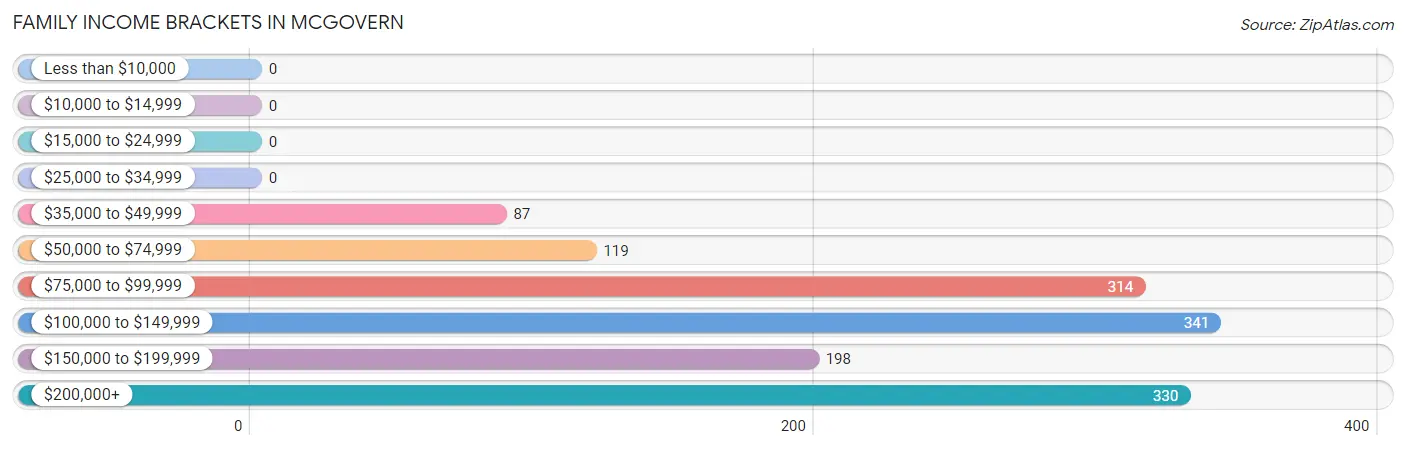
| Income Bracket | # Families | % Families |
| Less than $10,000 | 0 | 0.0% |
| $10,000 to $14,999 | 0 | 0.0% |
| $15,000 to $24,999 | 0 | 0.0% |
| $25,000 to $34,999 | 0 | 0.0% |
| $35,000 to $49,999 | 87 | 6.3% |
| $50,000 to $74,999 | 119 | 8.6% |
| $75,000 to $99,999 | 314 | 22.6% |
| $100,000 to $149,999 | 341 | 24.6% |
| $150,000 to $199,999 | 198 | 14.3% |
| $200,000+ | 330 | 23.8% |
Family Income by Famaliy Size in McGovern
6-person families (58 | 4.2%) account for the highest median family income in McGovern with $207,583 per family, while 2-person families (756 | 54.5%) have the highest median income of $59,528 per family member.
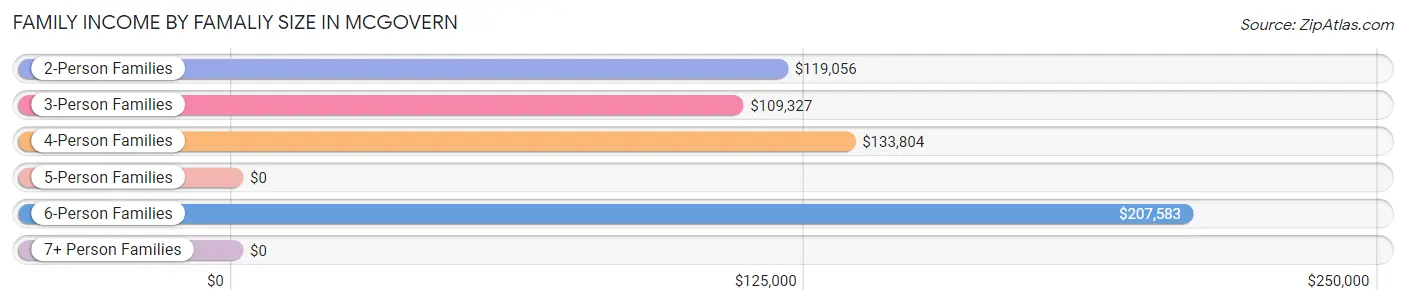
| Income Bracket | # Families | Median Income |
| 2-Person Families | 756 (54.5%) | $119,056 |
| 3-Person Families | 374 (27.0%) | $109,327 |
| 4-Person Families | 200 (14.4%) | $133,804 |
| 5-Person Families | 0 (0.0%) | $0 |
| 6-Person Families | 58 (4.2%) | $207,583 |
| 7+ Person Families | 0 (0.0%) | $0 |
| Total | 1,388 (100.0%) | $123,125 |
Family Income by Number of Earners in McGovern
The median family income in McGovern is $123,125, with families comprising 3+ earners (158) having the highest median family income of $176,646, while families with no earners (200) have the lowest median family income of $75,988, accounting for 11.4% and 14.4% of families, respectively.
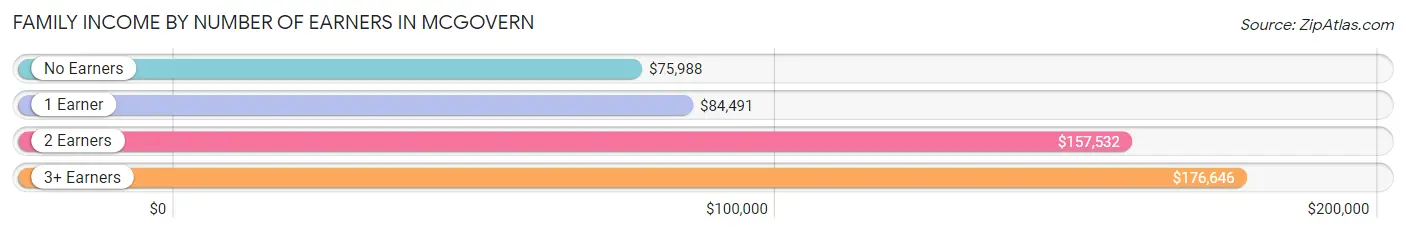
| Number of Earners | # Families | Median Income |
| No Earners | 200 (14.4%) | $75,988 |
| 1 Earner | 255 (18.4%) | $84,491 |
| 2 Earners | 775 (55.8%) | $157,532 |
| 3+ Earners | 158 (11.4%) | $176,646 |
| Total | 1,388 (100.0%) | $123,125 |
Household Income in McGovern
Household Income Brackets in McGovern
With 409 households falling in the category, the $100,000 to $149,999 income range is the most frequent in McGovern, accounting for 23.4% of all households.
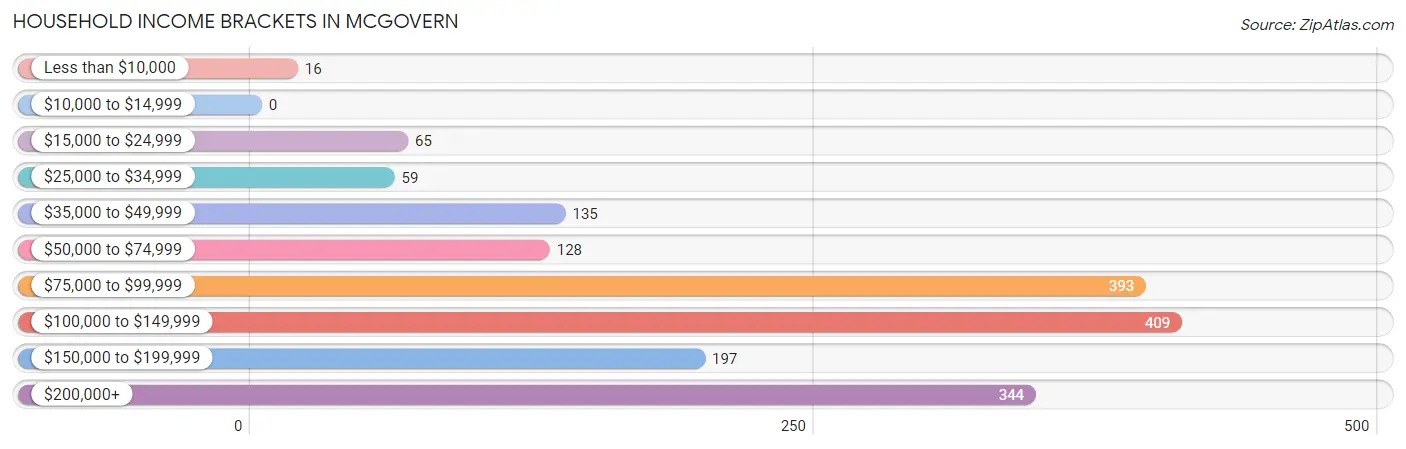
| Income Bracket | # Households | % Households |
| Less than $10,000 | 16 | 0.9% |
| $10,000 to $14,999 | 0 | 0.0% |
| $15,000 to $24,999 | 65 | 3.7% |
| $25,000 to $34,999 | 59 | 3.4% |
| $35,000 to $49,999 | 135 | 7.7% |
| $50,000 to $74,999 | 128 | 7.3% |
| $75,000 to $99,999 | 393 | 22.5% |
| $100,000 to $149,999 | 409 | 23.4% |
| $150,000 to $199,999 | 197 | 11.3% |
| $200,000+ | 344 | 19.7% |
Household Income by Householder Age in McGovern
The median household income in McGovern is $108,880, with the highest median household income of $177,281 found in the 45 to 64 years age bracket for the primary householder. A total of 664 households (38.0%) fall into this category.
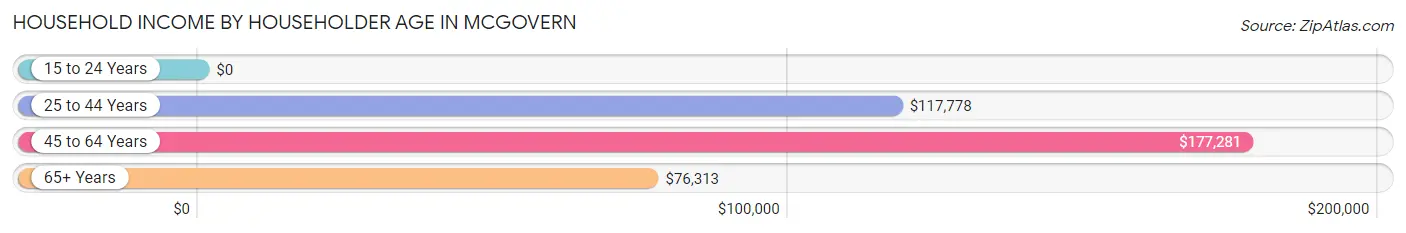
| Income Bracket | # Households | Median Income |
| 15 to 24 Years | 0 (0.0%) | $0 |
| 25 to 44 Years | 572 (32.7%) | $117,778 |
| 45 to 64 Years | 664 (38.0%) | $177,281 |
| 65+ Years | 511 (29.2%) | $76,313 |
| Total | 1,747 (100.0%) | $108,880 |
Poverty in McGovern
Income Below Poverty by Sex and Age in McGovern
With 0.8% poverty level for males and 0.9% for females among the residents of McGovern, 65 to 74 year old males and 55 to 64 year old females are the most vulnerable to poverty, with 16 males (5.1%) and 20 females (4.5%) in their respective age groups living below the poverty level.
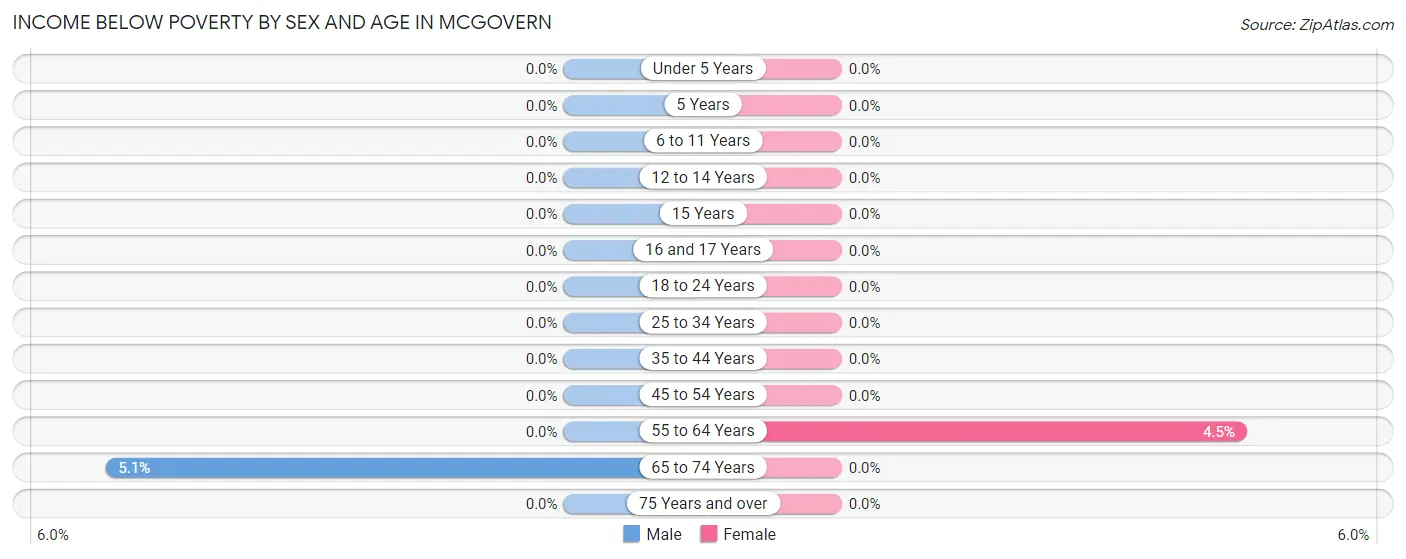
| Age Bracket | Male | Female |
| Under 5 Years | 0 (0.0%) | 0 (0.0%) |
| 5 Years | 0 (0.0%) | 0 (0.0%) |
| 6 to 11 Years | 0 (0.0%) | 0 (0.0%) |
| 12 to 14 Years | 0 (0.0%) | 0 (0.0%) |
| 15 Years | 0 (0.0%) | 0 (0.0%) |
| 16 and 17 Years | 0 (0.0%) | 0 (0.0%) |
| 18 to 24 Years | 0 (0.0%) | 0 (0.0%) |
| 25 to 34 Years | 0 (0.0%) | 0 (0.0%) |
| 35 to 44 Years | 0 (0.0%) | 0 (0.0%) |
| 45 to 54 Years | 0 (0.0%) | 0 (0.0%) |
| 55 to 64 Years | 0 (0.0%) | 20 (4.5%) |
| 65 to 74 Years | 16 (5.1%) | 0 (0.0%) |
| 75 Years and over | 0 (0.0%) | 0 (0.0%) |
| Total | 16 (0.8%) | 20 (0.9%) |
Income Above Poverty by Sex and Age in McGovern
According to the poverty statistics in McGovern, males aged under 5 years and females aged under 5 years are the age groups that are most secure financially, with 100.0% of males and 100.0% of females in these age groups living above the poverty line.
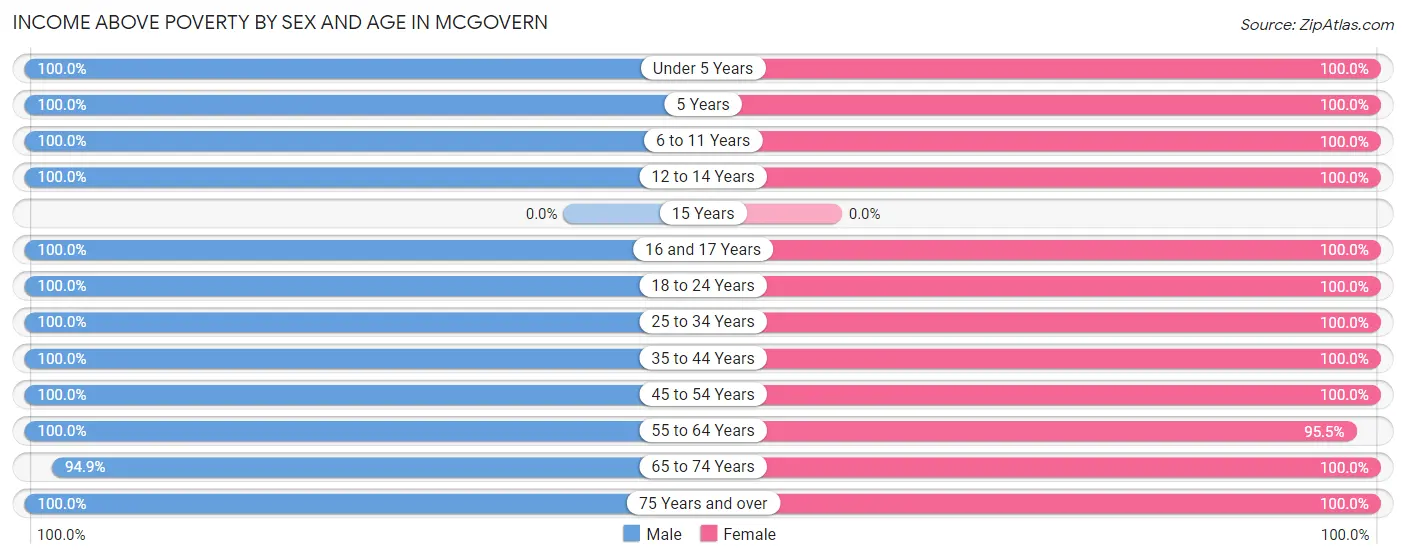
| Age Bracket | Male | Female |
| Under 5 Years | 108 (100.0%) | 81 (100.0%) |
| 5 Years | 33 (100.0%) | 10 (100.0%) |
| 6 to 11 Years | 176 (100.0%) | 113 (100.0%) |
| 12 to 14 Years | 105 (100.0%) | 34 (100.0%) |
| 15 Years | 0 (0.0%) | 0 (0.0%) |
| 16 and 17 Years | 21 (100.0%) | 98 (100.0%) |
| 18 to 24 Years | 115 (100.0%) | 19 (100.0%) |
| 25 to 34 Years | 300 (100.0%) | 336 (100.0%) |
| 35 to 44 Years | 247 (100.0%) | 304 (100.0%) |
| 45 to 54 Years | 273 (100.0%) | 260 (100.0%) |
| 55 to 64 Years | 270 (100.0%) | 423 (95.5%) |
| 65 to 74 Years | 298 (94.9%) | 315 (100.0%) |
| 75 Years and over | 99 (100.0%) | 120 (100.0%) |
| Total | 2,045 (99.2%) | 2,113 (99.1%) |
Income Below Poverty Among Married-Couple Families in McGovern
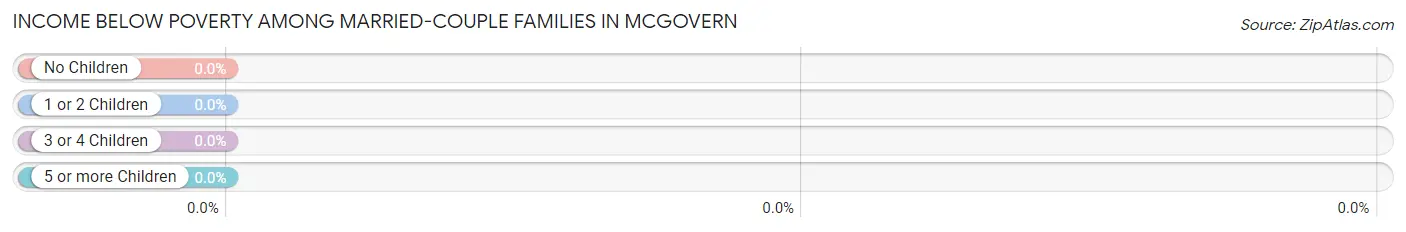
| Children | Above Poverty | Below Poverty |
| No Children | 827 (100.0%) | 0 (0.0%) |
| 1 or 2 Children | 379 (100.0%) | 0 (0.0%) |
| 3 or 4 Children | 18 (100.0%) | 0 (0.0%) |
| 5 or more Children | 0 (0.0%) | 0 (0.0%) |
| Total | 1,224 (100.0%) | 0 (0.0%) |
Income Below Poverty Among Single-Parent Households in McGovern
| Children | Single Father | Single Mother |
| No Children | 0 (0.0%) | 0 (0.0%) |
| 1 or 2 Children | 0 (0.0%) | 0 (0.0%) |
| 3 or 4 Children | 0 (0.0%) | 0 (0.0%) |
| 5 or more Children | 0 (0.0%) | 0 (0.0%) |
| Total | 0 (0.0%) | 0 (0.0%) |
Income Below Poverty Among Married-Couple vs Single-Parent Households in McGovern
| Children | Married-Couple Families | Single-Parent Households |
| No Children | 0 (0.0%) | 0 (0.0%) |
| 1 or 2 Children | 0 (0.0%) | 0 (0.0%) |
| 3 or 4 Children | 0 (0.0%) | 0 (0.0%) |
| 5 or more Children | 0 (0.0%) | 0 (0.0%) |
| Total | 0 (0.0%) | 0 (0.0%) |
Race in McGovern
The most populous races in McGovern are White / Caucasian (4,108 | 98.0%), Black / African American (73 | 1.7%), and Hispanic or Latino (70 | 1.7%).
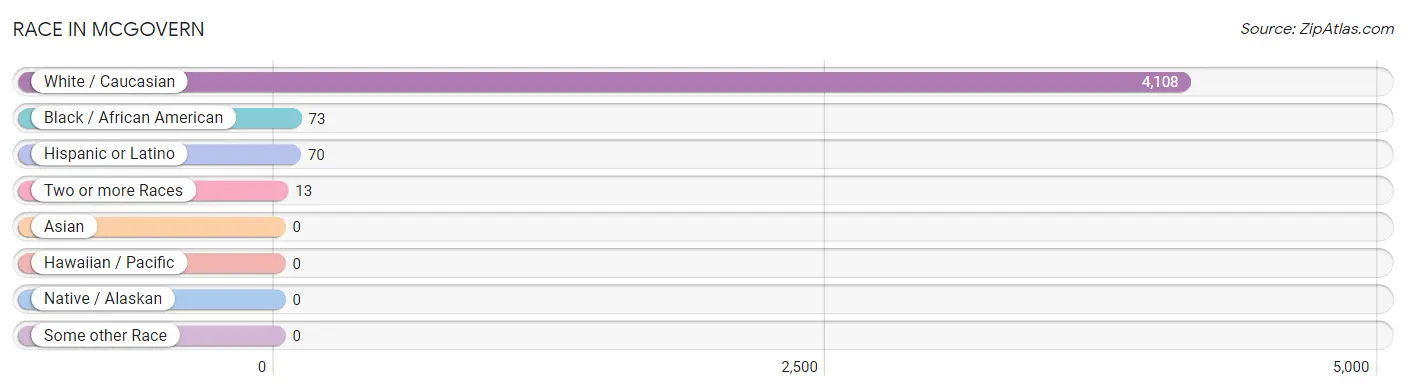
| Race | # Population | % Population |
| Asian | 0 | 0.0% |
| Black / African American | 73 | 1.7% |
| Hawaiian / Pacific | 0 | 0.0% |
| Hispanic or Latino | 70 | 1.7% |
| Native / Alaskan | 0 | 0.0% |
| White / Caucasian | 4,108 | 98.0% |
| Two or more Races | 13 | 0.3% |
| Some other Race | 0 | 0.0% |
| Total | 4,194 | 100.0% |
Ancestry in McGovern
The most populous ancestries reported in McGovern are German (887 | 21.1%), Italian (808 | 19.3%), Irish (590 | 14.1%), English (580 | 13.8%), and Polish (214 | 5.1%), together accounting for 73.4% of all McGovern residents.
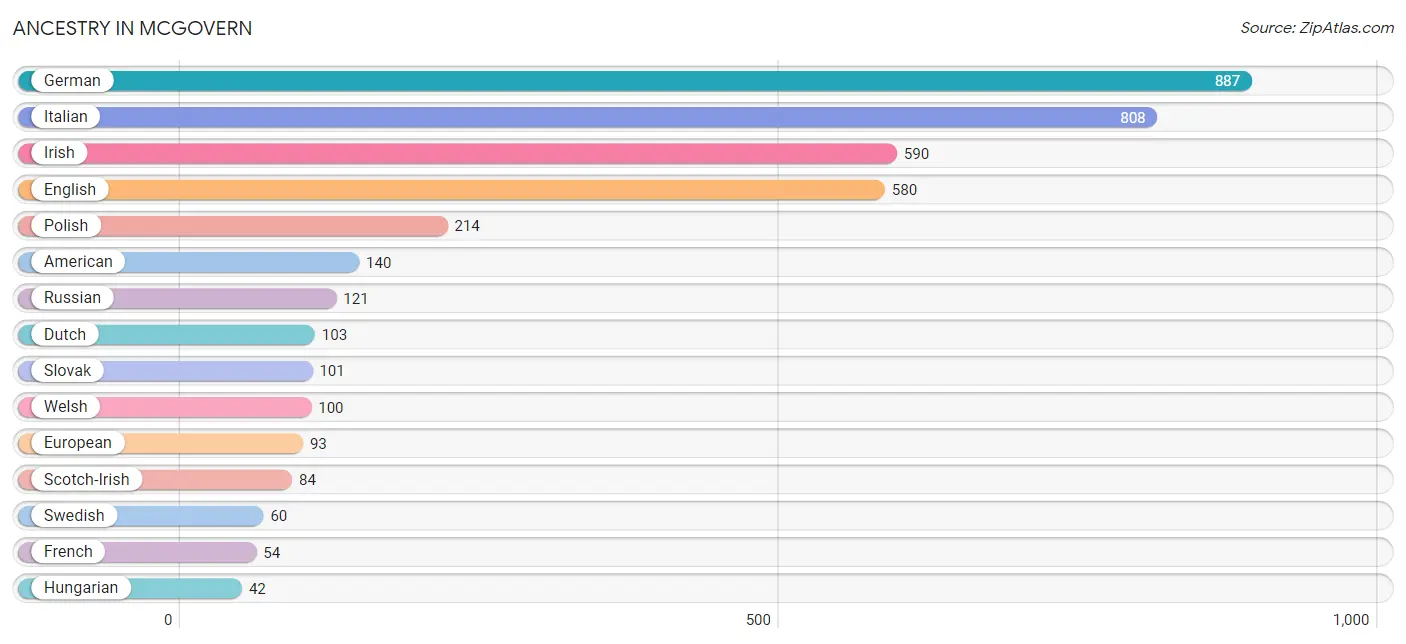
| Ancestry | # Population | % Population |
| American | 140 | 3.3% |
| Arab | 18 | 0.4% |
| Argentinean | 32 | 0.8% |
| British | 14 | 0.3% |
| Canadian | 16 | 0.4% |
| Cuban | 13 | 0.3% |
| Czech | 16 | 0.4% |
| Dutch | 103 | 2.5% |
| Eastern European | 19 | 0.4% |
| English | 580 | 13.8% |
| European | 93 | 2.2% |
| French | 54 | 1.3% |
| French Canadian | 16 | 0.4% |
| German | 887 | 21.1% |
| Hungarian | 42 | 1.0% |
| Irish | 590 | 14.1% |
| Italian | 808 | 19.3% |
| Lithuanian | 29 | 0.7% |
| Mexican | 13 | 0.3% |
| Polish | 214 | 5.1% |
| Puerto Rican | 12 | 0.3% |
| Russian | 121 | 2.9% |
| Scotch-Irish | 84 | 2.0% |
| Scottish | 37 | 0.9% |
| Slovak | 101 | 2.4% |
| Slovene | 30 | 0.7% |
| South American | 32 | 0.8% |
| Swedish | 60 | 1.4% |
| Ukrainian | 11 | 0.3% |
| Welsh | 100 | 2.4% | View All 30 Rows |
Immigrants in McGovern
The most numerous immigrant groups reported in McGovern came from Eastern Europe (45 | 1.1%), Europe (45 | 1.1%), Poland (34 | 0.8%), Argentina (32 | 0.8%), and Latin America (32 | 0.8%), together accounting for 4.5% of all McGovern residents.
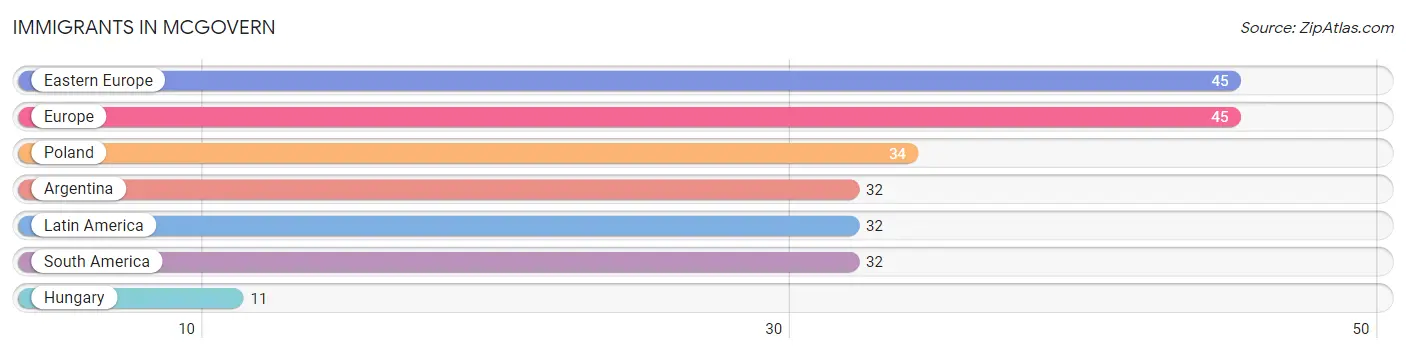
| Immigration Origin | # Population | % Population |
| Argentina | 32 | 0.8% |
| Eastern Europe | 45 | 1.1% |
| Europe | 45 | 1.1% |
| Hungary | 11 | 0.3% |
| Latin America | 32 | 0.8% |
| Poland | 34 | 0.8% |
| South America | 32 | 0.8% | View All 7 Rows |
Sex and Age in McGovern
Sex and Age in McGovern
The most populous age groups in McGovern are 55 to 59 Years (221 | 10.7%) for men and 55 to 59 Years (255 | 11.9%) for women.
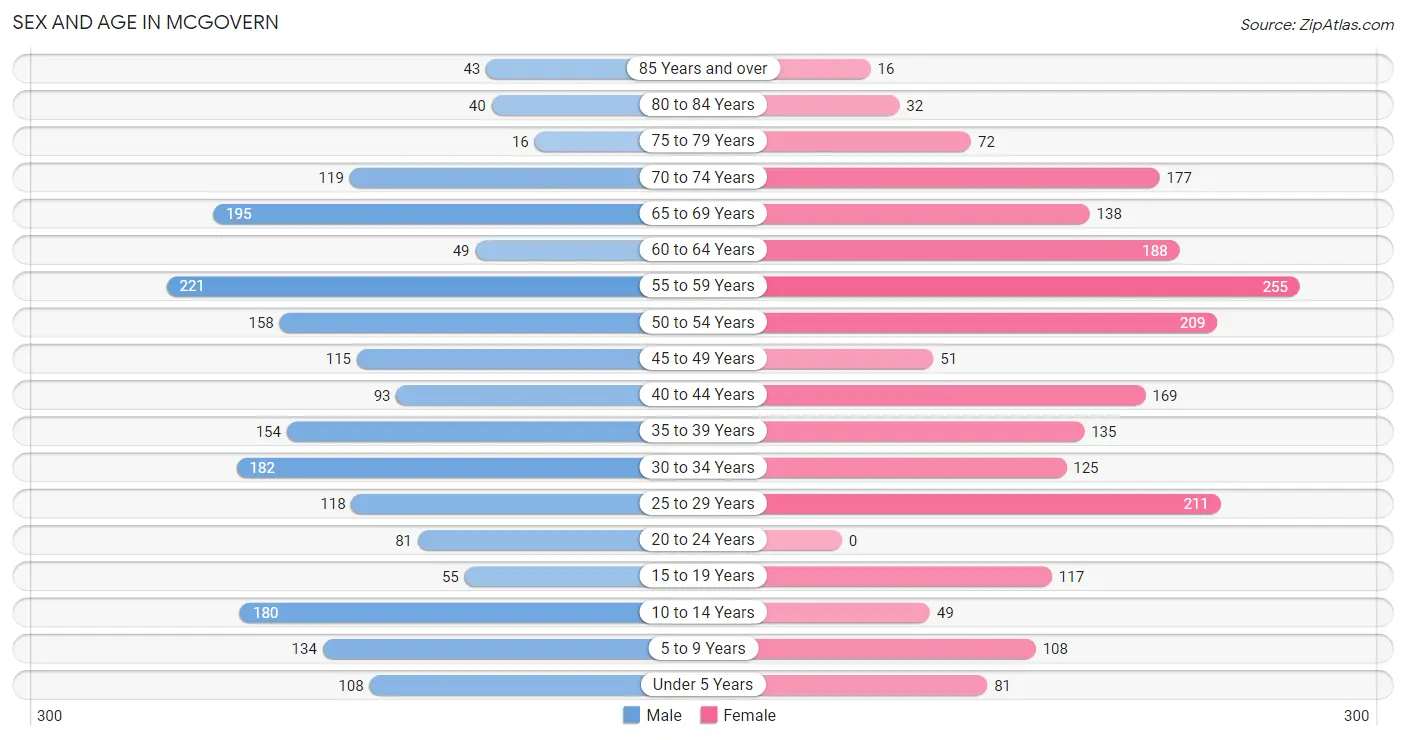
| Age Bracket | Male | Female |
| Under 5 Years | 108 (5.2%) | 81 (3.8%) |
| 5 to 9 Years | 134 (6.5%) | 108 (5.1%) |
| 10 to 14 Years | 180 (8.7%) | 49 (2.3%) |
| 15 to 19 Years | 55 (2.7%) | 117 (5.5%) |
| 20 to 24 Years | 81 (3.9%) | 0 (0.0%) |
| 25 to 29 Years | 118 (5.7%) | 211 (9.9%) |
| 30 to 34 Years | 182 (8.8%) | 125 (5.9%) |
| 35 to 39 Years | 154 (7.5%) | 135 (6.3%) |
| 40 to 44 Years | 93 (4.5%) | 169 (7.9%) |
| 45 to 49 Years | 115 (5.6%) | 51 (2.4%) |
| 50 to 54 Years | 158 (7.7%) | 209 (9.8%) |
| 55 to 59 Years | 221 (10.7%) | 255 (11.9%) |
| 60 to 64 Years | 49 (2.4%) | 188 (8.8%) |
| 65 to 69 Years | 195 (9.5%) | 138 (6.5%) |
| 70 to 74 Years | 119 (5.8%) | 177 (8.3%) |
| 75 to 79 Years | 16 (0.8%) | 72 (3.4%) |
| 80 to 84 Years | 40 (1.9%) | 32 (1.5%) |
| 85 Years and over | 43 (2.1%) | 16 (0.7%) |
| Total | 2,061 (100.0%) | 2,133 (100.0%) |
Families and Households in McGovern
Median Family Size in McGovern
The median family size in McGovern is 2.72 persons per family, with single male/father families (43 | 3.1%) accounting for the largest median family size of 3.02 persons per family. On the other hand, single female/mother families (121 | 8.7%) represent the smallest median family size with 2.60 persons per family.
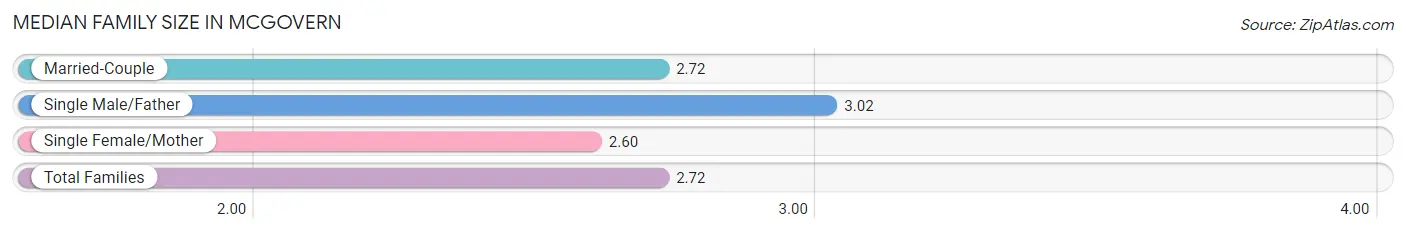
| Family Type | # Families | Family Size |
| Married-Couple | 1,224 (88.2%) | 2.72 |
| Single Male/Father | 43 (3.1%) | 3.02 |
| Single Female/Mother | 121 (8.7%) | 2.60 |
| Total Families | 1,388 (100.0%) | 2.72 |
Median Household Size in McGovern
The median household size in McGovern is 2.40 persons per household, with single male/father households (43 | 2.5%) accounting for the largest median household size of 3.56 persons per household. non-family households (359 | 20.5%) represent the smallest median household size with 1.11 persons per household.
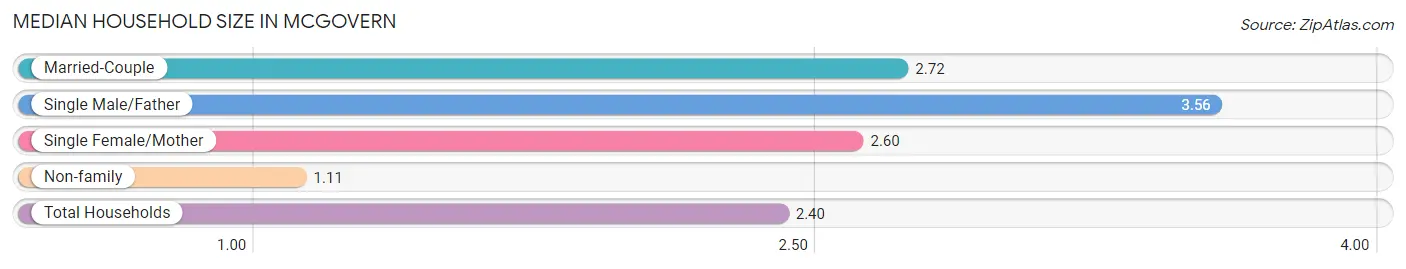
| Household Type | # Households | Household Size |
| Married-Couple | 1,224 (70.1%) | 2.72 |
| Single Male/Father | 43 (2.5%) | 3.56 |
| Single Female/Mother | 121 (6.9%) | 2.60 |
| Non-family | 359 (20.5%) | 1.11 |
| Total Households | 1,747 (100.0%) | 2.40 |
Household Size by Marriage Status in McGovern
Out of a total of 1,747 households in McGovern, 1,388 (79.4%) are family households, while 359 (20.5%) are nonfamily households. The most numerous type of family households are 2-person households, comprising 756, and the most common type of nonfamily households are 1-person households, comprising 323.
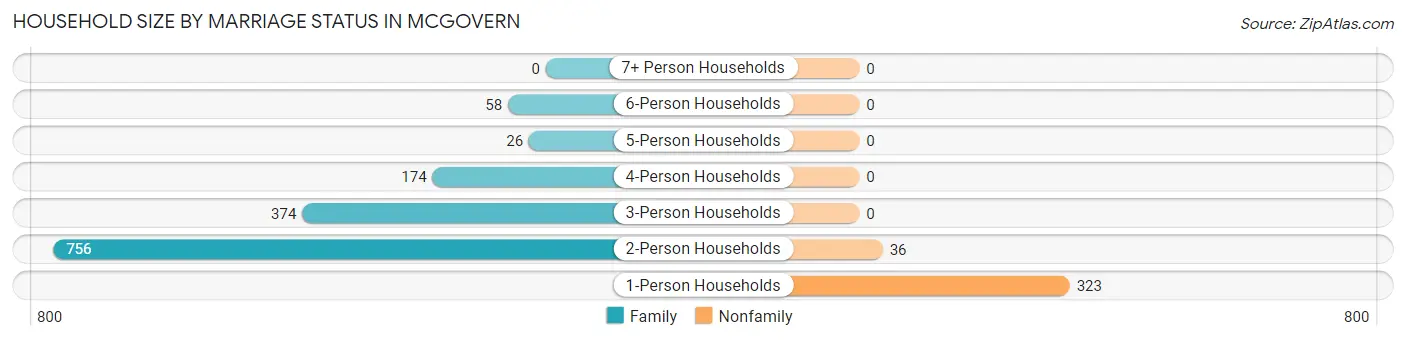
| Household Size | Family Households | Nonfamily Households |
| 1-Person Households | - | 323 (18.5%) |
| 2-Person Households | 756 (43.3%) | 36 (2.1%) |
| 3-Person Households | 374 (21.4%) | 0 (0.0%) |
| 4-Person Households | 174 (10.0%) | 0 (0.0%) |
| 5-Person Households | 26 (1.5%) | 0 (0.0%) |
| 6-Person Households | 58 (3.3%) | 0 (0.0%) |
| 7+ Person Households | 0 (0.0%) | 0 (0.0%) |
| Total | 1,388 (79.4%) | 359 (20.5%) |
Female Fertility in McGovern
Fertility by Age in McGovern
Average fertility rate in McGovern is 88.0 births per 1,000 women. Women in the age bracket of 20 to 34 years have the highest fertility rate with 223.0 births per 1,000 women. Women in the age bracket of 20 to 34 years acount for 100.0% of all women with births.
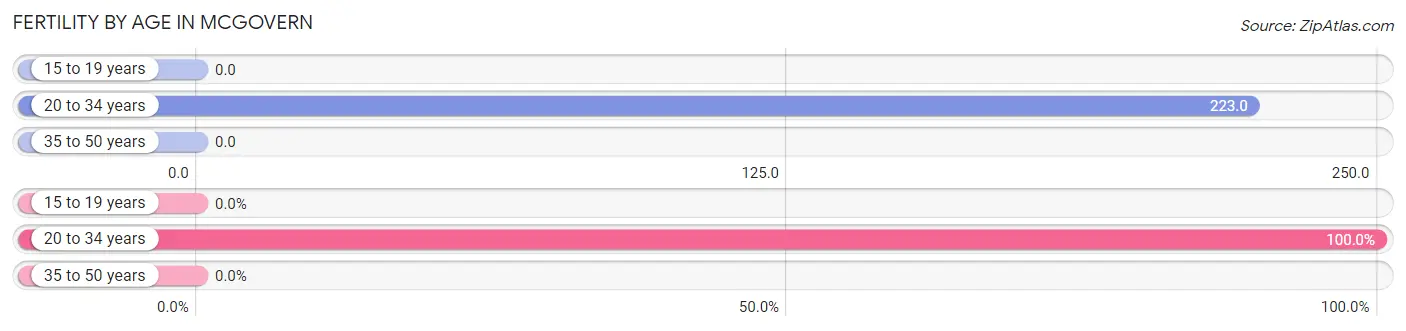
| Age Bracket | Women with Births | Births / 1,000 Women |
| 15 to 19 years | 0 (0.0%) | 0.0 |
| 20 to 34 years | 75 (100.0%) | 223.0 |
| 35 to 50 years | 0 (0.0%) | 0.0 |
| Total | 75 (100.0%) | 88.0 |
Fertility by Age by Marriage Status in McGovern
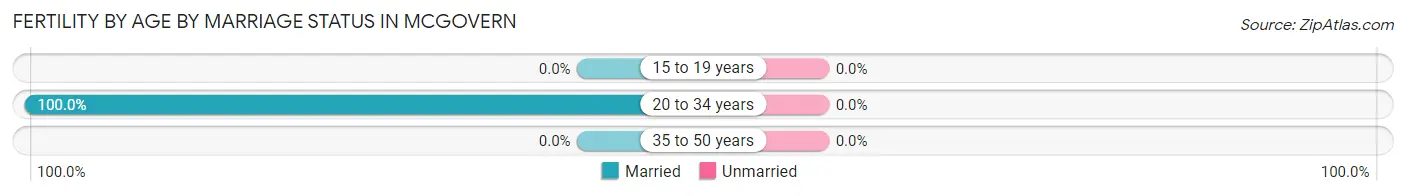
| Age Bracket | Married | Unmarried |
| 15 to 19 years | 0 (0.0%) | 0 (0.0%) |
| 20 to 34 years | 75 (100.0%) | 0 (0.0%) |
| 35 to 50 years | 0 (0.0%) | 0 (0.0%) |
| Total | 75 (100.0%) | 0 (0.0%) |
Fertility by Education in McGovern
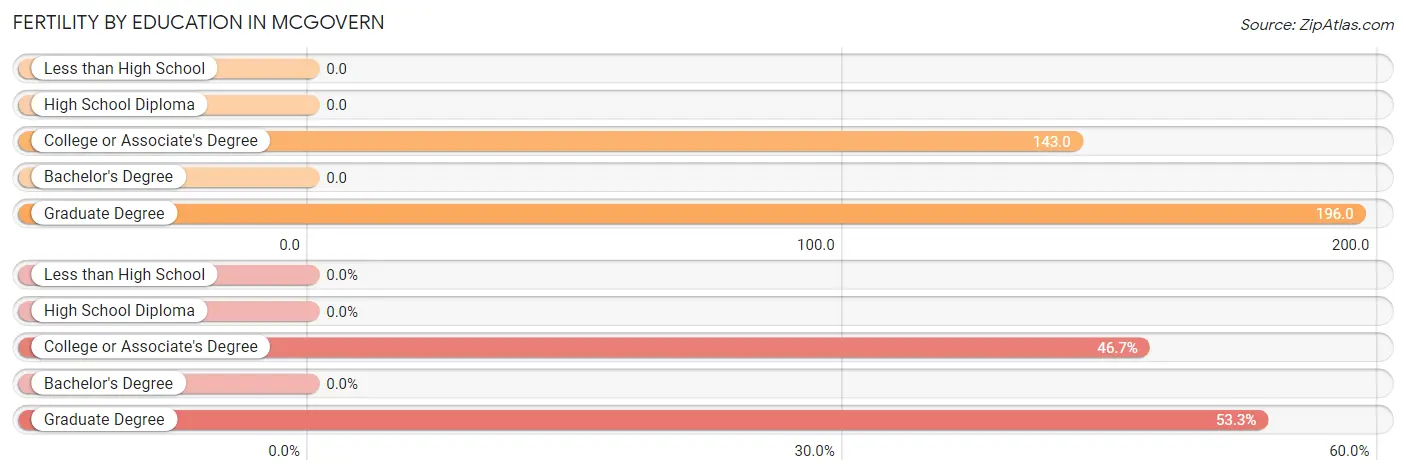
| Educational Attainment | Women with Births | Births / 1,000 Women |
| Less than High School | 0 (0.0%) | 0.0 |
| High School Diploma | 0 (0.0%) | 0.0 |
| College or Associate's Degree | 35 (46.7%) | 143.0 |
| Bachelor's Degree | 0 (0.0%) | 0.0 |
| Graduate Degree | 40 (53.3%) | 196.0 |
| Total | 75 (100.0%) | 88.0 |
Fertility by Education by Marriage Status in McGovern
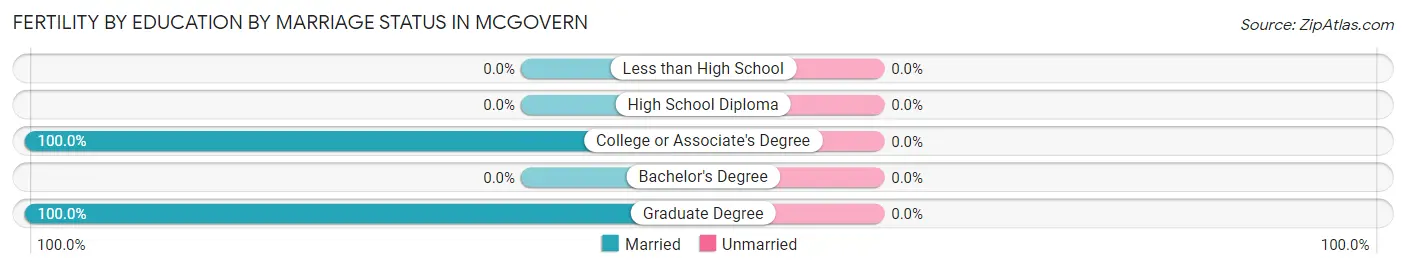
| Educational Attainment | Married | Unmarried |
| Less than High School | 0 (0.0%) | 0 (0.0%) |
| High School Diploma | 0 (0.0%) | 0 (0.0%) |
| College or Associate's Degree | 35 (100.0%) | 0 (0.0%) |
| Bachelor's Degree | 0 (0.0%) | 0 (0.0%) |
| Graduate Degree | 40 (100.0%) | 0 (0.0%) |
| Total | 75 (100.0%) | 0 (0.0%) |
Employment Characteristics in McGovern
Employment by Class of Employer in McGovern
Among the 2,306 employed individuals in McGovern, private company employees (1,566 | 67.9%), local government employees (284 | 12.3%), and not-for-profit organizations (251 | 10.9%) make up the most common classes of employment.
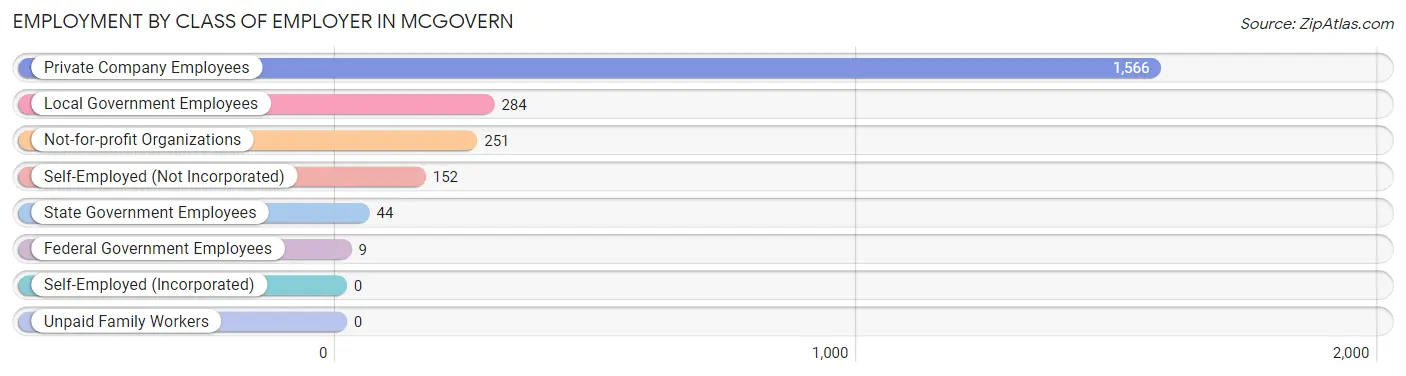
| Employer Class | # Employees | % Employees |
| Private Company Employees | 1,566 | 67.9% |
| Self-Employed (Incorporated) | 0 | 0.0% |
| Self-Employed (Not Incorporated) | 152 | 6.6% |
| Not-for-profit Organizations | 251 | 10.9% |
| Local Government Employees | 284 | 12.3% |
| State Government Employees | 44 | 1.9% |
| Federal Government Employees | 9 | 0.4% |
| Unpaid Family Workers | 0 | 0.0% |
| Total | 2,306 | 100.0% |
Employment Status by Age in McGovern
According to the labor force statistics for McGovern, out of the total population over 16 years of age (3,534), 69.2% or 2,446 individuals are in the labor force, with 4.0% or 98 of them unemployed. The age group with the highest labor force participation rate is 20 to 24 years, with 100.0% or 81 individuals in the labor force. Within the labor force, the 35 to 44 years age range has the highest percentage of unemployed individuals, with 12.8% or 67 of them being unemployed.
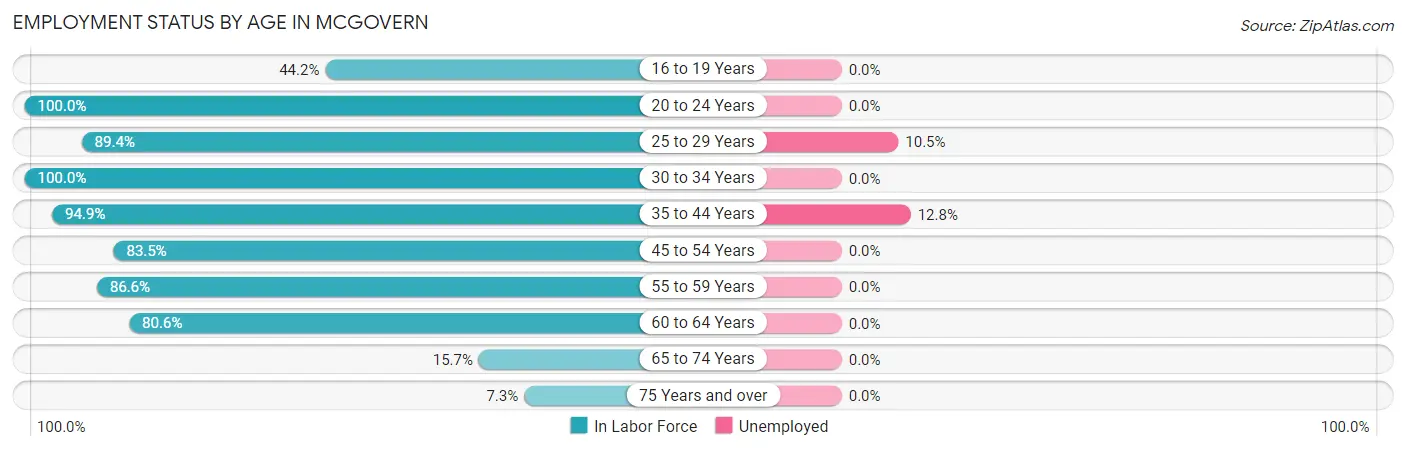
| Age Bracket | In Labor Force | Unemployed |
| 16 to 19 Years | 76 (44.2%) | 0 (0.0%) |
| 20 to 24 Years | 81 (100.0%) | 0 (0.0%) |
| 25 to 29 Years | 294 (89.4%) | 31 (10.5%) |
| 30 to 34 Years | 307 (100.0%) | 0 (0.0%) |
| 35 to 44 Years | 523 (94.9%) | 67 (12.8%) |
| 45 to 54 Years | 445 (83.5%) | 0 (0.0%) |
| 55 to 59 Years | 412 (86.6%) | 0 (0.0%) |
| 60 to 64 Years | 191 (80.6%) | 0 (0.0%) |
| 65 to 74 Years | 99 (15.7%) | 0 (0.0%) |
| 75 Years and over | 16 (7.3%) | 0 (0.0%) |
| Total | 2,446 (69.2%) | 98 (4.0%) |
Employment Status by Educational Attainment in McGovern
According to labor force statistics for McGovern, 89.3% of individuals (2,173) out of the total population between 25 and 64 years of age (2,433) are in the labor force, with 4.5% or 98 of them being unemployed. The group with the highest labor force participation rate are those with the educational attainment of bachelor's degree or higher, with 96.2% or 1,118 individuals in the labor force. Within the labor force, individuals with bachelor's degree or higher education have the highest percentage of unemployment, with 6.0% or 67 of them being unemployed.
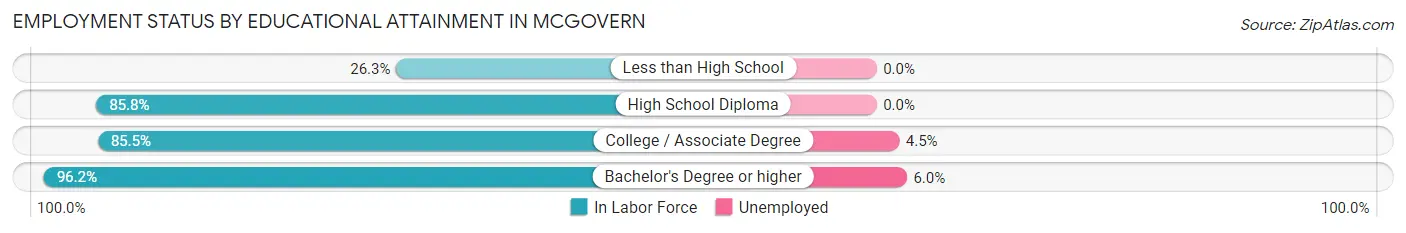
| Educational Attainment | In Labor Force | Unemployed |
| Less than High School | 15 (26.3%) | 0 (0.0%) |
| High School Diploma | 344 (85.8%) | 0 (0.0%) |
| College / Associate Degree | 695 (85.5%) | 37 (4.5%) |
| Bachelor's Degree or higher | 1,118 (96.2%) | 70 (6.0%) |
| Total | 2,173 (89.3%) | 109 (4.5%) |
Employment Occupations by Sex in McGovern
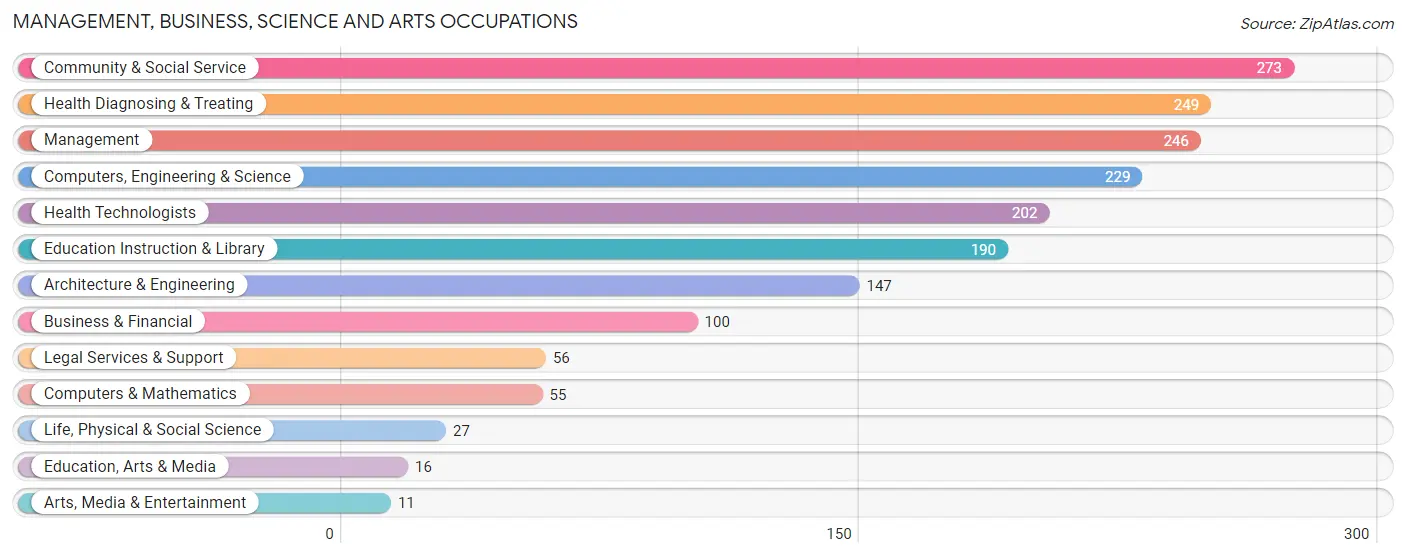
Management, Business, Science and Arts Occupations
The most common Management, Business, Science and Arts occupations in McGovern are Community & Social Service (273 | 11.7%), Health Diagnosing & Treating (249 | 10.6%), Management (246 | 10.5%), Computers, Engineering & Science (229 | 9.8%), and Health Technologists (202 | 8.6%).
Management, Business, Science and Arts Occupations by Sex
Within the Management, Business, Science and Arts occupations in McGovern, the most male-oriented occupations are Computers & Mathematics (100.0%), Architecture & Engineering (100.0%), and Computers, Engineering & Science (88.2%), while the most female-oriented occupations are Life, Physical & Social Science (100.0%), Education, Arts & Media (100.0%), and Education Instruction & Library (100.0%).
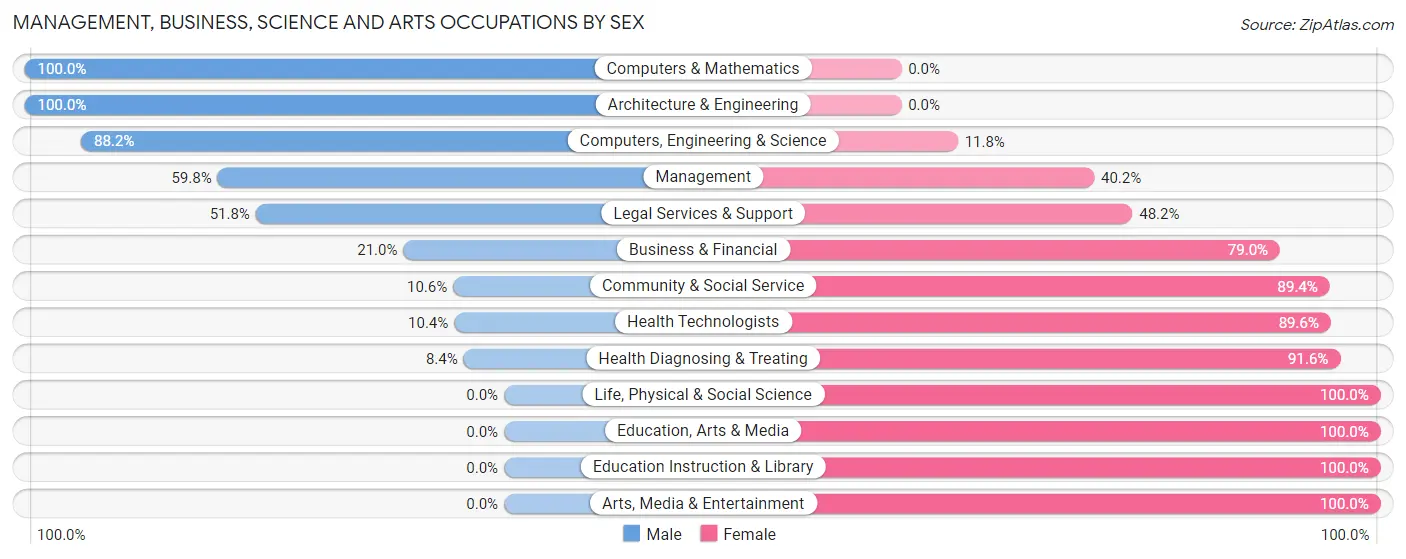
| Occupation | Male | Female |
| Management | 147 (59.8%) | 99 (40.2%) |
| Business & Financial | 21 (21.0%) | 79 (79.0%) |
| Computers, Engineering & Science | 202 (88.2%) | 27 (11.8%) |
| Computers & Mathematics | 55 (100.0%) | 0 (0.0%) |
| Architecture & Engineering | 147 (100.0%) | 0 (0.0%) |
| Life, Physical & Social Science | 0 (0.0%) | 27 (100.0%) |
| Community & Social Service | 29 (10.6%) | 244 (89.4%) |
| Education, Arts & Media | 0 (0.0%) | 16 (100.0%) |
| Legal Services & Support | 29 (51.8%) | 27 (48.2%) |
| Education Instruction & Library | 0 (0.0%) | 190 (100.0%) |
| Arts, Media & Entertainment | 0 (0.0%) | 11 (100.0%) |
| Health Diagnosing & Treating | 21 (8.4%) | 228 (91.6%) |
| Health Technologists | 21 (10.4%) | 181 (89.6%) |
| Total (Category) | 420 (38.3%) | 677 (61.7%) |
| Total (Overall) | 1,190 (50.9%) | 1,147 (49.1%) |
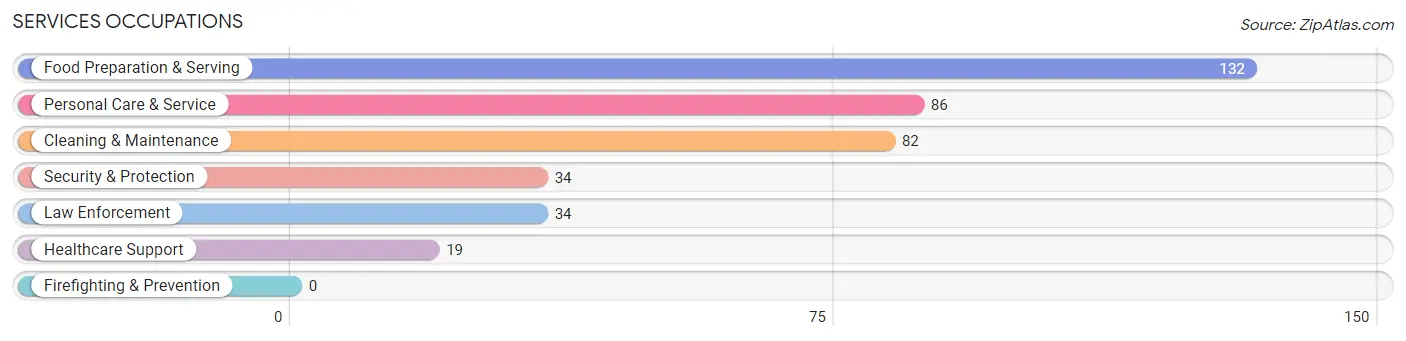
Services Occupations
The most common Services occupations in McGovern are Food Preparation & Serving (132 | 5.7%), Personal Care & Service (86 | 3.7%), Cleaning & Maintenance (82 | 3.5%), Security & Protection (34 | 1.5%), and Law Enforcement (34 | 1.5%).
Services Occupations by Sex
Within the Services occupations in McGovern, the most male-oriented occupations are Security & Protection (100.0%), Law Enforcement (100.0%), and Cleaning & Maintenance (81.7%), while the most female-oriented occupations are Healthcare Support (100.0%), Personal Care & Service (82.6%), and Food Preparation & Serving (67.4%).
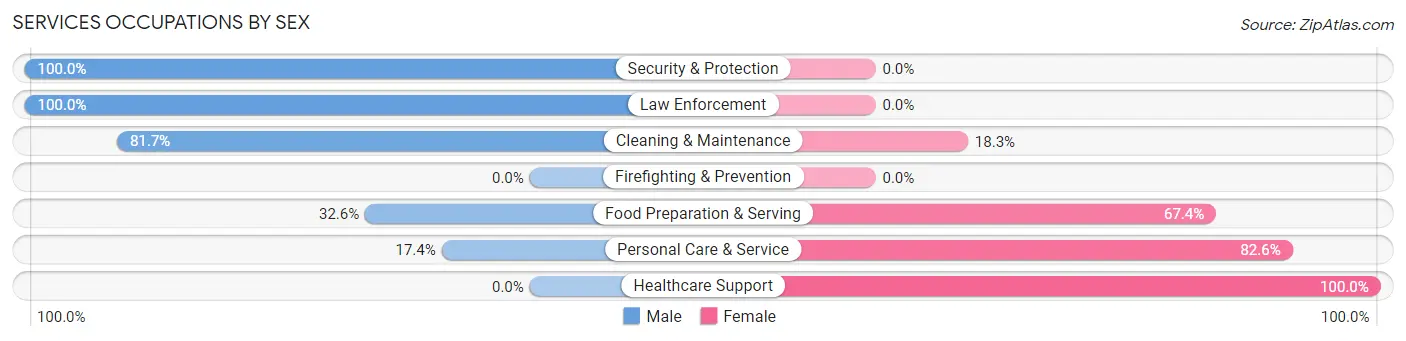
| Occupation | Male | Female |
| Healthcare Support | 0 (0.0%) | 19 (100.0%) |
| Security & Protection | 34 (100.0%) | 0 (0.0%) |
| Firefighting & Prevention | 0 (0.0%) | 0 (0.0%) |
| Law Enforcement | 34 (100.0%) | 0 (0.0%) |
| Food Preparation & Serving | 43 (32.6%) | 89 (67.4%) |
| Cleaning & Maintenance | 67 (81.7%) | 15 (18.3%) |
| Personal Care & Service | 15 (17.4%) | 71 (82.6%) |
| Total (Category) | 159 (45.0%) | 194 (55.0%) |
| Total (Overall) | 1,190 (50.9%) | 1,147 (49.1%) |
Sales and Office Occupations
The most common Sales and Office occupations in McGovern are Office & Administration (285 | 12.2%), and Sales & Related (211 | 9.0%).
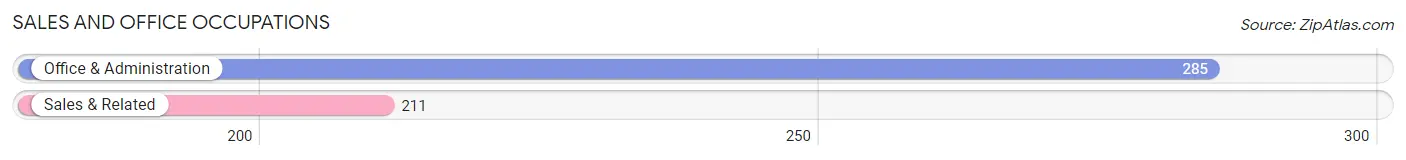
Sales and Office Occupations by Sex
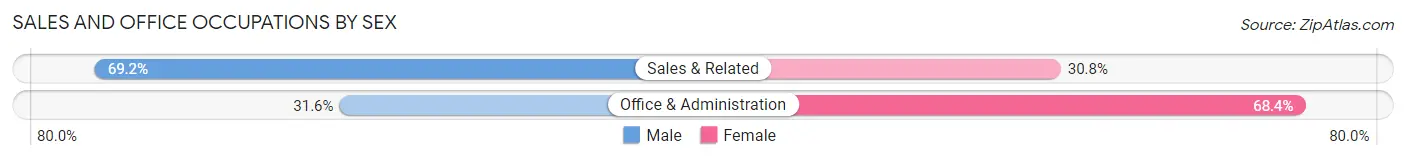
| Occupation | Male | Female |
| Sales & Related | 146 (69.2%) | 65 (30.8%) |
| Office & Administration | 90 (31.6%) | 195 (68.4%) |
| Total (Category) | 236 (47.6%) | 260 (52.4%) |
| Total (Overall) | 1,190 (50.9%) | 1,147 (49.1%) |
Natural Resources, Construction and Maintenance Occupations
The most common Natural Resources, Construction and Maintenance occupations in McGovern are Construction & Extraction (168 | 7.2%), and Installation, Maintenance & Repair (17 | 0.7%).
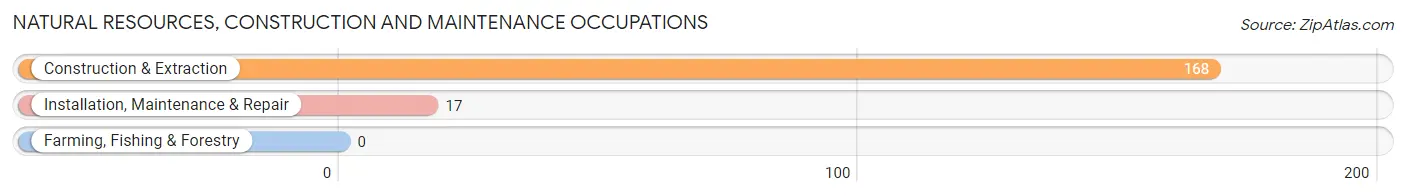
Natural Resources, Construction and Maintenance Occupations by Sex
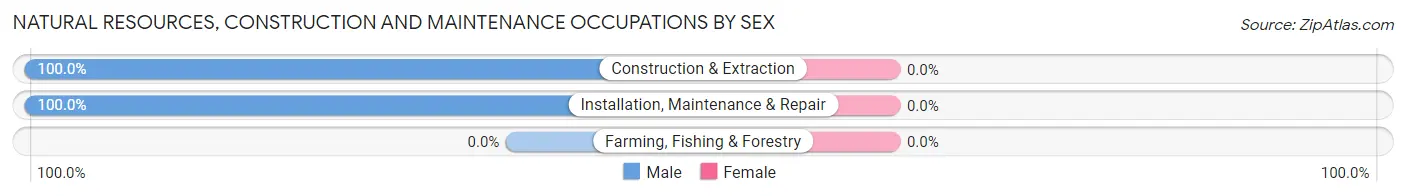
| Occupation | Male | Female |
| Farming, Fishing & Forestry | 0 (0.0%) | 0 (0.0%) |
| Construction & Extraction | 168 (100.0%) | 0 (0.0%) |
| Installation, Maintenance & Repair | 17 (100.0%) | 0 (0.0%) |
| Total (Category) | 185 (100.0%) | 0 (0.0%) |
| Total (Overall) | 1,190 (50.9%) | 1,147 (49.1%) |
Production, Transportation and Moving Occupations
The most common Production, Transportation and Moving occupations in McGovern are Production (131 | 5.6%), Material Moving (54 | 2.3%), and Transportation (21 | 0.9%).
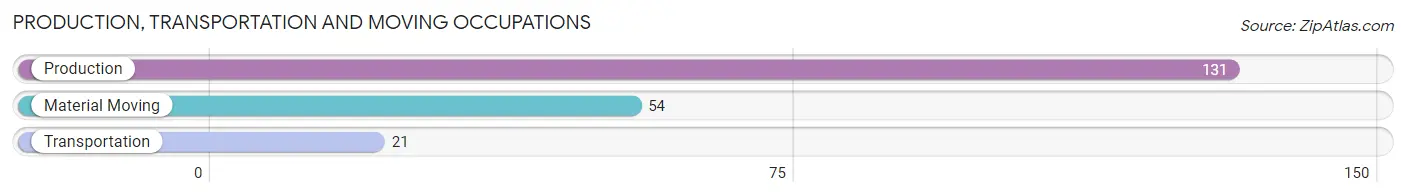
Production, Transportation and Moving Occupations by Sex
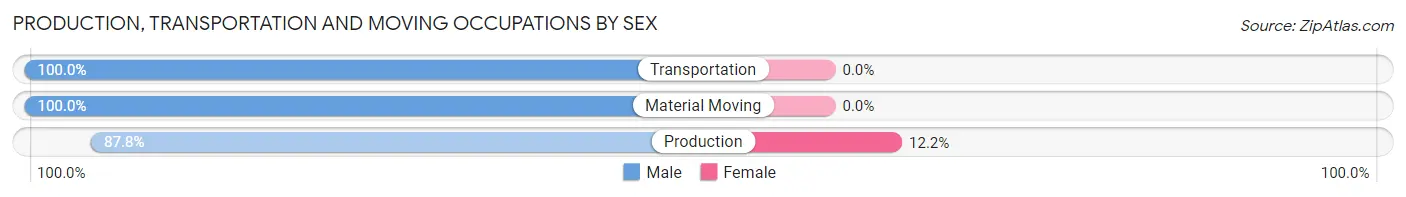
| Occupation | Male | Female |
| Production | 115 (87.8%) | 16 (12.2%) |
| Transportation | 21 (100.0%) | 0 (0.0%) |
| Material Moving | 54 (100.0%) | 0 (0.0%) |
| Total (Category) | 190 (92.2%) | 16 (7.8%) |
| Total (Overall) | 1,190 (50.9%) | 1,147 (49.1%) |
Employment Industries by Sex in McGovern
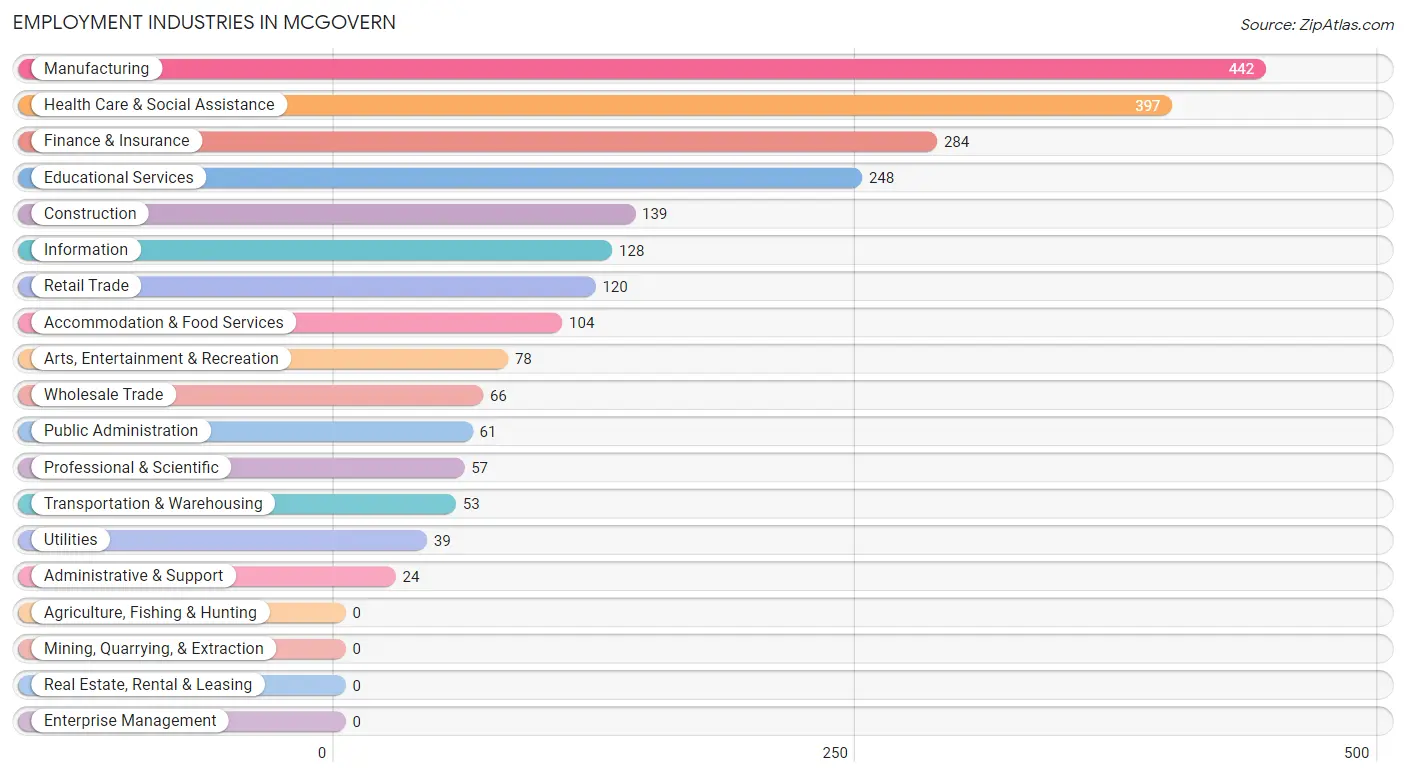
Employment Industries in McGovern
The major employment industries in McGovern include Manufacturing (442 | 18.9%), Health Care & Social Assistance (397 | 17.0%), Finance & Insurance (284 | 12.1%), Educational Services (248 | 10.6%), and Construction (139 | 5.9%).
Employment Industries by Sex in McGovern
The McGovern industries that see more men than women are Construction (100.0%), Transportation & Warehousing (100.0%), and Utilities (100.0%), whereas the industries that tend to have a higher number of women are Educational Services (94.8%), Finance & Insurance (76.8%), and Health Care & Social Assistance (71.8%).
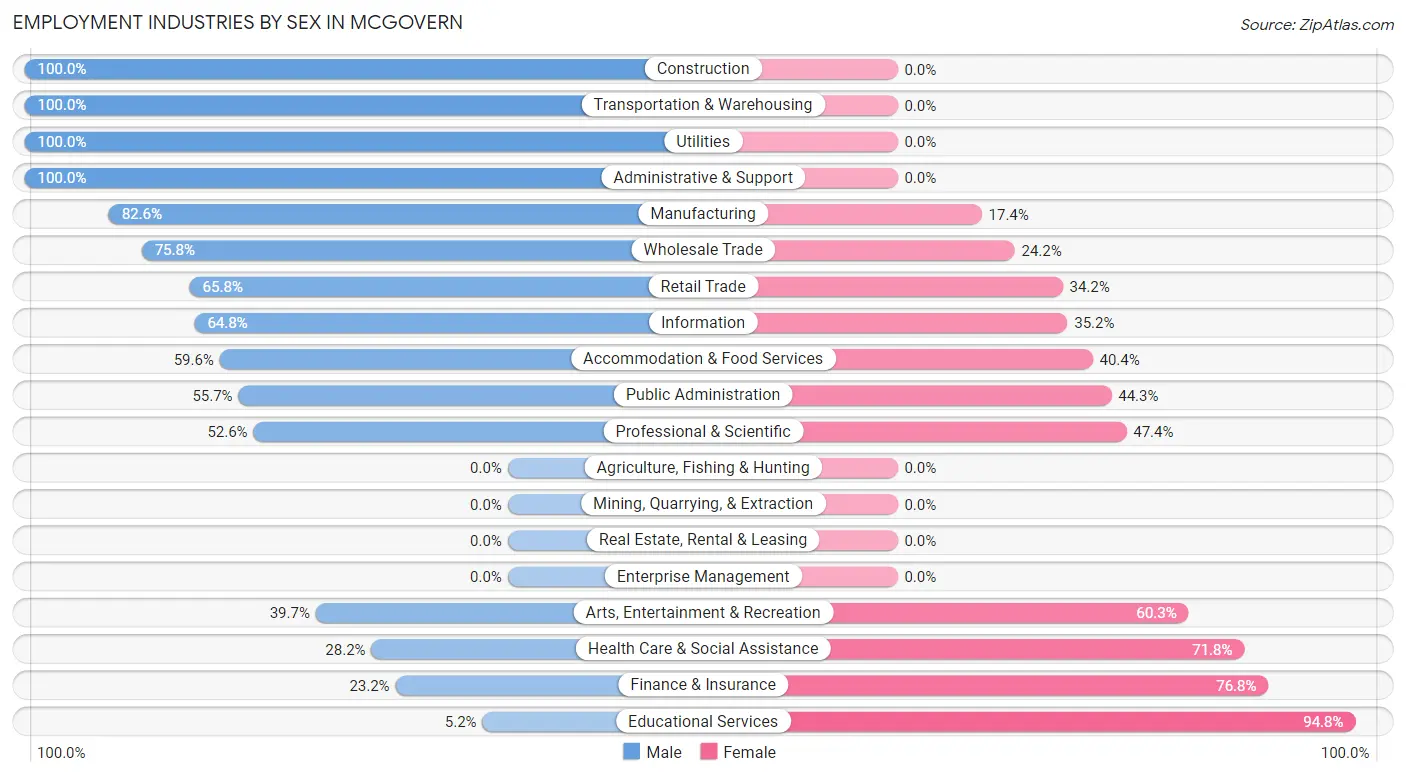
| Industry | Male | Female |
| Agriculture, Fishing & Hunting | 0 (0.0%) | 0 (0.0%) |
| Mining, Quarrying, & Extraction | 0 (0.0%) | 0 (0.0%) |
| Construction | 139 (100.0%) | 0 (0.0%) |
| Manufacturing | 365 (82.6%) | 77 (17.4%) |
| Wholesale Trade | 50 (75.8%) | 16 (24.2%) |
| Retail Trade | 79 (65.8%) | 41 (34.2%) |
| Transportation & Warehousing | 53 (100.0%) | 0 (0.0%) |
| Utilities | 39 (100.0%) | 0 (0.0%) |
| Information | 83 (64.8%) | 45 (35.2%) |
| Finance & Insurance | 66 (23.2%) | 218 (76.8%) |
| Real Estate, Rental & Leasing | 0 (0.0%) | 0 (0.0%) |
| Professional & Scientific | 30 (52.6%) | 27 (47.4%) |
| Enterprise Management | 0 (0.0%) | 0 (0.0%) |
| Administrative & Support | 24 (100.0%) | 0 (0.0%) |
| Educational Services | 13 (5.2%) | 235 (94.8%) |
| Health Care & Social Assistance | 112 (28.2%) | 285 (71.8%) |
| Arts, Entertainment & Recreation | 31 (39.7%) | 47 (60.3%) |
| Accommodation & Food Services | 62 (59.6%) | 42 (40.4%) |
| Public Administration | 34 (55.7%) | 27 (44.3%) |
| Total | 1,190 (50.9%) | 1,147 (49.1%) |
Education in McGovern
School Enrollment in McGovern
The most common levels of schooling among the 774 students in McGovern are middle school (196 | 25.3%), elementary school (171 | 22.1%), and high school (134 | 17.3%).
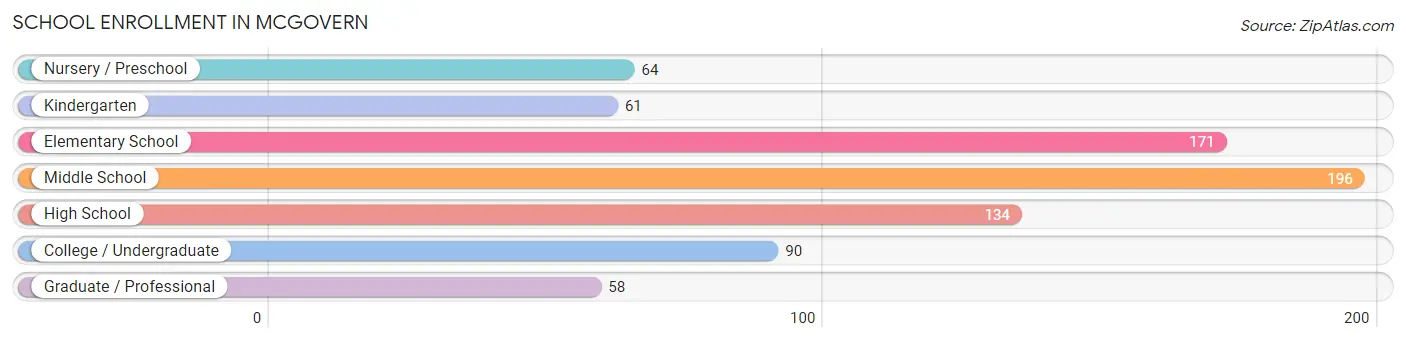
| School Level | # Students | % Students |
| Nursery / Preschool | 64 | 8.3% |
| Kindergarten | 61 | 7.9% |
| Elementary School | 171 | 22.1% |
| Middle School | 196 | 25.3% |
| High School | 134 | 17.3% |
| College / Undergraduate | 90 | 11.6% |
| Graduate / Professional | 58 | 7.5% |
| Total | 774 | 100.0% |
School Enrollment by Age by Funding Source in McGovern
Out of a total of 774 students who are enrolled in schools in McGovern, 182 (23.5%) attend a private institution, while the remaining 592 (76.5%) are enrolled in public schools. The age group of 35 years and over has the highest likelihood of being enrolled in private schools, with 21 (42.0% in the age bracket) enrolled. Conversely, the age group of 3 to 4 year olds has the lowest likelihood of being enrolled in a private school, with 21 (100.0% in the age bracket) attending a public institution.
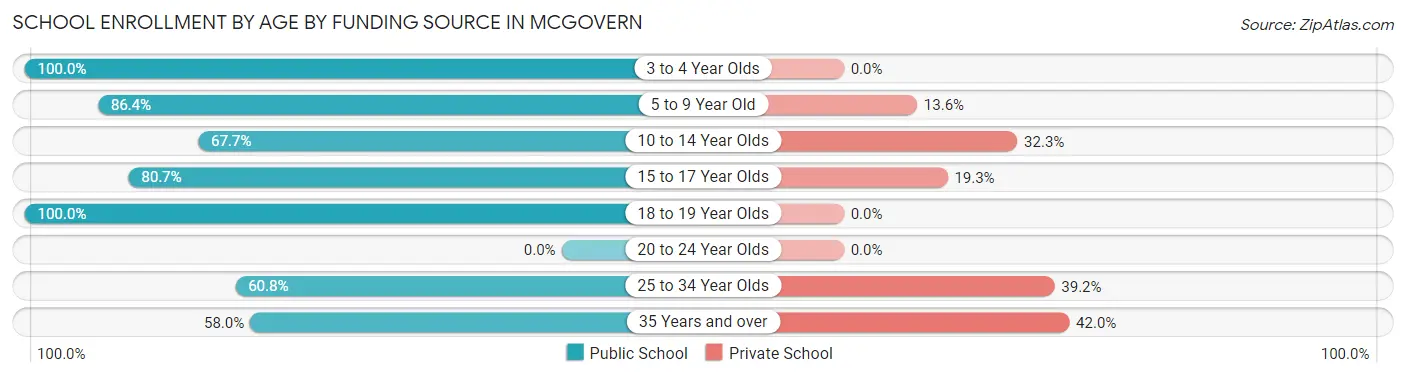
| Age Bracket | Public School | Private School |
| 3 to 4 Year Olds | 21 (100.0%) | 0 (0.0%) |
| 5 to 9 Year Old | 209 (86.4%) | 33 (13.6%) |
| 10 to 14 Year Olds | 155 (67.7%) | 74 (32.3%) |
| 15 to 17 Year Olds | 96 (80.7%) | 23 (19.3%) |
| 18 to 19 Year Olds | 34 (100.0%) | 0 (0.0%) |
| 20 to 24 Year Olds | 0 (0.0%) | 0 (0.0%) |
| 25 to 34 Year Olds | 48 (60.8%) | 31 (39.2%) |
| 35 Years and over | 29 (58.0%) | 21 (42.0%) |
| Total | 592 (76.5%) | 182 (23.5%) |
Educational Attainment by Field of Study in McGovern
Business (368 | 26.8%), science & technology (344 | 25.1%), education (102 | 7.4%), engineering (100 | 7.3%), and communications (99 | 7.2%) are the most common fields of study among 1,371 individuals in McGovern who have obtained a bachelor's degree or higher.
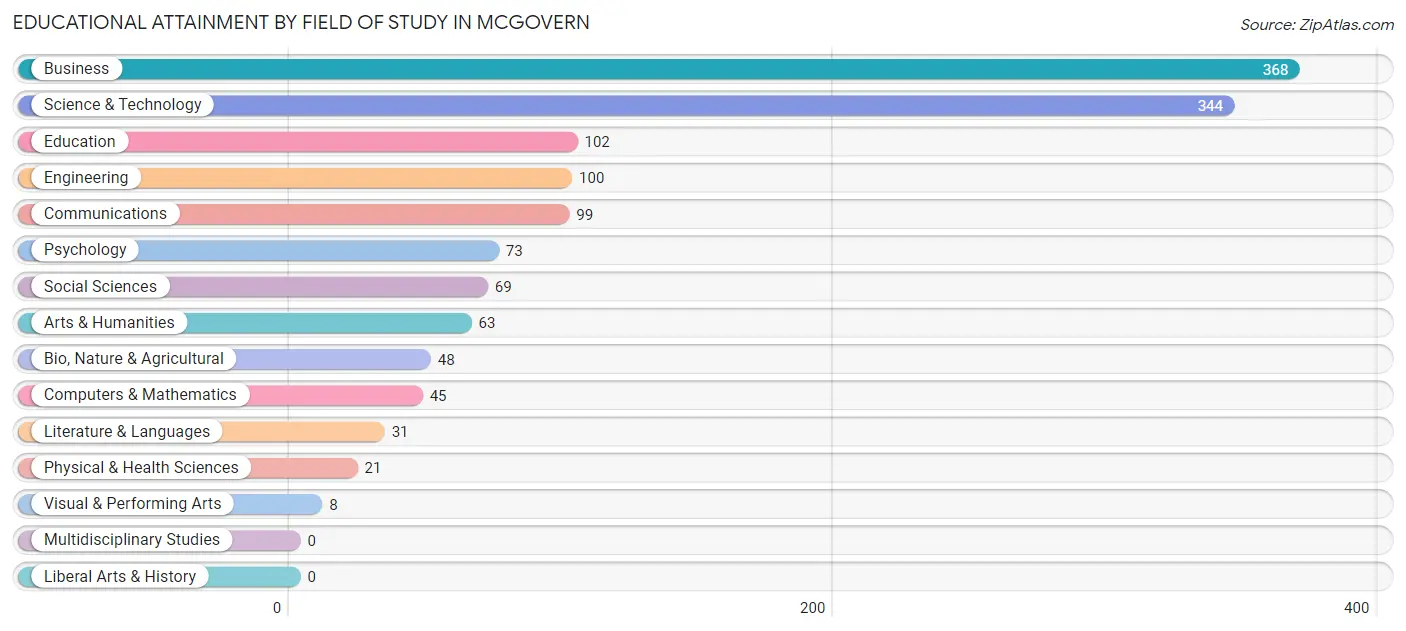
| Field of Study | # Graduates | % Graduates |
| Computers & Mathematics | 45 | 3.3% |
| Bio, Nature & Agricultural | 48 | 3.5% |
| Physical & Health Sciences | 21 | 1.5% |
| Psychology | 73 | 5.3% |
| Social Sciences | 69 | 5.0% |
| Engineering | 100 | 7.3% |
| Multidisciplinary Studies | 0 | 0.0% |
| Science & Technology | 344 | 25.1% |
| Business | 368 | 26.8% |
| Education | 102 | 7.4% |
| Literature & Languages | 31 | 2.3% |
| Liberal Arts & History | 0 | 0.0% |
| Visual & Performing Arts | 8 | 0.6% |
| Communications | 99 | 7.2% |
| Arts & Humanities | 63 | 4.6% |
| Total | 1,371 | 100.0% |
Transportation & Commute in McGovern
Vehicle Availability by Sex in McGovern
The most prevalent vehicle ownership categories in McGovern are males with 2 vehicles (504, accounting for 42.0%) and females with 2 vehicles (526, making up 45.5%).
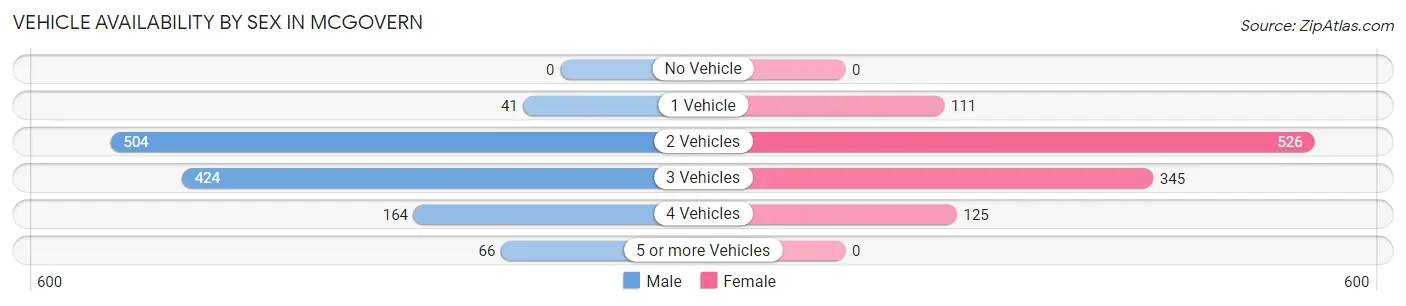
| Vehicles Available | Male | Female |
| No Vehicle | 0 (0.0%) | 0 (0.0%) |
| 1 Vehicle | 41 (3.4%) | 111 (10.0%) |
| 2 Vehicles | 504 (42.0%) | 526 (47.5%) |
| 3 Vehicles | 424 (35.4%) | 345 (31.2%) |
| 4 Vehicles | 164 (13.7%) | 125 (11.3%) |
| 5 or more Vehicles | 66 (5.5%) | 0 (0.0%) |
| Total | 1,199 (100.0%) | 1,107 (100.0%) |
Commute Time in McGovern
The most frequently occuring commute durations in McGovern are 5 to 9 minutes (498 commuters, 25.2%), 10 to 14 minutes (398 commuters, 20.1%), and 15 to 19 minutes (291 commuters, 14.7%).
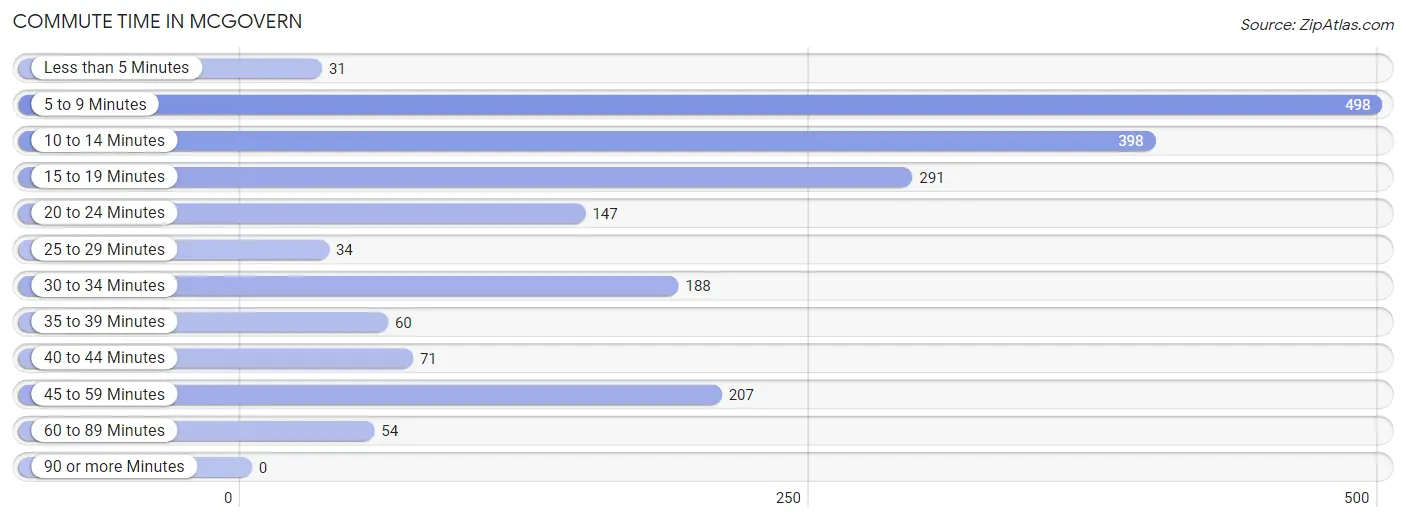
| Commute Time | # Commuters | % Commuters |
| Less than 5 Minutes | 31 | 1.6% |
| 5 to 9 Minutes | 498 | 25.2% |
| 10 to 14 Minutes | 398 | 20.1% |
| 15 to 19 Minutes | 291 | 14.7% |
| 20 to 24 Minutes | 147 | 7.4% |
| 25 to 29 Minutes | 34 | 1.7% |
| 30 to 34 Minutes | 188 | 9.5% |
| 35 to 39 Minutes | 60 | 3.0% |
| 40 to 44 Minutes | 71 | 3.6% |
| 45 to 59 Minutes | 207 | 10.5% |
| 60 to 89 Minutes | 54 | 2.7% |
| 90 or more Minutes | 0 | 0.0% |
Commute Time by Sex in McGovern
The most common commute times in McGovern are 10 to 14 minutes (259 commuters, 25.2%) for males and 5 to 9 minutes (348 commuters, 36.7%) for females.
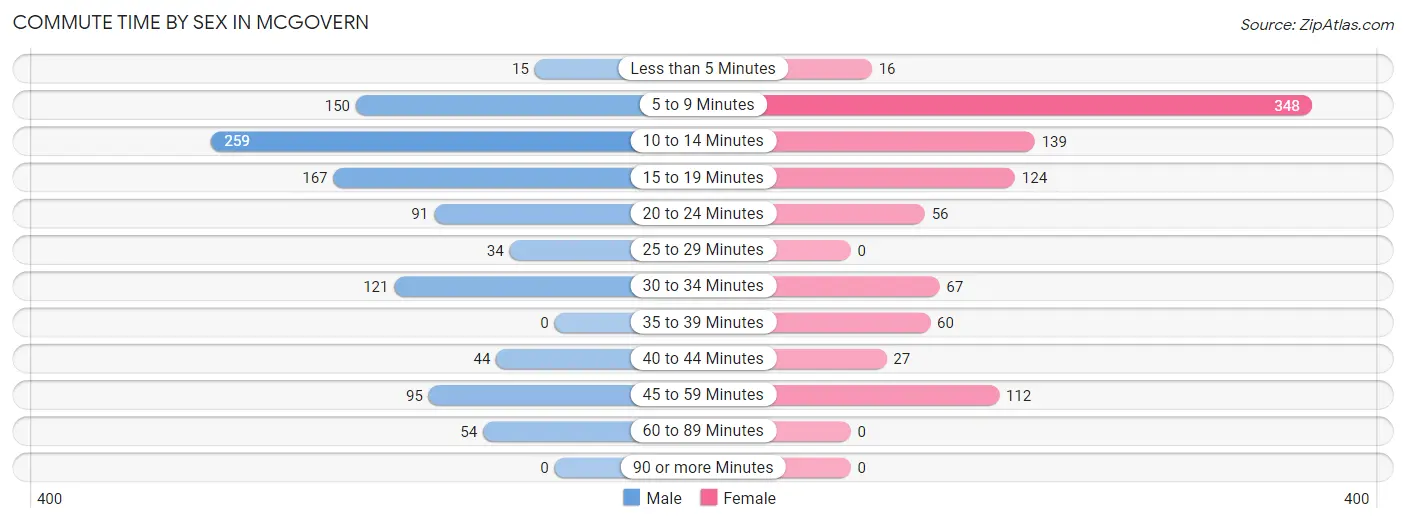
| Commute Time | Male | Female |
| Less than 5 Minutes | 15 (1.5%) | 16 (1.7%) |
| 5 to 9 Minutes | 150 (14.6%) | 348 (36.7%) |
| 10 to 14 Minutes | 259 (25.2%) | 139 (14.6%) |
| 15 to 19 Minutes | 167 (16.2%) | 124 (13.1%) |
| 20 to 24 Minutes | 91 (8.8%) | 56 (5.9%) |
| 25 to 29 Minutes | 34 (3.3%) | 0 (0.0%) |
| 30 to 34 Minutes | 121 (11.7%) | 67 (7.1%) |
| 35 to 39 Minutes | 0 (0.0%) | 60 (6.3%) |
| 40 to 44 Minutes | 44 (4.3%) | 27 (2.9%) |
| 45 to 59 Minutes | 95 (9.2%) | 112 (11.8%) |
| 60 to 89 Minutes | 54 (5.2%) | 0 (0.0%) |
| 90 or more Minutes | 0 (0.0%) | 0 (0.0%) |
Time of Departure to Work by Sex in McGovern
The most frequent times of departure to work in McGovern are 5:30 AM to 5:59 AM (217, 21.1%) for males and 5:30 AM to 5:59 AM (215, 22.7%) for females.
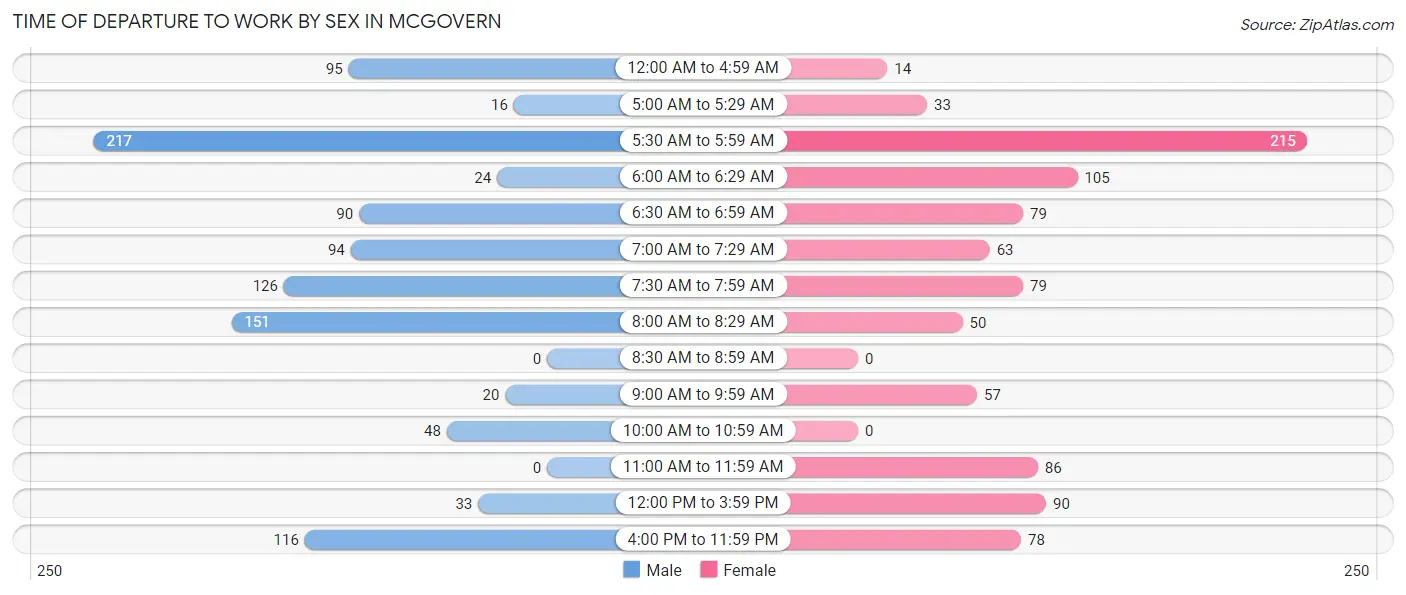
| Time of Departure | Male | Female |
| 12:00 AM to 4:59 AM | 95 (9.2%) | 14 (1.5%) |
| 5:00 AM to 5:29 AM | 16 (1.5%) | 33 (3.5%) |
| 5:30 AM to 5:59 AM | 217 (21.1%) | 215 (22.7%) |
| 6:00 AM to 6:29 AM | 24 (2.3%) | 105 (11.1%) |
| 6:30 AM to 6:59 AM | 90 (8.7%) | 79 (8.3%) |
| 7:00 AM to 7:29 AM | 94 (9.1%) | 63 (6.6%) |
| 7:30 AM to 7:59 AM | 126 (12.2%) | 79 (8.3%) |
| 8:00 AM to 8:29 AM | 151 (14.7%) | 50 (5.3%) |
| 8:30 AM to 8:59 AM | 0 (0.0%) | 0 (0.0%) |
| 9:00 AM to 9:59 AM | 20 (1.9%) | 57 (6.0%) |
| 10:00 AM to 10:59 AM | 48 (4.7%) | 0 (0.0%) |
| 11:00 AM to 11:59 AM | 0 (0.0%) | 86 (9.1%) |
| 12:00 PM to 3:59 PM | 33 (3.2%) | 90 (9.5%) |
| 4:00 PM to 11:59 PM | 116 (11.3%) | 78 (8.2%) |
| Total | 1,030 (100.0%) | 949 (100.0%) |
Housing Occupancy in McGovern
Occupancy by Ownership in McGovern
Of the total 1,747 dwellings in McGovern, owner-occupied units account for 1,673 (95.8%), while renter-occupied units make up 74 (4.2%).
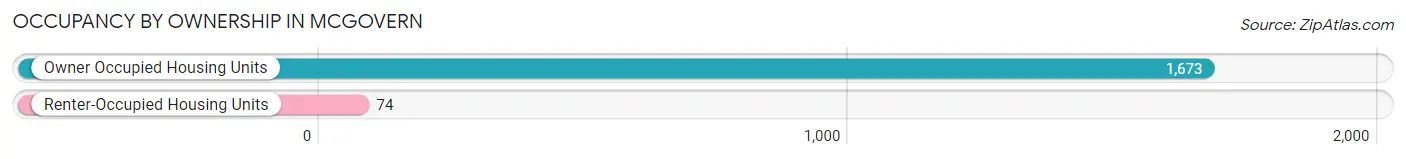
| Occupancy | # Housing Units | % Housing Units |
| Owner Occupied Housing Units | 1,673 | 95.8% |
| Renter-Occupied Housing Units | 74 | 4.2% |
| Total Occupied Housing Units | 1,747 | 100.0% |
Occupancy by Household Size in McGovern
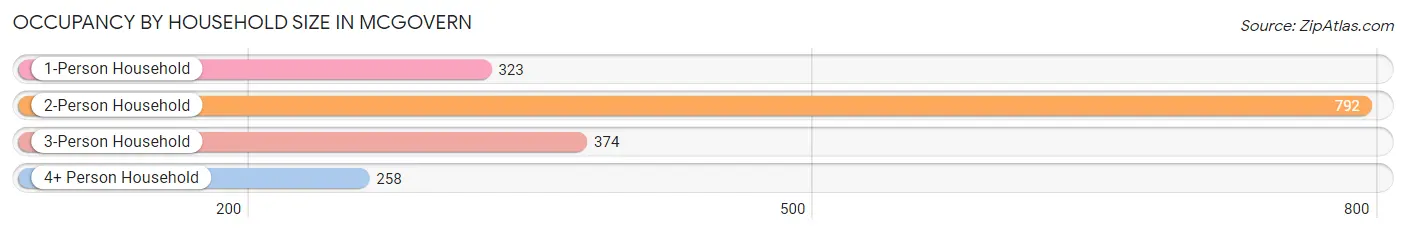
| Household Size | # Housing Units | % Housing Units |
| 1-Person Household | 323 | 18.5% |
| 2-Person Household | 792 | 45.3% |
| 3-Person Household | 374 | 21.4% |
| 4+ Person Household | 258 | 14.8% |
| Total Housing Units | 1,747 | 100.0% |
Occupancy by Ownership by Household Size in McGovern
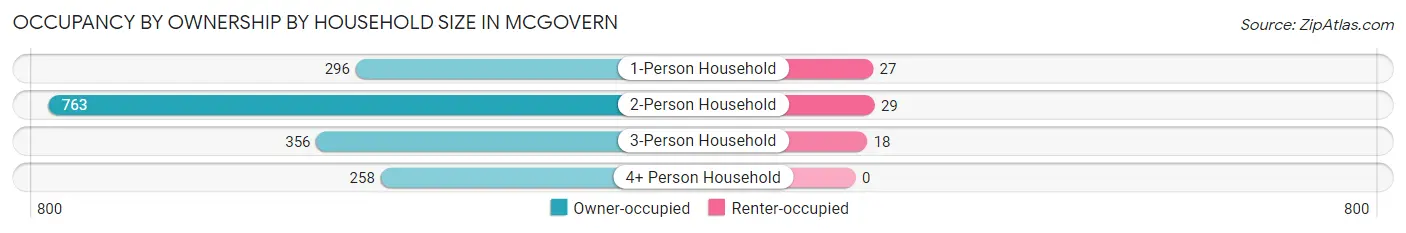
| Household Size | Owner-occupied | Renter-occupied |
| 1-Person Household | 296 (91.6%) | 27 (8.4%) |
| 2-Person Household | 763 (96.3%) | 29 (3.7%) |
| 3-Person Household | 356 (95.2%) | 18 (4.8%) |
| 4+ Person Household | 258 (100.0%) | 0 (0.0%) |
| Total Housing Units | 1,673 (95.8%) | 74 (4.2%) |
Occupancy by Educational Attainment in McGovern
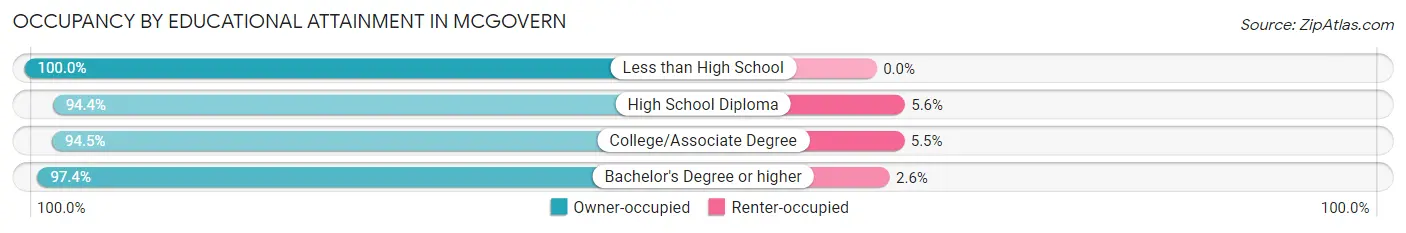
| Household Size | Owner-occupied | Renter-occupied |
| Less than High School | 30 (100.0%) | 0 (0.0%) |
| High School Diploma | 457 (94.4%) | 27 (5.6%) |
| College/Associate Degree | 501 (94.5%) | 29 (5.5%) |
| Bachelor's Degree or higher | 685 (97.4%) | 18 (2.6%) |
Occupancy by Age of Householder in McGovern
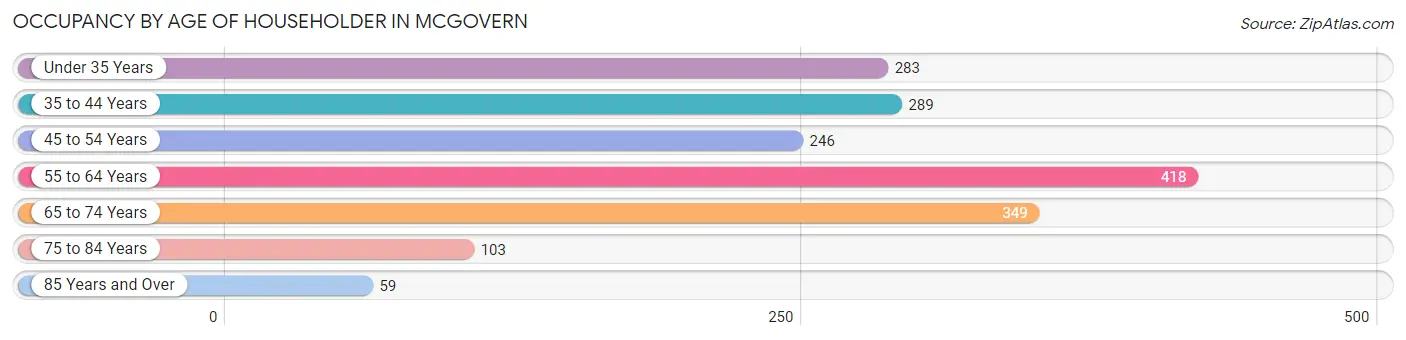
| Age Bracket | # Households | % Households |
| Under 35 Years | 283 | 16.2% |
| 35 to 44 Years | 289 | 16.5% |
| 45 to 54 Years | 246 | 14.1% |
| 55 to 64 Years | 418 | 23.9% |
| 65 to 74 Years | 349 | 20.0% |
| 75 to 84 Years | 103 | 5.9% |
| 85 Years and Over | 59 | 3.4% |
| Total | 1,747 | 100.0% |
Housing Finances in McGovern
Median Income by Occupancy in McGovern
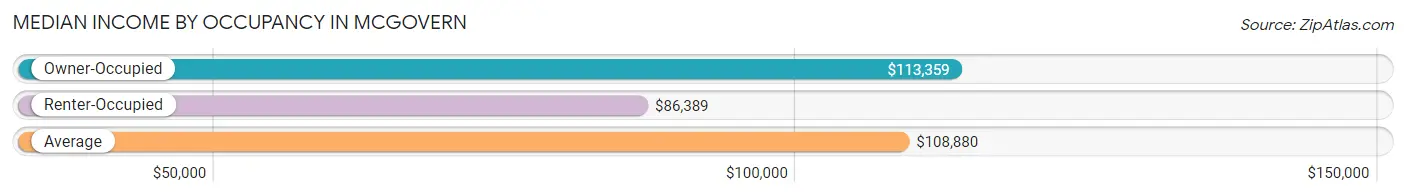
| Occupancy Type | # Households | Median Income |
| Owner-Occupied | 1,673 (95.8%) | $113,359 |
| Renter-Occupied | 74 (4.2%) | $86,389 |
| Average | 1,747 (100.0%) | $108,880 |
Occupancy by Householder Income Bracket in McGovern
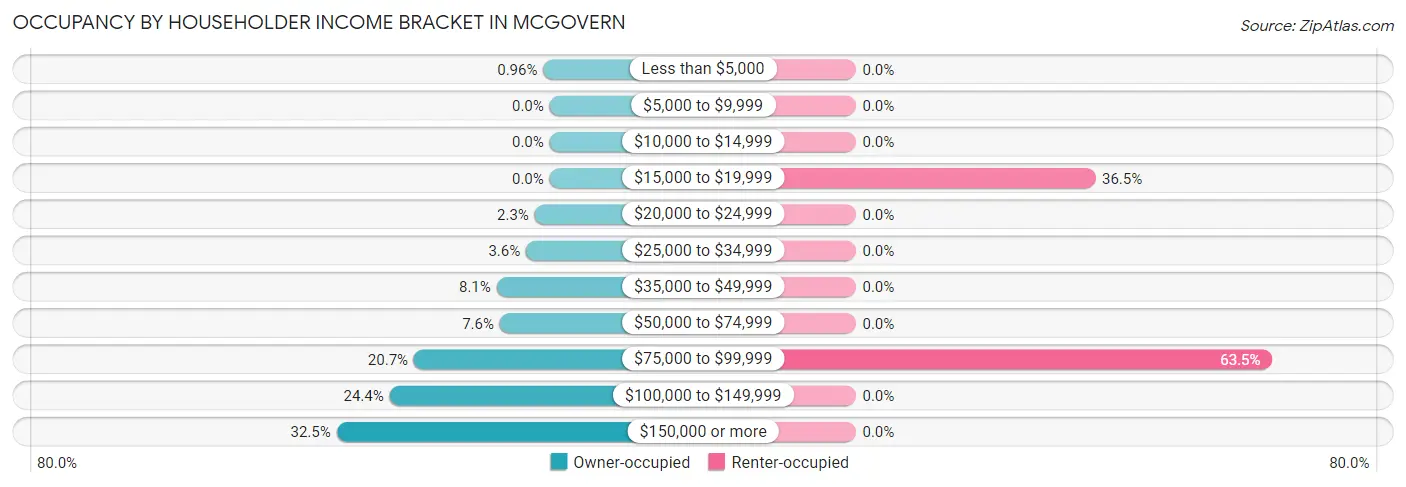
| Income Bracket | Owner-occupied | Renter-occupied |
| Less than $5,000 | 16 (1.0%) | 0 (0.0%) |
| $5,000 to $9,999 | 0 (0.0%) | 0 (0.0%) |
| $10,000 to $14,999 | 0 (0.0%) | 0 (0.0%) |
| $15,000 to $19,999 | 0 (0.0%) | 27 (36.5%) |
| $20,000 to $24,999 | 38 (2.3%) | 0 (0.0%) |
| $25,000 to $34,999 | 60 (3.6%) | 0 (0.0%) |
| $35,000 to $49,999 | 135 (8.1%) | 0 (0.0%) |
| $50,000 to $74,999 | 127 (7.6%) | 0 (0.0%) |
| $75,000 to $99,999 | 346 (20.7%) | 47 (63.5%) |
| $100,000 to $149,999 | 408 (24.4%) | 0 (0.0%) |
| $150,000 or more | 543 (32.5%) | 0 (0.0%) |
| Total | 1,673 (100.0%) | 74 (100.0%) |
Monthly Housing Cost Tiers in McGovern
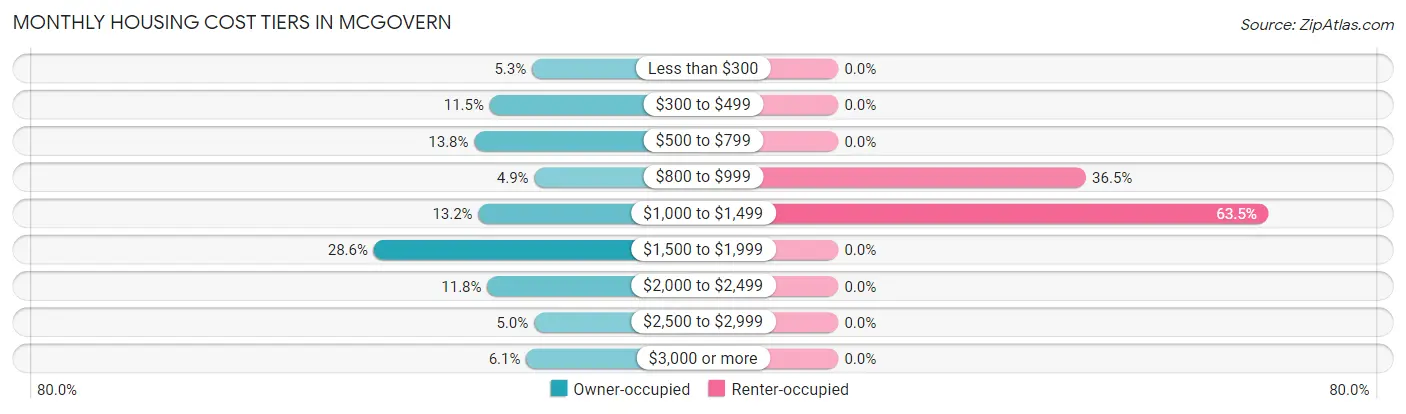
| Monthly Cost | Owner-occupied | Renter-occupied |
| Less than $300 | 88 (5.3%) | 0 (0.0%) |
| $300 to $499 | 192 (11.5%) | 0 (0.0%) |
| $500 to $799 | 230 (13.8%) | 0 (0.0%) |
| $800 to $999 | 82 (4.9%) | 27 (36.5%) |
| $1,000 to $1,499 | 220 (13.2%) | 47 (63.5%) |
| $1,500 to $1,999 | 478 (28.6%) | 0 (0.0%) |
| $2,000 to $2,499 | 198 (11.8%) | 0 (0.0%) |
| $2,500 to $2,999 | 83 (5.0%) | 0 (0.0%) |
| $3,000 or more | 102 (6.1%) | 0 (0.0%) |
| Total | 1,673 (100.0%) | 74 (100.0%) |
Physical Housing Characteristics in McGovern
Housing Structures in McGovern
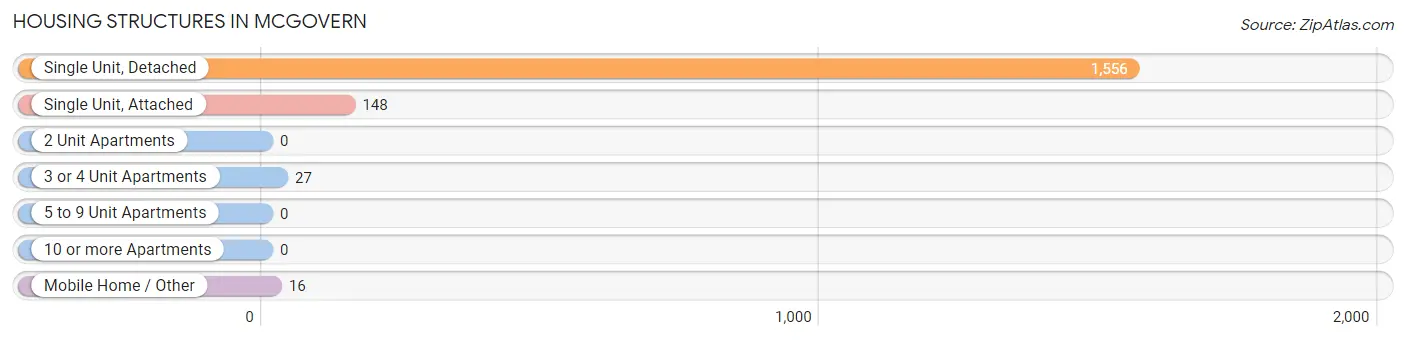
| Structure Type | # Housing Units | % Housing Units |
| Single Unit, Detached | 1,556 | 89.1% |
| Single Unit, Attached | 148 | 8.5% |
| 2 Unit Apartments | 0 | 0.0% |
| 3 or 4 Unit Apartments | 27 | 1.5% |
| 5 to 9 Unit Apartments | 0 | 0.0% |
| 10 or more Apartments | 0 | 0.0% |
| Mobile Home / Other | 16 | 0.9% |
| Total | 1,747 | 100.0% |
Housing Structures by Occupancy in McGovern
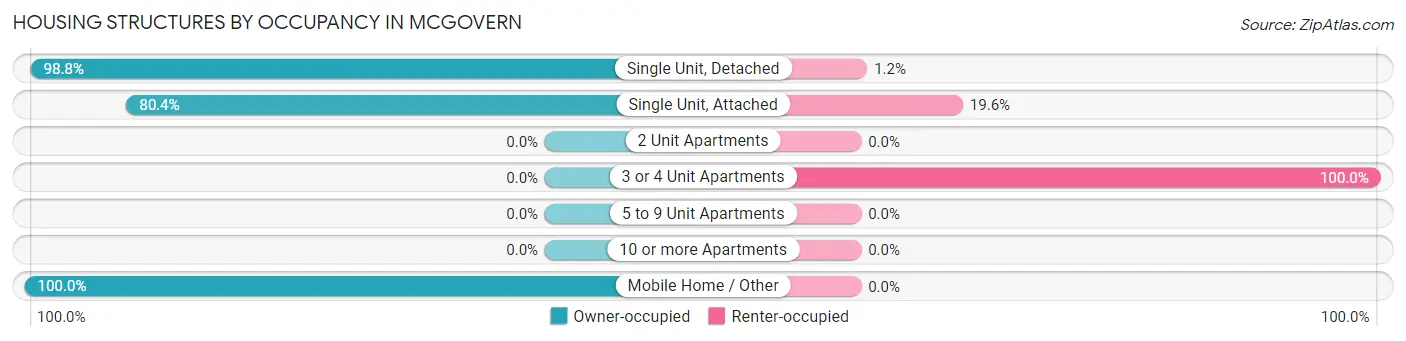
| Structure Type | Owner-occupied | Renter-occupied |
| Single Unit, Detached | 1,538 (98.8%) | 18 (1.2%) |
| Single Unit, Attached | 119 (80.4%) | 29 (19.6%) |
| 2 Unit Apartments | 0 (0.0%) | 0 (0.0%) |
| 3 or 4 Unit Apartments | 0 (0.0%) | 27 (100.0%) |
| 5 to 9 Unit Apartments | 0 (0.0%) | 0 (0.0%) |
| 10 or more Apartments | 0 (0.0%) | 0 (0.0%) |
| Mobile Home / Other | 16 (100.0%) | 0 (0.0%) |
| Total | 1,673 (95.8%) | 74 (4.2%) |
Housing Structures by Number of Rooms in McGovern
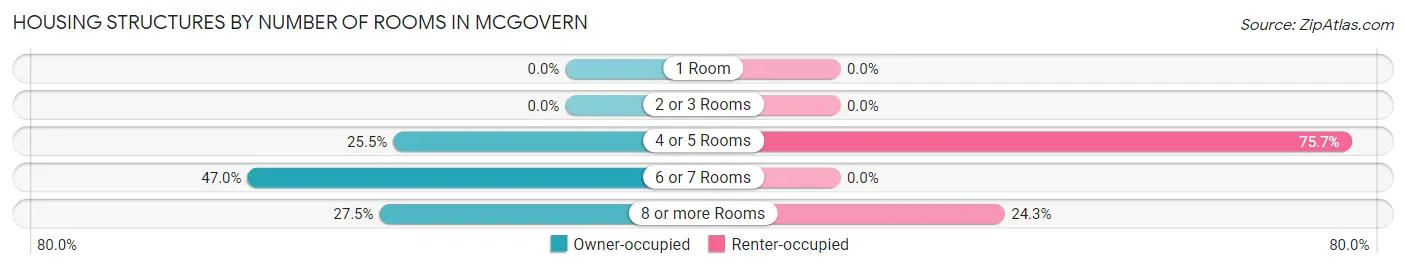
| Number of Rooms | Owner-occupied | Renter-occupied |
| 1 Room | 0 (0.0%) | 0 (0.0%) |
| 2 or 3 Rooms | 0 (0.0%) | 0 (0.0%) |
| 4 or 5 Rooms | 426 (25.5%) | 56 (75.7%) |
| 6 or 7 Rooms | 787 (47.0%) | 0 (0.0%) |
| 8 or more Rooms | 460 (27.5%) | 18 (24.3%) |
| Total | 1,673 (100.0%) | 74 (100.0%) |
Housing Structure by Heating Type in McGovern
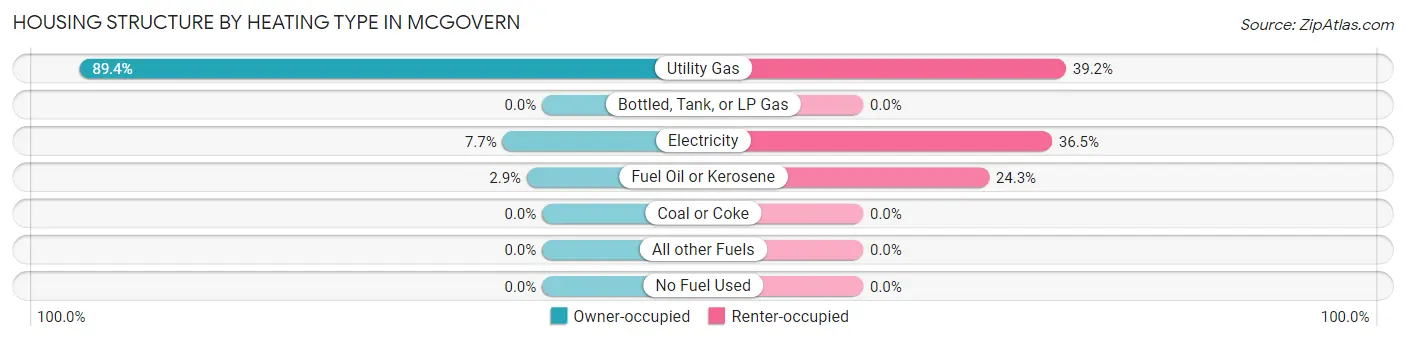
| Heating Type | Owner-occupied | Renter-occupied |
| Utility Gas | 1,496 (89.4%) | 29 (39.2%) |
| Bottled, Tank, or LP Gas | 0 (0.0%) | 0 (0.0%) |
| Electricity | 128 (7.6%) | 27 (36.5%) |
| Fuel Oil or Kerosene | 49 (2.9%) | 18 (24.3%) |
| Coal or Coke | 0 (0.0%) | 0 (0.0%) |
| All other Fuels | 0 (0.0%) | 0 (0.0%) |
| No Fuel Used | 0 (0.0%) | 0 (0.0%) |
| Total | 1,673 (100.0%) | 74 (100.0%) |
Household Vehicle Usage in McGovern
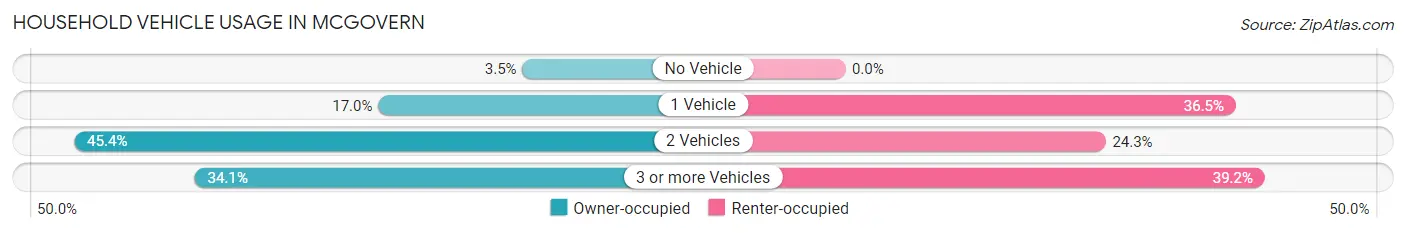
| Vehicles per Household | Owner-occupied | Renter-occupied |
| No Vehicle | 59 (3.5%) | 0 (0.0%) |
| 1 Vehicle | 284 (17.0%) | 27 (36.5%) |
| 2 Vehicles | 759 (45.4%) | 18 (24.3%) |
| 3 or more Vehicles | 571 (34.1%) | 29 (39.2%) |
| Total | 1,673 (100.0%) | 74 (100.0%) |
Real Estate & Mortgages in McGovern
Real Estate and Mortgage Overview in McGovern
| Characteristic | Without Mortgage | With Mortgage |
| Housing Units | 504 | 1,169 |
| Median Property Value | $234,500 | $293,800 |
| Median Household Income | $87,143 | $487 |
| Monthly Housing Costs | $469 | $102 |
| Real Estate Taxes | $2,102 | $66 |
Property Value by Mortgage Status in McGovern
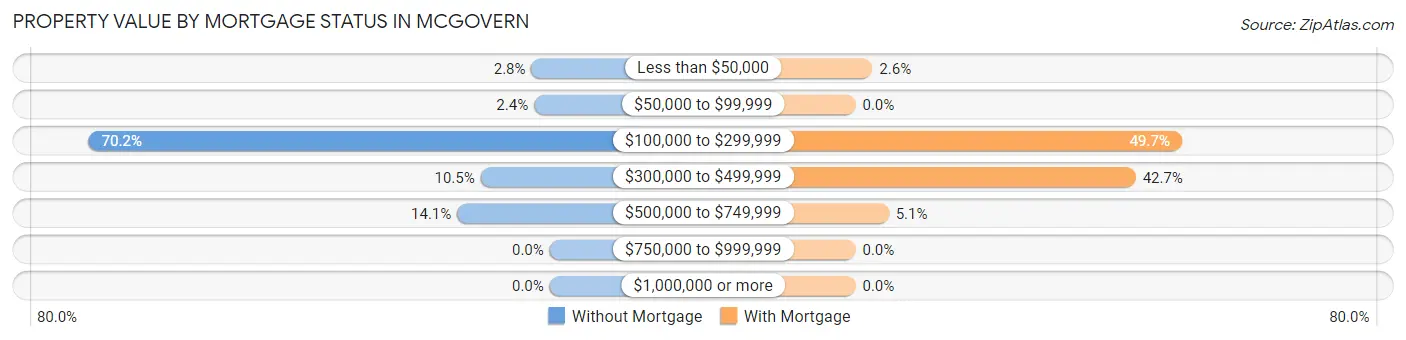
| Property Value | Without Mortgage | With Mortgage |
| Less than $50,000 | 14 (2.8%) | 30 (2.6%) |
| $50,000 to $99,999 | 12 (2.4%) | 0 (0.0%) |
| $100,000 to $299,999 | 354 (70.2%) | 581 (49.7%) |
| $300,000 to $499,999 | 53 (10.5%) | 499 (42.7%) |
| $500,000 to $749,999 | 71 (14.1%) | 59 (5.1%) |
| $750,000 to $999,999 | 0 (0.0%) | 0 (0.0%) |
| $1,000,000 or more | 0 (0.0%) | 0 (0.0%) |
| Total | 504 (100.0%) | 1,169 (100.0%) |
Household Income by Mortgage Status in McGovern
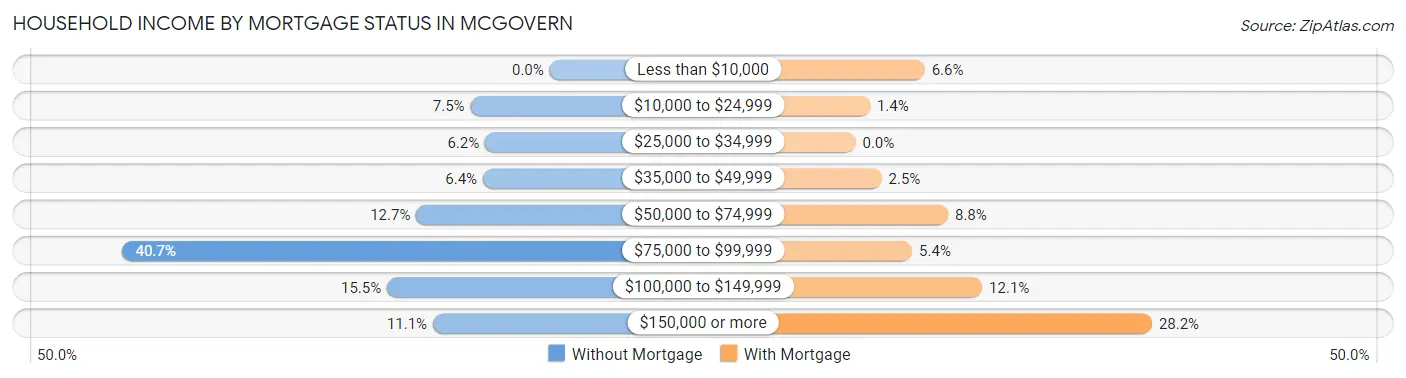
| Household Income | Without Mortgage | With Mortgage |
| Less than $10,000 | 0 (0.0%) | 77 (6.6%) |
| $10,000 to $24,999 | 38 (7.5%) | 16 (1.4%) |
| $25,000 to $34,999 | 31 (6.1%) | 0 (0.0%) |
| $35,000 to $49,999 | 32 (6.4%) | 29 (2.5%) |
| $50,000 to $74,999 | 64 (12.7%) | 103 (8.8%) |
| $75,000 to $99,999 | 205 (40.7%) | 63 (5.4%) |
| $100,000 to $149,999 | 78 (15.5%) | 141 (12.1%) |
| $150,000 or more | 56 (11.1%) | 330 (28.2%) |
| Total | 504 (100.0%) | 1,169 (100.0%) |
Property Value to Household Income Ratio in McGovern
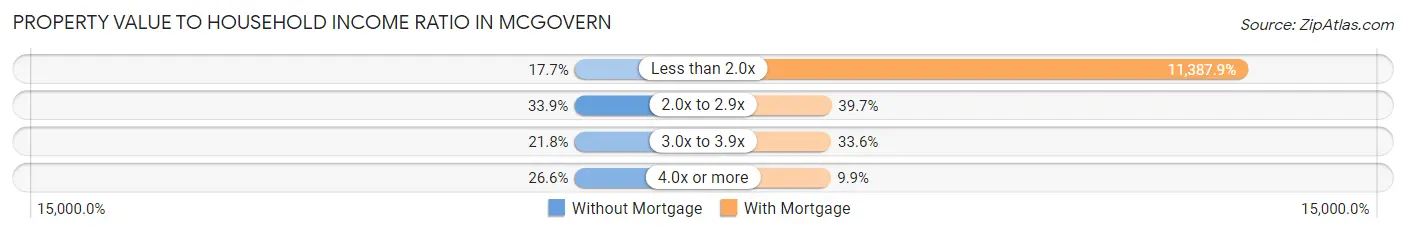
| Value-to-Income Ratio | Without Mortgage | With Mortgage |
| Less than 2.0x | 89 (17.7%) | 133,125 (11,387.9%) |
| 2.0x to 2.9x | 171 (33.9%) | 464 (39.7%) |
| 3.0x to 3.9x | 110 (21.8%) | 393 (33.6%) |
| 4.0x or more | 134 (26.6%) | 116 (9.9%) |
| Total | 504 (100.0%) | 1,169 (100.0%) |
Real Estate Taxes by Mortgage Status in McGovern
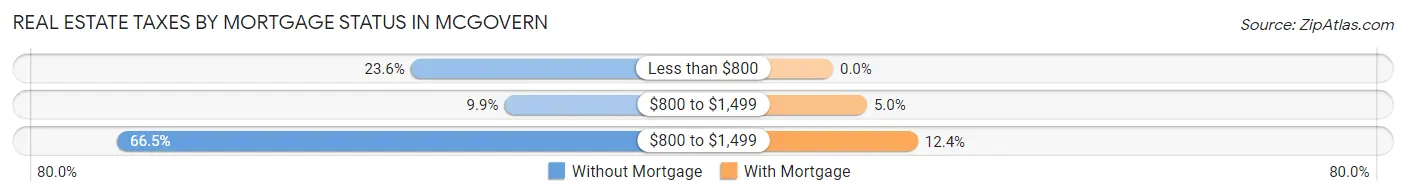
| Property Taxes | Without Mortgage | With Mortgage |
| Less than $800 | 119 (23.6%) | 0 (0.0%) |
| $800 to $1,499 | 50 (9.9%) | 58 (5.0%) |
| $800 to $1,499 | 335 (66.5%) | 145 (12.4%) |
| Total | 504 (100.0%) | 1,169 (100.0%) |
Health & Disability in McGovern
Health Insurance Coverage by Age in McGovern
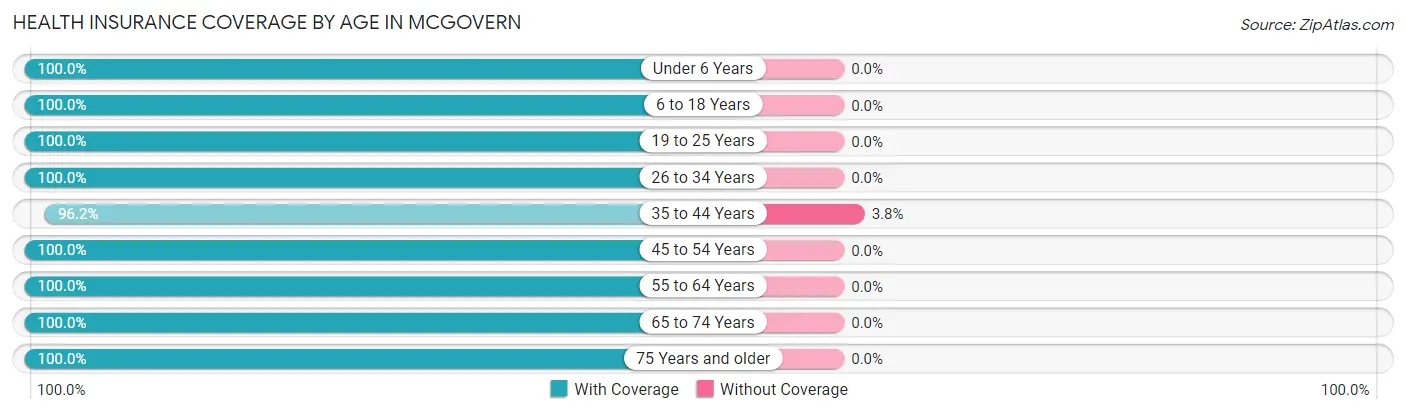
| Age Bracket | With Coverage | Without Coverage |
| Under 6 Years | 232 (100.0%) | 0 (0.0%) |
| 6 to 18 Years | 562 (100.0%) | 0 (0.0%) |
| 19 to 25 Years | 223 (100.0%) | 0 (0.0%) |
| 26 to 34 Years | 532 (100.0%) | 0 (0.0%) |
| 35 to 44 Years | 530 (96.2%) | 21 (3.8%) |
| 45 to 54 Years | 524 (100.0%) | 0 (0.0%) |
| 55 to 64 Years | 713 (100.0%) | 0 (0.0%) |
| 65 to 74 Years | 629 (100.0%) | 0 (0.0%) |
| 75 Years and older | 219 (100.0%) | 0 (0.0%) |
| Total | 4,164 (99.5%) | 21 (0.5%) |
Health Insurance Coverage by Citizenship Status in McGovern
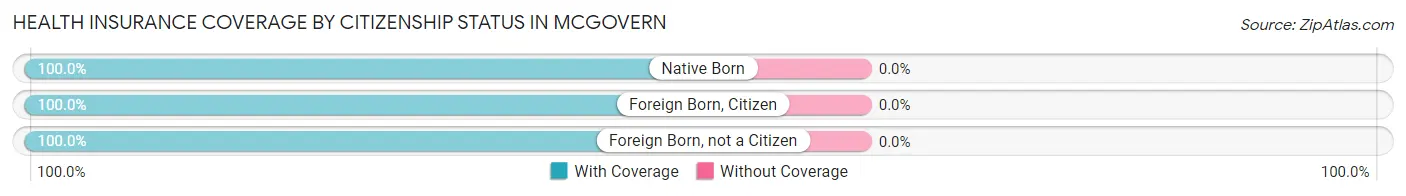
| Citizenship Status | With Coverage | Without Coverage |
| Native Born | 232 (100.0%) | 0 (0.0%) |
| Foreign Born, Citizen | 562 (100.0%) | 0 (0.0%) |
| Foreign Born, not a Citizen | 223 (100.0%) | 0 (0.0%) |
Health Insurance Coverage by Household Income in McGovern
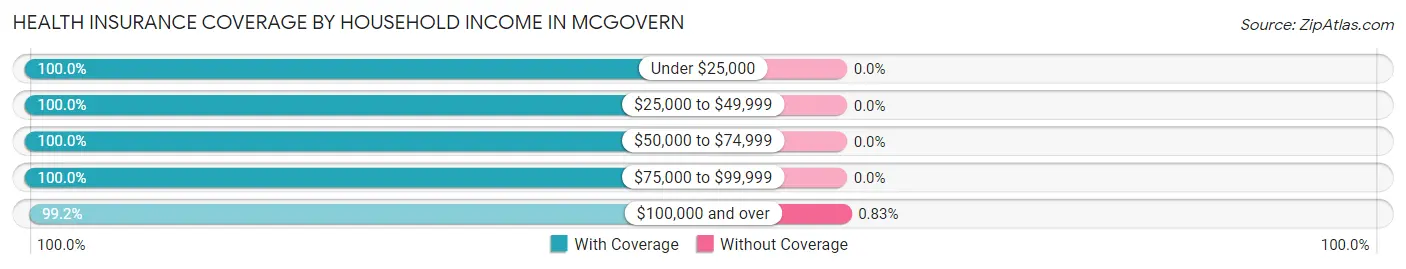
| Household Income | With Coverage | Without Coverage |
| Under $25,000 | 81 (100.0%) | 0 (0.0%) |
| $25,000 to $49,999 | 351 (100.0%) | 0 (0.0%) |
| $50,000 to $74,999 | 211 (100.0%) | 0 (0.0%) |
| $75,000 to $99,999 | 998 (100.0%) | 0 (0.0%) |
| $100,000 and over | 2,523 (99.2%) | 21 (0.8%) |
Public vs Private Health Insurance Coverage by Age in McGovern
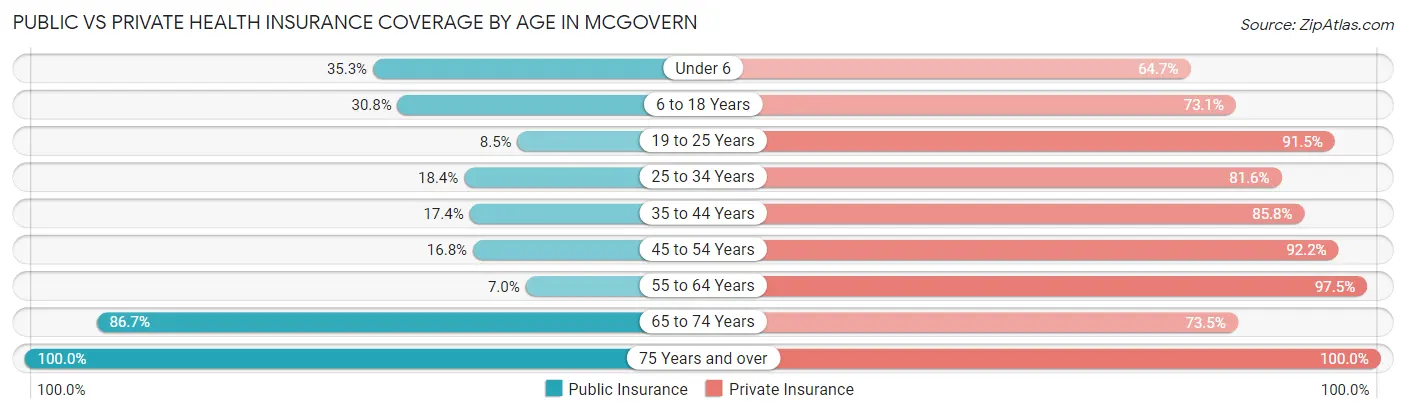
| Age Bracket | Public Insurance | Private Insurance |
| Under 6 | 82 (35.3%) | 150 (64.7%) |
| 6 to 18 Years | 173 (30.8%) | 411 (73.1%) |
| 19 to 25 Years | 19 (8.5%) | 204 (91.5%) |
| 25 to 34 Years | 98 (18.4%) | 434 (81.6%) |
| 35 to 44 Years | 96 (17.4%) | 473 (85.8%) |
| 45 to 54 Years | 88 (16.8%) | 483 (92.2%) |
| 55 to 64 Years | 50 (7.0%) | 695 (97.5%) |
| 65 to 74 Years | 545 (86.7%) | 462 (73.5%) |
| 75 Years and over | 219 (100.0%) | 219 (100.0%) |
| Total | 1,370 (32.7%) | 3,531 (84.4%) |
Disability Status by Sex by Age in McGovern
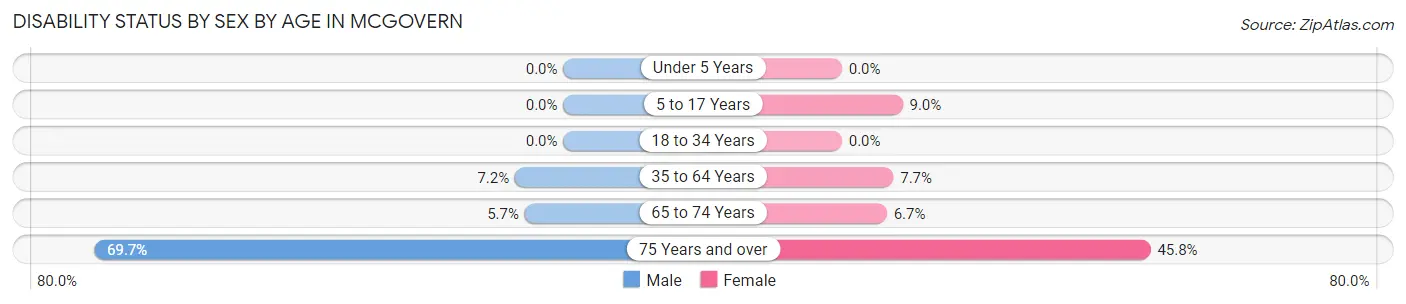
| Age Bracket | Male | Female |
| Under 5 Years | 0 (0.0%) | 0 (0.0%) |
| 5 to 17 Years | 0 (0.0%) | 23 (9.0%) |
| 18 to 34 Years | 0 (0.0%) | 0 (0.0%) |
| 35 to 64 Years | 56 (7.2%) | 77 (7.6%) |
| 65 to 74 Years | 18 (5.7%) | 21 (6.7%) |
| 75 Years and over | 69 (69.7%) | 55 (45.8%) |
Disability Class by Sex by Age in McGovern
Disability Class: Hearing Difficulty
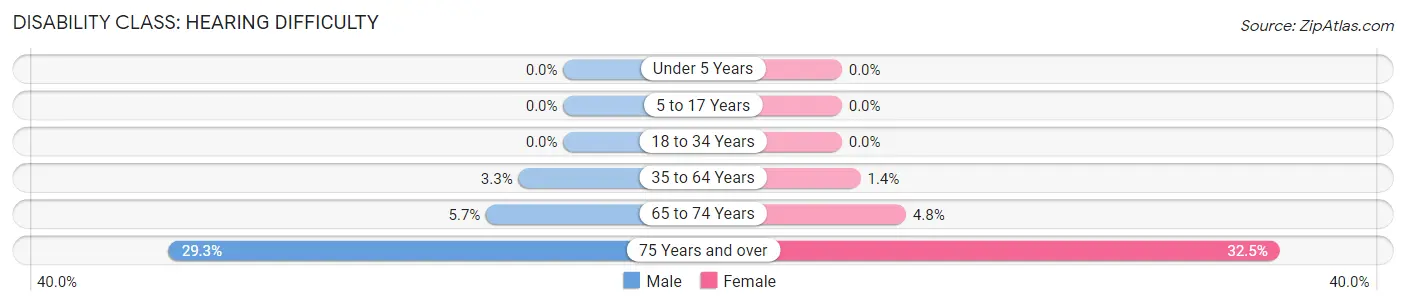
| Age Bracket | Male | Female |
| Under 5 Years | 0 (0.0%) | 0 (0.0%) |
| 5 to 17 Years | 0 (0.0%) | 0 (0.0%) |
| 18 to 34 Years | 0 (0.0%) | 0 (0.0%) |
| 35 to 64 Years | 26 (3.3%) | 14 (1.4%) |
| 65 to 74 Years | 18 (5.7%) | 15 (4.8%) |
| 75 Years and over | 29 (29.3%) | 39 (32.5%) |
Disability Class: Vision Difficulty
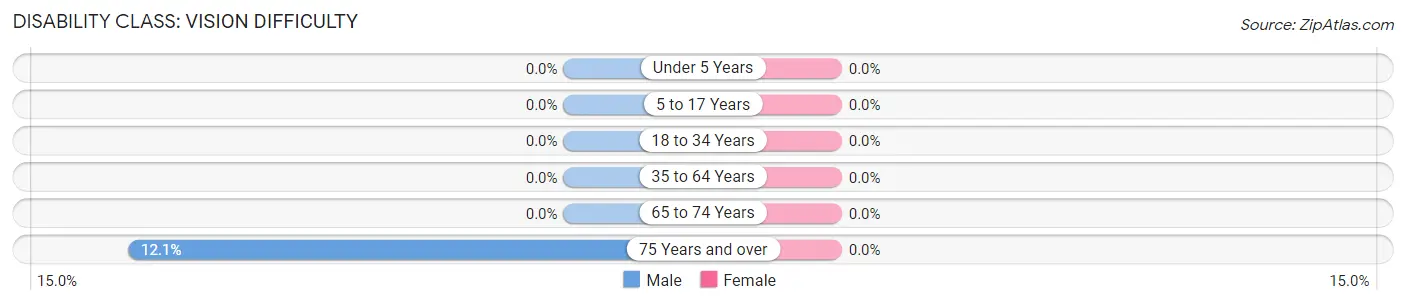
| Age Bracket | Male | Female |
| Under 5 Years | 0 (0.0%) | 0 (0.0%) |
| 5 to 17 Years | 0 (0.0%) | 0 (0.0%) |
| 18 to 34 Years | 0 (0.0%) | 0 (0.0%) |
| 35 to 64 Years | 0 (0.0%) | 0 (0.0%) |
| 65 to 74 Years | 0 (0.0%) | 0 (0.0%) |
| 75 Years and over | 12 (12.1%) | 0 (0.0%) |
Disability Class: Cognitive Difficulty
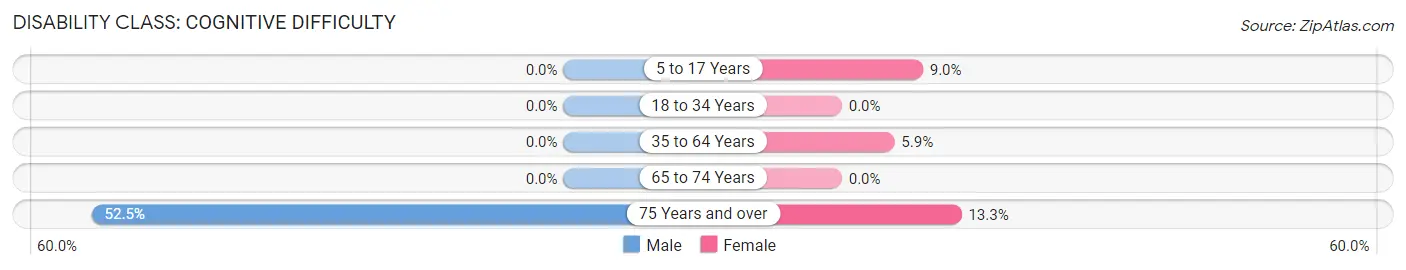
| Age Bracket | Male | Female |
| 5 to 17 Years | 0 (0.0%) | 23 (9.0%) |
| 18 to 34 Years | 0 (0.0%) | 0 (0.0%) |
| 35 to 64 Years | 0 (0.0%) | 59 (5.9%) |
| 65 to 74 Years | 0 (0.0%) | 0 (0.0%) |
| 75 Years and over | 52 (52.5%) | 16 (13.3%) |
Disability Class: Ambulatory Difficulty
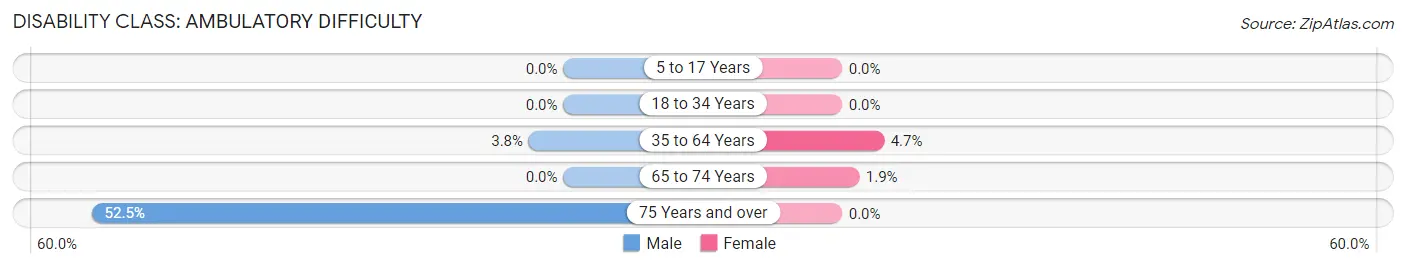
| Age Bracket | Male | Female |
| 5 to 17 Years | 0 (0.0%) | 0 (0.0%) |
| 18 to 34 Years | 0 (0.0%) | 0 (0.0%) |
| 35 to 64 Years | 30 (3.8%) | 47 (4.7%) |
| 65 to 74 Years | 0 (0.0%) | 6 (1.9%) |
| 75 Years and over | 52 (52.5%) | 0 (0.0%) |
Disability Class: Self-Care Difficulty
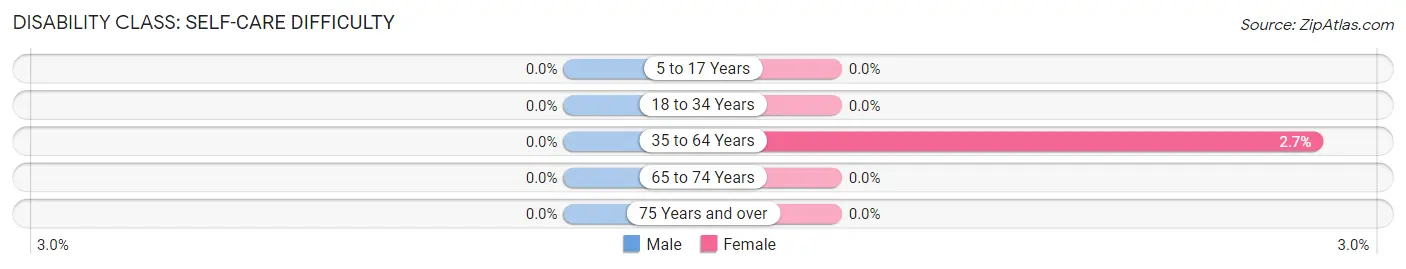
| Age Bracket | Male | Female |
| 5 to 17 Years | 0 (0.0%) | 0 (0.0%) |
| 18 to 34 Years | 0 (0.0%) | 0 (0.0%) |
| 35 to 64 Years | 0 (0.0%) | 27 (2.7%) |
| 65 to 74 Years | 0 (0.0%) | 0 (0.0%) |
| 75 Years and over | 0 (0.0%) | 0 (0.0%) |
Technology Access in McGovern
Computing Device Access in McGovern
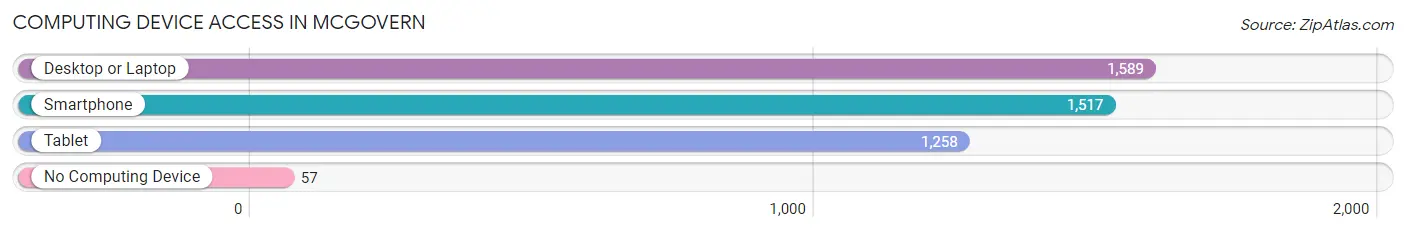
| Device Type | # Households | % Households |
| Desktop or Laptop | 1,589 | 91.0% |
| Smartphone | 1,517 | 86.8% |
| Tablet | 1,258 | 72.0% |
| No Computing Device | 57 | 3.3% |
| Total | 1,747 | 100.0% |
Internet Access in McGovern
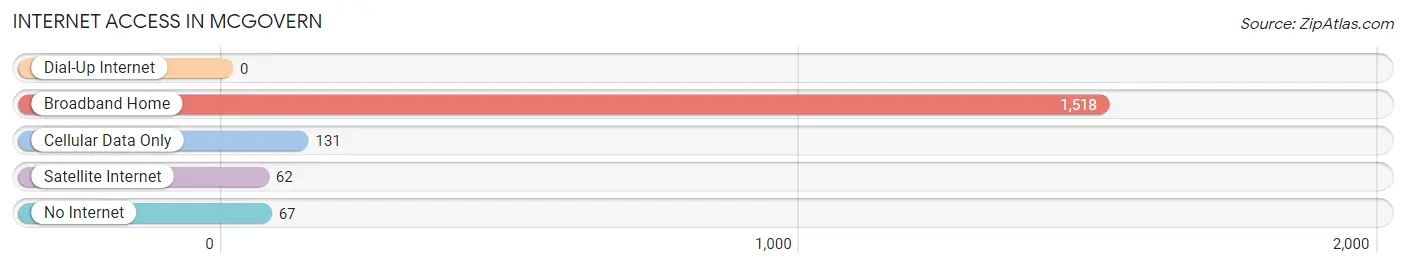
| Internet Type | # Households | % Households |
| Dial-Up Internet | 0 | 0.0% |
| Broadband Home | 1,518 | 86.9% |
| Cellular Data Only | 131 | 7.5% |
| Satellite Internet | 62 | 3.5% |
| No Internet | 67 | 3.8% |
| Total | 1,747 | 100.0% |
McGovern Summary
Introduction
McGovern is a small borough located in Schuylkill County, Pennsylvania. It is situated in the heart of the Anthracite Coal Region, and is surrounded by the towns of Frackville, Mahanoy City, and Shenandoah. The borough was founded in 1872 and was named after the prominent McGovern family, who were early settlers in the area. McGovern has a population of approximately 1,500 people and is known for its strong sense of community and its rich history.
History
McGovern was founded in 1872 by the McGovern family, who were early settlers in the area. The family had a long history in the region, having first arrived in the area in the late 1700s. The family was involved in the coal industry, and the town was named after them. The town was officially incorporated in 1872, and the first mayor was John McGovern.
The town grew rapidly in the late 1800s and early 1900s, as the coal industry flourished in the region. The town was home to several coal mines, and the population grew to over 3,000 people by the 1920s. The town was also home to several churches, schools, and businesses.
The town experienced a decline in the mid-1900s, as the coal industry began to decline. The population dropped to just over 1,500 people by the 2000s. Despite this, the town has maintained its strong sense of community and its rich history.
Geography
McGovern is located in Schuylkill County, Pennsylvania. It is situated in the heart of the Anthracite Coal Region, and is surrounded by the towns of Frackville, Mahanoy City, and Shenandoah. The town is located at an elevation of 1,000 feet above sea level.
The town is located in the Appalachian Mountains, and is surrounded by rolling hills and forests. The town is located near several rivers, including the Schuylkill River and the Little Schuylkill River. The town is also located near several state parks, including Locust Lake State Park and Tuscarora State Park.
Economy
McGovern’s economy is largely based on the coal industry. The town was once home to several coal mines, and the industry still plays an important role in the town’s economy. The town is also home to several small businesses, including restaurants, shops, and services.
The town is also home to several manufacturing companies, including a paper mill and a steel mill. The town is also home to several farms, and the surrounding area is known for its agricultural production.
Demographics
McGovern has a population of approximately 1,500 people. The town is predominantly white, with a small Hispanic population. The median household income is $37,000, and the median home value is $90,000. The town has a high rate of poverty, with nearly 30% of the population living below the poverty line.
Conclusion
McGovern is a small borough located in Schuylkill County, Pennsylvania. It is situated in the heart of the Anthracite Coal Region, and is surrounded by the towns of Frackville, Mahanoy City, and Shenandoah. The town was founded in 1872 and was named after the prominent McGovern family, who were early settlers in the area. McGovern has a population of approximately 1,500 people and is known for its strong sense of community and its rich history. The town’s economy is largely based on the coal industry, and the town is also home to several small businesses, manufacturing companies, and farms. The town is predominantly white, with a small Hispanic population. The median household income is $37,000, and the median home value is $90,000. The town has a high rate of poverty, with nearly 30% of the population living below the poverty line.
Common Questions
What is Per Capita Income in McGovern?
Per Capita income in McGovern is $56,370.
What is the Median Family Income in McGovern?
Median Family Income in McGovern is $123,125.
What is the Median Household income in McGovern?
Median Household Income in McGovern is $108,880.
What is Income or Wage Gap in McGovern?
Income or Wage Gap in McGovern is 31.0%.
Women in McGovern earn 69.0 cents for every dollar earned by a man.
What is Inequality or Gini Index in McGovern?
Inequality or Gini Index in McGovern is 0.37.
What is the Total Population of McGovern?
Total Population of McGovern is 4,194.
What is the Total Male Population of McGovern?
Total Male Population of McGovern is 2,061.
What is the Total Female Population of McGovern?
Total Female Population of McGovern is 2,133.
What is the Ratio of Males per 100 Females in McGovern?
There are 96.62 Males per 100 Females in McGovern.
What is the Ratio of Females per 100 Males in McGovern?
There are 103.49 Females per 100 Males in McGovern.
What is the Median Population Age in McGovern?
Median Population Age in McGovern is 44.9 Years.
What is the Average Family Size in McGovern
Average Family Size in McGovern is 2.7 People.
What is the Average Household Size in McGovern
Average Household Size in McGovern is 2.4 People.
How Large is the Labor Force in McGovern?
There are 2,446 People in the Labor Forcein in McGovern.
What is the Percentage of People in the Labor Force in McGovern?
69.2% of People are in the Labor Force in McGovern.
What is the Unemployment Rate in McGovern?
Unemployment Rate in McGovern is 4.0%.