Strasburg borough, PA Map & Demographics
Strasburg borough Overview
$39,762
PER CAPITA INCOME
$92,083
AVG FAMILY INCOME
$85,753
AVG HOUSEHOLD INCOME
14.5%
WAGE / INCOME GAP [ % ]
85.5¢/ $1
WAGE / INCOME GAP [ $ ]
0.34
INEQUALITY / GINI INDEX
3,097
TOTAL POPULATION
1,500
MALE POPULATION
1,597
FEMALE POPULATION
93.93
MALES / 100 FEMALES
106.47
FEMALES / 100 MALES
48.6
MEDIAN AGE
2.7
AVG FAMILY SIZE
2.5
AVG HOUSEHOLD SIZE
1,594
LABOR FORCE [ PEOPLE ]
63.6%
PERCENT IN LABOR FORCE
4.0%
UNEMPLOYMENT RATE
Income in Strasburg borough
Income Overview in Strasburg borough
Per Capita Income in Strasburg borough is $39,762, while median incomes of families and households are $92,083 and $85,753 respectively.
| Characteristic | Number | Measure |
| Per Capita Income | 3,097 | $39,762 |
| Median Family Income | 972 | $92,083 |
| Mean Family Income | 972 | $108,288 |
| Median Household Income | 1,252 | $85,753 |
| Mean Household Income | 1,252 | $97,060 |
| Income Deficit | 972 | $0 |
| Wage / Income Gap (%) | 3,097 | 14.55% |
| Wage / Income Gap ($) | 3,097 | 85.45¢ per $1 |
| Gini / Inequality Index | 3,097 | 0.34 |
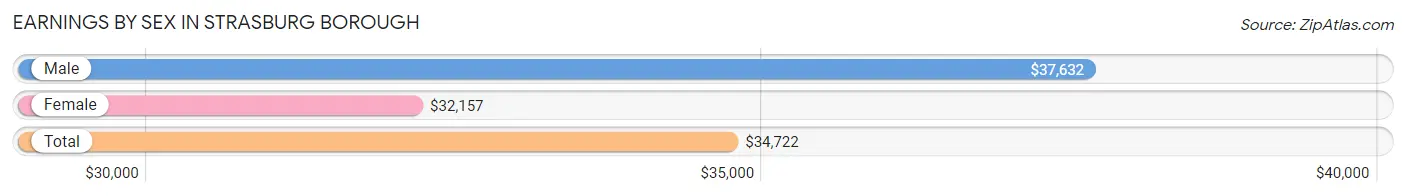
Earnings by Sex in Strasburg borough
Average Earnings in Strasburg borough are $34,722, $37,632 for men and $32,157 for women, a difference of 14.5%.
| Sex | Number | Average Earnings |
| Male | 918 (50.5%) | $37,632 |
| Female | 898 (49.4%) | $32,157 |
| Total | 1,816 (100.0%) | $34,722 |
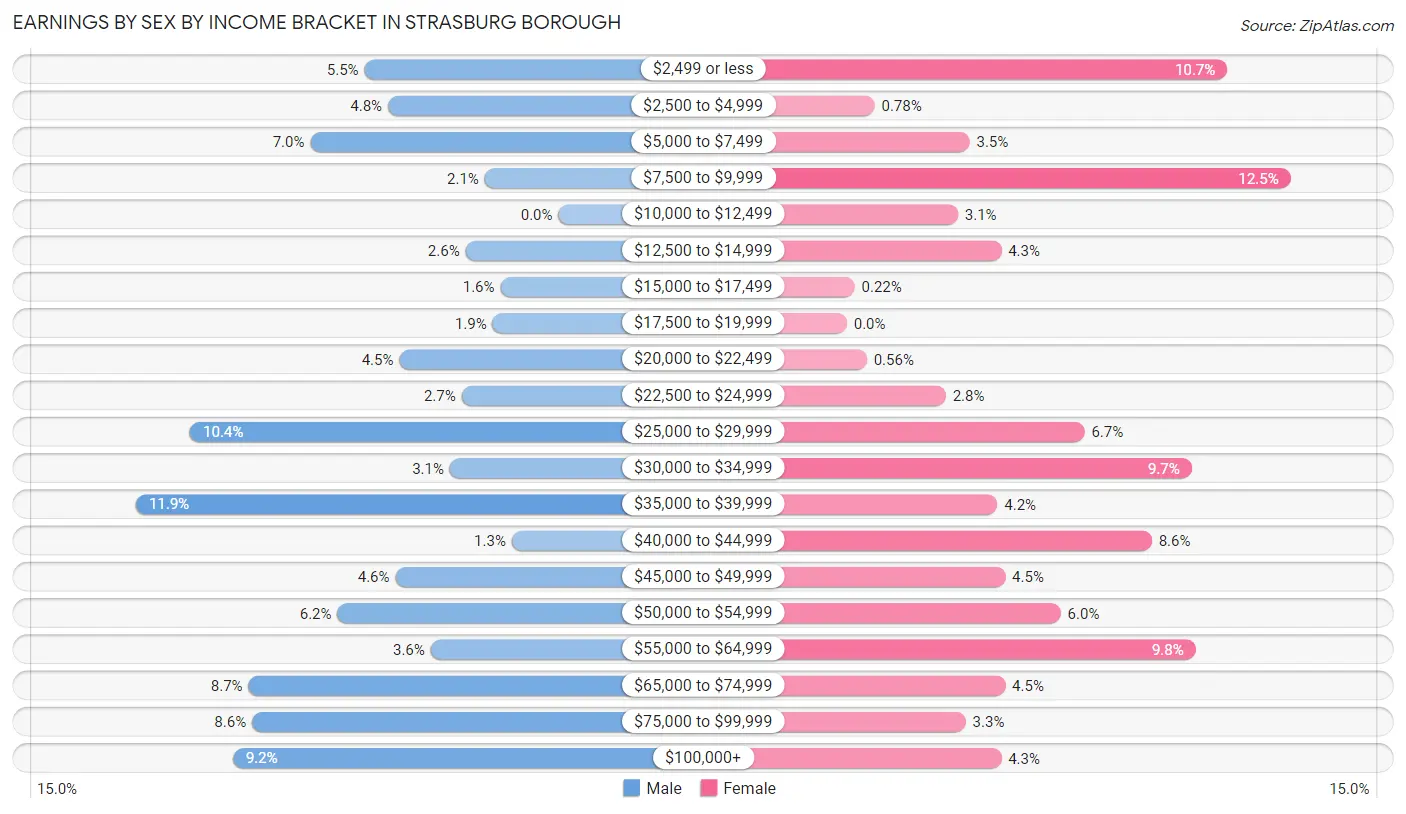
Earnings by Sex by Income Bracket in Strasburg borough
The most common earnings brackets in Strasburg borough are $35,000 to $39,999 for men (109 | 11.9%) and $7,500 to $9,999 for women (112 | 12.5%).
| Income | Male | Female |
| $2,499 or less | 50 (5.4%) | 96 (10.7%) |
| $2,500 to $4,999 | 44 (4.8%) | 7 (0.8%) |
| $5,000 to $7,499 | 64 (7.0%) | 31 (3.5%) |
| $7,500 to $9,999 | 19 (2.1%) | 112 (12.5%) |
| $10,000 to $12,499 | 0 (0.0%) | 28 (3.1%) |
| $12,500 to $14,999 | 24 (2.6%) | 39 (4.3%) |
| $15,000 to $17,499 | 15 (1.6%) | 2 (0.2%) |
| $17,500 to $19,999 | 17 (1.8%) | 0 (0.0%) |
| $20,000 to $22,499 | 41 (4.5%) | 5 (0.6%) |
| $22,500 to $24,999 | 25 (2.7%) | 25 (2.8%) |
| $25,000 to $29,999 | 95 (10.3%) | 60 (6.7%) |
| $30,000 to $34,999 | 28 (3.0%) | 87 (9.7%) |
| $35,000 to $39,999 | 109 (11.9%) | 38 (4.2%) |
| $40,000 to $44,999 | 12 (1.3%) | 77 (8.6%) |
| $45,000 to $49,999 | 42 (4.6%) | 40 (4.4%) |
| $50,000 to $54,999 | 57 (6.2%) | 54 (6.0%) |
| $55,000 to $64,999 | 33 (3.6%) | 88 (9.8%) |
| $65,000 to $74,999 | 80 (8.7%) | 40 (4.4%) |
| $75,000 to $99,999 | 79 (8.6%) | 30 (3.3%) |
| $100,000+ | 84 (9.1%) | 39 (4.3%) |
| Total | 918 (100.0%) | 898 (100.0%) |
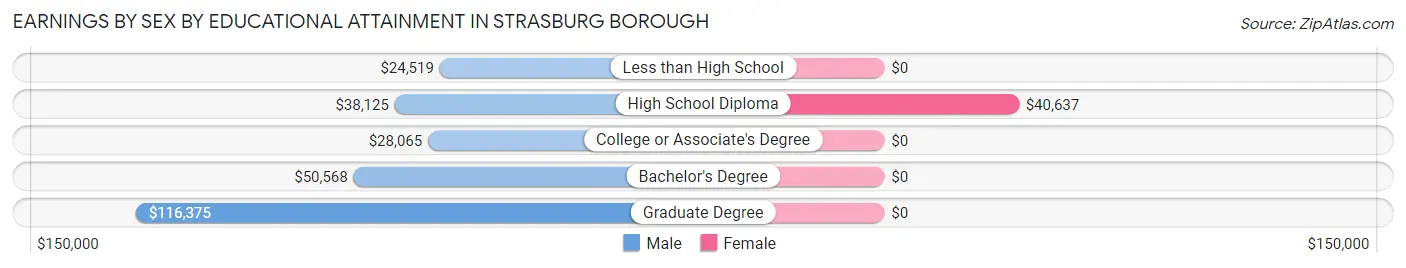
Earnings by Sex by Educational Attainment in Strasburg borough
Average earnings in Strasburg borough are $38,224 for men and $34,514 for women, a difference of 9.7%. Men with an educational attainment of graduate degree enjoy the highest average annual earnings of $116,375, while those with less than high school education earn the least with $24,519. Women with an educational attainment of high school diploma earn the most with the average annual earnings of $40,637, while those with high school diploma education have the smallest earnings of $40,637.
| Educational Attainment | Male Income | Female Income |
| Less than High School | $24,519 | $0 |
| High School Diploma | $38,125 | $40,637 |
| College or Associate's Degree | $28,065 | $0 |
| Bachelor's Degree | $50,568 | $0 |
| Graduate Degree | $116,375 | $0 |
| Total | $38,224 | $34,514 |
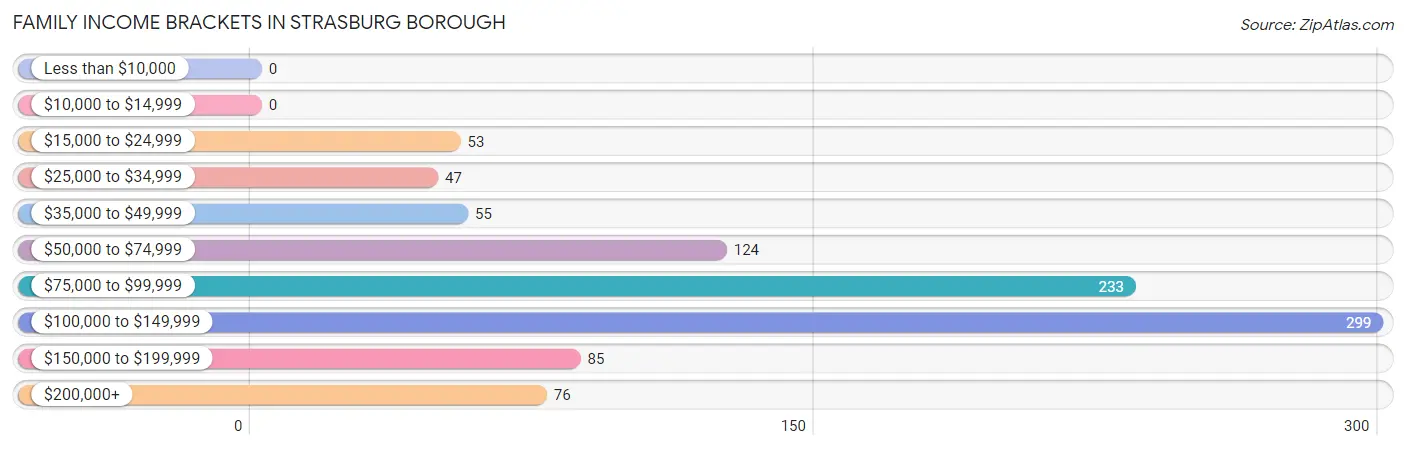
Family Income in Strasburg borough
Family Income Brackets in Strasburg borough
According to the Strasburg borough family income data, there are 299 families falling into the $100,000 to $149,999 income range, which is the most common income bracket and makes up 30.8% of all families.
| Income Bracket | # Families | % Families |
| Less than $10,000 | 0 | 0.0% |
| $10,000 to $14,999 | 0 | 0.0% |
| $15,000 to $24,999 | 53 | 5.5% |
| $25,000 to $34,999 | 47 | 4.8% |
| $35,000 to $49,999 | 55 | 5.7% |
| $50,000 to $74,999 | 124 | 12.8% |
| $75,000 to $99,999 | 233 | 24.0% |
| $100,000 to $149,999 | 299 | 30.8% |
| $150,000 to $199,999 | 85 | 8.7% |
| $200,000+ | 76 | 7.8% |
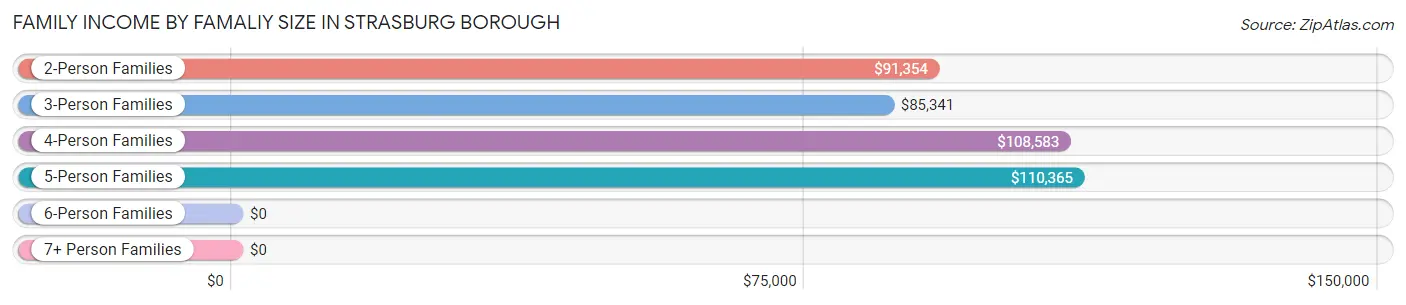
Family Income by Famaliy Size in Strasburg borough
5-person families (59 | 6.1%) account for the highest median family income in Strasburg borough with $110,365 per family, while 2-person families (608 | 62.5%) have the highest median income of $45,677 per family member.
| Income Bracket | # Families | Median Income |
| 2-Person Families | 608 (62.5%) | $91,354 |
| 3-Person Families | 171 (17.6%) | $85,341 |
| 4-Person Families | 129 (13.3%) | $108,583 |
| 5-Person Families | 59 (6.1%) | $110,365 |
| 6-Person Families | 5 (0.5%) | $0 |
| 7+ Person Families | 0 (0.0%) | $0 |
| Total | 972 (100.0%) | $92,083 |
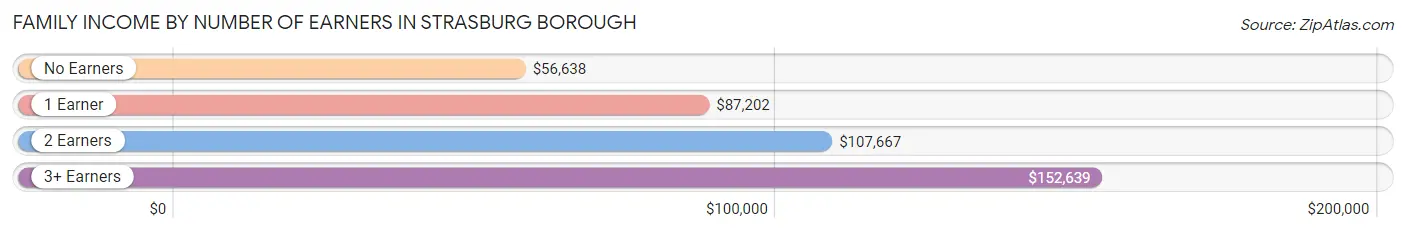
Family Income by Number of Earners in Strasburg borough
The median family income in Strasburg borough is $92,083, with families comprising 3+ earners (55) having the highest median family income of $152,639, while families with no earners (118) have the lowest median family income of $56,638, accounting for 5.7% and 12.1% of families, respectively.
| Number of Earners | # Families | Median Income |
| No Earners | 118 (12.1%) | $56,638 |
| 1 Earner | 309 (31.8%) | $87,202 |
| 2 Earners | 490 (50.4%) | $107,667 |
| 3+ Earners | 55 (5.7%) | $152,639 |
| Total | 972 (100.0%) | $92,083 |
Household Income in Strasburg borough
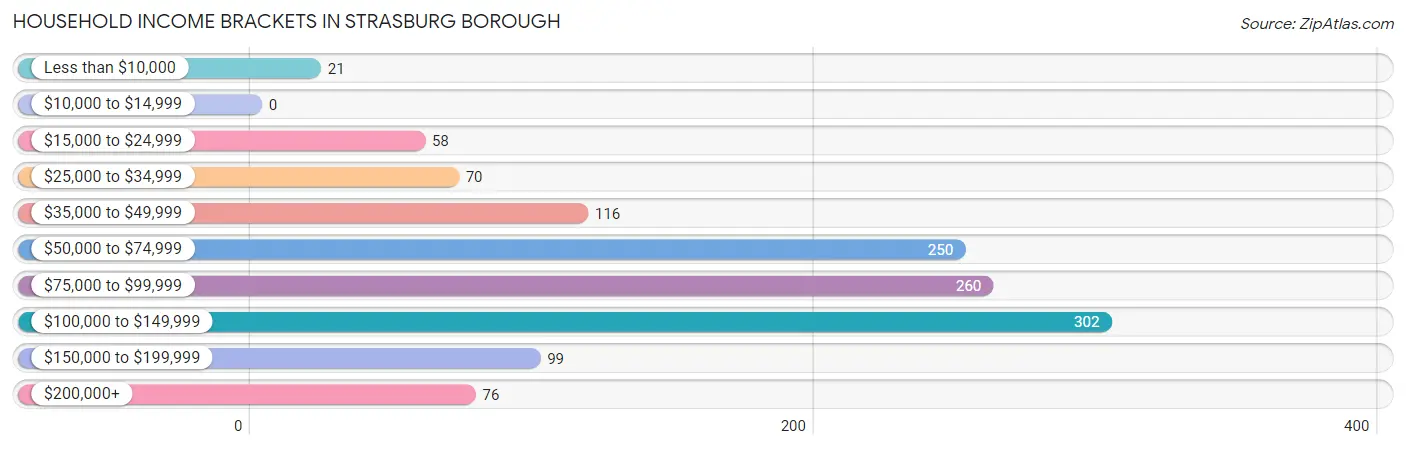
Household Income Brackets in Strasburg borough
With 302 households falling in the category, the $100,000 to $149,999 income range is the most frequent in Strasburg borough, accounting for 24.1% of all households.
| Income Bracket | # Households | % Households |
| Less than $10,000 | 21 | 1.7% |
| $10,000 to $14,999 | 0 | 0.0% |
| $15,000 to $24,999 | 58 | 4.6% |
| $25,000 to $34,999 | 70 | 5.6% |
| $35,000 to $49,999 | 116 | 9.3% |
| $50,000 to $74,999 | 250 | 20.0% |
| $75,000 to $99,999 | 260 | 20.8% |
| $100,000 to $149,999 | 302 | 24.1% |
| $150,000 to $199,999 | 99 | 7.9% |
| $200,000+ | 76 | 6.1% |
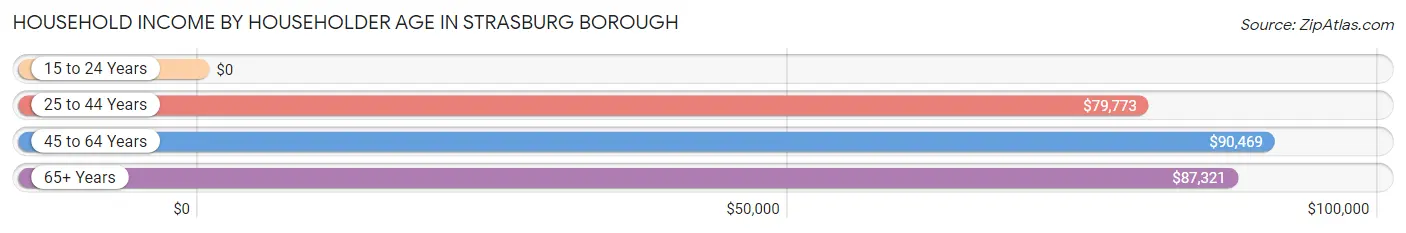
Household Income by Householder Age in Strasburg borough
The median household income in Strasburg borough is $85,753, with the highest median household income of $90,469 found in the 45 to 64 years age bracket for the primary householder. A total of 467 households (37.3%) fall into this category. Meanwhile, the 15 to 24 years age bracket for the primary householder has the lowest median household income of $0, with 5 households (0.4%) in this group.
| Income Bracket | # Households | Median Income |
| 15 to 24 Years | 5 (0.4%) | $0 |
| 25 to 44 Years | 286 (22.8%) | $79,773 |
| 45 to 64 Years | 467 (37.3%) | $90,469 |
| 65+ Years | 494 (39.5%) | $87,321 |
| Total | 1,252 (100.0%) | $85,753 |
Poverty in Strasburg borough
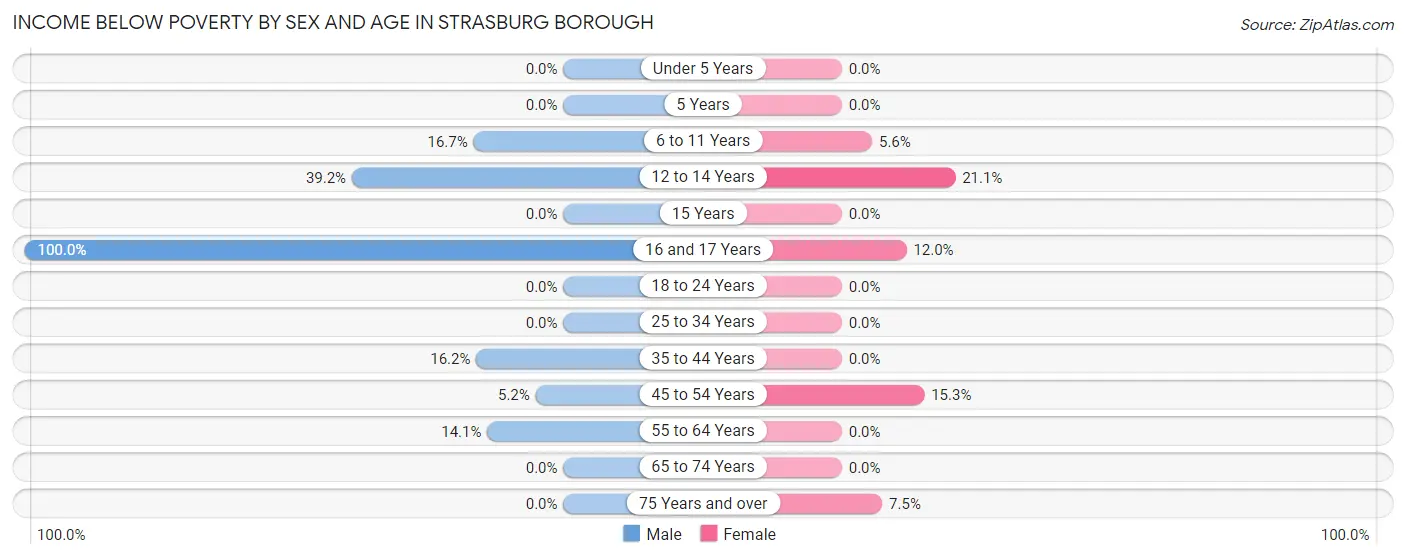
Income Below Poverty by Sex and Age in Strasburg borough
With 8.5% poverty level for males and 4.2% for females among the residents of Strasburg borough, 16 and 17 year old males and 12 to 14 year old females are the most vulnerable to poverty, with 10 males (100.0%) and 12 females (21.0%) in their respective age groups living below the poverty level.
| Age Bracket | Male | Female |
| Under 5 Years | 0 (0.0%) | 0 (0.0%) |
| 5 Years | 0 (0.0%) | 0 (0.0%) |
| 6 to 11 Years | 12 (16.7%) | 6 (5.6%) |
| 12 to 14 Years | 31 (39.2%) | 12 (21.0%) |
| 15 Years | 0 (0.0%) | 0 (0.0%) |
| 16 and 17 Years | 10 (100.0%) | 6 (12.0%) |
| 18 to 24 Years | 0 (0.0%) | 0 (0.0%) |
| 25 to 34 Years | 0 (0.0%) | 0 (0.0%) |
| 35 to 44 Years | 32 (16.2%) | 0 (0.0%) |
| 45 to 54 Years | 7 (5.1%) | 28 (15.3%) |
| 55 to 64 Years | 34 (14.1%) | 0 (0.0%) |
| 65 to 74 Years | 0 (0.0%) | 0 (0.0%) |
| 75 Years and over | 0 (0.0%) | 14 (7.5%) |
| Total | 126 (8.5%) | 66 (4.2%) |
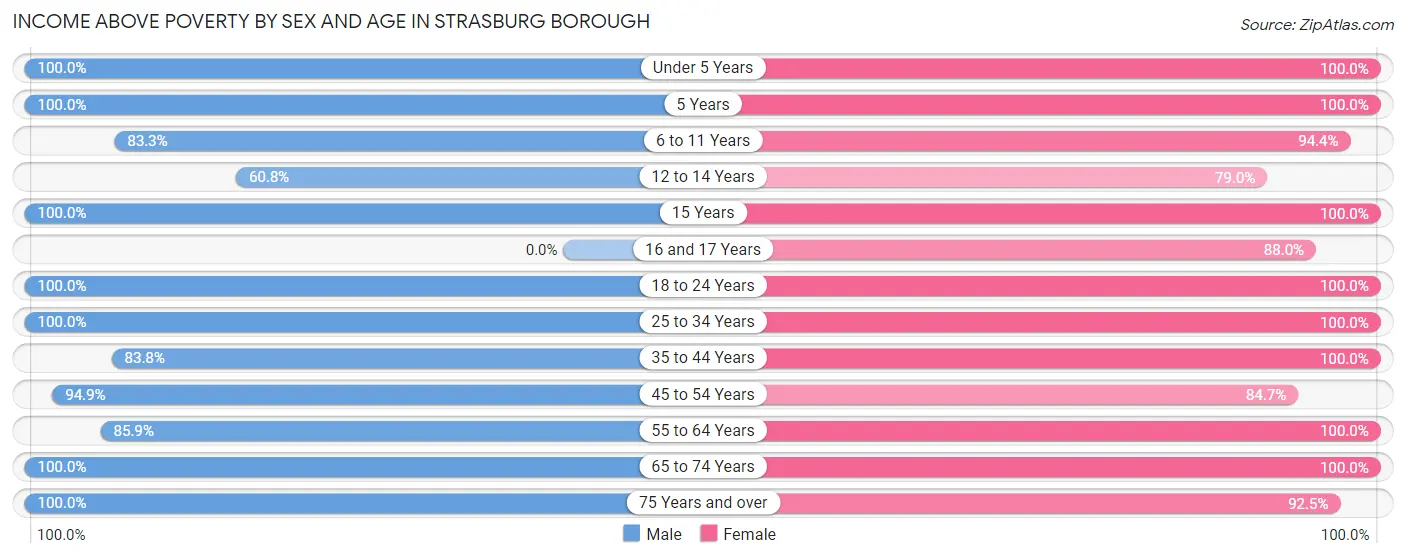
Income Above Poverty by Sex and Age in Strasburg borough
According to the poverty statistics in Strasburg borough, males aged under 5 years and females aged under 5 years are the age groups that are most secure financially, with 100.0% of males and 100.0% of females in these age groups living above the poverty line.
| Age Bracket | Male | Female |
| Under 5 Years | 61 (100.0%) | 85 (100.0%) |
| 5 Years | 20 (100.0%) | 16 (100.0%) |
| 6 to 11 Years | 60 (83.3%) | 101 (94.4%) |
| 12 to 14 Years | 48 (60.8%) | 45 (78.9%) |
| 15 Years | 26 (100.0%) | 36 (100.0%) |
| 16 and 17 Years | 0 (0.0%) | 44 (88.0%) |
| 18 to 24 Years | 36 (100.0%) | 66 (100.0%) |
| 25 to 34 Years | 186 (100.0%) | 177 (100.0%) |
| 35 to 44 Years | 166 (83.8%) | 113 (100.0%) |
| 45 to 54 Years | 129 (94.9%) | 155 (84.7%) |
| 55 to 64 Years | 207 (85.9%) | 290 (100.0%) |
| 65 to 74 Years | 310 (100.0%) | 207 (100.0%) |
| 75 Years and over | 117 (100.0%) | 173 (92.5%) |
| Total | 1,366 (91.5%) | 1,508 (95.8%) |
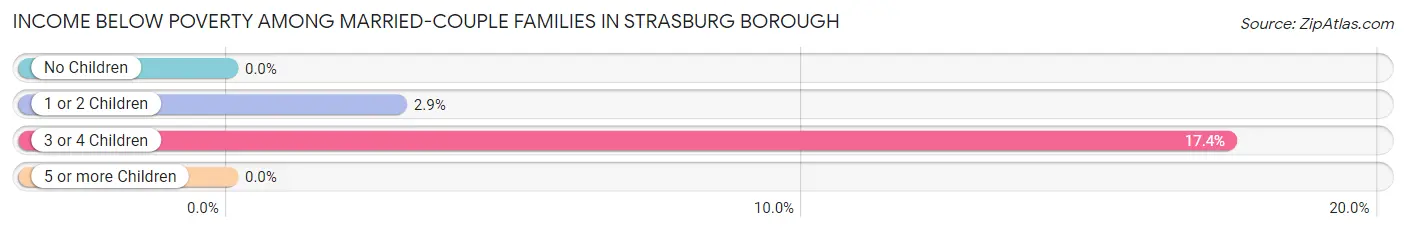
Income Below Poverty Among Married-Couple Families in Strasburg borough
The poverty statistics for married-couple families in Strasburg borough show that 1.8% or 14 of the total 791 families live below the poverty line. Families with 3 or 4 children have the highest poverty rate of 17.4%, comprising of 8 families. On the other hand, families with no children have the lowest poverty rate of 0.0%, which includes 0 families.
| Children | Above Poverty | Below Poverty |
| No Children | 541 (100.0%) | 0 (0.0%) |
| 1 or 2 Children | 198 (97.1%) | 6 (2.9%) |
| 3 or 4 Children | 38 (82.6%) | 8 (17.4%) |
| 5 or more Children | 0 (0.0%) | 0 (0.0%) |
| Total | 777 (98.2%) | 14 (1.8%) |
Income Below Poverty Among Single-Parent Households in Strasburg borough
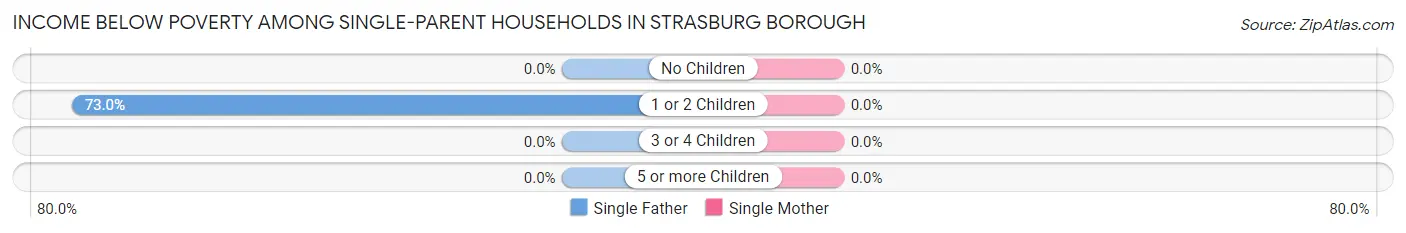
| Children | Single Father | Single Mother |
| No Children | 0 (0.0%) | 0 (0.0%) |
| 1 or 2 Children | 27 (73.0%) | 0 (0.0%) |
| 3 or 4 Children | 0 (0.0%) | 0 (0.0%) |
| 5 or more Children | 0 (0.0%) | 0 (0.0%) |
| Total | 27 (32.5%) | 0 (0.0%) |
Income Below Poverty Among Married-Couple vs Single-Parent Households in Strasburg borough
The poverty data for Strasburg borough shows that 14 of the married-couple family households (1.8%) and 27 of the single-parent households (14.9%) are living below the poverty level. Within the married-couple family households, those with 3 or 4 children have the highest poverty rate, with 8 households (17.4%) falling below the poverty line. Among the single-parent households, those with 1 or 2 children have the highest poverty rate, with 27 household (23.1%) living below poverty.
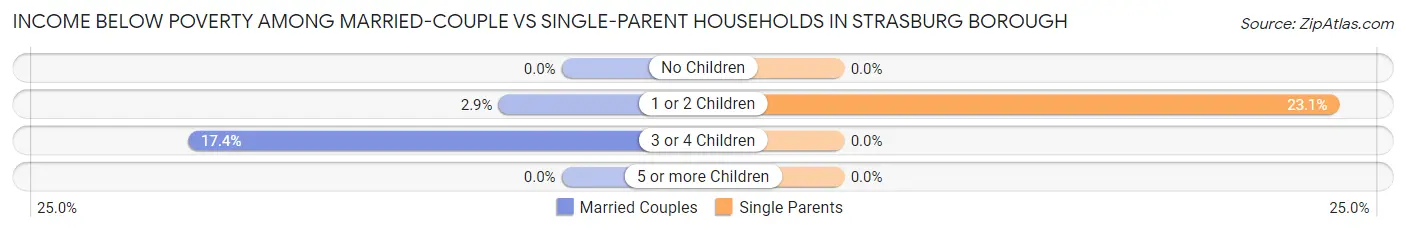
| Children | Married-Couple Families | Single-Parent Households |
| No Children | 0 (0.0%) | 0 (0.0%) |
| 1 or 2 Children | 6 (2.9%) | 27 (23.1%) |
| 3 or 4 Children | 8 (17.4%) | 0 (0.0%) |
| 5 or more Children | 0 (0.0%) | 0 (0.0%) |
| Total | 14 (1.8%) | 27 (14.9%) |
Race in Strasburg borough
The most populous races in Strasburg borough are White / Caucasian (2,930 | 94.6%), Hispanic or Latino (128 | 4.1%), and Two or more Races (121 | 3.9%).
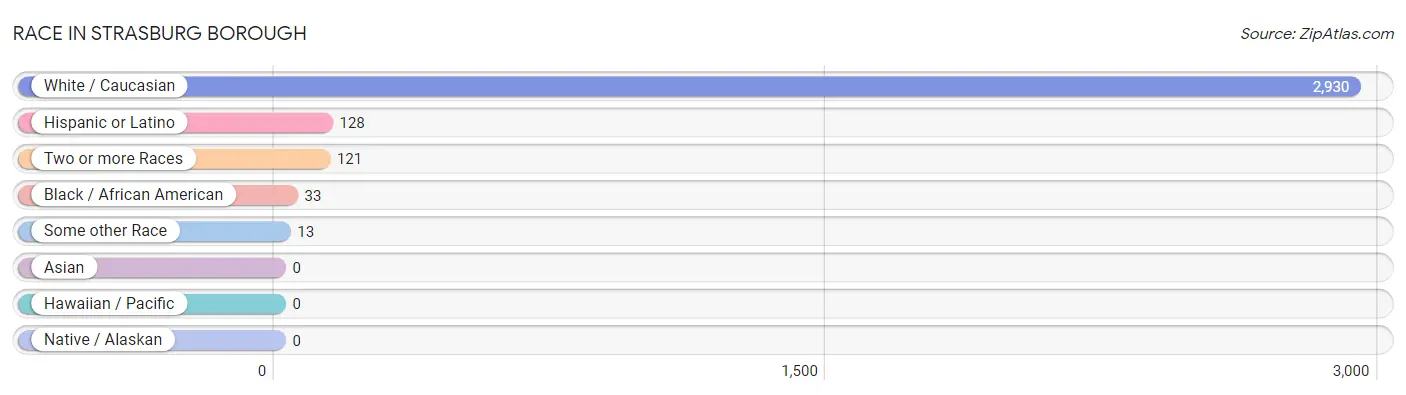
| Race | # Population | % Population |
| Asian | 0 | 0.0% |
| Black / African American | 33 | 1.1% |
| Hawaiian / Pacific | 0 | 0.0% |
| Hispanic or Latino | 128 | 4.1% |
| Native / Alaskan | 0 | 0.0% |
| White / Caucasian | 2,930 | 94.6% |
| Two or more Races | 121 | 3.9% |
| Some other Race | 13 | 0.4% |
| Total | 3,097 | 100.0% |
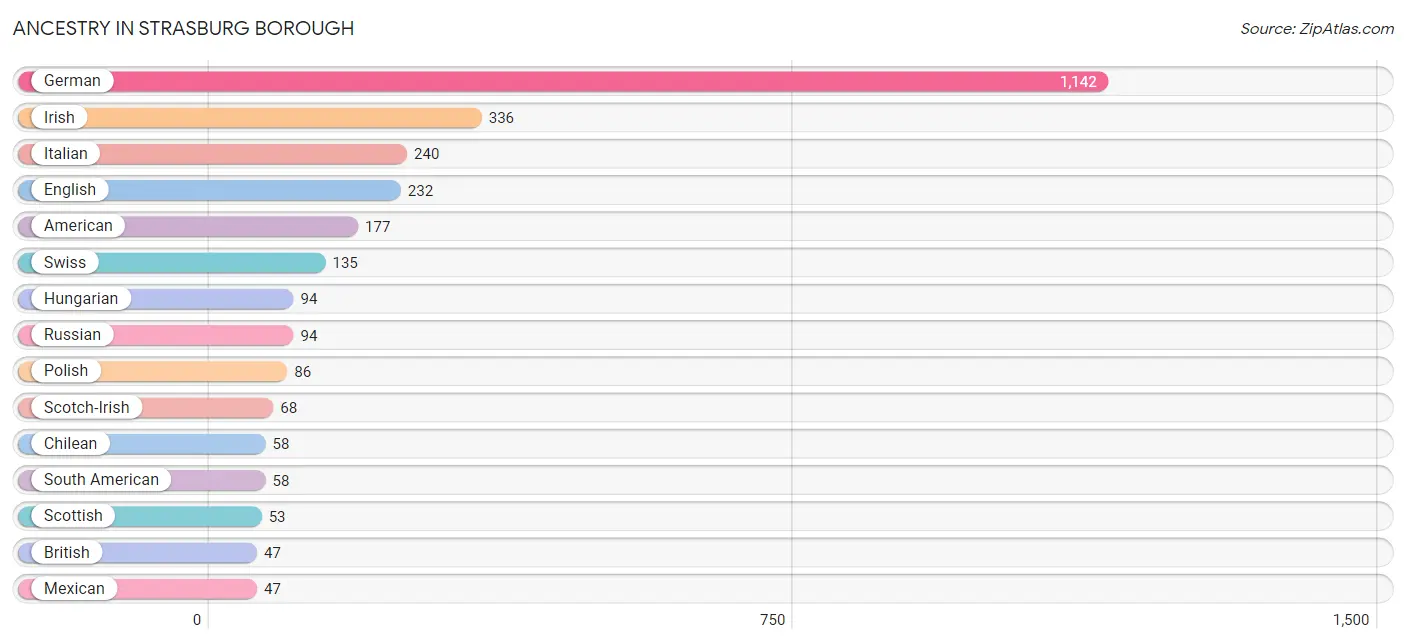
Ancestry in Strasburg borough
The most populous ancestries reported in Strasburg borough are German (1,142 | 36.9%), Irish (336 | 10.8%), Italian (240 | 7.7%), English (232 | 7.5%), and American (177 | 5.7%), together accounting for 68.7% of all Strasburg borough residents.
| Ancestry | # Population | % Population |
| American | 177 | 5.7% |
| British | 47 | 1.5% |
| Canadian | 9 | 0.3% |
| Chilean | 58 | 1.9% |
| Croatian | 12 | 0.4% |
| Czech | 26 | 0.8% |
| Dutch | 33 | 1.1% |
| English | 232 | 7.5% |
| European | 11 | 0.4% |
| French | 18 | 0.6% |
| German | 1,142 | 36.9% |
| Hungarian | 94 | 3.0% |
| Icelander | 24 | 0.8% |
| Irish | 336 | 10.8% |
| Italian | 240 | 7.7% |
| Mexican | 47 | 1.5% |
| Norwegian | 28 | 0.9% |
| Pennsylvania German | 11 | 0.4% |
| Polish | 86 | 2.8% |
| Puerto Rican | 23 | 0.7% |
| Russian | 94 | 3.0% |
| Scotch-Irish | 68 | 2.2% |
| Scottish | 53 | 1.7% |
| South American | 58 | 1.9% |
| Swedish | 26 | 0.8% |
| Swiss | 135 | 4.4% |
| Welsh | 11 | 0.4% | View All 27 Rows |
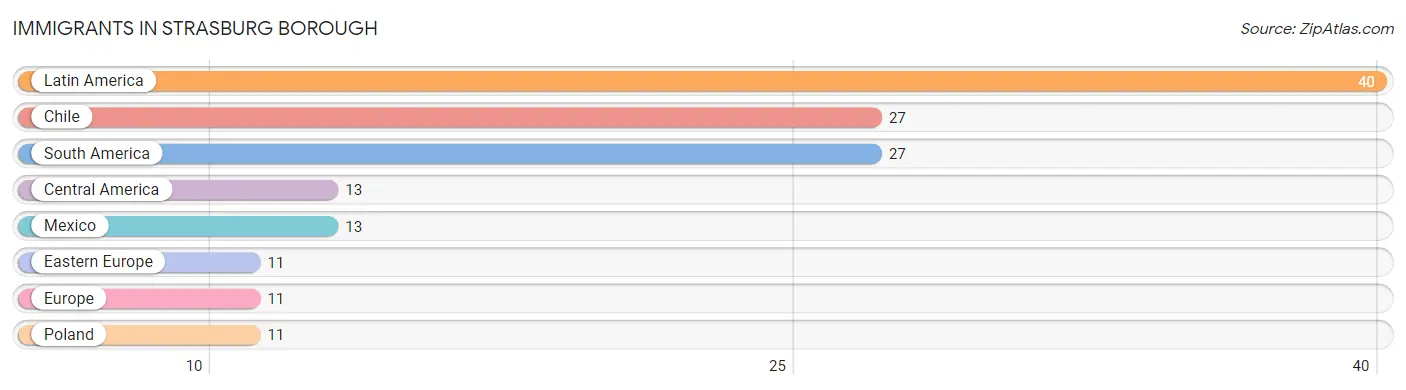
Immigrants in Strasburg borough
The most numerous immigrant groups reported in Strasburg borough came from Latin America (40 | 1.3%), Chile (27 | 0.9%), South America (27 | 0.9%), Central America (13 | 0.4%), and Mexico (13 | 0.4%), together accounting for 3.9% of all Strasburg borough residents.
| Immigration Origin | # Population | % Population |
| Central America | 13 | 0.4% |
| Chile | 27 | 0.9% |
| Eastern Europe | 11 | 0.4% |
| Europe | 11 | 0.4% |
| Latin America | 40 | 1.3% |
| Mexico | 13 | 0.4% |
| Poland | 11 | 0.4% |
| South America | 27 | 0.9% | View All 8 Rows |
Sex and Age in Strasburg borough
Sex and Age in Strasburg borough
The most populous age groups in Strasburg borough are 65 to 69 Years (160 | 10.7%) for men and 70 to 74 Years (187 | 11.7%) for women.
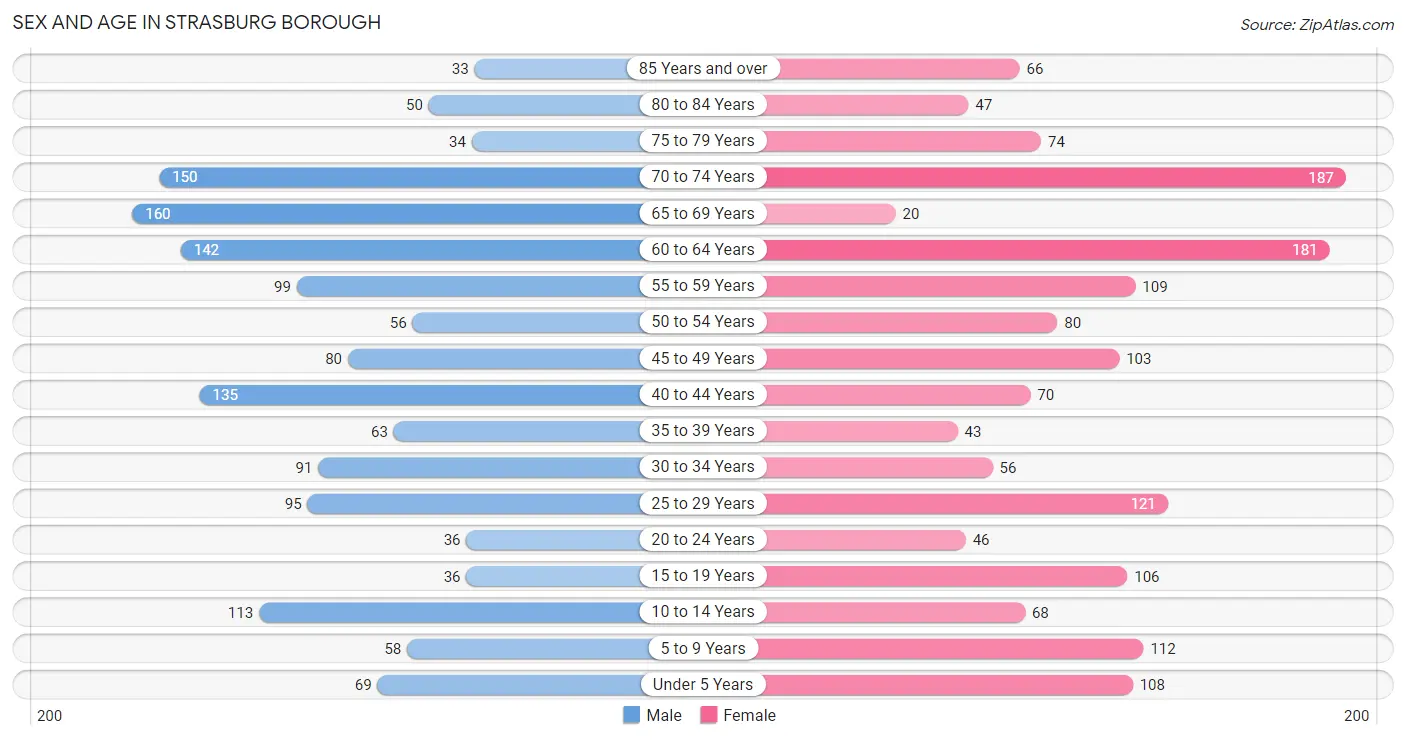
| Age Bracket | Male | Female |
| Under 5 Years | 69 (4.6%) | 108 (6.8%) |
| 5 to 9 Years | 58 (3.9%) | 112 (7.0%) |
| 10 to 14 Years | 113 (7.5%) | 68 (4.3%) |
| 15 to 19 Years | 36 (2.4%) | 106 (6.6%) |
| 20 to 24 Years | 36 (2.4%) | 46 (2.9%) |
| 25 to 29 Years | 95 (6.3%) | 121 (7.6%) |
| 30 to 34 Years | 91 (6.1%) | 56 (3.5%) |
| 35 to 39 Years | 63 (4.2%) | 43 (2.7%) |
| 40 to 44 Years | 135 (9.0%) | 70 (4.4%) |
| 45 to 49 Years | 80 (5.3%) | 103 (6.5%) |
| 50 to 54 Years | 56 (3.7%) | 80 (5.0%) |
| 55 to 59 Years | 99 (6.6%) | 109 (6.8%) |
| 60 to 64 Years | 142 (9.5%) | 181 (11.3%) |
| 65 to 69 Years | 160 (10.7%) | 20 (1.3%) |
| 70 to 74 Years | 150 (10.0%) | 187 (11.7%) |
| 75 to 79 Years | 34 (2.3%) | 74 (4.6%) |
| 80 to 84 Years | 50 (3.3%) | 47 (2.9%) |
| 85 Years and over | 33 (2.2%) | 66 (4.1%) |
| Total | 1,500 (100.0%) | 1,597 (100.0%) |
Families and Households in Strasburg borough
Median Family Size in Strasburg borough
The median family size in Strasburg borough is 2.73 persons per family, with married-couple families (791 | 81.4%) accounting for the largest median family size of 2.83 persons per family. On the other hand, single male/father families (83 | 8.5%) represent the smallest median family size with 2.28 persons per family.
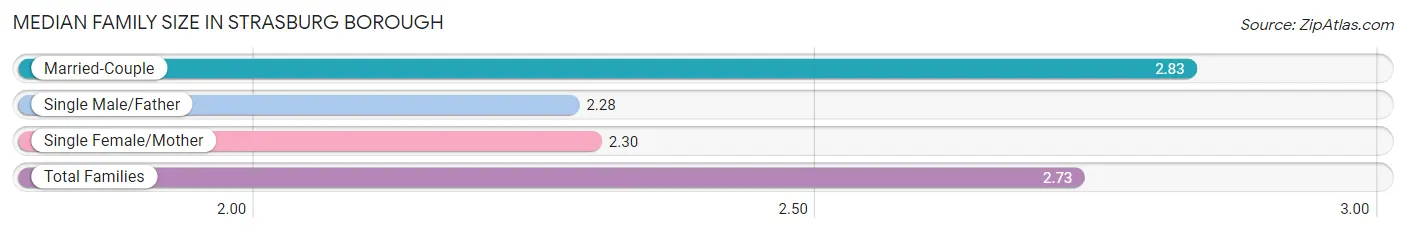
| Family Type | # Families | Family Size |
| Married-Couple | 791 (81.4%) | 2.83 |
| Single Male/Father | 83 (8.5%) | 2.28 |
| Single Female/Mother | 98 (10.1%) | 2.30 |
| Total Families | 972 (100.0%) | 2.73 |
Median Household Size in Strasburg borough
The median household size in Strasburg borough is 2.47 persons per household, with married-couple households (791 | 63.2%) accounting for the largest median household size of 2.84 persons per household. non-family households (280 | 22.4%) represent the smallest median household size with 1.41 persons per household.
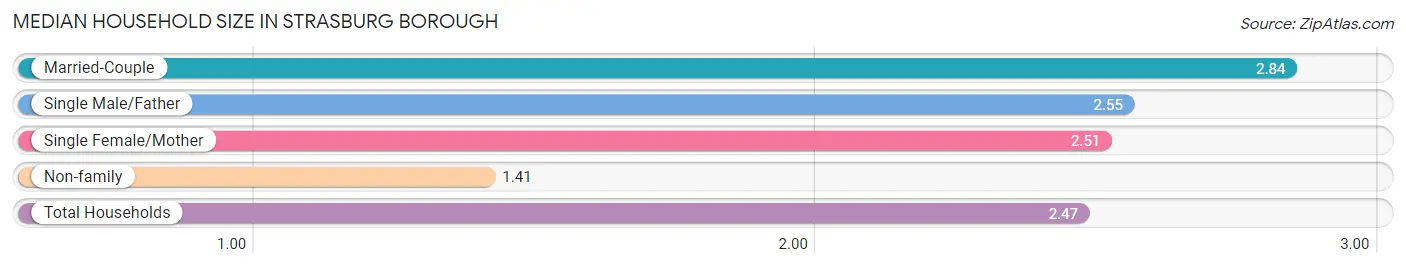
| Household Type | # Households | Household Size |
| Married-Couple | 791 (63.2%) | 2.84 |
| Single Male/Father | 83 (6.6%) | 2.55 |
| Single Female/Mother | 98 (7.8%) | 2.51 |
| Non-family | 280 (22.4%) | 1.41 |
| Total Households | 1,252 (100.0%) | 2.47 |
Household Size by Marriage Status in Strasburg borough
Out of a total of 1,252 households in Strasburg borough, 972 (77.6%) are family households, while 280 (22.4%) are nonfamily households. The most numerous type of family households are 2-person households, comprising 580, and the most common type of nonfamily households are 1-person households, comprising 196.
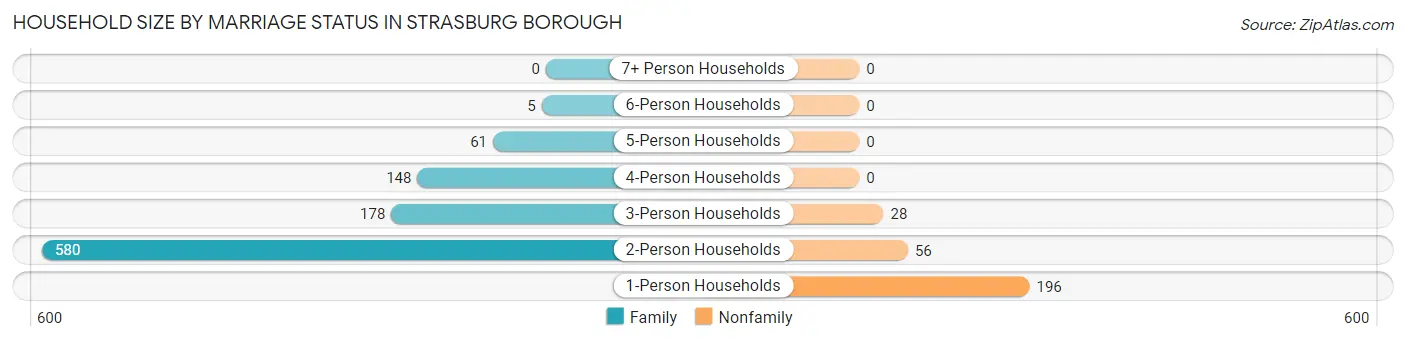
| Household Size | Family Households | Nonfamily Households |
| 1-Person Households | - | 196 (15.7%) |
| 2-Person Households | 580 (46.3%) | 56 (4.5%) |
| 3-Person Households | 178 (14.2%) | 28 (2.2%) |
| 4-Person Households | 148 (11.8%) | 0 (0.0%) |
| 5-Person Households | 61 (4.9%) | 0 (0.0%) |
| 6-Person Households | 5 (0.4%) | 0 (0.0%) |
| 7+ Person Households | 0 (0.0%) | 0 (0.0%) |
| Total | 972 (77.6%) | 280 (22.4%) |
Female Fertility in Strasburg borough
Fertility by Age in Strasburg borough
Average fertility rate in Strasburg borough is 48.0 births per 1,000 women. Women in the age bracket of 20 to 34 years have the highest fertility rate with 117.0 births per 1,000 women. Women in the age bracket of 20 to 34 years acount for 100.0% of all women with births.
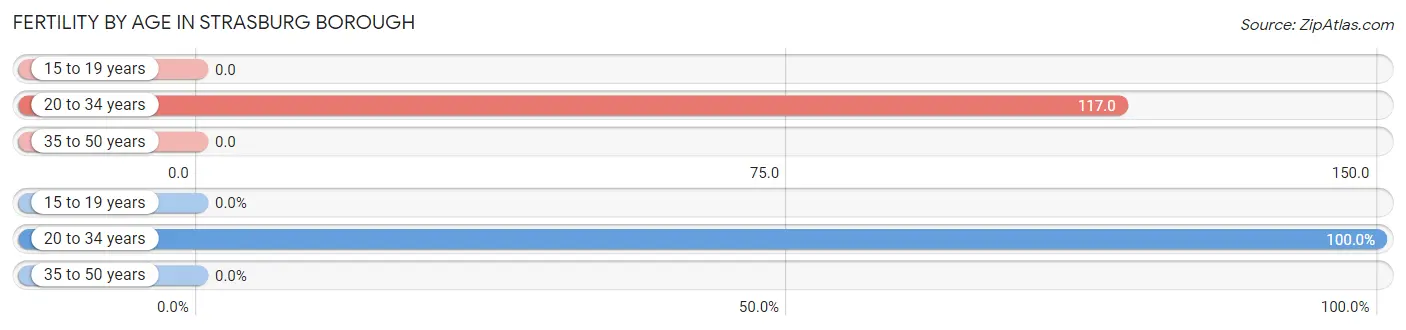
| Age Bracket | Women with Births | Births / 1,000 Women |
| 15 to 19 years | 0 (0.0%) | 0.0 |
| 20 to 34 years | 26 (100.0%) | 117.0 |
| 35 to 50 years | 0 (0.0%) | 0.0 |
| Total | 26 (100.0%) | 48.0 |
Fertility by Age by Marriage Status in Strasburg borough
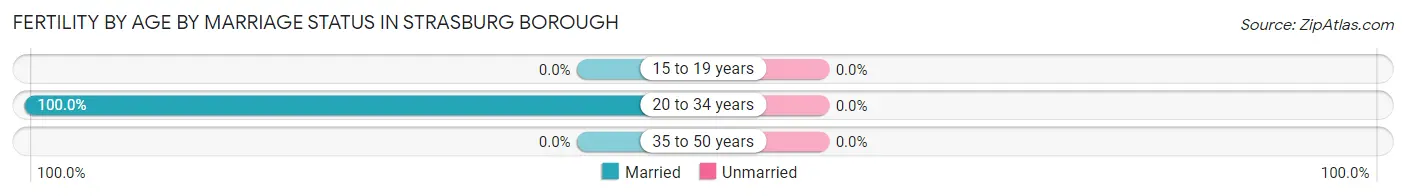
| Age Bracket | Married | Unmarried |
| 15 to 19 years | 0 (0.0%) | 0 (0.0%) |
| 20 to 34 years | 26 (100.0%) | 0 (0.0%) |
| 35 to 50 years | 0 (0.0%) | 0 (0.0%) |
| Total | 26 (100.0%) | 0 (0.0%) |
Fertility by Education in Strasburg borough
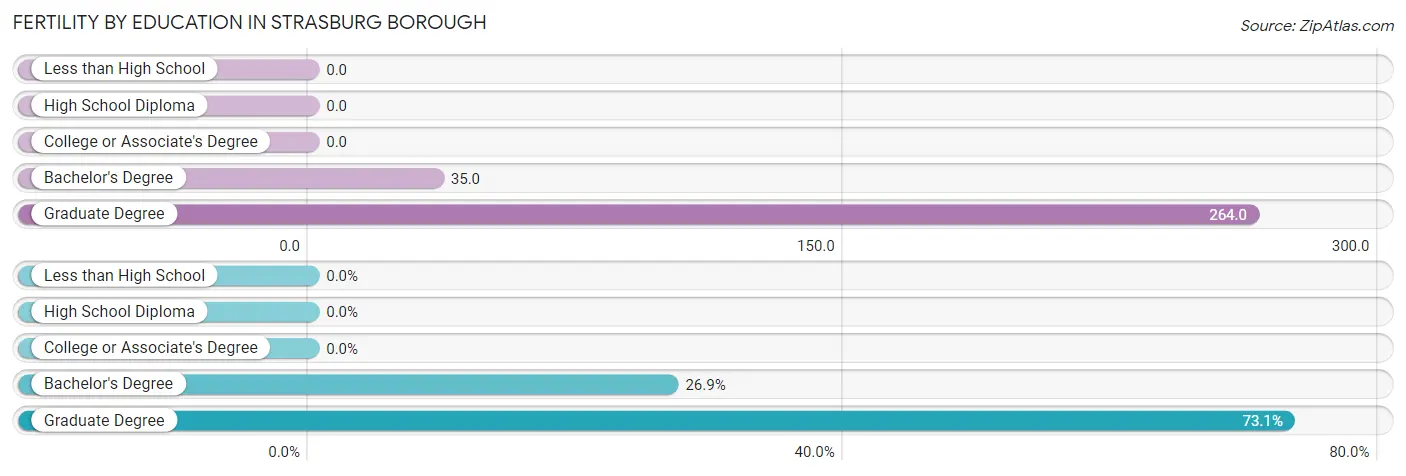
| Educational Attainment | Women with Births | Births / 1,000 Women |
| Less than High School | 0 (0.0%) | 0.0 |
| High School Diploma | 0 (0.0%) | 0.0 |
| College or Associate's Degree | 0 (0.0%) | 0.0 |
| Bachelor's Degree | 7 (26.9%) | 35.0 |
| Graduate Degree | 19 (73.1%) | 264.0 |
| Total | 26 (100.0%) | 48.0 |
Fertility by Education by Marriage Status in Strasburg borough
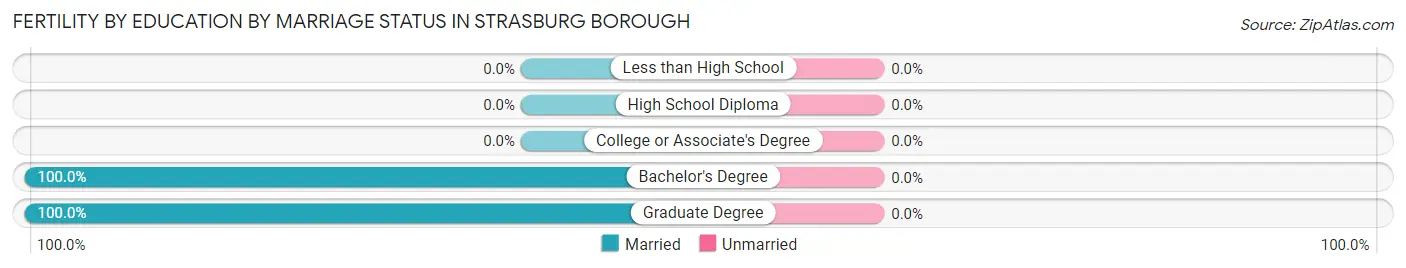
| Educational Attainment | Married | Unmarried |
| Less than High School | 0 (0.0%) | 0 (0.0%) |
| High School Diploma | 0 (0.0%) | 0 (0.0%) |
| College or Associate's Degree | 0 (0.0%) | 0 (0.0%) |
| Bachelor's Degree | 7 (100.0%) | 0 (0.0%) |
| Graduate Degree | 19 (100.0%) | 0 (0.0%) |
| Total | 26 (100.0%) | 0 (0.0%) |
Employment Characteristics in Strasburg borough
Employment by Class of Employer in Strasburg borough
Among the 1,511 employed individuals in Strasburg borough, private company employees (935 | 61.9%), not-for-profit organizations (246 | 16.3%), and local government employees (188 | 12.4%) make up the most common classes of employment.
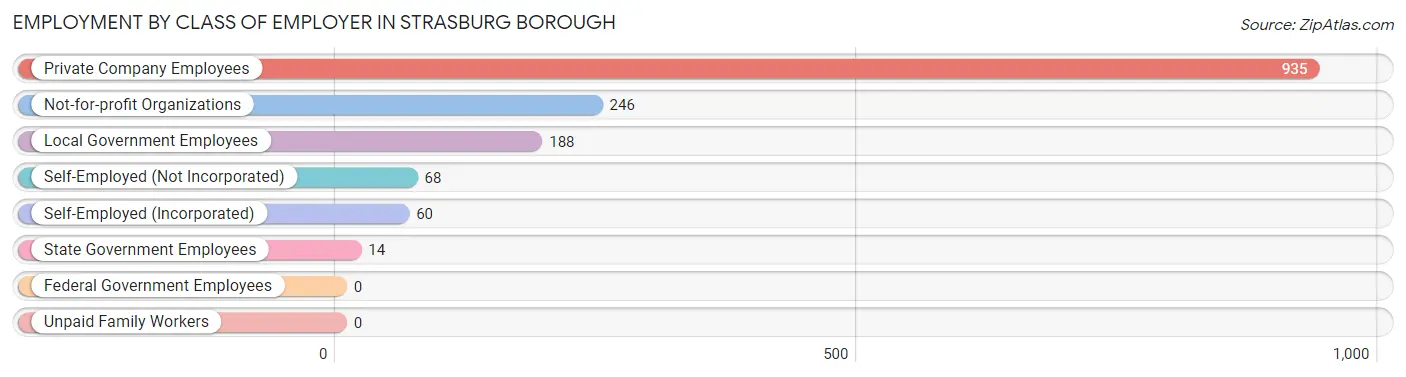
| Employer Class | # Employees | % Employees |
| Private Company Employees | 935 | 61.9% |
| Self-Employed (Incorporated) | 60 | 4.0% |
| Self-Employed (Not Incorporated) | 68 | 4.5% |
| Not-for-profit Organizations | 246 | 16.3% |
| Local Government Employees | 188 | 12.4% |
| State Government Employees | 14 | 0.9% |
| Federal Government Employees | 0 | 0.0% |
| Unpaid Family Workers | 0 | 0.0% |
| Total | 1,511 | 100.0% |
Employment Status by Age in Strasburg borough
According to the labor force statistics for Strasburg borough, out of the total population over 16 years of age (2,507), 63.6% or 1,594 individuals are in the labor force, with 4.0% or 64 of them unemployed. The age group with the highest labor force participation rate is 20 to 24 years, with 100.0% or 82 individuals in the labor force. Within the labor force, the 35 to 44 years age range has the highest percentage of unemployed individuals, with 11.9% or 37 of them being unemployed.
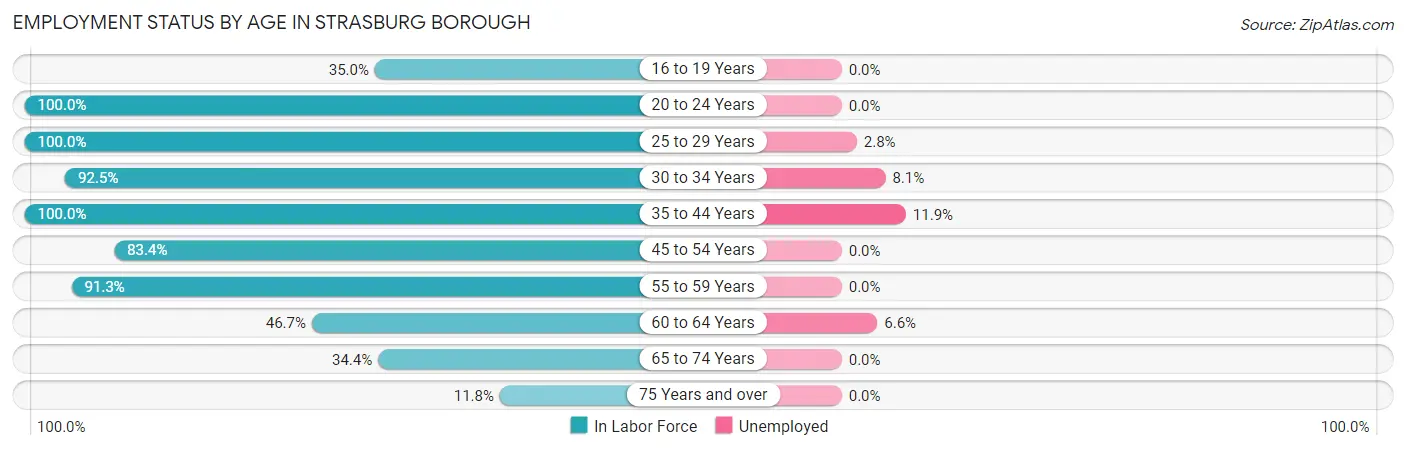
| Age Bracket | In Labor Force | Unemployed |
| 16 to 19 Years | 28 (35.0%) | 0 (0.0%) |
| 20 to 24 Years | 82 (100.0%) | 0 (0.0%) |
| 25 to 29 Years | 216 (100.0%) | 6 (2.8%) |
| 30 to 34 Years | 136 (92.5%) | 11 (8.1%) |
| 35 to 44 Years | 311 (100.0%) | 37 (11.9%) |
| 45 to 54 Years | 266 (83.4%) | 0 (0.0%) |
| 55 to 59 Years | 190 (91.3%) | 0 (0.0%) |
| 60 to 64 Years | 151 (46.7%) | 10 (6.6%) |
| 65 to 74 Years | 178 (34.4%) | 0 (0.0%) |
| 75 Years and over | 36 (11.8%) | 0 (0.0%) |
| Total | 1,594 (63.6%) | 64 (4.0%) |
Employment Status by Educational Attainment in Strasburg borough
According to labor force statistics for Strasburg borough, 83.3% of individuals (1,269) out of the total population between 25 and 64 years of age (1,524) are in the labor force, with 5.0% or 63 of them being unemployed. The group with the highest labor force participation rate are those with the educational attainment of bachelor's degree or higher, with 94.2% or 555 individuals in the labor force. Within the labor force, individuals with high school diploma education have the highest percentage of unemployment, with 11.0% or 48 of them being unemployed.
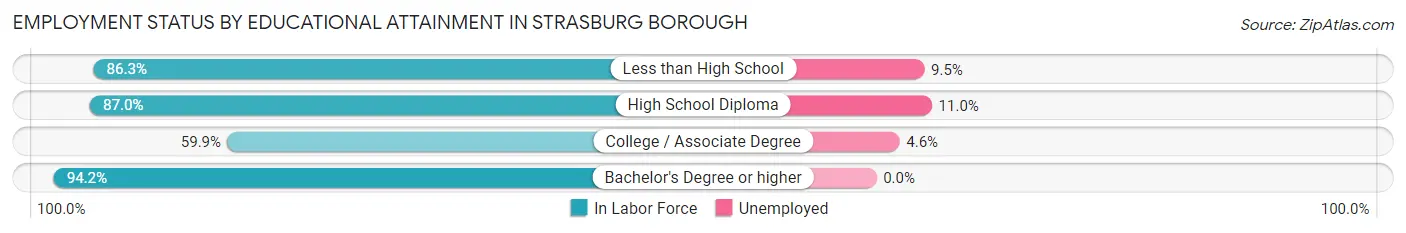
| Educational Attainment | In Labor Force | Unemployed |
| Less than High School | 63 (86.3%) | 7 (9.5%) |
| High School Diploma | 435 (87.0%) | 55 (11.0%) |
| College / Associate Degree | 217 (59.9%) | 17 (4.6%) |
| Bachelor's Degree or higher | 555 (94.2%) | 0 (0.0%) |
| Total | 1,269 (83.3%) | 76 (5.0%) |
Employment Occupations by Sex in Strasburg borough
Management, Business, Science and Arts Occupations
The most common Management, Business, Science and Arts occupations in Strasburg borough are Community & Social Service (274 | 17.9%), Education Instruction & Library (132 | 8.6%), Management (81 | 5.3%), Education, Arts & Media (78 | 5.1%), and Business & Financial (75 | 4.9%).
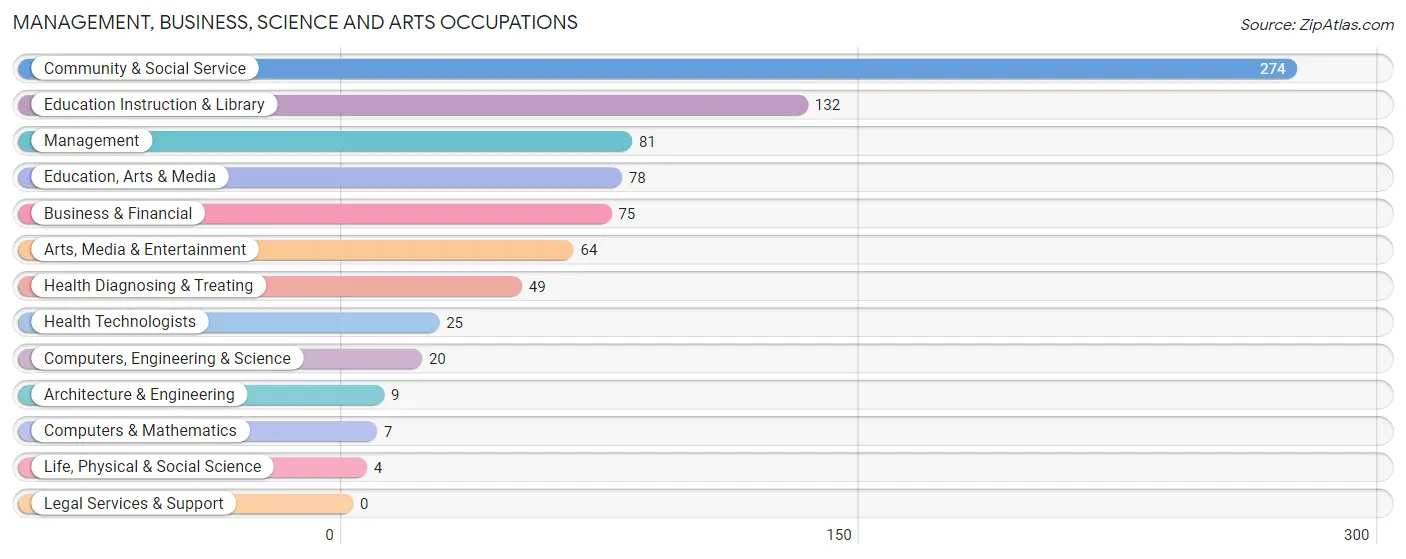
Management, Business, Science and Arts Occupations by Sex
Within the Management, Business, Science and Arts occupations in Strasburg borough, the most male-oriented occupations are Architecture & Engineering (100.0%), Management (63.0%), and Education Instruction & Library (57.6%), while the most female-oriented occupations are Computers & Mathematics (100.0%), Life, Physical & Social Science (100.0%), and Education, Arts & Media (93.6%).
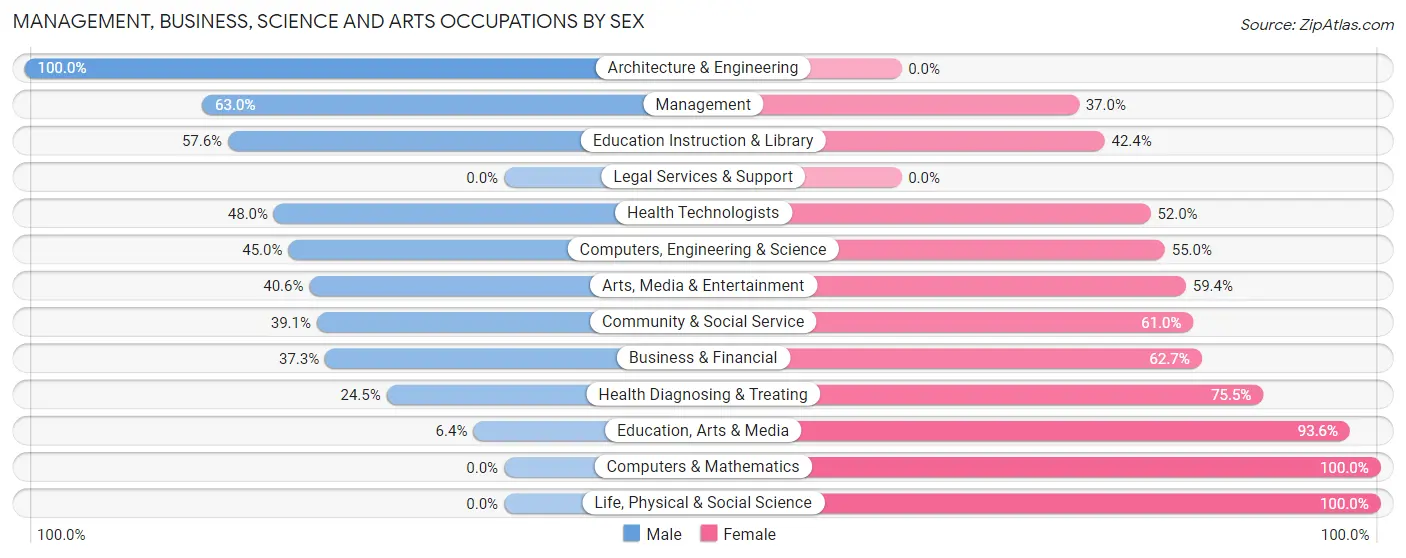
| Occupation | Male | Female |
| Management | 51 (63.0%) | 30 (37.0%) |
| Business & Financial | 28 (37.3%) | 47 (62.7%) |
| Computers, Engineering & Science | 9 (45.0%) | 11 (55.0%) |
| Computers & Mathematics | 0 (0.0%) | 7 (100.0%) |
| Architecture & Engineering | 9 (100.0%) | 0 (0.0%) |
| Life, Physical & Social Science | 0 (0.0%) | 4 (100.0%) |
| Community & Social Service | 107 (39.1%) | 167 (61.0%) |
| Education, Arts & Media | 5 (6.4%) | 73 (93.6%) |
| Legal Services & Support | 0 (0.0%) | 0 (0.0%) |
| Education Instruction & Library | 76 (57.6%) | 56 (42.4%) |
| Arts, Media & Entertainment | 26 (40.6%) | 38 (59.4%) |
| Health Diagnosing & Treating | 12 (24.5%) | 37 (75.5%) |
| Health Technologists | 12 (48.0%) | 13 (52.0%) |
| Total (Category) | 207 (41.5%) | 292 (58.5%) |
| Total (Overall) | 746 (48.8%) | 784 (51.2%) |
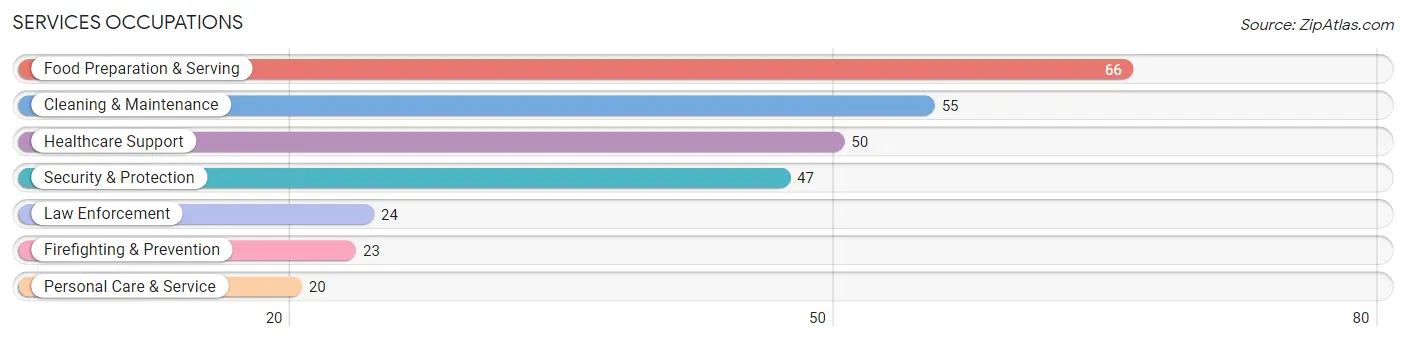
Services Occupations
The most common Services occupations in Strasburg borough are Food Preparation & Serving (66 | 4.3%), Cleaning & Maintenance (55 | 3.6%), Healthcare Support (50 | 3.3%), Security & Protection (47 | 3.1%), and Law Enforcement (24 | 1.6%).
Services Occupations by Sex
Within the Services occupations in Strasburg borough, the most male-oriented occupations are Security & Protection (100.0%), Firefighting & Prevention (100.0%), and Law Enforcement (100.0%), while the most female-oriented occupations are Food Preparation & Serving (69.7%), and Healthcare Support (12.0%).
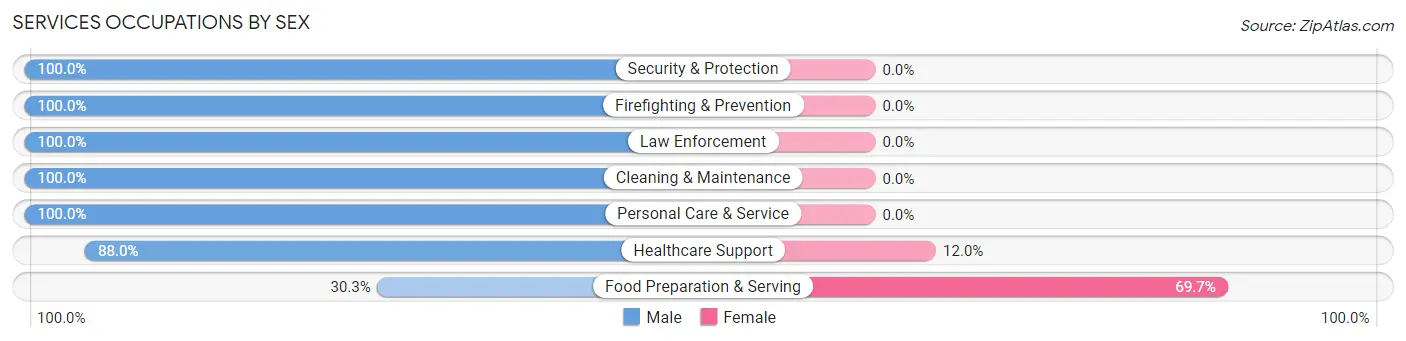
| Occupation | Male | Female |
| Healthcare Support | 44 (88.0%) | 6 (12.0%) |
| Security & Protection | 47 (100.0%) | 0 (0.0%) |
| Firefighting & Prevention | 23 (100.0%) | 0 (0.0%) |
| Law Enforcement | 24 (100.0%) | 0 (0.0%) |
| Food Preparation & Serving | 20 (30.3%) | 46 (69.7%) |
| Cleaning & Maintenance | 55 (100.0%) | 0 (0.0%) |
| Personal Care & Service | 20 (100.0%) | 0 (0.0%) |
| Total (Category) | 186 (78.1%) | 52 (21.8%) |
| Total (Overall) | 746 (48.8%) | 784 (51.2%) |
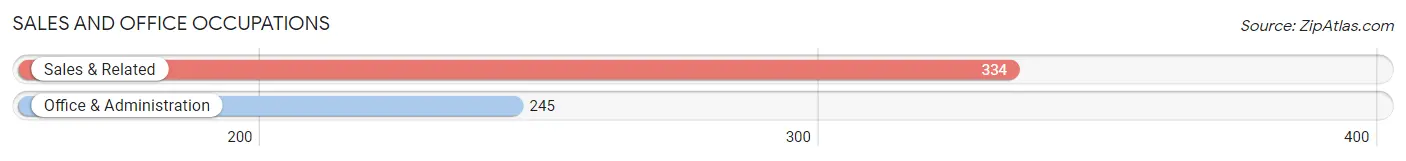
Sales and Office Occupations
The most common Sales and Office occupations in Strasburg borough are Sales & Related (334 | 21.8%), and Office & Administration (245 | 16.0%).
Sales and Office Occupations by Sex
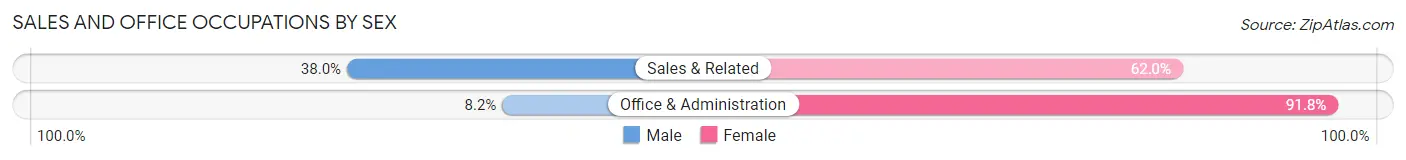
| Occupation | Male | Female |
| Sales & Related | 127 (38.0%) | 207 (62.0%) |
| Office & Administration | 20 (8.2%) | 225 (91.8%) |
| Total (Category) | 147 (25.4%) | 432 (74.6%) |
| Total (Overall) | 746 (48.8%) | 784 (51.2%) |
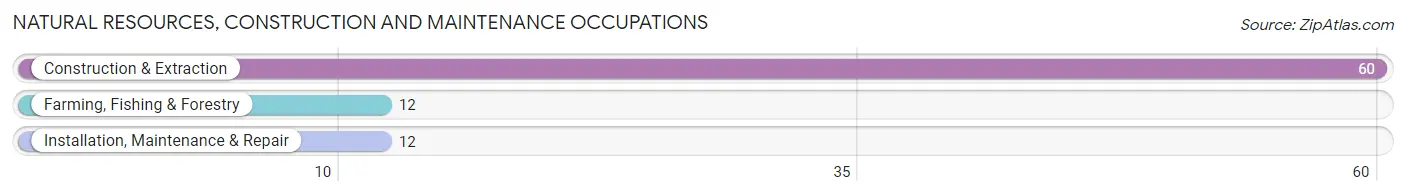
Natural Resources, Construction and Maintenance Occupations
The most common Natural Resources, Construction and Maintenance occupations in Strasburg borough are Construction & Extraction (60 | 3.9%), Farming, Fishing & Forestry (12 | 0.8%), and Installation, Maintenance & Repair (12 | 0.8%).
Natural Resources, Construction and Maintenance Occupations by Sex
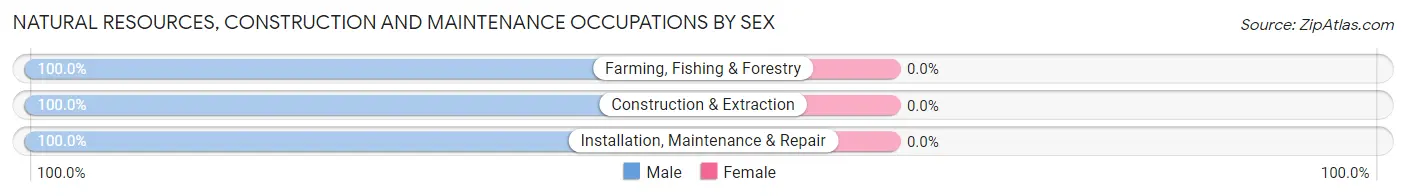
| Occupation | Male | Female |
| Farming, Fishing & Forestry | 12 (100.0%) | 0 (0.0%) |
| Construction & Extraction | 60 (100.0%) | 0 (0.0%) |
| Installation, Maintenance & Repair | 12 (100.0%) | 0 (0.0%) |
| Total (Category) | 84 (100.0%) | 0 (0.0%) |
| Total (Overall) | 746 (48.8%) | 784 (51.2%) |
Production, Transportation and Moving Occupations
The most common Production, Transportation and Moving occupations in Strasburg borough are Production (80 | 5.2%), Transportation (39 | 2.5%), and Material Moving (11 | 0.7%).
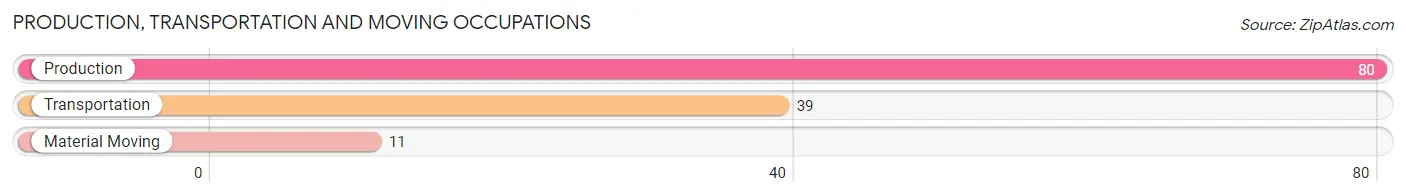
Production, Transportation and Moving Occupations by Sex
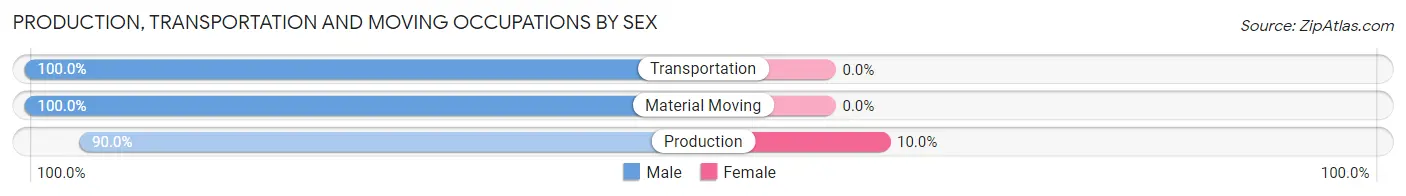
| Occupation | Male | Female |
| Production | 72 (90.0%) | 8 (10.0%) |
| Transportation | 39 (100.0%) | 0 (0.0%) |
| Material Moving | 11 (100.0%) | 0 (0.0%) |
| Total (Category) | 122 (93.9%) | 8 (6.1%) |
| Total (Overall) | 746 (48.8%) | 784 (51.2%) |
Employment Industries by Sex in Strasburg borough
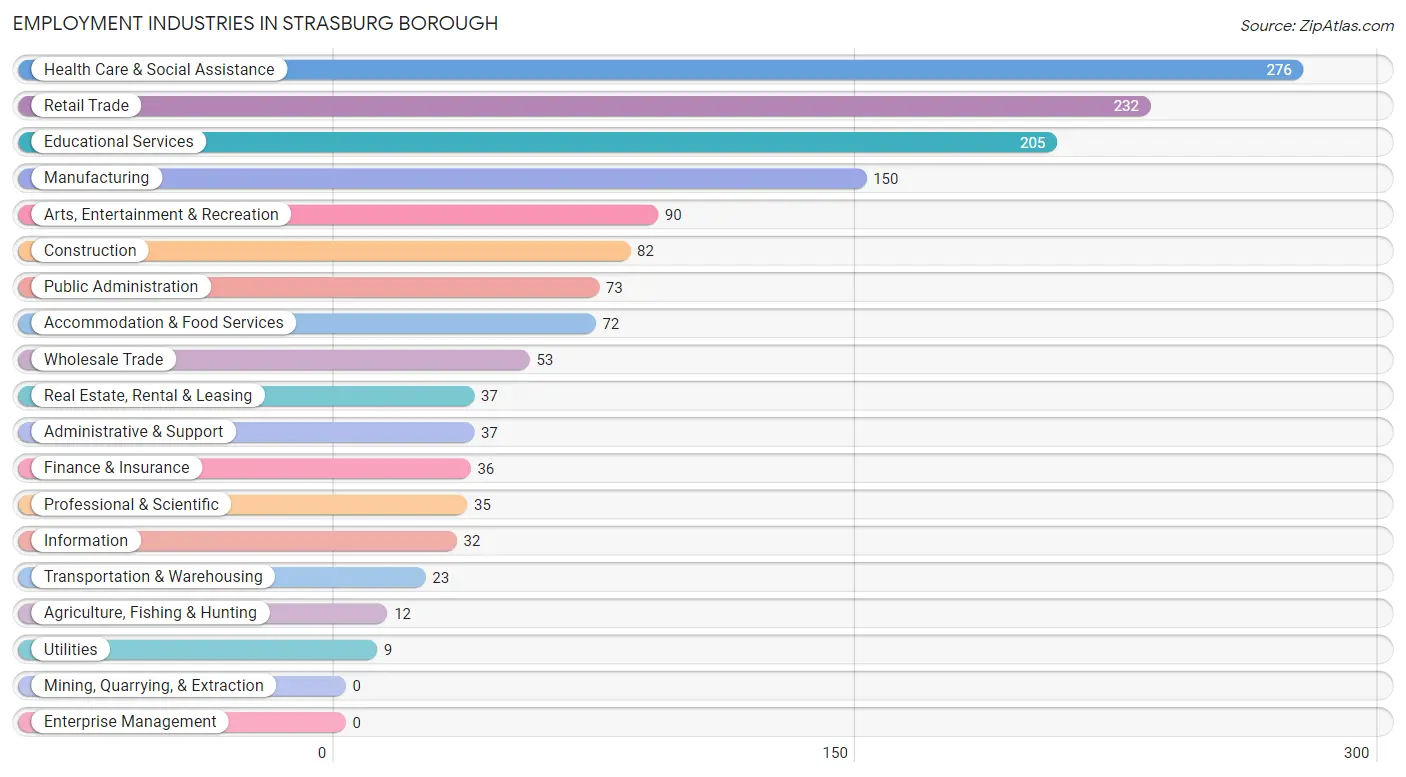
Employment Industries in Strasburg borough
The major employment industries in Strasburg borough include Health Care & Social Assistance (276 | 18.0%), Retail Trade (232 | 15.2%), Educational Services (205 | 13.4%), Manufacturing (150 | 9.8%), and Arts, Entertainment & Recreation (90 | 5.9%).
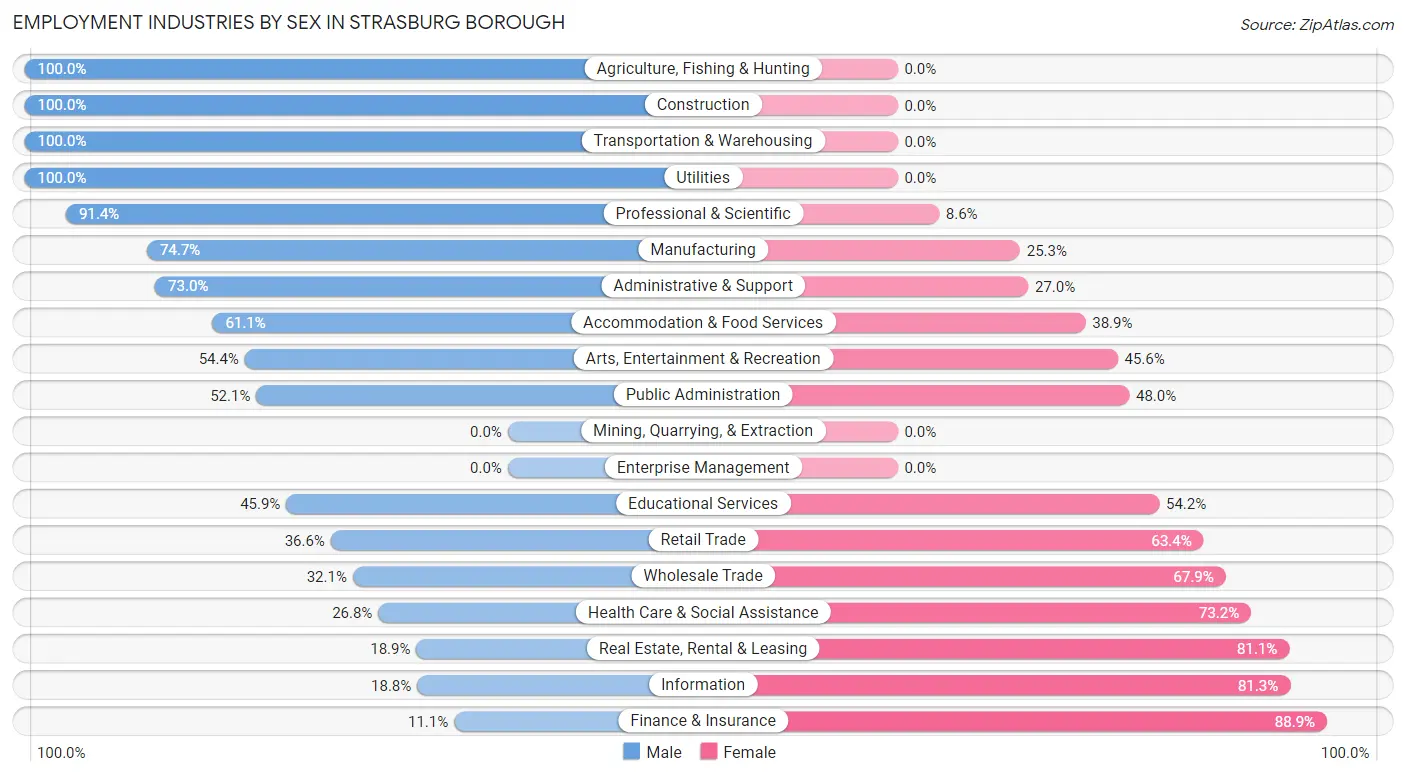
Employment Industries by Sex in Strasburg borough
The Strasburg borough industries that see more men than women are Agriculture, Fishing & Hunting (100.0%), Construction (100.0%), and Transportation & Warehousing (100.0%), whereas the industries that tend to have a higher number of women are Finance & Insurance (88.9%), Information (81.2%), and Real Estate, Rental & Leasing (81.1%).
| Industry | Male | Female |
| Agriculture, Fishing & Hunting | 12 (100.0%) | 0 (0.0%) |
| Mining, Quarrying, & Extraction | 0 (0.0%) | 0 (0.0%) |
| Construction | 82 (100.0%) | 0 (0.0%) |
| Manufacturing | 112 (74.7%) | 38 (25.3%) |
| Wholesale Trade | 17 (32.1%) | 36 (67.9%) |
| Retail Trade | 85 (36.6%) | 147 (63.4%) |
| Transportation & Warehousing | 23 (100.0%) | 0 (0.0%) |
| Utilities | 9 (100.0%) | 0 (0.0%) |
| Information | 6 (18.8%) | 26 (81.2%) |
| Finance & Insurance | 4 (11.1%) | 32 (88.9%) |
| Real Estate, Rental & Leasing | 7 (18.9%) | 30 (81.1%) |
| Professional & Scientific | 32 (91.4%) | 3 (8.6%) |
| Enterprise Management | 0 (0.0%) | 0 (0.0%) |
| Administrative & Support | 27 (73.0%) | 10 (27.0%) |
| Educational Services | 94 (45.9%) | 111 (54.1%) |
| Health Care & Social Assistance | 74 (26.8%) | 202 (73.2%) |
| Arts, Entertainment & Recreation | 49 (54.4%) | 41 (45.6%) |
| Accommodation & Food Services | 44 (61.1%) | 28 (38.9%) |
| Public Administration | 38 (52.0%) | 35 (47.9%) |
| Total | 746 (48.8%) | 784 (51.2%) |
Education in Strasburg borough
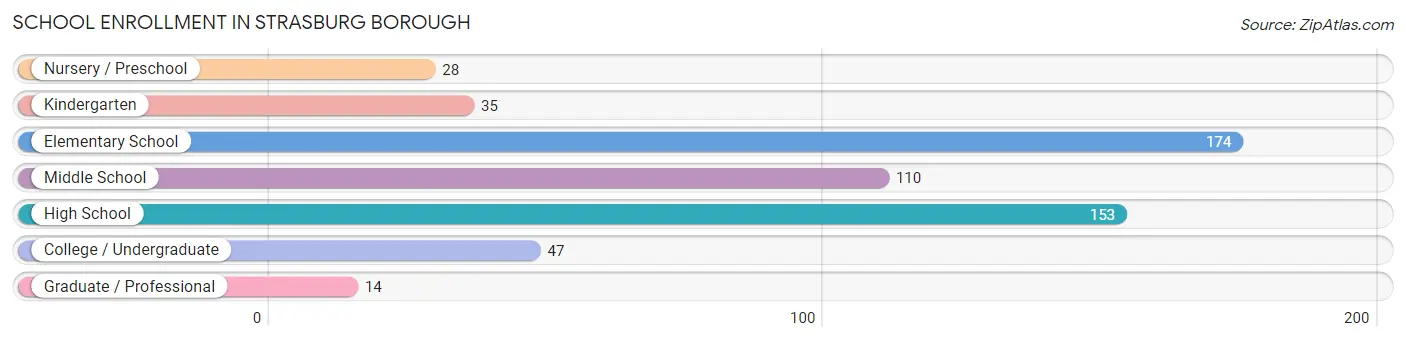
School Enrollment in Strasburg borough
The most common levels of schooling among the 561 students in Strasburg borough are elementary school (174 | 31.0%), high school (153 | 27.3%), and middle school (110 | 19.6%).
| School Level | # Students | % Students |
| Nursery / Preschool | 28 | 5.0% |
| Kindergarten | 35 | 6.2% |
| Elementary School | 174 | 31.0% |
| Middle School | 110 | 19.6% |
| High School | 153 | 27.3% |
| College / Undergraduate | 47 | 8.4% |
| Graduate / Professional | 14 | 2.5% |
| Total | 561 | 100.0% |
School Enrollment by Age by Funding Source in Strasburg borough
Out of a total of 561 students who are enrolled in schools in Strasburg borough, 72 (12.8%) attend a private institution, while the remaining 489 (87.2%) are enrolled in public schools. The age group of 20 to 24 year olds has the highest likelihood of being enrolled in private schools, with 11 (100.0% in the age bracket) enrolled. Conversely, the age group of 10 to 14 year olds has the lowest likelihood of being enrolled in a private school, with 181 (100.0% in the age bracket) attending a public institution.
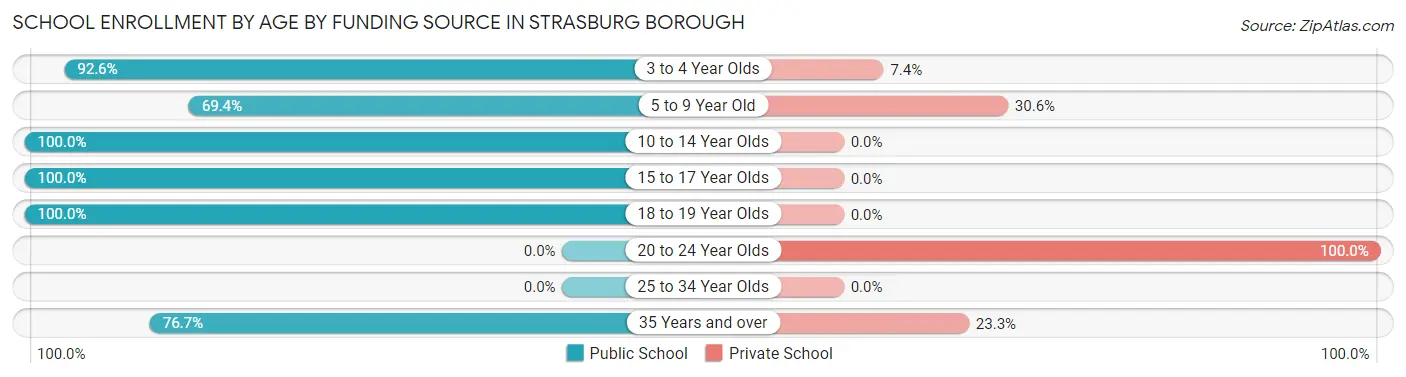
| Age Bracket | Public School | Private School |
| 3 to 4 Year Olds | 25 (92.6%) | 2 (7.4%) |
| 5 to 9 Year Old | 118 (69.4%) | 52 (30.6%) |
| 10 to 14 Year Olds | 181 (100.0%) | 0 (0.0%) |
| 15 to 17 Year Olds | 122 (100.0%) | 0 (0.0%) |
| 18 to 19 Year Olds | 20 (100.0%) | 0 (0.0%) |
| 20 to 24 Year Olds | 0 (0.0%) | 11 (100.0%) |
| 25 to 34 Year Olds | 0 (0.0%) | 0 (0.0%) |
| 35 Years and over | 23 (76.7%) | 7 (23.3%) |
| Total | 489 (87.2%) | 72 (12.8%) |
Educational Attainment by Field of Study in Strasburg borough
Education (370 | 37.0%), business (155 | 15.5%), arts & humanities (101 | 10.1%), visual & performing arts (76 | 7.6%), and social sciences (55 | 5.5%) are the most common fields of study among 1,000 individuals in Strasburg borough who have obtained a bachelor's degree or higher.
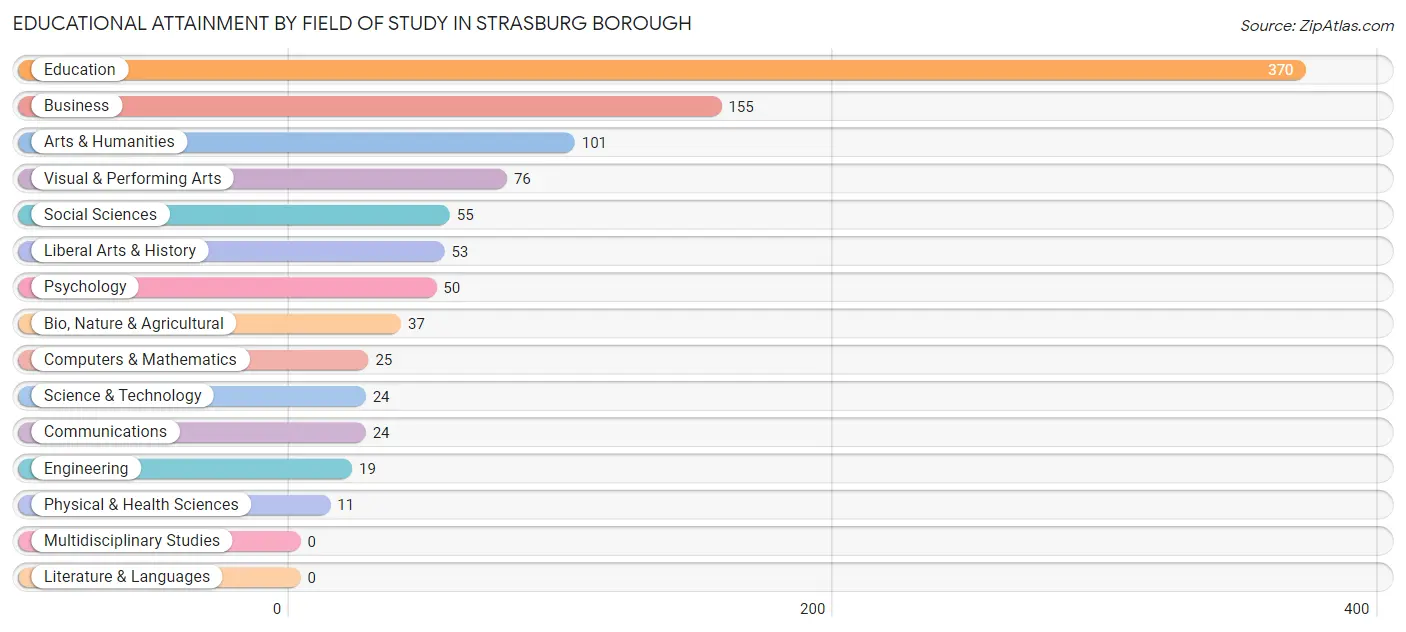
| Field of Study | # Graduates | % Graduates |
| Computers & Mathematics | 25 | 2.5% |
| Bio, Nature & Agricultural | 37 | 3.7% |
| Physical & Health Sciences | 11 | 1.1% |
| Psychology | 50 | 5.0% |
| Social Sciences | 55 | 5.5% |
| Engineering | 19 | 1.9% |
| Multidisciplinary Studies | 0 | 0.0% |
| Science & Technology | 24 | 2.4% |
| Business | 155 | 15.5% |
| Education | 370 | 37.0% |
| Literature & Languages | 0 | 0.0% |
| Liberal Arts & History | 53 | 5.3% |
| Visual & Performing Arts | 76 | 7.6% |
| Communications | 24 | 2.4% |
| Arts & Humanities | 101 | 10.1% |
| Total | 1,000 | 100.0% |
Transportation & Commute in Strasburg borough
Vehicle Availability by Sex in Strasburg borough
The most prevalent vehicle ownership categories in Strasburg borough are males with 2 vehicles (383, accounting for 52.7%) and females with 2 vehicles (420, making up 48.8%).
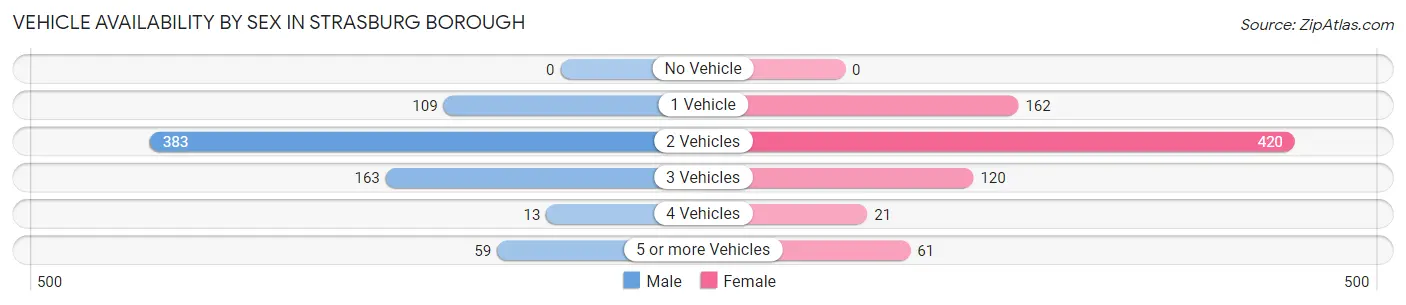
| Vehicles Available | Male | Female |
| No Vehicle | 0 (0.0%) | 0 (0.0%) |
| 1 Vehicle | 109 (15.0%) | 162 (20.7%) |
| 2 Vehicles | 383 (52.7%) | 420 (53.6%) |
| 3 Vehicles | 163 (22.4%) | 120 (15.3%) |
| 4 Vehicles | 13 (1.8%) | 21 (2.7%) |
| 5 or more Vehicles | 59 (8.1%) | 61 (7.8%) |
| Total | 727 (100.0%) | 784 (100.0%) |
Commute Time in Strasburg borough
The most frequently occuring commute durations in Strasburg borough are 20 to 24 minutes (277 commuters, 19.9%), 15 to 19 minutes (237 commuters, 17.0%), and 5 to 9 minutes (192 commuters, 13.8%).
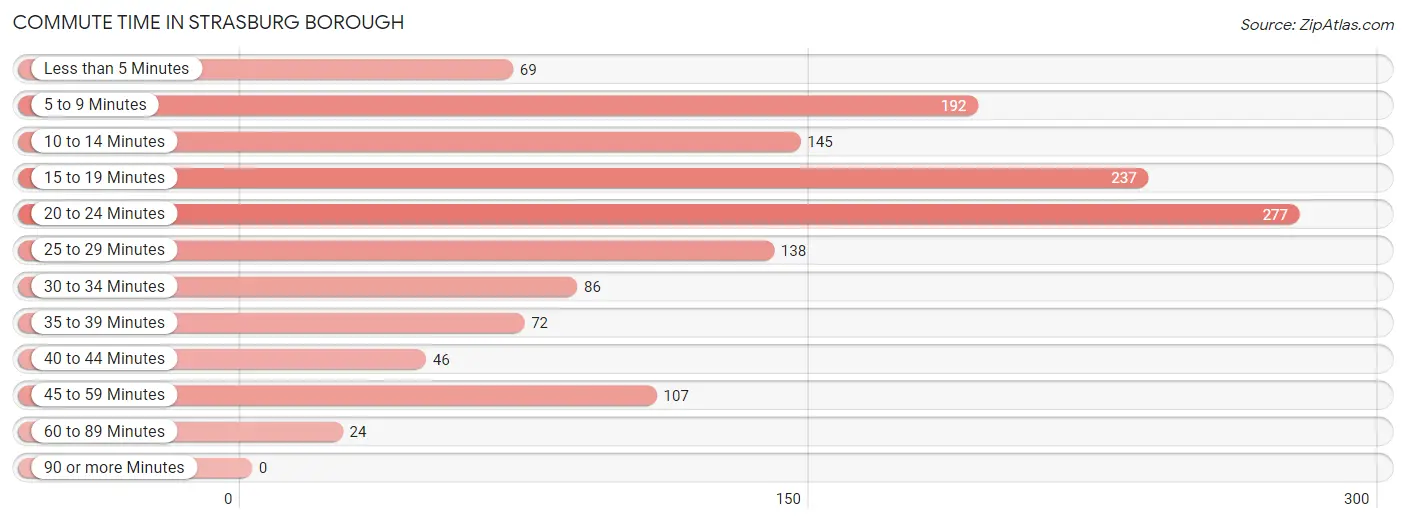
| Commute Time | # Commuters | % Commuters |
| Less than 5 Minutes | 69 | 5.0% |
| 5 to 9 Minutes | 192 | 13.8% |
| 10 to 14 Minutes | 145 | 10.4% |
| 15 to 19 Minutes | 237 | 17.0% |
| 20 to 24 Minutes | 277 | 19.9% |
| 25 to 29 Minutes | 138 | 9.9% |
| 30 to 34 Minutes | 86 | 6.2% |
| 35 to 39 Minutes | 72 | 5.2% |
| 40 to 44 Minutes | 46 | 3.3% |
| 45 to 59 Minutes | 107 | 7.7% |
| 60 to 89 Minutes | 24 | 1.7% |
| 90 or more Minutes | 0 | 0.0% |
Commute Time by Sex in Strasburg borough
The most common commute times in Strasburg borough are 25 to 29 minutes (122 commuters, 16.9%) for males and 15 to 19 minutes (172 commuters, 25.6%) for females.
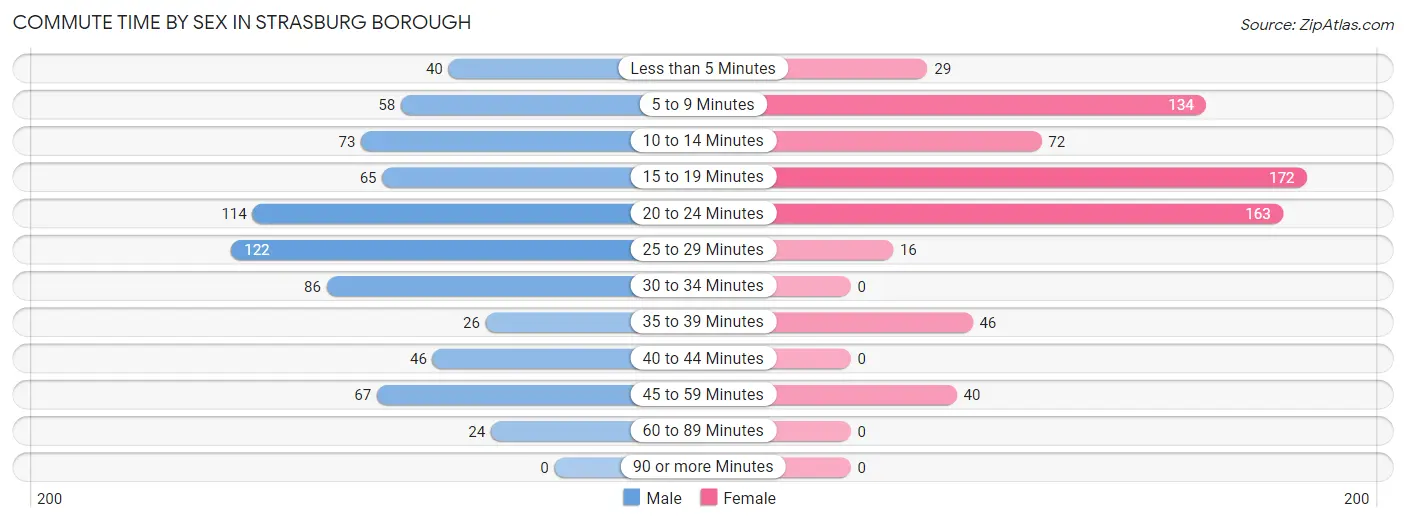
| Commute Time | Male | Female |
| Less than 5 Minutes | 40 (5.6%) | 29 (4.3%) |
| 5 to 9 Minutes | 58 (8.0%) | 134 (19.9%) |
| 10 to 14 Minutes | 73 (10.1%) | 72 (10.7%) |
| 15 to 19 Minutes | 65 (9.0%) | 172 (25.6%) |
| 20 to 24 Minutes | 114 (15.8%) | 163 (24.3%) |
| 25 to 29 Minutes | 122 (16.9%) | 16 (2.4%) |
| 30 to 34 Minutes | 86 (11.9%) | 0 (0.0%) |
| 35 to 39 Minutes | 26 (3.6%) | 46 (6.9%) |
| 40 to 44 Minutes | 46 (6.4%) | 0 (0.0%) |
| 45 to 59 Minutes | 67 (9.3%) | 40 (5.9%) |
| 60 to 89 Minutes | 24 (3.3%) | 0 (0.0%) |
| 90 or more Minutes | 0 (0.0%) | 0 (0.0%) |
Time of Departure to Work by Sex in Strasburg borough
The most frequent times of departure to work in Strasburg borough are 7:00 AM to 7:29 AM (153, 21.2%) for males and 9:00 AM to 9:59 AM (194, 28.9%) for females.
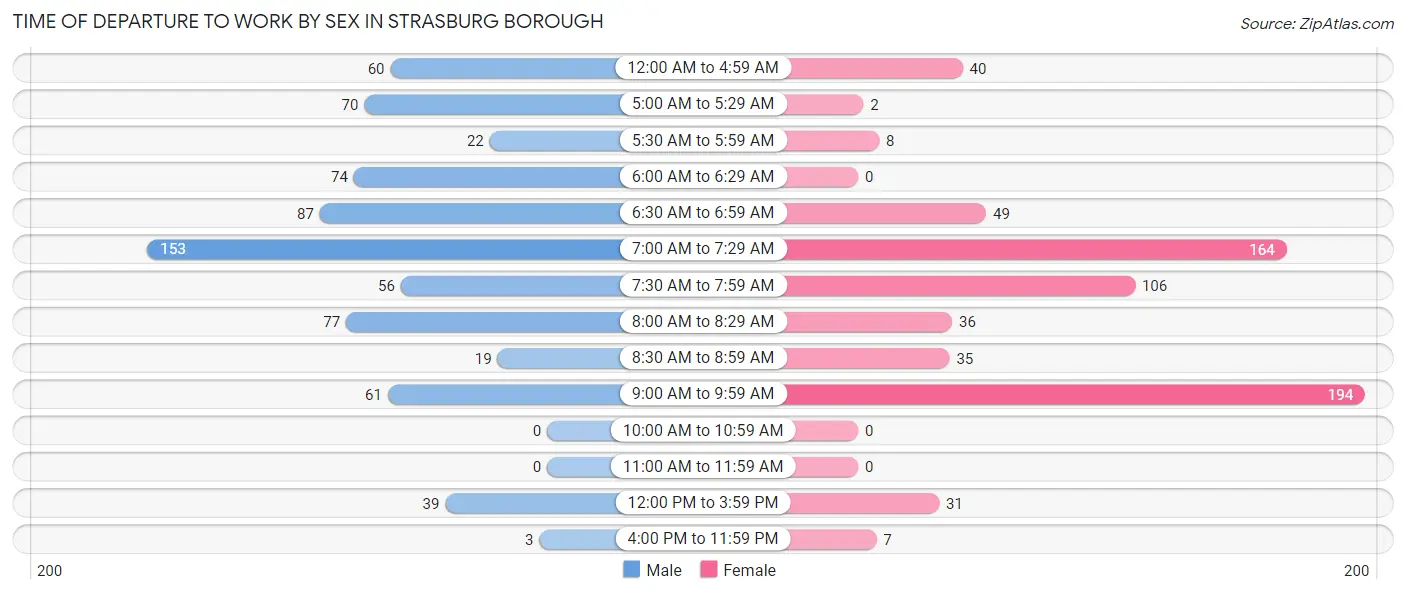
| Time of Departure | Male | Female |
| 12:00 AM to 4:59 AM | 60 (8.3%) | 40 (5.9%) |
| 5:00 AM to 5:29 AM | 70 (9.7%) | 2 (0.3%) |
| 5:30 AM to 5:59 AM | 22 (3.0%) | 8 (1.2%) |
| 6:00 AM to 6:29 AM | 74 (10.3%) | 0 (0.0%) |
| 6:30 AM to 6:59 AM | 87 (12.1%) | 49 (7.3%) |
| 7:00 AM to 7:29 AM | 153 (21.2%) | 164 (24.4%) |
| 7:30 AM to 7:59 AM | 56 (7.8%) | 106 (15.8%) |
| 8:00 AM to 8:29 AM | 77 (10.7%) | 36 (5.4%) |
| 8:30 AM to 8:59 AM | 19 (2.6%) | 35 (5.2%) |
| 9:00 AM to 9:59 AM | 61 (8.5%) | 194 (28.9%) |
| 10:00 AM to 10:59 AM | 0 (0.0%) | 0 (0.0%) |
| 11:00 AM to 11:59 AM | 0 (0.0%) | 0 (0.0%) |
| 12:00 PM to 3:59 PM | 39 (5.4%) | 31 (4.6%) |
| 4:00 PM to 11:59 PM | 3 (0.4%) | 7 (1.0%) |
| Total | 721 (100.0%) | 672 (100.0%) |
Housing Occupancy in Strasburg borough
Occupancy by Ownership in Strasburg borough
Of the total 1,252 dwellings in Strasburg borough, owner-occupied units account for 927 (74.0%), while renter-occupied units make up 325 (26.0%).
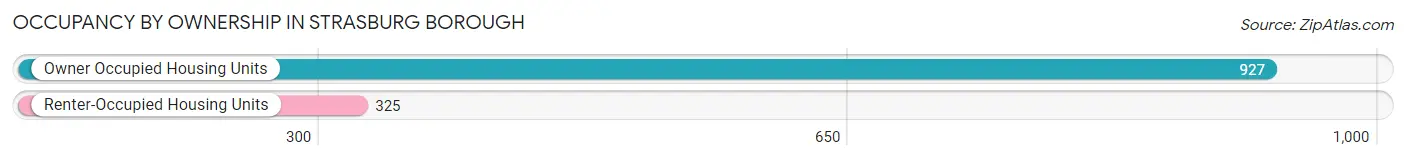
| Occupancy | # Housing Units | % Housing Units |
| Owner Occupied Housing Units | 927 | 74.0% |
| Renter-Occupied Housing Units | 325 | 26.0% |
| Total Occupied Housing Units | 1,252 | 100.0% |
Occupancy by Household Size in Strasburg borough
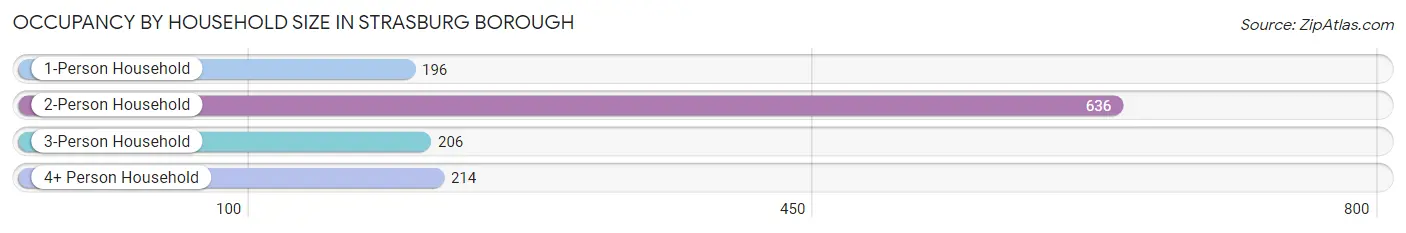
| Household Size | # Housing Units | % Housing Units |
| 1-Person Household | 196 | 15.7% |
| 2-Person Household | 636 | 50.8% |
| 3-Person Household | 206 | 16.5% |
| 4+ Person Household | 214 | 17.1% |
| Total Housing Units | 1,252 | 100.0% |
Occupancy by Ownership by Household Size in Strasburg borough
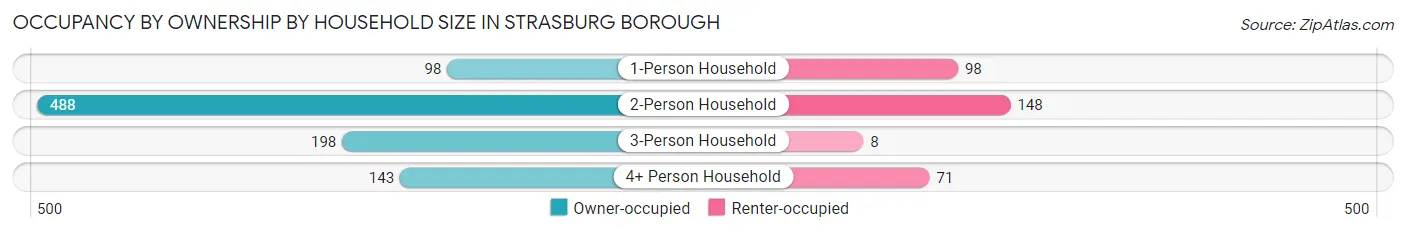
| Household Size | Owner-occupied | Renter-occupied |
| 1-Person Household | 98 (50.0%) | 98 (50.0%) |
| 2-Person Household | 488 (76.7%) | 148 (23.3%) |
| 3-Person Household | 198 (96.1%) | 8 (3.9%) |
| 4+ Person Household | 143 (66.8%) | 71 (33.2%) |
| Total Housing Units | 927 (74.0%) | 325 (26.0%) |
Occupancy by Educational Attainment in Strasburg borough
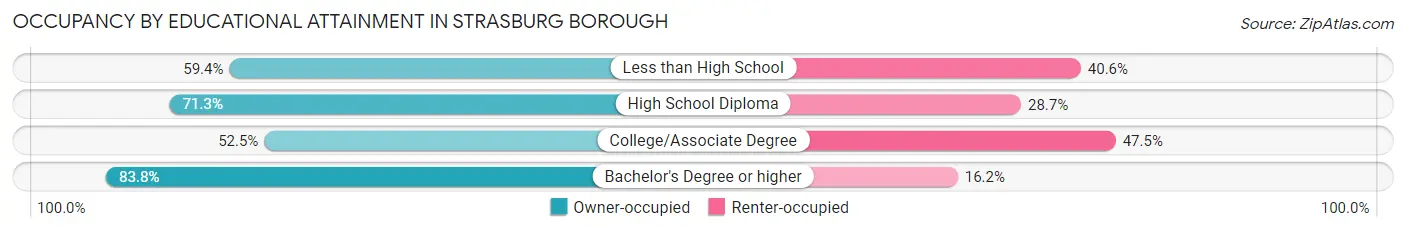
| Household Size | Owner-occupied | Renter-occupied |
| Less than High School | 41 (59.4%) | 28 (40.6%) |
| High School Diploma | 315 (71.3%) | 127 (28.7%) |
| College/Associate Degree | 84 (52.5%) | 76 (47.5%) |
| Bachelor's Degree or higher | 487 (83.8%) | 94 (16.2%) |
Occupancy by Age of Householder in Strasburg borough
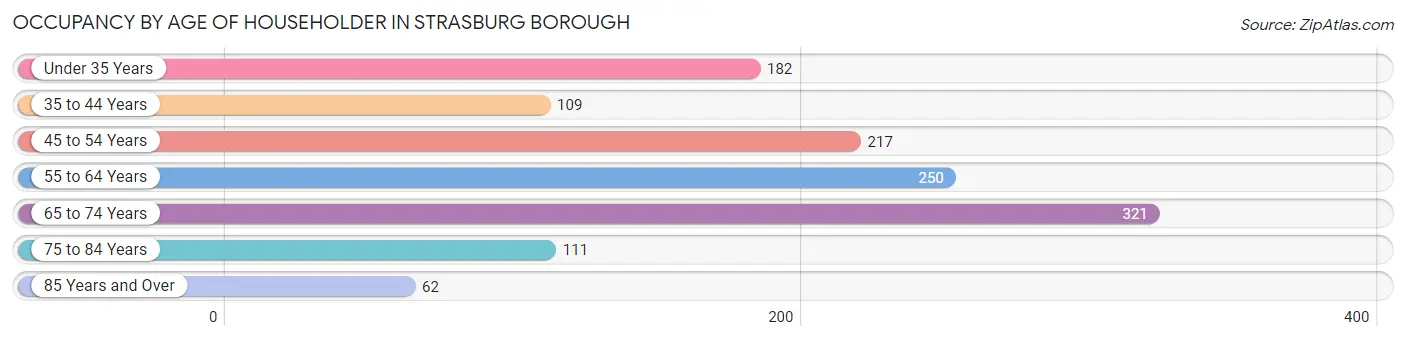
| Age Bracket | # Households | % Households |
| Under 35 Years | 182 | 14.5% |
| 35 to 44 Years | 109 | 8.7% |
| 45 to 54 Years | 217 | 17.3% |
| 55 to 64 Years | 250 | 20.0% |
| 65 to 74 Years | 321 | 25.6% |
| 75 to 84 Years | 111 | 8.9% |
| 85 Years and Over | 62 | 5.0% |
| Total | 1,252 | 100.0% |
Housing Finances in Strasburg borough
Median Income by Occupancy in Strasburg borough
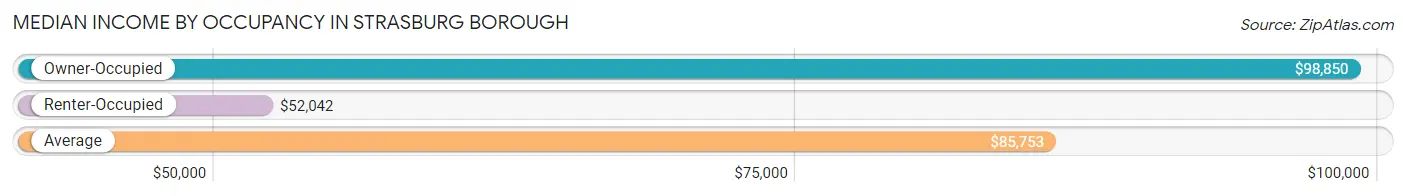
| Occupancy Type | # Households | Median Income |
| Owner-Occupied | 927 (74.0%) | $98,850 |
| Renter-Occupied | 325 (26.0%) | $52,042 |
| Average | 1,252 (100.0%) | $85,753 |
Occupancy by Householder Income Bracket in Strasburg borough
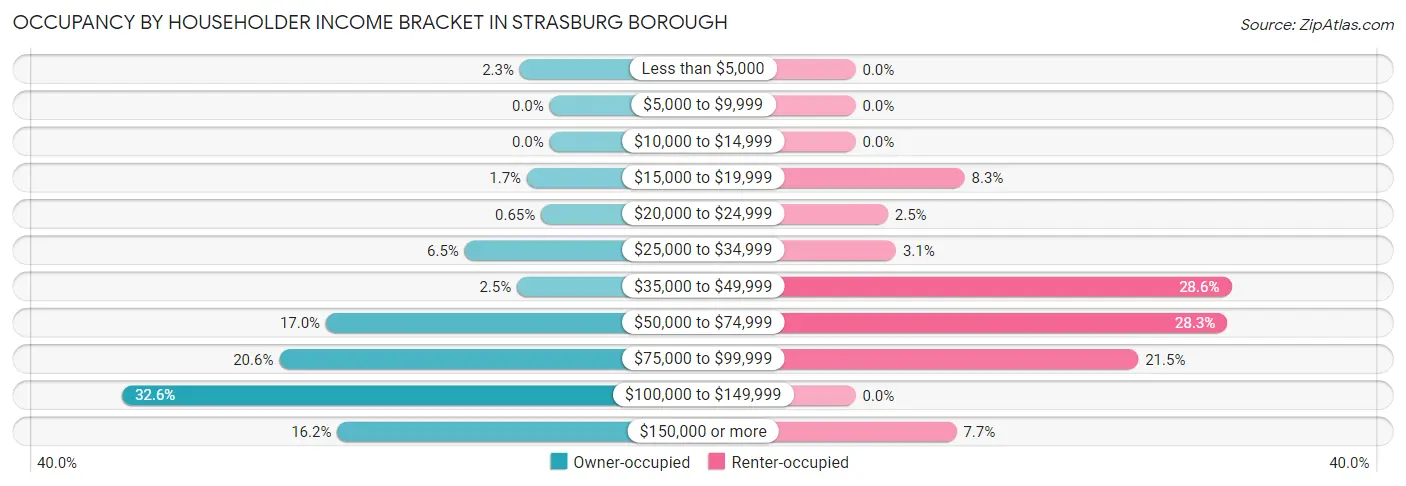
| Income Bracket | Owner-occupied | Renter-occupied |
| Less than $5,000 | 21 (2.3%) | 0 (0.0%) |
| $5,000 to $9,999 | 0 (0.0%) | 0 (0.0%) |
| $10,000 to $14,999 | 0 (0.0%) | 0 (0.0%) |
| $15,000 to $19,999 | 16 (1.7%) | 27 (8.3%) |
| $20,000 to $24,999 | 6 (0.6%) | 8 (2.5%) |
| $25,000 to $34,999 | 60 (6.5%) | 10 (3.1%) |
| $35,000 to $49,999 | 23 (2.5%) | 93 (28.6%) |
| $50,000 to $74,999 | 158 (17.0%) | 92 (28.3%) |
| $75,000 to $99,999 | 191 (20.6%) | 70 (21.5%) |
| $100,000 to $149,999 | 302 (32.6%) | 0 (0.0%) |
| $150,000 or more | 150 (16.2%) | 25 (7.7%) |
| Total | 927 (100.0%) | 325 (100.0%) |
Monthly Housing Cost Tiers in Strasburg borough
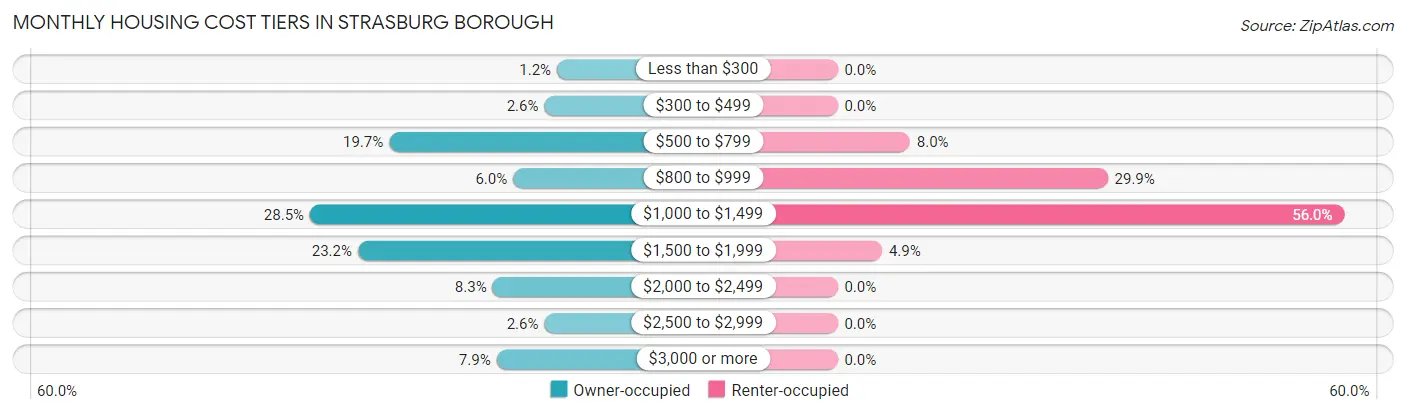
| Monthly Cost | Owner-occupied | Renter-occupied |
| Less than $300 | 11 (1.2%) | 0 (0.0%) |
| $300 to $499 | 24 (2.6%) | 0 (0.0%) |
| $500 to $799 | 183 (19.7%) | 26 (8.0%) |
| $800 to $999 | 56 (6.0%) | 97 (29.8%) |
| $1,000 to $1,499 | 264 (28.5%) | 182 (56.0%) |
| $1,500 to $1,999 | 215 (23.2%) | 16 (4.9%) |
| $2,000 to $2,499 | 77 (8.3%) | 0 (0.0%) |
| $2,500 to $2,999 | 24 (2.6%) | 0 (0.0%) |
| $3,000 or more | 73 (7.9%) | 0 (0.0%) |
| Total | 927 (100.0%) | 325 (100.0%) |
Physical Housing Characteristics in Strasburg borough
Housing Structures in Strasburg borough
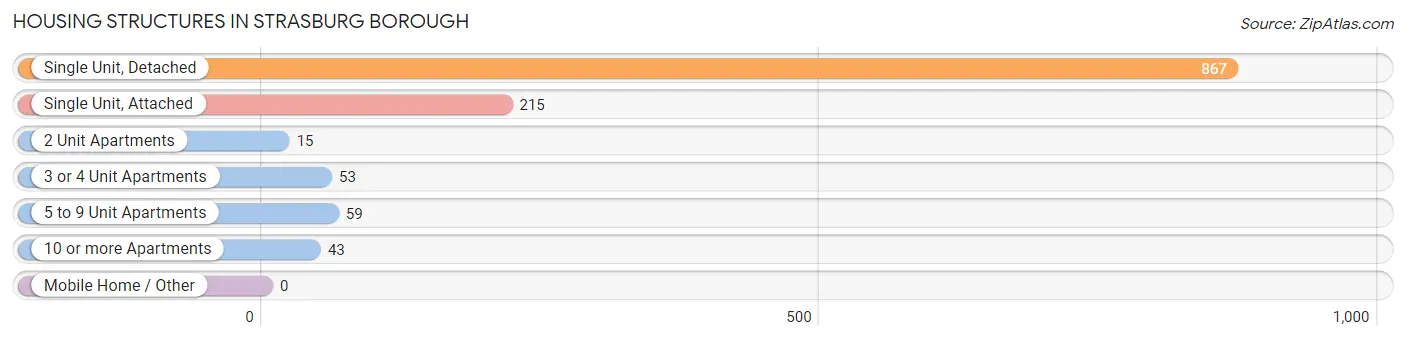
| Structure Type | # Housing Units | % Housing Units |
| Single Unit, Detached | 867 | 69.3% |
| Single Unit, Attached | 215 | 17.2% |
| 2 Unit Apartments | 15 | 1.2% |
| 3 or 4 Unit Apartments | 53 | 4.2% |
| 5 to 9 Unit Apartments | 59 | 4.7% |
| 10 or more Apartments | 43 | 3.4% |
| Mobile Home / Other | 0 | 0.0% |
| Total | 1,252 | 100.0% |
Housing Structures by Occupancy in Strasburg borough
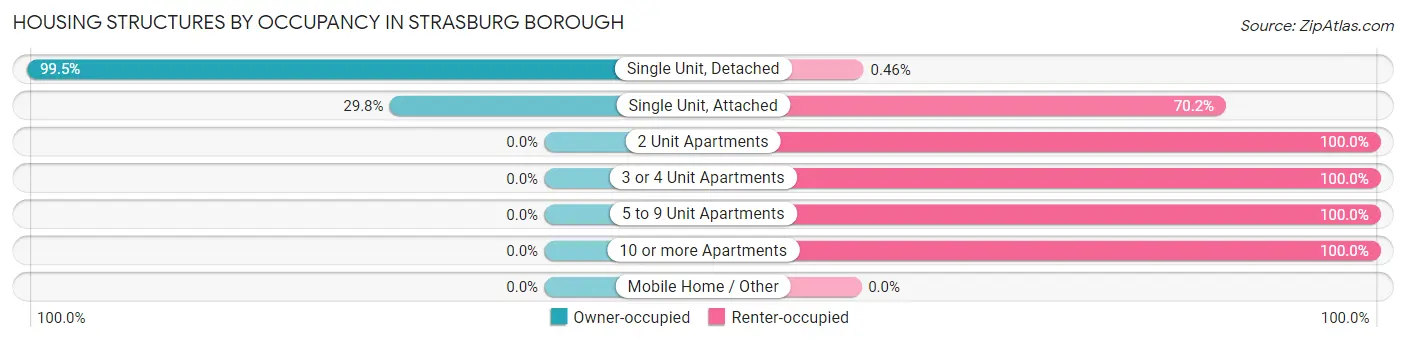
| Structure Type | Owner-occupied | Renter-occupied |
| Single Unit, Detached | 863 (99.5%) | 4 (0.5%) |
| Single Unit, Attached | 64 (29.8%) | 151 (70.2%) |
| 2 Unit Apartments | 0 (0.0%) | 15 (100.0%) |
| 3 or 4 Unit Apartments | 0 (0.0%) | 53 (100.0%) |
| 5 to 9 Unit Apartments | 0 (0.0%) | 59 (100.0%) |
| 10 or more Apartments | 0 (0.0%) | 43 (100.0%) |
| Mobile Home / Other | 0 (0.0%) | 0 (0.0%) |
| Total | 927 (74.0%) | 325 (26.0%) |
Housing Structures by Number of Rooms in Strasburg borough
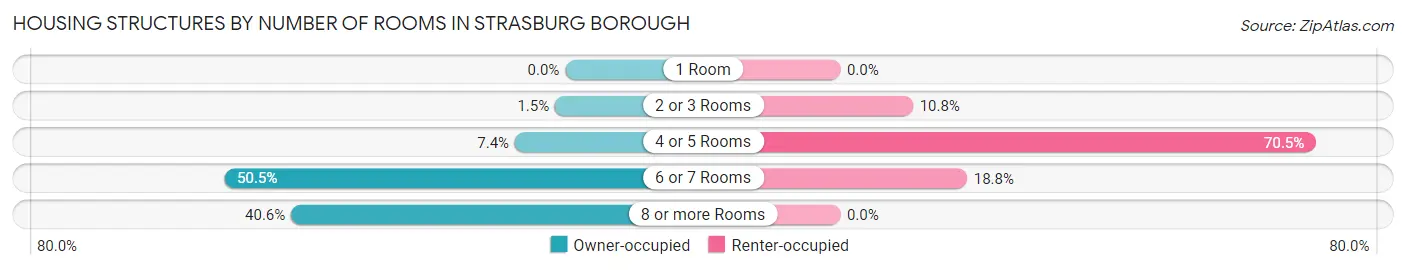
| Number of Rooms | Owner-occupied | Renter-occupied |
| 1 Room | 0 (0.0%) | 0 (0.0%) |
| 2 or 3 Rooms | 14 (1.5%) | 35 (10.8%) |
| 4 or 5 Rooms | 69 (7.4%) | 229 (70.5%) |
| 6 or 7 Rooms | 468 (50.5%) | 61 (18.8%) |
| 8 or more Rooms | 376 (40.6%) | 0 (0.0%) |
| Total | 927 (100.0%) | 325 (100.0%) |
Housing Structure by Heating Type in Strasburg borough
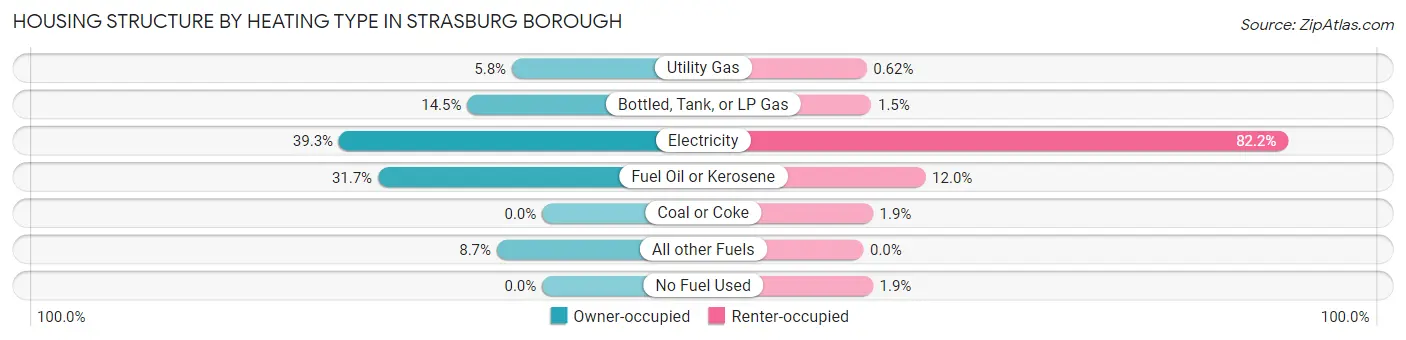
| Heating Type | Owner-occupied | Renter-occupied |
| Utility Gas | 54 (5.8%) | 2 (0.6%) |
| Bottled, Tank, or LP Gas | 134 (14.5%) | 5 (1.5%) |
| Electricity | 364 (39.3%) | 267 (82.2%) |
| Fuel Oil or Kerosene | 294 (31.7%) | 39 (12.0%) |
| Coal or Coke | 0 (0.0%) | 6 (1.8%) |
| All other Fuels | 81 (8.7%) | 0 (0.0%) |
| No Fuel Used | 0 (0.0%) | 6 (1.8%) |
| Total | 927 (100.0%) | 325 (100.0%) |
Household Vehicle Usage in Strasburg borough
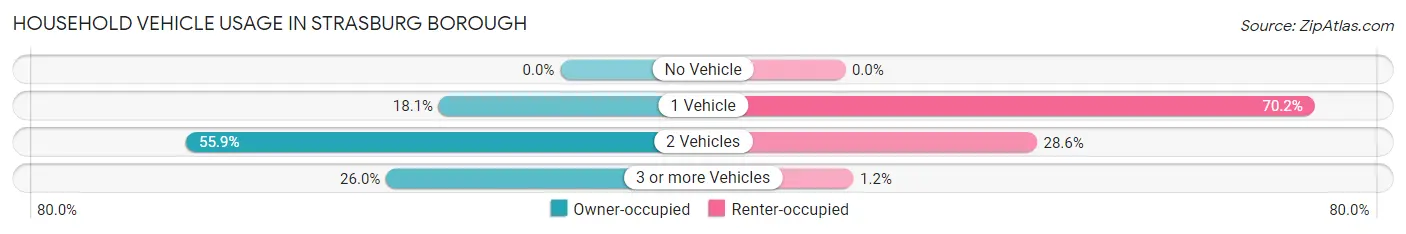
| Vehicles per Household | Owner-occupied | Renter-occupied |
| No Vehicle | 0 (0.0%) | 0 (0.0%) |
| 1 Vehicle | 168 (18.1%) | 228 (70.2%) |
| 2 Vehicles | 518 (55.9%) | 93 (28.6%) |
| 3 or more Vehicles | 241 (26.0%) | 4 (1.2%) |
| Total | 927 (100.0%) | 325 (100.0%) |
Real Estate & Mortgages in Strasburg borough
Real Estate and Mortgage Overview in Strasburg borough
| Characteristic | Without Mortgage | With Mortgage |
| Housing Units | 351 | 576 |
| Median Property Value | $274,200 | $332,500 |
| Median Household Income | $68,203 | $99 |
| Monthly Housing Costs | $695 | $73 |
| Real Estate Taxes | $3,974 | $0 |
Property Value by Mortgage Status in Strasburg borough
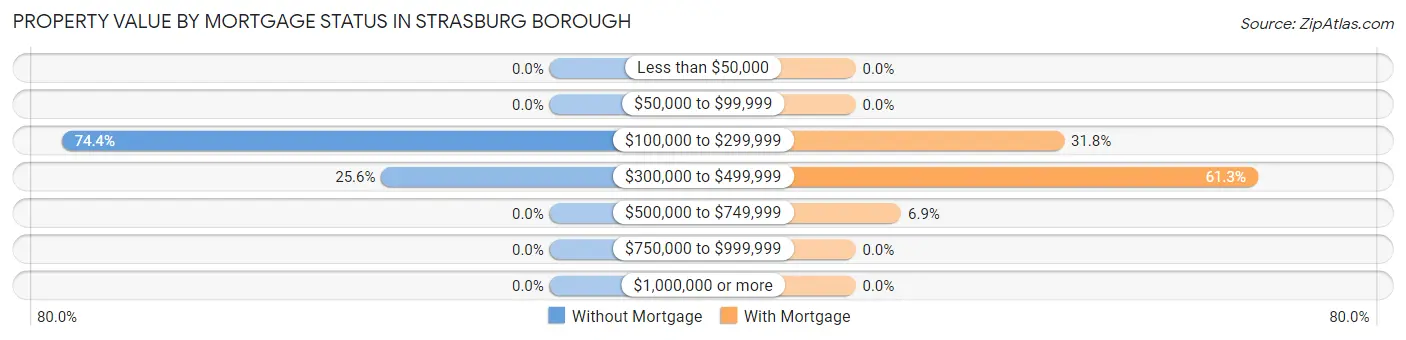
| Property Value | Without Mortgage | With Mortgage |
| Less than $50,000 | 0 (0.0%) | 0 (0.0%) |
| $50,000 to $99,999 | 0 (0.0%) | 0 (0.0%) |
| $100,000 to $299,999 | 261 (74.4%) | 183 (31.8%) |
| $300,000 to $499,999 | 90 (25.6%) | 353 (61.3%) |
| $500,000 to $749,999 | 0 (0.0%) | 40 (6.9%) |
| $750,000 to $999,999 | 0 (0.0%) | 0 (0.0%) |
| $1,000,000 or more | 0 (0.0%) | 0 (0.0%) |
| Total | 351 (100.0%) | 576 (100.0%) |
Household Income by Mortgage Status in Strasburg borough
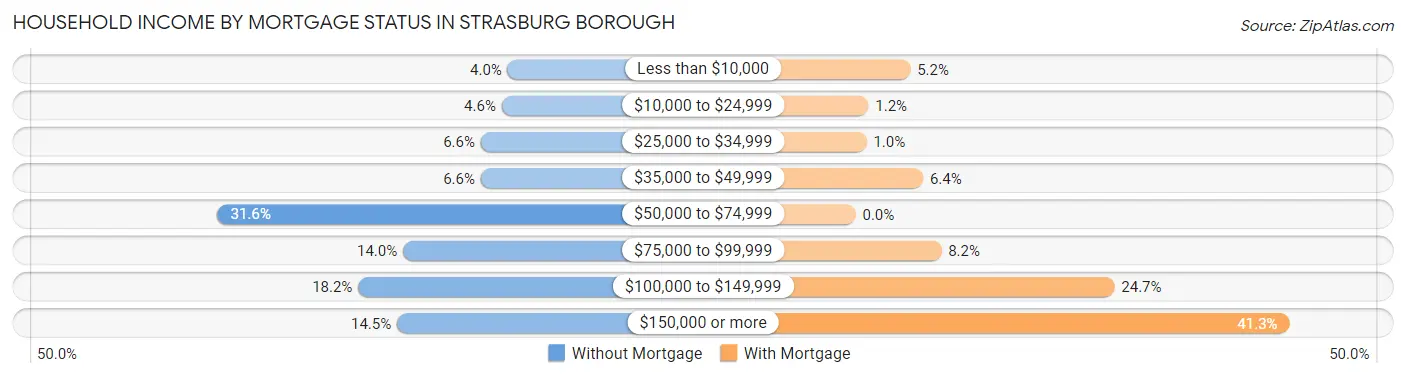
| Household Income | Without Mortgage | With Mortgage |
| Less than $10,000 | 14 (4.0%) | 30 (5.2%) |
| $10,000 to $24,999 | 16 (4.6%) | 7 (1.2%) |
| $25,000 to $34,999 | 23 (6.6%) | 6 (1.0%) |
| $35,000 to $49,999 | 23 (6.6%) | 37 (6.4%) |
| $50,000 to $74,999 | 111 (31.6%) | 0 (0.0%) |
| $75,000 to $99,999 | 49 (14.0%) | 47 (8.2%) |
| $100,000 to $149,999 | 64 (18.2%) | 142 (24.6%) |
| $150,000 or more | 51 (14.5%) | 238 (41.3%) |
| Total | 351 (100.0%) | 576 (100.0%) |
Property Value to Household Income Ratio in Strasburg borough
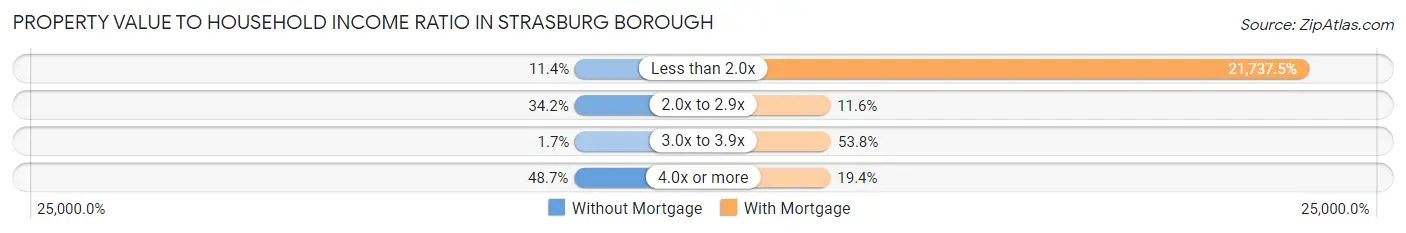
| Value-to-Income Ratio | Without Mortgage | With Mortgage |
| Less than 2.0x | 40 (11.4%) | 125,208 (21,737.5%) |
| 2.0x to 2.9x | 120 (34.2%) | 67 (11.6%) |
| 3.0x to 3.9x | 6 (1.7%) | 310 (53.8%) |
| 4.0x or more | 171 (48.7%) | 112 (19.4%) |
| Total | 351 (100.0%) | 576 (100.0%) |
Real Estate Taxes by Mortgage Status in Strasburg borough
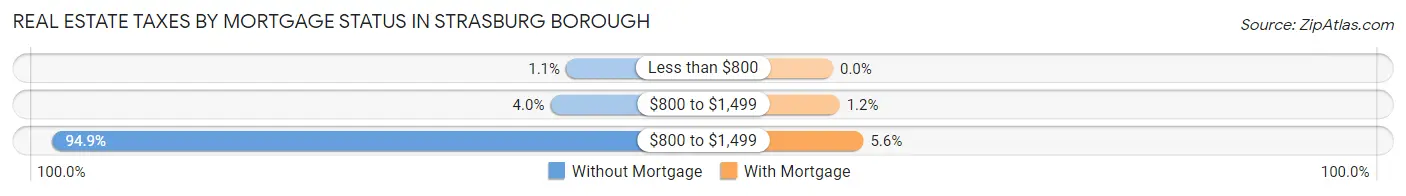
| Property Taxes | Without Mortgage | With Mortgage |
| Less than $800 | 4 (1.1%) | 0 (0.0%) |
| $800 to $1,499 | 14 (4.0%) | 7 (1.2%) |
| $800 to $1,499 | 333 (94.9%) | 32 (5.6%) |
| Total | 351 (100.0%) | 576 (100.0%) |
Health & Disability in Strasburg borough
Health Insurance Coverage by Age in Strasburg borough
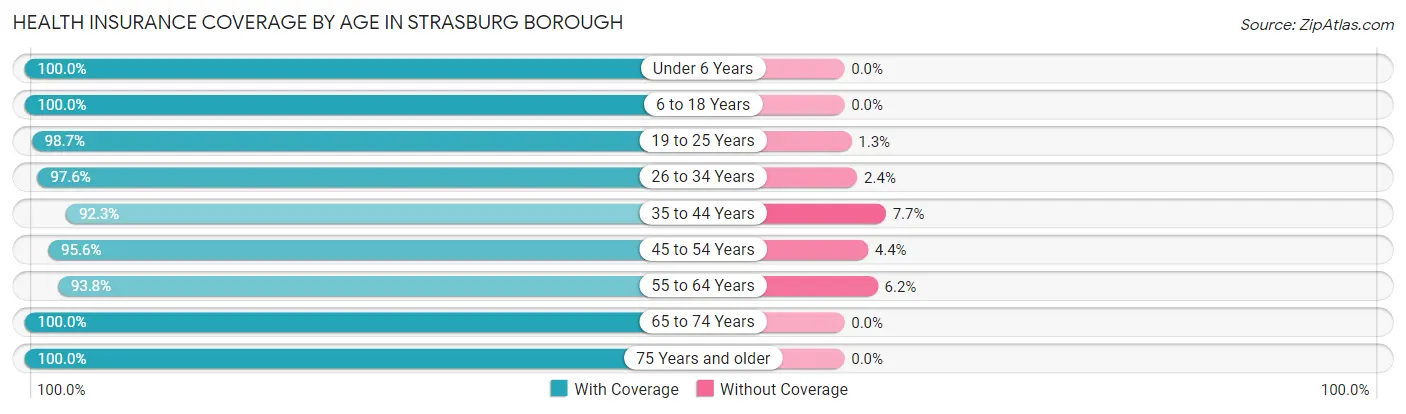
| Age Bracket | With Coverage | Without Coverage |
| Under 6 Years | 213 (100.0%) | 0 (0.0%) |
| 6 to 18 Years | 457 (100.0%) | 0 (0.0%) |
| 19 to 25 Years | 151 (98.7%) | 2 (1.3%) |
| 26 to 34 Years | 285 (97.6%) | 7 (2.4%) |
| 35 to 44 Years | 287 (92.3%) | 24 (7.7%) |
| 45 to 54 Years | 305 (95.6%) | 14 (4.4%) |
| 55 to 64 Years | 498 (93.8%) | 33 (6.2%) |
| 65 to 74 Years | 517 (100.0%) | 0 (0.0%) |
| 75 Years and older | 304 (100.0%) | 0 (0.0%) |
| Total | 3,017 (97.4%) | 80 (2.6%) |
Health Insurance Coverage by Citizenship Status in Strasburg borough
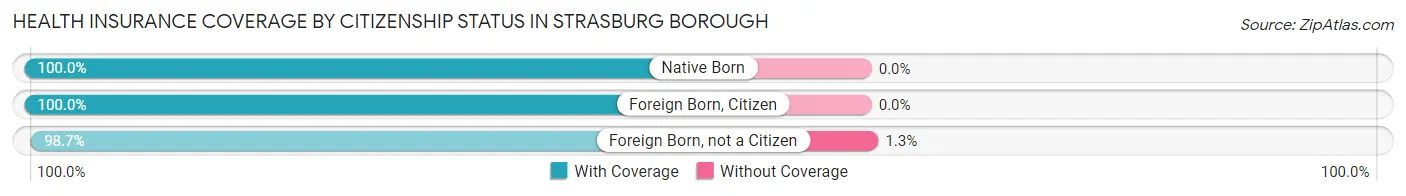
| Citizenship Status | With Coverage | Without Coverage |
| Native Born | 213 (100.0%) | 0 (0.0%) |
| Foreign Born, Citizen | 457 (100.0%) | 0 (0.0%) |
| Foreign Born, not a Citizen | 151 (98.7%) | 2 (1.3%) |
Health Insurance Coverage by Household Income in Strasburg borough
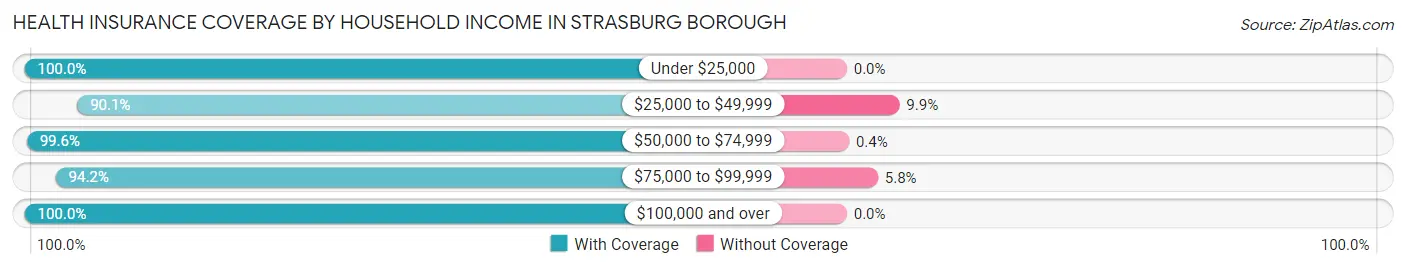
| Household Income | With Coverage | Without Coverage |
| Under $25,000 | 156 (100.0%) | 0 (0.0%) |
| $25,000 to $49,999 | 311 (90.1%) | 34 (9.9%) |
| $50,000 to $74,999 | 495 (99.6%) | 2 (0.4%) |
| $75,000 to $99,999 | 712 (94.2%) | 44 (5.8%) |
| $100,000 and over | 1,343 (100.0%) | 0 (0.0%) |
Public vs Private Health Insurance Coverage by Age in Strasburg borough
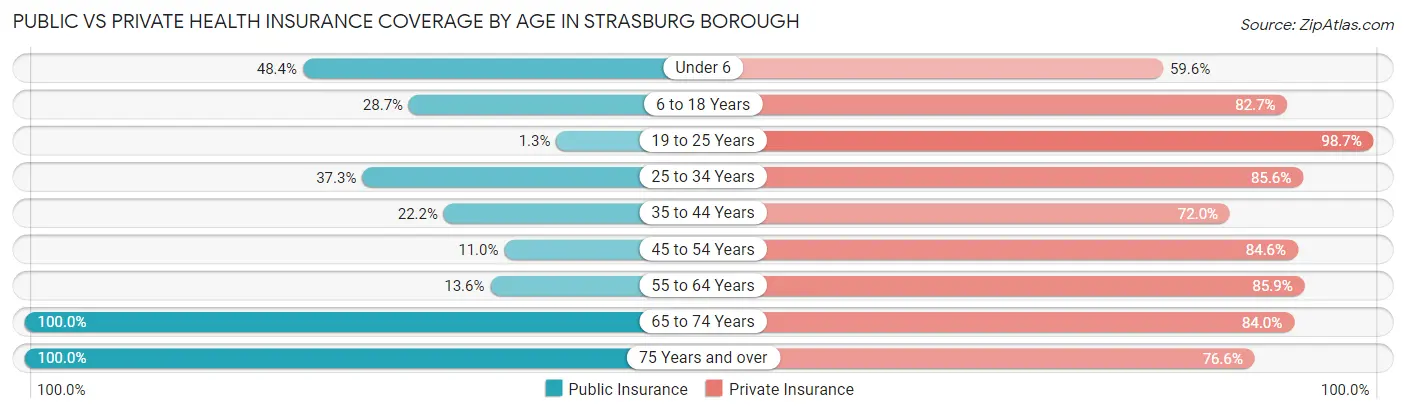
| Age Bracket | Public Insurance | Private Insurance |
| Under 6 | 103 (48.4%) | 127 (59.6%) |
| 6 to 18 Years | 131 (28.7%) | 378 (82.7%) |
| 19 to 25 Years | 2 (1.3%) | 151 (98.7%) |
| 25 to 34 Years | 109 (37.3%) | 250 (85.6%) |
| 35 to 44 Years | 69 (22.2%) | 224 (72.0%) |
| 45 to 54 Years | 35 (11.0%) | 270 (84.6%) |
| 55 to 64 Years | 72 (13.6%) | 456 (85.9%) |
| 65 to 74 Years | 517 (100.0%) | 434 (84.0%) |
| 75 Years and over | 304 (100.0%) | 233 (76.6%) |
| Total | 1,342 (43.3%) | 2,523 (81.5%) |
Disability Status by Sex by Age in Strasburg borough
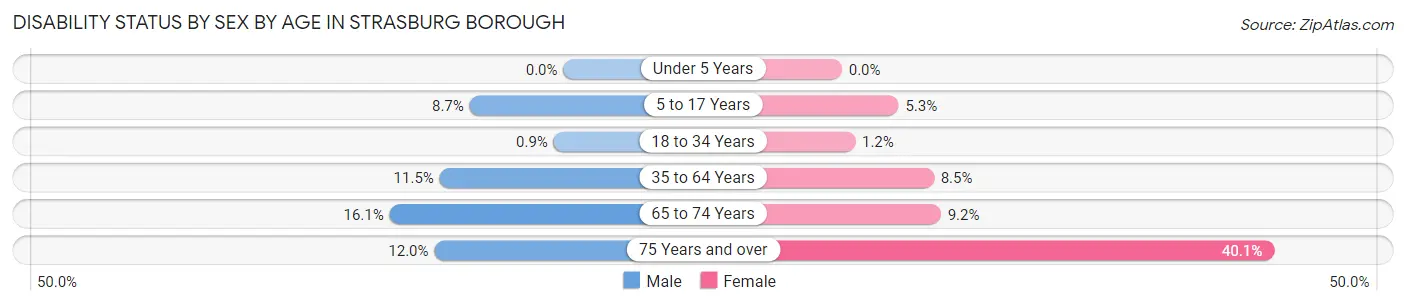
| Age Bracket | Male | Female |
| Under 5 Years | 0 (0.0%) | 0 (0.0%) |
| 5 to 17 Years | 18 (8.7%) | 14 (5.3%) |
| 18 to 34 Years | 2 (0.9%) | 3 (1.2%) |
| 35 to 64 Years | 66 (11.5%) | 50 (8.5%) |
| 65 to 74 Years | 50 (16.1%) | 19 (9.2%) |
| 75 Years and over | 14 (12.0%) | 75 (40.1%) |
Disability Class by Sex by Age in Strasburg borough
Disability Class: Hearing Difficulty
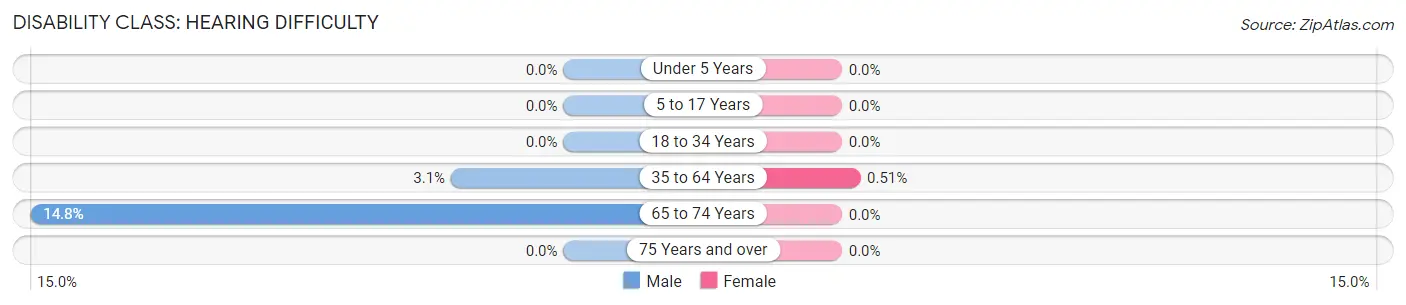
| Age Bracket | Male | Female |
| Under 5 Years | 0 (0.0%) | 0 (0.0%) |
| 5 to 17 Years | 0 (0.0%) | 0 (0.0%) |
| 18 to 34 Years | 0 (0.0%) | 0 (0.0%) |
| 35 to 64 Years | 18 (3.1%) | 3 (0.5%) |
| 65 to 74 Years | 46 (14.8%) | 0 (0.0%) |
| 75 Years and over | 0 (0.0%) | 0 (0.0%) |
Disability Class: Vision Difficulty
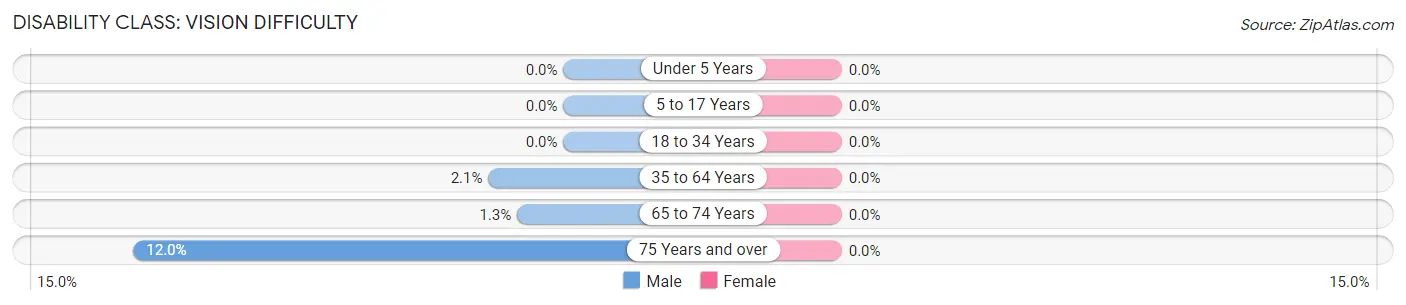
| Age Bracket | Male | Female |
| Under 5 Years | 0 (0.0%) | 0 (0.0%) |
| 5 to 17 Years | 0 (0.0%) | 0 (0.0%) |
| 18 to 34 Years | 0 (0.0%) | 0 (0.0%) |
| 35 to 64 Years | 12 (2.1%) | 0 (0.0%) |
| 65 to 74 Years | 4 (1.3%) | 0 (0.0%) |
| 75 Years and over | 14 (12.0%) | 0 (0.0%) |
Disability Class: Cognitive Difficulty
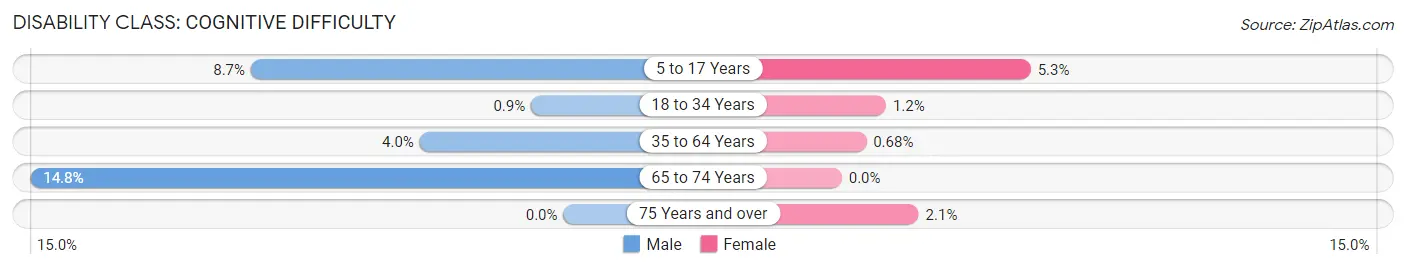
| Age Bracket | Male | Female |
| 5 to 17 Years | 18 (8.7%) | 14 (5.3%) |
| 18 to 34 Years | 2 (0.9%) | 3 (1.2%) |
| 35 to 64 Years | 23 (4.0%) | 4 (0.7%) |
| 65 to 74 Years | 46 (14.8%) | 0 (0.0%) |
| 75 Years and over | 0 (0.0%) | 4 (2.1%) |
Disability Class: Ambulatory Difficulty
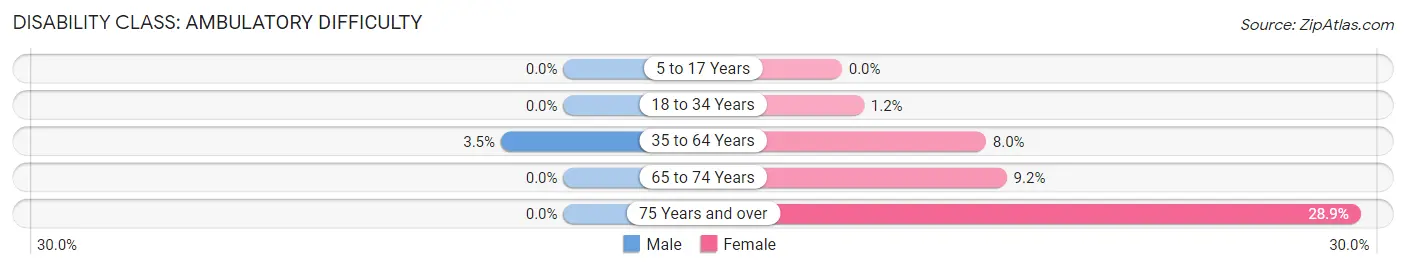
| Age Bracket | Male | Female |
| 5 to 17 Years | 0 (0.0%) | 0 (0.0%) |
| 18 to 34 Years | 0 (0.0%) | 3 (1.2%) |
| 35 to 64 Years | 20 (3.5%) | 47 (8.0%) |
| 65 to 74 Years | 0 (0.0%) | 19 (9.2%) |
| 75 Years and over | 0 (0.0%) | 54 (28.9%) |
Disability Class: Self-Care Difficulty
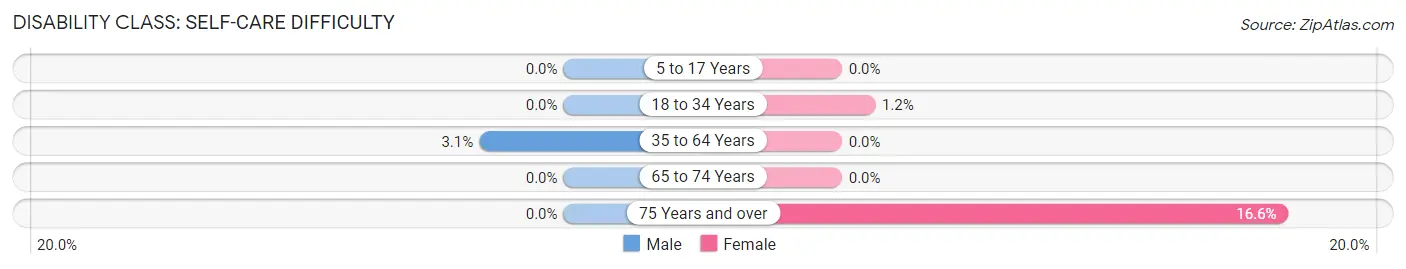
| Age Bracket | Male | Female |
| 5 to 17 Years | 0 (0.0%) | 0 (0.0%) |
| 18 to 34 Years | 0 (0.0%) | 3 (1.2%) |
| 35 to 64 Years | 18 (3.1%) | 0 (0.0%) |
| 65 to 74 Years | 0 (0.0%) | 0 (0.0%) |
| 75 Years and over | 0 (0.0%) | 31 (16.6%) |
Technology Access in Strasburg borough
Computing Device Access in Strasburg borough
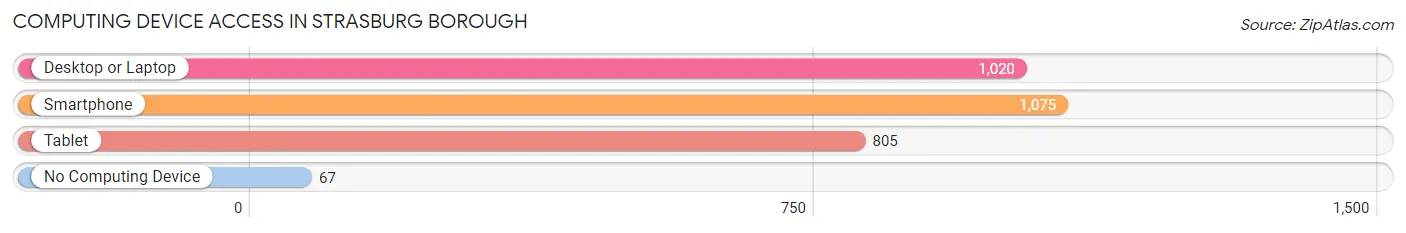
| Device Type | # Households | % Households |
| Desktop or Laptop | 1,020 | 81.5% |
| Smartphone | 1,075 | 85.9% |
| Tablet | 805 | 64.3% |
| No Computing Device | 67 | 5.3% |
| Total | 1,252 | 100.0% |
Internet Access in Strasburg borough
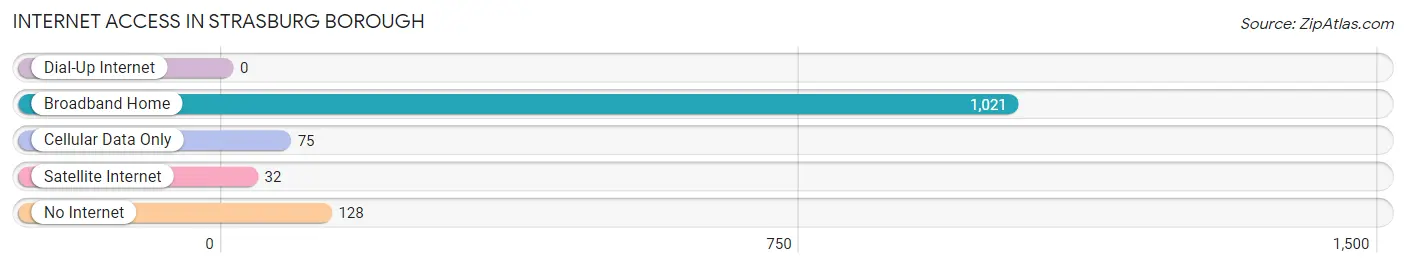
| Internet Type | # Households | % Households |
| Dial-Up Internet | 0 | 0.0% |
| Broadband Home | 1,021 | 81.6% |
| Cellular Data Only | 75 | 6.0% |
| Satellite Internet | 32 | 2.6% |
| No Internet | 128 | 10.2% |
| Total | 1,252 | 100.0% |
Strasburg borough Summary
Strasburg Borough is a small borough located in Lancaster County, Pennsylvania. It is situated in the southeastern corner of the county, approximately 10 miles east of the city of Lancaster. The borough is bordered by East Lampeter Township to the north, Paradise Township to the east, and West Lampeter Township to the south and west. According to the 2010 census, the population of Strasburg Borough was 2,398.
History
Strasburg Borough was founded in 1740 by a group of Mennonites from Germany. The town was named after Strasbourg, France, which was the hometown of one of the original settlers. The town was originally a farming community, but it soon developed into a center of commerce and industry. The first industry in the area was a grist mill, which was built in 1750. This was followed by a sawmill, a tannery, and a distillery.
In the late 19th century, Strasburg Borough became a popular tourist destination. The town was home to several hotels, including the Strasburg Hotel, which was built in 1876. The Strasburg Railroad was also established in 1832, and it quickly became a popular attraction for tourists.
Geography
Strasburg Borough is located in southeastern Lancaster County, Pennsylvania. It is situated in the southeastern corner of the county, approximately 10 miles east of the city of Lancaster. The borough is bordered by East Lampeter Township to the north, Paradise Township to the east, and West Lampeter Township to the south and west. According to the 2010 census, the population of Strasburg Borough was 2,398.
The borough covers an area of 1.2 square miles, all of which is land. The terrain is mostly flat, with some rolling hills in the northern part of the borough. The borough is located in the Piedmont region of Pennsylvania, and the climate is characterized by hot, humid summers and cold, wet winters.
Economy
The economy of Strasburg Borough is largely based on tourism and agriculture. The town is home to several tourist attractions, including the Strasburg Railroad, the Strasburg Hotel, and the Strasburg Museum. The town is also home to several farms, which produce a variety of crops, including corn, soybeans, and wheat.
The town is also home to several small businesses, including restaurants, retail stores, and professional services. The town is also home to several manufacturing companies, including a furniture factory and a printing company.
Demographics
According to the 2010 census, the population of Strasburg Borough was 2,398. The racial makeup of the borough was 95.3% White, 1.2% African American, 0.2% Native American, 0.7% Asian, 0.1% Pacific Islander, 0.9% from other races, and 1.6% from two or more races. Hispanic or Latino of any race were 2.2% of the population.
The median household income in the borough was $50,938, and the median family income was $60,938. The per capita income in the borough was $25,938. About 6.3% of families and 8.2% of the population were below the poverty line, including 10.2% of those under age 18 and 6.2% of those age 65 or over.
Common Questions
What is Per Capita Income in Strasburg borough?
Per Capita income in Strasburg borough is $39,762.
What is the Median Family Income in Strasburg borough?
Median Family Income in Strasburg borough is $92,083.
What is the Median Household income in Strasburg borough?
Median Household Income in Strasburg borough is $85,753.
What is Income or Wage Gap in Strasburg borough?
Income or Wage Gap in Strasburg borough is 14.5%.
Women in Strasburg borough earn 85.5 cents for every dollar earned by a man.
What is Inequality or Gini Index in Strasburg borough?
Inequality or Gini Index in Strasburg borough is 0.34.
What is the Total Population of Strasburg borough?
Total Population of Strasburg borough is 3,097.
What is the Total Male Population of Strasburg borough?
Total Male Population of Strasburg borough is 1,500.
What is the Total Female Population of Strasburg borough?
Total Female Population of Strasburg borough is 1,597.
What is the Ratio of Males per 100 Females in Strasburg borough?
There are 93.93 Males per 100 Females in Strasburg borough.
What is the Ratio of Females per 100 Males in Strasburg borough?
There are 106.47 Females per 100 Males in Strasburg borough.
What is the Median Population Age in Strasburg borough?
Median Population Age in Strasburg borough is 48.6 Years.
What is the Average Family Size in Strasburg borough
Average Family Size in Strasburg borough is 2.7 People.
What is the Average Household Size in Strasburg borough
Average Household Size in Strasburg borough is 2.5 People.
How Large is the Labor Force in Strasburg borough?
There are 1,594 People in the Labor Forcein in Strasburg borough.
What is the Percentage of People in the Labor Force in Strasburg borough?
63.6% of People are in the Labor Force in Strasburg borough.
What is the Unemployment Rate in Strasburg borough?
Unemployment Rate in Strasburg borough is 4.0%.