Harmony borough, PA Map & Demographics
Harmony borough Overview
$33,968
PER CAPITA INCOME
$91,964
AVG FAMILY INCOME
$88,571
AVG HOUSEHOLD INCOME
30.9%
WAGE / INCOME GAP [ % ]
69.1¢/ $1
WAGE / INCOME GAP [ $ ]
0.31
INEQUALITY / GINI INDEX
1,230
TOTAL POPULATION
609
MALE POPULATION
621
FEMALE POPULATION
98.07
MALES / 100 FEMALES
101.97
FEMALES / 100 MALES
43.2
MEDIAN AGE
3.2
AVG FAMILY SIZE
2.8
AVG HOUSEHOLD SIZE
647
LABOR FORCE [ PEOPLE ]
64.6%
PERCENT IN LABOR FORCE
15.6%
UNEMPLOYMENT RATE
Income in Harmony borough
Income Overview in Harmony borough
Per Capita Income in Harmony borough is $33,968, while median incomes of families and households are $91,964 and $88,571 respectively.
| Characteristic | Number | Measure |
| Per Capita Income | 1,230 | $33,968 |
| Median Family Income | 305 | $91,964 |
| Mean Family Income | 305 | $106,075 |
| Median Household Income | 434 | $88,571 |
| Mean Household Income | 434 | $95,699 |
| Income Deficit | 305 | $0 |
| Wage / Income Gap (%) | 1,230 | 30.89% |
| Wage / Income Gap ($) | 1,230 | 69.11¢ per $1 |
| Gini / Inequality Index | 1,230 | 0.31 |
Earnings by Sex in Harmony borough
Average Earnings in Harmony borough are $41,719, $47,656 for men and $32,933 for women, a difference of 30.9%.
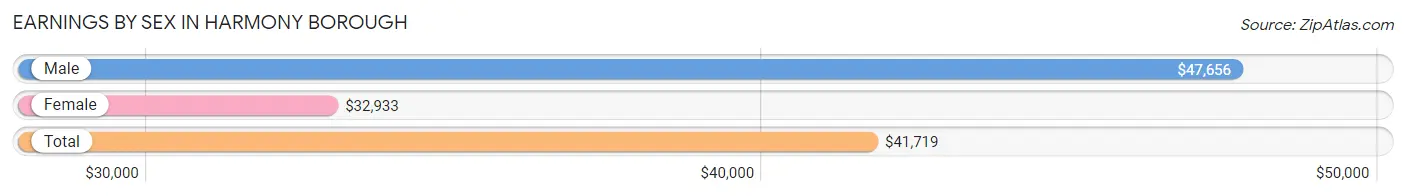
| Sex | Number | Average Earnings |
| Male | 350 (52.8%) | $47,656 |
| Female | 313 (47.2%) | $32,933 |
| Total | 663 (100.0%) | $41,719 |
Earnings by Sex by Income Bracket in Harmony borough
The most common earnings brackets in Harmony borough are $45,000 to $49,999 for men (48 | 13.7%) and $5,000 to $7,499 for women (76 | 24.3%).
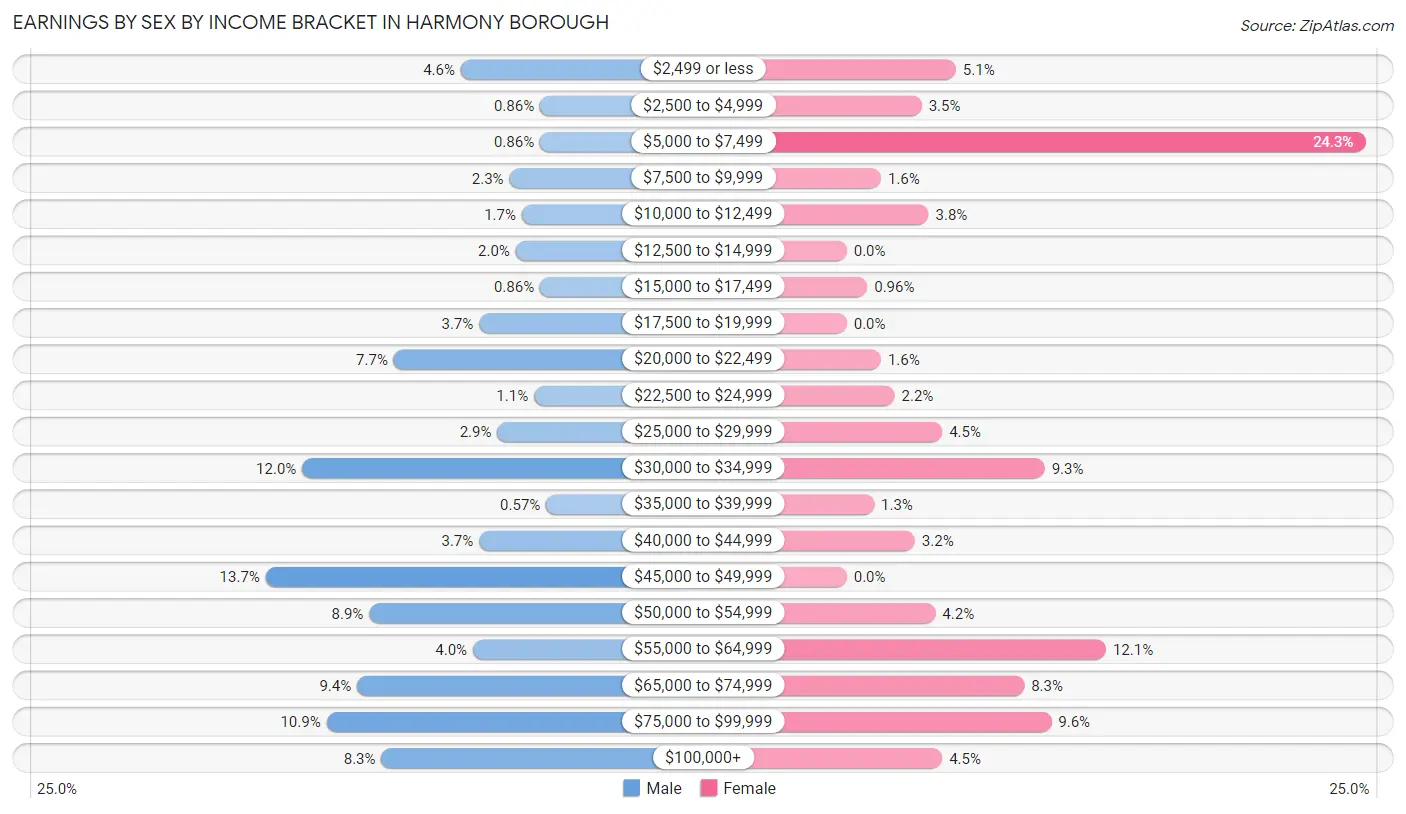
| Income | Male | Female |
| $2,499 or less | 16 (4.6%) | 16 (5.1%) |
| $2,500 to $4,999 | 3 (0.9%) | 11 (3.5%) |
| $5,000 to $7,499 | 3 (0.9%) | 76 (24.3%) |
| $7,500 to $9,999 | 8 (2.3%) | 5 (1.6%) |
| $10,000 to $12,499 | 6 (1.7%) | 12 (3.8%) |
| $12,500 to $14,999 | 7 (2.0%) | 0 (0.0%) |
| $15,000 to $17,499 | 3 (0.9%) | 3 (1.0%) |
| $17,500 to $19,999 | 13 (3.7%) | 0 (0.0%) |
| $20,000 to $22,499 | 27 (7.7%) | 5 (1.6%) |
| $22,500 to $24,999 | 4 (1.1%) | 7 (2.2%) |
| $25,000 to $29,999 | 10 (2.9%) | 14 (4.5%) |
| $30,000 to $34,999 | 42 (12.0%) | 29 (9.3%) |
| $35,000 to $39,999 | 2 (0.6%) | 4 (1.3%) |
| $40,000 to $44,999 | 13 (3.7%) | 10 (3.2%) |
| $45,000 to $49,999 | 48 (13.7%) | 0 (0.0%) |
| $50,000 to $54,999 | 31 (8.9%) | 13 (4.2%) |
| $55,000 to $64,999 | 14 (4.0%) | 38 (12.1%) |
| $65,000 to $74,999 | 33 (9.4%) | 26 (8.3%) |
| $75,000 to $99,999 | 38 (10.9%) | 30 (9.6%) |
| $100,000+ | 29 (8.3%) | 14 (4.5%) |
| Total | 350 (100.0%) | 313 (100.0%) |
Earnings by Sex by Educational Attainment in Harmony borough
Average earnings in Harmony borough are $49,453 for men and $42,500 for women, a difference of 14.1%. Men with an educational attainment of bachelor's degree enjoy the highest average annual earnings of $88,333, while those with college or associate's degree education earn the least with $41,250. Women with an educational attainment of bachelor's degree earn the most with the average annual earnings of $60,521, while those with high school diploma education have the smallest earnings of $33,654.
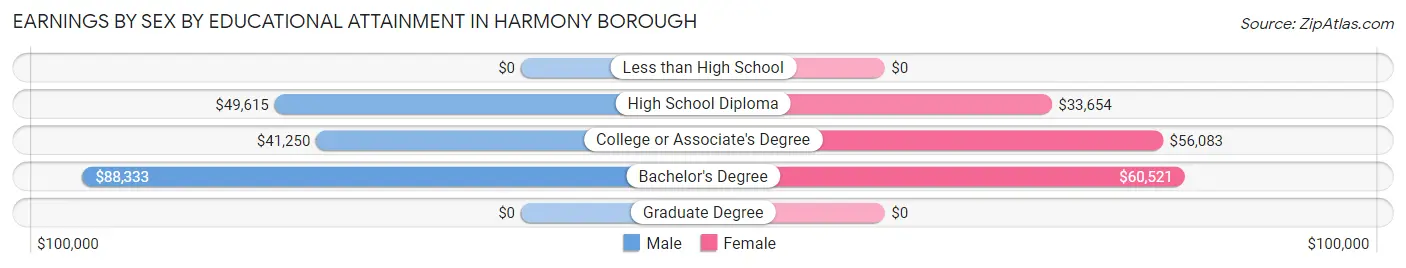
| Educational Attainment | Male Income | Female Income |
| Less than High School | - | - |
| High School Diploma | $49,615 | $33,654 |
| College or Associate's Degree | $41,250 | $56,083 |
| Bachelor's Degree | $88,333 | $60,521 |
| Graduate Degree | - | - |
| Total | $49,453 | $42,500 |
Family Income in Harmony borough
Family Income Brackets in Harmony borough
According to the Harmony borough family income data, there are 75 families falling into the $100,000 to $149,999 income range, which is the most common income bracket and makes up 24.6% of all families.
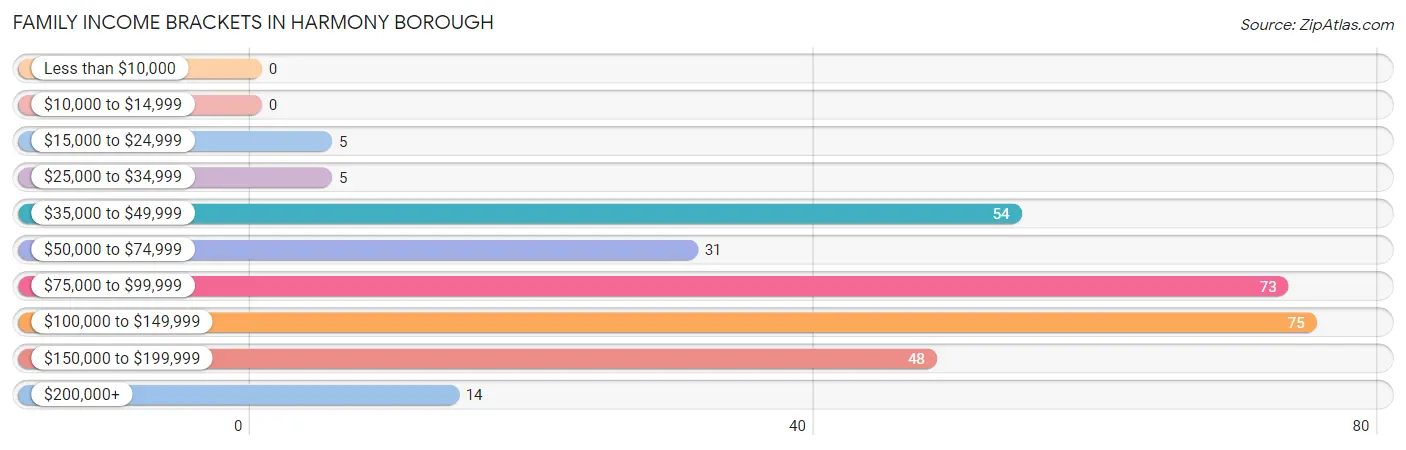
| Income Bracket | # Families | % Families |
| Less than $10,000 | 0 | 0.0% |
| $10,000 to $14,999 | 0 | 0.0% |
| $15,000 to $24,999 | 5 | 1.6% |
| $25,000 to $34,999 | 5 | 1.6% |
| $35,000 to $49,999 | 54 | 17.7% |
| $50,000 to $74,999 | 31 | 10.2% |
| $75,000 to $99,999 | 73 | 23.9% |
| $100,000 to $149,999 | 75 | 24.6% |
| $150,000 to $199,999 | 48 | 15.7% |
| $200,000+ | 14 | 4.6% |
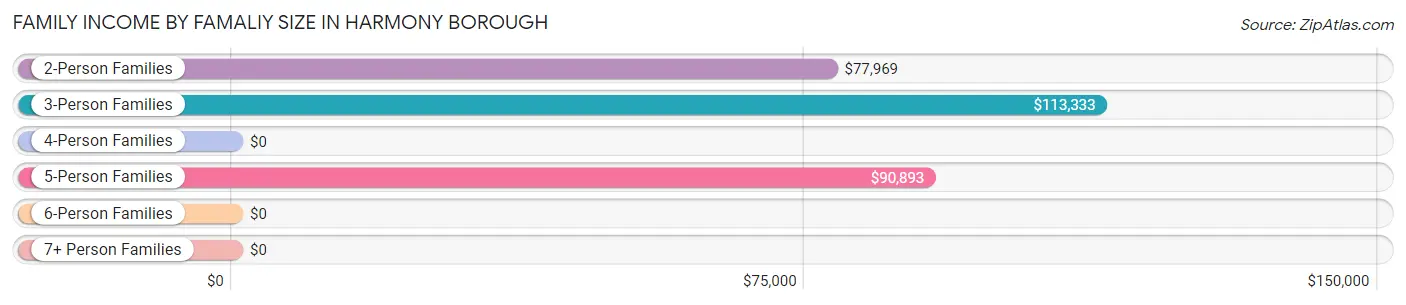
Family Income by Famaliy Size in Harmony borough
3-person families (70 | 23.0%) account for the highest median family income in Harmony borough with $113,333 per family, while 2-person families (149 | 48.8%) have the highest median income of $38,984 per family member.
| Income Bracket | # Families | Median Income |
| 2-Person Families | 149 (48.8%) | $77,969 |
| 3-Person Families | 70 (23.0%) | $113,333 |
| 4-Person Families | 24 (7.9%) | $0 |
| 5-Person Families | 34 (11.2%) | $90,893 |
| 6-Person Families | 5 (1.6%) | $0 |
| 7+ Person Families | 23 (7.5%) | $0 |
| Total | 305 (100.0%) | $91,964 |
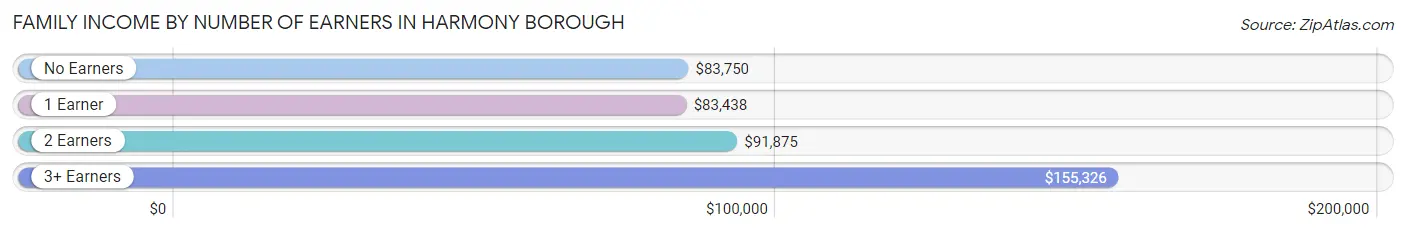
Family Income by Number of Earners in Harmony borough
The median family income in Harmony borough is $91,964, with families comprising 3+ earners (52) having the highest median family income of $155,326, while families with 1 earner (87) have the lowest median family income of $83,438, accounting for 17.1% and 28.5% of families, respectively.
| Number of Earners | # Families | Median Income |
| No Earners | 44 (14.4%) | $83,750 |
| 1 Earner | 87 (28.5%) | $83,438 |
| 2 Earners | 122 (40.0%) | $91,875 |
| 3+ Earners | 52 (17.1%) | $155,326 |
| Total | 305 (100.0%) | $91,964 |
Household Income in Harmony borough
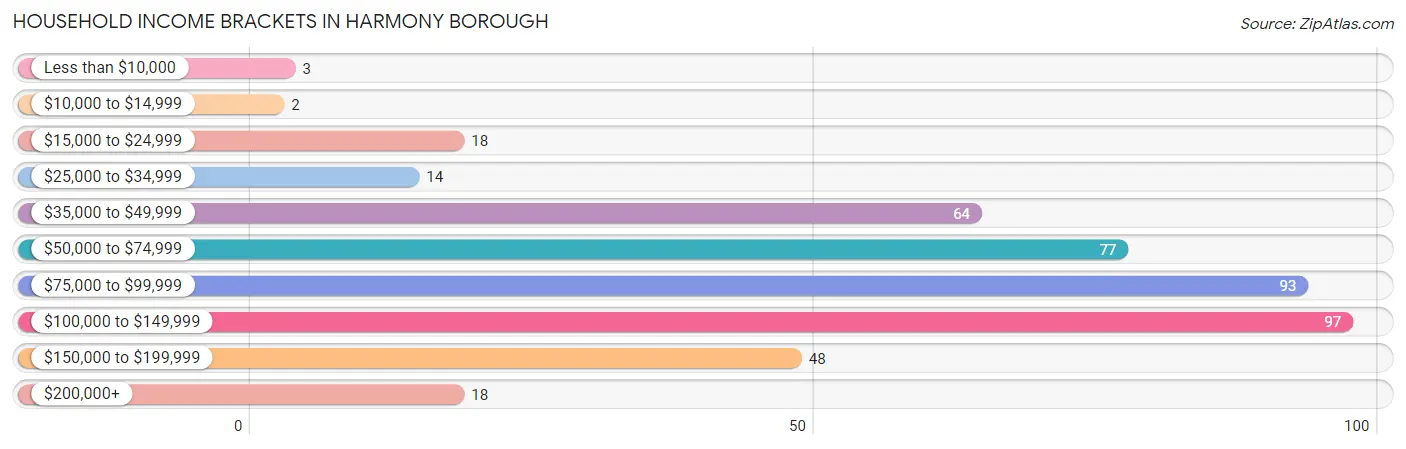
Household Income Brackets in Harmony borough
With 97 households falling in the category, the $100,000 to $149,999 income range is the most frequent in Harmony borough, accounting for 22.4% of all households. In contrast, only 2 households (0.5%) fall into the $10,000 to $14,999 income bracket, making it the least populous group.
| Income Bracket | # Households | % Households |
| Less than $10,000 | 3 | 0.7% |
| $10,000 to $14,999 | 2 | 0.5% |
| $15,000 to $24,999 | 18 | 4.1% |
| $25,000 to $34,999 | 14 | 3.2% |
| $35,000 to $49,999 | 64 | 14.7% |
| $50,000 to $74,999 | 77 | 17.7% |
| $75,000 to $99,999 | 93 | 21.4% |
| $100,000 to $149,999 | 97 | 22.4% |
| $150,000 to $199,999 | 48 | 11.1% |
| $200,000+ | 18 | 4.1% |
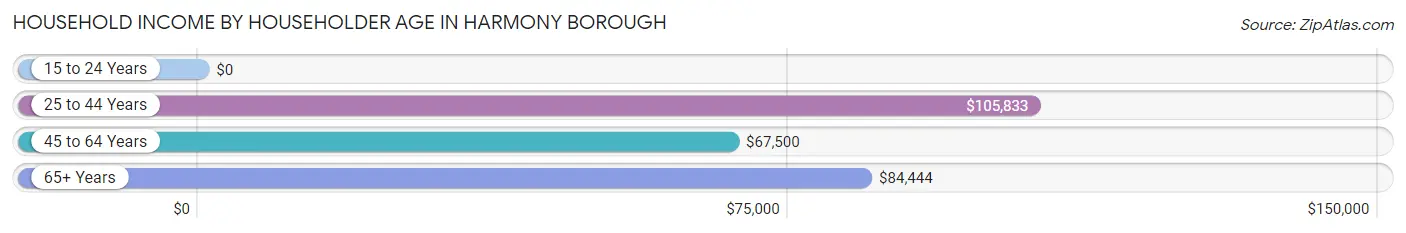
Household Income by Householder Age in Harmony borough
The median household income in Harmony borough is $88,571, with the highest median household income of $105,833 found in the 25 to 44 years age bracket for the primary householder. A total of 108 households (24.9%) fall into this category.
| Income Bracket | # Households | Median Income |
| 15 to 24 Years | 0 (0.0%) | $0 |
| 25 to 44 Years | 108 (24.9%) | $105,833 |
| 45 to 64 Years | 176 (40.6%) | $67,500 |
| 65+ Years | 150 (34.6%) | $84,444 |
| Total | 434 (100.0%) | $88,571 |
Poverty in Harmony borough
Income Below Poverty by Sex and Age in Harmony borough
With 8.1% poverty level for males and 8.1% for females among the residents of Harmony borough, 25 to 34 year old males and 55 to 64 year old females are the most vulnerable to poverty, with 41 males (36.6%) and 40 females (34.5%) in their respective age groups living below the poverty level.
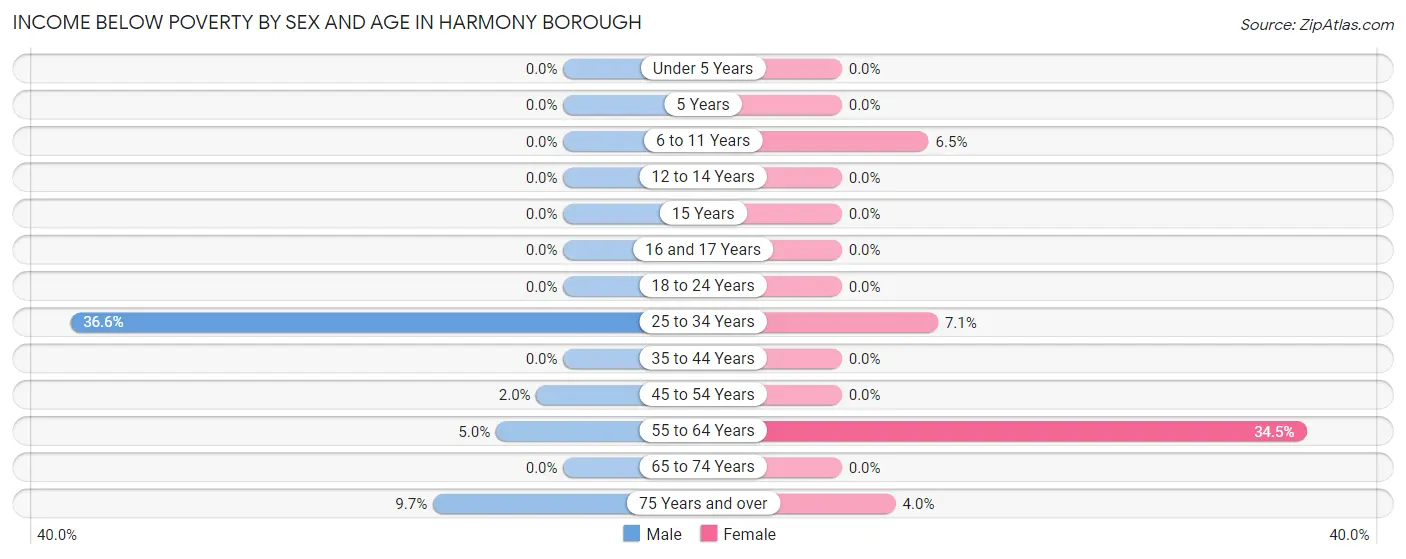
| Age Bracket | Male | Female |
| Under 5 Years | 0 (0.0%) | 0 (0.0%) |
| 5 Years | 0 (0.0%) | 0 (0.0%) |
| 6 to 11 Years | 0 (0.0%) | 4 (6.5%) |
| 12 to 14 Years | 0 (0.0%) | 0 (0.0%) |
| 15 Years | 0 (0.0%) | 0 (0.0%) |
| 16 and 17 Years | 0 (0.0%) | 0 (0.0%) |
| 18 to 24 Years | 0 (0.0%) | 0 (0.0%) |
| 25 to 34 Years | 41 (36.6%) | 5 (7.1%) |
| 35 to 44 Years | 0 (0.0%) | 0 (0.0%) |
| 45 to 54 Years | 2 (2.0%) | 0 (0.0%) |
| 55 to 64 Years | 3 (5.0%) | 40 (34.5%) |
| 65 to 74 Years | 0 (0.0%) | 0 (0.0%) |
| 75 Years and over | 3 (9.7%) | 1 (4.0%) |
| Total | 49 (8.1%) | 50 (8.1%) |
Income Above Poverty by Sex and Age in Harmony borough
According to the poverty statistics in Harmony borough, males aged under 5 years and females aged under 5 years are the age groups that are most secure financially, with 100.0% of males and 100.0% of females in these age groups living above the poverty line.
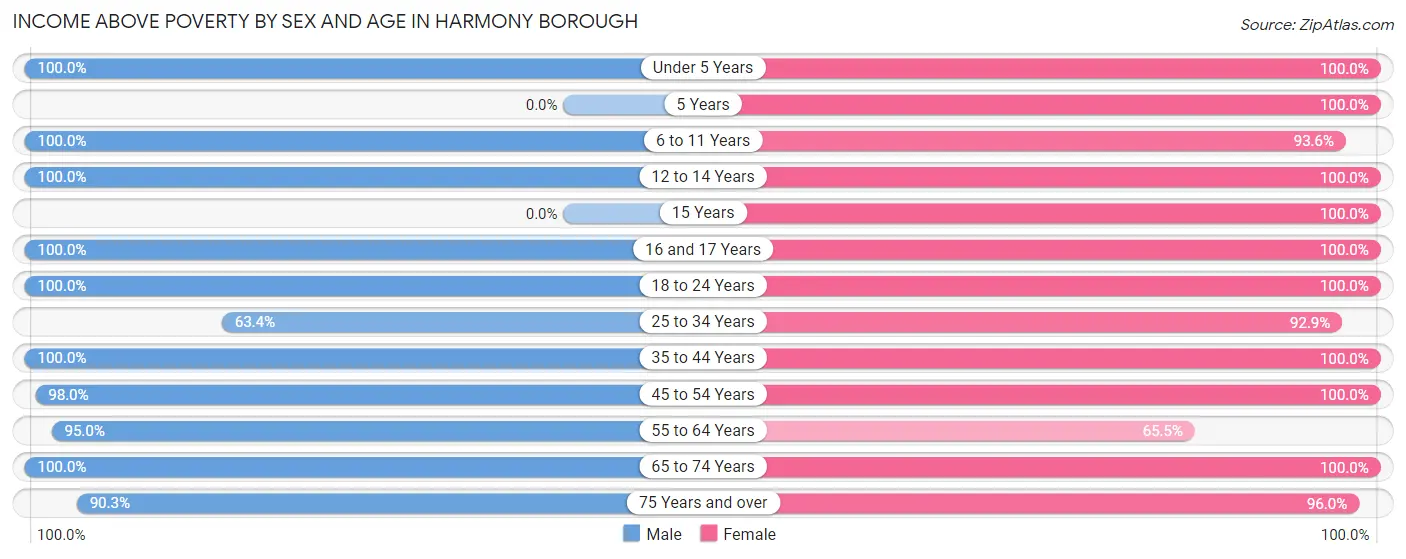
| Age Bracket | Male | Female |
| Under 5 Years | 29 (100.0%) | 13 (100.0%) |
| 5 Years | 0 (0.0%) | 3 (100.0%) |
| 6 to 11 Years | 39 (100.0%) | 58 (93.5%) |
| 12 to 14 Years | 35 (100.0%) | 36 (100.0%) |
| 15 Years | 0 (0.0%) | 12 (100.0%) |
| 16 and 17 Years | 5 (100.0%) | 12 (100.0%) |
| 18 to 24 Years | 44 (100.0%) | 79 (100.0%) |
| 25 to 34 Years | 71 (63.4%) | 65 (92.9%) |
| 35 to 44 Years | 49 (100.0%) | 49 (100.0%) |
| 45 to 54 Years | 98 (98.0%) | 42 (100.0%) |
| 55 to 64 Years | 57 (95.0%) | 76 (65.5%) |
| 65 to 74 Years | 105 (100.0%) | 102 (100.0%) |
| 75 Years and over | 28 (90.3%) | 24 (96.0%) |
| Total | 560 (91.9%) | 571 (91.9%) |
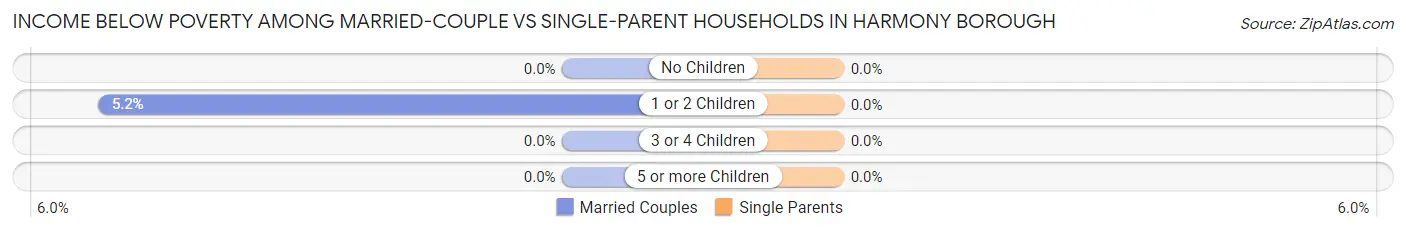
Income Below Poverty Among Married-Couple Families in Harmony borough
The poverty statistics for married-couple families in Harmony borough show that 1.3% or 3 of the total 224 families live below the poverty line. Families with 1 or 2 children have the highest poverty rate of 5.2%, comprising of 3 families. On the other hand, families with no children have the lowest poverty rate of 0.0%, which includes 0 families.
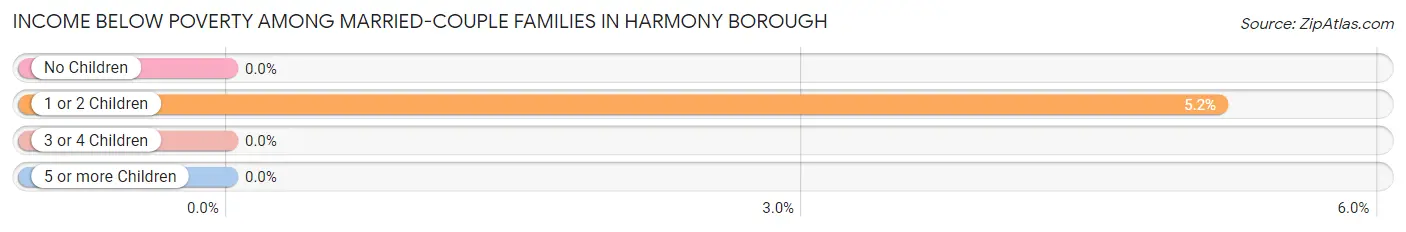
| Children | Above Poverty | Below Poverty |
| No Children | 120 (100.0%) | 0 (0.0%) |
| 1 or 2 Children | 55 (94.8%) | 3 (5.2%) |
| 3 or 4 Children | 46 (100.0%) | 0 (0.0%) |
| 5 or more Children | 0 (0.0%) | 0 (0.0%) |
| Total | 221 (98.7%) | 3 (1.3%) |
Income Below Poverty Among Single-Parent Households in Harmony borough
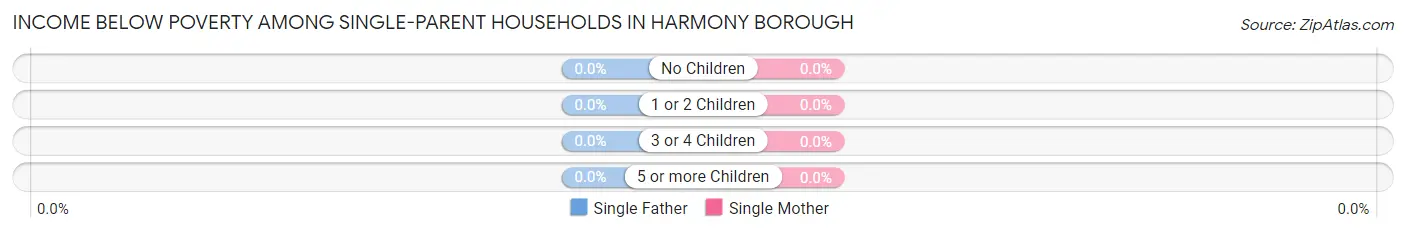
| Children | Single Father | Single Mother |
| No Children | 0 (0.0%) | 0 (0.0%) |
| 1 or 2 Children | 0 (0.0%) | 0 (0.0%) |
| 3 or 4 Children | 0 (0.0%) | 0 (0.0%) |
| 5 or more Children | 0 (0.0%) | 0 (0.0%) |
| Total | 0 (0.0%) | 0 (0.0%) |
Income Below Poverty Among Married-Couple vs Single-Parent Households in Harmony borough
| Children | Married-Couple Families | Single-Parent Households |
| No Children | 0 (0.0%) | 0 (0.0%) |
| 1 or 2 Children | 3 (5.2%) | 0 (0.0%) |
| 3 or 4 Children | 0 (0.0%) | 0 (0.0%) |
| 5 or more Children | 0 (0.0%) | 0 (0.0%) |
| Total | 3 (1.3%) | 0 (0.0%) |
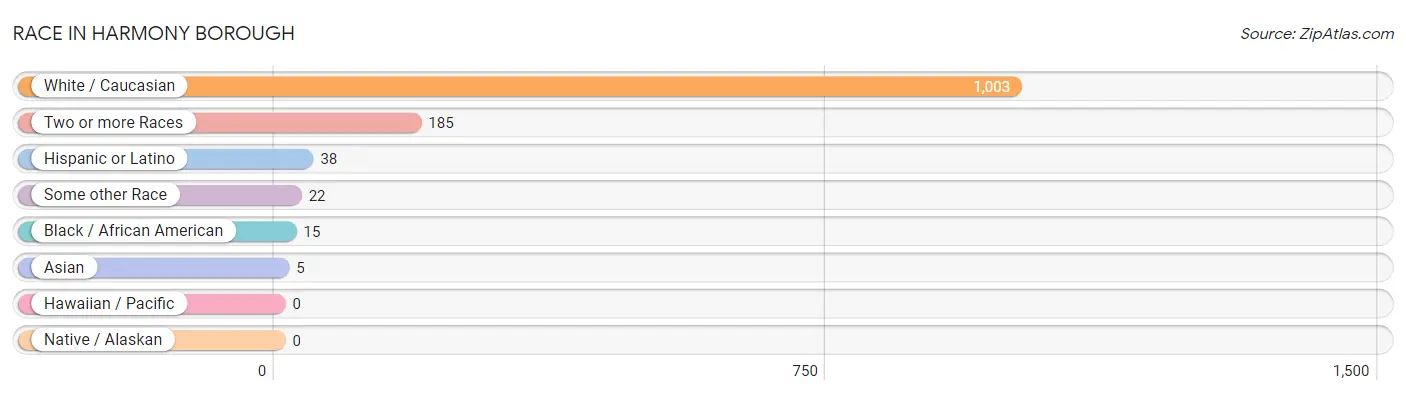
Race in Harmony borough
The most populous races in Harmony borough are White / Caucasian (1,003 | 81.5%), Two or more Races (185 | 15.0%), and Hispanic or Latino (38 | 3.1%).
| Race | # Population | % Population |
| Asian | 5 | 0.4% |
| Black / African American | 15 | 1.2% |
| Hawaiian / Pacific | 0 | 0.0% |
| Hispanic or Latino | 38 | 3.1% |
| Native / Alaskan | 0 | 0.0% |
| White / Caucasian | 1,003 | 81.5% |
| Two or more Races | 185 | 15.0% |
| Some other Race | 22 | 1.8% |
| Total | 1,230 | 100.0% |
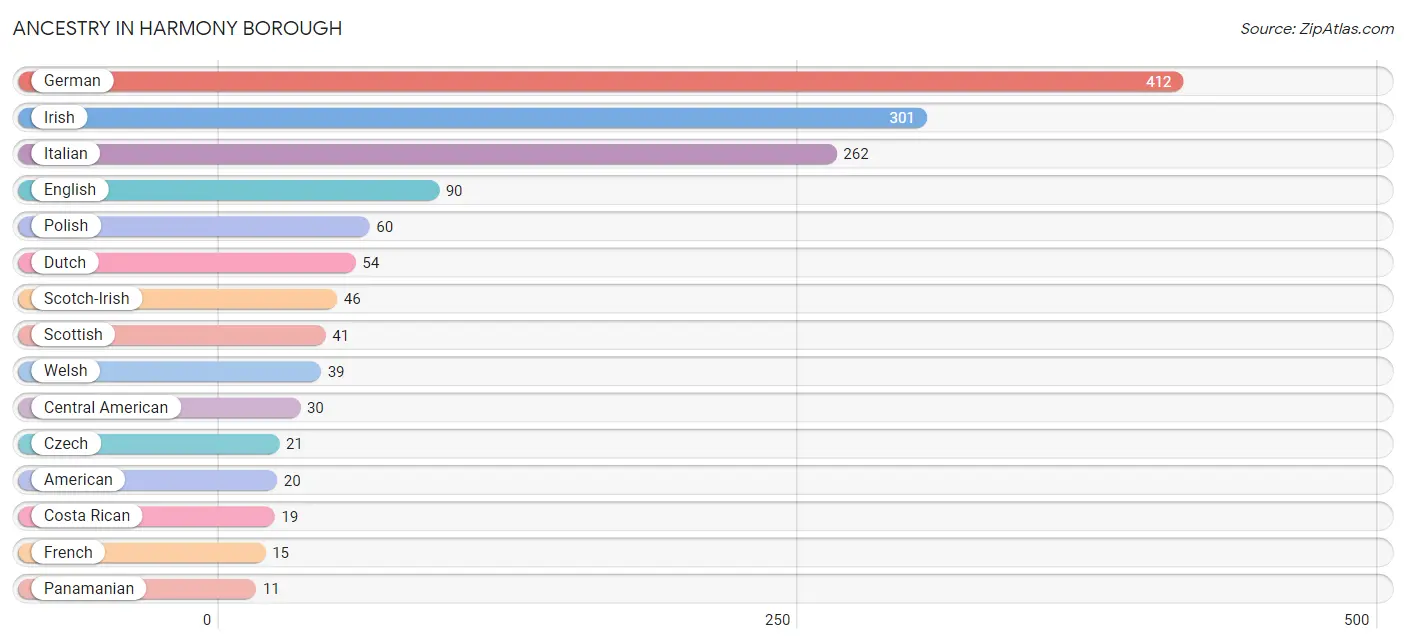
Ancestry in Harmony borough
The most populous ancestries reported in Harmony borough are German (412 | 33.5%), Irish (301 | 24.5%), Italian (262 | 21.3%), English (90 | 7.3%), and Polish (60 | 4.9%), together accounting for 91.5% of all Harmony borough residents.
| Ancestry | # Population | % Population |
| American | 20 | 1.6% |
| Austrian | 4 | 0.3% |
| Central American | 30 | 2.4% |
| Costa Rican | 19 | 1.5% |
| Czech | 21 | 1.7% |
| Dutch | 54 | 4.4% |
| Eastern European | 9 | 0.7% |
| English | 90 | 7.3% |
| Finnish | 4 | 0.3% |
| French | 15 | 1.2% |
| German | 412 | 33.5% |
| Hungarian | 7 | 0.6% |
| Indian (Asian) | 4 | 0.3% |
| Irish | 301 | 24.5% |
| Italian | 262 | 21.3% |
| Korean | 8 | 0.6% |
| Lithuanian | 7 | 0.6% |
| Norwegian | 5 | 0.4% |
| Panamanian | 11 | 0.9% |
| Polish | 60 | 4.9% |
| Puerto Rican | 8 | 0.6% |
| Russian | 4 | 0.3% |
| Scotch-Irish | 46 | 3.7% |
| Scottish | 41 | 3.3% |
| Slovak | 6 | 0.5% |
| South African | 9 | 0.7% |
| Subsaharan African | 9 | 0.7% |
| Swedish | 7 | 0.6% |
| Swiss | 8 | 0.6% |
| Ukrainian | 2 | 0.2% |
| Welsh | 39 | 3.2% | View All 31 Rows |
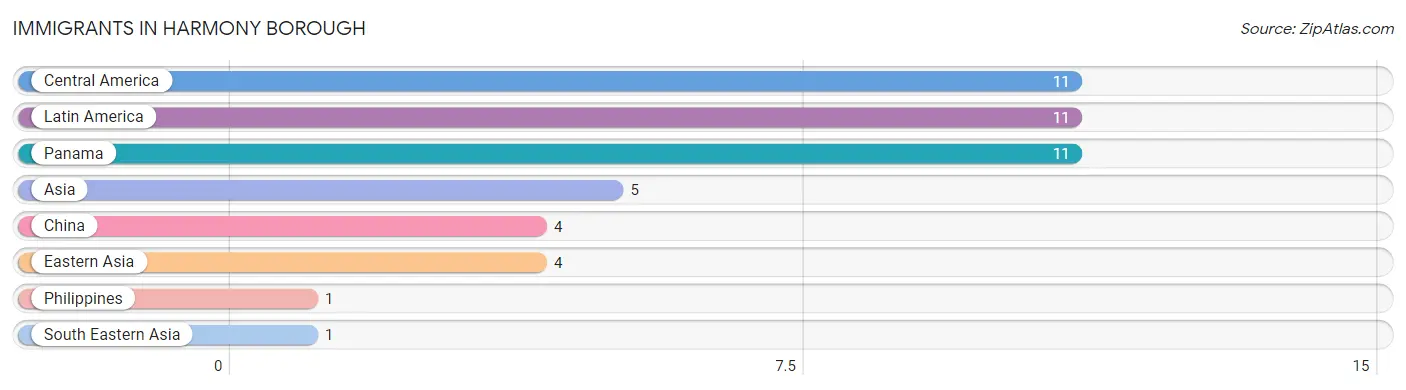
Immigrants in Harmony borough
The most numerous immigrant groups reported in Harmony borough came from Central America (11 | 0.9%), Latin America (11 | 0.9%), Panama (11 | 0.9%), Asia (5 | 0.4%), and China (4 | 0.3%), together accounting for 3.4% of all Harmony borough residents.
| Immigration Origin | # Population | % Population |
| Asia | 5 | 0.4% |
| Central America | 11 | 0.9% |
| China | 4 | 0.3% |
| Eastern Asia | 4 | 0.3% |
| Latin America | 11 | 0.9% |
| Panama | 11 | 0.9% |
| Philippines | 1 | 0.1% |
| South Eastern Asia | 1 | 0.1% | View All 8 Rows |
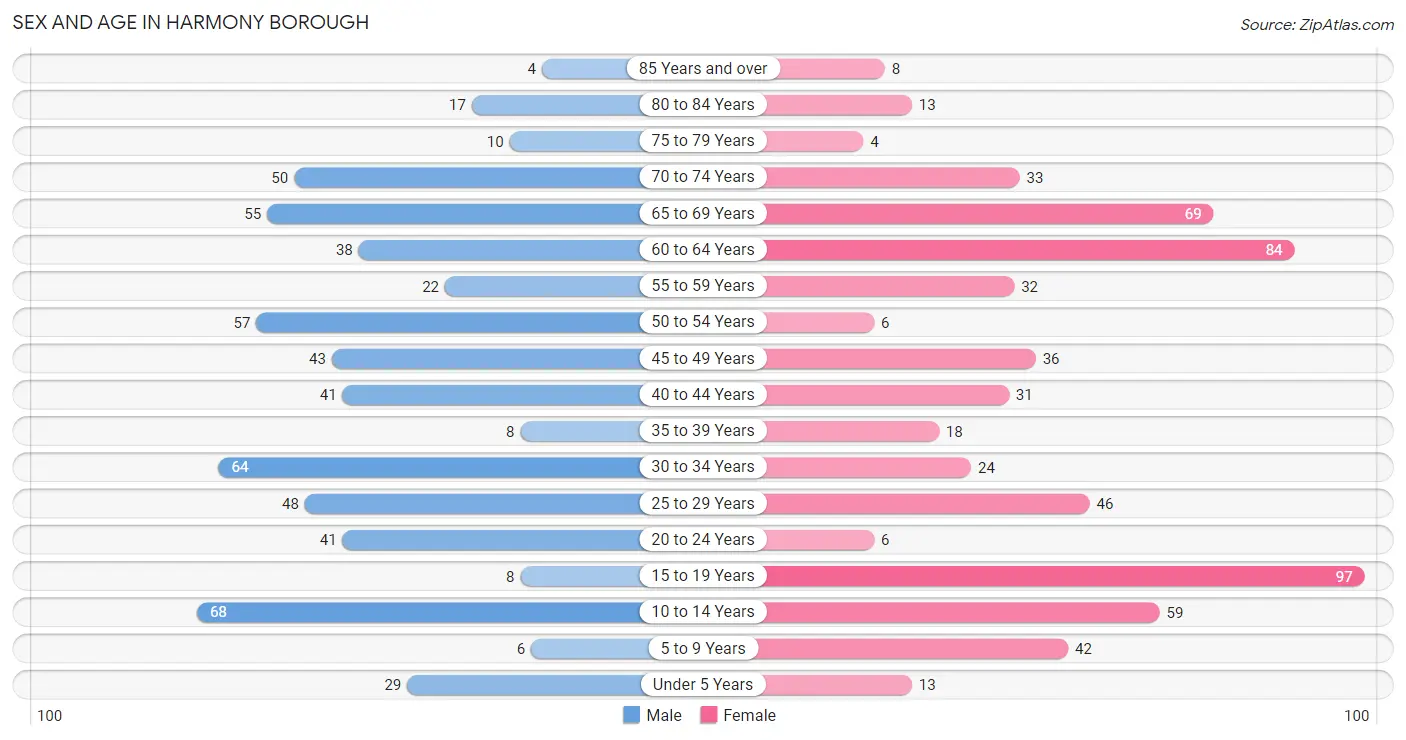
Sex and Age in Harmony borough
Sex and Age in Harmony borough
The most populous age groups in Harmony borough are 10 to 14 Years (68 | 11.2%) for men and 15 to 19 Years (97 | 15.6%) for women.
| Age Bracket | Male | Female |
| Under 5 Years | 29 (4.8%) | 13 (2.1%) |
| 5 to 9 Years | 6 (1.0%) | 42 (6.8%) |
| 10 to 14 Years | 68 (11.2%) | 59 (9.5%) |
| 15 to 19 Years | 8 (1.3%) | 97 (15.6%) |
| 20 to 24 Years | 41 (6.7%) | 6 (1.0%) |
| 25 to 29 Years | 48 (7.9%) | 46 (7.4%) |
| 30 to 34 Years | 64 (10.5%) | 24 (3.9%) |
| 35 to 39 Years | 8 (1.3%) | 18 (2.9%) |
| 40 to 44 Years | 41 (6.7%) | 31 (5.0%) |
| 45 to 49 Years | 43 (7.1%) | 36 (5.8%) |
| 50 to 54 Years | 57 (9.4%) | 6 (1.0%) |
| 55 to 59 Years | 22 (3.6%) | 32 (5.1%) |
| 60 to 64 Years | 38 (6.2%) | 84 (13.5%) |
| 65 to 69 Years | 55 (9.0%) | 69 (11.1%) |
| 70 to 74 Years | 50 (8.2%) | 33 (5.3%) |
| 75 to 79 Years | 10 (1.6%) | 4 (0.6%) |
| 80 to 84 Years | 17 (2.8%) | 13 (2.1%) |
| 85 Years and over | 4 (0.7%) | 8 (1.3%) |
| Total | 609 (100.0%) | 621 (100.0%) |
Families and Households in Harmony borough
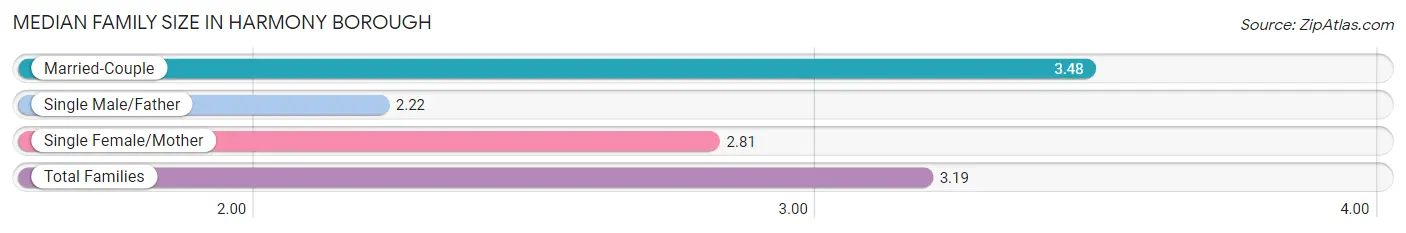
Median Family Size in Harmony borough
The median family size in Harmony borough is 3.19 persons per family, with married-couple families (224 | 73.4%) accounting for the largest median family size of 3.48 persons per family. On the other hand, single male/father families (60 | 19.7%) represent the smallest median family size with 2.22 persons per family.
| Family Type | # Families | Family Size |
| Married-Couple | 224 (73.4%) | 3.48 |
| Single Male/Father | 60 (19.7%) | 2.22 |
| Single Female/Mother | 21 (6.9%) | 2.81 |
| Total Families | 305 (100.0%) | 3.19 |
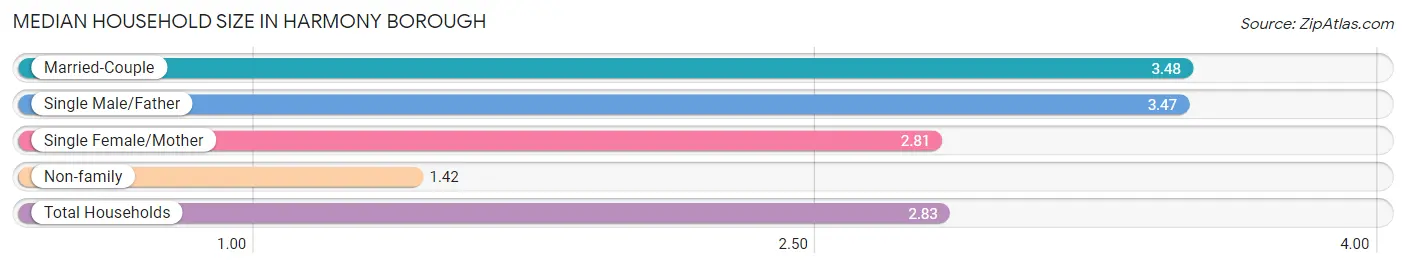
Median Household Size in Harmony borough
The median household size in Harmony borough is 2.83 persons per household, with married-couple households (224 | 51.6%) accounting for the largest median household size of 3.48 persons per household. non-family households (129 | 29.7%) represent the smallest median household size with 1.42 persons per household.
| Household Type | # Households | Household Size |
| Married-Couple | 224 (51.6%) | 3.48 |
| Single Male/Father | 60 (13.8%) | 3.47 |
| Single Female/Mother | 21 (4.8%) | 2.81 |
| Non-family | 129 (29.7%) | 1.42 |
| Total Households | 434 (100.0%) | 2.83 |
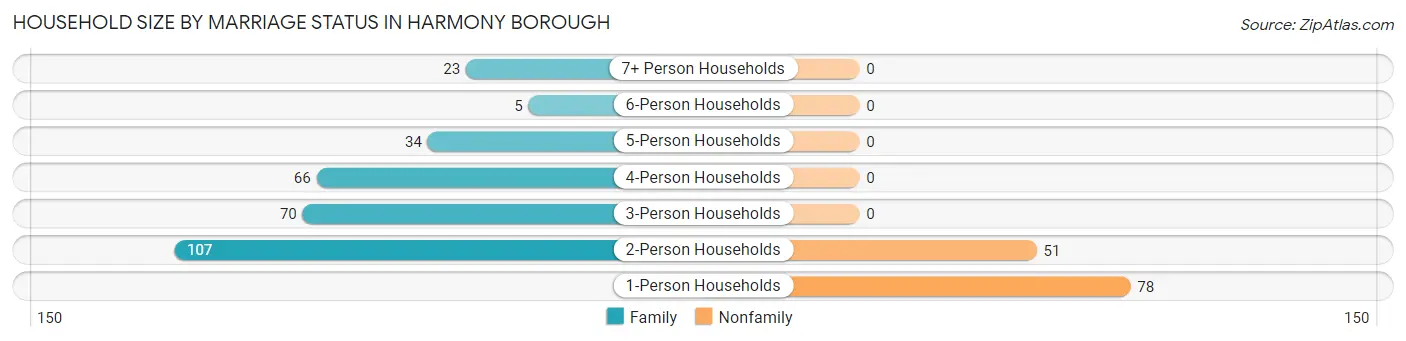
Household Size by Marriage Status in Harmony borough
Out of a total of 434 households in Harmony borough, 305 (70.3%) are family households, while 129 (29.7%) are nonfamily households. The most numerous type of family households are 2-person households, comprising 107, and the most common type of nonfamily households are 1-person households, comprising 78.
| Household Size | Family Households | Nonfamily Households |
| 1-Person Households | - | 78 (18.0%) |
| 2-Person Households | 107 (24.6%) | 51 (11.7%) |
| 3-Person Households | 70 (16.1%) | 0 (0.0%) |
| 4-Person Households | 66 (15.2%) | 0 (0.0%) |
| 5-Person Households | 34 (7.8%) | 0 (0.0%) |
| 6-Person Households | 5 (1.1%) | 0 (0.0%) |
| 7+ Person Households | 23 (5.3%) | 0 (0.0%) |
| Total | 305 (70.3%) | 129 (29.7%) |
Female Fertility in Harmony borough
Fertility by Age in Harmony borough
Average fertility rate in Harmony borough is 8.0 births per 1,000 women. Women in the age bracket of 35 to 50 years have the highest fertility rate with 24.0 births per 1,000 women. Women in the age bracket of 35 to 50 years acount for 100.0% of all women with births.
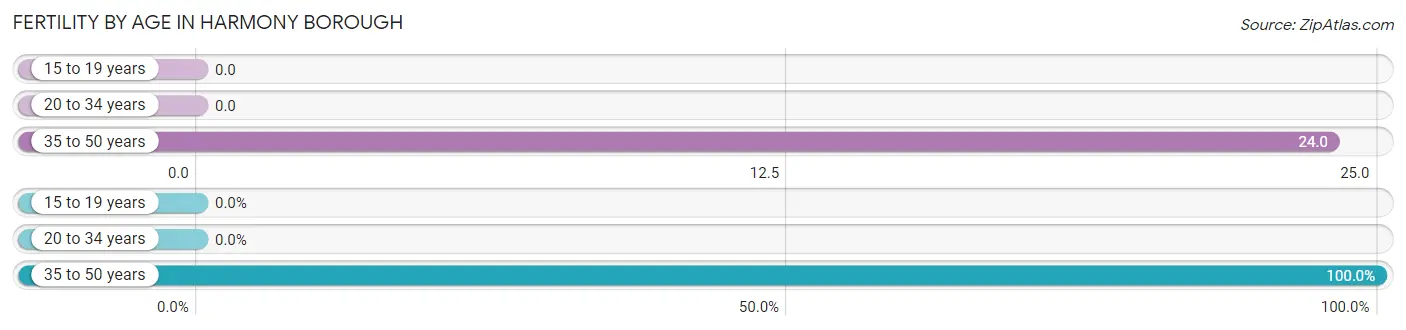
| Age Bracket | Women with Births | Births / 1,000 Women |
| 15 to 19 years | 0 (0.0%) | 0.0 |
| 20 to 34 years | 0 (0.0%) | 0.0 |
| 35 to 50 years | 2 (100.0%) | 24.0 |
| Total | 2 (100.0%) | 8.0 |
Fertility by Age by Marriage Status in Harmony borough
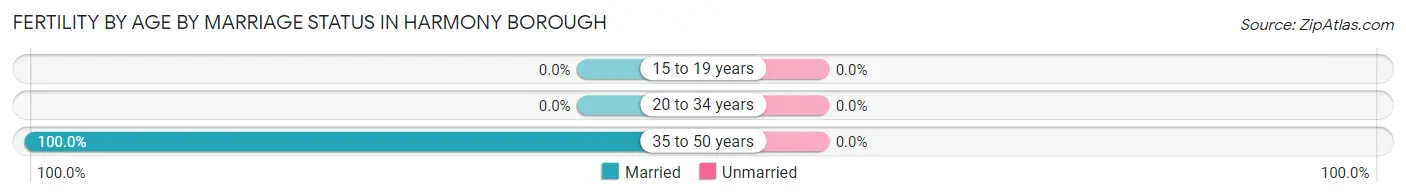
| Age Bracket | Married | Unmarried |
| 15 to 19 years | 0 (0.0%) | 0 (0.0%) |
| 20 to 34 years | 0 (0.0%) | 0 (0.0%) |
| 35 to 50 years | 2 (100.0%) | 0 (0.0%) |
| Total | 2 (100.0%) | 0 (0.0%) |
Fertility by Education in Harmony borough
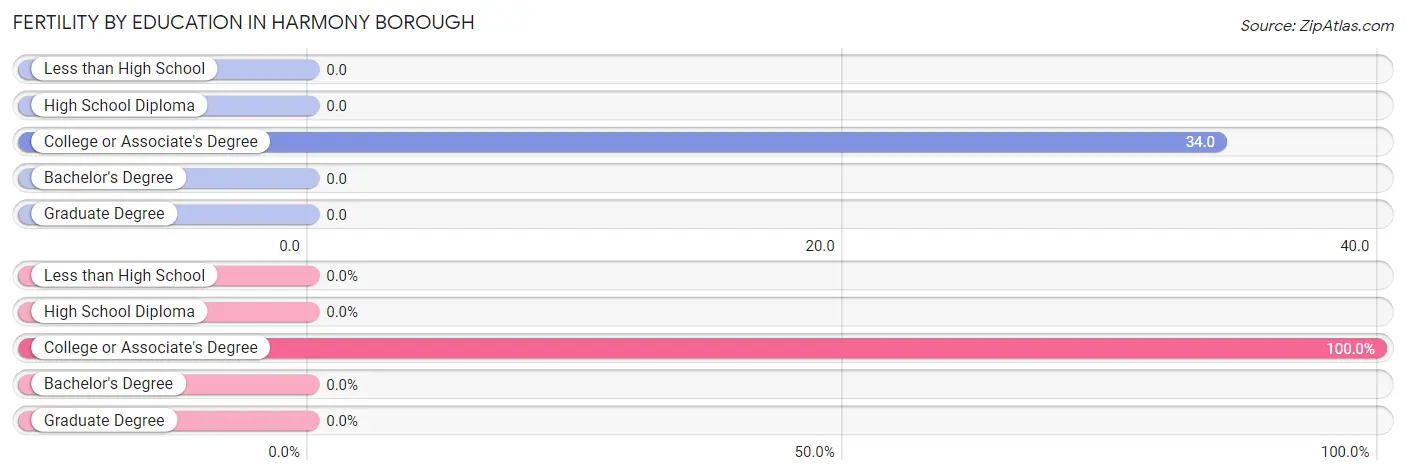
| Educational Attainment | Women with Births | Births / 1,000 Women |
| Less than High School | 0 (0.0%) | 0.0 |
| High School Diploma | 0 (0.0%) | 0.0 |
| College or Associate's Degree | 2 (100.0%) | 34.0 |
| Bachelor's Degree | 0 (0.0%) | 0.0 |
| Graduate Degree | 0 (0.0%) | 0.0 |
| Total | 2 (100.0%) | 8.0 |
Fertility by Education by Marriage Status in Harmony borough
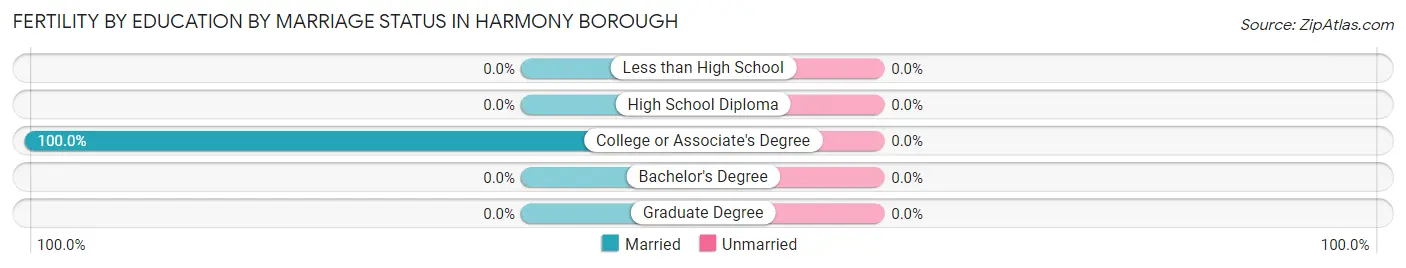
| Educational Attainment | Married | Unmarried |
| Less than High School | 0 (0.0%) | 0 (0.0%) |
| High School Diploma | 0 (0.0%) | 0 (0.0%) |
| College or Associate's Degree | 2 (100.0%) | 0 (0.0%) |
| Bachelor's Degree | 0 (0.0%) | 0 (0.0%) |
| Graduate Degree | 0 (0.0%) | 0 (0.0%) |
| Total | 2 (100.0%) | 0 (0.0%) |
Employment Characteristics in Harmony borough
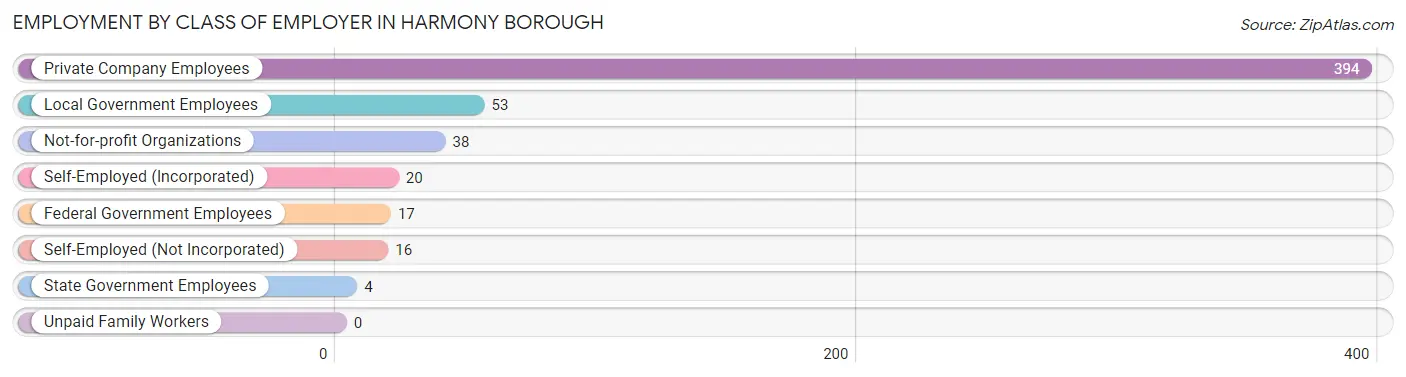
Employment by Class of Employer in Harmony borough
Among the 542 employed individuals in Harmony borough, private company employees (394 | 72.7%), local government employees (53 | 9.8%), and not-for-profit organizations (38 | 7.0%) make up the most common classes of employment.
| Employer Class | # Employees | % Employees |
| Private Company Employees | 394 | 72.7% |
| Self-Employed (Incorporated) | 20 | 3.7% |
| Self-Employed (Not Incorporated) | 16 | 2.9% |
| Not-for-profit Organizations | 38 | 7.0% |
| Local Government Employees | 53 | 9.8% |
| State Government Employees | 4 | 0.7% |
| Federal Government Employees | 17 | 3.1% |
| Unpaid Family Workers | 0 | 0.0% |
| Total | 542 | 100.0% |
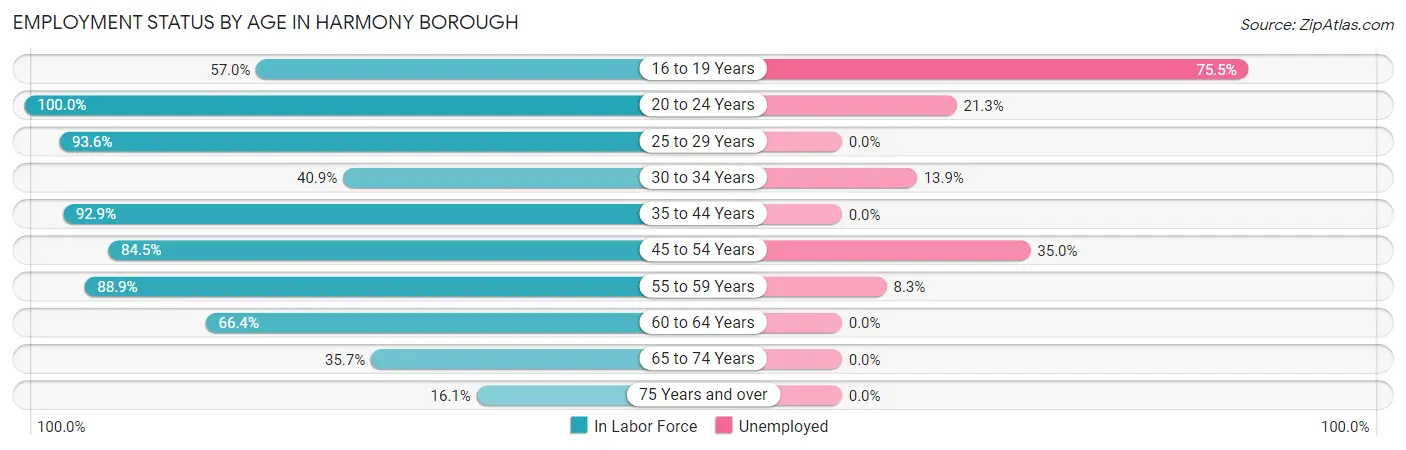
Employment Status by Age in Harmony borough
According to the labor force statistics for Harmony borough, out of the total population over 16 years of age (1,001), 64.6% or 647 individuals are in the labor force, with 15.6% or 101 of them unemployed. The age group with the highest labor force participation rate is 20 to 24 years, with 100.0% or 47 individuals in the labor force. Within the labor force, the 16 to 19 years age range has the highest percentage of unemployed individuals, with 75.5% or 40 of them being unemployed.
| Age Bracket | In Labor Force | Unemployed |
| 16 to 19 Years | 53 (57.0%) | 40 (75.5%) |
| 20 to 24 Years | 47 (100.0%) | 10 (21.3%) |
| 25 to 29 Years | 88 (93.6%) | 0 (0.0%) |
| 30 to 34 Years | 36 (40.9%) | 5 (13.9%) |
| 35 to 44 Years | 91 (92.9%) | 0 (0.0%) |
| 45 to 54 Years | 120 (84.5%) | 42 (35.0%) |
| 55 to 59 Years | 48 (88.9%) | 4 (8.3%) |
| 60 to 64 Years | 81 (66.4%) | 0 (0.0%) |
| 65 to 74 Years | 74 (35.7%) | 0 (0.0%) |
| 75 Years and over | 9 (16.1%) | 0 (0.0%) |
| Total | 647 (64.6%) | 101 (15.6%) |
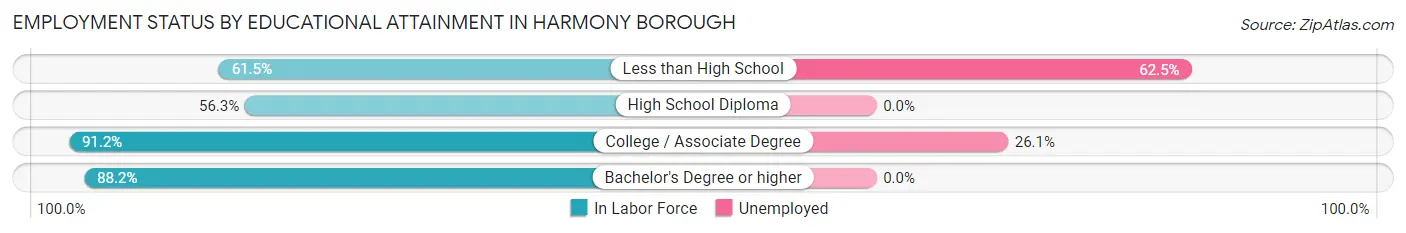
Employment Status by Educational Attainment in Harmony borough
According to labor force statistics for Harmony borough, 77.6% of individuals (464) out of the total population between 25 and 64 years of age (598) are in the labor force, with 11.0% or 51 of them being unemployed. The group with the highest labor force participation rate are those with the educational attainment of college / associate degree, with 91.2% or 176 individuals in the labor force. Within the labor force, individuals with less than high school education have the highest percentage of unemployment, with 62.5% or 5 of them being unemployed.
| Educational Attainment | In Labor Force | Unemployed |
| Less than High School | 8 (61.5%) | 8 (62.5%) |
| High School Diploma | 116 (56.3%) | 0 (0.0%) |
| College / Associate Degree | 176 (91.2%) | 50 (26.1%) |
| Bachelor's Degree or higher | 164 (88.2%) | 0 (0.0%) |
| Total | 464 (77.6%) | 66 (11.0%) |
Employment Occupations by Sex in Harmony borough
Management, Business, Science and Arts Occupations
The most common Management, Business, Science and Arts occupations in Harmony borough are Community & Social Service (74 | 13.6%), Education Instruction & Library (55 | 10.1%), Business & Financial (48 | 8.8%), Management (45 | 8.2%), and Computers, Engineering & Science (31 | 5.7%).
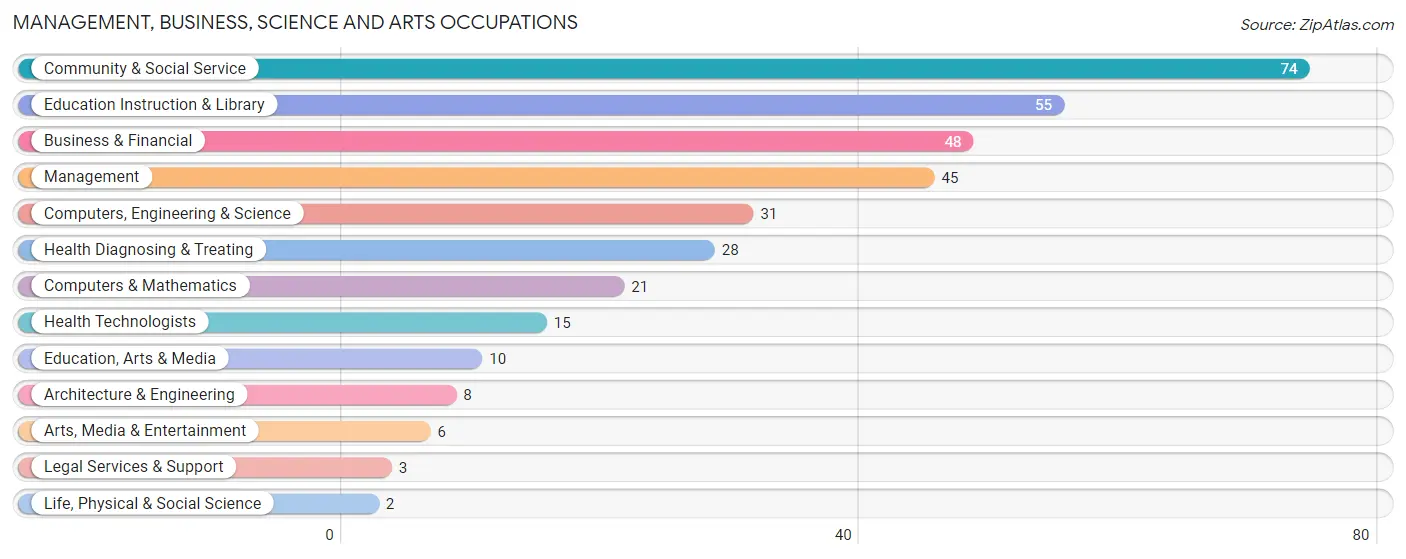
Management, Business, Science and Arts Occupations by Sex
Within the Management, Business, Science and Arts occupations in Harmony borough, the most male-oriented occupations are Computers, Engineering & Science (100.0%), Computers & Mathematics (100.0%), and Architecture & Engineering (100.0%), while the most female-oriented occupations are Education, Arts & Media (100.0%), Legal Services & Support (100.0%), and Health Diagnosing & Treating (100.0%).
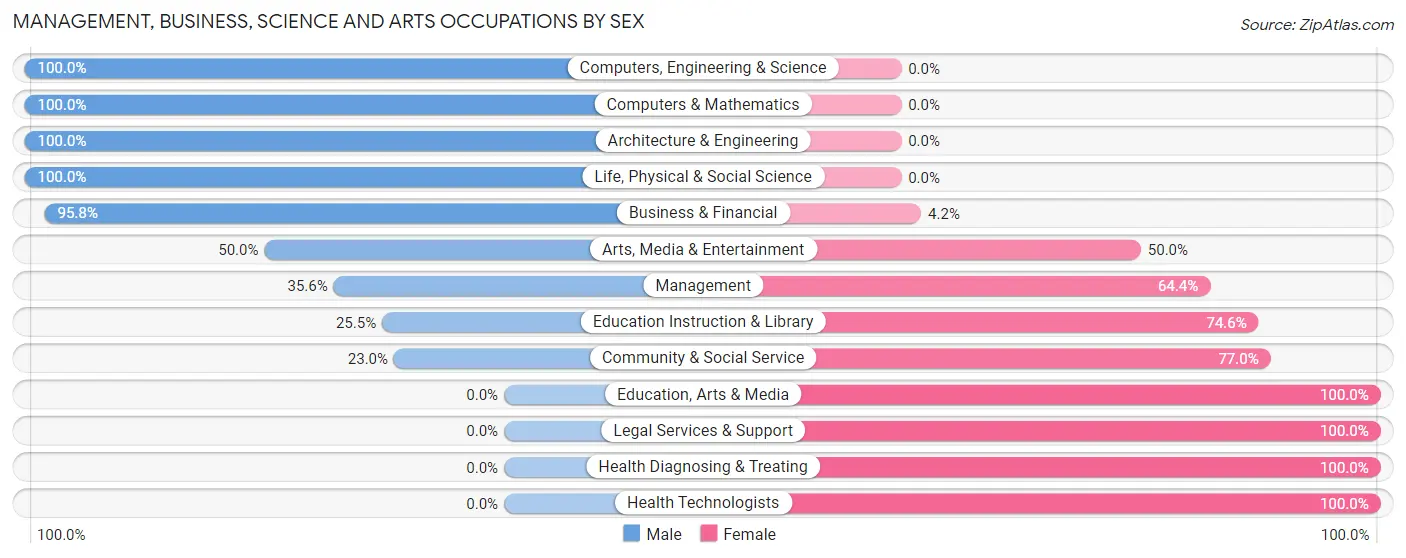
| Occupation | Male | Female |
| Management | 16 (35.6%) | 29 (64.4%) |
| Business & Financial | 46 (95.8%) | 2 (4.2%) |
| Computers, Engineering & Science | 31 (100.0%) | 0 (0.0%) |
| Computers & Mathematics | 21 (100.0%) | 0 (0.0%) |
| Architecture & Engineering | 8 (100.0%) | 0 (0.0%) |
| Life, Physical & Social Science | 2 (100.0%) | 0 (0.0%) |
| Community & Social Service | 17 (23.0%) | 57 (77.0%) |
| Education, Arts & Media | 0 (0.0%) | 10 (100.0%) |
| Legal Services & Support | 0 (0.0%) | 3 (100.0%) |
| Education Instruction & Library | 14 (25.5%) | 41 (74.6%) |
| Arts, Media & Entertainment | 3 (50.0%) | 3 (50.0%) |
| Health Diagnosing & Treating | 0 (0.0%) | 28 (100.0%) |
| Health Technologists | 0 (0.0%) | 15 (100.0%) |
| Total (Category) | 110 (48.7%) | 116 (51.3%) |
| Total (Overall) | 288 (52.7%) | 258 (47.2%) |
Services Occupations
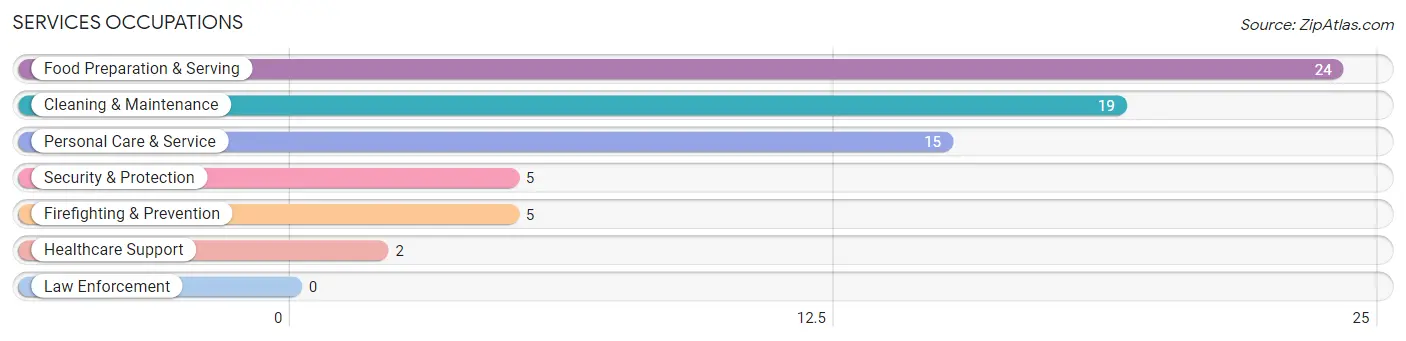
The most common Services occupations in Harmony borough are Food Preparation & Serving (24 | 4.4%), Cleaning & Maintenance (19 | 3.5%), Personal Care & Service (15 | 2.8%), Security & Protection (5 | 0.9%), and Firefighting & Prevention (5 | 0.9%).
Services Occupations by Sex
Within the Services occupations in Harmony borough, the most male-oriented occupations are Healthcare Support (100.0%), Cleaning & Maintenance (78.9%), and Food Preparation & Serving (25.0%), while the most female-oriented occupations are Security & Protection (100.0%), Firefighting & Prevention (100.0%), and Personal Care & Service (100.0%).
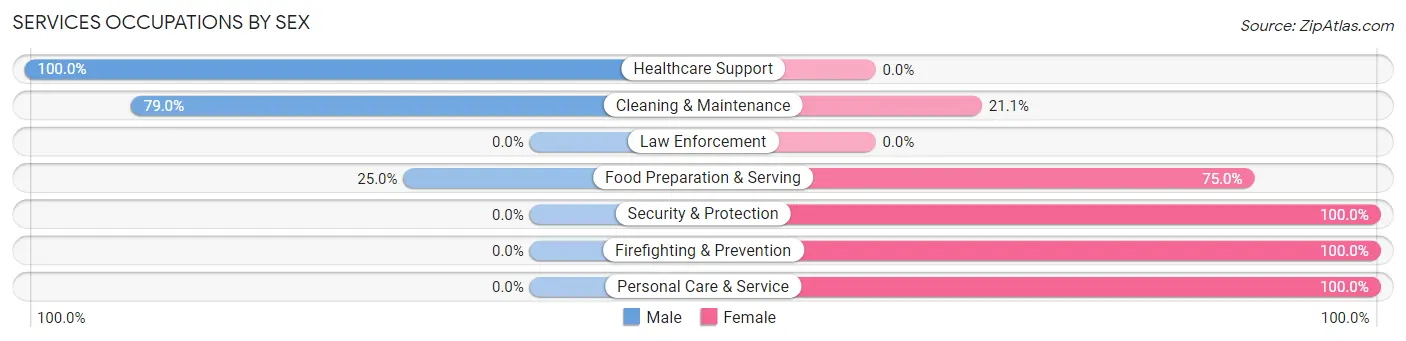
| Occupation | Male | Female |
| Healthcare Support | 2 (100.0%) | 0 (0.0%) |
| Security & Protection | 0 (0.0%) | 5 (100.0%) |
| Firefighting & Prevention | 0 (0.0%) | 5 (100.0%) |
| Law Enforcement | 0 (0.0%) | 0 (0.0%) |
| Food Preparation & Serving | 6 (25.0%) | 18 (75.0%) |
| Cleaning & Maintenance | 15 (78.9%) | 4 (21.0%) |
| Personal Care & Service | 0 (0.0%) | 15 (100.0%) |
| Total (Category) | 23 (35.4%) | 42 (64.6%) |
| Total (Overall) | 288 (52.7%) | 258 (47.2%) |
Sales and Office Occupations
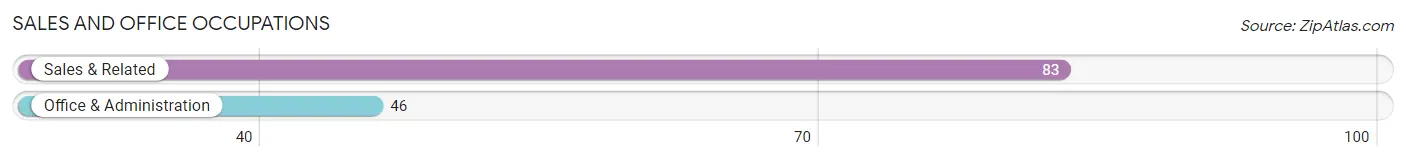
The most common Sales and Office occupations in Harmony borough are Sales & Related (83 | 15.2%), and Office & Administration (46 | 8.4%).
Sales and Office Occupations by Sex
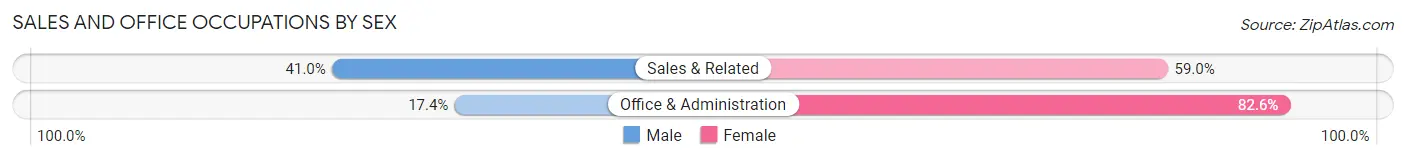
| Occupation | Male | Female |
| Sales & Related | 34 (41.0%) | 49 (59.0%) |
| Office & Administration | 8 (17.4%) | 38 (82.6%) |
| Total (Category) | 42 (32.6%) | 87 (67.4%) |
| Total (Overall) | 288 (52.7%) | 258 (47.2%) |
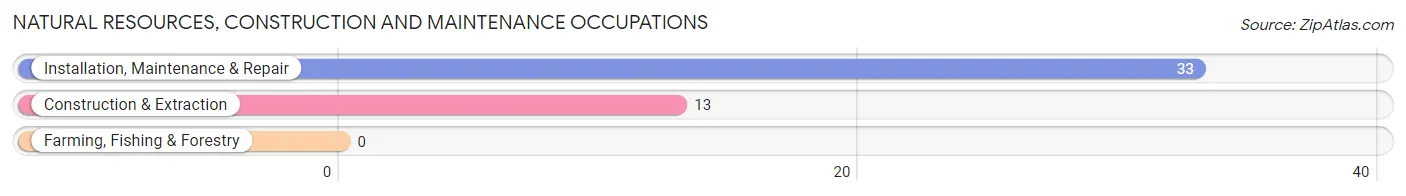
Natural Resources, Construction and Maintenance Occupations
The most common Natural Resources, Construction and Maintenance occupations in Harmony borough are Installation, Maintenance & Repair (33 | 6.0%), and Construction & Extraction (13 | 2.4%).
Natural Resources, Construction and Maintenance Occupations by Sex
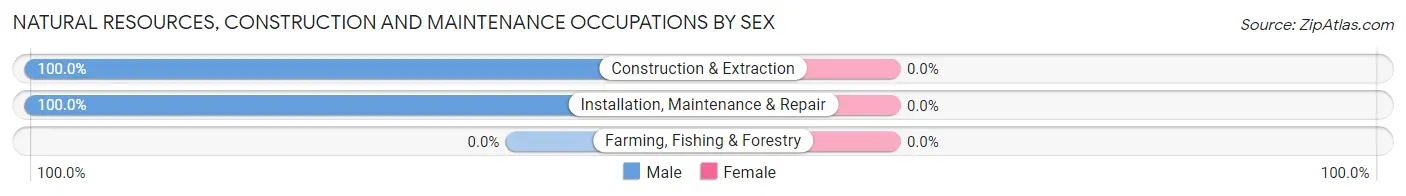
| Occupation | Male | Female |
| Farming, Fishing & Forestry | 0 (0.0%) | 0 (0.0%) |
| Construction & Extraction | 13 (100.0%) | 0 (0.0%) |
| Installation, Maintenance & Repair | 33 (100.0%) | 0 (0.0%) |
| Total (Category) | 46 (100.0%) | 0 (0.0%) |
| Total (Overall) | 288 (52.7%) | 258 (47.2%) |
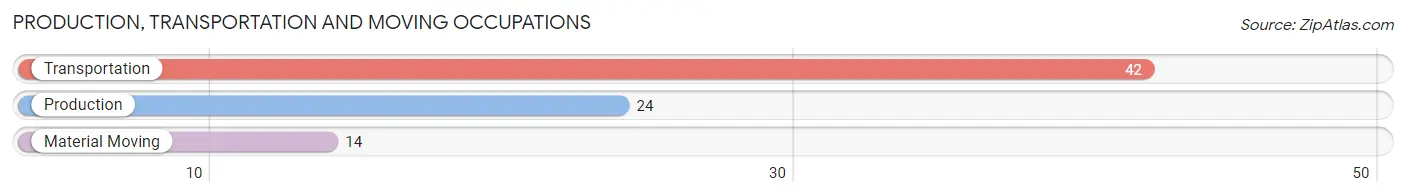
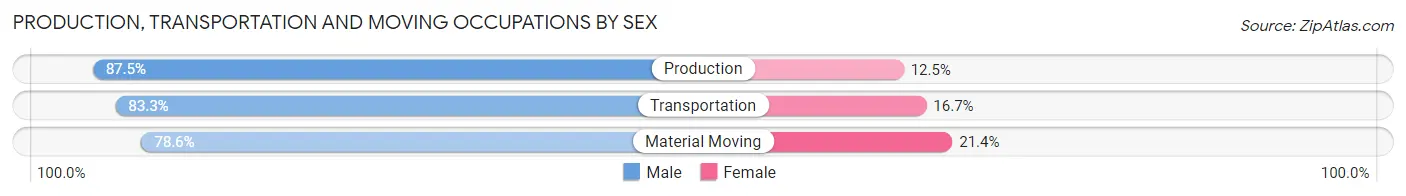
Production, Transportation and Moving Occupations
The most common Production, Transportation and Moving occupations in Harmony borough are Transportation (42 | 7.7%), Production (24 | 4.4%), and Material Moving (14 | 2.6%).
Production, Transportation and Moving Occupations by Sex
| Occupation | Male | Female |
| Production | 21 (87.5%) | 3 (12.5%) |
| Transportation | 35 (83.3%) | 7 (16.7%) |
| Material Moving | 11 (78.6%) | 3 (21.4%) |
| Total (Category) | 67 (83.8%) | 13 (16.3%) |
| Total (Overall) | 288 (52.7%) | 258 (47.2%) |
Employment Industries by Sex in Harmony borough
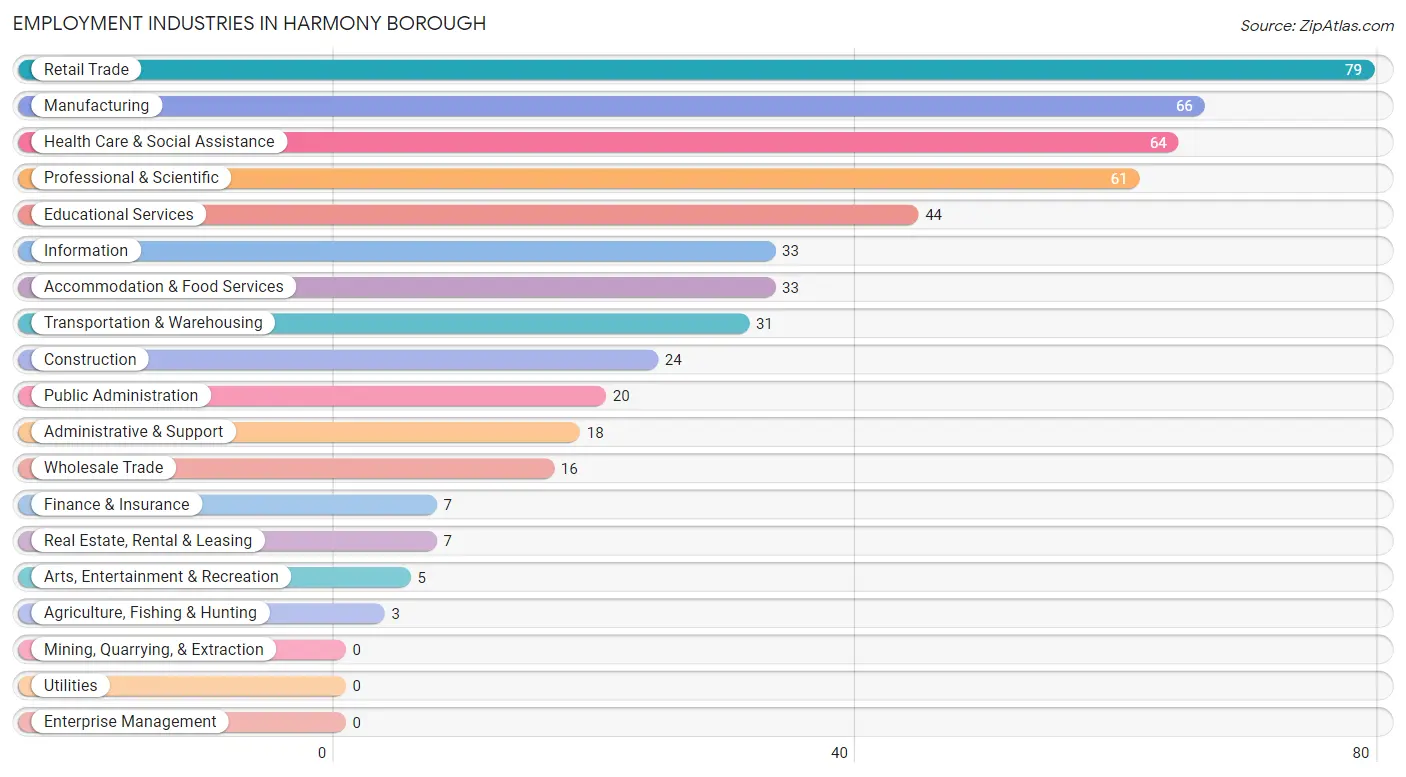
Employment Industries in Harmony borough
The major employment industries in Harmony borough include Retail Trade (79 | 14.5%), Manufacturing (66 | 12.1%), Health Care & Social Assistance (64 | 11.7%), Professional & Scientific (61 | 11.2%), and Educational Services (44 | 8.1%).
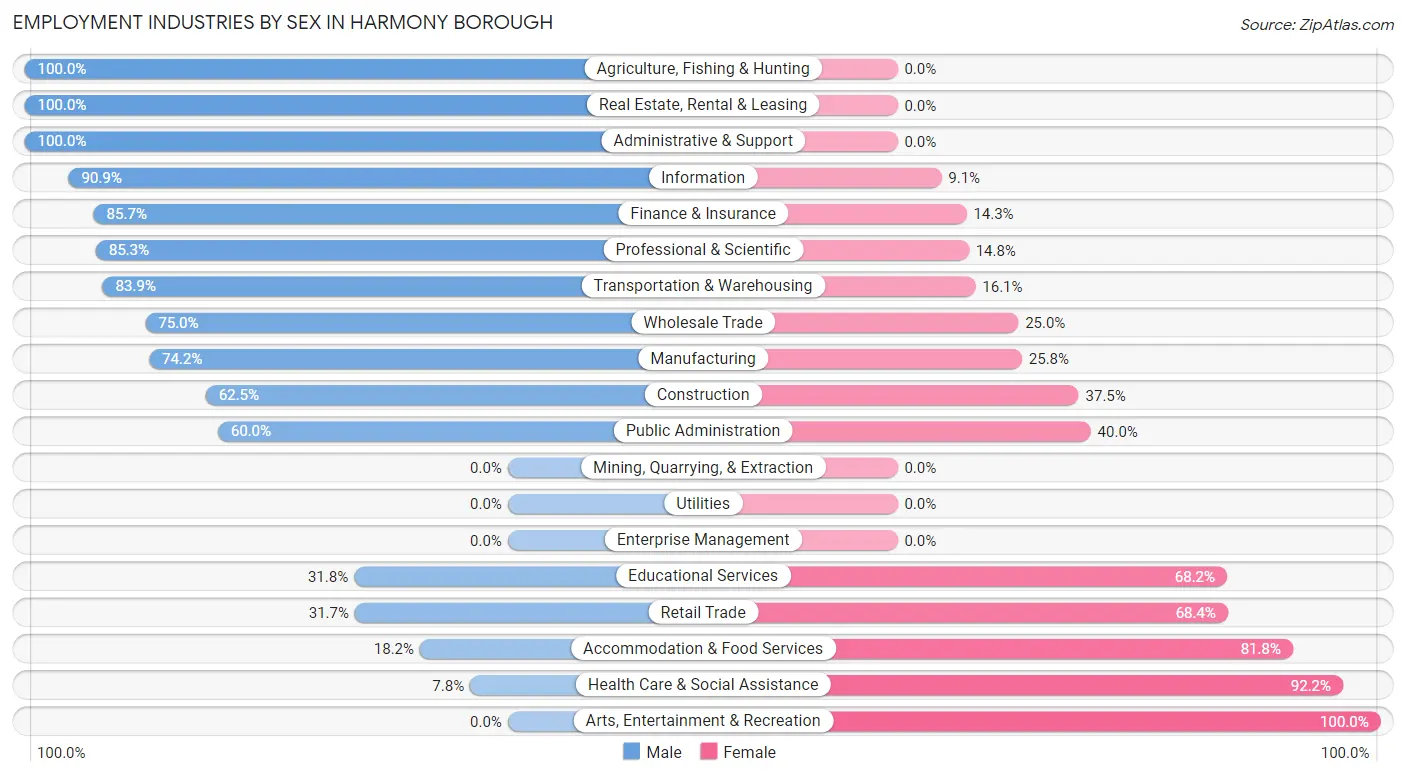
Employment Industries by Sex in Harmony borough
The Harmony borough industries that see more men than women are Agriculture, Fishing & Hunting (100.0%), Real Estate, Rental & Leasing (100.0%), and Administrative & Support (100.0%), whereas the industries that tend to have a higher number of women are Arts, Entertainment & Recreation (100.0%), Health Care & Social Assistance (92.2%), and Accommodation & Food Services (81.8%).
| Industry | Male | Female |
| Agriculture, Fishing & Hunting | 3 (100.0%) | 0 (0.0%) |
| Mining, Quarrying, & Extraction | 0 (0.0%) | 0 (0.0%) |
| Construction | 15 (62.5%) | 9 (37.5%) |
| Manufacturing | 49 (74.2%) | 17 (25.8%) |
| Wholesale Trade | 12 (75.0%) | 4 (25.0%) |
| Retail Trade | 25 (31.7%) | 54 (68.3%) |
| Transportation & Warehousing | 26 (83.9%) | 5 (16.1%) |
| Utilities | 0 (0.0%) | 0 (0.0%) |
| Information | 30 (90.9%) | 3 (9.1%) |
| Finance & Insurance | 6 (85.7%) | 1 (14.3%) |
| Real Estate, Rental & Leasing | 7 (100.0%) | 0 (0.0%) |
| Professional & Scientific | 52 (85.3%) | 9 (14.7%) |
| Enterprise Management | 0 (0.0%) | 0 (0.0%) |
| Administrative & Support | 18 (100.0%) | 0 (0.0%) |
| Educational Services | 14 (31.8%) | 30 (68.2%) |
| Health Care & Social Assistance | 5 (7.8%) | 59 (92.2%) |
| Arts, Entertainment & Recreation | 0 (0.0%) | 5 (100.0%) |
| Accommodation & Food Services | 6 (18.2%) | 27 (81.8%) |
| Public Administration | 12 (60.0%) | 8 (40.0%) |
| Total | 288 (52.7%) | 258 (47.2%) |
Education in Harmony borough
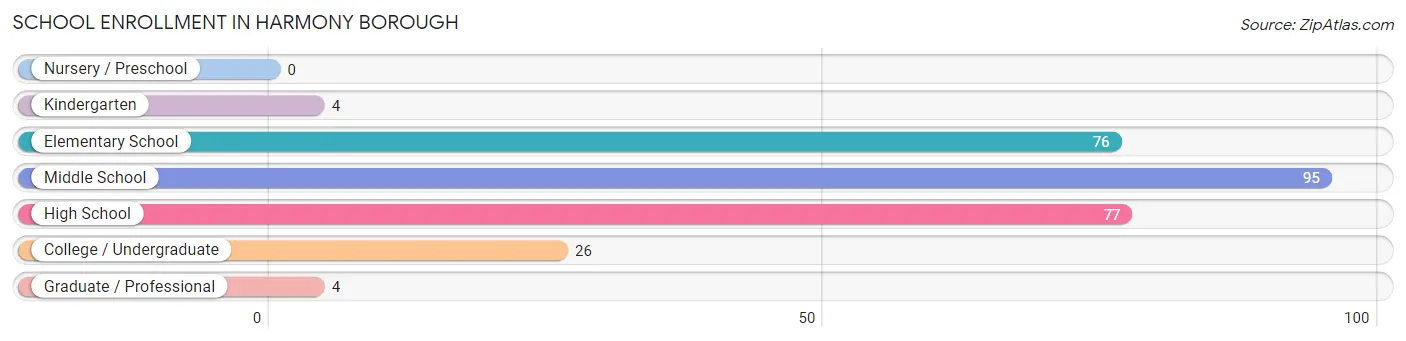
School Enrollment in Harmony borough
The most common levels of schooling among the 282 students in Harmony borough are middle school (95 | 33.7%), high school (77 | 27.3%), and elementary school (76 | 27.0%).
| School Level | # Students | % Students |
| Nursery / Preschool | 0 | 0.0% |
| Kindergarten | 4 | 1.4% |
| Elementary School | 76 | 27.0% |
| Middle School | 95 | 33.7% |
| High School | 77 | 27.3% |
| College / Undergraduate | 26 | 9.2% |
| Graduate / Professional | 4 | 1.4% |
| Total | 282 | 100.0% |
School Enrollment by Age by Funding Source in Harmony borough
Out of a total of 282 students who are enrolled in schools in Harmony borough, 14 (5.0%) attend a private institution, while the remaining 268 (95.0%) are enrolled in public schools. The age group of 5 to 9 year old has the highest likelihood of being enrolled in private schools, with 5 (10.4% in the age bracket) enrolled. Conversely, the age group of 15 to 17 year olds has the lowest likelihood of being enrolled in a private school, with 29 (100.0% in the age bracket) attending a public institution.
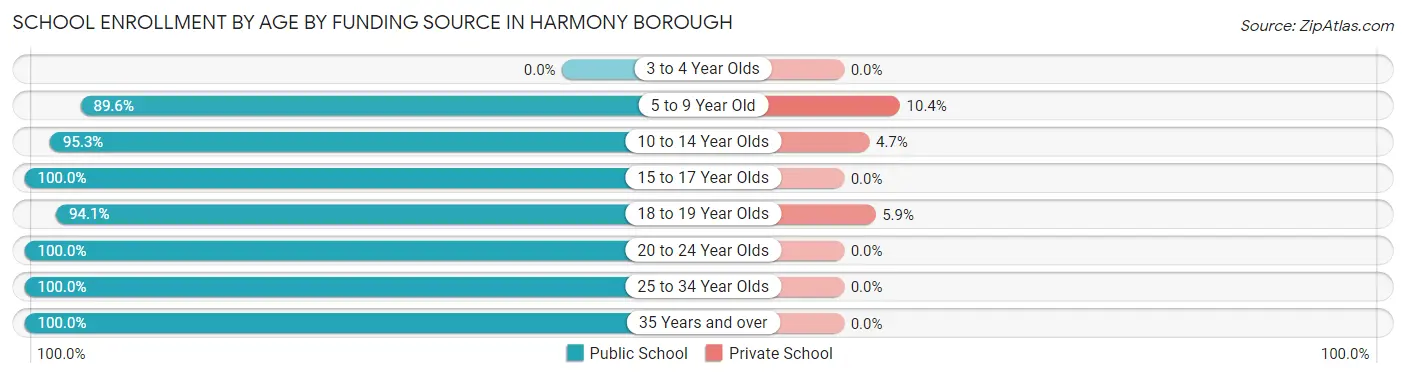
| Age Bracket | Public School | Private School |
| 3 to 4 Year Olds | 0 (0.0%) | 0 (0.0%) |
| 5 to 9 Year Old | 43 (89.6%) | 5 (10.4%) |
| 10 to 14 Year Olds | 121 (95.3%) | 6 (4.7%) |
| 15 to 17 Year Olds | 29 (100.0%) | 0 (0.0%) |
| 18 to 19 Year Olds | 48 (94.1%) | 3 (5.9%) |
| 20 to 24 Year Olds | 4 (100.0%) | 0 (0.0%) |
| 25 to 34 Year Olds | 17 (100.0%) | 0 (0.0%) |
| 35 Years and over | 6 (100.0%) | 0 (0.0%) |
| Total | 268 (95.0%) | 14 (5.0%) |
Educational Attainment by Field of Study in Harmony borough
Education (117 | 36.7%), business (43 | 13.5%), communications (34 | 10.7%), literature & languages (27 | 8.5%), and visual & performing arts (17 | 5.3%) are the most common fields of study among 319 individuals in Harmony borough who have obtained a bachelor's degree or higher.
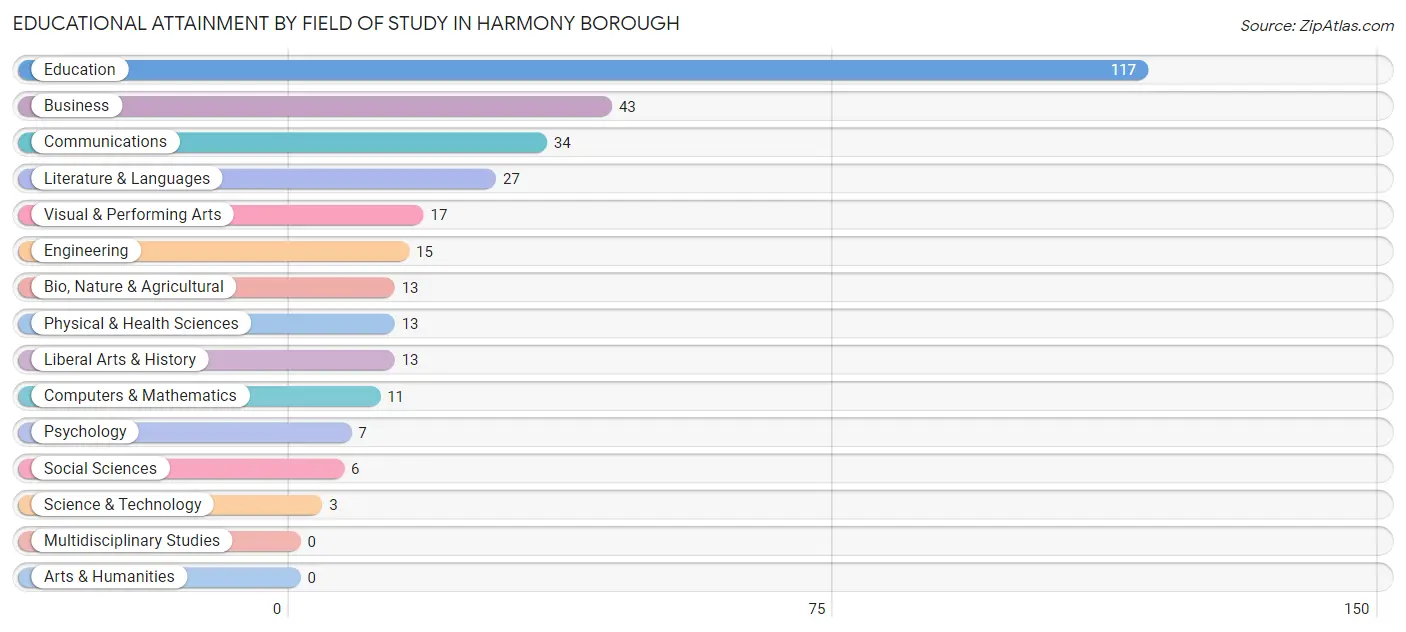
| Field of Study | # Graduates | % Graduates |
| Computers & Mathematics | 11 | 3.5% |
| Bio, Nature & Agricultural | 13 | 4.1% |
| Physical & Health Sciences | 13 | 4.1% |
| Psychology | 7 | 2.2% |
| Social Sciences | 6 | 1.9% |
| Engineering | 15 | 4.7% |
| Multidisciplinary Studies | 0 | 0.0% |
| Science & Technology | 3 | 0.9% |
| Business | 43 | 13.5% |
| Education | 117 | 36.7% |
| Literature & Languages | 27 | 8.5% |
| Liberal Arts & History | 13 | 4.1% |
| Visual & Performing Arts | 17 | 5.3% |
| Communications | 34 | 10.7% |
| Arts & Humanities | 0 | 0.0% |
| Total | 319 | 100.0% |
Transportation & Commute in Harmony borough
Vehicle Availability by Sex in Harmony borough
The most prevalent vehicle ownership categories in Harmony borough are males with 3 vehicles (142, accounting for 50.0%) and females with 3 vehicles (81, making up 55.0%).
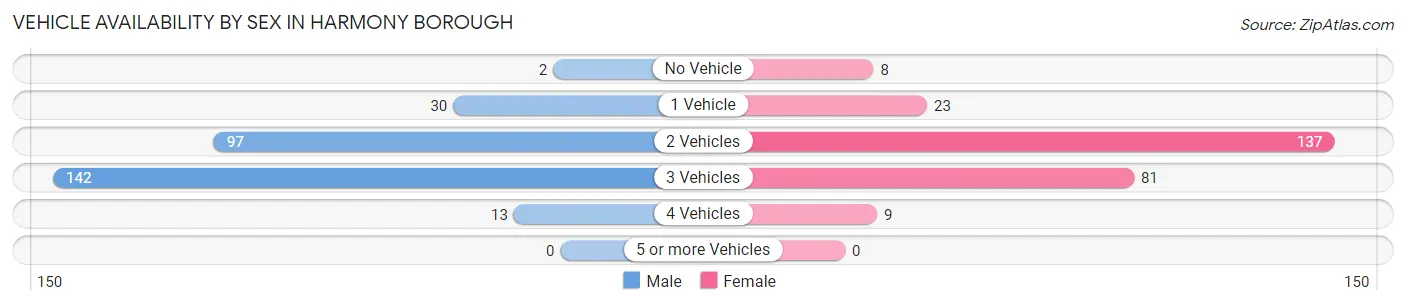
| Vehicles Available | Male | Female |
| No Vehicle | 2 (0.7%) | 8 (3.1%) |
| 1 Vehicle | 30 (10.6%) | 23 (8.9%) |
| 2 Vehicles | 97 (34.2%) | 137 (53.1%) |
| 3 Vehicles | 142 (50.0%) | 81 (31.4%) |
| 4 Vehicles | 13 (4.6%) | 9 (3.5%) |
| 5 or more Vehicles | 0 (0.0%) | 0 (0.0%) |
| Total | 284 (100.0%) | 258 (100.0%) |
Commute Time in Harmony borough
The most frequently occuring commute durations in Harmony borough are 15 to 19 minutes (94 commuters, 19.5%), 5 to 9 minutes (80 commuters, 16.6%), and 20 to 24 minutes (60 commuters, 12.4%).
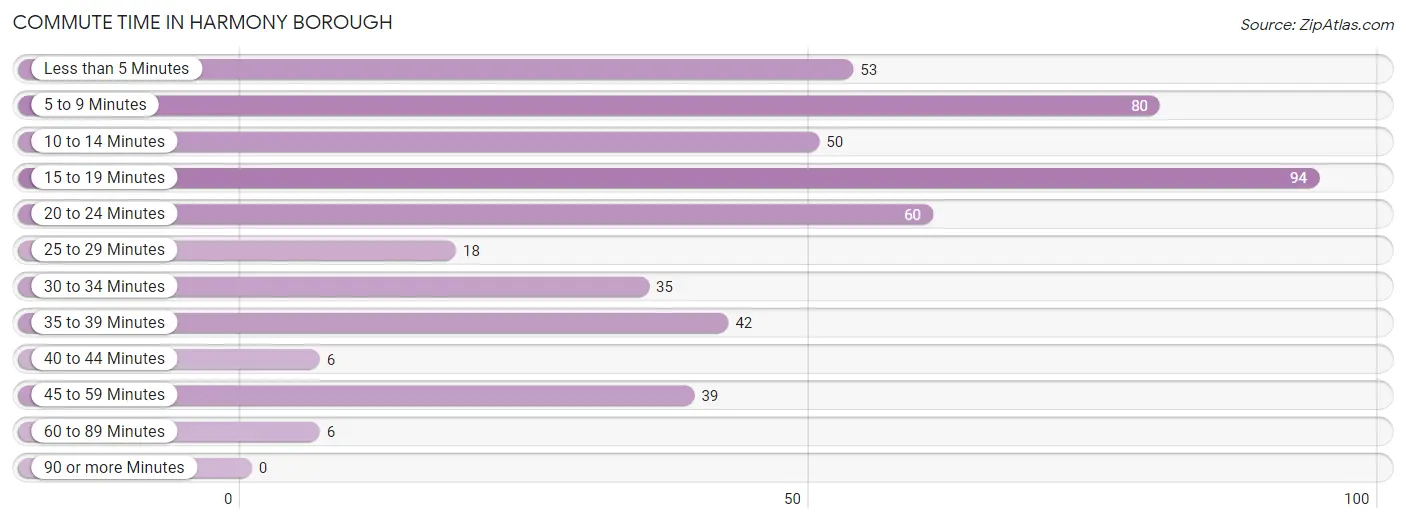
| Commute Time | # Commuters | % Commuters |
| Less than 5 Minutes | 53 | 11.0% |
| 5 to 9 Minutes | 80 | 16.6% |
| 10 to 14 Minutes | 50 | 10.3% |
| 15 to 19 Minutes | 94 | 19.5% |
| 20 to 24 Minutes | 60 | 12.4% |
| 25 to 29 Minutes | 18 | 3.7% |
| 30 to 34 Minutes | 35 | 7.2% |
| 35 to 39 Minutes | 42 | 8.7% |
| 40 to 44 Minutes | 6 | 1.2% |
| 45 to 59 Minutes | 39 | 8.1% |
| 60 to 89 Minutes | 6 | 1.2% |
| 90 or more Minutes | 0 | 0.0% |
Commute Time by Sex in Harmony borough
The most common commute times in Harmony borough are 5 to 9 minutes (50 commuters, 21.2%) for males and 15 to 19 minutes (81 commuters, 32.8%) for females.
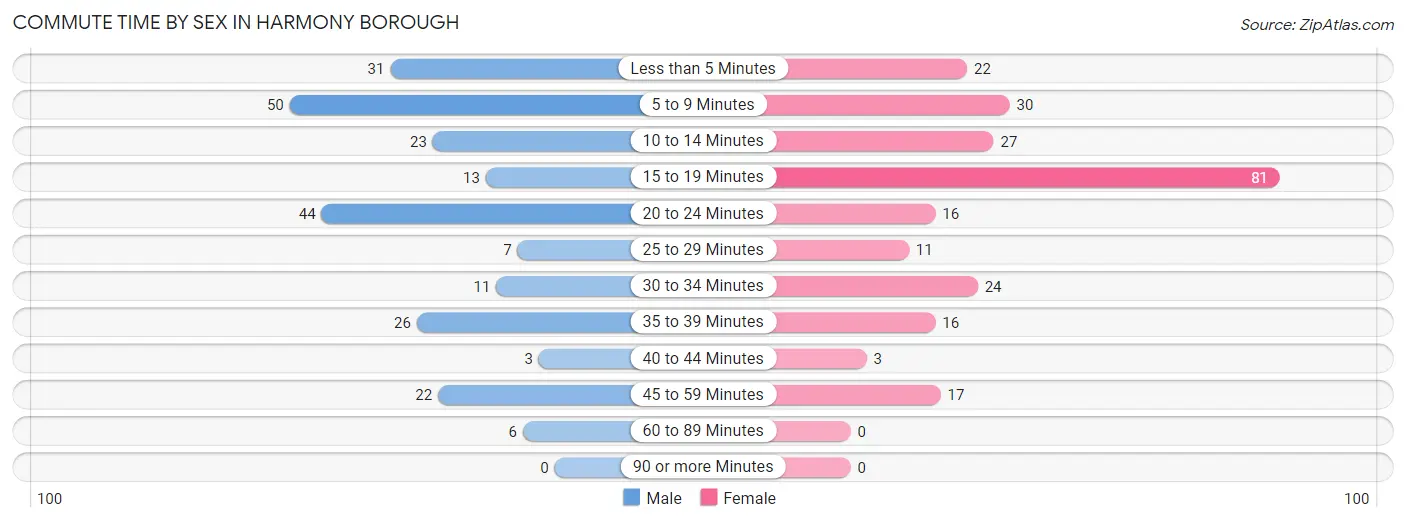
| Commute Time | Male | Female |
| Less than 5 Minutes | 31 (13.1%) | 22 (8.9%) |
| 5 to 9 Minutes | 50 (21.2%) | 30 (12.1%) |
| 10 to 14 Minutes | 23 (9.8%) | 27 (10.9%) |
| 15 to 19 Minutes | 13 (5.5%) | 81 (32.8%) |
| 20 to 24 Minutes | 44 (18.6%) | 16 (6.5%) |
| 25 to 29 Minutes | 7 (3.0%) | 11 (4.4%) |
| 30 to 34 Minutes | 11 (4.7%) | 24 (9.7%) |
| 35 to 39 Minutes | 26 (11.0%) | 16 (6.5%) |
| 40 to 44 Minutes | 3 (1.3%) | 3 (1.2%) |
| 45 to 59 Minutes | 22 (9.3%) | 17 (6.9%) |
| 60 to 89 Minutes | 6 (2.5%) | 0 (0.0%) |
| 90 or more Minutes | 0 (0.0%) | 0 (0.0%) |
Time of Departure to Work by Sex in Harmony borough
The most frequent times of departure to work in Harmony borough are 7:30 AM to 7:59 AM (59, 25.0%) for males and 6:00 AM to 6:29 AM (69, 27.9%) for females.
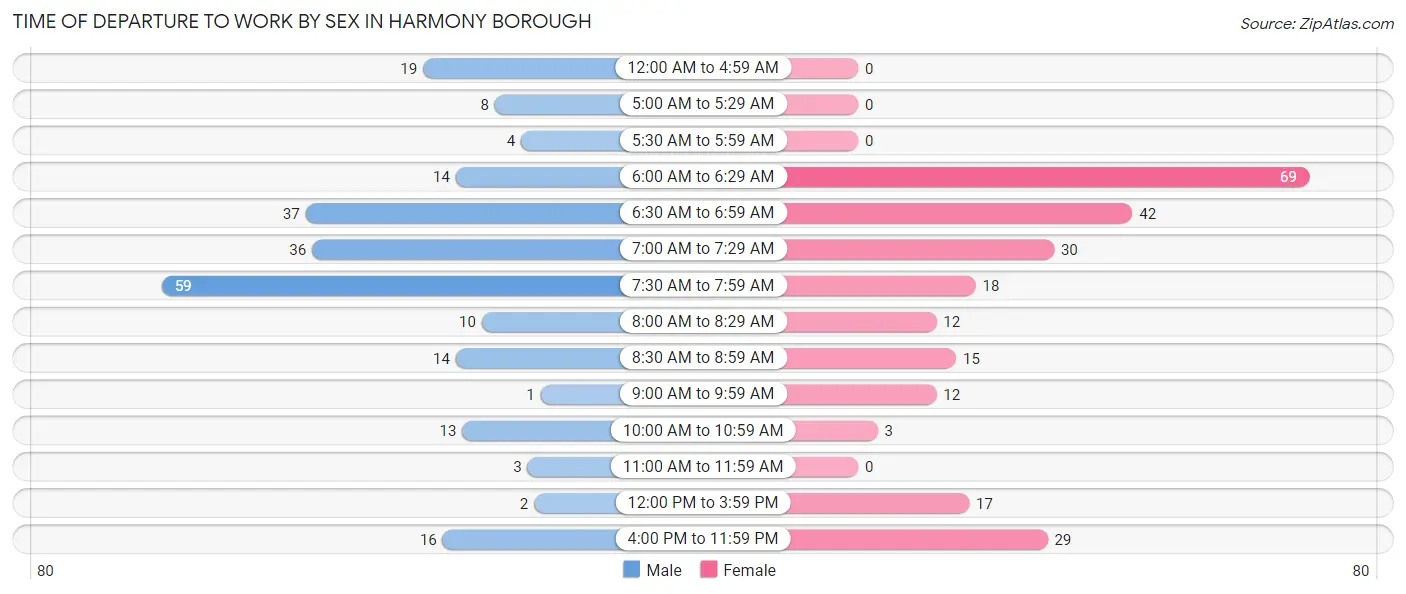
| Time of Departure | Male | Female |
| 12:00 AM to 4:59 AM | 19 (8.1%) | 0 (0.0%) |
| 5:00 AM to 5:29 AM | 8 (3.4%) | 0 (0.0%) |
| 5:30 AM to 5:59 AM | 4 (1.7%) | 0 (0.0%) |
| 6:00 AM to 6:29 AM | 14 (5.9%) | 69 (27.9%) |
| 6:30 AM to 6:59 AM | 37 (15.7%) | 42 (17.0%) |
| 7:00 AM to 7:29 AM | 36 (15.2%) | 30 (12.1%) |
| 7:30 AM to 7:59 AM | 59 (25.0%) | 18 (7.3%) |
| 8:00 AM to 8:29 AM | 10 (4.2%) | 12 (4.9%) |
| 8:30 AM to 8:59 AM | 14 (5.9%) | 15 (6.1%) |
| 9:00 AM to 9:59 AM | 1 (0.4%) | 12 (4.9%) |
| 10:00 AM to 10:59 AM | 13 (5.5%) | 3 (1.2%) |
| 11:00 AM to 11:59 AM | 3 (1.3%) | 0 (0.0%) |
| 12:00 PM to 3:59 PM | 2 (0.9%) | 17 (6.9%) |
| 4:00 PM to 11:59 PM | 16 (6.8%) | 29 (11.7%) |
| Total | 236 (100.0%) | 247 (100.0%) |
Housing Occupancy in Harmony borough
Occupancy by Ownership in Harmony borough
Of the total 434 dwellings in Harmony borough, owner-occupied units account for 379 (87.3%), while renter-occupied units make up 55 (12.7%).
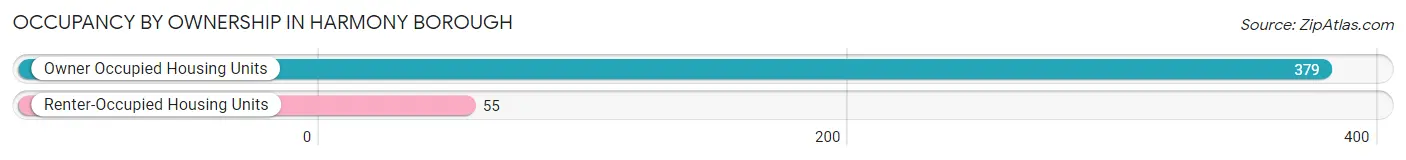
| Occupancy | # Housing Units | % Housing Units |
| Owner Occupied Housing Units | 379 | 87.3% |
| Renter-Occupied Housing Units | 55 | 12.7% |
| Total Occupied Housing Units | 434 | 100.0% |
Occupancy by Household Size in Harmony borough
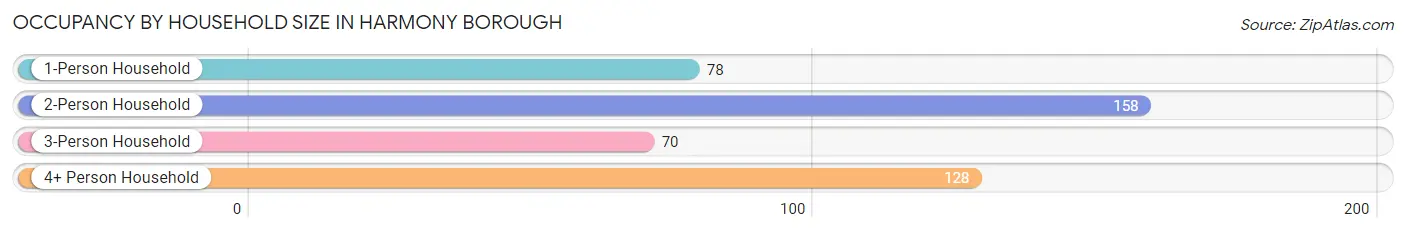
| Household Size | # Housing Units | % Housing Units |
| 1-Person Household | 78 | 18.0% |
| 2-Person Household | 158 | 36.4% |
| 3-Person Household | 70 | 16.1% |
| 4+ Person Household | 128 | 29.5% |
| Total Housing Units | 434 | 100.0% |
Occupancy by Ownership by Household Size in Harmony borough
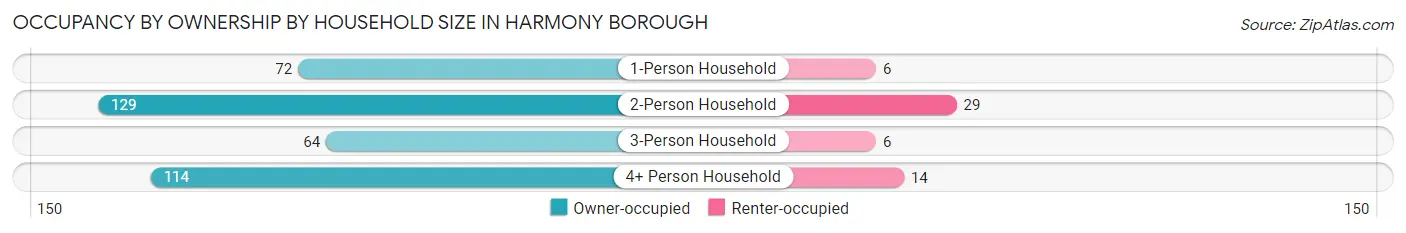
| Household Size | Owner-occupied | Renter-occupied |
| 1-Person Household | 72 (92.3%) | 6 (7.7%) |
| 2-Person Household | 129 (81.7%) | 29 (18.3%) |
| 3-Person Household | 64 (91.4%) | 6 (8.6%) |
| 4+ Person Household | 114 (89.1%) | 14 (10.9%) |
| Total Housing Units | 379 (87.3%) | 55 (12.7%) |
Occupancy by Educational Attainment in Harmony borough
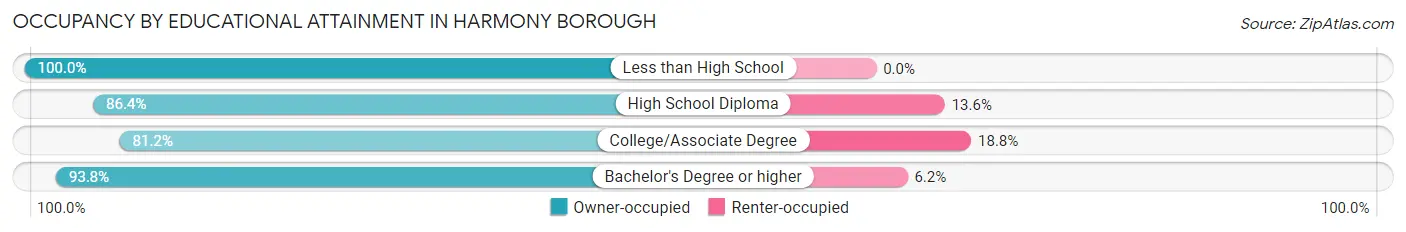
| Household Size | Owner-occupied | Renter-occupied |
| Less than High School | 16 (100.0%) | 0 (0.0%) |
| High School Diploma | 89 (86.4%) | 14 (13.6%) |
| College/Associate Degree | 138 (81.2%) | 32 (18.8%) |
| Bachelor's Degree or higher | 136 (93.8%) | 9 (6.2%) |
Occupancy by Age of Householder in Harmony borough
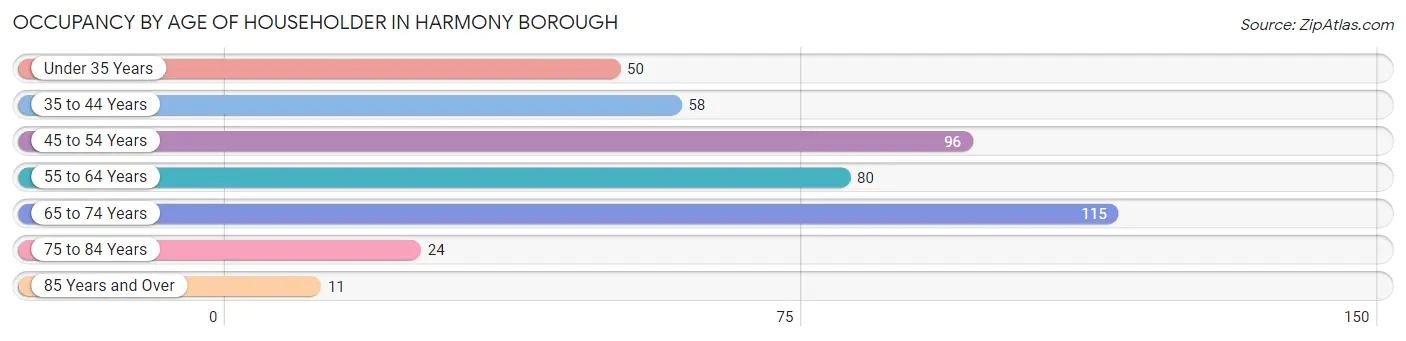
| Age Bracket | # Households | % Households |
| Under 35 Years | 50 | 11.5% |
| 35 to 44 Years | 58 | 13.4% |
| 45 to 54 Years | 96 | 22.1% |
| 55 to 64 Years | 80 | 18.4% |
| 65 to 74 Years | 115 | 26.5% |
| 75 to 84 Years | 24 | 5.5% |
| 85 Years and Over | 11 | 2.5% |
| Total | 434 | 100.0% |
Housing Finances in Harmony borough
Median Income by Occupancy in Harmony borough
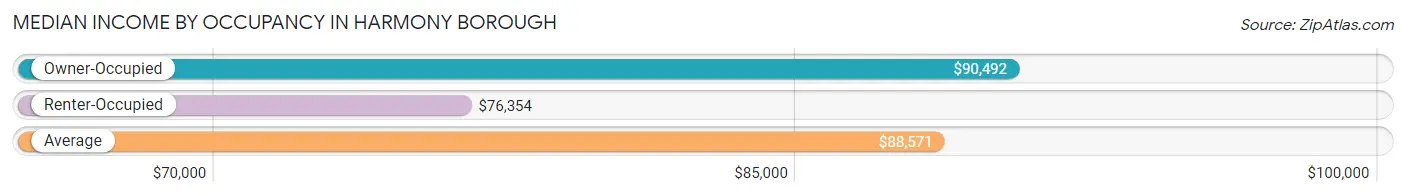
| Occupancy Type | # Households | Median Income |
| Owner-Occupied | 379 (87.3%) | $90,492 |
| Renter-Occupied | 55 (12.7%) | $76,354 |
| Average | 434 (100.0%) | $88,571 |
Occupancy by Householder Income Bracket in Harmony borough
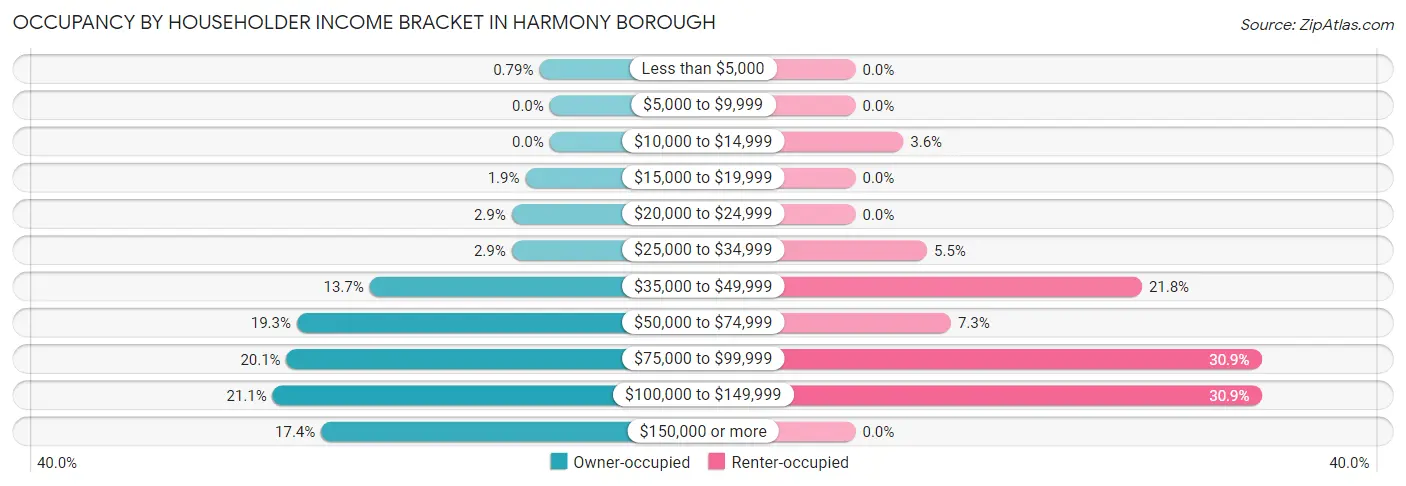
| Income Bracket | Owner-occupied | Renter-occupied |
| Less than $5,000 | 3 (0.8%) | 0 (0.0%) |
| $5,000 to $9,999 | 0 (0.0%) | 0 (0.0%) |
| $10,000 to $14,999 | 0 (0.0%) | 2 (3.6%) |
| $15,000 to $19,999 | 7 (1.8%) | 0 (0.0%) |
| $20,000 to $24,999 | 11 (2.9%) | 0 (0.0%) |
| $25,000 to $34,999 | 11 (2.9%) | 3 (5.4%) |
| $35,000 to $49,999 | 52 (13.7%) | 12 (21.8%) |
| $50,000 to $74,999 | 73 (19.3%) | 4 (7.3%) |
| $75,000 to $99,999 | 76 (20.1%) | 17 (30.9%) |
| $100,000 to $149,999 | 80 (21.1%) | 17 (30.9%) |
| $150,000 or more | 66 (17.4%) | 0 (0.0%) |
| Total | 379 (100.0%) | 55 (100.0%) |
Monthly Housing Cost Tiers in Harmony borough
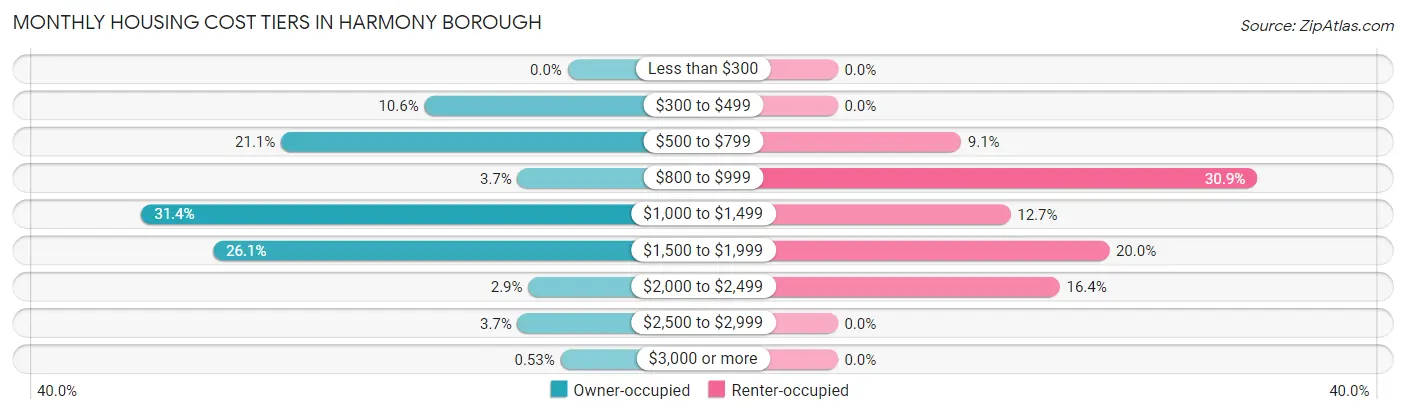
| Monthly Cost | Owner-occupied | Renter-occupied |
| Less than $300 | 0 (0.0%) | 0 (0.0%) |
| $300 to $499 | 40 (10.5%) | 0 (0.0%) |
| $500 to $799 | 80 (21.1%) | 5 (9.1%) |
| $800 to $999 | 14 (3.7%) | 17 (30.9%) |
| $1,000 to $1,499 | 119 (31.4%) | 7 (12.7%) |
| $1,500 to $1,999 | 99 (26.1%) | 11 (20.0%) |
| $2,000 to $2,499 | 11 (2.9%) | 9 (16.4%) |
| $2,500 to $2,999 | 14 (3.7%) | 0 (0.0%) |
| $3,000 or more | 2 (0.5%) | 0 (0.0%) |
| Total | 379 (100.0%) | 55 (100.0%) |
Physical Housing Characteristics in Harmony borough
Housing Structures in Harmony borough
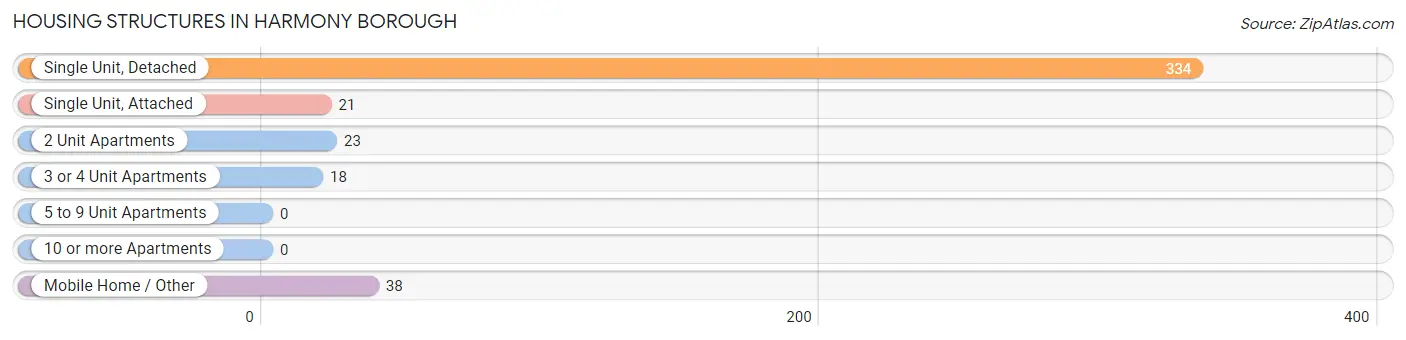
| Structure Type | # Housing Units | % Housing Units |
| Single Unit, Detached | 334 | 77.0% |
| Single Unit, Attached | 21 | 4.8% |
| 2 Unit Apartments | 23 | 5.3% |
| 3 or 4 Unit Apartments | 18 | 4.2% |
| 5 to 9 Unit Apartments | 0 | 0.0% |
| 10 or more Apartments | 0 | 0.0% |
| Mobile Home / Other | 38 | 8.8% |
| Total | 434 | 100.0% |
Housing Structures by Occupancy in Harmony borough
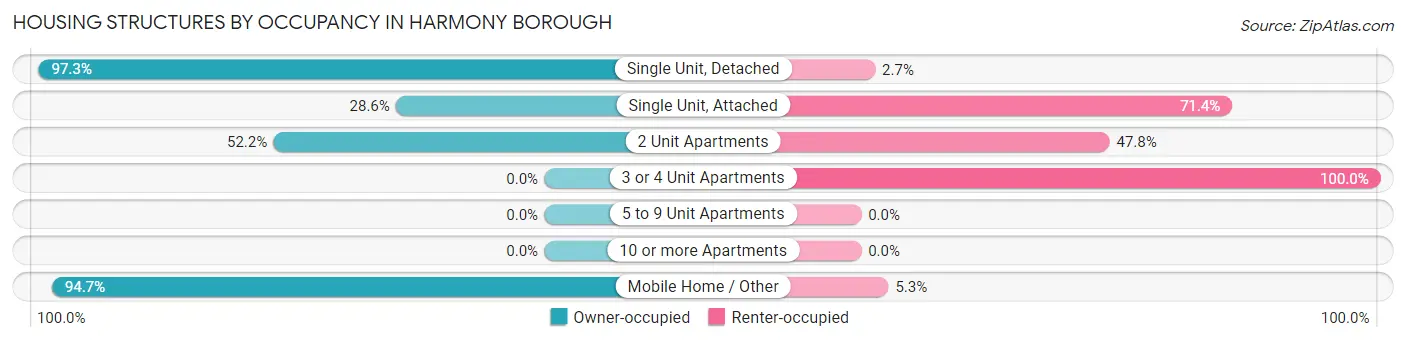
| Structure Type | Owner-occupied | Renter-occupied |
| Single Unit, Detached | 325 (97.3%) | 9 (2.7%) |
| Single Unit, Attached | 6 (28.6%) | 15 (71.4%) |
| 2 Unit Apartments | 12 (52.2%) | 11 (47.8%) |
| 3 or 4 Unit Apartments | 0 (0.0%) | 18 (100.0%) |
| 5 to 9 Unit Apartments | 0 (0.0%) | 0 (0.0%) |
| 10 or more Apartments | 0 (0.0%) | 0 (0.0%) |
| Mobile Home / Other | 36 (94.7%) | 2 (5.3%) |
| Total | 379 (87.3%) | 55 (12.7%) |
Housing Structures by Number of Rooms in Harmony borough
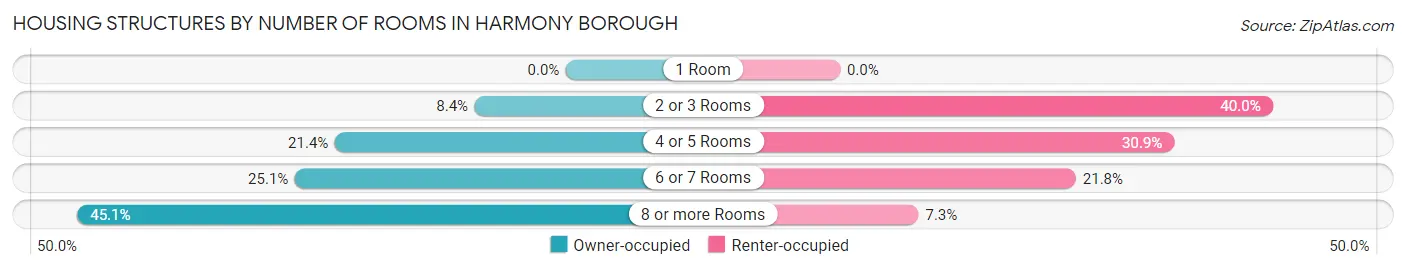
| Number of Rooms | Owner-occupied | Renter-occupied |
| 1 Room | 0 (0.0%) | 0 (0.0%) |
| 2 or 3 Rooms | 32 (8.4%) | 22 (40.0%) |
| 4 or 5 Rooms | 81 (21.4%) | 17 (30.9%) |
| 6 or 7 Rooms | 95 (25.1%) | 12 (21.8%) |
| 8 or more Rooms | 171 (45.1%) | 4 (7.3%) |
| Total | 379 (100.0%) | 55 (100.0%) |
Housing Structure by Heating Type in Harmony borough
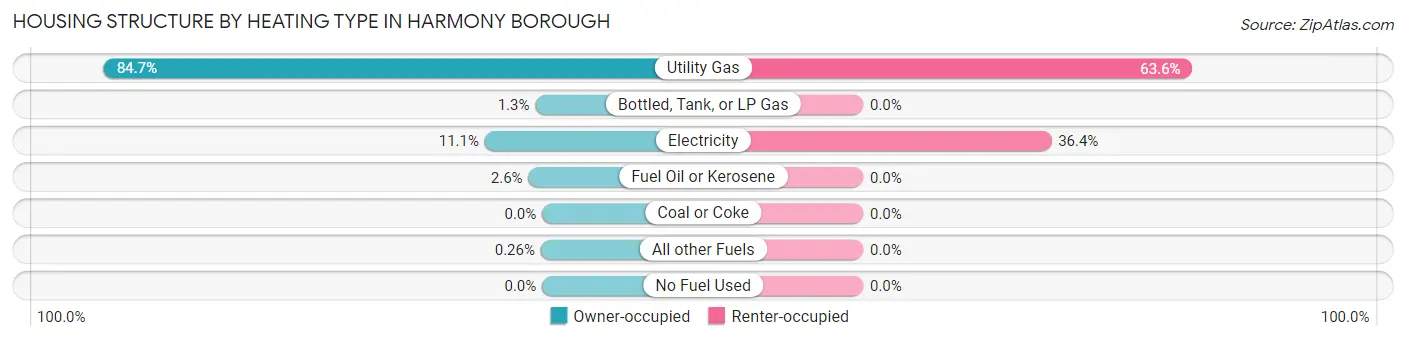
| Heating Type | Owner-occupied | Renter-occupied |
| Utility Gas | 321 (84.7%) | 35 (63.6%) |
| Bottled, Tank, or LP Gas | 5 (1.3%) | 0 (0.0%) |
| Electricity | 42 (11.1%) | 20 (36.4%) |
| Fuel Oil or Kerosene | 10 (2.6%) | 0 (0.0%) |
| Coal or Coke | 0 (0.0%) | 0 (0.0%) |
| All other Fuels | 1 (0.3%) | 0 (0.0%) |
| No Fuel Used | 0 (0.0%) | 0 (0.0%) |
| Total | 379 (100.0%) | 55 (100.0%) |
Household Vehicle Usage in Harmony borough
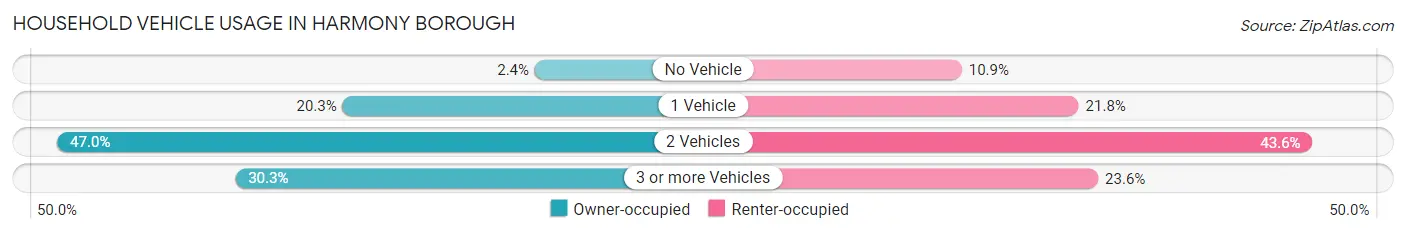
| Vehicles per Household | Owner-occupied | Renter-occupied |
| No Vehicle | 9 (2.4%) | 6 (10.9%) |
| 1 Vehicle | 77 (20.3%) | 12 (21.8%) |
| 2 Vehicles | 178 (47.0%) | 24 (43.6%) |
| 3 or more Vehicles | 115 (30.3%) | 13 (23.6%) |
| Total | 379 (100.0%) | 55 (100.0%) |
Real Estate & Mortgages in Harmony borough
Real Estate and Mortgage Overview in Harmony borough
| Characteristic | Without Mortgage | With Mortgage |
| Housing Units | 137 | 242 |
| Median Property Value | $224,000 | $250,000 |
| Median Household Income | $72,031 | $58 |
| Monthly Housing Costs | $598 | $0 |
| Real Estate Taxes | $1,992 | $2 |
Property Value by Mortgage Status in Harmony borough
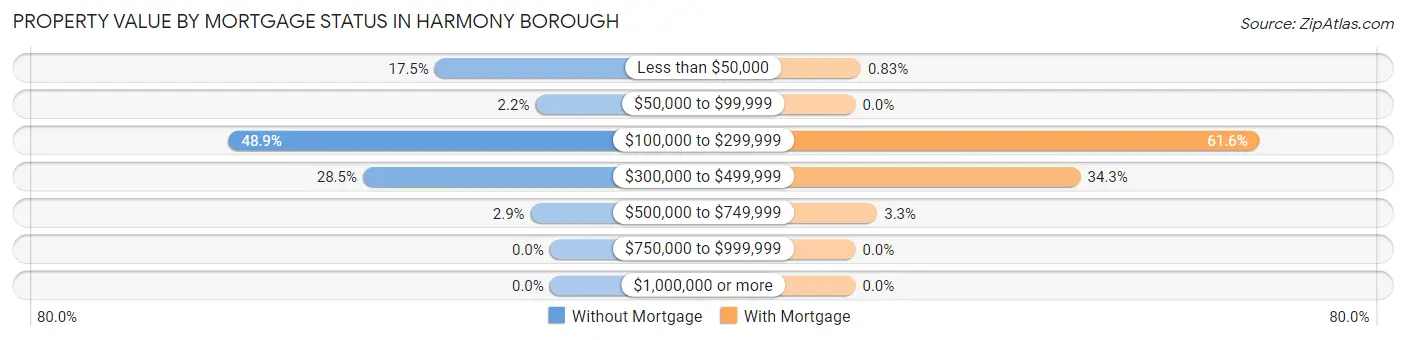
| Property Value | Without Mortgage | With Mortgage |
| Less than $50,000 | 24 (17.5%) | 2 (0.8%) |
| $50,000 to $99,999 | 3 (2.2%) | 0 (0.0%) |
| $100,000 to $299,999 | 67 (48.9%) | 149 (61.6%) |
| $300,000 to $499,999 | 39 (28.5%) | 83 (34.3%) |
| $500,000 to $749,999 | 4 (2.9%) | 8 (3.3%) |
| $750,000 to $999,999 | 0 (0.0%) | 0 (0.0%) |
| $1,000,000 or more | 0 (0.0%) | 0 (0.0%) |
| Total | 137 (100.0%) | 242 (100.0%) |
Household Income by Mortgage Status in Harmony borough
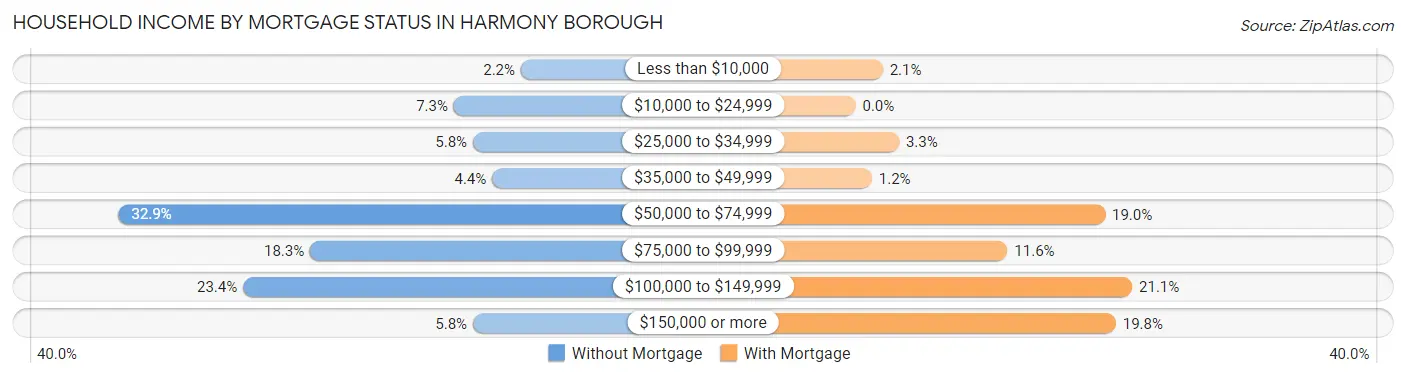
| Household Income | Without Mortgage | With Mortgage |
| Less than $10,000 | 3 (2.2%) | 5 (2.1%) |
| $10,000 to $24,999 | 10 (7.3%) | 0 (0.0%) |
| $25,000 to $34,999 | 8 (5.8%) | 8 (3.3%) |
| $35,000 to $49,999 | 6 (4.4%) | 3 (1.2%) |
| $50,000 to $74,999 | 45 (32.9%) | 46 (19.0%) |
| $75,000 to $99,999 | 25 (18.2%) | 28 (11.6%) |
| $100,000 to $149,999 | 32 (23.4%) | 51 (21.1%) |
| $150,000 or more | 8 (5.8%) | 48 (19.8%) |
| Total | 137 (100.0%) | 242 (100.0%) |
Property Value to Household Income Ratio in Harmony borough
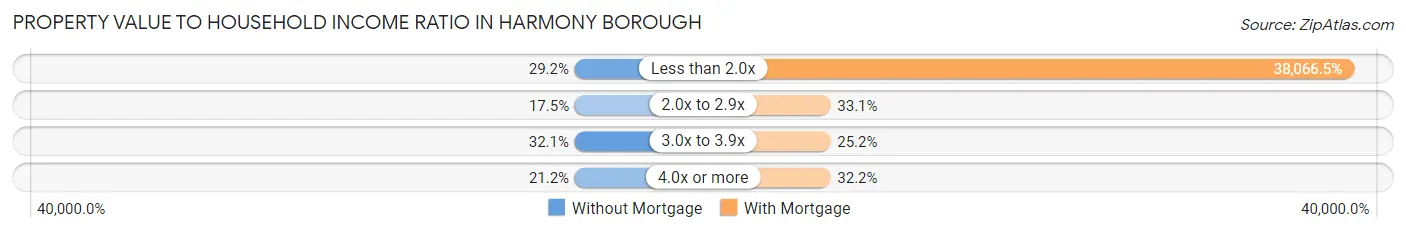
| Value-to-Income Ratio | Without Mortgage | With Mortgage |
| Less than 2.0x | 40 (29.2%) | 92,121 (38,066.5%) |
| 2.0x to 2.9x | 24 (17.5%) | 80 (33.1%) |
| 3.0x to 3.9x | 44 (32.1%) | 61 (25.2%) |
| 4.0x or more | 29 (21.2%) | 78 (32.2%) |
| Total | 137 (100.0%) | 242 (100.0%) |
Real Estate Taxes by Mortgage Status in Harmony borough
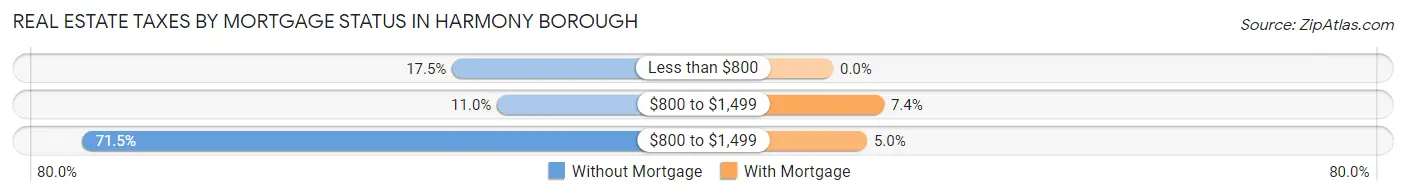
| Property Taxes | Without Mortgage | With Mortgage |
| Less than $800 | 24 (17.5%) | 0 (0.0%) |
| $800 to $1,499 | 15 (11.0%) | 18 (7.4%) |
| $800 to $1,499 | 98 (71.5%) | 12 (5.0%) |
| Total | 137 (100.0%) | 242 (100.0%) |
Health & Disability in Harmony borough
Health Insurance Coverage by Age in Harmony borough
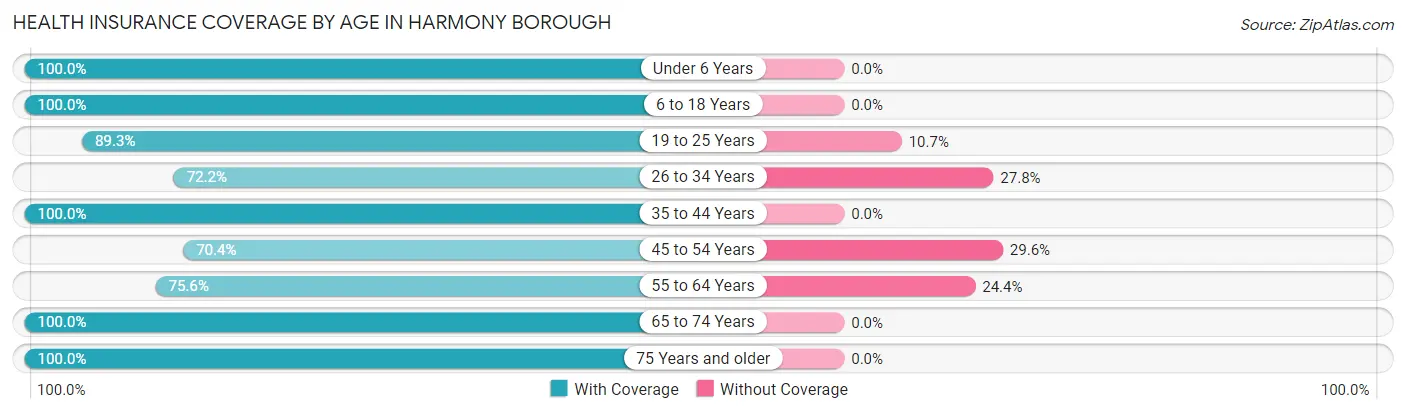
| Age Bracket | With Coverage | Without Coverage |
| Under 6 Years | 45 (100.0%) | 0 (0.0%) |
| 6 to 18 Years | 215 (100.0%) | 0 (0.0%) |
| 19 to 25 Years | 125 (89.3%) | 15 (10.7%) |
| 26 to 34 Years | 109 (72.2%) | 42 (27.8%) |
| 35 to 44 Years | 98 (100.0%) | 0 (0.0%) |
| 45 to 54 Years | 100 (70.4%) | 42 (29.6%) |
| 55 to 64 Years | 133 (75.6%) | 43 (24.4%) |
| 65 to 74 Years | 207 (100.0%) | 0 (0.0%) |
| 75 Years and older | 56 (100.0%) | 0 (0.0%) |
| Total | 1,088 (88.5%) | 142 (11.5%) |
Health Insurance Coverage by Citizenship Status in Harmony borough
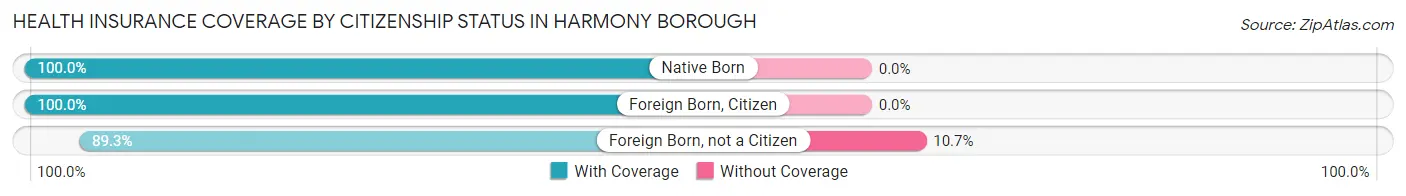
| Citizenship Status | With Coverage | Without Coverage |
| Native Born | 45 (100.0%) | 0 (0.0%) |
| Foreign Born, Citizen | 215 (100.0%) | 0 (0.0%) |
| Foreign Born, not a Citizen | 125 (89.3%) | 15 (10.7%) |
Health Insurance Coverage by Household Income in Harmony borough
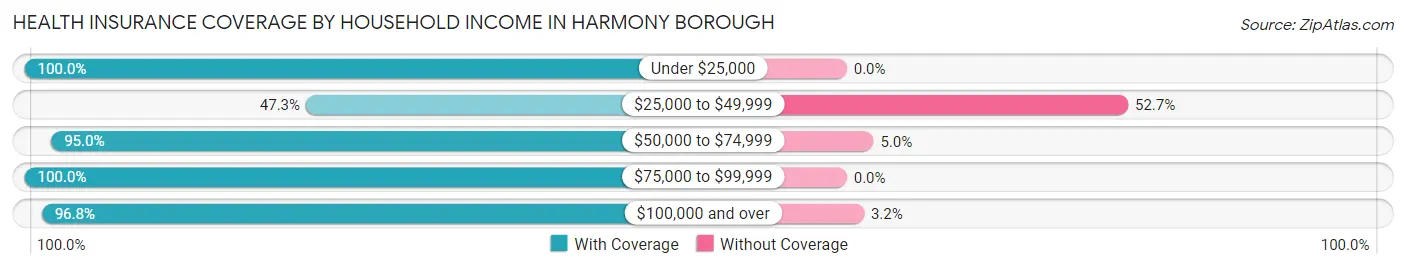
| Household Income | With Coverage | Without Coverage |
| Under $25,000 | 38 (100.0%) | 0 (0.0%) |
| $25,000 to $49,999 | 105 (47.3%) | 117 (52.7%) |
| $50,000 to $74,999 | 133 (95.0%) | 7 (5.0%) |
| $75,000 to $99,999 | 270 (100.0%) | 0 (0.0%) |
| $100,000 and over | 542 (96.8%) | 18 (3.2%) |
Public vs Private Health Insurance Coverage by Age in Harmony borough
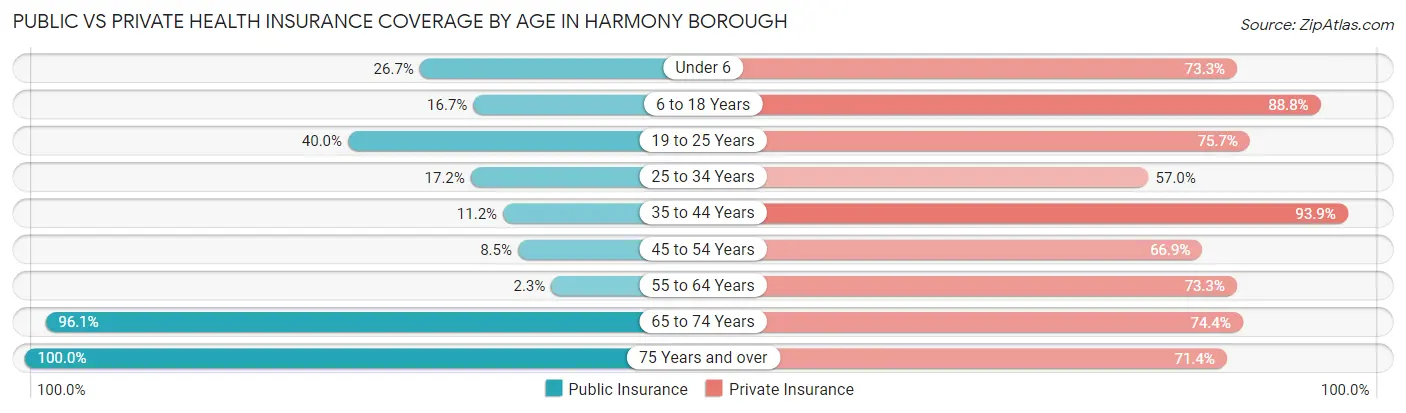
| Age Bracket | Public Insurance | Private Insurance |
| Under 6 | 12 (26.7%) | 33 (73.3%) |
| 6 to 18 Years | 36 (16.7%) | 191 (88.8%) |
| 19 to 25 Years | 56 (40.0%) | 106 (75.7%) |
| 25 to 34 Years | 26 (17.2%) | 86 (57.0%) |
| 35 to 44 Years | 11 (11.2%) | 92 (93.9%) |
| 45 to 54 Years | 12 (8.5%) | 95 (66.9%) |
| 55 to 64 Years | 4 (2.3%) | 129 (73.3%) |
| 65 to 74 Years | 199 (96.1%) | 154 (74.4%) |
| 75 Years and over | 56 (100.0%) | 40 (71.4%) |
| Total | 412 (33.5%) | 926 (75.3%) |
Disability Status by Sex by Age in Harmony borough
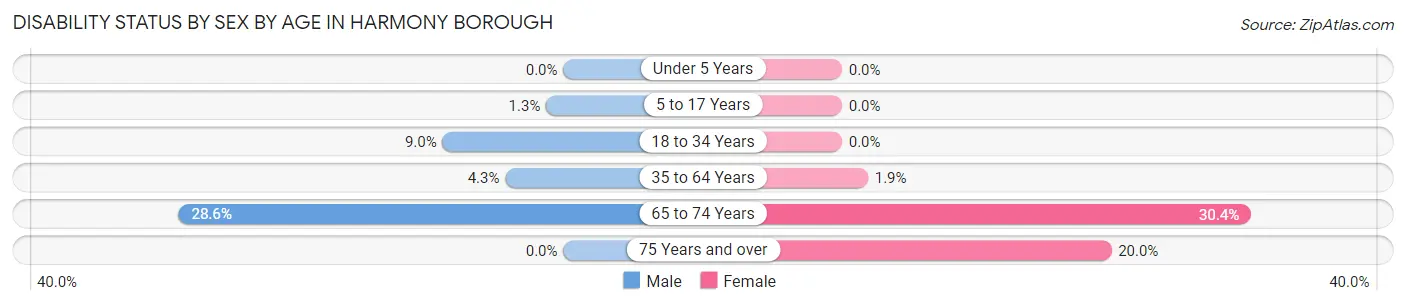
| Age Bracket | Male | Female |
| Under 5 Years | 0 (0.0%) | 0 (0.0%) |
| 5 to 17 Years | 1 (1.3%) | 0 (0.0%) |
| 18 to 34 Years | 14 (9.0%) | 0 (0.0%) |
| 35 to 64 Years | 9 (4.3%) | 4 (1.9%) |
| 65 to 74 Years | 30 (28.6%) | 31 (30.4%) |
| 75 Years and over | 0 (0.0%) | 5 (20.0%) |
Disability Class by Sex by Age in Harmony borough
Disability Class: Hearing Difficulty
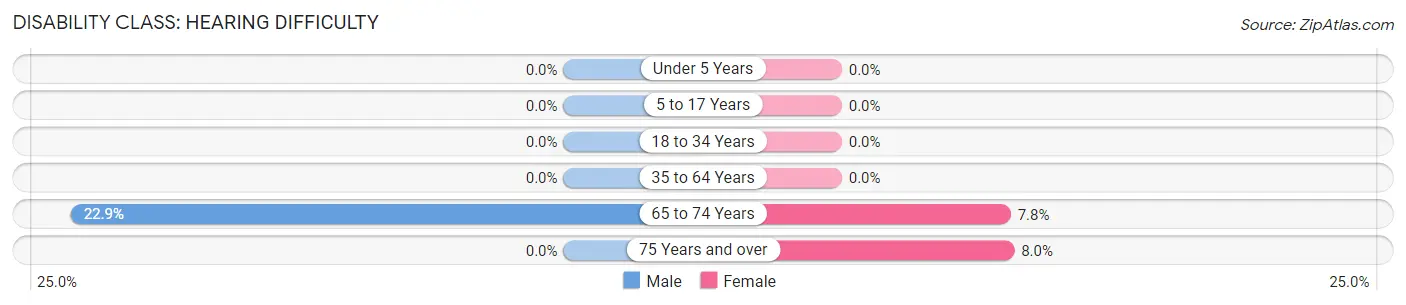
| Age Bracket | Male | Female |
| Under 5 Years | 0 (0.0%) | 0 (0.0%) |
| 5 to 17 Years | 0 (0.0%) | 0 (0.0%) |
| 18 to 34 Years | 0 (0.0%) | 0 (0.0%) |
| 35 to 64 Years | 0 (0.0%) | 0 (0.0%) |
| 65 to 74 Years | 24 (22.9%) | 8 (7.8%) |
| 75 Years and over | 0 (0.0%) | 2 (8.0%) |
Disability Class: Vision Difficulty
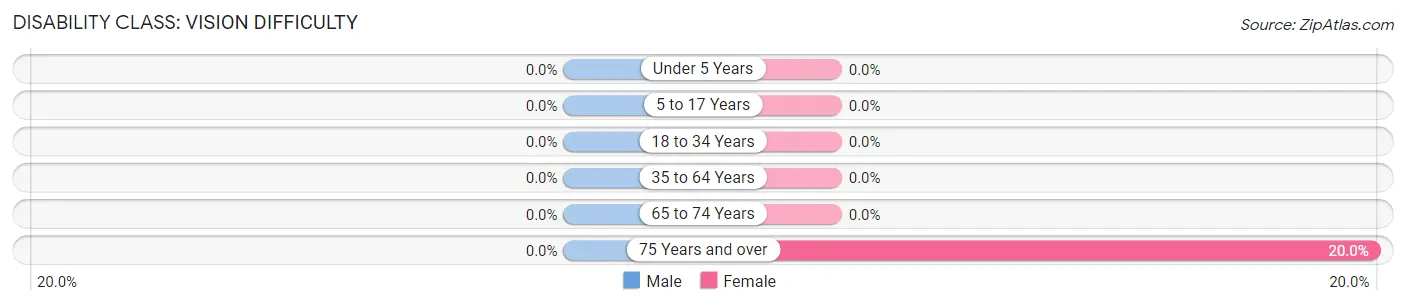
| Age Bracket | Male | Female |
| Under 5 Years | 0 (0.0%) | 0 (0.0%) |
| 5 to 17 Years | 0 (0.0%) | 0 (0.0%) |
| 18 to 34 Years | 0 (0.0%) | 0 (0.0%) |
| 35 to 64 Years | 0 (0.0%) | 0 (0.0%) |
| 65 to 74 Years | 0 (0.0%) | 0 (0.0%) |
| 75 Years and over | 0 (0.0%) | 5 (20.0%) |
Disability Class: Cognitive Difficulty
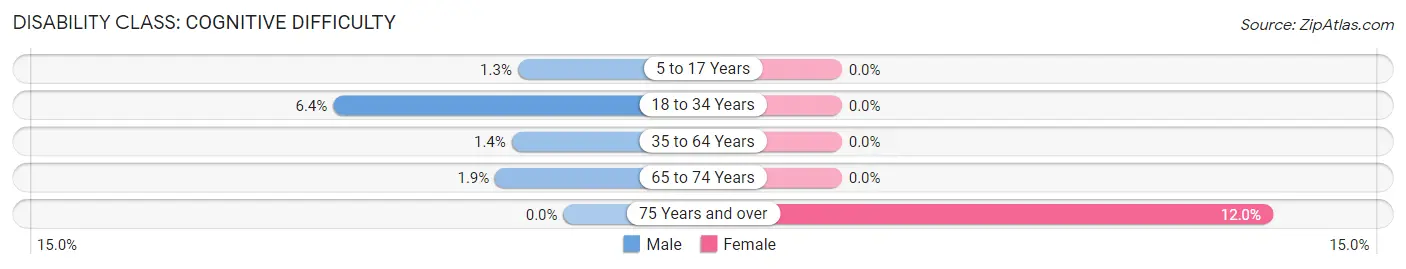
| Age Bracket | Male | Female |
| 5 to 17 Years | 1 (1.3%) | 0 (0.0%) |
| 18 to 34 Years | 10 (6.4%) | 0 (0.0%) |
| 35 to 64 Years | 3 (1.4%) | 0 (0.0%) |
| 65 to 74 Years | 2 (1.9%) | 0 (0.0%) |
| 75 Years and over | 0 (0.0%) | 3 (12.0%) |
Disability Class: Ambulatory Difficulty
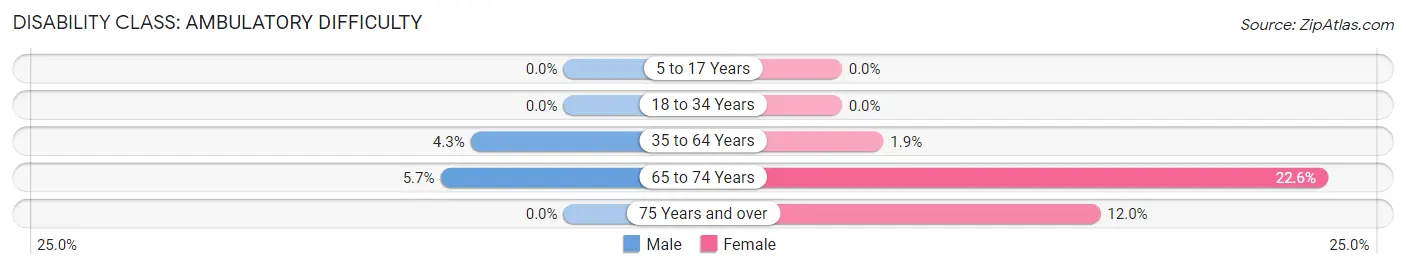
| Age Bracket | Male | Female |
| 5 to 17 Years | 0 (0.0%) | 0 (0.0%) |
| 18 to 34 Years | 0 (0.0%) | 0 (0.0%) |
| 35 to 64 Years | 9 (4.3%) | 4 (1.9%) |
| 65 to 74 Years | 6 (5.7%) | 23 (22.6%) |
| 75 Years and over | 0 (0.0%) | 3 (12.0%) |
Disability Class: Self-Care Difficulty
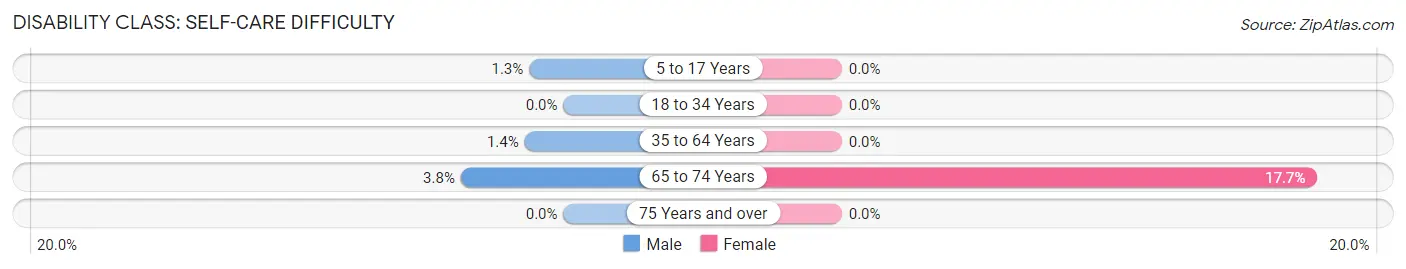
| Age Bracket | Male | Female |
| 5 to 17 Years | 1 (1.3%) | 0 (0.0%) |
| 18 to 34 Years | 0 (0.0%) | 0 (0.0%) |
| 35 to 64 Years | 3 (1.4%) | 0 (0.0%) |
| 65 to 74 Years | 4 (3.8%) | 18 (17.6%) |
| 75 Years and over | 0 (0.0%) | 0 (0.0%) |
Technology Access in Harmony borough
Computing Device Access in Harmony borough
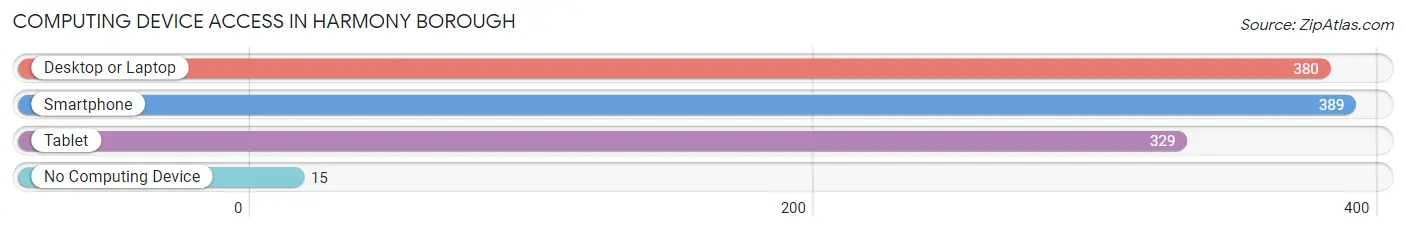
| Device Type | # Households | % Households |
| Desktop or Laptop | 380 | 87.6% |
| Smartphone | 389 | 89.6% |
| Tablet | 329 | 75.8% |
| No Computing Device | 15 | 3.5% |
| Total | 434 | 100.0% |
Internet Access in Harmony borough
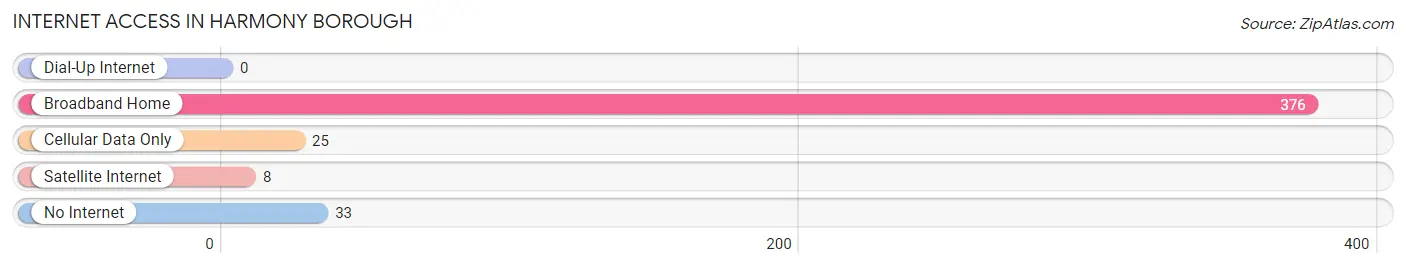
| Internet Type | # Households | % Households |
| Dial-Up Internet | 0 | 0.0% |
| Broadband Home | 376 | 86.6% |
| Cellular Data Only | 25 | 5.8% |
| Satellite Internet | 8 | 1.8% |
| No Internet | 33 | 7.6% |
| Total | 434 | 100.0% |
Harmony borough Summary
Harmony Borough is a small borough located in Butler County, Pennsylvania. It is situated in the western part of the county, approximately 25 miles north of Pittsburgh. The borough is bordered by the townships of Jackson, Connoquenessing, and Forward. According to the 2010 census, the population of Harmony Borough was 1,817.
History
Harmony Borough was founded in 1803 by a group of settlers from Harmony, New Jersey. The settlers purchased the land from the Seneca Indians and named the area after their hometown. The first settlers were mostly farmers and the area quickly grew into a small farming community. In 1832, the Harmony Society, a religious group, moved to the area and established a commune. The commune was successful and the population of the borough grew rapidly.
In 1841, the Harmony Society established a post office and the area was officially incorporated as a borough. The Harmony Society continued to be a major influence in the area until the early 1900s. In the late 1800s, the borough began to industrialize and several factories were built. The factories provided jobs for many of the residents and the population continued to grow.
Geography
Harmony Borough is located in western Butler County, Pennsylvania. It is situated in the foothills of the Allegheny Mountains and is approximately 25 miles north of Pittsburgh. The borough is bordered by the townships of Jackson, Connoquenessing, and Forward. According to the 2010 census, the population of Harmony Borough was 1,817.
The borough has a total area of 1.2 square miles, all of which is land. The borough is located in a hilly area and is mostly forested. The borough is home to several small creeks and streams, including the Connoquenessing Creek and the Little Connoquenessing Creek.
Economy
Harmony Borough has a diverse economy. The borough is home to several small businesses, including restaurants, retail stores, and professional services. The borough is also home to several manufacturing companies, including a steel mill and a paper mill. The borough is also home to several farms, which produce a variety of crops.
The borough is also home to several educational institutions, including a public school district and a community college. The borough is also home to several churches and other religious organizations.
Demographics
According to the 2010 census, the population of Harmony Borough was 1,817. The racial makeup of the borough was 97.2% White, 0.9% African American, 0.2% Native American, 0.3% Asian, 0.1% from other races, and 1.3% from two or more races. Hispanic or Latino of any race were 0.7% of the population.
The median income for a household in the borough was $41,250, and the median income for a family was $50,000. The per capita income for the borough was $20,845. About 8.2% of families and 10.2% of the population were below the poverty line, including 14.2% of those under age 18 and 6.2% of those age 65 or over.
Common Questions
What is Per Capita Income in Harmony borough?
Per Capita income in Harmony borough is $33,968.
What is the Median Family Income in Harmony borough?
Median Family Income in Harmony borough is $91,964.
What is the Median Household income in Harmony borough?
Median Household Income in Harmony borough is $88,571.
What is Income or Wage Gap in Harmony borough?
Income or Wage Gap in Harmony borough is 30.9%.
Women in Harmony borough earn 69.1 cents for every dollar earned by a man.
What is Inequality or Gini Index in Harmony borough?
Inequality or Gini Index in Harmony borough is 0.31.
What is the Total Population of Harmony borough?
Total Population of Harmony borough is 1,230.
What is the Total Male Population of Harmony borough?
Total Male Population of Harmony borough is 609.
What is the Total Female Population of Harmony borough?
Total Female Population of Harmony borough is 621.
What is the Ratio of Males per 100 Females in Harmony borough?
There are 98.07 Males per 100 Females in Harmony borough.
What is the Ratio of Females per 100 Males in Harmony borough?
There are 101.97 Females per 100 Males in Harmony borough.
What is the Median Population Age in Harmony borough?
Median Population Age in Harmony borough is 43.2 Years.
What is the Average Family Size in Harmony borough
Average Family Size in Harmony borough is 3.2 People.
What is the Average Household Size in Harmony borough
Average Household Size in Harmony borough is 2.8 People.
How Large is the Labor Force in Harmony borough?
There are 647 People in the Labor Forcein in Harmony borough.
What is the Percentage of People in the Labor Force in Harmony borough?
64.6% of People are in the Labor Force in Harmony borough.
What is the Unemployment Rate in Harmony borough?
Unemployment Rate in Harmony borough is 15.6%.