Red Lion borough, PA Map & Demographics
Red Lion borough Overview
$37,309
PER CAPITA INCOME
$77,129
AVG FAMILY INCOME
$59,503
AVG HOUSEHOLD INCOME
25.4%
WAGE / INCOME GAP [ % ]
74.6¢/ $1
WAGE / INCOME GAP [ $ ]
0.49
INEQUALITY / GINI INDEX
6,499
TOTAL POPULATION
3,238
MALE POPULATION
3,261
FEMALE POPULATION
99.29
MALES / 100 FEMALES
100.71
FEMALES / 100 MALES
35.4
MEDIAN AGE
2.9
AVG FAMILY SIZE
2.4
AVG HOUSEHOLD SIZE
3,544
LABOR FORCE [ PEOPLE ]
67.7%
PERCENT IN LABOR FORCE
0.5%
UNEMPLOYMENT RATE
Income in Red Lion borough
Income Overview in Red Lion borough
Per Capita Income in Red Lion borough is $37,309, while median incomes of families and households are $77,129 and $59,503 respectively.
| Characteristic | Number | Measure |
| Per Capita Income | 6,499 | $37,309 |
| Median Family Income | 1,579 | $77,129 |
| Mean Family Income | 1,579 | $112,777 |
| Median Household Income | 2,745 | $59,503 |
| Mean Household Income | 2,745 | $87,219 |
| Income Deficit | 1,579 | $0 |
| Wage / Income Gap (%) | 6,499 | 25.44% |
| Wage / Income Gap ($) | 6,499 | 74.56¢ per $1 |
| Gini / Inequality Index | 6,499 | 0.49 |
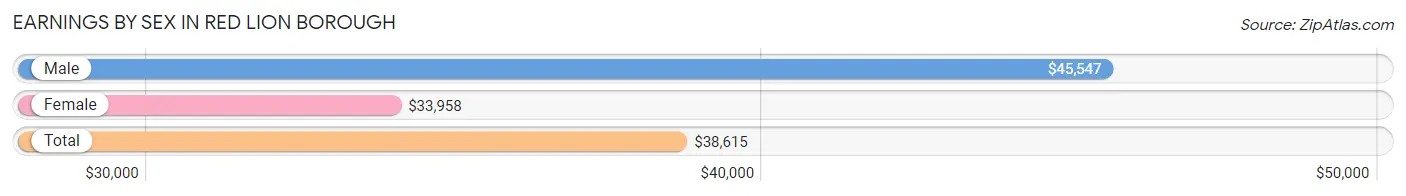
Earnings by Sex in Red Lion borough
Average Earnings in Red Lion borough are $38,615, $45,547 for men and $33,958 for women, a difference of 25.4%.
| Sex | Number | Average Earnings |
| Male | 1,823 (50.9%) | $45,547 |
| Female | 1,759 (49.1%) | $33,958 |
| Total | 3,582 (100.0%) | $38,615 |
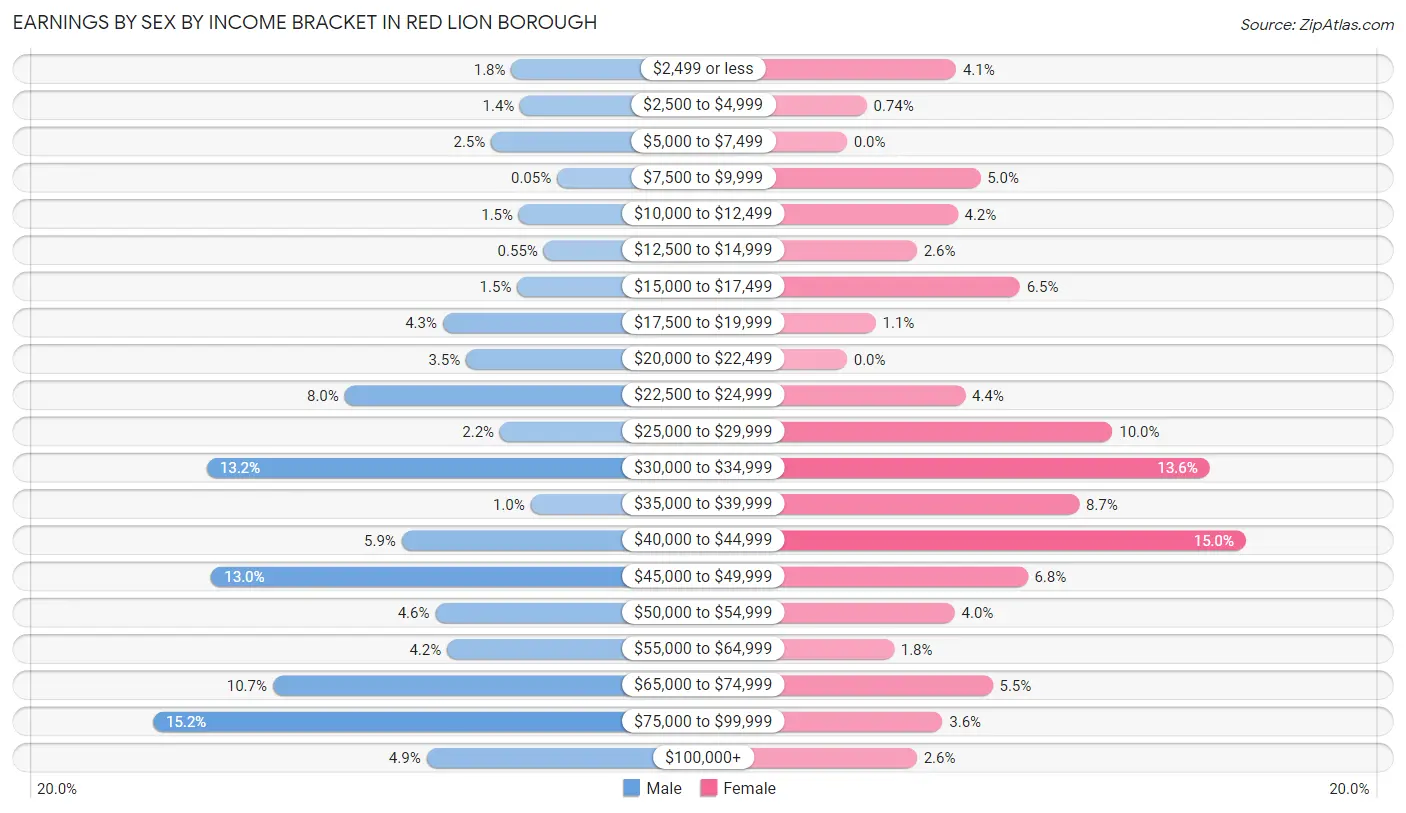
Earnings by Sex by Income Bracket in Red Lion borough
The most common earnings brackets in Red Lion borough are $75,000 to $99,999 for men (277 | 15.2%) and $40,000 to $44,999 for women (263 | 14.9%).
| Income | Male | Female |
| $2,499 or less | 32 (1.8%) | 72 (4.1%) |
| $2,500 to $4,999 | 26 (1.4%) | 13 (0.7%) |
| $5,000 to $7,499 | 46 (2.5%) | 0 (0.0%) |
| $7,500 to $9,999 | 1 (0.1%) | 88 (5.0%) |
| $10,000 to $12,499 | 27 (1.5%) | 73 (4.2%) |
| $12,500 to $14,999 | 10 (0.5%) | 46 (2.6%) |
| $15,000 to $17,499 | 28 (1.5%) | 114 (6.5%) |
| $17,500 to $19,999 | 79 (4.3%) | 19 (1.1%) |
| $20,000 to $22,499 | 63 (3.5%) | 0 (0.0%) |
| $22,500 to $24,999 | 146 (8.0%) | 78 (4.4%) |
| $25,000 to $29,999 | 40 (2.2%) | 175 (10.0%) |
| $30,000 to $34,999 | 240 (13.2%) | 239 (13.6%) |
| $35,000 to $39,999 | 19 (1.0%) | 153 (8.7%) |
| $40,000 to $44,999 | 107 (5.9%) | 263 (14.9%) |
| $45,000 to $49,999 | 237 (13.0%) | 119 (6.8%) |
| $50,000 to $54,999 | 84 (4.6%) | 71 (4.0%) |
| $55,000 to $64,999 | 76 (4.2%) | 31 (1.8%) |
| $65,000 to $74,999 | 195 (10.7%) | 96 (5.5%) |
| $75,000 to $99,999 | 277 (15.2%) | 63 (3.6%) |
| $100,000+ | 90 (4.9%) | 46 (2.6%) |
| Total | 1,823 (100.0%) | 1,759 (100.0%) |
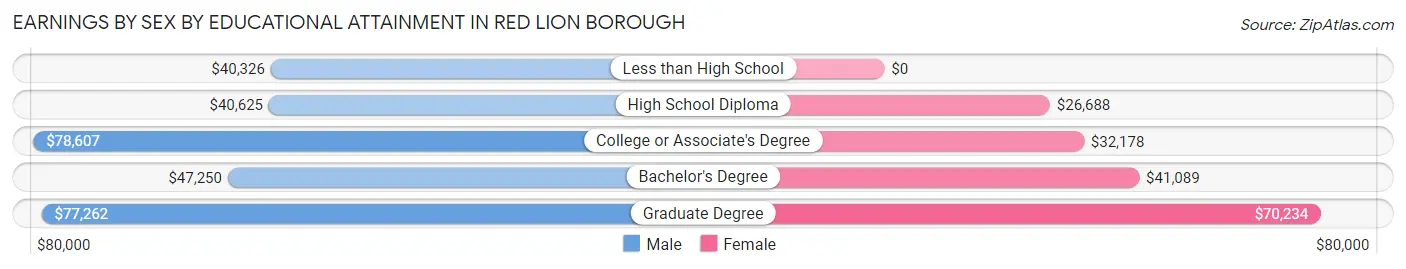
Earnings by Sex by Educational Attainment in Red Lion borough
Average earnings in Red Lion borough are $46,256 for men and $34,125 for women, a difference of 26.2%. Men with an educational attainment of college or associate's degree enjoy the highest average annual earnings of $78,607, while those with less than high school education earn the least with $40,326. Women with an educational attainment of graduate degree earn the most with the average annual earnings of $70,234, while those with high school diploma education have the smallest earnings of $26,688.
| Educational Attainment | Male Income | Female Income |
| Less than High School | $40,326 | $0 |
| High School Diploma | $40,625 | $26,688 |
| College or Associate's Degree | $78,607 | $32,178 |
| Bachelor's Degree | $47,250 | $41,089 |
| Graduate Degree | $77,262 | $70,234 |
| Total | $46,256 | $34,125 |
Family Income in Red Lion borough
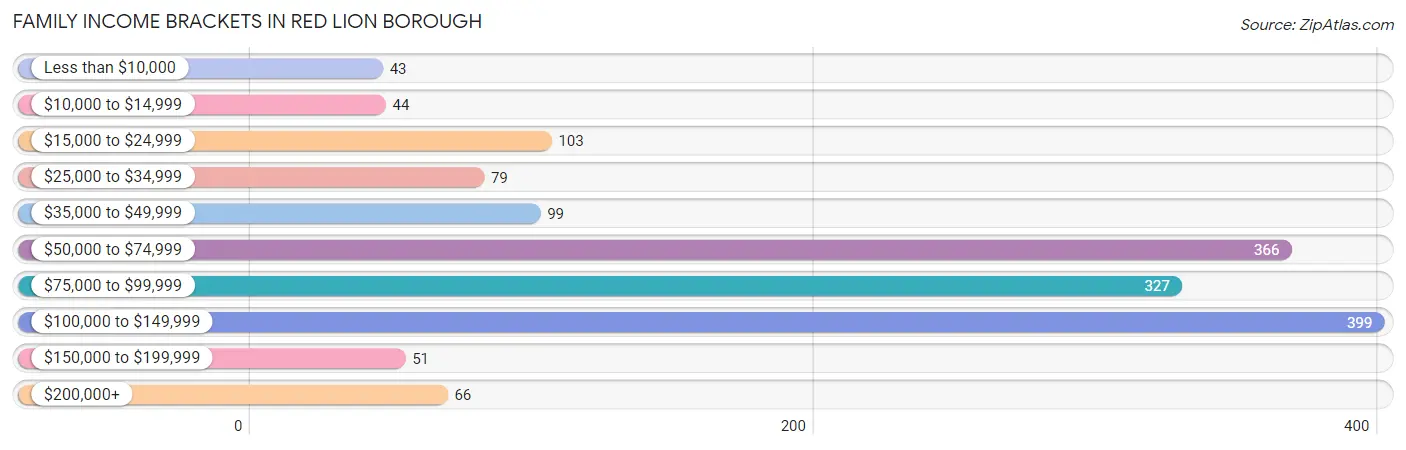
Family Income Brackets in Red Lion borough
According to the Red Lion borough family income data, there are 399 families falling into the $100,000 to $149,999 income range, which is the most common income bracket and makes up 25.3% of all families. Conversely, the less than $10,000 income bracket is the least frequent group with only 43 families (2.7%) belonging to this category.
| Income Bracket | # Families | % Families |
| Less than $10,000 | 43 | 2.7% |
| $10,000 to $14,999 | 44 | 2.8% |
| $15,000 to $24,999 | 103 | 6.5% |
| $25,000 to $34,999 | 79 | 5.0% |
| $35,000 to $49,999 | 99 | 6.3% |
| $50,000 to $74,999 | 366 | 23.2% |
| $75,000 to $99,999 | 327 | 20.7% |
| $100,000 to $149,999 | 399 | 25.3% |
| $150,000 to $199,999 | 51 | 3.2% |
| $200,000+ | 66 | 4.2% |
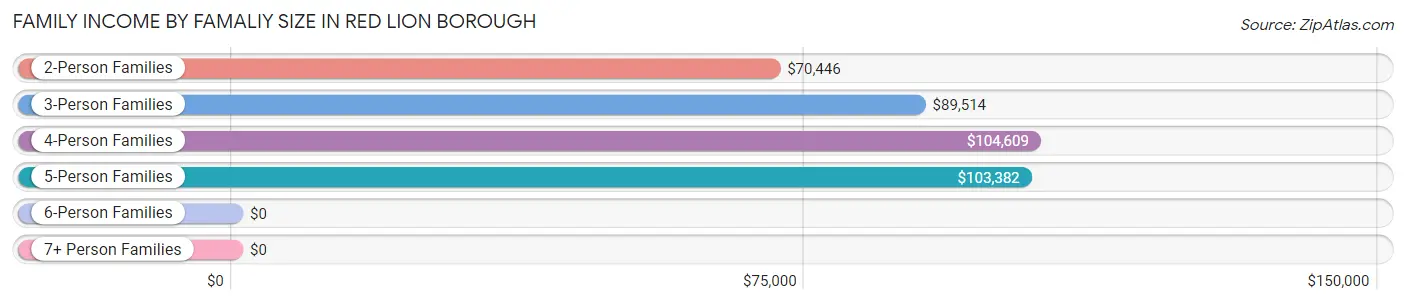
Family Income by Famaliy Size in Red Lion borough
4-person families (75 | 4.8%) account for the highest median family income in Red Lion borough with $104,609 per family, while 2-person families (954 | 60.4%) have the highest median income of $35,223 per family member.
| Income Bracket | # Families | Median Income |
| 2-Person Families | 954 (60.4%) | $70,446 |
| 3-Person Families | 323 (20.5%) | $89,514 |
| 4-Person Families | 75 (4.8%) | $104,609 |
| 5-Person Families | 138 (8.7%) | $103,382 |
| 6-Person Families | 61 (3.9%) | $0 |
| 7+ Person Families | 28 (1.8%) | $0 |
| Total | 1,579 (100.0%) | $77,129 |
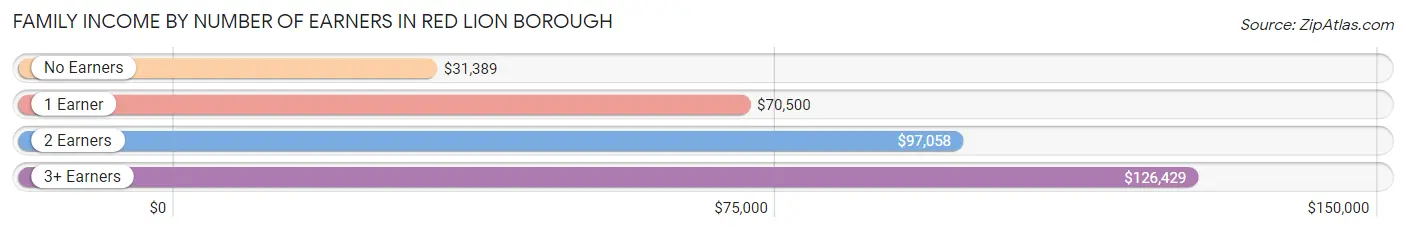
Family Income by Number of Earners in Red Lion borough
The median family income in Red Lion borough is $77,129, with families comprising 3+ earners (144) having the highest median family income of $126,429, while families with no earners (198) have the lowest median family income of $31,389, accounting for 9.1% and 12.5% of families, respectively.
| Number of Earners | # Families | Median Income |
| No Earners | 198 (12.5%) | $31,389 |
| 1 Earner | 616 (39.0%) | $70,500 |
| 2 Earners | 621 (39.3%) | $97,058 |
| 3+ Earners | 144 (9.1%) | $126,429 |
| Total | 1,579 (100.0%) | $77,129 |
Household Income in Red Lion borough
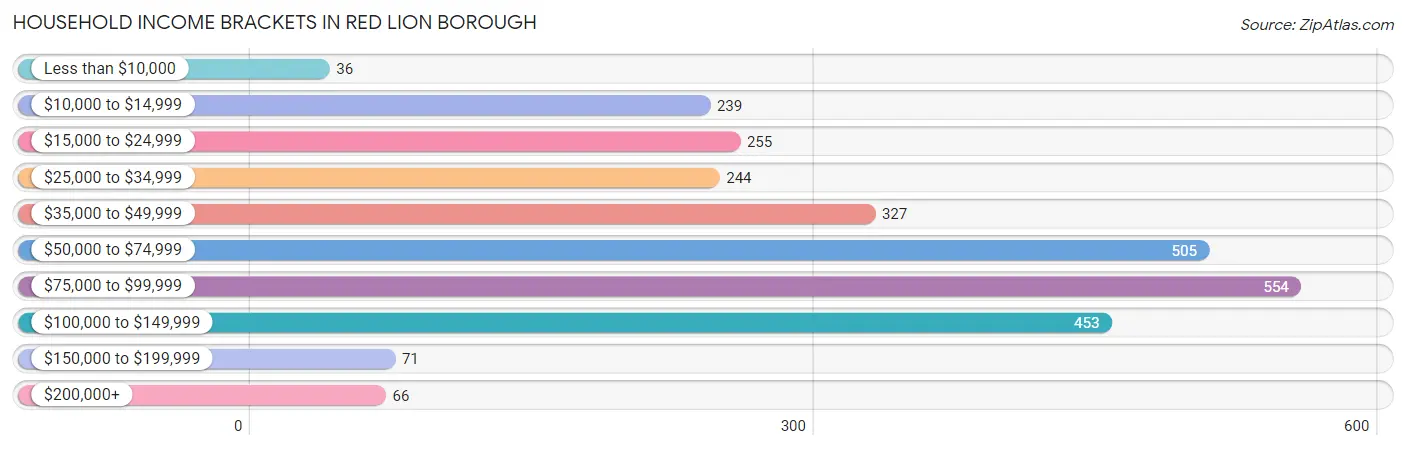
Household Income Brackets in Red Lion borough
With 554 households falling in the category, the $75,000 to $99,999 income range is the most frequent in Red Lion borough, accounting for 20.2% of all households. In contrast, only 36 households (1.3%) fall into the less than $10,000 income bracket, making it the least populous group.
| Income Bracket | # Households | % Households |
| Less than $10,000 | 36 | 1.3% |
| $10,000 to $14,999 | 239 | 8.7% |
| $15,000 to $24,999 | 255 | 9.3% |
| $25,000 to $34,999 | 244 | 8.9% |
| $35,000 to $49,999 | 327 | 11.9% |
| $50,000 to $74,999 | 505 | 18.4% |
| $75,000 to $99,999 | 554 | 20.2% |
| $100,000 to $149,999 | 453 | 16.5% |
| $150,000 to $199,999 | 71 | 2.6% |
| $200,000+ | 66 | 2.4% |
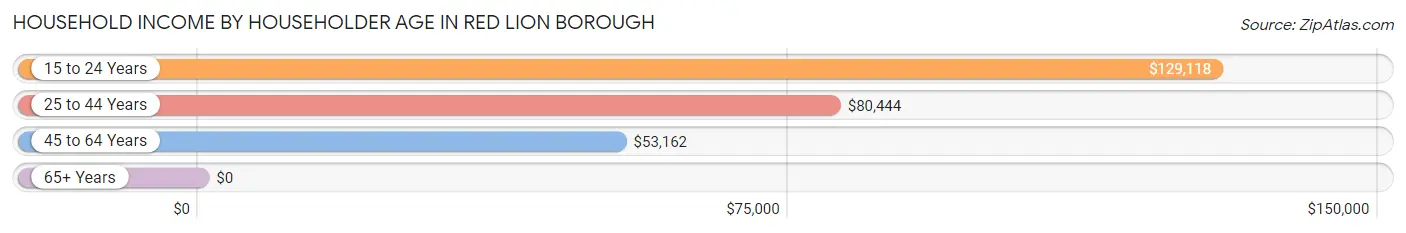
Household Income by Householder Age in Red Lion borough
The median household income in Red Lion borough is $59,503, with the highest median household income of $129,118 found in the 15 to 24 years age bracket for the primary householder. A total of 50 households (1.8%) fall into this category. Meanwhile, the 65+ years age bracket for the primary householder has the lowest median household income of $0, with 671 households (24.4%) in this group.
| Income Bracket | # Households | Median Income |
| 15 to 24 Years | 50 (1.8%) | $129,118 |
| 25 to 44 Years | 1,135 (41.3%) | $80,444 |
| 45 to 64 Years | 889 (32.4%) | $53,162 |
| 65+ Years | 671 (24.4%) | $0 |
| Total | 2,745 (100.0%) | $59,503 |
Poverty in Red Lion borough
Income Below Poverty by Sex and Age in Red Lion borough
With 12.6% poverty level for males and 14.2% for females among the residents of Red Lion borough, under 5 year old males and 5 year old females are the most vulnerable to poverty, with 75 males (50.0%) and 25 females (54.3%) in their respective age groups living below the poverty level.
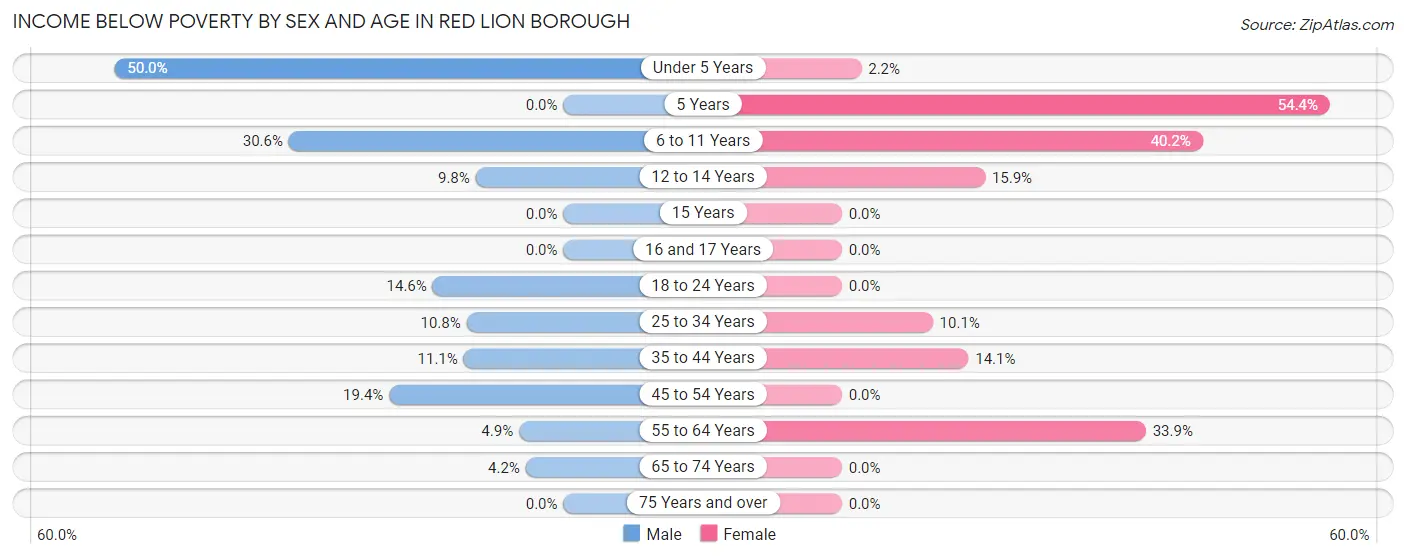
| Age Bracket | Male | Female |
| Under 5 Years | 75 (50.0%) | 3 (2.2%) |
| 5 Years | 0 (0.0%) | 25 (54.3%) |
| 6 to 11 Years | 74 (30.6%) | 86 (40.2%) |
| 12 to 14 Years | 17 (9.8%) | 22 (15.9%) |
| 15 Years | 0 (0.0%) | 0 (0.0%) |
| 16 and 17 Years | 0 (0.0%) | 0 (0.0%) |
| 18 to 24 Years | 30 (14.6%) | 0 (0.0%) |
| 25 to 34 Years | 84 (10.8%) | 65 (10.1%) |
| 35 to 44 Years | 46 (11.1%) | 62 (14.1%) |
| 45 to 54 Years | 45 (19.4%) | 0 (0.0%) |
| 55 to 64 Years | 22 (4.9%) | 197 (33.9%) |
| 65 to 74 Years | 11 (4.2%) | 0 (0.0%) |
| 75 Years and over | 0 (0.0%) | 0 (0.0%) |
| Total | 404 (12.6%) | 460 (14.2%) |
Income Above Poverty by Sex and Age in Red Lion borough
According to the poverty statistics in Red Lion borough, males aged 5 years and females aged 16 and 17 years are the age groups that are most secure financially, with 100.0% of males and 100.0% of females in these age groups living above the poverty line.
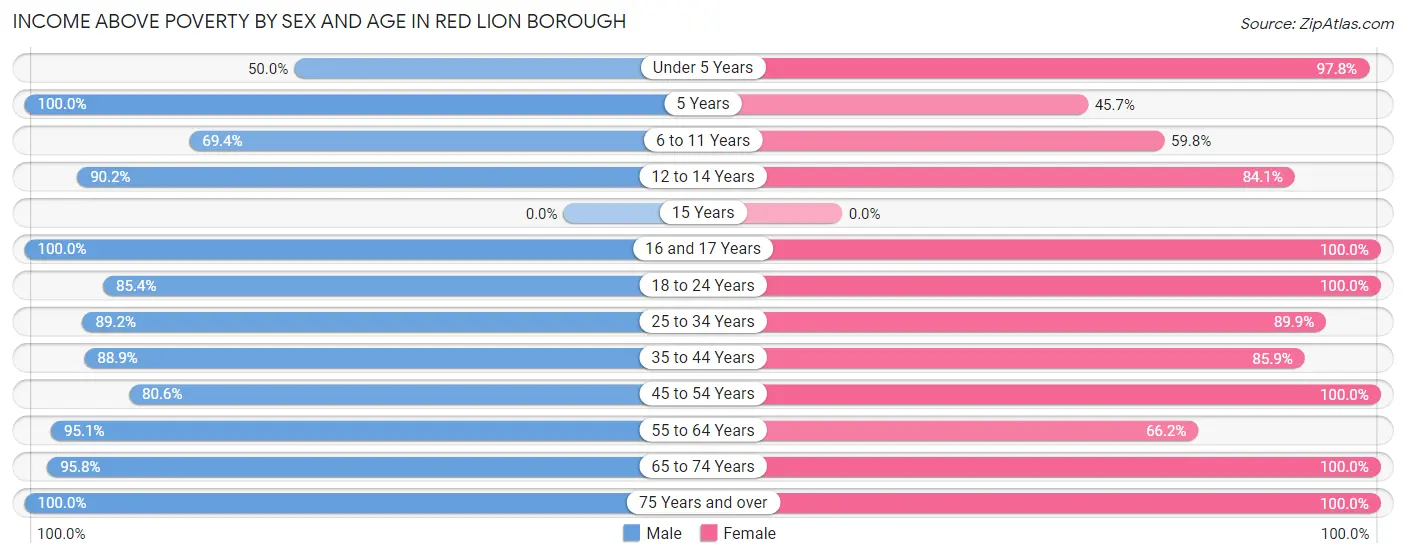
| Age Bracket | Male | Female |
| Under 5 Years | 75 (50.0%) | 135 (97.8%) |
| 5 Years | 92 (100.0%) | 21 (45.7%) |
| 6 to 11 Years | 168 (69.4%) | 128 (59.8%) |
| 12 to 14 Years | 157 (90.2%) | 116 (84.1%) |
| 15 Years | 0 (0.0%) | 0 (0.0%) |
| 16 and 17 Years | 48 (100.0%) | 12 (100.0%) |
| 18 to 24 Years | 176 (85.4%) | 229 (100.0%) |
| 25 to 34 Years | 695 (89.2%) | 577 (89.9%) |
| 35 to 44 Years | 368 (88.9%) | 378 (85.9%) |
| 45 to 54 Years | 187 (80.6%) | 248 (100.0%) |
| 55 to 64 Years | 423 (95.1%) | 385 (66.1%) |
| 65 to 74 Years | 251 (95.8%) | 207 (100.0%) |
| 75 Years and over | 158 (100.0%) | 331 (100.0%) |
| Total | 2,798 (87.4%) | 2,767 (85.8%) |
Income Below Poverty Among Married-Couple Families in Red Lion borough
The poverty statistics for married-couple families in Red Lion borough show that 4.4% or 40 of the total 908 families live below the poverty line. Families with 3 or 4 children have the highest poverty rate of 20.7%, comprising of 28 families. On the other hand, families with 1 or 2 children have the lowest poverty rate of 0.0%, which includes 0 families.
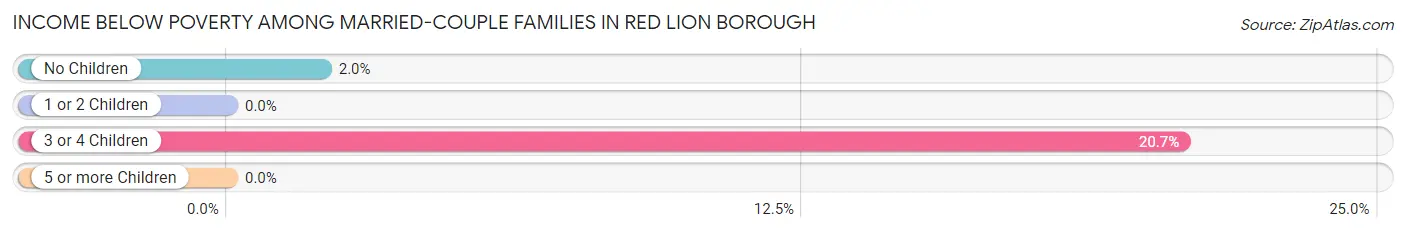
| Children | Above Poverty | Below Poverty |
| No Children | 576 (98.0%) | 12 (2.0%) |
| 1 or 2 Children | 185 (100.0%) | 0 (0.0%) |
| 3 or 4 Children | 107 (79.3%) | 28 (20.7%) |
| 5 or more Children | 0 (0.0%) | 0 (0.0%) |
| Total | 868 (95.6%) | 40 (4.4%) |
Income Below Poverty Among Single-Parent Households in Red Lion borough
According to the poverty data in Red Lion borough, 11.8% or 18 single-father households and 17.2% or 89 single-mother households are living below the poverty line. Among single-father households, those with 1 or 2 children have the highest poverty rate, with 18 households (18.6%) experiencing poverty. Likewise, among single-mother households, those with 3 or 4 children have the highest poverty rate, with 17 households (100.0%) falling below the poverty line.
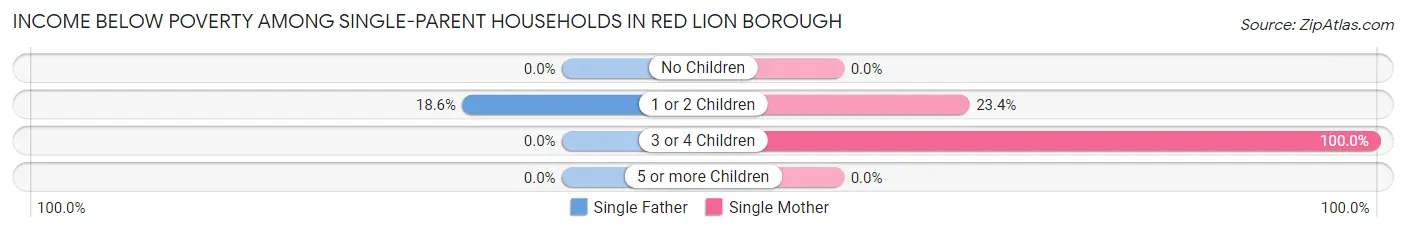
| Children | Single Father | Single Mother |
| No Children | 0 (0.0%) | 0 (0.0%) |
| 1 or 2 Children | 18 (18.6%) | 72 (23.4%) |
| 3 or 4 Children | 0 (0.0%) | 17 (100.0%) |
| 5 or more Children | 0 (0.0%) | 0 (0.0%) |
| Total | 18 (11.8%) | 89 (17.2%) |
Income Below Poverty Among Married-Couple vs Single-Parent Households in Red Lion borough
The poverty data for Red Lion borough shows that 40 of the married-couple family households (4.4%) and 107 of the single-parent households (16.0%) are living below the poverty level. Within the married-couple family households, those with 3 or 4 children have the highest poverty rate, with 28 households (20.7%) falling below the poverty line. Among the single-parent households, those with 3 or 4 children have the highest poverty rate, with 17 household (100.0%) living below poverty.
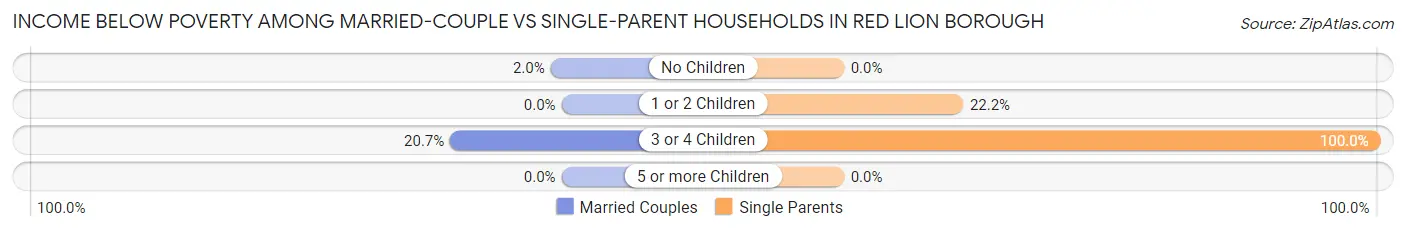
| Children | Married-Couple Families | Single-Parent Households |
| No Children | 12 (2.0%) | 0 (0.0%) |
| 1 or 2 Children | 0 (0.0%) | 90 (22.2%) |
| 3 or 4 Children | 28 (20.7%) | 17 (100.0%) |
| 5 or more Children | 0 (0.0%) | 0 (0.0%) |
| Total | 40 (4.4%) | 107 (16.0%) |
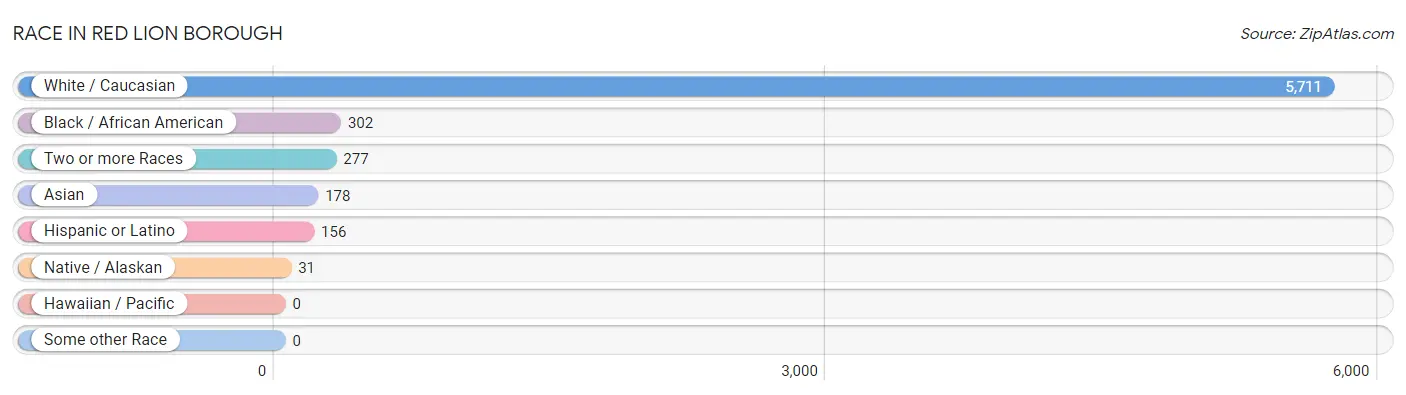
Race in Red Lion borough
The most populous races in Red Lion borough are White / Caucasian (5,711 | 87.9%), Black / African American (302 | 4.6%), and Two or more Races (277 | 4.3%).
| Race | # Population | % Population |
| Asian | 178 | 2.7% |
| Black / African American | 302 | 4.6% |
| Hawaiian / Pacific | 0 | 0.0% |
| Hispanic or Latino | 156 | 2.4% |
| Native / Alaskan | 31 | 0.5% |
| White / Caucasian | 5,711 | 87.9% |
| Two or more Races | 277 | 4.3% |
| Some other Race | 0 | 0.0% |
| Total | 6,499 | 100.0% |
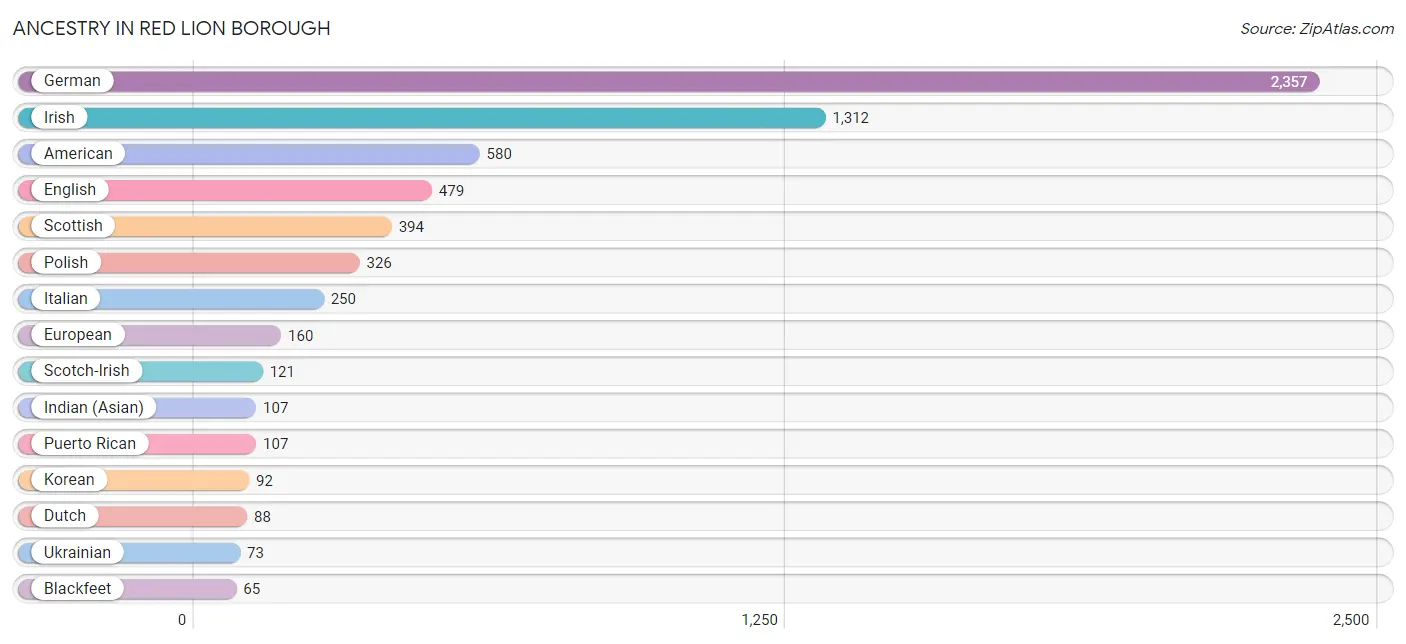
Ancestry in Red Lion borough
The most populous ancestries reported in Red Lion borough are German (2,357 | 36.3%), Irish (1,312 | 20.2%), American (580 | 8.9%), English (479 | 7.4%), and Scottish (394 | 6.1%), together accounting for 78.8% of all Red Lion borough residents.
| Ancestry | # Population | % Population |
| American | 580 | 8.9% |
| Austrian | 14 | 0.2% |
| Barbadian | 23 | 0.4% |
| Blackfeet | 65 | 1.0% |
| British | 27 | 0.4% |
| Canadian | 23 | 0.4% |
| Central American | 20 | 0.3% |
| Central American Indian | 20 | 0.3% |
| Cherokee | 24 | 0.4% |
| Czechoslovakian | 14 | 0.2% |
| Danish | 1 | 0.0% |
| Dutch | 88 | 1.3% |
| Eastern European | 18 | 0.3% |
| English | 479 | 7.4% |
| European | 160 | 2.5% |
| French | 47 | 0.7% |
| German | 2,357 | 36.3% |
| Guatemalan | 20 | 0.3% |
| Hungarian | 56 | 0.9% |
| Indian (Asian) | 107 | 1.7% |
| Irish | 1,312 | 20.2% |
| Iroquois | 24 | 0.4% |
| Italian | 250 | 3.8% |
| Jamaican | 1 | 0.0% |
| Kenyan | 21 | 0.3% |
| Korean | 92 | 1.4% |
| Mexican | 29 | 0.4% |
| Norwegian | 19 | 0.3% |
| Pennsylvania German | 26 | 0.4% |
| Polish | 326 | 5.0% |
| Puerto Rican | 107 | 1.7% |
| Russian | 36 | 0.5% |
| Scotch-Irish | 121 | 1.9% |
| Scottish | 394 | 6.1% |
| Subsaharan African | 21 | 0.3% |
| Swedish | 27 | 0.4% |
| Ukrainian | 73 | 1.1% |
| Welsh | 56 | 0.9% | View All 38 Rows |
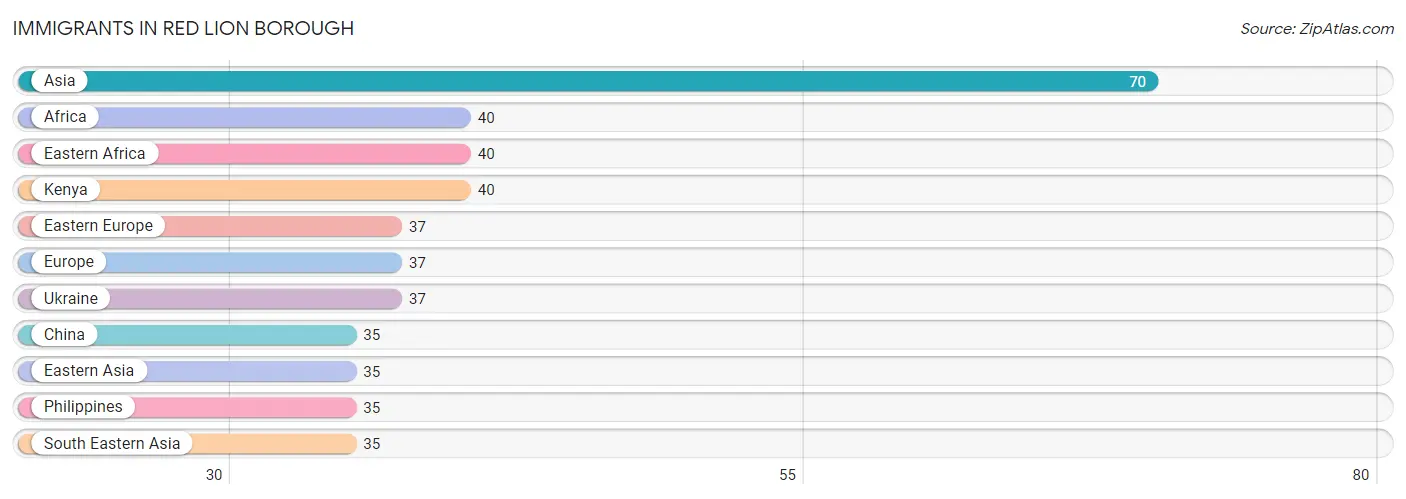
Immigrants in Red Lion borough
The most numerous immigrant groups reported in Red Lion borough came from Asia (70 | 1.1%), Africa (40 | 0.6%), Eastern Africa (40 | 0.6%), Kenya (40 | 0.6%), and Eastern Europe (37 | 0.6%), together accounting for 3.5% of all Red Lion borough residents.
| Immigration Origin | # Population | % Population |
| Africa | 40 | 0.6% |
| Asia | 70 | 1.1% |
| China | 35 | 0.5% |
| Eastern Africa | 40 | 0.6% |
| Eastern Asia | 35 | 0.5% |
| Eastern Europe | 37 | 0.6% |
| Europe | 37 | 0.6% |
| Kenya | 40 | 0.6% |
| Philippines | 35 | 0.5% |
| South Eastern Asia | 35 | 0.5% |
| Ukraine | 37 | 0.6% | View All 11 Rows |
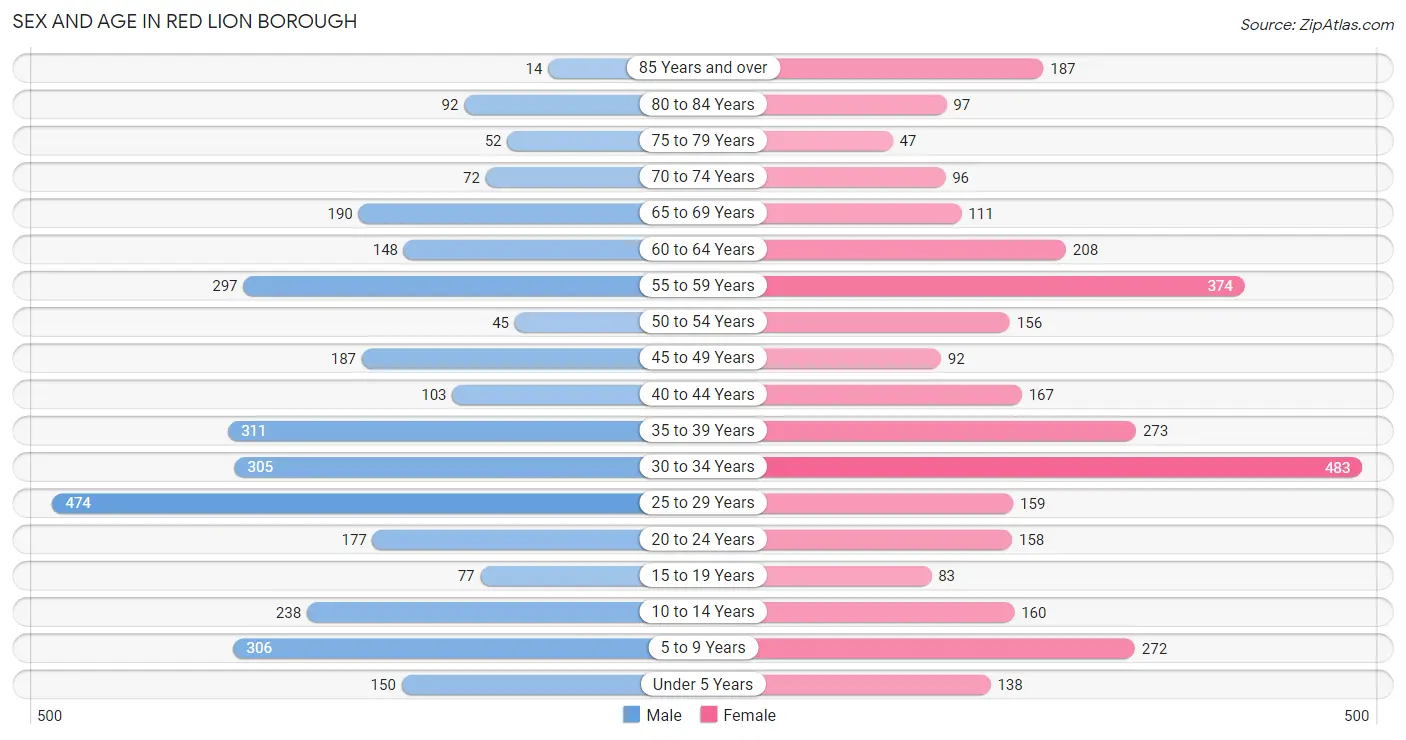
Sex and Age in Red Lion borough
Sex and Age in Red Lion borough
The most populous age groups in Red Lion borough are 25 to 29 Years (474 | 14.6%) for men and 30 to 34 Years (483 | 14.8%) for women.
| Age Bracket | Male | Female |
| Under 5 Years | 150 (4.6%) | 138 (4.2%) |
| 5 to 9 Years | 306 (9.5%) | 272 (8.3%) |
| 10 to 14 Years | 238 (7.3%) | 160 (4.9%) |
| 15 to 19 Years | 77 (2.4%) | 83 (2.5%) |
| 20 to 24 Years | 177 (5.5%) | 158 (4.9%) |
| 25 to 29 Years | 474 (14.6%) | 159 (4.9%) |
| 30 to 34 Years | 305 (9.4%) | 483 (14.8%) |
| 35 to 39 Years | 311 (9.6%) | 273 (8.4%) |
| 40 to 44 Years | 103 (3.2%) | 167 (5.1%) |
| 45 to 49 Years | 187 (5.8%) | 92 (2.8%) |
| 50 to 54 Years | 45 (1.4%) | 156 (4.8%) |
| 55 to 59 Years | 297 (9.2%) | 374 (11.5%) |
| 60 to 64 Years | 148 (4.6%) | 208 (6.4%) |
| 65 to 69 Years | 190 (5.9%) | 111 (3.4%) |
| 70 to 74 Years | 72 (2.2%) | 96 (2.9%) |
| 75 to 79 Years | 52 (1.6%) | 47 (1.4%) |
| 80 to 84 Years | 92 (2.8%) | 97 (3.0%) |
| 85 Years and over | 14 (0.4%) | 187 (5.7%) |
| Total | 3,238 (100.0%) | 3,261 (100.0%) |
Families and Households in Red Lion borough
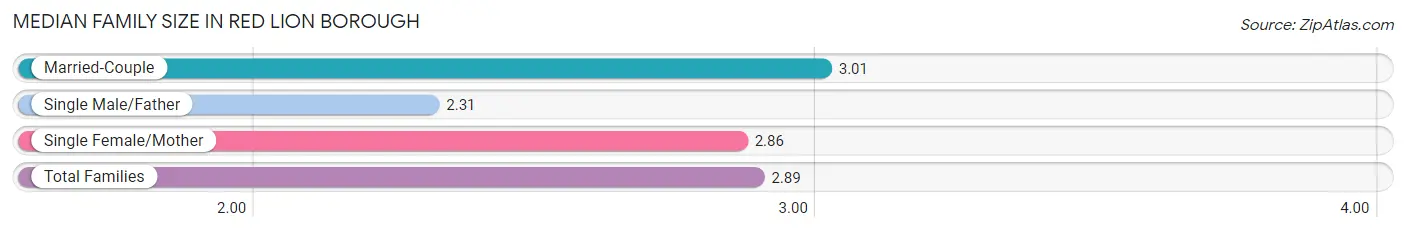
Median Family Size in Red Lion borough
The median family size in Red Lion borough is 2.89 persons per family, with married-couple families (908 | 57.5%) accounting for the largest median family size of 3.01 persons per family. On the other hand, single male/father families (153 | 9.7%) represent the smallest median family size with 2.31 persons per family.
| Family Type | # Families | Family Size |
| Married-Couple | 908 (57.5%) | 3.01 |
| Single Male/Father | 153 (9.7%) | 2.31 |
| Single Female/Mother | 518 (32.8%) | 2.86 |
| Total Families | 1,579 (100.0%) | 2.89 |
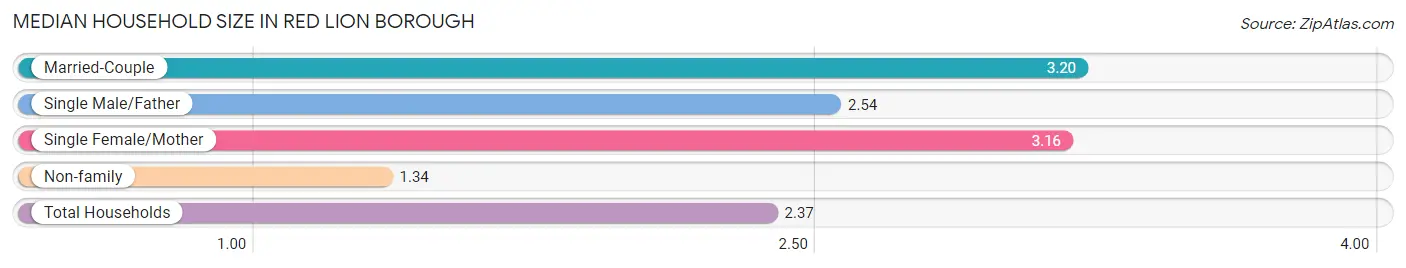
Median Household Size in Red Lion borough
The median household size in Red Lion borough is 2.37 persons per household, with married-couple households (908 | 33.1%) accounting for the largest median household size of 3.2 persons per household. non-family households (1,166 | 42.5%) represent the smallest median household size with 1.34 persons per household.
| Household Type | # Households | Household Size |
| Married-Couple | 908 (33.1%) | 3.20 |
| Single Male/Father | 153 (5.6%) | 2.54 |
| Single Female/Mother | 518 (18.9%) | 3.16 |
| Non-family | 1,166 (42.5%) | 1.34 |
| Total Households | 2,745 (100.0%) | 2.37 |
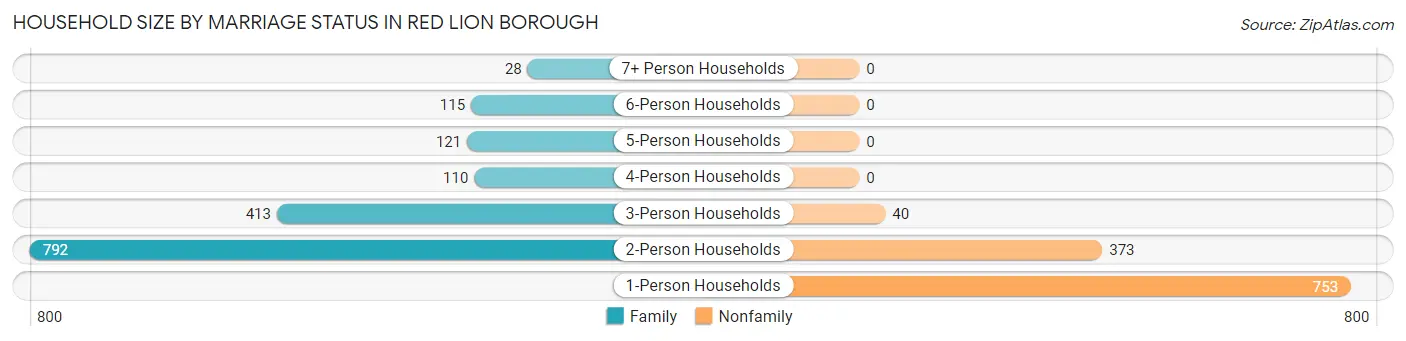
Household Size by Marriage Status in Red Lion borough
Out of a total of 2,745 households in Red Lion borough, 1,579 (57.5%) are family households, while 1,166 (42.5%) are nonfamily households. The most numerous type of family households are 2-person households, comprising 792, and the most common type of nonfamily households are 1-person households, comprising 753.
| Household Size | Family Households | Nonfamily Households |
| 1-Person Households | - | 753 (27.4%) |
| 2-Person Households | 792 (28.8%) | 373 (13.6%) |
| 3-Person Households | 413 (15.0%) | 40 (1.5%) |
| 4-Person Households | 110 (4.0%) | 0 (0.0%) |
| 5-Person Households | 121 (4.4%) | 0 (0.0%) |
| 6-Person Households | 115 (4.2%) | 0 (0.0%) |
| 7+ Person Households | 28 (1.0%) | 0 (0.0%) |
| Total | 1,579 (57.5%) | 1,166 (42.5%) |
Female Fertility in Red Lion borough
Fertility by Age in Red Lion borough
| Age Bracket | Women with Births | Births / 1,000 Women |
| 15 to 19 years | 0 (0.0%) | 0.0 |
| 20 to 34 years | 0 (0.0%) | 0.0 |
| 35 to 50 years | 0 (0.0%) | 0.0 |
| Total | 0 (0.0%) | 0.0 |
Fertility by Age by Marriage Status in Red Lion borough
| Age Bracket | Married | Unmarried |
| 15 to 19 years | 0 (0.0%) | 0 (0.0%) |
| 20 to 34 years | 0 (0.0%) | 0 (0.0%) |
| 35 to 50 years | 0 (0.0%) | 0 (0.0%) |
| Total | 0 (0.0%) | 0 (0.0%) |
Fertility by Education in Red Lion borough
| Educational Attainment | Women with Births | Births / 1,000 Women |
| Less than High School | 0 (0.0%) | 0.0 |
| High School Diploma | 0 (0.0%) | 0.0 |
| College or Associate's Degree | 0 (0.0%) | 0.0 |
| Bachelor's Degree | 0 (0.0%) | 0.0 |
| Graduate Degree | 0 (0.0%) | 0.0 |
| Total | 0 (0.0%) | 0.0 |
Fertility by Education by Marriage Status in Red Lion borough
| Educational Attainment | Married | Unmarried |
| Less than High School | 0 (0.0%) | 0 (0.0%) |
| High School Diploma | 0 (0.0%) | 0 (0.0%) |
| College or Associate's Degree | 0 (0.0%) | 0 (0.0%) |
| Bachelor's Degree | 0 (0.0%) | 0 (0.0%) |
| Graduate Degree | 0 (0.0%) | 0 (0.0%) |
| Total | 0 (0.0%) | 0 (0.0%) |
Employment Characteristics in Red Lion borough
Employment by Class of Employer in Red Lion borough
Among the 3,295 employed individuals in Red Lion borough, private company employees (2,515 | 76.3%), not-for-profit organizations (284 | 8.6%), and self-employed (not incorporated) (195 | 5.9%) make up the most common classes of employment.
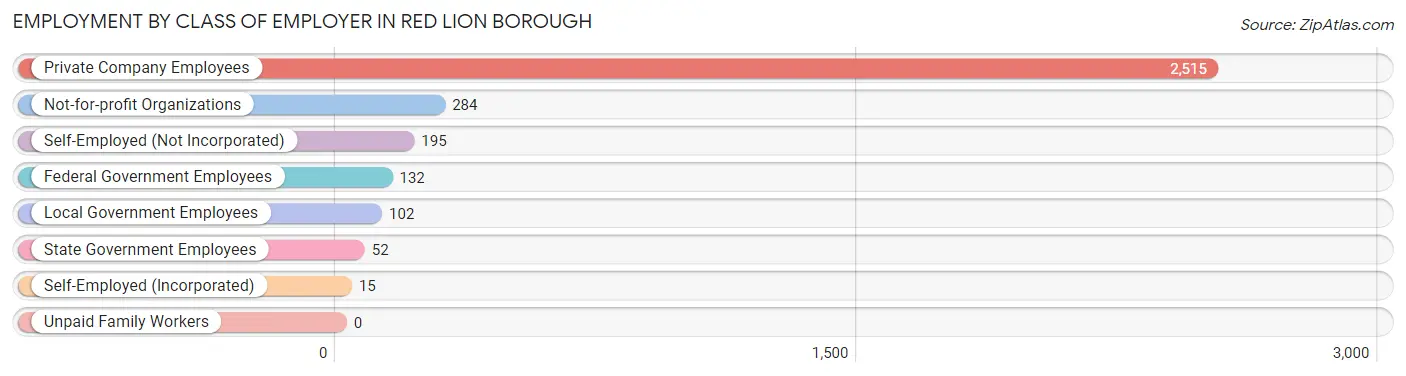
| Employer Class | # Employees | % Employees |
| Private Company Employees | 2,515 | 76.3% |
| Self-Employed (Incorporated) | 15 | 0.5% |
| Self-Employed (Not Incorporated) | 195 | 5.9% |
| Not-for-profit Organizations | 284 | 8.6% |
| Local Government Employees | 102 | 3.1% |
| State Government Employees | 52 | 1.6% |
| Federal Government Employees | 132 | 4.0% |
| Unpaid Family Workers | 0 | 0.0% |
| Total | 3,295 | 100.0% |
Employment Status by Age in Red Lion borough
According to the labor force statistics for Red Lion borough, out of the total population over 16 years of age (5,235), 67.7% or 3,544 individuals are in the labor force, with 0.5% or 18 of them unemployed. The age group with the highest labor force participation rate is 25 to 29 years, with 100.0% or 633 individuals in the labor force. Within the labor force, the 35 to 44 years age range has the highest percentage of unemployed individuals, with 2.5% or 17 of them being unemployed.
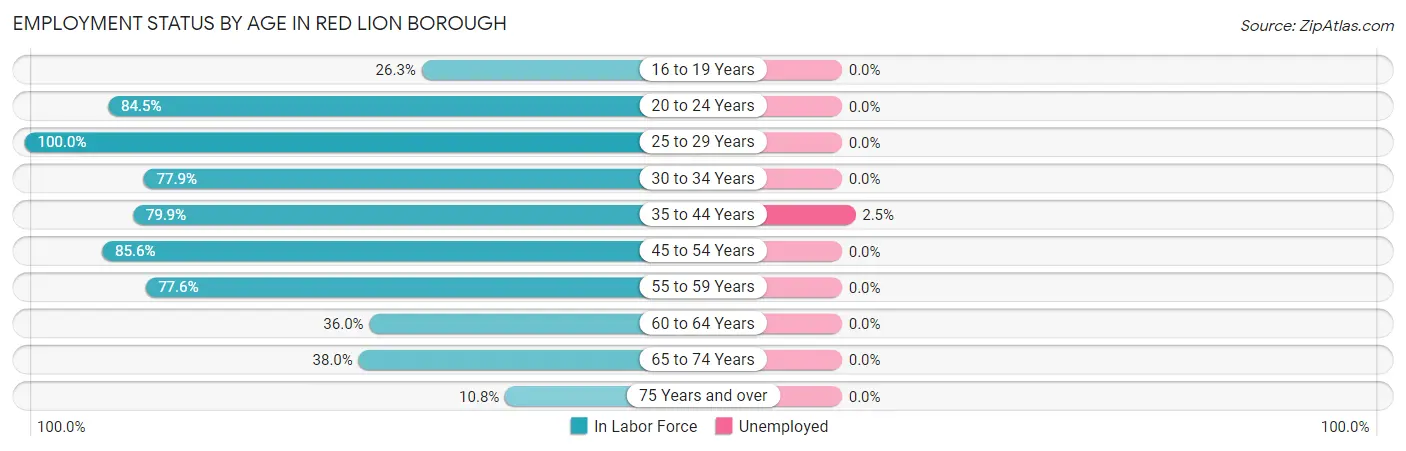
| Age Bracket | In Labor Force | Unemployed |
| 16 to 19 Years | 42 (26.3%) | 0 (0.0%) |
| 20 to 24 Years | 283 (84.5%) | 0 (0.0%) |
| 25 to 29 Years | 633 (100.0%) | 0 (0.0%) |
| 30 to 34 Years | 614 (77.9%) | 0 (0.0%) |
| 35 to 44 Years | 682 (79.9%) | 17 (2.5%) |
| 45 to 54 Years | 411 (85.6%) | 0 (0.0%) |
| 55 to 59 Years | 521 (77.6%) | 0 (0.0%) |
| 60 to 64 Years | 128 (36.0%) | 0 (0.0%) |
| 65 to 74 Years | 178 (38.0%) | 0 (0.0%) |
| 75 Years and over | 53 (10.8%) | 0 (0.0%) |
| Total | 3,544 (67.7%) | 18 (0.5%) |
Employment Status by Educational Attainment in Red Lion borough
According to labor force statistics for Red Lion borough, 79.0% of individuals (2,988) out of the total population between 25 and 64 years of age (3,782) are in the labor force, with 0.6% or 18 of them being unemployed. The group with the highest labor force participation rate are those with the educational attainment of high school diploma, with 85.0% or 1,400 individuals in the labor force. Within the labor force, individuals with high school diploma education have the highest percentage of unemployment, with 1.2% or 17 of them being unemployed.
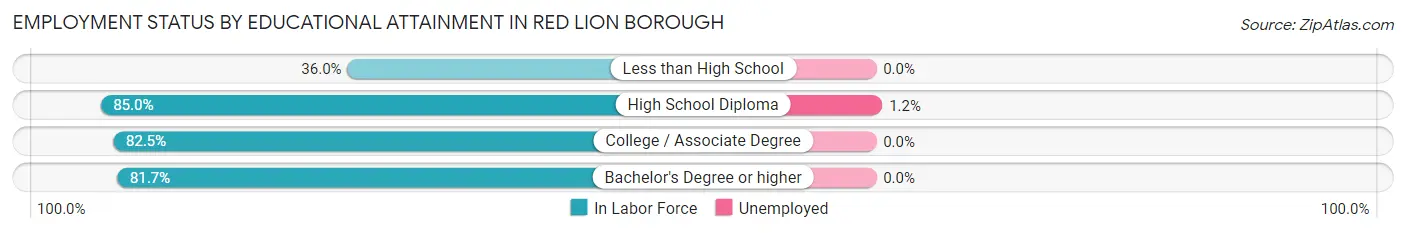
| Educational Attainment | In Labor Force | Unemployed |
| Less than High School | 130 (36.0%) | 0 (0.0%) |
| High School Diploma | 1,400 (85.0%) | 20 (1.2%) |
| College / Associate Degree | 972 (82.5%) | 0 (0.0%) |
| Bachelor's Degree or higher | 487 (81.7%) | 0 (0.0%) |
| Total | 2,988 (79.0%) | 23 (0.6%) |
Employment Occupations by Sex in Red Lion borough
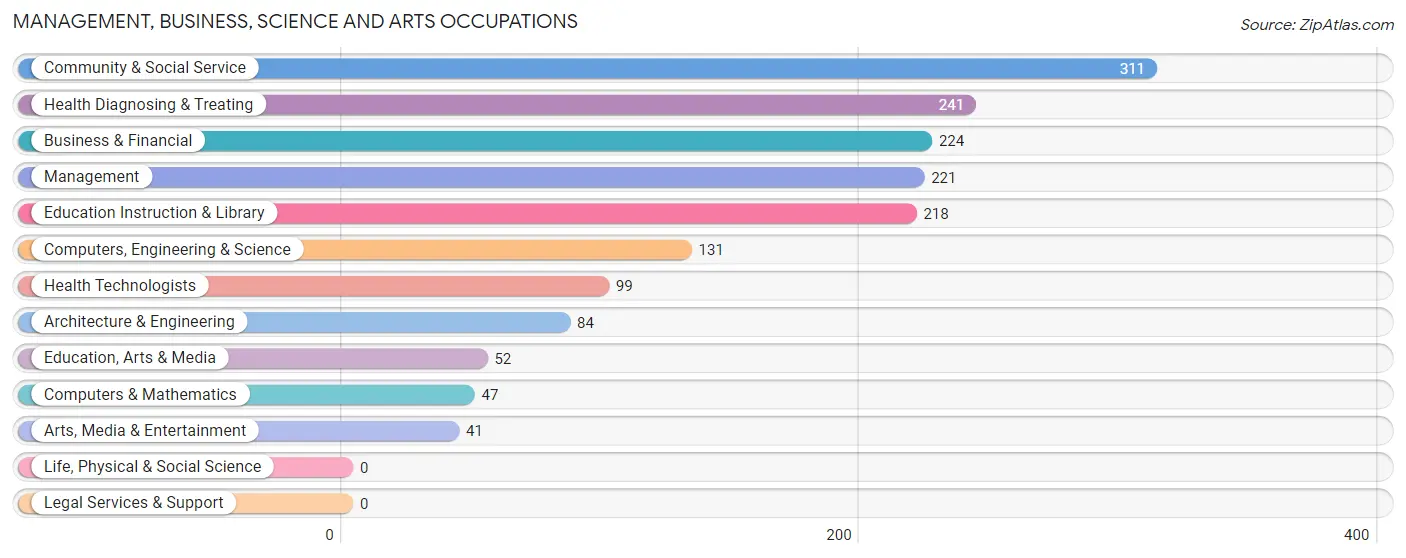
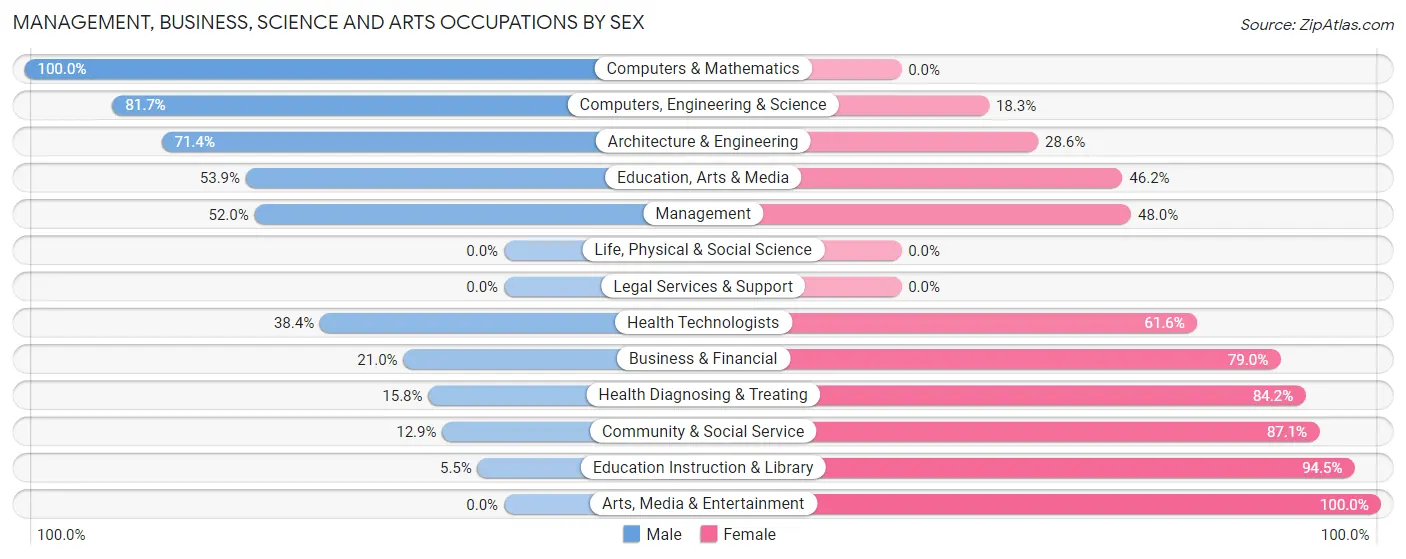
Management, Business, Science and Arts Occupations
The most common Management, Business, Science and Arts occupations in Red Lion borough are Community & Social Service (311 | 8.9%), Health Diagnosing & Treating (241 | 6.9%), Business & Financial (224 | 6.4%), Management (221 | 6.3%), and Education Instruction & Library (218 | 6.2%).
Management, Business, Science and Arts Occupations by Sex
Within the Management, Business, Science and Arts occupations in Red Lion borough, the most male-oriented occupations are Computers & Mathematics (100.0%), Computers, Engineering & Science (81.7%), and Architecture & Engineering (71.4%), while the most female-oriented occupations are Arts, Media & Entertainment (100.0%), Education Instruction & Library (94.5%), and Community & Social Service (87.1%).
| Occupation | Male | Female |
| Management | 115 (52.0%) | 106 (48.0%) |
| Business & Financial | 47 (21.0%) | 177 (79.0%) |
| Computers, Engineering & Science | 107 (81.7%) | 24 (18.3%) |
| Computers & Mathematics | 47 (100.0%) | 0 (0.0%) |
| Architecture & Engineering | 60 (71.4%) | 24 (28.6%) |
| Life, Physical & Social Science | 0 (0.0%) | 0 (0.0%) |
| Community & Social Service | 40 (12.9%) | 271 (87.1%) |
| Education, Arts & Media | 28 (53.8%) | 24 (46.2%) |
| Legal Services & Support | 0 (0.0%) | 0 (0.0%) |
| Education Instruction & Library | 12 (5.5%) | 206 (94.5%) |
| Arts, Media & Entertainment | 0 (0.0%) | 41 (100.0%) |
| Health Diagnosing & Treating | 38 (15.8%) | 203 (84.2%) |
| Health Technologists | 38 (38.4%) | 61 (61.6%) |
| Total (Category) | 347 (30.8%) | 781 (69.2%) |
| Total (Overall) | 1,794 (51.3%) | 1,706 (48.7%) |
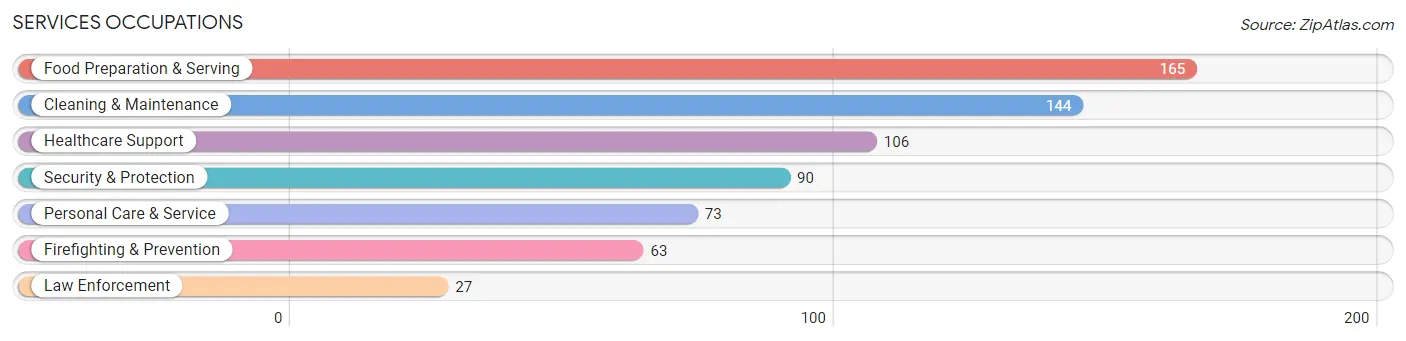
Services Occupations
The most common Services occupations in Red Lion borough are Food Preparation & Serving (165 | 4.7%), Cleaning & Maintenance (144 | 4.1%), Healthcare Support (106 | 3.0%), Security & Protection (90 | 2.6%), and Personal Care & Service (73 | 2.1%).
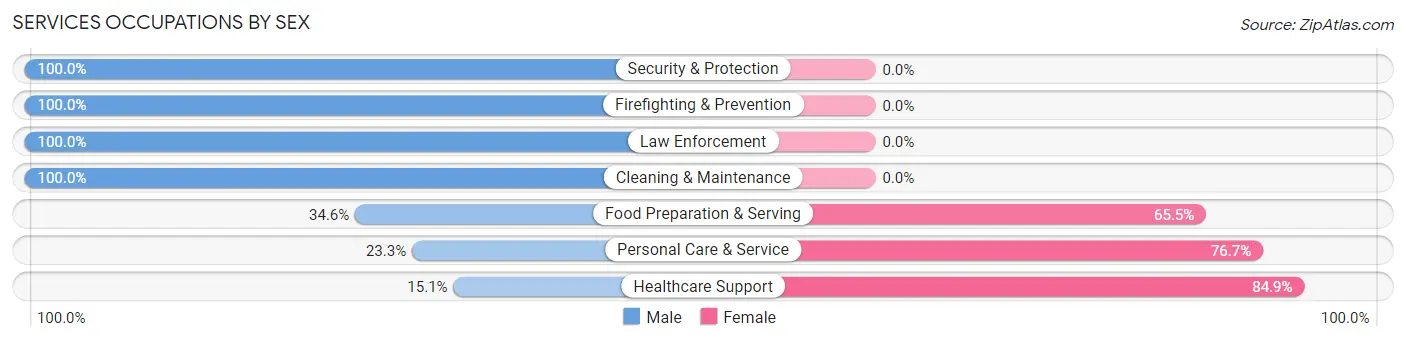
Services Occupations by Sex
Within the Services occupations in Red Lion borough, the most male-oriented occupations are Security & Protection (100.0%), Firefighting & Prevention (100.0%), and Law Enforcement (100.0%), while the most female-oriented occupations are Healthcare Support (84.9%), Personal Care & Service (76.7%), and Food Preparation & Serving (65.4%).
| Occupation | Male | Female |
| Healthcare Support | 16 (15.1%) | 90 (84.9%) |
| Security & Protection | 90 (100.0%) | 0 (0.0%) |
| Firefighting & Prevention | 63 (100.0%) | 0 (0.0%) |
| Law Enforcement | 27 (100.0%) | 0 (0.0%) |
| Food Preparation & Serving | 57 (34.5%) | 108 (65.4%) |
| Cleaning & Maintenance | 144 (100.0%) | 0 (0.0%) |
| Personal Care & Service | 17 (23.3%) | 56 (76.7%) |
| Total (Category) | 324 (56.1%) | 254 (43.9%) |
| Total (Overall) | 1,794 (51.3%) | 1,706 (48.7%) |
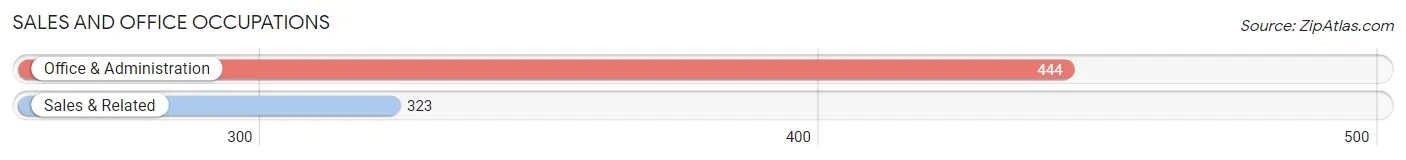
Sales and Office Occupations
The most common Sales and Office occupations in Red Lion borough are Office & Administration (444 | 12.7%), and Sales & Related (323 | 9.2%).
Sales and Office Occupations by Sex
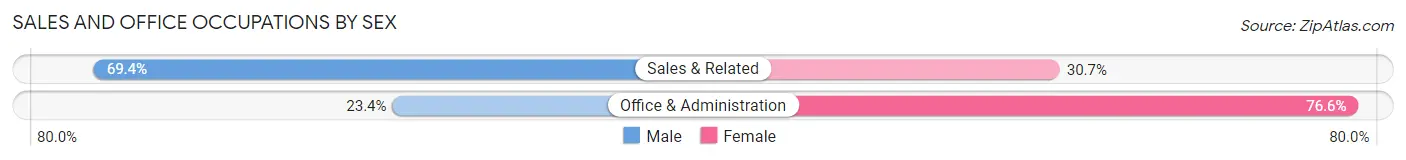
| Occupation | Male | Female |
| Sales & Related | 224 (69.4%) | 99 (30.6%) |
| Office & Administration | 104 (23.4%) | 340 (76.6%) |
| Total (Category) | 328 (42.8%) | 439 (57.2%) |
| Total (Overall) | 1,794 (51.3%) | 1,706 (48.7%) |
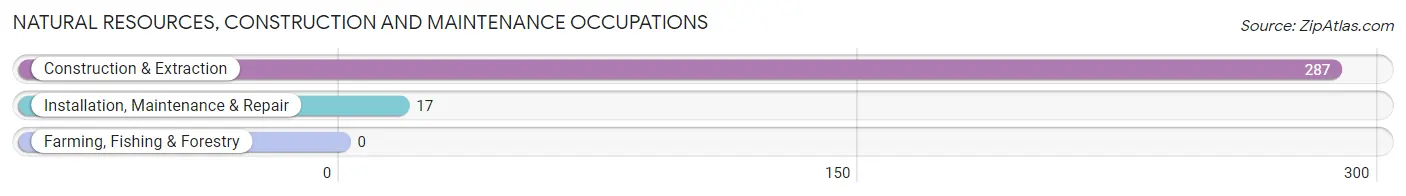
Natural Resources, Construction and Maintenance Occupations
The most common Natural Resources, Construction and Maintenance occupations in Red Lion borough are Construction & Extraction (287 | 8.2%), and Installation, Maintenance & Repair (17 | 0.5%).
Natural Resources, Construction and Maintenance Occupations by Sex
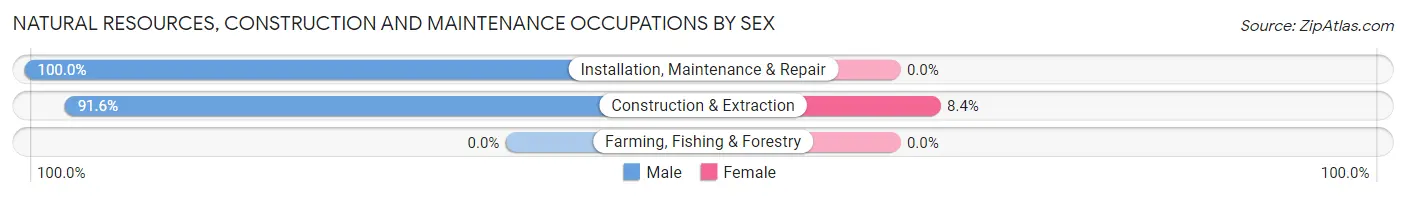
| Occupation | Male | Female |
| Farming, Fishing & Forestry | 0 (0.0%) | 0 (0.0%) |
| Construction & Extraction | 263 (91.6%) | 24 (8.4%) |
| Installation, Maintenance & Repair | 17 (100.0%) | 0 (0.0%) |
| Total (Category) | 280 (92.1%) | 24 (7.9%) |
| Total (Overall) | 1,794 (51.3%) | 1,706 (48.7%) |
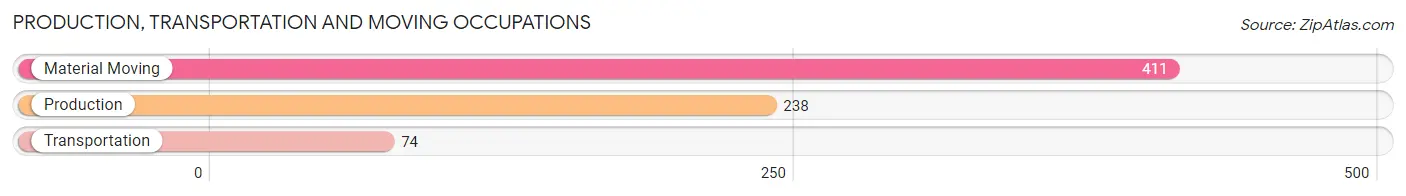
Production, Transportation and Moving Occupations
The most common Production, Transportation and Moving occupations in Red Lion borough are Material Moving (411 | 11.7%), Production (238 | 6.8%), and Transportation (74 | 2.1%).
Production, Transportation and Moving Occupations by Sex
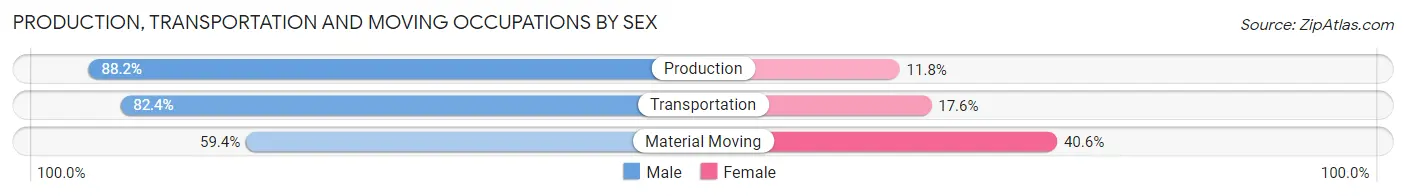
| Occupation | Male | Female |
| Production | 210 (88.2%) | 28 (11.8%) |
| Transportation | 61 (82.4%) | 13 (17.6%) |
| Material Moving | 244 (59.4%) | 167 (40.6%) |
| Total (Category) | 515 (71.2%) | 208 (28.8%) |
| Total (Overall) | 1,794 (51.3%) | 1,706 (48.7%) |
Employment Industries by Sex in Red Lion borough
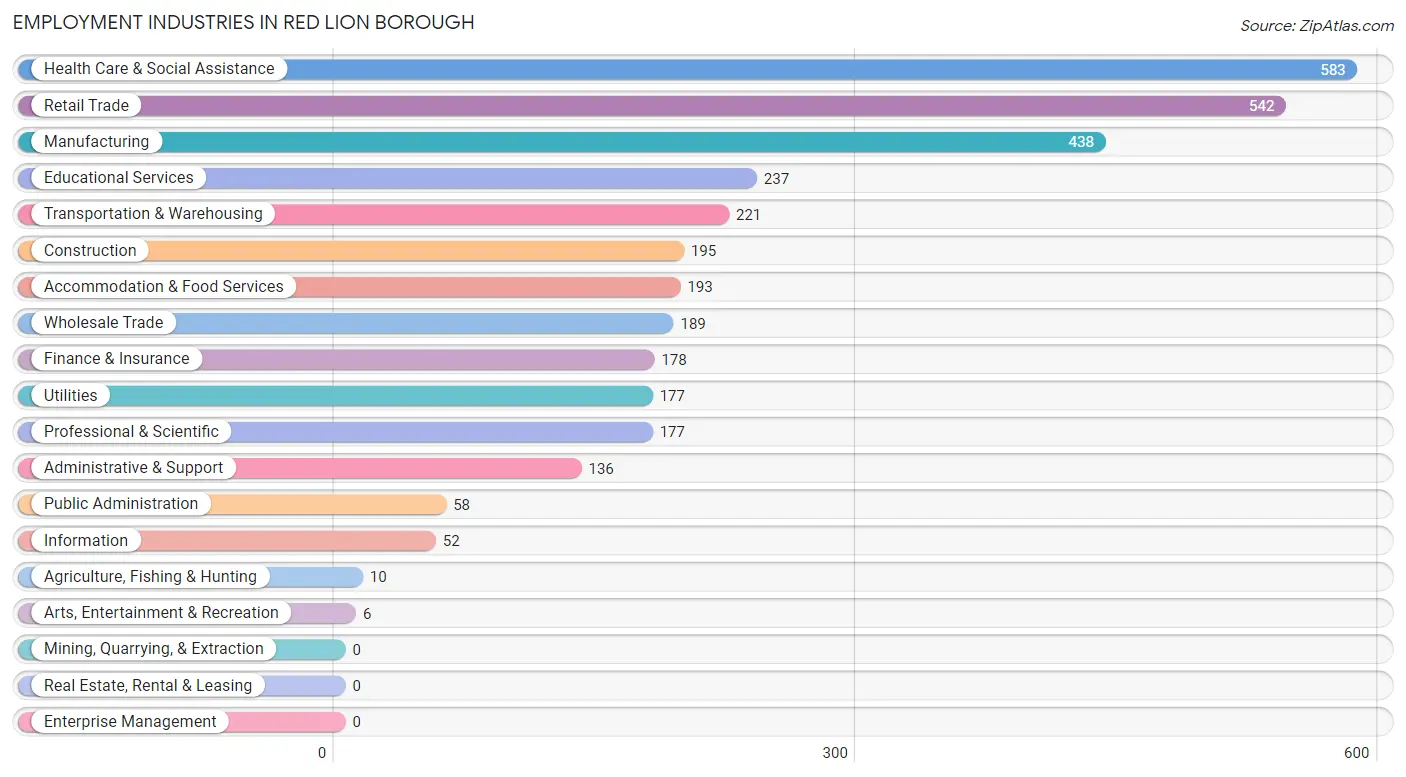
Employment Industries in Red Lion borough
The major employment industries in Red Lion borough include Health Care & Social Assistance (583 | 16.7%), Retail Trade (542 | 15.5%), Manufacturing (438 | 12.5%), Educational Services (237 | 6.8%), and Transportation & Warehousing (221 | 6.3%).
Employment Industries by Sex in Red Lion borough
The Red Lion borough industries that see more men than women are Agriculture, Fishing & Hunting (100.0%), Utilities (100.0%), and Information (100.0%), whereas the industries that tend to have a higher number of women are Arts, Entertainment & Recreation (100.0%), Educational Services (89.4%), and Health Care & Social Assistance (85.9%).
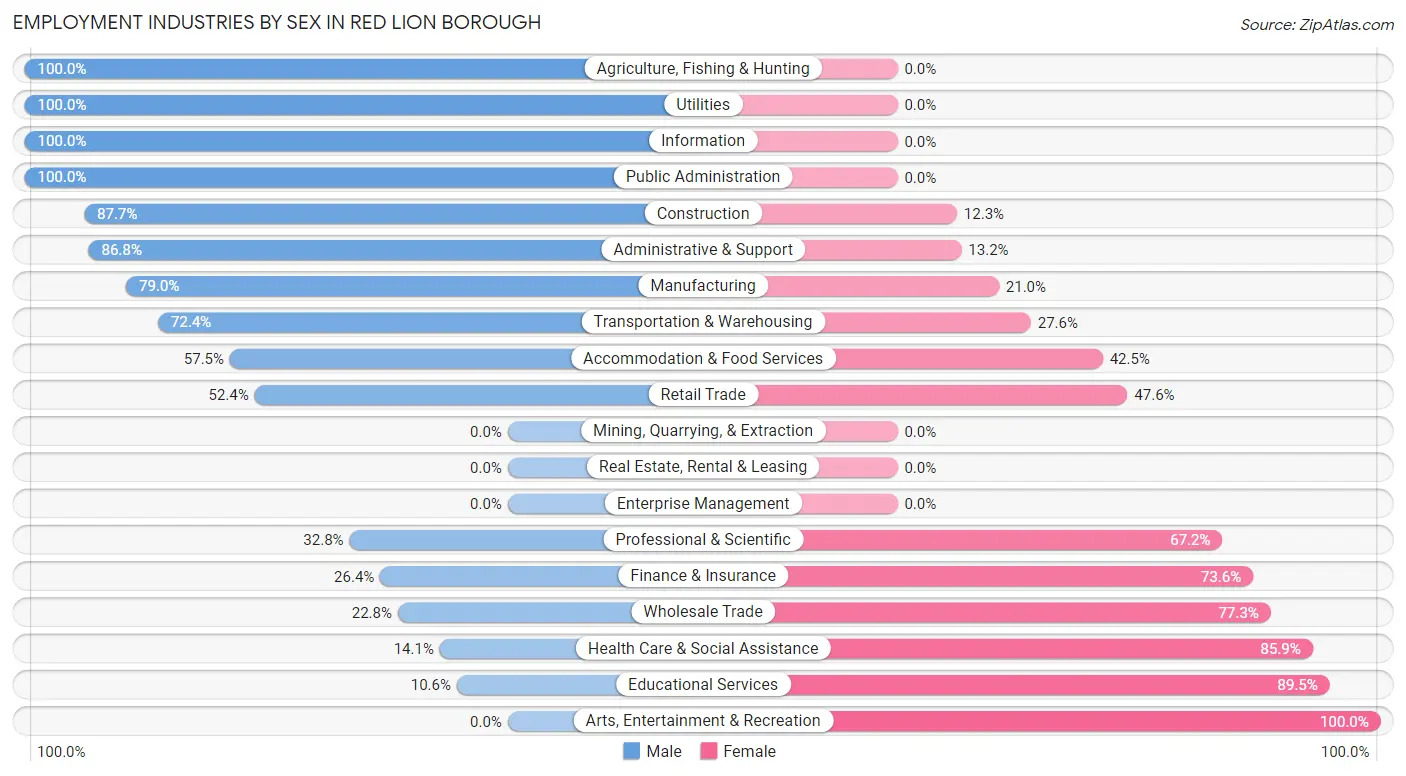
| Industry | Male | Female |
| Agriculture, Fishing & Hunting | 10 (100.0%) | 0 (0.0%) |
| Mining, Quarrying, & Extraction | 0 (0.0%) | 0 (0.0%) |
| Construction | 171 (87.7%) | 24 (12.3%) |
| Manufacturing | 346 (79.0%) | 92 (21.0%) |
| Wholesale Trade | 43 (22.8%) | 146 (77.2%) |
| Retail Trade | 284 (52.4%) | 258 (47.6%) |
| Transportation & Warehousing | 160 (72.4%) | 61 (27.6%) |
| Utilities | 177 (100.0%) | 0 (0.0%) |
| Information | 52 (100.0%) | 0 (0.0%) |
| Finance & Insurance | 47 (26.4%) | 131 (73.6%) |
| Real Estate, Rental & Leasing | 0 (0.0%) | 0 (0.0%) |
| Professional & Scientific | 58 (32.8%) | 119 (67.2%) |
| Enterprise Management | 0 (0.0%) | 0 (0.0%) |
| Administrative & Support | 118 (86.8%) | 18 (13.2%) |
| Educational Services | 25 (10.5%) | 212 (89.4%) |
| Health Care & Social Assistance | 82 (14.1%) | 501 (85.9%) |
| Arts, Entertainment & Recreation | 0 (0.0%) | 6 (100.0%) |
| Accommodation & Food Services | 111 (57.5%) | 82 (42.5%) |
| Public Administration | 58 (100.0%) | 0 (0.0%) |
| Total | 1,794 (51.3%) | 1,706 (48.7%) |
Education in Red Lion borough
School Enrollment in Red Lion borough
The most common levels of schooling among the 1,183 students in Red Lion borough are elementary school (380 | 32.1%), middle school (326 | 27.6%), and college / undergraduate (170 | 14.4%).
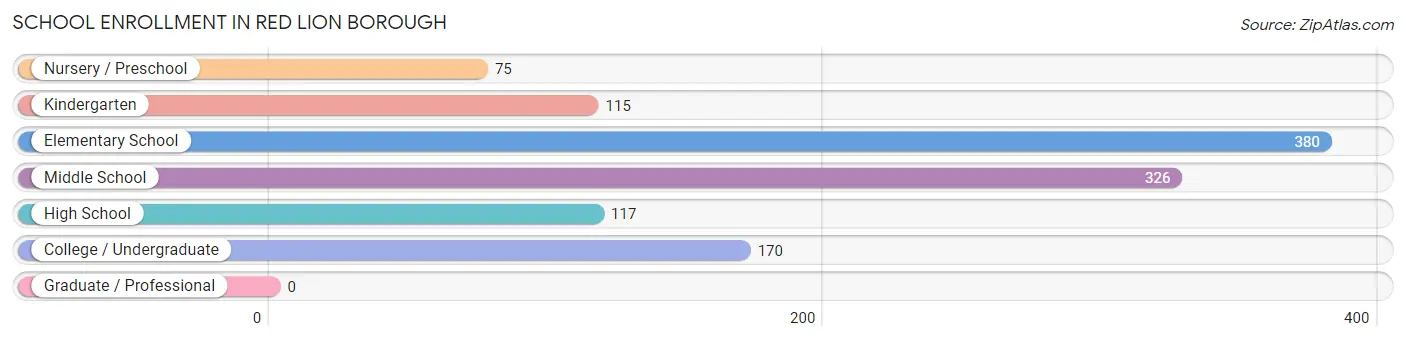
| School Level | # Students | % Students |
| Nursery / Preschool | 75 | 6.3% |
| Kindergarten | 115 | 9.7% |
| Elementary School | 380 | 32.1% |
| Middle School | 326 | 27.6% |
| High School | 117 | 9.9% |
| College / Undergraduate | 170 | 14.4% |
| Graduate / Professional | 0 | 0.0% |
| Total | 1,183 | 100.0% |
School Enrollment by Age by Funding Source in Red Lion borough
Out of a total of 1,183 students who are enrolled in schools in Red Lion borough, 209 (17.7%) attend a private institution, while the remaining 974 (82.3%) are enrolled in public schools. The age group of 18 to 19 year olds has the highest likelihood of being enrolled in private schools, with 82 (100.0% in the age bracket) enrolled. Conversely, the age group of 10 to 14 year olds has the lowest likelihood of being enrolled in a private school, with 398 (100.0% in the age bracket) attending a public institution.
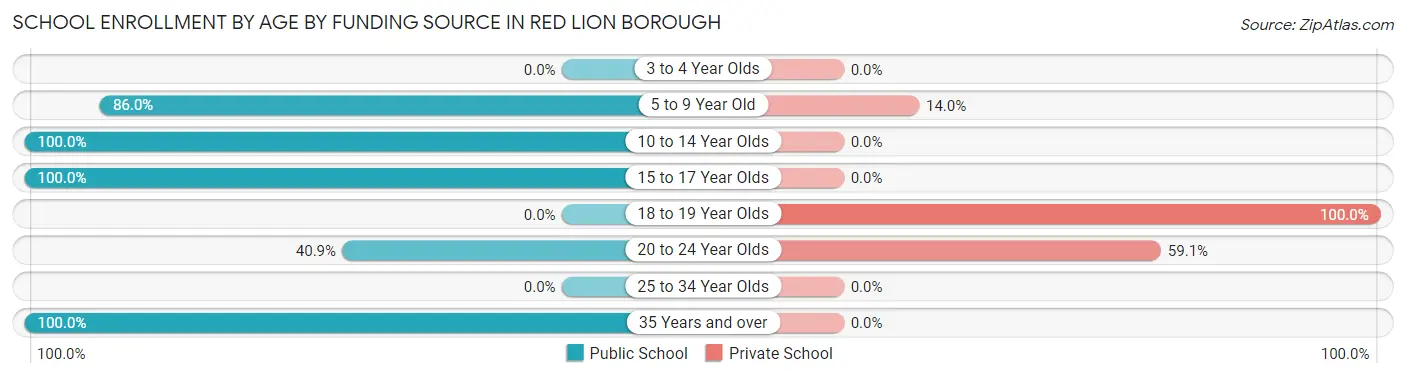
| Age Bracket | Public School | Private School |
| 3 to 4 Year Olds | 0 (0.0%) | 0 (0.0%) |
| 5 to 9 Year Old | 459 (86.0%) | 75 (14.0%) |
| 10 to 14 Year Olds | 398 (100.0%) | 0 (0.0%) |
| 15 to 17 Year Olds | 60 (100.0%) | 0 (0.0%) |
| 18 to 19 Year Olds | 0 (0.0%) | 82 (100.0%) |
| 20 to 24 Year Olds | 36 (40.9%) | 52 (59.1%) |
| 25 to 34 Year Olds | 0 (0.0%) | 0 (0.0%) |
| 35 Years and over | 21 (100.0%) | 0 (0.0%) |
| Total | 974 (82.3%) | 209 (17.7%) |
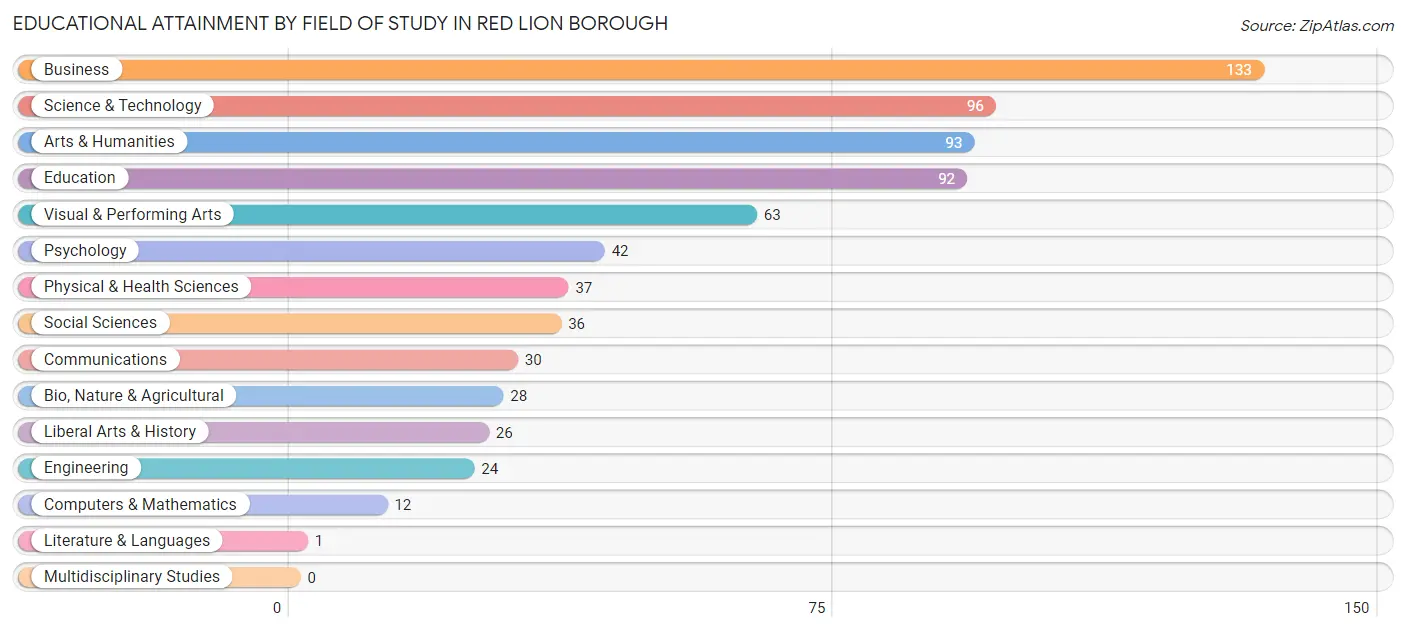
Educational Attainment by Field of Study in Red Lion borough
Business (133 | 18.6%), science & technology (96 | 13.5%), arts & humanities (93 | 13.0%), education (92 | 12.9%), and visual & performing arts (63 | 8.8%) are the most common fields of study among 713 individuals in Red Lion borough who have obtained a bachelor's degree or higher.
| Field of Study | # Graduates | % Graduates |
| Computers & Mathematics | 12 | 1.7% |
| Bio, Nature & Agricultural | 28 | 3.9% |
| Physical & Health Sciences | 37 | 5.2% |
| Psychology | 42 | 5.9% |
| Social Sciences | 36 | 5.1% |
| Engineering | 24 | 3.4% |
| Multidisciplinary Studies | 0 | 0.0% |
| Science & Technology | 96 | 13.5% |
| Business | 133 | 18.6% |
| Education | 92 | 12.9% |
| Literature & Languages | 1 | 0.1% |
| Liberal Arts & History | 26 | 3.6% |
| Visual & Performing Arts | 63 | 8.8% |
| Communications | 30 | 4.2% |
| Arts & Humanities | 93 | 13.0% |
| Total | 713 | 100.0% |
Transportation & Commute in Red Lion borough
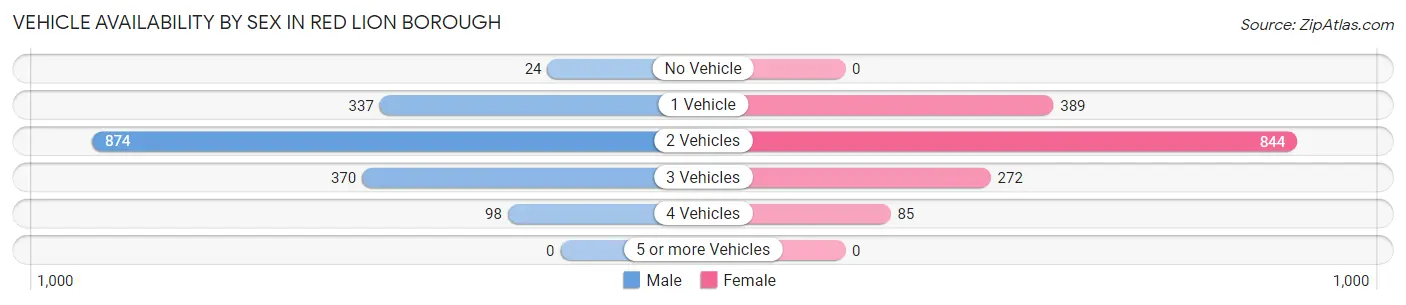
Vehicle Availability by Sex in Red Lion borough
The most prevalent vehicle ownership categories in Red Lion borough are males with 2 vehicles (874, accounting for 51.3%) and females with 2 vehicles (844, making up 55.0%).
| Vehicles Available | Male | Female |
| No Vehicle | 24 (1.4%) | 0 (0.0%) |
| 1 Vehicle | 337 (19.8%) | 389 (24.5%) |
| 2 Vehicles | 874 (51.3%) | 844 (53.1%) |
| 3 Vehicles | 370 (21.7%) | 272 (17.1%) |
| 4 Vehicles | 98 (5.8%) | 85 (5.3%) |
| 5 or more Vehicles | 0 (0.0%) | 0 (0.0%) |
| Total | 1,703 (100.0%) | 1,590 (100.0%) |
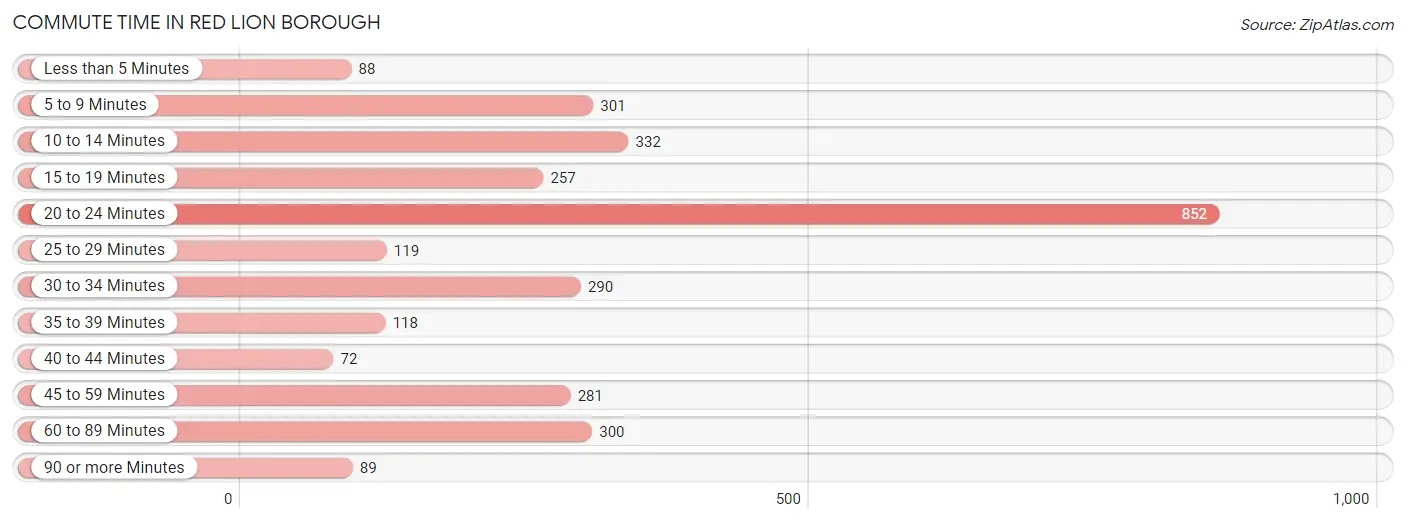
Commute Time in Red Lion borough
The most frequently occuring commute durations in Red Lion borough are 20 to 24 minutes (852 commuters, 27.5%), 10 to 14 minutes (332 commuters, 10.7%), and 5 to 9 minutes (301 commuters, 9.7%).
| Commute Time | # Commuters | % Commuters |
| Less than 5 Minutes | 88 | 2.8% |
| 5 to 9 Minutes | 301 | 9.7% |
| 10 to 14 Minutes | 332 | 10.7% |
| 15 to 19 Minutes | 257 | 8.3% |
| 20 to 24 Minutes | 852 | 27.5% |
| 25 to 29 Minutes | 119 | 3.8% |
| 30 to 34 Minutes | 290 | 9.4% |
| 35 to 39 Minutes | 118 | 3.8% |
| 40 to 44 Minutes | 72 | 2.3% |
| 45 to 59 Minutes | 281 | 9.1% |
| 60 to 89 Minutes | 300 | 9.7% |
| 90 or more Minutes | 89 | 2.9% |
Commute Time by Sex in Red Lion borough
The most common commute times in Red Lion borough are 20 to 24 minutes (533 commuters, 32.2%) for males and 20 to 24 minutes (319 commuters, 22.1%) for females.
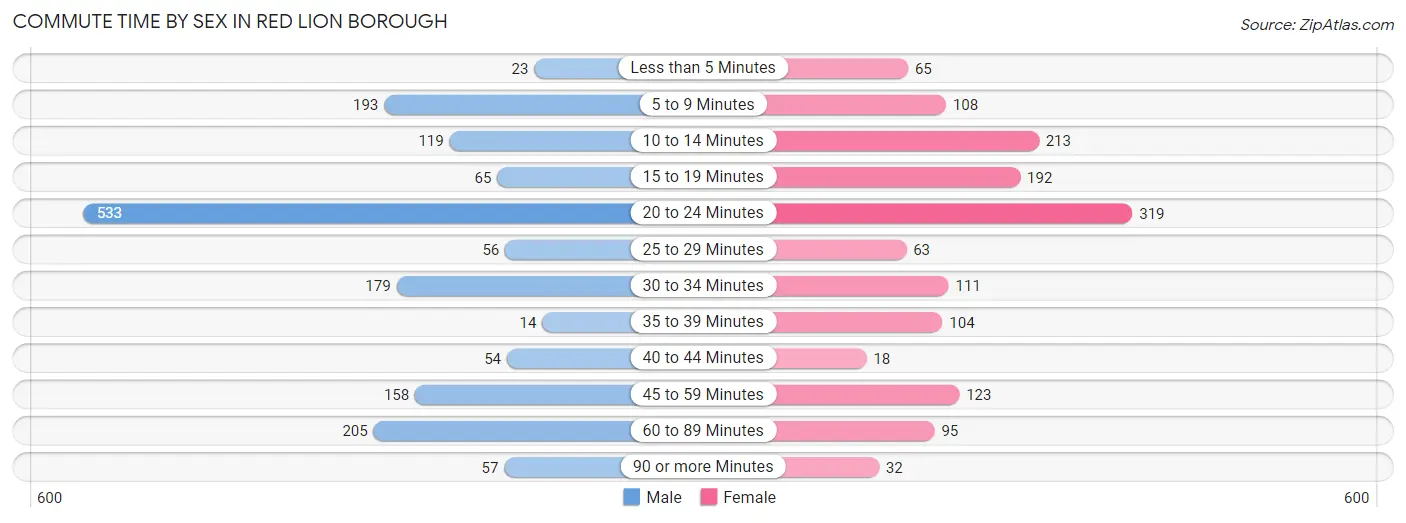
| Commute Time | Male | Female |
| Less than 5 Minutes | 23 (1.4%) | 65 (4.5%) |
| 5 to 9 Minutes | 193 (11.7%) | 108 (7.5%) |
| 10 to 14 Minutes | 119 (7.2%) | 213 (14.8%) |
| 15 to 19 Minutes | 65 (3.9%) | 192 (13.3%) |
| 20 to 24 Minutes | 533 (32.2%) | 319 (22.1%) |
| 25 to 29 Minutes | 56 (3.4%) | 63 (4.4%) |
| 30 to 34 Minutes | 179 (10.8%) | 111 (7.7%) |
| 35 to 39 Minutes | 14 (0.9%) | 104 (7.2%) |
| 40 to 44 Minutes | 54 (3.3%) | 18 (1.3%) |
| 45 to 59 Minutes | 158 (9.5%) | 123 (8.5%) |
| 60 to 89 Minutes | 205 (12.4%) | 95 (6.6%) |
| 90 or more Minutes | 57 (3.4%) | 32 (2.2%) |
Time of Departure to Work by Sex in Red Lion borough
The most frequent times of departure to work in Red Lion borough are 6:00 AM to 6:29 AM (302, 18.2%) for males and 7:30 AM to 7:59 AM (286, 19.8%) for females.
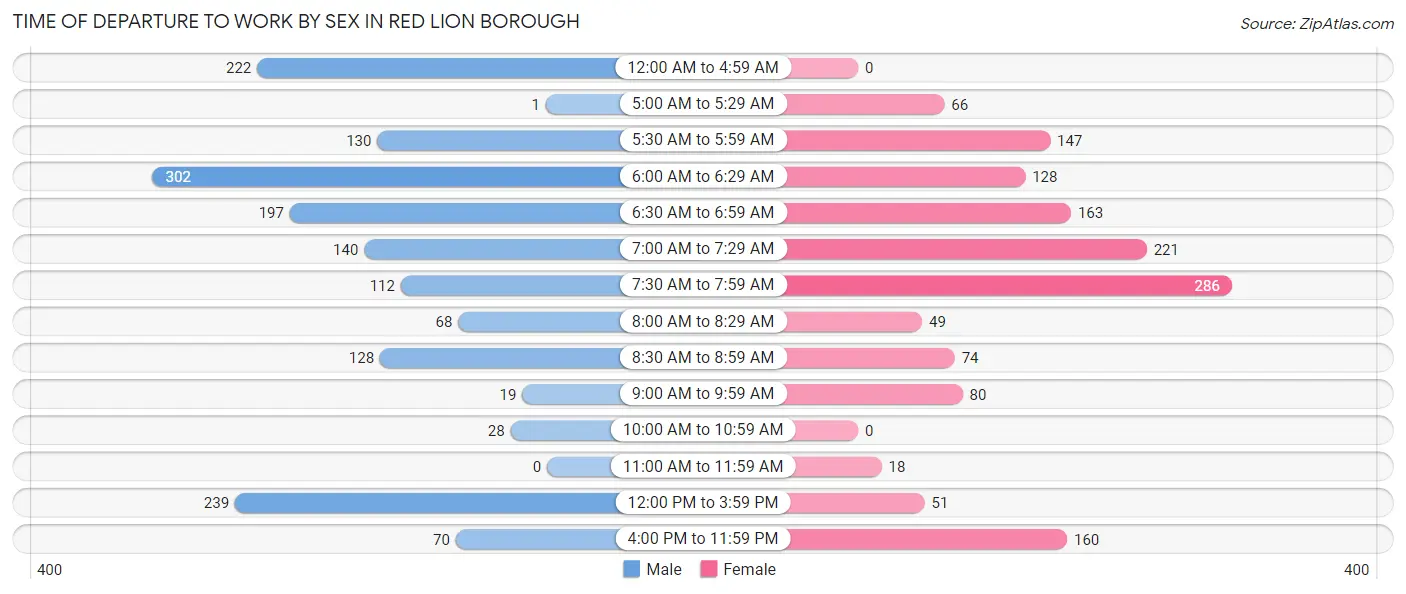
| Time of Departure | Male | Female |
| 12:00 AM to 4:59 AM | 222 (13.4%) | 0 (0.0%) |
| 5:00 AM to 5:29 AM | 1 (0.1%) | 66 (4.6%) |
| 5:30 AM to 5:59 AM | 130 (7.9%) | 147 (10.2%) |
| 6:00 AM to 6:29 AM | 302 (18.2%) | 128 (8.9%) |
| 6:30 AM to 6:59 AM | 197 (11.9%) | 163 (11.3%) |
| 7:00 AM to 7:29 AM | 140 (8.5%) | 221 (15.3%) |
| 7:30 AM to 7:59 AM | 112 (6.8%) | 286 (19.8%) |
| 8:00 AM to 8:29 AM | 68 (4.1%) | 49 (3.4%) |
| 8:30 AM to 8:59 AM | 128 (7.7%) | 74 (5.1%) |
| 9:00 AM to 9:59 AM | 19 (1.1%) | 80 (5.5%) |
| 10:00 AM to 10:59 AM | 28 (1.7%) | 0 (0.0%) |
| 11:00 AM to 11:59 AM | 0 (0.0%) | 18 (1.3%) |
| 12:00 PM to 3:59 PM | 239 (14.4%) | 51 (3.5%) |
| 4:00 PM to 11:59 PM | 70 (4.2%) | 160 (11.1%) |
| Total | 1,656 (100.0%) | 1,443 (100.0%) |
Housing Occupancy in Red Lion borough
Occupancy by Ownership in Red Lion borough
Of the total 2,745 dwellings in Red Lion borough, owner-occupied units account for 1,528 (55.7%), while renter-occupied units make up 1,217 (44.3%).
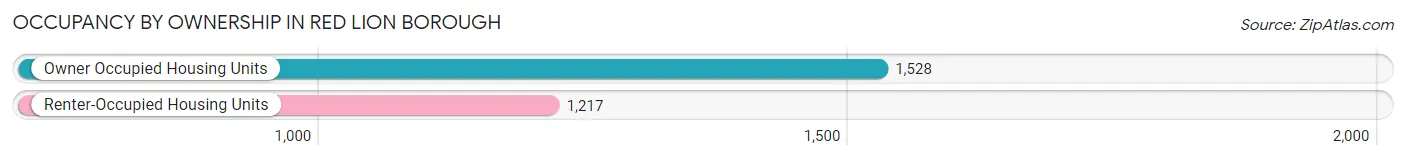
| Occupancy | # Housing Units | % Housing Units |
| Owner Occupied Housing Units | 1,528 | 55.7% |
| Renter-Occupied Housing Units | 1,217 | 44.3% |
| Total Occupied Housing Units | 2,745 | 100.0% |
Occupancy by Household Size in Red Lion borough
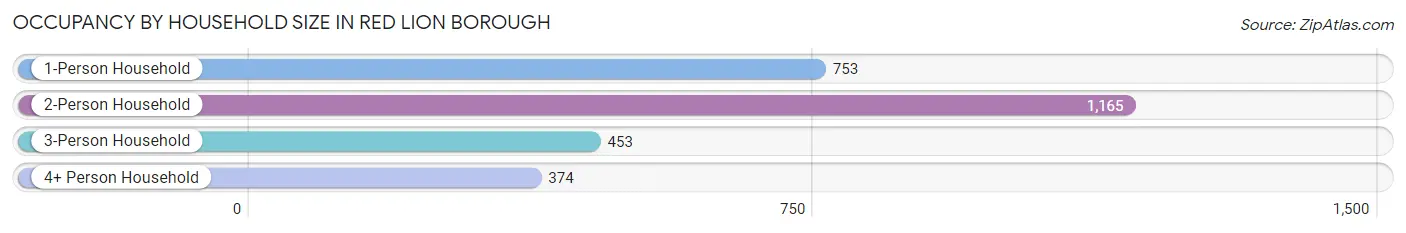
| Household Size | # Housing Units | % Housing Units |
| 1-Person Household | 753 | 27.4% |
| 2-Person Household | 1,165 | 42.4% |
| 3-Person Household | 453 | 16.5% |
| 4+ Person Household | 374 | 13.6% |
| Total Housing Units | 2,745 | 100.0% |
Occupancy by Ownership by Household Size in Red Lion borough
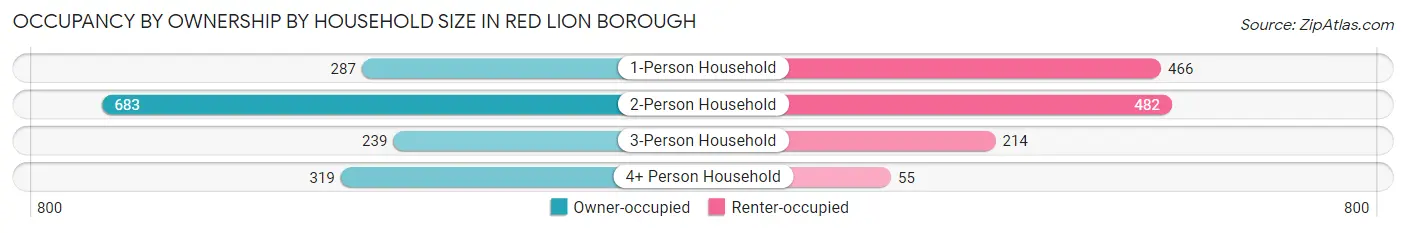
| Household Size | Owner-occupied | Renter-occupied |
| 1-Person Household | 287 (38.1%) | 466 (61.9%) |
| 2-Person Household | 683 (58.6%) | 482 (41.4%) |
| 3-Person Household | 239 (52.8%) | 214 (47.2%) |
| 4+ Person Household | 319 (85.3%) | 55 (14.7%) |
| Total Housing Units | 1,528 (55.7%) | 1,217 (44.3%) |
Occupancy by Educational Attainment in Red Lion borough
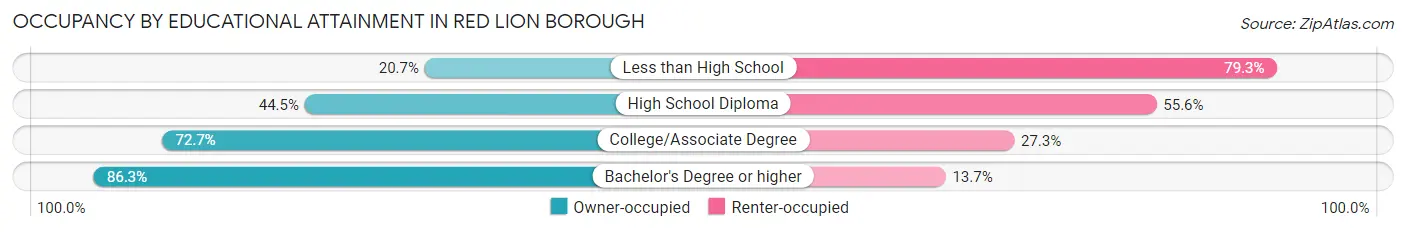
| Household Size | Owner-occupied | Renter-occupied |
| Less than High School | 75 (20.7%) | 288 (79.3%) |
| High School Diploma | 533 (44.5%) | 666 (55.5%) |
| College/Associate Degree | 537 (72.7%) | 202 (27.3%) |
| Bachelor's Degree or higher | 383 (86.3%) | 61 (13.7%) |
Occupancy by Age of Householder in Red Lion borough
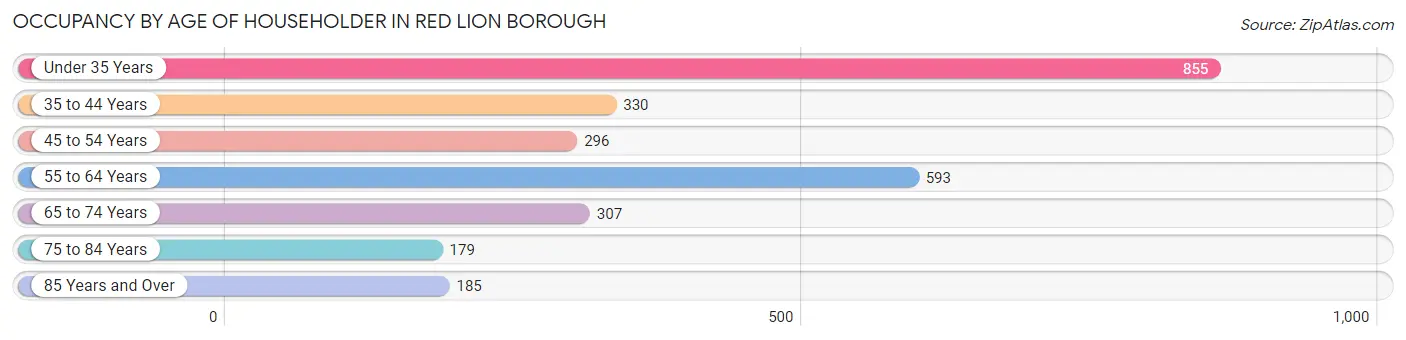
| Age Bracket | # Households | % Households |
| Under 35 Years | 855 | 31.1% |
| 35 to 44 Years | 330 | 12.0% |
| 45 to 54 Years | 296 | 10.8% |
| 55 to 64 Years | 593 | 21.6% |
| 65 to 74 Years | 307 | 11.2% |
| 75 to 84 Years | 179 | 6.5% |
| 85 Years and Over | 185 | 6.7% |
| Total | 2,745 | 100.0% |
Housing Finances in Red Lion borough
Median Income by Occupancy in Red Lion borough
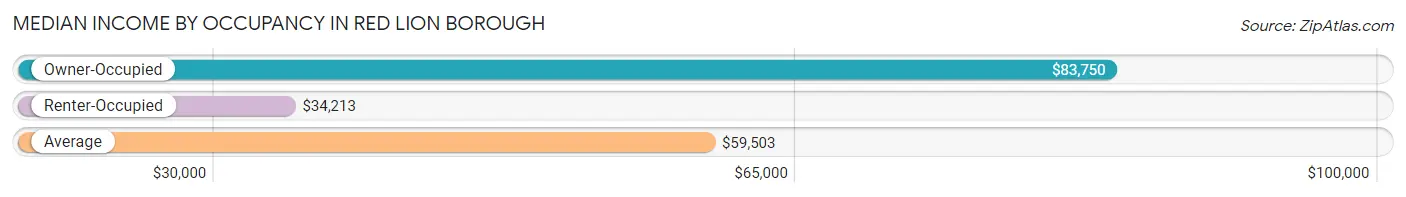
| Occupancy Type | # Households | Median Income |
| Owner-Occupied | 1,528 (55.7%) | $83,750 |
| Renter-Occupied | 1,217 (44.3%) | $34,213 |
| Average | 2,745 (100.0%) | $59,503 |
Occupancy by Householder Income Bracket in Red Lion borough
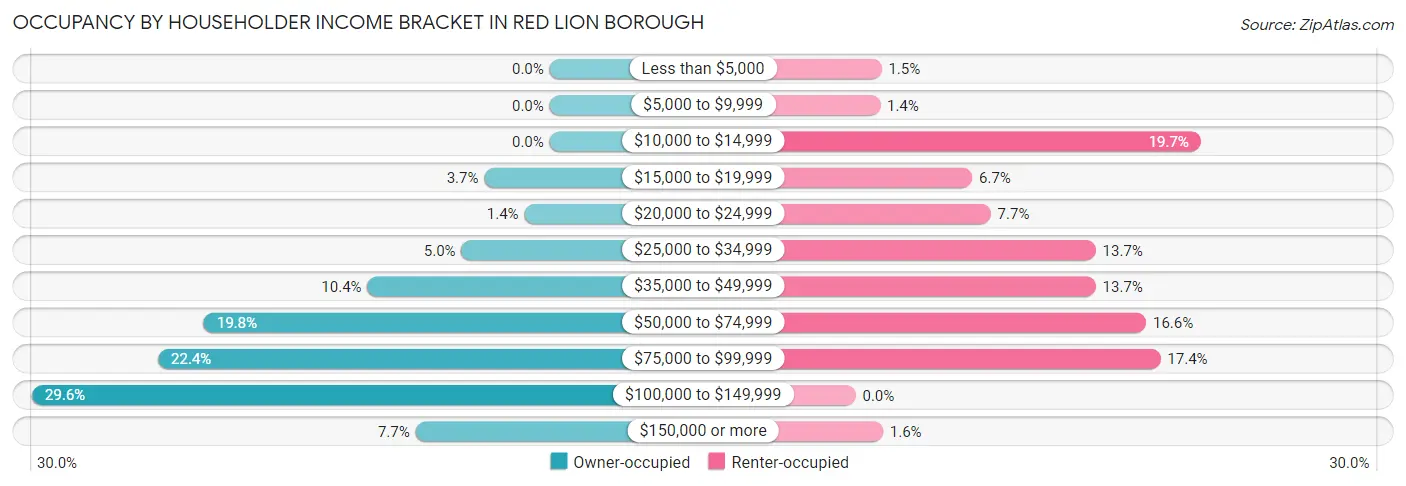
| Income Bracket | Owner-occupied | Renter-occupied |
| Less than $5,000 | 0 (0.0%) | 18 (1.5%) |
| $5,000 to $9,999 | 0 (0.0%) | 17 (1.4%) |
| $10,000 to $14,999 | 0 (0.0%) | 240 (19.7%) |
| $15,000 to $19,999 | 57 (3.7%) | 81 (6.7%) |
| $20,000 to $24,999 | 22 (1.4%) | 94 (7.7%) |
| $25,000 to $34,999 | 77 (5.0%) | 167 (13.7%) |
| $35,000 to $49,999 | 159 (10.4%) | 167 (13.7%) |
| $50,000 to $74,999 | 302 (19.8%) | 202 (16.6%) |
| $75,000 to $99,999 | 342 (22.4%) | 212 (17.4%) |
| $100,000 to $149,999 | 452 (29.6%) | 0 (0.0%) |
| $150,000 or more | 117 (7.7%) | 19 (1.6%) |
| Total | 1,528 (100.0%) | 1,217 (100.0%) |
Monthly Housing Cost Tiers in Red Lion borough
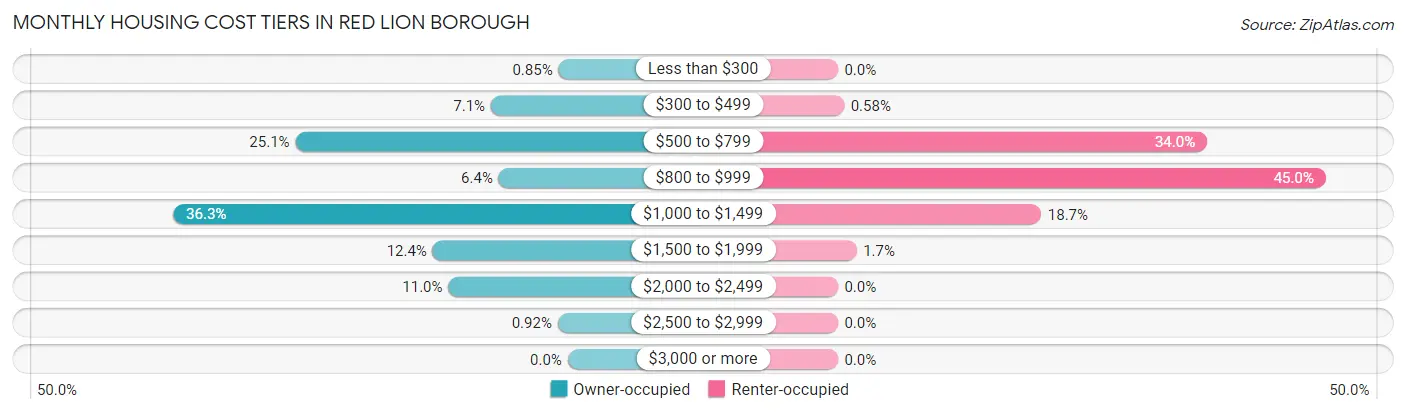
| Monthly Cost | Owner-occupied | Renter-occupied |
| Less than $300 | 13 (0.9%) | 0 (0.0%) |
| $300 to $499 | 108 (7.1%) | 7 (0.6%) |
| $500 to $799 | 383 (25.1%) | 414 (34.0%) |
| $800 to $999 | 97 (6.4%) | 547 (45.0%) |
| $1,000 to $1,499 | 555 (36.3%) | 228 (18.7%) |
| $1,500 to $1,999 | 190 (12.4%) | 21 (1.7%) |
| $2,000 to $2,499 | 168 (11.0%) | 0 (0.0%) |
| $2,500 to $2,999 | 14 (0.9%) | 0 (0.0%) |
| $3,000 or more | 0 (0.0%) | 0 (0.0%) |
| Total | 1,528 (100.0%) | 1,217 (100.0%) |
Physical Housing Characteristics in Red Lion borough
Housing Structures in Red Lion borough
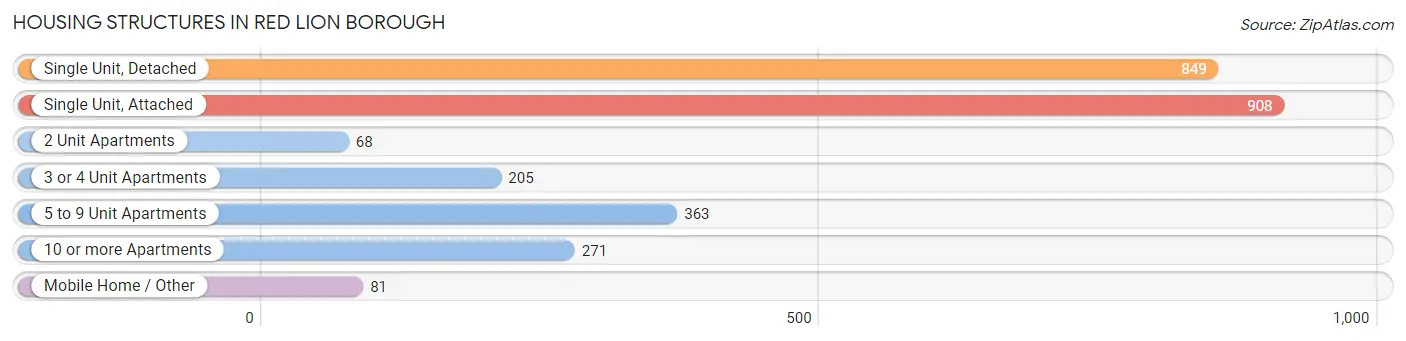
| Structure Type | # Housing Units | % Housing Units |
| Single Unit, Detached | 849 | 30.9% |
| Single Unit, Attached | 908 | 33.1% |
| 2 Unit Apartments | 68 | 2.5% |
| 3 or 4 Unit Apartments | 205 | 7.5% |
| 5 to 9 Unit Apartments | 363 | 13.2% |
| 10 or more Apartments | 271 | 9.9% |
| Mobile Home / Other | 81 | 2.9% |
| Total | 2,745 | 100.0% |
Housing Structures by Occupancy in Red Lion borough
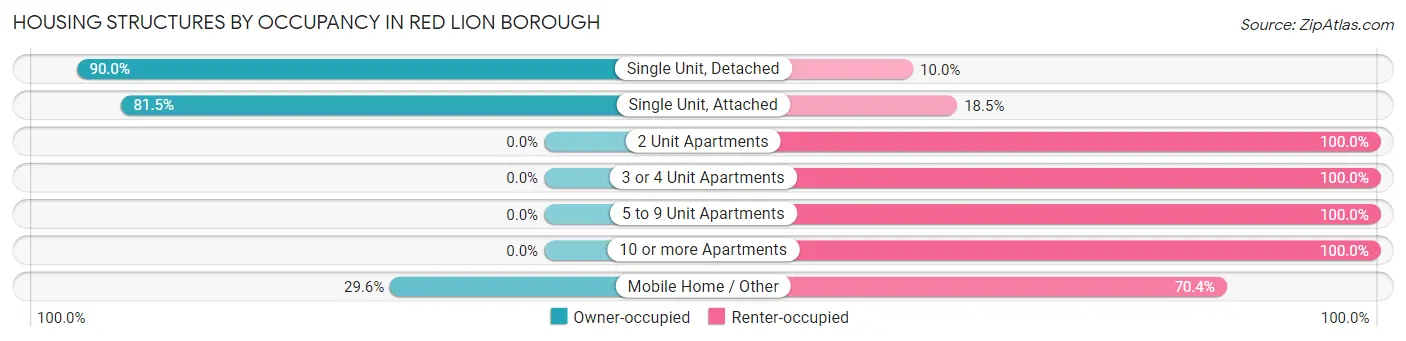
| Structure Type | Owner-occupied | Renter-occupied |
| Single Unit, Detached | 764 (90.0%) | 85 (10.0%) |
| Single Unit, Attached | 740 (81.5%) | 168 (18.5%) |
| 2 Unit Apartments | 0 (0.0%) | 68 (100.0%) |
| 3 or 4 Unit Apartments | 0 (0.0%) | 205 (100.0%) |
| 5 to 9 Unit Apartments | 0 (0.0%) | 363 (100.0%) |
| 10 or more Apartments | 0 (0.0%) | 271 (100.0%) |
| Mobile Home / Other | 24 (29.6%) | 57 (70.4%) |
| Total | 1,528 (55.7%) | 1,217 (44.3%) |
Housing Structures by Number of Rooms in Red Lion borough
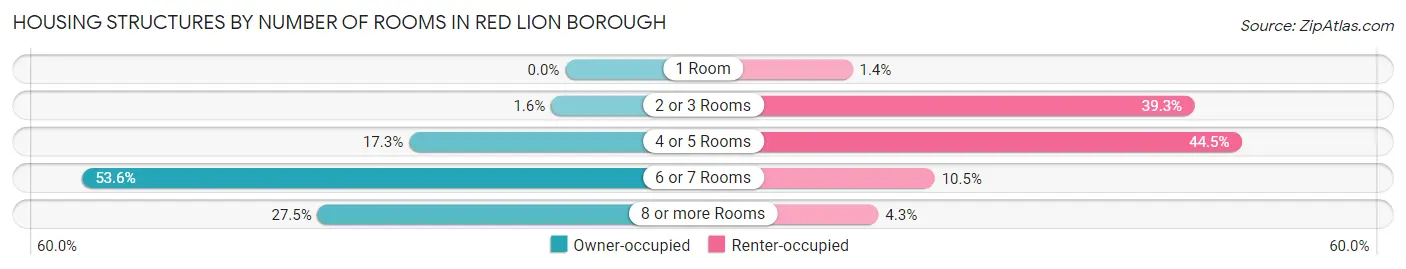
| Number of Rooms | Owner-occupied | Renter-occupied |
| 1 Room | 0 (0.0%) | 17 (1.4%) |
| 2 or 3 Rooms | 24 (1.6%) | 478 (39.3%) |
| 4 or 5 Rooms | 265 (17.3%) | 542 (44.5%) |
| 6 or 7 Rooms | 819 (53.6%) | 128 (10.5%) |
| 8 or more Rooms | 420 (27.5%) | 52 (4.3%) |
| Total | 1,528 (100.0%) | 1,217 (100.0%) |
Housing Structure by Heating Type in Red Lion borough
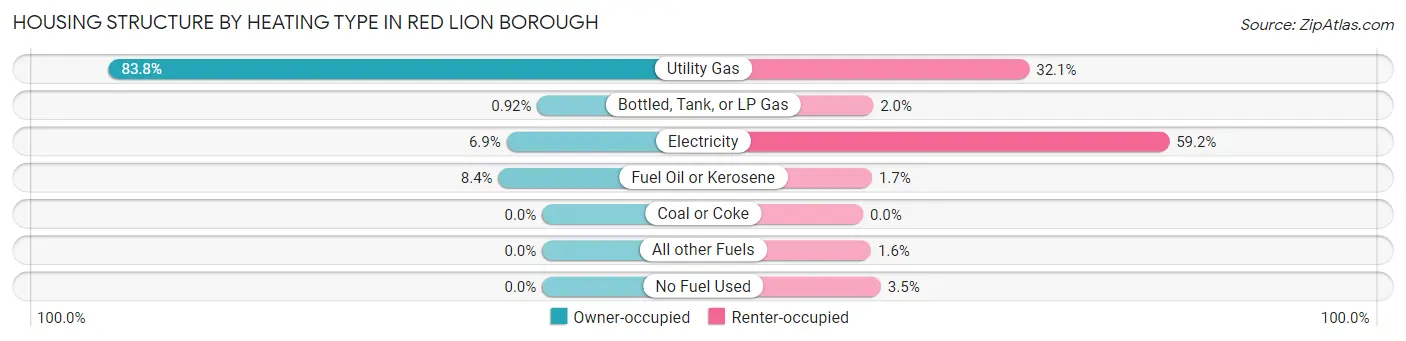
| Heating Type | Owner-occupied | Renter-occupied |
| Utility Gas | 1,280 (83.8%) | 391 (32.1%) |
| Bottled, Tank, or LP Gas | 14 (0.9%) | 24 (2.0%) |
| Electricity | 105 (6.9%) | 720 (59.2%) |
| Fuel Oil or Kerosene | 129 (8.4%) | 21 (1.7%) |
| Coal or Coke | 0 (0.0%) | 0 (0.0%) |
| All other Fuels | 0 (0.0%) | 19 (1.6%) |
| No Fuel Used | 0 (0.0%) | 42 (3.5%) |
| Total | 1,528 (100.0%) | 1,217 (100.0%) |
Household Vehicle Usage in Red Lion borough
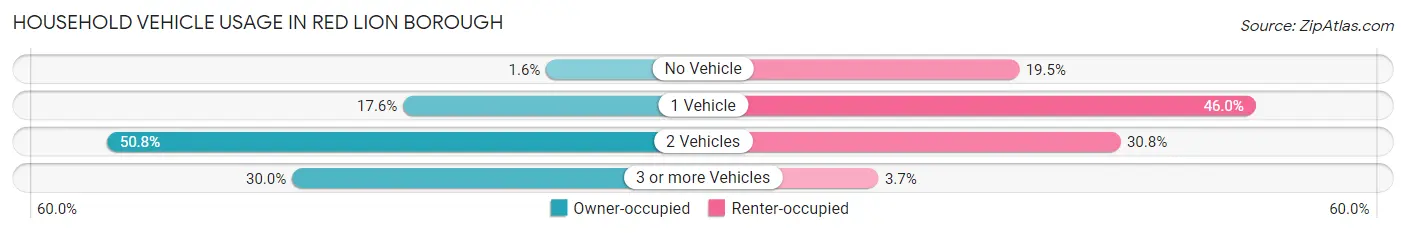
| Vehicles per Household | Owner-occupied | Renter-occupied |
| No Vehicle | 24 (1.6%) | 237 (19.5%) |
| 1 Vehicle | 269 (17.6%) | 560 (46.0%) |
| 2 Vehicles | 776 (50.8%) | 375 (30.8%) |
| 3 or more Vehicles | 459 (30.0%) | 45 (3.7%) |
| Total | 1,528 (100.0%) | 1,217 (100.0%) |
Real Estate & Mortgages in Red Lion borough
Real Estate and Mortgage Overview in Red Lion borough
| Characteristic | Without Mortgage | With Mortgage |
| Housing Units | 560 | 968 |
| Median Property Value | $177,200 | $151,200 |
| Median Household Income | $59,118 | $60 |
| Monthly Housing Costs | $590 | $0 |
| Real Estate Taxes | $2,789 | $0 |
Property Value by Mortgage Status in Red Lion borough
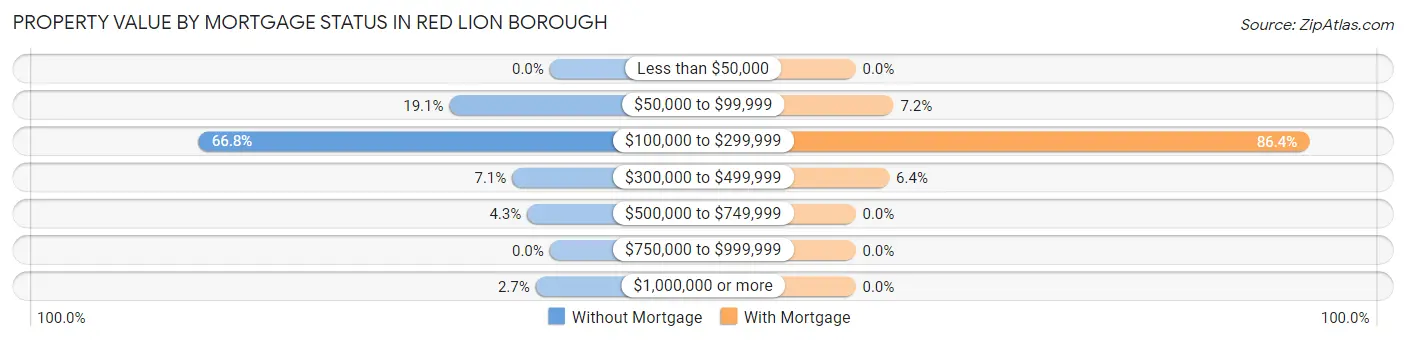
| Property Value | Without Mortgage | With Mortgage |
| Less than $50,000 | 0 (0.0%) | 0 (0.0%) |
| $50,000 to $99,999 | 107 (19.1%) | 70 (7.2%) |
| $100,000 to $299,999 | 374 (66.8%) | 836 (86.4%) |
| $300,000 to $499,999 | 40 (7.1%) | 62 (6.4%) |
| $500,000 to $749,999 | 24 (4.3%) | 0 (0.0%) |
| $750,000 to $999,999 | 0 (0.0%) | 0 (0.0%) |
| $1,000,000 or more | 15 (2.7%) | 0 (0.0%) |
| Total | 560 (100.0%) | 968 (100.0%) |
Household Income by Mortgage Status in Red Lion borough
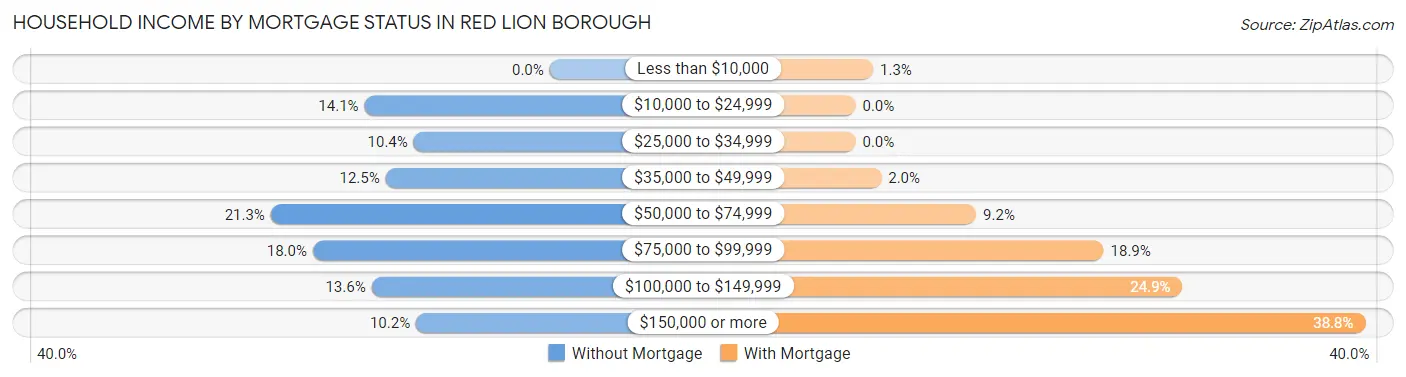
| Household Income | Without Mortgage | With Mortgage |
| Less than $10,000 | 0 (0.0%) | 13 (1.3%) |
| $10,000 to $24,999 | 79 (14.1%) | 0 (0.0%) |
| $25,000 to $34,999 | 58 (10.4%) | 0 (0.0%) |
| $35,000 to $49,999 | 70 (12.5%) | 19 (2.0%) |
| $50,000 to $74,999 | 119 (21.2%) | 89 (9.2%) |
| $75,000 to $99,999 | 101 (18.0%) | 183 (18.9%) |
| $100,000 to $149,999 | 76 (13.6%) | 241 (24.9%) |
| $150,000 or more | 57 (10.2%) | 376 (38.8%) |
| Total | 560 (100.0%) | 968 (100.0%) |
Property Value to Household Income Ratio in Red Lion borough
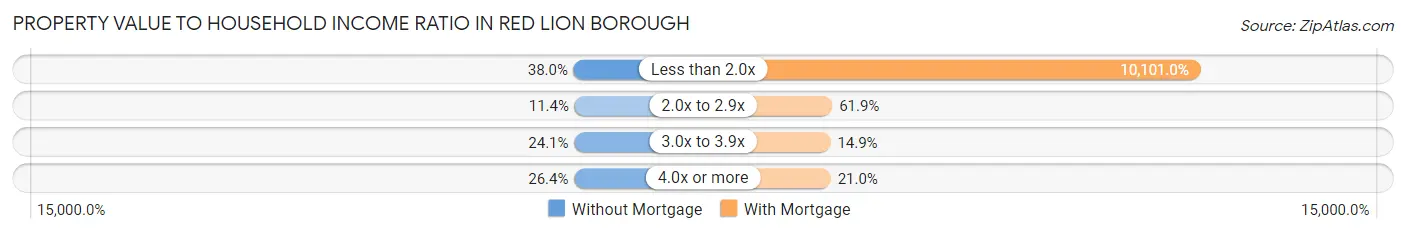
| Value-to-Income Ratio | Without Mortgage | With Mortgage |
| Less than 2.0x | 213 (38.0%) | 97,778 (10,101.0%) |
| 2.0x to 2.9x | 64 (11.4%) | 599 (61.9%) |
| 3.0x to 3.9x | 135 (24.1%) | 144 (14.9%) |
| 4.0x or more | 148 (26.4%) | 203 (21.0%) |
| Total | 560 (100.0%) | 968 (100.0%) |
Real Estate Taxes by Mortgage Status in Red Lion borough
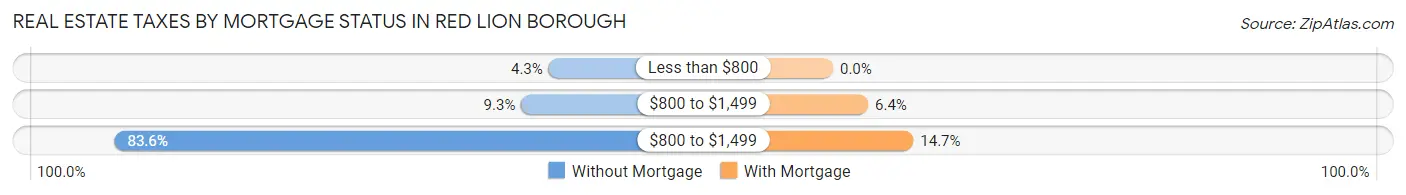
| Property Taxes | Without Mortgage | With Mortgage |
| Less than $800 | 24 (4.3%) | 0 (0.0%) |
| $800 to $1,499 | 52 (9.3%) | 62 (6.4%) |
| $800 to $1,499 | 468 (83.6%) | 142 (14.7%) |
| Total | 560 (100.0%) | 968 (100.0%) |
Health & Disability in Red Lion borough
Health Insurance Coverage by Age in Red Lion borough
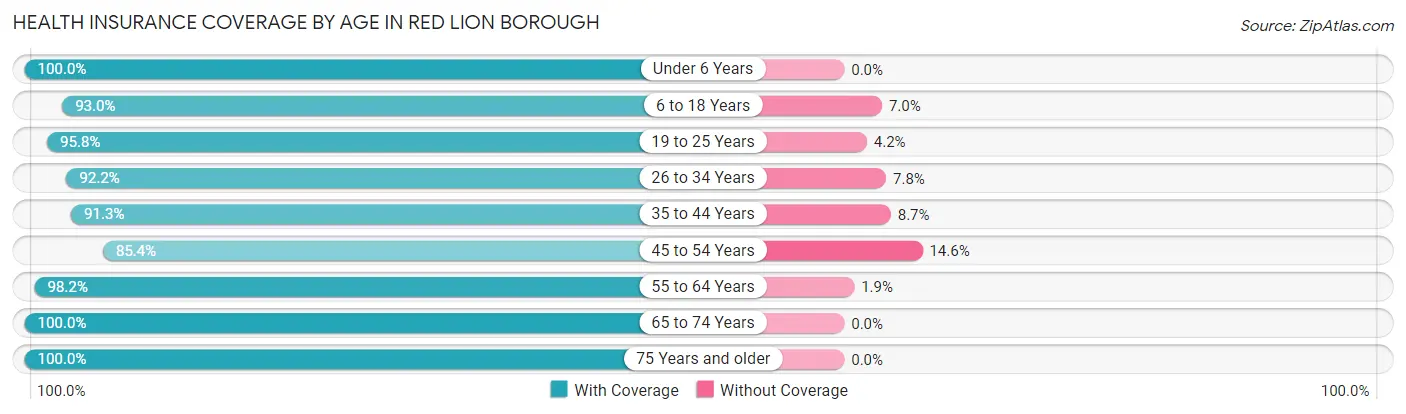
| Age Bracket | With Coverage | Without Coverage |
| Under 6 Years | 426 (100.0%) | 0 (0.0%) |
| 6 to 18 Years | 887 (93.0%) | 67 (7.0%) |
| 19 to 25 Years | 432 (95.8%) | 19 (4.2%) |
| 26 to 34 Years | 1,218 (92.2%) | 103 (7.8%) |
| 35 to 44 Years | 780 (91.3%) | 74 (8.7%) |
| 45 to 54 Years | 410 (85.4%) | 70 (14.6%) |
| 55 to 64 Years | 1,008 (98.2%) | 19 (1.8%) |
| 65 to 74 Years | 469 (100.0%) | 0 (0.0%) |
| 75 Years and older | 489 (100.0%) | 0 (0.0%) |
| Total | 6,119 (94.6%) | 352 (5.4%) |
Health Insurance Coverage by Citizenship Status in Red Lion borough
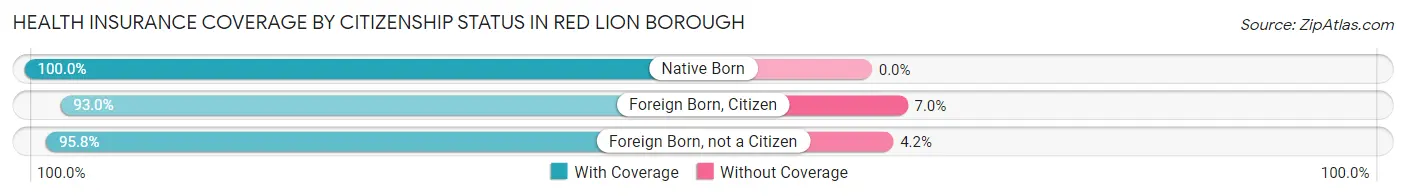
| Citizenship Status | With Coverage | Without Coverage |
| Native Born | 426 (100.0%) | 0 (0.0%) |
| Foreign Born, Citizen | 887 (93.0%) | 67 (7.0%) |
| Foreign Born, not a Citizen | 432 (95.8%) | 19 (4.2%) |
Health Insurance Coverage by Household Income in Red Lion borough
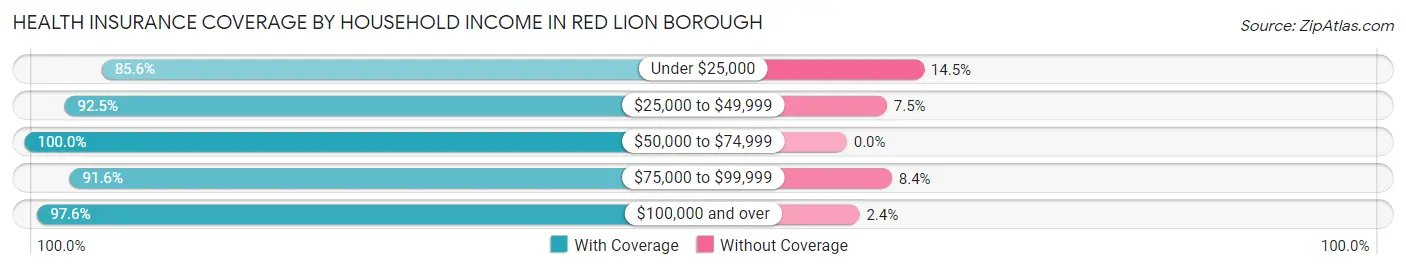
| Household Income | With Coverage | Without Coverage |
| Under $25,000 | 657 (85.6%) | 111 (14.4%) |
| $25,000 to $49,999 | 937 (92.5%) | 76 (7.5%) |
| $50,000 to $74,999 | 1,219 (100.0%) | 0 (0.0%) |
| $75,000 to $99,999 | 1,248 (91.6%) | 115 (8.4%) |
| $100,000 and over | 2,053 (97.6%) | 50 (2.4%) |
Public vs Private Health Insurance Coverage by Age in Red Lion borough
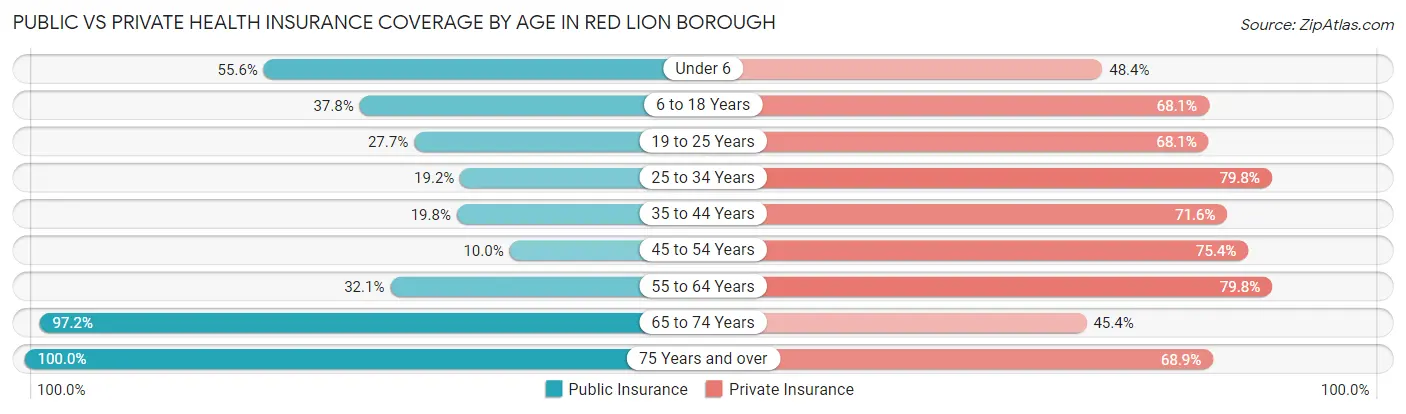
| Age Bracket | Public Insurance | Private Insurance |
| Under 6 | 237 (55.6%) | 206 (48.4%) |
| 6 to 18 Years | 361 (37.8%) | 650 (68.1%) |
| 19 to 25 Years | 125 (27.7%) | 307 (68.1%) |
| 25 to 34 Years | 253 (19.2%) | 1,054 (79.8%) |
| 35 to 44 Years | 169 (19.8%) | 611 (71.6%) |
| 45 to 54 Years | 48 (10.0%) | 362 (75.4%) |
| 55 to 64 Years | 330 (32.1%) | 820 (79.8%) |
| 65 to 74 Years | 456 (97.2%) | 213 (45.4%) |
| 75 Years and over | 489 (100.0%) | 337 (68.9%) |
| Total | 2,468 (38.1%) | 4,560 (70.5%) |
Disability Status by Sex by Age in Red Lion borough
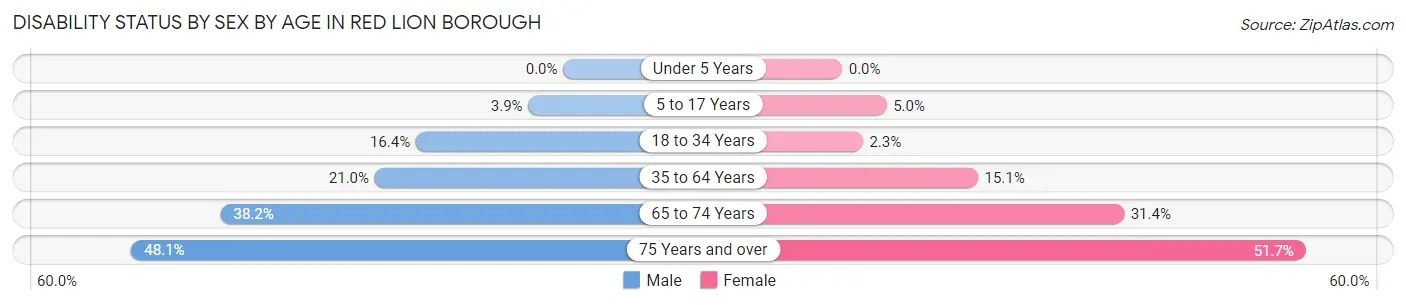
| Age Bracket | Male | Female |
| Under 5 Years | 0 (0.0%) | 0 (0.0%) |
| 5 to 17 Years | 23 (3.9%) | 22 (5.0%) |
| 18 to 34 Years | 157 (16.4%) | 20 (2.3%) |
| 35 to 64 Years | 229 (21.0%) | 192 (15.1%) |
| 65 to 74 Years | 100 (38.2%) | 65 (31.4%) |
| 75 Years and over | 76 (48.1%) | 171 (51.7%) |
Disability Class by Sex by Age in Red Lion borough
Disability Class: Hearing Difficulty
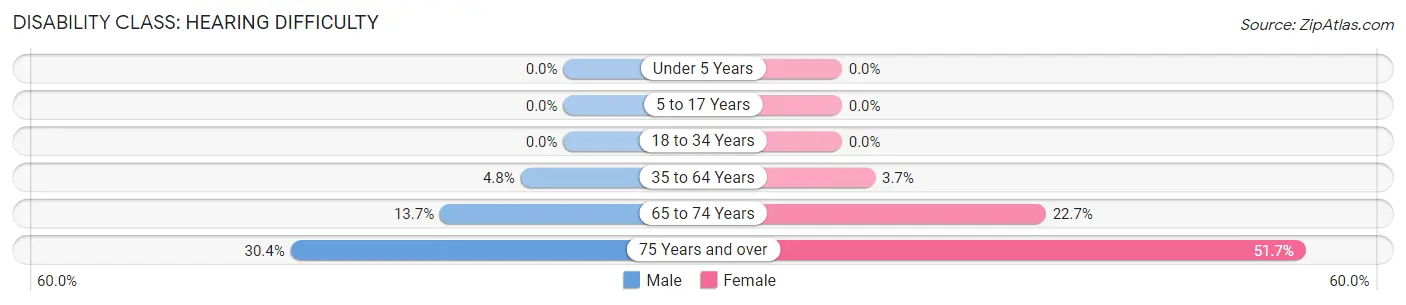
| Age Bracket | Male | Female |
| Under 5 Years | 0 (0.0%) | 0 (0.0%) |
| 5 to 17 Years | 0 (0.0%) | 0 (0.0%) |
| 18 to 34 Years | 0 (0.0%) | 0 (0.0%) |
| 35 to 64 Years | 52 (4.8%) | 47 (3.7%) |
| 65 to 74 Years | 36 (13.7%) | 47 (22.7%) |
| 75 Years and over | 48 (30.4%) | 171 (51.7%) |
Disability Class: Vision Difficulty
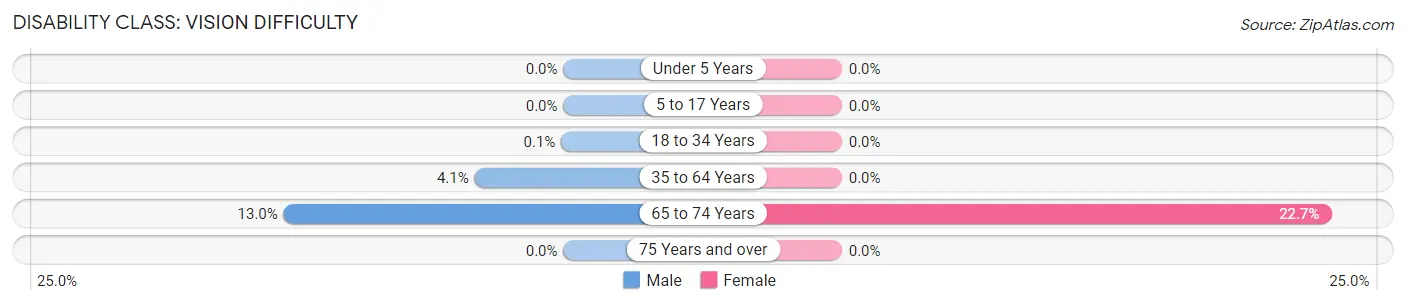
| Age Bracket | Male | Female |
| Under 5 Years | 0 (0.0%) | 0 (0.0%) |
| 5 to 17 Years | 0 (0.0%) | 0 (0.0%) |
| 18 to 34 Years | 1 (0.1%) | 0 (0.0%) |
| 35 to 64 Years | 45 (4.1%) | 0 (0.0%) |
| 65 to 74 Years | 34 (13.0%) | 47 (22.7%) |
| 75 Years and over | 0 (0.0%) | 0 (0.0%) |
Disability Class: Cognitive Difficulty
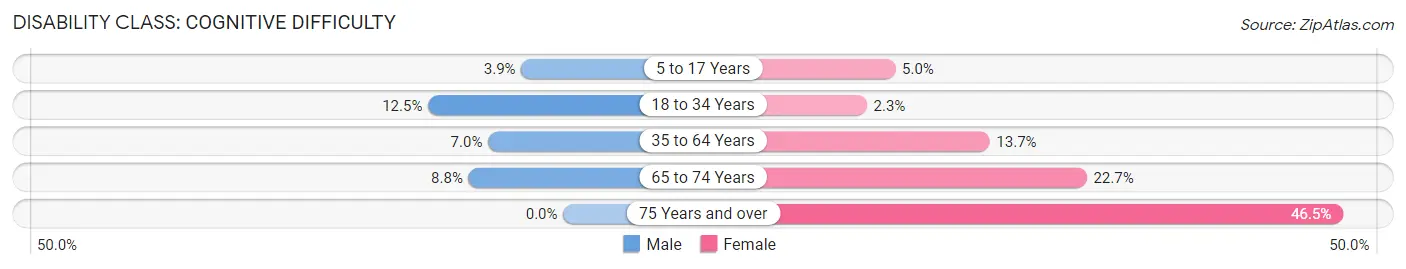
| Age Bracket | Male | Female |
| 5 to 17 Years | 23 (3.9%) | 22 (5.0%) |
| 18 to 34 Years | 120 (12.5%) | 20 (2.3%) |
| 35 to 64 Years | 76 (7.0%) | 174 (13.7%) |
| 65 to 74 Years | 23 (8.8%) | 47 (22.7%) |
| 75 Years and over | 0 (0.0%) | 154 (46.5%) |
Disability Class: Ambulatory Difficulty
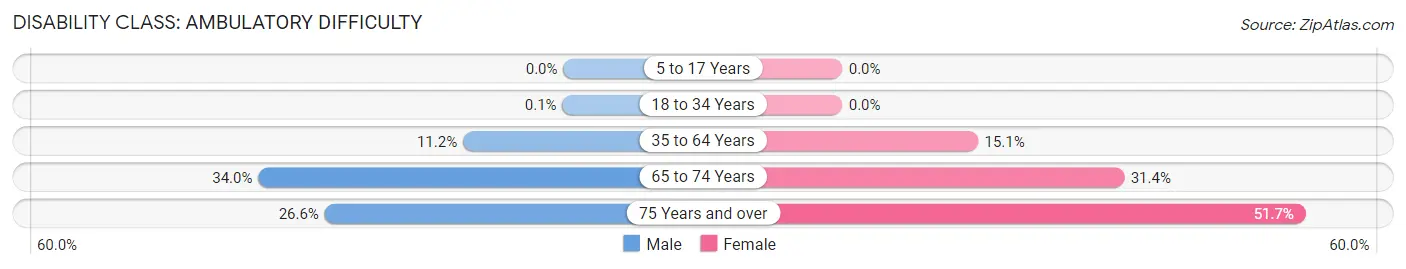
| Age Bracket | Male | Female |
| 5 to 17 Years | 0 (0.0%) | 0 (0.0%) |
| 18 to 34 Years | 1 (0.1%) | 0 (0.0%) |
| 35 to 64 Years | 122 (11.2%) | 192 (15.1%) |
| 65 to 74 Years | 89 (34.0%) | 65 (31.4%) |
| 75 Years and over | 42 (26.6%) | 171 (51.7%) |
Disability Class: Self-Care Difficulty
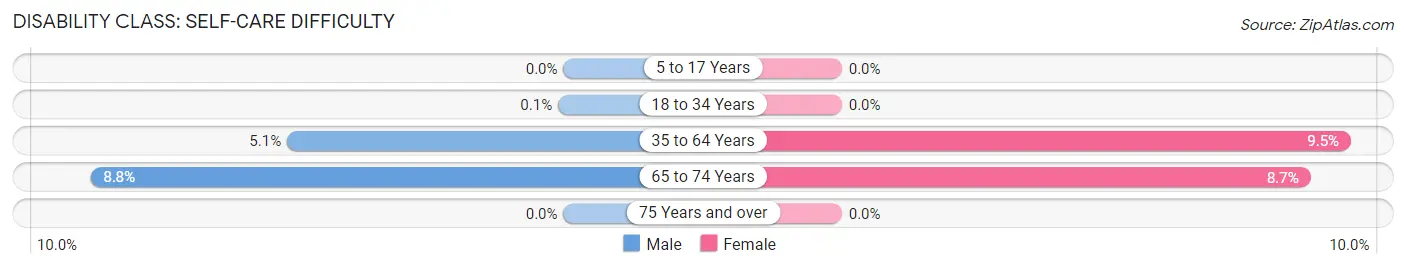
| Age Bracket | Male | Female |
| 5 to 17 Years | 0 (0.0%) | 0 (0.0%) |
| 18 to 34 Years | 1 (0.1%) | 0 (0.0%) |
| 35 to 64 Years | 56 (5.1%) | 120 (9.5%) |
| 65 to 74 Years | 23 (8.8%) | 18 (8.7%) |
| 75 Years and over | 0 (0.0%) | 0 (0.0%) |
Technology Access in Red Lion borough
Computing Device Access in Red Lion borough
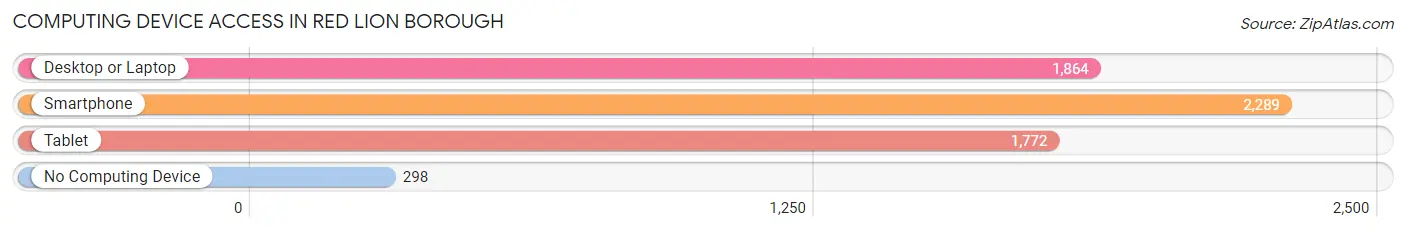
| Device Type | # Households | % Households |
| Desktop or Laptop | 1,864 | 67.9% |
| Smartphone | 2,289 | 83.4% |
| Tablet | 1,772 | 64.5% |
| No Computing Device | 298 | 10.9% |
| Total | 2,745 | 100.0% |
Internet Access in Red Lion borough
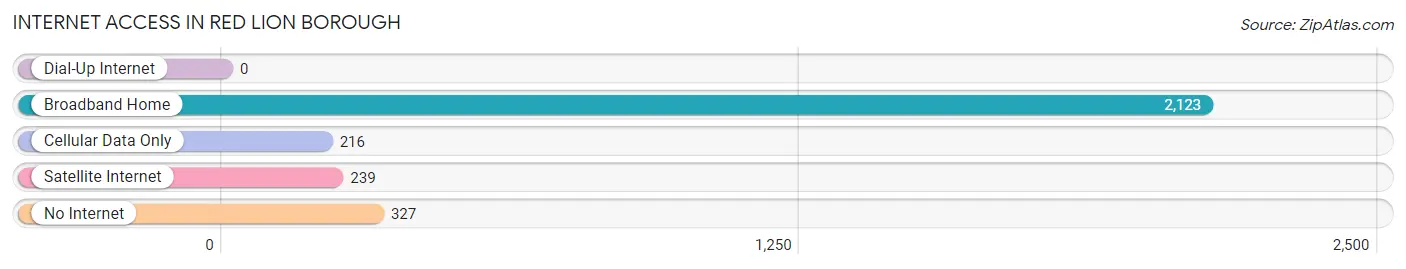
| Internet Type | # Households | % Households |
| Dial-Up Internet | 0 | 0.0% |
| Broadband Home | 2,123 | 77.3% |
| Cellular Data Only | 216 | 7.9% |
| Satellite Internet | 239 | 8.7% |
| No Internet | 327 | 11.9% |
| Total | 2,745 | 100.0% |
Red Lion borough Summary
Introduction
Red Lion Borough is a small borough located in York County, Pennsylvania. It is situated in the southeastern part of the state, approximately 25 miles south of the state capital of Harrisburg. The borough is home to a population of approximately 6,000 people and is part of the York-Hanover Metropolitan Statistical Area. Red Lion Borough is known for its rich history, diverse geography, vibrant economy, and diverse demographics.
History
Red Lion Borough was founded in 1798 by a group of settlers from Lancaster County. The borough was named after the Red Lion Inn, which was located in the area. The inn was a popular stop for travelers and was known for its hospitality. The borough was officially incorporated in 1845 and has since grown to become a thriving community.
The borough has a long and rich history. During the Civil War, Red Lion Borough was a major stop on the Underground Railroad. The borough was also home to a number of prominent figures, including the first African-American mayor of York County, William H. Brown.
Geography
Red Lion Borough is located in the southeastern part of York County, Pennsylvania. The borough is situated in the Susquehanna River Valley and is surrounded by rolling hills and farmland. The borough is located approximately 25 miles south of the state capital of Harrisburg.
The borough is home to a number of parks and recreational areas, including Red Lion Community Park, which features a playground, basketball courts, and a walking trail. The borough is also home to a number of historic sites, including the Red Lion Inn, which is listed on the National Register of Historic Places.
Economy
Red Lion Borough has a vibrant economy that is driven by a number of industries. The borough is home to a number of manufacturing companies, including York Manufacturing, which produces a variety of products, including air conditioners, refrigerators, and other appliances. The borough is also home to a number of retail stores, restaurants, and other businesses.
The borough is also home to a number of educational institutions, including Red Lion Area School District, which serves the borough and surrounding areas. The district is home to a number of elementary, middle, and high schools, as well as a number of vocational and technical schools.
Demographics
Red Lion Borough is home to a population of approximately 6,000 people. The borough is racially and ethnically diverse, with a population that is approximately 75% white, 15% African American, 5% Hispanic, and 5% other. The median household income in the borough is approximately $50,000, and the median home value is approximately $150,000.
Conclusion
Red Lion Borough is a small borough located in York County, Pennsylvania. The borough is known for its rich history, diverse geography, vibrant economy, and diverse demographics. The borough is home to a number of manufacturing companies, retail stores, restaurants, and other businesses, as well as a number of educational institutions. Red Lion Borough is a thriving community that is home to a population of approximately 6,000 people.
Common Questions
What is Per Capita Income in Red Lion borough?
Per Capita income in Red Lion borough is $37,309.
What is the Median Family Income in Red Lion borough?
Median Family Income in Red Lion borough is $77,129.
What is the Median Household income in Red Lion borough?
Median Household Income in Red Lion borough is $59,503.
What is Income or Wage Gap in Red Lion borough?
Income or Wage Gap in Red Lion borough is 25.4%.
Women in Red Lion borough earn 74.6 cents for every dollar earned by a man.
What is Inequality or Gini Index in Red Lion borough?
Inequality or Gini Index in Red Lion borough is 0.49.
What is the Total Population of Red Lion borough?
Total Population of Red Lion borough is 6,499.
What is the Total Male Population of Red Lion borough?
Total Male Population of Red Lion borough is 3,238.
What is the Total Female Population of Red Lion borough?
Total Female Population of Red Lion borough is 3,261.
What is the Ratio of Males per 100 Females in Red Lion borough?
There are 99.29 Males per 100 Females in Red Lion borough.
What is the Ratio of Females per 100 Males in Red Lion borough?
There are 100.71 Females per 100 Males in Red Lion borough.
What is the Median Population Age in Red Lion borough?
Median Population Age in Red Lion borough is 35.4 Years.
What is the Average Family Size in Red Lion borough
Average Family Size in Red Lion borough is 2.9 People.
What is the Average Household Size in Red Lion borough
Average Household Size in Red Lion borough is 2.4 People.
How Large is the Labor Force in Red Lion borough?
There are 3,544 People in the Labor Forcein in Red Lion borough.
What is the Percentage of People in the Labor Force in Red Lion borough?
67.7% of People are in the Labor Force in Red Lion borough.
What is the Unemployment Rate in Red Lion borough?
Unemployment Rate in Red Lion borough is 0.5%.