Egypt, PA Map & Demographics
Egypt Map
Egypt Overview
$40,375
PER CAPITA INCOME
$112,609
AVG FAMILY INCOME
$105,655
AVG HOUSEHOLD INCOME
47.9%
WAGE / INCOME GAP [ % ]
52.1¢/ $1
WAGE / INCOME GAP [ $ ]
0.34
INEQUALITY / GINI INDEX
2,998
TOTAL POPULATION
1,442
MALE POPULATION
1,556
FEMALE POPULATION
92.67
MALES / 100 FEMALES
107.91
FEMALES / 100 MALES
40.8
MEDIAN AGE
3.1
AVG FAMILY SIZE
2.7
AVG HOUSEHOLD SIZE
1,548
LABOR FORCE [ PEOPLE ]
64.4%
PERCENT IN LABOR FORCE
1.8%
UNEMPLOYMENT RATE
Income in Egypt
Income Overview in Egypt
Per Capita Income in Egypt is $40,375, while median incomes of families and households are $112,609 and $105,655 respectively.
| Characteristic | Number | Measure |
| Per Capita Income | 2,998 | $40,375 |
| Median Family Income | 844 | $112,609 |
| Mean Family Income | 844 | $125,584 |
| Median Household Income | 1,103 | $105,655 |
| Mean Household Income | 1,103 | $107,441 |
| Income Deficit | 844 | $0 |
| Wage / Income Gap (%) | 2,998 | 47.94% |
| Wage / Income Gap ($) | 2,998 | 52.06¢ per $1 |
| Gini / Inequality Index | 2,998 | 0.34 |
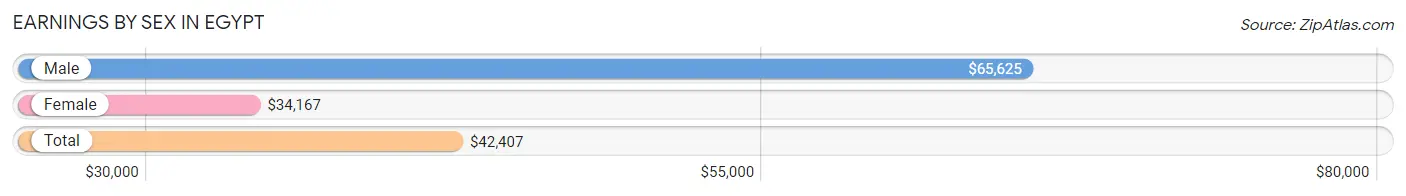
Earnings by Sex in Egypt
Average Earnings in Egypt are $42,407, $65,625 for men and $34,167 for women, a difference of 47.9%.
| Sex | Number | Average Earnings |
| Male | 844 (51.1%) | $65,625 |
| Female | 806 (48.8%) | $34,167 |
| Total | 1,650 (100.0%) | $42,407 |
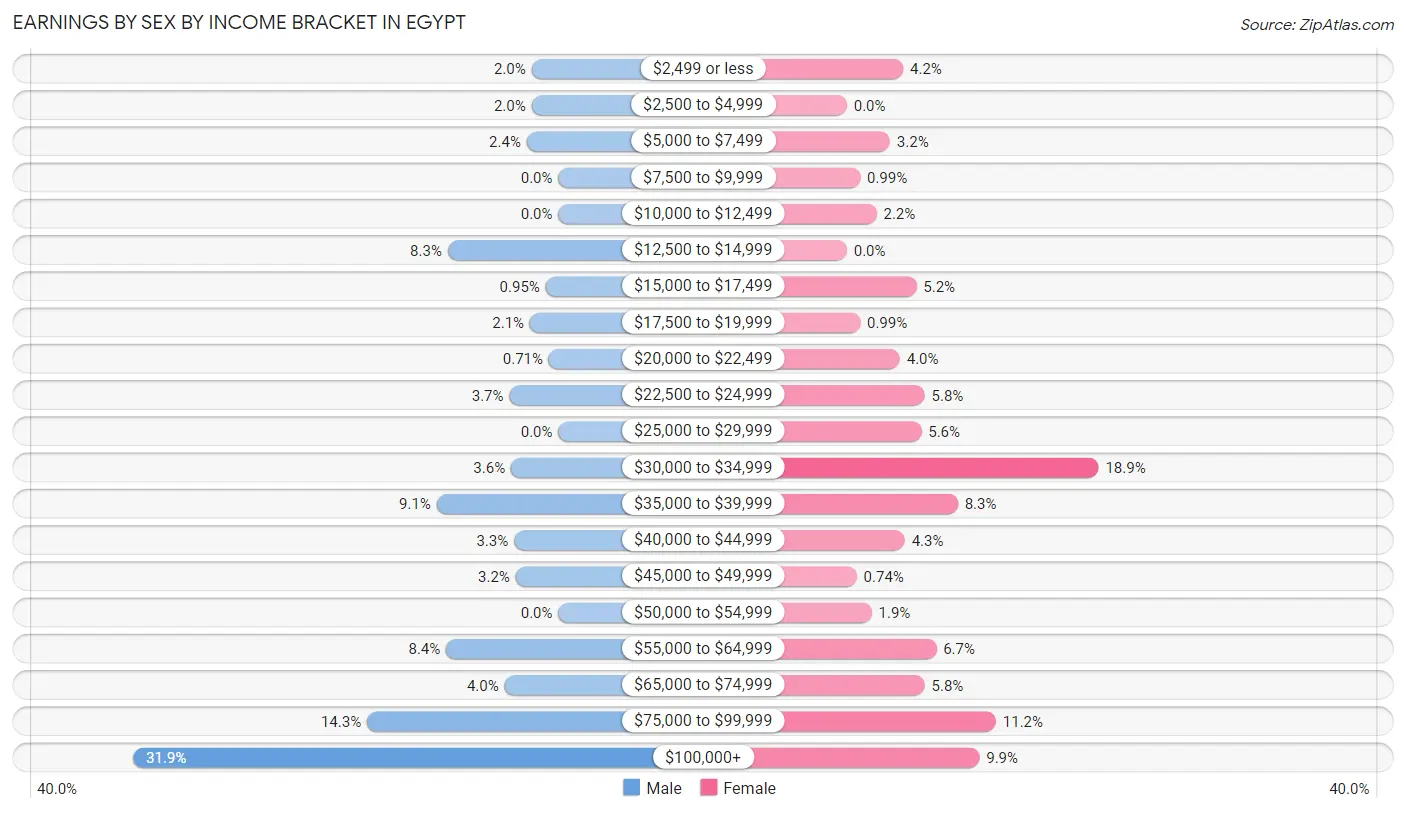
Earnings by Sex by Income Bracket in Egypt
The most common earnings brackets in Egypt are $100,000+ for men (269 | 31.9%) and $30,000 to $34,999 for women (152 | 18.9%).
| Income | Male | Female |
| $2,499 or less | 17 (2.0%) | 34 (4.2%) |
| $2,500 to $4,999 | 17 (2.0%) | 0 (0.0%) |
| $5,000 to $7,499 | 20 (2.4%) | 26 (3.2%) |
| $7,500 to $9,999 | 0 (0.0%) | 8 (1.0%) |
| $10,000 to $12,499 | 0 (0.0%) | 18 (2.2%) |
| $12,500 to $14,999 | 70 (8.3%) | 0 (0.0%) |
| $15,000 to $17,499 | 8 (0.9%) | 42 (5.2%) |
| $17,500 to $19,999 | 18 (2.1%) | 8 (1.0%) |
| $20,000 to $22,499 | 6 (0.7%) | 32 (4.0%) |
| $22,500 to $24,999 | 31 (3.7%) | 47 (5.8%) |
| $25,000 to $29,999 | 0 (0.0%) | 45 (5.6%) |
| $30,000 to $34,999 | 30 (3.5%) | 152 (18.9%) |
| $35,000 to $39,999 | 77 (9.1%) | 67 (8.3%) |
| $40,000 to $44,999 | 28 (3.3%) | 35 (4.3%) |
| $45,000 to $49,999 | 27 (3.2%) | 6 (0.7%) |
| $50,000 to $54,999 | 0 (0.0%) | 15 (1.9%) |
| $55,000 to $64,999 | 71 (8.4%) | 54 (6.7%) |
| $65,000 to $74,999 | 34 (4.0%) | 47 (5.8%) |
| $75,000 to $99,999 | 121 (14.3%) | 90 (11.2%) |
| $100,000+ | 269 (31.9%) | 80 (9.9%) |
| Total | 844 (100.0%) | 806 (100.0%) |
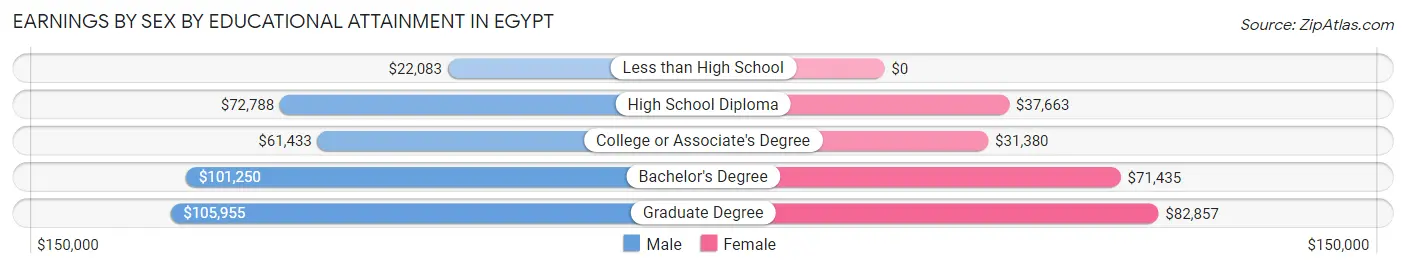
Earnings by Sex by Educational Attainment in Egypt
Average earnings in Egypt are $81,905 for men and $39,366 for women, a difference of 51.9%. Men with an educational attainment of graduate degree enjoy the highest average annual earnings of $105,955, while those with less than high school education earn the least with $22,083. Women with an educational attainment of graduate degree earn the most with the average annual earnings of $82,857, while those with college or associate's degree education have the smallest earnings of $31,380.
| Educational Attainment | Male Income | Female Income |
| Less than High School | $22,083 | $0 |
| High School Diploma | $72,788 | $37,663 |
| College or Associate's Degree | $61,433 | $31,380 |
| Bachelor's Degree | $101,250 | $71,435 |
| Graduate Degree | $105,955 | $82,857 |
| Total | $81,905 | $39,366 |
Family Income in Egypt
Family Income Brackets in Egypt
According to the Egypt family income data, there are 333 families falling into the $100,000 to $149,999 income range, which is the most common income bracket and makes up 39.5% of all families.
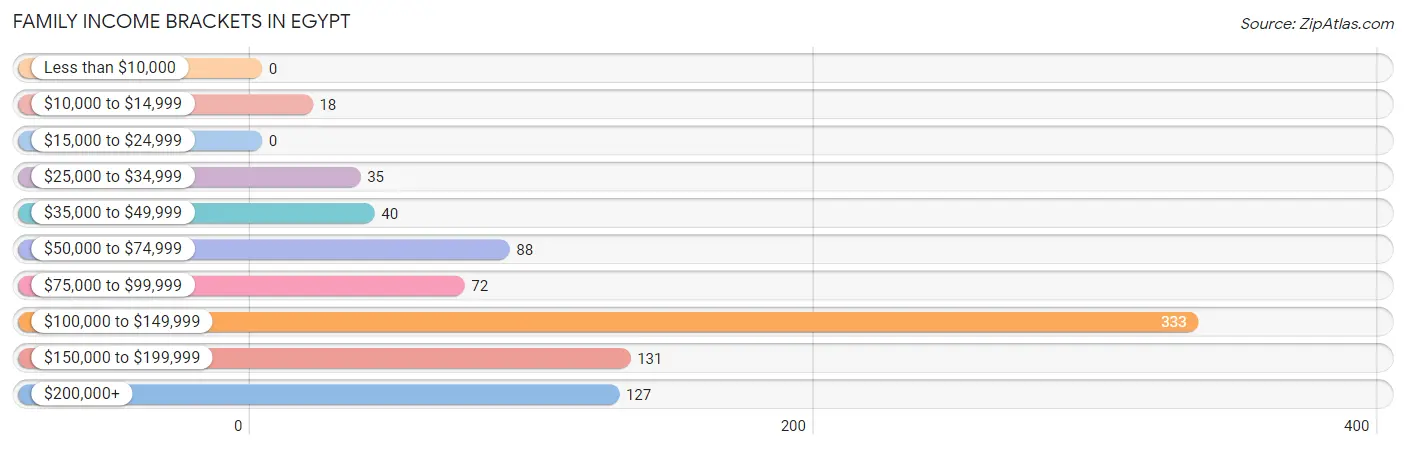
| Income Bracket | # Families | % Families |
| Less than $10,000 | 0 | 0.0% |
| $10,000 to $14,999 | 18 | 2.1% |
| $15,000 to $24,999 | 0 | 0.0% |
| $25,000 to $34,999 | 35 | 4.1% |
| $35,000 to $49,999 | 40 | 4.7% |
| $50,000 to $74,999 | 88 | 10.4% |
| $75,000 to $99,999 | 72 | 8.5% |
| $100,000 to $149,999 | 333 | 39.5% |
| $150,000 to $199,999 | 131 | 15.5% |
| $200,000+ | 127 | 15.0% |
Family Income by Famaliy Size in Egypt
2-person families (379 | 44.9%) account for the highest median family income in Egypt with $118,750 per family, while 2-person families (379 | 44.9%) have the highest median income of $59,375 per family member.
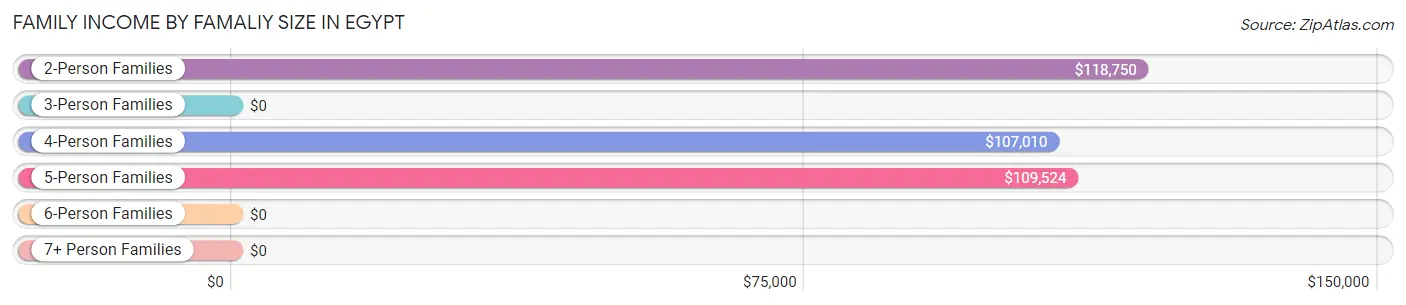
| Income Bracket | # Families | Median Income |
| 2-Person Families | 379 (44.9%) | $118,750 |
| 3-Person Families | 136 (16.1%) | $0 |
| 4-Person Families | 237 (28.1%) | $107,010 |
| 5-Person Families | 92 (10.9%) | $109,524 |
| 6-Person Families | 0 (0.0%) | $0 |
| 7+ Person Families | 0 (0.0%) | $0 |
| Total | 844 (100.0%) | $112,609 |
Family Income by Number of Earners in Egypt
The median family income in Egypt is $112,609, with families comprising 2 earners (283) having the highest median family income of $162,924, while families with no earners (120) have the lowest median family income of $51,987, accounting for 33.5% and 14.2% of families, respectively.
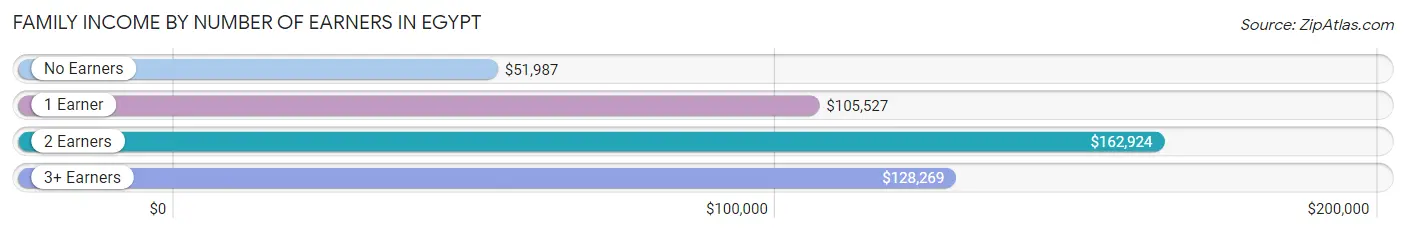
| Number of Earners | # Families | Median Income |
| No Earners | 120 (14.2%) | $51,987 |
| 1 Earner | 279 (33.1%) | $105,527 |
| 2 Earners | 283 (33.5%) | $162,924 |
| 3+ Earners | 162 (19.2%) | $128,269 |
| Total | 844 (100.0%) | $112,609 |
Household Income in Egypt
Household Income Brackets in Egypt
With 352 households falling in the category, the $100,000 to $149,999 income range is the most frequent in Egypt, accounting for 31.9% of all households. In contrast, only 18 households (1.6%) fall into the $10,000 to $14,999 income bracket, making it the least populous group.
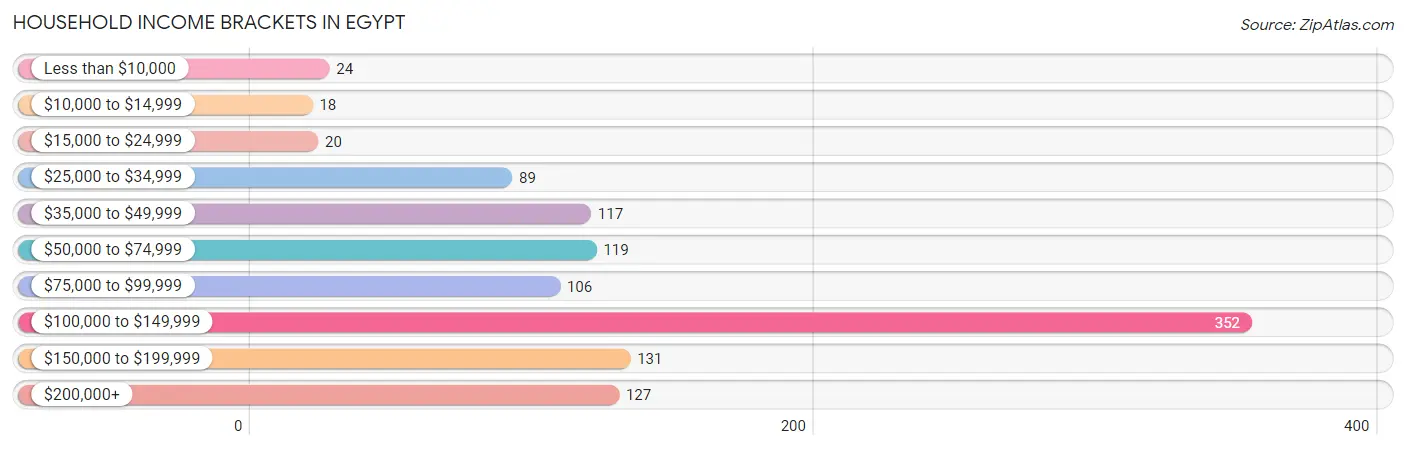
| Income Bracket | # Households | % Households |
| Less than $10,000 | 24 | 2.2% |
| $10,000 to $14,999 | 18 | 1.6% |
| $15,000 to $24,999 | 20 | 1.8% |
| $25,000 to $34,999 | 89 | 8.1% |
| $35,000 to $49,999 | 117 | 10.6% |
| $50,000 to $74,999 | 119 | 10.8% |
| $75,000 to $99,999 | 106 | 9.6% |
| $100,000 to $149,999 | 352 | 31.9% |
| $150,000 to $199,999 | 131 | 11.9% |
| $200,000+ | 127 | 11.5% |
Household Income by Householder Age in Egypt
The median household income in Egypt is $105,655, with the highest median household income of $113,804 found in the 45 to 64 years age bracket for the primary householder. A total of 444 households (40.3%) fall into this category. Meanwhile, the 15 to 24 years age bracket for the primary householder has the lowest median household income of $0, with 23 households (2.1%) in this group.
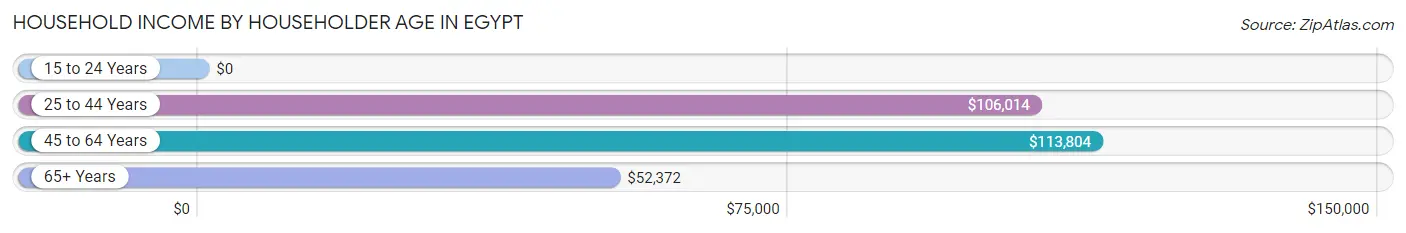
| Income Bracket | # Households | Median Income |
| 15 to 24 Years | 23 (2.1%) | $0 |
| 25 to 44 Years | 330 (29.9%) | $106,014 |
| 45 to 64 Years | 444 (40.3%) | $113,804 |
| 65+ Years | 306 (27.7%) | $52,372 |
| Total | 1,103 (100.0%) | $105,655 |
Poverty in Egypt
Income Below Poverty by Sex and Age in Egypt
With 2.7% poverty level for males and 5.2% for females among the residents of Egypt, 15 year old males and 6 to 11 year old females are the most vulnerable to poverty, with 19 males (70.4%) and 23 females (23.5%) in their respective age groups living below the poverty level.
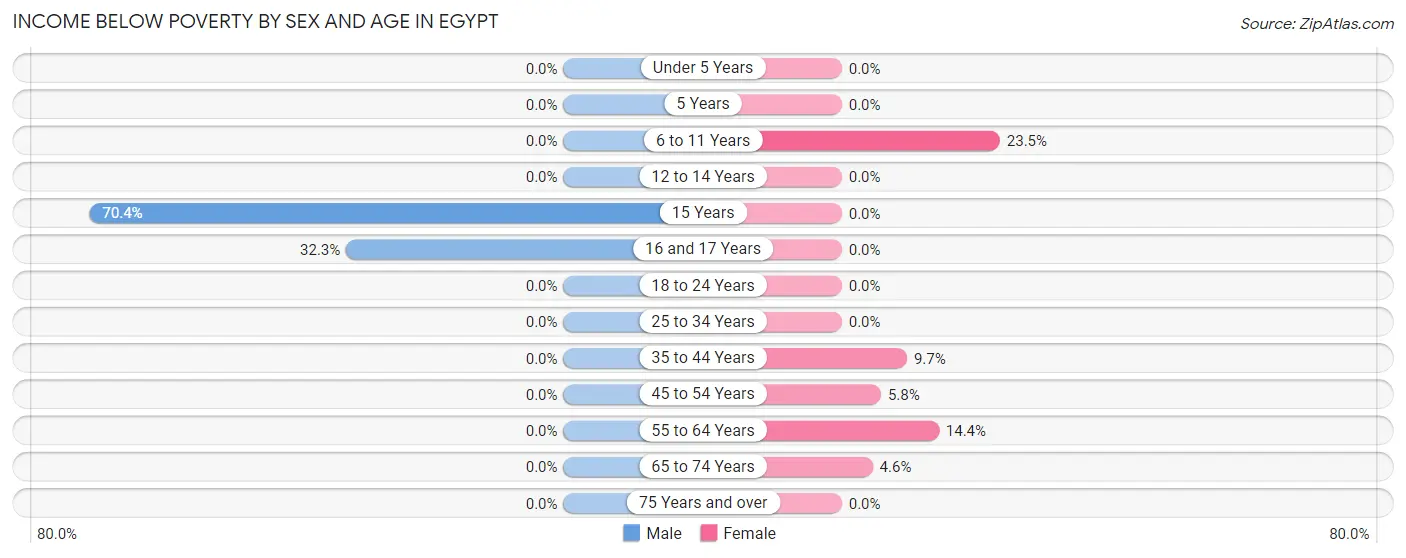
| Age Bracket | Male | Female |
| Under 5 Years | 0 (0.0%) | 0 (0.0%) |
| 5 Years | 0 (0.0%) | 0 (0.0%) |
| 6 to 11 Years | 0 (0.0%) | 23 (23.5%) |
| 12 to 14 Years | 0 (0.0%) | 0 (0.0%) |
| 15 Years | 19 (70.4%) | 0 (0.0%) |
| 16 and 17 Years | 20 (32.3%) | 0 (0.0%) |
| 18 to 24 Years | 0 (0.0%) | 0 (0.0%) |
| 25 to 34 Years | 0 (0.0%) | 0 (0.0%) |
| 35 to 44 Years | 0 (0.0%) | 18 (9.7%) |
| 45 to 54 Years | 0 (0.0%) | 16 (5.8%) |
| 55 to 64 Years | 0 (0.0%) | 17 (14.4%) |
| 65 to 74 Years | 0 (0.0%) | 7 (4.6%) |
| 75 Years and over | 0 (0.0%) | 0 (0.0%) |
| Total | 39 (2.7%) | 81 (5.2%) |
Income Above Poverty by Sex and Age in Egypt
According to the poverty statistics in Egypt, males aged under 5 years and females aged under 5 years are the age groups that are most secure financially, with 100.0% of males and 100.0% of females in these age groups living above the poverty line.
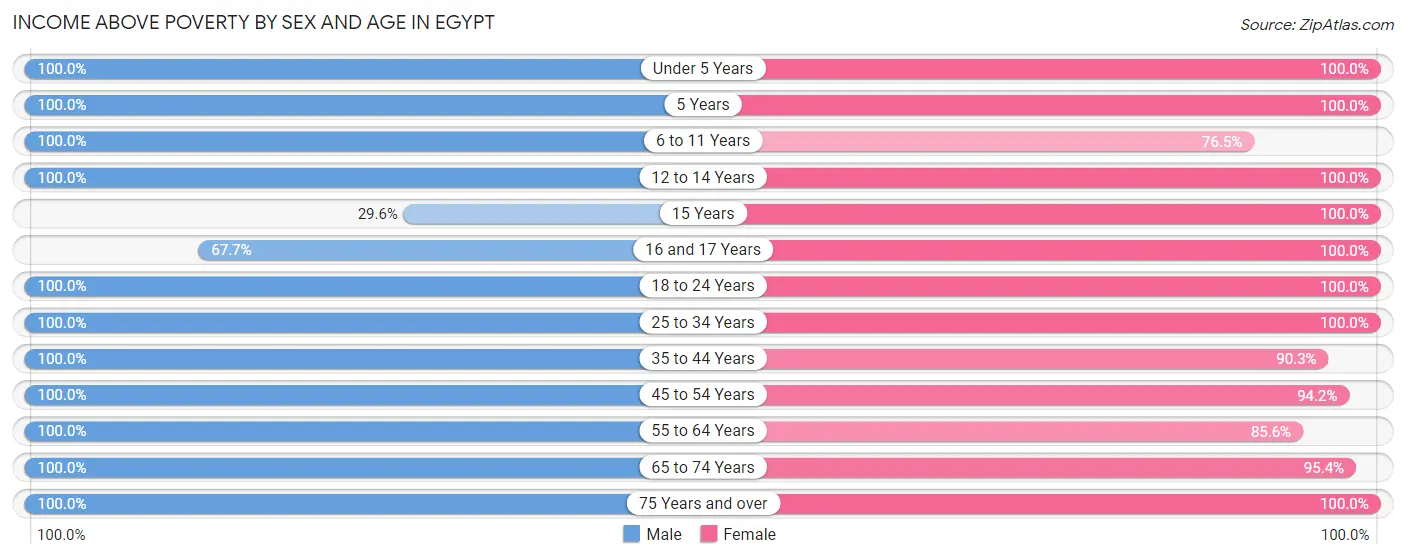
| Age Bracket | Male | Female |
| Under 5 Years | 89 (100.0%) | 28 (100.0%) |
| 5 Years | 90 (100.0%) | 92 (100.0%) |
| 6 to 11 Years | 60 (100.0%) | 75 (76.5%) |
| 12 to 14 Years | 27 (100.0%) | 52 (100.0%) |
| 15 Years | 8 (29.6%) | 31 (100.0%) |
| 16 and 17 Years | 42 (67.7%) | 11 (100.0%) |
| 18 to 24 Years | 150 (100.0%) | 118 (100.0%) |
| 25 to 34 Years | 105 (100.0%) | 239 (100.0%) |
| 35 to 44 Years | 264 (100.0%) | 168 (90.3%) |
| 45 to 54 Years | 151 (100.0%) | 259 (94.2%) |
| 55 to 64 Years | 215 (100.0%) | 101 (85.6%) |
| 65 to 74 Years | 93 (100.0%) | 146 (95.4%) |
| 75 Years and over | 109 (100.0%) | 155 (100.0%) |
| Total | 1,403 (97.3%) | 1,475 (94.8%) |
Income Below Poverty Among Married-Couple Families in Egypt
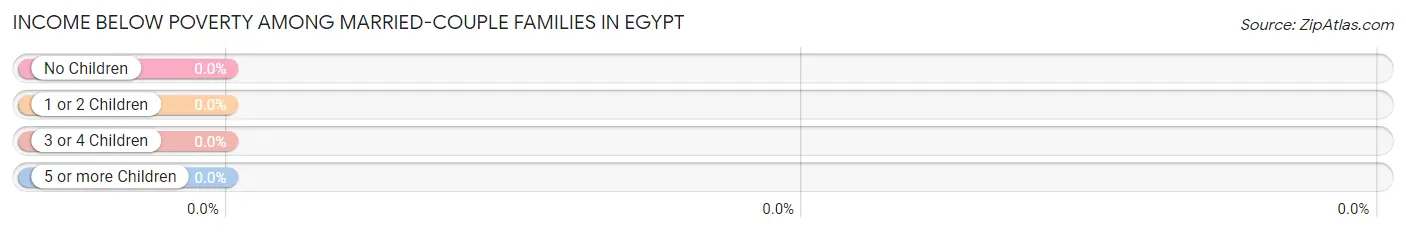
| Children | Above Poverty | Below Poverty |
| No Children | 425 (100.0%) | 0 (0.0%) |
| 1 or 2 Children | 204 (100.0%) | 0 (0.0%) |
| 3 or 4 Children | 0 (0.0%) | 0 (0.0%) |
| 5 or more Children | 0 (0.0%) | 0 (0.0%) |
| Total | 629 (100.0%) | 0 (0.0%) |
Income Below Poverty Among Single-Parent Households in Egypt
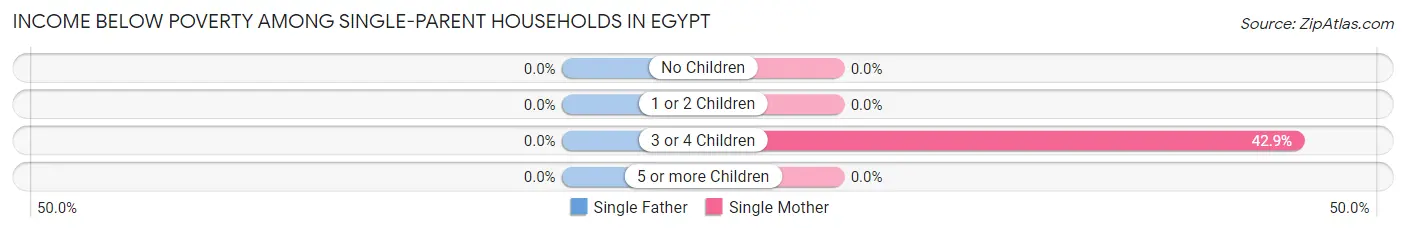
| Children | Single Father | Single Mother |
| No Children | 0 (0.0%) | 0 (0.0%) |
| 1 or 2 Children | 0 (0.0%) | 0 (0.0%) |
| 3 or 4 Children | 0 (0.0%) | 18 (42.9%) |
| 5 or more Children | 0 (0.0%) | 0 (0.0%) |
| Total | 0 (0.0%) | 18 (11.9%) |
Income Below Poverty Among Married-Couple vs Single-Parent Households in Egypt
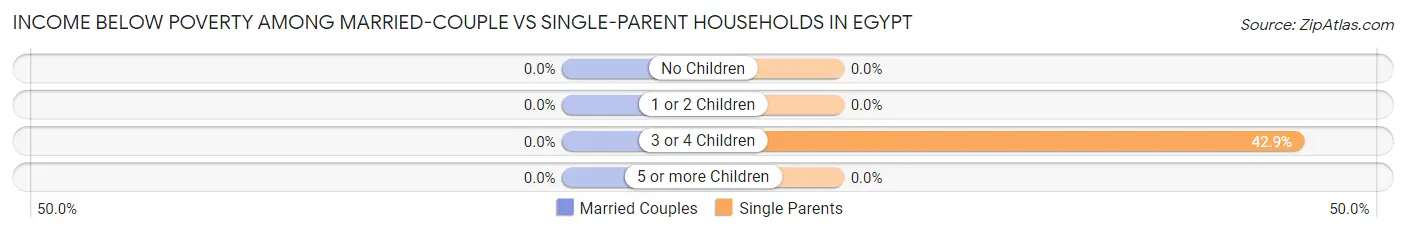
| Children | Married-Couple Families | Single-Parent Households |
| No Children | 0 (0.0%) | 0 (0.0%) |
| 1 or 2 Children | 0 (0.0%) | 0 (0.0%) |
| 3 or 4 Children | 0 (0.0%) | 18 (42.9%) |
| 5 or more Children | 0 (0.0%) | 0 (0.0%) |
| Total | 0 (0.0%) | 18 (8.4%) |
Race in Egypt
The most populous races in Egypt are White / Caucasian (2,524 | 84.2%), Two or more Races (380 | 12.7%), and Hispanic or Latino (328 | 10.9%).
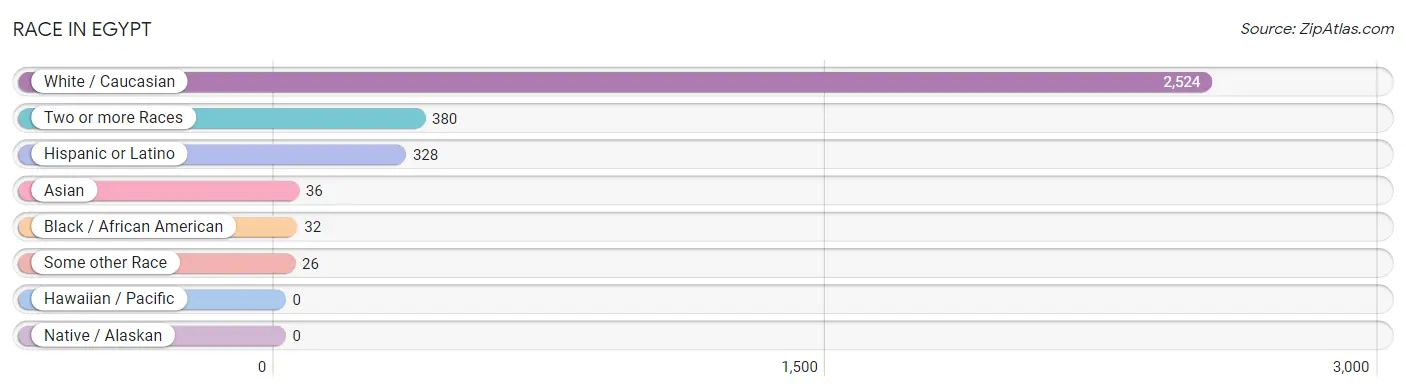
| Race | # Population | % Population |
| Asian | 36 | 1.2% |
| Black / African American | 32 | 1.1% |
| Hawaiian / Pacific | 0 | 0.0% |
| Hispanic or Latino | 328 | 10.9% |
| Native / Alaskan | 0 | 0.0% |
| White / Caucasian | 2,524 | 84.2% |
| Two or more Races | 380 | 12.7% |
| Some other Race | 26 | 0.9% |
| Total | 2,998 | 100.0% |
Ancestry in Egypt
The most populous ancestries reported in Egypt are German (1,091 | 36.4%), Irish (330 | 11.0%), Arab (313 | 10.4%), Syrian (304 | 10.1%), and Puerto Rican (302 | 10.1%), together accounting for 78.1% of all Egypt residents.
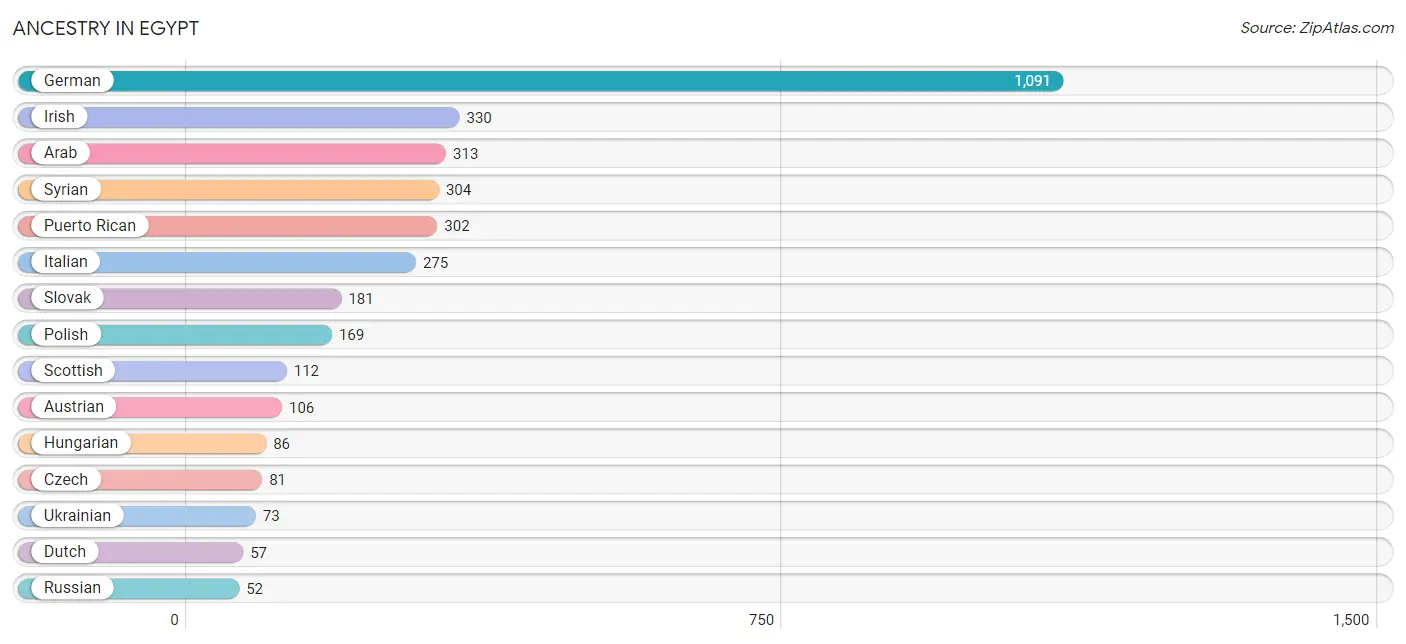
| Ancestry | # Population | % Population |
| American | 41 | 1.4% |
| Arab | 313 | 10.4% |
| Austrian | 106 | 3.5% |
| British | 7 | 0.2% |
| Czech | 81 | 2.7% |
| Czechoslovakian | 18 | 0.6% |
| Dominican | 26 | 0.9% |
| Dutch | 57 | 1.9% |
| Eastern European | 10 | 0.3% |
| English | 48 | 1.6% |
| European | 30 | 1.0% |
| French | 21 | 0.7% |
| German | 1,091 | 36.4% |
| Greek | 15 | 0.5% |
| Hungarian | 86 | 2.9% |
| Irish | 330 | 11.0% |
| Italian | 275 | 9.2% |
| Lebanese | 12 | 0.4% |
| Pennsylvania German | 22 | 0.7% |
| Polish | 169 | 5.6% |
| Puerto Rican | 302 | 10.1% |
| Russian | 52 | 1.7% |
| Scottish | 112 | 3.7% |
| Slovak | 181 | 6.0% |
| Sri Lankan | 18 | 0.6% |
| Swedish | 14 | 0.5% |
| Syrian | 304 | 10.1% |
| Thai | 15 | 0.5% |
| Ukrainian | 73 | 2.4% |
| Welsh | 10 | 0.3% | View All 30 Rows |
Immigrants in Egypt
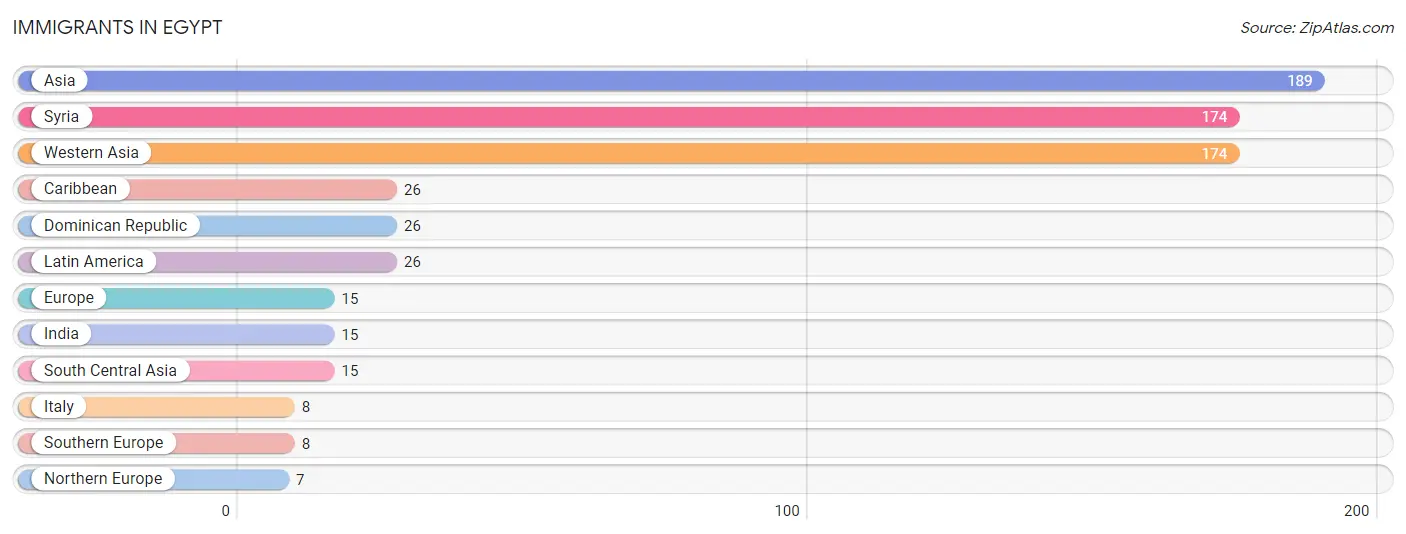
The most numerous immigrant groups reported in Egypt came from Asia (189 | 6.3%), Syria (174 | 5.8%), Western Asia (174 | 5.8%), Caribbean (26 | 0.9%), and Dominican Republic (26 | 0.9%), together accounting for 19.6% of all Egypt residents.
| Immigration Origin | # Population | % Population |
| Asia | 189 | 6.3% |
| Caribbean | 26 | 0.9% |
| Dominican Republic | 26 | 0.9% |
| Europe | 15 | 0.5% |
| India | 15 | 0.5% |
| Italy | 8 | 0.3% |
| Latin America | 26 | 0.9% |
| Northern Europe | 7 | 0.2% |
| South Central Asia | 15 | 0.5% |
| Southern Europe | 8 | 0.3% |
| Syria | 174 | 5.8% |
| Western Asia | 174 | 5.8% | View All 12 Rows |
Sex and Age in Egypt
Sex and Age in Egypt
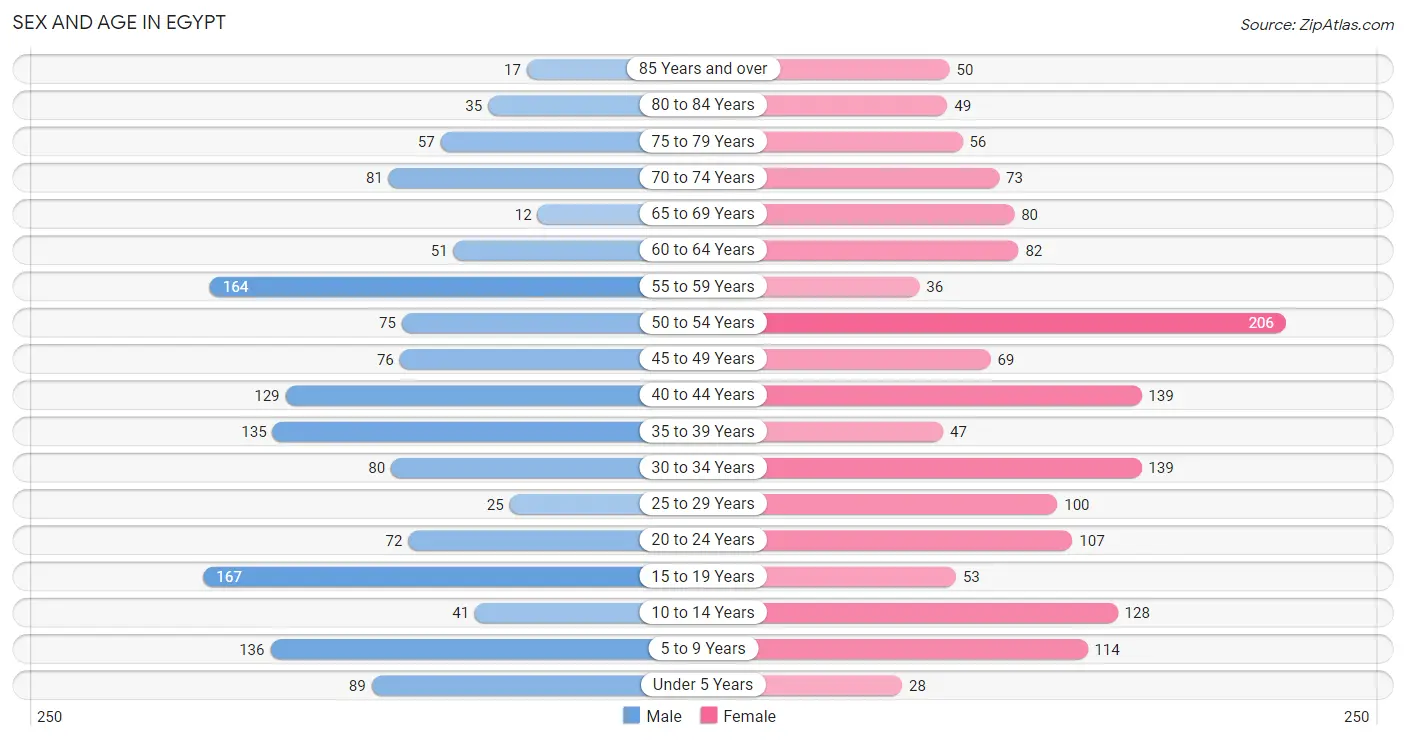
The most populous age groups in Egypt are 15 to 19 Years (167 | 11.6%) for men and 50 to 54 Years (206 | 13.2%) for women.
| Age Bracket | Male | Female |
| Under 5 Years | 89 (6.2%) | 28 (1.8%) |
| 5 to 9 Years | 136 (9.4%) | 114 (7.3%) |
| 10 to 14 Years | 41 (2.8%) | 128 (8.2%) |
| 15 to 19 Years | 167 (11.6%) | 53 (3.4%) |
| 20 to 24 Years | 72 (5.0%) | 107 (6.9%) |
| 25 to 29 Years | 25 (1.7%) | 100 (6.4%) |
| 30 to 34 Years | 80 (5.6%) | 139 (8.9%) |
| 35 to 39 Years | 135 (9.4%) | 47 (3.0%) |
| 40 to 44 Years | 129 (8.9%) | 139 (8.9%) |
| 45 to 49 Years | 76 (5.3%) | 69 (4.4%) |
| 50 to 54 Years | 75 (5.2%) | 206 (13.2%) |
| 55 to 59 Years | 164 (11.4%) | 36 (2.3%) |
| 60 to 64 Years | 51 (3.5%) | 82 (5.3%) |
| 65 to 69 Years | 12 (0.8%) | 80 (5.1%) |
| 70 to 74 Years | 81 (5.6%) | 73 (4.7%) |
| 75 to 79 Years | 57 (4.0%) | 56 (3.6%) |
| 80 to 84 Years | 35 (2.4%) | 49 (3.2%) |
| 85 Years and over | 17 (1.2%) | 50 (3.2%) |
| Total | 1,442 (100.0%) | 1,556 (100.0%) |
Families and Households in Egypt
Median Family Size in Egypt
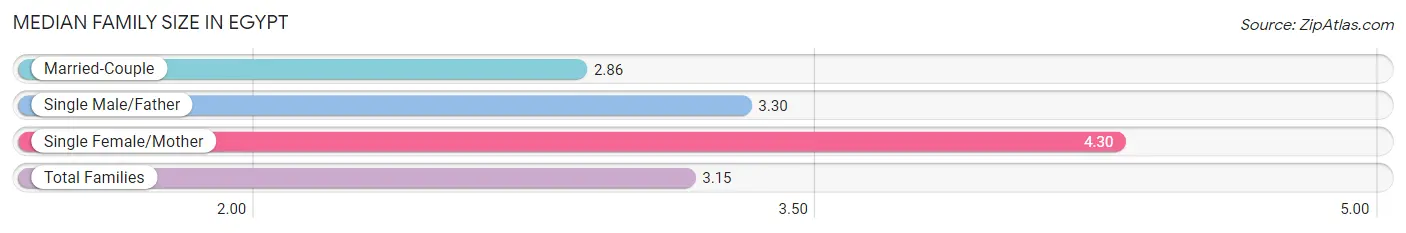
The median family size in Egypt is 3.15 persons per family, with single female/mother families (151 | 17.9%) accounting for the largest median family size of 4.3 persons per family. On the other hand, married-couple families (629 | 74.5%) represent the smallest median family size with 2.86 persons per family.
| Family Type | # Families | Family Size |
| Married-Couple | 629 (74.5%) | 2.86 |
| Single Male/Father | 64 (7.6%) | 3.30 |
| Single Female/Mother | 151 (17.9%) | 4.30 |
| Total Families | 844 (100.0%) | 3.15 |
Median Household Size in Egypt
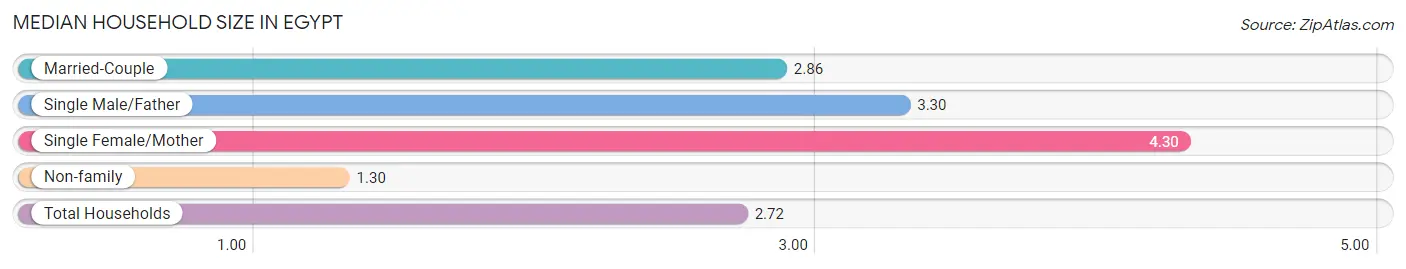
The median household size in Egypt is 2.72 persons per household, with single female/mother households (151 | 13.7%) accounting for the largest median household size of 4.3 persons per household. non-family households (259 | 23.5%) represent the smallest median household size with 1.30 persons per household.
| Household Type | # Households | Household Size |
| Married-Couple | 629 (57.0%) | 2.86 |
| Single Male/Father | 64 (5.8%) | 3.30 |
| Single Female/Mother | 151 (13.7%) | 4.30 |
| Non-family | 259 (23.5%) | 1.30 |
| Total Households | 1,103 (100.0%) | 2.72 |
Household Size by Marriage Status in Egypt
Out of a total of 1,103 households in Egypt, 844 (76.5%) are family households, while 259 (23.5%) are nonfamily households. The most numerous type of family households are 2-person households, comprising 379, and the most common type of nonfamily households are 1-person households, comprising 186.
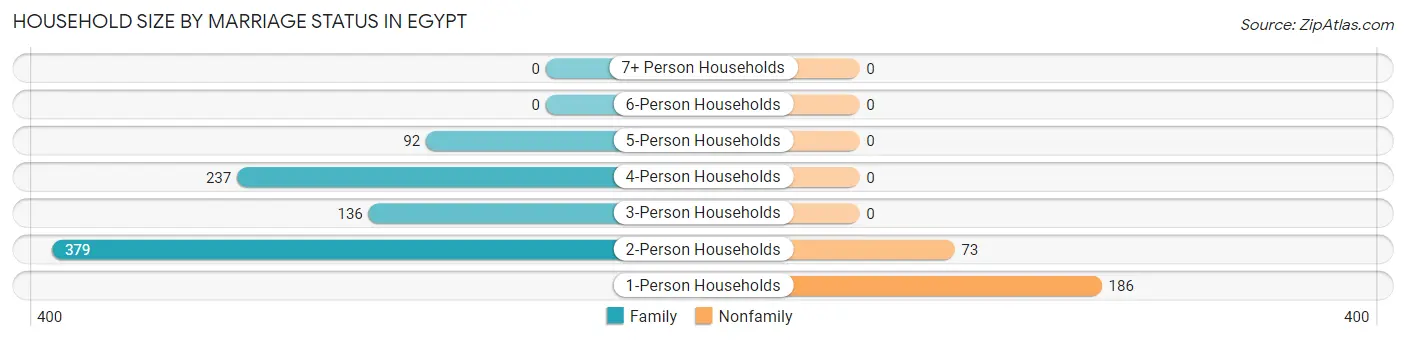
| Household Size | Family Households | Nonfamily Households |
| 1-Person Households | - | 186 (16.9%) |
| 2-Person Households | 379 (34.4%) | 73 (6.6%) |
| 3-Person Households | 136 (12.3%) | 0 (0.0%) |
| 4-Person Households | 237 (21.5%) | 0 (0.0%) |
| 5-Person Households | 92 (8.3%) | 0 (0.0%) |
| 6-Person Households | 0 (0.0%) | 0 (0.0%) |
| 7+ Person Households | 0 (0.0%) | 0 (0.0%) |
| Total | 844 (76.5%) | 259 (23.5%) |
Female Fertility in Egypt
Fertility by Age in Egypt
Average fertility rate in Egypt is 121.0 births per 1,000 women. Women in the age bracket of 20 to 34 years have the highest fertility rate with 237.0 births per 1,000 women. Women in the age bracket of 20 to 34 years acount for 100.0% of all women with births.
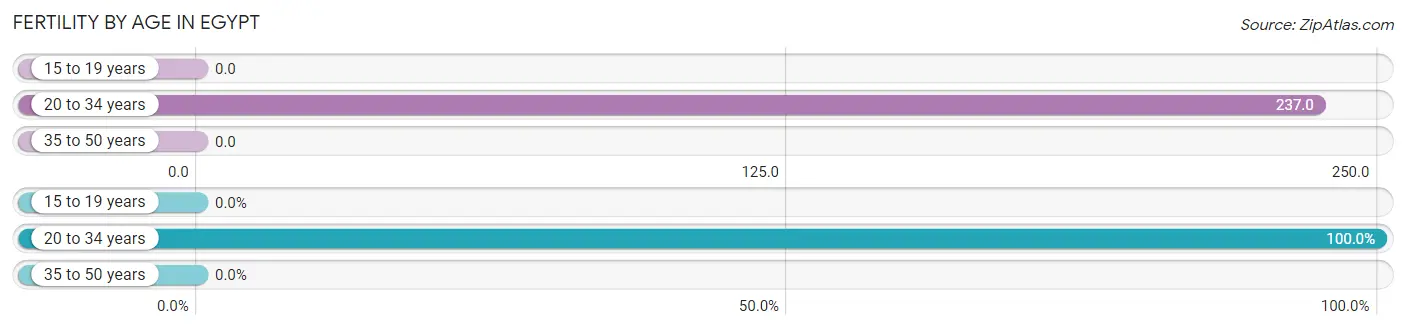
| Age Bracket | Women with Births | Births / 1,000 Women |
| 15 to 19 years | 0 (0.0%) | 0.0 |
| 20 to 34 years | 82 (100.0%) | 237.0 |
| 35 to 50 years | 0 (0.0%) | 0.0 |
| Total | 82 (100.0%) | 121.0 |
Fertility by Age by Marriage Status in Egypt
92.7% of women with births (82) in Egypt are married. The highest percentage of unmarried women with births falls into 20 to 34 years age bracket with 7.3% of them unmarried at the time of birth, while the lowest percentage of unmarried women with births belong to 20 to 34 years age bracket with 7.3% of them unmarried.
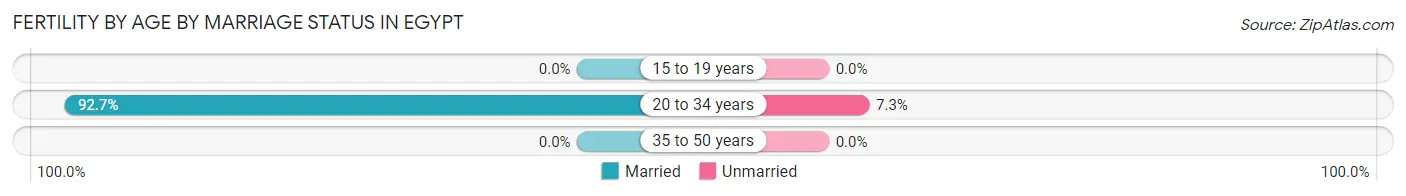
| Age Bracket | Married | Unmarried |
| 15 to 19 years | 0 (0.0%) | 0 (0.0%) |
| 20 to 34 years | 76 (92.7%) | 6 (7.3%) |
| 35 to 50 years | 0 (0.0%) | 0 (0.0%) |
| Total | 76 (92.7%) | 6 (7.3%) |
Fertility by Education in Egypt
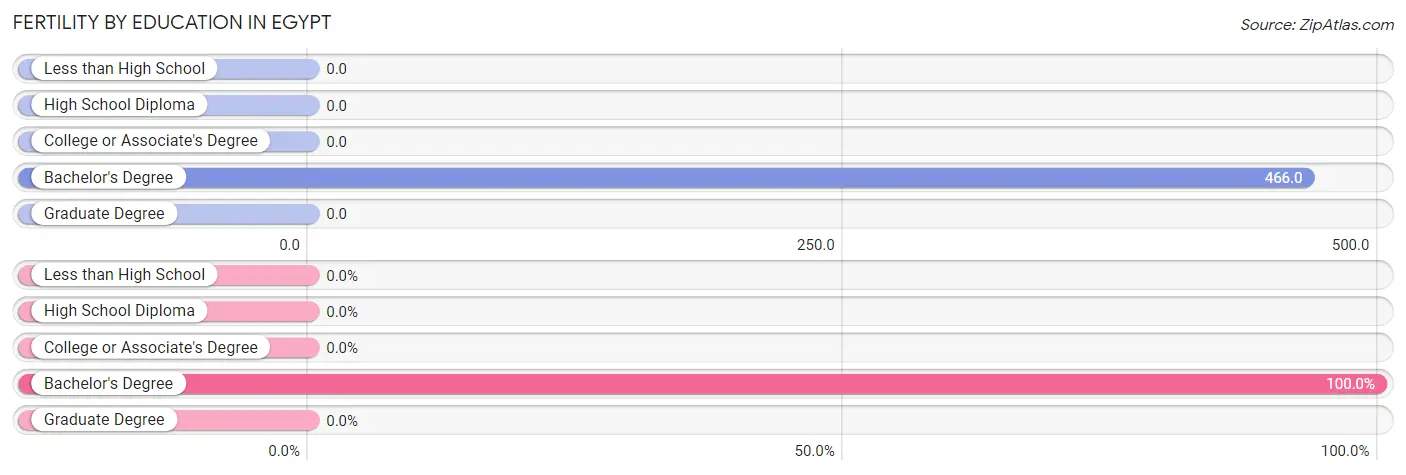
| Educational Attainment | Women with Births | Births / 1,000 Women |
| Less than High School | 0 (0.0%) | 0.0 |
| High School Diploma | 0 (0.0%) | 0.0 |
| College or Associate's Degree | 0 (0.0%) | 0.0 |
| Bachelor's Degree | 82 (100.0%) | 466.0 |
| Graduate Degree | 0 (0.0%) | 0.0 |
| Total | 82 (100.0%) | 121.0 |
Fertility by Education by Marriage Status in Egypt
7.3% of women with births in Egypt are unmarried. Women with the educational attainment of bachelor's degree are most likely to be married with 92.7% of them married at childbirth, while women with the educational attainment of bachelor's degree are least likely to be married with 7.3% of them unmarried at childbirth.
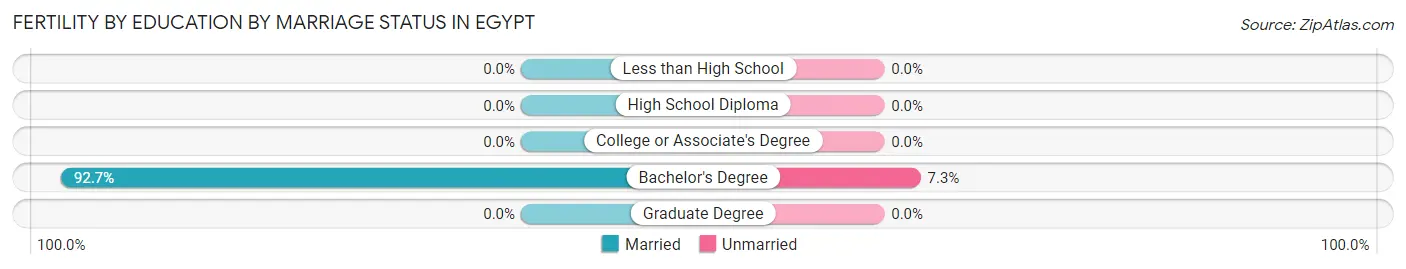
| Educational Attainment | Married | Unmarried |
| Less than High School | 0 (0.0%) | 0 (0.0%) |
| High School Diploma | 0 (0.0%) | 0 (0.0%) |
| College or Associate's Degree | 0 (0.0%) | 0 (0.0%) |
| Bachelor's Degree | 76 (92.7%) | 6 (7.3%) |
| Graduate Degree | 0 (0.0%) | 0 (0.0%) |
| Total | 76 (92.7%) | 6 (7.3%) |
Employment Characteristics in Egypt
Employment by Class of Employer in Egypt
Among the 1,499 employed individuals in Egypt, private company employees (1,096 | 73.1%), local government employees (249 | 16.6%), and not-for-profit organizations (82 | 5.5%) make up the most common classes of employment.
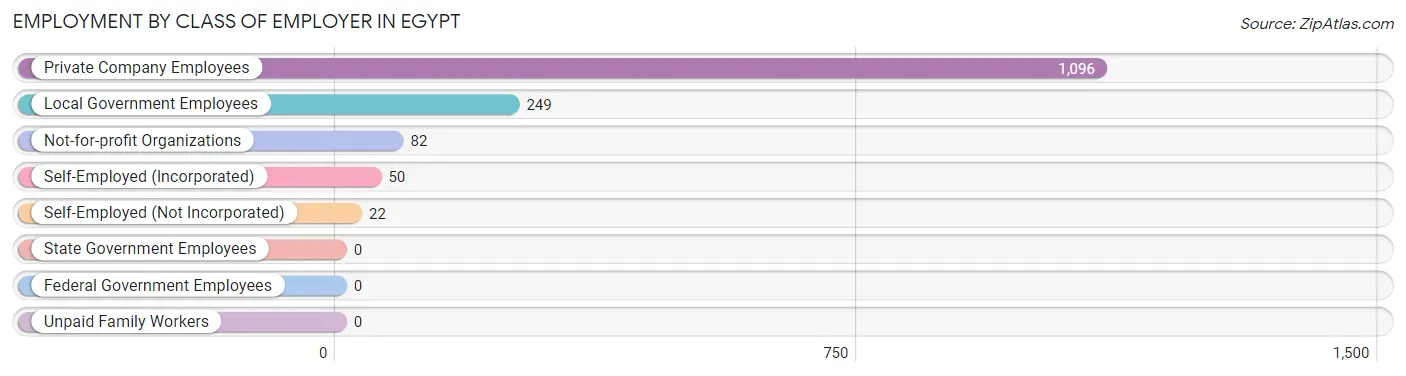
| Employer Class | # Employees | % Employees |
| Private Company Employees | 1,096 | 73.1% |
| Self-Employed (Incorporated) | 50 | 3.3% |
| Self-Employed (Not Incorporated) | 22 | 1.5% |
| Not-for-profit Organizations | 82 | 5.5% |
| Local Government Employees | 249 | 16.6% |
| State Government Employees | 0 | 0.0% |
| Federal Government Employees | 0 | 0.0% |
| Unpaid Family Workers | 0 | 0.0% |
| Total | 1,499 | 100.0% |
Employment Status by Age in Egypt
According to the labor force statistics for Egypt, out of the total population over 16 years of age (2,404), 64.4% or 1,548 individuals are in the labor force, with 1.8% or 28 of them unemployed. The age group with the highest labor force participation rate is 20 to 24 years, with 100.0% or 179 individuals in the labor force. Within the labor force, the 20 to 24 years age range has the highest percentage of unemployed individuals, with 5.6% or 10 of them being unemployed.
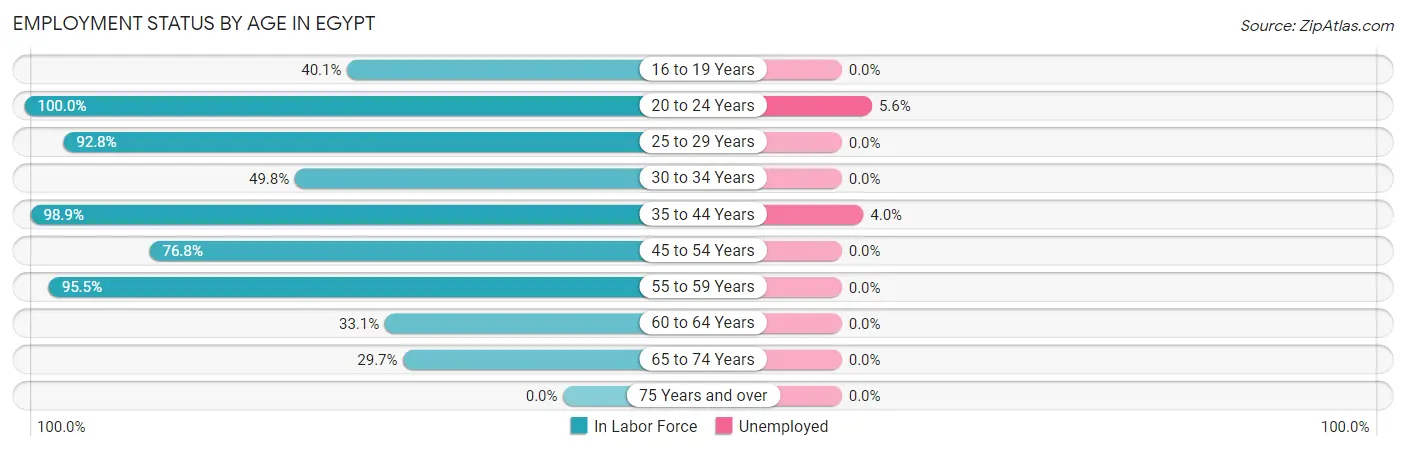
| Age Bracket | In Labor Force | Unemployed |
| 16 to 19 Years | 65 (40.1%) | 0 (0.0%) |
| 20 to 24 Years | 179 (100.0%) | 10 (5.6%) |
| 25 to 29 Years | 116 (92.8%) | 0 (0.0%) |
| 30 to 34 Years | 109 (49.8%) | 0 (0.0%) |
| 35 to 44 Years | 445 (98.9%) | 18 (4.0%) |
| 45 to 54 Years | 327 (76.8%) | 0 (0.0%) |
| 55 to 59 Years | 191 (95.5%) | 0 (0.0%) |
| 60 to 64 Years | 44 (33.1%) | 0 (0.0%) |
| 65 to 74 Years | 73 (29.7%) | 0 (0.0%) |
| 75 Years and over | 0 (0.0%) | 0 (0.0%) |
| Total | 1,548 (64.4%) | 28 (1.8%) |
Employment Status by Educational Attainment in Egypt
According to labor force statistics for Egypt, 79.3% of individuals (1,232) out of the total population between 25 and 64 years of age (1,553) are in the labor force, with 1.5% or 18 of them being unemployed. The group with the highest labor force participation rate are those with the educational attainment of college / associate degree, with 86.8% or 369 individuals in the labor force. Within the labor force, individuals with college / associate degree education have the highest percentage of unemployment, with 4.9% or 18 of them being unemployed.
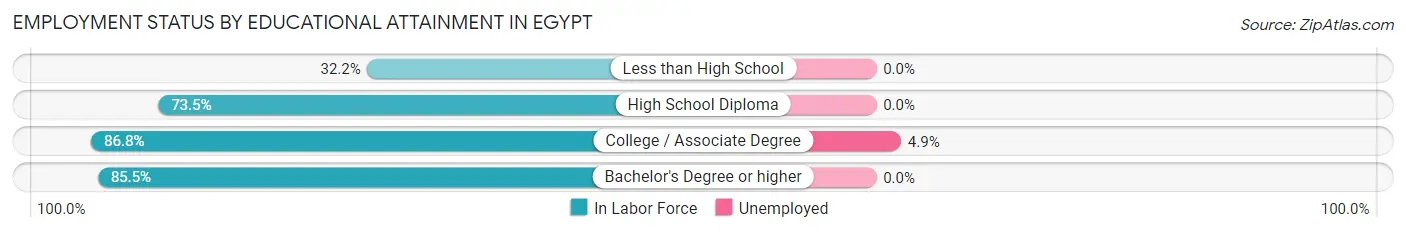
| Educational Attainment | In Labor Force | Unemployed |
| Less than High School | 28 (32.2%) | 0 (0.0%) |
| High School Diploma | 338 (73.5%) | 0 (0.0%) |
| College / Associate Degree | 369 (86.8%) | 21 (4.9%) |
| Bachelor's Degree or higher | 497 (85.5%) | 0 (0.0%) |
| Total | 1,232 (79.3%) | 23 (1.5%) |
Employment Occupations by Sex in Egypt
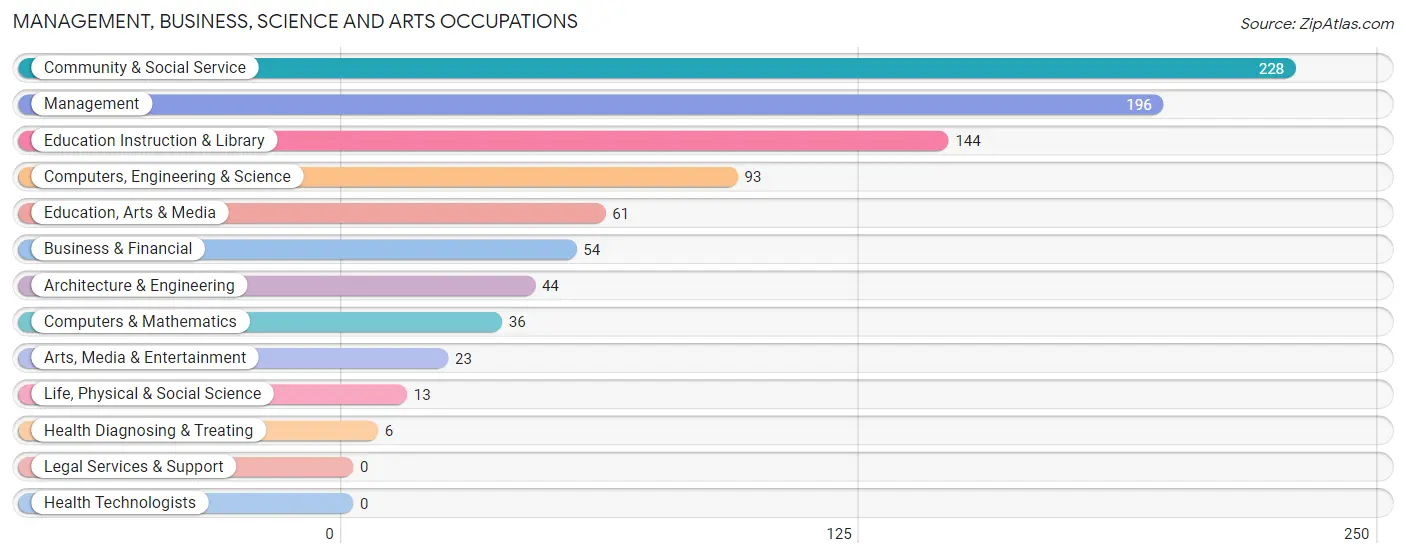
Management, Business, Science and Arts Occupations
The most common Management, Business, Science and Arts occupations in Egypt are Community & Social Service (228 | 15.0%), Management (196 | 12.9%), Education Instruction & Library (144 | 9.5%), Computers, Engineering & Science (93 | 6.1%), and Education, Arts & Media (61 | 4.0%).
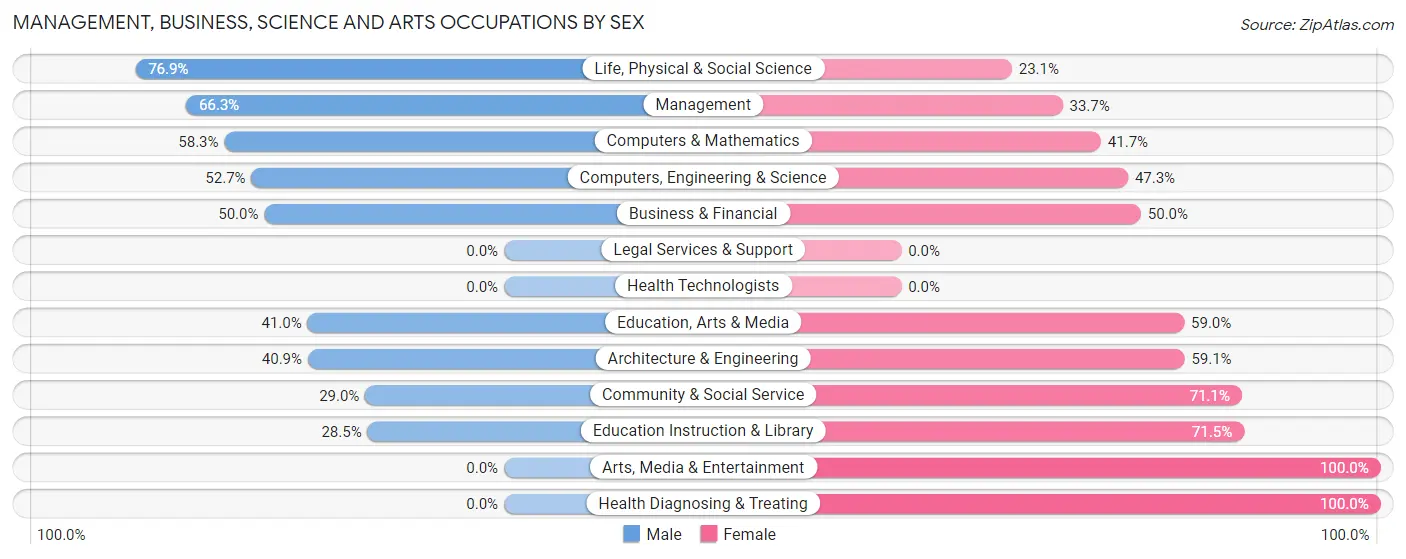
Management, Business, Science and Arts Occupations by Sex
Within the Management, Business, Science and Arts occupations in Egypt, the most male-oriented occupations are Life, Physical & Social Science (76.9%), Management (66.3%), and Computers & Mathematics (58.3%), while the most female-oriented occupations are Arts, Media & Entertainment (100.0%), Health Diagnosing & Treating (100.0%), and Education Instruction & Library (71.5%).
| Occupation | Male | Female |
| Management | 130 (66.3%) | 66 (33.7%) |
| Business & Financial | 27 (50.0%) | 27 (50.0%) |
| Computers, Engineering & Science | 49 (52.7%) | 44 (47.3%) |
| Computers & Mathematics | 21 (58.3%) | 15 (41.7%) |
| Architecture & Engineering | 18 (40.9%) | 26 (59.1%) |
| Life, Physical & Social Science | 10 (76.9%) | 3 (23.1%) |
| Community & Social Service | 66 (28.9%) | 162 (71.1%) |
| Education, Arts & Media | 25 (41.0%) | 36 (59.0%) |
| Legal Services & Support | 0 (0.0%) | 0 (0.0%) |
| Education Instruction & Library | 41 (28.5%) | 103 (71.5%) |
| Arts, Media & Entertainment | 0 (0.0%) | 23 (100.0%) |
| Health Diagnosing & Treating | 0 (0.0%) | 6 (100.0%) |
| Health Technologists | 0 (0.0%) | 0 (0.0%) |
| Total (Category) | 272 (47.1%) | 305 (52.9%) |
| Total (Overall) | 802 (52.7%) | 719 (47.3%) |
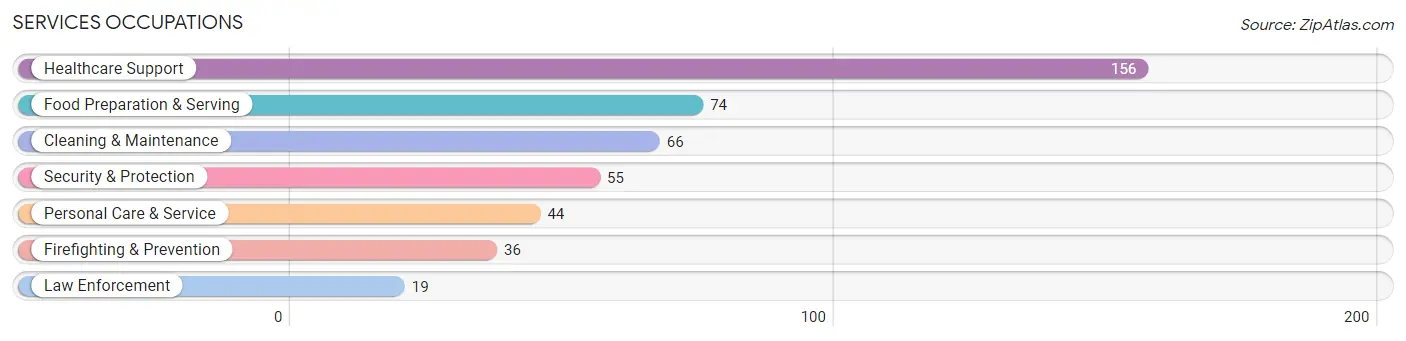
Services Occupations
The most common Services occupations in Egypt are Healthcare Support (156 | 10.3%), Food Preparation & Serving (74 | 4.9%), Cleaning & Maintenance (66 | 4.3%), Security & Protection (55 | 3.6%), and Personal Care & Service (44 | 2.9%).
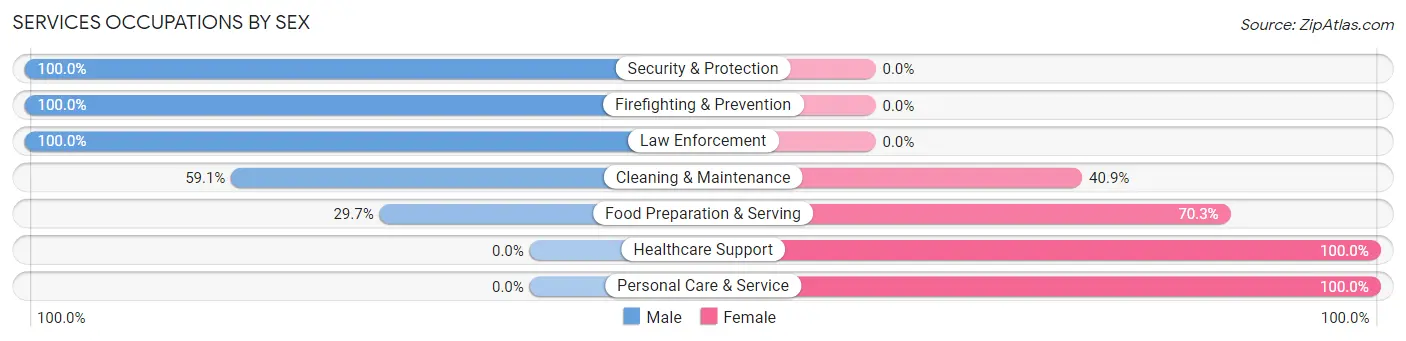
Services Occupations by Sex
Within the Services occupations in Egypt, the most male-oriented occupations are Security & Protection (100.0%), Firefighting & Prevention (100.0%), and Law Enforcement (100.0%), while the most female-oriented occupations are Healthcare Support (100.0%), Personal Care & Service (100.0%), and Food Preparation & Serving (70.3%).
| Occupation | Male | Female |
| Healthcare Support | 0 (0.0%) | 156 (100.0%) |
| Security & Protection | 55 (100.0%) | 0 (0.0%) |
| Firefighting & Prevention | 36 (100.0%) | 0 (0.0%) |
| Law Enforcement | 19 (100.0%) | 0 (0.0%) |
| Food Preparation & Serving | 22 (29.7%) | 52 (70.3%) |
| Cleaning & Maintenance | 39 (59.1%) | 27 (40.9%) |
| Personal Care & Service | 0 (0.0%) | 44 (100.0%) |
| Total (Category) | 116 (29.4%) | 279 (70.6%) |
| Total (Overall) | 802 (52.7%) | 719 (47.3%) |
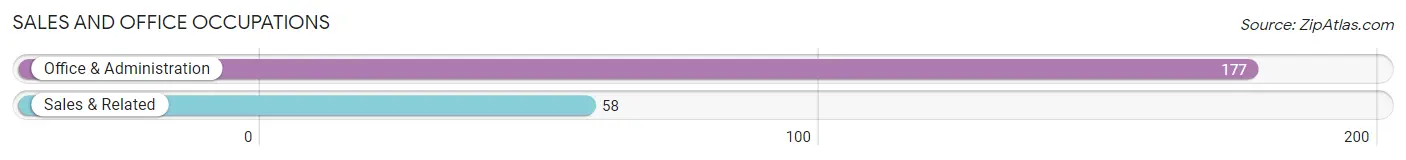
Sales and Office Occupations
The most common Sales and Office occupations in Egypt are Office & Administration (177 | 11.6%), and Sales & Related (58 | 3.8%).
Sales and Office Occupations by Sex
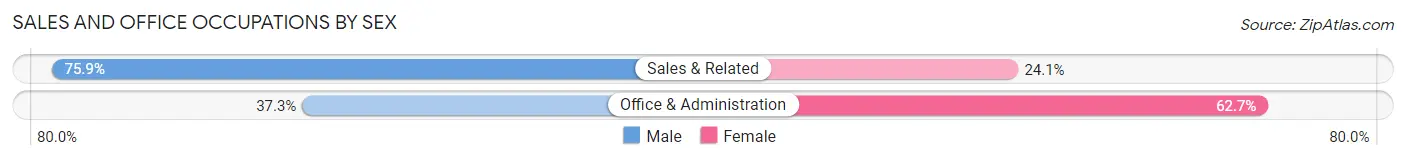
| Occupation | Male | Female |
| Sales & Related | 44 (75.9%) | 14 (24.1%) |
| Office & Administration | 66 (37.3%) | 111 (62.7%) |
| Total (Category) | 110 (46.8%) | 125 (53.2%) |
| Total (Overall) | 802 (52.7%) | 719 (47.3%) |
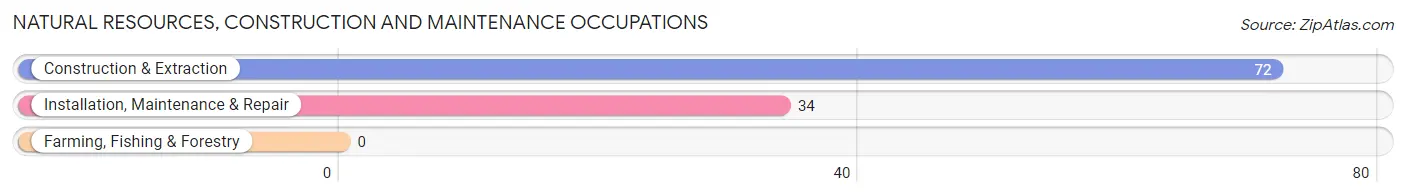
Natural Resources, Construction and Maintenance Occupations
The most common Natural Resources, Construction and Maintenance occupations in Egypt are Construction & Extraction (72 | 4.7%), and Installation, Maintenance & Repair (34 | 2.2%).
Natural Resources, Construction and Maintenance Occupations by Sex
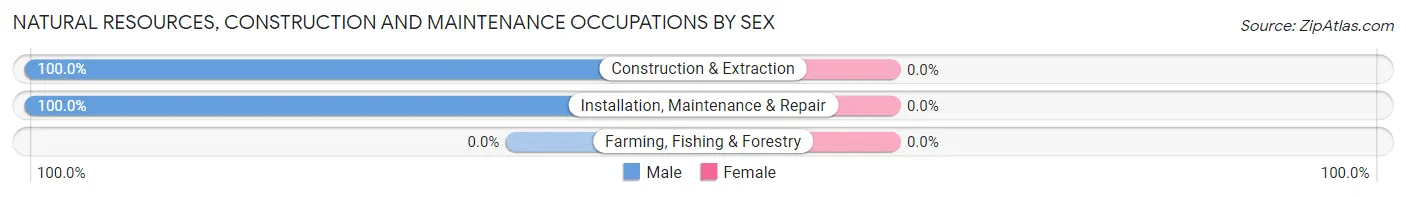
| Occupation | Male | Female |
| Farming, Fishing & Forestry | 0 (0.0%) | 0 (0.0%) |
| Construction & Extraction | 72 (100.0%) | 0 (0.0%) |
| Installation, Maintenance & Repair | 34 (100.0%) | 0 (0.0%) |
| Total (Category) | 106 (100.0%) | 0 (0.0%) |
| Total (Overall) | 802 (52.7%) | 719 (47.3%) |
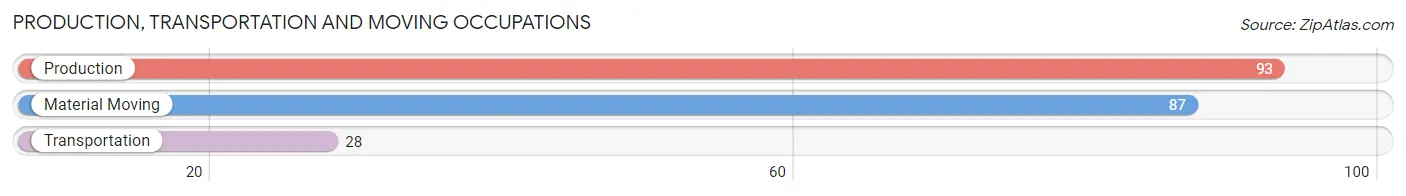
Production, Transportation and Moving Occupations
The most common Production, Transportation and Moving occupations in Egypt are Production (93 | 6.1%), Material Moving (87 | 5.7%), and Transportation (28 | 1.8%).
Production, Transportation and Moving Occupations by Sex
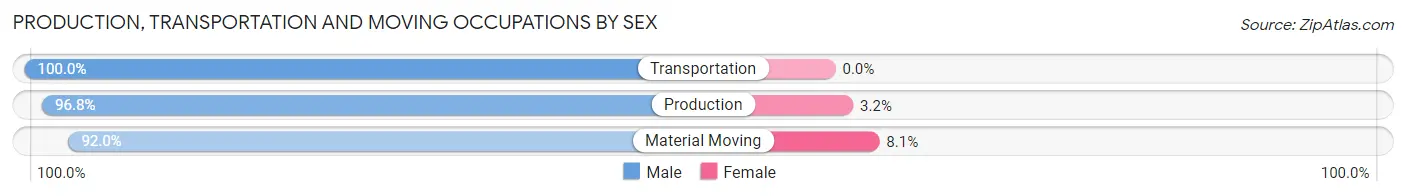
| Occupation | Male | Female |
| Production | 90 (96.8%) | 3 (3.2%) |
| Transportation | 28 (100.0%) | 0 (0.0%) |
| Material Moving | 80 (91.9%) | 7 (8.1%) |
| Total (Category) | 198 (95.2%) | 10 (4.8%) |
| Total (Overall) | 802 (52.7%) | 719 (47.3%) |
Employment Industries by Sex in Egypt
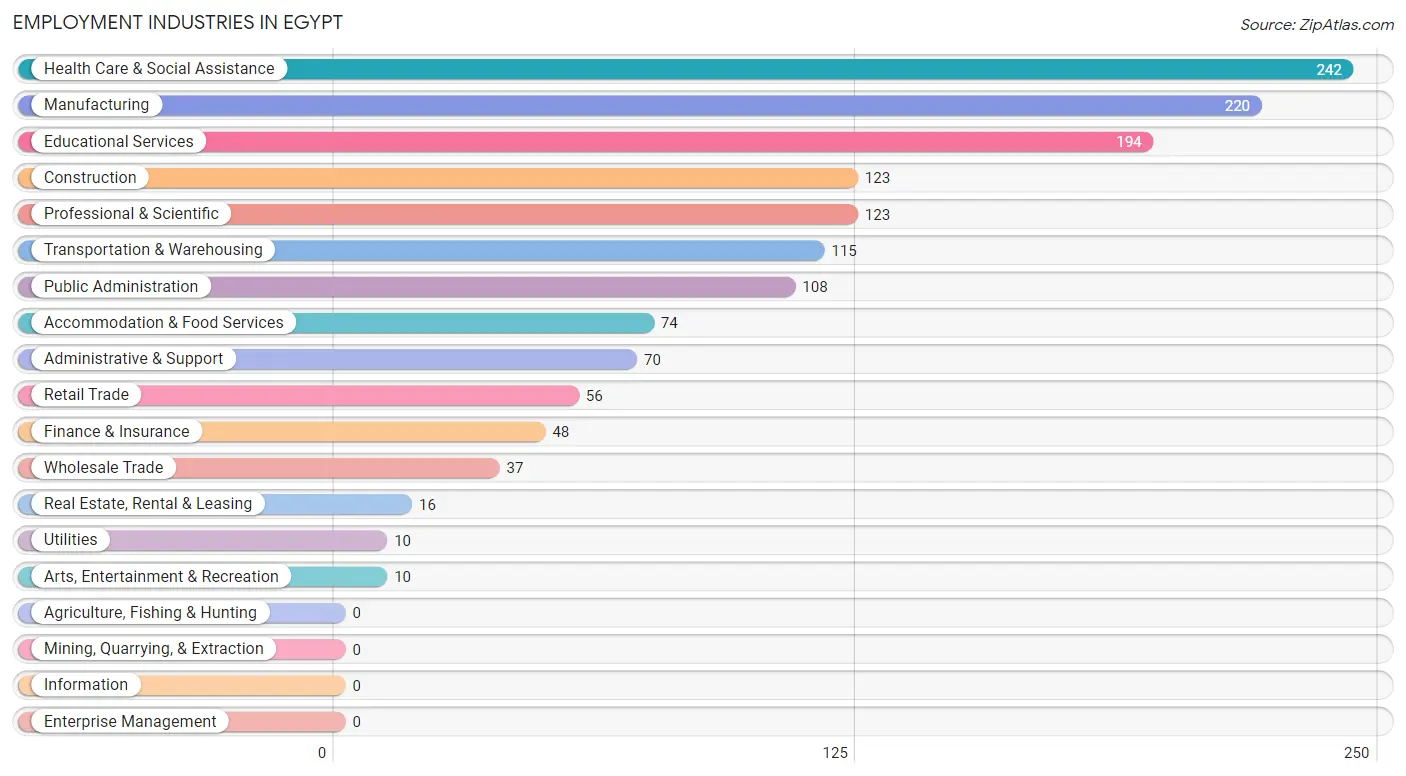
Employment Industries in Egypt
The major employment industries in Egypt include Health Care & Social Assistance (242 | 15.9%), Manufacturing (220 | 14.5%), Educational Services (194 | 12.8%), Construction (123 | 8.1%), and Professional & Scientific (123 | 8.1%).
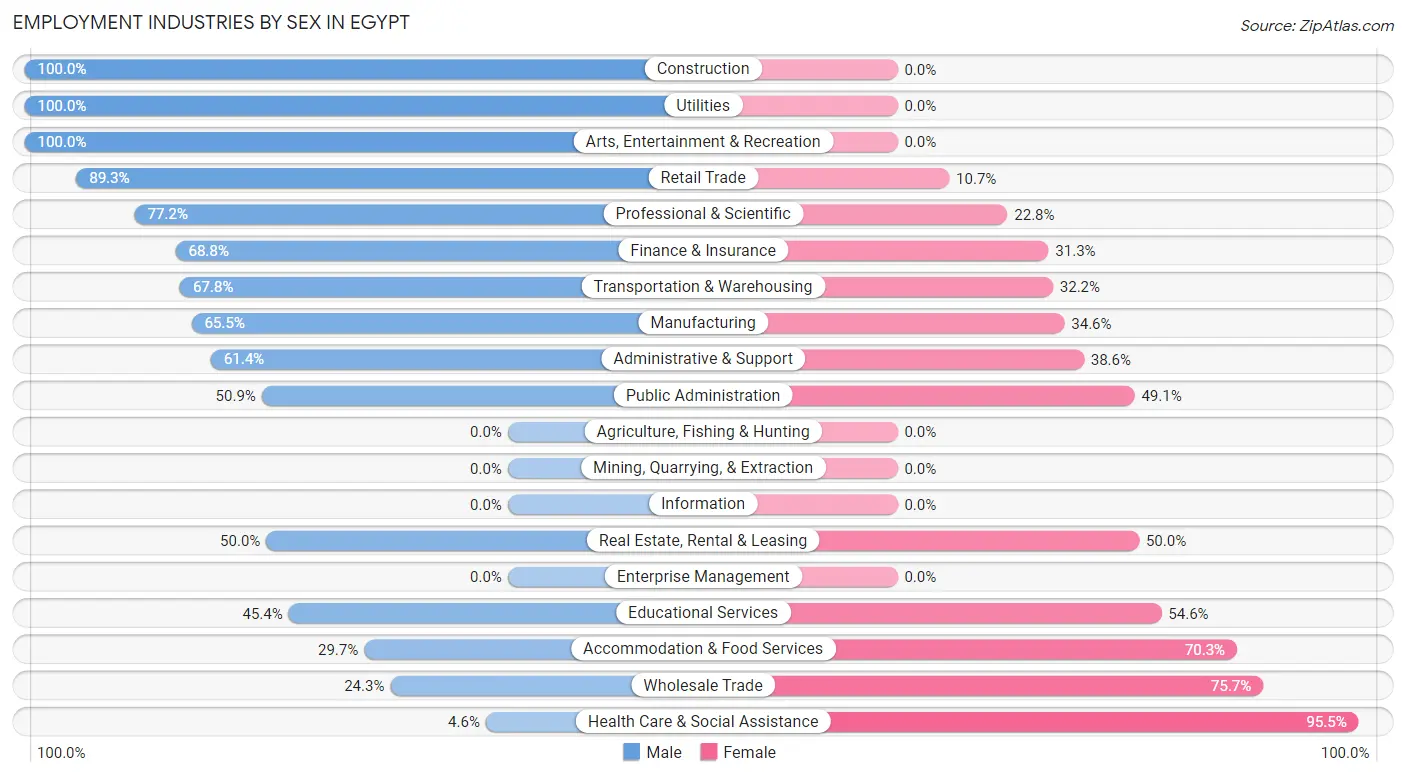
Employment Industries by Sex in Egypt
The Egypt industries that see more men than women are Construction (100.0%), Utilities (100.0%), and Arts, Entertainment & Recreation (100.0%), whereas the industries that tend to have a higher number of women are Health Care & Social Assistance (95.5%), Wholesale Trade (75.7%), and Accommodation & Food Services (70.3%).
| Industry | Male | Female |
| Agriculture, Fishing & Hunting | 0 (0.0%) | 0 (0.0%) |
| Mining, Quarrying, & Extraction | 0 (0.0%) | 0 (0.0%) |
| Construction | 123 (100.0%) | 0 (0.0%) |
| Manufacturing | 144 (65.4%) | 76 (34.5%) |
| Wholesale Trade | 9 (24.3%) | 28 (75.7%) |
| Retail Trade | 50 (89.3%) | 6 (10.7%) |
| Transportation & Warehousing | 78 (67.8%) | 37 (32.2%) |
| Utilities | 10 (100.0%) | 0 (0.0%) |
| Information | 0 (0.0%) | 0 (0.0%) |
| Finance & Insurance | 33 (68.8%) | 15 (31.2%) |
| Real Estate, Rental & Leasing | 8 (50.0%) | 8 (50.0%) |
| Professional & Scientific | 95 (77.2%) | 28 (22.8%) |
| Enterprise Management | 0 (0.0%) | 0 (0.0%) |
| Administrative & Support | 43 (61.4%) | 27 (38.6%) |
| Educational Services | 88 (45.4%) | 106 (54.6%) |
| Health Care & Social Assistance | 11 (4.5%) | 231 (95.5%) |
| Arts, Entertainment & Recreation | 10 (100.0%) | 0 (0.0%) |
| Accommodation & Food Services | 22 (29.7%) | 52 (70.3%) |
| Public Administration | 55 (50.9%) | 53 (49.1%) |
| Total | 802 (52.7%) | 719 (47.3%) |
Education in Egypt
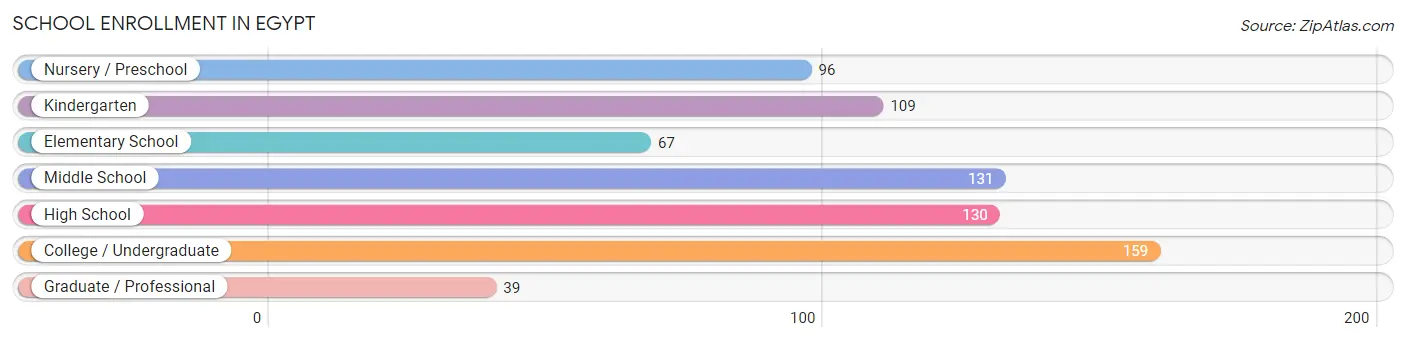
School Enrollment in Egypt
The most common levels of schooling among the 731 students in Egypt are college / undergraduate (159 | 21.7%), middle school (131 | 17.9%), and high school (130 | 17.8%).
| School Level | # Students | % Students |
| Nursery / Preschool | 96 | 13.1% |
| Kindergarten | 109 | 14.9% |
| Elementary School | 67 | 9.2% |
| Middle School | 131 | 17.9% |
| High School | 130 | 17.8% |
| College / Undergraduate | 159 | 21.7% |
| Graduate / Professional | 39 | 5.3% |
| Total | 731 | 100.0% |
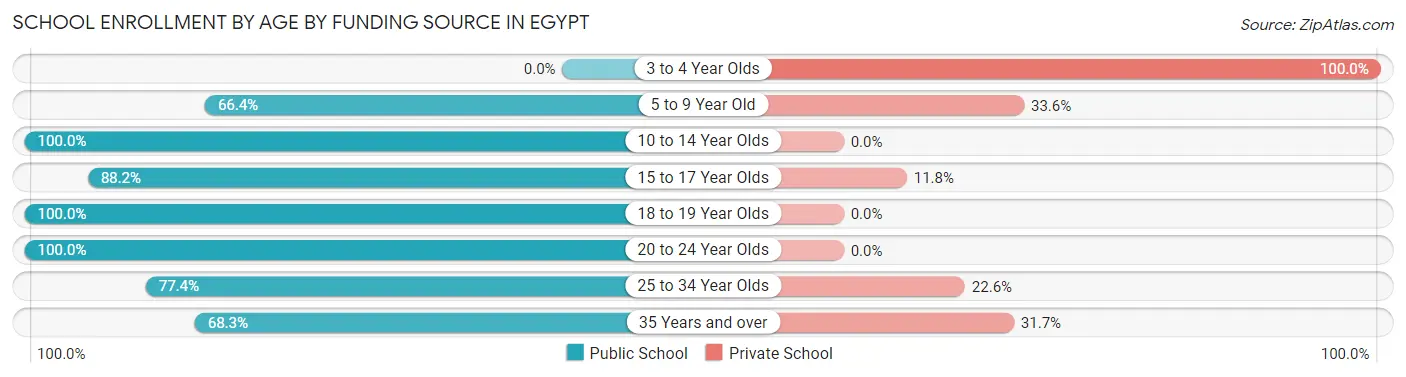
School Enrollment by Age by Funding Source in Egypt
Out of a total of 731 students who are enrolled in schools in Egypt, 135 (18.5%) attend a private institution, while the remaining 596 (81.5%) are enrolled in public schools. The age group of 3 to 4 year olds has the highest likelihood of being enrolled in private schools, with 12 (100.0% in the age bracket) enrolled. Conversely, the age group of 10 to 14 year olds has the lowest likelihood of being enrolled in a private school, with 141 (100.0% in the age bracket) attending a public institution.
| Age Bracket | Public School | Private School |
| 3 to 4 Year Olds | 0 (0.0%) | 12 (100.0%) |
| 5 to 9 Year Old | 166 (66.4%) | 84 (33.6%) |
| 10 to 14 Year Olds | 141 (100.0%) | 0 (0.0%) |
| 15 to 17 Year Olds | 90 (88.2%) | 12 (11.8%) |
| 18 to 19 Year Olds | 39 (100.0%) | 0 (0.0%) |
| 20 to 24 Year Olds | 84 (100.0%) | 0 (0.0%) |
| 25 to 34 Year Olds | 48 (77.4%) | 14 (22.6%) |
| 35 Years and over | 28 (68.3%) | 13 (31.7%) |
| Total | 596 (81.5%) | 135 (18.5%) |
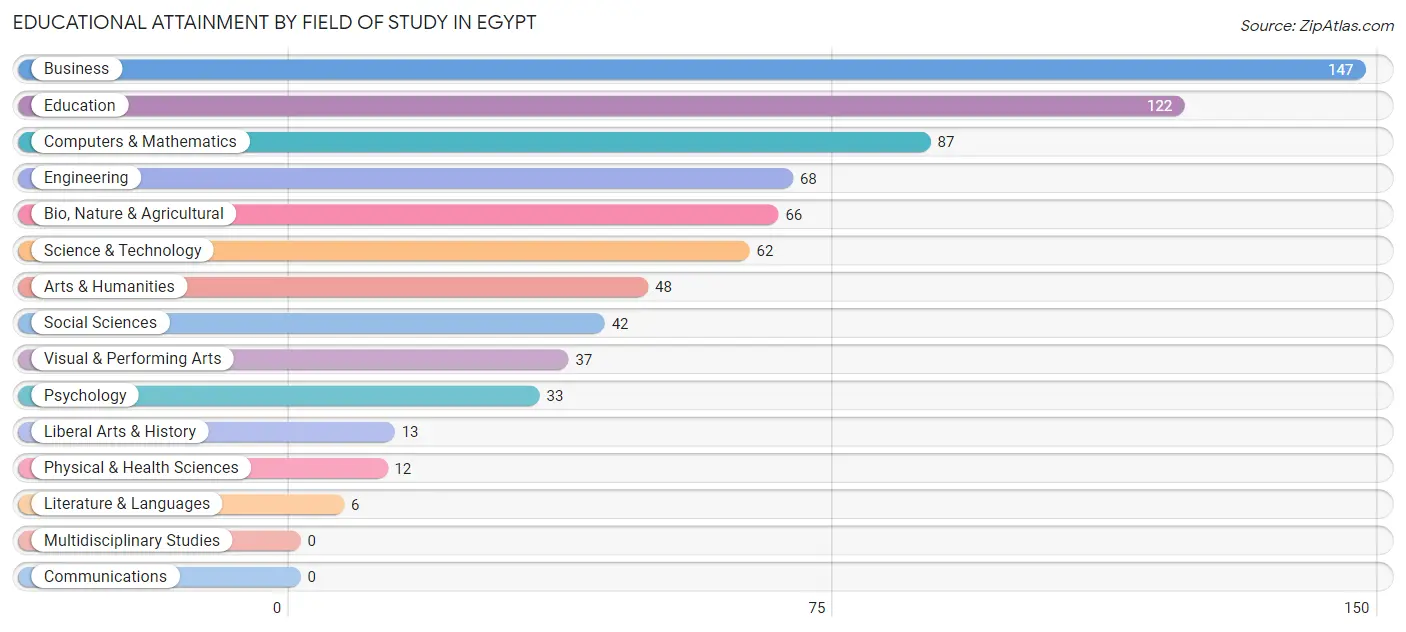
Educational Attainment by Field of Study in Egypt
Business (147 | 19.8%), education (122 | 16.4%), computers & mathematics (87 | 11.7%), engineering (68 | 9.1%), and bio, nature & agricultural (66 | 8.9%) are the most common fields of study among 743 individuals in Egypt who have obtained a bachelor's degree or higher.
| Field of Study | # Graduates | % Graduates |
| Computers & Mathematics | 87 | 11.7% |
| Bio, Nature & Agricultural | 66 | 8.9% |
| Physical & Health Sciences | 12 | 1.6% |
| Psychology | 33 | 4.4% |
| Social Sciences | 42 | 5.7% |
| Engineering | 68 | 9.1% |
| Multidisciplinary Studies | 0 | 0.0% |
| Science & Technology | 62 | 8.3% |
| Business | 147 | 19.8% |
| Education | 122 | 16.4% |
| Literature & Languages | 6 | 0.8% |
| Liberal Arts & History | 13 | 1.8% |
| Visual & Performing Arts | 37 | 5.0% |
| Communications | 0 | 0.0% |
| Arts & Humanities | 48 | 6.5% |
| Total | 743 | 100.0% |
Transportation & Commute in Egypt
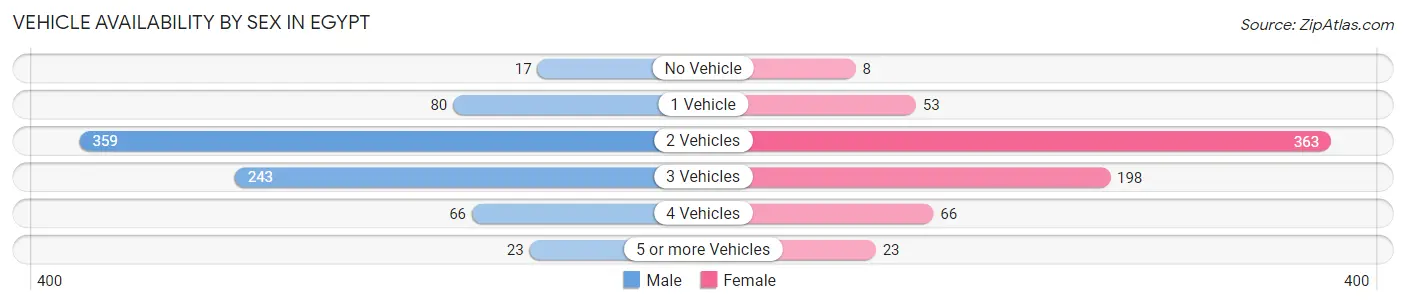
Vehicle Availability by Sex in Egypt
The most prevalent vehicle ownership categories in Egypt are males with 2 vehicles (359, accounting for 45.6%) and females with 2 vehicles (363, making up 50.5%).
| Vehicles Available | Male | Female |
| No Vehicle | 17 (2.2%) | 8 (1.1%) |
| 1 Vehicle | 80 (10.2%) | 53 (7.4%) |
| 2 Vehicles | 359 (45.6%) | 363 (51.0%) |
| 3 Vehicles | 243 (30.8%) | 198 (27.9%) |
| 4 Vehicles | 66 (8.4%) | 66 (9.3%) |
| 5 or more Vehicles | 23 (2.9%) | 23 (3.2%) |
| Total | 788 (100.0%) | 711 (100.0%) |
Commute Time in Egypt
The most frequently occuring commute durations in Egypt are 30 to 34 minutes (251 commuters, 19.2%), 10 to 14 minutes (218 commuters, 16.7%), and 20 to 24 minutes (210 commuters, 16.1%).
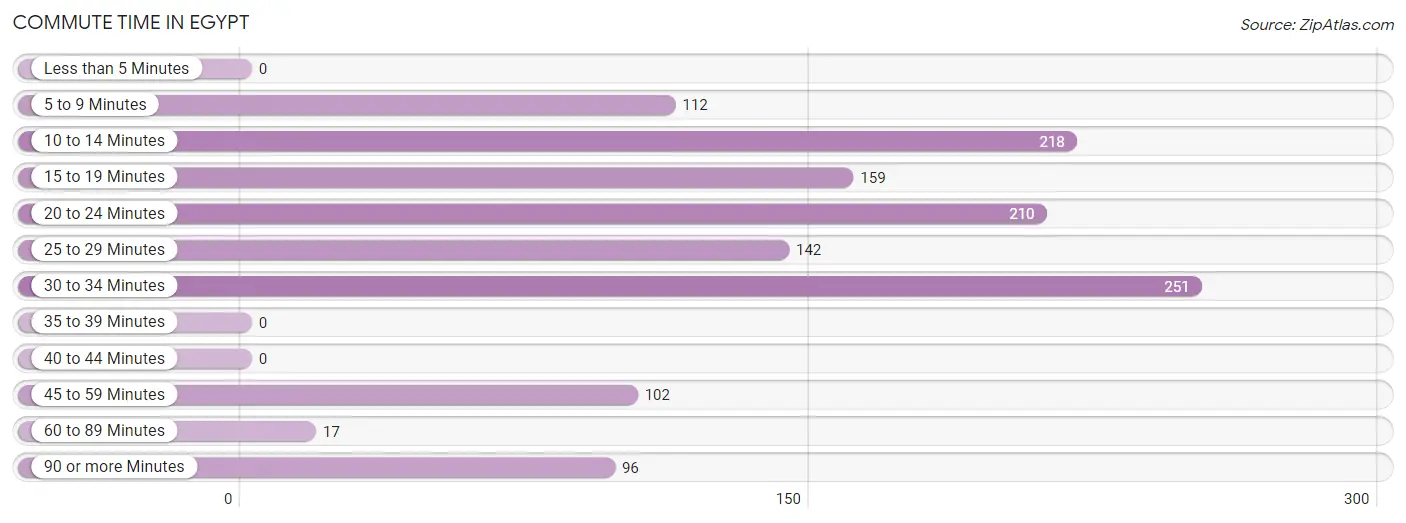
| Commute Time | # Commuters | % Commuters |
| Less than 5 Minutes | 0 | 0.0% |
| 5 to 9 Minutes | 112 | 8.6% |
| 10 to 14 Minutes | 218 | 16.7% |
| 15 to 19 Minutes | 159 | 12.2% |
| 20 to 24 Minutes | 210 | 16.1% |
| 25 to 29 Minutes | 142 | 10.9% |
| 30 to 34 Minutes | 251 | 19.2% |
| 35 to 39 Minutes | 0 | 0.0% |
| 40 to 44 Minutes | 0 | 0.0% |
| 45 to 59 Minutes | 102 | 7.8% |
| 60 to 89 Minutes | 17 | 1.3% |
| 90 or more Minutes | 96 | 7.3% |
Commute Time by Sex in Egypt
The most common commute times in Egypt are 30 to 34 minutes (139 commuters, 20.7%) for males and 20 to 24 minutes (124 commuters, 19.5%) for females.
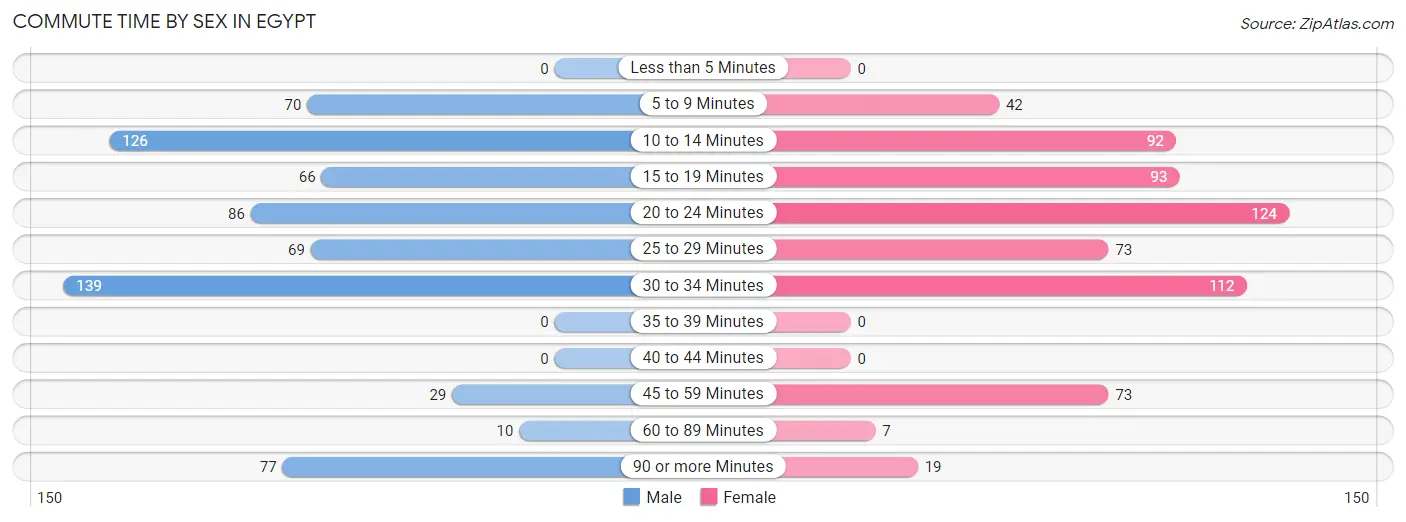
| Commute Time | Male | Female |
| Less than 5 Minutes | 0 (0.0%) | 0 (0.0%) |
| 5 to 9 Minutes | 70 (10.4%) | 42 (6.6%) |
| 10 to 14 Minutes | 126 (18.8%) | 92 (14.5%) |
| 15 to 19 Minutes | 66 (9.8%) | 93 (14.6%) |
| 20 to 24 Minutes | 86 (12.8%) | 124 (19.5%) |
| 25 to 29 Minutes | 69 (10.3%) | 73 (11.5%) |
| 30 to 34 Minutes | 139 (20.7%) | 112 (17.6%) |
| 35 to 39 Minutes | 0 (0.0%) | 0 (0.0%) |
| 40 to 44 Minutes | 0 (0.0%) | 0 (0.0%) |
| 45 to 59 Minutes | 29 (4.3%) | 73 (11.5%) |
| 60 to 89 Minutes | 10 (1.5%) | 7 (1.1%) |
| 90 or more Minutes | 77 (11.5%) | 19 (3.0%) |
Time of Departure to Work by Sex in Egypt
The most frequent times of departure to work in Egypt are 7:30 AM to 7:59 AM (130, 19.4%) for males and 7:30 AM to 7:59 AM (180, 28.3%) for females.
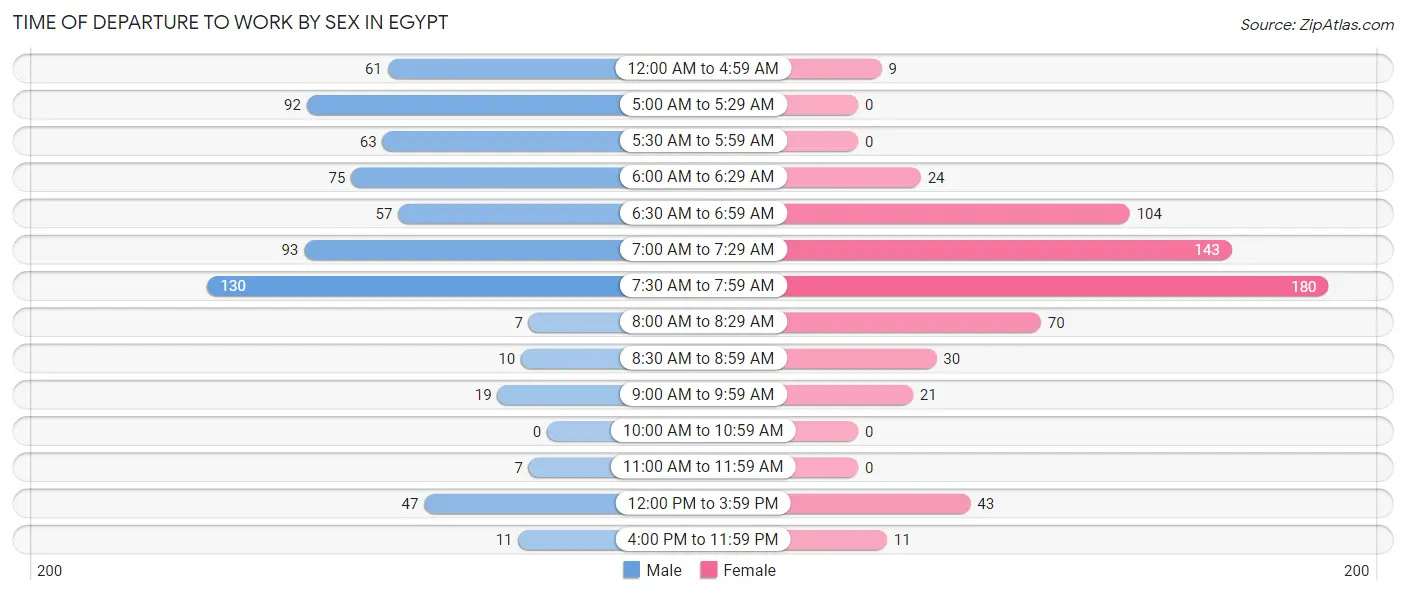
| Time of Departure | Male | Female |
| 12:00 AM to 4:59 AM | 61 (9.1%) | 9 (1.4%) |
| 5:00 AM to 5:29 AM | 92 (13.7%) | 0 (0.0%) |
| 5:30 AM to 5:59 AM | 63 (9.4%) | 0 (0.0%) |
| 6:00 AM to 6:29 AM | 75 (11.2%) | 24 (3.8%) |
| 6:30 AM to 6:59 AM | 57 (8.5%) | 104 (16.4%) |
| 7:00 AM to 7:29 AM | 93 (13.8%) | 143 (22.5%) |
| 7:30 AM to 7:59 AM | 130 (19.4%) | 180 (28.3%) |
| 8:00 AM to 8:29 AM | 7 (1.0%) | 70 (11.0%) |
| 8:30 AM to 8:59 AM | 10 (1.5%) | 30 (4.7%) |
| 9:00 AM to 9:59 AM | 19 (2.8%) | 21 (3.3%) |
| 10:00 AM to 10:59 AM | 0 (0.0%) | 0 (0.0%) |
| 11:00 AM to 11:59 AM | 7 (1.0%) | 0 (0.0%) |
| 12:00 PM to 3:59 PM | 47 (7.0%) | 43 (6.8%) |
| 4:00 PM to 11:59 PM | 11 (1.6%) | 11 (1.7%) |
| Total | 672 (100.0%) | 635 (100.0%) |
Housing Occupancy in Egypt
Occupancy by Ownership in Egypt
Of the total 1,103 dwellings in Egypt, owner-occupied units account for 994 (90.1%), while renter-occupied units make up 109 (9.9%).
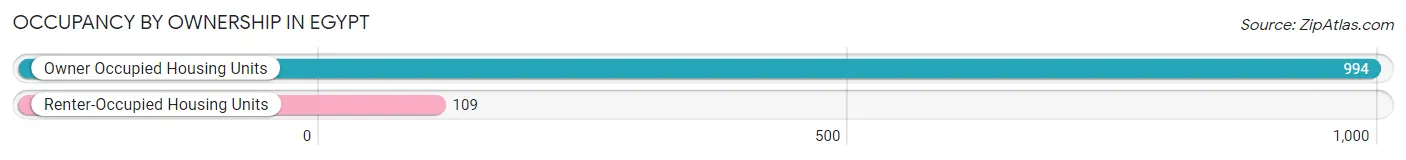
| Occupancy | # Housing Units | % Housing Units |
| Owner Occupied Housing Units | 994 | 90.1% |
| Renter-Occupied Housing Units | 109 | 9.9% |
| Total Occupied Housing Units | 1,103 | 100.0% |
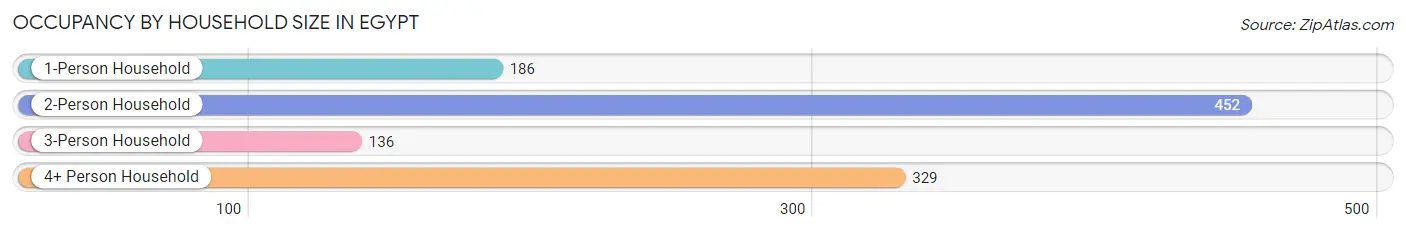
Occupancy by Household Size in Egypt
| Household Size | # Housing Units | % Housing Units |
| 1-Person Household | 186 | 16.9% |
| 2-Person Household | 452 | 41.0% |
| 3-Person Household | 136 | 12.3% |
| 4+ Person Household | 329 | 29.8% |
| Total Housing Units | 1,103 | 100.0% |
Occupancy by Ownership by Household Size in Egypt
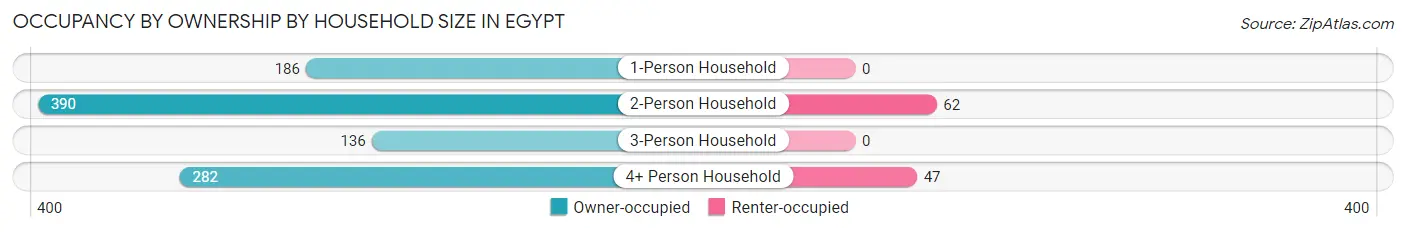
| Household Size | Owner-occupied | Renter-occupied |
| 1-Person Household | 186 (100.0%) | 0 (0.0%) |
| 2-Person Household | 390 (86.3%) | 62 (13.7%) |
| 3-Person Household | 136 (100.0%) | 0 (0.0%) |
| 4+ Person Household | 282 (85.7%) | 47 (14.3%) |
| Total Housing Units | 994 (90.1%) | 109 (9.9%) |
Occupancy by Educational Attainment in Egypt
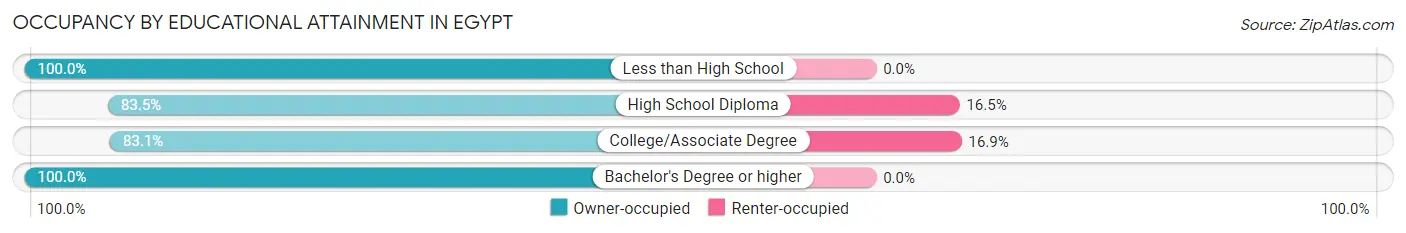
| Household Size | Owner-occupied | Renter-occupied |
| Less than High School | 65 (100.0%) | 0 (0.0%) |
| High School Diploma | 379 (83.5%) | 75 (16.5%) |
| College/Associate Degree | 167 (83.1%) | 34 (16.9%) |
| Bachelor's Degree or higher | 383 (100.0%) | 0 (0.0%) |
Occupancy by Age of Householder in Egypt
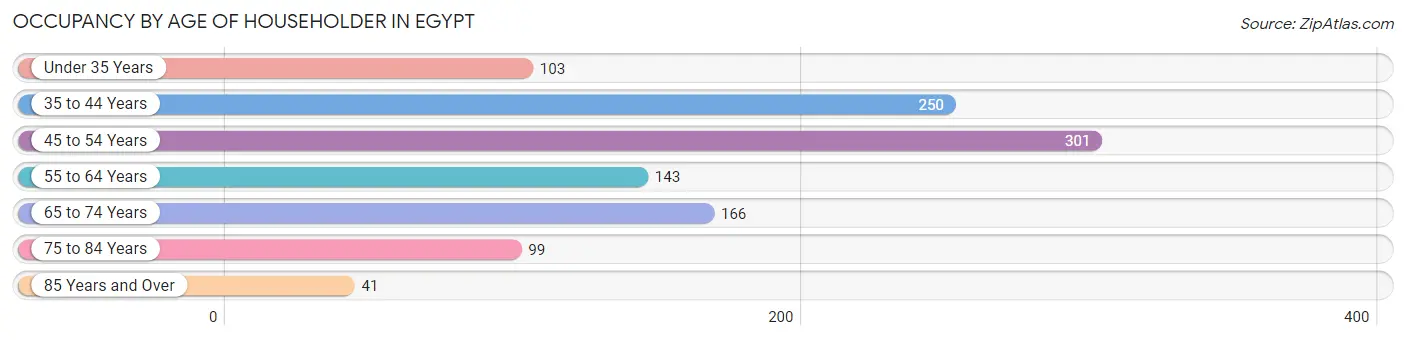
| Age Bracket | # Households | % Households |
| Under 35 Years | 103 | 9.3% |
| 35 to 44 Years | 250 | 22.7% |
| 45 to 54 Years | 301 | 27.3% |
| 55 to 64 Years | 143 | 13.0% |
| 65 to 74 Years | 166 | 15.0% |
| 75 to 84 Years | 99 | 9.0% |
| 85 Years and Over | 41 | 3.7% |
| Total | 1,103 | 100.0% |
Housing Finances in Egypt
Median Income by Occupancy in Egypt
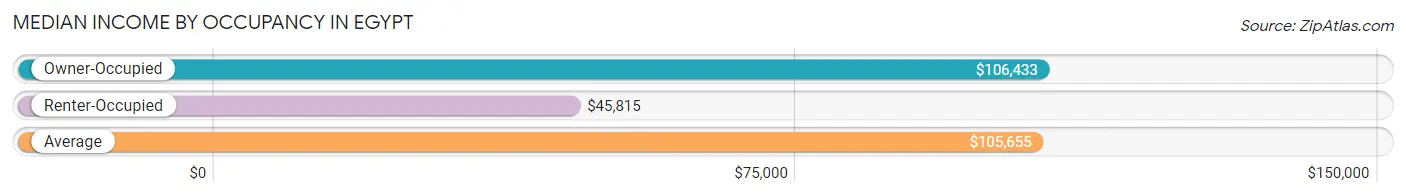
| Occupancy Type | # Households | Median Income |
| Owner-Occupied | 994 (90.1%) | $106,433 |
| Renter-Occupied | 109 (9.9%) | $45,815 |
| Average | 1,103 (100.0%) | $105,655 |
Occupancy by Householder Income Bracket in Egypt
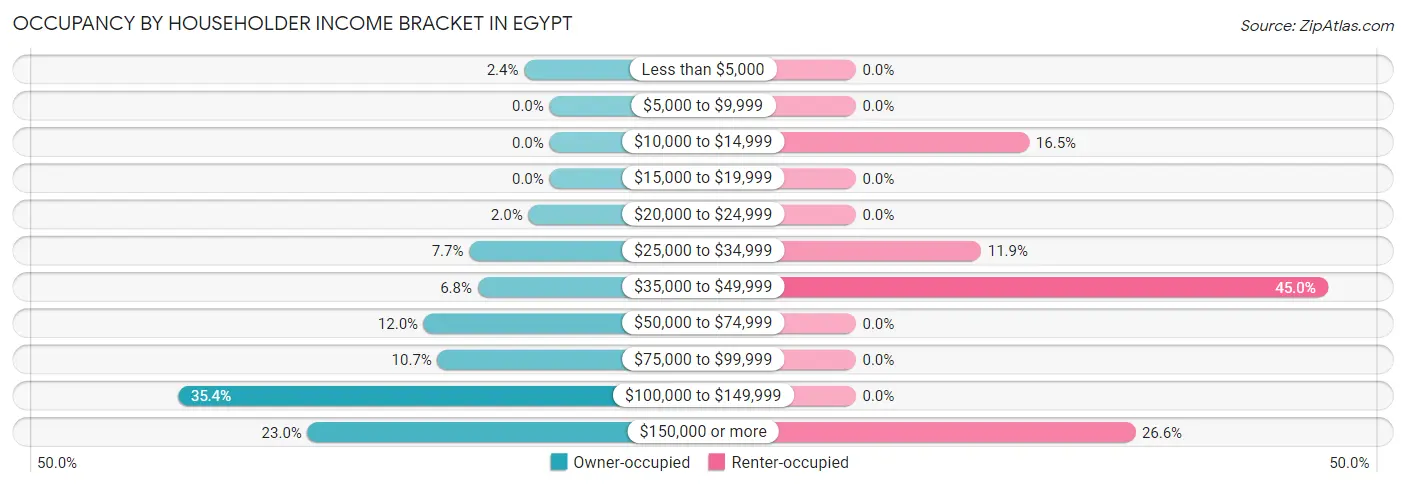
| Income Bracket | Owner-occupied | Renter-occupied |
| Less than $5,000 | 24 (2.4%) | 0 (0.0%) |
| $5,000 to $9,999 | 0 (0.0%) | 0 (0.0%) |
| $10,000 to $14,999 | 0 (0.0%) | 18 (16.5%) |
| $15,000 to $19,999 | 0 (0.0%) | 0 (0.0%) |
| $20,000 to $24,999 | 20 (2.0%) | 0 (0.0%) |
| $25,000 to $34,999 | 76 (7.6%) | 13 (11.9%) |
| $35,000 to $49,999 | 68 (6.8%) | 49 (45.0%) |
| $50,000 to $74,999 | 119 (12.0%) | 0 (0.0%) |
| $75,000 to $99,999 | 106 (10.7%) | 0 (0.0%) |
| $100,000 to $149,999 | 352 (35.4%) | 0 (0.0%) |
| $150,000 or more | 229 (23.0%) | 29 (26.6%) |
| Total | 994 (100.0%) | 109 (100.0%) |
Monthly Housing Cost Tiers in Egypt
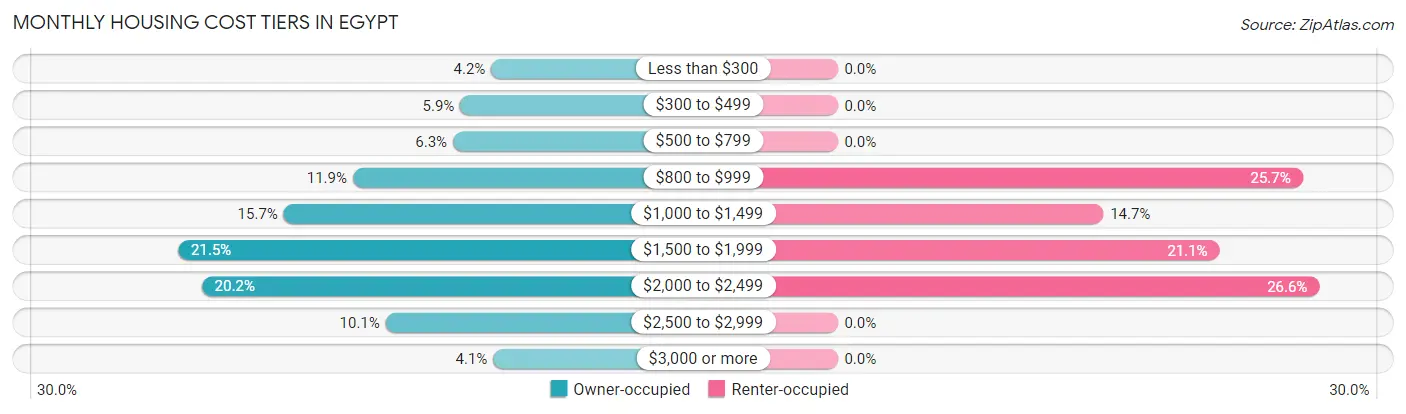
| Monthly Cost | Owner-occupied | Renter-occupied |
| Less than $300 | 42 (4.2%) | 0 (0.0%) |
| $300 to $499 | 59 (5.9%) | 0 (0.0%) |
| $500 to $799 | 63 (6.3%) | 0 (0.0%) |
| $800 to $999 | 118 (11.9%) | 28 (25.7%) |
| $1,000 to $1,499 | 156 (15.7%) | 16 (14.7%) |
| $1,500 to $1,999 | 214 (21.5%) | 23 (21.1%) |
| $2,000 to $2,499 | 201 (20.2%) | 29 (26.6%) |
| $2,500 to $2,999 | 100 (10.1%) | 0 (0.0%) |
| $3,000 or more | 41 (4.1%) | 0 (0.0%) |
| Total | 994 (100.0%) | 109 (100.0%) |
Physical Housing Characteristics in Egypt
Housing Structures in Egypt
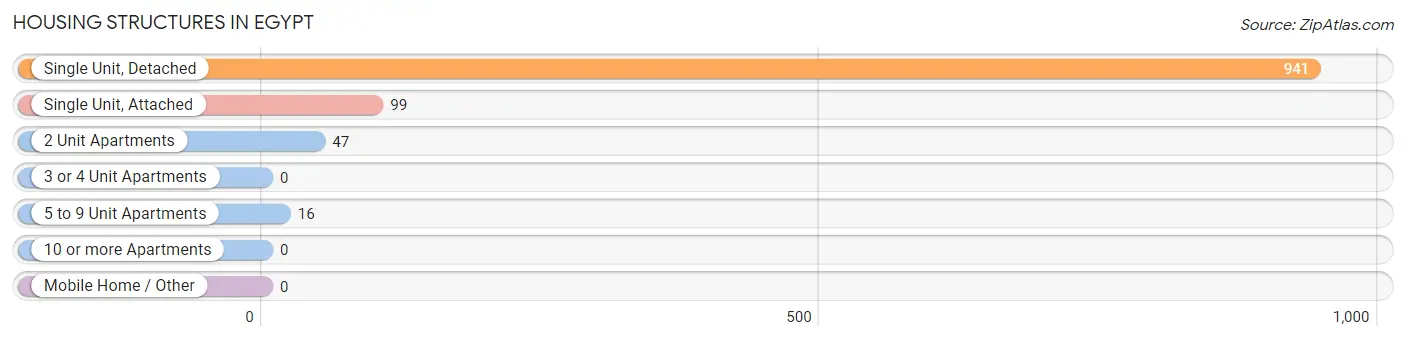
| Structure Type | # Housing Units | % Housing Units |
| Single Unit, Detached | 941 | 85.3% |
| Single Unit, Attached | 99 | 9.0% |
| 2 Unit Apartments | 47 | 4.3% |
| 3 or 4 Unit Apartments | 0 | 0.0% |
| 5 to 9 Unit Apartments | 16 | 1.5% |
| 10 or more Apartments | 0 | 0.0% |
| Mobile Home / Other | 0 | 0.0% |
| Total | 1,103 | 100.0% |
Housing Structures by Occupancy in Egypt
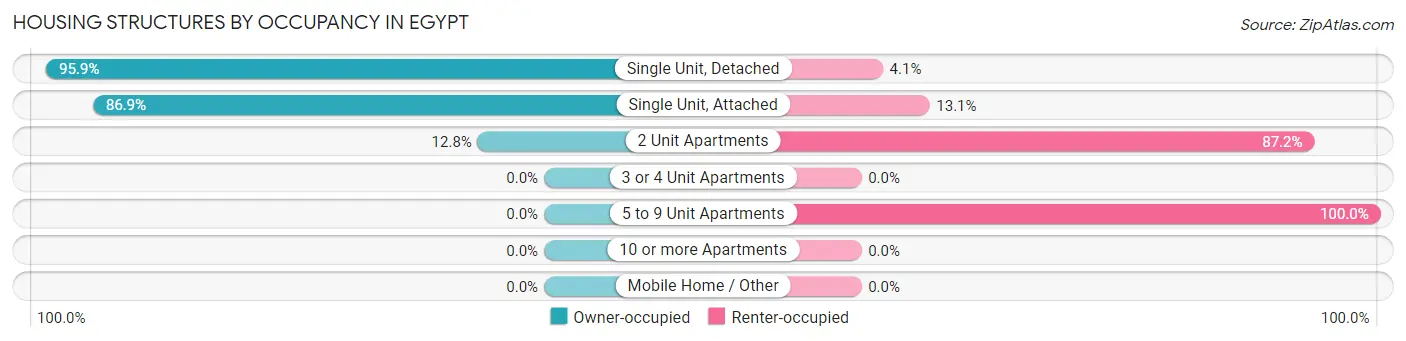
| Structure Type | Owner-occupied | Renter-occupied |
| Single Unit, Detached | 902 (95.9%) | 39 (4.1%) |
| Single Unit, Attached | 86 (86.9%) | 13 (13.1%) |
| 2 Unit Apartments | 6 (12.8%) | 41 (87.2%) |
| 3 or 4 Unit Apartments | 0 (0.0%) | 0 (0.0%) |
| 5 to 9 Unit Apartments | 0 (0.0%) | 16 (100.0%) |
| 10 or more Apartments | 0 (0.0%) | 0 (0.0%) |
| Mobile Home / Other | 0 (0.0%) | 0 (0.0%) |
| Total | 994 (90.1%) | 109 (9.9%) |
Housing Structures by Number of Rooms in Egypt
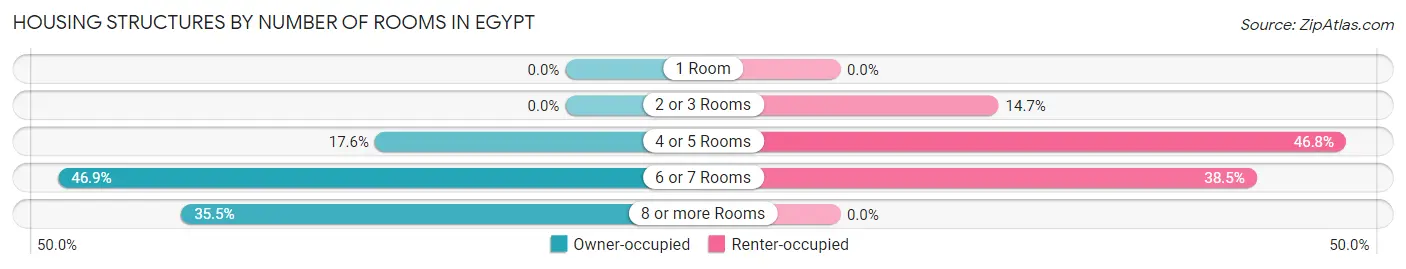
| Number of Rooms | Owner-occupied | Renter-occupied |
| 1 Room | 0 (0.0%) | 0 (0.0%) |
| 2 or 3 Rooms | 0 (0.0%) | 16 (14.7%) |
| 4 or 5 Rooms | 175 (17.6%) | 51 (46.8%) |
| 6 or 7 Rooms | 466 (46.9%) | 42 (38.5%) |
| 8 or more Rooms | 353 (35.5%) | 0 (0.0%) |
| Total | 994 (100.0%) | 109 (100.0%) |
Housing Structure by Heating Type in Egypt
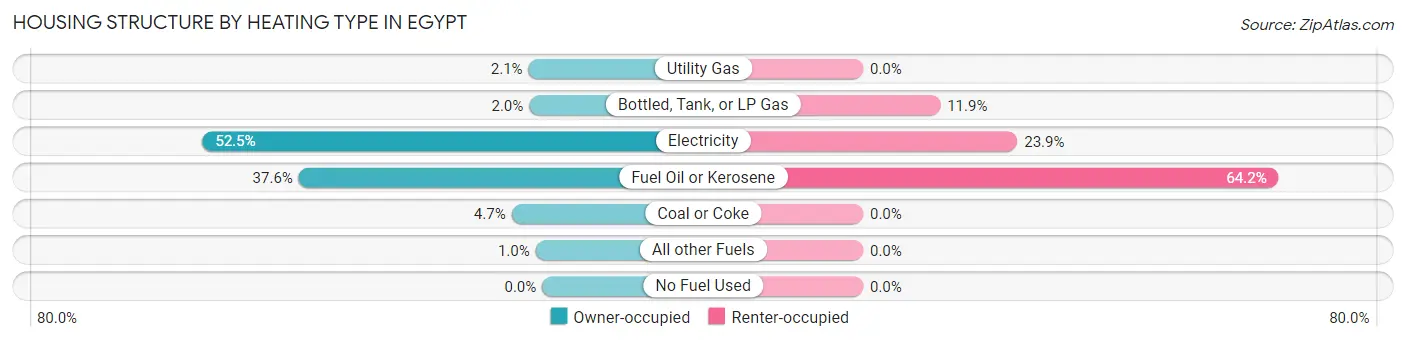
| Heating Type | Owner-occupied | Renter-occupied |
| Utility Gas | 21 (2.1%) | 0 (0.0%) |
| Bottled, Tank, or LP Gas | 20 (2.0%) | 13 (11.9%) |
| Electricity | 522 (52.5%) | 26 (23.8%) |
| Fuel Oil or Kerosene | 374 (37.6%) | 70 (64.2%) |
| Coal or Coke | 47 (4.7%) | 0 (0.0%) |
| All other Fuels | 10 (1.0%) | 0 (0.0%) |
| No Fuel Used | 0 (0.0%) | 0 (0.0%) |
| Total | 994 (100.0%) | 109 (100.0%) |
Household Vehicle Usage in Egypt
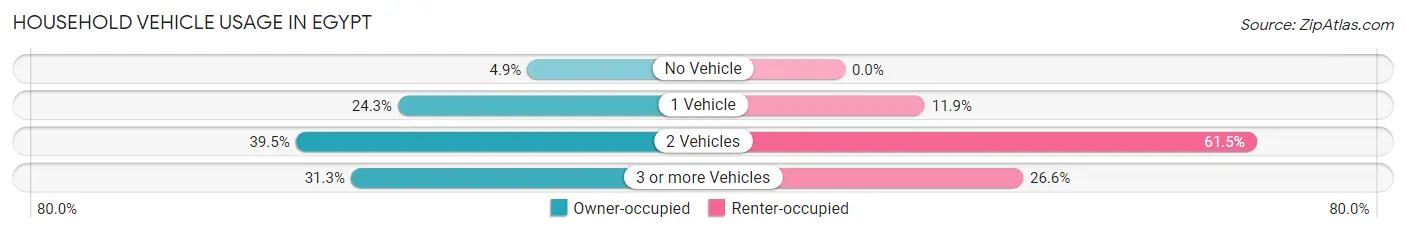
| Vehicles per Household | Owner-occupied | Renter-occupied |
| No Vehicle | 49 (4.9%) | 0 (0.0%) |
| 1 Vehicle | 241 (24.2%) | 13 (11.9%) |
| 2 Vehicles | 393 (39.5%) | 67 (61.5%) |
| 3 or more Vehicles | 311 (31.3%) | 29 (26.6%) |
| Total | 994 (100.0%) | 109 (100.0%) |
Real Estate & Mortgages in Egypt
Real Estate and Mortgage Overview in Egypt
| Characteristic | Without Mortgage | With Mortgage |
| Housing Units | 322 | 672 |
| Median Property Value | $266,900 | $294,000 |
| Median Household Income | $63,750 | $208 |
| Monthly Housing Costs | $775 | $41 |
| Real Estate Taxes | $4,958 | $0 |
Property Value by Mortgage Status in Egypt
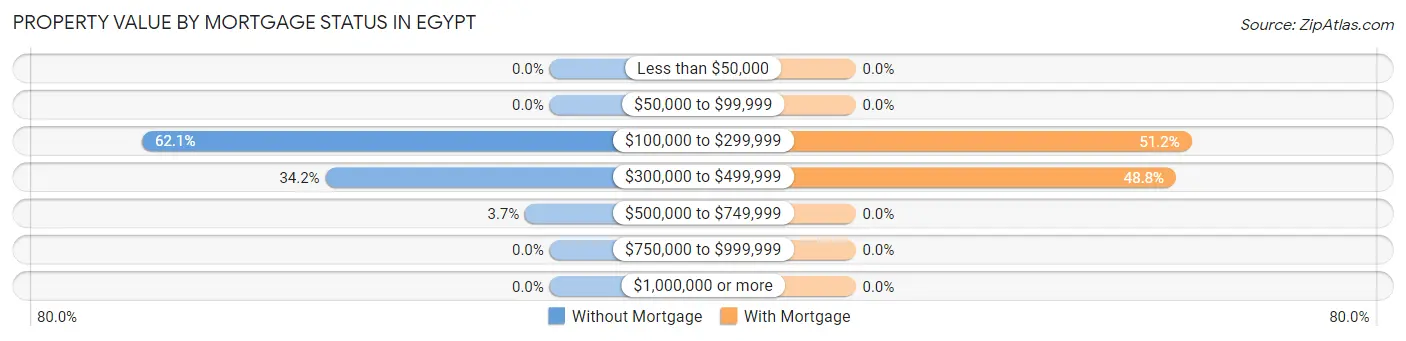
| Property Value | Without Mortgage | With Mortgage |
| Less than $50,000 | 0 (0.0%) | 0 (0.0%) |
| $50,000 to $99,999 | 0 (0.0%) | 0 (0.0%) |
| $100,000 to $299,999 | 200 (62.1%) | 344 (51.2%) |
| $300,000 to $499,999 | 110 (34.2%) | 328 (48.8%) |
| $500,000 to $749,999 | 12 (3.7%) | 0 (0.0%) |
| $750,000 to $999,999 | 0 (0.0%) | 0 (0.0%) |
| $1,000,000 or more | 0 (0.0%) | 0 (0.0%) |
| Total | 322 (100.0%) | 672 (100.0%) |
Household Income by Mortgage Status in Egypt
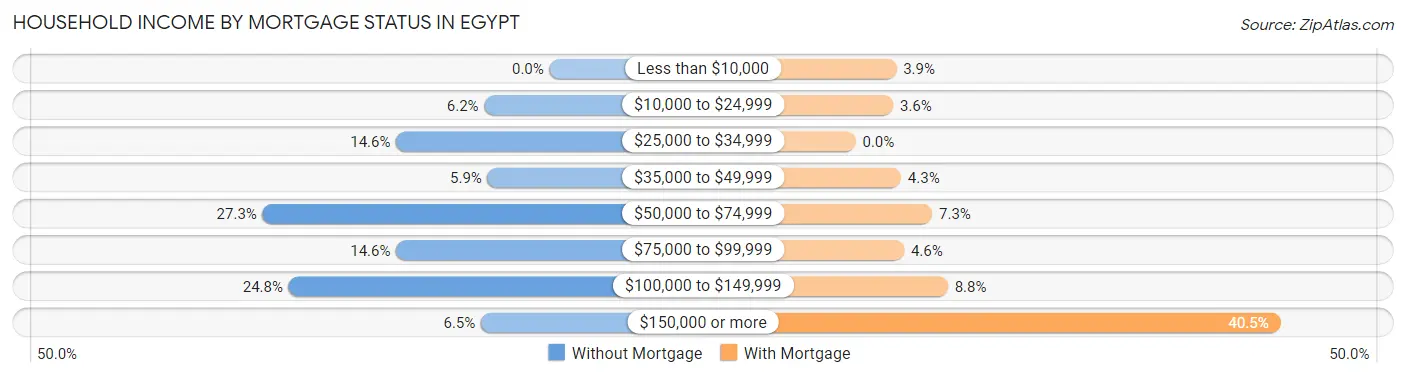
| Household Income | Without Mortgage | With Mortgage |
| Less than $10,000 | 0 (0.0%) | 26 (3.9%) |
| $10,000 to $24,999 | 20 (6.2%) | 24 (3.6%) |
| $25,000 to $34,999 | 47 (14.6%) | 0 (0.0%) |
| $35,000 to $49,999 | 19 (5.9%) | 29 (4.3%) |
| $50,000 to $74,999 | 88 (27.3%) | 49 (7.3%) |
| $75,000 to $99,999 | 47 (14.6%) | 31 (4.6%) |
| $100,000 to $149,999 | 80 (24.8%) | 59 (8.8%) |
| $150,000 or more | 21 (6.5%) | 272 (40.5%) |
| Total | 322 (100.0%) | 672 (100.0%) |
Property Value to Household Income Ratio in Egypt
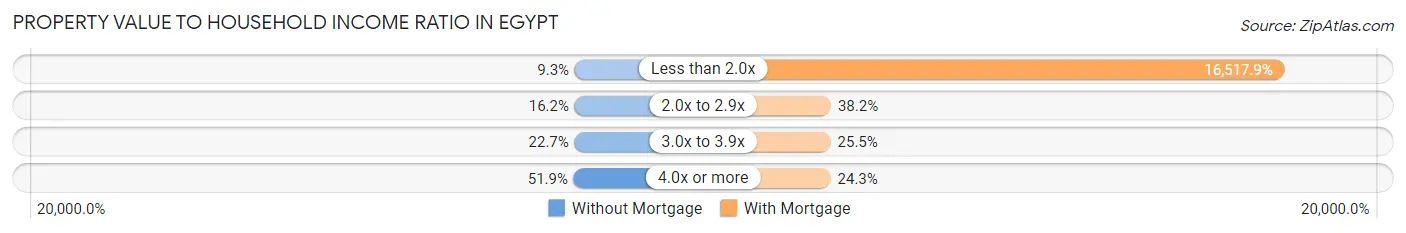
| Value-to-Income Ratio | Without Mortgage | With Mortgage |
| Less than 2.0x | 30 (9.3%) | 111,000 (16,517.9%) |
| 2.0x to 2.9x | 52 (16.2%) | 257 (38.2%) |
| 3.0x to 3.9x | 73 (22.7%) | 171 (25.5%) |
| 4.0x or more | 167 (51.9%) | 163 (24.3%) |
| Total | 322 (100.0%) | 672 (100.0%) |
Real Estate Taxes by Mortgage Status in Egypt
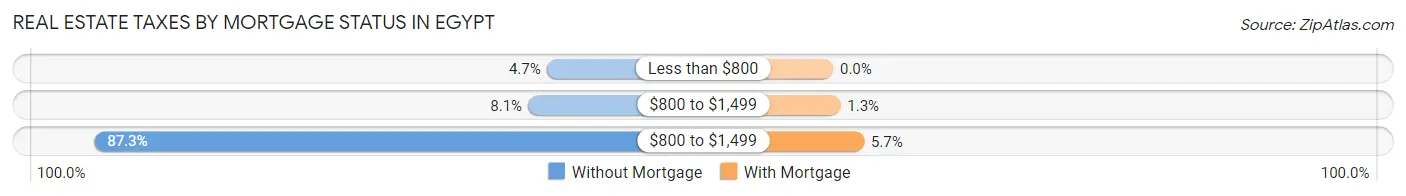
| Property Taxes | Without Mortgage | With Mortgage |
| Less than $800 | 15 (4.7%) | 0 (0.0%) |
| $800 to $1,499 | 26 (8.1%) | 9 (1.3%) |
| $800 to $1,499 | 281 (87.3%) | 38 (5.7%) |
| Total | 322 (100.0%) | 672 (100.0%) |
Health & Disability in Egypt
Health Insurance Coverage by Age in Egypt
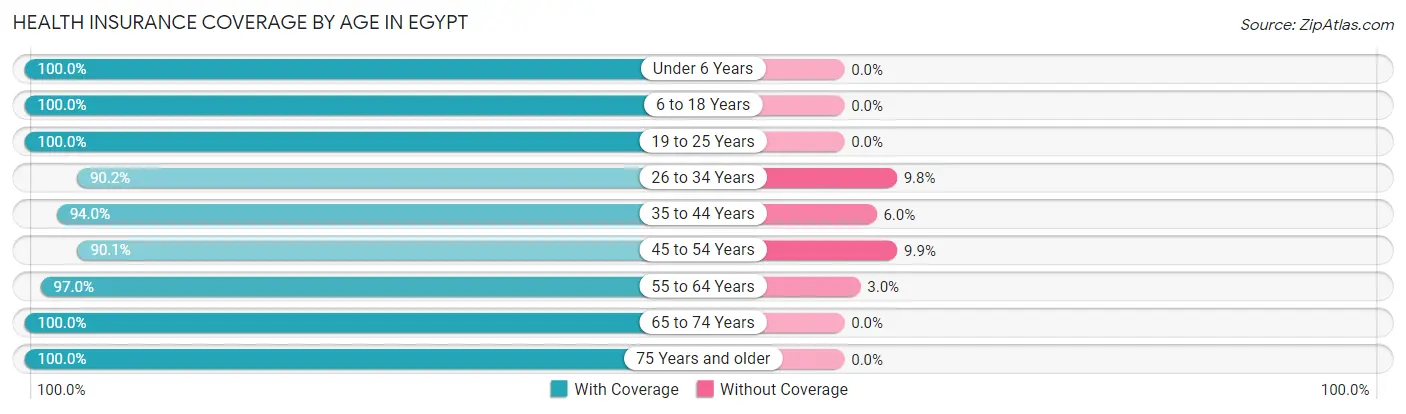
| Age Bracket | With Coverage | Without Coverage |
| Under 6 Years | 299 (100.0%) | 0 (0.0%) |
| 6 to 18 Years | 407 (100.0%) | 0 (0.0%) |
| 19 to 25 Years | 307 (100.0%) | 0 (0.0%) |
| 26 to 34 Years | 240 (90.2%) | 26 (9.8%) |
| 35 to 44 Years | 423 (94.0%) | 27 (6.0%) |
| 45 to 54 Years | 384 (90.1%) | 42 (9.9%) |
| 55 to 64 Years | 323 (97.0%) | 10 (3.0%) |
| 65 to 74 Years | 246 (100.0%) | 0 (0.0%) |
| 75 Years and older | 264 (100.0%) | 0 (0.0%) |
| Total | 2,893 (96.5%) | 105 (3.5%) |
Health Insurance Coverage by Citizenship Status in Egypt
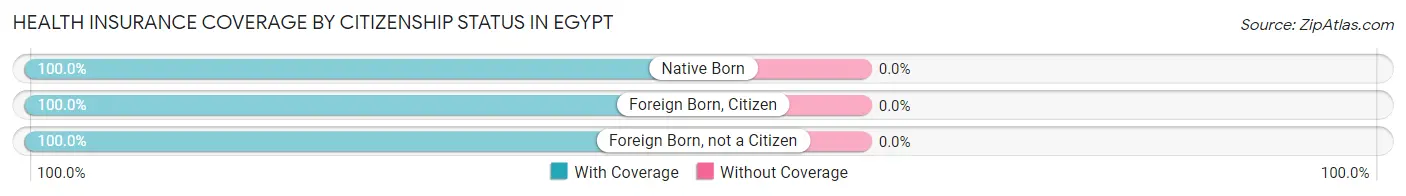
| Citizenship Status | With Coverage | Without Coverage |
| Native Born | 299 (100.0%) | 0 (0.0%) |
| Foreign Born, Citizen | 407 (100.0%) | 0 (0.0%) |
| Foreign Born, not a Citizen | 307 (100.0%) | 0 (0.0%) |
Health Insurance Coverage by Household Income in Egypt
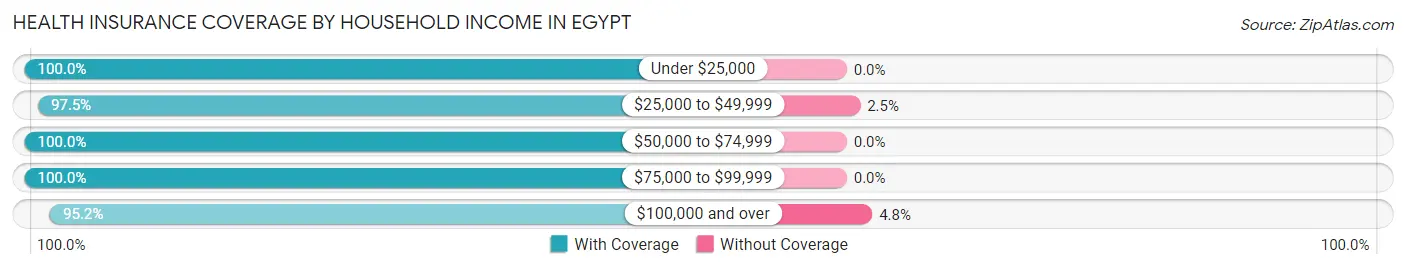
| Household Income | With Coverage | Without Coverage |
| Under $25,000 | 124 (100.0%) | 0 (0.0%) |
| $25,000 to $49,999 | 388 (97.5%) | 10 (2.5%) |
| $50,000 to $74,999 | 256 (100.0%) | 0 (0.0%) |
| $75,000 to $99,999 | 227 (100.0%) | 0 (0.0%) |
| $100,000 and over | 1,898 (95.2%) | 95 (4.8%) |
Public vs Private Health Insurance Coverage by Age in Egypt
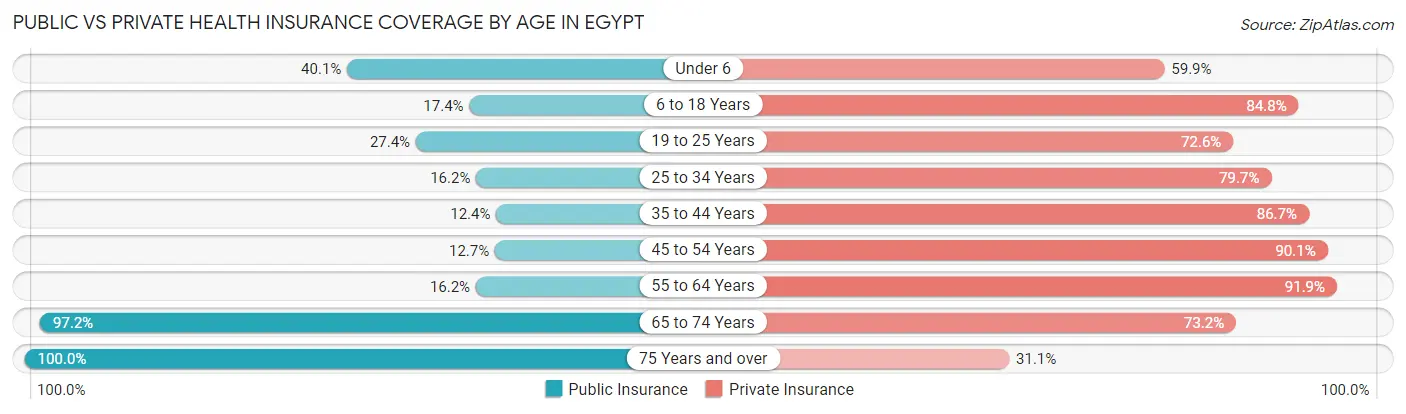
| Age Bracket | Public Insurance | Private Insurance |
| Under 6 | 120 (40.1%) | 179 (59.9%) |
| 6 to 18 Years | 71 (17.4%) | 345 (84.8%) |
| 19 to 25 Years | 84 (27.4%) | 223 (72.6%) |
| 25 to 34 Years | 43 (16.2%) | 212 (79.7%) |
| 35 to 44 Years | 56 (12.4%) | 390 (86.7%) |
| 45 to 54 Years | 54 (12.7%) | 384 (90.1%) |
| 55 to 64 Years | 54 (16.2%) | 306 (91.9%) |
| 65 to 74 Years | 239 (97.2%) | 180 (73.2%) |
| 75 Years and over | 264 (100.0%) | 82 (31.1%) |
| Total | 985 (32.9%) | 2,301 (76.7%) |
Disability Status by Sex by Age in Egypt
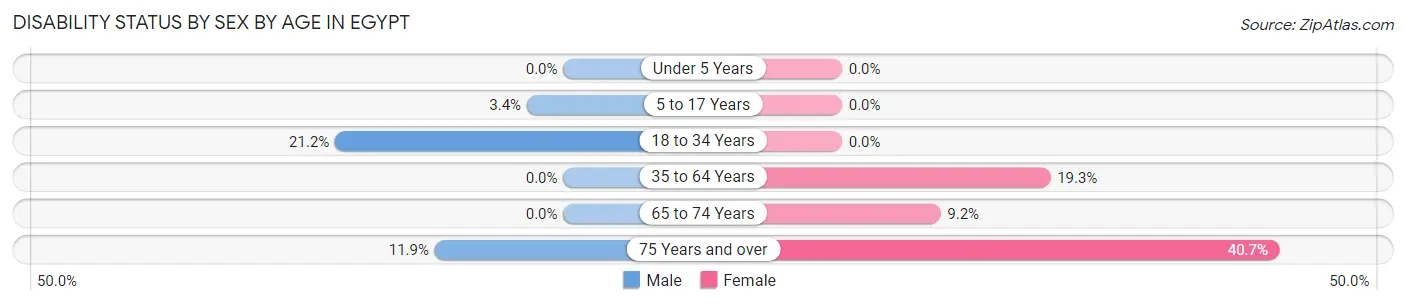
| Age Bracket | Male | Female |
| Under 5 Years | 0 (0.0%) | 0 (0.0%) |
| 5 to 17 Years | 9 (3.4%) | 0 (0.0%) |
| 18 to 34 Years | 54 (21.2%) | 0 (0.0%) |
| 35 to 64 Years | 0 (0.0%) | 112 (19.3%) |
| 65 to 74 Years | 0 (0.0%) | 14 (9.1%) |
| 75 Years and over | 13 (11.9%) | 63 (40.6%) |
Disability Class by Sex by Age in Egypt
Disability Class: Hearing Difficulty
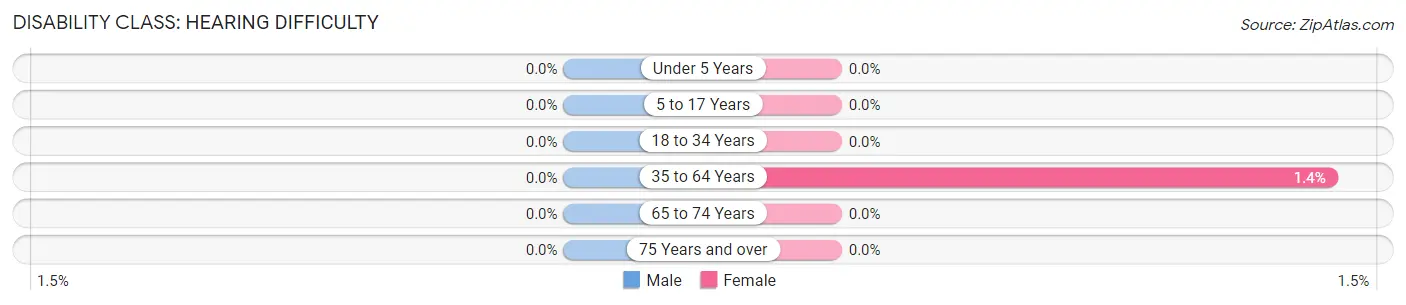
| Age Bracket | Male | Female |
| Under 5 Years | 0 (0.0%) | 0 (0.0%) |
| 5 to 17 Years | 0 (0.0%) | 0 (0.0%) |
| 18 to 34 Years | 0 (0.0%) | 0 (0.0%) |
| 35 to 64 Years | 0 (0.0%) | 8 (1.4%) |
| 65 to 74 Years | 0 (0.0%) | 0 (0.0%) |
| 75 Years and over | 0 (0.0%) | 0 (0.0%) |
Disability Class: Vision Difficulty
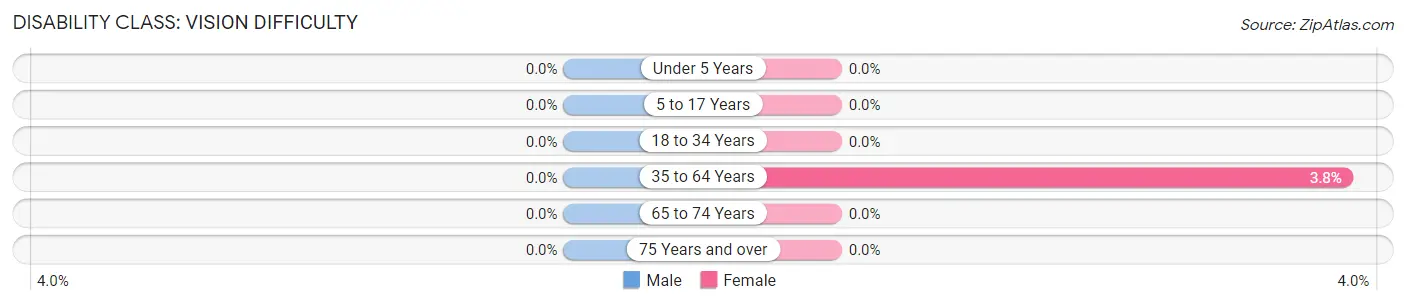
| Age Bracket | Male | Female |
| Under 5 Years | 0 (0.0%) | 0 (0.0%) |
| 5 to 17 Years | 0 (0.0%) | 0 (0.0%) |
| 18 to 34 Years | 0 (0.0%) | 0 (0.0%) |
| 35 to 64 Years | 0 (0.0%) | 22 (3.8%) |
| 65 to 74 Years | 0 (0.0%) | 0 (0.0%) |
| 75 Years and over | 0 (0.0%) | 0 (0.0%) |
Disability Class: Cognitive Difficulty
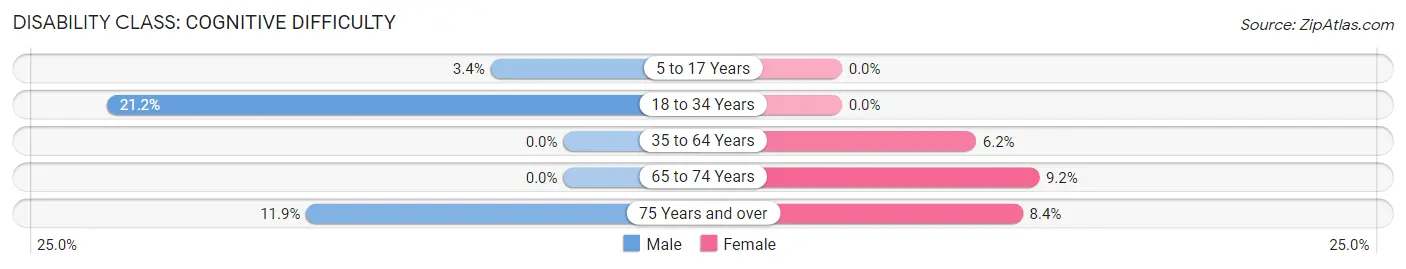
| Age Bracket | Male | Female |
| 5 to 17 Years | 9 (3.4%) | 0 (0.0%) |
| 18 to 34 Years | 54 (21.2%) | 0 (0.0%) |
| 35 to 64 Years | 0 (0.0%) | 36 (6.2%) |
| 65 to 74 Years | 0 (0.0%) | 14 (9.1%) |
| 75 Years and over | 13 (11.9%) | 13 (8.4%) |
Disability Class: Ambulatory Difficulty
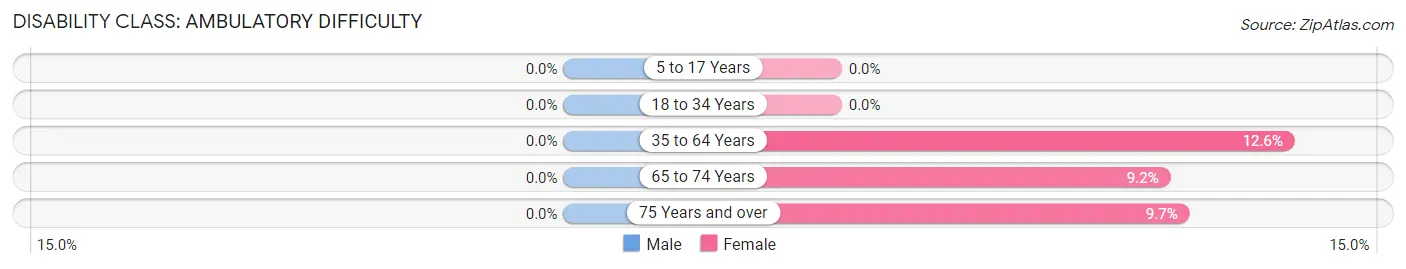
| Age Bracket | Male | Female |
| 5 to 17 Years | 0 (0.0%) | 0 (0.0%) |
| 18 to 34 Years | 0 (0.0%) | 0 (0.0%) |
| 35 to 64 Years | 0 (0.0%) | 73 (12.6%) |
| 65 to 74 Years | 0 (0.0%) | 14 (9.1%) |
| 75 Years and over | 0 (0.0%) | 15 (9.7%) |
Disability Class: Self-Care Difficulty
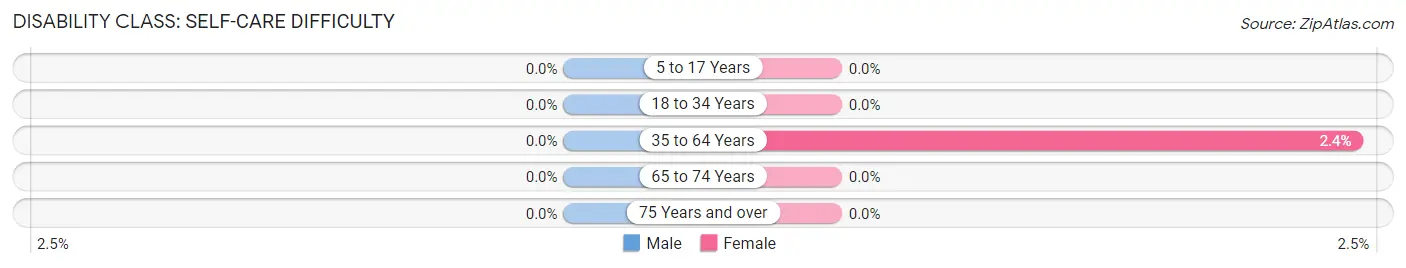
| Age Bracket | Male | Female |
| 5 to 17 Years | 0 (0.0%) | 0 (0.0%) |
| 18 to 34 Years | 0 (0.0%) | 0 (0.0%) |
| 35 to 64 Years | 0 (0.0%) | 14 (2.4%) |
| 65 to 74 Years | 0 (0.0%) | 0 (0.0%) |
| 75 Years and over | 0 (0.0%) | 0 (0.0%) |
Technology Access in Egypt
Computing Device Access in Egypt
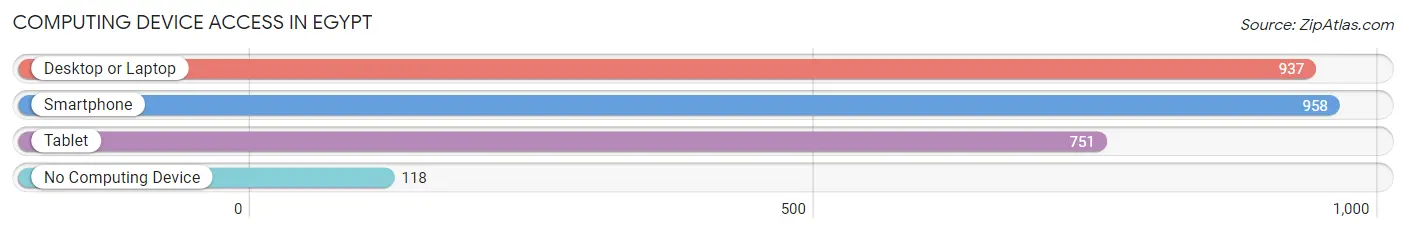
| Device Type | # Households | % Households |
| Desktop or Laptop | 937 | 85.0% |
| Smartphone | 958 | 86.9% |
| Tablet | 751 | 68.1% |
| No Computing Device | 118 | 10.7% |
| Total | 1,103 | 100.0% |
Internet Access in Egypt
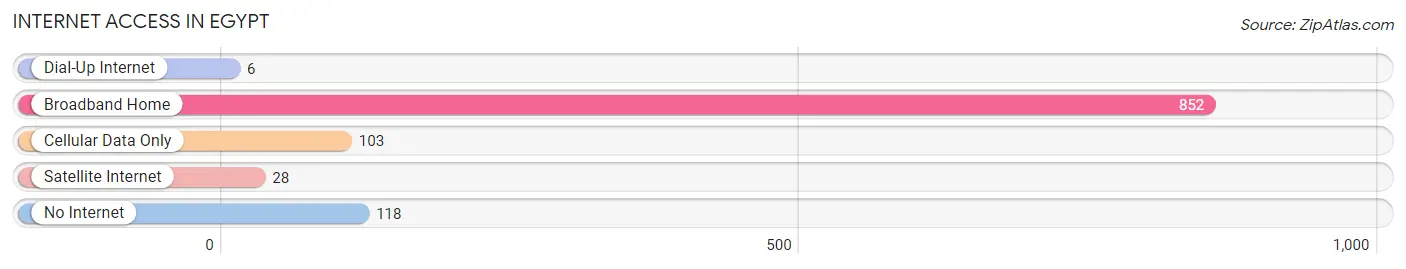
| Internet Type | # Households | % Households |
| Dial-Up Internet | 6 | 0.5% |
| Broadband Home | 852 | 77.2% |
| Cellular Data Only | 103 | 9.3% |
| Satellite Internet | 28 | 2.5% |
| No Internet | 118 | 10.7% |
| Total | 1,103 | 100.0% |
Egypt Summary
Egypt is a country located in the northeast corner of Africa, bordered by the Mediterranean Sea to the north, the Gaza Strip and Israel to the northeast, the Red Sea to the east, Sudan to the south, and Libya to the west. It is the most populous country in the Arab world, with a population of over 95 million people. Egypt is a transcontinental country, spanning the northeast corner of Africa and southwest corner of Asia, via a land bridge formed by the Sinai Peninsula.
Geography
Egypt is a country of vast desert landscapes, rugged mountains, and the Nile River, which runs through the country from south to north. The Nile is the longest river in the world, and it is the lifeblood of Egypt, providing the country with its most important source of water and fertile soil. The Nile Delta is located in the northern part of the country, and it is the most densely populated area in Egypt. The country is divided into two distinct regions: the Nile Valley and the Sinai Peninsula. The Nile Valley is the most fertile region in the country, and it is home to the majority of Egypt’s population. The Sinai Peninsula is a desert region located in the northeast corner of the country, and it is home to the Red Sea and the Suez Canal.
History
Egypt has a long and rich history, dating back to the dawn of civilization. The ancient Egyptians were one of the first civilizations to develop writing, and they are credited with inventing the 365-day calendar. The ancient Egyptians were also known for their impressive engineering feats, such as the Great Pyramid of Giza and the Sphinx.
Egypt was conquered by the Romans in 30 BC, and it remained under Roman rule until the 7th century AD. In 639 AD, Egypt was conquered by the Arabs, and it became part of the Islamic world. In the 16th century, Egypt was conquered by the Ottoman Empire, and it remained under Ottoman rule until the 19th century. In 1882, Egypt was occupied by the British, and it remained under British rule until 1922. In 1952, Egypt declared its independence from Britain, and it has been an independent nation ever since.
Economy
Egypt has a mixed economy, with a large public sector and a growing private sector. The country’s main industries include agriculture, tourism, manufacturing, and oil and gas. Agriculture is the main source of employment in Egypt, and it accounts for around 20% of the country’s GDP. Tourism is also an important industry in Egypt, and it is the country’s second-largest source of foreign currency. Manufacturing is also an important industry in Egypt, and it accounts for around 10% of the country’s GDP. Oil and gas are also important industries in Egypt, and they account for around 5% of the country’s GDP.
Demographics
Egypt has a population of over 95 million people, making it the most populous country in the Arab world. The majority of the population is of Arab descent, with a small minority of Coptic Christians. The official language of Egypt is Arabic, and the majority of the population is Muslim. The literacy rate in Egypt is around 70%, and the life expectancy is around 70 years.
Conclusion
Egypt is a country located in the northeast corner of Africa, bordered by the Mediterranean Sea to the north, the Gaza Strip and Israel to the northeast, the Red Sea to the east, Sudan to the south, and Libya to the west. It is the most populous country in the Arab world, with a population of over 95 million people. Egypt has a long and rich history, dating back to the dawn of civilization. The country has a mixed economy, with a large public sector and a growing private sector. The majority of the population is of Arab descent, with a small minority of Coptic Christians. The official language of Egypt is Arabic, and the majority of the population is Muslim.
Common Questions
What is Per Capita Income in Egypt?
Per Capita income in Egypt is $40,375.
What is the Median Family Income in Egypt?
Median Family Income in Egypt is $112,609.
What is the Median Household income in Egypt?
Median Household Income in Egypt is $105,655.
What is Income or Wage Gap in Egypt?
Income or Wage Gap in Egypt is 47.9%.
Women in Egypt earn 52.1 cents for every dollar earned by a man.
What is Inequality or Gini Index in Egypt?
Inequality or Gini Index in Egypt is 0.34.
What is the Total Population of Egypt?
Total Population of Egypt is 2,998.
What is the Total Male Population of Egypt?
Total Male Population of Egypt is 1,442.
What is the Total Female Population of Egypt?
Total Female Population of Egypt is 1,556.
What is the Ratio of Males per 100 Females in Egypt?
There are 92.67 Males per 100 Females in Egypt.
What is the Ratio of Females per 100 Males in Egypt?
There are 107.91 Females per 100 Males in Egypt.
What is the Median Population Age in Egypt?
Median Population Age in Egypt is 40.8 Years.
What is the Average Family Size in Egypt
Average Family Size in Egypt is 3.1 People.
What is the Average Household Size in Egypt
Average Household Size in Egypt is 2.7 People.
How Large is the Labor Force in Egypt?
There are 1,548 People in the Labor Forcein in Egypt.
What is the Percentage of People in the Labor Force in Egypt?
64.4% of People are in the Labor Force in Egypt.
What is the Unemployment Rate in Egypt?
Unemployment Rate in Egypt is 1.8%.