South Waverly borough, PA Map & Demographics
South Waverly borough Overview
$40,040
PER CAPITA INCOME
$91,364
AVG FAMILY INCOME
$87,604
AVG HOUSEHOLD INCOME
27.9%
WAGE / INCOME GAP [ % ]
72.1¢/ $1
WAGE / INCOME GAP [ $ ]
0.38
INEQUALITY / GINI INDEX
1,162
TOTAL POPULATION
547
MALE POPULATION
615
FEMALE POPULATION
88.94
MALES / 100 FEMALES
112.43
FEMALES / 100 MALES
43.0
MEDIAN AGE
3.1
AVG FAMILY SIZE
2.6
AVG HOUSEHOLD SIZE
593
LABOR FORCE [ PEOPLE ]
63.7%
PERCENT IN LABOR FORCE
2.7%
UNEMPLOYMENT RATE
Income in South Waverly borough
Income Overview in South Waverly borough
Per Capita Income in South Waverly borough is $40,040, while median incomes of families and households are $91,364 and $87,604 respectively.
| Characteristic | Number | Measure |
| Per Capita Income | 1,162 | $40,040 |
| Median Family Income | 298 | $91,364 |
| Mean Family Income | 298 | $113,796 |
| Median Household Income | 441 | $87,604 |
| Mean Household Income | 441 | $101,049 |
| Income Deficit | 298 | $0 |
| Wage / Income Gap (%) | 1,162 | 27.87% |
| Wage / Income Gap ($) | 1,162 | 72.13¢ per $1 |
| Gini / Inequality Index | 1,162 | 0.38 |
Earnings by Sex in South Waverly borough
Average Earnings in South Waverly borough are $40,938, $48,869 for men and $35,250 for women, a difference of 27.9%.
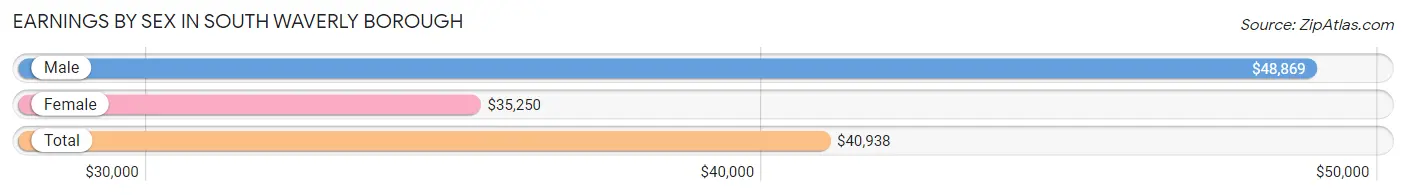
| Sex | Number | Average Earnings |
| Male | 307 (48.6%) | $48,869 |
| Female | 325 (51.4%) | $35,250 |
| Total | 632 (100.0%) | $40,938 |
Earnings by Sex by Income Bracket in South Waverly borough
The most common earnings brackets in South Waverly borough are $45,000 to $49,999 for men (49 | 16.0%) and $75,000 to $99,999 for women (43 | 13.2%).
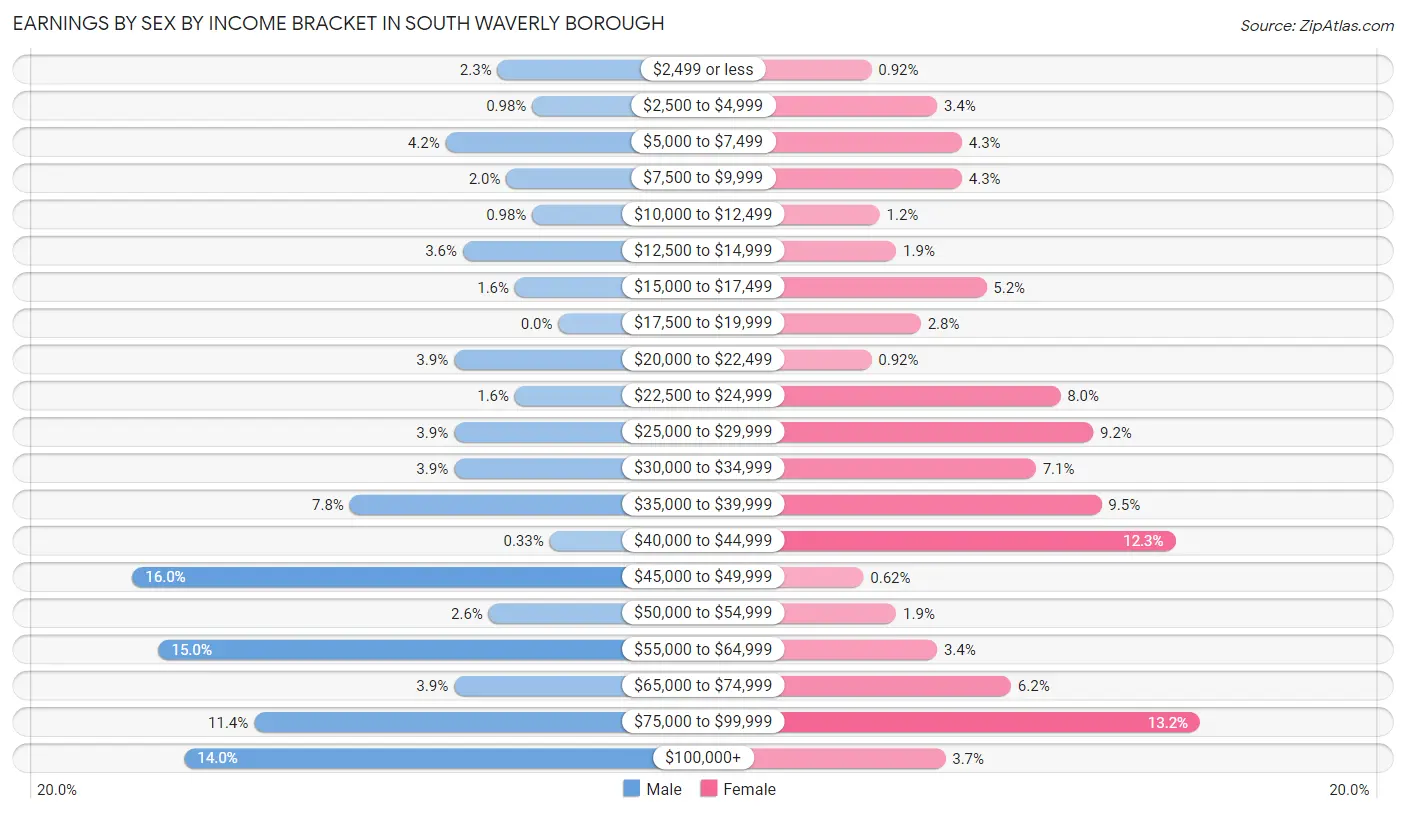
| Income | Male | Female |
| $2,499 or less | 7 (2.3%) | 3 (0.9%) |
| $2,500 to $4,999 | 3 (1.0%) | 11 (3.4%) |
| $5,000 to $7,499 | 13 (4.2%) | 14 (4.3%) |
| $7,500 to $9,999 | 6 (1.9%) | 14 (4.3%) |
| $10,000 to $12,499 | 3 (1.0%) | 4 (1.2%) |
| $12,500 to $14,999 | 11 (3.6%) | 6 (1.8%) |
| $15,000 to $17,499 | 5 (1.6%) | 17 (5.2%) |
| $17,500 to $19,999 | 0 (0.0%) | 9 (2.8%) |
| $20,000 to $22,499 | 12 (3.9%) | 3 (0.9%) |
| $22,500 to $24,999 | 5 (1.6%) | 26 (8.0%) |
| $25,000 to $29,999 | 12 (3.9%) | 30 (9.2%) |
| $30,000 to $34,999 | 12 (3.9%) | 23 (7.1%) |
| $35,000 to $39,999 | 24 (7.8%) | 31 (9.5%) |
| $40,000 to $44,999 | 1 (0.3%) | 40 (12.3%) |
| $45,000 to $49,999 | 49 (16.0%) | 2 (0.6%) |
| $50,000 to $54,999 | 8 (2.6%) | 6 (1.8%) |
| $55,000 to $64,999 | 46 (15.0%) | 11 (3.4%) |
| $65,000 to $74,999 | 12 (3.9%) | 20 (6.1%) |
| $75,000 to $99,999 | 35 (11.4%) | 43 (13.2%) |
| $100,000+ | 43 (14.0%) | 12 (3.7%) |
| Total | 307 (100.0%) | 325 (100.0%) |
Earnings by Sex by Educational Attainment in South Waverly borough
Average earnings in South Waverly borough are $49,821 for men and $38,333 for women, a difference of 23.1%. Men with an educational attainment of bachelor's degree enjoy the highest average annual earnings of $71,250, while those with high school diploma education earn the least with $46,477. Women with an educational attainment of graduate degree earn the most with the average annual earnings of $72,708, while those with high school diploma education have the smallest earnings of $22,941.
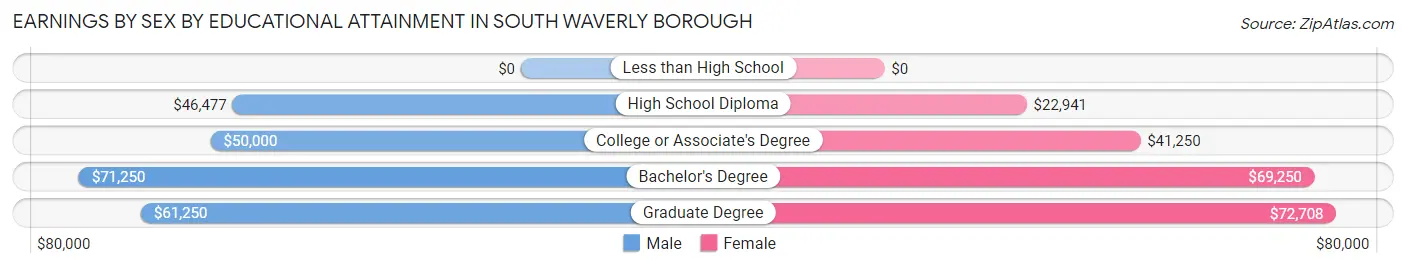
| Educational Attainment | Male Income | Female Income |
| Less than High School | - | - |
| High School Diploma | $46,477 | $22,941 |
| College or Associate's Degree | $50,000 | $41,250 |
| Bachelor's Degree | $71,250 | $69,250 |
| Graduate Degree | $61,250 | $72,708 |
| Total | $49,821 | $38,333 |
Family Income in South Waverly borough
Family Income Brackets in South Waverly borough
According to the South Waverly borough family income data, there are 63 families falling into the $100,000 to $149,999 income range, which is the most common income bracket and makes up 21.1% of all families. Conversely, the $15,000 to $24,999 income bracket is the least frequent group with only 2 families (0.7%) belonging to this category.
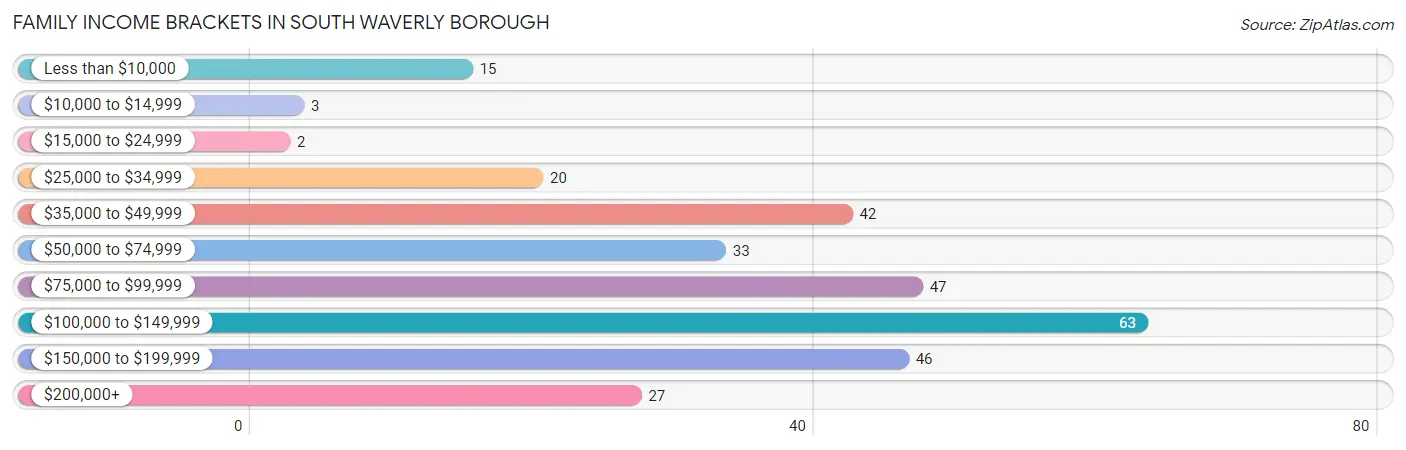
| Income Bracket | # Families | % Families |
| Less than $10,000 | 15 | 5.0% |
| $10,000 to $14,999 | 3 | 1.0% |
| $15,000 to $24,999 | 2 | 0.7% |
| $25,000 to $34,999 | 20 | 6.7% |
| $35,000 to $49,999 | 42 | 14.1% |
| $50,000 to $74,999 | 33 | 11.1% |
| $75,000 to $99,999 | 47 | 15.8% |
| $100,000 to $149,999 | 63 | 21.1% |
| $150,000 to $199,999 | 46 | 15.4% |
| $200,000+ | 27 | 9.1% |
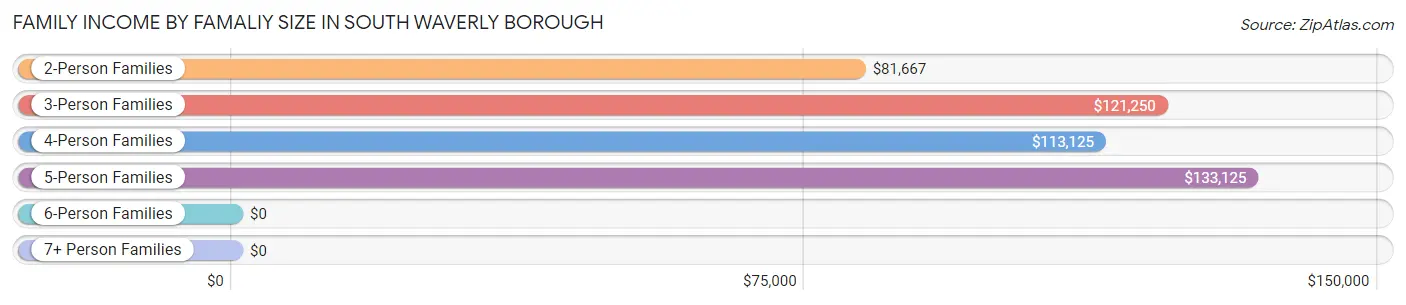
Family Income by Famaliy Size in South Waverly borough
5-person families (14 | 4.7%) account for the highest median family income in South Waverly borough with $133,125 per family, while 2-person families (158 | 53.0%) have the highest median income of $40,834 per family member.
| Income Bracket | # Families | Median Income |
| 2-Person Families | 158 (53.0%) | $81,667 |
| 3-Person Families | 58 (19.5%) | $121,250 |
| 4-Person Families | 48 (16.1%) | $113,125 |
| 5-Person Families | 14 (4.7%) | $133,125 |
| 6-Person Families | 0 (0.0%) | $0 |
| 7+ Person Families | 20 (6.7%) | $0 |
| Total | 298 (100.0%) | $91,364 |
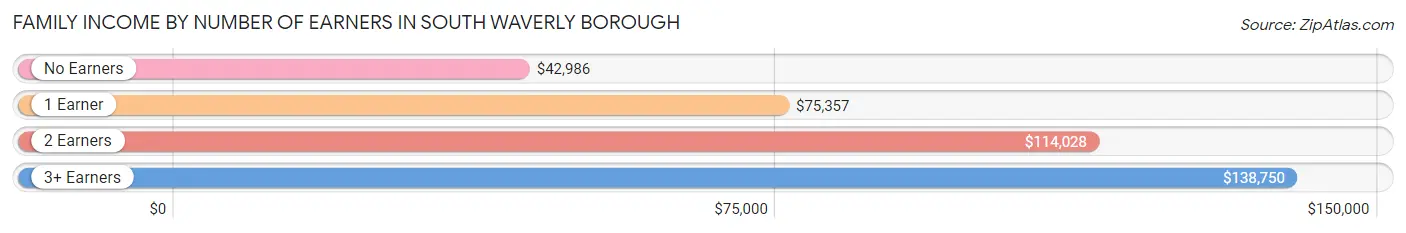
Family Income by Number of Earners in South Waverly borough
The median family income in South Waverly borough is $91,364, with families comprising 3+ earners (64) having the highest median family income of $138,750, while families with no earners (71) have the lowest median family income of $42,986, accounting for 21.5% and 23.8% of families, respectively.
| Number of Earners | # Families | Median Income |
| No Earners | 71 (23.8%) | $42,986 |
| 1 Earner | 72 (24.2%) | $75,357 |
| 2 Earners | 91 (30.5%) | $114,028 |
| 3+ Earners | 64 (21.5%) | $138,750 |
| Total | 298 (100.0%) | $91,364 |
Household Income in South Waverly borough
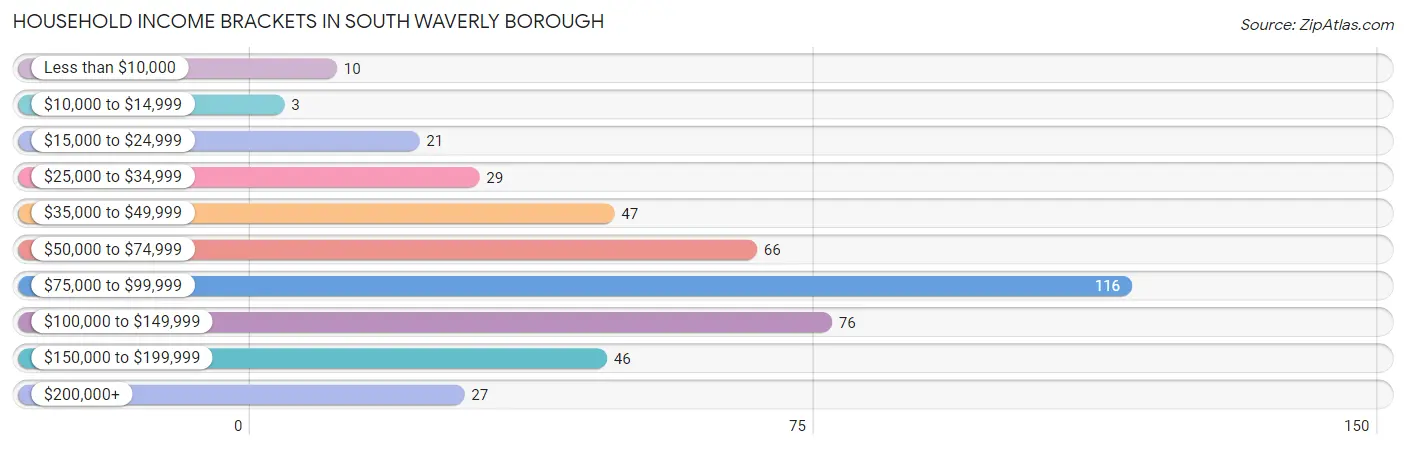
Household Income Brackets in South Waverly borough
With 116 households falling in the category, the $75,000 to $99,999 income range is the most frequent in South Waverly borough, accounting for 26.3% of all households. In contrast, only 3 households (0.7%) fall into the $10,000 to $14,999 income bracket, making it the least populous group.
| Income Bracket | # Households | % Households |
| Less than $10,000 | 10 | 2.3% |
| $10,000 to $14,999 | 3 | 0.7% |
| $15,000 to $24,999 | 21 | 4.8% |
| $25,000 to $34,999 | 29 | 6.6% |
| $35,000 to $49,999 | 47 | 10.7% |
| $50,000 to $74,999 | 66 | 15.0% |
| $75,000 to $99,999 | 116 | 26.3% |
| $100,000 to $149,999 | 76 | 17.2% |
| $150,000 to $199,999 | 46 | 10.4% |
| $200,000+ | 27 | 6.1% |
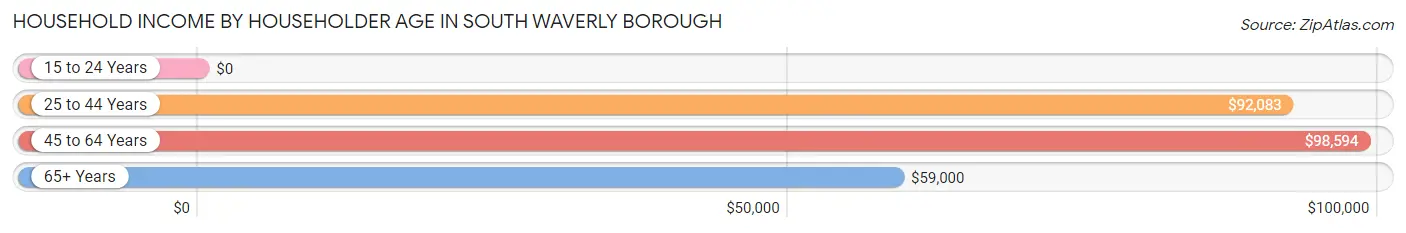
Household Income by Householder Age in South Waverly borough
The median household income in South Waverly borough is $87,604, with the highest median household income of $98,594 found in the 45 to 64 years age bracket for the primary householder. A total of 169 households (38.3%) fall into this category. Meanwhile, the 15 to 24 years age bracket for the primary householder has the lowest median household income of $0, with 2 households (0.4%) in this group.
| Income Bracket | # Households | Median Income |
| 15 to 24 Years | 2 (0.4%) | $0 |
| 25 to 44 Years | 108 (24.5%) | $92,083 |
| 45 to 64 Years | 169 (38.3%) | $98,594 |
| 65+ Years | 162 (36.7%) | $59,000 |
| Total | 441 (100.0%) | $87,604 |
Poverty in South Waverly borough
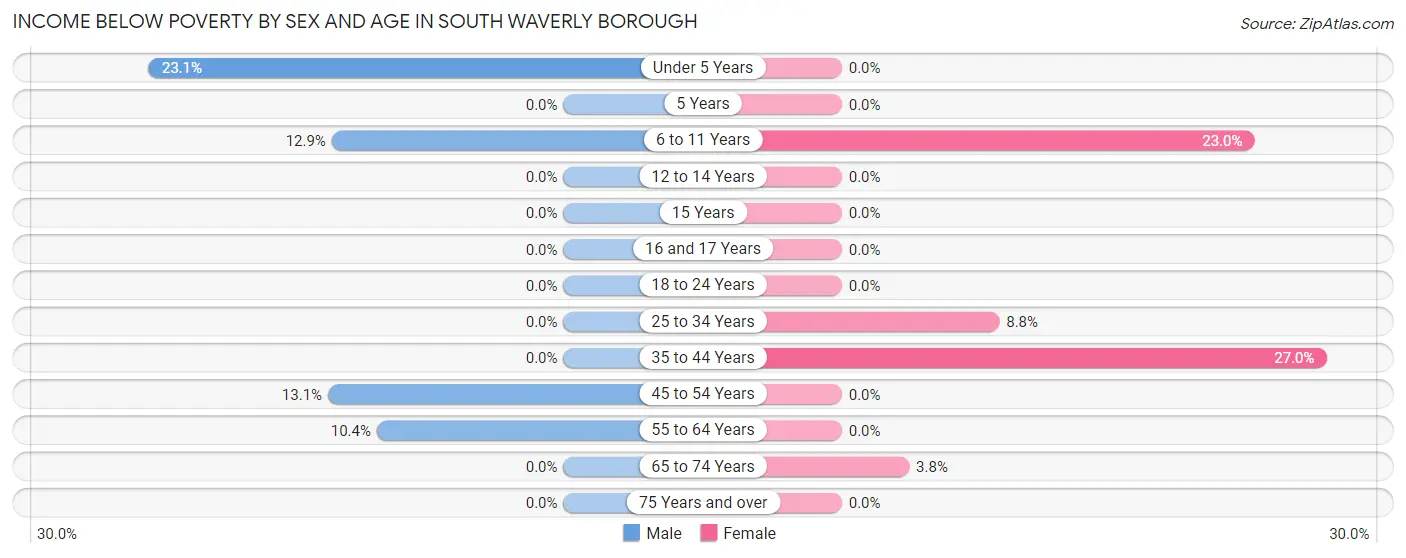
Income Below Poverty by Sex and Age in South Waverly borough
With 4.9% poverty level for males and 6.8% for females among the residents of South Waverly borough, under 5 year old males and 35 to 44 year old females are the most vulnerable to poverty, with 3 males (23.1%) and 17 females (27.0%) in their respective age groups living below the poverty level.
| Age Bracket | Male | Female |
| Under 5 Years | 3 (23.1%) | 0 (0.0%) |
| 5 Years | 0 (0.0%) | 0 (0.0%) |
| 6 to 11 Years | 8 (12.9%) | 17 (23.0%) |
| 12 to 14 Years | 0 (0.0%) | 0 (0.0%) |
| 15 Years | 0 (0.0%) | 0 (0.0%) |
| 16 and 17 Years | 0 (0.0%) | 0 (0.0%) |
| 18 to 24 Years | 0 (0.0%) | 0 (0.0%) |
| 25 to 34 Years | 0 (0.0%) | 5 (8.8%) |
| 35 to 44 Years | 0 (0.0%) | 17 (27.0%) |
| 45 to 54 Years | 8 (13.1%) | 0 (0.0%) |
| 55 to 64 Years | 8 (10.4%) | 0 (0.0%) |
| 65 to 74 Years | 0 (0.0%) | 3 (3.7%) |
| 75 Years and over | 0 (0.0%) | 0 (0.0%) |
| Total | 27 (4.9%) | 42 (6.8%) |
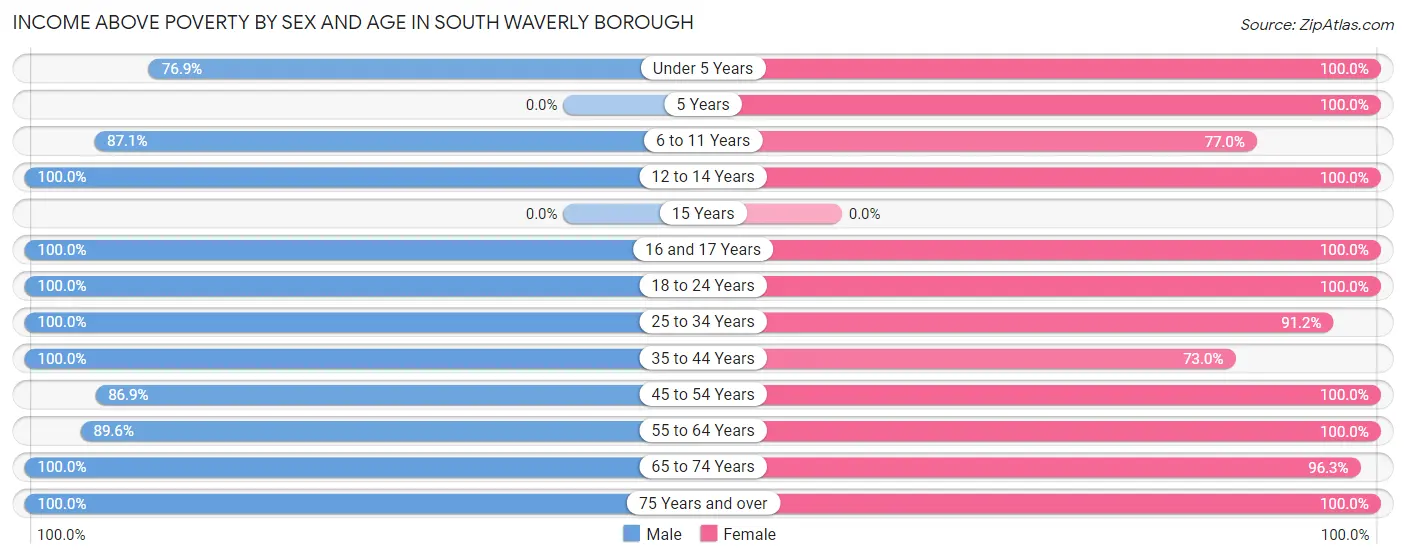
Income Above Poverty by Sex and Age in South Waverly borough
According to the poverty statistics in South Waverly borough, males aged 12 to 14 years and females aged under 5 years are the age groups that are most secure financially, with 100.0% of males and 100.0% of females in these age groups living above the poverty line.
| Age Bracket | Male | Female |
| Under 5 Years | 10 (76.9%) | 32 (100.0%) |
| 5 Years | 0 (0.0%) | 8 (100.0%) |
| 6 to 11 Years | 54 (87.1%) | 57 (77.0%) |
| 12 to 14 Years | 17 (100.0%) | 25 (100.0%) |
| 15 Years | 0 (0.0%) | 0 (0.0%) |
| 16 and 17 Years | 8 (100.0%) | 10 (100.0%) |
| 18 to 24 Years | 27 (100.0%) | 47 (100.0%) |
| 25 to 34 Years | 76 (100.0%) | 52 (91.2%) |
| 35 to 44 Years | 75 (100.0%) | 46 (73.0%) |
| 45 to 54 Years | 53 (86.9%) | 80 (100.0%) |
| 55 to 64 Years | 69 (89.6%) | 99 (100.0%) |
| 65 to 74 Years | 93 (100.0%) | 77 (96.3%) |
| 75 Years and over | 38 (100.0%) | 40 (100.0%) |
| Total | 520 (95.1%) | 573 (93.2%) |
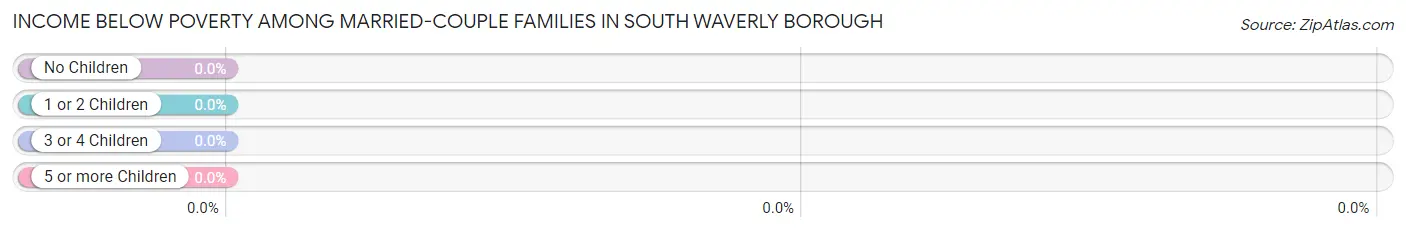
Income Below Poverty Among Married-Couple Families in South Waverly borough
| Children | Above Poverty | Below Poverty |
| No Children | 171 (100.0%) | 0 (0.0%) |
| 1 or 2 Children | 35 (100.0%) | 0 (0.0%) |
| 3 or 4 Children | 10 (100.0%) | 0 (0.0%) |
| 5 or more Children | 0 (0.0%) | 0 (0.0%) |
| Total | 216 (100.0%) | 0 (0.0%) |
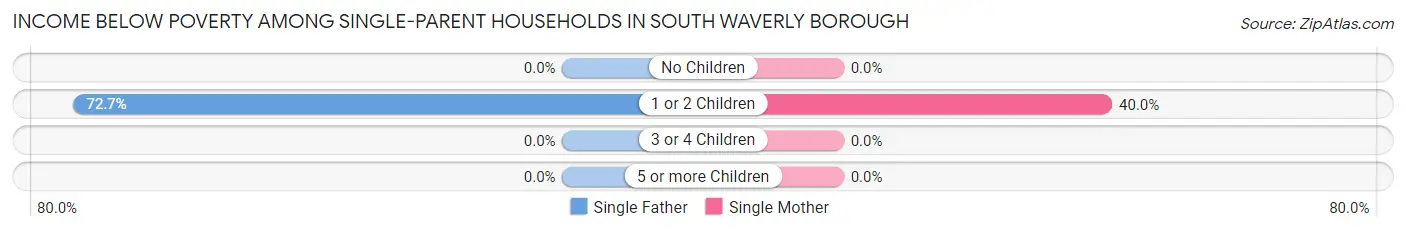
Income Below Poverty Among Single-Parent Households in South Waverly borough
According to the poverty data in South Waverly borough, 18.2% or 8 single-father households and 26.3% or 10 single-mother households are living below the poverty line. Among single-father households, those with 1 or 2 children have the highest poverty rate, with 8 households (72.7%) experiencing poverty. Likewise, among single-mother households, those with 1 or 2 children have the highest poverty rate, with 10 households (40.0%) falling below the poverty line.
| Children | Single Father | Single Mother |
| No Children | 0 (0.0%) | 0 (0.0%) |
| 1 or 2 Children | 8 (72.7%) | 10 (40.0%) |
| 3 or 4 Children | 0 (0.0%) | 0 (0.0%) |
| 5 or more Children | 0 (0.0%) | 0 (0.0%) |
| Total | 8 (18.2%) | 10 (26.3%) |
Income Below Poverty Among Married-Couple vs Single-Parent Households in South Waverly borough
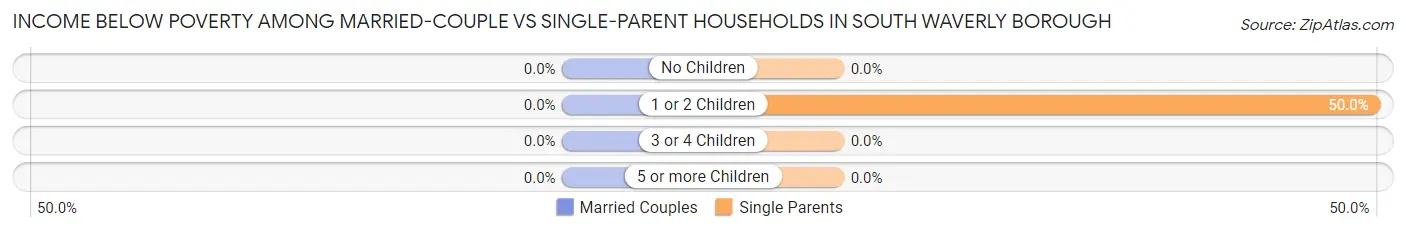
| Children | Married-Couple Families | Single-Parent Households |
| No Children | 0 (0.0%) | 0 (0.0%) |
| 1 or 2 Children | 0 (0.0%) | 18 (50.0%) |
| 3 or 4 Children | 0 (0.0%) | 0 (0.0%) |
| 5 or more Children | 0 (0.0%) | 0 (0.0%) |
| Total | 0 (0.0%) | 18 (22.0%) |
Race in South Waverly borough
The most populous races in South Waverly borough are White / Caucasian (1,113 | 95.8%), Two or more Races (45 | 3.9%), and Black / African American (4 | 0.3%).
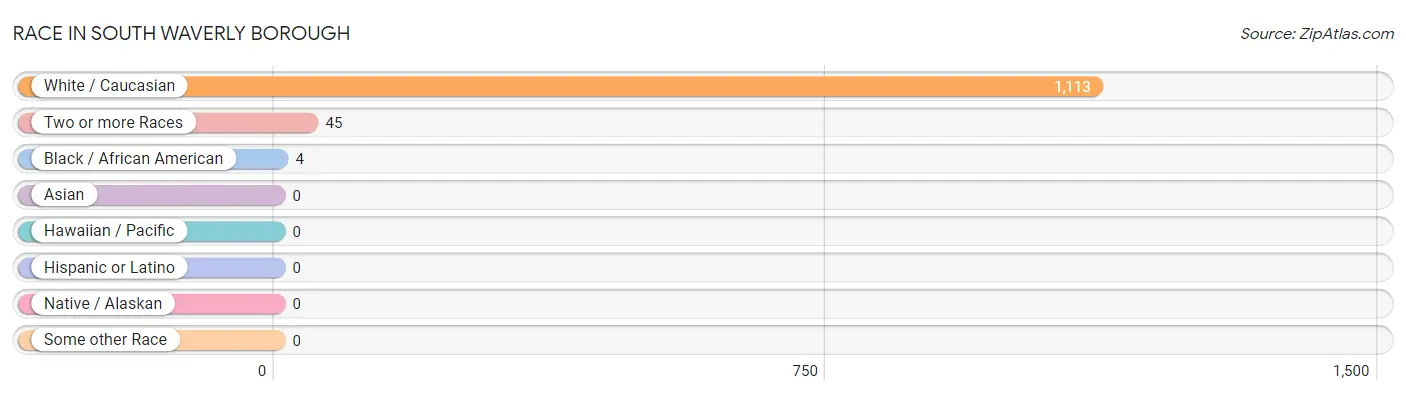
| Race | # Population | % Population |
| Asian | 0 | 0.0% |
| Black / African American | 4 | 0.3% |
| Hawaiian / Pacific | 0 | 0.0% |
| Hispanic or Latino | 0 | 0.0% |
| Native / Alaskan | 0 | 0.0% |
| White / Caucasian | 1,113 | 95.8% |
| Two or more Races | 45 | 3.9% |
| Some other Race | 0 | 0.0% |
| Total | 1,162 | 100.0% |
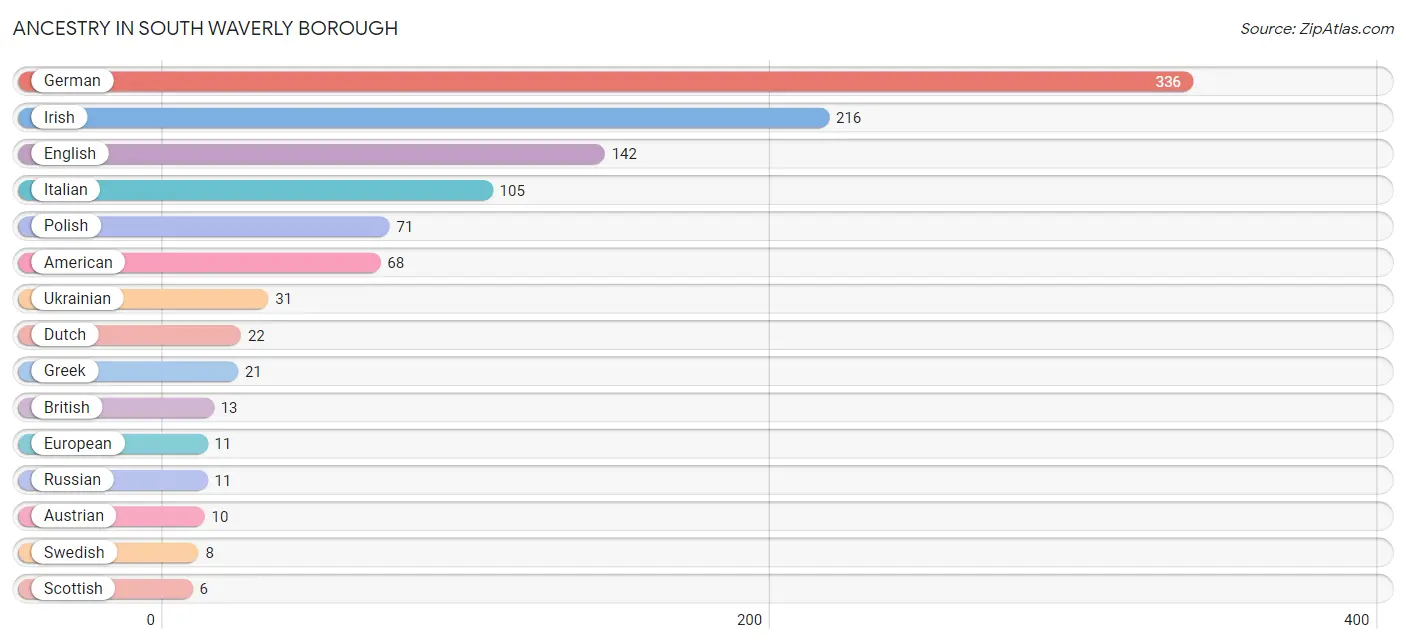
Ancestry in South Waverly borough
The most populous ancestries reported in South Waverly borough are German (336 | 28.9%), Irish (216 | 18.6%), English (142 | 12.2%), Italian (105 | 9.0%), and Polish (71 | 6.1%), together accounting for 74.9% of all South Waverly borough residents.
| Ancestry | # Population | % Population |
| American | 68 | 5.9% |
| Austrian | 10 | 0.9% |
| Blackfeet | 5 | 0.4% |
| British | 13 | 1.1% |
| Carpatho Rusyn | 2 | 0.2% |
| Dutch | 22 | 1.9% |
| English | 142 | 12.2% |
| European | 11 | 0.9% |
| French | 5 | 0.4% |
| German | 336 | 28.9% |
| Greek | 21 | 1.8% |
| Hungarian | 3 | 0.3% |
| Irish | 216 | 18.6% |
| Italian | 105 | 9.0% |
| Lithuanian | 3 | 0.3% |
| Pennsylvania German | 5 | 0.4% |
| Polish | 71 | 6.1% |
| Russian | 11 | 0.9% |
| Scotch-Irish | 3 | 0.3% |
| Scottish | 6 | 0.5% |
| Swedish | 8 | 0.7% |
| Swiss | 3 | 0.3% |
| Ukrainian | 31 | 2.7% |
| Welsh | 3 | 0.3% | View All 24 Rows |
Immigrants in South Waverly borough
The most numerous immigrant groups reported in South Waverly borough came from Europe (12 | 1.0%), Eastern Europe (8 | 0.7%), Ukraine (8 | 0.7%), Germany (4 | 0.3%), and Western Europe (4 | 0.3%), together accounting for 3.1% of all South Waverly borough residents.
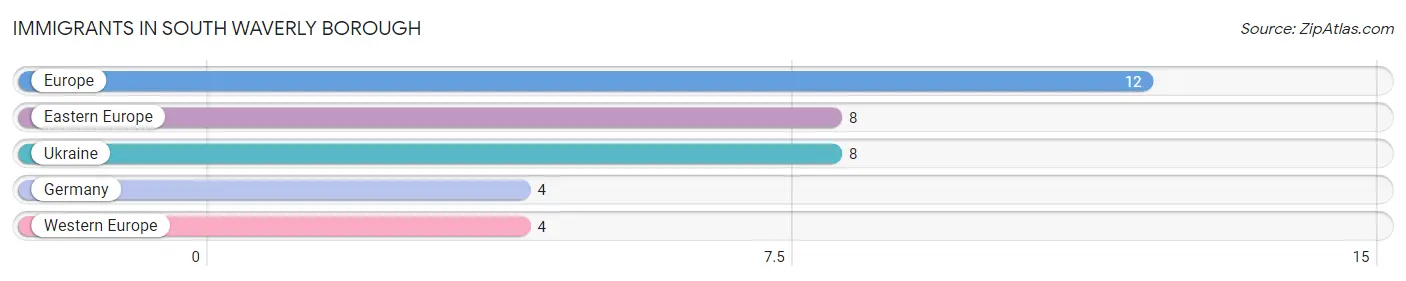
| Immigration Origin | # Population | % Population |
| Eastern Europe | 8 | 0.7% |
| Europe | 12 | 1.0% |
| Germany | 4 | 0.3% |
| Ukraine | 8 | 0.7% |
| Western Europe | 4 | 0.3% | View All 5 Rows |
Sex and Age in South Waverly borough
Sex and Age in South Waverly borough
The most populous age groups in South Waverly borough are 65 to 69 Years (78 | 14.3%) for men and 5 to 9 Years (73 | 11.9%) for women.
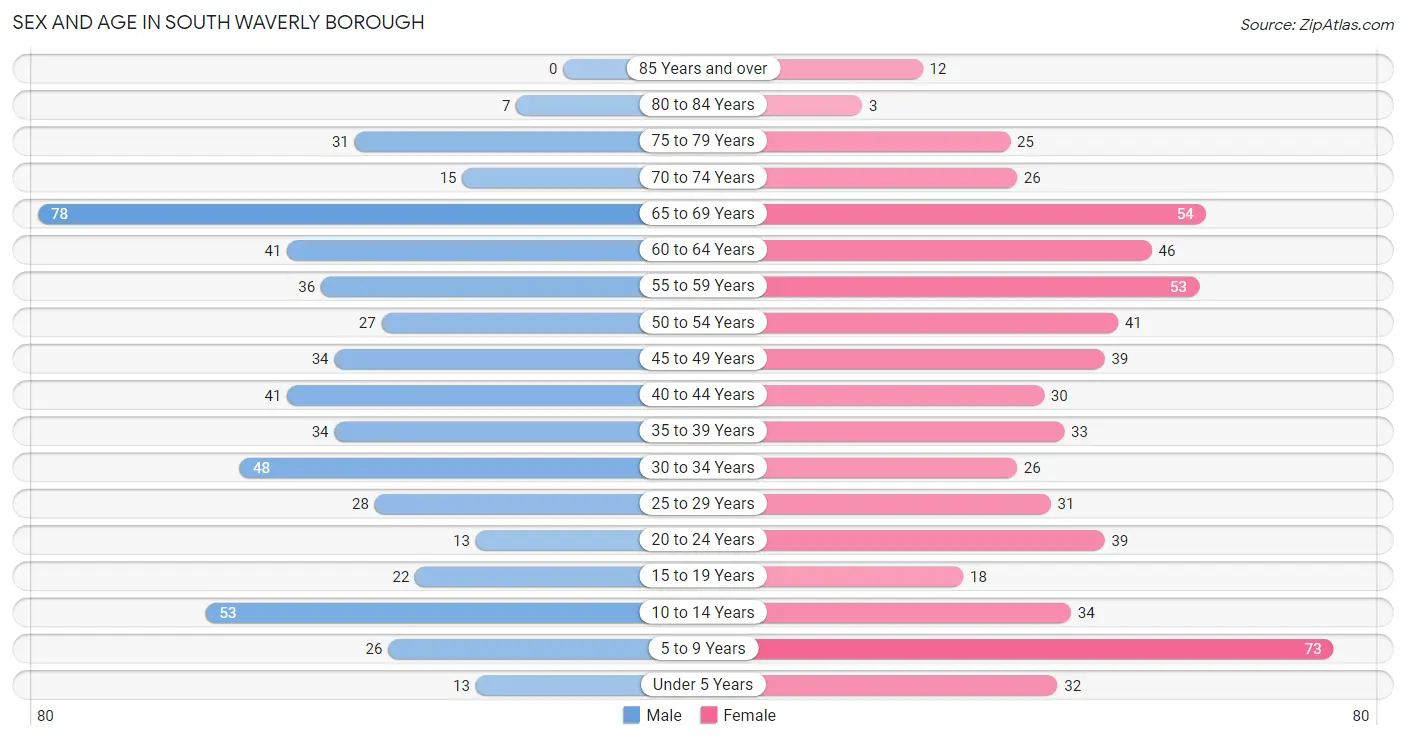
| Age Bracket | Male | Female |
| Under 5 Years | 13 (2.4%) | 32 (5.2%) |
| 5 to 9 Years | 26 (4.8%) | 73 (11.9%) |
| 10 to 14 Years | 53 (9.7%) | 34 (5.5%) |
| 15 to 19 Years | 22 (4.0%) | 18 (2.9%) |
| 20 to 24 Years | 13 (2.4%) | 39 (6.3%) |
| 25 to 29 Years | 28 (5.1%) | 31 (5.0%) |
| 30 to 34 Years | 48 (8.8%) | 26 (4.2%) |
| 35 to 39 Years | 34 (6.2%) | 33 (5.4%) |
| 40 to 44 Years | 41 (7.5%) | 30 (4.9%) |
| 45 to 49 Years | 34 (6.2%) | 39 (6.3%) |
| 50 to 54 Years | 27 (4.9%) | 41 (6.7%) |
| 55 to 59 Years | 36 (6.6%) | 53 (8.6%) |
| 60 to 64 Years | 41 (7.5%) | 46 (7.5%) |
| 65 to 69 Years | 78 (14.3%) | 54 (8.8%) |
| 70 to 74 Years | 15 (2.7%) | 26 (4.2%) |
| 75 to 79 Years | 31 (5.7%) | 25 (4.1%) |
| 80 to 84 Years | 7 (1.3%) | 3 (0.5%) |
| 85 Years and over | 0 (0.0%) | 12 (1.9%) |
| Total | 547 (100.0%) | 615 (100.0%) |
Families and Households in South Waverly borough
Median Family Size in South Waverly borough
The median family size in South Waverly borough is 3.06 persons per family, with single male/father families (44 | 14.8%) accounting for the largest median family size of 3.95 persons per family. On the other hand, single female/mother families (38 | 12.8%) represent the smallest median family size with 2.89 persons per family.
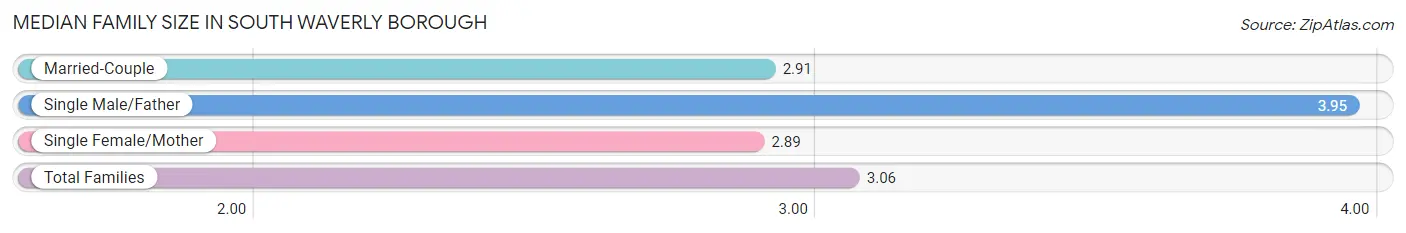
| Family Type | # Families | Family Size |
| Married-Couple | 216 (72.5%) | 2.91 |
| Single Male/Father | 44 (14.8%) | 3.95 |
| Single Female/Mother | 38 (12.8%) | 2.89 |
| Total Families | 298 (100.0%) | 3.06 |
Median Household Size in South Waverly borough
The median household size in South Waverly borough is 2.63 persons per household, with single male/father households (44 | 10.0%) accounting for the largest median household size of 4.3 persons per household. non-family households (143 | 32.4%) represent the smallest median household size with 1.51 persons per household.
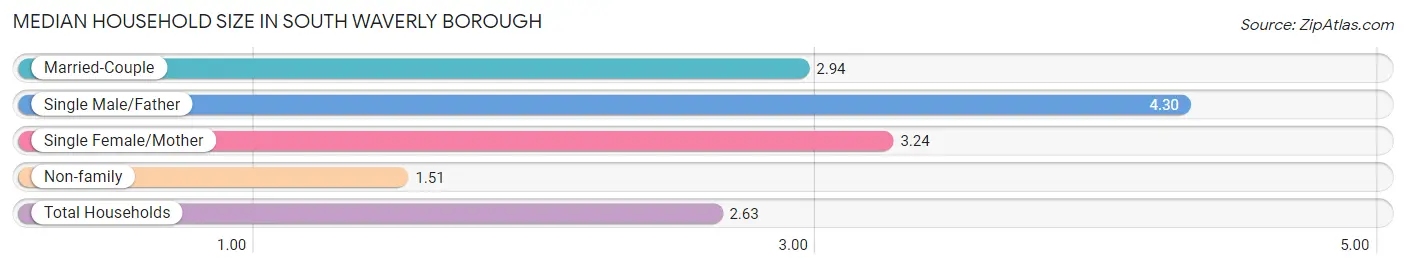
| Household Type | # Households | Household Size |
| Married-Couple | 216 (49.0%) | 2.94 |
| Single Male/Father | 44 (10.0%) | 4.30 |
| Single Female/Mother | 38 (8.6%) | 3.24 |
| Non-family | 143 (32.4%) | 1.51 |
| Total Households | 441 (100.0%) | 2.63 |
Household Size by Marriage Status in South Waverly borough
Out of a total of 441 households in South Waverly borough, 298 (67.6%) are family households, while 143 (32.4%) are nonfamily households. The most numerous type of family households are 2-person households, comprising 149, and the most common type of nonfamily households are 1-person households, comprising 78.
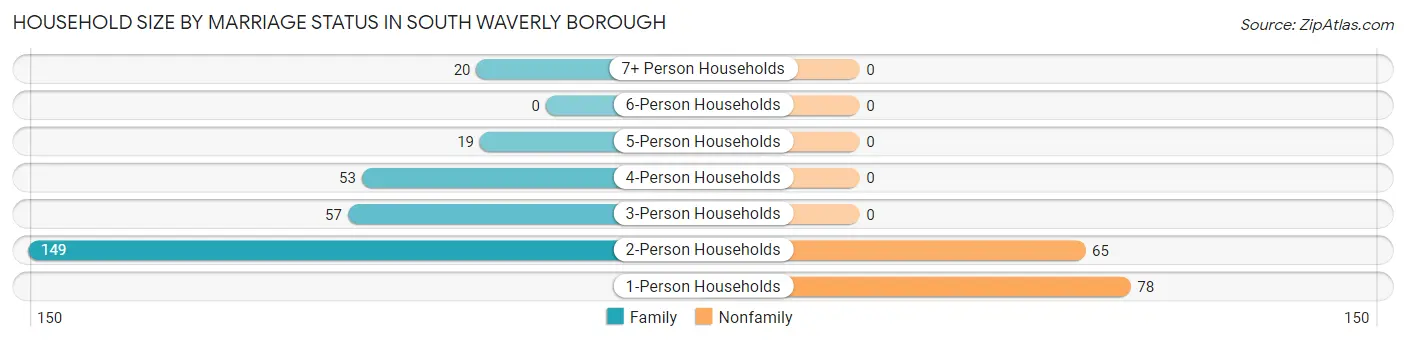
| Household Size | Family Households | Nonfamily Households |
| 1-Person Households | - | 78 (17.7%) |
| 2-Person Households | 149 (33.8%) | 65 (14.7%) |
| 3-Person Households | 57 (12.9%) | 0 (0.0%) |
| 4-Person Households | 53 (12.0%) | 0 (0.0%) |
| 5-Person Households | 19 (4.3%) | 0 (0.0%) |
| 6-Person Households | 0 (0.0%) | 0 (0.0%) |
| 7+ Person Households | 20 (4.5%) | 0 (0.0%) |
| Total | 298 (67.6%) | 143 (32.4%) |
Female Fertility in South Waverly borough
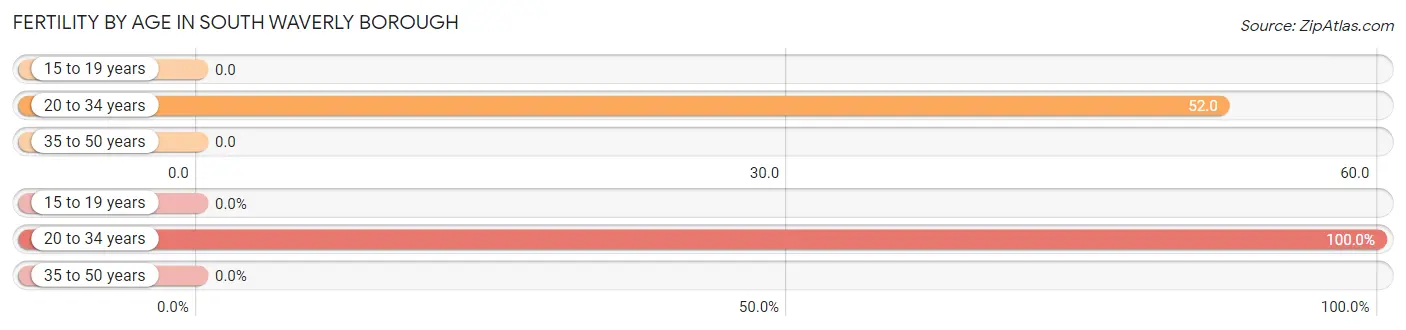
Fertility by Age in South Waverly borough
Average fertility rate in South Waverly borough is 22.0 births per 1,000 women. Women in the age bracket of 20 to 34 years have the highest fertility rate with 52.0 births per 1,000 women. Women in the age bracket of 20 to 34 years acount for 100.0% of all women with births.
| Age Bracket | Women with Births | Births / 1,000 Women |
| 15 to 19 years | 0 (0.0%) | 0.0 |
| 20 to 34 years | 5 (100.0%) | 52.0 |
| 35 to 50 years | 0 (0.0%) | 0.0 |
| Total | 5 (100.0%) | 22.0 |
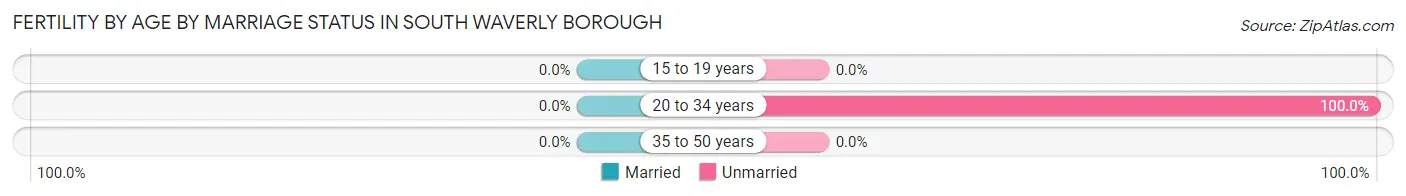
Fertility by Age by Marriage Status in South Waverly borough
| Age Bracket | Married | Unmarried |
| 15 to 19 years | 0 (0.0%) | 0 (0.0%) |
| 20 to 34 years | 0 (0.0%) | 5 (100.0%) |
| 35 to 50 years | 0 (0.0%) | 0 (0.0%) |
| Total | 0 (0.0%) | 5 (100.0%) |
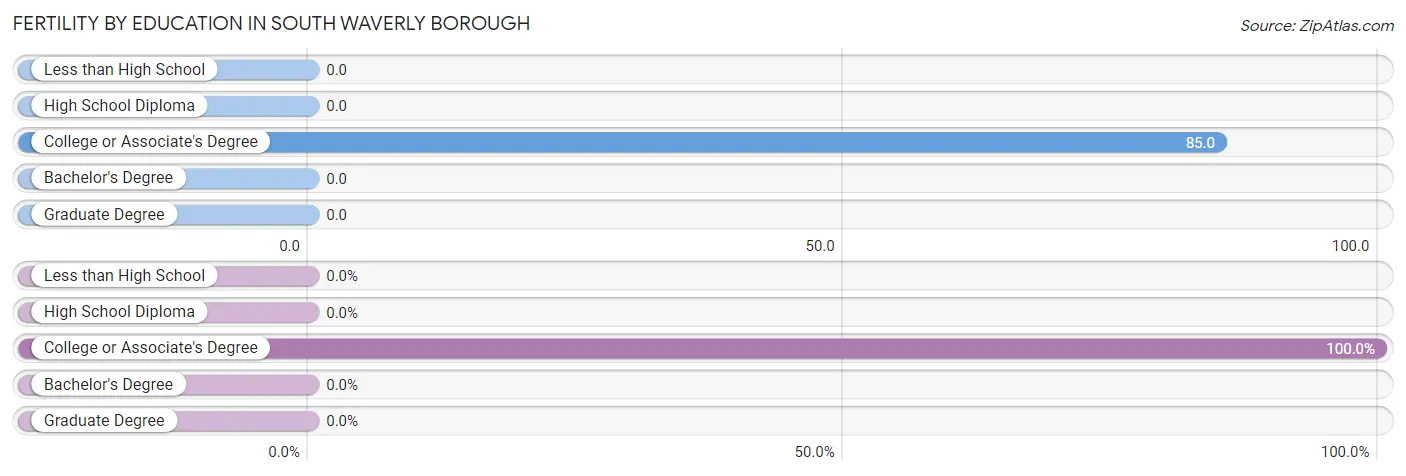
Fertility by Education in South Waverly borough
| Educational Attainment | Women with Births | Births / 1,000 Women |
| Less than High School | 0 (0.0%) | 0.0 |
| High School Diploma | 0 (0.0%) | 0.0 |
| College or Associate's Degree | 5 (100.0%) | 85.0 |
| Bachelor's Degree | 0 (0.0%) | 0.0 |
| Graduate Degree | 0 (0.0%) | 0.0 |
| Total | 5 (100.0%) | 22.0 |
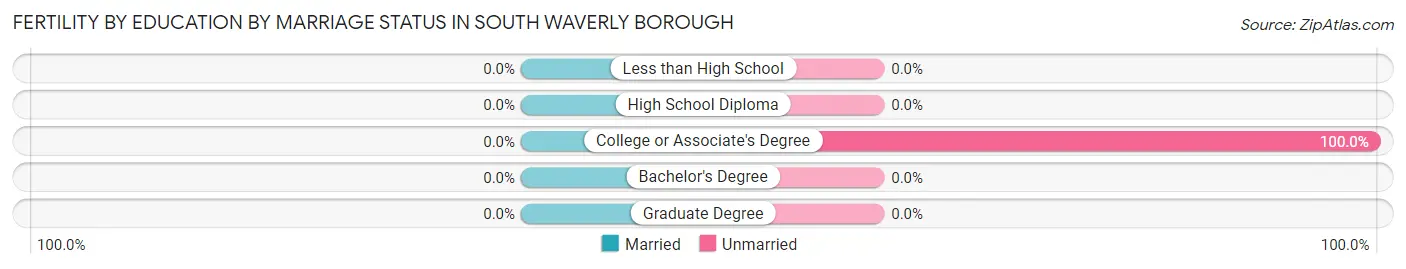
Fertility by Education by Marriage Status in South Waverly borough
| Educational Attainment | Married | Unmarried |
| Less than High School | 0 (0.0%) | 0 (0.0%) |
| High School Diploma | 0 (0.0%) | 0 (0.0%) |
| College or Associate's Degree | 0 (0.0%) | 5 (100.0%) |
| Bachelor's Degree | 0 (0.0%) | 0 (0.0%) |
| Graduate Degree | 0 (0.0%) | 0 (0.0%) |
| Total | 0 (0.0%) | 5 (100.0%) |
Employment Characteristics in South Waverly borough
Employment by Class of Employer in South Waverly borough
Among the 577 employed individuals in South Waverly borough, private company employees (394 | 68.3%), not-for-profit organizations (89 | 15.4%), and local government employees (53 | 9.2%) make up the most common classes of employment.
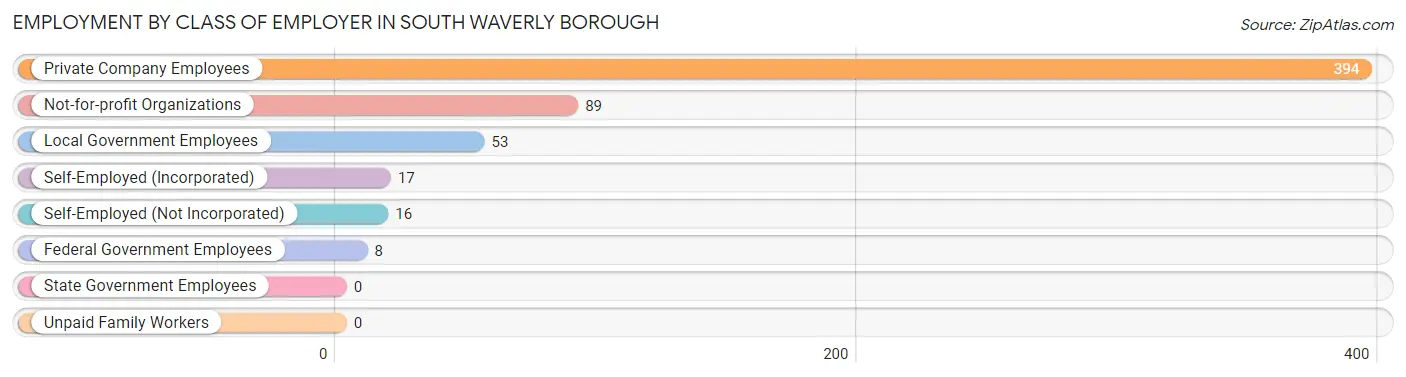
| Employer Class | # Employees | % Employees |
| Private Company Employees | 394 | 68.3% |
| Self-Employed (Incorporated) | 17 | 2.9% |
| Self-Employed (Not Incorporated) | 16 | 2.8% |
| Not-for-profit Organizations | 89 | 15.4% |
| Local Government Employees | 53 | 9.2% |
| State Government Employees | 0 | 0.0% |
| Federal Government Employees | 8 | 1.4% |
| Unpaid Family Workers | 0 | 0.0% |
| Total | 577 | 100.0% |
Employment Status by Age in South Waverly borough
According to the labor force statistics for South Waverly borough, out of the total population over 16 years of age (931), 63.7% or 593 individuals are in the labor force, with 2.7% or 16 of them unemployed. The age group with the highest labor force participation rate is 20 to 24 years, with 100.0% or 52 individuals in the labor force. Within the labor force, the 30 to 34 years age range has the highest percentage of unemployed individuals, with 8.1% or 5 of them being unemployed.
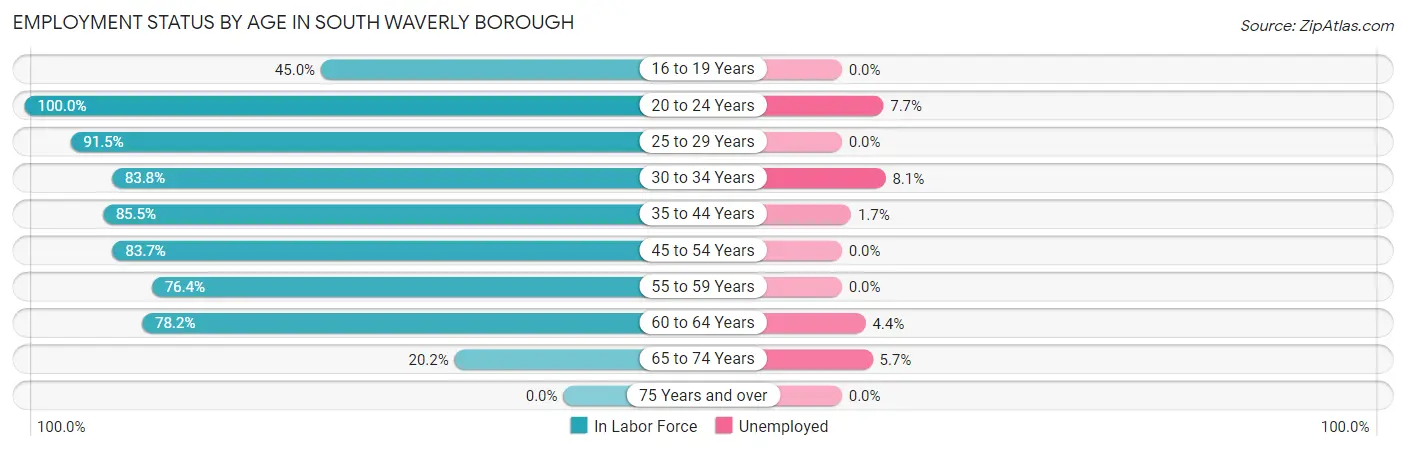
| Age Bracket | In Labor Force | Unemployed |
| 16 to 19 Years | 18 (45.0%) | 0 (0.0%) |
| 20 to 24 Years | 52 (100.0%) | 4 (7.7%) |
| 25 to 29 Years | 54 (91.5%) | 0 (0.0%) |
| 30 to 34 Years | 62 (83.8%) | 5 (8.1%) |
| 35 to 44 Years | 118 (85.5%) | 2 (1.7%) |
| 45 to 54 Years | 118 (83.7%) | 0 (0.0%) |
| 55 to 59 Years | 68 (76.4%) | 0 (0.0%) |
| 60 to 64 Years | 68 (78.2%) | 3 (4.4%) |
| 65 to 74 Years | 35 (20.2%) | 2 (5.7%) |
| 75 Years and over | 0 (0.0%) | 0 (0.0%) |
| Total | 593 (63.7%) | 16 (2.7%) |
Employment Status by Educational Attainment in South Waverly borough
According to labor force statistics for South Waverly borough, 83.0% of individuals (488) out of the total population between 25 and 64 years of age (588) are in the labor force, with 2.0% or 10 of them being unemployed. The group with the highest labor force participation rate are those with the educational attainment of bachelor's degree or higher, with 95.5% or 147 individuals in the labor force. Within the labor force, individuals with college / associate degree education have the highest percentage of unemployment, with 3.5% or 5 of them being unemployed.
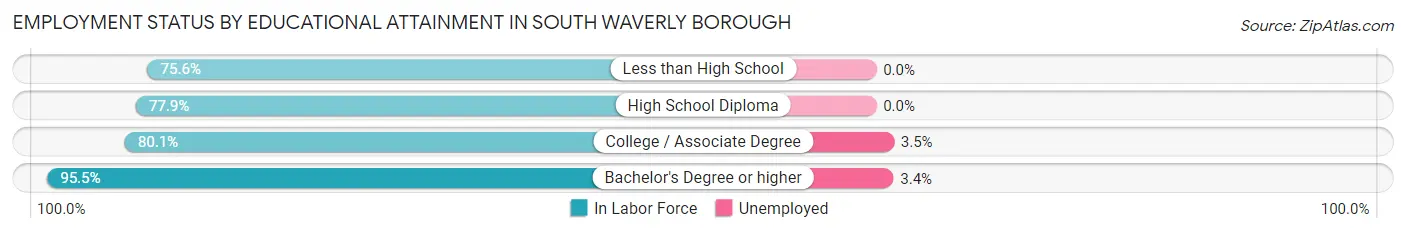
| Educational Attainment | In Labor Force | Unemployed |
| Less than High School | 34 (75.6%) | 0 (0.0%) |
| High School Diploma | 166 (77.9%) | 0 (0.0%) |
| College / Associate Degree | 141 (80.1%) | 6 (3.5%) |
| Bachelor's Degree or higher | 147 (95.5%) | 5 (3.4%) |
| Total | 488 (83.0%) | 12 (2.0%) |
Employment Occupations by Sex in South Waverly borough
Management, Business, Science and Arts Occupations
The most common Management, Business, Science and Arts occupations in South Waverly borough are Community & Social Service (65 | 11.3%), Management (51 | 8.8%), Health Diagnosing & Treating (45 | 7.8%), Education Instruction & Library (41 | 7.1%), and Computers, Engineering & Science (39 | 6.8%).
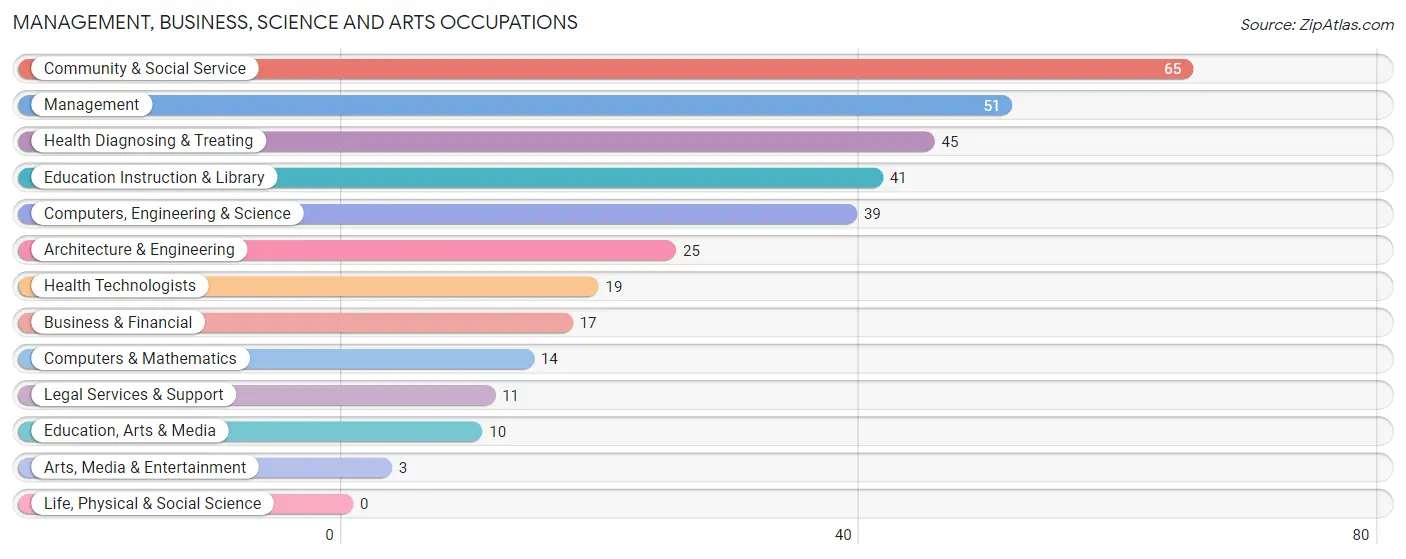
Management, Business, Science and Arts Occupations by Sex
Within the Management, Business, Science and Arts occupations in South Waverly borough, the most male-oriented occupations are Architecture & Engineering (100.0%), Computers, Engineering & Science (74.4%), and Education, Arts & Media (60.0%), while the most female-oriented occupations are Arts, Media & Entertainment (100.0%), Health Diagnosing & Treating (95.6%), and Health Technologists (89.5%).
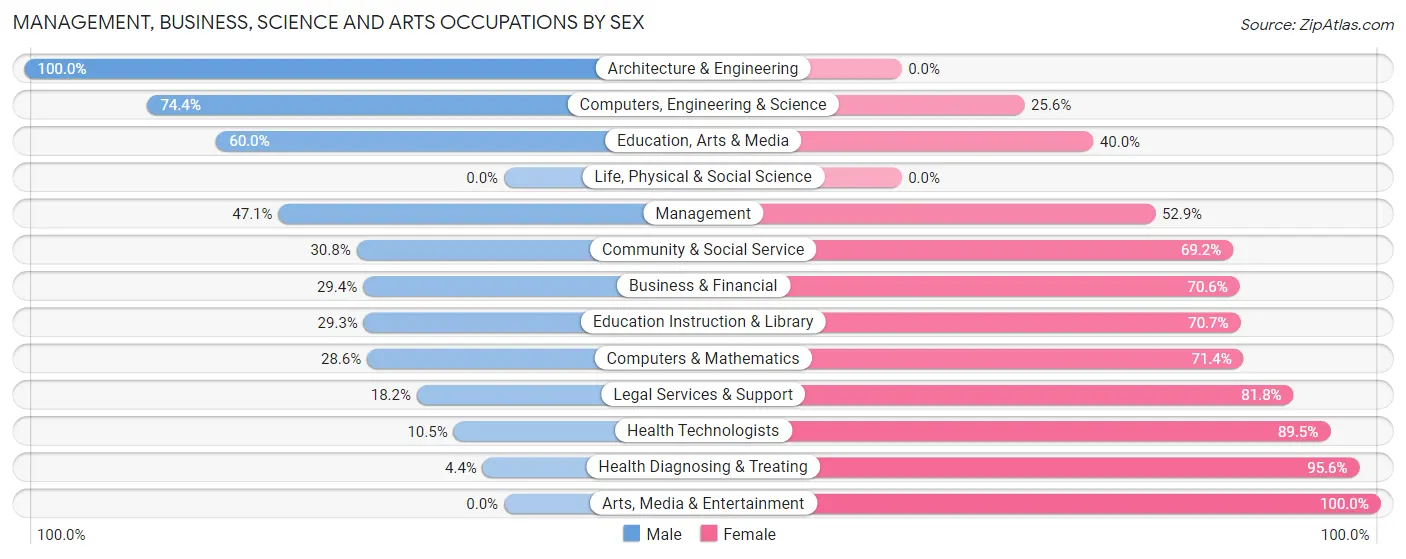
| Occupation | Male | Female |
| Management | 24 (47.1%) | 27 (52.9%) |
| Business & Financial | 5 (29.4%) | 12 (70.6%) |
| Computers, Engineering & Science | 29 (74.4%) | 10 (25.6%) |
| Computers & Mathematics | 4 (28.6%) | 10 (71.4%) |
| Architecture & Engineering | 25 (100.0%) | 0 (0.0%) |
| Life, Physical & Social Science | 0 (0.0%) | 0 (0.0%) |
| Community & Social Service | 20 (30.8%) | 45 (69.2%) |
| Education, Arts & Media | 6 (60.0%) | 4 (40.0%) |
| Legal Services & Support | 2 (18.2%) | 9 (81.8%) |
| Education Instruction & Library | 12 (29.3%) | 29 (70.7%) |
| Arts, Media & Entertainment | 0 (0.0%) | 3 (100.0%) |
| Health Diagnosing & Treating | 2 (4.4%) | 43 (95.6%) |
| Health Technologists | 2 (10.5%) | 17 (89.5%) |
| Total (Category) | 80 (36.9%) | 137 (63.1%) |
| Total (Overall) | 292 (50.6%) | 285 (49.4%) |
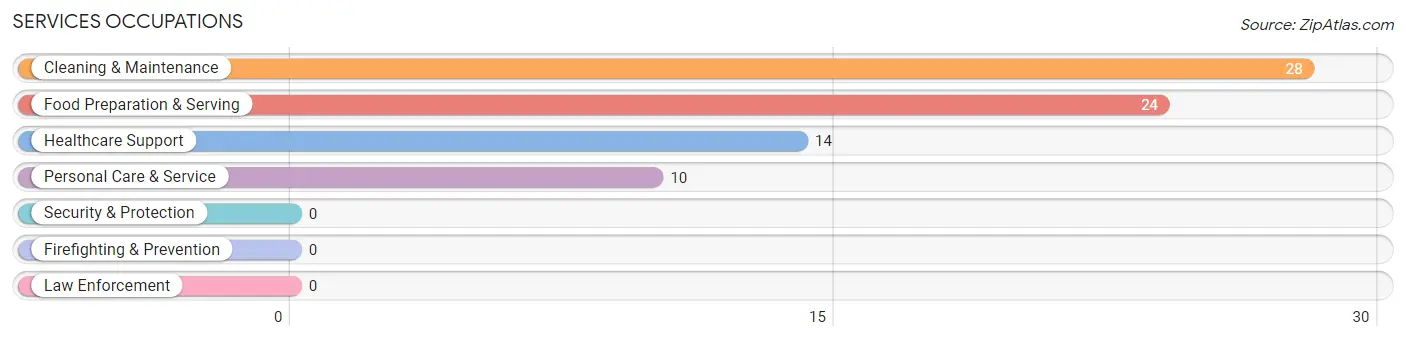
Services Occupations
The most common Services occupations in South Waverly borough are Cleaning & Maintenance (28 | 4.9%), Food Preparation & Serving (24 | 4.2%), Healthcare Support (14 | 2.4%), and Personal Care & Service (10 | 1.7%).
Services Occupations by Sex
Within the Services occupations in South Waverly borough, the most male-oriented occupations are Food Preparation & Serving (83.3%), and Cleaning & Maintenance (75.0%), while the most female-oriented occupations are Healthcare Support (100.0%), Personal Care & Service (100.0%), and Cleaning & Maintenance (25.0%).
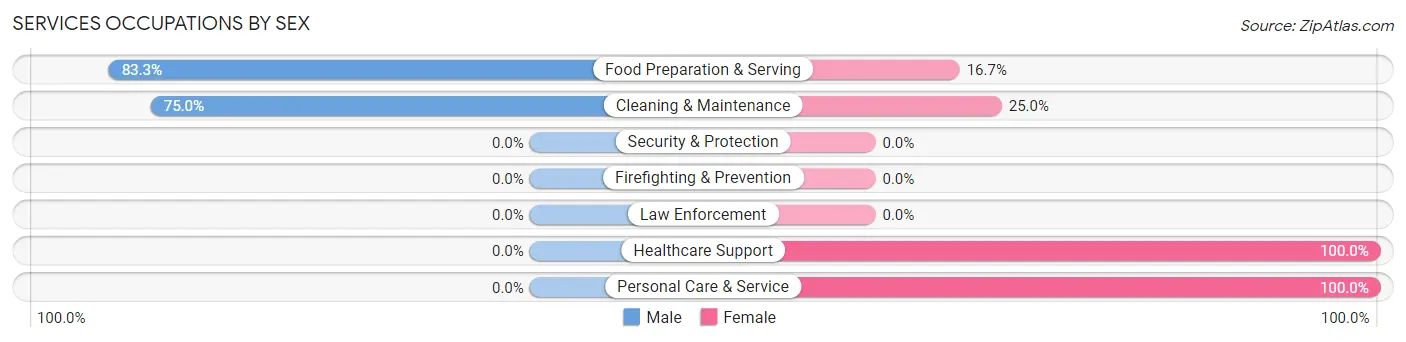
| Occupation | Male | Female |
| Healthcare Support | 0 (0.0%) | 14 (100.0%) |
| Security & Protection | 0 (0.0%) | 0 (0.0%) |
| Firefighting & Prevention | 0 (0.0%) | 0 (0.0%) |
| Law Enforcement | 0 (0.0%) | 0 (0.0%) |
| Food Preparation & Serving | 20 (83.3%) | 4 (16.7%) |
| Cleaning & Maintenance | 21 (75.0%) | 7 (25.0%) |
| Personal Care & Service | 0 (0.0%) | 10 (100.0%) |
| Total (Category) | 41 (53.9%) | 35 (46.1%) |
| Total (Overall) | 292 (50.6%) | 285 (49.4%) |
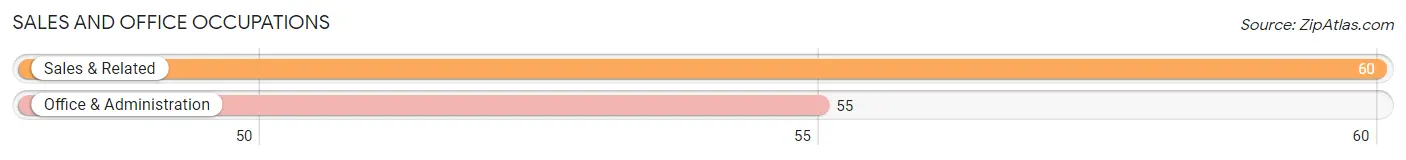
Sales and Office Occupations
The most common Sales and Office occupations in South Waverly borough are Sales & Related (60 | 10.4%), and Office & Administration (55 | 9.5%).
Sales and Office Occupations by Sex
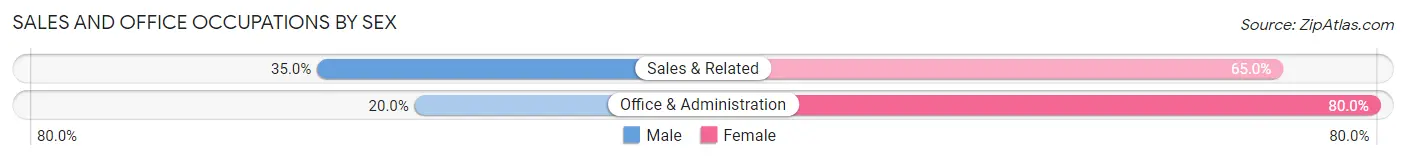
| Occupation | Male | Female |
| Sales & Related | 21 (35.0%) | 39 (65.0%) |
| Office & Administration | 11 (20.0%) | 44 (80.0%) |
| Total (Category) | 32 (27.8%) | 83 (72.2%) |
| Total (Overall) | 292 (50.6%) | 285 (49.4%) |
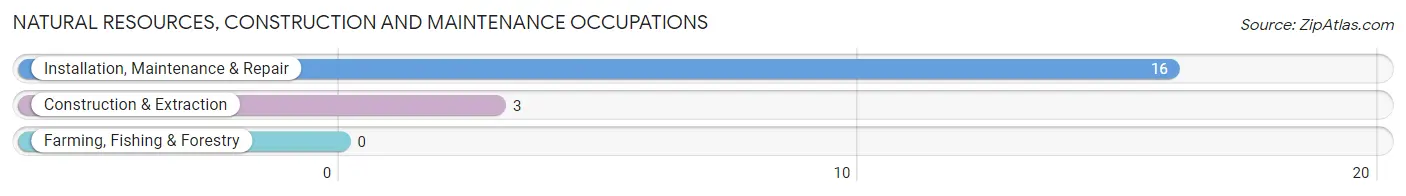
Natural Resources, Construction and Maintenance Occupations
The most common Natural Resources, Construction and Maintenance occupations in South Waverly borough are Installation, Maintenance & Repair (16 | 2.8%), and Construction & Extraction (3 | 0.5%).
Natural Resources, Construction and Maintenance Occupations by Sex
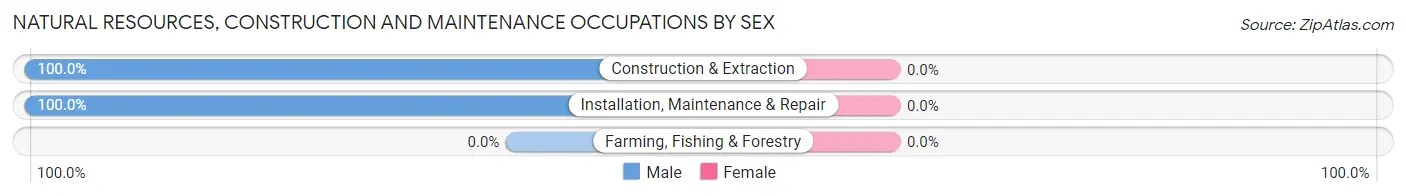
| Occupation | Male | Female |
| Farming, Fishing & Forestry | 0 (0.0%) | 0 (0.0%) |
| Construction & Extraction | 3 (100.0%) | 0 (0.0%) |
| Installation, Maintenance & Repair | 16 (100.0%) | 0 (0.0%) |
| Total (Category) | 19 (100.0%) | 0 (0.0%) |
| Total (Overall) | 292 (50.6%) | 285 (49.4%) |
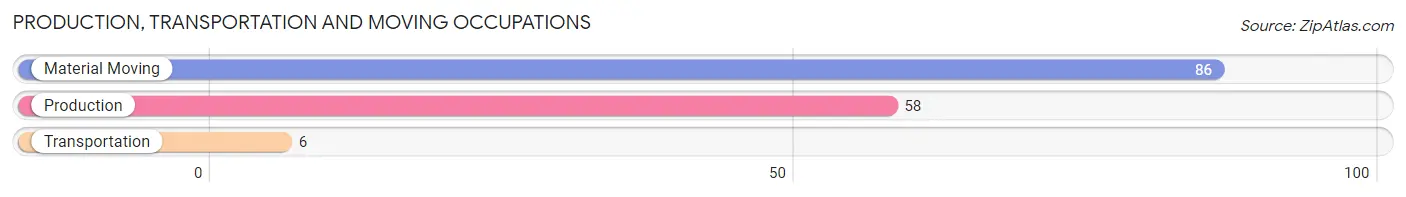
Production, Transportation and Moving Occupations
The most common Production, Transportation and Moving occupations in South Waverly borough are Material Moving (86 | 14.9%), Production (58 | 10.1%), and Transportation (6 | 1.0%).
Production, Transportation and Moving Occupations by Sex
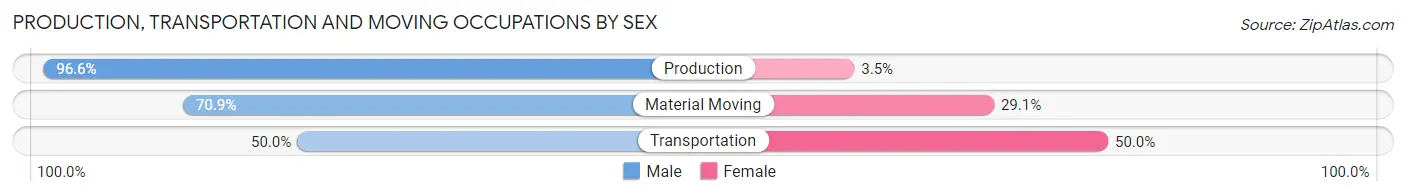
| Occupation | Male | Female |
| Production | 56 (96.6%) | 2 (3.5%) |
| Transportation | 3 (50.0%) | 3 (50.0%) |
| Material Moving | 61 (70.9%) | 25 (29.1%) |
| Total (Category) | 120 (80.0%) | 30 (20.0%) |
| Total (Overall) | 292 (50.6%) | 285 (49.4%) |
Employment Industries by Sex in South Waverly borough
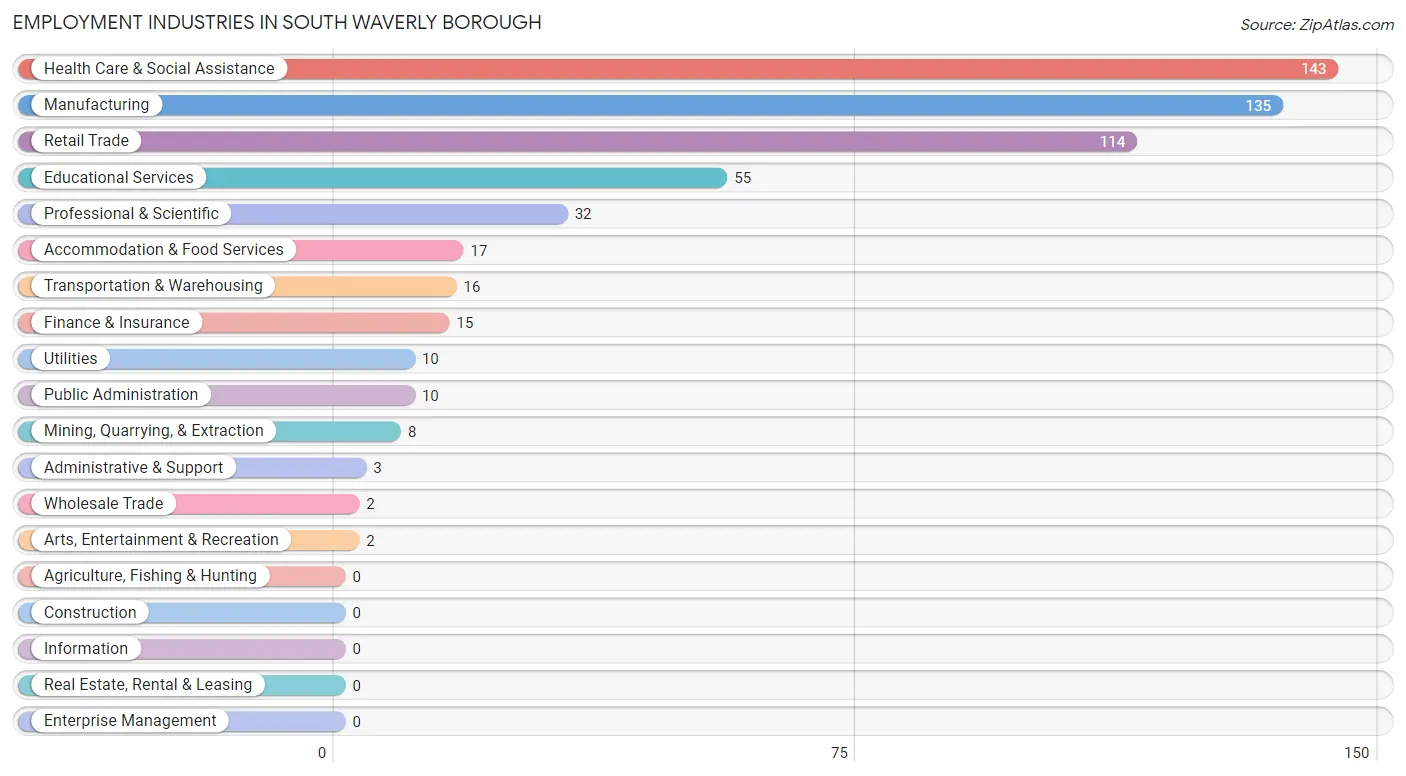
Employment Industries in South Waverly borough
The major employment industries in South Waverly borough include Health Care & Social Assistance (143 | 24.8%), Manufacturing (135 | 23.4%), Retail Trade (114 | 19.8%), Educational Services (55 | 9.5%), and Professional & Scientific (32 | 5.6%).
Employment Industries by Sex in South Waverly borough
The South Waverly borough industries that see more men than women are Wholesale Trade (100.0%), Transportation & Warehousing (100.0%), and Utilities (100.0%), whereas the industries that tend to have a higher number of women are Mining, Quarrying, & Extraction (100.0%), Administrative & Support (100.0%), and Public Administration (100.0%).
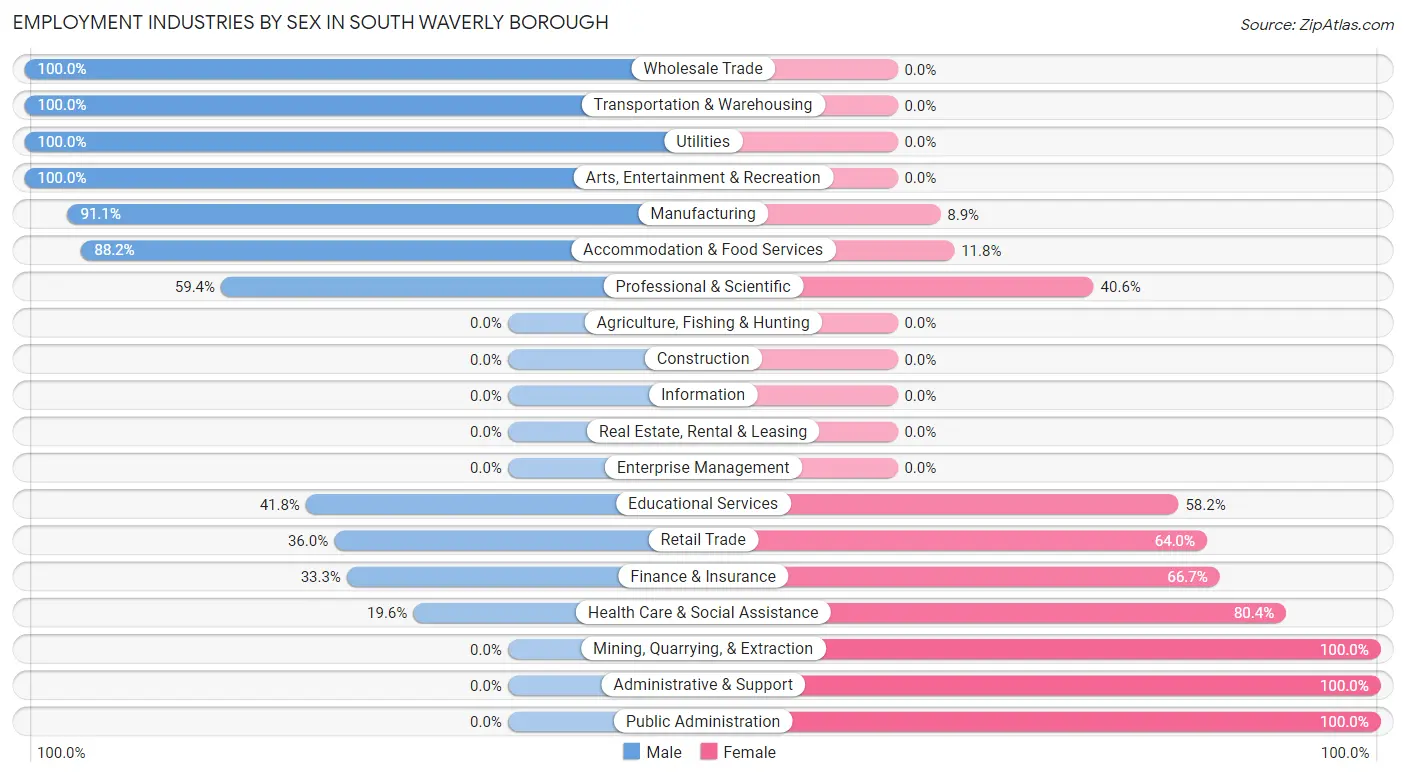
| Industry | Male | Female |
| Agriculture, Fishing & Hunting | 0 (0.0%) | 0 (0.0%) |
| Mining, Quarrying, & Extraction | 0 (0.0%) | 8 (100.0%) |
| Construction | 0 (0.0%) | 0 (0.0%) |
| Manufacturing | 123 (91.1%) | 12 (8.9%) |
| Wholesale Trade | 2 (100.0%) | 0 (0.0%) |
| Retail Trade | 41 (36.0%) | 73 (64.0%) |
| Transportation & Warehousing | 16 (100.0%) | 0 (0.0%) |
| Utilities | 10 (100.0%) | 0 (0.0%) |
| Information | 0 (0.0%) | 0 (0.0%) |
| Finance & Insurance | 5 (33.3%) | 10 (66.7%) |
| Real Estate, Rental & Leasing | 0 (0.0%) | 0 (0.0%) |
| Professional & Scientific | 19 (59.4%) | 13 (40.6%) |
| Enterprise Management | 0 (0.0%) | 0 (0.0%) |
| Administrative & Support | 0 (0.0%) | 3 (100.0%) |
| Educational Services | 23 (41.8%) | 32 (58.2%) |
| Health Care & Social Assistance | 28 (19.6%) | 115 (80.4%) |
| Arts, Entertainment & Recreation | 2 (100.0%) | 0 (0.0%) |
| Accommodation & Food Services | 15 (88.2%) | 2 (11.8%) |
| Public Administration | 0 (0.0%) | 10 (100.0%) |
| Total | 292 (50.6%) | 285 (49.4%) |
Education in South Waverly borough
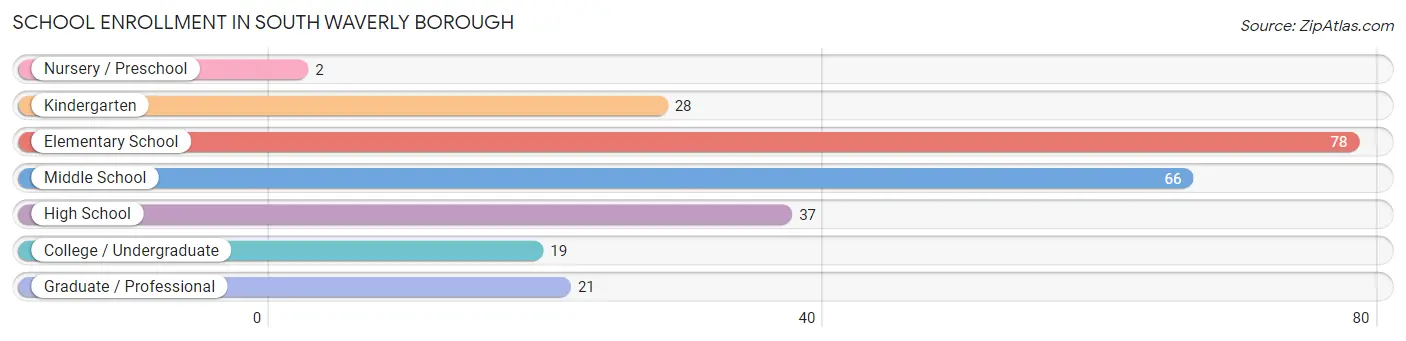
School Enrollment in South Waverly borough
The most common levels of schooling among the 251 students in South Waverly borough are elementary school (78 | 31.1%), middle school (66 | 26.3%), and high school (37 | 14.7%).
| School Level | # Students | % Students |
| Nursery / Preschool | 2 | 0.8% |
| Kindergarten | 28 | 11.2% |
| Elementary School | 78 | 31.1% |
| Middle School | 66 | 26.3% |
| High School | 37 | 14.7% |
| College / Undergraduate | 19 | 7.6% |
| Graduate / Professional | 21 | 8.4% |
| Total | 251 | 100.0% |
School Enrollment by Age by Funding Source in South Waverly borough
Out of a total of 251 students who are enrolled in schools in South Waverly borough, 15 (6.0%) attend a private institution, while the remaining 236 (94.0%) are enrolled in public schools. The age group of 18 to 19 year olds has the highest likelihood of being enrolled in private schools, with 4 (44.4% in the age bracket) enrolled. Conversely, the age group of 5 to 9 year old has the lowest likelihood of being enrolled in a private school, with 99 (100.0% in the age bracket) attending a public institution.
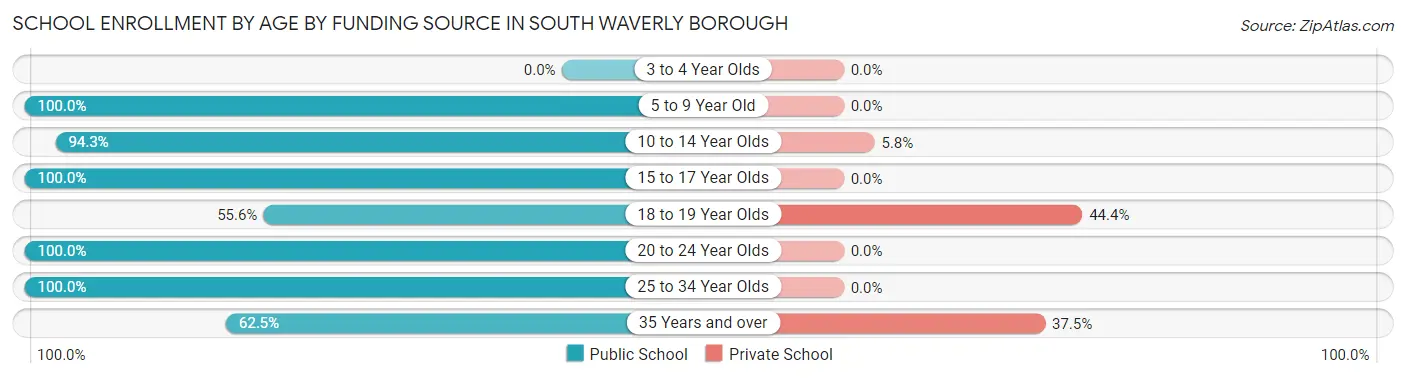
| Age Bracket | Public School | Private School |
| 3 to 4 Year Olds | 0 (0.0%) | 0 (0.0%) |
| 5 to 9 Year Old | 99 (100.0%) | 0 (0.0%) |
| 10 to 14 Year Olds | 82 (94.3%) | 5 (5.8%) |
| 15 to 17 Year Olds | 18 (100.0%) | 0 (0.0%) |
| 18 to 19 Year Olds | 5 (55.6%) | 4 (44.4%) |
| 20 to 24 Year Olds | 13 (100.0%) | 0 (0.0%) |
| 25 to 34 Year Olds | 9 (100.0%) | 0 (0.0%) |
| 35 Years and over | 10 (62.5%) | 6 (37.5%) |
| Total | 236 (94.0%) | 15 (6.0%) |
Educational Attainment by Field of Study in South Waverly borough
Science & technology (38 | 17.0%), education (38 | 17.0%), business (37 | 16.5%), engineering (25 | 11.2%), and bio, nature & agricultural (23 | 10.3%) are the most common fields of study among 224 individuals in South Waverly borough who have obtained a bachelor's degree or higher.
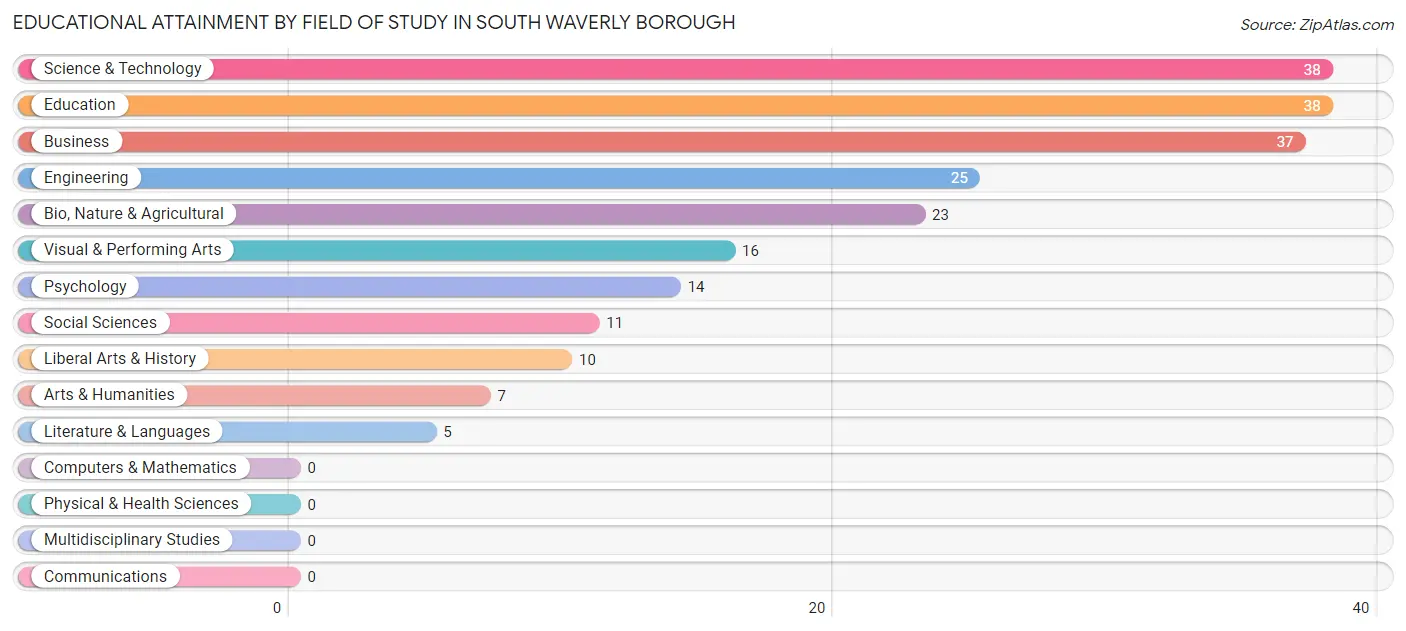
| Field of Study | # Graduates | % Graduates |
| Computers & Mathematics | 0 | 0.0% |
| Bio, Nature & Agricultural | 23 | 10.3% |
| Physical & Health Sciences | 0 | 0.0% |
| Psychology | 14 | 6.2% |
| Social Sciences | 11 | 4.9% |
| Engineering | 25 | 11.2% |
| Multidisciplinary Studies | 0 | 0.0% |
| Science & Technology | 38 | 17.0% |
| Business | 37 | 16.5% |
| Education | 38 | 17.0% |
| Literature & Languages | 5 | 2.2% |
| Liberal Arts & History | 10 | 4.5% |
| Visual & Performing Arts | 16 | 7.1% |
| Communications | 0 | 0.0% |
| Arts & Humanities | 7 | 3.1% |
| Total | 224 | 100.0% |
Transportation & Commute in South Waverly borough
Vehicle Availability by Sex in South Waverly borough
The most prevalent vehicle ownership categories in South Waverly borough are males with 2 vehicles (163, accounting for 55.8%) and females with 2 vehicles (143, making up 57.2%).
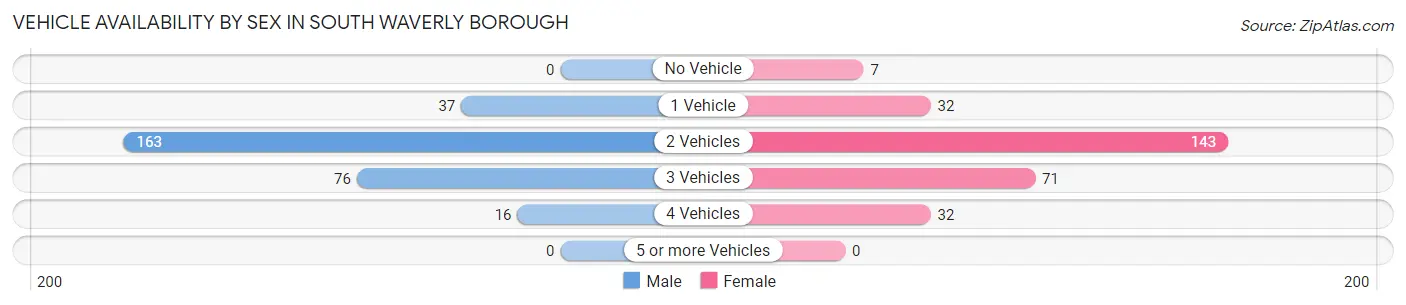
| Vehicles Available | Male | Female |
| No Vehicle | 0 (0.0%) | 7 (2.5%) |
| 1 Vehicle | 37 (12.7%) | 32 (11.2%) |
| 2 Vehicles | 163 (55.8%) | 143 (50.2%) |
| 3 Vehicles | 76 (26.0%) | 71 (24.9%) |
| 4 Vehicles | 16 (5.5%) | 32 (11.2%) |
| 5 or more Vehicles | 0 (0.0%) | 0 (0.0%) |
| Total | 292 (100.0%) | 285 (100.0%) |
Commute Time in South Waverly borough
The most frequently occuring commute durations in South Waverly borough are 5 to 9 minutes (181 commuters, 32.4%), 10 to 14 minutes (94 commuters, 16.8%), and less than 5 minutes (72 commuters, 12.9%).
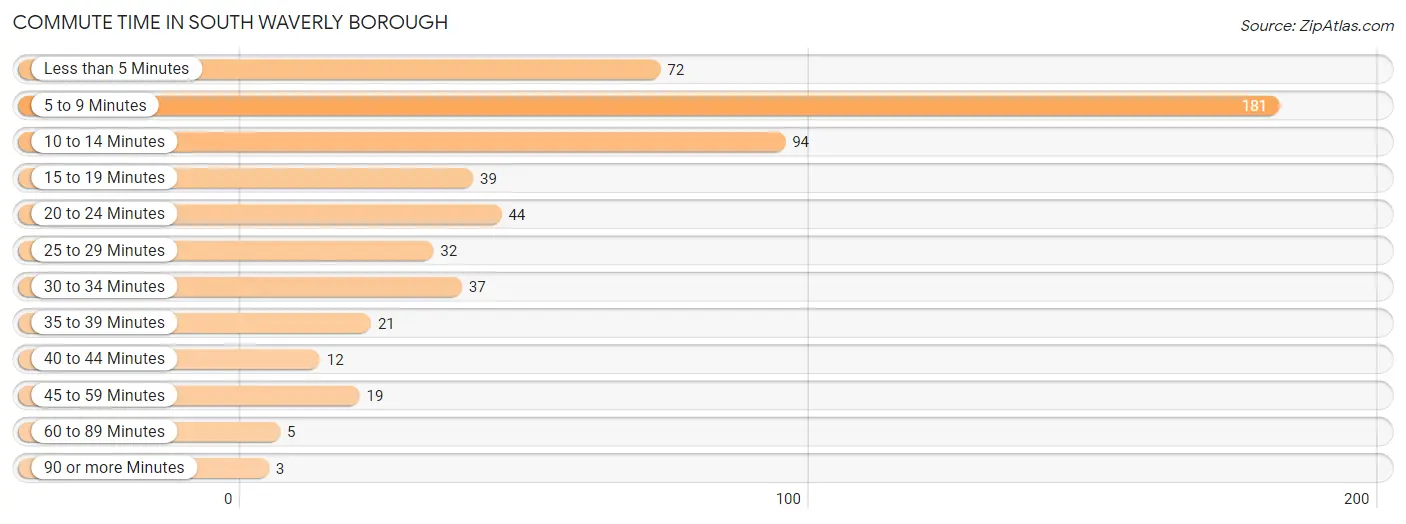
| Commute Time | # Commuters | % Commuters |
| Less than 5 Minutes | 72 | 12.9% |
| 5 to 9 Minutes | 181 | 32.4% |
| 10 to 14 Minutes | 94 | 16.8% |
| 15 to 19 Minutes | 39 | 7.0% |
| 20 to 24 Minutes | 44 | 7.9% |
| 25 to 29 Minutes | 32 | 5.7% |
| 30 to 34 Minutes | 37 | 6.6% |
| 35 to 39 Minutes | 21 | 3.8% |
| 40 to 44 Minutes | 12 | 2.1% |
| 45 to 59 Minutes | 19 | 3.4% |
| 60 to 89 Minutes | 5 | 0.9% |
| 90 or more Minutes | 3 | 0.5% |
Commute Time by Sex in South Waverly borough
The most common commute times in South Waverly borough are 5 to 9 minutes (93 commuters, 32.1%) for males and 5 to 9 minutes (88 commuters, 32.7%) for females.
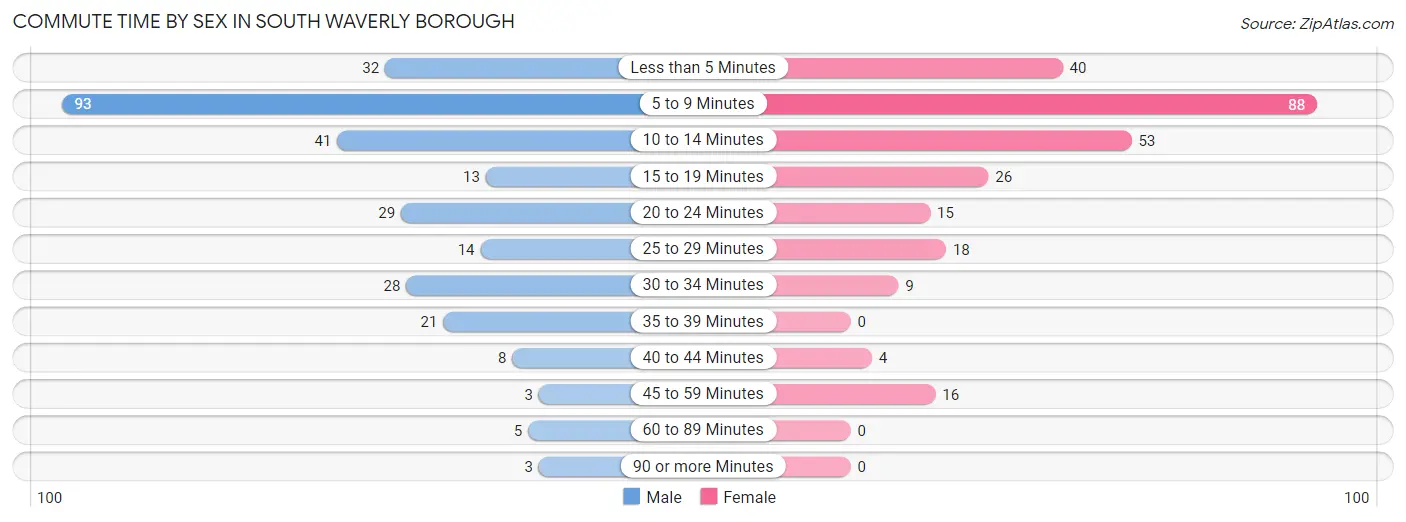
| Commute Time | Male | Female |
| Less than 5 Minutes | 32 (11.0%) | 40 (14.9%) |
| 5 to 9 Minutes | 93 (32.1%) | 88 (32.7%) |
| 10 to 14 Minutes | 41 (14.1%) | 53 (19.7%) |
| 15 to 19 Minutes | 13 (4.5%) | 26 (9.7%) |
| 20 to 24 Minutes | 29 (10.0%) | 15 (5.6%) |
| 25 to 29 Minutes | 14 (4.8%) | 18 (6.7%) |
| 30 to 34 Minutes | 28 (9.7%) | 9 (3.4%) |
| 35 to 39 Minutes | 21 (7.2%) | 0 (0.0%) |
| 40 to 44 Minutes | 8 (2.8%) | 4 (1.5%) |
| 45 to 59 Minutes | 3 (1.0%) | 16 (5.9%) |
| 60 to 89 Minutes | 5 (1.7%) | 0 (0.0%) |
| 90 or more Minutes | 3 (1.0%) | 0 (0.0%) |
Time of Departure to Work by Sex in South Waverly borough
The most frequent times of departure to work in South Waverly borough are 6:30 AM to 6:59 AM (62, 21.4%) for males and 7:00 AM to 7:29 AM (75, 27.9%) for females.
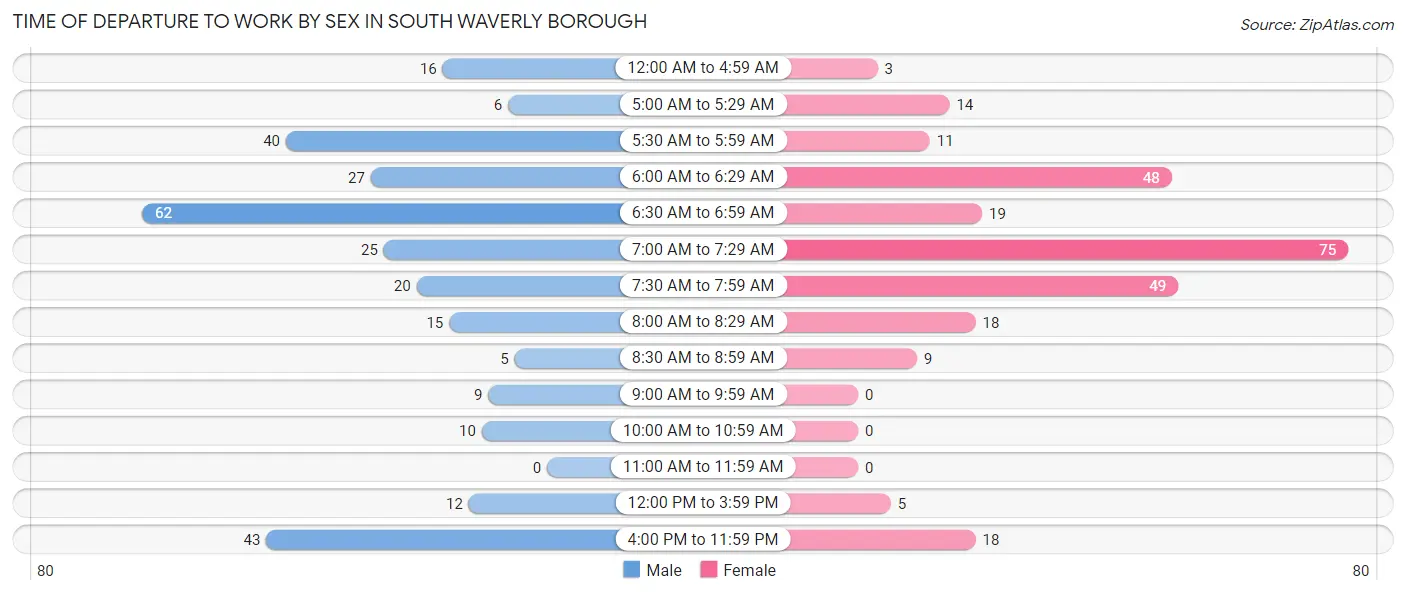
| Time of Departure | Male | Female |
| 12:00 AM to 4:59 AM | 16 (5.5%) | 3 (1.1%) |
| 5:00 AM to 5:29 AM | 6 (2.1%) | 14 (5.2%) |
| 5:30 AM to 5:59 AM | 40 (13.8%) | 11 (4.1%) |
| 6:00 AM to 6:29 AM | 27 (9.3%) | 48 (17.8%) |
| 6:30 AM to 6:59 AM | 62 (21.4%) | 19 (7.1%) |
| 7:00 AM to 7:29 AM | 25 (8.6%) | 75 (27.9%) |
| 7:30 AM to 7:59 AM | 20 (6.9%) | 49 (18.2%) |
| 8:00 AM to 8:29 AM | 15 (5.2%) | 18 (6.7%) |
| 8:30 AM to 8:59 AM | 5 (1.7%) | 9 (3.4%) |
| 9:00 AM to 9:59 AM | 9 (3.1%) | 0 (0.0%) |
| 10:00 AM to 10:59 AM | 10 (3.5%) | 0 (0.0%) |
| 11:00 AM to 11:59 AM | 0 (0.0%) | 0 (0.0%) |
| 12:00 PM to 3:59 PM | 12 (4.1%) | 5 (1.9%) |
| 4:00 PM to 11:59 PM | 43 (14.8%) | 18 (6.7%) |
| Total | 290 (100.0%) | 269 (100.0%) |
Housing Occupancy in South Waverly borough
Occupancy by Ownership in South Waverly borough
Of the total 441 dwellings in South Waverly borough, owner-occupied units account for 391 (88.7%), while renter-occupied units make up 50 (11.3%).
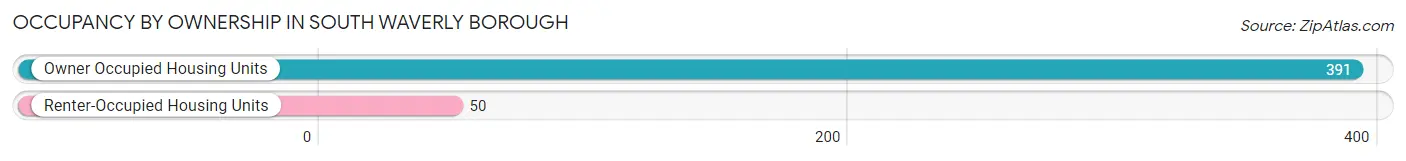
| Occupancy | # Housing Units | % Housing Units |
| Owner Occupied Housing Units | 391 | 88.7% |
| Renter-Occupied Housing Units | 50 | 11.3% |
| Total Occupied Housing Units | 441 | 100.0% |
Occupancy by Household Size in South Waverly borough
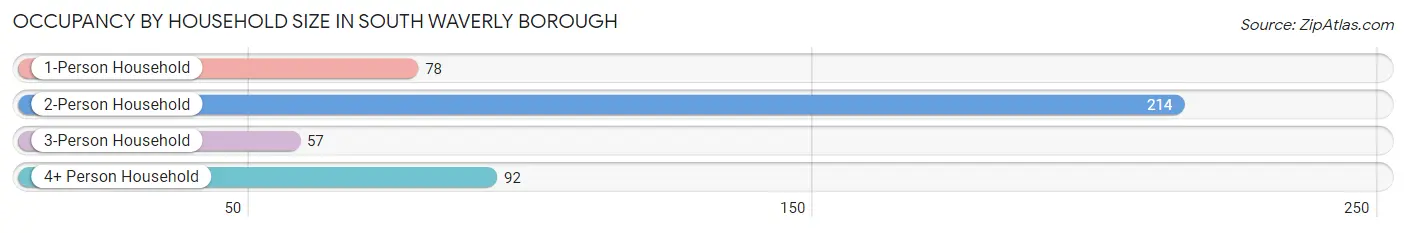
| Household Size | # Housing Units | % Housing Units |
| 1-Person Household | 78 | 17.7% |
| 2-Person Household | 214 | 48.5% |
| 3-Person Household | 57 | 12.9% |
| 4+ Person Household | 92 | 20.9% |
| Total Housing Units | 441 | 100.0% |
Occupancy by Ownership by Household Size in South Waverly borough
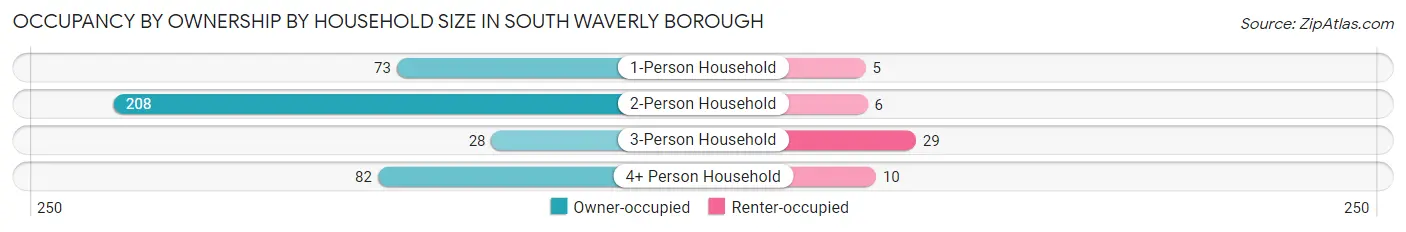
| Household Size | Owner-occupied | Renter-occupied |
| 1-Person Household | 73 (93.6%) | 5 (6.4%) |
| 2-Person Household | 208 (97.2%) | 6 (2.8%) |
| 3-Person Household | 28 (49.1%) | 29 (50.9%) |
| 4+ Person Household | 82 (89.1%) | 10 (10.9%) |
| Total Housing Units | 391 (88.7%) | 50 (11.3%) |
Occupancy by Educational Attainment in South Waverly borough
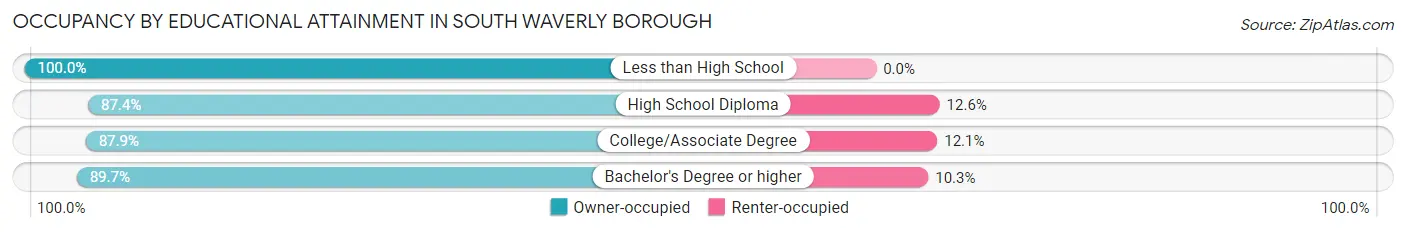
| Household Size | Owner-occupied | Renter-occupied |
| Less than High School | 17 (100.0%) | 0 (0.0%) |
| High School Diploma | 125 (87.4%) | 18 (12.6%) |
| College/Associate Degree | 145 (87.9%) | 20 (12.1%) |
| Bachelor's Degree or higher | 104 (89.7%) | 12 (10.3%) |
Occupancy by Age of Householder in South Waverly borough
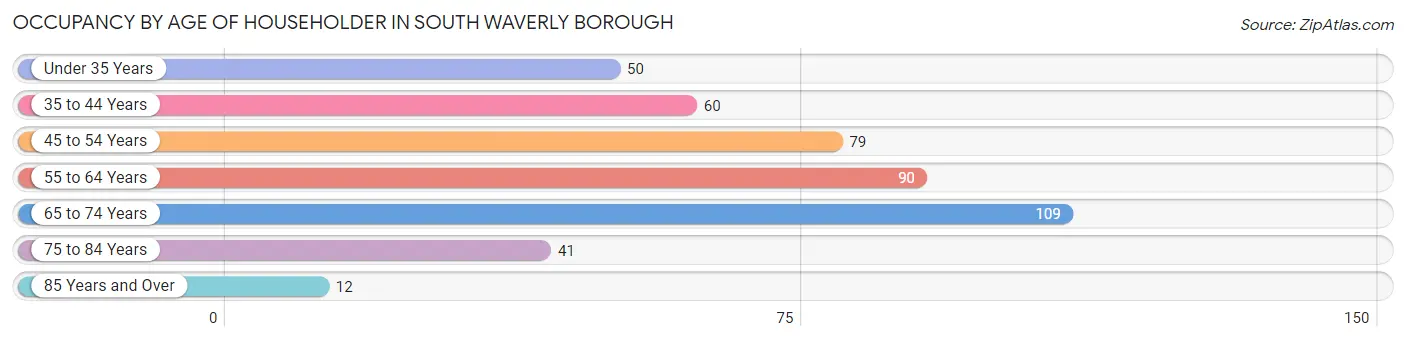
| Age Bracket | # Households | % Households |
| Under 35 Years | 50 | 11.3% |
| 35 to 44 Years | 60 | 13.6% |
| 45 to 54 Years | 79 | 17.9% |
| 55 to 64 Years | 90 | 20.4% |
| 65 to 74 Years | 109 | 24.7% |
| 75 to 84 Years | 41 | 9.3% |
| 85 Years and Over | 12 | 2.7% |
| Total | 441 | 100.0% |
Housing Finances in South Waverly borough
Median Income by Occupancy in South Waverly borough
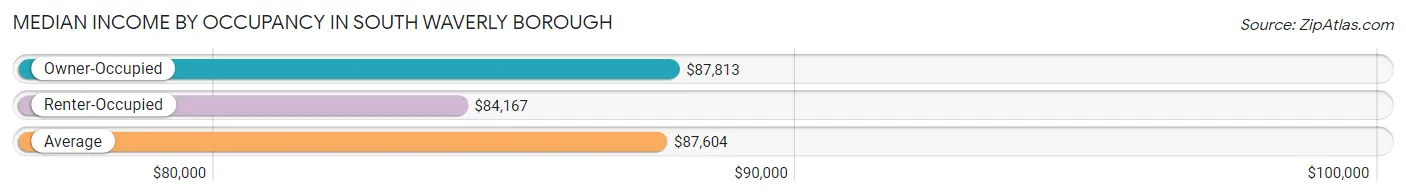
| Occupancy Type | # Households | Median Income |
| Owner-Occupied | 391 (88.7%) | $87,813 |
| Renter-Occupied | 50 (11.3%) | $84,167 |
| Average | 441 (100.0%) | $87,604 |
Occupancy by Householder Income Bracket in South Waverly borough
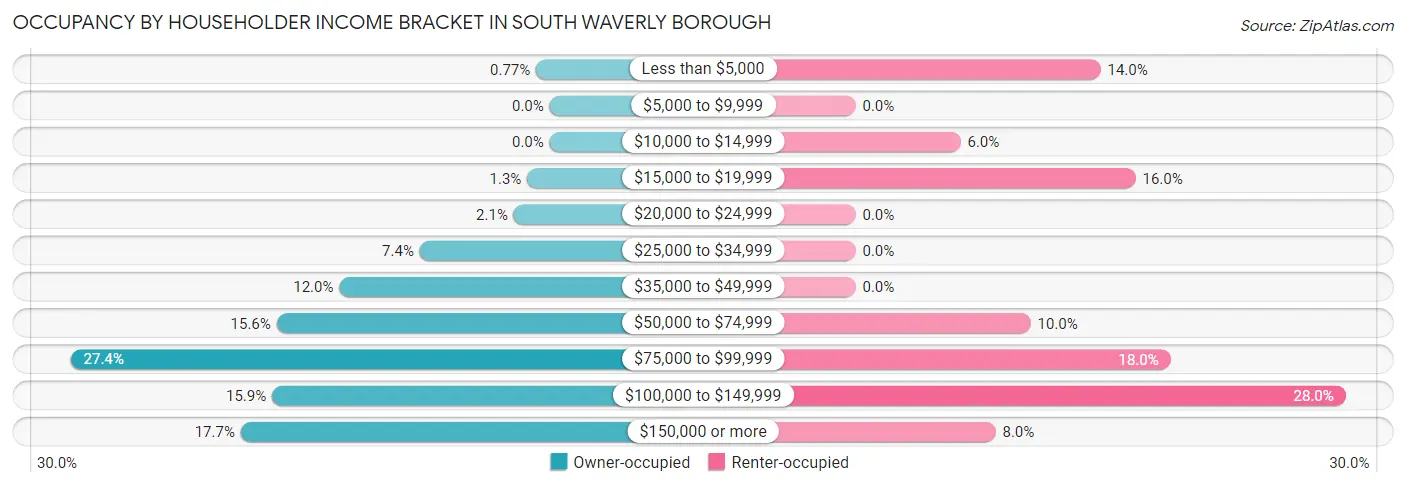
| Income Bracket | Owner-occupied | Renter-occupied |
| Less than $5,000 | 3 (0.8%) | 7 (14.0%) |
| $5,000 to $9,999 | 0 (0.0%) | 0 (0.0%) |
| $10,000 to $14,999 | 0 (0.0%) | 3 (6.0%) |
| $15,000 to $19,999 | 5 (1.3%) | 8 (16.0%) |
| $20,000 to $24,999 | 8 (2.1%) | 0 (0.0%) |
| $25,000 to $34,999 | 29 (7.4%) | 0 (0.0%) |
| $35,000 to $49,999 | 47 (12.0%) | 0 (0.0%) |
| $50,000 to $74,999 | 61 (15.6%) | 5 (10.0%) |
| $75,000 to $99,999 | 107 (27.4%) | 9 (18.0%) |
| $100,000 to $149,999 | 62 (15.9%) | 14 (28.0%) |
| $150,000 or more | 69 (17.6%) | 4 (8.0%) |
| Total | 391 (100.0%) | 50 (100.0%) |
Monthly Housing Cost Tiers in South Waverly borough
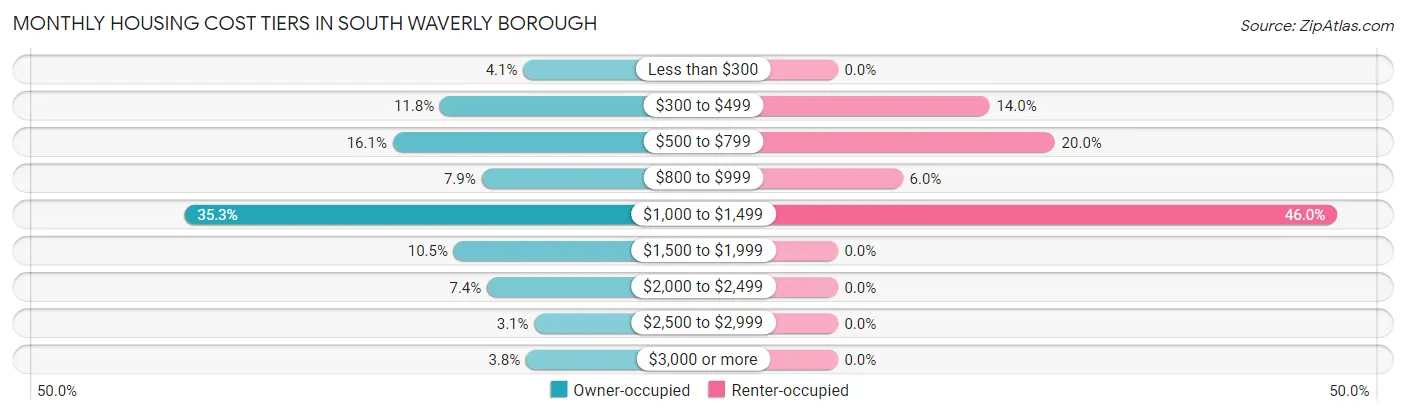
| Monthly Cost | Owner-occupied | Renter-occupied |
| Less than $300 | 16 (4.1%) | 0 (0.0%) |
| $300 to $499 | 46 (11.8%) | 7 (14.0%) |
| $500 to $799 | 63 (16.1%) | 10 (20.0%) |
| $800 to $999 | 31 (7.9%) | 3 (6.0%) |
| $1,000 to $1,499 | 138 (35.3%) | 23 (46.0%) |
| $1,500 to $1,999 | 41 (10.5%) | 0 (0.0%) |
| $2,000 to $2,499 | 29 (7.4%) | 0 (0.0%) |
| $2,500 to $2,999 | 12 (3.1%) | 0 (0.0%) |
| $3,000 or more | 15 (3.8%) | 0 (0.0%) |
| Total | 391 (100.0%) | 50 (100.0%) |
Physical Housing Characteristics in South Waverly borough
Housing Structures in South Waverly borough
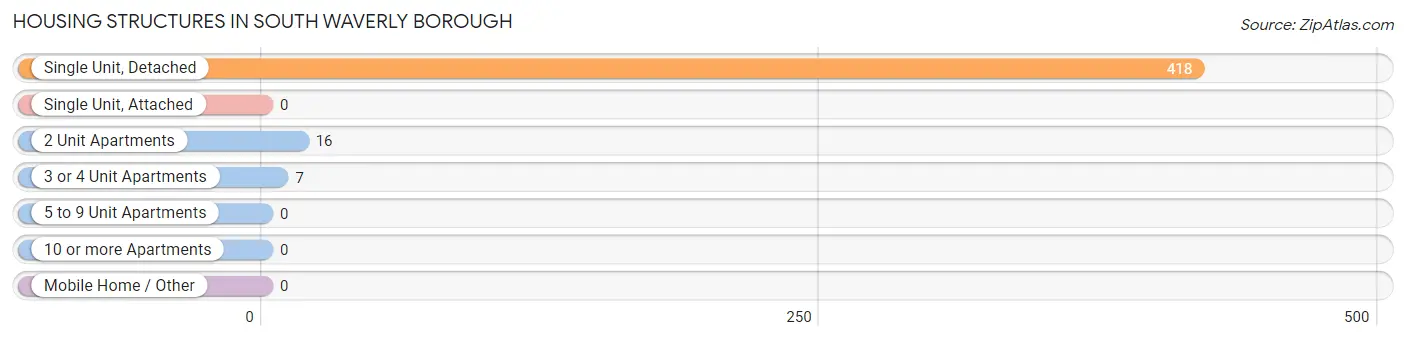
| Structure Type | # Housing Units | % Housing Units |
| Single Unit, Detached | 418 | 94.8% |
| Single Unit, Attached | 0 | 0.0% |
| 2 Unit Apartments | 16 | 3.6% |
| 3 or 4 Unit Apartments | 7 | 1.6% |
| 5 to 9 Unit Apartments | 0 | 0.0% |
| 10 or more Apartments | 0 | 0.0% |
| Mobile Home / Other | 0 | 0.0% |
| Total | 441 | 100.0% |
Housing Structures by Occupancy in South Waverly borough
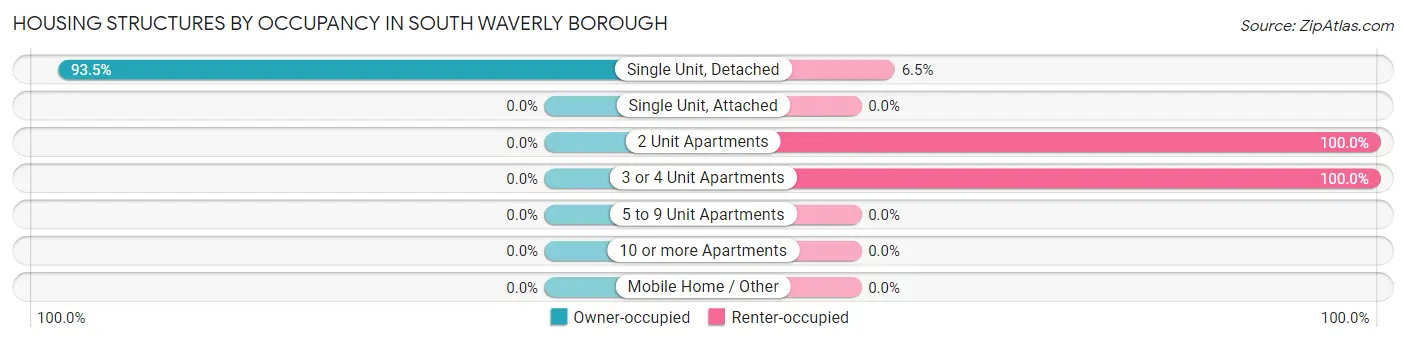
| Structure Type | Owner-occupied | Renter-occupied |
| Single Unit, Detached | 391 (93.5%) | 27 (6.5%) |
| Single Unit, Attached | 0 (0.0%) | 0 (0.0%) |
| 2 Unit Apartments | 0 (0.0%) | 16 (100.0%) |
| 3 or 4 Unit Apartments | 0 (0.0%) | 7 (100.0%) |
| 5 to 9 Unit Apartments | 0 (0.0%) | 0 (0.0%) |
| 10 or more Apartments | 0 (0.0%) | 0 (0.0%) |
| Mobile Home / Other | 0 (0.0%) | 0 (0.0%) |
| Total | 391 (88.7%) | 50 (11.3%) |
Housing Structures by Number of Rooms in South Waverly borough
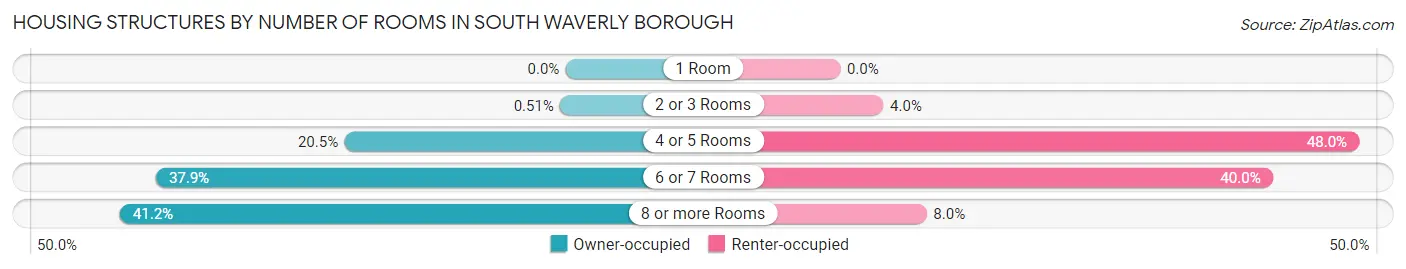
| Number of Rooms | Owner-occupied | Renter-occupied |
| 1 Room | 0 (0.0%) | 0 (0.0%) |
| 2 or 3 Rooms | 2 (0.5%) | 2 (4.0%) |
| 4 or 5 Rooms | 80 (20.5%) | 24 (48.0%) |
| 6 or 7 Rooms | 148 (37.9%) | 20 (40.0%) |
| 8 or more Rooms | 161 (41.2%) | 4 (8.0%) |
| Total | 391 (100.0%) | 50 (100.0%) |
Housing Structure by Heating Type in South Waverly borough
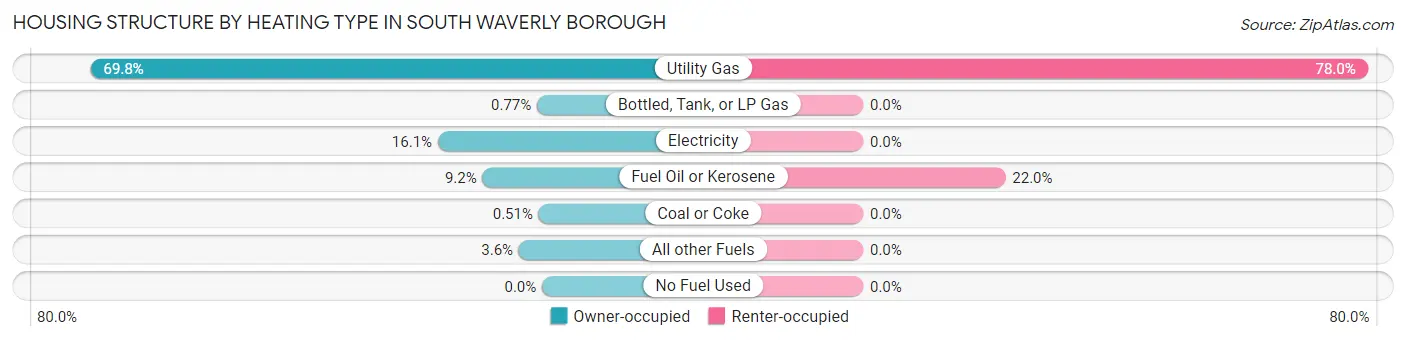
| Heating Type | Owner-occupied | Renter-occupied |
| Utility Gas | 273 (69.8%) | 39 (78.0%) |
| Bottled, Tank, or LP Gas | 3 (0.8%) | 0 (0.0%) |
| Electricity | 63 (16.1%) | 0 (0.0%) |
| Fuel Oil or Kerosene | 36 (9.2%) | 11 (22.0%) |
| Coal or Coke | 2 (0.5%) | 0 (0.0%) |
| All other Fuels | 14 (3.6%) | 0 (0.0%) |
| No Fuel Used | 0 (0.0%) | 0 (0.0%) |
| Total | 391 (100.0%) | 50 (100.0%) |
Household Vehicle Usage in South Waverly borough
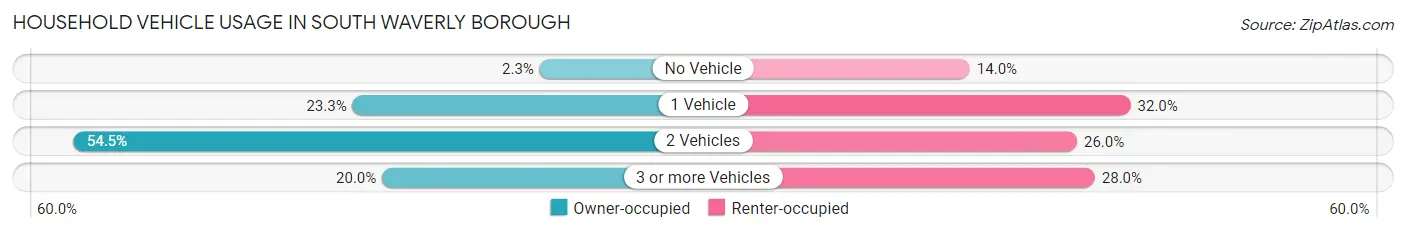
| Vehicles per Household | Owner-occupied | Renter-occupied |
| No Vehicle | 9 (2.3%) | 7 (14.0%) |
| 1 Vehicle | 91 (23.3%) | 16 (32.0%) |
| 2 Vehicles | 213 (54.5%) | 13 (26.0%) |
| 3 or more Vehicles | 78 (20.0%) | 14 (28.0%) |
| Total | 391 (100.0%) | 50 (100.0%) |
Real Estate & Mortgages in South Waverly borough
Real Estate and Mortgage Overview in South Waverly borough
| Characteristic | Without Mortgage | With Mortgage |
| Housing Units | 139 | 252 |
| Median Property Value | $150,700 | $178,900 |
| Median Household Income | $71,607 | $60 |
| Monthly Housing Costs | $531 | $15 |
| Real Estate Taxes | $2,310 | $0 |
Property Value by Mortgage Status in South Waverly borough
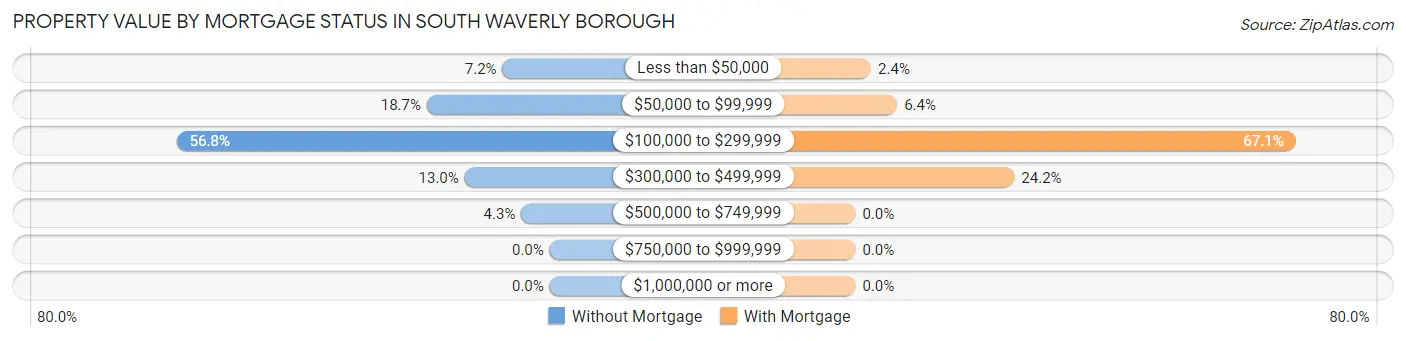
| Property Value | Without Mortgage | With Mortgage |
| Less than $50,000 | 10 (7.2%) | 6 (2.4%) |
| $50,000 to $99,999 | 26 (18.7%) | 16 (6.4%) |
| $100,000 to $299,999 | 79 (56.8%) | 169 (67.1%) |
| $300,000 to $499,999 | 18 (13.0%) | 61 (24.2%) |
| $500,000 to $749,999 | 6 (4.3%) | 0 (0.0%) |
| $750,000 to $999,999 | 0 (0.0%) | 0 (0.0%) |
| $1,000,000 or more | 0 (0.0%) | 0 (0.0%) |
| Total | 139 (100.0%) | 252 (100.0%) |
Household Income by Mortgage Status in South Waverly borough
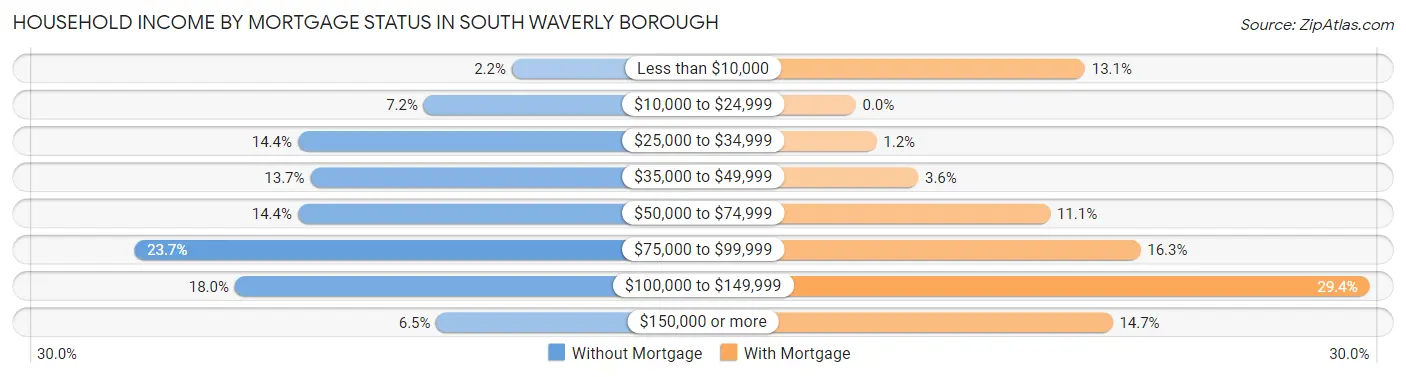
| Household Income | Without Mortgage | With Mortgage |
| Less than $10,000 | 3 (2.2%) | 33 (13.1%) |
| $10,000 to $24,999 | 10 (7.2%) | 0 (0.0%) |
| $25,000 to $34,999 | 20 (14.4%) | 3 (1.2%) |
| $35,000 to $49,999 | 19 (13.7%) | 9 (3.6%) |
| $50,000 to $74,999 | 20 (14.4%) | 28 (11.1%) |
| $75,000 to $99,999 | 33 (23.7%) | 41 (16.3%) |
| $100,000 to $149,999 | 25 (18.0%) | 74 (29.4%) |
| $150,000 or more | 9 (6.5%) | 37 (14.7%) |
| Total | 139 (100.0%) | 252 (100.0%) |
Property Value to Household Income Ratio in South Waverly borough
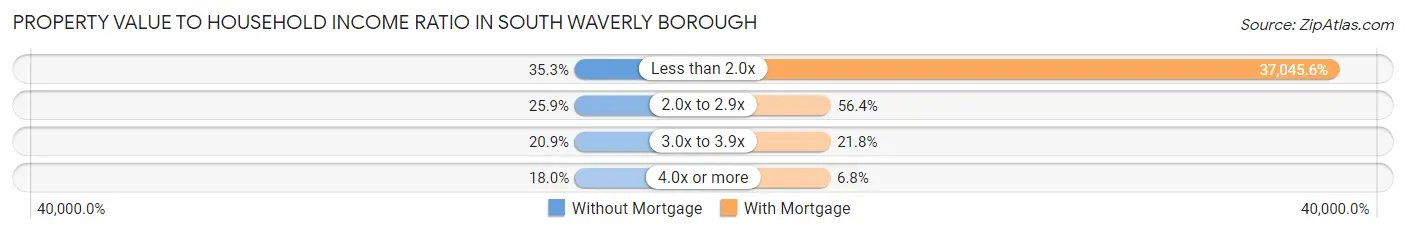
| Value-to-Income Ratio | Without Mortgage | With Mortgage |
| Less than 2.0x | 49 (35.2%) | 93,355 (37,045.6%) |
| 2.0x to 2.9x | 36 (25.9%) | 142 (56.4%) |
| 3.0x to 3.9x | 29 (20.9%) | 55 (21.8%) |
| 4.0x or more | 25 (18.0%) | 17 (6.8%) |
| Total | 139 (100.0%) | 252 (100.0%) |
Real Estate Taxes by Mortgage Status in South Waverly borough
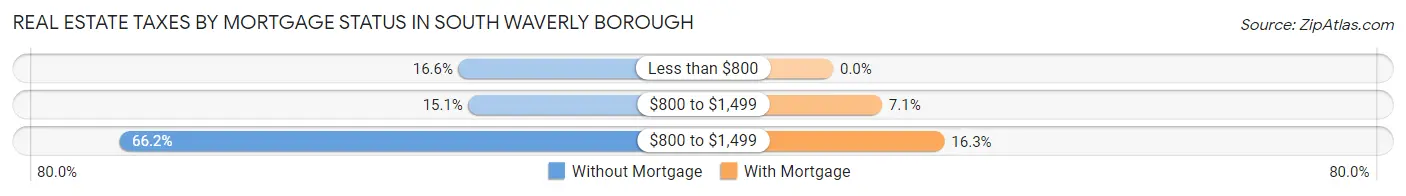
| Property Taxes | Without Mortgage | With Mortgage |
| Less than $800 | 23 (16.6%) | 0 (0.0%) |
| $800 to $1,499 | 21 (15.1%) | 18 (7.1%) |
| $800 to $1,499 | 92 (66.2%) | 41 (16.3%) |
| Total | 139 (100.0%) | 252 (100.0%) |
Health & Disability in South Waverly borough
Health Insurance Coverage by Age in South Waverly borough
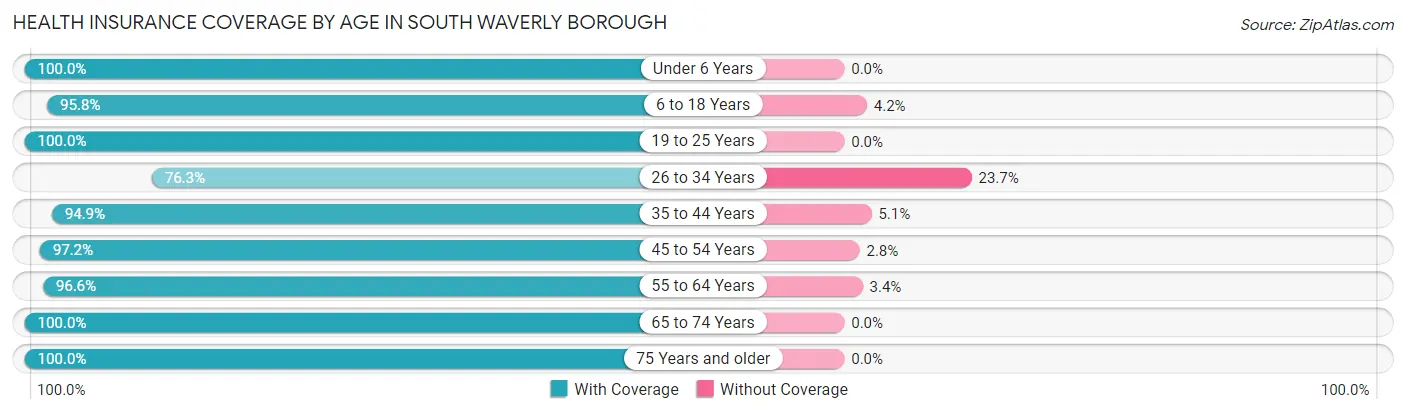
| Age Bracket | With Coverage | Without Coverage |
| Under 6 Years | 53 (100.0%) | 0 (0.0%) |
| 6 to 18 Years | 205 (95.8%) | 9 (4.2%) |
| 19 to 25 Years | 71 (100.0%) | 0 (0.0%) |
| 26 to 34 Years | 90 (76.3%) | 28 (23.7%) |
| 35 to 44 Years | 131 (94.9%) | 7 (5.1%) |
| 45 to 54 Years | 137 (97.2%) | 4 (2.8%) |
| 55 to 64 Years | 170 (96.6%) | 6 (3.4%) |
| 65 to 74 Years | 173 (100.0%) | 0 (0.0%) |
| 75 Years and older | 78 (100.0%) | 0 (0.0%) |
| Total | 1,108 (95.4%) | 54 (4.6%) |
Health Insurance Coverage by Citizenship Status in South Waverly borough
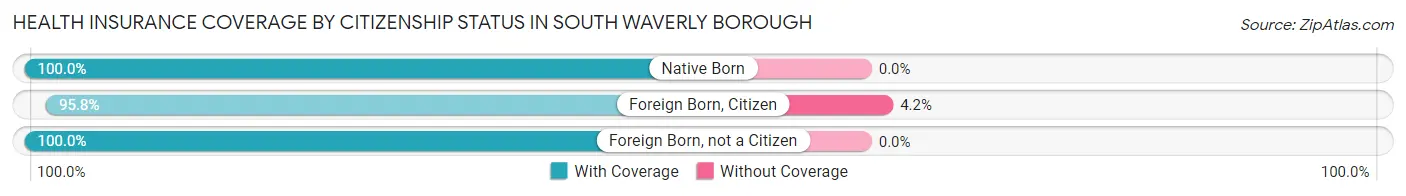
| Citizenship Status | With Coverage | Without Coverage |
| Native Born | 53 (100.0%) | 0 (0.0%) |
| Foreign Born, Citizen | 205 (95.8%) | 9 (4.2%) |
| Foreign Born, not a Citizen | 71 (100.0%) | 0 (0.0%) |
Health Insurance Coverage by Household Income in South Waverly borough
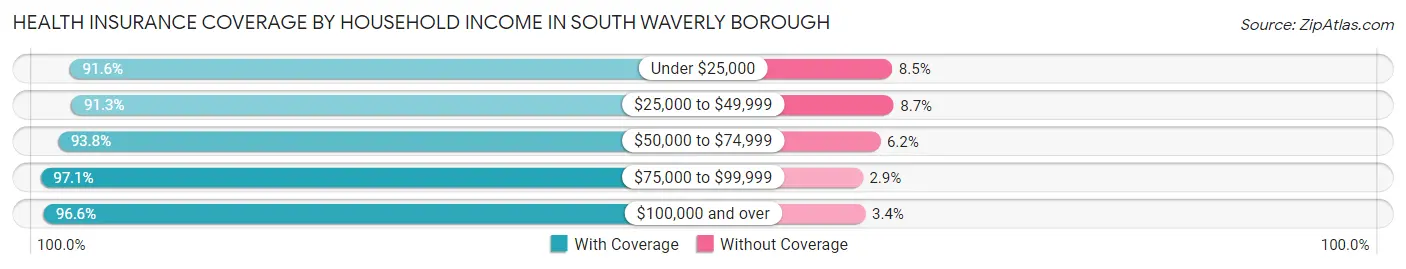
| Household Income | With Coverage | Without Coverage |
| Under $25,000 | 65 (91.5%) | 6 (8.5%) |
| $25,000 to $49,999 | 136 (91.3%) | 13 (8.7%) |
| $50,000 to $74,999 | 136 (93.8%) | 9 (6.2%) |
| $75,000 to $99,999 | 264 (97.1%) | 8 (2.9%) |
| $100,000 and over | 507 (96.6%) | 18 (3.4%) |
Public vs Private Health Insurance Coverage by Age in South Waverly borough
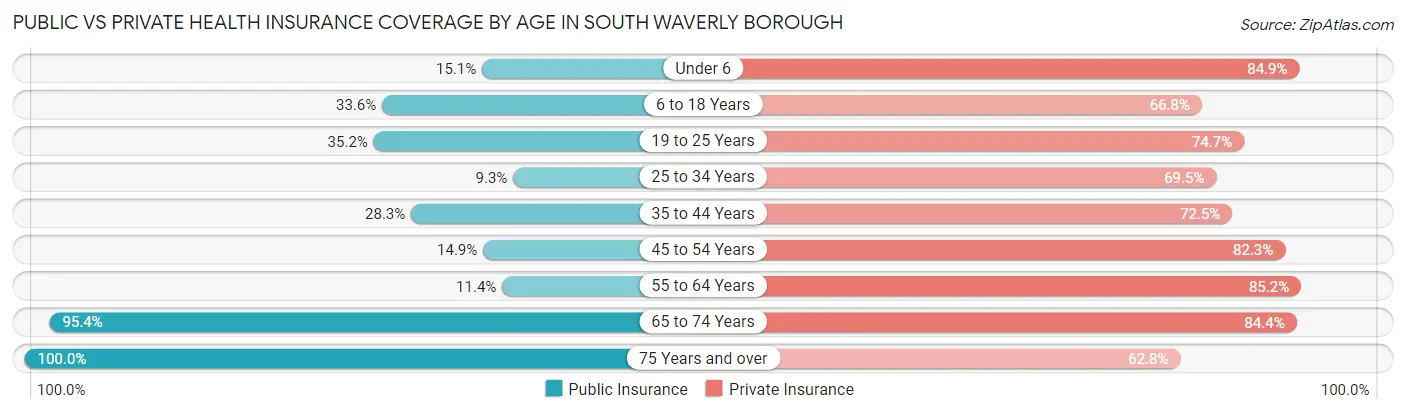
| Age Bracket | Public Insurance | Private Insurance |
| Under 6 | 8 (15.1%) | 45 (84.9%) |
| 6 to 18 Years | 72 (33.6%) | 143 (66.8%) |
| 19 to 25 Years | 25 (35.2%) | 53 (74.7%) |
| 25 to 34 Years | 11 (9.3%) | 82 (69.5%) |
| 35 to 44 Years | 39 (28.3%) | 100 (72.5%) |
| 45 to 54 Years | 21 (14.9%) | 116 (82.3%) |
| 55 to 64 Years | 20 (11.4%) | 150 (85.2%) |
| 65 to 74 Years | 165 (95.4%) | 146 (84.4%) |
| 75 Years and over | 78 (100.0%) | 49 (62.8%) |
| Total | 439 (37.8%) | 884 (76.1%) |
Disability Status by Sex by Age in South Waverly borough
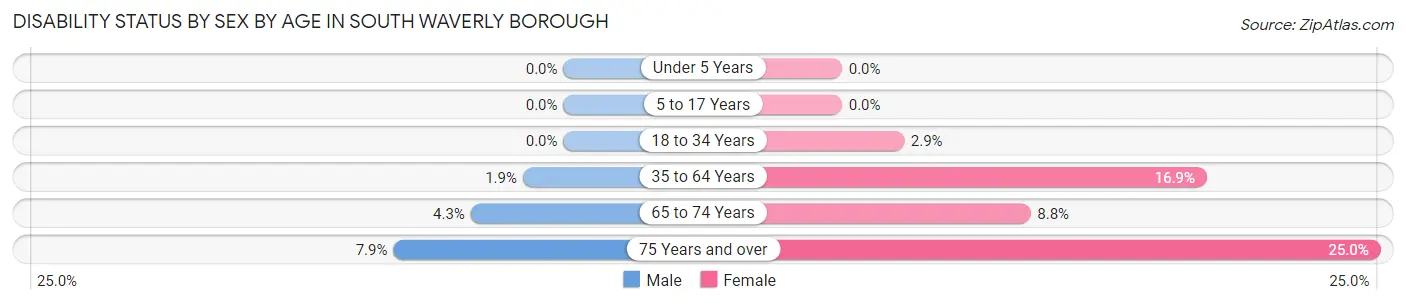
| Age Bracket | Male | Female |
| Under 5 Years | 0 (0.0%) | 0 (0.0%) |
| 5 to 17 Years | 0 (0.0%) | 0 (0.0%) |
| 18 to 34 Years | 0 (0.0%) | 3 (2.9%) |
| 35 to 64 Years | 4 (1.9%) | 41 (16.9%) |
| 65 to 74 Years | 4 (4.3%) | 7 (8.7%) |
| 75 Years and over | 3 (7.9%) | 10 (25.0%) |
Disability Class by Sex by Age in South Waverly borough
Disability Class: Hearing Difficulty
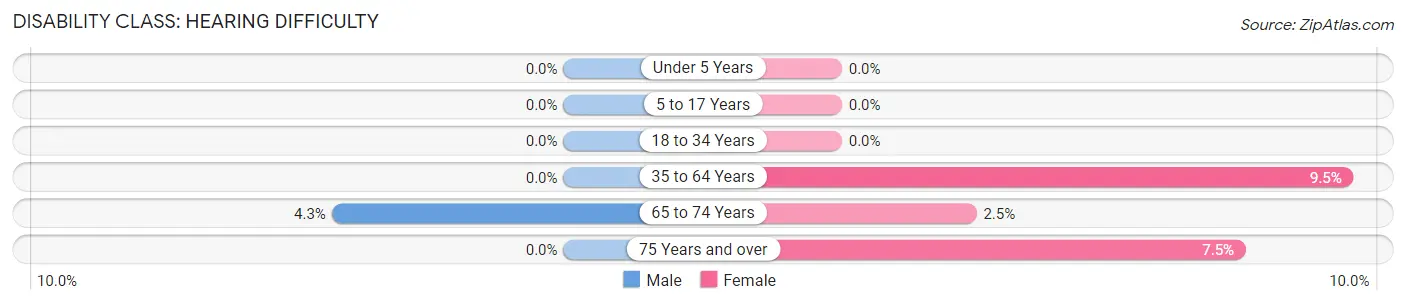
| Age Bracket | Male | Female |
| Under 5 Years | 0 (0.0%) | 0 (0.0%) |
| 5 to 17 Years | 0 (0.0%) | 0 (0.0%) |
| 18 to 34 Years | 0 (0.0%) | 0 (0.0%) |
| 35 to 64 Years | 0 (0.0%) | 23 (9.5%) |
| 65 to 74 Years | 4 (4.3%) | 2 (2.5%) |
| 75 Years and over | 0 (0.0%) | 3 (7.5%) |
Disability Class: Vision Difficulty
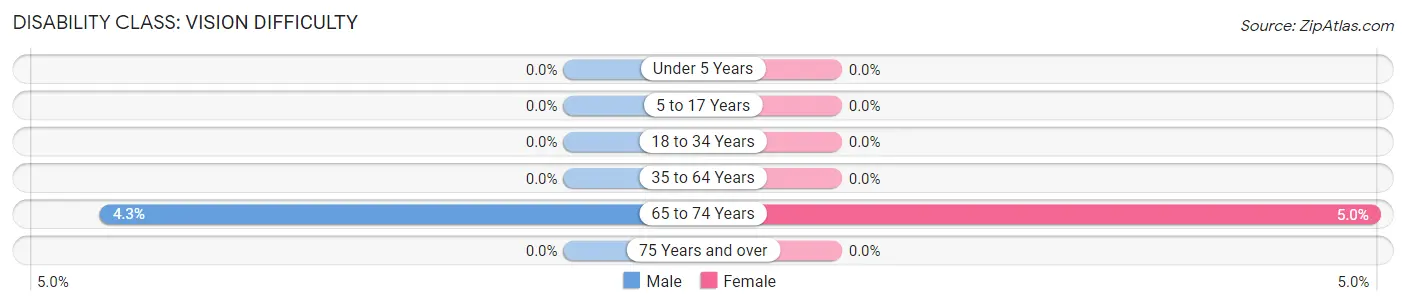
| Age Bracket | Male | Female |
| Under 5 Years | 0 (0.0%) | 0 (0.0%) |
| 5 to 17 Years | 0 (0.0%) | 0 (0.0%) |
| 18 to 34 Years | 0 (0.0%) | 0 (0.0%) |
| 35 to 64 Years | 0 (0.0%) | 0 (0.0%) |
| 65 to 74 Years | 4 (4.3%) | 4 (5.0%) |
| 75 Years and over | 0 (0.0%) | 0 (0.0%) |
Disability Class: Cognitive Difficulty
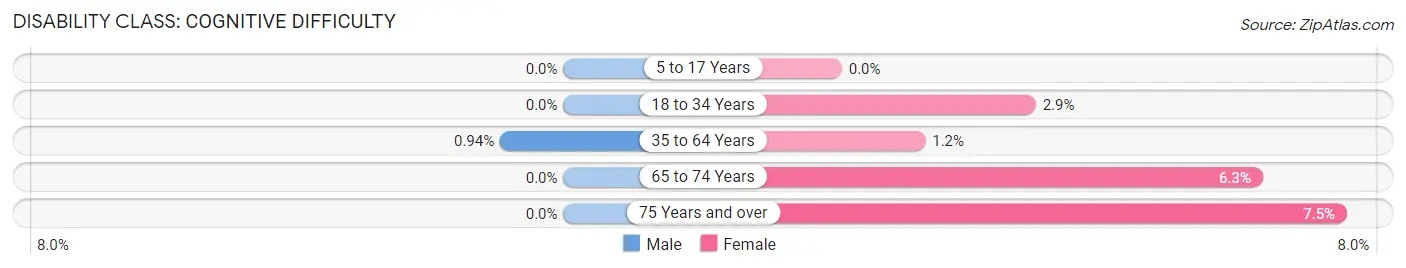
| Age Bracket | Male | Female |
| 5 to 17 Years | 0 (0.0%) | 0 (0.0%) |
| 18 to 34 Years | 0 (0.0%) | 3 (2.9%) |
| 35 to 64 Years | 2 (0.9%) | 3 (1.2%) |
| 65 to 74 Years | 0 (0.0%) | 5 (6.2%) |
| 75 Years and over | 0 (0.0%) | 3 (7.5%) |
Disability Class: Ambulatory Difficulty
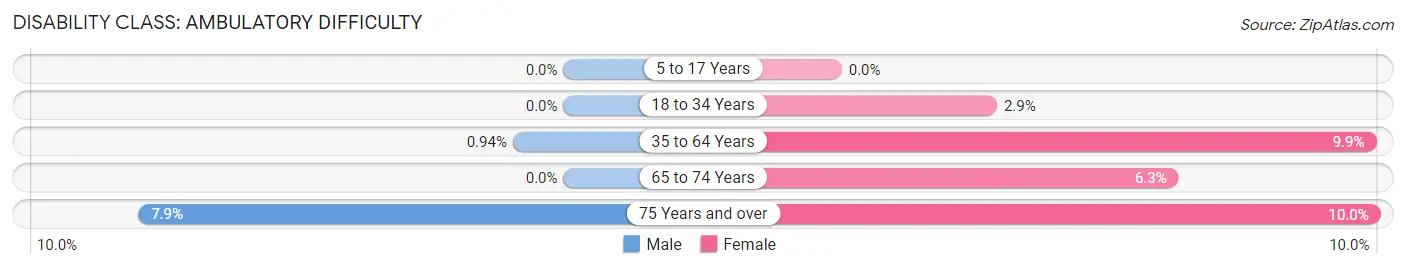
| Age Bracket | Male | Female |
| 5 to 17 Years | 0 (0.0%) | 0 (0.0%) |
| 18 to 34 Years | 0 (0.0%) | 3 (2.9%) |
| 35 to 64 Years | 2 (0.9%) | 24 (9.9%) |
| 65 to 74 Years | 0 (0.0%) | 5 (6.2%) |
| 75 Years and over | 3 (7.9%) | 4 (10.0%) |
Disability Class: Self-Care Difficulty
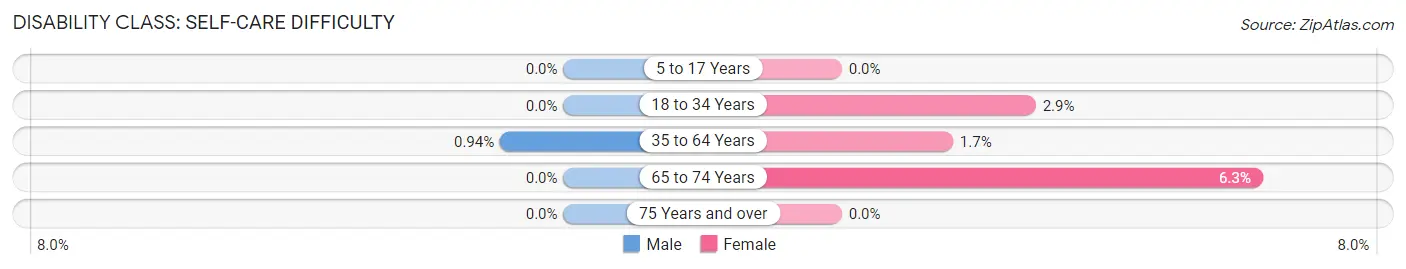
| Age Bracket | Male | Female |
| 5 to 17 Years | 0 (0.0%) | 0 (0.0%) |
| 18 to 34 Years | 0 (0.0%) | 3 (2.9%) |
| 35 to 64 Years | 2 (0.9%) | 4 (1.7%) |
| 65 to 74 Years | 0 (0.0%) | 5 (6.2%) |
| 75 Years and over | 0 (0.0%) | 0 (0.0%) |
Technology Access in South Waverly borough
Computing Device Access in South Waverly borough
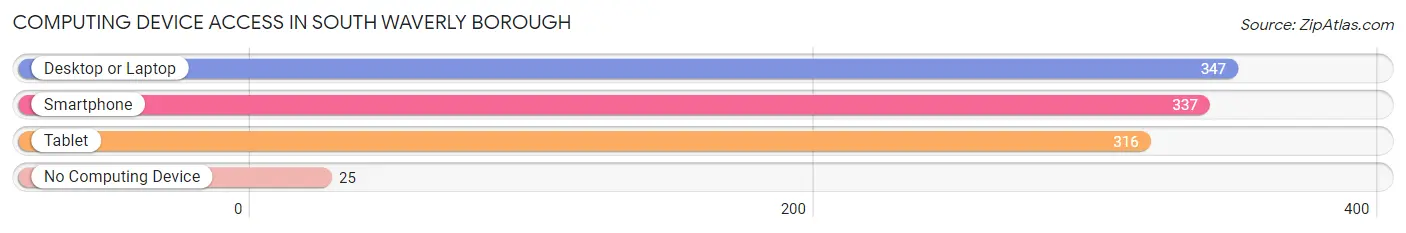
| Device Type | # Households | % Households |
| Desktop or Laptop | 347 | 78.7% |
| Smartphone | 337 | 76.4% |
| Tablet | 316 | 71.7% |
| No Computing Device | 25 | 5.7% |
| Total | 441 | 100.0% |
Internet Access in South Waverly borough
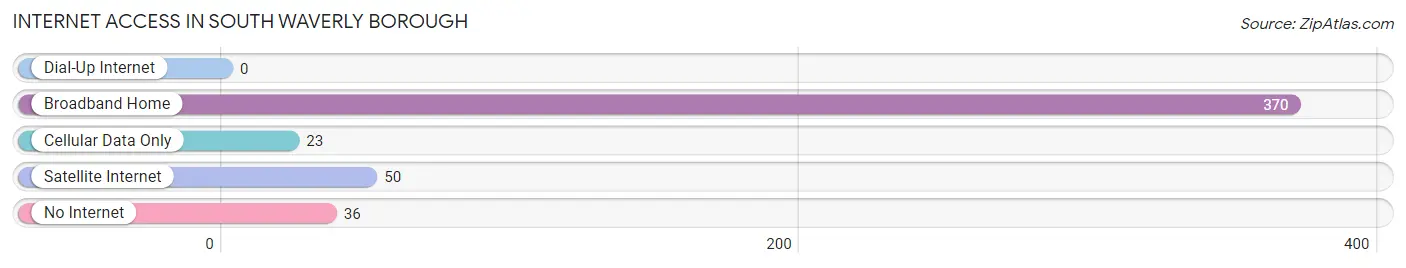
| Internet Type | # Households | % Households |
| Dial-Up Internet | 0 | 0.0% |
| Broadband Home | 370 | 83.9% |
| Cellular Data Only | 23 | 5.2% |
| Satellite Internet | 50 | 11.3% |
| No Internet | 36 | 8.2% |
| Total | 441 | 100.0% |
South Waverly borough Summary
South Waverly Borough is a small borough located in Bradford County, Pennsylvania. It is situated in the Endless Mountains region of the state, and is bordered by the Susquehanna River to the east. The borough has a population of 1,845 as of the 2010 census, and is part of the Sayre, PA Micropolitan Statistical Area.
History
The area that is now South Waverly Borough was first settled in the late 1700s by settlers from Connecticut. The first settler was a man named John Waverly, who established a sawmill and gristmill on the banks of the Susquehanna River. The area was known as Waverly Mills, and the settlement grew to include a post office, a school, and a church.
In 1845, the area was incorporated as a borough, and was named South Waverly in honor of John Waverly. The borough was an important stop on the Erie Railroad, and the population grew steadily throughout the 19th century.
In the early 20th century, the borough was home to several factories, including a silk mill, a paper mill, and a furniture factory. These factories provided employment for many of the residents of South Waverly.
Geography
South Waverly Borough is located in the Endless Mountains region of Pennsylvania. It is situated in the Susquehanna Valley, and is bordered by the Susquehanna River to the east. The borough is located approximately 10 miles south of the city of Sayre, and is approximately 30 miles northwest of Scranton.
The borough has a total area of 1.2 square miles, all of which is land. The terrain is mostly flat, with some rolling hills. The climate is humid continental, with cold winters and hot, humid summers.
Economy
The economy of South Waverly Borough is largely based on manufacturing and services. The borough is home to several factories, including a paper mill, a furniture factory, and a silk mill. These factories provide employment for many of the residents of the borough.
In addition, the borough is home to several small businesses, including restaurants, retail stores, and professional services. The borough also has a small tourism industry, with several bed and breakfasts and other tourist attractions.
Demographics
As of the 2010 census, the population of South Waverly Borough was 1,845. The racial makeup of the borough was 97.3% White, 0.7% African American, 0.2% Native American, 0.3% Asian, and 1.5% from other races. Hispanic or Latino of any race were 1.2% of the population.
The median household income in the borough was $37,917, and the median family income was $45,938. The per capita income was $19,945. About 11.3% of the population was below the poverty line.
Conclusion
South Waverly Borough is a small borough located in Bradford County, Pennsylvania. It is situated in the Endless Mountains region of the state, and is bordered by the Susquehanna River to the east. The borough has a population of 1,845 as of the 2010 census, and is part of the Sayre, PA Micropolitan Statistical Area. The economy of South Waverly Borough is largely based on manufacturing and services, and the borough is home to several small businesses. The racial makeup of the borough is mostly White, with a small percentage of African American, Native American, Asian, and other races. The median household income in the borough is $37,917, and the per capita income is $19,945.
Common Questions
What is Per Capita Income in South Waverly borough?
Per Capita income in South Waverly borough is $40,040.
What is the Median Family Income in South Waverly borough?
Median Family Income in South Waverly borough is $91,364.
What is the Median Household income in South Waverly borough?
Median Household Income in South Waverly borough is $87,604.
What is Income or Wage Gap in South Waverly borough?
Income or Wage Gap in South Waverly borough is 27.9%.
Women in South Waverly borough earn 72.1 cents for every dollar earned by a man.
What is Inequality or Gini Index in South Waverly borough?
Inequality or Gini Index in South Waverly borough is 0.38.
What is the Total Population of South Waverly borough?
Total Population of South Waverly borough is 1,162.
What is the Total Male Population of South Waverly borough?
Total Male Population of South Waverly borough is 547.
What is the Total Female Population of South Waverly borough?
Total Female Population of South Waverly borough is 615.
What is the Ratio of Males per 100 Females in South Waverly borough?
There are 88.94 Males per 100 Females in South Waverly borough.
What is the Ratio of Females per 100 Males in South Waverly borough?
There are 112.43 Females per 100 Males in South Waverly borough.
What is the Median Population Age in South Waverly borough?
Median Population Age in South Waverly borough is 43.0 Years.
What is the Average Family Size in South Waverly borough
Average Family Size in South Waverly borough is 3.1 People.
What is the Average Household Size in South Waverly borough
Average Household Size in South Waverly borough is 2.6 People.
How Large is the Labor Force in South Waverly borough?
There are 593 People in the Labor Forcein in South Waverly borough.
What is the Percentage of People in the Labor Force in South Waverly borough?
63.7% of People are in the Labor Force in South Waverly borough.
What is the Unemployment Rate in South Waverly borough?
Unemployment Rate in South Waverly borough is 2.7%.