Pennsburg borough, PA Map & Demographics
Pennsburg borough Overview
$34,529
PER CAPITA INCOME
$98,426
AVG FAMILY INCOME
$92,054
AVG HOUSEHOLD INCOME
39.1%
WAGE / INCOME GAP [ % ]
60.9¢/ $1
WAGE / INCOME GAP [ $ ]
0.31
INEQUALITY / GINI INDEX
3,915
TOTAL POPULATION
1,921
MALE POPULATION
1,994
FEMALE POPULATION
96.34
MALES / 100 FEMALES
103.80
FEMALES / 100 MALES
37.4
MEDIAN AGE
3.0
AVG FAMILY SIZE
2.7
AVG HOUSEHOLD SIZE
2,324
LABOR FORCE [ PEOPLE ]
72.9%
PERCENT IN LABOR FORCE
1.3%
UNEMPLOYMENT RATE
Income in Pennsburg borough
Income Overview in Pennsburg borough
Per Capita Income in Pennsburg borough is $34,529, while median incomes of families and households are $98,426 and $92,054 respectively.
| Characteristic | Number | Measure |
| Per Capita Income | 3,915 | $34,529 |
| Median Family Income | 1,058 | $98,426 |
| Mean Family Income | 1,058 | $100,597 |
| Median Household Income | 1,354 | $92,054 |
| Mean Household Income | 1,354 | $96,292 |
| Income Deficit | 1,058 | $0 |
| Wage / Income Gap (%) | 3,915 | 39.06% |
| Wage / Income Gap ($) | 3,915 | 60.94¢ per $1 |
| Gini / Inequality Index | 3,915 | 0.31 |
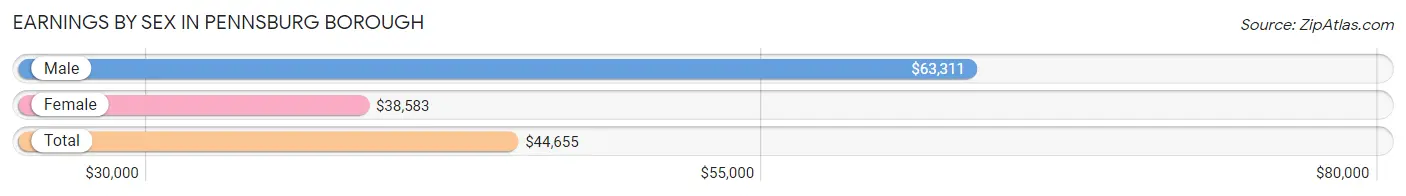
Earnings by Sex in Pennsburg borough
Average Earnings in Pennsburg borough are $44,655, $63,311 for men and $38,583 for women, a difference of 39.1%.
| Sex | Number | Average Earnings |
| Male | 1,160 (48.9%) | $63,311 |
| Female | 1,214 (51.1%) | $38,583 |
| Total | 2,374 (100.0%) | $44,655 |
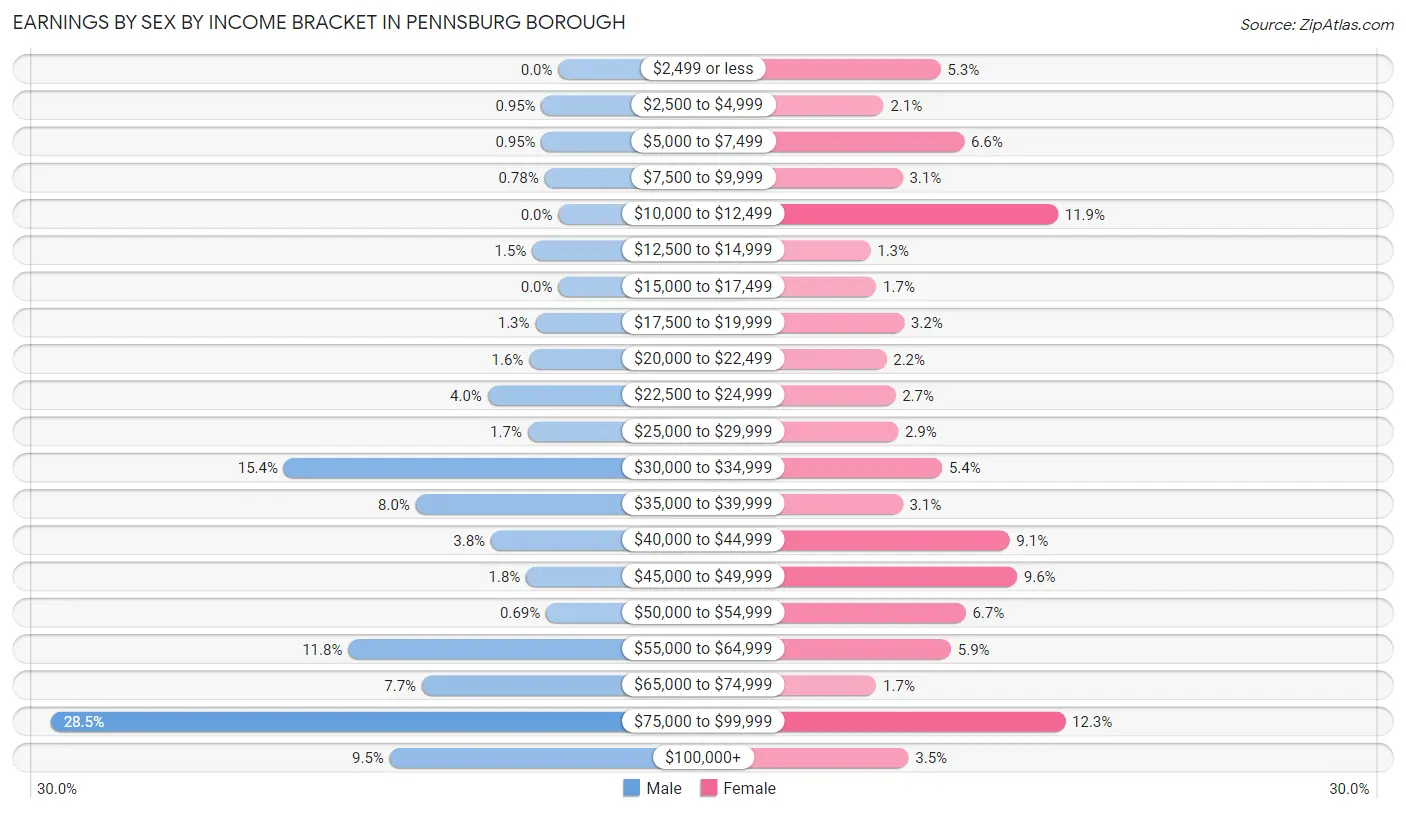
Earnings by Sex by Income Bracket in Pennsburg borough
The most common earnings brackets in Pennsburg borough are $75,000 to $99,999 for men (331 | 28.5%) and $75,000 to $99,999 for women (149 | 12.3%).
| Income | Male | Female |
| $2,499 or less | 0 (0.0%) | 64 (5.3%) |
| $2,500 to $4,999 | 11 (0.9%) | 25 (2.1%) |
| $5,000 to $7,499 | 11 (0.9%) | 80 (6.6%) |
| $7,500 to $9,999 | 9 (0.8%) | 38 (3.1%) |
| $10,000 to $12,499 | 0 (0.0%) | 144 (11.9%) |
| $12,500 to $14,999 | 17 (1.5%) | 16 (1.3%) |
| $15,000 to $17,499 | 0 (0.0%) | 20 (1.7%) |
| $17,500 to $19,999 | 15 (1.3%) | 39 (3.2%) |
| $20,000 to $22,499 | 19 (1.6%) | 27 (2.2%) |
| $22,500 to $24,999 | 46 (4.0%) | 33 (2.7%) |
| $25,000 to $29,999 | 20 (1.7%) | 35 (2.9%) |
| $30,000 to $34,999 | 179 (15.4%) | 65 (5.3%) |
| $35,000 to $39,999 | 93 (8.0%) | 38 (3.1%) |
| $40,000 to $44,999 | 44 (3.8%) | 111 (9.1%) |
| $45,000 to $49,999 | 21 (1.8%) | 116 (9.6%) |
| $50,000 to $54,999 | 8 (0.7%) | 81 (6.7%) |
| $55,000 to $64,999 | 137 (11.8%) | 71 (5.9%) |
| $65,000 to $74,999 | 89 (7.7%) | 20 (1.7%) |
| $75,000 to $99,999 | 331 (28.5%) | 149 (12.3%) |
| $100,000+ | 110 (9.5%) | 42 (3.5%) |
| Total | 1,160 (100.0%) | 1,214 (100.0%) |
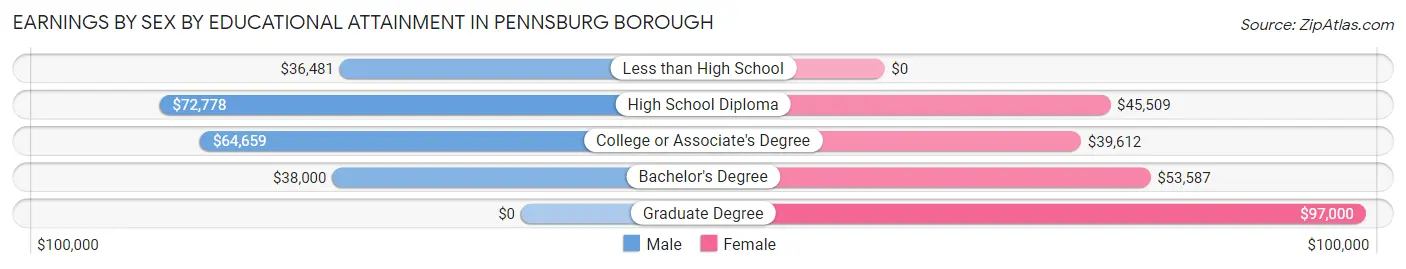
Earnings by Sex by Educational Attainment in Pennsburg borough
Average earnings in Pennsburg borough are $65,733 for men and $44,236 for women, a difference of 32.7%. Men with an educational attainment of high school diploma enjoy the highest average annual earnings of $72,778, while those with less than high school education earn the least with $36,481. Women with an educational attainment of graduate degree earn the most with the average annual earnings of $97,000, while those with college or associate's degree education have the smallest earnings of $39,612.
| Educational Attainment | Male Income | Female Income |
| Less than High School | $36,481 | $0 |
| High School Diploma | $72,778 | $45,509 |
| College or Associate's Degree | $64,659 | $39,612 |
| Bachelor's Degree | $38,000 | $53,587 |
| Graduate Degree | - | - |
| Total | $65,733 | $44,236 |
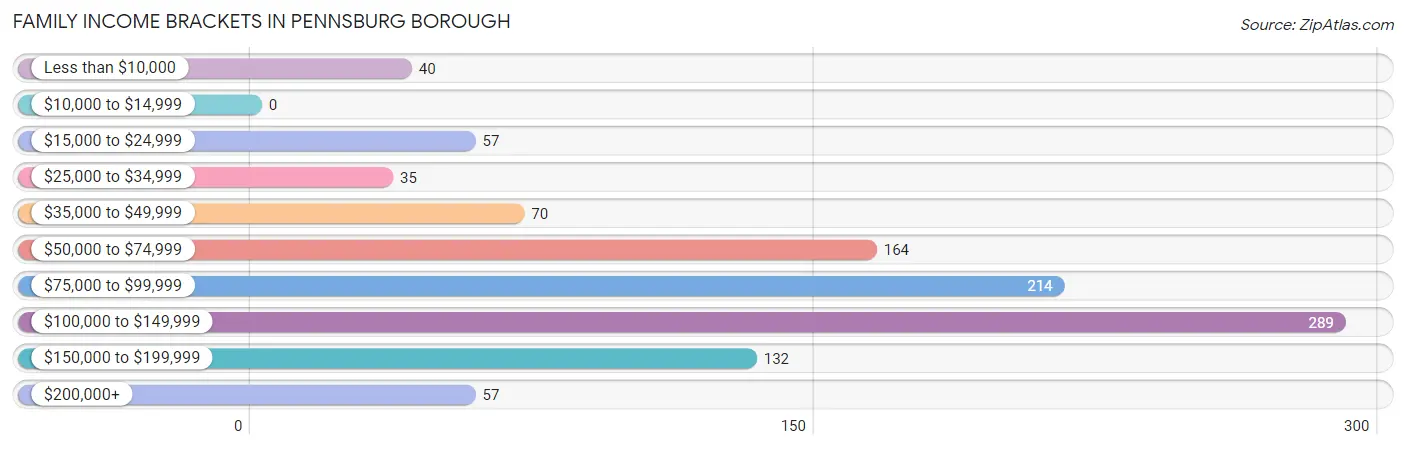
Family Income in Pennsburg borough
Family Income Brackets in Pennsburg borough
According to the Pennsburg borough family income data, there are 289 families falling into the $100,000 to $149,999 income range, which is the most common income bracket and makes up 27.3% of all families.
| Income Bracket | # Families | % Families |
| Less than $10,000 | 40 | 3.8% |
| $10,000 to $14,999 | 0 | 0.0% |
| $15,000 to $24,999 | 57 | 5.4% |
| $25,000 to $34,999 | 35 | 3.3% |
| $35,000 to $49,999 | 70 | 6.6% |
| $50,000 to $74,999 | 164 | 15.5% |
| $75,000 to $99,999 | 214 | 20.2% |
| $100,000 to $149,999 | 289 | 27.3% |
| $150,000 to $199,999 | 132 | 12.5% |
| $200,000+ | 57 | 5.4% |
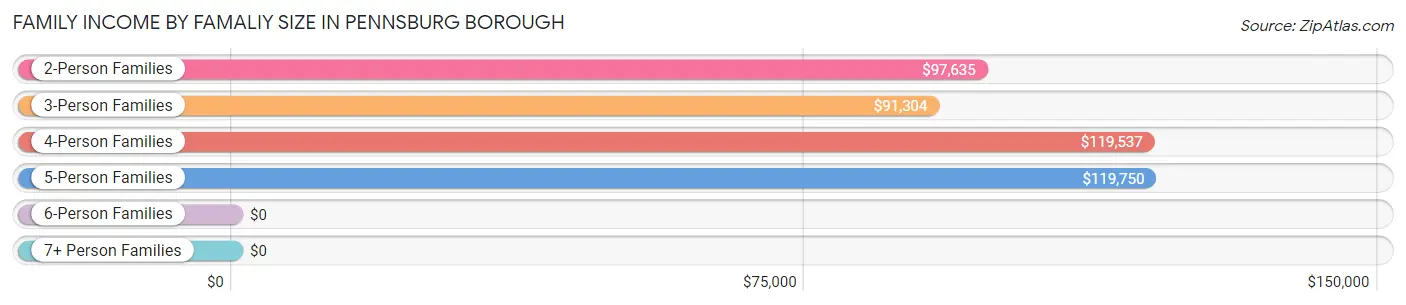
Family Income by Famaliy Size in Pennsburg borough
5-person families (84 | 7.9%) account for the highest median family income in Pennsburg borough with $119,750 per family, while 2-person families (450 | 42.5%) have the highest median income of $48,818 per family member.
| Income Bracket | # Families | Median Income |
| 2-Person Families | 450 (42.5%) | $97,635 |
| 3-Person Families | 320 (30.2%) | $91,304 |
| 4-Person Families | 180 (17.0%) | $119,537 |
| 5-Person Families | 84 (7.9%) | $119,750 |
| 6-Person Families | 15 (1.4%) | $0 |
| 7+ Person Families | 9 (0.9%) | $0 |
| Total | 1,058 (100.0%) | $98,426 |
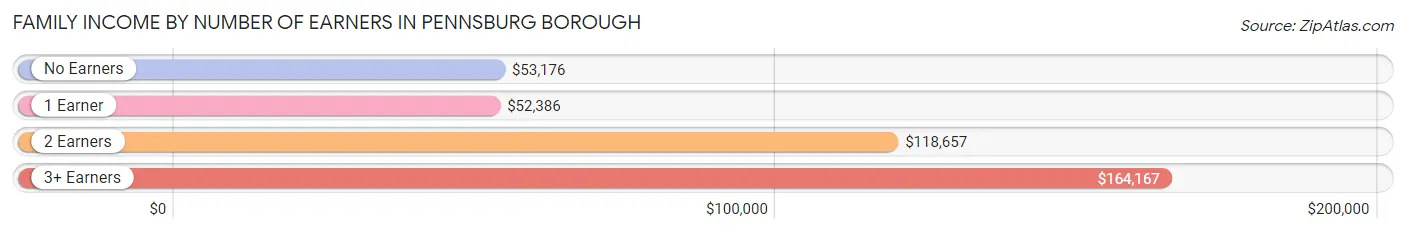
Family Income by Number of Earners in Pennsburg borough
The median family income in Pennsburg borough is $98,426, with families comprising 3+ earners (158) having the highest median family income of $164,167, while families with 1 earner (287) have the lowest median family income of $52,386, accounting for 14.9% and 27.1% of families, respectively.
| Number of Earners | # Families | Median Income |
| No Earners | 92 (8.7%) | $53,176 |
| 1 Earner | 287 (27.1%) | $52,386 |
| 2 Earners | 521 (49.2%) | $118,657 |
| 3+ Earners | 158 (14.9%) | $164,167 |
| Total | 1,058 (100.0%) | $98,426 |
Household Income in Pennsburg borough
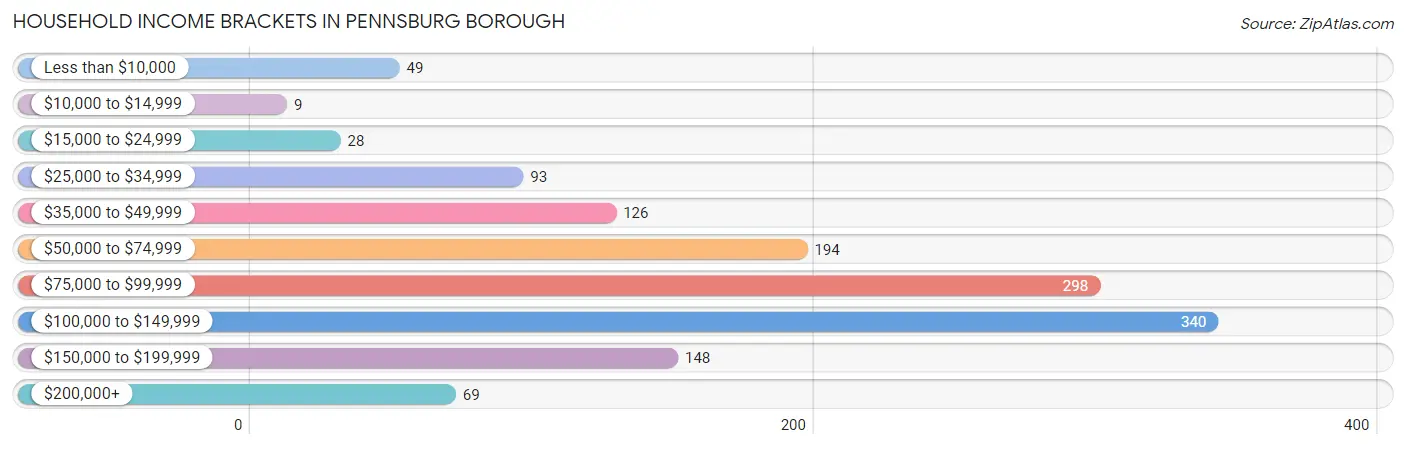
Household Income Brackets in Pennsburg borough
With 340 households falling in the category, the $100,000 to $149,999 income range is the most frequent in Pennsburg borough, accounting for 25.1% of all households. In contrast, only 9 households (0.7%) fall into the $10,000 to $14,999 income bracket, making it the least populous group.
| Income Bracket | # Households | % Households |
| Less than $10,000 | 49 | 3.6% |
| $10,000 to $14,999 | 9 | 0.7% |
| $15,000 to $24,999 | 28 | 2.1% |
| $25,000 to $34,999 | 93 | 6.9% |
| $35,000 to $49,999 | 126 | 9.3% |
| $50,000 to $74,999 | 194 | 14.3% |
| $75,000 to $99,999 | 298 | 22.0% |
| $100,000 to $149,999 | 340 | 25.1% |
| $150,000 to $199,999 | 148 | 10.9% |
| $200,000+ | 69 | 5.1% |
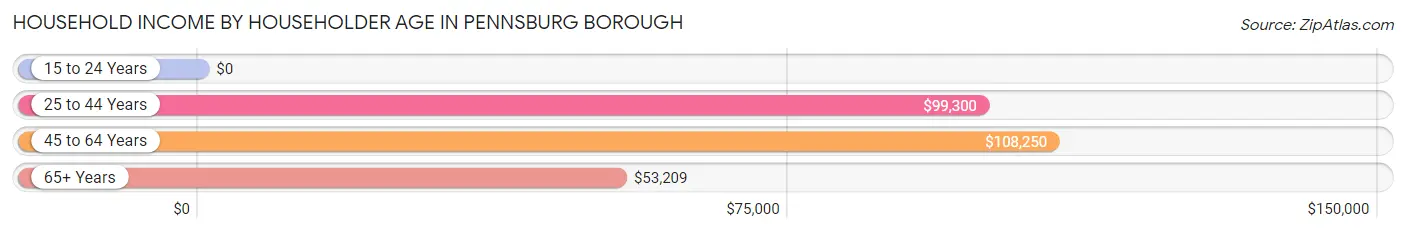
Household Income by Householder Age in Pennsburg borough
The median household income in Pennsburg borough is $92,054, with the highest median household income of $108,250 found in the 45 to 64 years age bracket for the primary householder. A total of 658 households (48.6%) fall into this category. Meanwhile, the 15 to 24 years age bracket for the primary householder has the lowest median household income of $0, with 113 households (8.4%) in this group.
| Income Bracket | # Households | Median Income |
| 15 to 24 Years | 113 (8.4%) | $0 |
| 25 to 44 Years | 374 (27.6%) | $99,300 |
| 45 to 64 Years | 658 (48.6%) | $108,250 |
| 65+ Years | 209 (15.4%) | $53,209 |
| Total | 1,354 (100.0%) | $92,054 |
Poverty in Pennsburg borough
Income Below Poverty by Sex and Age in Pennsburg borough
With 8.4% poverty level for males and 11.7% for females among the residents of Pennsburg borough, 15 year old males and 15 year old females are the most vulnerable to poverty, with 29 males (55.8%) and 11 females (50.0%) in their respective age groups living below the poverty level.
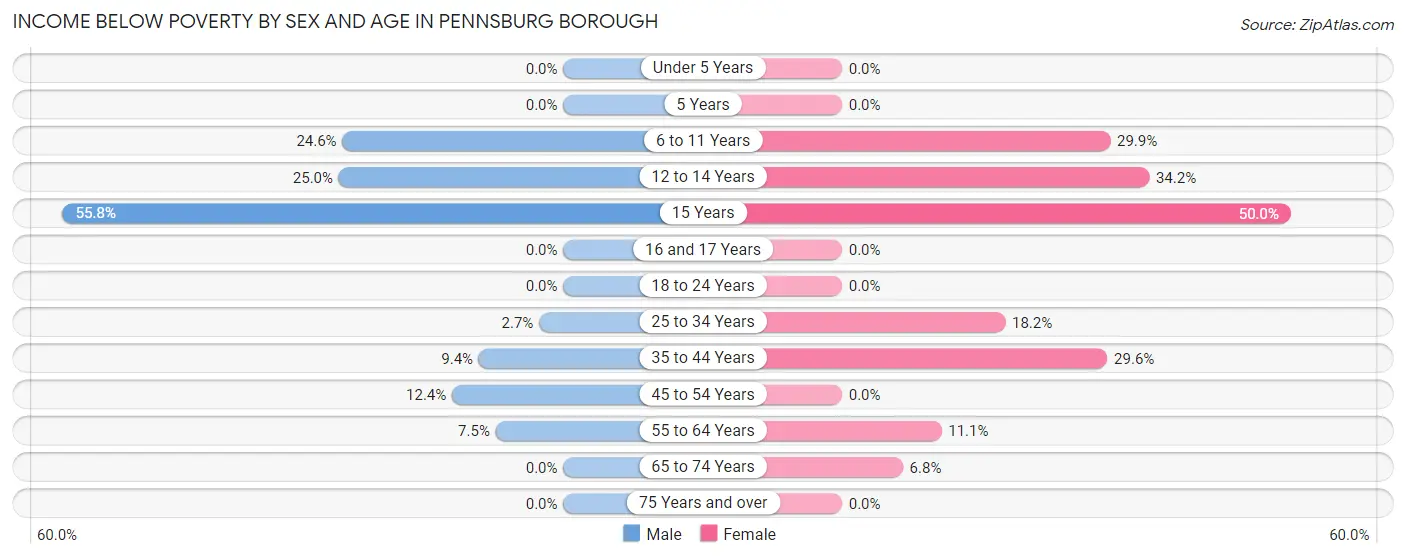
| Age Bracket | Male | Female |
| Under 5 Years | 0 (0.0%) | 0 (0.0%) |
| 5 Years | 0 (0.0%) | 0 (0.0%) |
| 6 to 11 Years | 31 (24.6%) | 23 (29.9%) |
| 12 to 14 Years | 10 (25.0%) | 39 (34.2%) |
| 15 Years | 29 (55.8%) | 11 (50.0%) |
| 16 and 17 Years | 0 (0.0%) | 0 (0.0%) |
| 18 to 24 Years | 0 (0.0%) | 0 (0.0%) |
| 25 to 34 Years | 9 (2.7%) | 56 (18.2%) |
| 35 to 44 Years | 22 (9.4%) | 39 (29.5%) |
| 45 to 54 Years | 28 (12.4%) | 0 (0.0%) |
| 55 to 64 Years | 29 (7.5%) | 37 (11.1%) |
| 65 to 74 Years | 0 (0.0%) | 8 (6.8%) |
| 75 Years and over | 0 (0.0%) | 0 (0.0%) |
| Total | 158 (8.4%) | 213 (11.7%) |
Income Above Poverty by Sex and Age in Pennsburg borough
According to the poverty statistics in Pennsburg borough, males aged under 5 years and females aged under 5 years are the age groups that are most secure financially, with 100.0% of males and 100.0% of females in these age groups living above the poverty line.
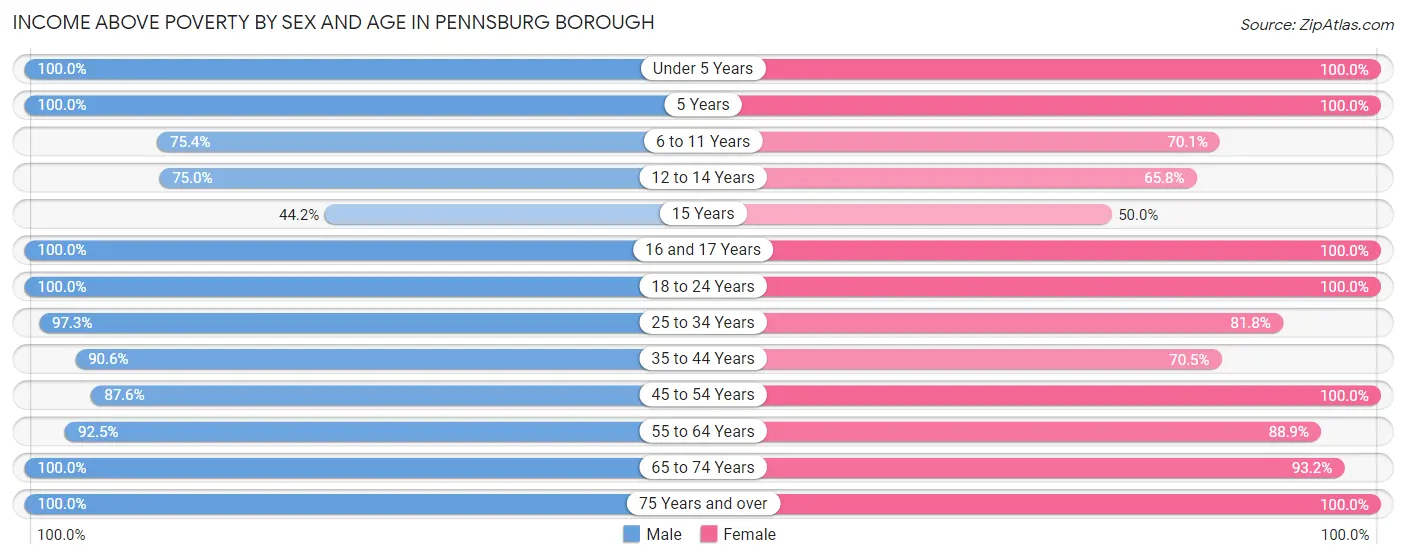
| Age Bracket | Male | Female |
| Under 5 Years | 99 (100.0%) | 152 (100.0%) |
| 5 Years | 12 (100.0%) | 30 (100.0%) |
| 6 to 11 Years | 95 (75.4%) | 54 (70.1%) |
| 12 to 14 Years | 30 (75.0%) | 75 (65.8%) |
| 15 Years | 23 (44.2%) | 11 (50.0%) |
| 16 and 17 Years | 23 (100.0%) | 28 (100.0%) |
| 18 to 24 Years | 160 (100.0%) | 215 (100.0%) |
| 25 to 34 Years | 326 (97.3%) | 252 (81.8%) |
| 35 to 44 Years | 212 (90.6%) | 93 (70.5%) |
| 45 to 54 Years | 198 (87.6%) | 257 (100.0%) |
| 55 to 64 Years | 356 (92.5%) | 297 (88.9%) |
| 65 to 74 Years | 134 (100.0%) | 110 (93.2%) |
| 75 Years and over | 60 (100.0%) | 42 (100.0%) |
| Total | 1,728 (91.6%) | 1,616 (88.3%) |
Income Below Poverty Among Married-Couple Families in Pennsburg borough
The poverty statistics for married-couple families in Pennsburg borough show that 5.5% or 40 of the total 731 families live below the poverty line. Families with no children have the highest poverty rate of 6.6%, comprising of 29 families. On the other hand, families with 3 or 4 children have the lowest poverty rate of 0.0%, which includes 0 families.
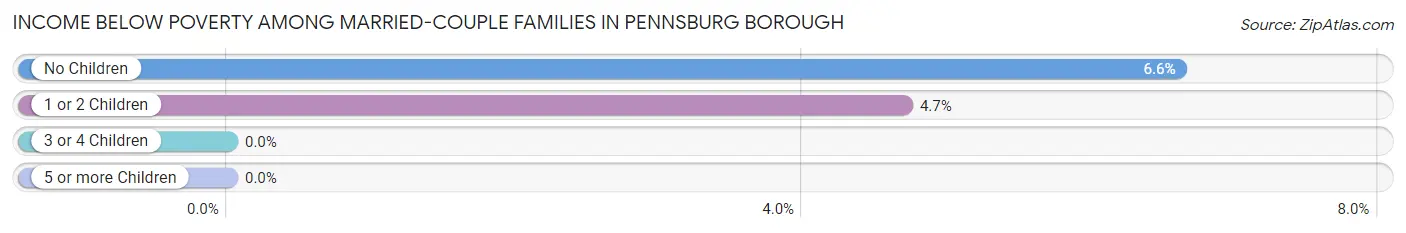
| Children | Above Poverty | Below Poverty |
| No Children | 410 (93.4%) | 29 (6.6%) |
| 1 or 2 Children | 223 (95.3%) | 11 (4.7%) |
| 3 or 4 Children | 58 (100.0%) | 0 (0.0%) |
| 5 or more Children | 0 (0.0%) | 0 (0.0%) |
| Total | 691 (94.5%) | 40 (5.5%) |
Income Below Poverty Among Single-Parent Households in Pennsburg borough
According to the poverty data in Pennsburg borough, 6.6% or 11 single-father households and 28.6% or 46 single-mother households are living below the poverty line. Among single-father households, those with 1 or 2 children have the highest poverty rate, with 11 households (10.8%) experiencing poverty. Likewise, among single-mother households, those with 1 or 2 children have the highest poverty rate, with 46 households (69.7%) falling below the poverty line.
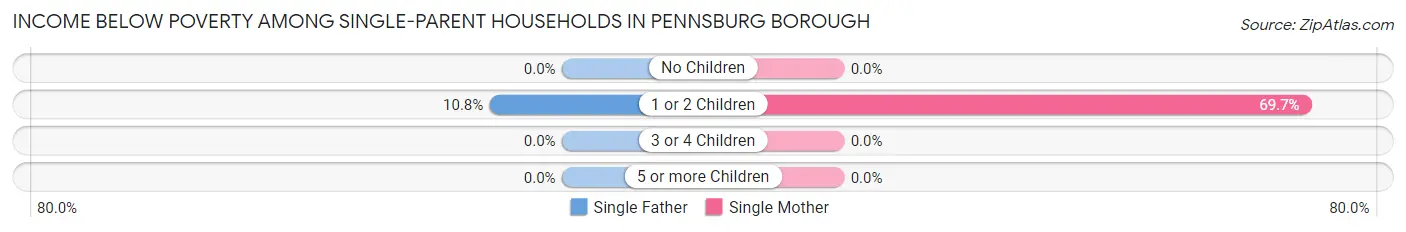
| Children | Single Father | Single Mother |
| No Children | 0 (0.0%) | 0 (0.0%) |
| 1 or 2 Children | 11 (10.8%) | 46 (69.7%) |
| 3 or 4 Children | 0 (0.0%) | 0 (0.0%) |
| 5 or more Children | 0 (0.0%) | 0 (0.0%) |
| Total | 11 (6.6%) | 46 (28.6%) |
Income Below Poverty Among Married-Couple vs Single-Parent Households in Pennsburg borough
The poverty data for Pennsburg borough shows that 40 of the married-couple family households (5.5%) and 57 of the single-parent households (17.4%) are living below the poverty level. Within the married-couple family households, those with no children have the highest poverty rate, with 29 households (6.6%) falling below the poverty line. Among the single-parent households, those with 1 or 2 children have the highest poverty rate, with 57 household (33.9%) living below poverty.
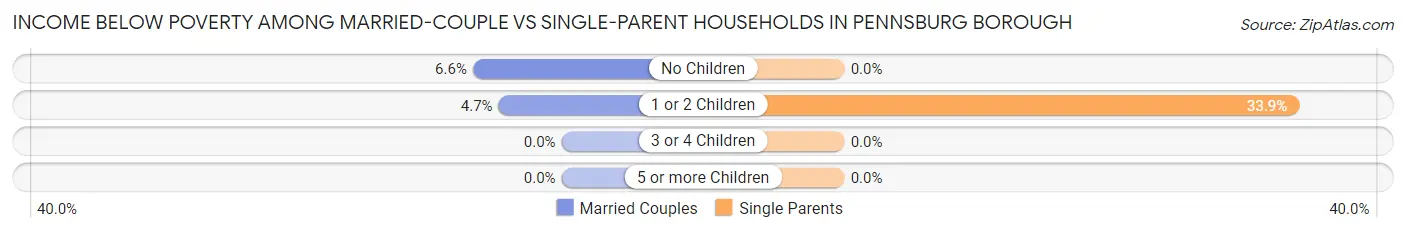
| Children | Married-Couple Families | Single-Parent Households |
| No Children | 29 (6.6%) | 0 (0.0%) |
| 1 or 2 Children | 11 (4.7%) | 57 (33.9%) |
| 3 or 4 Children | 0 (0.0%) | 0 (0.0%) |
| 5 or more Children | 0 (0.0%) | 0 (0.0%) |
| Total | 40 (5.5%) | 57 (17.4%) |
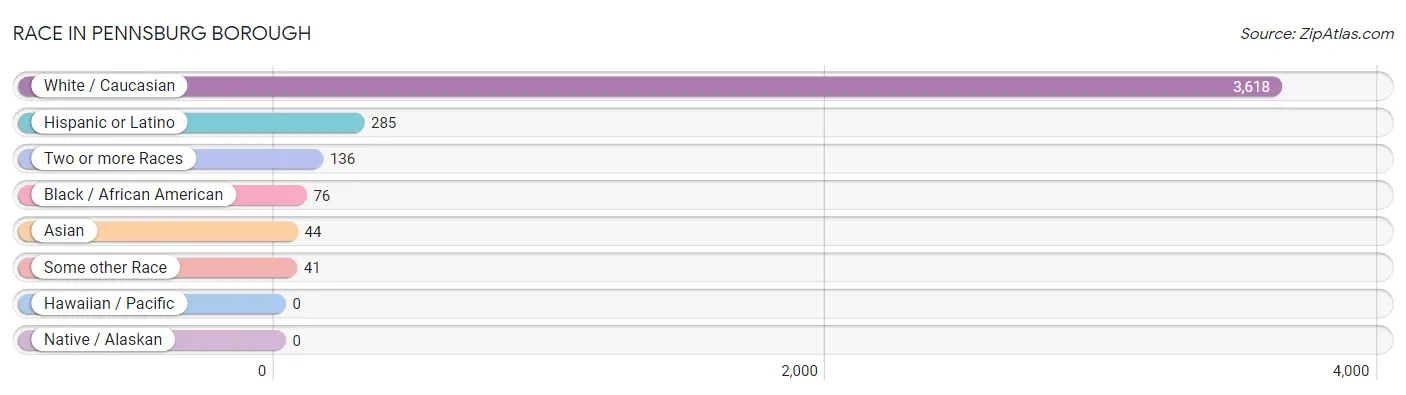
Race in Pennsburg borough
The most populous races in Pennsburg borough are White / Caucasian (3,618 | 92.4%), Hispanic or Latino (285 | 7.3%), and Two or more Races (136 | 3.5%).
| Race | # Population | % Population |
| Asian | 44 | 1.1% |
| Black / African American | 76 | 1.9% |
| Hawaiian / Pacific | 0 | 0.0% |
| Hispanic or Latino | 285 | 7.3% |
| Native / Alaskan | 0 | 0.0% |
| White / Caucasian | 3,618 | 92.4% |
| Two or more Races | 136 | 3.5% |
| Some other Race | 41 | 1.1% |
| Total | 3,915 | 100.0% |
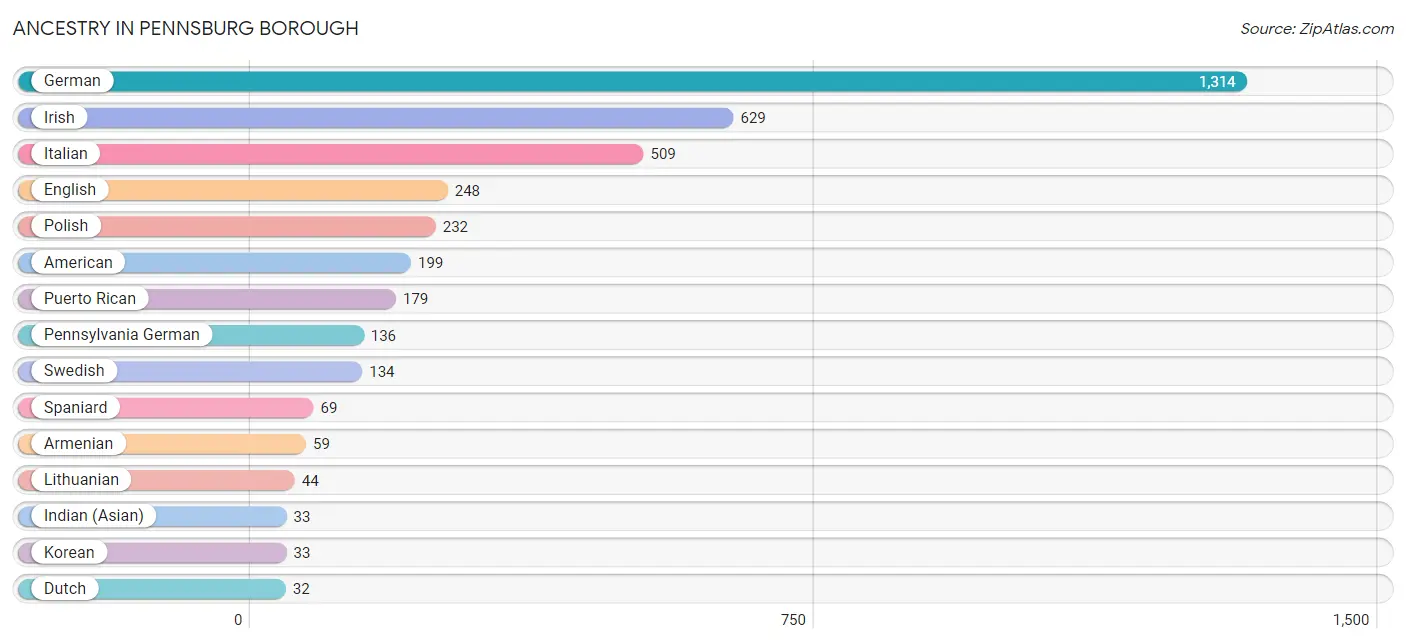
Ancestry in Pennsburg borough
The most populous ancestries reported in Pennsburg borough are German (1,314 | 33.6%), Irish (629 | 16.1%), Italian (509 | 13.0%), English (248 | 6.3%), and Polish (232 | 5.9%), together accounting for 74.9% of all Pennsburg borough residents.
| Ancestry | # Population | % Population |
| African | 21 | 0.5% |
| American | 199 | 5.1% |
| Arab | 26 | 0.7% |
| Armenian | 59 | 1.5% |
| Dutch | 32 | 0.8% |
| Egyptian | 26 | 0.7% |
| English | 248 | 6.3% |
| European | 24 | 0.6% |
| French | 5 | 0.1% |
| French Canadian | 11 | 0.3% |
| German | 1,314 | 33.6% |
| Greek | 4 | 0.1% |
| Hungarian | 10 | 0.3% |
| Indian (Asian) | 33 | 0.8% |
| Iranian | 13 | 0.3% |
| Irish | 629 | 16.1% |
| Italian | 509 | 13.0% |
| Korean | 33 | 0.8% |
| Lithuanian | 44 | 1.1% |
| Mexican | 21 | 0.5% |
| Norwegian | 10 | 0.3% |
| Pennsylvania German | 136 | 3.5% |
| Peruvian | 16 | 0.4% |
| Polish | 232 | 5.9% |
| Puerto Rican | 179 | 4.6% |
| Russian | 21 | 0.5% |
| Scandinavian | 1 | 0.0% |
| Scotch-Irish | 29 | 0.7% |
| South American | 16 | 0.4% |
| Spaniard | 69 | 1.8% |
| Subsaharan African | 21 | 0.5% |
| Swedish | 134 | 3.4% |
| Ukrainian | 6 | 0.2% | View All 33 Rows |
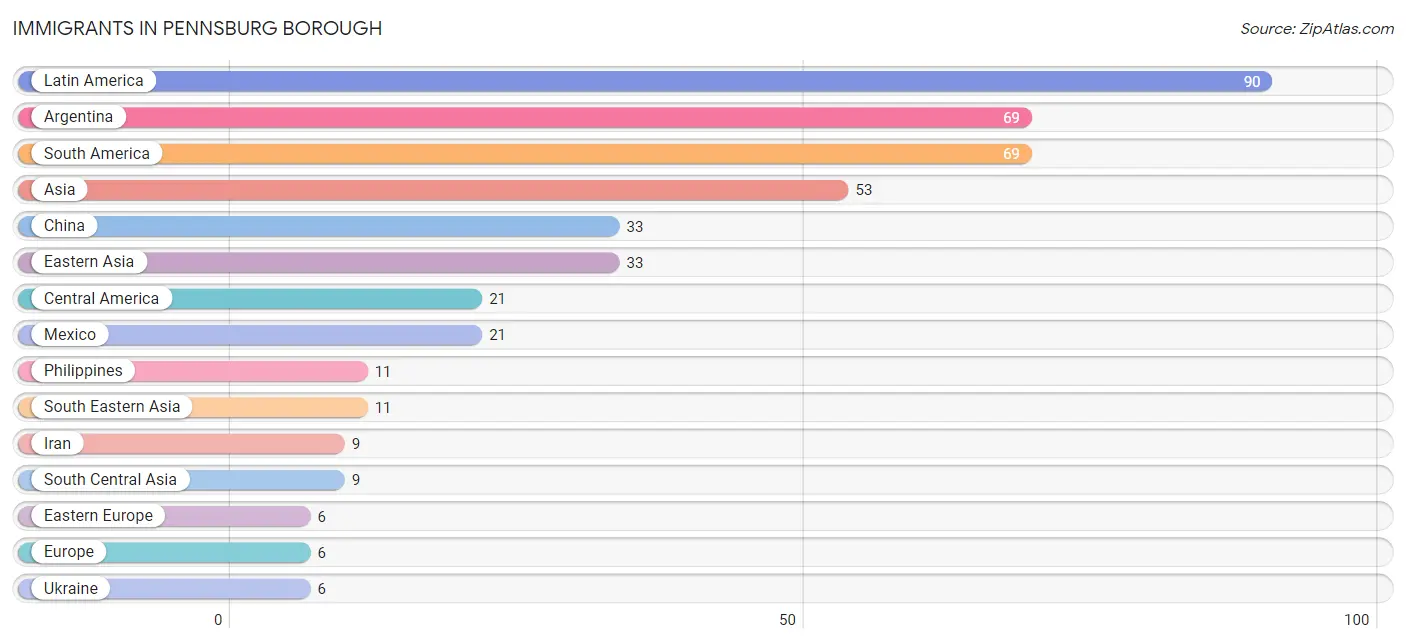
Immigrants in Pennsburg borough
The most numerous immigrant groups reported in Pennsburg borough came from Latin America (90 | 2.3%), Argentina (69 | 1.8%), South America (69 | 1.8%), Asia (53 | 1.3%), and China (33 | 0.8%), together accounting for 8.0% of all Pennsburg borough residents.
| Immigration Origin | # Population | % Population |
| Argentina | 69 | 1.8% |
| Asia | 53 | 1.3% |
| Central America | 21 | 0.5% |
| China | 33 | 0.8% |
| Eastern Asia | 33 | 0.8% |
| Eastern Europe | 6 | 0.2% |
| Europe | 6 | 0.2% |
| Iran | 9 | 0.2% |
| Latin America | 90 | 2.3% |
| Mexico | 21 | 0.5% |
| Philippines | 11 | 0.3% |
| South America | 69 | 1.8% |
| South Central Asia | 9 | 0.2% |
| South Eastern Asia | 11 | 0.3% |
| Ukraine | 6 | 0.2% | View All 15 Rows |
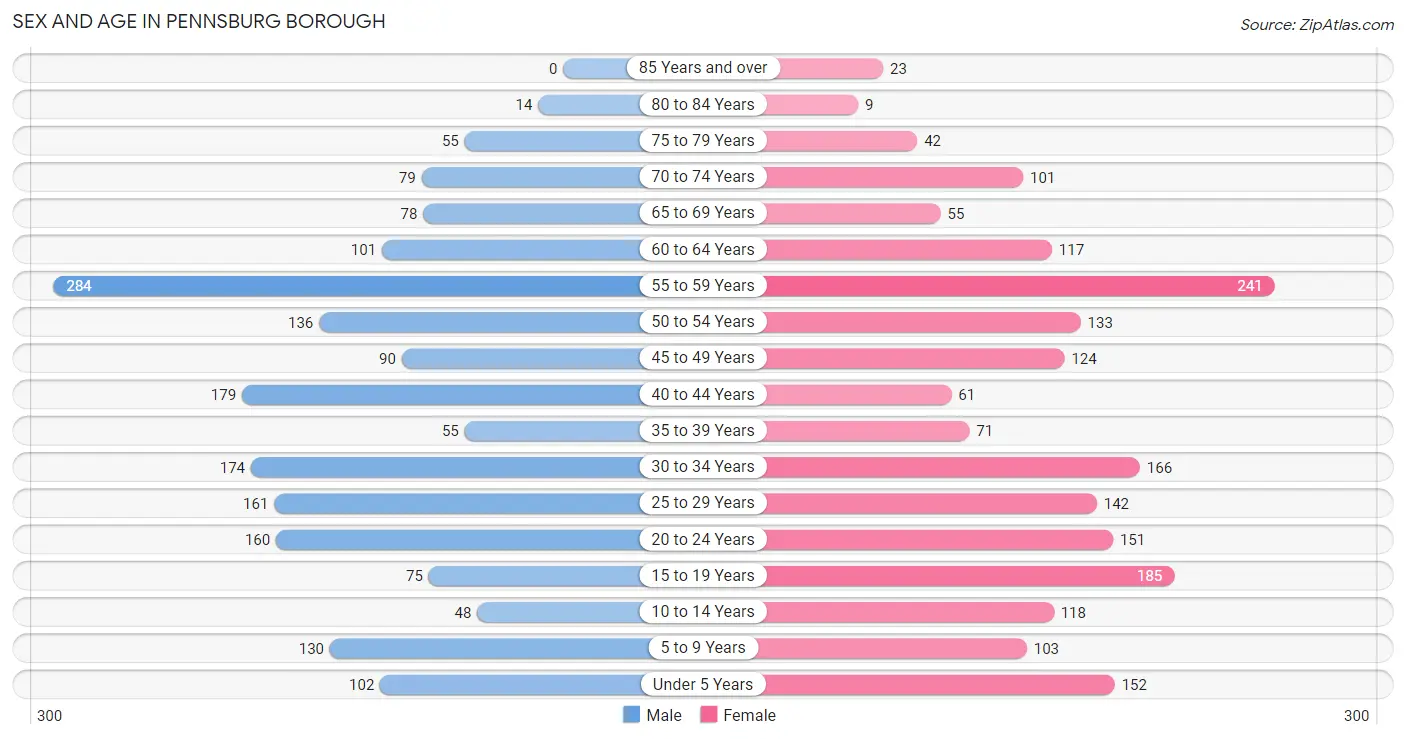
Sex and Age in Pennsburg borough
Sex and Age in Pennsburg borough
The most populous age groups in Pennsburg borough are 55 to 59 Years (284 | 14.8%) for men and 55 to 59 Years (241 | 12.1%) for women.
| Age Bracket | Male | Female |
| Under 5 Years | 102 (5.3%) | 152 (7.6%) |
| 5 to 9 Years | 130 (6.8%) | 103 (5.2%) |
| 10 to 14 Years | 48 (2.5%) | 118 (5.9%) |
| 15 to 19 Years | 75 (3.9%) | 185 (9.3%) |
| 20 to 24 Years | 160 (8.3%) | 151 (7.6%) |
| 25 to 29 Years | 161 (8.4%) | 142 (7.1%) |
| 30 to 34 Years | 174 (9.1%) | 166 (8.3%) |
| 35 to 39 Years | 55 (2.9%) | 71 (3.6%) |
| 40 to 44 Years | 179 (9.3%) | 61 (3.1%) |
| 45 to 49 Years | 90 (4.7%) | 124 (6.2%) |
| 50 to 54 Years | 136 (7.1%) | 133 (6.7%) |
| 55 to 59 Years | 284 (14.8%) | 241 (12.1%) |
| 60 to 64 Years | 101 (5.3%) | 117 (5.9%) |
| 65 to 69 Years | 78 (4.1%) | 55 (2.8%) |
| 70 to 74 Years | 79 (4.1%) | 101 (5.1%) |
| 75 to 79 Years | 55 (2.9%) | 42 (2.1%) |
| 80 to 84 Years | 14 (0.7%) | 9 (0.4%) |
| 85 Years and over | 0 (0.0%) | 23 (1.1%) |
| Total | 1,921 (100.0%) | 1,994 (100.0%) |
Families and Households in Pennsburg borough
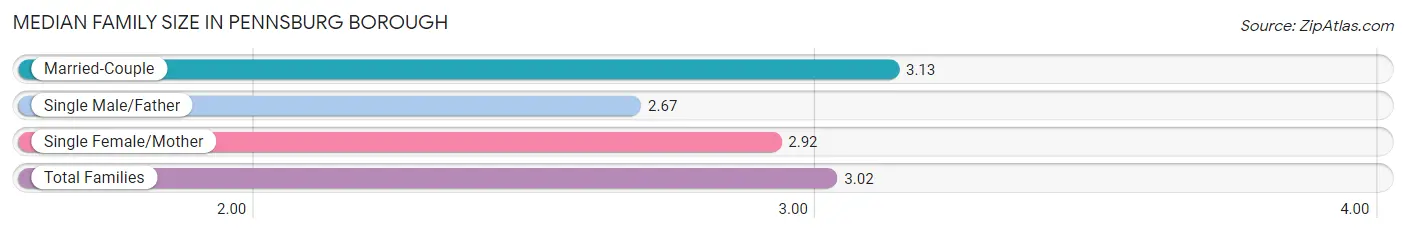
Median Family Size in Pennsburg borough
The median family size in Pennsburg borough is 3.02 persons per family, with married-couple families (731 | 69.1%) accounting for the largest median family size of 3.13 persons per family. On the other hand, single male/father families (166 | 15.7%) represent the smallest median family size with 2.67 persons per family.
| Family Type | # Families | Family Size |
| Married-Couple | 731 (69.1%) | 3.13 |
| Single Male/Father | 166 (15.7%) | 2.67 |
| Single Female/Mother | 161 (15.2%) | 2.92 |
| Total Families | 1,058 (100.0%) | 3.02 |
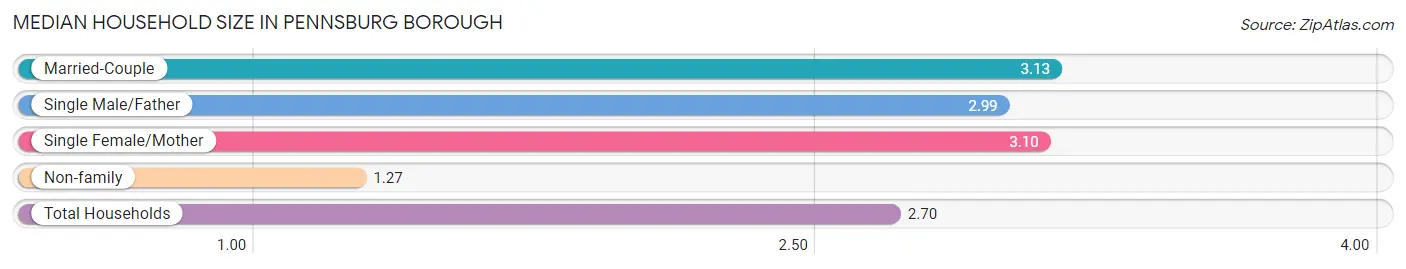
Median Household Size in Pennsburg borough
The median household size in Pennsburg borough is 2.70 persons per household, with married-couple households (731 | 54.0%) accounting for the largest median household size of 3.13 persons per household. non-family households (296 | 21.9%) represent the smallest median household size with 1.27 persons per household.
| Household Type | # Households | Household Size |
| Married-Couple | 731 (54.0%) | 3.13 |
| Single Male/Father | 166 (12.3%) | 2.99 |
| Single Female/Mother | 161 (11.9%) | 3.10 |
| Non-family | 296 (21.9%) | 1.27 |
| Total Households | 1,354 (100.0%) | 2.70 |
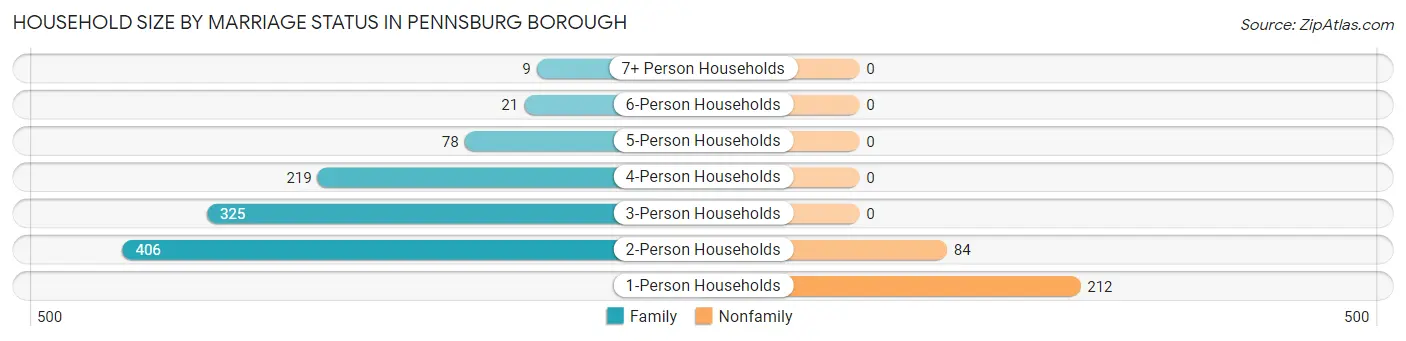
Household Size by Marriage Status in Pennsburg borough
Out of a total of 1,354 households in Pennsburg borough, 1,058 (78.1%) are family households, while 296 (21.9%) are nonfamily households. The most numerous type of family households are 2-person households, comprising 406, and the most common type of nonfamily households are 1-person households, comprising 212.
| Household Size | Family Households | Nonfamily Households |
| 1-Person Households | - | 212 (15.7%) |
| 2-Person Households | 406 (30.0%) | 84 (6.2%) |
| 3-Person Households | 325 (24.0%) | 0 (0.0%) |
| 4-Person Households | 219 (16.2%) | 0 (0.0%) |
| 5-Person Households | 78 (5.8%) | 0 (0.0%) |
| 6-Person Households | 21 (1.5%) | 0 (0.0%) |
| 7+ Person Households | 9 (0.7%) | 0 (0.0%) |
| Total | 1,058 (78.1%) | 296 (21.9%) |
Female Fertility in Pennsburg borough
Fertility by Age in Pennsburg borough
Average fertility rate in Pennsburg borough is 54.0 births per 1,000 women. Women in the age bracket of 20 to 34 years have the highest fertility rate with 107.0 births per 1,000 women. Women in the age bracket of 20 to 34 years acount for 100.0% of all women with births.
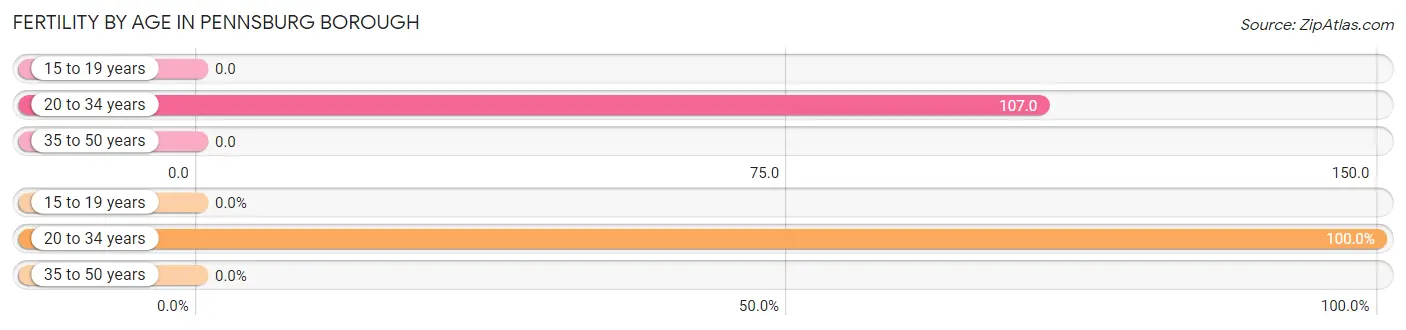
| Age Bracket | Women with Births | Births / 1,000 Women |
| 15 to 19 years | 0 (0.0%) | 0.0 |
| 20 to 34 years | 49 (100.0%) | 107.0 |
| 35 to 50 years | 0 (0.0%) | 0.0 |
| Total | 49 (100.0%) | 54.0 |
Fertility by Age by Marriage Status in Pennsburg borough
22.4% of women with births (49) in Pennsburg borough are married. The highest percentage of unmarried women with births falls into 20 to 34 years age bracket with 77.5% of them unmarried at the time of birth, while the lowest percentage of unmarried women with births belong to 20 to 34 years age bracket with 77.5% of them unmarried.
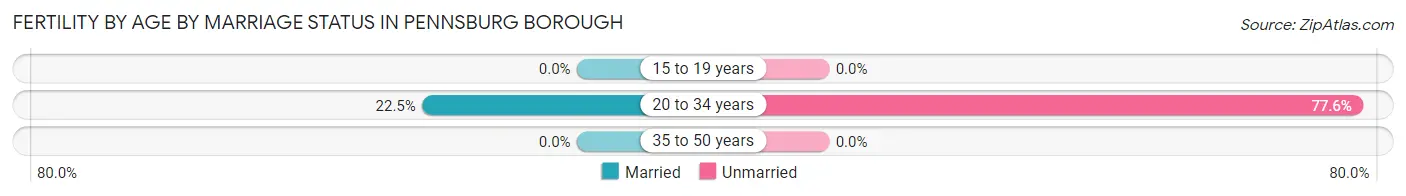
| Age Bracket | Married | Unmarried |
| 15 to 19 years | 0 (0.0%) | 0 (0.0%) |
| 20 to 34 years | 11 (22.5%) | 38 (77.5%) |
| 35 to 50 years | 0 (0.0%) | 0 (0.0%) |
| Total | 11 (22.5%) | 38 (77.5%) |
Fertility by Education in Pennsburg borough
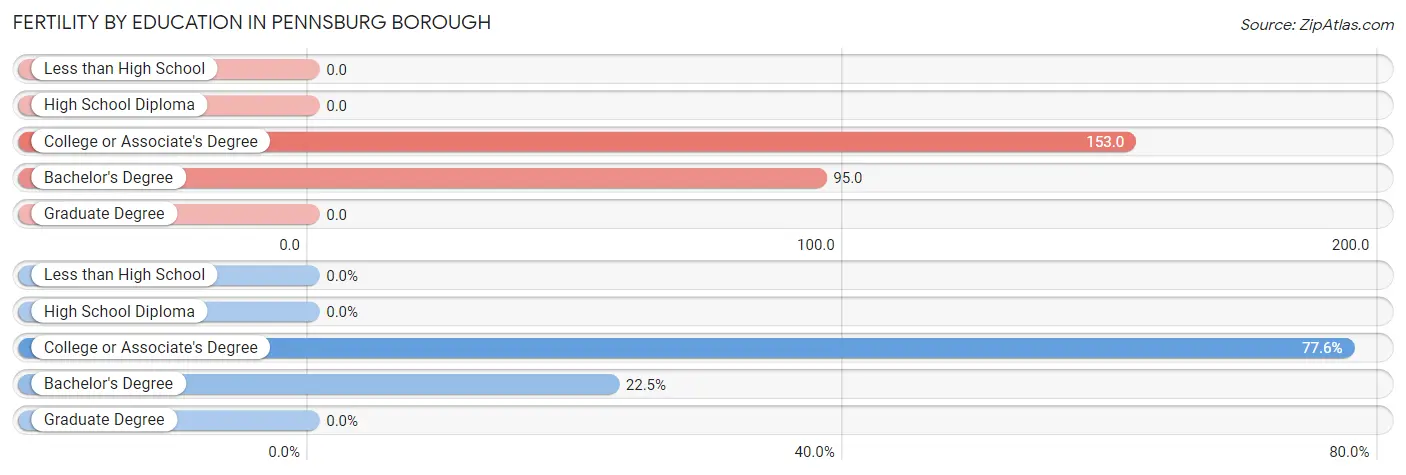
| Educational Attainment | Women with Births | Births / 1,000 Women |
| Less than High School | 0 (0.0%) | 0.0 |
| High School Diploma | 0 (0.0%) | 0.0 |
| College or Associate's Degree | 38 (77.5%) | 153.0 |
| Bachelor's Degree | 11 (22.5%) | 95.0 |
| Graduate Degree | 0 (0.0%) | 0.0 |
| Total | 49 (100.0%) | 54.0 |
Fertility by Education by Marriage Status in Pennsburg borough
77.5% of women with births in Pennsburg borough are unmarried. Women with the educational attainment of bachelor's degree are most likely to be married with 100.0% of them married at childbirth, while women with the educational attainment of college or associate's degree are least likely to be married with 100.0% of them unmarried at childbirth.
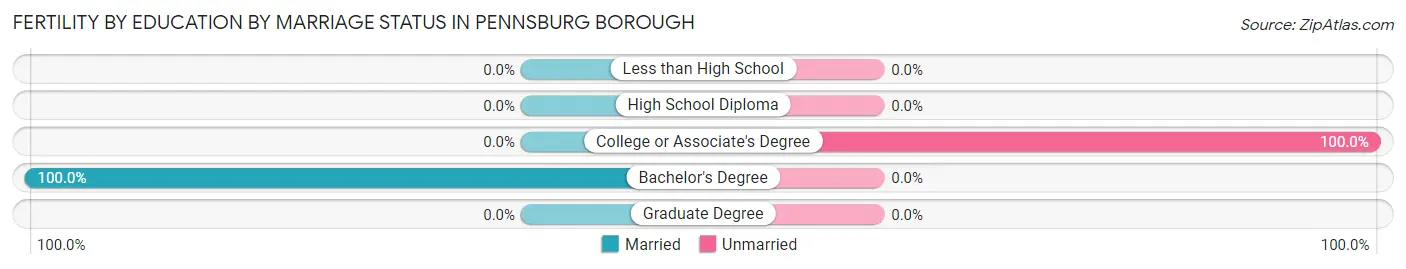
| Educational Attainment | Married | Unmarried |
| Less than High School | 0 (0.0%) | 0 (0.0%) |
| High School Diploma | 0 (0.0%) | 0 (0.0%) |
| College or Associate's Degree | 0 (0.0%) | 38 (100.0%) |
| Bachelor's Degree | 11 (100.0%) | 0 (0.0%) |
| Graduate Degree | 0 (0.0%) | 0 (0.0%) |
| Total | 11 (22.5%) | 38 (77.5%) |
Employment Characteristics in Pennsburg borough
Employment by Class of Employer in Pennsburg borough
Among the 2,289 employed individuals in Pennsburg borough, private company employees (1,852 | 80.9%), not-for-profit organizations (201 | 8.8%), and local government employees (98 | 4.3%) make up the most common classes of employment.
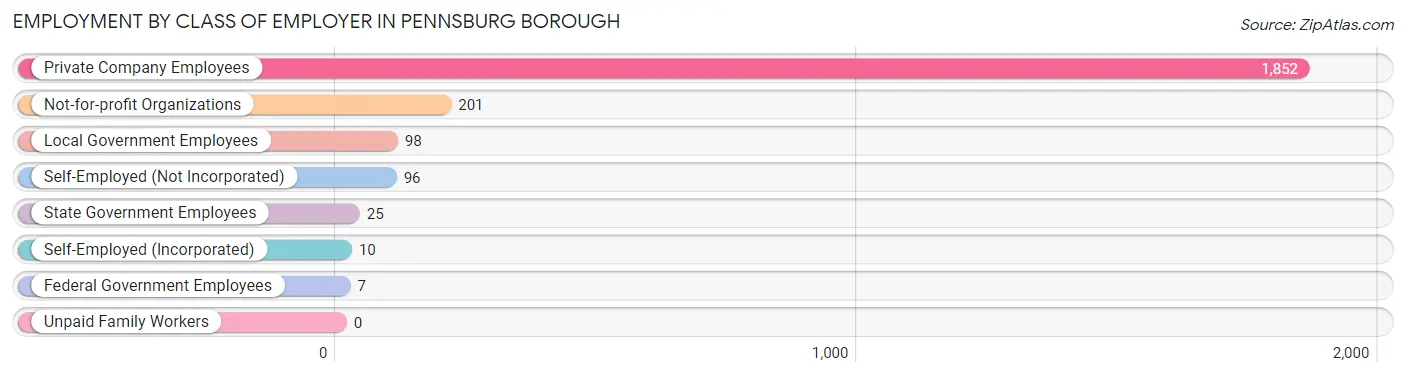
| Employer Class | # Employees | % Employees |
| Private Company Employees | 1,852 | 80.9% |
| Self-Employed (Incorporated) | 10 | 0.4% |
| Self-Employed (Not Incorporated) | 96 | 4.2% |
| Not-for-profit Organizations | 201 | 8.8% |
| Local Government Employees | 98 | 4.3% |
| State Government Employees | 25 | 1.1% |
| Federal Government Employees | 7 | 0.3% |
| Unpaid Family Workers | 0 | 0.0% |
| Total | 2,289 | 100.0% |
Employment Status by Age in Pennsburg borough
According to the labor force statistics for Pennsburg borough, out of the total population over 16 years of age (3,188), 72.9% or 2,324 individuals are in the labor force, with 1.3% or 30 of them unemployed. The age group with the highest labor force participation rate is 25 to 29 years, with 94.4% or 286 individuals in the labor force. Within the labor force, the 25 to 29 years age range has the highest percentage of unemployed individuals, with 4.9% or 14 of them being unemployed.
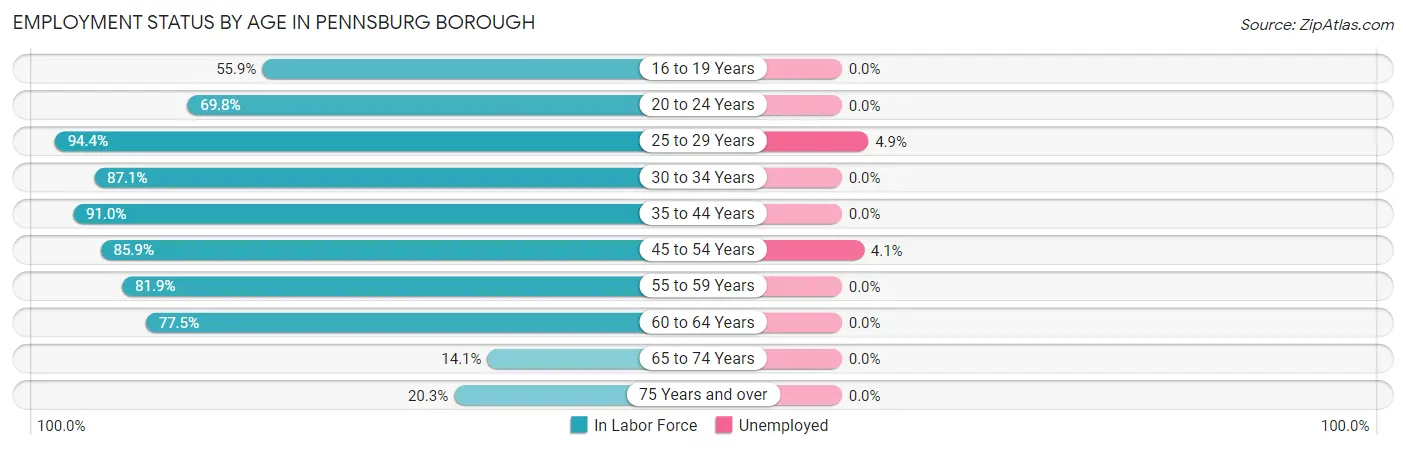
| Age Bracket | In Labor Force | Unemployed |
| 16 to 19 Years | 104 (55.9%) | 0 (0.0%) |
| 20 to 24 Years | 217 (69.8%) | 0 (0.0%) |
| 25 to 29 Years | 286 (94.4%) | 14 (4.9%) |
| 30 to 34 Years | 296 (87.1%) | 0 (0.0%) |
| 35 to 44 Years | 333 (91.0%) | 0 (0.0%) |
| 45 to 54 Years | 415 (85.9%) | 17 (4.1%) |
| 55 to 59 Years | 430 (81.9%) | 0 (0.0%) |
| 60 to 64 Years | 169 (77.5%) | 0 (0.0%) |
| 65 to 74 Years | 44 (14.1%) | 0 (0.0%) |
| 75 Years and over | 29 (20.3%) | 0 (0.0%) |
| Total | 2,324 (72.9%) | 30 (1.3%) |
Employment Status by Educational Attainment in Pennsburg borough
According to labor force statistics for Pennsburg borough, 86.3% of individuals (1,929) out of the total population between 25 and 64 years of age (2,235) are in the labor force, with 1.6% or 31 of them being unemployed. The group with the highest labor force participation rate are those with the educational attainment of bachelor's degree or higher, with 93.6% or 424 individuals in the labor force. Within the labor force, individuals with bachelor's degree or higher education have the highest percentage of unemployment, with 4.0% or 17 of them being unemployed.
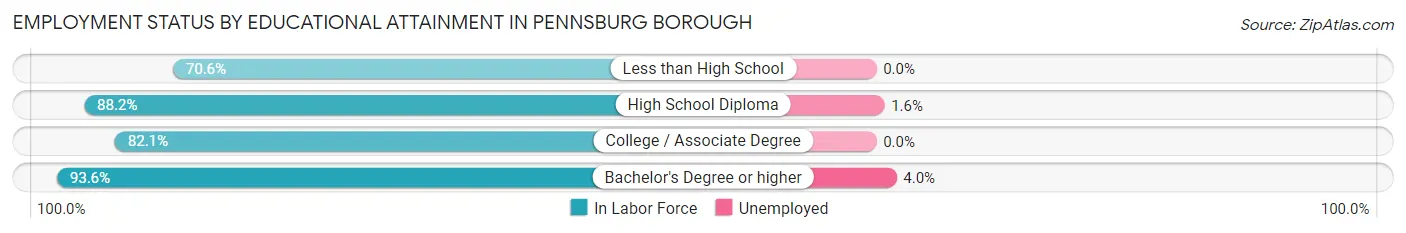
| Educational Attainment | In Labor Force | Unemployed |
| Less than High School | 120 (70.6%) | 0 (0.0%) |
| High School Diploma | 891 (88.2%) | 16 (1.6%) |
| College / Associate Degree | 494 (82.1%) | 0 (0.0%) |
| Bachelor's Degree or higher | 424 (93.6%) | 18 (4.0%) |
| Total | 1,929 (86.3%) | 36 (1.6%) |
Employment Occupations by Sex in Pennsburg borough
Management, Business, Science and Arts Occupations
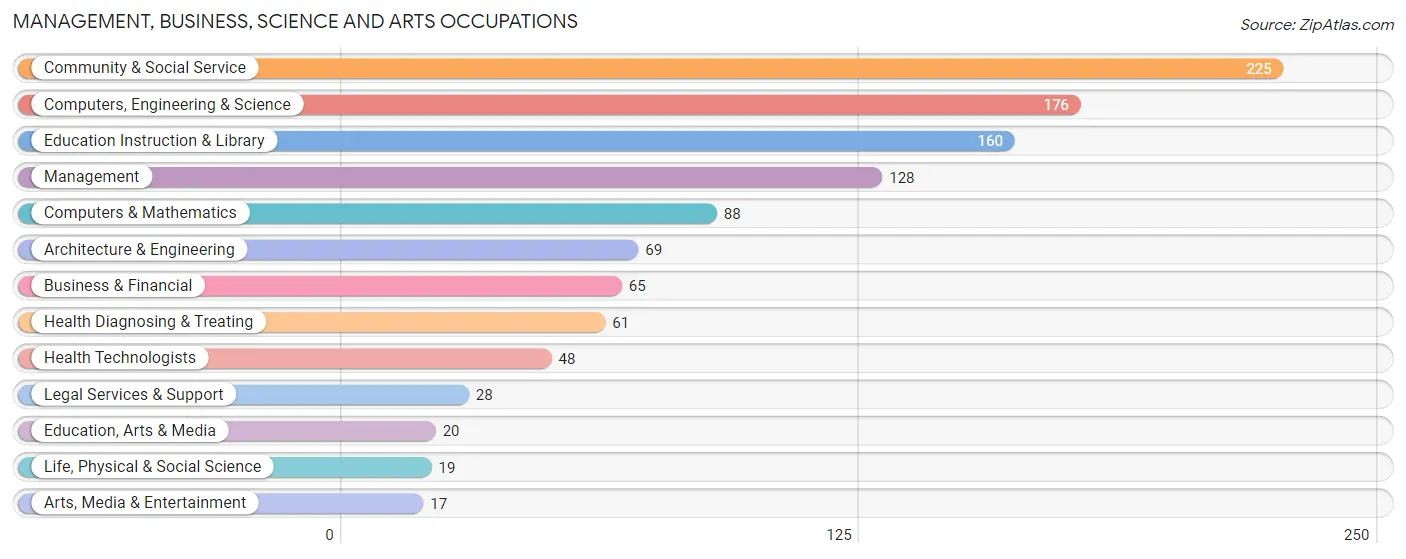
The most common Management, Business, Science and Arts occupations in Pennsburg borough are Community & Social Service (225 | 9.8%), Computers, Engineering & Science (176 | 7.7%), Education Instruction & Library (160 | 7.0%), Management (128 | 5.6%), and Computers & Mathematics (88 | 3.8%).
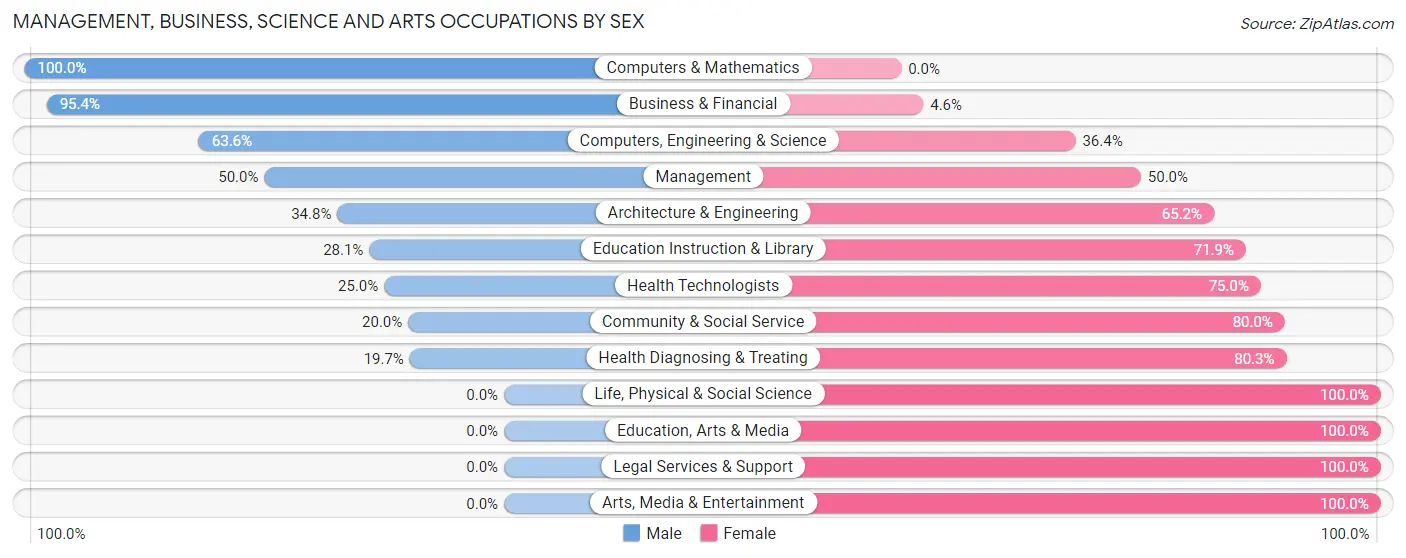
Management, Business, Science and Arts Occupations by Sex
Within the Management, Business, Science and Arts occupations in Pennsburg borough, the most male-oriented occupations are Computers & Mathematics (100.0%), Business & Financial (95.4%), and Computers, Engineering & Science (63.6%), while the most female-oriented occupations are Life, Physical & Social Science (100.0%), Education, Arts & Media (100.0%), and Legal Services & Support (100.0%).
| Occupation | Male | Female |
| Management | 64 (50.0%) | 64 (50.0%) |
| Business & Financial | 62 (95.4%) | 3 (4.6%) |
| Computers, Engineering & Science | 112 (63.6%) | 64 (36.4%) |
| Computers & Mathematics | 88 (100.0%) | 0 (0.0%) |
| Architecture & Engineering | 24 (34.8%) | 45 (65.2%) |
| Life, Physical & Social Science | 0 (0.0%) | 19 (100.0%) |
| Community & Social Service | 45 (20.0%) | 180 (80.0%) |
| Education, Arts & Media | 0 (0.0%) | 20 (100.0%) |
| Legal Services & Support | 0 (0.0%) | 28 (100.0%) |
| Education Instruction & Library | 45 (28.1%) | 115 (71.9%) |
| Arts, Media & Entertainment | 0 (0.0%) | 17 (100.0%) |
| Health Diagnosing & Treating | 12 (19.7%) | 49 (80.3%) |
| Health Technologists | 12 (25.0%) | 36 (75.0%) |
| Total (Category) | 295 (45.0%) | 360 (55.0%) |
| Total (Overall) | 1,120 (48.9%) | 1,172 (51.1%) |
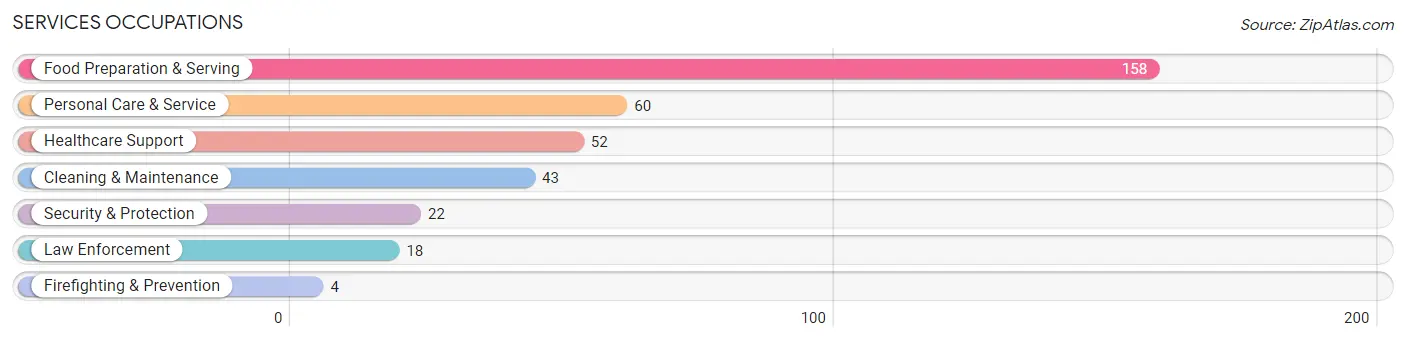
Services Occupations
The most common Services occupations in Pennsburg borough are Food Preparation & Serving (158 | 6.9%), Personal Care & Service (60 | 2.6%), Healthcare Support (52 | 2.3%), Cleaning & Maintenance (43 | 1.9%), and Security & Protection (22 | 1.0%).
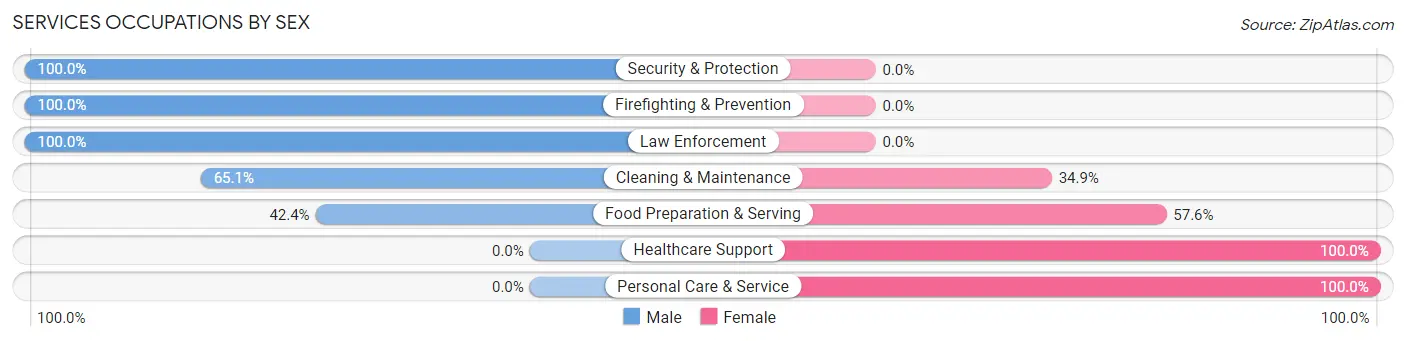
Services Occupations by Sex
Within the Services occupations in Pennsburg borough, the most male-oriented occupations are Security & Protection (100.0%), Firefighting & Prevention (100.0%), and Law Enforcement (100.0%), while the most female-oriented occupations are Healthcare Support (100.0%), Personal Care & Service (100.0%), and Food Preparation & Serving (57.6%).
| Occupation | Male | Female |
| Healthcare Support | 0 (0.0%) | 52 (100.0%) |
| Security & Protection | 22 (100.0%) | 0 (0.0%) |
| Firefighting & Prevention | 4 (100.0%) | 0 (0.0%) |
| Law Enforcement | 18 (100.0%) | 0 (0.0%) |
| Food Preparation & Serving | 67 (42.4%) | 91 (57.6%) |
| Cleaning & Maintenance | 28 (65.1%) | 15 (34.9%) |
| Personal Care & Service | 0 (0.0%) | 60 (100.0%) |
| Total (Category) | 117 (34.9%) | 218 (65.1%) |
| Total (Overall) | 1,120 (48.9%) | 1,172 (51.1%) |
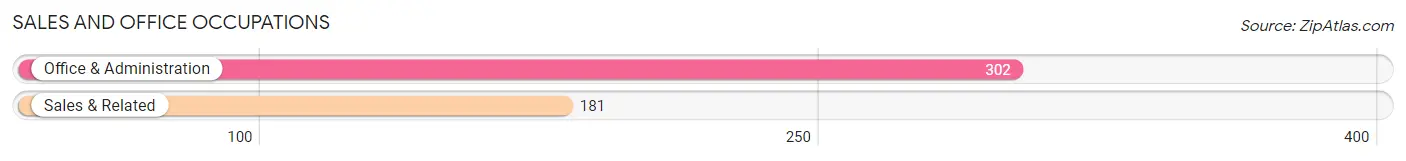
Sales and Office Occupations
The most common Sales and Office occupations in Pennsburg borough are Office & Administration (302 | 13.2%), and Sales & Related (181 | 7.9%).
Sales and Office Occupations by Sex
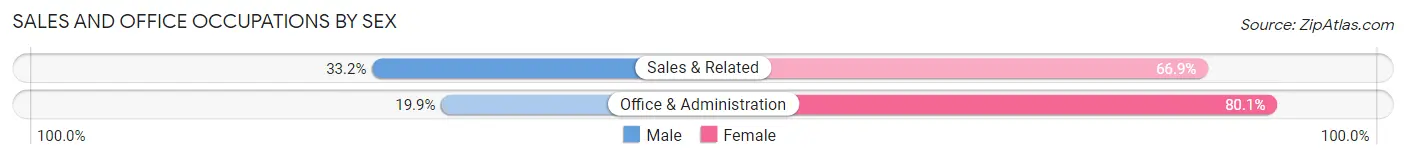
| Occupation | Male | Female |
| Sales & Related | 60 (33.2%) | 121 (66.8%) |
| Office & Administration | 60 (19.9%) | 242 (80.1%) |
| Total (Category) | 120 (24.8%) | 363 (75.2%) |
| Total (Overall) | 1,120 (48.9%) | 1,172 (51.1%) |
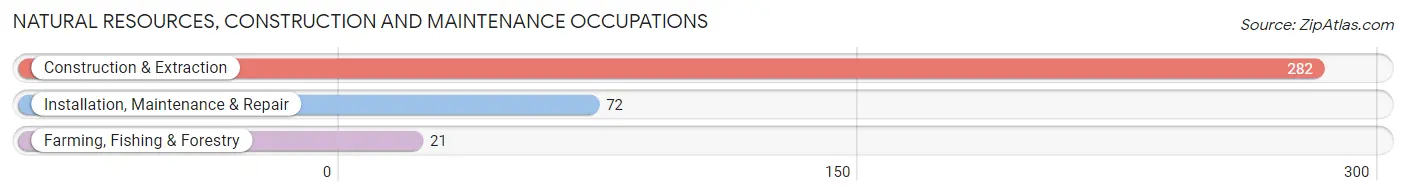
Natural Resources, Construction and Maintenance Occupations
The most common Natural Resources, Construction and Maintenance occupations in Pennsburg borough are Construction & Extraction (282 | 12.3%), Installation, Maintenance & Repair (72 | 3.1%), and Farming, Fishing & Forestry (21 | 0.9%).
Natural Resources, Construction and Maintenance Occupations by Sex
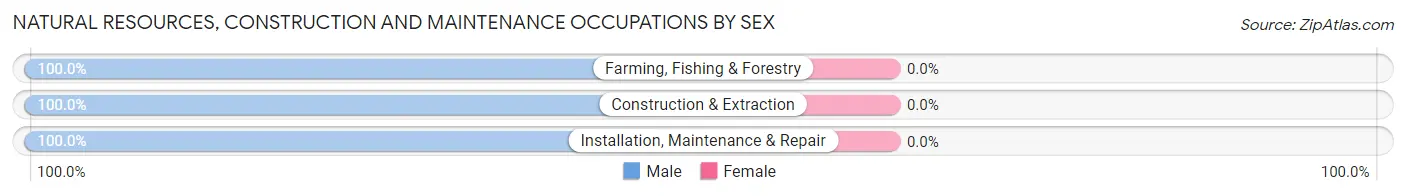
| Occupation | Male | Female |
| Farming, Fishing & Forestry | 21 (100.0%) | 0 (0.0%) |
| Construction & Extraction | 282 (100.0%) | 0 (0.0%) |
| Installation, Maintenance & Repair | 72 (100.0%) | 0 (0.0%) |
| Total (Category) | 375 (100.0%) | 0 (0.0%) |
| Total (Overall) | 1,120 (48.9%) | 1,172 (51.1%) |
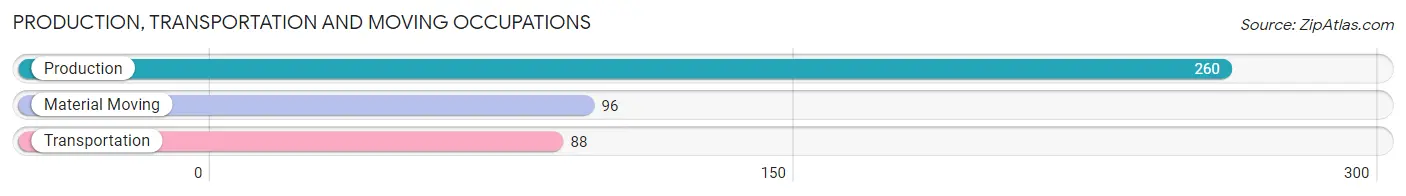
Production, Transportation and Moving Occupations
The most common Production, Transportation and Moving occupations in Pennsburg borough are Production (260 | 11.3%), Material Moving (96 | 4.2%), and Transportation (88 | 3.8%).
Production, Transportation and Moving Occupations by Sex
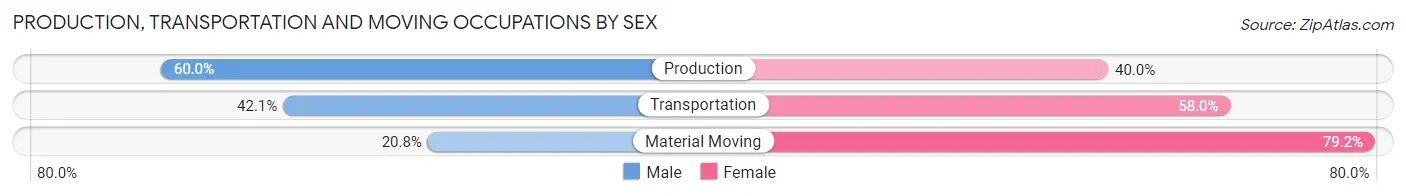
| Occupation | Male | Female |
| Production | 156 (60.0%) | 104 (40.0%) |
| Transportation | 37 (42.0%) | 51 (58.0%) |
| Material Moving | 20 (20.8%) | 76 (79.2%) |
| Total (Category) | 213 (48.0%) | 231 (52.0%) |
| Total (Overall) | 1,120 (48.9%) | 1,172 (51.1%) |
Employment Industries by Sex in Pennsburg borough
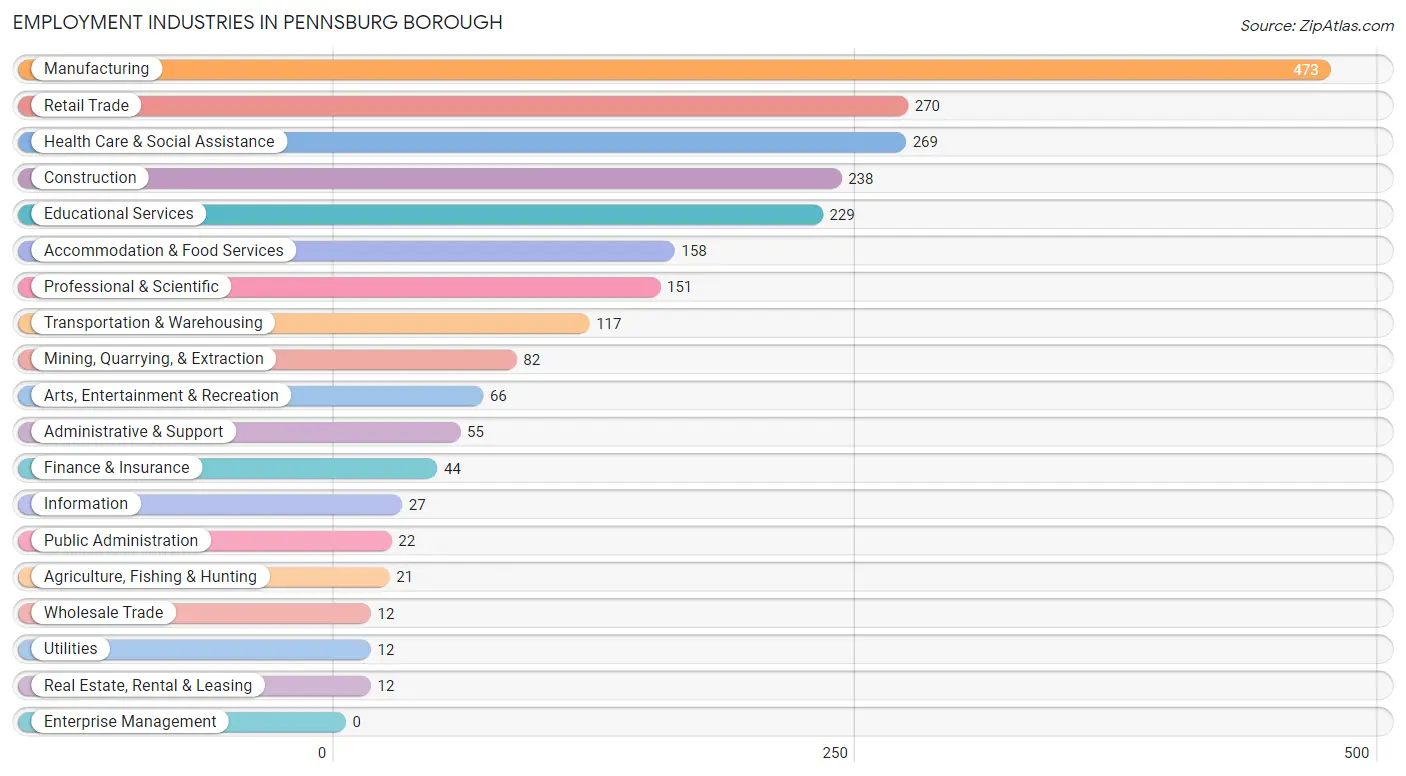
Employment Industries in Pennsburg borough
The major employment industries in Pennsburg borough include Manufacturing (473 | 20.6%), Retail Trade (270 | 11.8%), Health Care & Social Assistance (269 | 11.7%), Construction (238 | 10.4%), and Educational Services (229 | 10.0%).
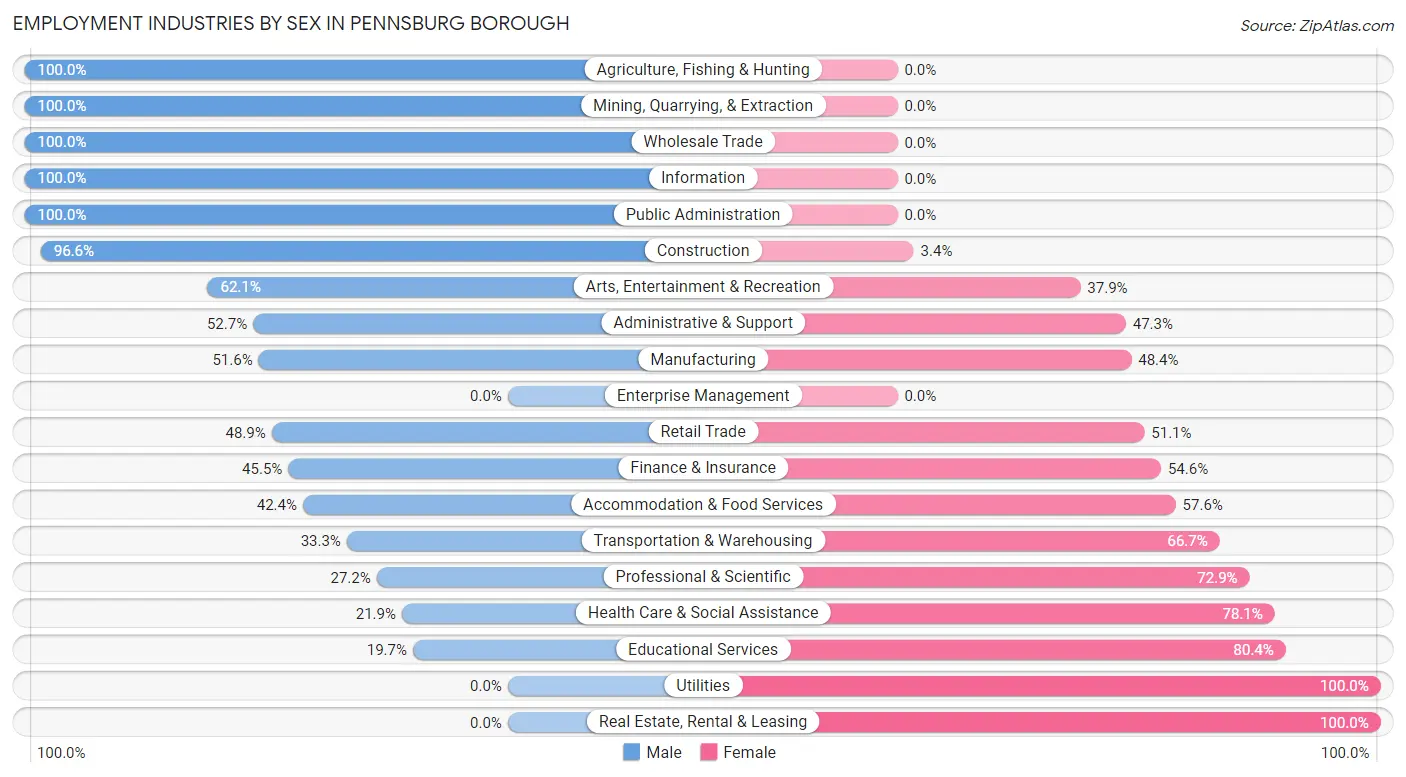
Employment Industries by Sex in Pennsburg borough
The Pennsburg borough industries that see more men than women are Agriculture, Fishing & Hunting (100.0%), Mining, Quarrying, & Extraction (100.0%), and Wholesale Trade (100.0%), whereas the industries that tend to have a higher number of women are Utilities (100.0%), Real Estate, Rental & Leasing (100.0%), and Educational Services (80.3%).
| Industry | Male | Female |
| Agriculture, Fishing & Hunting | 21 (100.0%) | 0 (0.0%) |
| Mining, Quarrying, & Extraction | 82 (100.0%) | 0 (0.0%) |
| Construction | 230 (96.6%) | 8 (3.4%) |
| Manufacturing | 244 (51.6%) | 229 (48.4%) |
| Wholesale Trade | 12 (100.0%) | 0 (0.0%) |
| Retail Trade | 132 (48.9%) | 138 (51.1%) |
| Transportation & Warehousing | 39 (33.3%) | 78 (66.7%) |
| Utilities | 0 (0.0%) | 12 (100.0%) |
| Information | 27 (100.0%) | 0 (0.0%) |
| Finance & Insurance | 20 (45.5%) | 24 (54.5%) |
| Real Estate, Rental & Leasing | 0 (0.0%) | 12 (100.0%) |
| Professional & Scientific | 41 (27.2%) | 110 (72.9%) |
| Enterprise Management | 0 (0.0%) | 0 (0.0%) |
| Administrative & Support | 29 (52.7%) | 26 (47.3%) |
| Educational Services | 45 (19.7%) | 184 (80.3%) |
| Health Care & Social Assistance | 59 (21.9%) | 210 (78.1%) |
| Arts, Entertainment & Recreation | 41 (62.1%) | 25 (37.9%) |
| Accommodation & Food Services | 67 (42.4%) | 91 (57.6%) |
| Public Administration | 22 (100.0%) | 0 (0.0%) |
| Total | 1,120 (48.9%) | 1,172 (51.1%) |
Education in Pennsburg borough
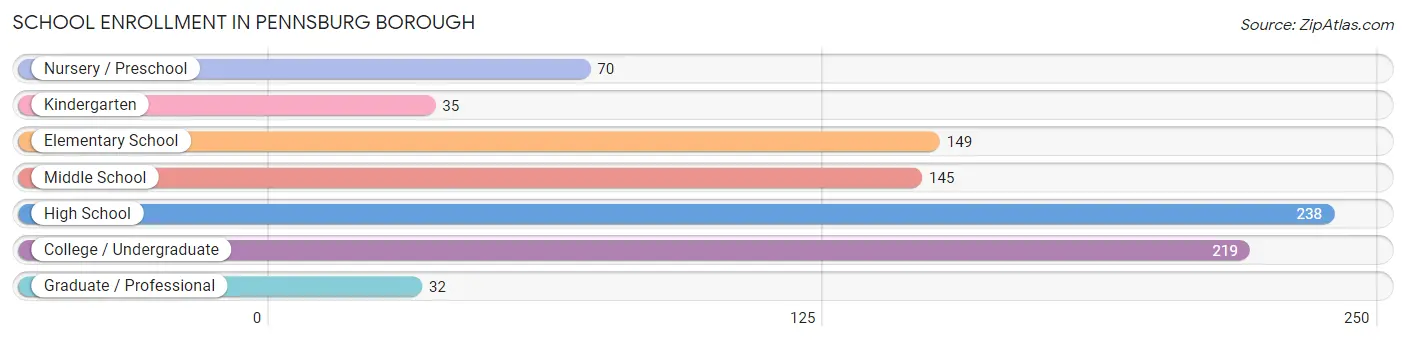
School Enrollment in Pennsburg borough
The most common levels of schooling among the 888 students in Pennsburg borough are high school (238 | 26.8%), college / undergraduate (219 | 24.7%), and elementary school (149 | 16.8%).
| School Level | # Students | % Students |
| Nursery / Preschool | 70 | 7.9% |
| Kindergarten | 35 | 3.9% |
| Elementary School | 149 | 16.8% |
| Middle School | 145 | 16.3% |
| High School | 238 | 26.8% |
| College / Undergraduate | 219 | 24.7% |
| Graduate / Professional | 32 | 3.6% |
| Total | 888 | 100.0% |
School Enrollment by Age by Funding Source in Pennsburg borough
Out of a total of 888 students who are enrolled in schools in Pennsburg borough, 168 (18.9%) attend a private institution, while the remaining 720 (81.1%) are enrolled in public schools. The age group of 3 to 4 year olds has the highest likelihood of being enrolled in private schools, with 46 (79.3% in the age bracket) enrolled. Conversely, the age group of 10 to 14 year olds has the lowest likelihood of being enrolled in a private school, with 166 (100.0% in the age bracket) attending a public institution.
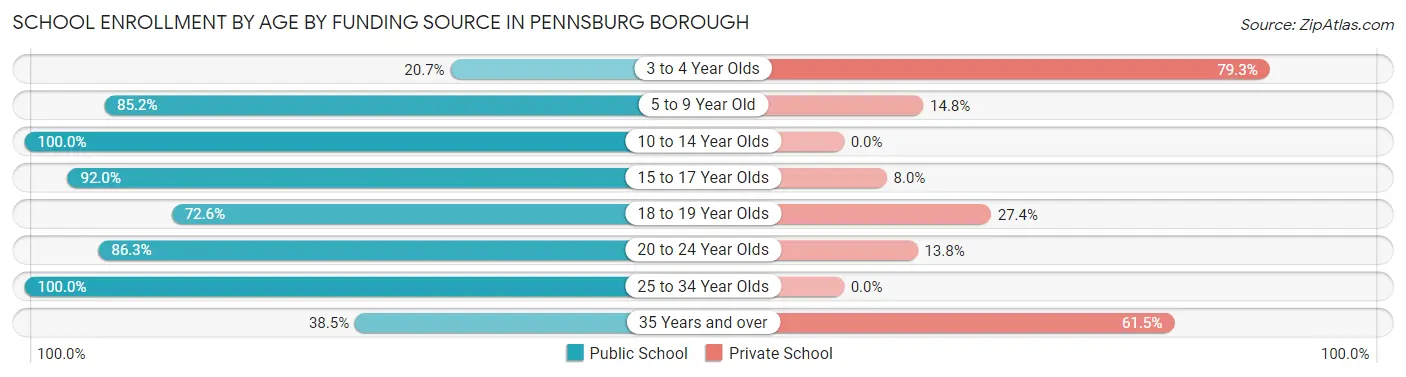
| Age Bracket | Public School | Private School |
| 3 to 4 Year Olds | 12 (20.7%) | 46 (79.3%) |
| 5 to 9 Year Old | 167 (85.2%) | 29 (14.8%) |
| 10 to 14 Year Olds | 166 (100.0%) | 0 (0.0%) |
| 15 to 17 Year Olds | 115 (92.0%) | 10 (8.0%) |
| 18 to 19 Year Olds | 98 (72.6%) | 37 (27.4%) |
| 20 to 24 Year Olds | 138 (86.3%) | 22 (13.8%) |
| 25 to 34 Year Olds | 9 (100.0%) | 0 (0.0%) |
| 35 Years and over | 15 (38.5%) | 24 (61.5%) |
| Total | 720 (81.1%) | 168 (18.9%) |
Educational Attainment by Field of Study in Pennsburg borough
Education (121 | 22.0%), business (92 | 16.8%), science & technology (83 | 15.1%), visual & performing arts (46 | 8.4%), and computers & mathematics (35 | 6.4%) are the most common fields of study among 549 individuals in Pennsburg borough who have obtained a bachelor's degree or higher.
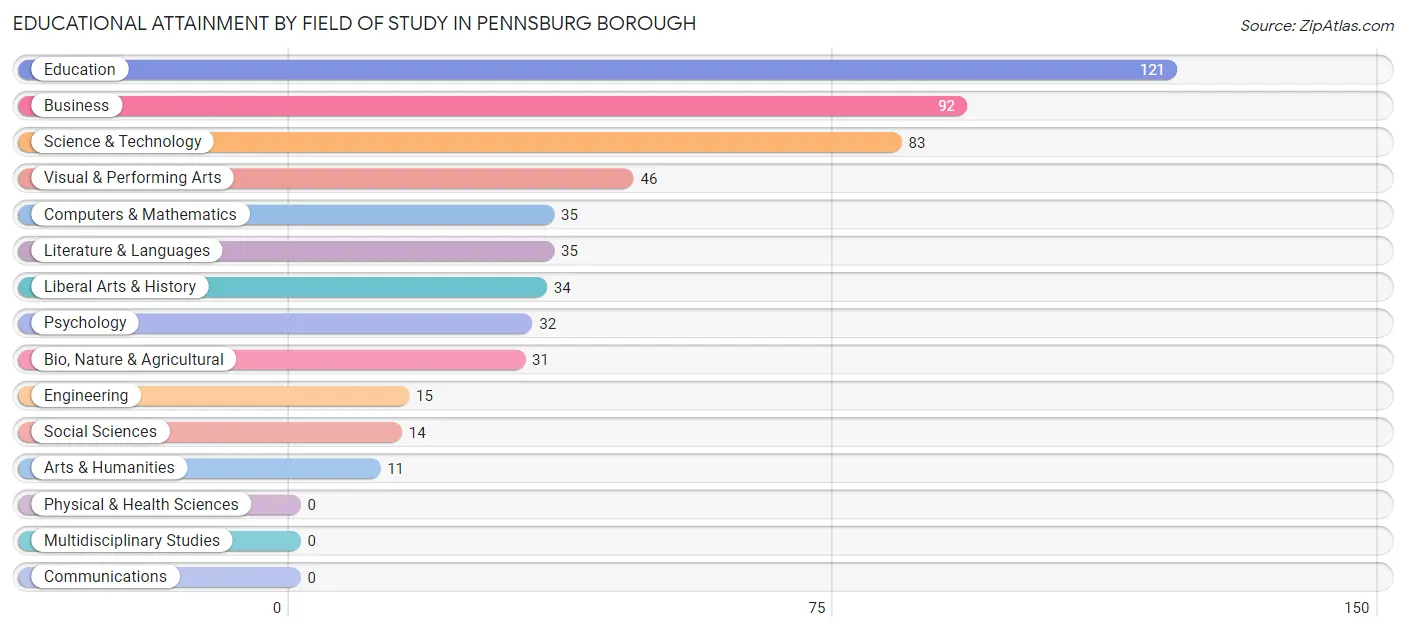
| Field of Study | # Graduates | % Graduates |
| Computers & Mathematics | 35 | 6.4% |
| Bio, Nature & Agricultural | 31 | 5.7% |
| Physical & Health Sciences | 0 | 0.0% |
| Psychology | 32 | 5.8% |
| Social Sciences | 14 | 2.5% |
| Engineering | 15 | 2.7% |
| Multidisciplinary Studies | 0 | 0.0% |
| Science & Technology | 83 | 15.1% |
| Business | 92 | 16.8% |
| Education | 121 | 22.0% |
| Literature & Languages | 35 | 6.4% |
| Liberal Arts & History | 34 | 6.2% |
| Visual & Performing Arts | 46 | 8.4% |
| Communications | 0 | 0.0% |
| Arts & Humanities | 11 | 2.0% |
| Total | 549 | 100.0% |
Transportation & Commute in Pennsburg borough
Vehicle Availability by Sex in Pennsburg borough
The most prevalent vehicle ownership categories in Pennsburg borough are males with 2 vehicles (508, accounting for 46.2%) and females with 2 vehicles (532, making up 44.8%).
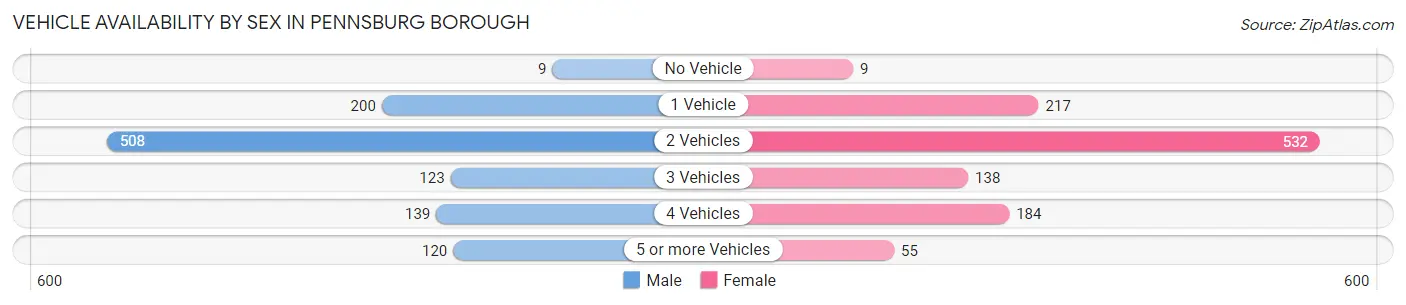
| Vehicles Available | Male | Female |
| No Vehicle | 9 (0.8%) | 9 (0.8%) |
| 1 Vehicle | 200 (18.2%) | 217 (19.1%) |
| 2 Vehicles | 508 (46.2%) | 532 (46.9%) |
| 3 Vehicles | 123 (11.2%) | 138 (12.2%) |
| 4 Vehicles | 139 (12.7%) | 184 (16.2%) |
| 5 or more Vehicles | 120 (10.9%) | 55 (4.9%) |
| Total | 1,099 (100.0%) | 1,135 (100.0%) |
Commute Time in Pennsburg borough
The most frequently occuring commute durations in Pennsburg borough are 45 to 59 minutes (518 commuters, 24.8%), 5 to 9 minutes (284 commuters, 13.6%), and 20 to 24 minutes (264 commuters, 12.6%).
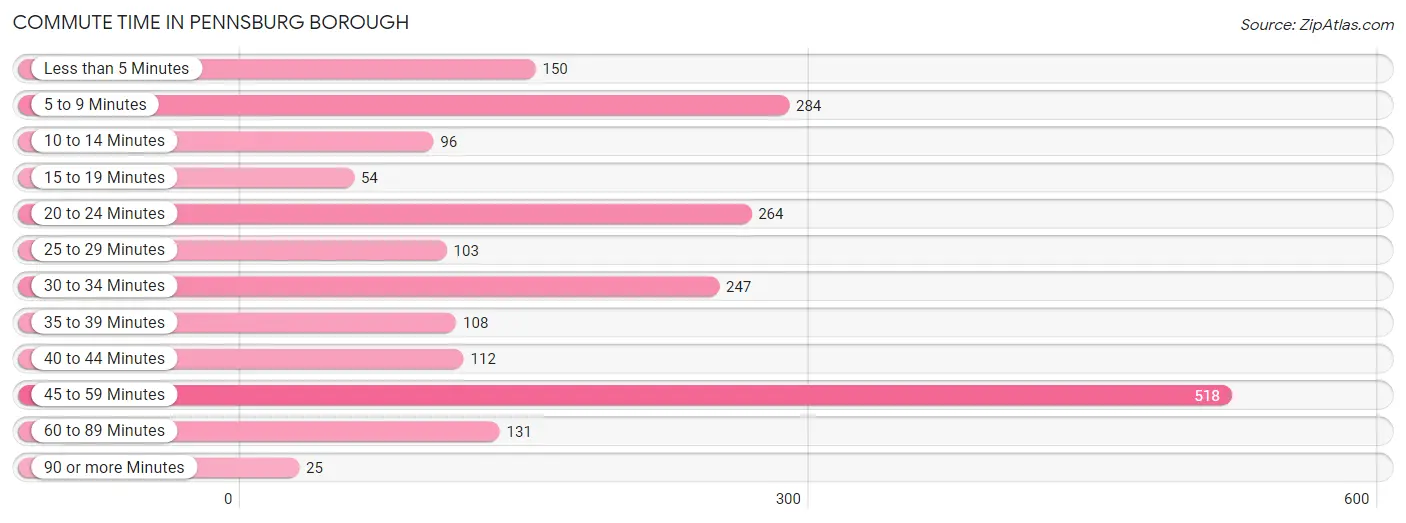
| Commute Time | # Commuters | % Commuters |
| Less than 5 Minutes | 150 | 7.2% |
| 5 to 9 Minutes | 284 | 13.6% |
| 10 to 14 Minutes | 96 | 4.6% |
| 15 to 19 Minutes | 54 | 2.6% |
| 20 to 24 Minutes | 264 | 12.6% |
| 25 to 29 Minutes | 103 | 4.9% |
| 30 to 34 Minutes | 247 | 11.8% |
| 35 to 39 Minutes | 108 | 5.2% |
| 40 to 44 Minutes | 112 | 5.3% |
| 45 to 59 Minutes | 518 | 24.8% |
| 60 to 89 Minutes | 131 | 6.3% |
| 90 or more Minutes | 25 | 1.2% |
Commute Time by Sex in Pennsburg borough
The most common commute times in Pennsburg borough are 45 to 59 minutes (299 commuters, 28.7%) for males and 45 to 59 minutes (219 commuters, 20.8%) for females.
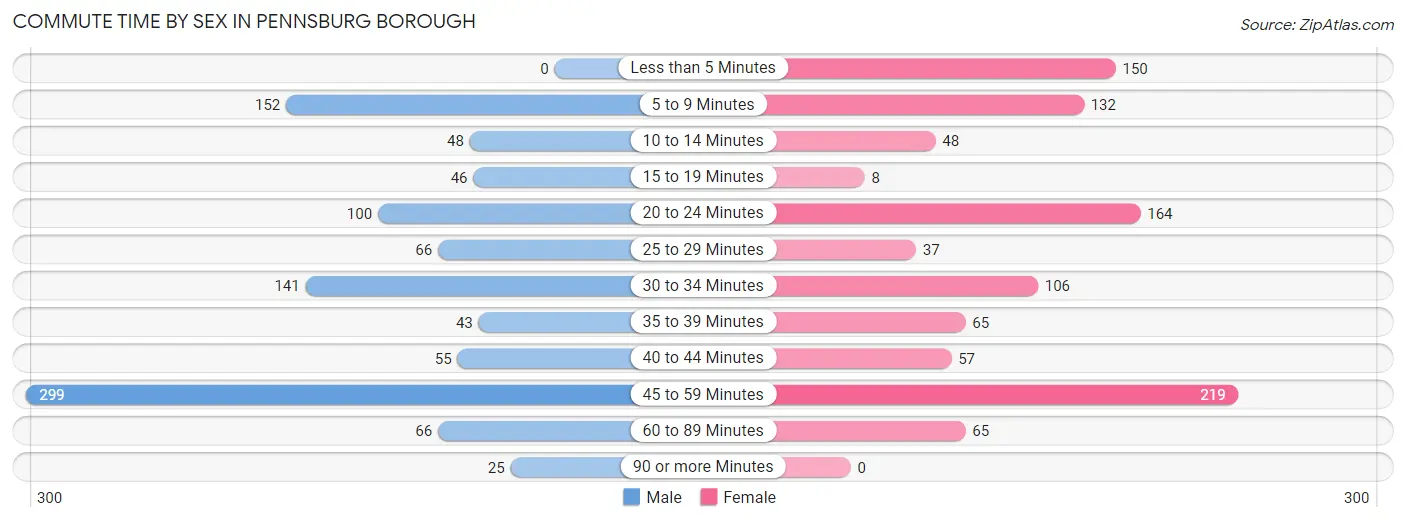
| Commute Time | Male | Female |
| Less than 5 Minutes | 0 (0.0%) | 150 (14.3%) |
| 5 to 9 Minutes | 152 (14.6%) | 132 (12.6%) |
| 10 to 14 Minutes | 48 (4.6%) | 48 (4.6%) |
| 15 to 19 Minutes | 46 (4.4%) | 8 (0.8%) |
| 20 to 24 Minutes | 100 (9.6%) | 164 (15.6%) |
| 25 to 29 Minutes | 66 (6.3%) | 37 (3.5%) |
| 30 to 34 Minutes | 141 (13.5%) | 106 (10.1%) |
| 35 to 39 Minutes | 43 (4.1%) | 65 (6.2%) |
| 40 to 44 Minutes | 55 (5.3%) | 57 (5.4%) |
| 45 to 59 Minutes | 299 (28.7%) | 219 (20.8%) |
| 60 to 89 Minutes | 66 (6.3%) | 65 (6.2%) |
| 90 or more Minutes | 25 (2.4%) | 0 (0.0%) |
Time of Departure to Work by Sex in Pennsburg borough
The most frequent times of departure to work in Pennsburg borough are 12:00 AM to 4:59 AM (266, 25.6%) for males and 7:00 AM to 7:29 AM (312, 29.7%) for females.

| Time of Departure | Male | Female |
| 12:00 AM to 4:59 AM | 266 (25.6%) | 26 (2.5%) |
| 5:00 AM to 5:29 AM | 123 (11.8%) | 9 (0.9%) |
| 5:30 AM to 5:59 AM | 115 (11.1%) | 68 (6.5%) |
| 6:00 AM to 6:29 AM | 206 (19.8%) | 87 (8.3%) |
| 6:30 AM to 6:59 AM | 29 (2.8%) | 128 (12.2%) |
| 7:00 AM to 7:29 AM | 140 (13.5%) | 312 (29.7%) |
| 7:30 AM to 7:59 AM | 37 (3.5%) | 74 (7.0%) |
| 8:00 AM to 8:29 AM | 33 (3.2%) | 81 (7.7%) |
| 8:30 AM to 8:59 AM | 0 (0.0%) | 10 (0.9%) |
| 9:00 AM to 9:59 AM | 32 (3.1%) | 29 (2.8%) |
| 10:00 AM to 10:59 AM | 0 (0.0%) | 0 (0.0%) |
| 11:00 AM to 11:59 AM | 0 (0.0%) | 11 (1.1%) |
| 12:00 PM to 3:59 PM | 21 (2.0%) | 141 (13.4%) |
| 4:00 PM to 11:59 PM | 39 (3.7%) | 75 (7.1%) |
| Total | 1,041 (100.0%) | 1,051 (100.0%) |
Housing Occupancy in Pennsburg borough
Occupancy by Ownership in Pennsburg borough
Of the total 1,354 dwellings in Pennsburg borough, owner-occupied units account for 950 (70.2%), while renter-occupied units make up 404 (29.8%).
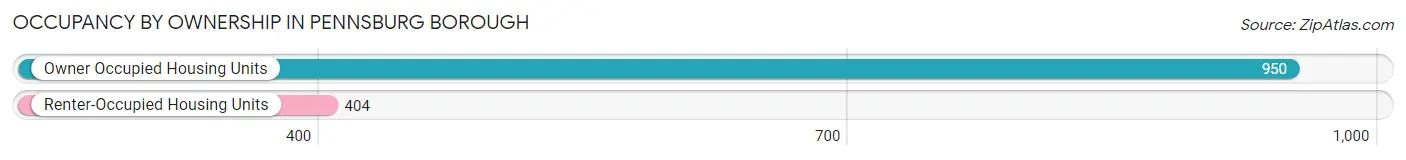
| Occupancy | # Housing Units | % Housing Units |
| Owner Occupied Housing Units | 950 | 70.2% |
| Renter-Occupied Housing Units | 404 | 29.8% |
| Total Occupied Housing Units | 1,354 | 100.0% |
Occupancy by Household Size in Pennsburg borough
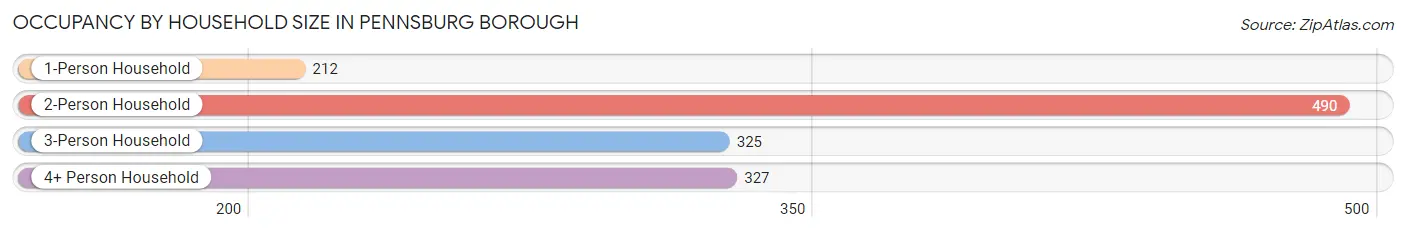
| Household Size | # Housing Units | % Housing Units |
| 1-Person Household | 212 | 15.7% |
| 2-Person Household | 490 | 36.2% |
| 3-Person Household | 325 | 24.0% |
| 4+ Person Household | 327 | 24.1% |
| Total Housing Units | 1,354 | 100.0% |
Occupancy by Ownership by Household Size in Pennsburg borough
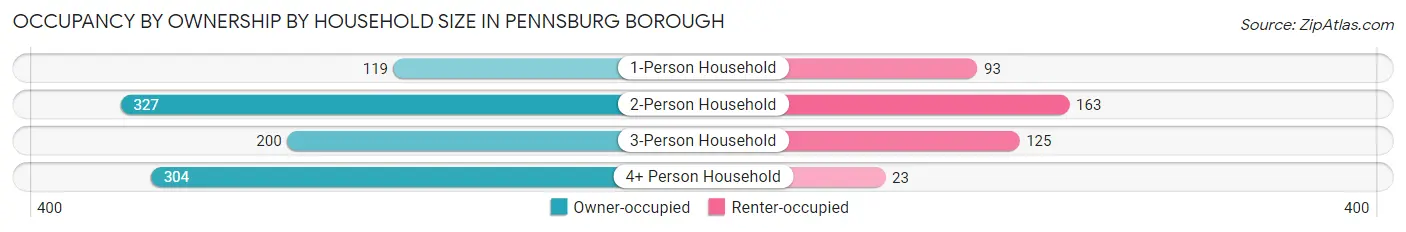
| Household Size | Owner-occupied | Renter-occupied |
| 1-Person Household | 119 (56.1%) | 93 (43.9%) |
| 2-Person Household | 327 (66.7%) | 163 (33.3%) |
| 3-Person Household | 200 (61.5%) | 125 (38.5%) |
| 4+ Person Household | 304 (93.0%) | 23 (7.0%) |
| Total Housing Units | 950 (70.2%) | 404 (29.8%) |
Occupancy by Educational Attainment in Pennsburg borough
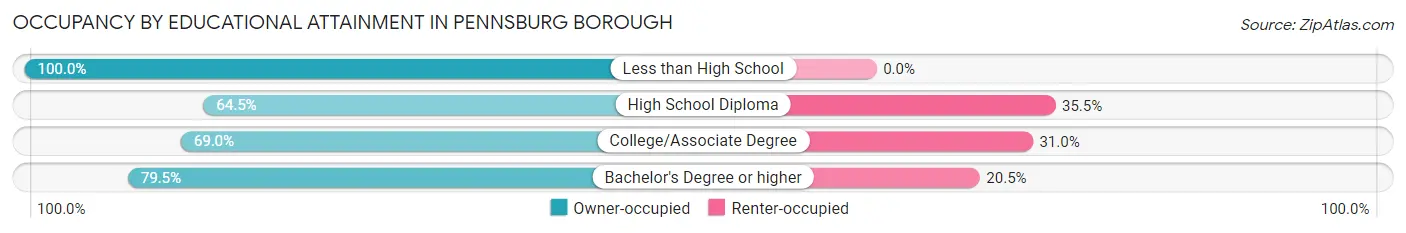
| Household Size | Owner-occupied | Renter-occupied |
| Less than High School | 50 (100.0%) | 0 (0.0%) |
| High School Diploma | 384 (64.5%) | 211 (35.5%) |
| College/Associate Degree | 314 (69.0%) | 141 (31.0%) |
| Bachelor's Degree or higher | 202 (79.5%) | 52 (20.5%) |
Occupancy by Age of Householder in Pennsburg borough
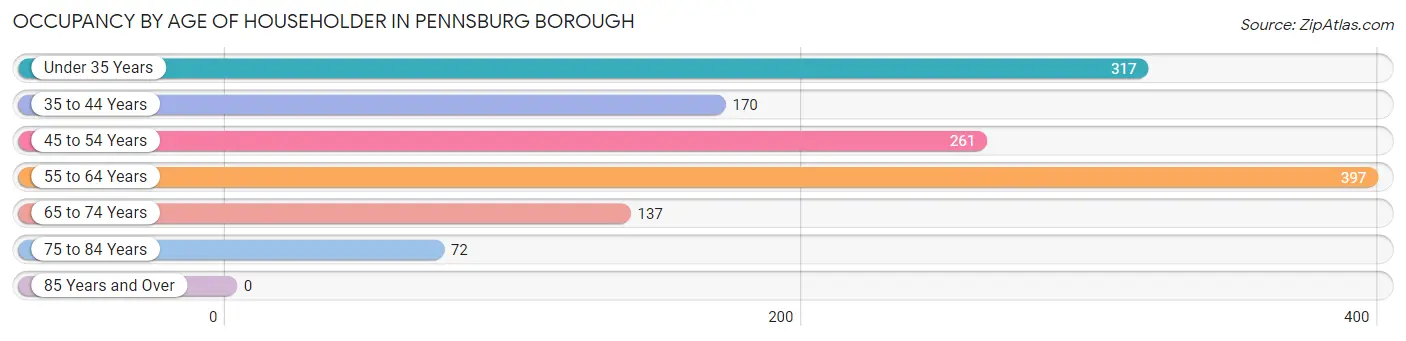
| Age Bracket | # Households | % Households |
| Under 35 Years | 317 | 23.4% |
| 35 to 44 Years | 170 | 12.6% |
| 45 to 54 Years | 261 | 19.3% |
| 55 to 64 Years | 397 | 29.3% |
| 65 to 74 Years | 137 | 10.1% |
| 75 to 84 Years | 72 | 5.3% |
| 85 Years and Over | 0 | 0.0% |
| Total | 1,354 | 100.0% |
Housing Finances in Pennsburg borough
Median Income by Occupancy in Pennsburg borough
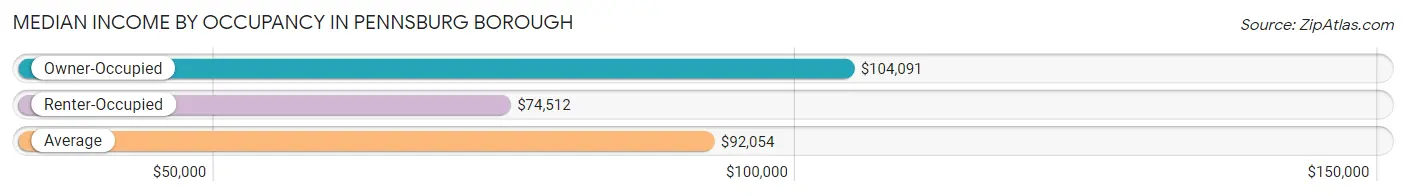
| Occupancy Type | # Households | Median Income |
| Owner-Occupied | 950 (70.2%) | $104,091 |
| Renter-Occupied | 404 (29.8%) | $74,512 |
| Average | 1,354 (100.0%) | $92,054 |
Occupancy by Householder Income Bracket in Pennsburg borough
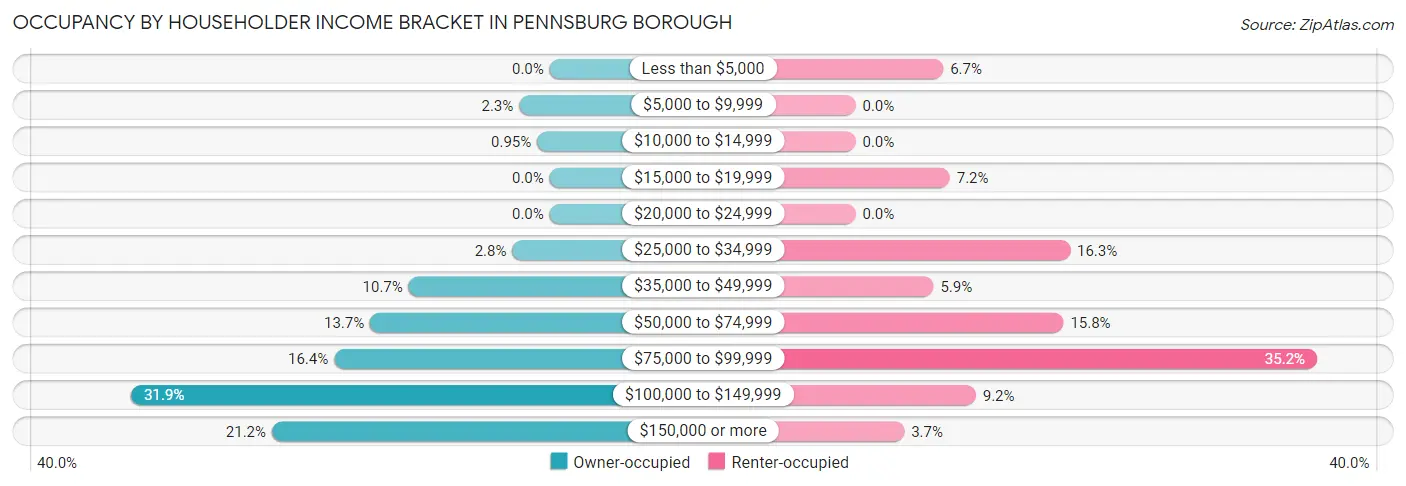
| Income Bracket | Owner-occupied | Renter-occupied |
| Less than $5,000 | 0 (0.0%) | 27 (6.7%) |
| $5,000 to $9,999 | 22 (2.3%) | 0 (0.0%) |
| $10,000 to $14,999 | 9 (0.9%) | 0 (0.0%) |
| $15,000 to $19,999 | 0 (0.0%) | 29 (7.2%) |
| $20,000 to $24,999 | 0 (0.0%) | 0 (0.0%) |
| $25,000 to $34,999 | 27 (2.8%) | 66 (16.3%) |
| $35,000 to $49,999 | 102 (10.7%) | 24 (5.9%) |
| $50,000 to $74,999 | 130 (13.7%) | 64 (15.8%) |
| $75,000 to $99,999 | 156 (16.4%) | 142 (35.1%) |
| $100,000 to $149,999 | 303 (31.9%) | 37 (9.2%) |
| $150,000 or more | 201 (21.2%) | 15 (3.7%) |
| Total | 950 (100.0%) | 404 (100.0%) |
Monthly Housing Cost Tiers in Pennsburg borough
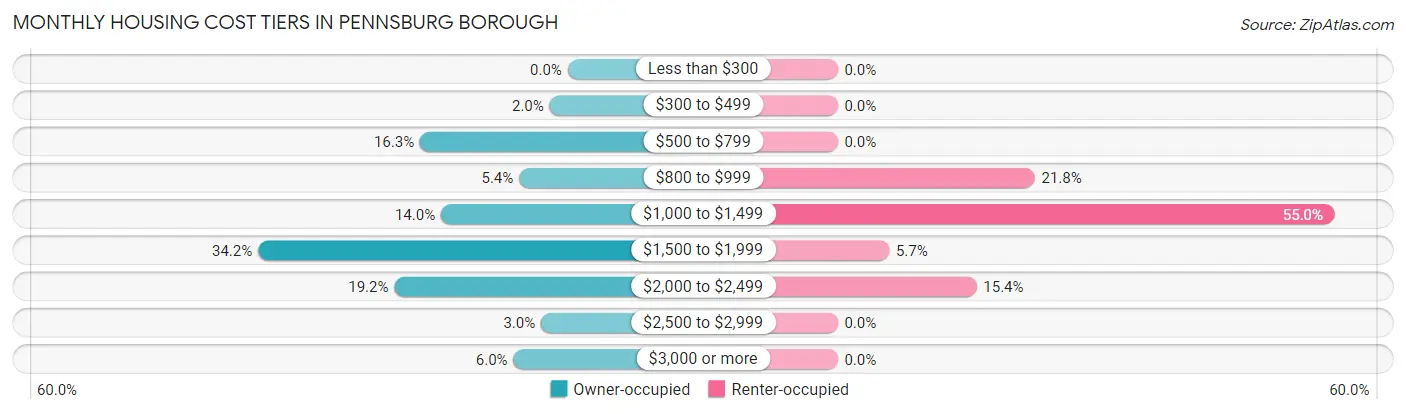
| Monthly Cost | Owner-occupied | Renter-occupied |
| Less than $300 | 0 (0.0%) | 0 (0.0%) |
| $300 to $499 | 19 (2.0%) | 0 (0.0%) |
| $500 to $799 | 155 (16.3%) | 0 (0.0%) |
| $800 to $999 | 51 (5.4%) | 88 (21.8%) |
| $1,000 to $1,499 | 133 (14.0%) | 222 (54.9%) |
| $1,500 to $1,999 | 325 (34.2%) | 23 (5.7%) |
| $2,000 to $2,499 | 182 (19.2%) | 62 (15.3%) |
| $2,500 to $2,999 | 28 (2.9%) | 0 (0.0%) |
| $3,000 or more | 57 (6.0%) | 0 (0.0%) |
| Total | 950 (100.0%) | 404 (100.0%) |
Physical Housing Characteristics in Pennsburg borough
Housing Structures in Pennsburg borough
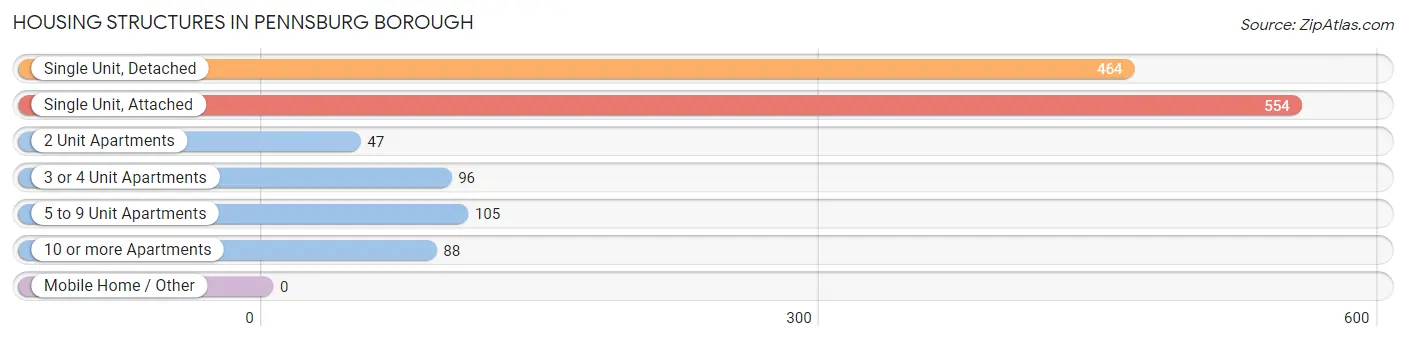
| Structure Type | # Housing Units | % Housing Units |
| Single Unit, Detached | 464 | 34.3% |
| Single Unit, Attached | 554 | 40.9% |
| 2 Unit Apartments | 47 | 3.5% |
| 3 or 4 Unit Apartments | 96 | 7.1% |
| 5 to 9 Unit Apartments | 105 | 7.7% |
| 10 or more Apartments | 88 | 6.5% |
| Mobile Home / Other | 0 | 0.0% |
| Total | 1,354 | 100.0% |
Housing Structures by Occupancy in Pennsburg borough
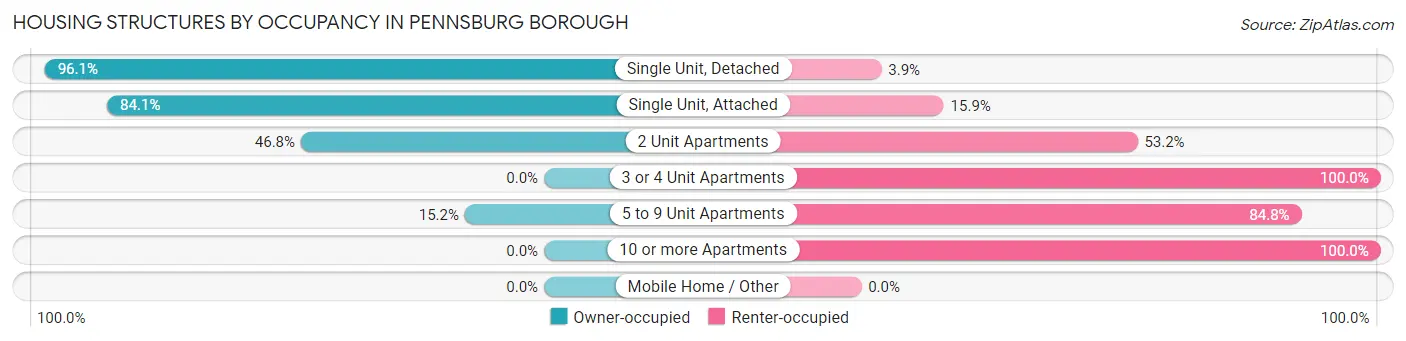
| Structure Type | Owner-occupied | Renter-occupied |
| Single Unit, Detached | 446 (96.1%) | 18 (3.9%) |
| Single Unit, Attached | 466 (84.1%) | 88 (15.9%) |
| 2 Unit Apartments | 22 (46.8%) | 25 (53.2%) |
| 3 or 4 Unit Apartments | 0 (0.0%) | 96 (100.0%) |
| 5 to 9 Unit Apartments | 16 (15.2%) | 89 (84.8%) |
| 10 or more Apartments | 0 (0.0%) | 88 (100.0%) |
| Mobile Home / Other | 0 (0.0%) | 0 (0.0%) |
| Total | 950 (70.2%) | 404 (29.8%) |
Housing Structures by Number of Rooms in Pennsburg borough
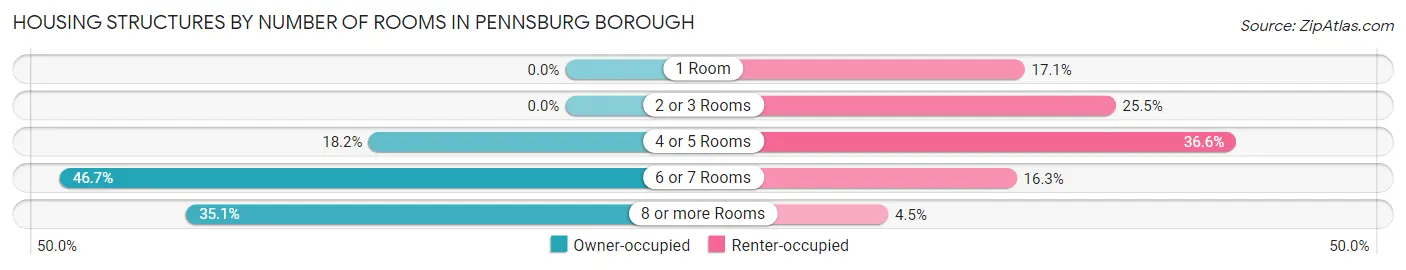
| Number of Rooms | Owner-occupied | Renter-occupied |
| 1 Room | 0 (0.0%) | 69 (17.1%) |
| 2 or 3 Rooms | 0 (0.0%) | 103 (25.5%) |
| 4 or 5 Rooms | 173 (18.2%) | 148 (36.6%) |
| 6 or 7 Rooms | 444 (46.7%) | 66 (16.3%) |
| 8 or more Rooms | 333 (35.0%) | 18 (4.5%) |
| Total | 950 (100.0%) | 404 (100.0%) |
Housing Structure by Heating Type in Pennsburg borough
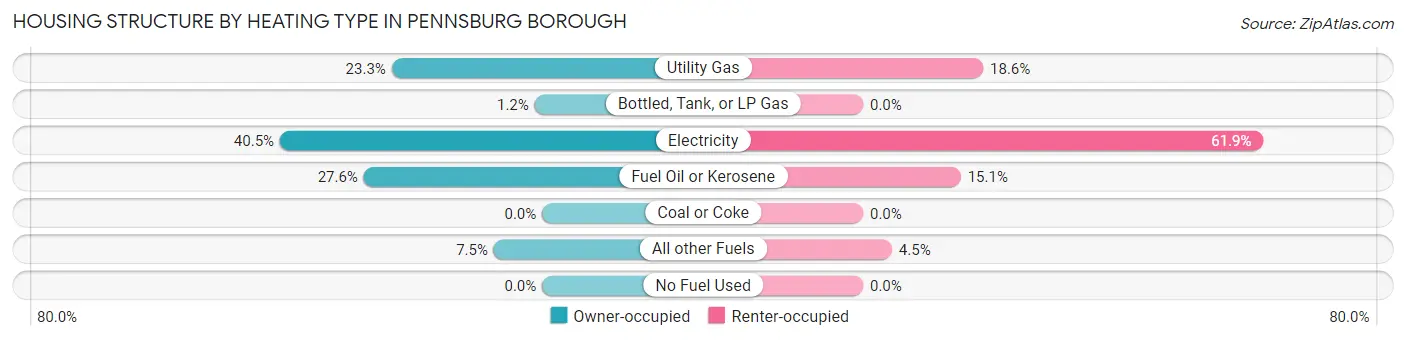
| Heating Type | Owner-occupied | Renter-occupied |
| Utility Gas | 221 (23.3%) | 75 (18.6%) |
| Bottled, Tank, or LP Gas | 11 (1.2%) | 0 (0.0%) |
| Electricity | 385 (40.5%) | 250 (61.9%) |
| Fuel Oil or Kerosene | 262 (27.6%) | 61 (15.1%) |
| Coal or Coke | 0 (0.0%) | 0 (0.0%) |
| All other Fuels | 71 (7.5%) | 18 (4.5%) |
| No Fuel Used | 0 (0.0%) | 0 (0.0%) |
| Total | 950 (100.0%) | 404 (100.0%) |
Household Vehicle Usage in Pennsburg borough
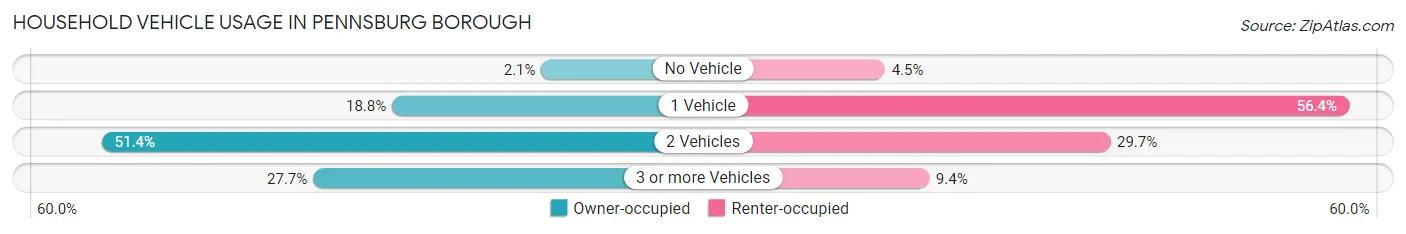
| Vehicles per Household | Owner-occupied | Renter-occupied |
| No Vehicle | 20 (2.1%) | 18 (4.5%) |
| 1 Vehicle | 179 (18.8%) | 228 (56.4%) |
| 2 Vehicles | 488 (51.4%) | 120 (29.7%) |
| 3 or more Vehicles | 263 (27.7%) | 38 (9.4%) |
| Total | 950 (100.0%) | 404 (100.0%) |
Real Estate & Mortgages in Pennsburg borough
Real Estate and Mortgage Overview in Pennsburg borough
| Characteristic | Without Mortgage | With Mortgage |
| Housing Units | 203 | 747 |
| Median Property Value | $257,800 | $253,000 |
| Median Household Income | $54,561 | $179 |
| Monthly Housing Costs | $692 | $57 |
| Real Estate Taxes | $4,509 | $0 |
Property Value by Mortgage Status in Pennsburg borough
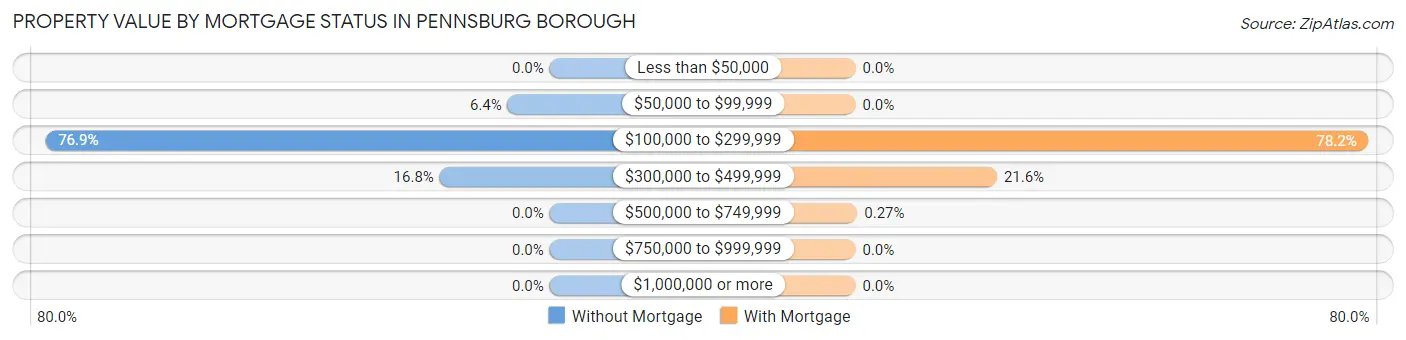
| Property Value | Without Mortgage | With Mortgage |
| Less than $50,000 | 0 (0.0%) | 0 (0.0%) |
| $50,000 to $99,999 | 13 (6.4%) | 0 (0.0%) |
| $100,000 to $299,999 | 156 (76.8%) | 584 (78.2%) |
| $300,000 to $499,999 | 34 (16.8%) | 161 (21.5%) |
| $500,000 to $749,999 | 0 (0.0%) | 2 (0.3%) |
| $750,000 to $999,999 | 0 (0.0%) | 0 (0.0%) |
| $1,000,000 or more | 0 (0.0%) | 0 (0.0%) |
| Total | 203 (100.0%) | 747 (100.0%) |
Household Income by Mortgage Status in Pennsburg borough
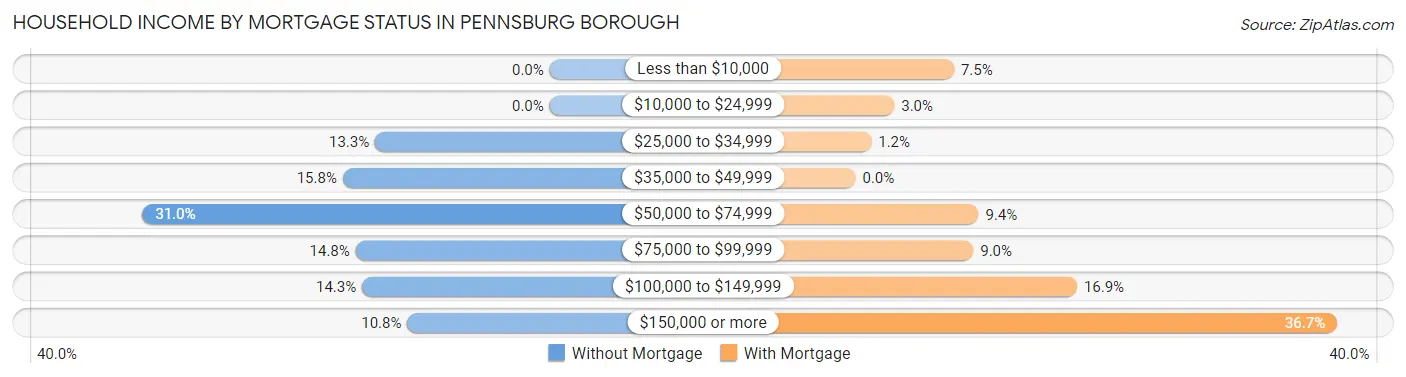
| Household Income | Without Mortgage | With Mortgage |
| Less than $10,000 | 0 (0.0%) | 56 (7.5%) |
| $10,000 to $24,999 | 0 (0.0%) | 22 (2.9%) |
| $25,000 to $34,999 | 27 (13.3%) | 9 (1.2%) |
| $35,000 to $49,999 | 32 (15.8%) | 0 (0.0%) |
| $50,000 to $74,999 | 63 (31.0%) | 70 (9.4%) |
| $75,000 to $99,999 | 30 (14.8%) | 67 (9.0%) |
| $100,000 to $149,999 | 29 (14.3%) | 126 (16.9%) |
| $150,000 or more | 22 (10.8%) | 274 (36.7%) |
| Total | 203 (100.0%) | 747 (100.0%) |
Property Value to Household Income Ratio in Pennsburg borough
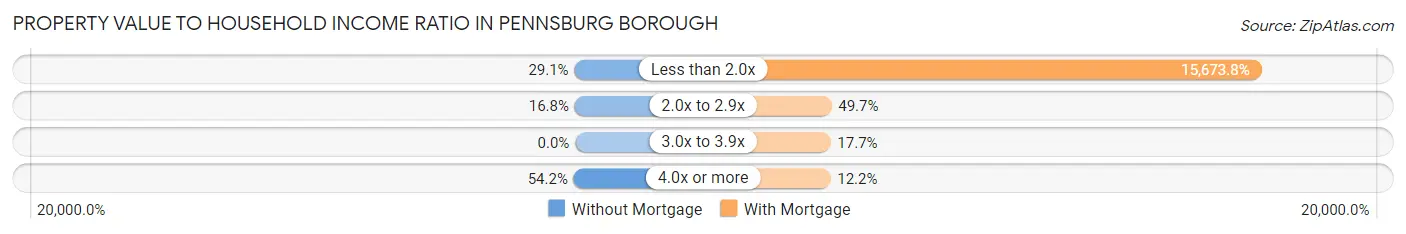
| Value-to-Income Ratio | Without Mortgage | With Mortgage |
| Less than 2.0x | 59 (29.1%) | 117,083 (15,673.8%) |
| 2.0x to 2.9x | 34 (16.8%) | 371 (49.7%) |
| 3.0x to 3.9x | 0 (0.0%) | 132 (17.7%) |
| 4.0x or more | 110 (54.2%) | 91 (12.2%) |
| Total | 203 (100.0%) | 747 (100.0%) |
Real Estate Taxes by Mortgage Status in Pennsburg borough
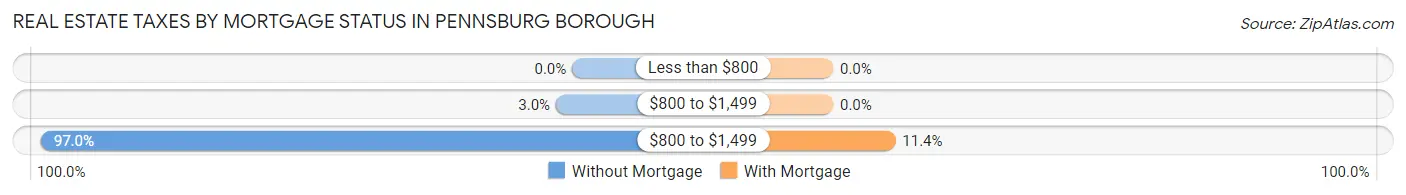
| Property Taxes | Without Mortgage | With Mortgage |
| Less than $800 | 0 (0.0%) | 0 (0.0%) |
| $800 to $1,499 | 6 (3.0%) | 0 (0.0%) |
| $800 to $1,499 | 197 (97.0%) | 85 (11.4%) |
| Total | 203 (100.0%) | 747 (100.0%) |
Health & Disability in Pennsburg borough
Health Insurance Coverage by Age in Pennsburg borough
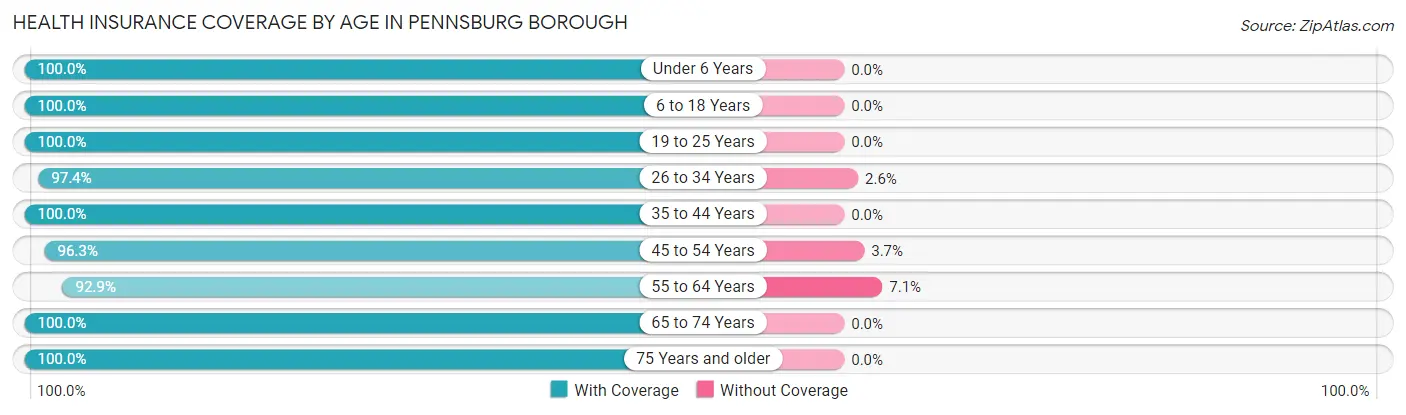
| Age Bracket | With Coverage | Without Coverage |
| Under 6 Years | 296 (100.0%) | 0 (0.0%) |
| 6 to 18 Years | 586 (100.0%) | 0 (0.0%) |
| 19 to 25 Years | 440 (100.0%) | 0 (0.0%) |
| 26 to 34 Years | 531 (97.4%) | 14 (2.6%) |
| 35 to 44 Years | 366 (100.0%) | 0 (0.0%) |
| 45 to 54 Years | 465 (96.3%) | 18 (3.7%) |
| 55 to 64 Years | 668 (92.9%) | 51 (7.1%) |
| 65 to 74 Years | 252 (100.0%) | 0 (0.0%) |
| 75 Years and older | 102 (100.0%) | 0 (0.0%) |
| Total | 3,706 (97.8%) | 83 (2.2%) |
Health Insurance Coverage by Citizenship Status in Pennsburg borough
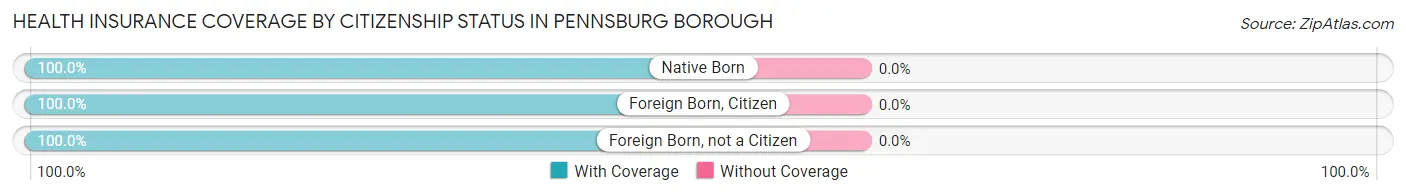
| Citizenship Status | With Coverage | Without Coverage |
| Native Born | 296 (100.0%) | 0 (0.0%) |
| Foreign Born, Citizen | 586 (100.0%) | 0 (0.0%) |
| Foreign Born, not a Citizen | 440 (100.0%) | 0 (0.0%) |
Health Insurance Coverage by Household Income in Pennsburg borough
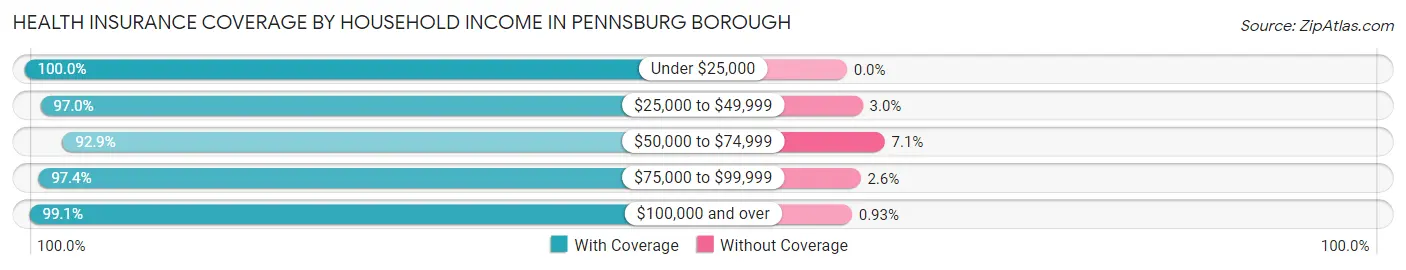
| Household Income | With Coverage | Without Coverage |
| Under $25,000 | 211 (100.0%) | 0 (0.0%) |
| $25,000 to $49,999 | 558 (97.0%) | 17 (3.0%) |
| $50,000 to $74,999 | 420 (92.9%) | 32 (7.1%) |
| $75,000 to $99,999 | 686 (97.4%) | 18 (2.6%) |
| $100,000 and over | 1,703 (99.1%) | 16 (0.9%) |
Public vs Private Health Insurance Coverage by Age in Pennsburg borough
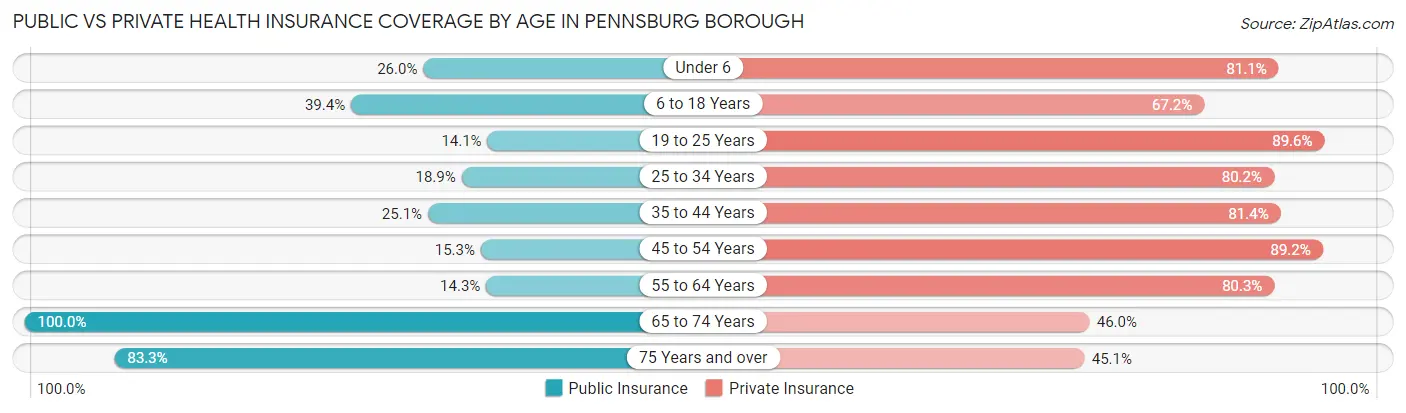
| Age Bracket | Public Insurance | Private Insurance |
| Under 6 | 77 (26.0%) | 240 (81.1%) |
| 6 to 18 Years | 231 (39.4%) | 394 (67.2%) |
| 19 to 25 Years | 62 (14.1%) | 394 (89.5%) |
| 25 to 34 Years | 103 (18.9%) | 437 (80.2%) |
| 35 to 44 Years | 92 (25.1%) | 298 (81.4%) |
| 45 to 54 Years | 74 (15.3%) | 431 (89.2%) |
| 55 to 64 Years | 103 (14.3%) | 577 (80.2%) |
| 65 to 74 Years | 252 (100.0%) | 116 (46.0%) |
| 75 Years and over | 85 (83.3%) | 46 (45.1%) |
| Total | 1,079 (28.5%) | 2,933 (77.4%) |
Disability Status by Sex by Age in Pennsburg borough
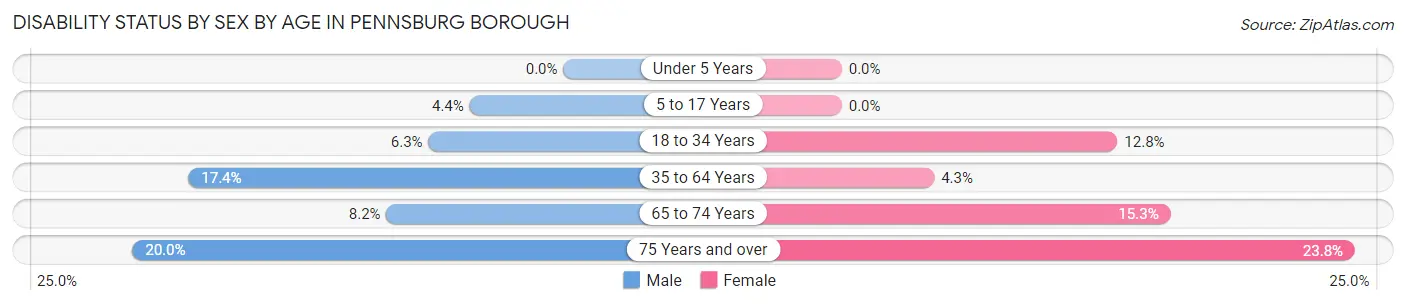
| Age Bracket | Male | Female |
| Under 5 Years | 0 (0.0%) | 0 (0.0%) |
| 5 to 17 Years | 11 (4.3%) | 0 (0.0%) |
| 18 to 34 Years | 31 (6.3%) | 76 (12.8%) |
| 35 to 64 Years | 147 (17.4%) | 31 (4.3%) |
| 65 to 74 Years | 11 (8.2%) | 18 (15.2%) |
| 75 Years and over | 12 (20.0%) | 10 (23.8%) |
Disability Class by Sex by Age in Pennsburg borough
Disability Class: Hearing Difficulty
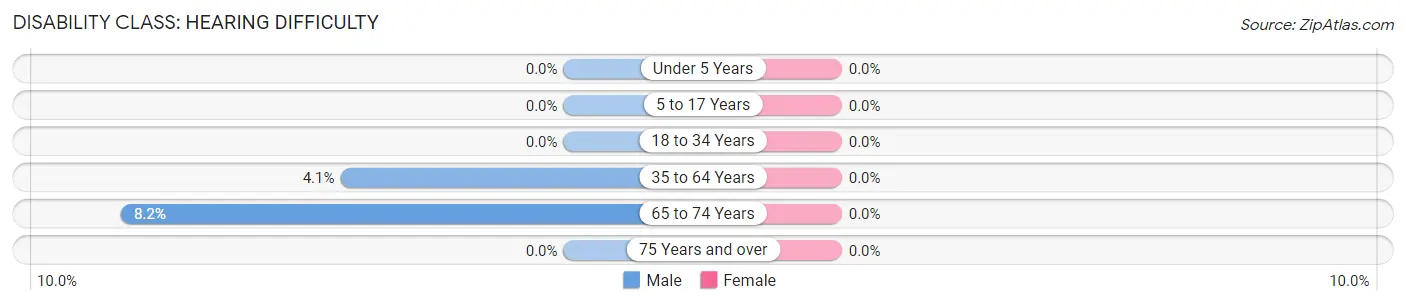
| Age Bracket | Male | Female |
| Under 5 Years | 0 (0.0%) | 0 (0.0%) |
| 5 to 17 Years | 0 (0.0%) | 0 (0.0%) |
| 18 to 34 Years | 0 (0.0%) | 0 (0.0%) |
| 35 to 64 Years | 35 (4.1%) | 0 (0.0%) |
| 65 to 74 Years | 11 (8.2%) | 0 (0.0%) |
| 75 Years and over | 0 (0.0%) | 0 (0.0%) |
Disability Class: Vision Difficulty
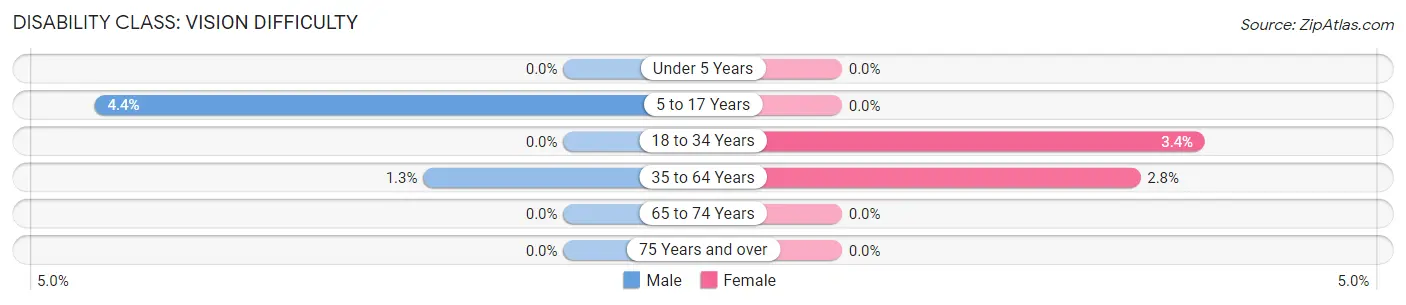
| Age Bracket | Male | Female |
| Under 5 Years | 0 (0.0%) | 0 (0.0%) |
| 5 to 17 Years | 11 (4.3%) | 0 (0.0%) |
| 18 to 34 Years | 0 (0.0%) | 20 (3.4%) |
| 35 to 64 Years | 11 (1.3%) | 20 (2.8%) |
| 65 to 74 Years | 0 (0.0%) | 0 (0.0%) |
| 75 Years and over | 0 (0.0%) | 0 (0.0%) |
Disability Class: Cognitive Difficulty
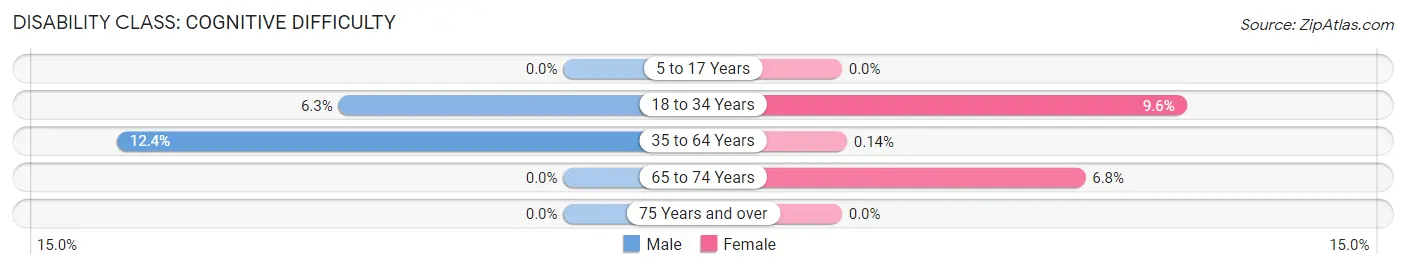
| Age Bracket | Male | Female |
| 5 to 17 Years | 0 (0.0%) | 0 (0.0%) |
| 18 to 34 Years | 31 (6.3%) | 57 (9.6%) |
| 35 to 64 Years | 105 (12.4%) | 1 (0.1%) |
| 65 to 74 Years | 0 (0.0%) | 8 (6.8%) |
| 75 Years and over | 0 (0.0%) | 0 (0.0%) |
Disability Class: Ambulatory Difficulty
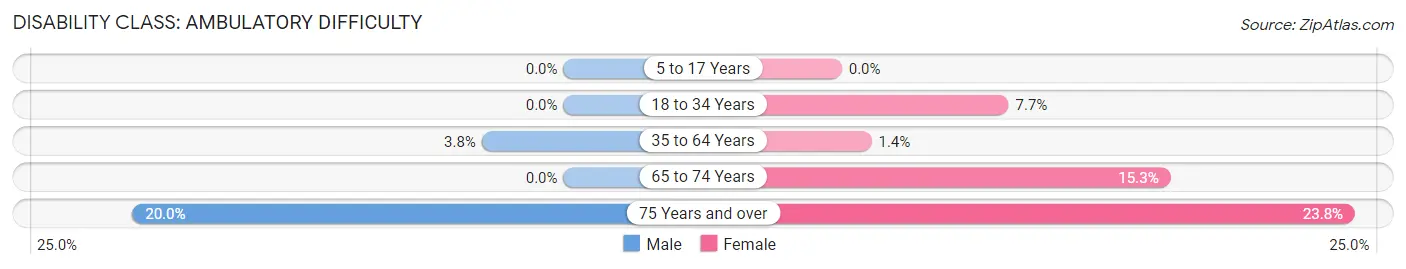
| Age Bracket | Male | Female |
| 5 to 17 Years | 0 (0.0%) | 0 (0.0%) |
| 18 to 34 Years | 0 (0.0%) | 46 (7.7%) |
| 35 to 64 Years | 32 (3.8%) | 10 (1.4%) |
| 65 to 74 Years | 0 (0.0%) | 18 (15.2%) |
| 75 Years and over | 12 (20.0%) | 10 (23.8%) |
Disability Class: Self-Care Difficulty
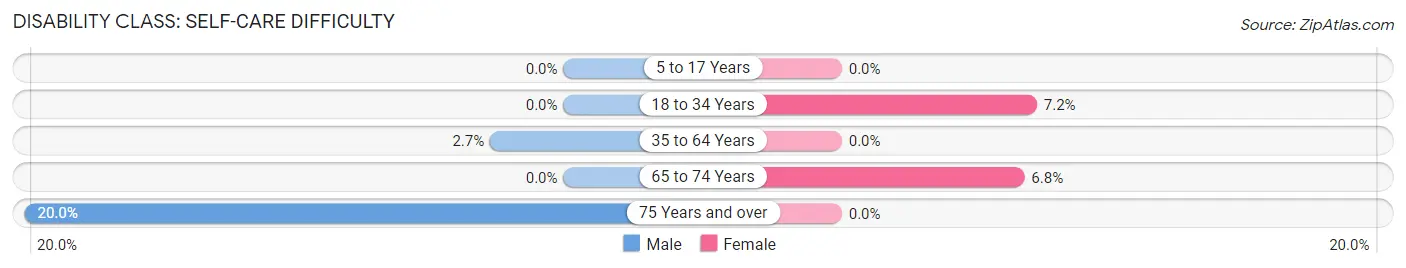
| Age Bracket | Male | Female |
| 5 to 17 Years | 0 (0.0%) | 0 (0.0%) |
| 18 to 34 Years | 0 (0.0%) | 43 (7.2%) |
| 35 to 64 Years | 23 (2.7%) | 0 (0.0%) |
| 65 to 74 Years | 0 (0.0%) | 8 (6.8%) |
| 75 Years and over | 12 (20.0%) | 0 (0.0%) |
Technology Access in Pennsburg borough
Computing Device Access in Pennsburg borough
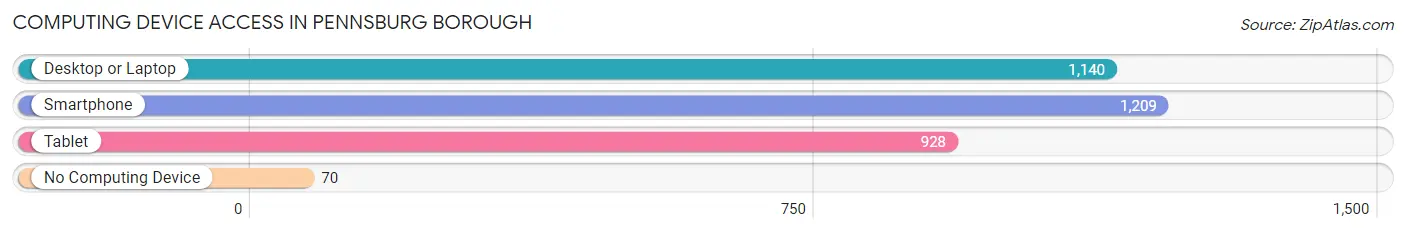
| Device Type | # Households | % Households |
| Desktop or Laptop | 1,140 | 84.2% |
| Smartphone | 1,209 | 89.3% |
| Tablet | 928 | 68.5% |
| No Computing Device | 70 | 5.2% |
| Total | 1,354 | 100.0% |
Internet Access in Pennsburg borough
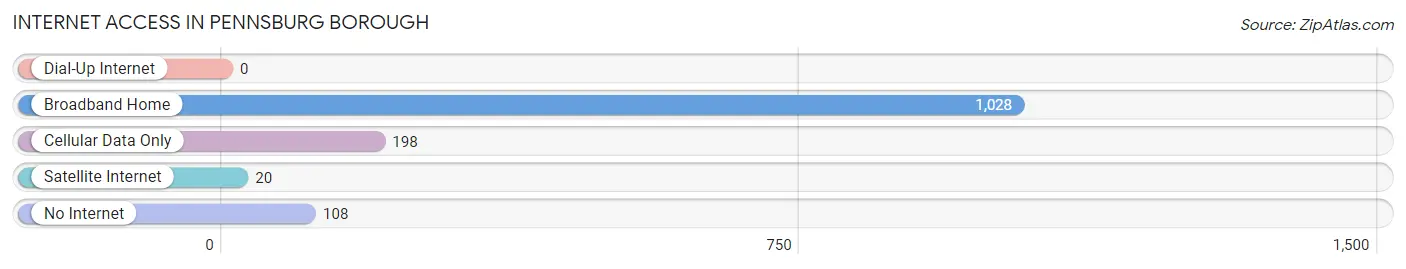
| Internet Type | # Households | % Households |
| Dial-Up Internet | 0 | 0.0% |
| Broadband Home | 1,028 | 75.9% |
| Cellular Data Only | 198 | 14.6% |
| Satellite Internet | 20 | 1.5% |
| No Internet | 108 | 8.0% |
| Total | 1,354 | 100.0% |
Pennsburg borough Summary
Pennsburg Borough is a small borough located in Montgomery County, Pennsylvania. It is situated in the Upper Perkiomen Valley, approximately 30 miles northwest of Philadelphia. The borough is part of the Upper Perkiomen School District and is home to approximately 2,500 people.
History
Pennsburg Borough was founded in 1725 by a group of German settlers led by Johann Peter Schumacher. The settlers purchased the land from the Penn family, who had originally acquired it from William Penn. The town was originally known as Schumacherstown, but was later renamed Pennsburg in honor of the Penn family.
The town grew slowly over the years, and by the mid-1800s, it had become a thriving agricultural community. The town was home to several mills, including a grist mill, a saw mill, and a paper mill. The town also had a blacksmith, a tannery, and a general store.
In the late 1800s, the town began to experience a period of growth and development. The railroad arrived in 1871, and the town was connected to Philadelphia and other major cities. This allowed for increased trade and commerce, and the town began to grow.
In the early 1900s, the town experienced a period of industrialization. Several factories were built, including a silk mill, a shirt factory, and a shoe factory. These factories provided employment for many of the town’s residents.
In the 1950s, the town began to experience a period of decline. Many of the factories closed, and the population began to decline. In the late 1970s, the town began to experience a period of revitalization. Several new businesses opened, and the population began to increase.
Geography
Pennsburg Borough is located in the Upper Perkiomen Valley, approximately 30 miles northwest of Philadelphia. The borough is situated on the banks of the Perkiomen Creek, and is surrounded by rolling hills and farmland. The borough covers an area of 1.2 square miles, and is home to approximately 2,500 people.
The borough is located in the humid continental climate zone, and experiences four distinct seasons. Summers are typically hot and humid, while winters are cold and snowy. The average annual temperature is around 50 degrees Fahrenheit, and the average annual precipitation is around 40 inches.
Economy
The economy of Pennsburg Borough is largely based on agriculture and manufacturing. The town is home to several farms, which produce a variety of crops, including corn, soybeans, and hay. The town is also home to several factories, which produce a variety of products, including clothing, furniture, and electronics.
The town is also home to several small businesses, including restaurants, shops, and professional services. The town is also home to several banks, which provide financial services to the local community.
Demographics
As of the 2010 census, the population of Pennsburg Borough was 2,521. The racial makeup of the borough was 94.3% White, 2.2% African American, 0.3% Native American, 0.7% Asian, 0.1% Pacific Islander, and 2.4% from other races. Hispanic or Latino of any race were 2.7% of the population.
The median household income in Pennsburg Borough was $50,938, and the median family income was $60,938. The per capita income was $25,938. About 5.3% of families and 6.7% of the population were below the poverty line, including 8.3% of those under age 18 and 4.2% of those age 65 or over.
Common Questions
What is Per Capita Income in Pennsburg borough?
Per Capita income in Pennsburg borough is $34,529.
What is the Median Family Income in Pennsburg borough?
Median Family Income in Pennsburg borough is $98,426.
What is the Median Household income in Pennsburg borough?
Median Household Income in Pennsburg borough is $92,054.
What is Income or Wage Gap in Pennsburg borough?
Income or Wage Gap in Pennsburg borough is 39.1%.
Women in Pennsburg borough earn 60.9 cents for every dollar earned by a man.
What is Inequality or Gini Index in Pennsburg borough?
Inequality or Gini Index in Pennsburg borough is 0.31.
What is the Total Population of Pennsburg borough?
Total Population of Pennsburg borough is 3,915.
What is the Total Male Population of Pennsburg borough?
Total Male Population of Pennsburg borough is 1,921.
What is the Total Female Population of Pennsburg borough?
Total Female Population of Pennsburg borough is 1,994.
What is the Ratio of Males per 100 Females in Pennsburg borough?
There are 96.34 Males per 100 Females in Pennsburg borough.
What is the Ratio of Females per 100 Males in Pennsburg borough?
There are 103.80 Females per 100 Males in Pennsburg borough.
What is the Median Population Age in Pennsburg borough?
Median Population Age in Pennsburg borough is 37.4 Years.
What is the Average Family Size in Pennsburg borough
Average Family Size in Pennsburg borough is 3.0 People.
What is the Average Household Size in Pennsburg borough
Average Household Size in Pennsburg borough is 2.7 People.
How Large is the Labor Force in Pennsburg borough?
There are 2,324 People in the Labor Forcein in Pennsburg borough.
What is the Percentage of People in the Labor Force in Pennsburg borough?
72.9% of People are in the Labor Force in Pennsburg borough.
What is the Unemployment Rate in Pennsburg borough?
Unemployment Rate in Pennsburg borough is 1.3%.