Beaverdale, PA Map & Demographics
Beaverdale Map
Beaverdale Overview
$31,604
PER CAPITA INCOME
$58,500
AVG FAMILY INCOME
$40,909
AVG HOUSEHOLD INCOME
39.0%
WAGE / INCOME GAP [ % ]
61.0¢/ $1
WAGE / INCOME GAP [ $ ]
0.38
INEQUALITY / GINI INDEX
650
TOTAL POPULATION
258
MALE POPULATION
392
FEMALE POPULATION
65.82
MALES / 100 FEMALES
151.94
FEMALES / 100 MALES
64.0
MEDIAN AGE
2.9
AVG FAMILY SIZE
1.9
AVG HOUSEHOLD SIZE
271
LABOR FORCE [ PEOPLE ]
46.5%
PERCENT IN LABOR FORCE
1.5%
UNEMPLOYMENT RATE
Beaverdale Zip Codes
Beaverdale Area Codes
Income in Beaverdale
Income Overview in Beaverdale
Per Capita Income in Beaverdale is $31,604, while median incomes of families and households are $58,500 and $40,909 respectively.
| Characteristic | Number | Measure |
| Per Capita Income | 650 | $31,604 |
| Median Family Income | 150 | $58,500 |
| Mean Family Income | 150 | $77,657 |
| Median Household Income | 346 | $40,909 |
| Mean Household Income | 346 | $51,565 |
| Income Deficit | 150 | $0 |
| Wage / Income Gap (%) | 650 | 39.03% |
| Wage / Income Gap ($) | 650 | 60.97¢ per $1 |
| Gini / Inequality Index | 650 | 0.38 |
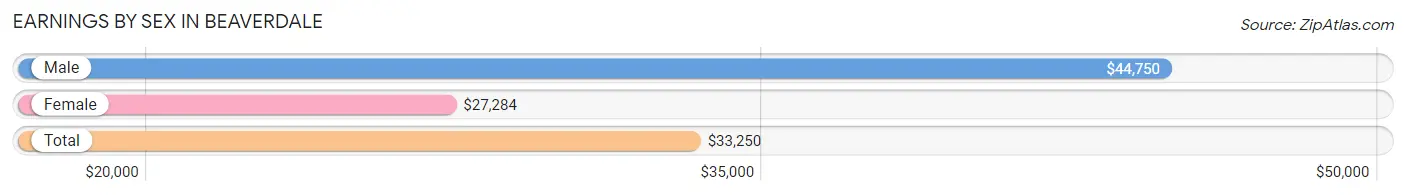
Earnings by Sex in Beaverdale
Average Earnings in Beaverdale are $33,250, $44,750 for men and $27,284 for women, a difference of 39.0%.
| Sex | Number | Average Earnings |
| Male | 93 (33.9%) | $44,750 |
| Female | 181 (66.1%) | $27,284 |
| Total | 274 (100.0%) | $33,250 |
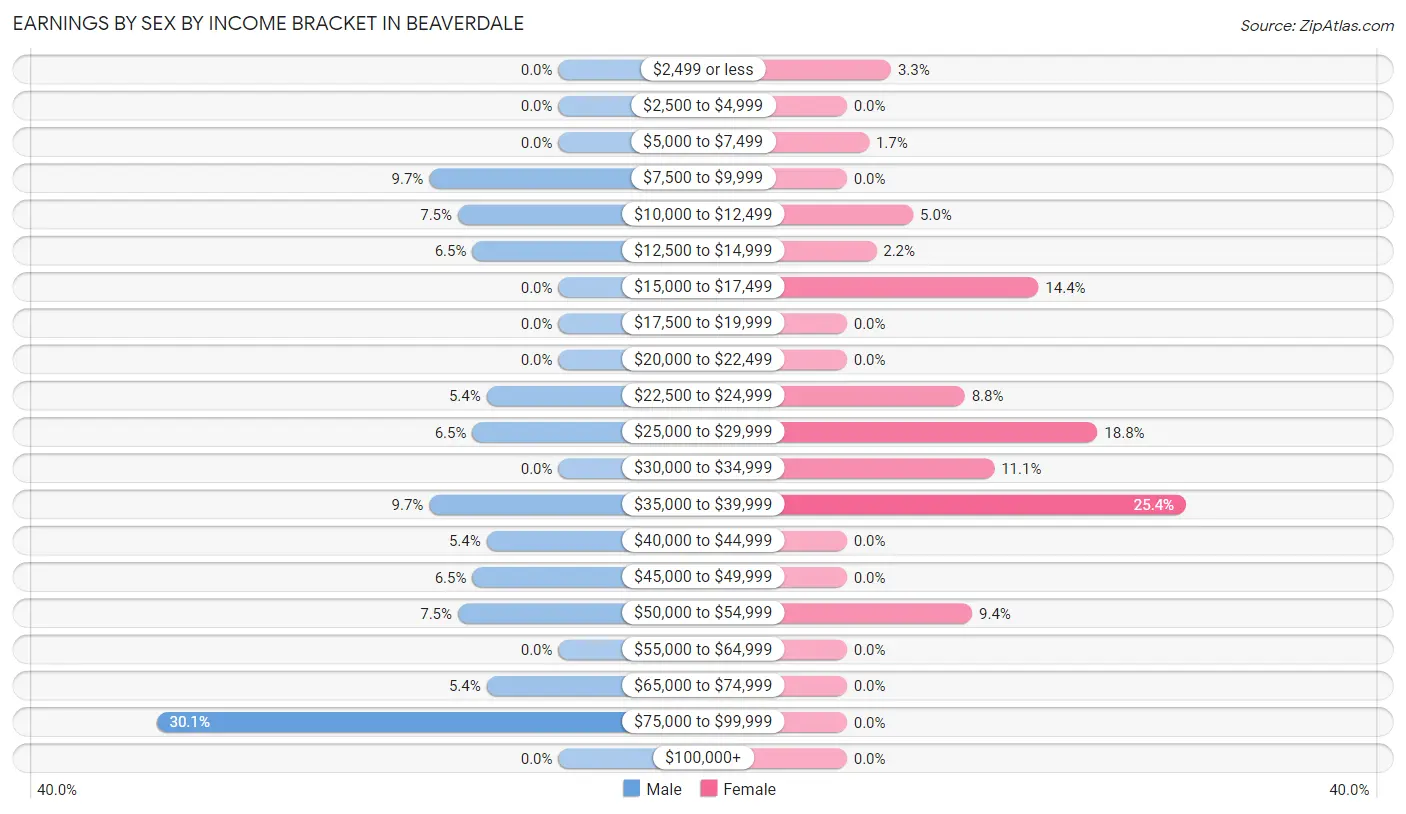
Earnings by Sex by Income Bracket in Beaverdale
The most common earnings brackets in Beaverdale are $75,000 to $99,999 for men (28 | 30.1%) and $35,000 to $39,999 for women (46 | 25.4%).
| Income | Male | Female |
| $2,499 or less | 0 (0.0%) | 6 (3.3%) |
| $2,500 to $4,999 | 0 (0.0%) | 0 (0.0%) |
| $5,000 to $7,499 | 0 (0.0%) | 3 (1.7%) |
| $7,500 to $9,999 | 9 (9.7%) | 0 (0.0%) |
| $10,000 to $12,499 | 7 (7.5%) | 9 (5.0%) |
| $12,500 to $14,999 | 6 (6.5%) | 4 (2.2%) |
| $15,000 to $17,499 | 0 (0.0%) | 26 (14.4%) |
| $17,500 to $19,999 | 0 (0.0%) | 0 (0.0%) |
| $20,000 to $22,499 | 0 (0.0%) | 0 (0.0%) |
| $22,500 to $24,999 | 5 (5.4%) | 16 (8.8%) |
| $25,000 to $29,999 | 6 (6.5%) | 34 (18.8%) |
| $30,000 to $34,999 | 0 (0.0%) | 20 (11.1%) |
| $35,000 to $39,999 | 9 (9.7%) | 46 (25.4%) |
| $40,000 to $44,999 | 5 (5.4%) | 0 (0.0%) |
| $45,000 to $49,999 | 6 (6.5%) | 0 (0.0%) |
| $50,000 to $54,999 | 7 (7.5%) | 17 (9.4%) |
| $55,000 to $64,999 | 0 (0.0%) | 0 (0.0%) |
| $65,000 to $74,999 | 5 (5.4%) | 0 (0.0%) |
| $75,000 to $99,999 | 28 (30.1%) | 0 (0.0%) |
| $100,000+ | 0 (0.0%) | 0 (0.0%) |
| Total | 93 (100.0%) | 181 (100.0%) |
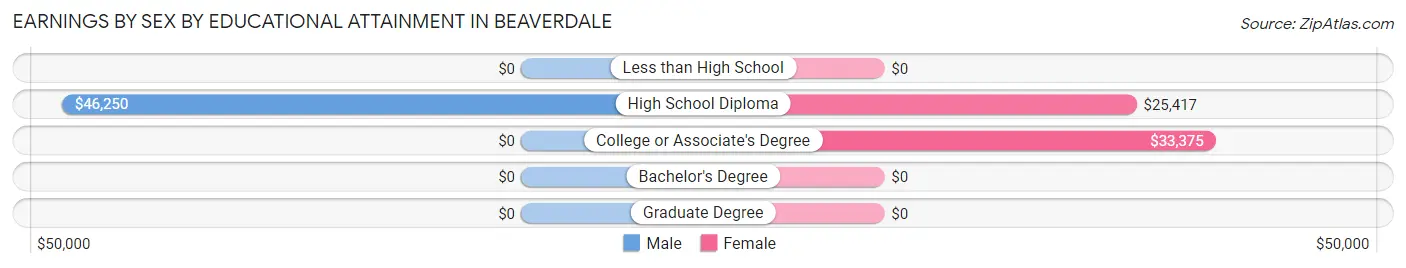
Earnings by Sex by Educational Attainment in Beaverdale
Average earnings in Beaverdale are $49,792 for men and $28,000 for women, a difference of 43.8%. Men with an educational attainment of high school diploma enjoy the highest average annual earnings of $46,250, while those with high school diploma education earn the least with $46,250. Women with an educational attainment of college or associate's degree earn the most with the average annual earnings of $33,375, while those with high school diploma education have the smallest earnings of $25,417.
| Educational Attainment | Male Income | Female Income |
| Less than High School | - | - |
| High School Diploma | $46,250 | $25,417 |
| College or Associate's Degree | - | - |
| Bachelor's Degree | - | - |
| Graduate Degree | - | - |
| Total | $49,792 | $28,000 |
Family Income in Beaverdale
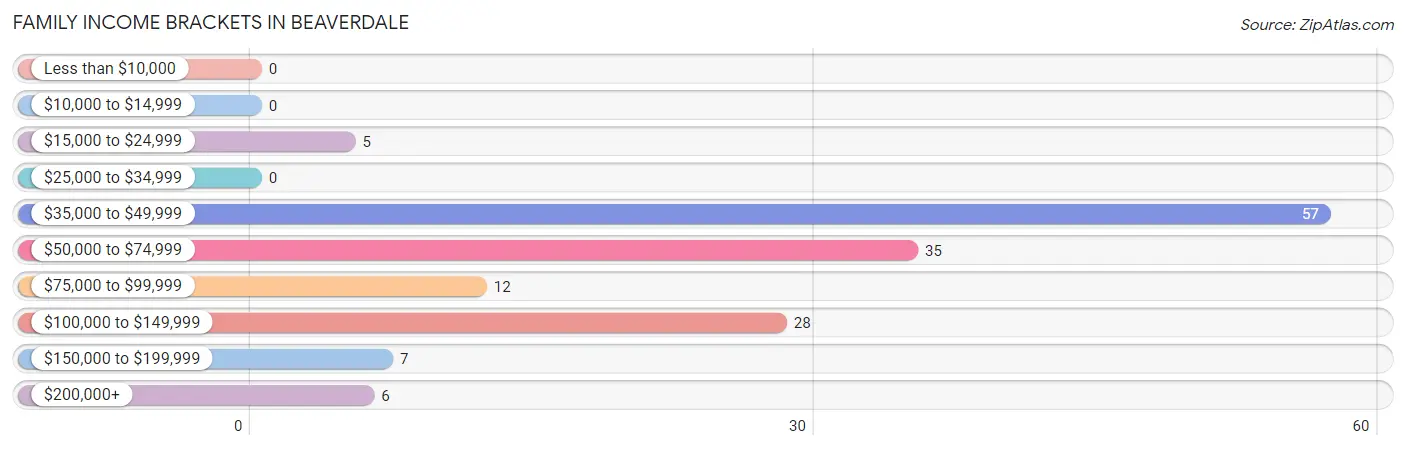
Family Income Brackets in Beaverdale
According to the Beaverdale family income data, there are 57 families falling into the $35,000 to $49,999 income range, which is the most common income bracket and makes up 38.0% of all families.
| Income Bracket | # Families | % Families |
| Less than $10,000 | 0 | 0.0% |
| $10,000 to $14,999 | 0 | 0.0% |
| $15,000 to $24,999 | 5 | 3.3% |
| $25,000 to $34,999 | 0 | 0.0% |
| $35,000 to $49,999 | 57 | 38.0% |
| $50,000 to $74,999 | 35 | 23.3% |
| $75,000 to $99,999 | 12 | 8.0% |
| $100,000 to $149,999 | 28 | 18.7% |
| $150,000 to $199,999 | 7 | 4.7% |
| $200,000+ | 6 | 4.0% |
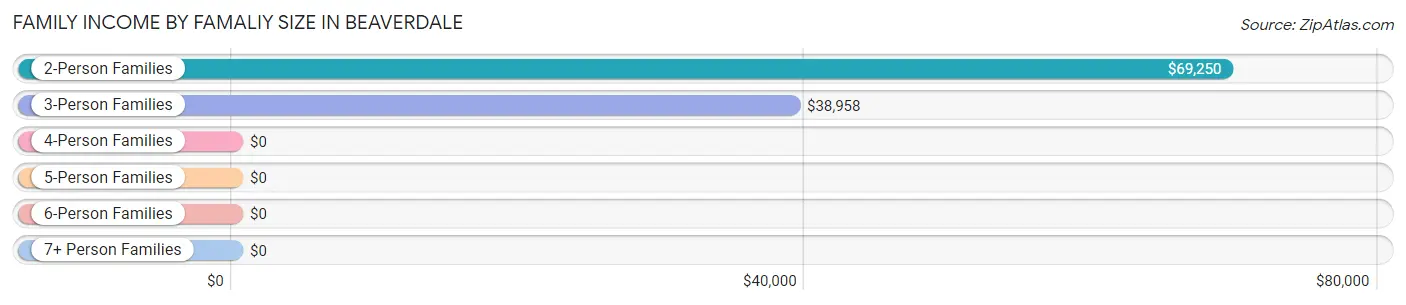
Family Income by Famaliy Size in Beaverdale
2-person families (103 | 68.7%) account for the highest median family income in Beaverdale with $69,250 per family, while 2-person families (103 | 68.7%) have the highest median income of $34,625 per family member.
| Income Bracket | # Families | Median Income |
| 2-Person Families | 103 (68.7%) | $69,250 |
| 3-Person Families | 31 (20.7%) | $38,958 |
| 4-Person Families | 14 (9.3%) | $0 |
| 5-Person Families | 0 (0.0%) | $0 |
| 6-Person Families | 0 (0.0%) | $0 |
| 7+ Person Families | 2 (1.3%) | $0 |
| Total | 150 (100.0%) | $58,500 |
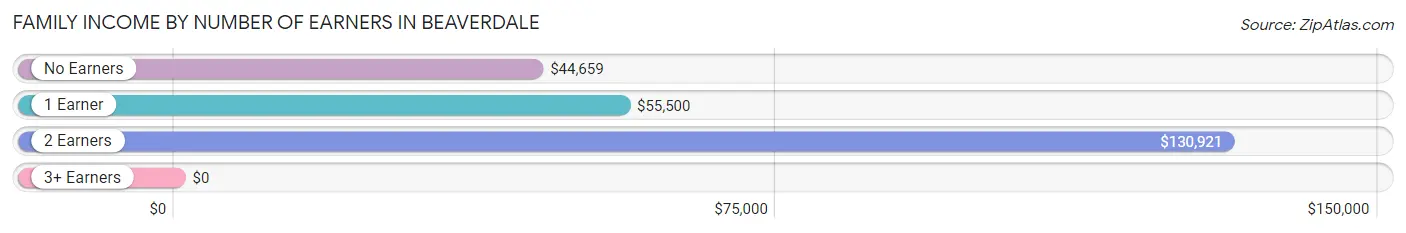
Family Income by Number of Earners in Beaverdale
| Number of Earners | # Families | Median Income |
| No Earners | 61 (40.7%) | $44,659 |
| 1 Earner | 38 (25.3%) | $55,500 |
| 2 Earners | 36 (24.0%) | $130,921 |
| 3+ Earners | 15 (10.0%) | $0 |
| Total | 150 (100.0%) | $58,500 |
Household Income in Beaverdale
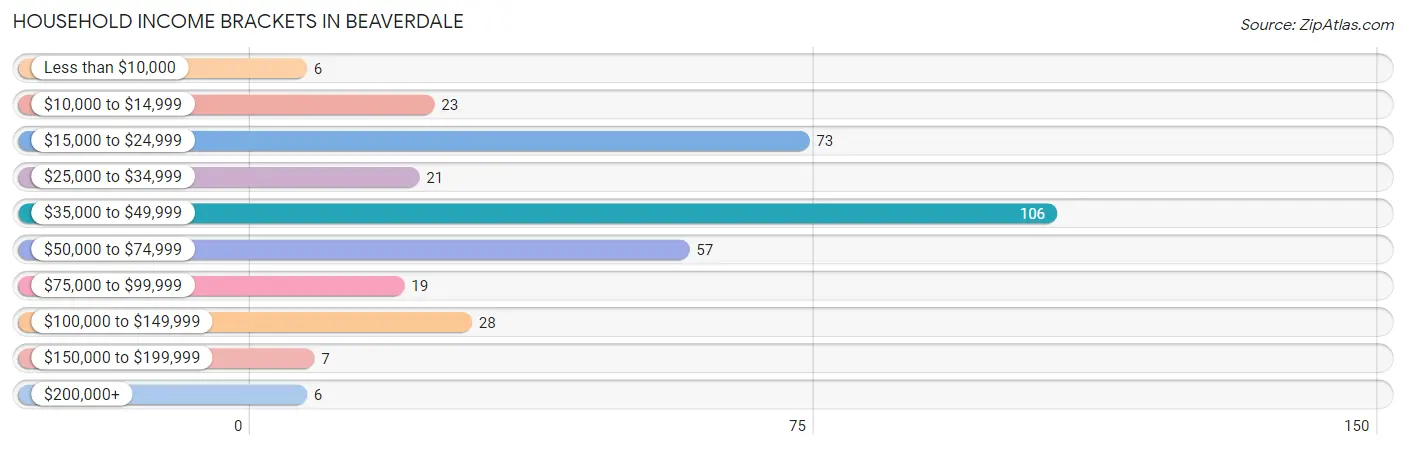
Household Income Brackets in Beaverdale
With 106 households falling in the category, the $35,000 to $49,999 income range is the most frequent in Beaverdale, accounting for 30.6% of all households. In contrast, only 6 households (1.7%) fall into the less than $10,000 income bracket, making it the least populous group.
| Income Bracket | # Households | % Households |
| Less than $10,000 | 6 | 1.7% |
| $10,000 to $14,999 | 23 | 6.6% |
| $15,000 to $24,999 | 73 | 21.1% |
| $25,000 to $34,999 | 21 | 6.1% |
| $35,000 to $49,999 | 106 | 30.6% |
| $50,000 to $74,999 | 57 | 16.5% |
| $75,000 to $99,999 | 19 | 5.5% |
| $100,000 to $149,999 | 28 | 8.1% |
| $150,000 to $199,999 | 7 | 2.0% |
| $200,000+ | 6 | 1.7% |
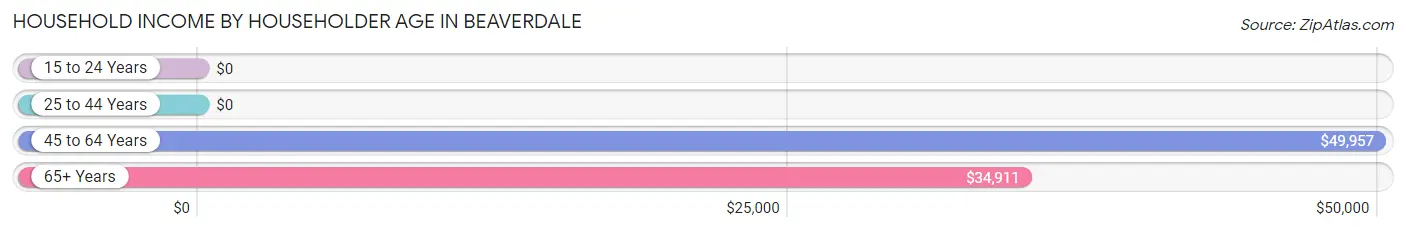
Household Income by Householder Age in Beaverdale
The median household income in Beaverdale is $40,909, with the highest median household income of $49,957 found in the 45 to 64 years age bracket for the primary householder. A total of 119 households (34.4%) fall into this category. Meanwhile, the 15 to 24 years age bracket for the primary householder has the lowest median household income of $0, with 6 households (1.7%) in this group.
| Income Bracket | # Households | Median Income |
| 15 to 24 Years | 6 (1.7%) | $0 |
| 25 to 44 Years | 22 (6.4%) | $0 |
| 45 to 64 Years | 119 (34.4%) | $49,957 |
| 65+ Years | 199 (57.5%) | $34,911 |
| Total | 346 (100.0%) | $40,909 |
Poverty in Beaverdale
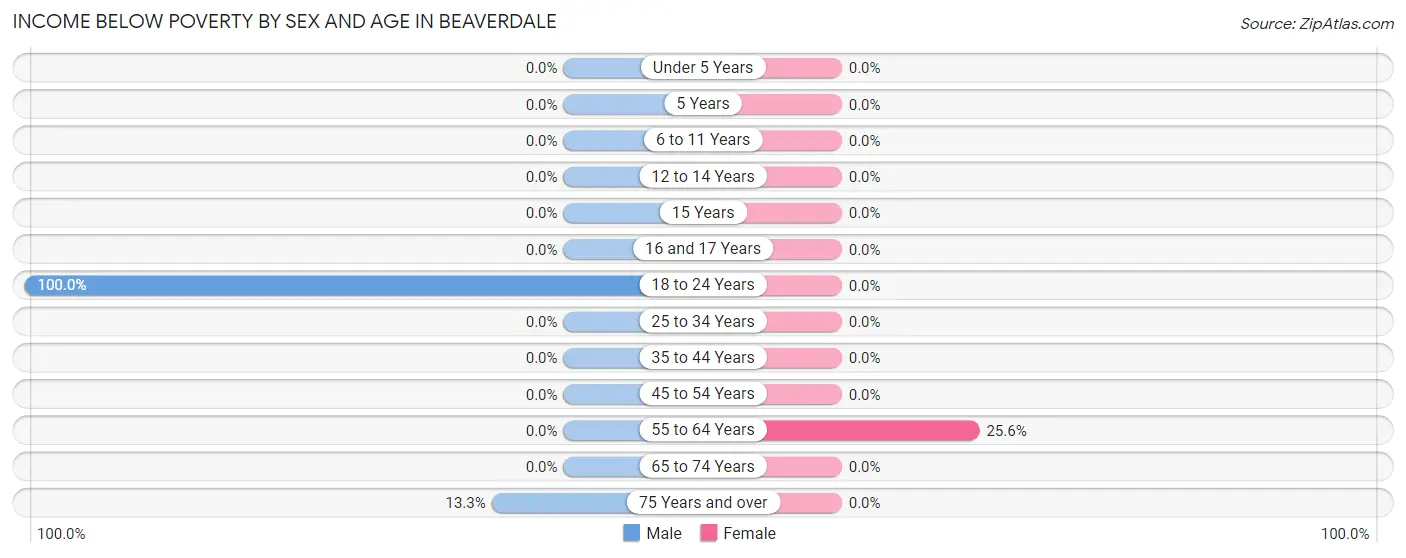
Income Below Poverty by Sex and Age in Beaverdale
With 4.8% poverty level for males and 5.9% for females among the residents of Beaverdale, 18 to 24 year old males and 55 to 64 year old females are the most vulnerable to poverty, with 6 males (100.0%) and 23 females (25.6%) in their respective age groups living below the poverty level.
| Age Bracket | Male | Female |
| Under 5 Years | 0 (0.0%) | 0 (0.0%) |
| 5 Years | 0 (0.0%) | 0 (0.0%) |
| 6 to 11 Years | 0 (0.0%) | 0 (0.0%) |
| 12 to 14 Years | 0 (0.0%) | 0 (0.0%) |
| 15 Years | 0 (0.0%) | 0 (0.0%) |
| 16 and 17 Years | 0 (0.0%) | 0 (0.0%) |
| 18 to 24 Years | 6 (100.0%) | 0 (0.0%) |
| 25 to 34 Years | 0 (0.0%) | 0 (0.0%) |
| 35 to 44 Years | 0 (0.0%) | 0 (0.0%) |
| 45 to 54 Years | 0 (0.0%) | 0 (0.0%) |
| 55 to 64 Years | 0 (0.0%) | 23 (25.6%) |
| 65 to 74 Years | 0 (0.0%) | 0 (0.0%) |
| 75 Years and over | 6 (13.3%) | 0 (0.0%) |
| Total | 12 (4.8%) | 23 (5.9%) |
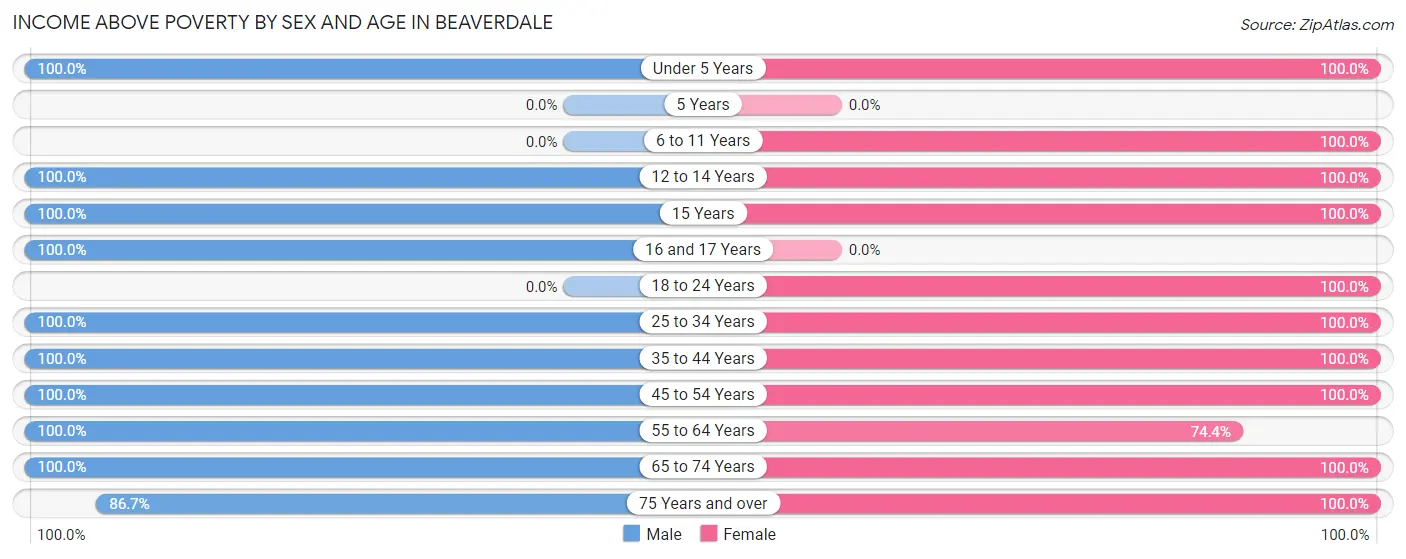
Income Above Poverty by Sex and Age in Beaverdale
According to the poverty statistics in Beaverdale, males aged under 5 years and females aged under 5 years are the age groups that are most secure financially, with 100.0% of males and 100.0% of females in these age groups living above the poverty line.
| Age Bracket | Male | Female |
| Under 5 Years | 3 (100.0%) | 3 (100.0%) |
| 5 Years | 0 (0.0%) | 0 (0.0%) |
| 6 to 11 Years | 0 (0.0%) | 9 (100.0%) |
| 12 to 14 Years | 17 (100.0%) | 4 (100.0%) |
| 15 Years | 19 (100.0%) | 6 (100.0%) |
| 16 and 17 Years | 6 (100.0%) | 0 (0.0%) |
| 18 to 24 Years | 0 (0.0%) | 7 (100.0%) |
| 25 to 34 Years | 1 (100.0%) | 7 (100.0%) |
| 35 to 44 Years | 9 (100.0%) | 24 (100.0%) |
| 45 to 54 Years | 22 (100.0%) | 80 (100.0%) |
| 55 to 64 Years | 44 (100.0%) | 67 (74.4%) |
| 65 to 74 Years | 80 (100.0%) | 73 (100.0%) |
| 75 Years and over | 39 (86.7%) | 89 (100.0%) |
| Total | 240 (95.2%) | 369 (94.1%) |
Income Below Poverty Among Married-Couple Families in Beaverdale
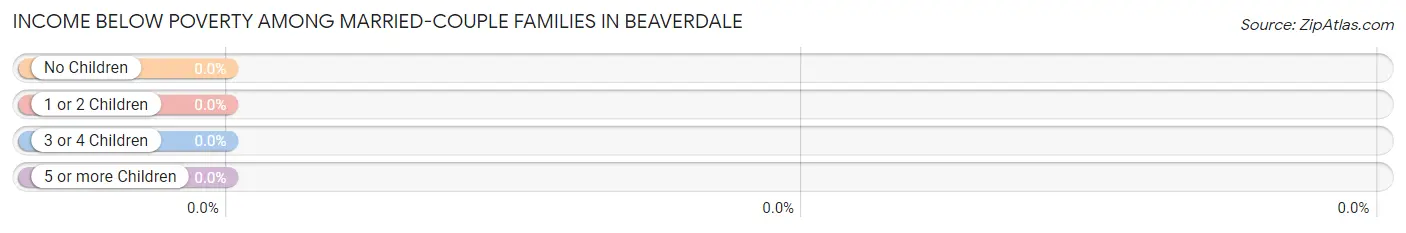
| Children | Above Poverty | Below Poverty |
| No Children | 106 (100.0%) | 0 (0.0%) |
| 1 or 2 Children | 16 (100.0%) | 0 (0.0%) |
| 3 or 4 Children | 0 (0.0%) | 0 (0.0%) |
| 5 or more Children | 0 (0.0%) | 0 (0.0%) |
| Total | 122 (100.0%) | 0 (0.0%) |
Income Below Poverty Among Single-Parent Households in Beaverdale
| Children | Single Father | Single Mother |
| No Children | 0 (0.0%) | 0 (0.0%) |
| 1 or 2 Children | 0 (0.0%) | 0 (0.0%) |
| 3 or 4 Children | 0 (0.0%) | 0 (0.0%) |
| 5 or more Children | 0 (0.0%) | 0 (0.0%) |
| Total | 0 (0.0%) | 0 (0.0%) |
Income Below Poverty Among Married-Couple vs Single-Parent Households in Beaverdale
| Children | Married-Couple Families | Single-Parent Households |
| No Children | 0 (0.0%) | 0 (0.0%) |
| 1 or 2 Children | 0 (0.0%) | 0 (0.0%) |
| 3 or 4 Children | 0 (0.0%) | 0 (0.0%) |
| 5 or more Children | 0 (0.0%) | 0 (0.0%) |
| Total | 0 (0.0%) | 0 (0.0%) |
Race in Beaverdale
The most populous races in Beaverdale are White / Caucasian (640 | 98.5%), Two or more Races (9 | 1.4%), and Hispanic or Latino (7 | 1.1%).
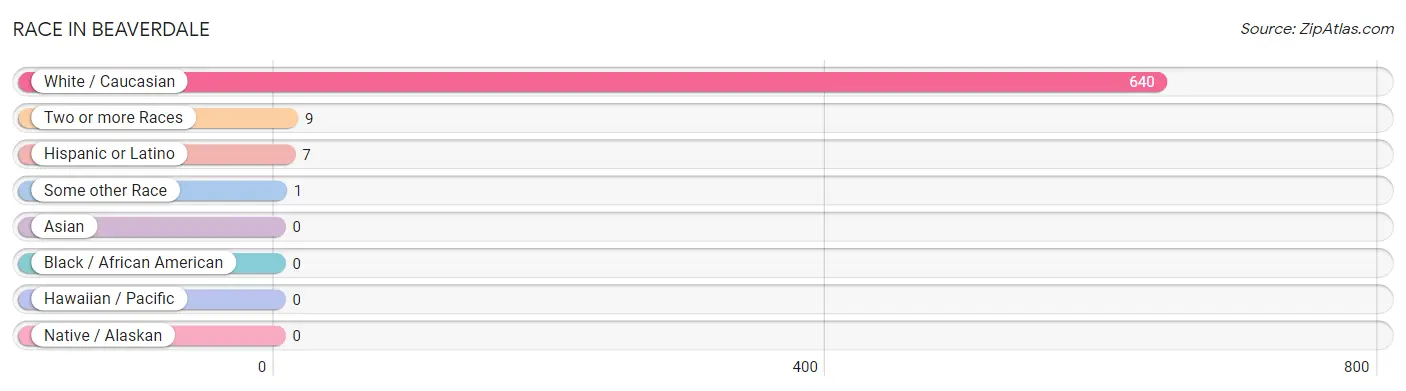
| Race | # Population | % Population |
| Asian | 0 | 0.0% |
| Black / African American | 0 | 0.0% |
| Hawaiian / Pacific | 0 | 0.0% |
| Hispanic or Latino | 7 | 1.1% |
| Native / Alaskan | 0 | 0.0% |
| White / Caucasian | 640 | 98.5% |
| Two or more Races | 9 | 1.4% |
| Some other Race | 1 | 0.2% |
| Total | 650 | 100.0% |
Ancestry in Beaverdale
The most populous ancestries reported in Beaverdale are German (267 | 41.1%), American (99 | 15.2%), Irish (94 | 14.5%), Czech (54 | 8.3%), and Polish (54 | 8.3%), together accounting for 87.4% of all Beaverdale residents.
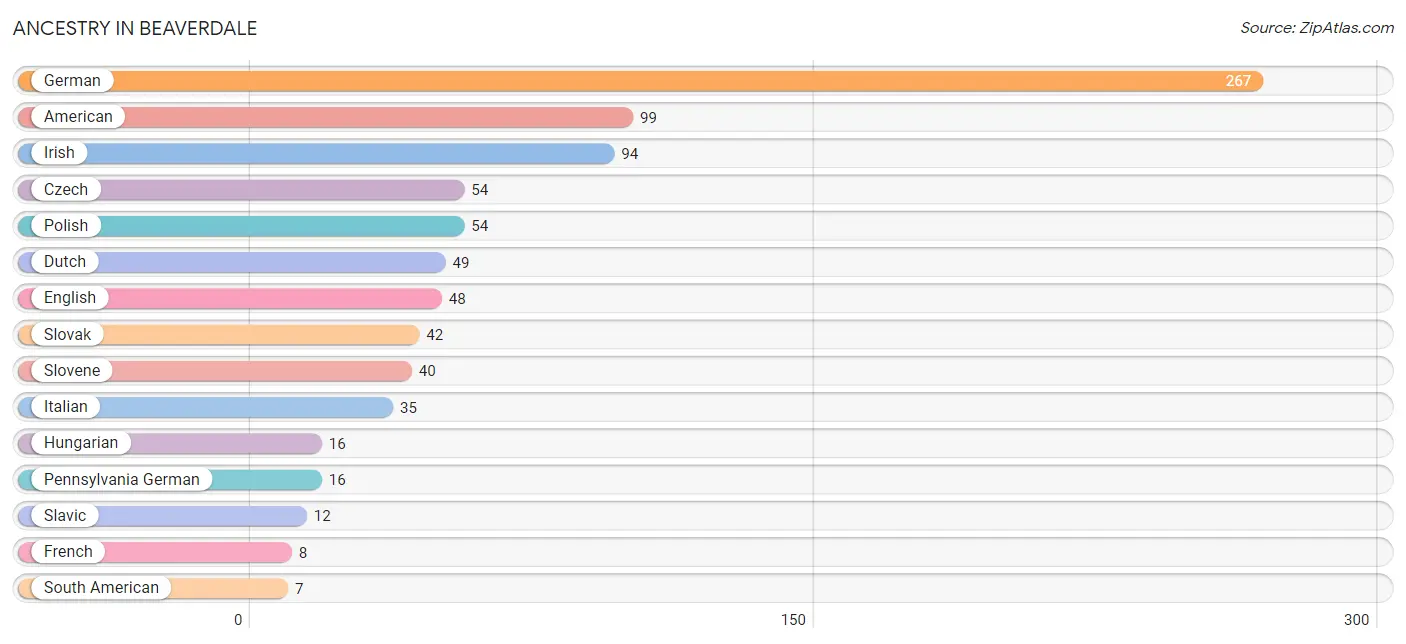
| Ancestry | # Population | % Population |
| American | 99 | 15.2% |
| Austrian | 4 | 0.6% |
| Belgian | 2 | 0.3% |
| Cherokee | 3 | 0.5% |
| Croatian | 5 | 0.8% |
| Czech | 54 | 8.3% |
| Dutch | 49 | 7.5% |
| English | 48 | 7.4% |
| French | 8 | 1.2% |
| German | 267 | 41.1% |
| Hungarian | 16 | 2.5% |
| Irish | 94 | 14.5% |
| Italian | 35 | 5.4% |
| Pennsylvania German | 16 | 2.5% |
| Polish | 54 | 8.3% |
| Slavic | 12 | 1.8% |
| Slovak | 42 | 6.5% |
| Slovene | 40 | 6.1% |
| South American | 7 | 1.1% |
| Swedish | 5 | 0.8% |
| Venezuelan | 7 | 1.1% | View All 21 Rows |
Immigrants in Beaverdale
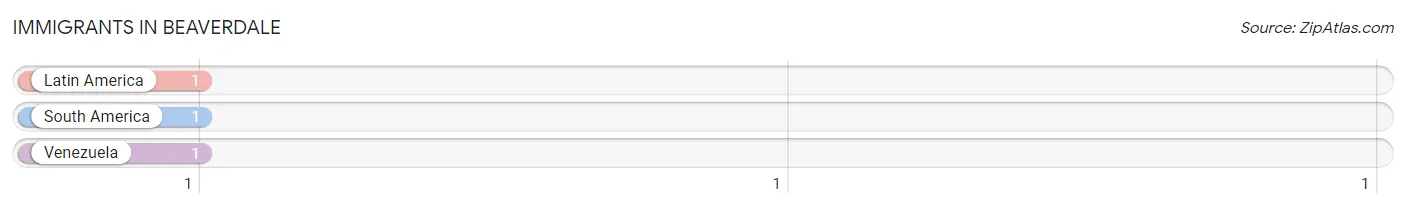
The most numerous immigrant groups reported in Beaverdale came from Latin America (1 | 0.2%), South America (1 | 0.2%), and Venezuela (1 | 0.2%), together accounting for 0.5% of all Beaverdale residents.
| Immigration Origin | # Population | % Population |
| Latin America | 1 | 0.2% |
| South America | 1 | 0.2% |
| Venezuela | 1 | 0.2% | View All 3 Rows |
Sex and Age in Beaverdale
Sex and Age in Beaverdale
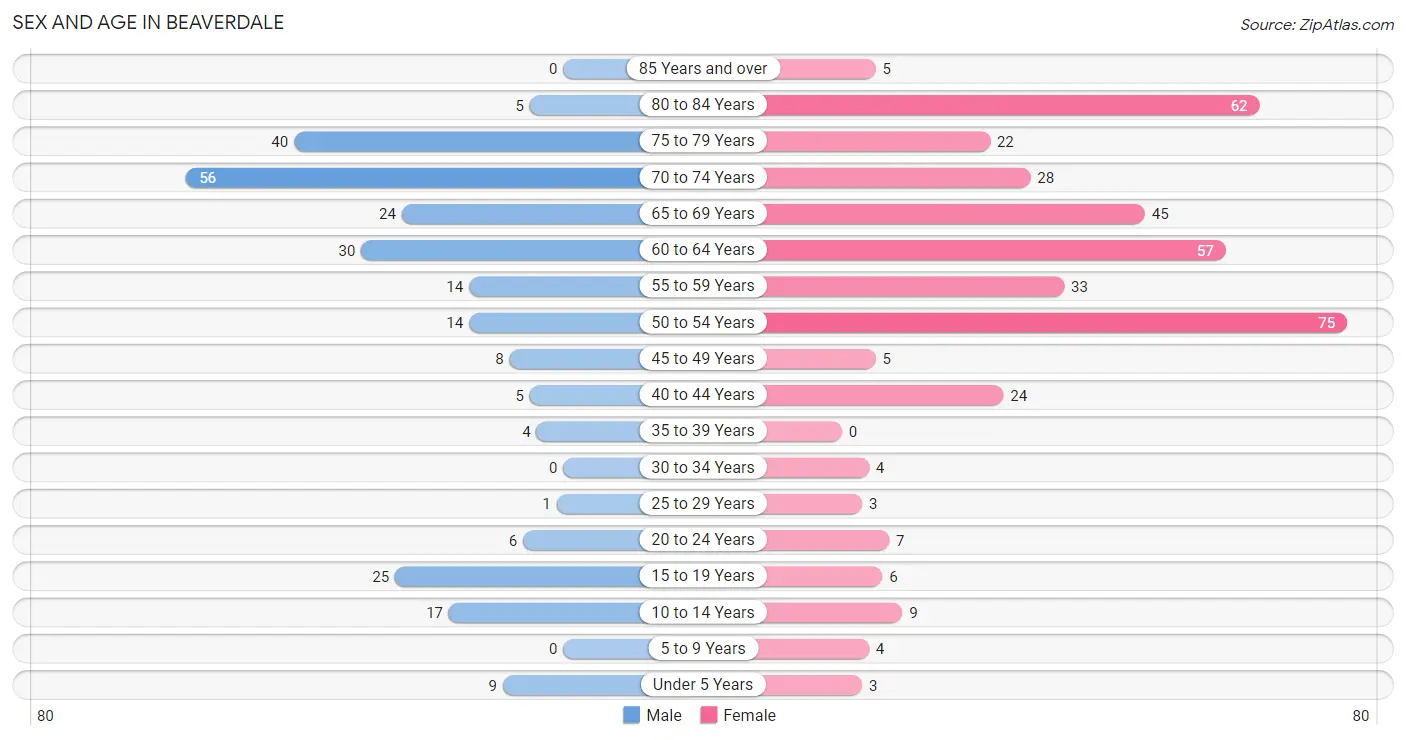
The most populous age groups in Beaverdale are 70 to 74 Years (56 | 21.7%) for men and 50 to 54 Years (75 | 19.1%) for women.
| Age Bracket | Male | Female |
| Under 5 Years | 9 (3.5%) | 3 (0.8%) |
| 5 to 9 Years | 0 (0.0%) | 4 (1.0%) |
| 10 to 14 Years | 17 (6.6%) | 9 (2.3%) |
| 15 to 19 Years | 25 (9.7%) | 6 (1.5%) |
| 20 to 24 Years | 6 (2.3%) | 7 (1.8%) |
| 25 to 29 Years | 1 (0.4%) | 3 (0.8%) |
| 30 to 34 Years | 0 (0.0%) | 4 (1.0%) |
| 35 to 39 Years | 4 (1.5%) | 0 (0.0%) |
| 40 to 44 Years | 5 (1.9%) | 24 (6.1%) |
| 45 to 49 Years | 8 (3.1%) | 5 (1.3%) |
| 50 to 54 Years | 14 (5.4%) | 75 (19.1%) |
| 55 to 59 Years | 14 (5.4%) | 33 (8.4%) |
| 60 to 64 Years | 30 (11.6%) | 57 (14.5%) |
| 65 to 69 Years | 24 (9.3%) | 45 (11.5%) |
| 70 to 74 Years | 56 (21.7%) | 28 (7.1%) |
| 75 to 79 Years | 40 (15.5%) | 22 (5.6%) |
| 80 to 84 Years | 5 (1.9%) | 62 (15.8%) |
| 85 Years and over | 0 (0.0%) | 5 (1.3%) |
| Total | 258 (100.0%) | 392 (100.0%) |
Families and Households in Beaverdale
Median Family Size in Beaverdale
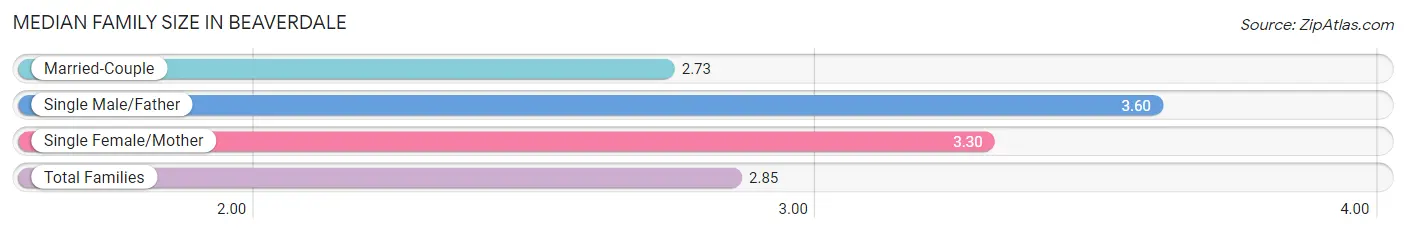
The median family size in Beaverdale is 2.85 persons per family, with single male/father families (5 | 3.3%) accounting for the largest median family size of 3.6 persons per family. On the other hand, married-couple families (122 | 81.3%) represent the smallest median family size with 2.73 persons per family.
| Family Type | # Families | Family Size |
| Married-Couple | 122 (81.3%) | 2.73 |
| Single Male/Father | 5 (3.3%) | 3.60 |
| Single Female/Mother | 23 (15.3%) | 3.30 |
| Total Families | 150 (100.0%) | 2.85 |
Median Household Size in Beaverdale
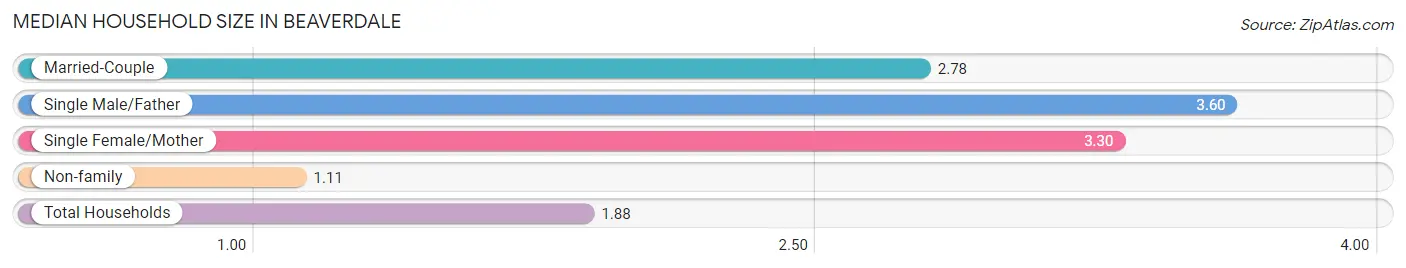
The median household size in Beaverdale is 1.88 persons per household, with single male/father households (5 | 1.5%) accounting for the largest median household size of 3.6 persons per household. non-family households (196 | 56.7%) represent the smallest median household size with 1.11 persons per household.
| Household Type | # Households | Household Size |
| Married-Couple | 122 (35.3%) | 2.78 |
| Single Male/Father | 5 (1.5%) | 3.60 |
| Single Female/Mother | 23 (6.7%) | 3.30 |
| Non-family | 196 (56.7%) | 1.11 |
| Total Households | 346 (100.0%) | 1.88 |
Household Size by Marriage Status in Beaverdale
Out of a total of 346 households in Beaverdale, 150 (43.3%) are family households, while 196 (56.7%) are nonfamily households. The most numerous type of family households are 2-person households, comprising 103, and the most common type of nonfamily households are 1-person households, comprising 166.
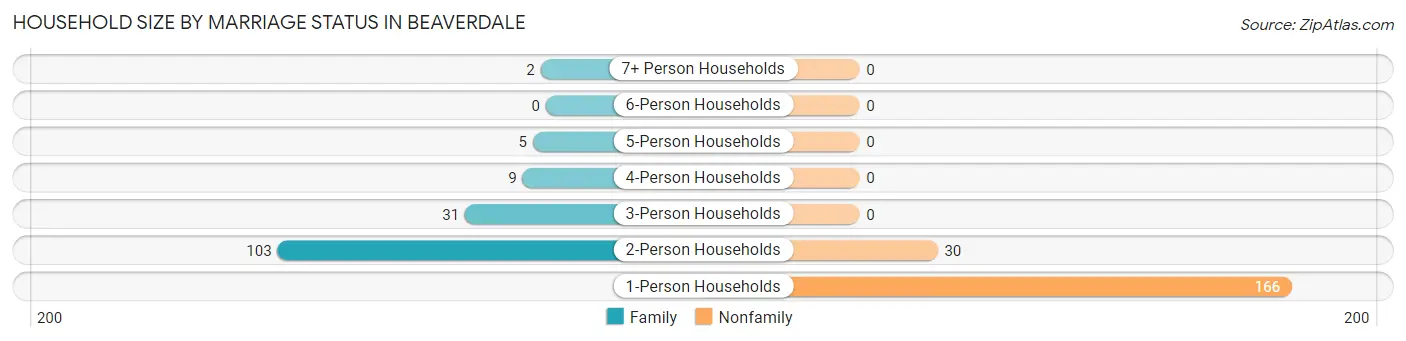
| Household Size | Family Households | Nonfamily Households |
| 1-Person Households | - | 166 (48.0%) |
| 2-Person Households | 103 (29.8%) | 30 (8.7%) |
| 3-Person Households | 31 (9.0%) | 0 (0.0%) |
| 4-Person Households | 9 (2.6%) | 0 (0.0%) |
| 5-Person Households | 5 (1.5%) | 0 (0.0%) |
| 6-Person Households | 0 (0.0%) | 0 (0.0%) |
| 7+ Person Households | 2 (0.6%) | 0 (0.0%) |
| Total | 150 (43.3%) | 196 (56.7%) |
Female Fertility in Beaverdale
Fertility by Age in Beaverdale
Average fertility rate in Beaverdale is 143.0 births per 1,000 women. Women in the age bracket of 35 to 50 years have the highest fertility rate with 172.0 births per 1,000 women. Women in the age bracket of 35 to 50 years acount for 71.4% of all women with births.
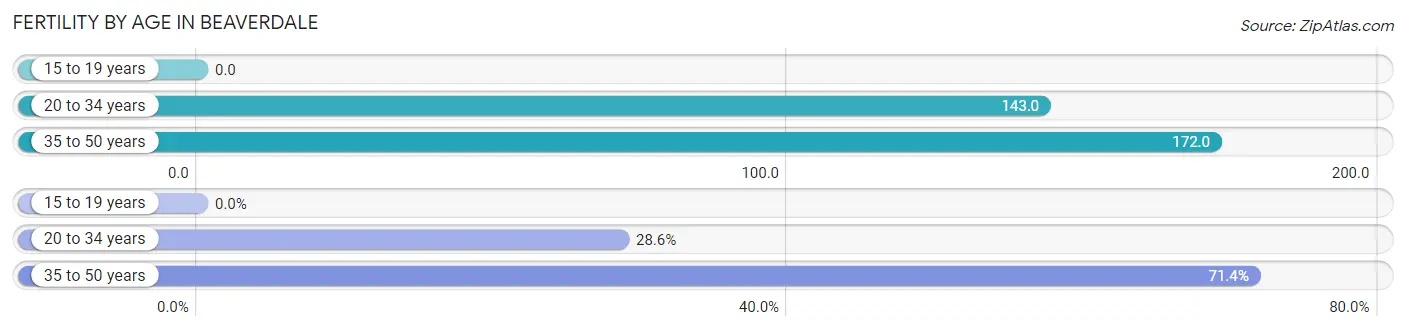
| Age Bracket | Women with Births | Births / 1,000 Women |
| 15 to 19 years | 0 (0.0%) | 0.0 |
| 20 to 34 years | 2 (28.6%) | 143.0 |
| 35 to 50 years | 5 (71.4%) | 172.0 |
| Total | 7 (100.0%) | 143.0 |
Fertility by Age by Marriage Status in Beaverdale
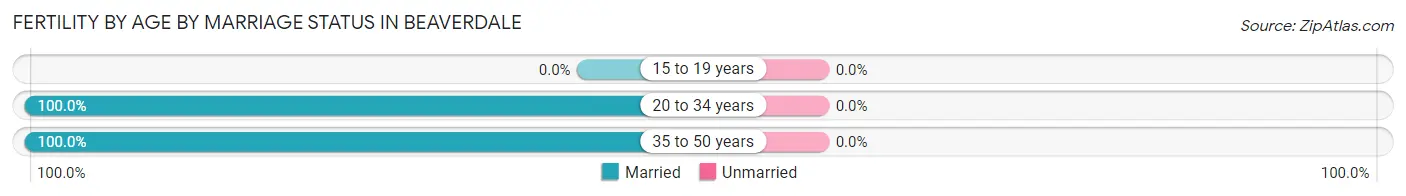
| Age Bracket | Married | Unmarried |
| 15 to 19 years | 0 (0.0%) | 0 (0.0%) |
| 20 to 34 years | 2 (100.0%) | 0 (0.0%) |
| 35 to 50 years | 5 (100.0%) | 0 (0.0%) |
| Total | 7 (100.0%) | 0 (0.0%) |
Fertility by Education in Beaverdale
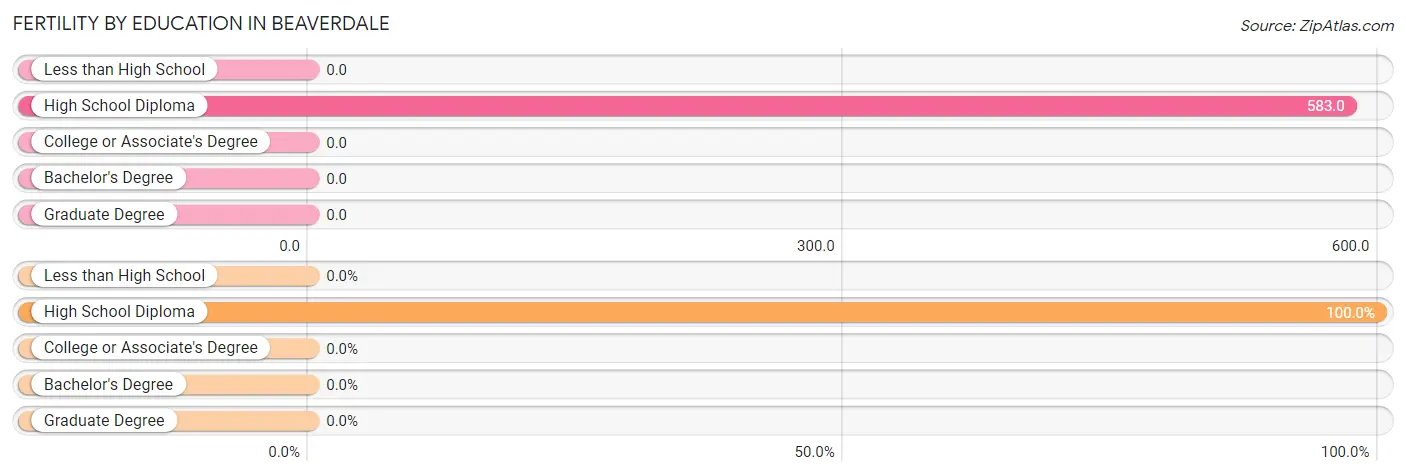
| Educational Attainment | Women with Births | Births / 1,000 Women |
| Less than High School | 0 (0.0%) | 0.0 |
| High School Diploma | 7 (100.0%) | 583.0 |
| College or Associate's Degree | 0 (0.0%) | 0.0 |
| Bachelor's Degree | 0 (0.0%) | 0.0 |
| Graduate Degree | 0 (0.0%) | 0.0 |
| Total | 7 (100.0%) | 143.0 |
Fertility by Education by Marriage Status in Beaverdale
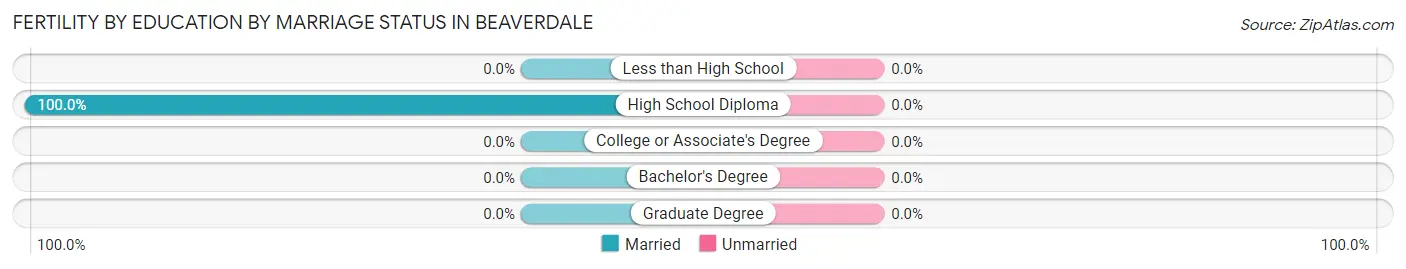
| Educational Attainment | Married | Unmarried |
| Less than High School | 0 (0.0%) | 0 (0.0%) |
| High School Diploma | 7 (100.0%) | 0 (0.0%) |
| College or Associate's Degree | 0 (0.0%) | 0 (0.0%) |
| Bachelor's Degree | 0 (0.0%) | 0 (0.0%) |
| Graduate Degree | 0 (0.0%) | 0 (0.0%) |
| Total | 7 (100.0%) | 0 (0.0%) |
Employment Characteristics in Beaverdale
Employment by Class of Employer in Beaverdale
Among the 267 employed individuals in Beaverdale, private company employees (184 | 68.9%), not-for-profit organizations (65 | 24.3%), and self-employed (not incorporated) (11 | 4.1%) make up the most common classes of employment.
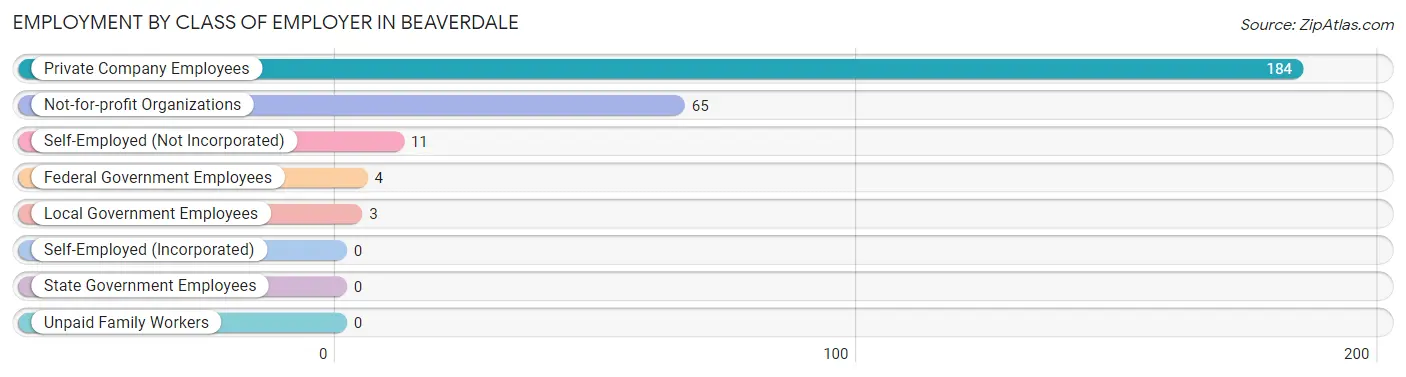
| Employer Class | # Employees | % Employees |
| Private Company Employees | 184 | 68.9% |
| Self-Employed (Incorporated) | 0 | 0.0% |
| Self-Employed (Not Incorporated) | 11 | 4.1% |
| Not-for-profit Organizations | 65 | 24.3% |
| Local Government Employees | 3 | 1.1% |
| State Government Employees | 0 | 0.0% |
| Federal Government Employees | 4 | 1.5% |
| Unpaid Family Workers | 0 | 0.0% |
| Total | 267 | 100.0% |
Employment Status by Age in Beaverdale
According to the labor force statistics for Beaverdale, out of the total population over 16 years of age (583), 46.5% or 271 individuals are in the labor force, with 1.5% or 4 of them unemployed. The age group with the highest labor force participation rate is 16 to 19 years, with 100.0% or 6 individuals in the labor force. Within the labor force, the 35 to 44 years age range has the highest percentage of unemployed individuals, with 14.8% or 4 of them being unemployed.
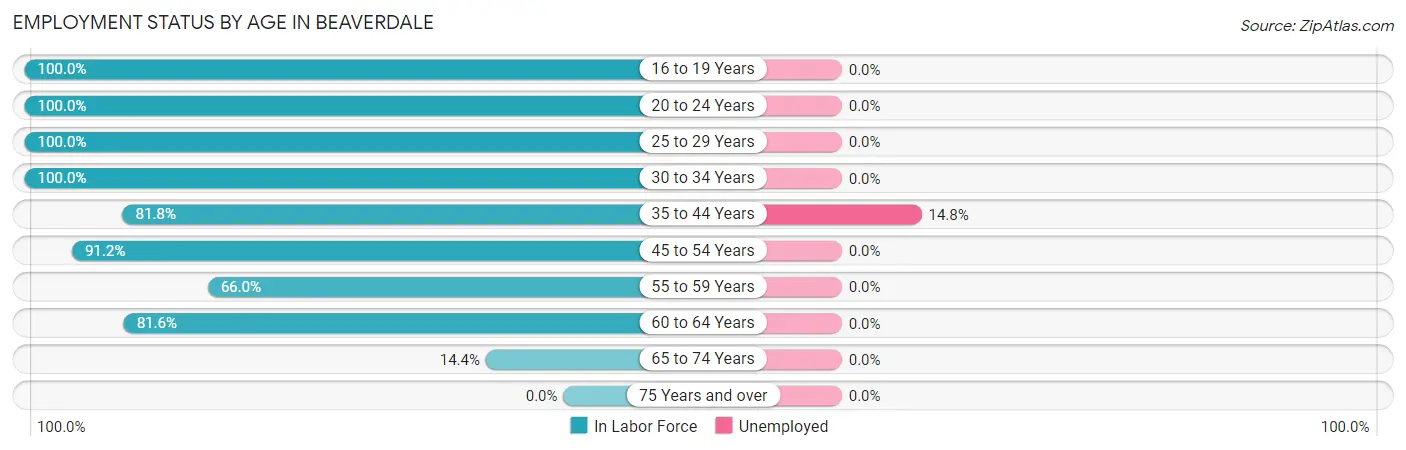
| Age Bracket | In Labor Force | Unemployed |
| 16 to 19 Years | 6 (100.0%) | 0 (0.0%) |
| 20 to 24 Years | 13 (100.0%) | 0 (0.0%) |
| 25 to 29 Years | 4 (100.0%) | 0 (0.0%) |
| 30 to 34 Years | 4 (100.0%) | 0 (0.0%) |
| 35 to 44 Years | 27 (81.8%) | 4 (14.8%) |
| 45 to 54 Years | 93 (91.2%) | 0 (0.0%) |
| 55 to 59 Years | 31 (66.0%) | 0 (0.0%) |
| 60 to 64 Years | 71 (81.6%) | 0 (0.0%) |
| 65 to 74 Years | 22 (14.4%) | 0 (0.0%) |
| 75 Years and over | 0 (0.0%) | 0 (0.0%) |
| Total | 271 (46.5%) | 4 (1.5%) |
Employment Status by Educational Attainment in Beaverdale
According to labor force statistics for Beaverdale, 83.0% of individuals (230) out of the total population between 25 and 64 years of age (277) are in the labor force, with 1.7% or 4 of them being unemployed. The group with the highest labor force participation rate are those with the educational attainment of bachelor's degree or higher, with 100.0% or 24 individuals in the labor force. Within the labor force, individuals with high school diploma education have the highest percentage of unemployment, with 4.1% or 4 of them being unemployed.
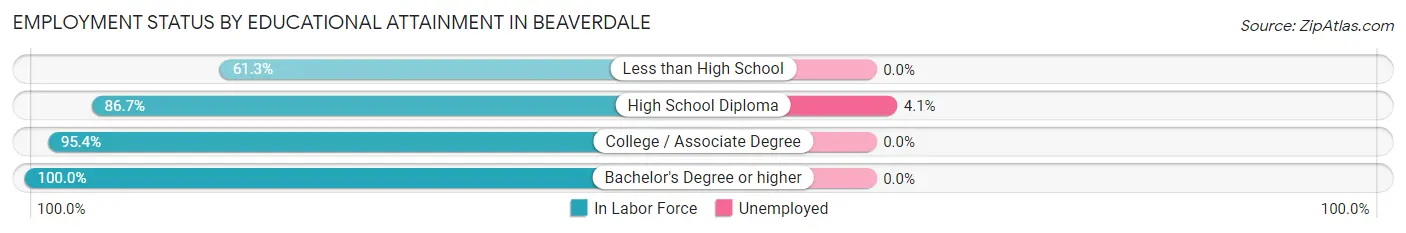
| Educational Attainment | In Labor Force | Unemployed |
| Less than High School | 46 (61.3%) | 0 (0.0%) |
| High School Diploma | 98 (86.7%) | 5 (4.1%) |
| College / Associate Degree | 62 (95.4%) | 0 (0.0%) |
| Bachelor's Degree or higher | 24 (100.0%) | 0 (0.0%) |
| Total | 230 (83.0%) | 5 (1.7%) |
Employment Occupations by Sex in Beaverdale
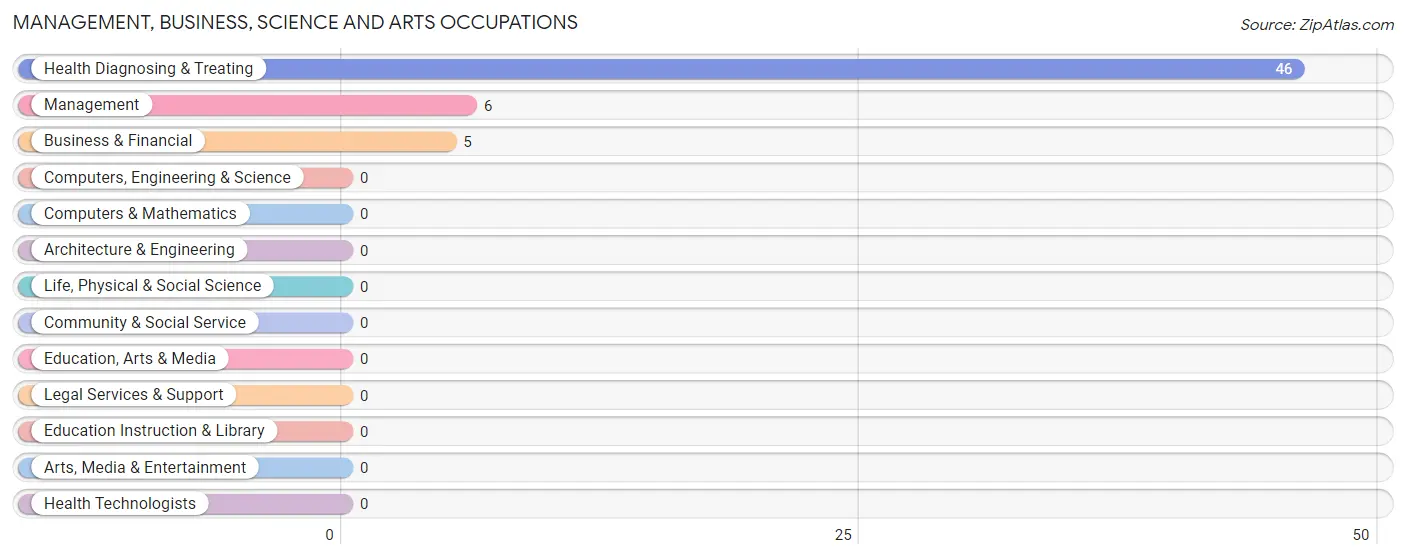
Management, Business, Science and Arts Occupations
The most common Management, Business, Science and Arts occupations in Beaverdale are Health Diagnosing & Treating (46 | 17.2%), Management (6 | 2.2%), and Business & Financial (5 | 1.9%).
Management, Business, Science and Arts Occupations by Sex
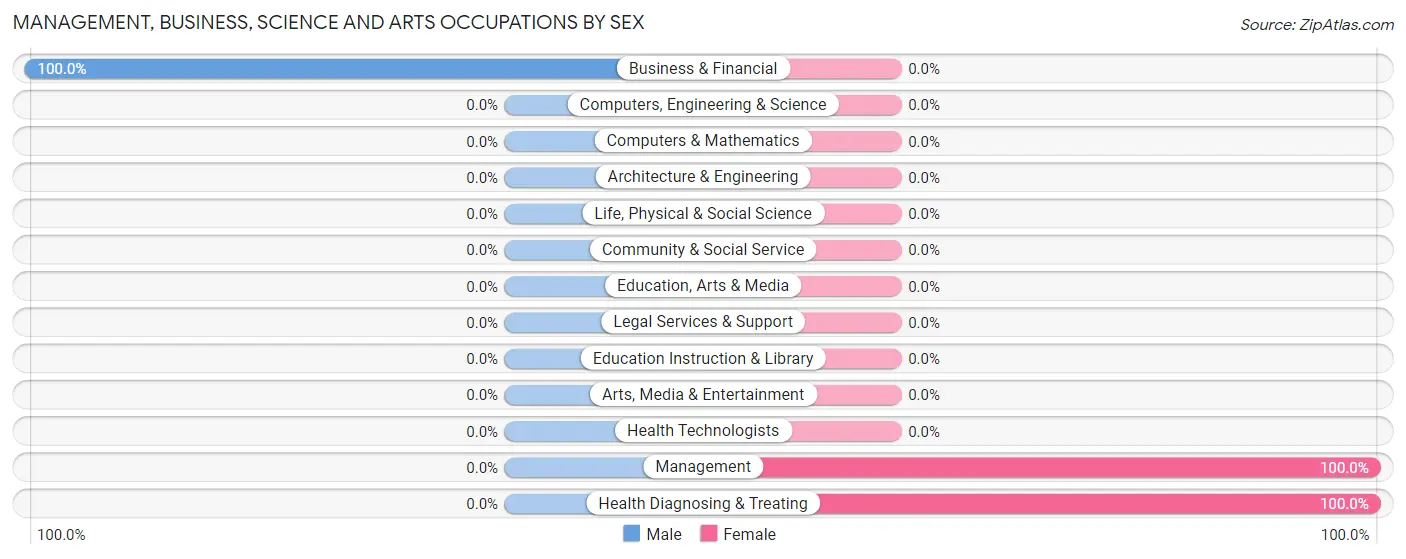
| Occupation | Male | Female |
| Management | 0 (0.0%) | 6 (100.0%) |
| Business & Financial | 5 (100.0%) | 0 (0.0%) |
| Computers, Engineering & Science | 0 (0.0%) | 0 (0.0%) |
| Computers & Mathematics | 0 (0.0%) | 0 (0.0%) |
| Architecture & Engineering | 0 (0.0%) | 0 (0.0%) |
| Life, Physical & Social Science | 0 (0.0%) | 0 (0.0%) |
| Community & Social Service | 0 (0.0%) | 0 (0.0%) |
| Education, Arts & Media | 0 (0.0%) | 0 (0.0%) |
| Legal Services & Support | 0 (0.0%) | 0 (0.0%) |
| Education Instruction & Library | 0 (0.0%) | 0 (0.0%) |
| Arts, Media & Entertainment | 0 (0.0%) | 0 (0.0%) |
| Health Diagnosing & Treating | 0 (0.0%) | 46 (100.0%) |
| Health Technologists | 0 (0.0%) | 0 (0.0%) |
| Total (Category) | 5 (8.8%) | 52 (91.2%) |
| Total (Overall) | 86 (32.2%) | 181 (67.8%) |
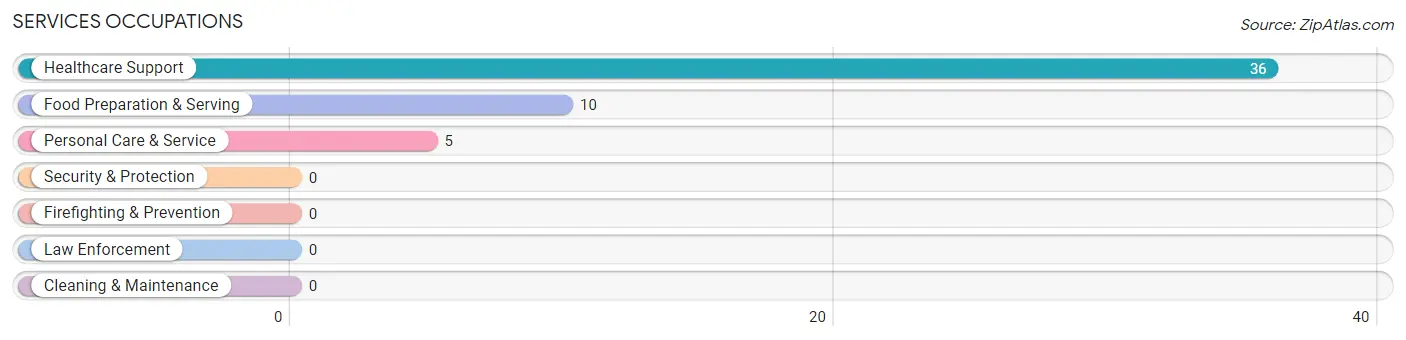
Services Occupations
The most common Services occupations in Beaverdale are Healthcare Support (36 | 13.5%), Food Preparation & Serving (10 | 3.7%), and Personal Care & Service (5 | 1.9%).
Services Occupations by Sex
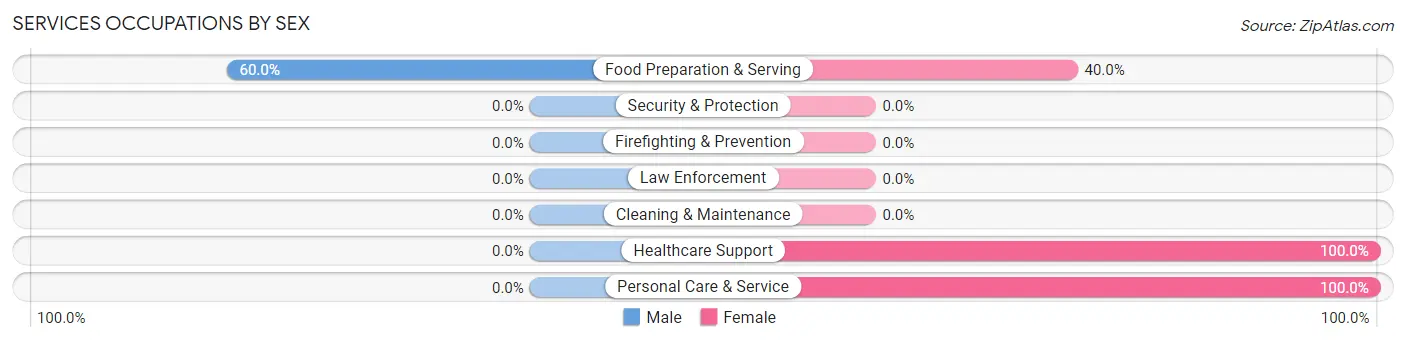
| Occupation | Male | Female |
| Healthcare Support | 0 (0.0%) | 36 (100.0%) |
| Security & Protection | 0 (0.0%) | 0 (0.0%) |
| Firefighting & Prevention | 0 (0.0%) | 0 (0.0%) |
| Law Enforcement | 0 (0.0%) | 0 (0.0%) |
| Food Preparation & Serving | 6 (60.0%) | 4 (40.0%) |
| Cleaning & Maintenance | 0 (0.0%) | 0 (0.0%) |
| Personal Care & Service | 0 (0.0%) | 5 (100.0%) |
| Total (Category) | 6 (11.8%) | 45 (88.2%) |
| Total (Overall) | 86 (32.2%) | 181 (67.8%) |
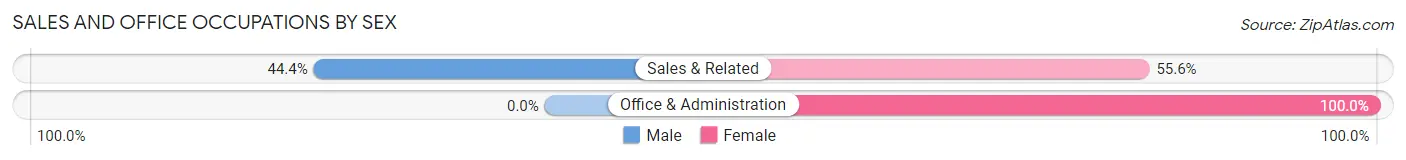
Sales and Office Occupations
The most common Sales and Office occupations in Beaverdale are Sales & Related (9 | 3.4%), and Office & Administration (9 | 3.4%).

Sales and Office Occupations by Sex
| Occupation | Male | Female |
| Sales & Related | 4 (44.4%) | 5 (55.6%) |
| Office & Administration | 0 (0.0%) | 9 (100.0%) |
| Total (Category) | 4 (22.2%) | 14 (77.8%) |
| Total (Overall) | 86 (32.2%) | 181 (67.8%) |
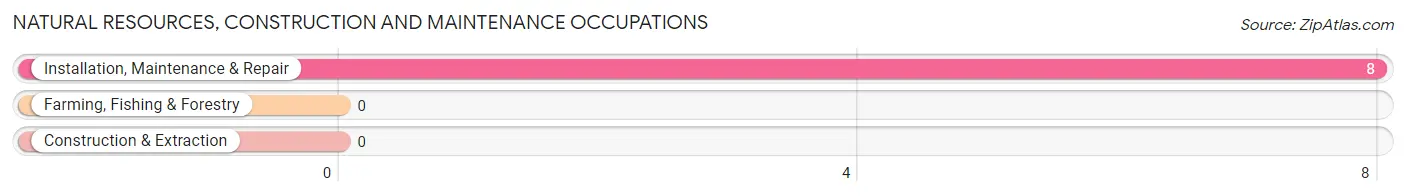
Natural Resources, Construction and Maintenance Occupations
The most common Natural Resources, Construction and Maintenance occupations in Beaverdale are , and Installation, Maintenance & Repair (8 | 3.0%).
Natural Resources, Construction and Maintenance Occupations by Sex
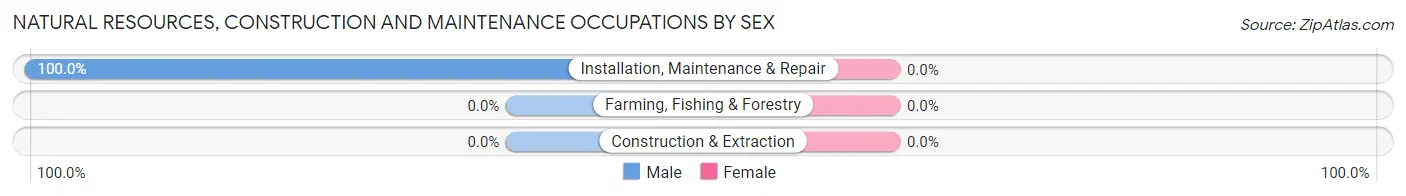
| Occupation | Male | Female |
| Farming, Fishing & Forestry | 0 (0.0%) | 0 (0.0%) |
| Construction & Extraction | 0 (0.0%) | 0 (0.0%) |
| Installation, Maintenance & Repair | 8 (100.0%) | 0 (0.0%) |
| Total (Category) | 8 (100.0%) | 0 (0.0%) |
| Total (Overall) | 86 (32.2%) | 181 (67.8%) |
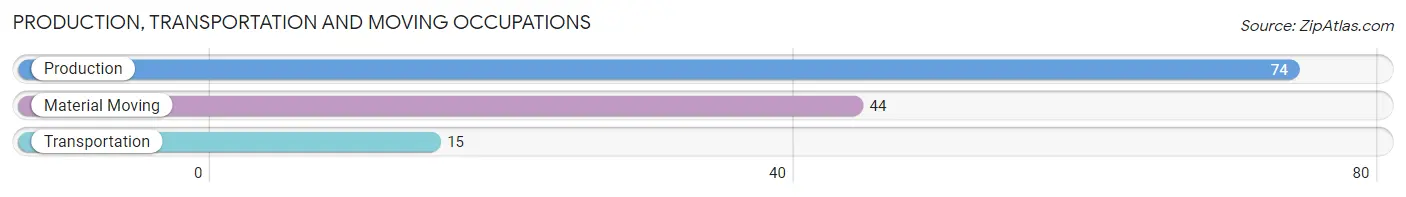
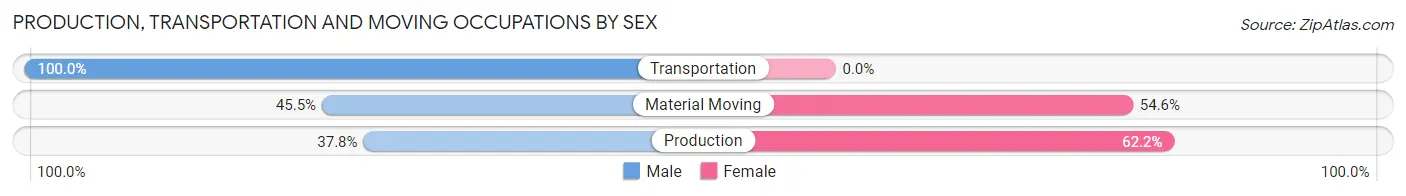
Production, Transportation and Moving Occupations
The most common Production, Transportation and Moving occupations in Beaverdale are Production (74 | 27.7%), Material Moving (44 | 16.5%), and Transportation (15 | 5.6%).
Production, Transportation and Moving Occupations by Sex
| Occupation | Male | Female |
| Production | 28 (37.8%) | 46 (62.2%) |
| Transportation | 15 (100.0%) | 0 (0.0%) |
| Material Moving | 20 (45.5%) | 24 (54.5%) |
| Total (Category) | 63 (47.4%) | 70 (52.6%) |
| Total (Overall) | 86 (32.2%) | 181 (67.8%) |
Employment Industries by Sex in Beaverdale
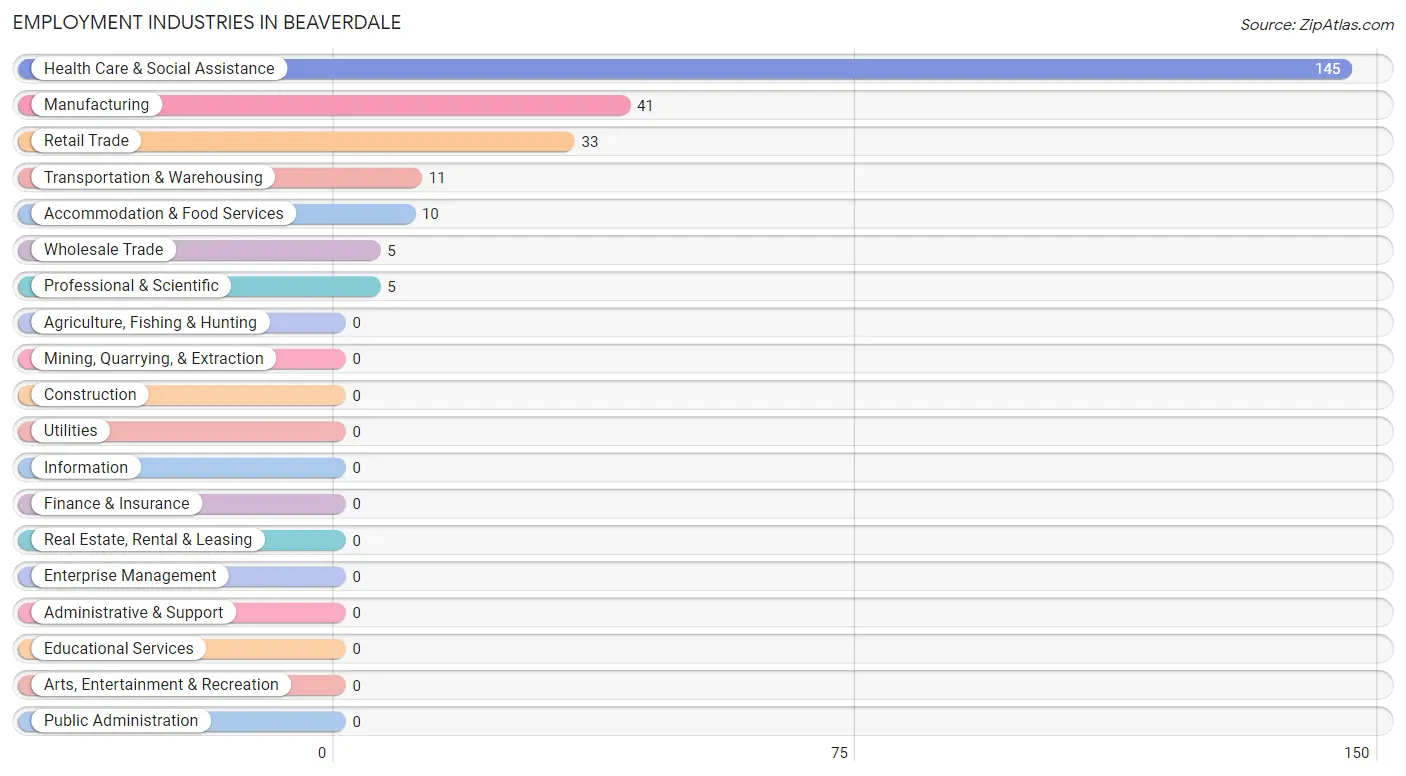
Employment Industries in Beaverdale
The major employment industries in Beaverdale include Health Care & Social Assistance (145 | 54.3%), Manufacturing (41 | 15.4%), Retail Trade (33 | 12.4%), Transportation & Warehousing (11 | 4.1%), and Accommodation & Food Services (10 | 3.7%).
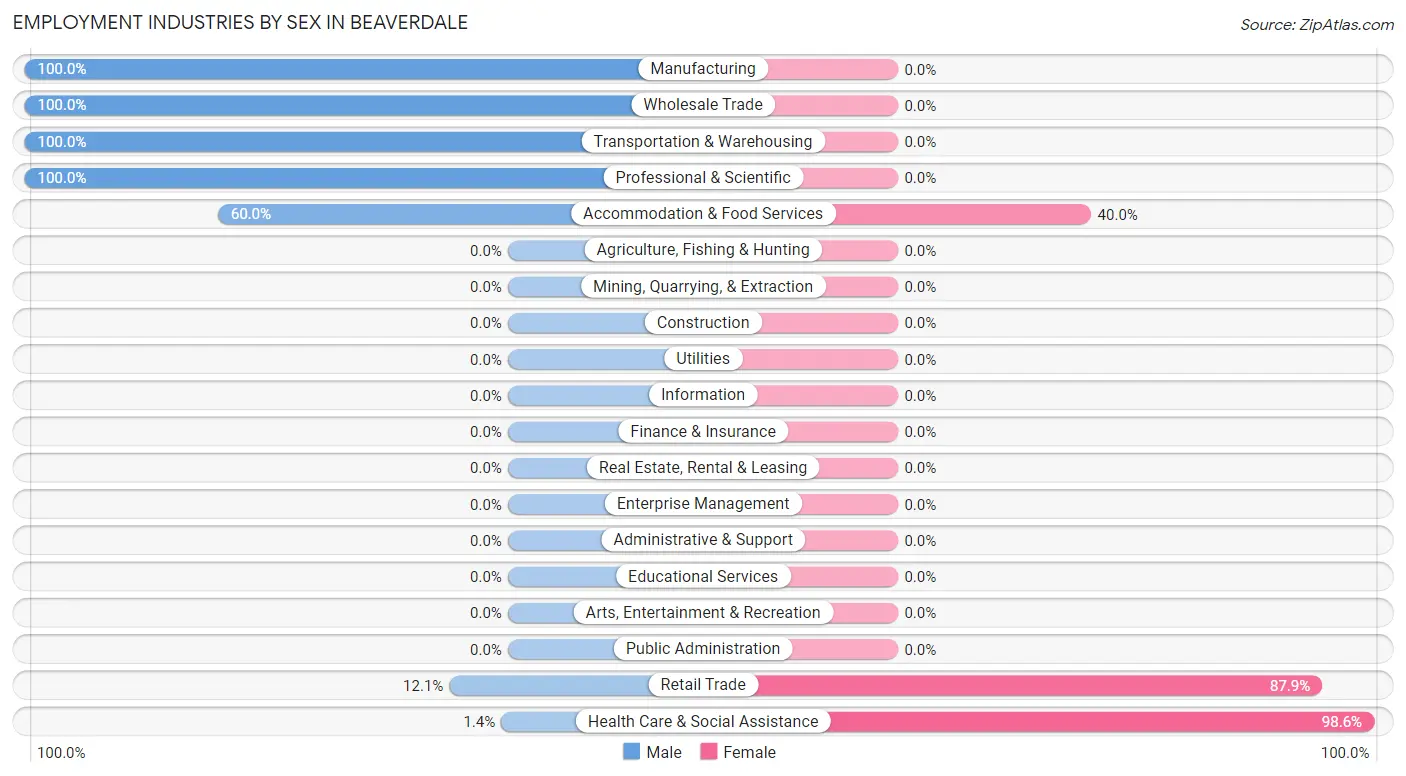
Employment Industries by Sex in Beaverdale
The Beaverdale industries that see more men than women are Manufacturing (100.0%), Wholesale Trade (100.0%), and Transportation & Warehousing (100.0%), whereas the industries that tend to have a higher number of women are Health Care & Social Assistance (98.6%), Retail Trade (87.9%), and Accommodation & Food Services (40.0%).
| Industry | Male | Female |
| Agriculture, Fishing & Hunting | 0 (0.0%) | 0 (0.0%) |
| Mining, Quarrying, & Extraction | 0 (0.0%) | 0 (0.0%) |
| Construction | 0 (0.0%) | 0 (0.0%) |
| Manufacturing | 41 (100.0%) | 0 (0.0%) |
| Wholesale Trade | 5 (100.0%) | 0 (0.0%) |
| Retail Trade | 4 (12.1%) | 29 (87.9%) |
| Transportation & Warehousing | 11 (100.0%) | 0 (0.0%) |
| Utilities | 0 (0.0%) | 0 (0.0%) |
| Information | 0 (0.0%) | 0 (0.0%) |
| Finance & Insurance | 0 (0.0%) | 0 (0.0%) |
| Real Estate, Rental & Leasing | 0 (0.0%) | 0 (0.0%) |
| Professional & Scientific | 5 (100.0%) | 0 (0.0%) |
| Enterprise Management | 0 (0.0%) | 0 (0.0%) |
| Administrative & Support | 0 (0.0%) | 0 (0.0%) |
| Educational Services | 0 (0.0%) | 0 (0.0%) |
| Health Care & Social Assistance | 2 (1.4%) | 143 (98.6%) |
| Arts, Entertainment & Recreation | 0 (0.0%) | 0 (0.0%) |
| Accommodation & Food Services | 6 (60.0%) | 4 (40.0%) |
| Public Administration | 0 (0.0%) | 0 (0.0%) |
| Total | 86 (32.2%) | 181 (67.8%) |
Education in Beaverdale
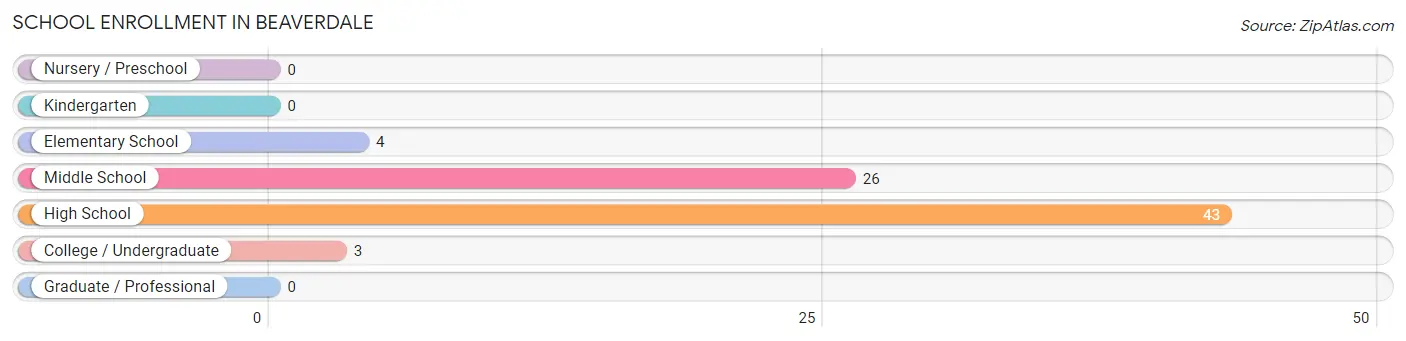
School Enrollment in Beaverdale
The most common levels of schooling among the 76 students in Beaverdale are high school (43 | 56.6%), middle school (26 | 34.2%), and elementary school (4 | 5.3%).
| School Level | # Students | % Students |
| Nursery / Preschool | 0 | 0.0% |
| Kindergarten | 0 | 0.0% |
| Elementary School | 4 | 5.3% |
| Middle School | 26 | 34.2% |
| High School | 43 | 56.6% |
| College / Undergraduate | 3 | 4.0% |
| Graduate / Professional | 0 | 0.0% |
| Total | 76 | 100.0% |
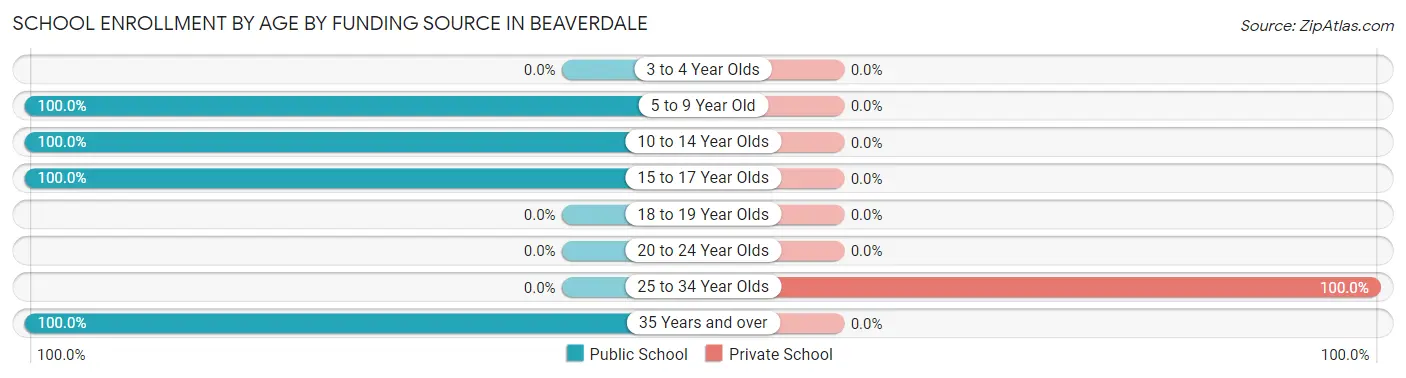
School Enrollment by Age by Funding Source in Beaverdale
Out of a total of 76 students who are enrolled in schools in Beaverdale, 3 (3.9%) attend a private institution, while the remaining 73 (96.1%) are enrolled in public schools. The age group of 25 to 34 year olds has the highest likelihood of being enrolled in private schools, with 3 (100.0% in the age bracket) enrolled. Conversely, the age group of 5 to 9 year old has the lowest likelihood of being enrolled in a private school, with 4 (100.0% in the age bracket) attending a public institution.
| Age Bracket | Public School | Private School |
| 3 to 4 Year Olds | 0 (0.0%) | 0 (0.0%) |
| 5 to 9 Year Old | 4 (100.0%) | 0 (0.0%) |
| 10 to 14 Year Olds | 26 (100.0%) | 0 (0.0%) |
| 15 to 17 Year Olds | 31 (100.0%) | 0 (0.0%) |
| 18 to 19 Year Olds | 0 (0.0%) | 0 (0.0%) |
| 20 to 24 Year Olds | 0 (0.0%) | 0 (0.0%) |
| 25 to 34 Year Olds | 0 (0.0%) | 3 (100.0%) |
| 35 Years and over | 12 (100.0%) | 0 (0.0%) |
| Total | 73 (96.1%) | 3 (3.9%) |
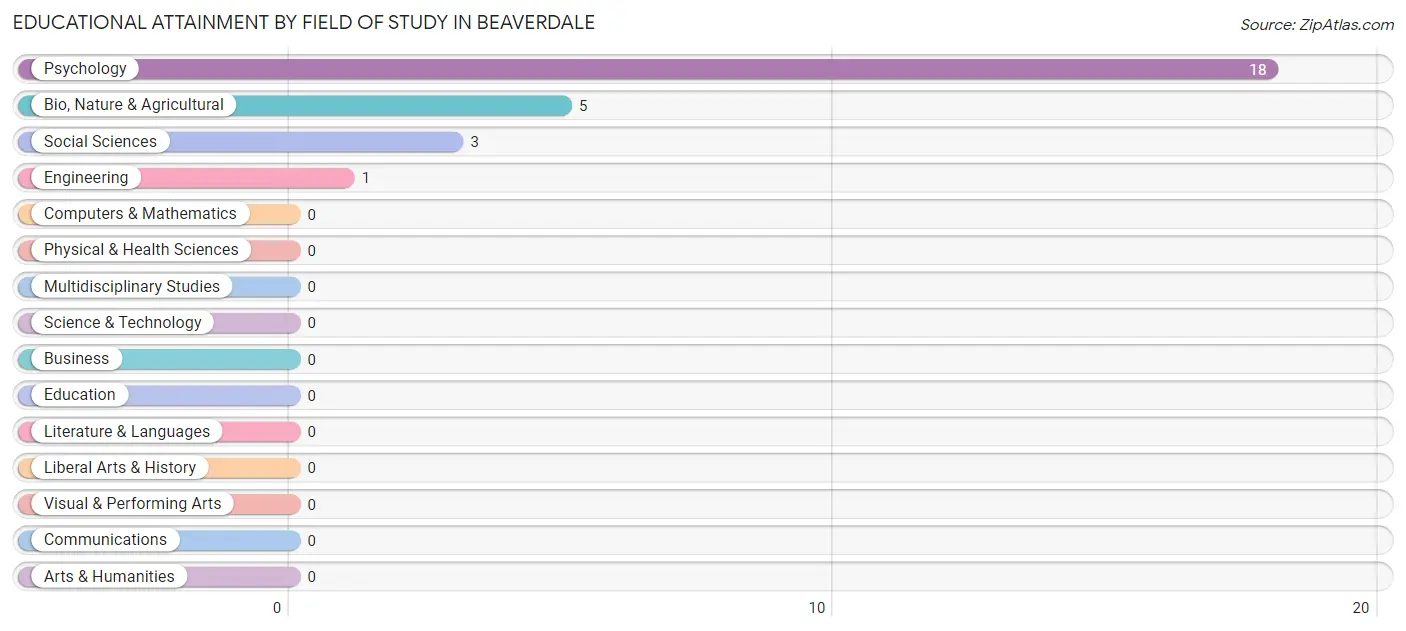
Educational Attainment by Field of Study in Beaverdale
Psychology (18 | 66.7%), bio, nature & agricultural (5 | 18.5%), social sciences (3 | 11.1%), and engineering (1 | 3.7%) are the most common fields of study among 27 individuals in Beaverdale who have obtained a bachelor's degree or higher.
| Field of Study | # Graduates | % Graduates |
| Computers & Mathematics | 0 | 0.0% |
| Bio, Nature & Agricultural | 5 | 18.5% |
| Physical & Health Sciences | 0 | 0.0% |
| Psychology | 18 | 66.7% |
| Social Sciences | 3 | 11.1% |
| Engineering | 1 | 3.7% |
| Multidisciplinary Studies | 0 | 0.0% |
| Science & Technology | 0 | 0.0% |
| Business | 0 | 0.0% |
| Education | 0 | 0.0% |
| Literature & Languages | 0 | 0.0% |
| Liberal Arts & History | 0 | 0.0% |
| Visual & Performing Arts | 0 | 0.0% |
| Communications | 0 | 0.0% |
| Arts & Humanities | 0 | 0.0% |
| Total | 27 | 100.0% |
Transportation & Commute in Beaverdale
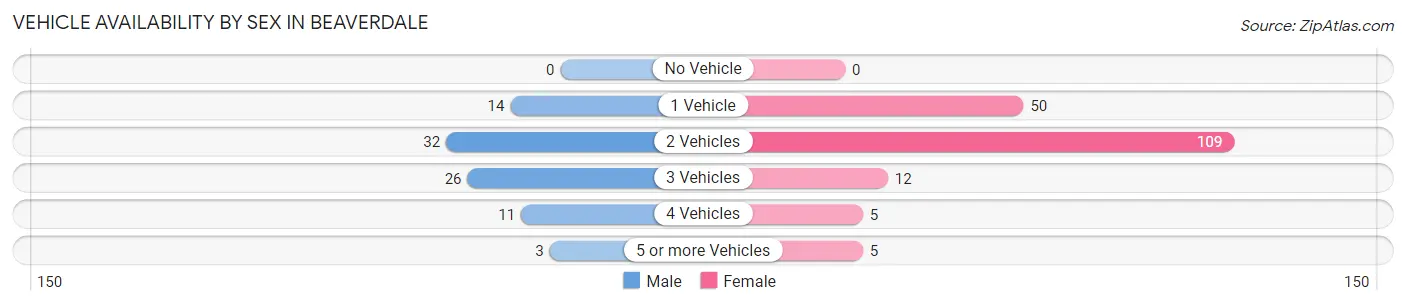
Vehicle Availability by Sex in Beaverdale
The most prevalent vehicle ownership categories in Beaverdale are males with 2 vehicles (32, accounting for 37.2%) and females with 2 vehicles (109, making up 17.7%).
| Vehicles Available | Male | Female |
| No Vehicle | 0 (0.0%) | 0 (0.0%) |
| 1 Vehicle | 14 (16.3%) | 50 (27.6%) |
| 2 Vehicles | 32 (37.2%) | 109 (60.2%) |
| 3 Vehicles | 26 (30.2%) | 12 (6.6%) |
| 4 Vehicles | 11 (12.8%) | 5 (2.8%) |
| 5 or more Vehicles | 3 (3.5%) | 5 (2.8%) |
| Total | 86 (100.0%) | 181 (100.0%) |
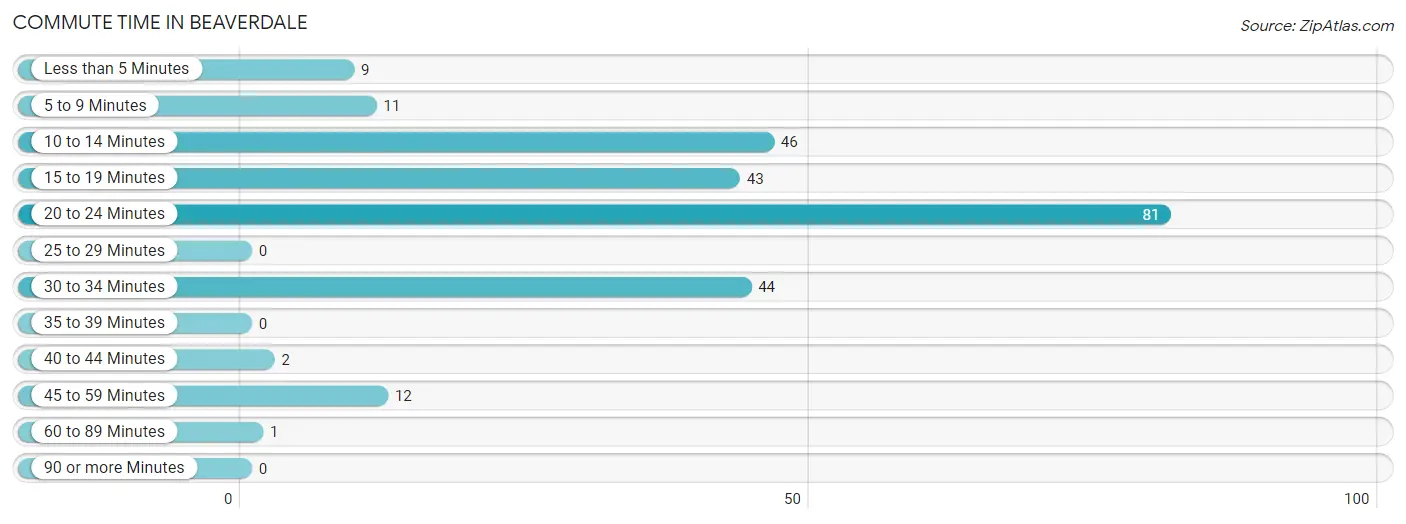
Commute Time in Beaverdale
The most frequently occuring commute durations in Beaverdale are 20 to 24 minutes (81 commuters, 32.5%), 10 to 14 minutes (46 commuters, 18.5%), and 30 to 34 minutes (44 commuters, 17.7%).
| Commute Time | # Commuters | % Commuters |
| Less than 5 Minutes | 9 | 3.6% |
| 5 to 9 Minutes | 11 | 4.4% |
| 10 to 14 Minutes | 46 | 18.5% |
| 15 to 19 Minutes | 43 | 17.3% |
| 20 to 24 Minutes | 81 | 32.5% |
| 25 to 29 Minutes | 0 | 0.0% |
| 30 to 34 Minutes | 44 | 17.7% |
| 35 to 39 Minutes | 0 | 0.0% |
| 40 to 44 Minutes | 2 | 0.8% |
| 45 to 59 Minutes | 12 | 4.8% |
| 60 to 89 Minutes | 1 | 0.4% |
| 90 or more Minutes | 0 | 0.0% |
Commute Time by Sex in Beaverdale
The most common commute times in Beaverdale are 30 to 34 minutes (26 commuters, 32.1%) for males and 20 to 24 minutes (81 commuters, 48.2%) for females.
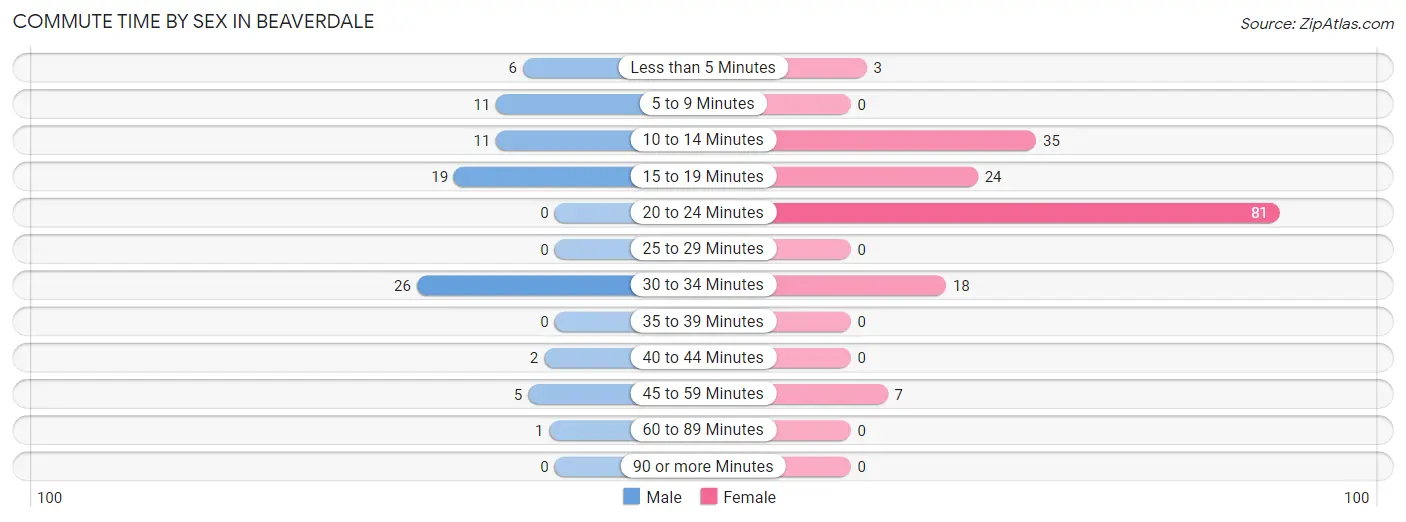
| Commute Time | Male | Female |
| Less than 5 Minutes | 6 (7.4%) | 3 (1.8%) |
| 5 to 9 Minutes | 11 (13.6%) | 0 (0.0%) |
| 10 to 14 Minutes | 11 (13.6%) | 35 (20.8%) |
| 15 to 19 Minutes | 19 (23.5%) | 24 (14.3%) |
| 20 to 24 Minutes | 0 (0.0%) | 81 (48.2%) |
| 25 to 29 Minutes | 0 (0.0%) | 0 (0.0%) |
| 30 to 34 Minutes | 26 (32.1%) | 18 (10.7%) |
| 35 to 39 Minutes | 0 (0.0%) | 0 (0.0%) |
| 40 to 44 Minutes | 2 (2.5%) | 0 (0.0%) |
| 45 to 59 Minutes | 5 (6.2%) | 7 (4.2%) |
| 60 to 89 Minutes | 1 (1.2%) | 0 (0.0%) |
| 90 or more Minutes | 0 (0.0%) | 0 (0.0%) |
Time of Departure to Work by Sex in Beaverdale
The most frequent times of departure to work in Beaverdale are 12:00 PM to 3:59 PM (34, 42.0%) for males and 7:00 AM to 7:29 AM (55, 32.7%) for females.
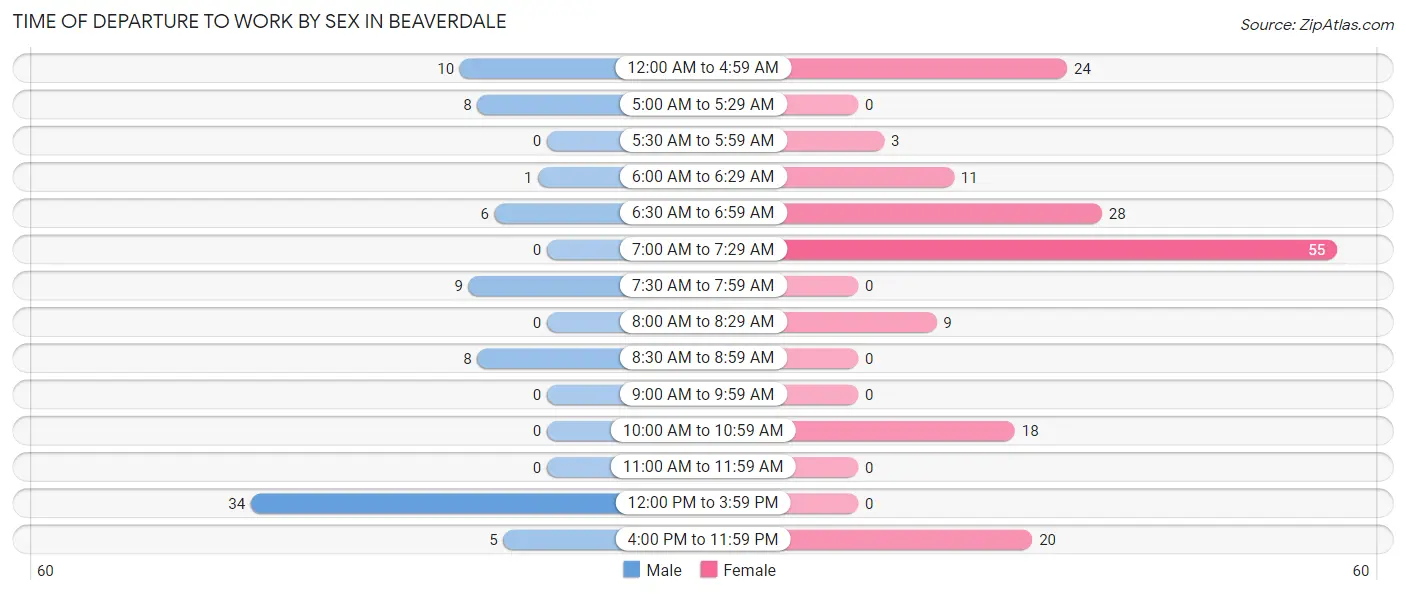
| Time of Departure | Male | Female |
| 12:00 AM to 4:59 AM | 10 (12.3%) | 24 (14.3%) |
| 5:00 AM to 5:29 AM | 8 (9.9%) | 0 (0.0%) |
| 5:30 AM to 5:59 AM | 0 (0.0%) | 3 (1.8%) |
| 6:00 AM to 6:29 AM | 1 (1.2%) | 11 (6.6%) |
| 6:30 AM to 6:59 AM | 6 (7.4%) | 28 (16.7%) |
| 7:00 AM to 7:29 AM | 0 (0.0%) | 55 (32.7%) |
| 7:30 AM to 7:59 AM | 9 (11.1%) | 0 (0.0%) |
| 8:00 AM to 8:29 AM | 0 (0.0%) | 9 (5.4%) |
| 8:30 AM to 8:59 AM | 8 (9.9%) | 0 (0.0%) |
| 9:00 AM to 9:59 AM | 0 (0.0%) | 0 (0.0%) |
| 10:00 AM to 10:59 AM | 0 (0.0%) | 18 (10.7%) |
| 11:00 AM to 11:59 AM | 0 (0.0%) | 0 (0.0%) |
| 12:00 PM to 3:59 PM | 34 (42.0%) | 0 (0.0%) |
| 4:00 PM to 11:59 PM | 5 (6.2%) | 20 (11.9%) |
| Total | 81 (100.0%) | 168 (100.0%) |
Housing Occupancy in Beaverdale
Occupancy by Ownership in Beaverdale
Of the total 346 dwellings in Beaverdale, owner-occupied units account for 290 (83.8%), while renter-occupied units make up 56 (16.2%).
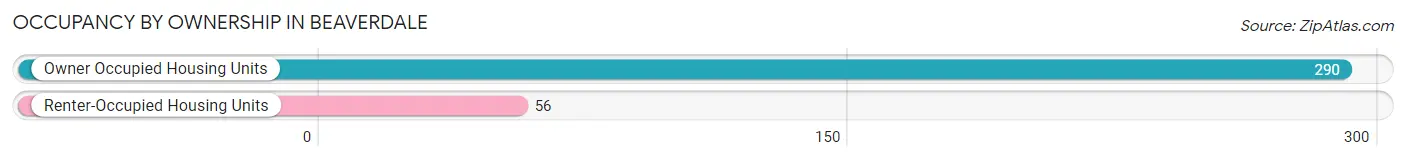
| Occupancy | # Housing Units | % Housing Units |
| Owner Occupied Housing Units | 290 | 83.8% |
| Renter-Occupied Housing Units | 56 | 16.2% |
| Total Occupied Housing Units | 346 | 100.0% |
Occupancy by Household Size in Beaverdale
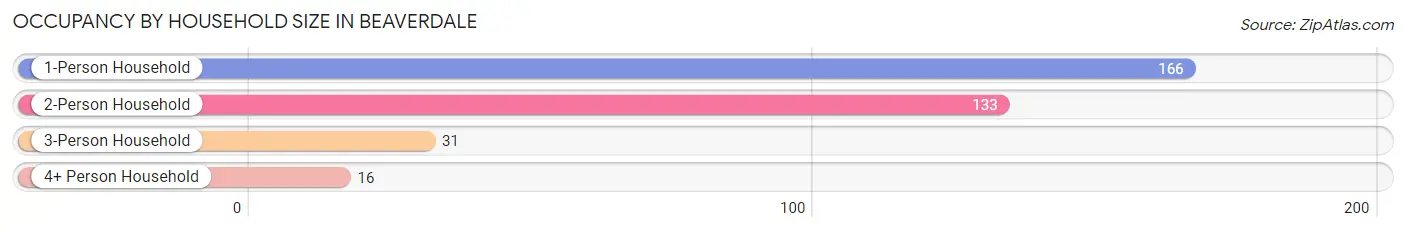
| Household Size | # Housing Units | % Housing Units |
| 1-Person Household | 166 | 48.0% |
| 2-Person Household | 133 | 38.4% |
| 3-Person Household | 31 | 9.0% |
| 4+ Person Household | 16 | 4.6% |
| Total Housing Units | 346 | 100.0% |
Occupancy by Ownership by Household Size in Beaverdale
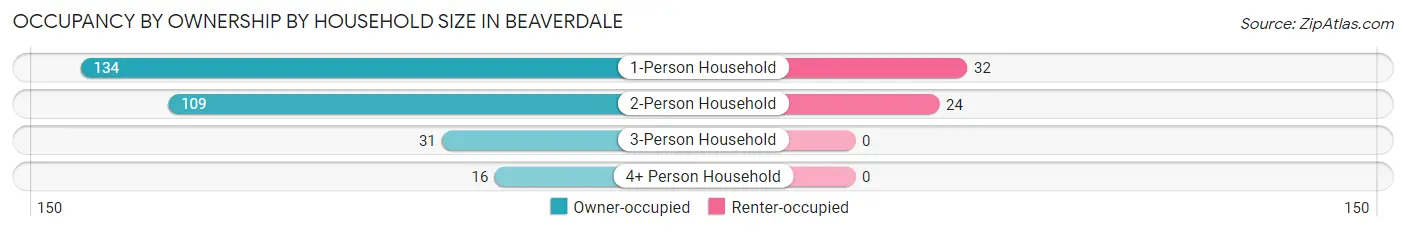
| Household Size | Owner-occupied | Renter-occupied |
| 1-Person Household | 134 (80.7%) | 32 (19.3%) |
| 2-Person Household | 109 (82.0%) | 24 (18.0%) |
| 3-Person Household | 31 (100.0%) | 0 (0.0%) |
| 4+ Person Household | 16 (100.0%) | 0 (0.0%) |
| Total Housing Units | 290 (83.8%) | 56 (16.2%) |
Occupancy by Educational Attainment in Beaverdale
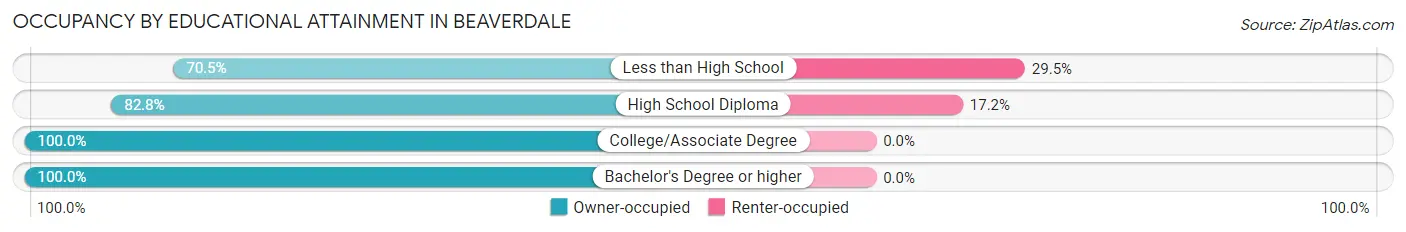
| Household Size | Owner-occupied | Renter-occupied |
| Less than High School | 55 (70.5%) | 23 (29.5%) |
| High School Diploma | 159 (82.8%) | 33 (17.2%) |
| College/Associate Degree | 55 (100.0%) | 0 (0.0%) |
| Bachelor's Degree or higher | 21 (100.0%) | 0 (0.0%) |
Occupancy by Age of Householder in Beaverdale
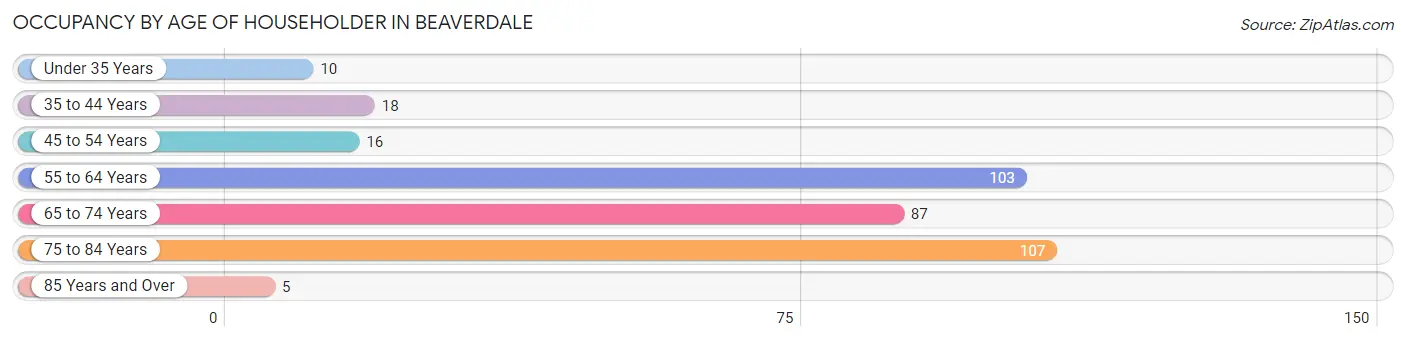
| Age Bracket | # Households | % Households |
| Under 35 Years | 10 | 2.9% |
| 35 to 44 Years | 18 | 5.2% |
| 45 to 54 Years | 16 | 4.6% |
| 55 to 64 Years | 103 | 29.8% |
| 65 to 74 Years | 87 | 25.1% |
| 75 to 84 Years | 107 | 30.9% |
| 85 Years and Over | 5 | 1.5% |
| Total | 346 | 100.0% |
Housing Finances in Beaverdale
Median Income by Occupancy in Beaverdale
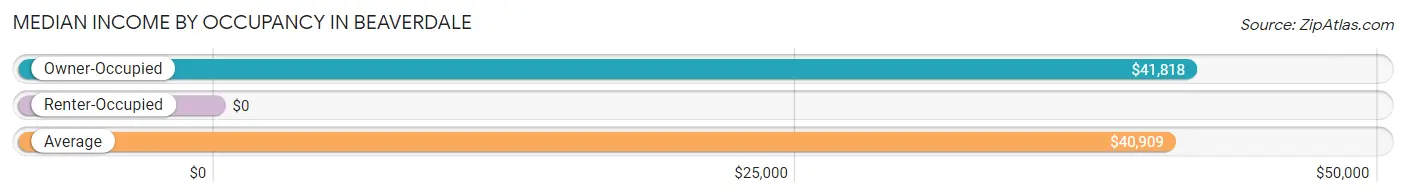
| Occupancy Type | # Households | Median Income |
| Owner-Occupied | 290 (83.8%) | $41,818 |
| Renter-Occupied | 56 (16.2%) | $0 |
| Average | 346 (100.0%) | $40,909 |
Occupancy by Householder Income Bracket in Beaverdale
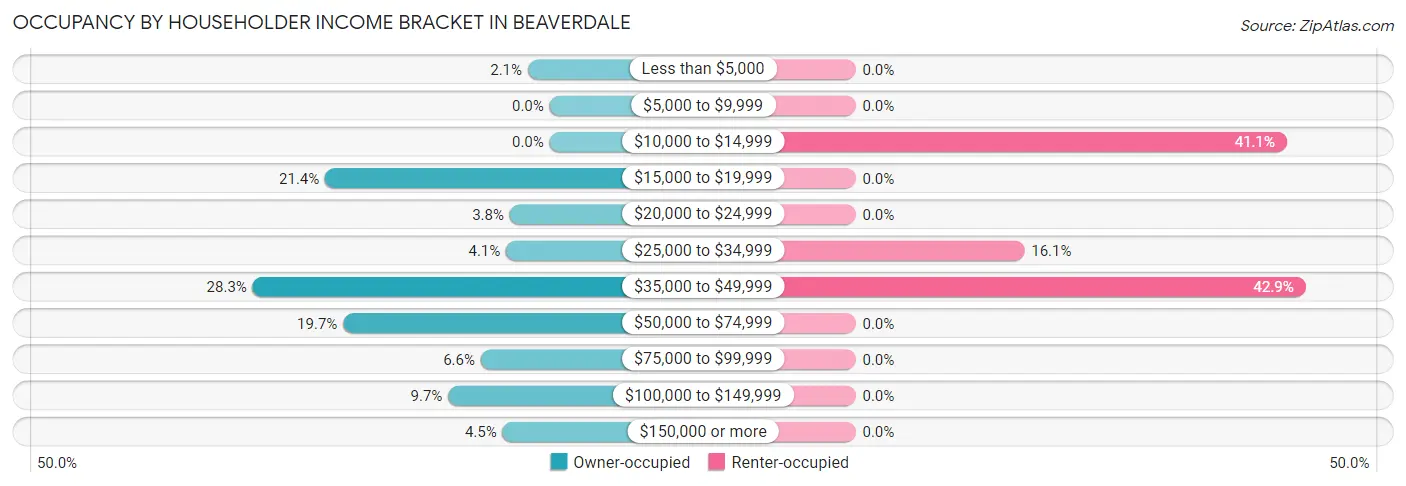
| Income Bracket | Owner-occupied | Renter-occupied |
| Less than $5,000 | 6 (2.1%) | 0 (0.0%) |
| $5,000 to $9,999 | 0 (0.0%) | 0 (0.0%) |
| $10,000 to $14,999 | 0 (0.0%) | 23 (41.1%) |
| $15,000 to $19,999 | 62 (21.4%) | 0 (0.0%) |
| $20,000 to $24,999 | 11 (3.8%) | 0 (0.0%) |
| $25,000 to $34,999 | 12 (4.1%) | 9 (16.1%) |
| $35,000 to $49,999 | 82 (28.3%) | 24 (42.9%) |
| $50,000 to $74,999 | 57 (19.7%) | 0 (0.0%) |
| $75,000 to $99,999 | 19 (6.6%) | 0 (0.0%) |
| $100,000 to $149,999 | 28 (9.7%) | 0 (0.0%) |
| $150,000 or more | 13 (4.5%) | 0 (0.0%) |
| Total | 290 (100.0%) | 56 (100.0%) |
Monthly Housing Cost Tiers in Beaverdale
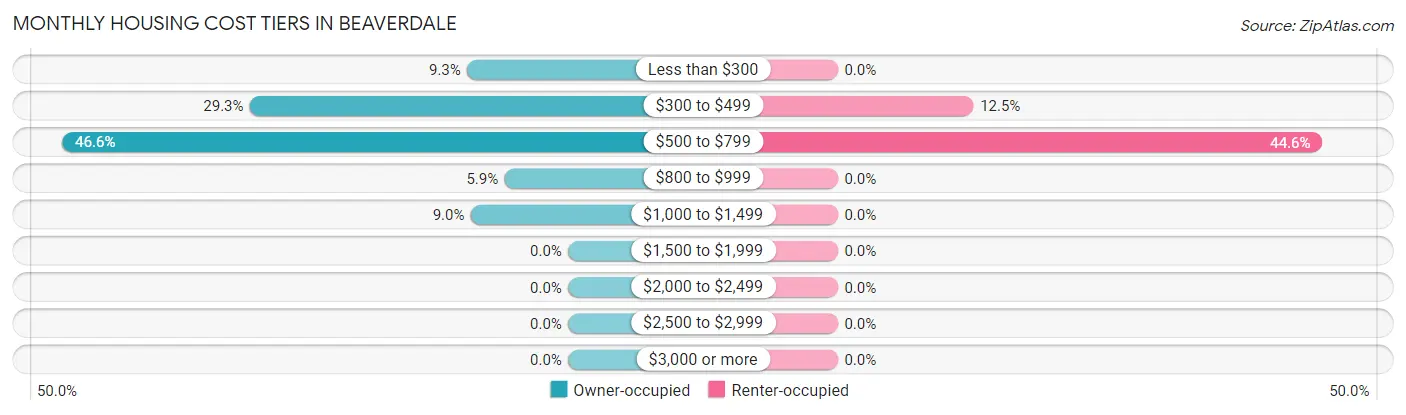
| Monthly Cost | Owner-occupied | Renter-occupied |
| Less than $300 | 27 (9.3%) | 0 (0.0%) |
| $300 to $499 | 85 (29.3%) | 7 (12.5%) |
| $500 to $799 | 135 (46.6%) | 25 (44.6%) |
| $800 to $999 | 17 (5.9%) | 0 (0.0%) |
| $1,000 to $1,499 | 26 (9.0%) | 0 (0.0%) |
| $1,500 to $1,999 | 0 (0.0%) | 0 (0.0%) |
| $2,000 to $2,499 | 0 (0.0%) | 0 (0.0%) |
| $2,500 to $2,999 | 0 (0.0%) | 0 (0.0%) |
| $3,000 or more | 0 (0.0%) | 0 (0.0%) |
| Total | 290 (100.0%) | 56 (100.0%) |
Physical Housing Characteristics in Beaverdale
Housing Structures in Beaverdale
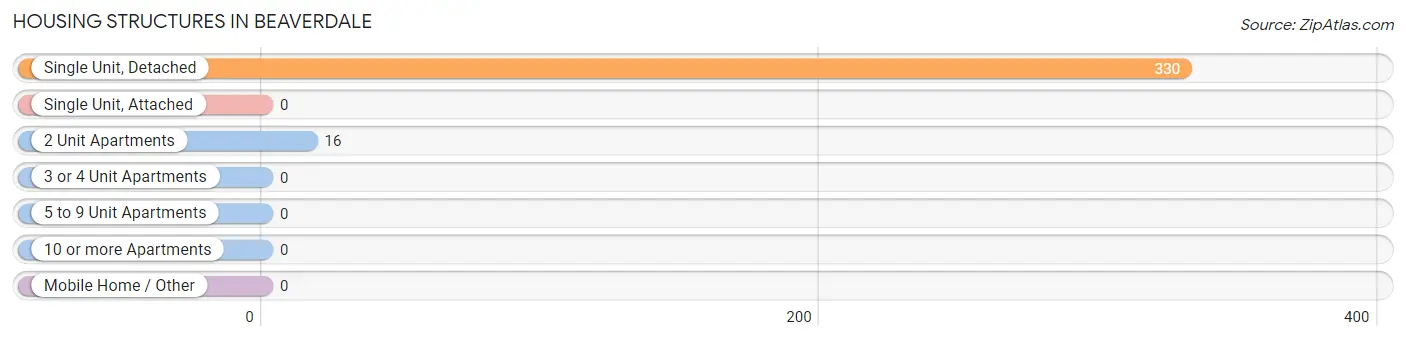
| Structure Type | # Housing Units | % Housing Units |
| Single Unit, Detached | 330 | 95.4% |
| Single Unit, Attached | 0 | 0.0% |
| 2 Unit Apartments | 16 | 4.6% |
| 3 or 4 Unit Apartments | 0 | 0.0% |
| 5 to 9 Unit Apartments | 0 | 0.0% |
| 10 or more Apartments | 0 | 0.0% |
| Mobile Home / Other | 0 | 0.0% |
| Total | 346 | 100.0% |
Housing Structures by Occupancy in Beaverdale
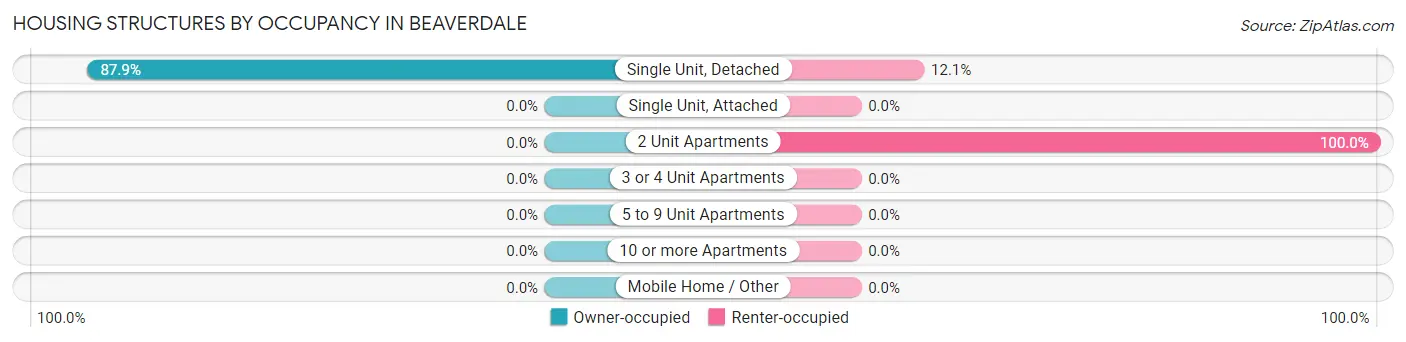
| Structure Type | Owner-occupied | Renter-occupied |
| Single Unit, Detached | 290 (87.9%) | 40 (12.1%) |
| Single Unit, Attached | 0 (0.0%) | 0 (0.0%) |
| 2 Unit Apartments | 0 (0.0%) | 16 (100.0%) |
| 3 or 4 Unit Apartments | 0 (0.0%) | 0 (0.0%) |
| 5 to 9 Unit Apartments | 0 (0.0%) | 0 (0.0%) |
| 10 or more Apartments | 0 (0.0%) | 0 (0.0%) |
| Mobile Home / Other | 0 (0.0%) | 0 (0.0%) |
| Total | 290 (83.8%) | 56 (16.2%) |
Housing Structures by Number of Rooms in Beaverdale
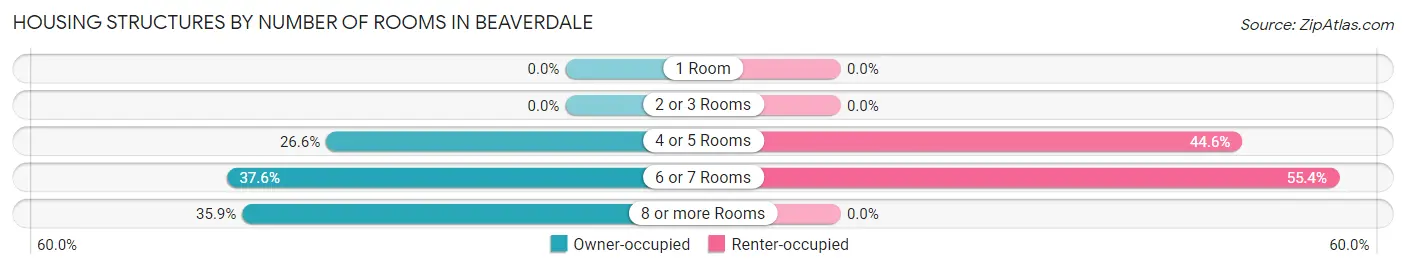
| Number of Rooms | Owner-occupied | Renter-occupied |
| 1 Room | 0 (0.0%) | 0 (0.0%) |
| 2 or 3 Rooms | 0 (0.0%) | 0 (0.0%) |
| 4 or 5 Rooms | 77 (26.6%) | 25 (44.6%) |
| 6 or 7 Rooms | 109 (37.6%) | 31 (55.4%) |
| 8 or more Rooms | 104 (35.9%) | 0 (0.0%) |
| Total | 290 (100.0%) | 56 (100.0%) |
Housing Structure by Heating Type in Beaverdale
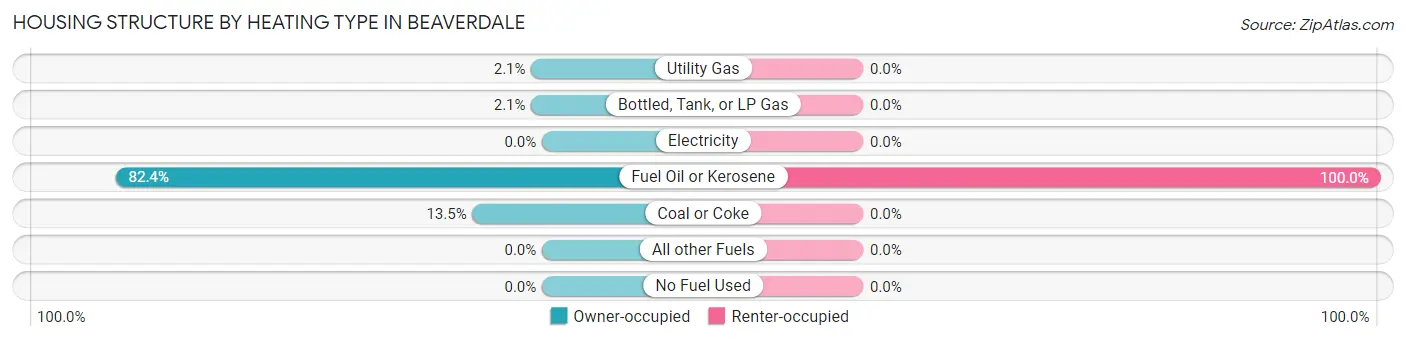
| Heating Type | Owner-occupied | Renter-occupied |
| Utility Gas | 6 (2.1%) | 0 (0.0%) |
| Bottled, Tank, or LP Gas | 6 (2.1%) | 0 (0.0%) |
| Electricity | 0 (0.0%) | 0 (0.0%) |
| Fuel Oil or Kerosene | 239 (82.4%) | 56 (100.0%) |
| Coal or Coke | 39 (13.5%) | 0 (0.0%) |
| All other Fuels | 0 (0.0%) | 0 (0.0%) |
| No Fuel Used | 0 (0.0%) | 0 (0.0%) |
| Total | 290 (100.0%) | 56 (100.0%) |
Household Vehicle Usage in Beaverdale
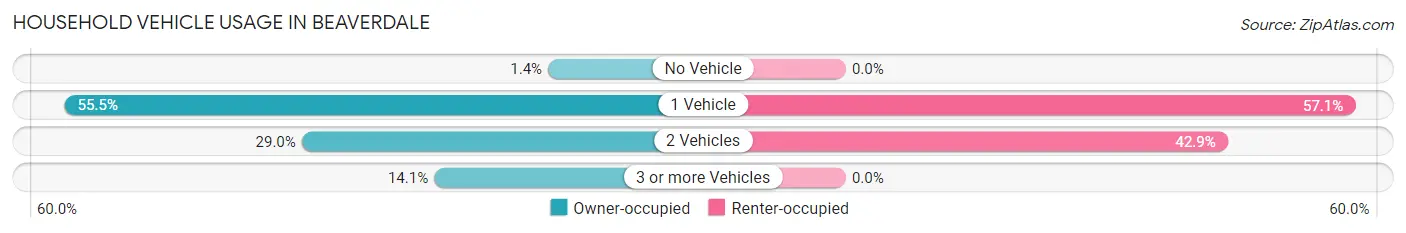
| Vehicles per Household | Owner-occupied | Renter-occupied |
| No Vehicle | 4 (1.4%) | 0 (0.0%) |
| 1 Vehicle | 161 (55.5%) | 32 (57.1%) |
| 2 Vehicles | 84 (29.0%) | 24 (42.9%) |
| 3 or more Vehicles | 41 (14.1%) | 0 (0.0%) |
| Total | 290 (100.0%) | 56 (100.0%) |
Real Estate & Mortgages in Beaverdale
Real Estate and Mortgage Overview in Beaverdale
| Characteristic | Without Mortgage | With Mortgage |
| Housing Units | 199 | 91 |
| Median Property Value | $75,600 | $70,200 |
| Median Household Income | $39,327 | $7 |
| Monthly Housing Costs | $440 | $0 |
| Real Estate Taxes | $844 | $6 |
Property Value by Mortgage Status in Beaverdale
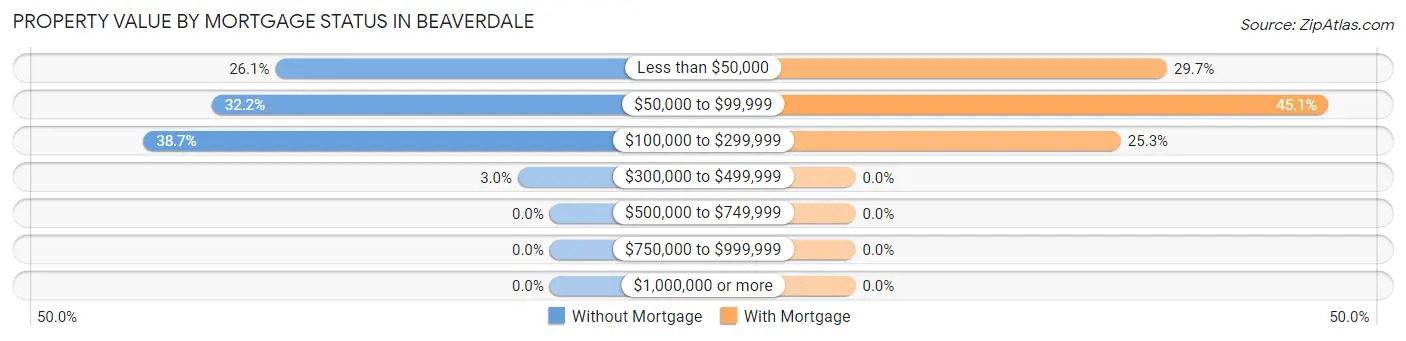
| Property Value | Without Mortgage | With Mortgage |
| Less than $50,000 | 52 (26.1%) | 27 (29.7%) |
| $50,000 to $99,999 | 64 (32.2%) | 41 (45.1%) |
| $100,000 to $299,999 | 77 (38.7%) | 23 (25.3%) |
| $300,000 to $499,999 | 6 (3.0%) | 0 (0.0%) |
| $500,000 to $749,999 | 0 (0.0%) | 0 (0.0%) |
| $750,000 to $999,999 | 0 (0.0%) | 0 (0.0%) |
| $1,000,000 or more | 0 (0.0%) | 0 (0.0%) |
| Total | 199 (100.0%) | 91 (100.0%) |
Household Income by Mortgage Status in Beaverdale
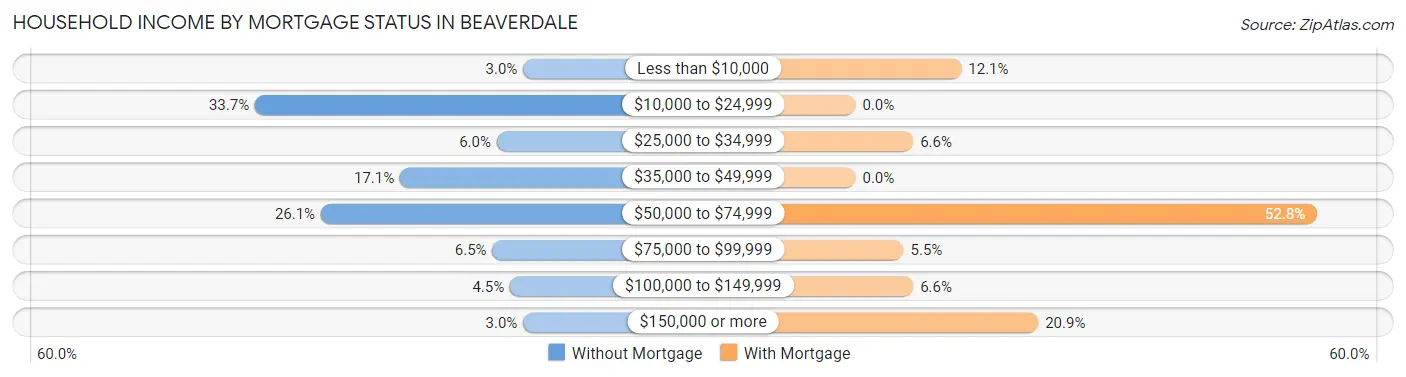
| Household Income | Without Mortgage | With Mortgage |
| Less than $10,000 | 6 (3.0%) | 11 (12.1%) |
| $10,000 to $24,999 | 67 (33.7%) | 0 (0.0%) |
| $25,000 to $34,999 | 12 (6.0%) | 6 (6.6%) |
| $35,000 to $49,999 | 34 (17.1%) | 0 (0.0%) |
| $50,000 to $74,999 | 52 (26.1%) | 48 (52.7%) |
| $75,000 to $99,999 | 13 (6.5%) | 5 (5.5%) |
| $100,000 to $149,999 | 9 (4.5%) | 6 (6.6%) |
| $150,000 or more | 6 (3.0%) | 19 (20.9%) |
| Total | 199 (100.0%) | 91 (100.0%) |
Property Value to Household Income Ratio in Beaverdale
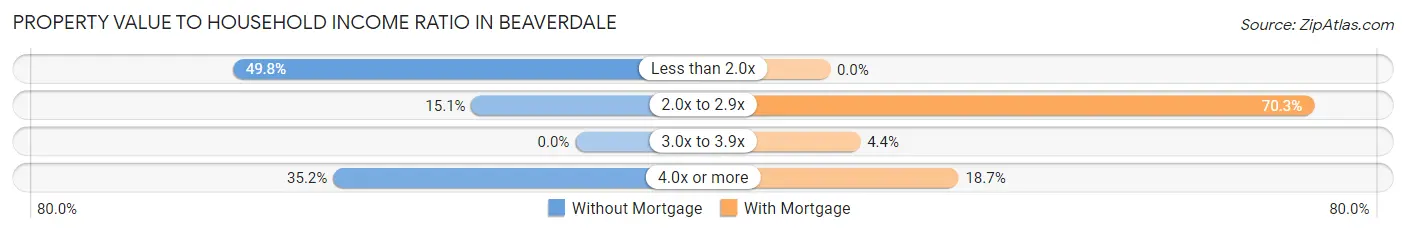
| Value-to-Income Ratio | Without Mortgage | With Mortgage |
| Less than 2.0x | 99 (49.7%) | 0 (0.0%) |
| 2.0x to 2.9x | 30 (15.1%) | 64 (70.3%) |
| 3.0x to 3.9x | 0 (0.0%) | 4 (4.4%) |
| 4.0x or more | 70 (35.2%) | 17 (18.7%) |
| Total | 199 (100.0%) | 91 (100.0%) |
Real Estate Taxes by Mortgage Status in Beaverdale
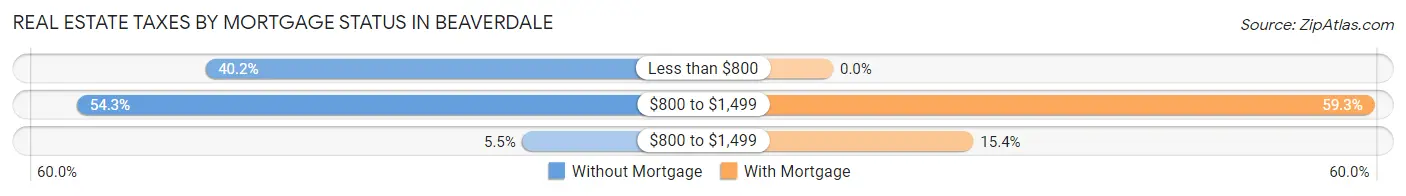
| Property Taxes | Without Mortgage | With Mortgage |
| Less than $800 | 80 (40.2%) | 0 (0.0%) |
| $800 to $1,499 | 108 (54.3%) | 54 (59.3%) |
| $800 to $1,499 | 11 (5.5%) | 14 (15.4%) |
| Total | 199 (100.0%) | 91 (100.0%) |
Health & Disability in Beaverdale
Health Insurance Coverage by Age in Beaverdale
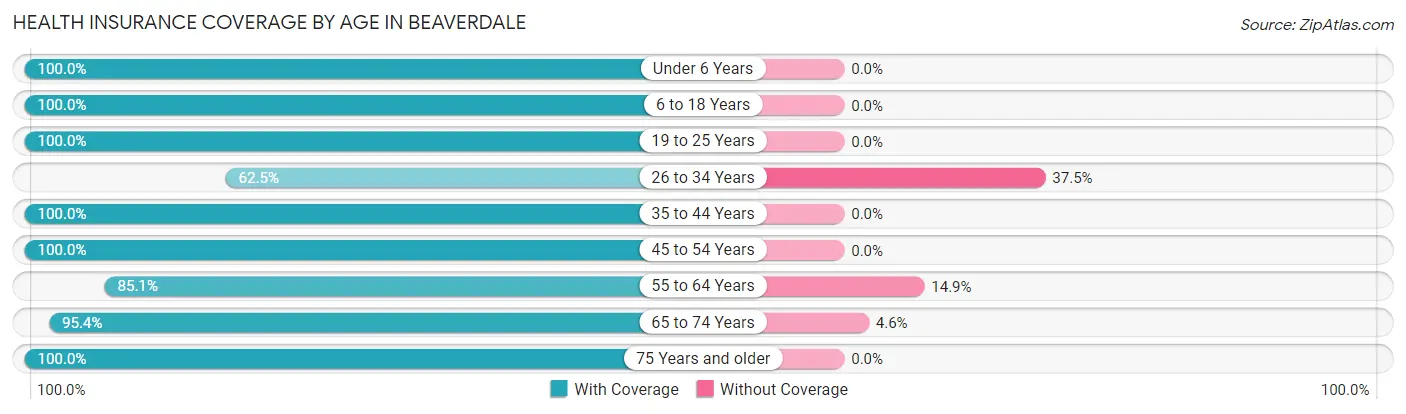
| Age Bracket | With Coverage | Without Coverage |
| Under 6 Years | 12 (100.0%) | 0 (0.0%) |
| 6 to 18 Years | 61 (100.0%) | 0 (0.0%) |
| 19 to 25 Years | 13 (100.0%) | 0 (0.0%) |
| 26 to 34 Years | 5 (62.5%) | 3 (37.5%) |
| 35 to 44 Years | 33 (100.0%) | 0 (0.0%) |
| 45 to 54 Years | 102 (100.0%) | 0 (0.0%) |
| 55 to 64 Years | 114 (85.1%) | 20 (14.9%) |
| 65 to 74 Years | 146 (95.4%) | 7 (4.6%) |
| 75 Years and older | 134 (100.0%) | 0 (0.0%) |
| Total | 620 (95.4%) | 30 (4.6%) |
Health Insurance Coverage by Citizenship Status in Beaverdale
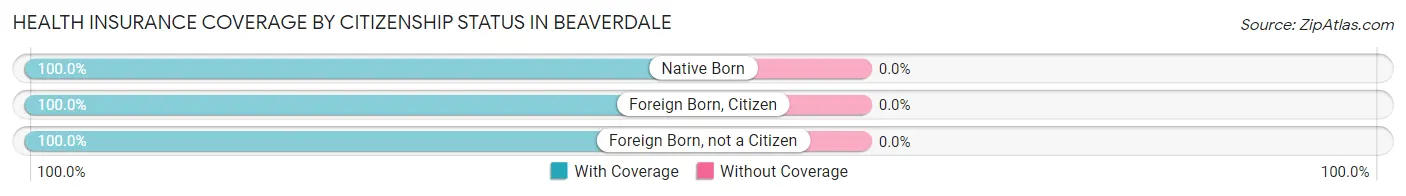
| Citizenship Status | With Coverage | Without Coverage |
| Native Born | 12 (100.0%) | 0 (0.0%) |
| Foreign Born, Citizen | 61 (100.0%) | 0 (0.0%) |
| Foreign Born, not a Citizen | 13 (100.0%) | 0 (0.0%) |
Health Insurance Coverage by Household Income in Beaverdale
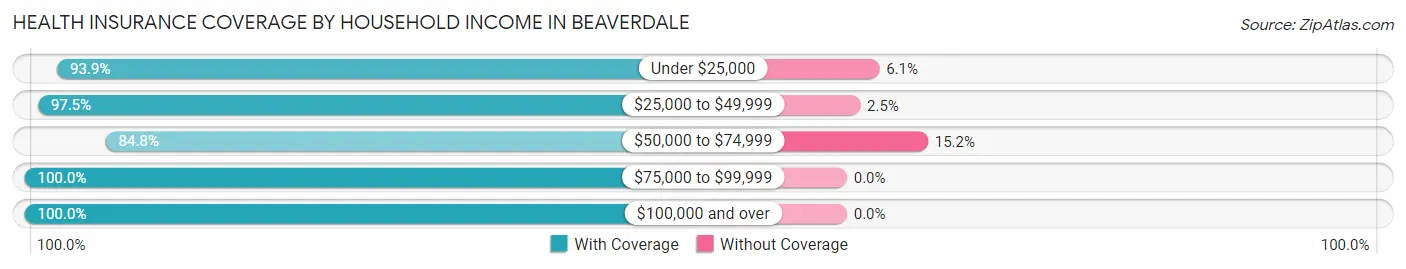
| Household Income | With Coverage | Without Coverage |
| Under $25,000 | 108 (93.9%) | 7 (6.1%) |
| $25,000 to $49,999 | 235 (97.5%) | 6 (2.5%) |
| $50,000 to $74,999 | 95 (84.8%) | 17 (15.2%) |
| $75,000 to $99,999 | 73 (100.0%) | 0 (0.0%) |
| $100,000 and over | 109 (100.0%) | 0 (0.0%) |
Public vs Private Health Insurance Coverage by Age in Beaverdale
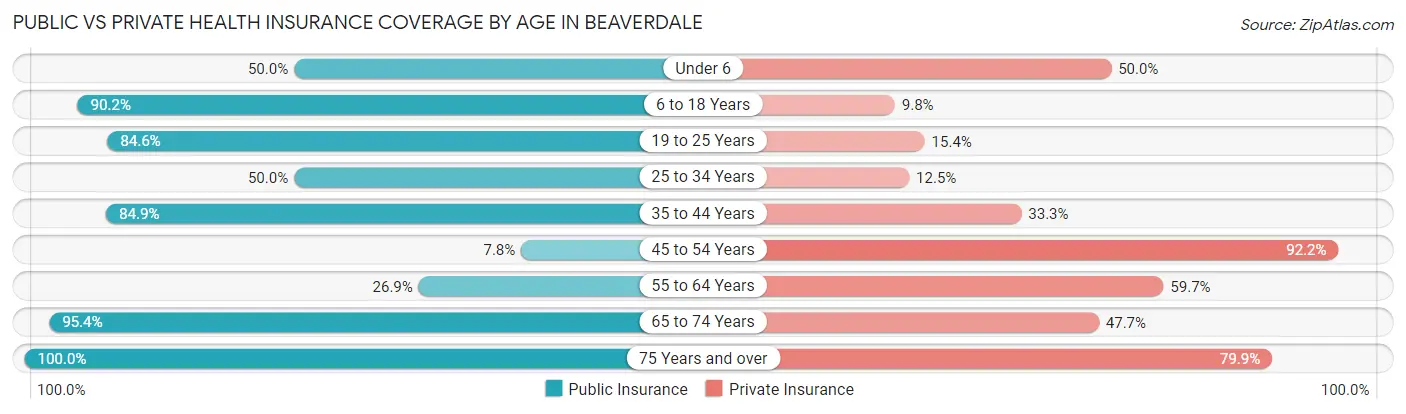
| Age Bracket | Public Insurance | Private Insurance |
| Under 6 | 6 (50.0%) | 6 (50.0%) |
| 6 to 18 Years | 55 (90.2%) | 6 (9.8%) |
| 19 to 25 Years | 11 (84.6%) | 2 (15.4%) |
| 25 to 34 Years | 4 (50.0%) | 1 (12.5%) |
| 35 to 44 Years | 28 (84.9%) | 11 (33.3%) |
| 45 to 54 Years | 8 (7.8%) | 94 (92.2%) |
| 55 to 64 Years | 36 (26.9%) | 80 (59.7%) |
| 65 to 74 Years | 146 (95.4%) | 73 (47.7%) |
| 75 Years and over | 134 (100.0%) | 107 (79.8%) |
| Total | 428 (65.8%) | 380 (58.5%) |
Disability Status by Sex by Age in Beaverdale
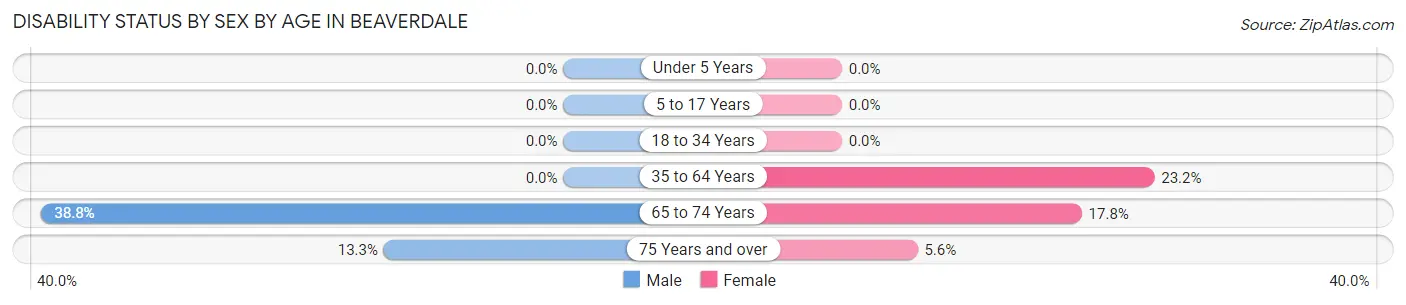
| Age Bracket | Male | Female |
| Under 5 Years | 0 (0.0%) | 0 (0.0%) |
| 5 to 17 Years | 0 (0.0%) | 0 (0.0%) |
| 18 to 34 Years | 0 (0.0%) | 0 (0.0%) |
| 35 to 64 Years | 0 (0.0%) | 45 (23.2%) |
| 65 to 74 Years | 31 (38.8%) | 13 (17.8%) |
| 75 Years and over | 6 (13.3%) | 5 (5.6%) |
Disability Class by Sex by Age in Beaverdale
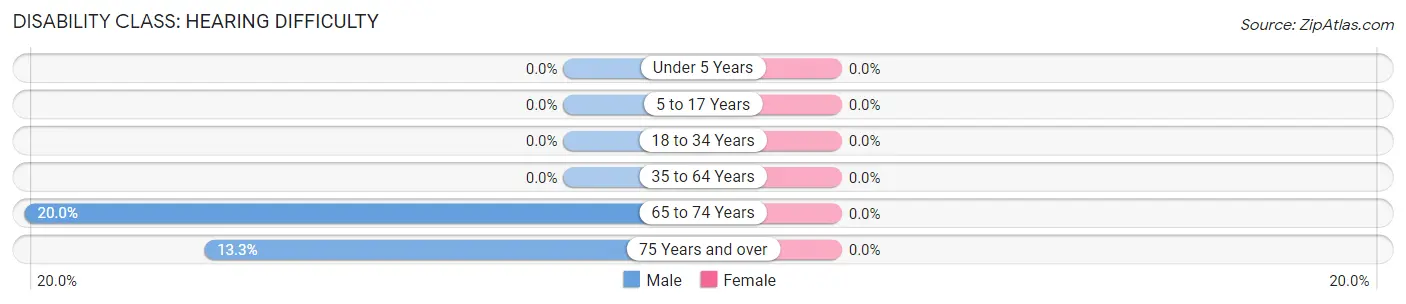
Disability Class: Hearing Difficulty
| Age Bracket | Male | Female |
| Under 5 Years | 0 (0.0%) | 0 (0.0%) |
| 5 to 17 Years | 0 (0.0%) | 0 (0.0%) |
| 18 to 34 Years | 0 (0.0%) | 0 (0.0%) |
| 35 to 64 Years | 0 (0.0%) | 0 (0.0%) |
| 65 to 74 Years | 16 (20.0%) | 0 (0.0%) |
| 75 Years and over | 6 (13.3%) | 0 (0.0%) |
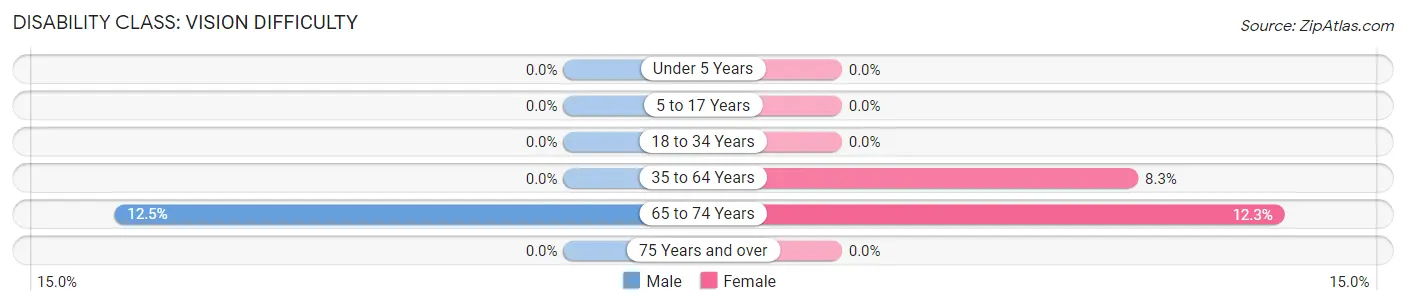
Disability Class: Vision Difficulty
| Age Bracket | Male | Female |
| Under 5 Years | 0 (0.0%) | 0 (0.0%) |
| 5 to 17 Years | 0 (0.0%) | 0 (0.0%) |
| 18 to 34 Years | 0 (0.0%) | 0 (0.0%) |
| 35 to 64 Years | 0 (0.0%) | 16 (8.3%) |
| 65 to 74 Years | 10 (12.5%) | 9 (12.3%) |
| 75 Years and over | 0 (0.0%) | 0 (0.0%) |
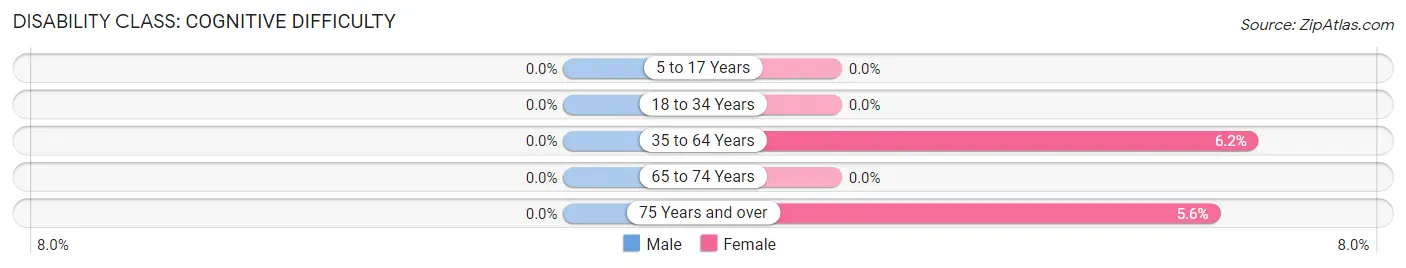
Disability Class: Cognitive Difficulty
| Age Bracket | Male | Female |
| 5 to 17 Years | 0 (0.0%) | 0 (0.0%) |
| 18 to 34 Years | 0 (0.0%) | 0 (0.0%) |
| 35 to 64 Years | 0 (0.0%) | 12 (6.2%) |
| 65 to 74 Years | 0 (0.0%) | 0 (0.0%) |
| 75 Years and over | 0 (0.0%) | 5 (5.6%) |
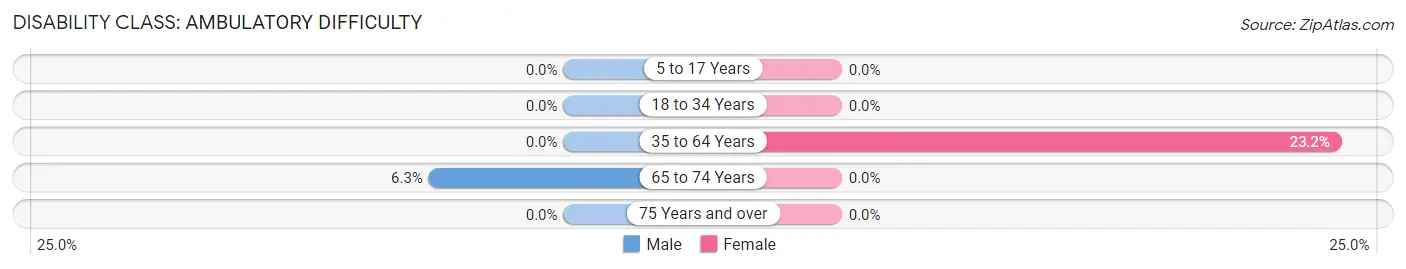
Disability Class: Ambulatory Difficulty
| Age Bracket | Male | Female |
| 5 to 17 Years | 0 (0.0%) | 0 (0.0%) |
| 18 to 34 Years | 0 (0.0%) | 0 (0.0%) |
| 35 to 64 Years | 0 (0.0%) | 45 (23.2%) |
| 65 to 74 Years | 5 (6.2%) | 0 (0.0%) |
| 75 Years and over | 0 (0.0%) | 0 (0.0%) |
Disability Class: Self-Care Difficulty
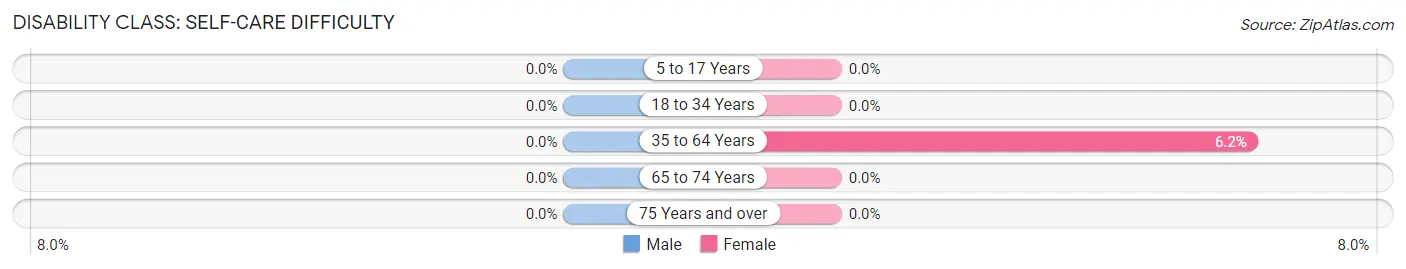
| Age Bracket | Male | Female |
| 5 to 17 Years | 0 (0.0%) | 0 (0.0%) |
| 18 to 34 Years | 0 (0.0%) | 0 (0.0%) |
| 35 to 64 Years | 0 (0.0%) | 12 (6.2%) |
| 65 to 74 Years | 0 (0.0%) | 0 (0.0%) |
| 75 Years and over | 0 (0.0%) | 0 (0.0%) |
Technology Access in Beaverdale
Computing Device Access in Beaverdale
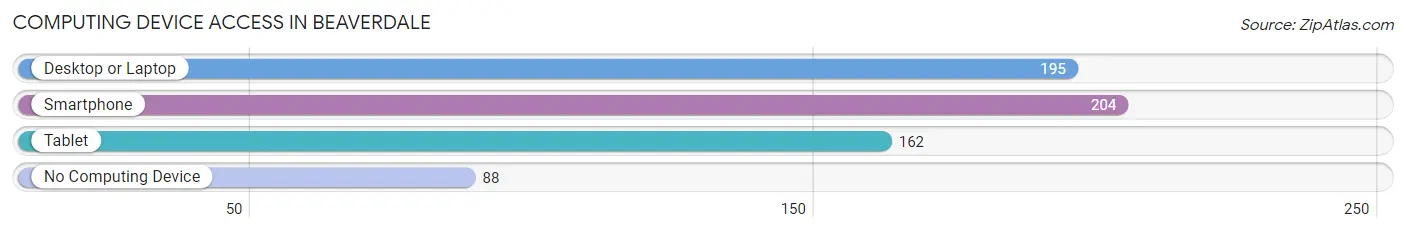
| Device Type | # Households | % Households |
| Desktop or Laptop | 195 | 56.4% |
| Smartphone | 204 | 59.0% |
| Tablet | 162 | 46.8% |
| No Computing Device | 88 | 25.4% |
| Total | 346 | 100.0% |
Internet Access in Beaverdale
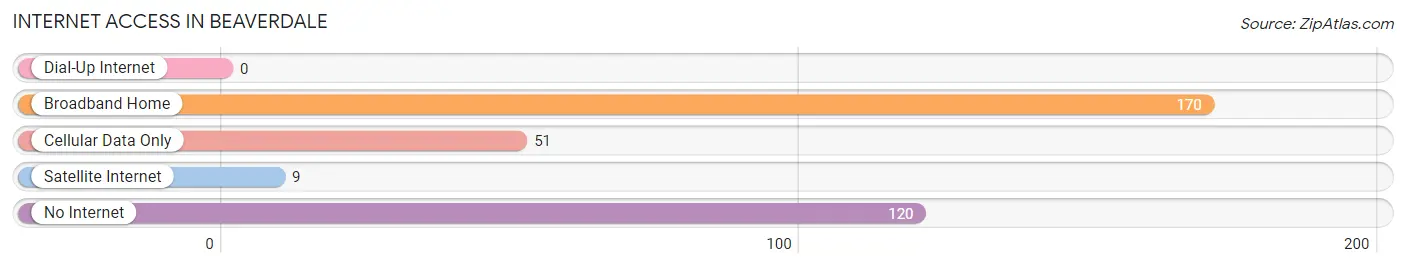
| Internet Type | # Households | % Households |
| Dial-Up Internet | 0 | 0.0% |
| Broadband Home | 170 | 49.1% |
| Cellular Data Only | 51 | 14.7% |
| Satellite Internet | 9 | 2.6% |
| No Internet | 120 | 34.7% |
| Total | 346 | 100.0% |
Beaverdale Summary
Beaverdale is a small borough located in Cambria County, Pennsylvania. It is situated in the foothills of the Allegheny Mountains, approximately 10 miles east of Johnstown. The borough was founded in 1876 and has a population of approximately 1,000 people.
History
Beaverdale was founded in 1876 by a group of settlers from the nearby town of Johnstown. The settlers were looking for a place to build a new community and chose the area due to its proximity to the Allegheny Mountains. The town was named after the nearby Beaver Creek, which was a popular spot for fishing and hunting.
The first settlers of Beaverdale were mostly farmers and miners. The town quickly grew and by the early 1900s, it had become a thriving community with a variety of businesses, including a general store, a blacksmith shop, a sawmill, and a gristmill.
In the early 1900s, Beaverdale was a popular destination for tourists. The town was known for its scenic beauty and its abundance of outdoor activities, such as fishing, hunting, and camping.
Geography
Beaverdale is located in the foothills of the Allegheny Mountains in Cambria County, Pennsylvania. The borough is situated on the banks of the Beaver Creek, which is a tributary of the Conemaugh River. The borough is surrounded by the towns of Johnstown, Ebensburg, and Portage.
The terrain of Beaverdale is mostly hilly and forested. The borough is home to several parks, including Beaverdale Park, which is a popular spot for picnics and outdoor activities.
Economy
Beaverdale’s economy is largely based on tourism and agriculture. The town is home to several small businesses, including a general store, a blacksmith shop, and a sawmill. The town also has a few restaurants and bars.
The town is also home to several small farms, which produce a variety of crops, including corn, wheat, and hay. The town is also home to several wineries, which produce a variety of wines.
Demographics
As of the 2010 census, Beaverdale had a population of 1,000 people. The racial makeup of the borough was 97.2% White, 0.7% African American, 0.2% Native American, 0.2% Asian, and 1.7% from two or more races.
The median household income in Beaverdale was $37,500, and the median family income was $45,000. The per capita income in the borough was $18,000. Approximately 8.7% of the population was below the poverty line.
Beaverdale is a small borough with a rich history and a vibrant economy. The town is home to a variety of businesses and is a popular destination for tourists. The town is also home to several small farms, which produce a variety of crops. The town has a population of 1,000 people and is a great place to live and work.
Common Questions
What is Per Capita Income in Beaverdale?
Per Capita income in Beaverdale is $31,604.
What is the Median Family Income in Beaverdale?
Median Family Income in Beaverdale is $58,500.
What is the Median Household income in Beaverdale?
Median Household Income in Beaverdale is $40,909.
What is Income or Wage Gap in Beaverdale?
Income or Wage Gap in Beaverdale is 39.0%.
Women in Beaverdale earn 61.0 cents for every dollar earned by a man.
What is Inequality or Gini Index in Beaverdale?
Inequality or Gini Index in Beaverdale is 0.38.
What is the Total Population of Beaverdale?
Total Population of Beaverdale is 650.
What is the Total Male Population of Beaverdale?
Total Male Population of Beaverdale is 258.
What is the Total Female Population of Beaverdale?
Total Female Population of Beaverdale is 392.
What is the Ratio of Males per 100 Females in Beaverdale?
There are 65.82 Males per 100 Females in Beaverdale.
What is the Ratio of Females per 100 Males in Beaverdale?
There are 151.94 Females per 100 Males in Beaverdale.
What is the Median Population Age in Beaverdale?
Median Population Age in Beaverdale is 64.0 Years.
What is the Average Family Size in Beaverdale
Average Family Size in Beaverdale is 2.9 People.
What is the Average Household Size in Beaverdale
Average Household Size in Beaverdale is 1.9 People.
How Large is the Labor Force in Beaverdale?
There are 271 People in the Labor Forcein in Beaverdale.
What is the Percentage of People in the Labor Force in Beaverdale?
46.5% of People are in the Labor Force in Beaverdale.
What is the Unemployment Rate in Beaverdale?
Unemployment Rate in Beaverdale is 1.5%.