St Petersburg borough, PA Map & Demographics
St Petersburg borough Overview
$30,702
PER CAPITA INCOME
$68,750
AVG FAMILY INCOME
$49,750
AVG HOUSEHOLD INCOME
59.3%
WAGE / INCOME GAP [ % ]
40.7¢/ $1
WAGE / INCOME GAP [ $ ]
0.37
INEQUALITY / GINI INDEX
272
TOTAL POPULATION
140
MALE POPULATION
132
FEMALE POPULATION
106.06
MALES / 100 FEMALES
94.29
FEMALES / 100 MALES
55.6
MEDIAN AGE
2.4
AVG FAMILY SIZE
2.0
AVG HOUSEHOLD SIZE
129
LABOR FORCE [ PEOPLE ]
51.0%
PERCENT IN LABOR FORCE
9.3%
UNEMPLOYMENT RATE
Income in St Petersburg borough
Income Overview in St Petersburg borough
Per Capita Income in St Petersburg borough is $30,702, while median incomes of families and households are $68,750 and $49,750 respectively.
| Characteristic | Number | Measure |
| Per Capita Income | 272 | $30,702 |
| Median Family Income | 74 | $68,750 |
| Mean Family Income | 74 | $73,555 |
| Median Household Income | 135 | $49,750 |
| Mean Household Income | 135 | $60,020 |
| Income Deficit | 74 | $0 |
| Wage / Income Gap (%) | 272 | 59.32% |
| Wage / Income Gap ($) | 272 | 40.68¢ per $1 |
| Gini / Inequality Index | 272 | 0.37 |
Earnings by Sex in St Petersburg borough
Average Earnings in St Petersburg borough are $35,000, $49,167 for men and $20,000 for women, a difference of 59.3%.
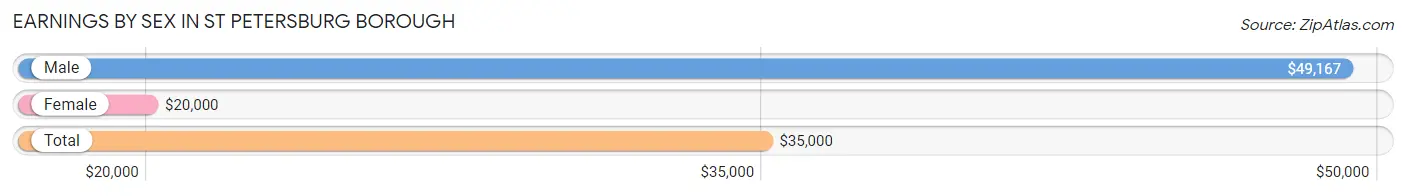
| Sex | Number | Average Earnings |
| Male | 66 (50.8%) | $49,167 |
| Female | 64 (49.2%) | $20,000 |
| Total | 130 (100.0%) | $35,000 |
Earnings by Sex by Income Bracket in St Petersburg borough
The most common earnings brackets in St Petersburg borough are $50,000 to $54,999 for men (12 | 18.2%) and $2,499 or less for women (10 | 15.6%).
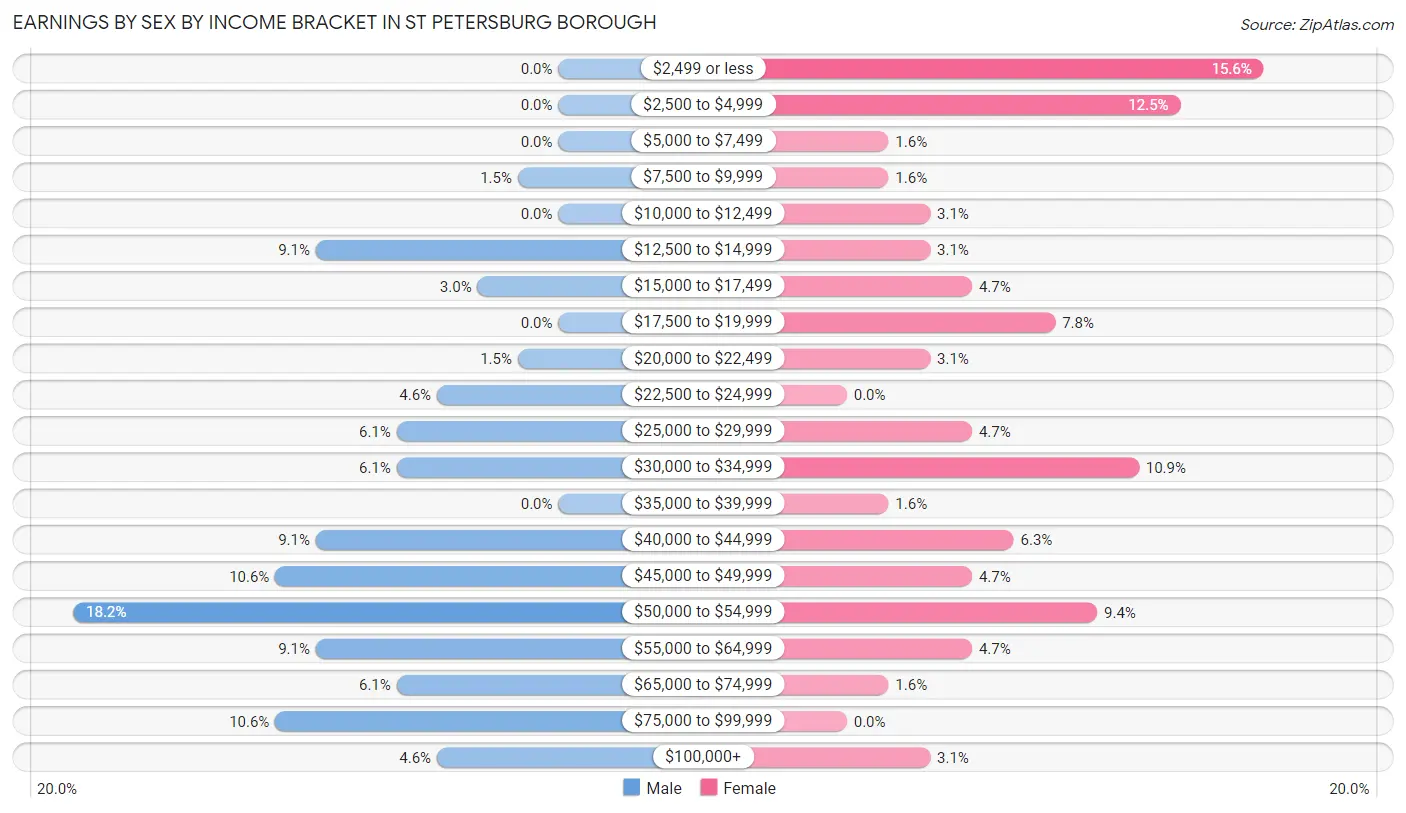
| Income | Male | Female |
| $2,499 or less | 0 (0.0%) | 10 (15.6%) |
| $2,500 to $4,999 | 0 (0.0%) | 8 (12.5%) |
| $5,000 to $7,499 | 0 (0.0%) | 1 (1.6%) |
| $7,500 to $9,999 | 1 (1.5%) | 1 (1.6%) |
| $10,000 to $12,499 | 0 (0.0%) | 2 (3.1%) |
| $12,500 to $14,999 | 6 (9.1%) | 2 (3.1%) |
| $15,000 to $17,499 | 2 (3.0%) | 3 (4.7%) |
| $17,500 to $19,999 | 0 (0.0%) | 5 (7.8%) |
| $20,000 to $22,499 | 1 (1.5%) | 2 (3.1%) |
| $22,500 to $24,999 | 3 (4.5%) | 0 (0.0%) |
| $25,000 to $29,999 | 4 (6.1%) | 3 (4.7%) |
| $30,000 to $34,999 | 4 (6.1%) | 7 (10.9%) |
| $35,000 to $39,999 | 0 (0.0%) | 1 (1.6%) |
| $40,000 to $44,999 | 6 (9.1%) | 4 (6.2%) |
| $45,000 to $49,999 | 7 (10.6%) | 3 (4.7%) |
| $50,000 to $54,999 | 12 (18.2%) | 6 (9.4%) |
| $55,000 to $64,999 | 6 (9.1%) | 3 (4.7%) |
| $65,000 to $74,999 | 4 (6.1%) | 1 (1.6%) |
| $75,000 to $99,999 | 7 (10.6%) | 0 (0.0%) |
| $100,000+ | 3 (4.5%) | 2 (3.1%) |
| Total | 66 (100.0%) | 64 (100.0%) |
Earnings by Sex by Educational Attainment in St Petersburg borough
Average earnings in St Petersburg borough are $50,375 for men and $28,750 for women, a difference of 42.9%. Men with an educational attainment of college or associate's degree enjoy the highest average annual earnings of $61,250, while those with less than high school education earn the least with $48,333. Women with an educational attainment of college or associate's degree earn the most with the average annual earnings of $42,500, while those with bachelor's degree education have the smallest earnings of $3,958.
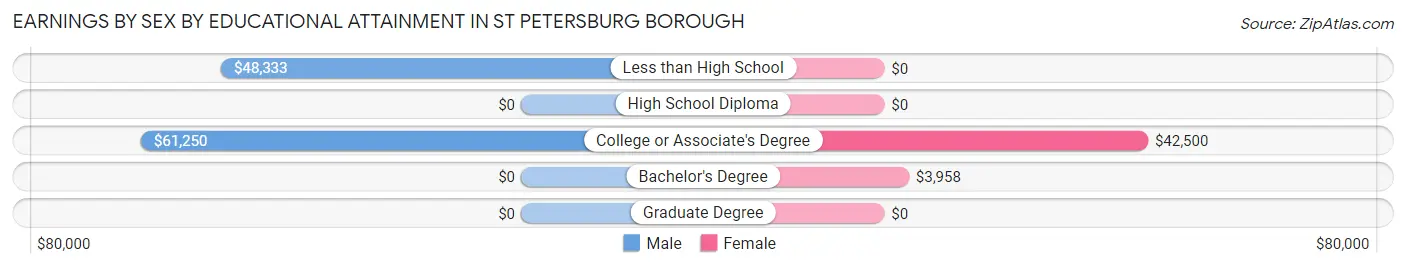
| Educational Attainment | Male Income | Female Income |
| Less than High School | $48,333 | $0 |
| High School Diploma | - | - |
| College or Associate's Degree | $61,250 | $42,500 |
| Bachelor's Degree | - | - |
| Graduate Degree | - | - |
| Total | $50,375 | $28,750 |
Family Income in St Petersburg borough
Family Income Brackets in St Petersburg borough
According to the St Petersburg borough family income data, there are 20 families falling into the $100,000 to $149,999 income range, which is the most common income bracket and makes up 27.0% of all families.
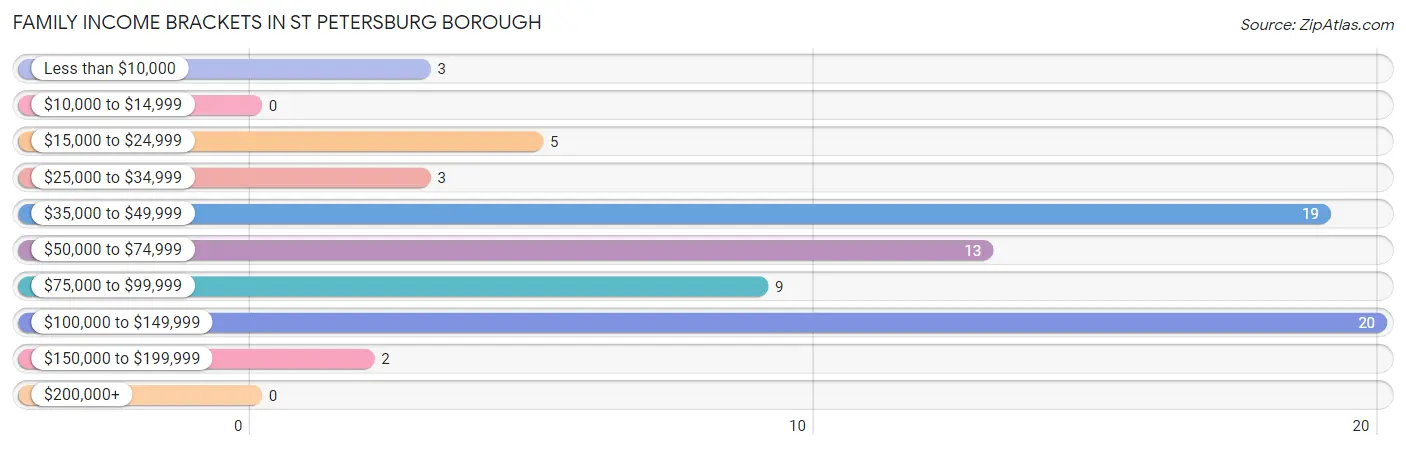
| Income Bracket | # Families | % Families |
| Less than $10,000 | 3 | 4.1% |
| $10,000 to $14,999 | 0 | 0.0% |
| $15,000 to $24,999 | 5 | 6.8% |
| $25,000 to $34,999 | 3 | 4.1% |
| $35,000 to $49,999 | 19 | 25.7% |
| $50,000 to $74,999 | 13 | 17.6% |
| $75,000 to $99,999 | 9 | 12.2% |
| $100,000 to $149,999 | 20 | 27.0% |
| $150,000 to $199,999 | 2 | 2.7% |
| $200,000+ | 0 | 0.0% |
Family Income by Famaliy Size in St Petersburg borough
4-person families (9 | 12.2%) account for the highest median family income in St Petersburg borough with $103,750 per family, while 2-person families (54 | 73.0%) have the highest median income of $28,750 per family member.
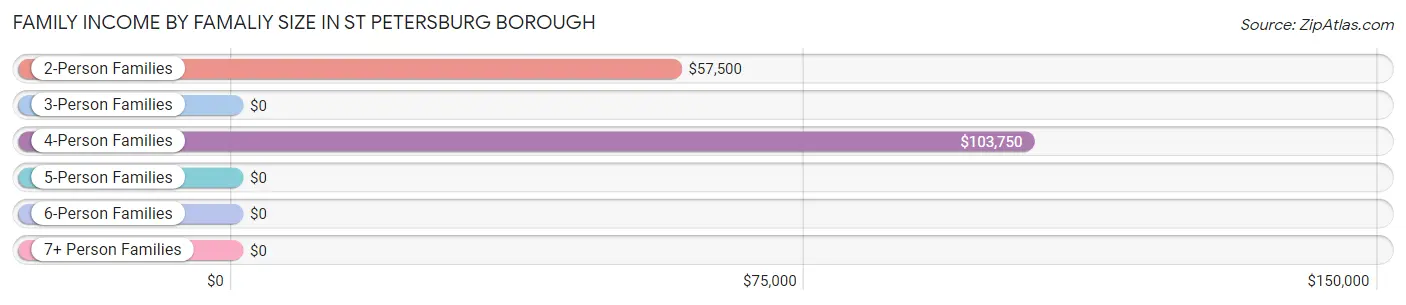
| Income Bracket | # Families | Median Income |
| 2-Person Families | 54 (73.0%) | $57,500 |
| 3-Person Families | 11 (14.9%) | $0 |
| 4-Person Families | 9 (12.2%) | $103,750 |
| 5-Person Families | 0 (0.0%) | $0 |
| 6-Person Families | 0 (0.0%) | $0 |
| 7+ Person Families | 0 (0.0%) | $0 |
| Total | 74 (100.0%) | $68,750 |
Family Income by Number of Earners in St Petersburg borough
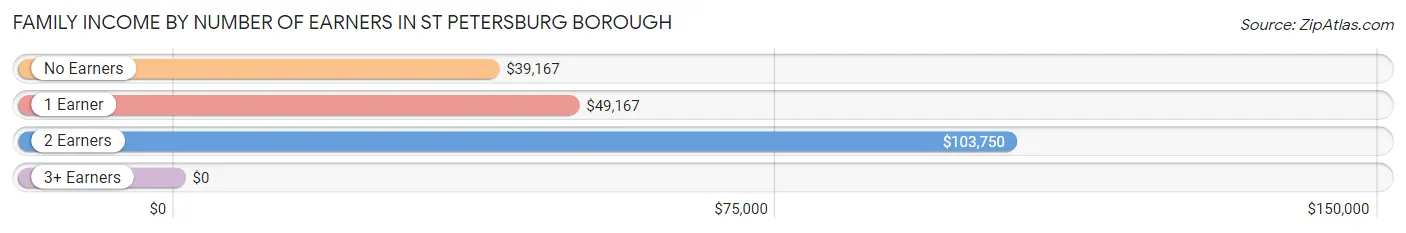
| Number of Earners | # Families | Median Income |
| No Earners | 28 (37.8%) | $39,167 |
| 1 Earner | 16 (21.6%) | $49,167 |
| 2 Earners | 27 (36.5%) | $103,750 |
| 3+ Earners | 3 (4.1%) | $0 |
| Total | 74 (100.0%) | $68,750 |
Household Income in St Petersburg borough
Household Income Brackets in St Petersburg borough
With 29 households falling in the category, the $35,000 to $49,999 income range is the most frequent in St Petersburg borough, accounting for 21.5% of all households.
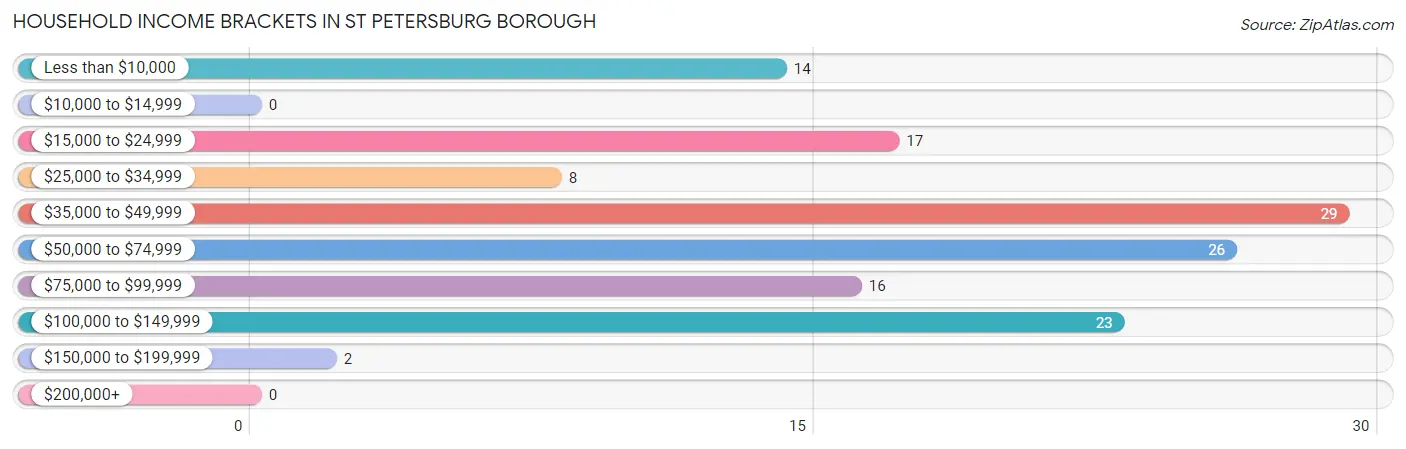
| Income Bracket | # Households | % Households |
| Less than $10,000 | 14 | 10.4% |
| $10,000 to $14,999 | 0 | 0.0% |
| $15,000 to $24,999 | 17 | 12.6% |
| $25,000 to $34,999 | 8 | 5.9% |
| $35,000 to $49,999 | 29 | 21.5% |
| $50,000 to $74,999 | 26 | 19.3% |
| $75,000 to $99,999 | 16 | 11.9% |
| $100,000 to $149,999 | 23 | 17.0% |
| $150,000 to $199,999 | 2 | 1.5% |
| $200,000+ | 0 | 0.0% |
Household Income by Householder Age in St Petersburg borough
The median household income in St Petersburg borough is $49,750, with the highest median household income of $73,750 found in the 25 to 44 years age bracket for the primary householder. A total of 20 households (14.8%) fall into this category. Meanwhile, the 15 to 24 years age bracket for the primary householder has the lowest median household income of $23,750, with 7 households (5.2%) in this group.
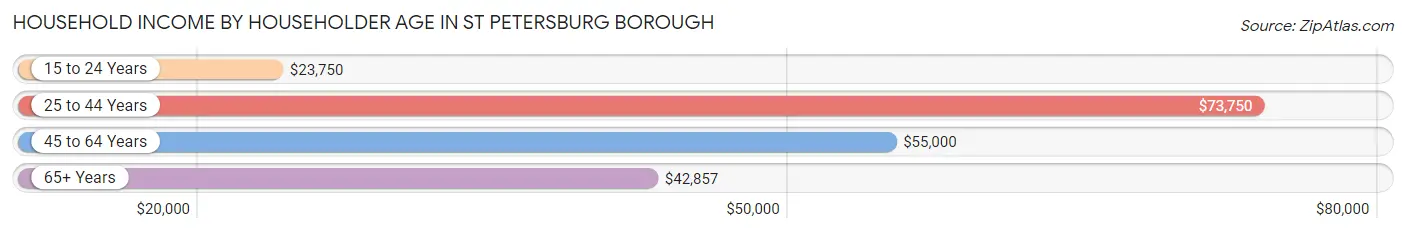
| Income Bracket | # Households | Median Income |
| 15 to 24 Years | 7 (5.2%) | $23,750 |
| 25 to 44 Years | 20 (14.8%) | $73,750 |
| 45 to 64 Years | 56 (41.5%) | $55,000 |
| 65+ Years | 52 (38.5%) | $42,857 |
| Total | 135 (100.0%) | $49,750 |
Poverty in St Petersburg borough
Income Below Poverty by Sex and Age in St Petersburg borough
With 6.4% poverty level for males and 8.3% for females among the residents of St Petersburg borough, 55 to 64 year old males and 18 to 24 year old females are the most vulnerable to poverty, with 6 males (23.1%) and 3 females (27.3%) in their respective age groups living below the poverty level.
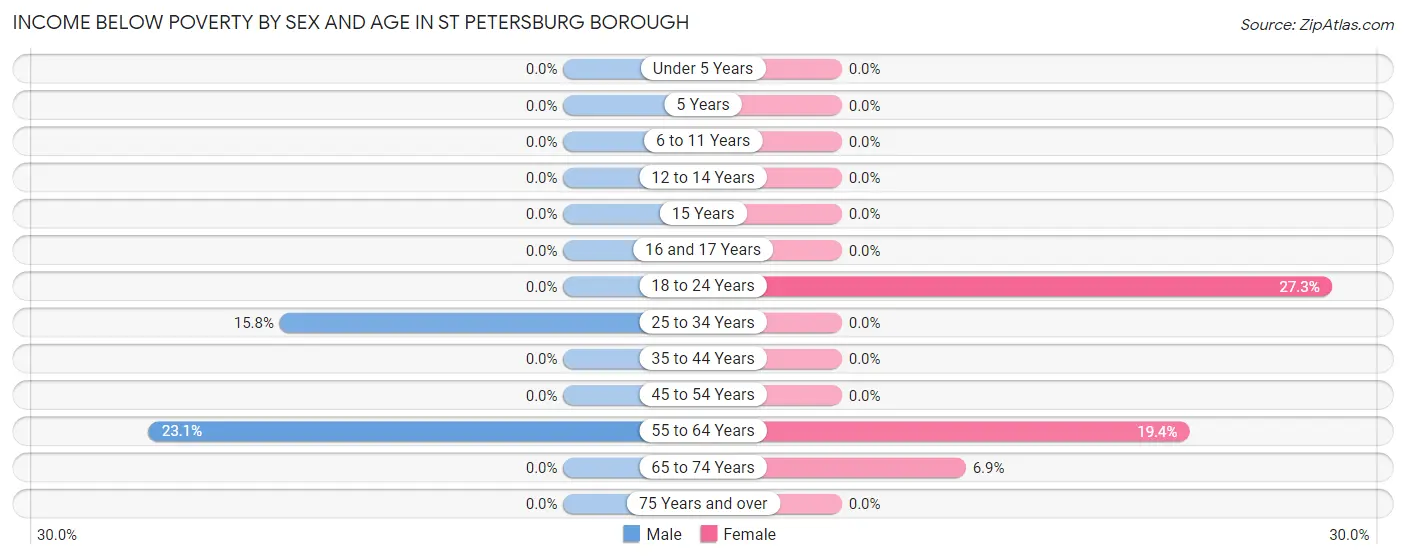
| Age Bracket | Male | Female |
| Under 5 Years | 0 (0.0%) | 0 (0.0%) |
| 5 Years | 0 (0.0%) | 0 (0.0%) |
| 6 to 11 Years | 0 (0.0%) | 0 (0.0%) |
| 12 to 14 Years | 0 (0.0%) | 0 (0.0%) |
| 15 Years | 0 (0.0%) | 0 (0.0%) |
| 16 and 17 Years | 0 (0.0%) | 0 (0.0%) |
| 18 to 24 Years | 0 (0.0%) | 3 (27.3%) |
| 25 to 34 Years | 3 (15.8%) | 0 (0.0%) |
| 35 to 44 Years | 0 (0.0%) | 0 (0.0%) |
| 45 to 54 Years | 0 (0.0%) | 0 (0.0%) |
| 55 to 64 Years | 6 (23.1%) | 6 (19.4%) |
| 65 to 74 Years | 0 (0.0%) | 2 (6.9%) |
| 75 Years and over | 0 (0.0%) | 0 (0.0%) |
| Total | 9 (6.4%) | 11 (8.3%) |
Income Above Poverty by Sex and Age in St Petersburg borough
According to the poverty statistics in St Petersburg borough, males aged under 5 years and females aged under 5 years are the age groups that are most secure financially, with 100.0% of males and 100.0% of females in these age groups living above the poverty line.
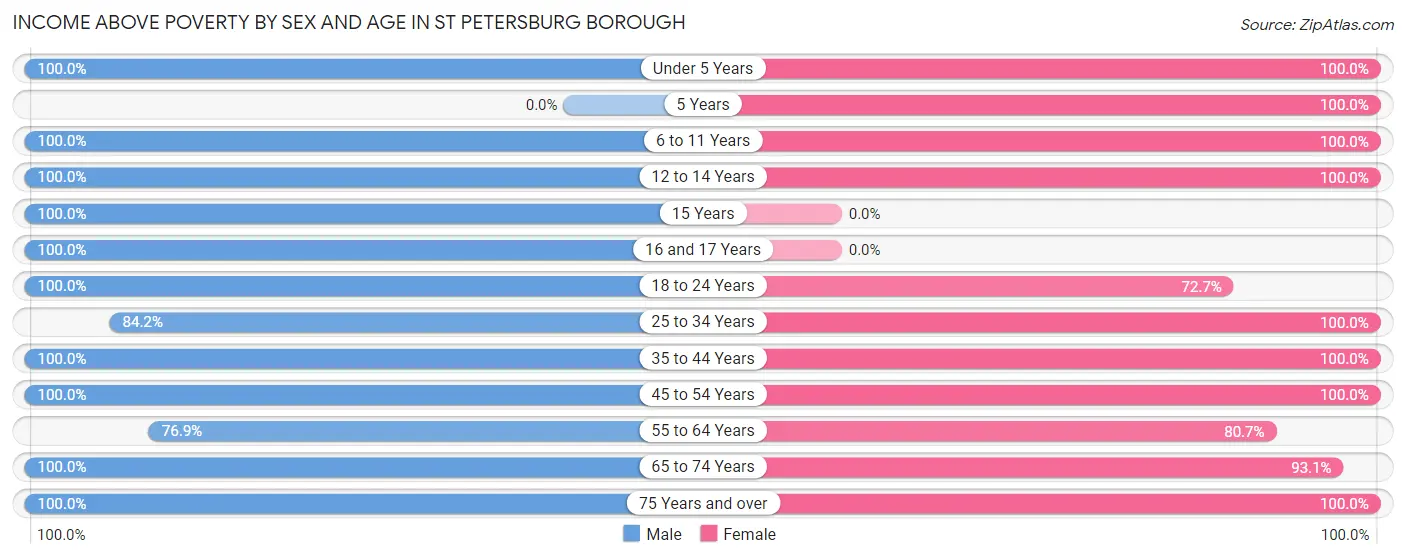
| Age Bracket | Male | Female |
| Under 5 Years | 2 (100.0%) | 1 (100.0%) |
| 5 Years | 0 (0.0%) | 1 (100.0%) |
| 6 to 11 Years | 6 (100.0%) | 5 (100.0%) |
| 12 to 14 Years | 1 (100.0%) | 1 (100.0%) |
| 15 Years | 2 (100.0%) | 0 (0.0%) |
| 16 and 17 Years | 4 (100.0%) | 0 (0.0%) |
| 18 to 24 Years | 12 (100.0%) | 8 (72.7%) |
| 25 to 34 Years | 16 (84.2%) | 13 (100.0%) |
| 35 to 44 Years | 5 (100.0%) | 2 (100.0%) |
| 45 to 54 Years | 21 (100.0%) | 23 (100.0%) |
| 55 to 64 Years | 20 (76.9%) | 25 (80.6%) |
| 65 to 74 Years | 21 (100.0%) | 27 (93.1%) |
| 75 Years and over | 21 (100.0%) | 15 (100.0%) |
| Total | 131 (93.6%) | 121 (91.7%) |
Income Below Poverty Among Married-Couple Families in St Petersburg borough
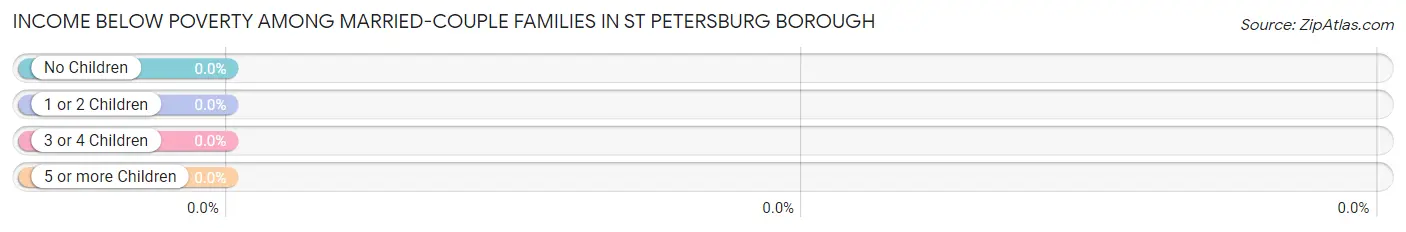
| Children | Above Poverty | Below Poverty |
| No Children | 50 (100.0%) | 0 (0.0%) |
| 1 or 2 Children | 9 (100.0%) | 0 (0.0%) |
| 3 or 4 Children | 0 (0.0%) | 0 (0.0%) |
| 5 or more Children | 0 (0.0%) | 0 (0.0%) |
| Total | 59 (100.0%) | 0 (0.0%) |
Income Below Poverty Among Single-Parent Households in St Petersburg borough
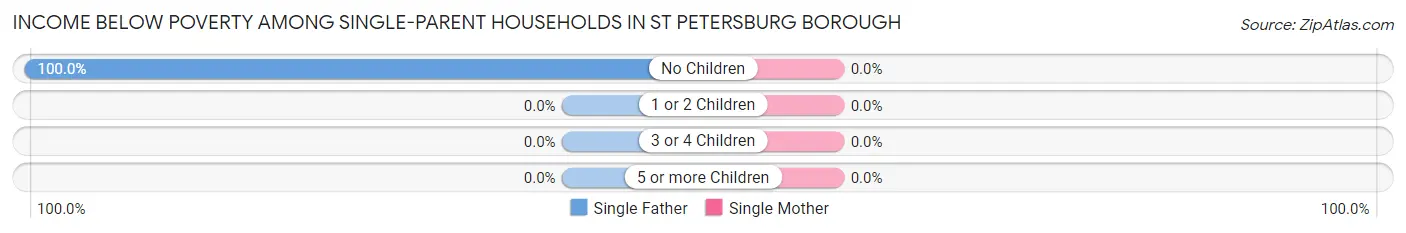
| Children | Single Father | Single Mother |
| No Children | 3 (100.0%) | 0 (0.0%) |
| 1 or 2 Children | 0 (0.0%) | 0 (0.0%) |
| 3 or 4 Children | 0 (0.0%) | 0 (0.0%) |
| 5 or more Children | 0 (0.0%) | 0 (0.0%) |
| Total | 3 (50.0%) | 0 (0.0%) |
Income Below Poverty Among Married-Couple vs Single-Parent Households in St Petersburg borough
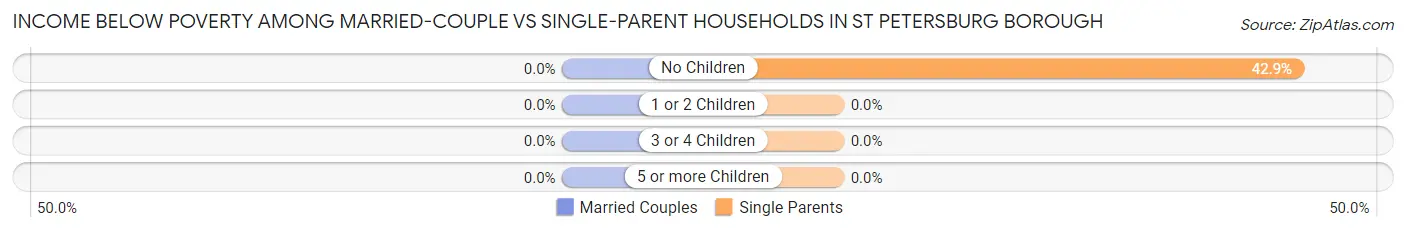
| Children | Married-Couple Families | Single-Parent Households |
| No Children | 0 (0.0%) | 3 (42.9%) |
| 1 or 2 Children | 0 (0.0%) | 0 (0.0%) |
| 3 or 4 Children | 0 (0.0%) | 0 (0.0%) |
| 5 or more Children | 0 (0.0%) | 0 (0.0%) |
| Total | 0 (0.0%) | 3 (20.0%) |
Race in St Petersburg borough
The most populous races in St Petersburg borough are White / Caucasian (266 | 97.8%), Two or more Races (4 | 1.5%), and Hispanic or Latino (2 | 0.7%).
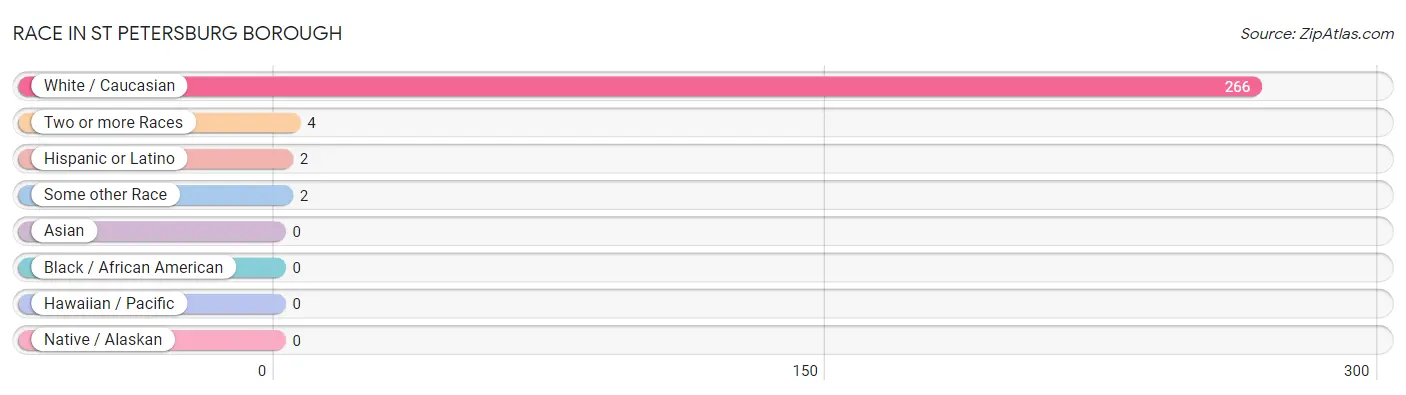
| Race | # Population | % Population |
| Asian | 0 | 0.0% |
| Black / African American | 0 | 0.0% |
| Hawaiian / Pacific | 0 | 0.0% |
| Hispanic or Latino | 2 | 0.7% |
| Native / Alaskan | 0 | 0.0% |
| White / Caucasian | 266 | 97.8% |
| Two or more Races | 4 | 1.5% |
| Some other Race | 2 | 0.7% |
| Total | 272 | 100.0% |
Ancestry in St Petersburg borough
The most populous ancestries reported in St Petersburg borough are German (78 | 28.7%), Irish (56 | 20.6%), American (33 | 12.1%), English (20 | 7.3%), and Italian (11 | 4.0%), together accounting for 72.8% of all St Petersburg borough residents.
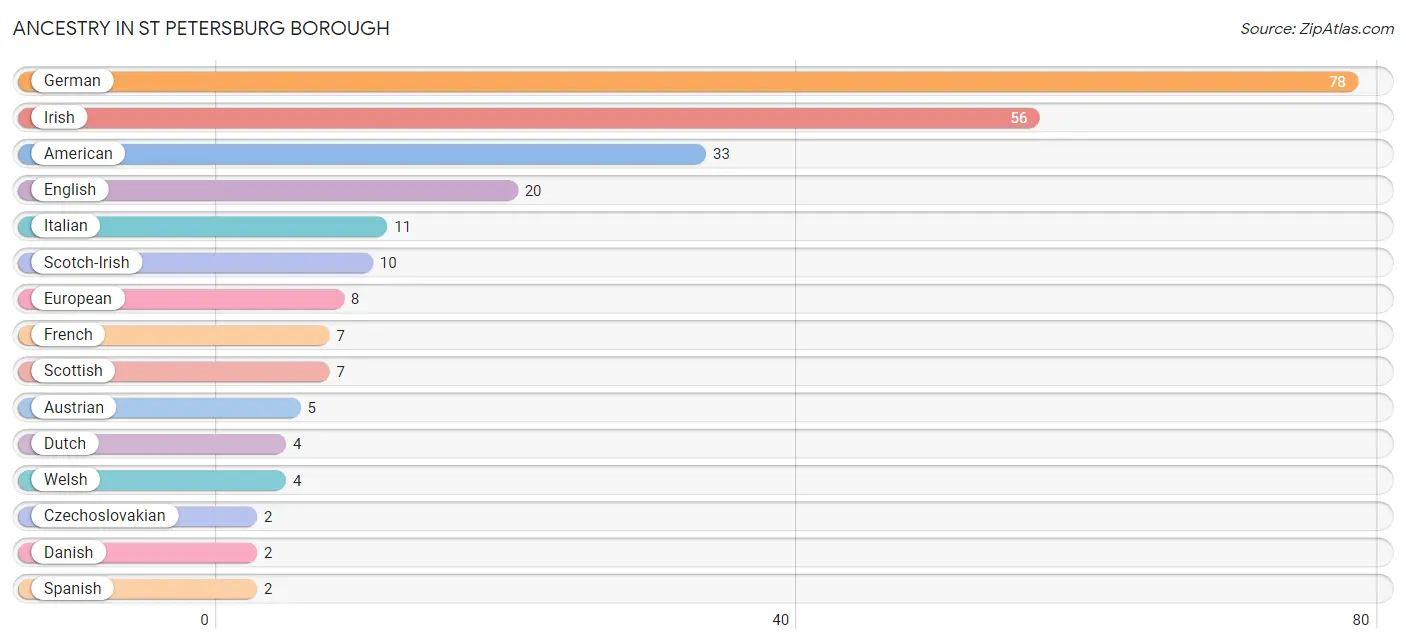
| Ancestry | # Population | % Population |
| American | 33 | 12.1% |
| Austrian | 5 | 1.8% |
| British | 1 | 0.4% |
| Czechoslovakian | 2 | 0.7% |
| Danish | 2 | 0.7% |
| Dutch | 4 | 1.5% |
| English | 20 | 7.3% |
| European | 8 | 2.9% |
| French | 7 | 2.6% |
| German | 78 | 28.7% |
| Irish | 56 | 20.6% |
| Italian | 11 | 4.0% |
| Portuguese | 1 | 0.4% |
| Scandinavian | 1 | 0.4% |
| Scotch-Irish | 10 | 3.7% |
| Scottish | 7 | 2.6% |
| Spanish | 2 | 0.7% |
| Ukrainian | 2 | 0.7% |
| Welsh | 4 | 1.5% | View All 19 Rows |
Immigrants in St Petersburg borough

| Immigration Origin | # Population | % Population | View All 0 Rows |
Sex and Age in St Petersburg borough
Sex and Age in St Petersburg borough
The most populous age groups in St Petersburg borough are 50 to 54 Years (16 | 11.4%) for men and 65 to 69 Years (19 | 14.4%) for women.
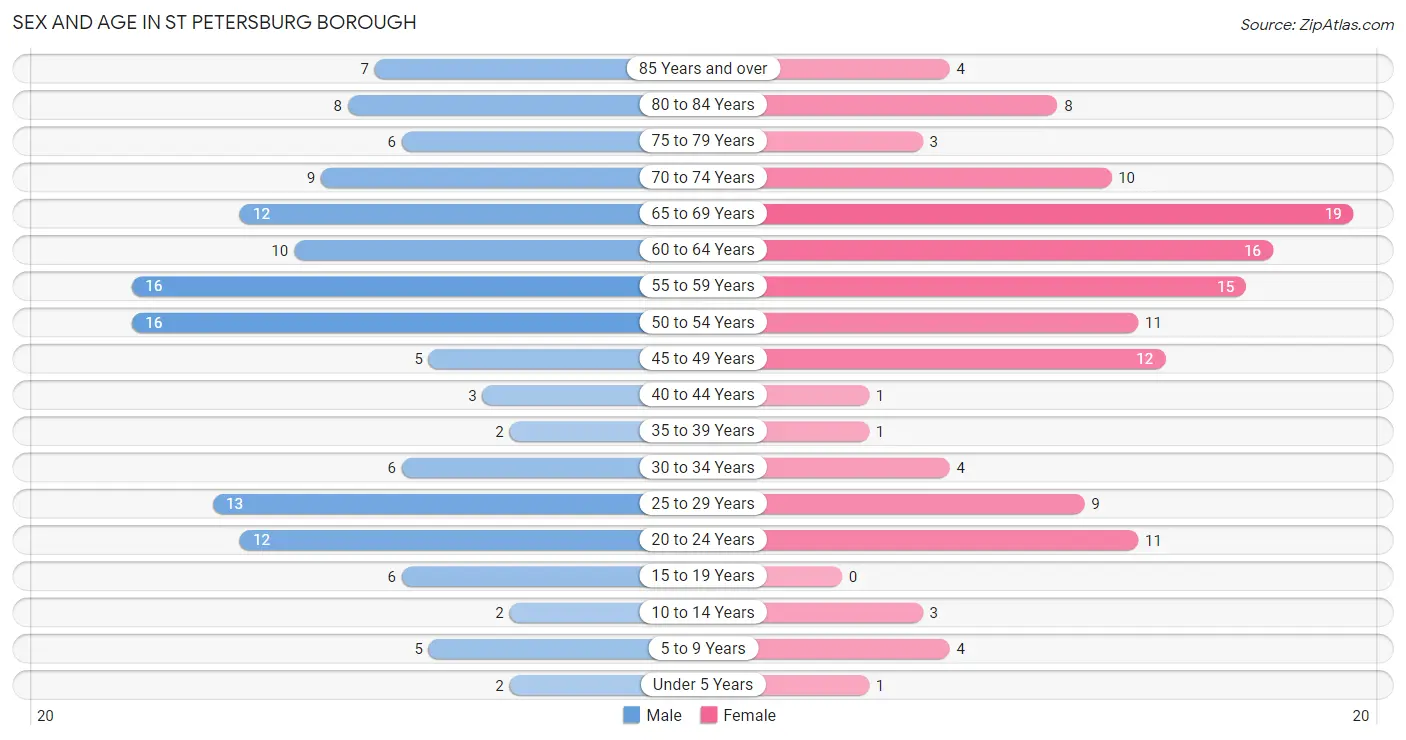
| Age Bracket | Male | Female |
| Under 5 Years | 2 (1.4%) | 1 (0.8%) |
| 5 to 9 Years | 5 (3.6%) | 4 (3.0%) |
| 10 to 14 Years | 2 (1.4%) | 3 (2.3%) |
| 15 to 19 Years | 6 (4.3%) | 0 (0.0%) |
| 20 to 24 Years | 12 (8.6%) | 11 (8.3%) |
| 25 to 29 Years | 13 (9.3%) | 9 (6.8%) |
| 30 to 34 Years | 6 (4.3%) | 4 (3.0%) |
| 35 to 39 Years | 2 (1.4%) | 1 (0.8%) |
| 40 to 44 Years | 3 (2.1%) | 1 (0.8%) |
| 45 to 49 Years | 5 (3.6%) | 12 (9.1%) |
| 50 to 54 Years | 16 (11.4%) | 11 (8.3%) |
| 55 to 59 Years | 16 (11.4%) | 15 (11.4%) |
| 60 to 64 Years | 10 (7.1%) | 16 (12.1%) |
| 65 to 69 Years | 12 (8.6%) | 19 (14.4%) |
| 70 to 74 Years | 9 (6.4%) | 10 (7.6%) |
| 75 to 79 Years | 6 (4.3%) | 3 (2.3%) |
| 80 to 84 Years | 8 (5.7%) | 8 (6.1%) |
| 85 Years and over | 7 (5.0%) | 4 (3.0%) |
| Total | 140 (100.0%) | 132 (100.0%) |
Families and Households in St Petersburg borough
Median Family Size in St Petersburg borough
The median family size in St Petersburg borough is 2.43 persons per family, with married-couple families (59 | 79.7%) accounting for the largest median family size of 2.53 persons per family. On the other hand, single male/father families (6 | 8.1%) represent the smallest median family size with 1.67 persons per family.
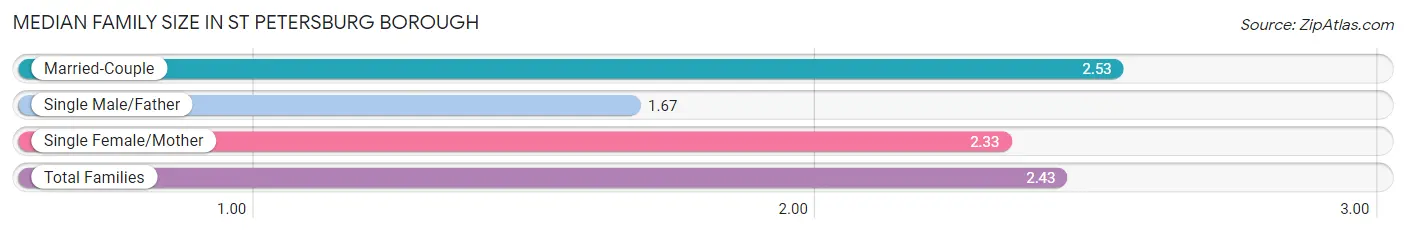
| Family Type | # Families | Family Size |
| Married-Couple | 59 (79.7%) | 2.53 |
| Single Male/Father | 6 (8.1%) | 1.67 |
| Single Female/Mother | 9 (12.2%) | 2.33 |
| Total Families | 74 (100.0%) | 2.43 |
Median Household Size in St Petersburg borough
The median household size in St Petersburg borough is 2.01 persons per household, with single female/mother households (9 | 6.7%) accounting for the largest median household size of 3.22 persons per household. non-family households (61 | 45.2%) represent the smallest median household size with 1.38 persons per household.
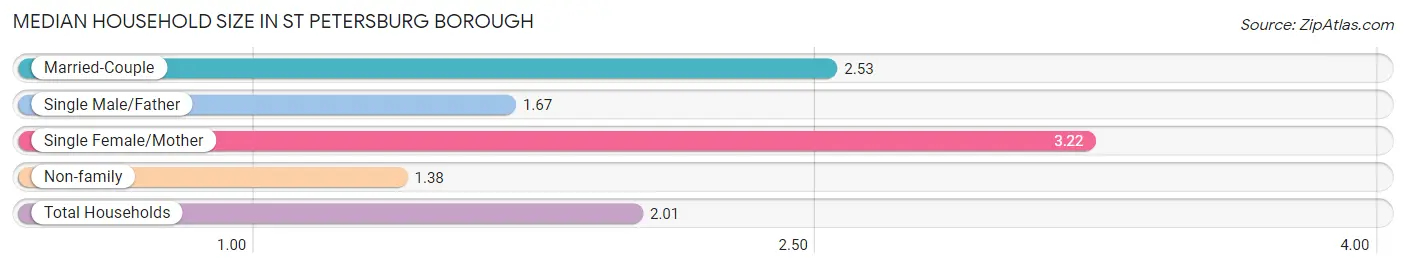
| Household Type | # Households | Household Size |
| Married-Couple | 59 (43.7%) | 2.53 |
| Single Male/Father | 6 (4.4%) | 1.67 |
| Single Female/Mother | 9 (6.7%) | 3.22 |
| Non-family | 61 (45.2%) | 1.38 |
| Total Households | 135 (100.0%) | 2.01 |
Household Size by Marriage Status in St Petersburg borough
Out of a total of 135 households in St Petersburg borough, 74 (54.8%) are family households, while 61 (45.2%) are nonfamily households. The most numerous type of family households are 2-person households, comprising 52, and the most common type of nonfamily households are 1-person households, comprising 39.
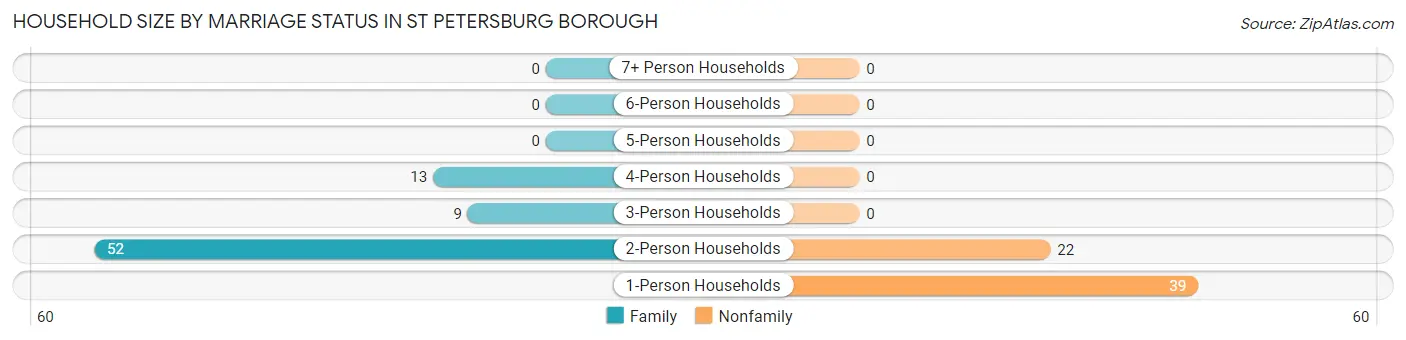
| Household Size | Family Households | Nonfamily Households |
| 1-Person Households | - | 39 (28.9%) |
| 2-Person Households | 52 (38.5%) | 22 (16.3%) |
| 3-Person Households | 9 (6.7%) | 0 (0.0%) |
| 4-Person Households | 13 (9.6%) | 0 (0.0%) |
| 5-Person Households | 0 (0.0%) | 0 (0.0%) |
| 6-Person Households | 0 (0.0%) | 0 (0.0%) |
| 7+ Person Households | 0 (0.0%) | 0 (0.0%) |
| Total | 74 (54.8%) | 61 (45.2%) |
Female Fertility in St Petersburg borough
Fertility by Age in St Petersburg borough
Average fertility rate in St Petersburg borough is 45.0 births per 1,000 women. Women in the age bracket of 20 to 34 years have the highest fertility rate with 83.0 births per 1,000 women. Women in the age bracket of 20 to 34 years acount for 100.0% of all women with births.
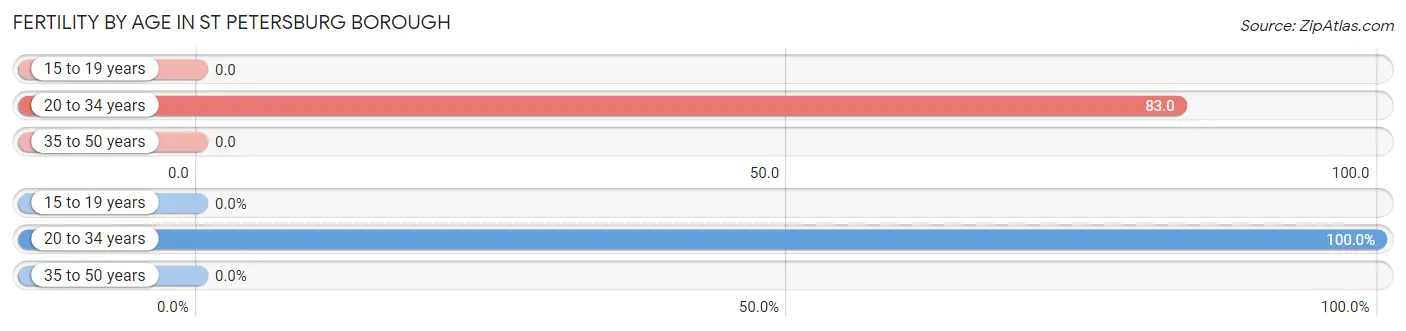
| Age Bracket | Women with Births | Births / 1,000 Women |
| 15 to 19 years | 0 (0.0%) | 0.0 |
| 20 to 34 years | 2 (100.0%) | 83.0 |
| 35 to 50 years | 0 (0.0%) | 0.0 |
| Total | 2 (100.0%) | 45.0 |
Fertility by Age by Marriage Status in St Petersburg borough
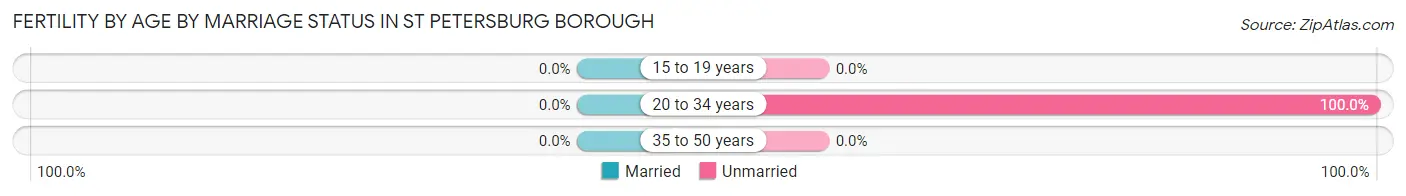
| Age Bracket | Married | Unmarried |
| 15 to 19 years | 0 (0.0%) | 0 (0.0%) |
| 20 to 34 years | 0 (0.0%) | 2 (100.0%) |
| 35 to 50 years | 0 (0.0%) | 0 (0.0%) |
| Total | 0 (0.0%) | 2 (100.0%) |
Fertility by Education in St Petersburg borough
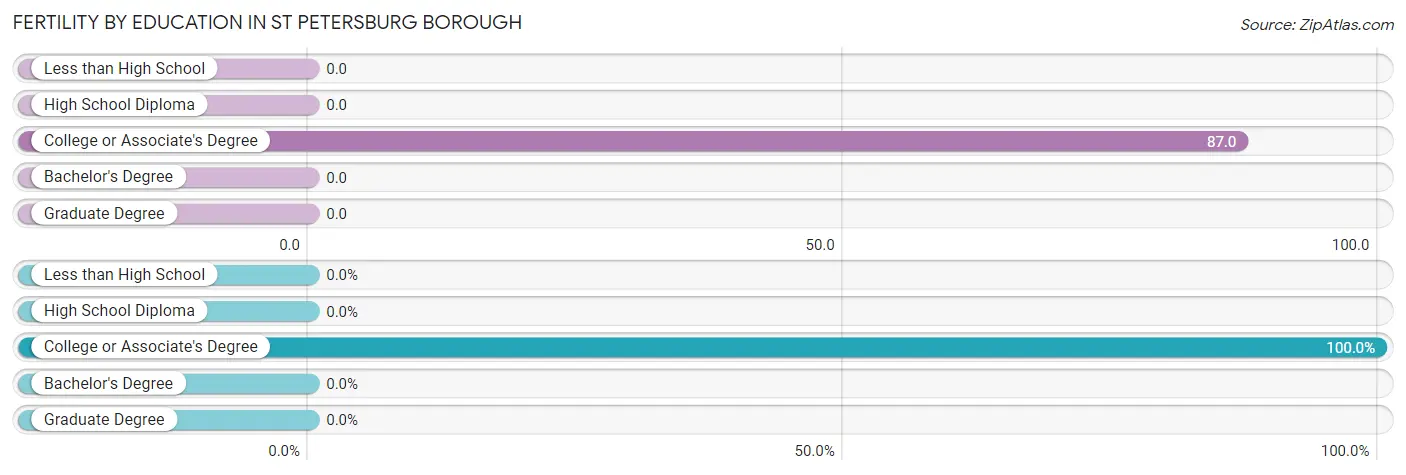
| Educational Attainment | Women with Births | Births / 1,000 Women |
| Less than High School | 0 (0.0%) | 0.0 |
| High School Diploma | 0 (0.0%) | 0.0 |
| College or Associate's Degree | 2 (100.0%) | 87.0 |
| Bachelor's Degree | 0 (0.0%) | 0.0 |
| Graduate Degree | 0 (0.0%) | 0.0 |
| Total | 2 (100.0%) | 45.0 |
Fertility by Education by Marriage Status in St Petersburg borough

| Educational Attainment | Married | Unmarried |
| Less than High School | 0 (0.0%) | 0 (0.0%) |
| High School Diploma | 0 (0.0%) | 0 (0.0%) |
| College or Associate's Degree | 0 (0.0%) | 2 (100.0%) |
| Bachelor's Degree | 0 (0.0%) | 0 (0.0%) |
| Graduate Degree | 0 (0.0%) | 0 (0.0%) |
| Total | 0 (0.0%) | 2 (100.0%) |
Employment Characteristics in St Petersburg borough
Employment by Class of Employer in St Petersburg borough
Among the 113 employed individuals in St Petersburg borough, private company employees (93 | 82.3%), not-for-profit organizations (6 | 5.3%), and self-employed (not incorporated) (5 | 4.4%) make up the most common classes of employment.
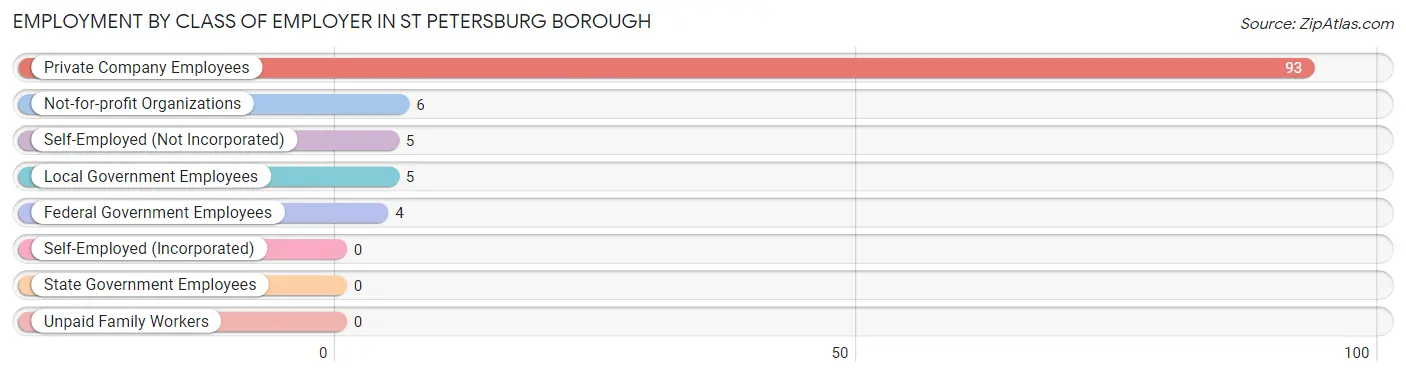
| Employer Class | # Employees | % Employees |
| Private Company Employees | 93 | 82.3% |
| Self-Employed (Incorporated) | 0 | 0.0% |
| Self-Employed (Not Incorporated) | 5 | 4.4% |
| Not-for-profit Organizations | 6 | 5.3% |
| Local Government Employees | 5 | 4.4% |
| State Government Employees | 0 | 0.0% |
| Federal Government Employees | 4 | 3.5% |
| Unpaid Family Workers | 0 | 0.0% |
| Total | 113 | 100.0% |
Employment Status by Age in St Petersburg borough
According to the labor force statistics for St Petersburg borough, out of the total population over 16 years of age (253), 51.0% or 129 individuals are in the labor force, with 9.3% or 12 of them unemployed. The age group with the highest labor force participation rate is 20 to 24 years, with 100.0% or 23 individuals in the labor force. Within the labor force, the 20 to 24 years age range has the highest percentage of unemployed individuals, with 30.4% or 7 of them being unemployed.
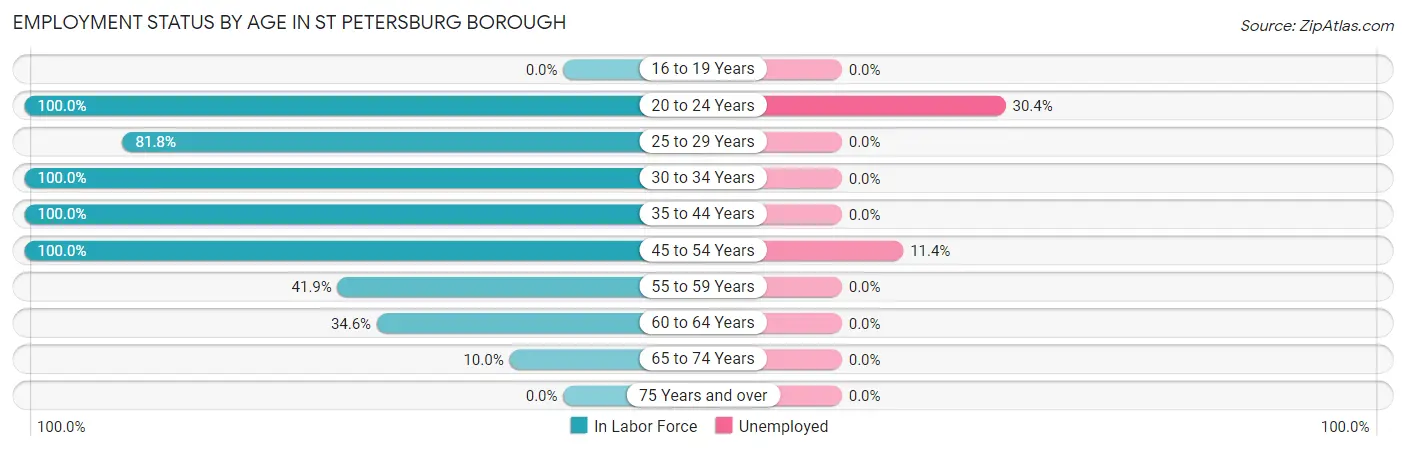
| Age Bracket | In Labor Force | Unemployed |
| 16 to 19 Years | 0 (0.0%) | 0 (0.0%) |
| 20 to 24 Years | 23 (100.0%) | 7 (30.4%) |
| 25 to 29 Years | 18 (81.8%) | 0 (0.0%) |
| 30 to 34 Years | 10 (100.0%) | 0 (0.0%) |
| 35 to 44 Years | 7 (100.0%) | 0 (0.0%) |
| 45 to 54 Years | 44 (100.0%) | 5 (11.4%) |
| 55 to 59 Years | 13 (41.9%) | 0 (0.0%) |
| 60 to 64 Years | 9 (34.6%) | 0 (0.0%) |
| 65 to 74 Years | 5 (10.0%) | 0 (0.0%) |
| 75 Years and over | 0 (0.0%) | 0 (0.0%) |
| Total | 129 (51.0%) | 12 (9.3%) |
Employment Status by Educational Attainment in St Petersburg borough
According to labor force statistics for St Petersburg borough, 72.1% of individuals (101) out of the total population between 25 and 64 years of age (140) are in the labor force, with 5.0% or 5 of them being unemployed. The group with the highest labor force participation rate are those with the educational attainment of bachelor's degree or higher, with 100.0% or 6 individuals in the labor force. Within the labor force, individuals with high school diploma education have the highest percentage of unemployment, with 11.4% or 5 of them being unemployed.
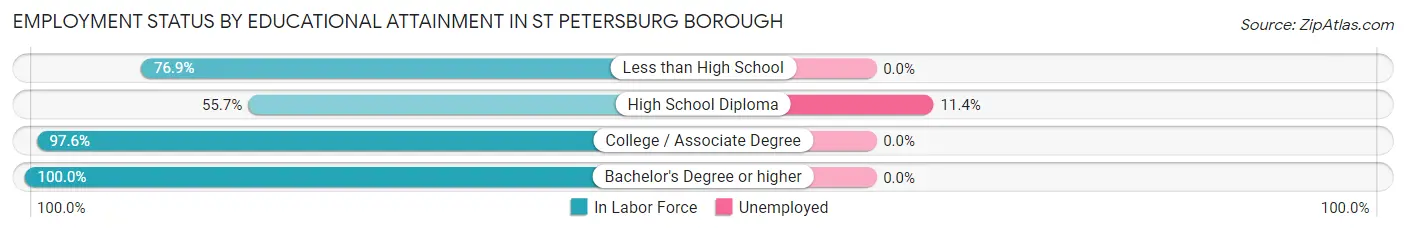
| Educational Attainment | In Labor Force | Unemployed |
| Less than High School | 10 (76.9%) | 0 (0.0%) |
| High School Diploma | 44 (55.7%) | 9 (11.4%) |
| College / Associate Degree | 41 (97.6%) | 0 (0.0%) |
| Bachelor's Degree or higher | 6 (100.0%) | 0 (0.0%) |
| Total | 101 (72.1%) | 7 (5.0%) |
Employment Occupations by Sex in St Petersburg borough
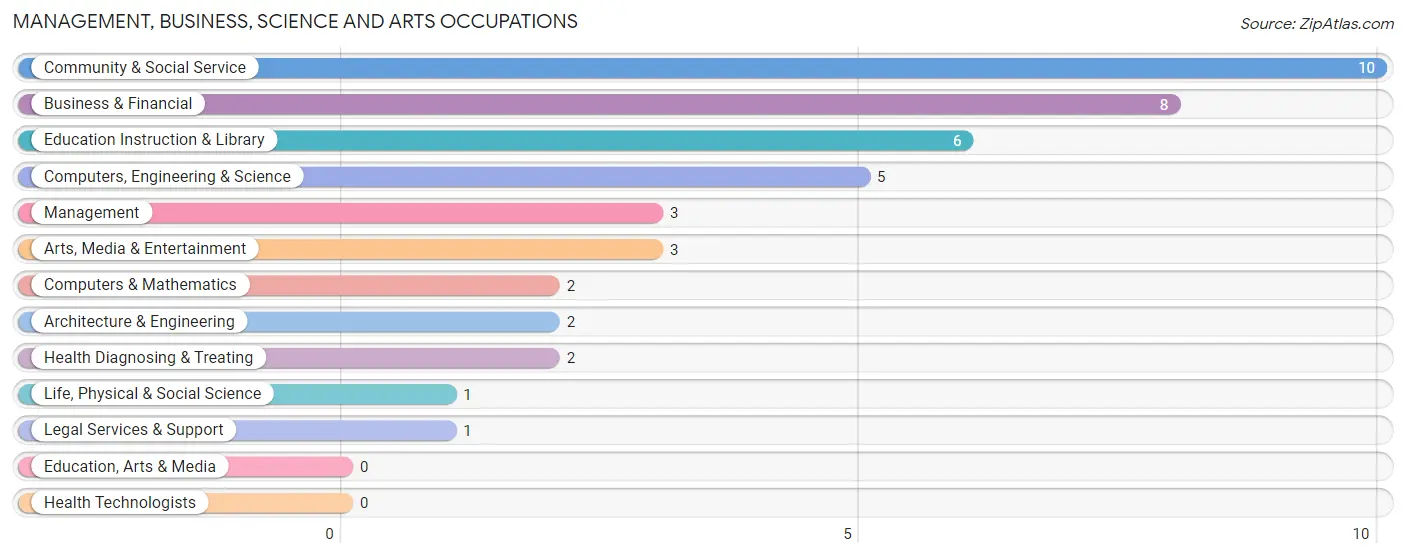
Management, Business, Science and Arts Occupations
The most common Management, Business, Science and Arts occupations in St Petersburg borough are Community & Social Service (10 | 8.6%), Business & Financial (8 | 6.8%), Education Instruction & Library (6 | 5.1%), Computers, Engineering & Science (5 | 4.3%), and Management (3 | 2.6%).
Management, Business, Science and Arts Occupations by Sex
Within the Management, Business, Science and Arts occupations in St Petersburg borough, the most male-oriented occupations are Computers & Mathematics (100.0%), Architecture & Engineering (100.0%), and Arts, Media & Entertainment (100.0%), while the most female-oriented occupations are Management (100.0%), Life, Physical & Social Science (100.0%), and Legal Services & Support (100.0%).
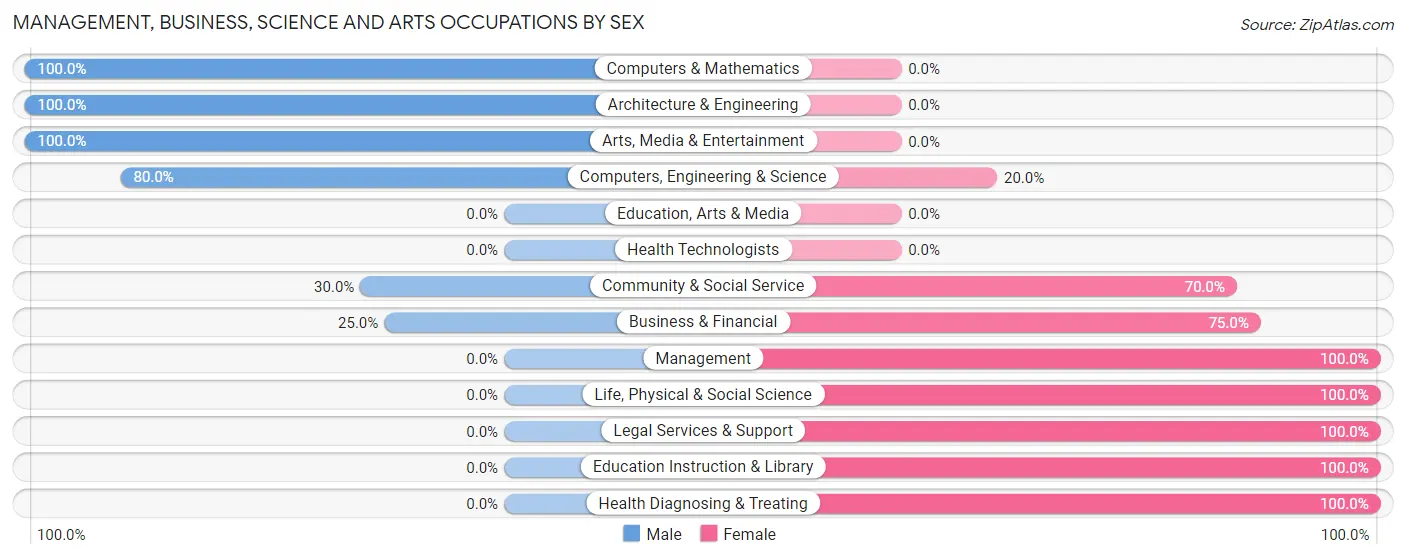
| Occupation | Male | Female |
| Management | 0 (0.0%) | 3 (100.0%) |
| Business & Financial | 2 (25.0%) | 6 (75.0%) |
| Computers, Engineering & Science | 4 (80.0%) | 1 (20.0%) |
| Computers & Mathematics | 2 (100.0%) | 0 (0.0%) |
| Architecture & Engineering | 2 (100.0%) | 0 (0.0%) |
| Life, Physical & Social Science | 0 (0.0%) | 1 (100.0%) |
| Community & Social Service | 3 (30.0%) | 7 (70.0%) |
| Education, Arts & Media | 0 (0.0%) | 0 (0.0%) |
| Legal Services & Support | 0 (0.0%) | 1 (100.0%) |
| Education Instruction & Library | 0 (0.0%) | 6 (100.0%) |
| Arts, Media & Entertainment | 3 (100.0%) | 0 (0.0%) |
| Health Diagnosing & Treating | 0 (0.0%) | 2 (100.0%) |
| Health Technologists | 0 (0.0%) | 0 (0.0%) |
| Total (Category) | 9 (32.1%) | 19 (67.9%) |
| Total (Overall) | 60 (51.3%) | 57 (48.7%) |
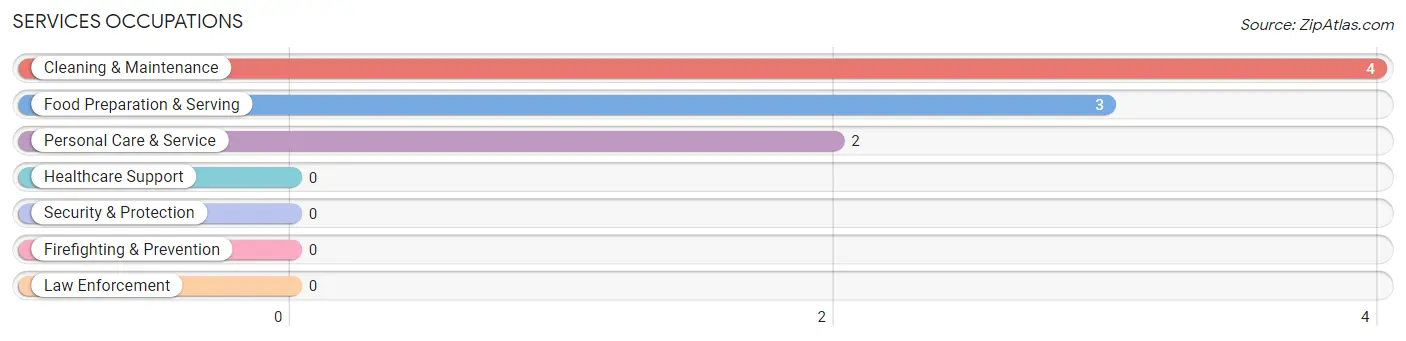
Services Occupations
The most common Services occupations in St Petersburg borough are Cleaning & Maintenance (4 | 3.4%), Food Preparation & Serving (3 | 2.6%), and Personal Care & Service (2 | 1.7%).
Services Occupations by Sex
Within the Services occupations in St Petersburg borough, the most male-oriented occupations are Food Preparation & Serving (66.7%), and Cleaning & Maintenance (25.0%), while the most female-oriented occupations are Personal Care & Service (100.0%), Cleaning & Maintenance (75.0%), and Food Preparation & Serving (33.3%).
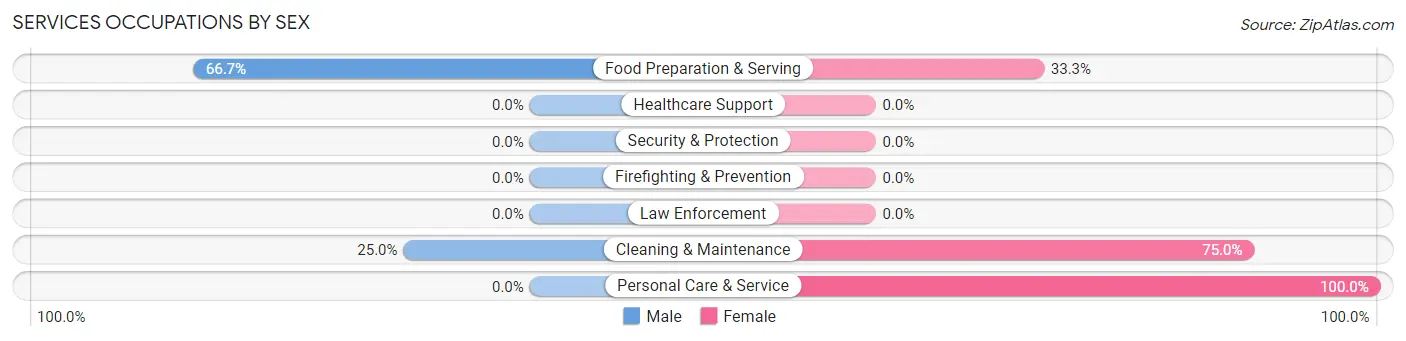
| Occupation | Male | Female |
| Healthcare Support | 0 (0.0%) | 0 (0.0%) |
| Security & Protection | 0 (0.0%) | 0 (0.0%) |
| Firefighting & Prevention | 0 (0.0%) | 0 (0.0%) |
| Law Enforcement | 0 (0.0%) | 0 (0.0%) |
| Food Preparation & Serving | 2 (66.7%) | 1 (33.3%) |
| Cleaning & Maintenance | 1 (25.0%) | 3 (75.0%) |
| Personal Care & Service | 0 (0.0%) | 2 (100.0%) |
| Total (Category) | 3 (33.3%) | 6 (66.7%) |
| Total (Overall) | 60 (51.3%) | 57 (48.7%) |
Sales and Office Occupations
The most common Sales and Office occupations in St Petersburg borough are Office & Administration (29 | 24.8%), and Sales & Related (3 | 2.6%).
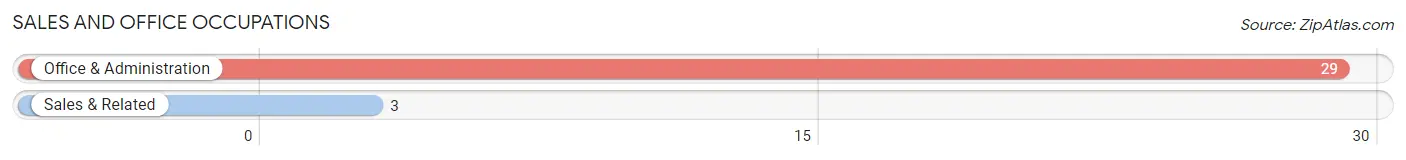
Sales and Office Occupations by Sex
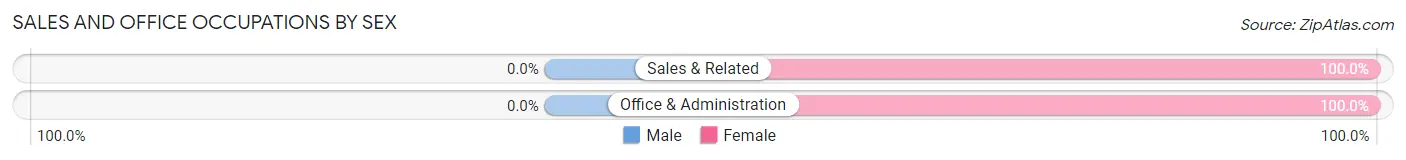
| Occupation | Male | Female |
| Sales & Related | 0 (0.0%) | 3 (100.0%) |
| Office & Administration | 0 (0.0%) | 29 (100.0%) |
| Total (Category) | 0 (0.0%) | 32 (100.0%) |
| Total (Overall) | 60 (51.3%) | 57 (48.7%) |
Natural Resources, Construction and Maintenance Occupations
The most common Natural Resources, Construction and Maintenance occupations in St Petersburg borough are Construction & Extraction (21 | 17.9%), and Installation, Maintenance & Repair (4 | 3.4%).

Natural Resources, Construction and Maintenance Occupations by Sex
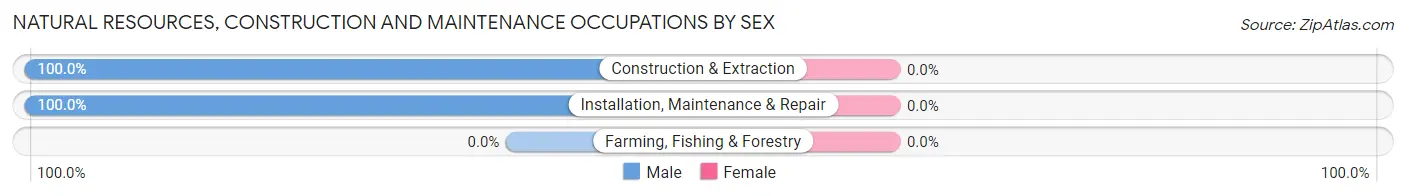
| Occupation | Male | Female |
| Farming, Fishing & Forestry | 0 (0.0%) | 0 (0.0%) |
| Construction & Extraction | 21 (100.0%) | 0 (0.0%) |
| Installation, Maintenance & Repair | 4 (100.0%) | 0 (0.0%) |
| Total (Category) | 25 (100.0%) | 0 (0.0%) |
| Total (Overall) | 60 (51.3%) | 57 (48.7%) |
Production, Transportation and Moving Occupations
The most common Production, Transportation and Moving occupations in St Petersburg borough are Production (13 | 11.1%), and Transportation (10 | 8.6%).
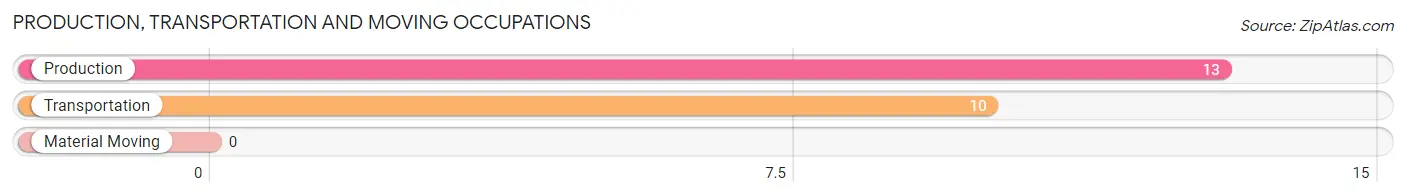
Production, Transportation and Moving Occupations by Sex
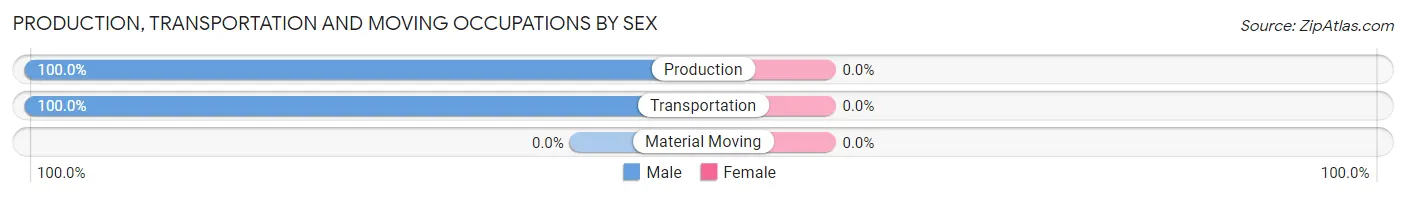
| Occupation | Male | Female |
| Production | 13 (100.0%) | 0 (0.0%) |
| Transportation | 10 (100.0%) | 0 (0.0%) |
| Material Moving | 0 (0.0%) | 0 (0.0%) |
| Total (Category) | 23 (100.0%) | 0 (0.0%) |
| Total (Overall) | 60 (51.3%) | 57 (48.7%) |
Employment Industries by Sex in St Petersburg borough
Employment Industries in St Petersburg borough
The major employment industries in St Petersburg borough include Manufacturing (22 | 18.8%), Health Care & Social Assistance (20 | 17.1%), Construction (19 | 16.2%), Transportation & Warehousing (16 | 13.7%), and Administrative & Support (11 | 9.4%).
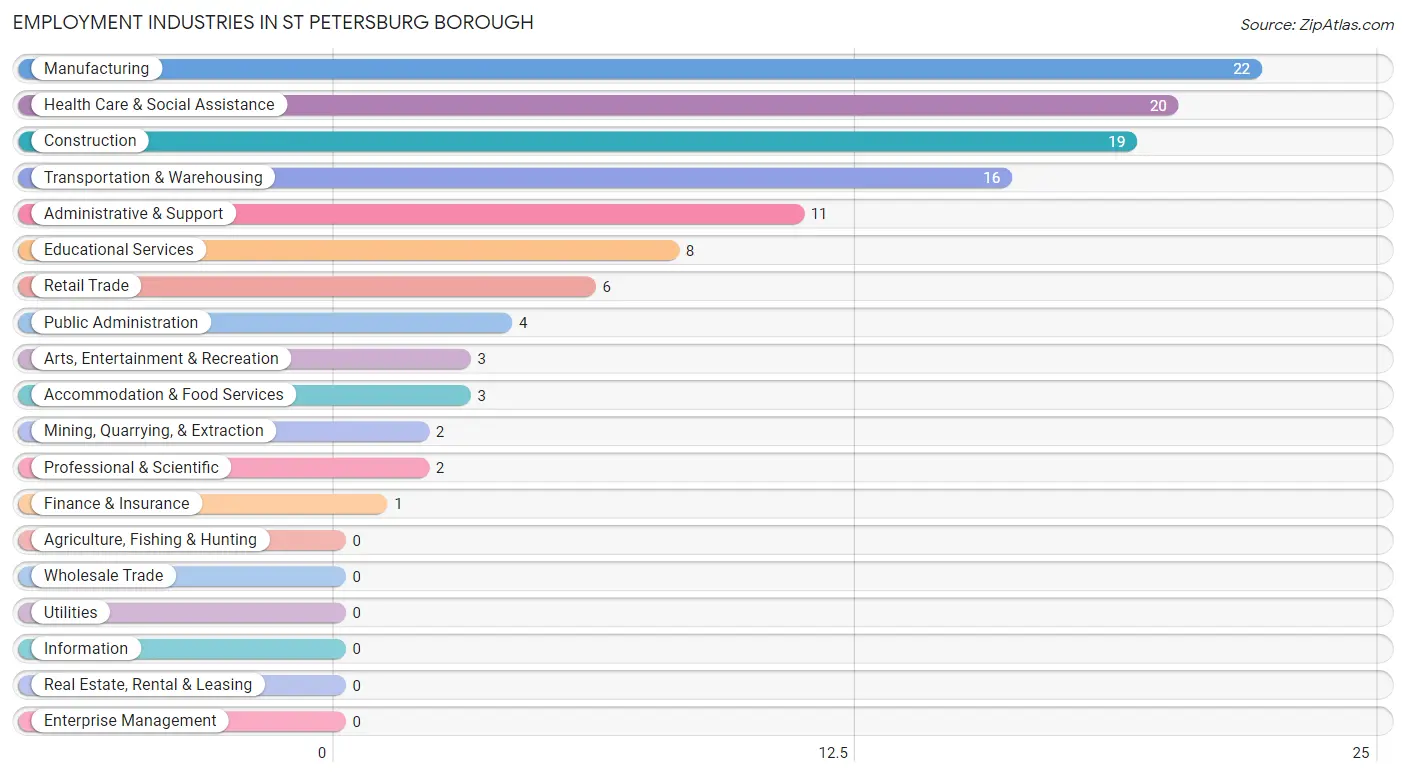
Employment Industries by Sex in St Petersburg borough
The St Petersburg borough industries that see more men than women are Mining, Quarrying, & Extraction (100.0%), Construction (100.0%), and Manufacturing (77.3%), whereas the industries that tend to have a higher number of women are Finance & Insurance (100.0%), Professional & Scientific (100.0%), and Educational Services (100.0%).
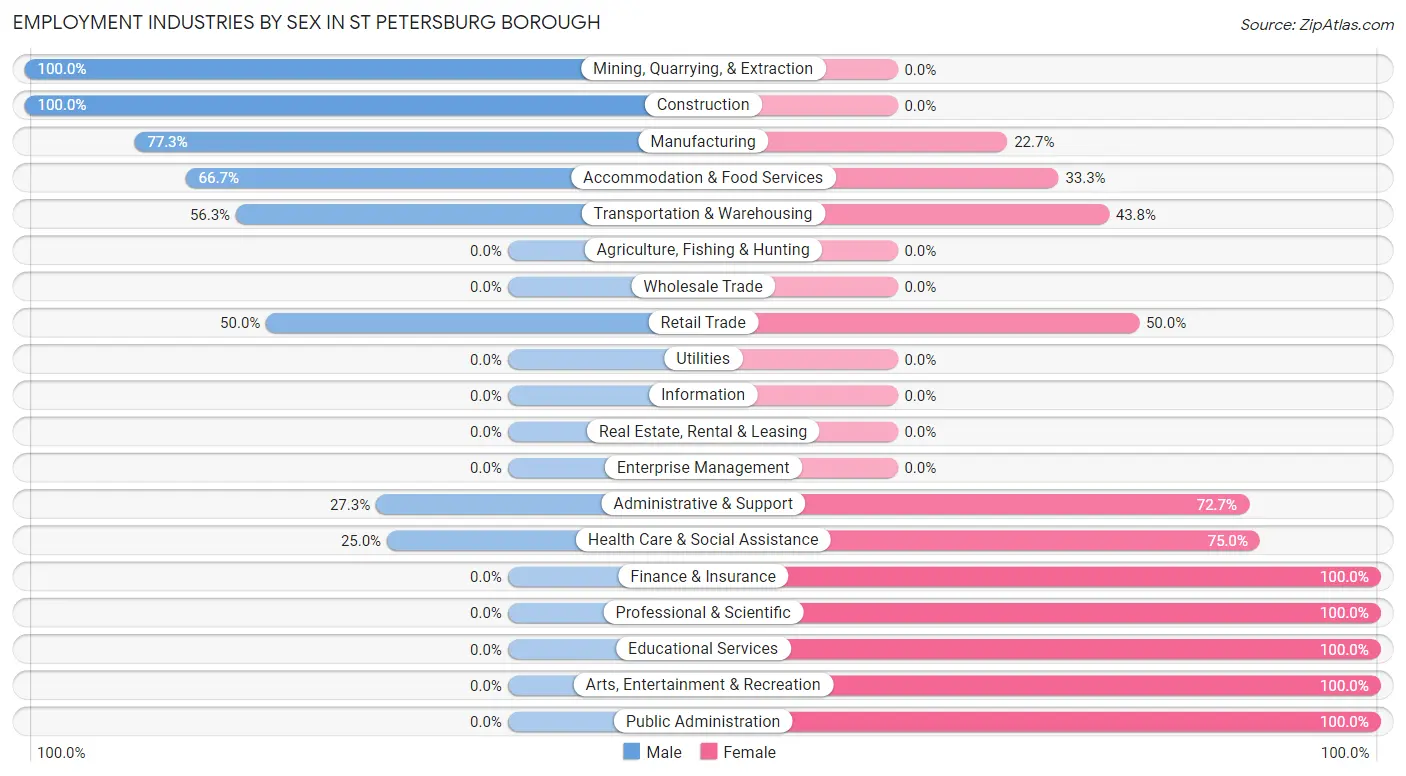
| Industry | Male | Female |
| Agriculture, Fishing & Hunting | 0 (0.0%) | 0 (0.0%) |
| Mining, Quarrying, & Extraction | 2 (100.0%) | 0 (0.0%) |
| Construction | 19 (100.0%) | 0 (0.0%) |
| Manufacturing | 17 (77.3%) | 5 (22.7%) |
| Wholesale Trade | 0 (0.0%) | 0 (0.0%) |
| Retail Trade | 3 (50.0%) | 3 (50.0%) |
| Transportation & Warehousing | 9 (56.2%) | 7 (43.8%) |
| Utilities | 0 (0.0%) | 0 (0.0%) |
| Information | 0 (0.0%) | 0 (0.0%) |
| Finance & Insurance | 0 (0.0%) | 1 (100.0%) |
| Real Estate, Rental & Leasing | 0 (0.0%) | 0 (0.0%) |
| Professional & Scientific | 0 (0.0%) | 2 (100.0%) |
| Enterprise Management | 0 (0.0%) | 0 (0.0%) |
| Administrative & Support | 3 (27.3%) | 8 (72.7%) |
| Educational Services | 0 (0.0%) | 8 (100.0%) |
| Health Care & Social Assistance | 5 (25.0%) | 15 (75.0%) |
| Arts, Entertainment & Recreation | 0 (0.0%) | 3 (100.0%) |
| Accommodation & Food Services | 2 (66.7%) | 1 (33.3%) |
| Public Administration | 0 (0.0%) | 4 (100.0%) |
| Total | 60 (51.3%) | 57 (48.7%) |
Education in St Petersburg borough
School Enrollment in St Petersburg borough
The most common levels of schooling among the 26 students in St Petersburg borough are high school (7 | 26.9%), elementary school (6 | 23.1%), and college / undergraduate (5 | 19.2%).
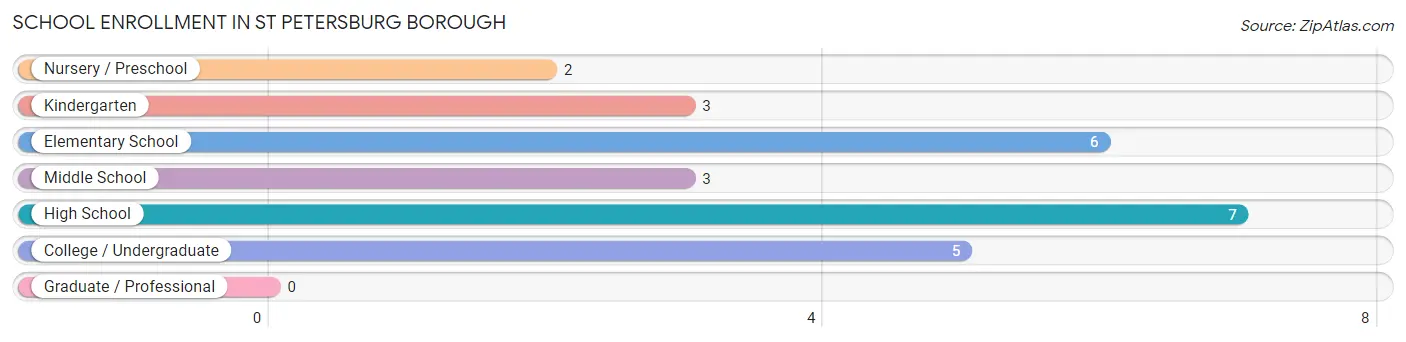
| School Level | # Students | % Students |
| Nursery / Preschool | 2 | 7.7% |
| Kindergarten | 3 | 11.5% |
| Elementary School | 6 | 23.1% |
| Middle School | 3 | 11.5% |
| High School | 7 | 26.9% |
| College / Undergraduate | 5 | 19.2% |
| Graduate / Professional | 0 | 0.0% |
| Total | 26 | 100.0% |
School Enrollment by Age by Funding Source in St Petersburg borough
Out of a total of 26 students who are enrolled in schools in St Petersburg borough, 3 (11.5%) attend a private institution, while the remaining 23 (88.5%) are enrolled in public schools. The age group of 15 to 17 year olds has the highest likelihood of being enrolled in private schools, with 2 (33.3% in the age bracket) enrolled. Conversely, the age group of 3 to 4 year olds has the lowest likelihood of being enrolled in a private school, with 2 (100.0% in the age bracket) attending a public institution.
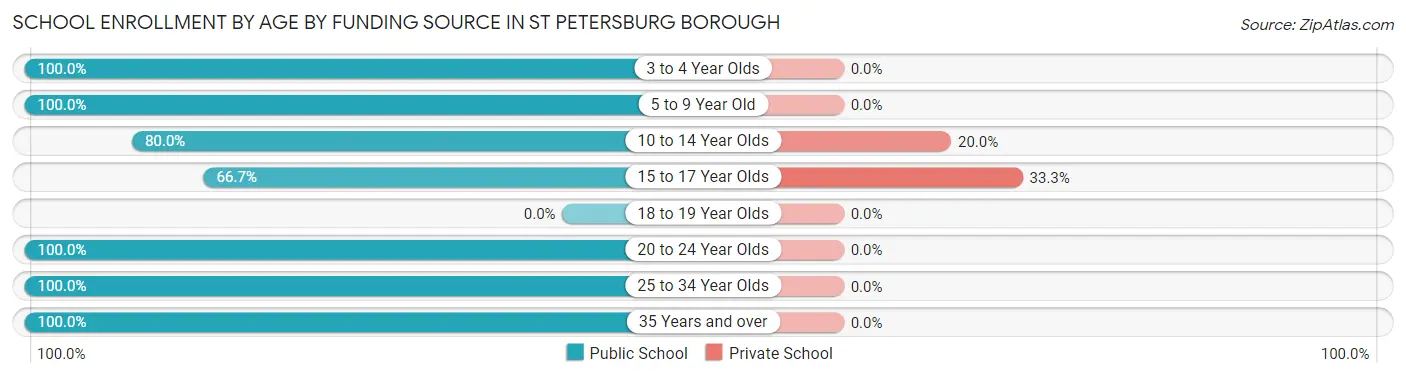
| Age Bracket | Public School | Private School |
| 3 to 4 Year Olds | 2 (100.0%) | 0 (0.0%) |
| 5 to 9 Year Old | 8 (100.0%) | 0 (0.0%) |
| 10 to 14 Year Olds | 4 (80.0%) | 1 (20.0%) |
| 15 to 17 Year Olds | 4 (66.7%) | 2 (33.3%) |
| 18 to 19 Year Olds | 0 (0.0%) | 0 (0.0%) |
| 20 to 24 Year Olds | 3 (100.0%) | 0 (0.0%) |
| 25 to 34 Year Olds | 1 (100.0%) | 0 (0.0%) |
| 35 Years and over | 1 (100.0%) | 0 (0.0%) |
| Total | 23 (88.5%) | 3 (11.5%) |
Educational Attainment by Field of Study in St Petersburg borough
Education (9 | 40.9%), psychology (4 | 18.2%), science & technology (3 | 13.6%), literature & languages (2 | 9.1%), and visual & performing arts (2 | 9.1%) are the most common fields of study among 22 individuals in St Petersburg borough who have obtained a bachelor's degree or higher.
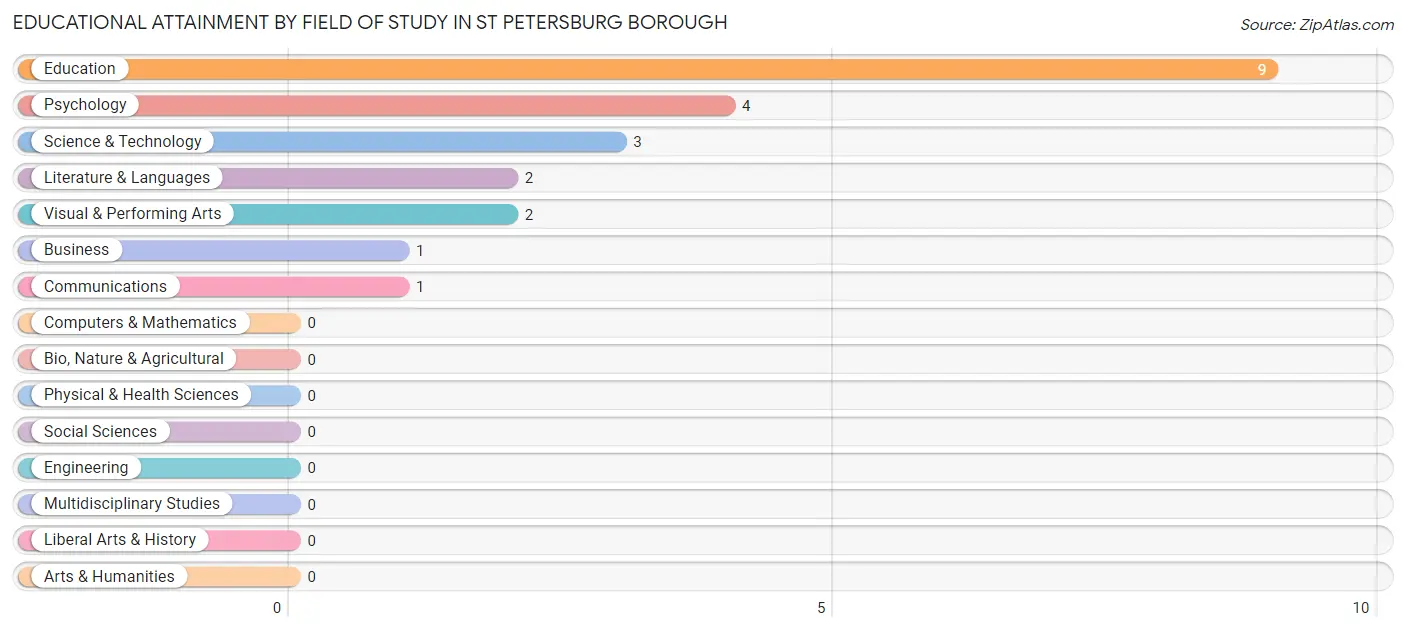
| Field of Study | # Graduates | % Graduates |
| Computers & Mathematics | 0 | 0.0% |
| Bio, Nature & Agricultural | 0 | 0.0% |
| Physical & Health Sciences | 0 | 0.0% |
| Psychology | 4 | 18.2% |
| Social Sciences | 0 | 0.0% |
| Engineering | 0 | 0.0% |
| Multidisciplinary Studies | 0 | 0.0% |
| Science & Technology | 3 | 13.6% |
| Business | 1 | 4.5% |
| Education | 9 | 40.9% |
| Literature & Languages | 2 | 9.1% |
| Liberal Arts & History | 0 | 0.0% |
| Visual & Performing Arts | 2 | 9.1% |
| Communications | 1 | 4.5% |
| Arts & Humanities | 0 | 0.0% |
| Total | 22 | 100.0% |
Transportation & Commute in St Petersburg borough
Vehicle Availability by Sex in St Petersburg borough
The most prevalent vehicle ownership categories in St Petersburg borough are males with 2 vehicles (23, accounting for 39.7%) and females with 2 vehicles (31, making up 41.8%).
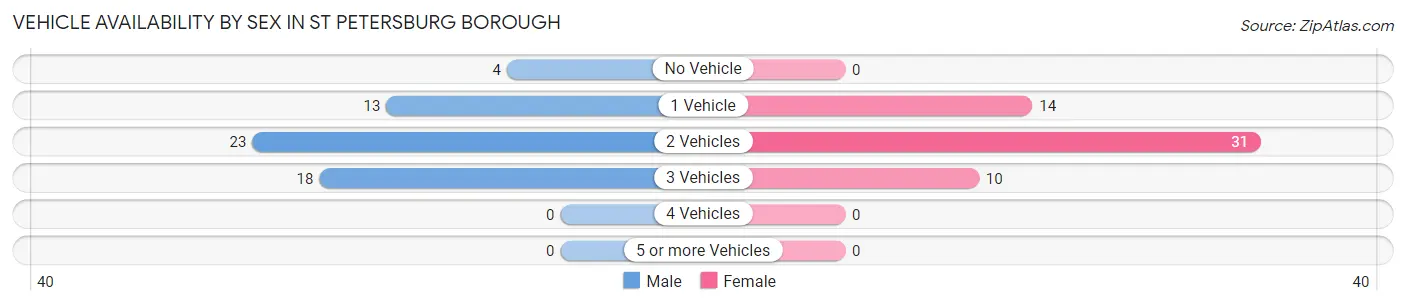
| Vehicles Available | Male | Female |
| No Vehicle | 4 (6.9%) | 0 (0.0%) |
| 1 Vehicle | 13 (22.4%) | 14 (25.5%) |
| 2 Vehicles | 23 (39.7%) | 31 (56.4%) |
| 3 Vehicles | 18 (31.0%) | 10 (18.2%) |
| 4 Vehicles | 0 (0.0%) | 0 (0.0%) |
| 5 or more Vehicles | 0 (0.0%) | 0 (0.0%) |
| Total | 58 (100.0%) | 55 (100.0%) |
Commute Time in St Petersburg borough
The most frequently occuring commute durations in St Petersburg borough are 10 to 14 minutes (22 commuters, 20.4%), 25 to 29 minutes (17 commuters, 15.7%), and 40 to 44 minutes (12 commuters, 11.1%).
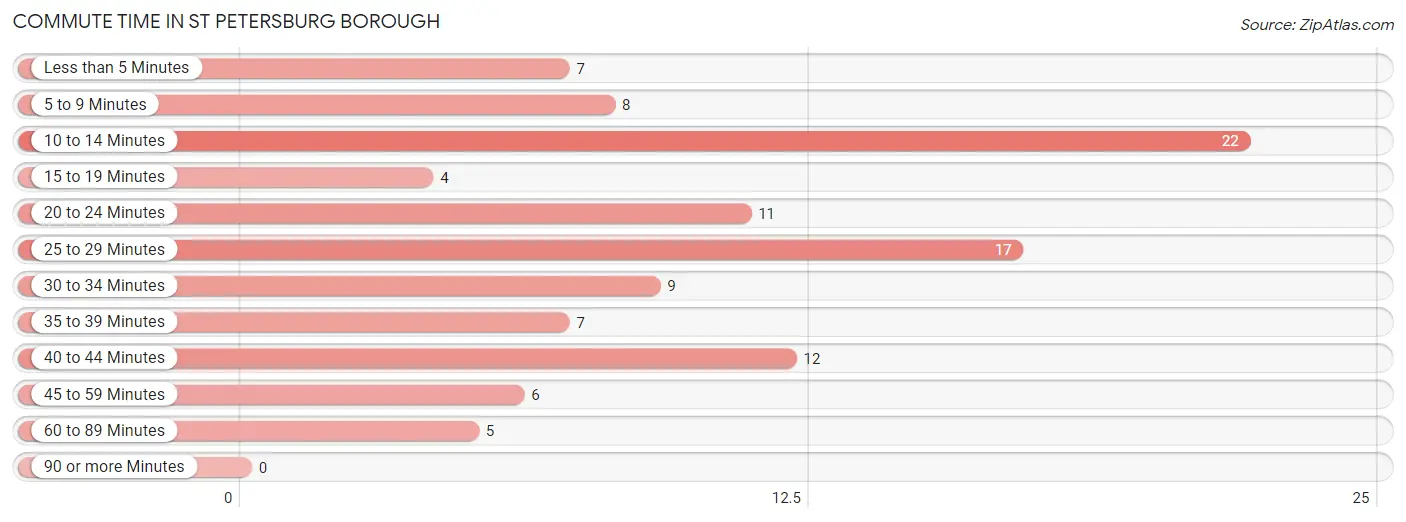
| Commute Time | # Commuters | % Commuters |
| Less than 5 Minutes | 7 | 6.5% |
| 5 to 9 Minutes | 8 | 7.4% |
| 10 to 14 Minutes | 22 | 20.4% |
| 15 to 19 Minutes | 4 | 3.7% |
| 20 to 24 Minutes | 11 | 10.2% |
| 25 to 29 Minutes | 17 | 15.7% |
| 30 to 34 Minutes | 9 | 8.3% |
| 35 to 39 Minutes | 7 | 6.5% |
| 40 to 44 Minutes | 12 | 11.1% |
| 45 to 59 Minutes | 6 | 5.6% |
| 60 to 89 Minutes | 5 | 4.6% |
| 90 or more Minutes | 0 | 0.0% |
Commute Time by Sex in St Petersburg borough
The most common commute times in St Petersburg borough are 10 to 14 minutes (11 commuters, 19.6%) for males and 25 to 29 minutes (15 commuters, 28.8%) for females.
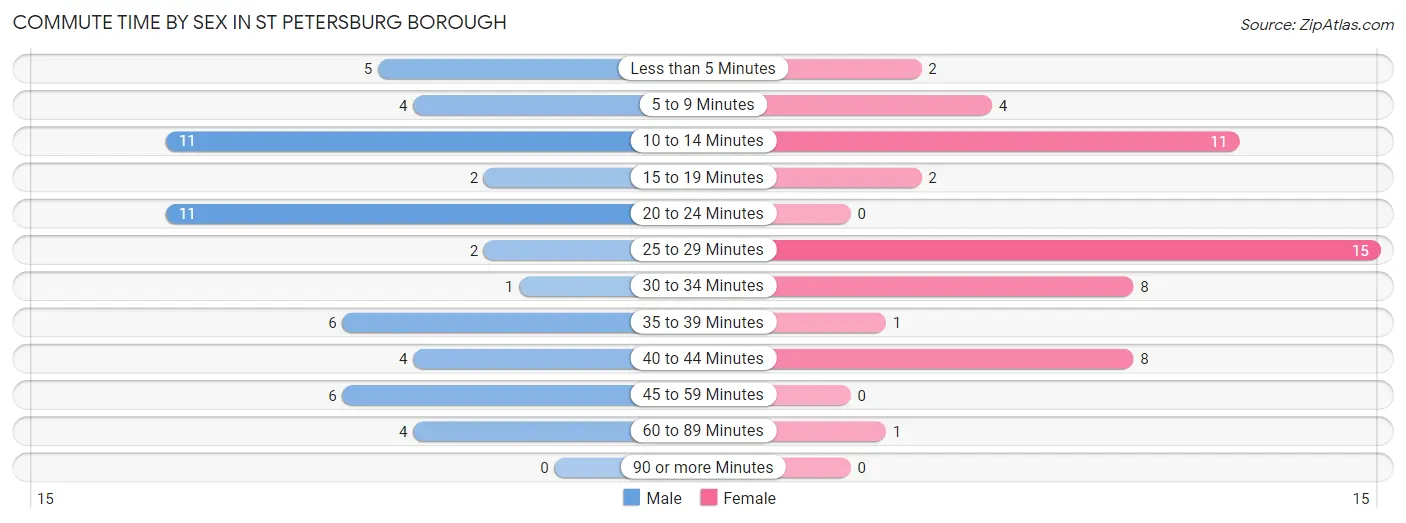
| Commute Time | Male | Female |
| Less than 5 Minutes | 5 (8.9%) | 2 (3.8%) |
| 5 to 9 Minutes | 4 (7.1%) | 4 (7.7%) |
| 10 to 14 Minutes | 11 (19.6%) | 11 (21.1%) |
| 15 to 19 Minutes | 2 (3.6%) | 2 (3.8%) |
| 20 to 24 Minutes | 11 (19.6%) | 0 (0.0%) |
| 25 to 29 Minutes | 2 (3.6%) | 15 (28.8%) |
| 30 to 34 Minutes | 1 (1.8%) | 8 (15.4%) |
| 35 to 39 Minutes | 6 (10.7%) | 1 (1.9%) |
| 40 to 44 Minutes | 4 (7.1%) | 8 (15.4%) |
| 45 to 59 Minutes | 6 (10.7%) | 0 (0.0%) |
| 60 to 89 Minutes | 4 (7.1%) | 1 (1.9%) |
| 90 or more Minutes | 0 (0.0%) | 0 (0.0%) |
Time of Departure to Work by Sex in St Petersburg borough
The most frequent times of departure to work in St Petersburg borough are 12:00 AM to 4:59 AM (30, 53.6%) for males and 7:00 AM to 7:29 AM (15, 28.8%) for females.
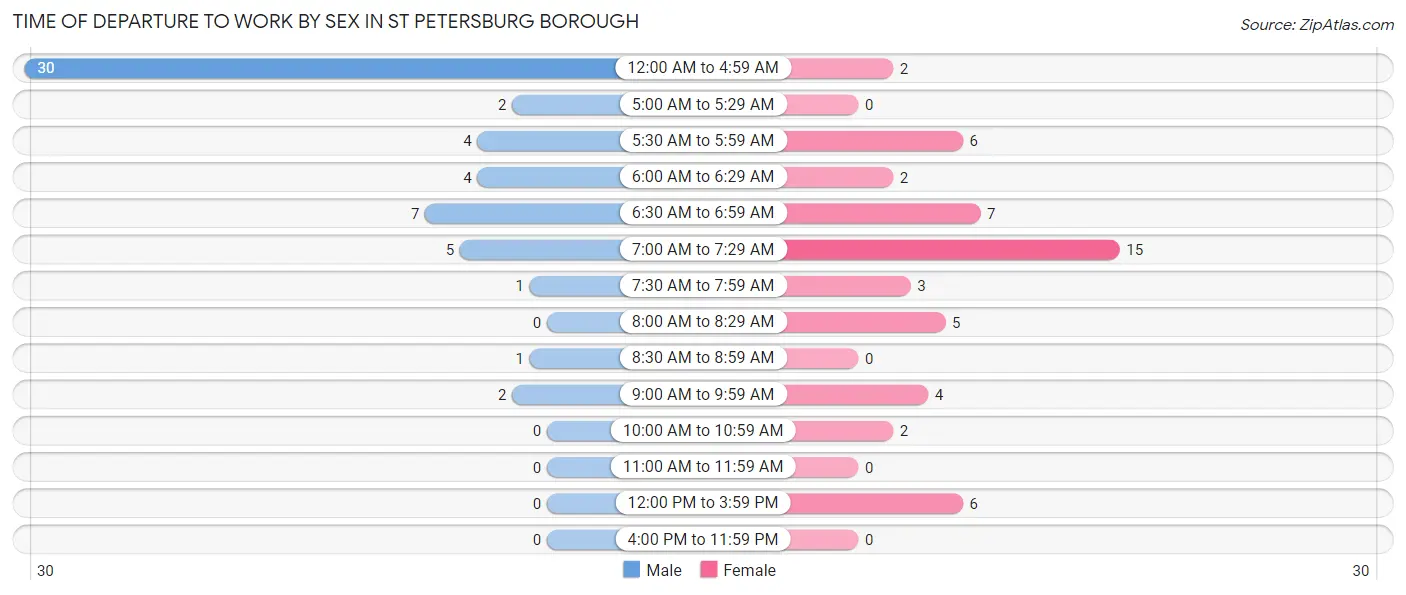
| Time of Departure | Male | Female |
| 12:00 AM to 4:59 AM | 30 (53.6%) | 2 (3.8%) |
| 5:00 AM to 5:29 AM | 2 (3.6%) | 0 (0.0%) |
| 5:30 AM to 5:59 AM | 4 (7.1%) | 6 (11.5%) |
| 6:00 AM to 6:29 AM | 4 (7.1%) | 2 (3.8%) |
| 6:30 AM to 6:59 AM | 7 (12.5%) | 7 (13.5%) |
| 7:00 AM to 7:29 AM | 5 (8.9%) | 15 (28.8%) |
| 7:30 AM to 7:59 AM | 1 (1.8%) | 3 (5.8%) |
| 8:00 AM to 8:29 AM | 0 (0.0%) | 5 (9.6%) |
| 8:30 AM to 8:59 AM | 1 (1.8%) | 0 (0.0%) |
| 9:00 AM to 9:59 AM | 2 (3.6%) | 4 (7.7%) |
| 10:00 AM to 10:59 AM | 0 (0.0%) | 2 (3.8%) |
| 11:00 AM to 11:59 AM | 0 (0.0%) | 0 (0.0%) |
| 12:00 PM to 3:59 PM | 0 (0.0%) | 6 (11.5%) |
| 4:00 PM to 11:59 PM | 0 (0.0%) | 0 (0.0%) |
| Total | 56 (100.0%) | 52 (100.0%) |
Housing Occupancy in St Petersburg borough
Occupancy by Ownership in St Petersburg borough
Of the total 135 dwellings in St Petersburg borough, owner-occupied units account for 106 (78.5%), while renter-occupied units make up 29 (21.5%).
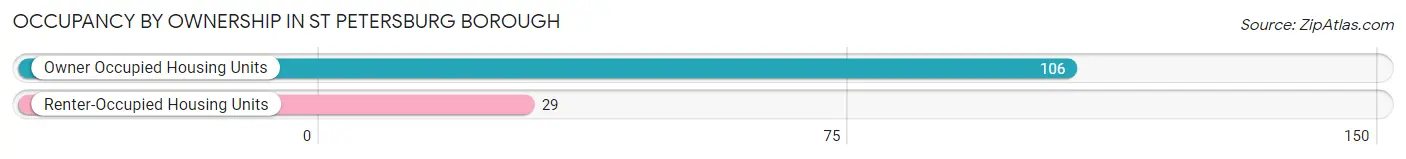
| Occupancy | # Housing Units | % Housing Units |
| Owner Occupied Housing Units | 106 | 78.5% |
| Renter-Occupied Housing Units | 29 | 21.5% |
| Total Occupied Housing Units | 135 | 100.0% |
Occupancy by Household Size in St Petersburg borough
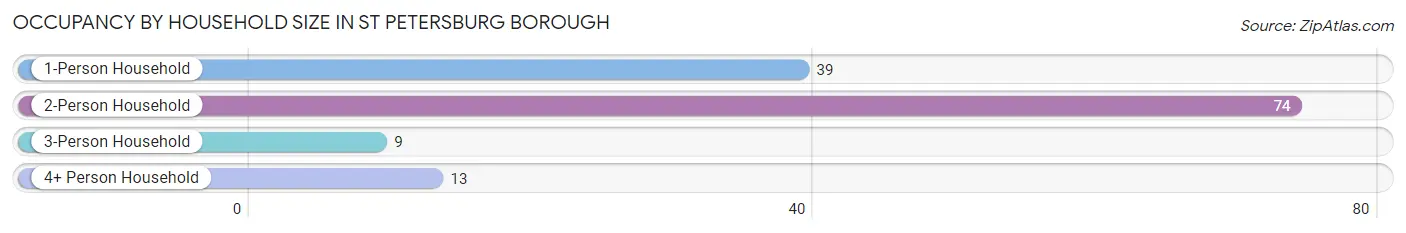
| Household Size | # Housing Units | % Housing Units |
| 1-Person Household | 39 | 28.9% |
| 2-Person Household | 74 | 54.8% |
| 3-Person Household | 9 | 6.7% |
| 4+ Person Household | 13 | 9.6% |
| Total Housing Units | 135 | 100.0% |
Occupancy by Ownership by Household Size in St Petersburg borough
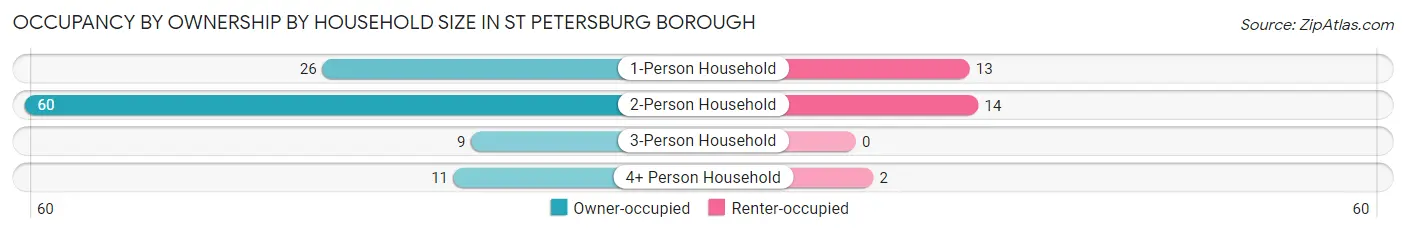
| Household Size | Owner-occupied | Renter-occupied |
| 1-Person Household | 26 (66.7%) | 13 (33.3%) |
| 2-Person Household | 60 (81.1%) | 14 (18.9%) |
| 3-Person Household | 9 (100.0%) | 0 (0.0%) |
| 4+ Person Household | 11 (84.6%) | 2 (15.4%) |
| Total Housing Units | 106 (78.5%) | 29 (21.5%) |
Occupancy by Educational Attainment in St Petersburg borough
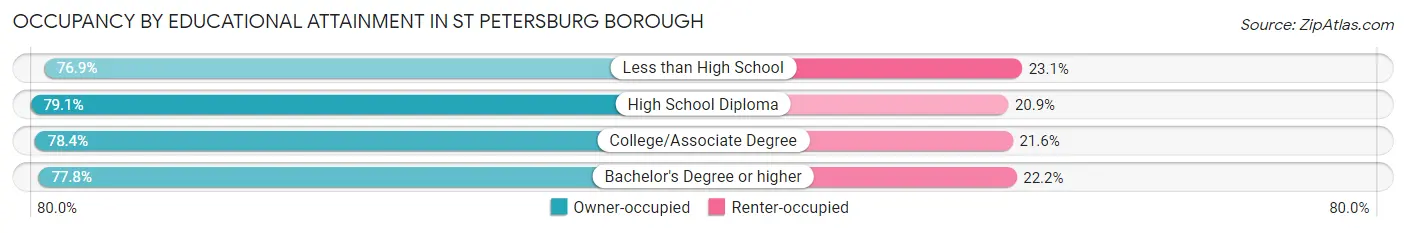
| Household Size | Owner-occupied | Renter-occupied |
| Less than High School | 10 (76.9%) | 3 (23.1%) |
| High School Diploma | 53 (79.1%) | 14 (20.9%) |
| College/Associate Degree | 29 (78.4%) | 8 (21.6%) |
| Bachelor's Degree or higher | 14 (77.8%) | 4 (22.2%) |
Occupancy by Age of Householder in St Petersburg borough
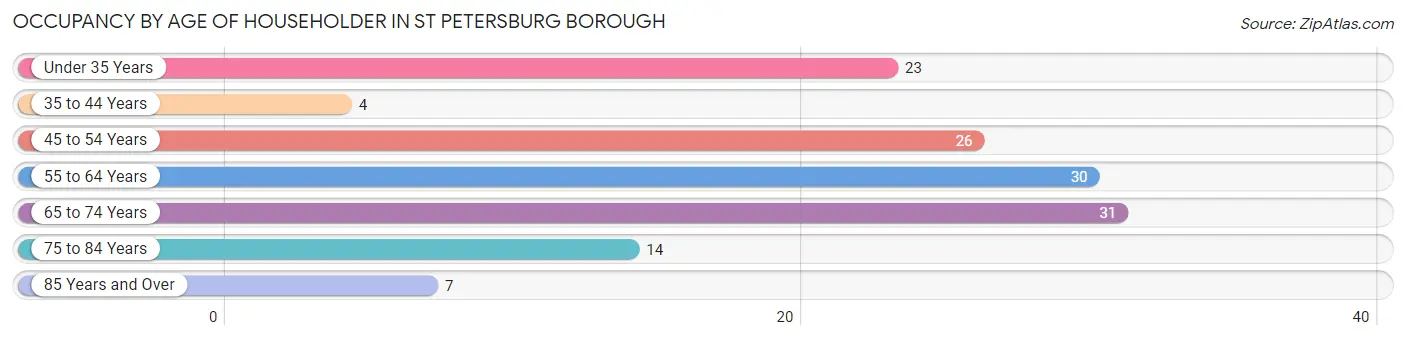
| Age Bracket | # Households | % Households |
| Under 35 Years | 23 | 17.0% |
| 35 to 44 Years | 4 | 3.0% |
| 45 to 54 Years | 26 | 19.3% |
| 55 to 64 Years | 30 | 22.2% |
| 65 to 74 Years | 31 | 23.0% |
| 75 to 84 Years | 14 | 10.4% |
| 85 Years and Over | 7 | 5.2% |
| Total | 135 | 100.0% |
Housing Finances in St Petersburg borough
Median Income by Occupancy in St Petersburg borough
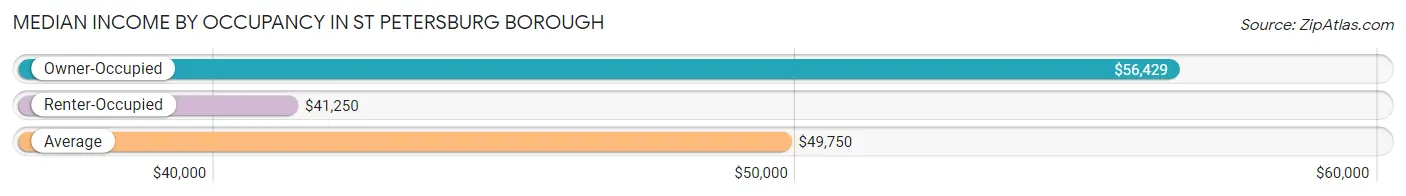
| Occupancy Type | # Households | Median Income |
| Owner-Occupied | 106 (78.5%) | $56,429 |
| Renter-Occupied | 29 (21.5%) | $41,250 |
| Average | 135 (100.0%) | $49,750 |
Occupancy by Householder Income Bracket in St Petersburg borough
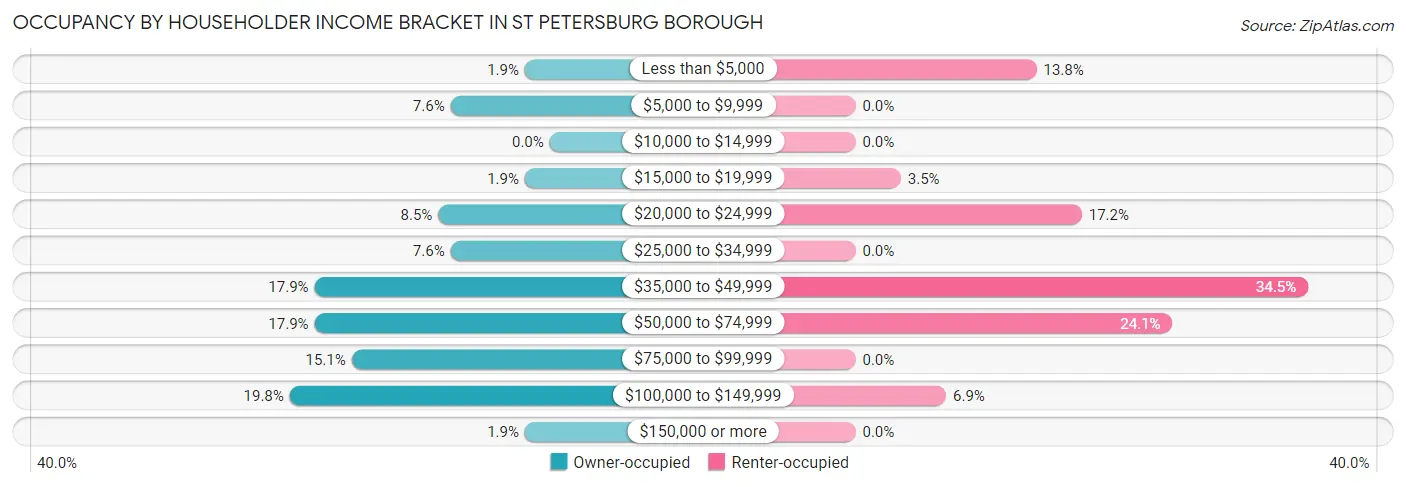
| Income Bracket | Owner-occupied | Renter-occupied |
| Less than $5,000 | 2 (1.9%) | 4 (13.8%) |
| $5,000 to $9,999 | 8 (7.5%) | 0 (0.0%) |
| $10,000 to $14,999 | 0 (0.0%) | 0 (0.0%) |
| $15,000 to $19,999 | 2 (1.9%) | 1 (3.5%) |
| $20,000 to $24,999 | 9 (8.5%) | 5 (17.2%) |
| $25,000 to $34,999 | 8 (7.5%) | 0 (0.0%) |
| $35,000 to $49,999 | 19 (17.9%) | 10 (34.5%) |
| $50,000 to $74,999 | 19 (17.9%) | 7 (24.1%) |
| $75,000 to $99,999 | 16 (15.1%) | 0 (0.0%) |
| $100,000 to $149,999 | 21 (19.8%) | 2 (6.9%) |
| $150,000 or more | 2 (1.9%) | 0 (0.0%) |
| Total | 106 (100.0%) | 29 (100.0%) |
Monthly Housing Cost Tiers in St Petersburg borough
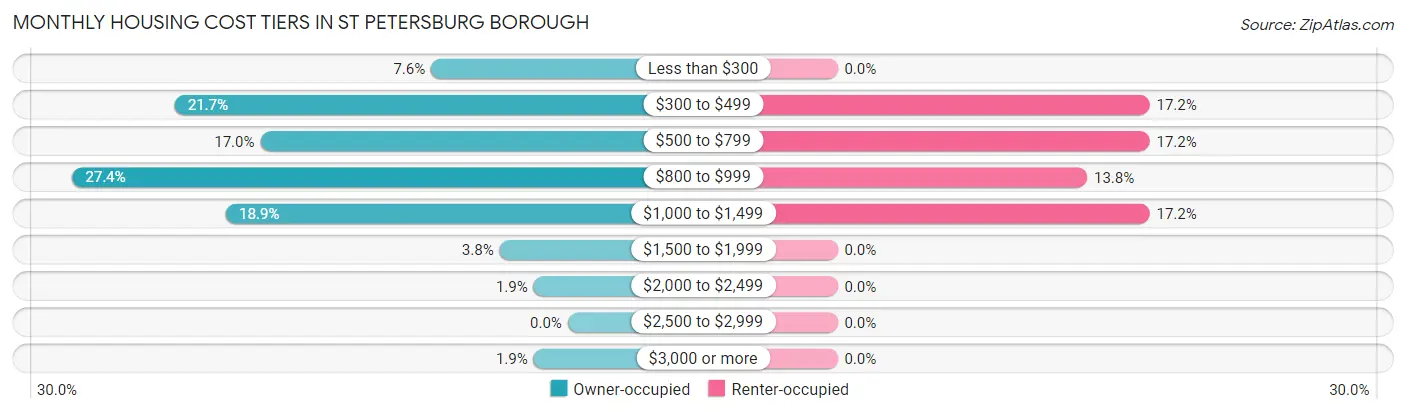
| Monthly Cost | Owner-occupied | Renter-occupied |
| Less than $300 | 8 (7.5%) | 0 (0.0%) |
| $300 to $499 | 23 (21.7%) | 5 (17.2%) |
| $500 to $799 | 18 (17.0%) | 5 (17.2%) |
| $800 to $999 | 29 (27.4%) | 4 (13.8%) |
| $1,000 to $1,499 | 20 (18.9%) | 5 (17.2%) |
| $1,500 to $1,999 | 4 (3.8%) | 0 (0.0%) |
| $2,000 to $2,499 | 2 (1.9%) | 0 (0.0%) |
| $2,500 to $2,999 | 0 (0.0%) | 0 (0.0%) |
| $3,000 or more | 2 (1.9%) | 0 (0.0%) |
| Total | 106 (100.0%) | 29 (100.0%) |
Physical Housing Characteristics in St Petersburg borough
Housing Structures in St Petersburg borough
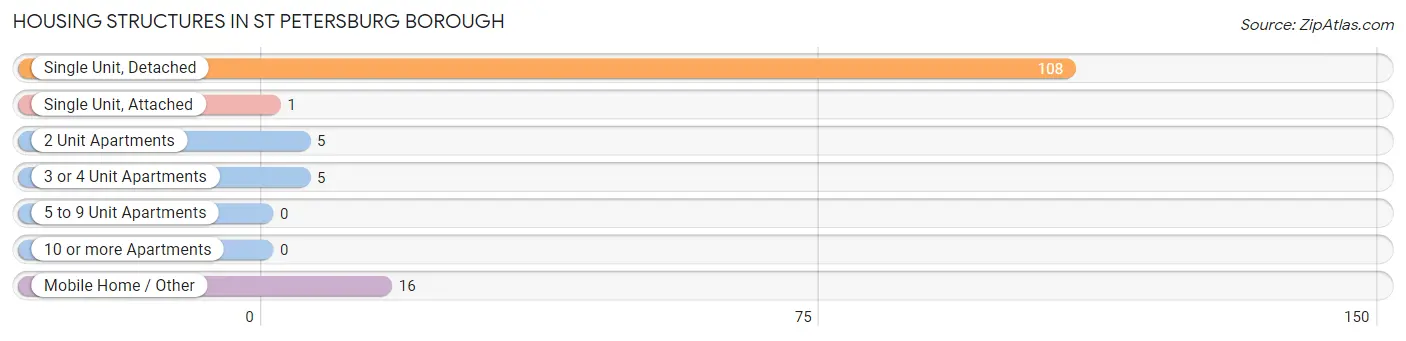
| Structure Type | # Housing Units | % Housing Units |
| Single Unit, Detached | 108 | 80.0% |
| Single Unit, Attached | 1 | 0.7% |
| 2 Unit Apartments | 5 | 3.7% |
| 3 or 4 Unit Apartments | 5 | 3.7% |
| 5 to 9 Unit Apartments | 0 | 0.0% |
| 10 or more Apartments | 0 | 0.0% |
| Mobile Home / Other | 16 | 11.8% |
| Total | 135 | 100.0% |
Housing Structures by Occupancy in St Petersburg borough
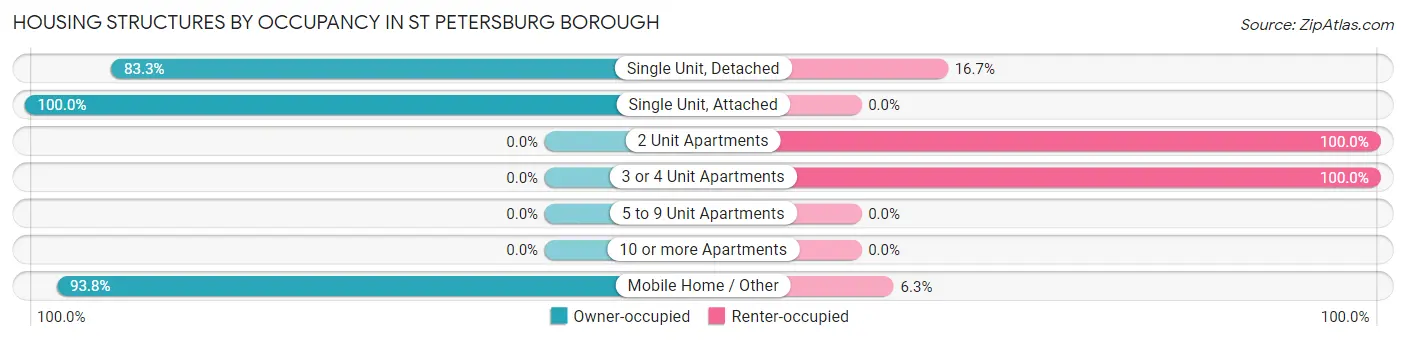
| Structure Type | Owner-occupied | Renter-occupied |
| Single Unit, Detached | 90 (83.3%) | 18 (16.7%) |
| Single Unit, Attached | 1 (100.0%) | 0 (0.0%) |
| 2 Unit Apartments | 0 (0.0%) | 5 (100.0%) |
| 3 or 4 Unit Apartments | 0 (0.0%) | 5 (100.0%) |
| 5 to 9 Unit Apartments | 0 (0.0%) | 0 (0.0%) |
| 10 or more Apartments | 0 (0.0%) | 0 (0.0%) |
| Mobile Home / Other | 15 (93.8%) | 1 (6.2%) |
| Total | 106 (78.5%) | 29 (21.5%) |
Housing Structures by Number of Rooms in St Petersburg borough
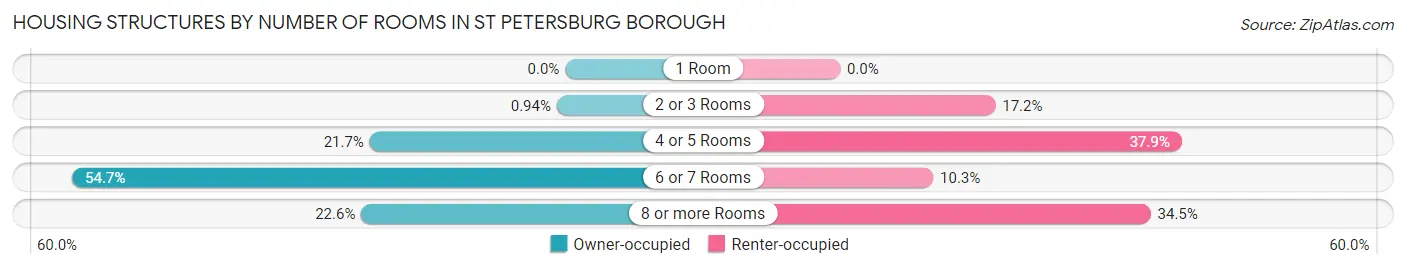
| Number of Rooms | Owner-occupied | Renter-occupied |
| 1 Room | 0 (0.0%) | 0 (0.0%) |
| 2 or 3 Rooms | 1 (0.9%) | 5 (17.2%) |
| 4 or 5 Rooms | 23 (21.7%) | 11 (37.9%) |
| 6 or 7 Rooms | 58 (54.7%) | 3 (10.3%) |
| 8 or more Rooms | 24 (22.6%) | 10 (34.5%) |
| Total | 106 (100.0%) | 29 (100.0%) |
Housing Structure by Heating Type in St Petersburg borough
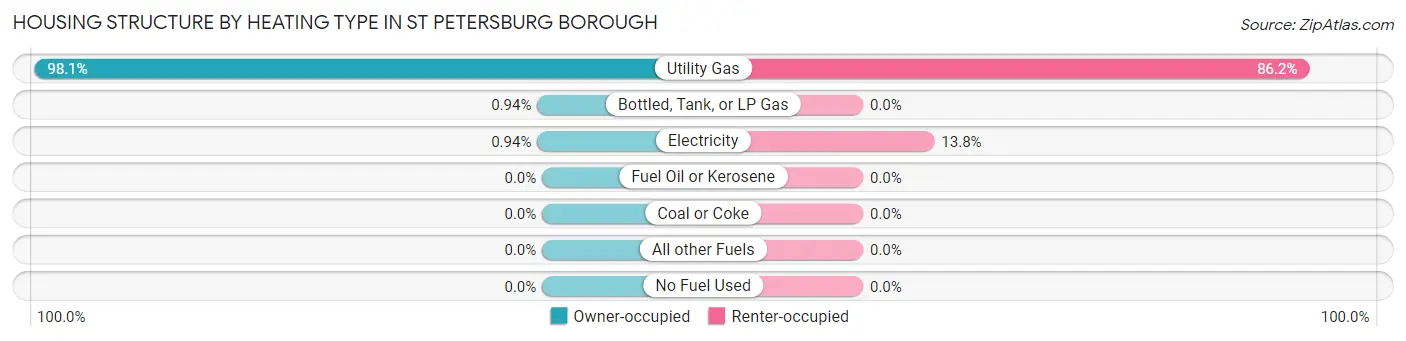
| Heating Type | Owner-occupied | Renter-occupied |
| Utility Gas | 104 (98.1%) | 25 (86.2%) |
| Bottled, Tank, or LP Gas | 1 (0.9%) | 0 (0.0%) |
| Electricity | 1 (0.9%) | 4 (13.8%) |
| Fuel Oil or Kerosene | 0 (0.0%) | 0 (0.0%) |
| Coal or Coke | 0 (0.0%) | 0 (0.0%) |
| All other Fuels | 0 (0.0%) | 0 (0.0%) |
| No Fuel Used | 0 (0.0%) | 0 (0.0%) |
| Total | 106 (100.0%) | 29 (100.0%) |
Household Vehicle Usage in St Petersburg borough
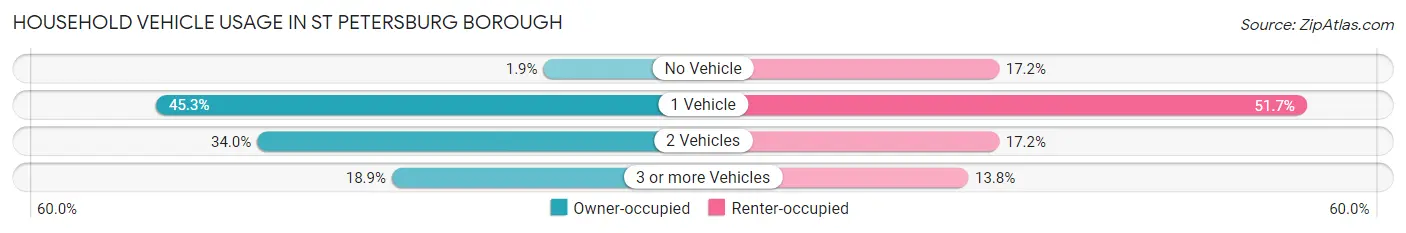
| Vehicles per Household | Owner-occupied | Renter-occupied |
| No Vehicle | 2 (1.9%) | 5 (17.2%) |
| 1 Vehicle | 48 (45.3%) | 15 (51.7%) |
| 2 Vehicles | 36 (34.0%) | 5 (17.2%) |
| 3 or more Vehicles | 20 (18.9%) | 4 (13.8%) |
| Total | 106 (100.0%) | 29 (100.0%) |
Real Estate & Mortgages in St Petersburg borough
Real Estate and Mortgage Overview in St Petersburg borough
| Characteristic | Without Mortgage | With Mortgage |
| Housing Units | 46 | 60 |
| Median Property Value | - | - |
| Median Household Income | $39,167 | $2 |
| Monthly Housing Costs | $433 | $2 |
| Real Estate Taxes | $1,056 | $2 |
Property Value by Mortgage Status in St Petersburg borough
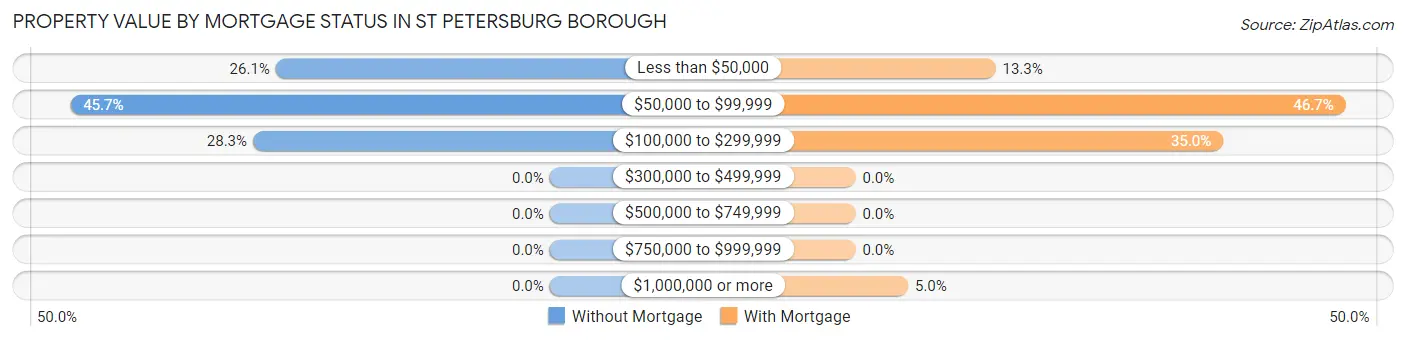
| Property Value | Without Mortgage | With Mortgage |
| Less than $50,000 | 12 (26.1%) | 8 (13.3%) |
| $50,000 to $99,999 | 21 (45.7%) | 28 (46.7%) |
| $100,000 to $299,999 | 13 (28.3%) | 21 (35.0%) |
| $300,000 to $499,999 | 0 (0.0%) | 0 (0.0%) |
| $500,000 to $749,999 | 0 (0.0%) | 0 (0.0%) |
| $750,000 to $999,999 | 0 (0.0%) | 0 (0.0%) |
| $1,000,000 or more | 0 (0.0%) | 3 (5.0%) |
| Total | 46 (100.0%) | 60 (100.0%) |
Household Income by Mortgage Status in St Petersburg borough
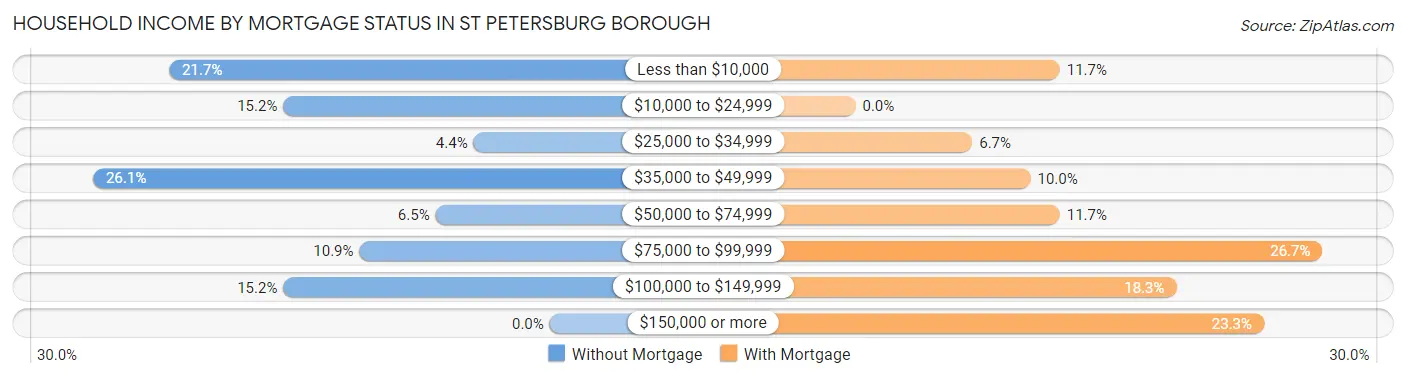
| Household Income | Without Mortgage | With Mortgage |
| Less than $10,000 | 10 (21.7%) | 7 (11.7%) |
| $10,000 to $24,999 | 7 (15.2%) | 0 (0.0%) |
| $25,000 to $34,999 | 2 (4.3%) | 4 (6.7%) |
| $35,000 to $49,999 | 12 (26.1%) | 6 (10.0%) |
| $50,000 to $74,999 | 3 (6.5%) | 7 (11.7%) |
| $75,000 to $99,999 | 5 (10.9%) | 16 (26.7%) |
| $100,000 to $149,999 | 7 (15.2%) | 11 (18.3%) |
| $150,000 or more | 0 (0.0%) | 14 (23.3%) |
| Total | 46 (100.0%) | 60 (100.0%) |
Property Value to Household Income Ratio in St Petersburg borough
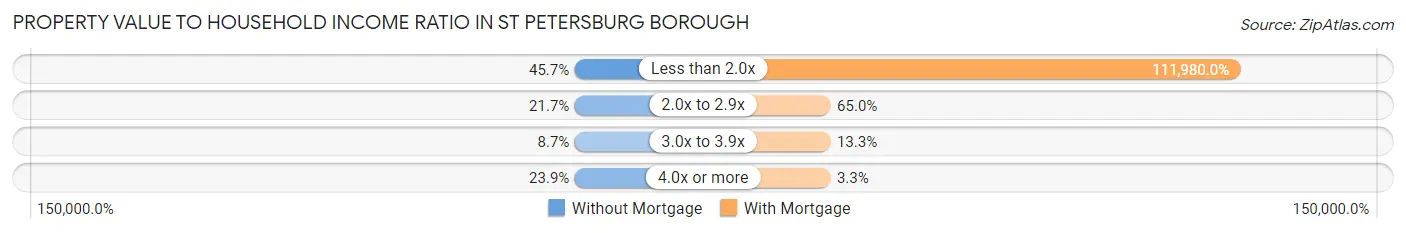
| Value-to-Income Ratio | Without Mortgage | With Mortgage |
| Less than 2.0x | 21 (45.7%) | 67,188 (111,980.0%) |
| 2.0x to 2.9x | 10 (21.7%) | 39 (65.0%) |
| 3.0x to 3.9x | 4 (8.7%) | 8 (13.3%) |
| 4.0x or more | 11 (23.9%) | 2 (3.3%) |
| Total | 46 (100.0%) | 60 (100.0%) |
Real Estate Taxes by Mortgage Status in St Petersburg borough
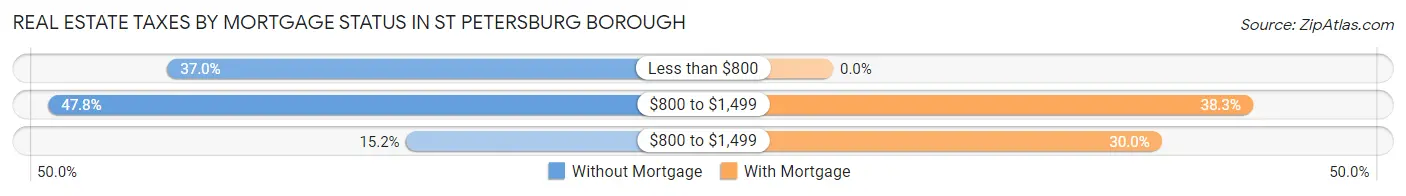
| Property Taxes | Without Mortgage | With Mortgage |
| Less than $800 | 17 (37.0%) | 0 (0.0%) |
| $800 to $1,499 | 22 (47.8%) | 23 (38.3%) |
| $800 to $1,499 | 7 (15.2%) | 18 (30.0%) |
| Total | 46 (100.0%) | 60 (100.0%) |
Health & Disability in St Petersburg borough
Health Insurance Coverage by Age in St Petersburg borough
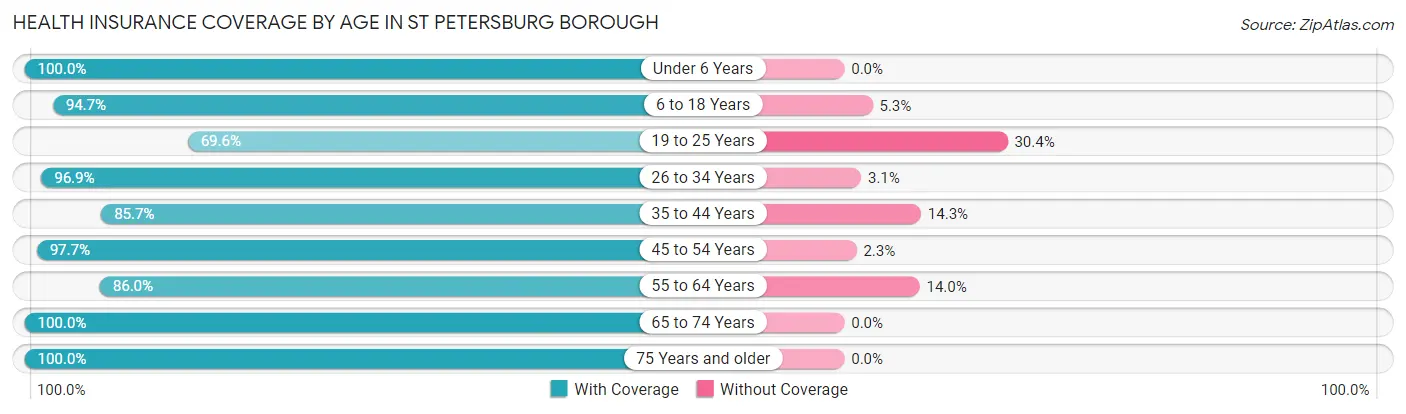
| Age Bracket | With Coverage | Without Coverage |
| Under 6 Years | 4 (100.0%) | 0 (0.0%) |
| 6 to 18 Years | 18 (94.7%) | 1 (5.3%) |
| 19 to 25 Years | 16 (69.6%) | 7 (30.4%) |
| 26 to 34 Years | 31 (96.9%) | 1 (3.1%) |
| 35 to 44 Years | 6 (85.7%) | 1 (14.3%) |
| 45 to 54 Years | 43 (97.7%) | 1 (2.3%) |
| 55 to 64 Years | 49 (86.0%) | 8 (14.0%) |
| 65 to 74 Years | 50 (100.0%) | 0 (0.0%) |
| 75 Years and older | 36 (100.0%) | 0 (0.0%) |
| Total | 253 (93.0%) | 19 (7.0%) |
Health Insurance Coverage by Citizenship Status in St Petersburg borough
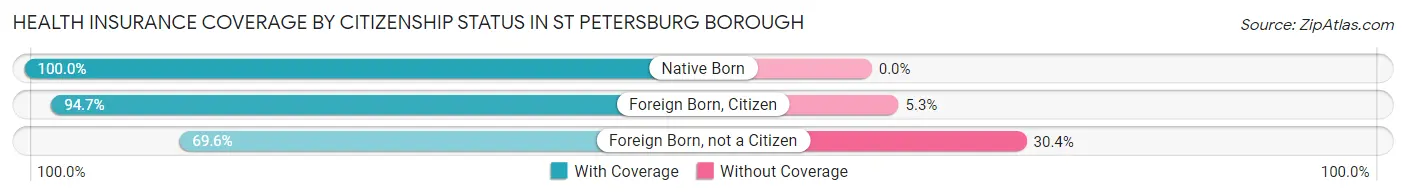
| Citizenship Status | With Coverage | Without Coverage |
| Native Born | 4 (100.0%) | 0 (0.0%) |
| Foreign Born, Citizen | 18 (94.7%) | 1 (5.3%) |
| Foreign Born, not a Citizen | 16 (69.6%) | 7 (30.4%) |
Health Insurance Coverage by Household Income in St Petersburg borough
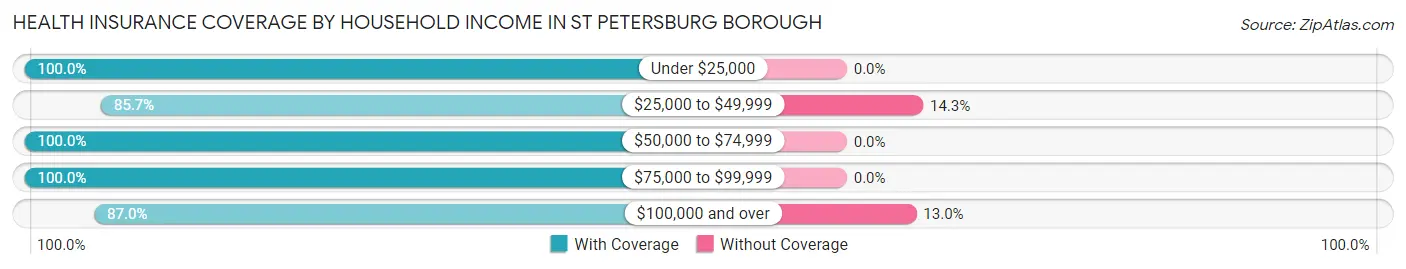
| Household Income | With Coverage | Without Coverage |
| Under $25,000 | 37 (100.0%) | 0 (0.0%) |
| $25,000 to $49,999 | 60 (85.7%) | 10 (14.3%) |
| $50,000 to $74,999 | 59 (100.0%) | 0 (0.0%) |
| $75,000 to $99,999 | 37 (100.0%) | 0 (0.0%) |
| $100,000 and over | 60 (87.0%) | 9 (13.0%) |
Public vs Private Health Insurance Coverage by Age in St Petersburg borough
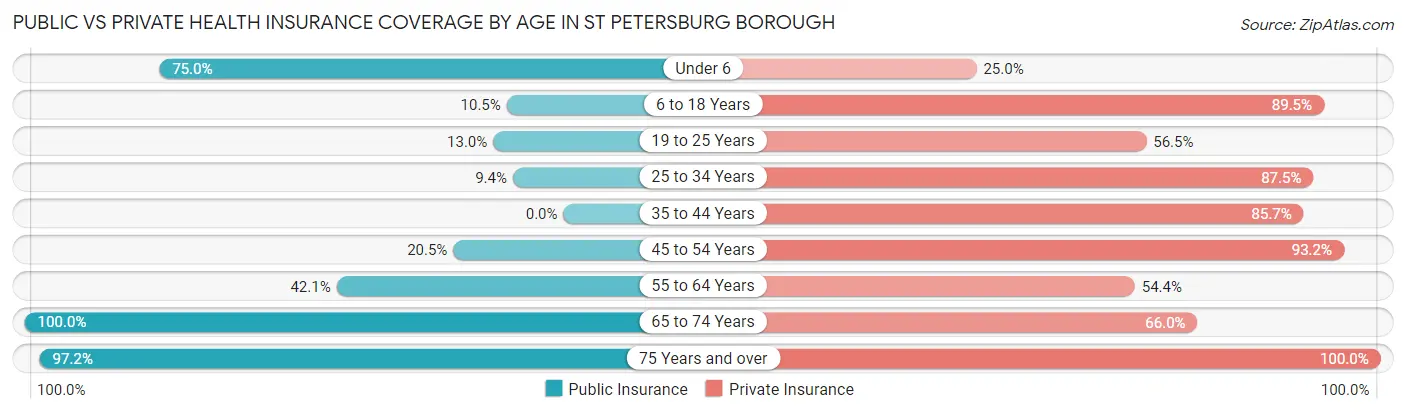
| Age Bracket | Public Insurance | Private Insurance |
| Under 6 | 3 (75.0%) | 1 (25.0%) |
| 6 to 18 Years | 2 (10.5%) | 17 (89.5%) |
| 19 to 25 Years | 3 (13.0%) | 13 (56.5%) |
| 25 to 34 Years | 3 (9.4%) | 28 (87.5%) |
| 35 to 44 Years | 0 (0.0%) | 6 (85.7%) |
| 45 to 54 Years | 9 (20.4%) | 41 (93.2%) |
| 55 to 64 Years | 24 (42.1%) | 31 (54.4%) |
| 65 to 74 Years | 50 (100.0%) | 33 (66.0%) |
| 75 Years and over | 35 (97.2%) | 36 (100.0%) |
| Total | 129 (47.4%) | 206 (75.7%) |
Disability Status by Sex by Age in St Petersburg borough
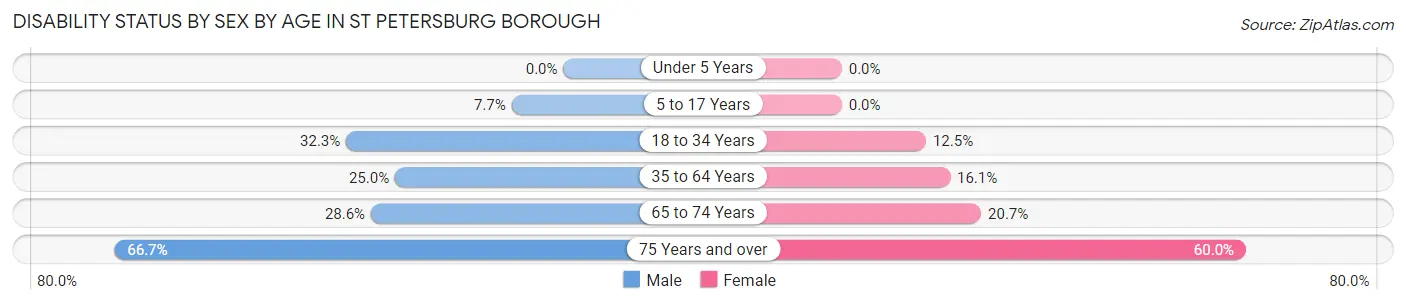
| Age Bracket | Male | Female |
| Under 5 Years | 0 (0.0%) | 0 (0.0%) |
| 5 to 17 Years | 1 (7.7%) | 0 (0.0%) |
| 18 to 34 Years | 10 (32.3%) | 3 (12.5%) |
| 35 to 64 Years | 13 (25.0%) | 9 (16.1%) |
| 65 to 74 Years | 6 (28.6%) | 6 (20.7%) |
| 75 Years and over | 14 (66.7%) | 9 (60.0%) |
Disability Class by Sex by Age in St Petersburg borough
Disability Class: Hearing Difficulty
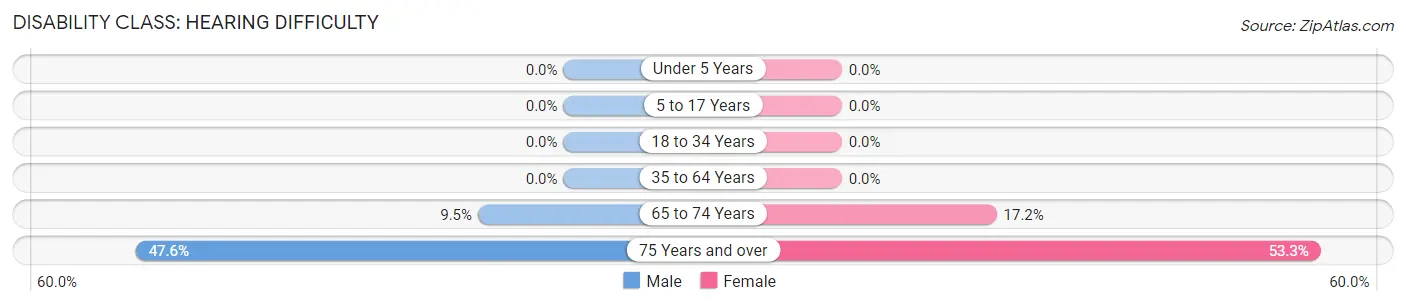
| Age Bracket | Male | Female |
| Under 5 Years | 0 (0.0%) | 0 (0.0%) |
| 5 to 17 Years | 0 (0.0%) | 0 (0.0%) |
| 18 to 34 Years | 0 (0.0%) | 0 (0.0%) |
| 35 to 64 Years | 0 (0.0%) | 0 (0.0%) |
| 65 to 74 Years | 2 (9.5%) | 5 (17.2%) |
| 75 Years and over | 10 (47.6%) | 8 (53.3%) |
Disability Class: Vision Difficulty
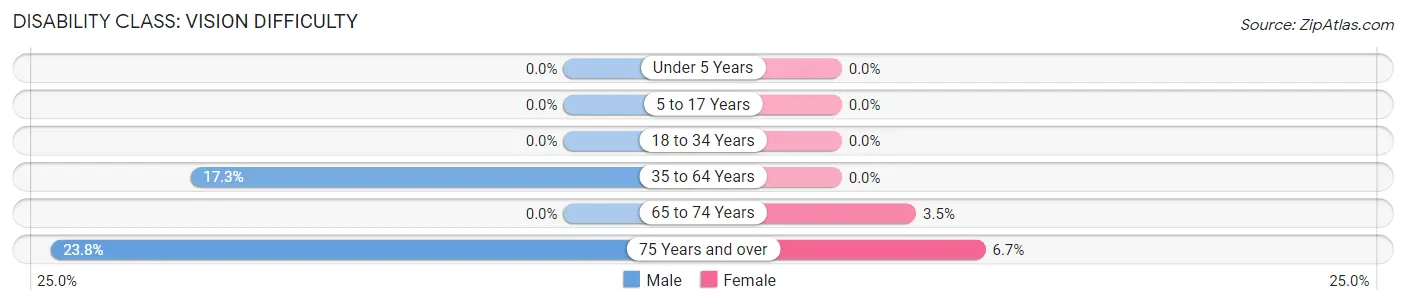
| Age Bracket | Male | Female |
| Under 5 Years | 0 (0.0%) | 0 (0.0%) |
| 5 to 17 Years | 0 (0.0%) | 0 (0.0%) |
| 18 to 34 Years | 0 (0.0%) | 0 (0.0%) |
| 35 to 64 Years | 9 (17.3%) | 0 (0.0%) |
| 65 to 74 Years | 0 (0.0%) | 1 (3.5%) |
| 75 Years and over | 5 (23.8%) | 1 (6.7%) |
Disability Class: Cognitive Difficulty
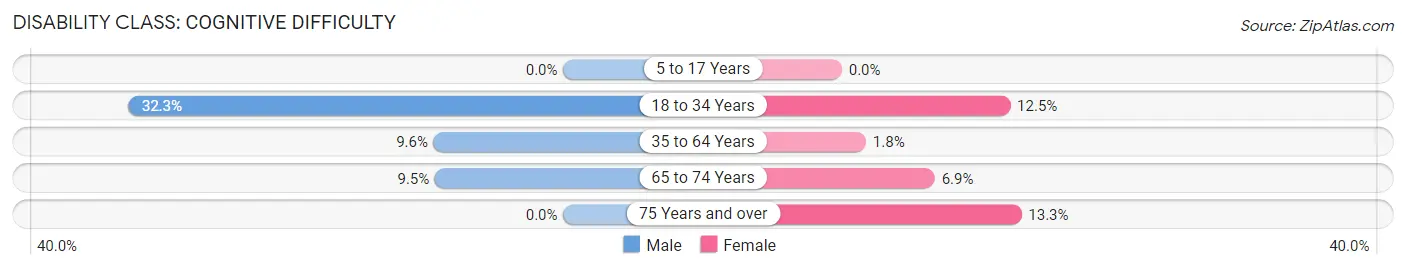
| Age Bracket | Male | Female |
| 5 to 17 Years | 0 (0.0%) | 0 (0.0%) |
| 18 to 34 Years | 10 (32.3%) | 3 (12.5%) |
| 35 to 64 Years | 5 (9.6%) | 1 (1.8%) |
| 65 to 74 Years | 2 (9.5%) | 2 (6.9%) |
| 75 Years and over | 0 (0.0%) | 2 (13.3%) |
Disability Class: Ambulatory Difficulty
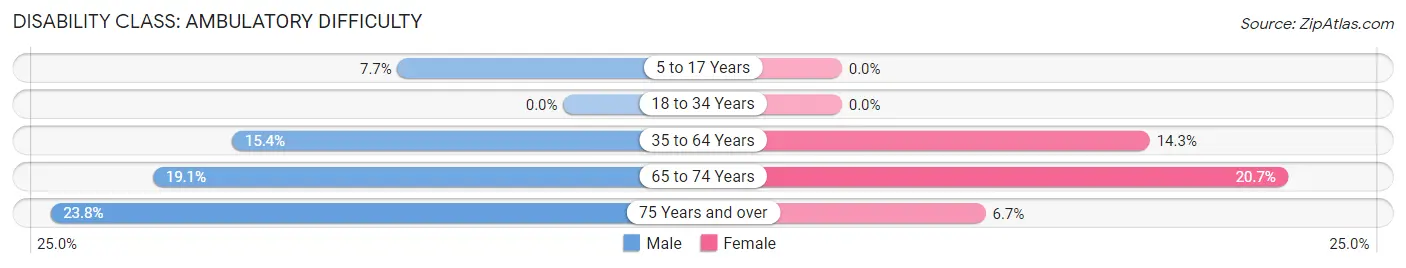
| Age Bracket | Male | Female |
| 5 to 17 Years | 1 (7.7%) | 0 (0.0%) |
| 18 to 34 Years | 0 (0.0%) | 0 (0.0%) |
| 35 to 64 Years | 8 (15.4%) | 8 (14.3%) |
| 65 to 74 Years | 4 (19.1%) | 6 (20.7%) |
| 75 Years and over | 5 (23.8%) | 1 (6.7%) |
Disability Class: Self-Care Difficulty
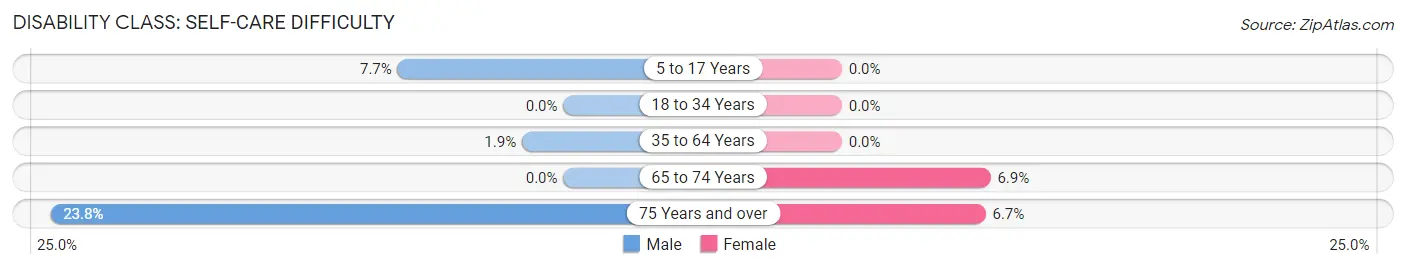
| Age Bracket | Male | Female |
| 5 to 17 Years | 1 (7.7%) | 0 (0.0%) |
| 18 to 34 Years | 0 (0.0%) | 0 (0.0%) |
| 35 to 64 Years | 1 (1.9%) | 0 (0.0%) |
| 65 to 74 Years | 0 (0.0%) | 2 (6.9%) |
| 75 Years and over | 5 (23.8%) | 1 (6.7%) |
Technology Access in St Petersburg borough
Computing Device Access in St Petersburg borough
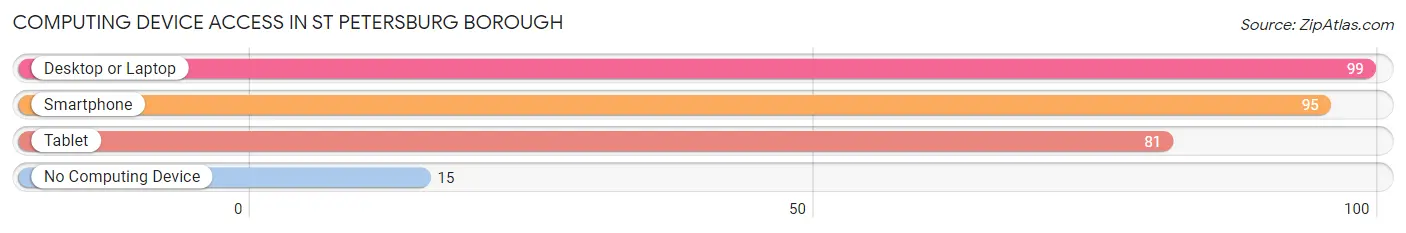
| Device Type | # Households | % Households |
| Desktop or Laptop | 99 | 73.3% |
| Smartphone | 95 | 70.4% |
| Tablet | 81 | 60.0% |
| No Computing Device | 15 | 11.1% |
| Total | 135 | 100.0% |
Internet Access in St Petersburg borough
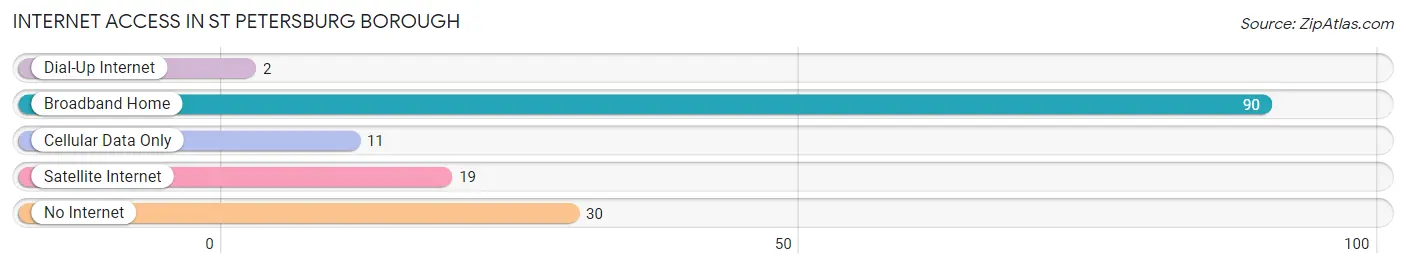
| Internet Type | # Households | % Households |
| Dial-Up Internet | 2 | 1.5% |
| Broadband Home | 90 | 66.7% |
| Cellular Data Only | 11 | 8.2% |
| Satellite Internet | 19 | 14.1% |
| No Internet | 30 | 22.2% |
| Total | 135 | 100.0% |
St Petersburg borough Summary
St Petersburg Borough is a borough located in Clarion County, Pennsylvania. It is situated in the northwestern part of the state, approximately 70 miles northeast of Pittsburgh. The borough is bordered by the Clarion River to the north and the Allegheny River to the south. As of the 2010 census, the population of St Petersburg Borough was 1,845.
History
St Petersburg Borough was founded in 1851 by a group of settlers from St Petersburg, Russia. The settlers were led by a man named John Kostka, who had been a soldier in the Russian army. The settlers chose the area because of its proximity to the Clarion River, which provided them with a means of transportation and access to the Allegheny River. The settlers named the area St Petersburg after their hometown in Russia.
The first settlers of St Petersburg Borough were mostly of German and Russian descent. They were primarily farmers and lumbermen, and the area quickly became known for its timber industry. The timber industry was so successful that the borough was incorporated in 1871.
In the late 19th century, St Petersburg Borough began to experience a period of growth and prosperity. The timber industry continued to thrive, and the borough became a popular destination for tourists. The borough also became a center for the production of furniture and other wood products.
Geography
St Petersburg Borough is located in the northwestern part of Clarion County, Pennsylvania. It is situated along the Clarion River and the Allegheny River. The borough is bordered by the townships of Beaver, Richland, and Perry.
The borough has a total area of 1.3 square miles, all of which is land. The terrain is mostly flat, with some rolling hills. The climate is humid continental, with cold winters and warm summers.
Economy
The economy of St Petersburg Borough is largely based on the timber industry. The borough is home to several sawmills and woodworking shops, as well as a furniture factory. The borough also has a number of small businesses, including restaurants, retail stores, and service providers.
The borough is also home to a number of tourist attractions, including the Clarion River, the Allegheny River, and the St Petersburg Borough Historical Society Museum.
Demographics
As of the 2010 census, the population of St Petersburg Borough was 1,845. The racial makeup of the borough was 97.3% White, 0.7% African American, 0.2% Native American, 0.2% Asian, 0.1% from other races, and 1.5% from two or more races. Hispanic or Latino of any race were 0.7% of the population.
The median household income in St Petersburg Borough was $37,917, and the median family income was $45,000. The per capita income was $19,845. About 11.3% of families and 14.2% of the population were below the poverty line, including 18.2% of those under age 18 and 8.3% of those age 65 or over.
Common Questions
What is Per Capita Income in St Petersburg borough?
Per Capita income in St Petersburg borough is $30,702.
What is the Median Family Income in St Petersburg borough?
Median Family Income in St Petersburg borough is $68,750.
What is the Median Household income in St Petersburg borough?
Median Household Income in St Petersburg borough is $49,750.
What is Income or Wage Gap in St Petersburg borough?
Income or Wage Gap in St Petersburg borough is 59.3%.
Women in St Petersburg borough earn 40.7 cents for every dollar earned by a man.
What is Inequality or Gini Index in St Petersburg borough?
Inequality or Gini Index in St Petersburg borough is 0.37.
What is the Total Population of St Petersburg borough?
Total Population of St Petersburg borough is 272.
What is the Total Male Population of St Petersburg borough?
Total Male Population of St Petersburg borough is 140.
What is the Total Female Population of St Petersburg borough?
Total Female Population of St Petersburg borough is 132.
What is the Ratio of Males per 100 Females in St Petersburg borough?
There are 106.06 Males per 100 Females in St Petersburg borough.
What is the Ratio of Females per 100 Males in St Petersburg borough?
There are 94.29 Females per 100 Males in St Petersburg borough.
What is the Median Population Age in St Petersburg borough?
Median Population Age in St Petersburg borough is 55.6 Years.
What is the Average Family Size in St Petersburg borough
Average Family Size in St Petersburg borough is 2.4 People.
What is the Average Household Size in St Petersburg borough
Average Household Size in St Petersburg borough is 2.0 People.
How Large is the Labor Force in St Petersburg borough?
There are 129 People in the Labor Forcein in St Petersburg borough.
What is the Percentage of People in the Labor Force in St Petersburg borough?
51.0% of People are in the Labor Force in St Petersburg borough.
What is the Unemployment Rate in St Petersburg borough?
Unemployment Rate in St Petersburg borough is 9.3%.