Mountville borough, PA Map & Demographics
Mountville borough Overview
$38,971
PER CAPITA INCOME
$103,553
AVG FAMILY INCOME
$83,578
AVG HOUSEHOLD INCOME
36.8%
WAGE / INCOME GAP [ % ]
63.2¢/ $1
WAGE / INCOME GAP [ $ ]
0.35
INEQUALITY / GINI INDEX
3,002
TOTAL POPULATION
1,478
MALE POPULATION
1,524
FEMALE POPULATION
96.98
MALES / 100 FEMALES
103.11
FEMALES / 100 MALES
45.9
MEDIAN AGE
2.8
AVG FAMILY SIZE
2.1
AVG HOUSEHOLD SIZE
1,548
LABOR FORCE [ PEOPLE ]
62.1%
PERCENT IN LABOR FORCE
1.1%
UNEMPLOYMENT RATE
Income in Mountville borough
Income Overview in Mountville borough
Per Capita Income in Mountville borough is $38,971, while median incomes of families and households are $103,553 and $83,578 respectively.
| Characteristic | Number | Measure |
| Per Capita Income | 3,002 | $38,971 |
| Median Family Income | 780 | $103,553 |
| Mean Family Income | 780 | $109,908 |
| Median Household Income | 1,334 | $83,578 |
| Mean Household Income | 1,334 | $87,195 |
| Income Deficit | 780 | $0 |
| Wage / Income Gap (%) | 3,002 | 36.82% |
| Wage / Income Gap ($) | 3,002 | 63.18¢ per $1 |
| Gini / Inequality Index | 3,002 | 0.35 |
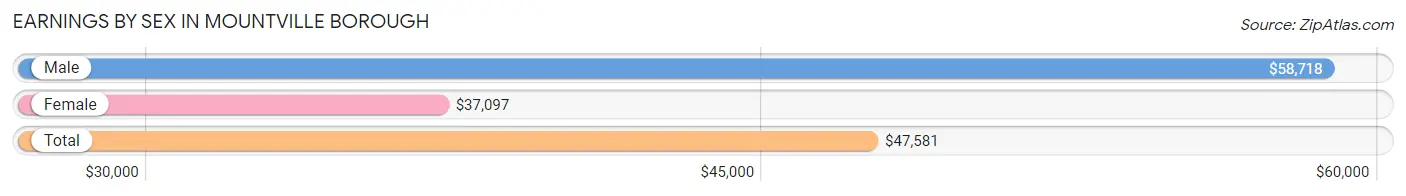
Earnings by Sex in Mountville borough
Average Earnings in Mountville borough are $47,581, $58,718 for men and $37,097 for women, a difference of 36.8%.
| Sex | Number | Average Earnings |
| Male | 808 (49.9%) | $58,718 |
| Female | 810 (50.1%) | $37,097 |
| Total | 1,618 (100.0%) | $47,581 |
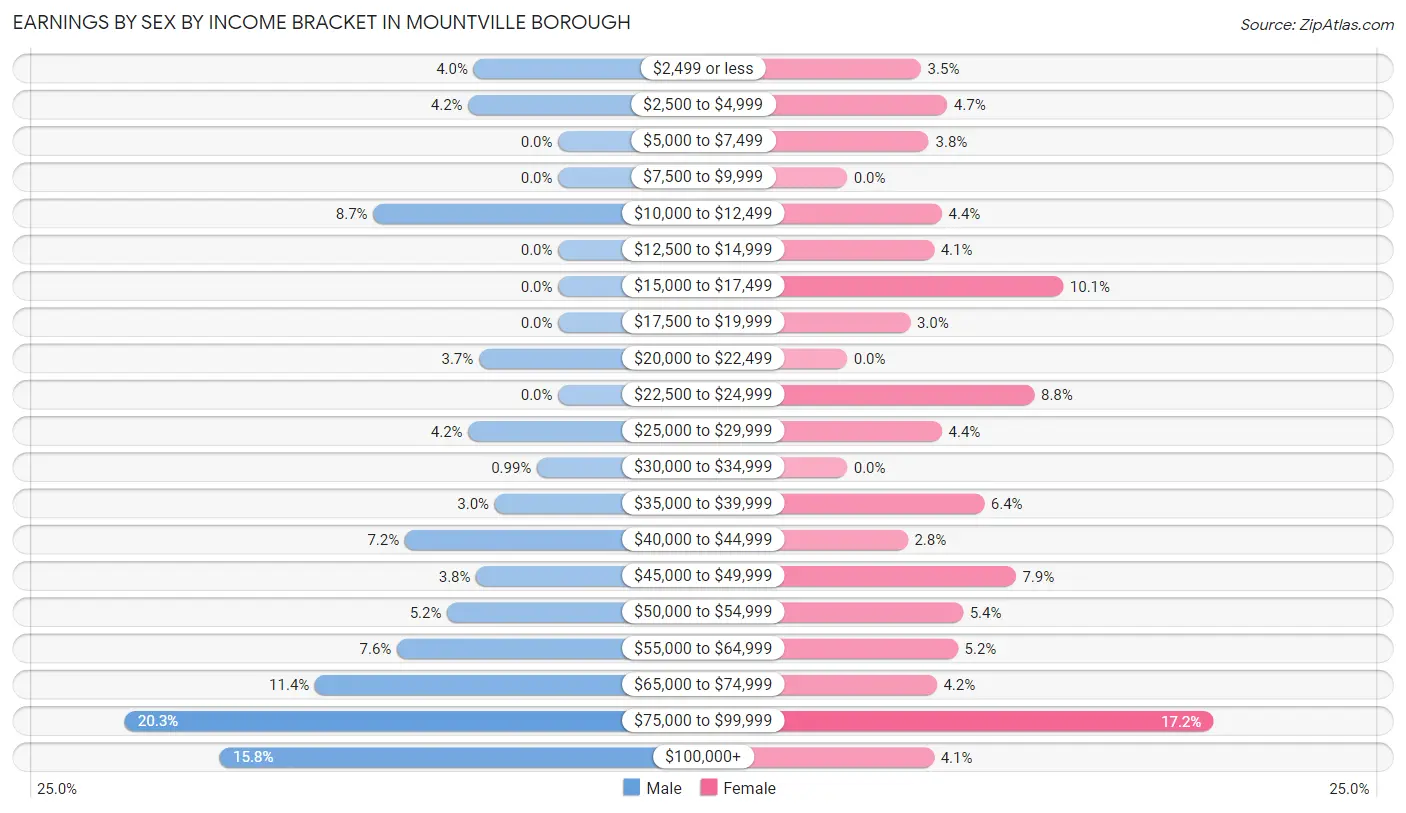
Earnings by Sex by Income Bracket in Mountville borough
The most common earnings brackets in Mountville borough are $75,000 to $99,999 for men (164 | 20.3%) and $75,000 to $99,999 for women (139 | 17.2%).
| Income | Male | Female |
| $2,499 or less | 32 (4.0%) | 28 (3.5%) |
| $2,500 to $4,999 | 34 (4.2%) | 38 (4.7%) |
| $5,000 to $7,499 | 0 (0.0%) | 31 (3.8%) |
| $7,500 to $9,999 | 0 (0.0%) | 0 (0.0%) |
| $10,000 to $12,499 | 70 (8.7%) | 36 (4.4%) |
| $12,500 to $14,999 | 0 (0.0%) | 33 (4.1%) |
| $15,000 to $17,499 | 0 (0.0%) | 82 (10.1%) |
| $17,500 to $19,999 | 0 (0.0%) | 24 (3.0%) |
| $20,000 to $22,499 | 30 (3.7%) | 0 (0.0%) |
| $22,500 to $24,999 | 0 (0.0%) | 71 (8.8%) |
| $25,000 to $29,999 | 34 (4.2%) | 36 (4.4%) |
| $30,000 to $34,999 | 8 (1.0%) | 0 (0.0%) |
| $35,000 to $39,999 | 24 (3.0%) | 52 (6.4%) |
| $40,000 to $44,999 | 58 (7.2%) | 23 (2.8%) |
| $45,000 to $49,999 | 31 (3.8%) | 64 (7.9%) |
| $50,000 to $54,999 | 42 (5.2%) | 44 (5.4%) |
| $55,000 to $64,999 | 61 (7.5%) | 42 (5.2%) |
| $65,000 to $74,999 | 92 (11.4%) | 34 (4.2%) |
| $75,000 to $99,999 | 164 (20.3%) | 139 (17.2%) |
| $100,000+ | 128 (15.8%) | 33 (4.1%) |
| Total | 808 (100.0%) | 810 (100.0%) |
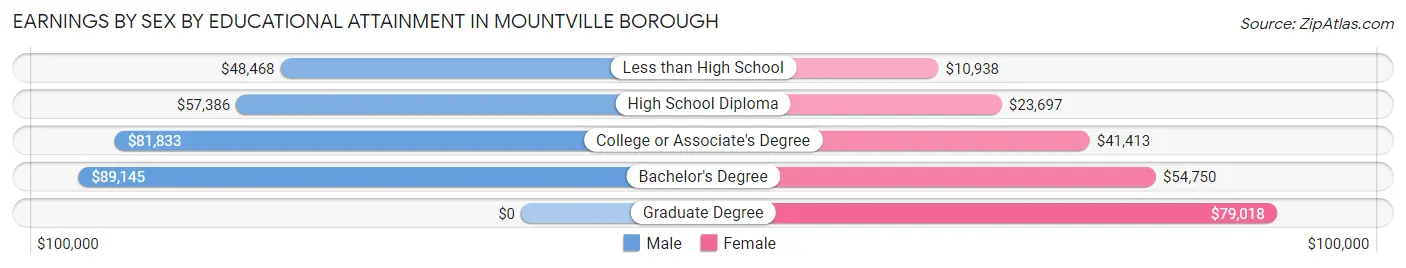
Earnings by Sex by Educational Attainment in Mountville borough
Average earnings in Mountville borough are $67,658 for men and $39,107 for women, a difference of 42.2%. Men with an educational attainment of bachelor's degree enjoy the highest average annual earnings of $89,145, while those with less than high school education earn the least with $48,468. Women with an educational attainment of graduate degree earn the most with the average annual earnings of $79,018, while those with less than high school education have the smallest earnings of $10,938.
| Educational Attainment | Male Income | Female Income |
| Less than High School | $48,468 | $10,938 |
| High School Diploma | $57,386 | $23,697 |
| College or Associate's Degree | $81,833 | $41,413 |
| Bachelor's Degree | $89,145 | $54,750 |
| Graduate Degree | - | - |
| Total | $67,658 | $39,107 |
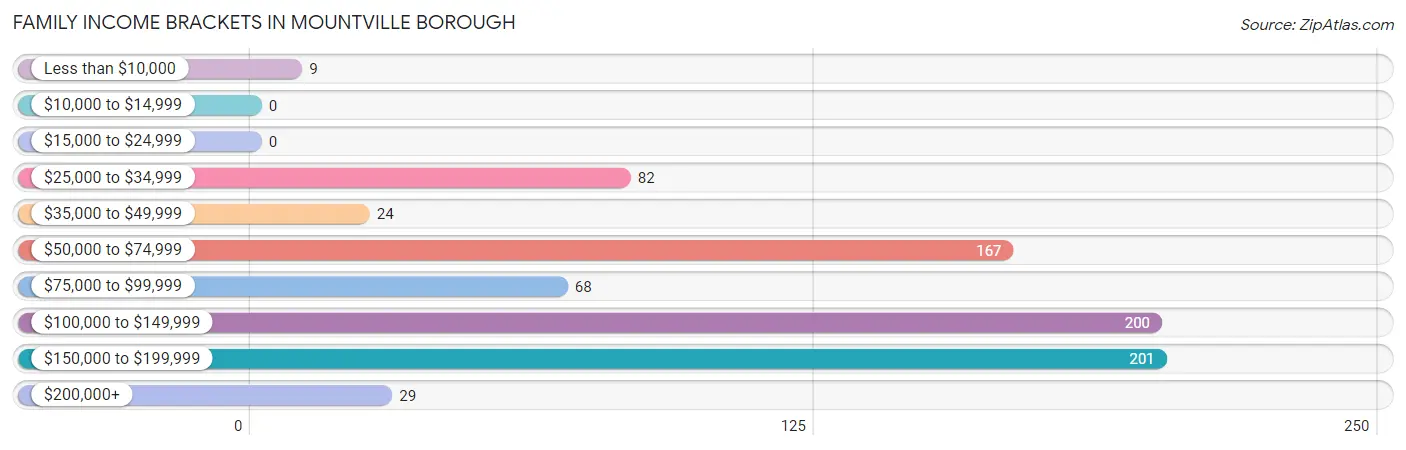
Family Income in Mountville borough
Family Income Brackets in Mountville borough
According to the Mountville borough family income data, there are 201 families falling into the $150,000 to $199,999 income range, which is the most common income bracket and makes up 25.8% of all families.
| Income Bracket | # Families | % Families |
| Less than $10,000 | 9 | 1.2% |
| $10,000 to $14,999 | 0 | 0.0% |
| $15,000 to $24,999 | 0 | 0.0% |
| $25,000 to $34,999 | 82 | 10.5% |
| $35,000 to $49,999 | 24 | 3.1% |
| $50,000 to $74,999 | 167 | 21.4% |
| $75,000 to $99,999 | 68 | 8.7% |
| $100,000 to $149,999 | 200 | 25.6% |
| $150,000 to $199,999 | 201 | 25.8% |
| $200,000+ | 29 | 3.7% |
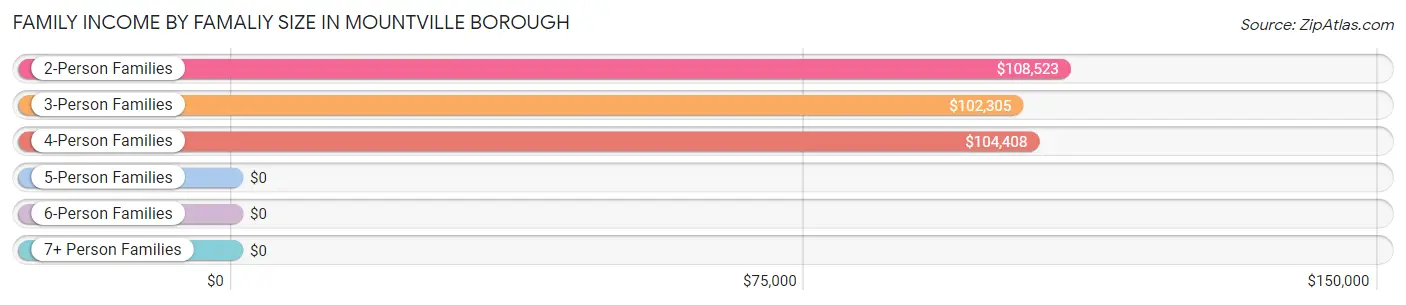
Family Income by Famaliy Size in Mountville borough
2-person families (433 | 55.5%) account for the highest median family income in Mountville borough with $108,523 per family, while 2-person families (433 | 55.5%) have the highest median income of $54,262 per family member.
| Income Bracket | # Families | Median Income |
| 2-Person Families | 433 (55.5%) | $108,523 |
| 3-Person Families | 119 (15.3%) | $102,305 |
| 4-Person Families | 193 (24.7%) | $104,408 |
| 5-Person Families | 11 (1.4%) | $0 |
| 6-Person Families | 24 (3.1%) | $0 |
| 7+ Person Families | 0 (0.0%) | $0 |
| Total | 780 (100.0%) | $103,553 |
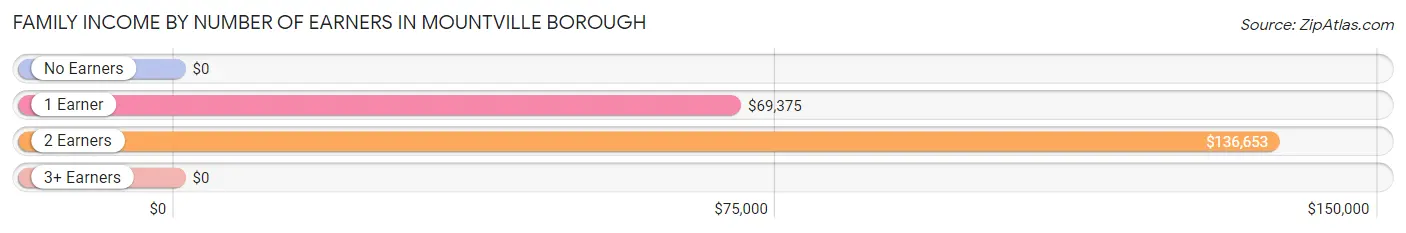
Family Income by Number of Earners in Mountville borough
| Number of Earners | # Families | Median Income |
| No Earners | 35 (4.5%) | $0 |
| 1 Earner | 235 (30.1%) | $69,375 |
| 2 Earners | 491 (62.9%) | $136,653 |
| 3+ Earners | 19 (2.4%) | $0 |
| Total | 780 (100.0%) | $103,553 |
Household Income in Mountville borough
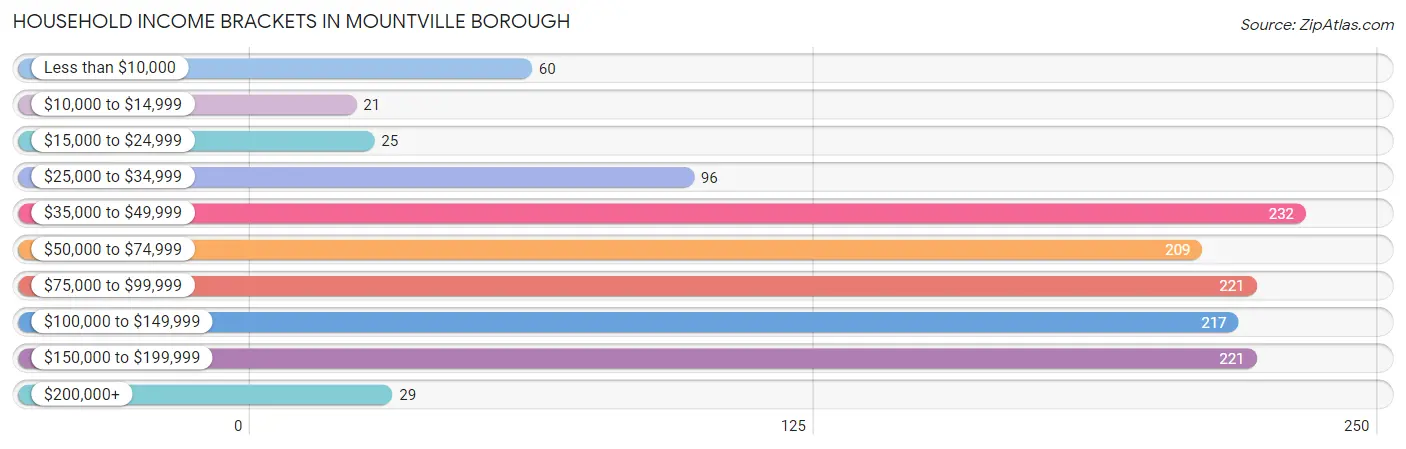
Household Income Brackets in Mountville borough
With 232 households falling in the category, the $35,000 to $49,999 income range is the most frequent in Mountville borough, accounting for 17.4% of all households. In contrast, only 21 households (1.6%) fall into the $10,000 to $14,999 income bracket, making it the least populous group.
| Income Bracket | # Households | % Households |
| Less than $10,000 | 60 | 4.5% |
| $10,000 to $14,999 | 21 | 1.6% |
| $15,000 to $24,999 | 25 | 1.9% |
| $25,000 to $34,999 | 96 | 7.2% |
| $35,000 to $49,999 | 232 | 17.4% |
| $50,000 to $74,999 | 209 | 15.7% |
| $75,000 to $99,999 | 221 | 16.6% |
| $100,000 to $149,999 | 217 | 16.3% |
| $150,000 to $199,999 | 221 | 16.6% |
| $200,000+ | 29 | 2.2% |
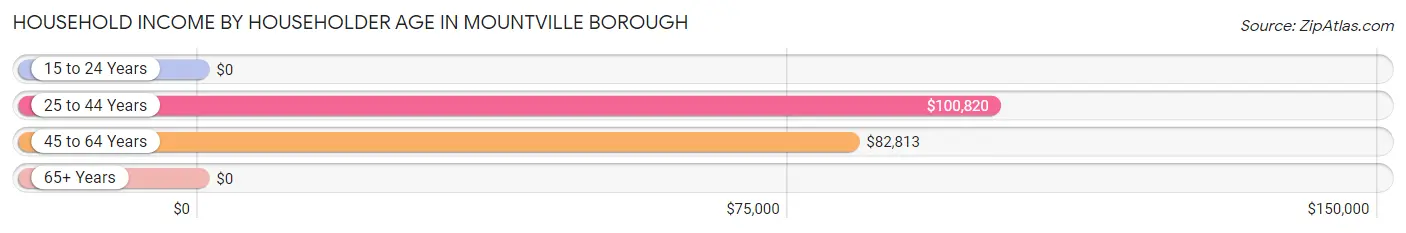
Household Income by Householder Age in Mountville borough
The median household income in Mountville borough is $83,578, with the highest median household income of $100,820 found in the 25 to 44 years age bracket for the primary householder. A total of 331 households (24.8%) fall into this category. Meanwhile, the 15 to 24 years age bracket for the primary householder has the lowest median household income of $0, with 14 households (1.1%) in this group.
| Income Bracket | # Households | Median Income |
| 15 to 24 Years | 14 (1.1%) | $0 |
| 25 to 44 Years | 331 (24.8%) | $100,820 |
| 45 to 64 Years | 516 (38.7%) | $82,813 |
| 65+ Years | 473 (35.5%) | $0 |
| Total | 1,334 (100.0%) | $83,578 |
Poverty in Mountville borough
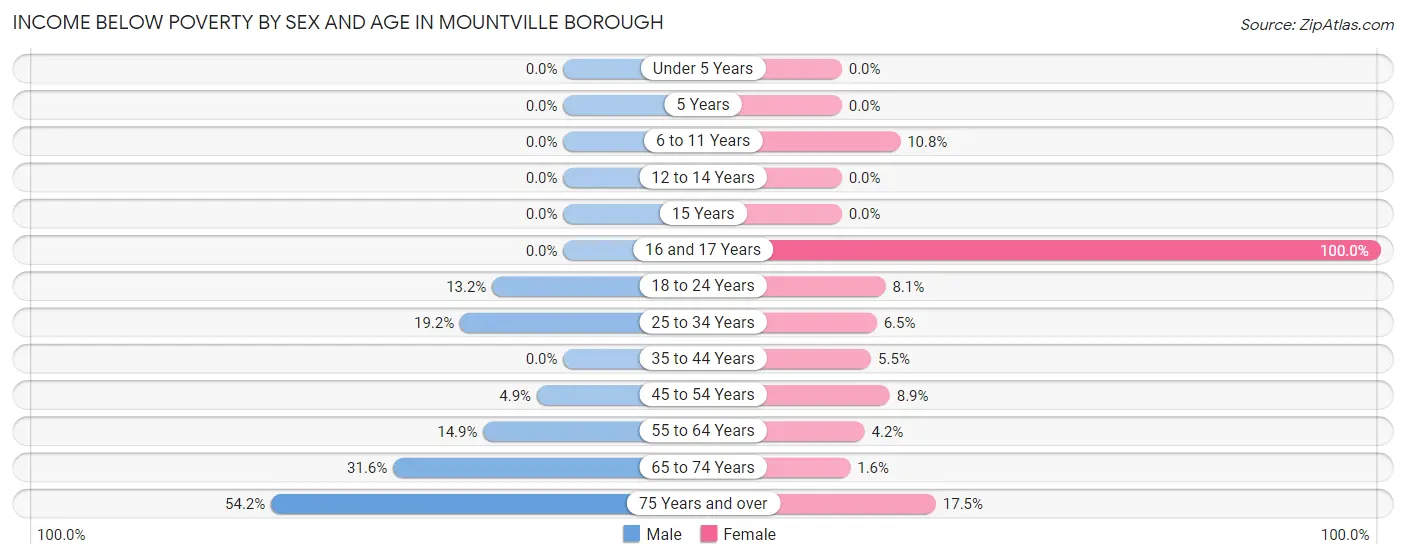
Income Below Poverty by Sex and Age in Mountville borough
With 14.4% poverty level for males and 6.6% for females among the residents of Mountville borough, 75 year old and over males and 16 and 17 year old females are the most vulnerable to poverty, with 64 males (54.2%) and 2 females (100.0%) in their respective age groups living below the poverty level.
| Age Bracket | Male | Female |
| Under 5 Years | 0 (0.0%) | 0 (0.0%) |
| 5 Years | 0 (0.0%) | 0 (0.0%) |
| 6 to 11 Years | 0 (0.0%) | 9 (10.8%) |
| 12 to 14 Years | 0 (0.0%) | 0 (0.0%) |
| 15 Years | 0 (0.0%) | 0 (0.0%) |
| 16 and 17 Years | 0 (0.0%) | 2 (100.0%) |
| 18 to 24 Years | 14 (13.2%) | 3 (8.1%) |
| 25 to 34 Years | 28 (19.2%) | 16 (6.5%) |
| 35 to 44 Years | 0 (0.0%) | 11 (5.4%) |
| 45 to 54 Years | 8 (4.9%) | 9 (8.9%) |
| 55 to 64 Years | 26 (14.9%) | 13 (4.2%) |
| 65 to 74 Years | 73 (31.6%) | 4 (1.6%) |
| 75 Years and over | 64 (54.2%) | 33 (17.5%) |
| Total | 213 (14.4%) | 100 (6.6%) |
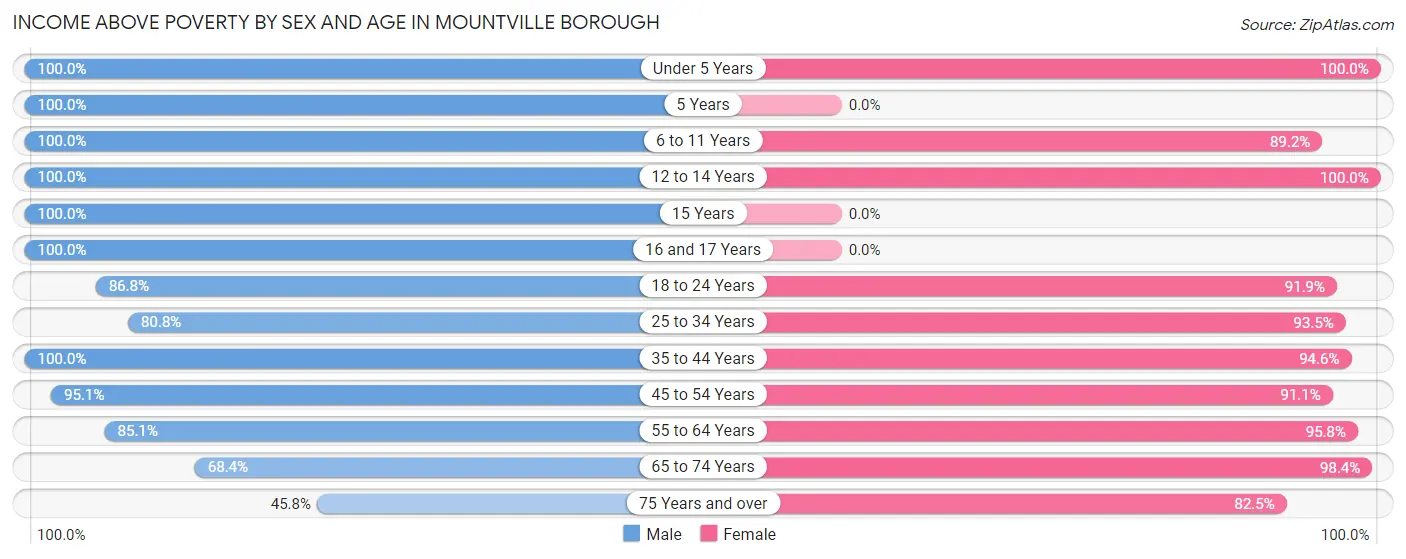
Income Above Poverty by Sex and Age in Mountville borough
According to the poverty statistics in Mountville borough, males aged under 5 years and females aged under 5 years are the age groups that are most secure financially, with 100.0% of males and 100.0% of females in these age groups living above the poverty line.
| Age Bracket | Male | Female |
| Under 5 Years | 108 (100.0%) | 50 (100.0%) |
| 5 Years | 25 (100.0%) | 0 (0.0%) |
| 6 to 11 Years | 120 (100.0%) | 74 (89.2%) |
| 12 to 14 Years | 28 (100.0%) | 52 (100.0%) |
| 15 Years | 44 (100.0%) | 0 (0.0%) |
| 16 and 17 Years | 17 (100.0%) | 0 (0.0%) |
| 18 to 24 Years | 92 (86.8%) | 34 (91.9%) |
| 25 to 34 Years | 118 (80.8%) | 231 (93.5%) |
| 35 to 44 Years | 197 (100.0%) | 191 (94.6%) |
| 45 to 54 Years | 155 (95.1%) | 92 (91.1%) |
| 55 to 64 Years | 149 (85.1%) | 294 (95.8%) |
| 65 to 74 Years | 158 (68.4%) | 250 (98.4%) |
| 75 Years and over | 54 (45.8%) | 156 (82.5%) |
| Total | 1,265 (85.6%) | 1,424 (93.4%) |
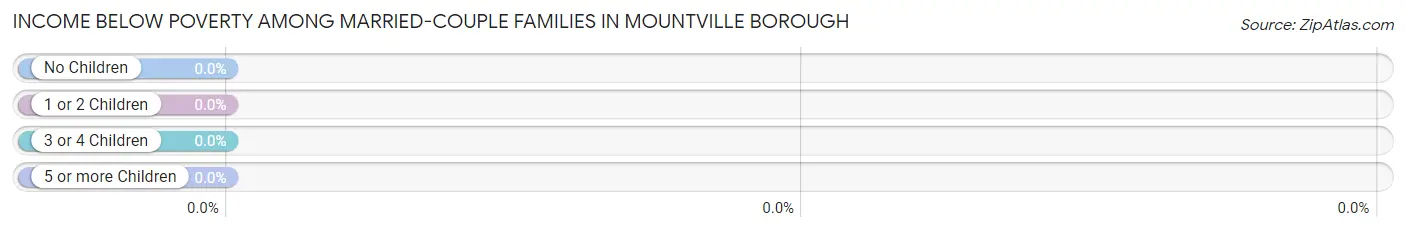
Income Below Poverty Among Married-Couple Families in Mountville borough
| Children | Above Poverty | Below Poverty |
| No Children | 389 (100.0%) | 0 (0.0%) |
| 1 or 2 Children | 138 (100.0%) | 0 (0.0%) |
| 3 or 4 Children | 35 (100.0%) | 0 (0.0%) |
| 5 or more Children | 0 (0.0%) | 0 (0.0%) |
| Total | 562 (100.0%) | 0 (0.0%) |
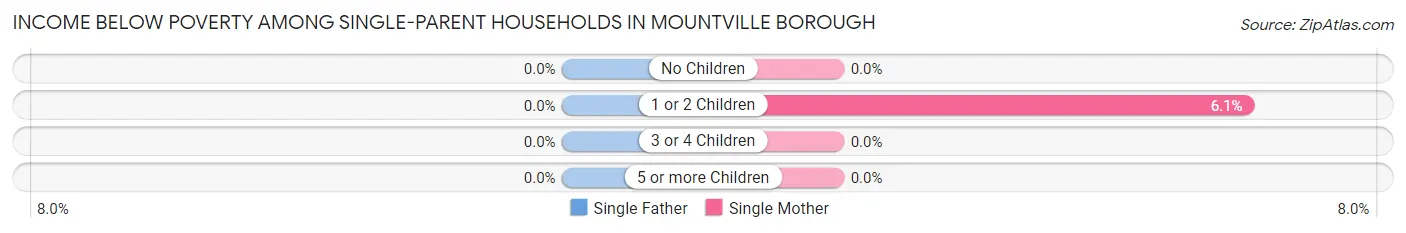
Income Below Poverty Among Single-Parent Households in Mountville borough
| Children | Single Father | Single Mother |
| No Children | 0 (0.0%) | 0 (0.0%) |
| 1 or 2 Children | 0 (0.0%) | 9 (6.1%) |
| 3 or 4 Children | 0 (0.0%) | 0 (0.0%) |
| 5 or more Children | 0 (0.0%) | 0 (0.0%) |
| Total | 0 (0.0%) | 9 (5.4%) |
Income Below Poverty Among Married-Couple vs Single-Parent Households in Mountville borough
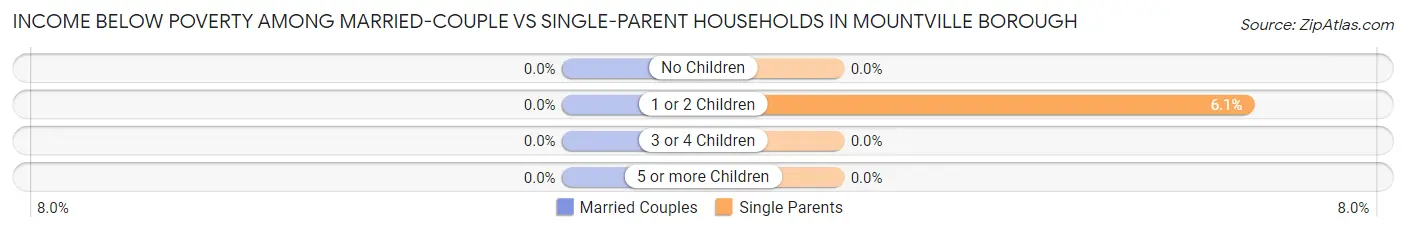
| Children | Married-Couple Families | Single-Parent Households |
| No Children | 0 (0.0%) | 0 (0.0%) |
| 1 or 2 Children | 0 (0.0%) | 9 (6.1%) |
| 3 or 4 Children | 0 (0.0%) | 0 (0.0%) |
| 5 or more Children | 0 (0.0%) | 0 (0.0%) |
| Total | 0 (0.0%) | 9 (4.1%) |
Race in Mountville borough
The most populous races in Mountville borough are White / Caucasian (2,772 | 92.3%), Hispanic or Latino (158 | 5.3%), and Black / African American (118 | 3.9%).
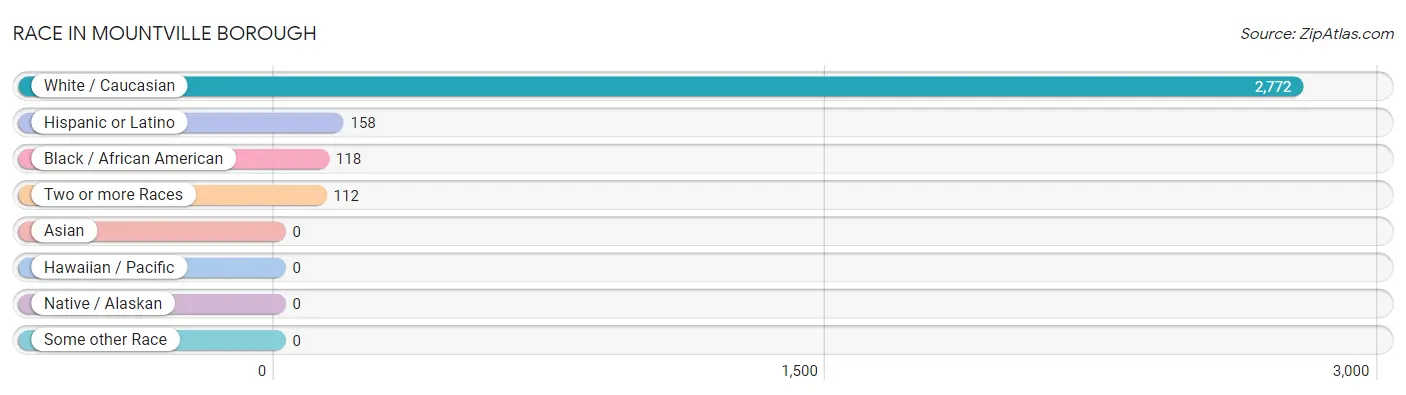
| Race | # Population | % Population |
| Asian | 0 | 0.0% |
| Black / African American | 118 | 3.9% |
| Hawaiian / Pacific | 0 | 0.0% |
| Hispanic or Latino | 158 | 5.3% |
| Native / Alaskan | 0 | 0.0% |
| White / Caucasian | 2,772 | 92.3% |
| Two or more Races | 112 | 3.7% |
| Some other Race | 0 | 0.0% |
| Total | 3,002 | 100.0% |
Ancestry in Mountville borough
The most populous ancestries reported in Mountville borough are German (910 | 30.3%), Irish (457 | 15.2%), Italian (320 | 10.7%), American (310 | 10.3%), and English (270 | 9.0%), together accounting for 75.5% of all Mountville borough residents.
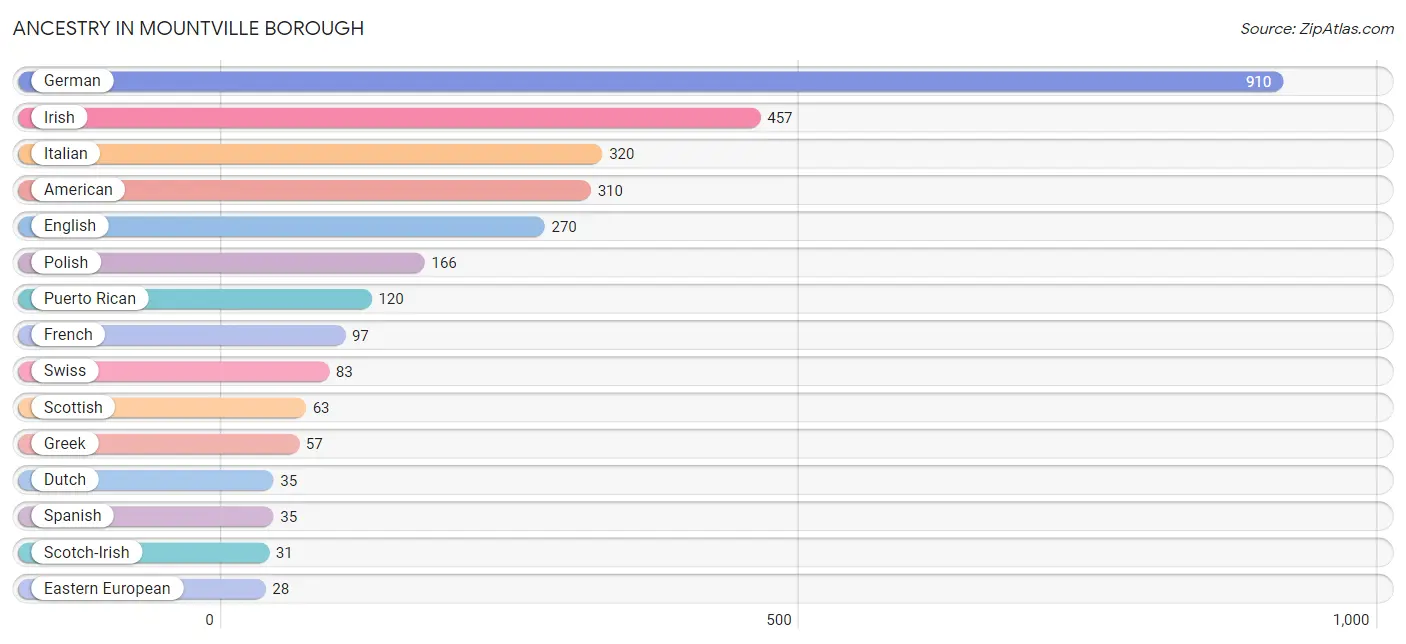
| Ancestry | # Population | % Population |
| American | 310 | 10.3% |
| Armenian | 13 | 0.4% |
| Canadian | 20 | 0.7% |
| Dutch | 35 | 1.2% |
| Eastern European | 28 | 0.9% |
| English | 270 | 9.0% |
| European | 20 | 0.7% |
| French | 97 | 3.2% |
| German | 910 | 30.3% |
| Greek | 57 | 1.9% |
| Irish | 457 | 15.2% |
| Italian | 320 | 10.7% |
| Norwegian | 8 | 0.3% |
| Pennsylvania German | 25 | 0.8% |
| Polish | 166 | 5.5% |
| Puerto Rican | 120 | 4.0% |
| Scotch-Irish | 31 | 1.0% |
| Scottish | 63 | 2.1% |
| Slovak | 8 | 0.3% |
| Spanish | 35 | 1.2% |
| Sri Lankan | 21 | 0.7% |
| Swiss | 83 | 2.8% | View All 22 Rows |
Immigrants in Mountville borough

| Immigration Origin | # Population | % Population | View All 0 Rows |
Sex and Age in Mountville borough
Sex and Age in Mountville borough
The most populous age groups in Mountville borough are 15 to 19 Years (153 | 10.3%) for men and 60 to 64 Years (185 | 12.1%) for women.
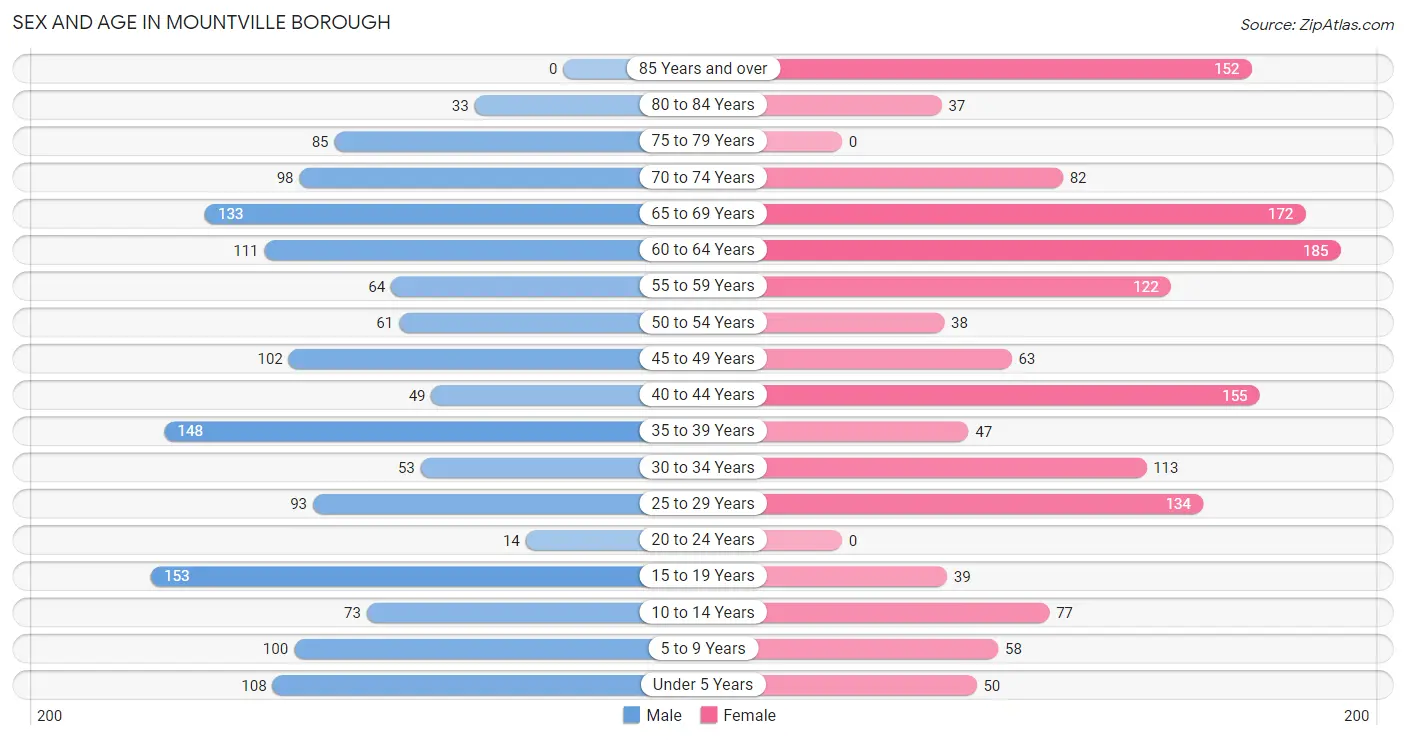
| Age Bracket | Male | Female |
| Under 5 Years | 108 (7.3%) | 50 (3.3%) |
| 5 to 9 Years | 100 (6.8%) | 58 (3.8%) |
| 10 to 14 Years | 73 (4.9%) | 77 (5.1%) |
| 15 to 19 Years | 153 (10.3%) | 39 (2.6%) |
| 20 to 24 Years | 14 (0.9%) | 0 (0.0%) |
| 25 to 29 Years | 93 (6.3%) | 134 (8.8%) |
| 30 to 34 Years | 53 (3.6%) | 113 (7.4%) |
| 35 to 39 Years | 148 (10.0%) | 47 (3.1%) |
| 40 to 44 Years | 49 (3.3%) | 155 (10.2%) |
| 45 to 49 Years | 102 (6.9%) | 63 (4.1%) |
| 50 to 54 Years | 61 (4.1%) | 38 (2.5%) |
| 55 to 59 Years | 64 (4.3%) | 122 (8.0%) |
| 60 to 64 Years | 111 (7.5%) | 185 (12.1%) |
| 65 to 69 Years | 133 (9.0%) | 172 (11.3%) |
| 70 to 74 Years | 98 (6.6%) | 82 (5.4%) |
| 75 to 79 Years | 85 (5.8%) | 0 (0.0%) |
| 80 to 84 Years | 33 (2.2%) | 37 (2.4%) |
| 85 Years and over | 0 (0.0%) | 152 (10.0%) |
| Total | 1,478 (100.0%) | 1,524 (100.0%) |
Families and Households in Mountville borough
Median Family Size in Mountville borough
The median family size in Mountville borough is 2.75 persons per family, with single female/mother families (165 | 21.1%) accounting for the largest median family size of 3.27 persons per family. On the other hand, single male/father families (53 | 6.8%) represent the smallest median family size with 2.09 persons per family.
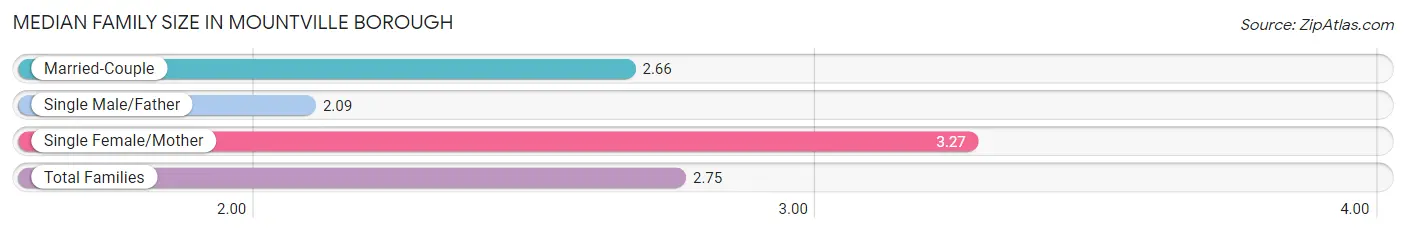
| Family Type | # Families | Family Size |
| Married-Couple | 562 (72.1%) | 2.66 |
| Single Male/Father | 53 (6.8%) | 2.09 |
| Single Female/Mother | 165 (21.1%) | 3.27 |
| Total Families | 780 (100.0%) | 2.75 |
Median Household Size in Mountville borough
The median household size in Mountville borough is 2.15 persons per household, with single female/mother households (165 | 12.4%) accounting for the largest median household size of 3.39 persons per household. non-family households (554 | 41.5%) represent the smallest median household size with 1.18 persons per household.
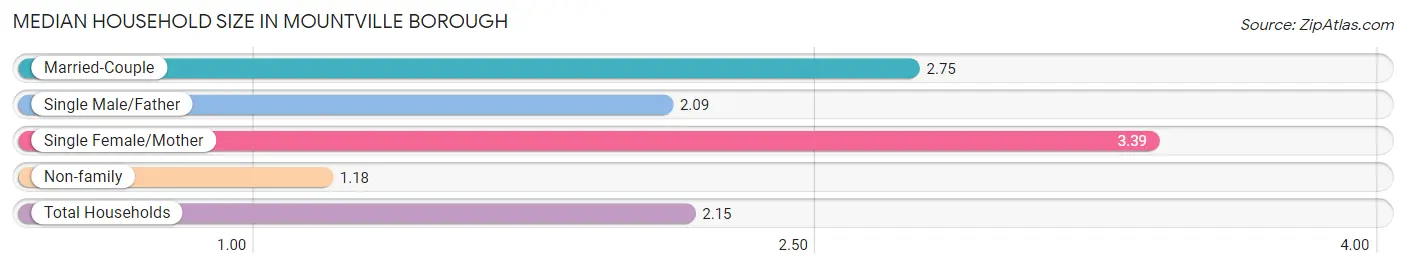
| Household Type | # Households | Household Size |
| Married-Couple | 562 (42.1%) | 2.75 |
| Single Male/Father | 53 (4.0%) | 2.09 |
| Single Female/Mother | 165 (12.4%) | 3.39 |
| Non-family | 554 (41.5%) | 1.18 |
| Total Households | 1,334 (100.0%) | 2.15 |
Household Size by Marriage Status in Mountville borough
Out of a total of 1,334 households in Mountville borough, 780 (58.5%) are family households, while 554 (41.5%) are nonfamily households. The most numerous type of family households are 2-person households, comprising 433, and the most common type of nonfamily households are 1-person households, comprising 491.
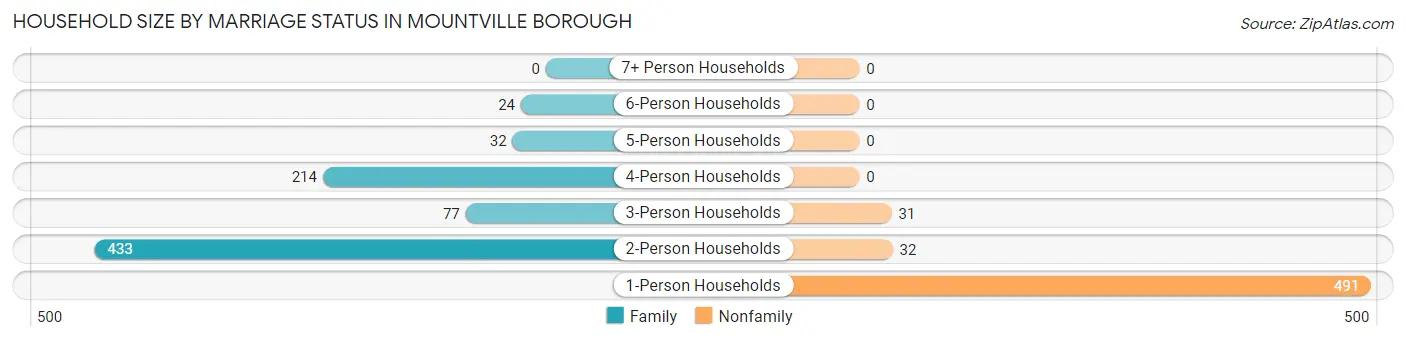
| Household Size | Family Households | Nonfamily Households |
| 1-Person Households | - | 491 (36.8%) |
| 2-Person Households | 433 (32.5%) | 32 (2.4%) |
| 3-Person Households | 77 (5.8%) | 31 (2.3%) |
| 4-Person Households | 214 (16.0%) | 0 (0.0%) |
| 5-Person Households | 32 (2.4%) | 0 (0.0%) |
| 6-Person Households | 24 (1.8%) | 0 (0.0%) |
| 7+ Person Households | 0 (0.0%) | 0 (0.0%) |
| Total | 780 (58.5%) | 554 (41.5%) |
Female Fertility in Mountville borough
Fertility by Age in Mountville borough
Average fertility rate in Mountville borough is 7.0 births per 1,000 women. Women in the age bracket of 35 to 50 years have the highest fertility rate with 14.0 births per 1,000 women. Women in the age bracket of 35 to 50 years acount for 100.0% of all women with births.
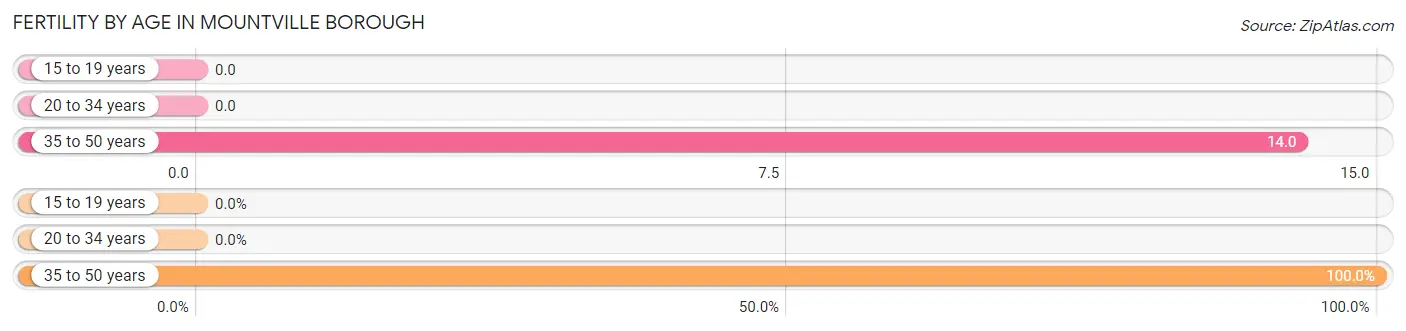
| Age Bracket | Women with Births | Births / 1,000 Women |
| 15 to 19 years | 0 (0.0%) | 0.0 |
| 20 to 34 years | 0 (0.0%) | 0.0 |
| 35 to 50 years | 4 (100.0%) | 14.0 |
| Total | 4 (100.0%) | 7.0 |
Fertility by Age by Marriage Status in Mountville borough
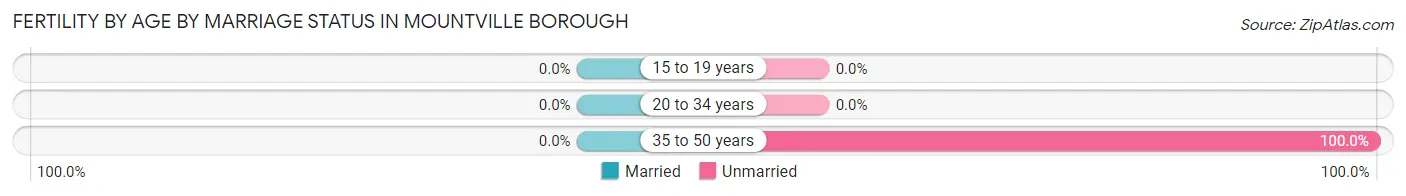
| Age Bracket | Married | Unmarried |
| 15 to 19 years | 0 (0.0%) | 0 (0.0%) |
| 20 to 34 years | 0 (0.0%) | 0 (0.0%) |
| 35 to 50 years | 0 (0.0%) | 4 (100.0%) |
| Total | 0 (0.0%) | 4 (100.0%) |
Fertility by Education in Mountville borough
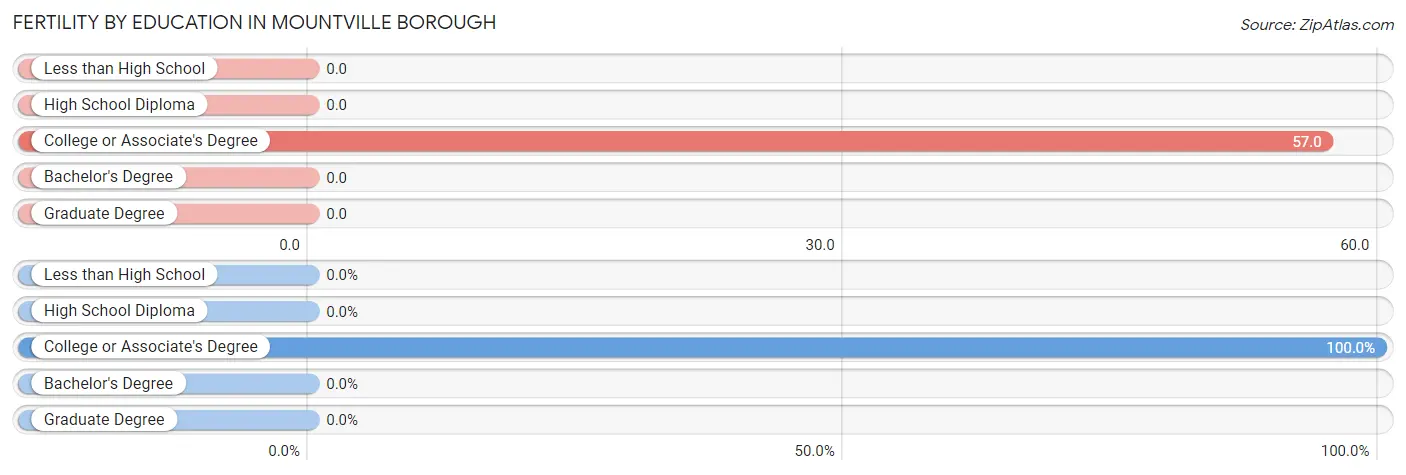
| Educational Attainment | Women with Births | Births / 1,000 Women |
| Less than High School | 0 (0.0%) | 0.0 |
| High School Diploma | 0 (0.0%) | 0.0 |
| College or Associate's Degree | 4 (100.0%) | 57.0 |
| Bachelor's Degree | 0 (0.0%) | 0.0 |
| Graduate Degree | 0 (0.0%) | 0.0 |
| Total | 4 (100.0%) | 7.0 |
Fertility by Education by Marriage Status in Mountville borough
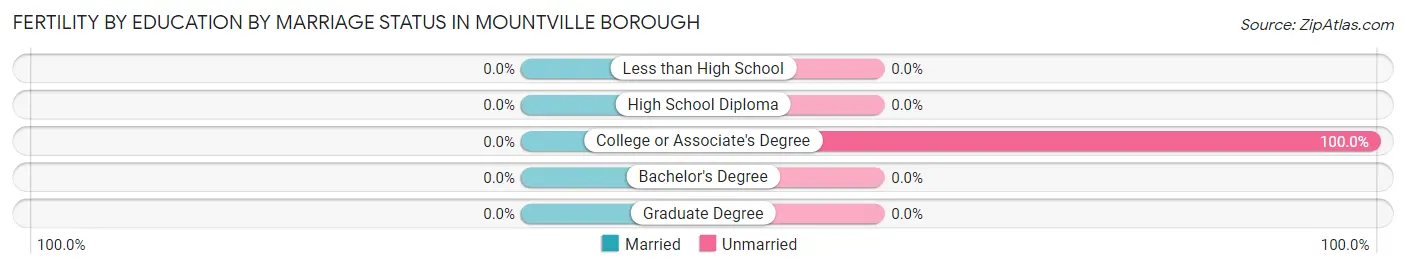
| Educational Attainment | Married | Unmarried |
| Less than High School | 0 (0.0%) | 0 (0.0%) |
| High School Diploma | 0 (0.0%) | 0 (0.0%) |
| College or Associate's Degree | 0 (0.0%) | 4 (100.0%) |
| Bachelor's Degree | 0 (0.0%) | 0 (0.0%) |
| Graduate Degree | 0 (0.0%) | 0 (0.0%) |
| Total | 0 (0.0%) | 4 (100.0%) |
Employment Characteristics in Mountville borough
Employment by Class of Employer in Mountville borough
Among the 1,531 employed individuals in Mountville borough, private company employees (1,001 | 65.4%), not-for-profit organizations (257 | 16.8%), and self-employed (not incorporated) (151 | 9.9%) make up the most common classes of employment.
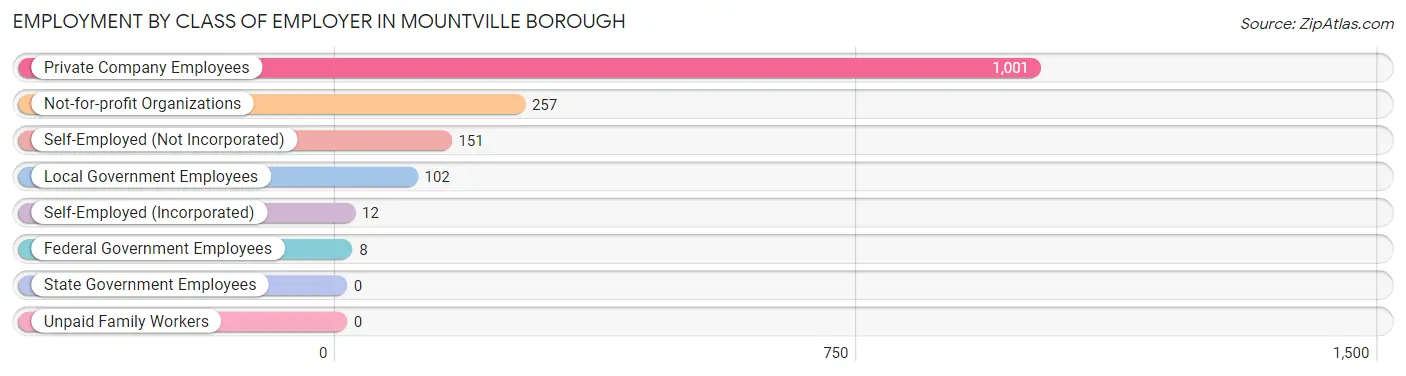
| Employer Class | # Employees | % Employees |
| Private Company Employees | 1,001 | 65.4% |
| Self-Employed (Incorporated) | 12 | 0.8% |
| Self-Employed (Not Incorporated) | 151 | 9.9% |
| Not-for-profit Organizations | 257 | 16.8% |
| Local Government Employees | 102 | 6.7% |
| State Government Employees | 0 | 0.0% |
| Federal Government Employees | 8 | 0.5% |
| Unpaid Family Workers | 0 | 0.0% |
| Total | 1,531 | 100.0% |
Employment Status by Age in Mountville borough
According to the labor force statistics for Mountville borough, out of the total population over 16 years of age (2,492), 62.1% or 1,548 individuals are in the labor force, with 1.1% or 17 of them unemployed. The age group with the highest labor force participation rate is 20 to 24 years, with 100.0% or 14 individuals in the labor force. Within the labor force, the 30 to 34 years age range has the highest percentage of unemployed individuals, with 5.1% or 7 of them being unemployed.
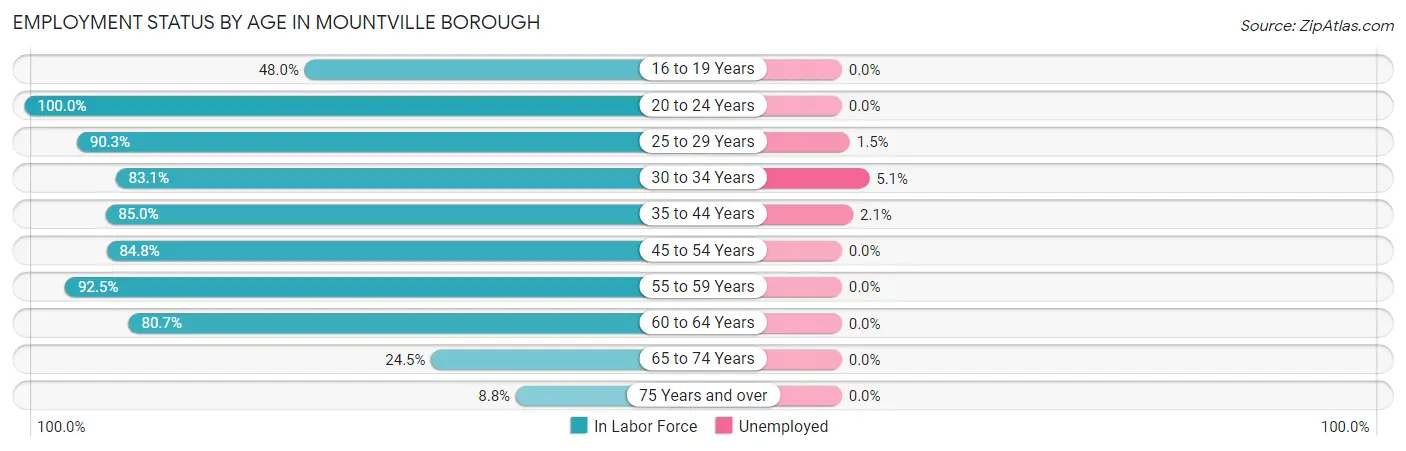
| Age Bracket | In Labor Force | Unemployed |
| 16 to 19 Years | 71 (48.0%) | 0 (0.0%) |
| 20 to 24 Years | 14 (100.0%) | 0 (0.0%) |
| 25 to 29 Years | 205 (90.3%) | 3 (1.5%) |
| 30 to 34 Years | 138 (83.1%) | 7 (5.1%) |
| 35 to 44 Years | 339 (85.0%) | 7 (2.1%) |
| 45 to 54 Years | 224 (84.8%) | 0 (0.0%) |
| 55 to 59 Years | 172 (92.5%) | 0 (0.0%) |
| 60 to 64 Years | 239 (80.7%) | 0 (0.0%) |
| 65 to 74 Years | 119 (24.5%) | 0 (0.0%) |
| 75 Years and over | 27 (8.8%) | 0 (0.0%) |
| Total | 1,548 (62.1%) | 17 (1.1%) |
Employment Status by Educational Attainment in Mountville borough
According to labor force statistics for Mountville borough, 85.6% of individuals (1,317) out of the total population between 25 and 64 years of age (1,538) are in the labor force, with 1.3% or 17 of them being unemployed. The group with the highest labor force participation rate are those with the educational attainment of bachelor's degree or higher, with 96.7% or 414 individuals in the labor force. Within the labor force, individuals with less than high school education have the highest percentage of unemployment, with 4.6% or 4 of them being unemployed.
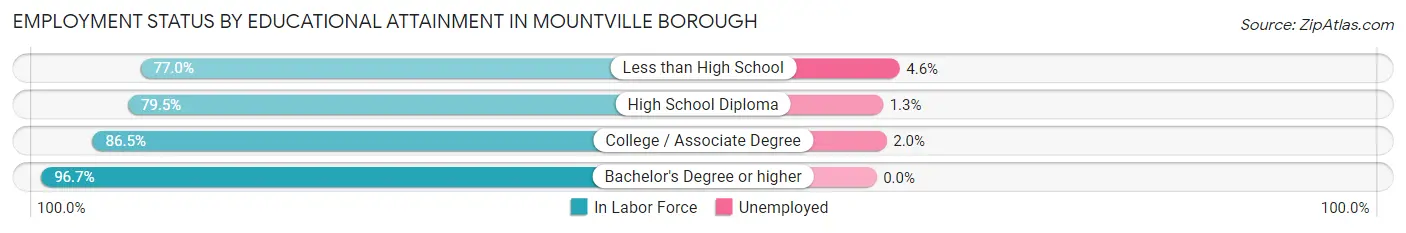
| Educational Attainment | In Labor Force | Unemployed |
| Less than High School | 87 (77.0%) | 5 (4.6%) |
| High School Diploma | 522 (79.5%) | 9 (1.3%) |
| College / Associate Degree | 294 (86.5%) | 7 (2.0%) |
| Bachelor's Degree or higher | 414 (96.7%) | 0 (0.0%) |
| Total | 1,317 (85.6%) | 20 (1.3%) |
Employment Occupations by Sex in Mountville borough
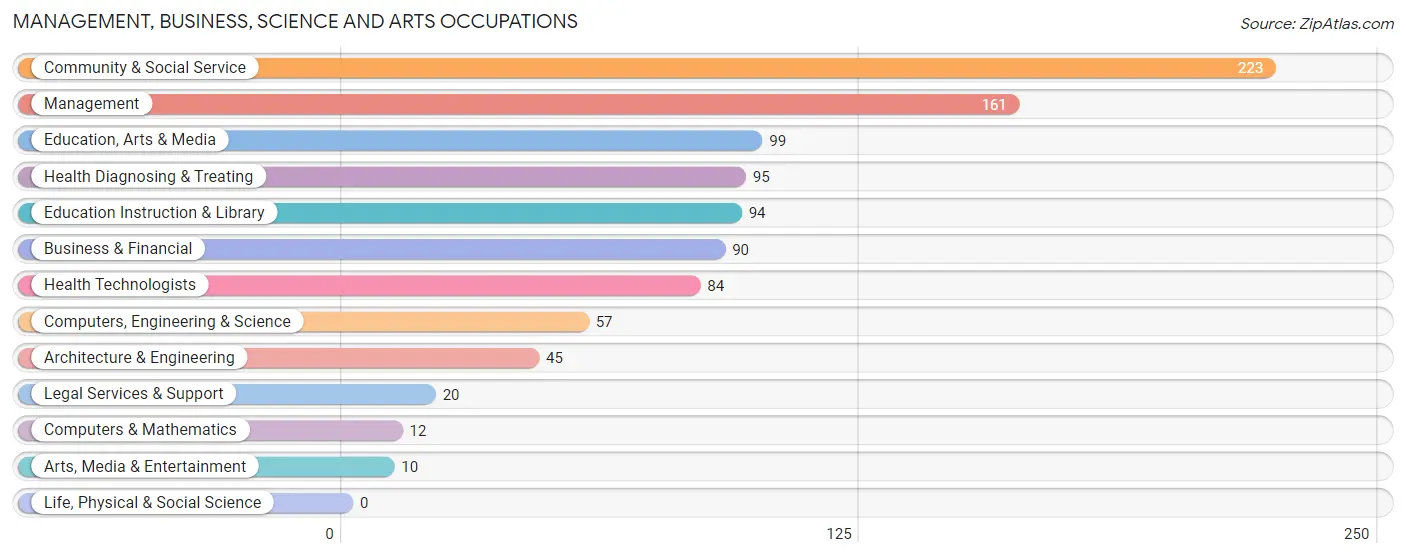
Management, Business, Science and Arts Occupations
The most common Management, Business, Science and Arts occupations in Mountville borough are Community & Social Service (223 | 14.6%), Management (161 | 10.5%), Education, Arts & Media (99 | 6.5%), Health Diagnosing & Treating (95 | 6.2%), and Education Instruction & Library (94 | 6.1%).
Management, Business, Science and Arts Occupations by Sex
Within the Management, Business, Science and Arts occupations in Mountville borough, the most male-oriented occupations are Computers & Mathematics (100.0%), Management (90.7%), and Business & Financial (50.0%), while the most female-oriented occupations are Architecture & Engineering (100.0%), Legal Services & Support (100.0%), and Arts, Media & Entertainment (100.0%).
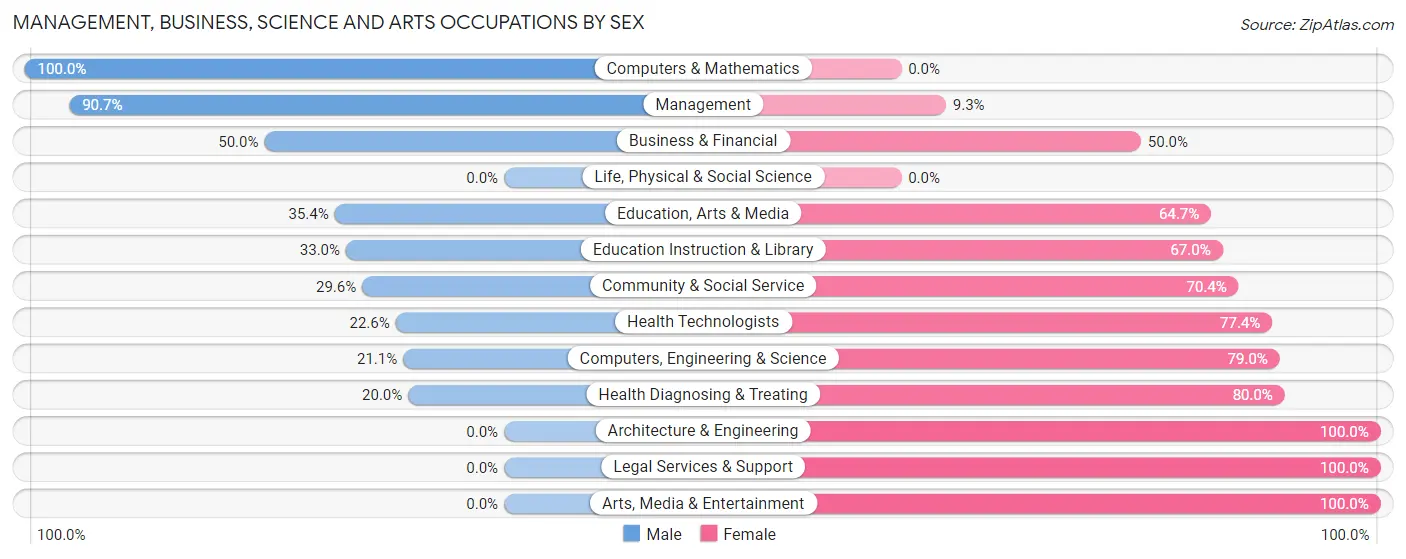
| Occupation | Male | Female |
| Management | 146 (90.7%) | 15 (9.3%) |
| Business & Financial | 45 (50.0%) | 45 (50.0%) |
| Computers, Engineering & Science | 12 (21.0%) | 45 (78.9%) |
| Computers & Mathematics | 12 (100.0%) | 0 (0.0%) |
| Architecture & Engineering | 0 (0.0%) | 45 (100.0%) |
| Life, Physical & Social Science | 0 (0.0%) | 0 (0.0%) |
| Community & Social Service | 66 (29.6%) | 157 (70.4%) |
| Education, Arts & Media | 35 (35.3%) | 64 (64.6%) |
| Legal Services & Support | 0 (0.0%) | 20 (100.0%) |
| Education Instruction & Library | 31 (33.0%) | 63 (67.0%) |
| Arts, Media & Entertainment | 0 (0.0%) | 10 (100.0%) |
| Health Diagnosing & Treating | 19 (20.0%) | 76 (80.0%) |
| Health Technologists | 19 (22.6%) | 65 (77.4%) |
| Total (Category) | 288 (46.0%) | 338 (54.0%) |
| Total (Overall) | 755 (49.3%) | 776 (50.7%) |
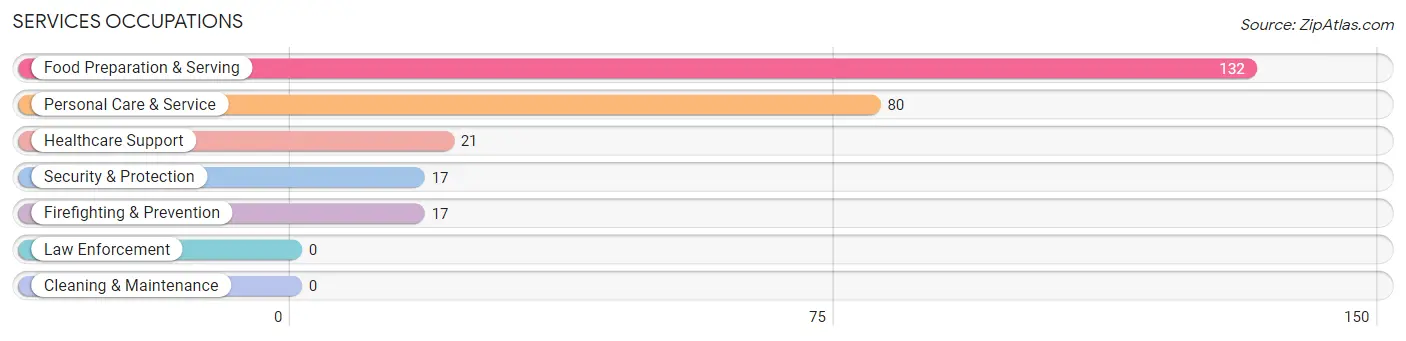
Services Occupations
The most common Services occupations in Mountville borough are Food Preparation & Serving (132 | 8.6%), Personal Care & Service (80 | 5.2%), Healthcare Support (21 | 1.4%), Security & Protection (17 | 1.1%), and Firefighting & Prevention (17 | 1.1%).
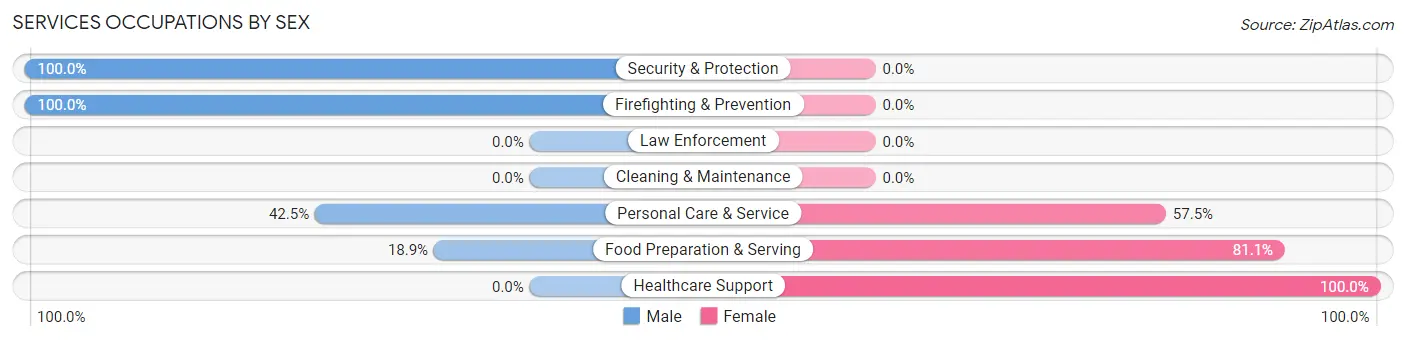
Services Occupations by Sex
Within the Services occupations in Mountville borough, the most male-oriented occupations are Security & Protection (100.0%), Firefighting & Prevention (100.0%), and Personal Care & Service (42.5%), while the most female-oriented occupations are Healthcare Support (100.0%), Food Preparation & Serving (81.1%), and Personal Care & Service (57.5%).
| Occupation | Male | Female |
| Healthcare Support | 0 (0.0%) | 21 (100.0%) |
| Security & Protection | 17 (100.0%) | 0 (0.0%) |
| Firefighting & Prevention | 17 (100.0%) | 0 (0.0%) |
| Law Enforcement | 0 (0.0%) | 0 (0.0%) |
| Food Preparation & Serving | 25 (18.9%) | 107 (81.1%) |
| Cleaning & Maintenance | 0 (0.0%) | 0 (0.0%) |
| Personal Care & Service | 34 (42.5%) | 46 (57.5%) |
| Total (Category) | 76 (30.4%) | 174 (69.6%) |
| Total (Overall) | 755 (49.3%) | 776 (50.7%) |
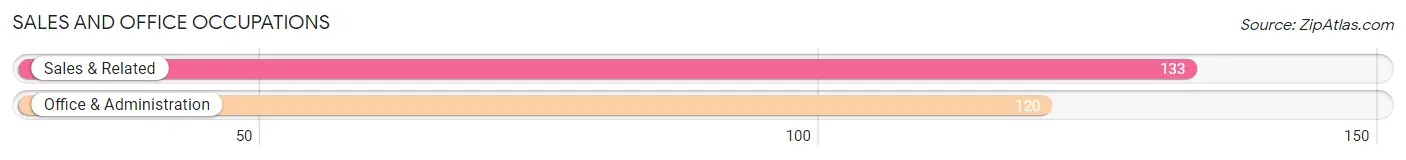
Sales and Office Occupations
The most common Sales and Office occupations in Mountville borough are Sales & Related (133 | 8.7%), and Office & Administration (120 | 7.8%).
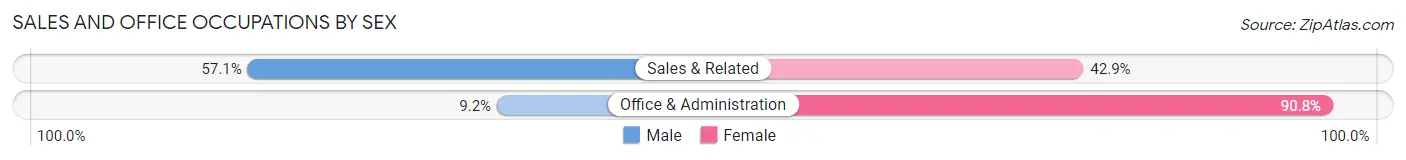
Sales and Office Occupations by Sex
| Occupation | Male | Female |
| Sales & Related | 76 (57.1%) | 57 (42.9%) |
| Office & Administration | 11 (9.2%) | 109 (90.8%) |
| Total (Category) | 87 (34.4%) | 166 (65.6%) |
| Total (Overall) | 755 (49.3%) | 776 (50.7%) |
Natural Resources, Construction and Maintenance Occupations
The most common Natural Resources, Construction and Maintenance occupations in Mountville borough are Construction & Extraction (107 | 7.0%), and Installation, Maintenance & Repair (79 | 5.2%).
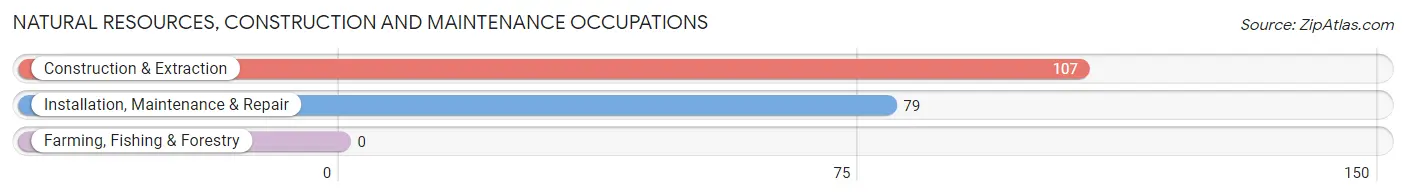
Natural Resources, Construction and Maintenance Occupations by Sex
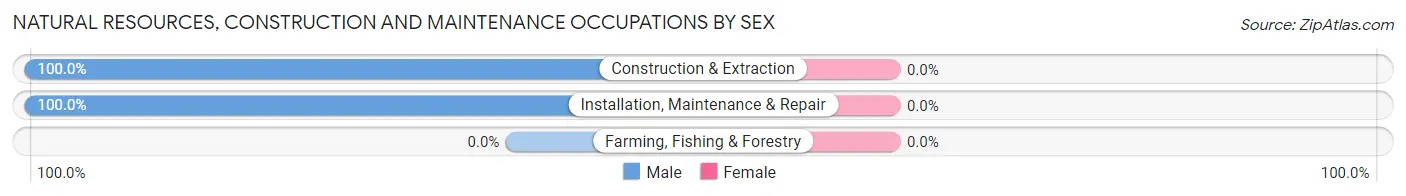
| Occupation | Male | Female |
| Farming, Fishing & Forestry | 0 (0.0%) | 0 (0.0%) |
| Construction & Extraction | 107 (100.0%) | 0 (0.0%) |
| Installation, Maintenance & Repair | 79 (100.0%) | 0 (0.0%) |
| Total (Category) | 186 (100.0%) | 0 (0.0%) |
| Total (Overall) | 755 (49.3%) | 776 (50.7%) |
Production, Transportation and Moving Occupations
The most common Production, Transportation and Moving occupations in Mountville borough are Production (94 | 6.1%), Transportation (91 | 5.9%), and Material Moving (31 | 2.0%).
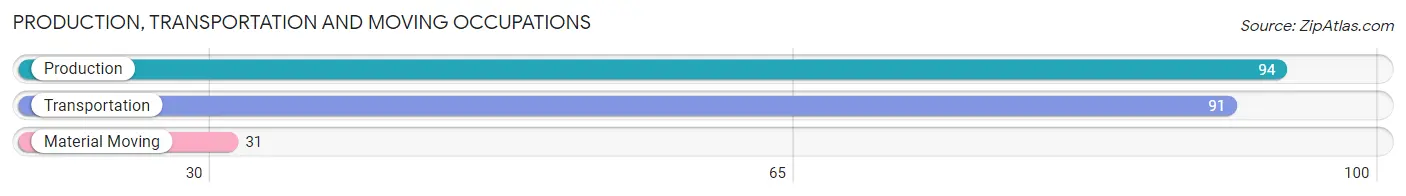
Production, Transportation and Moving Occupations by Sex
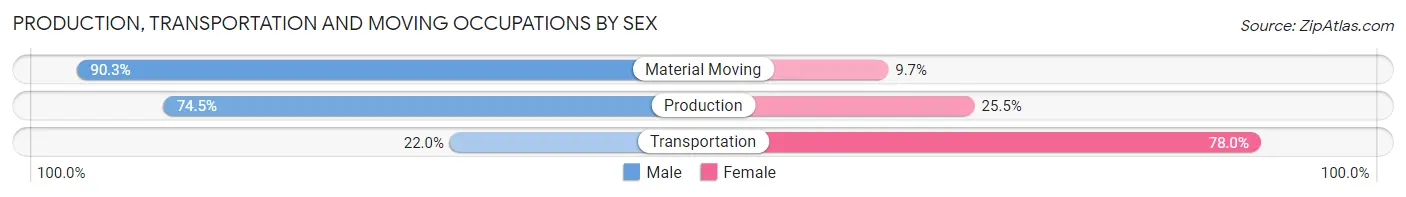
| Occupation | Male | Female |
| Production | 70 (74.5%) | 24 (25.5%) |
| Transportation | 20 (22.0%) | 71 (78.0%) |
| Material Moving | 28 (90.3%) | 3 (9.7%) |
| Total (Category) | 118 (54.6%) | 98 (45.4%) |
| Total (Overall) | 755 (49.3%) | 776 (50.7%) |
Employment Industries by Sex in Mountville borough
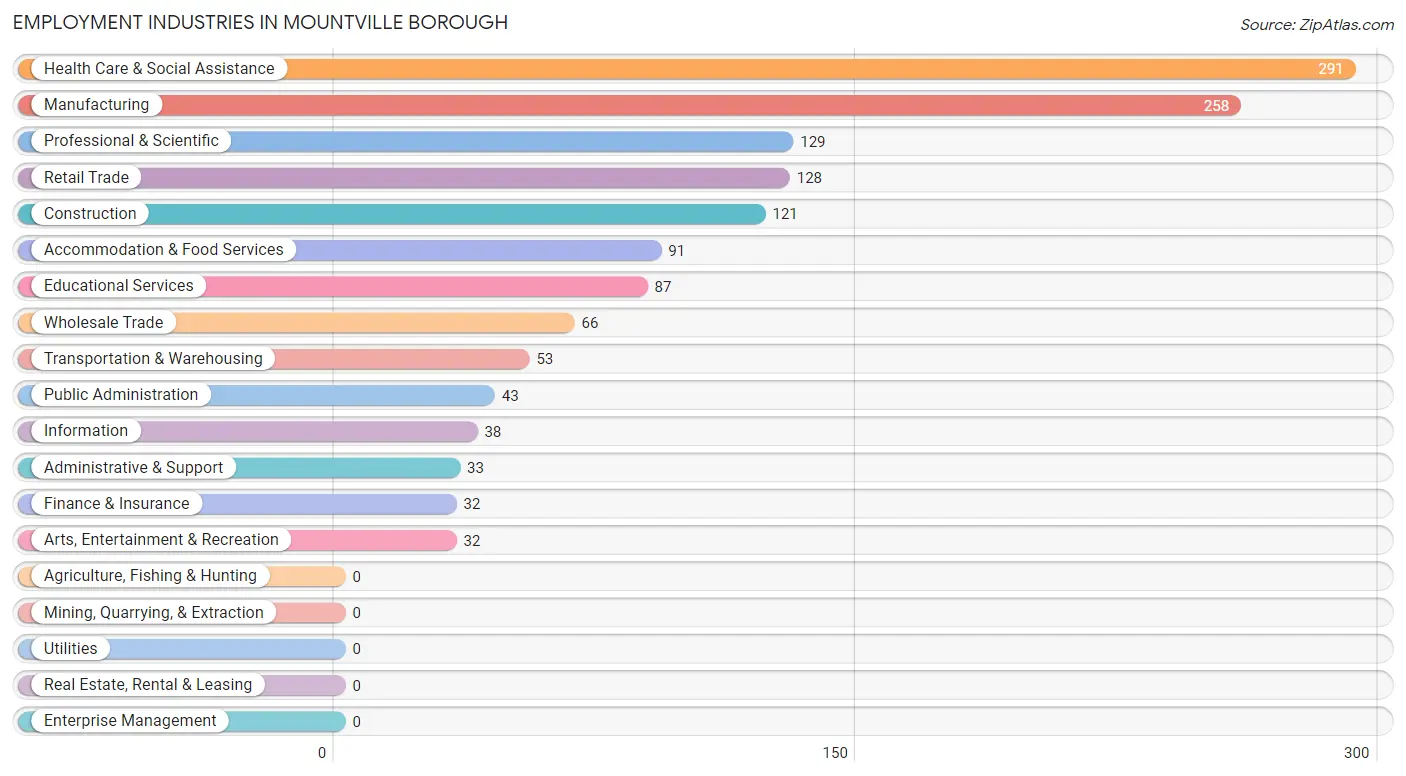
Employment Industries in Mountville borough
The major employment industries in Mountville borough include Health Care & Social Assistance (291 | 19.0%), Manufacturing (258 | 16.9%), Professional & Scientific (129 | 8.4%), Retail Trade (128 | 8.4%), and Construction (121 | 7.9%).
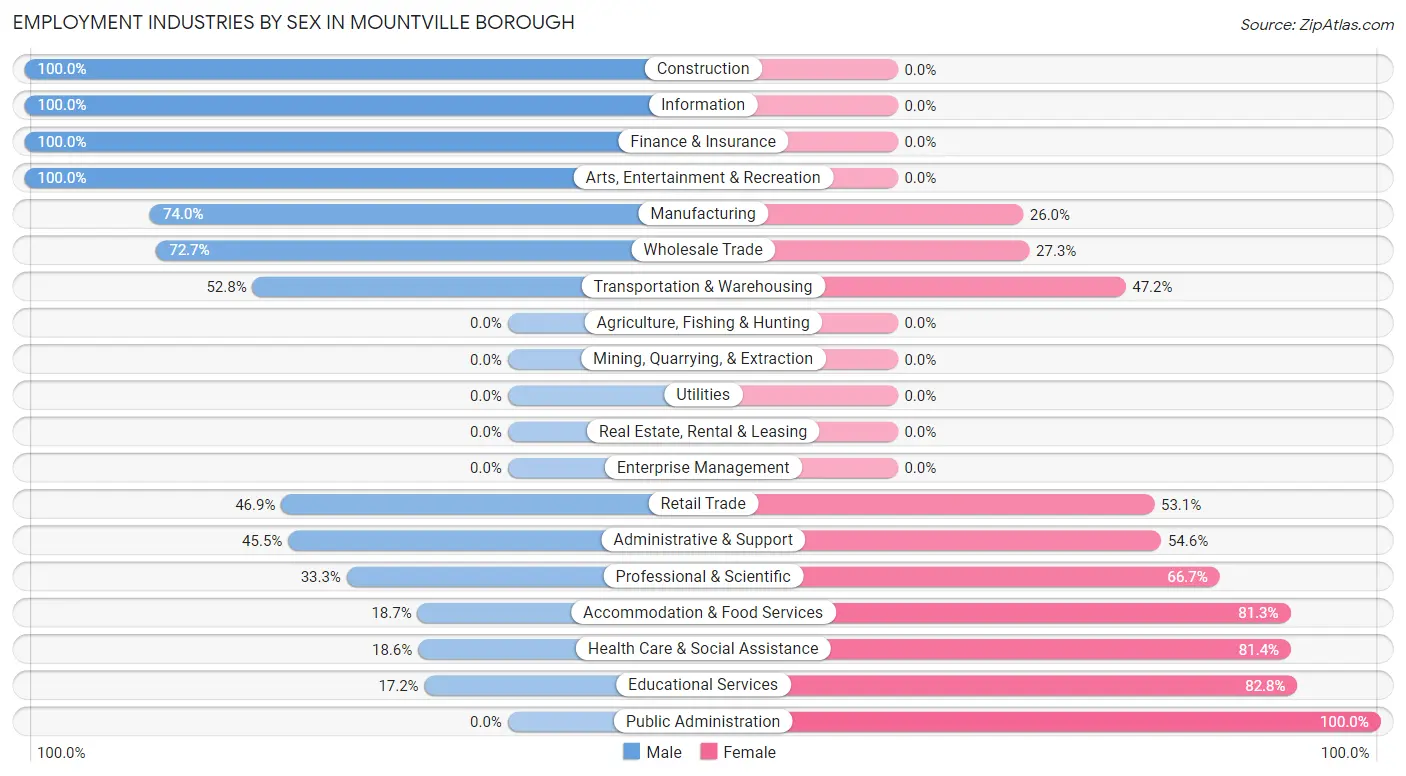
Employment Industries by Sex in Mountville borough
The Mountville borough industries that see more men than women are Construction (100.0%), Information (100.0%), and Finance & Insurance (100.0%), whereas the industries that tend to have a higher number of women are Public Administration (100.0%), Educational Services (82.8%), and Health Care & Social Assistance (81.4%).
| Industry | Male | Female |
| Agriculture, Fishing & Hunting | 0 (0.0%) | 0 (0.0%) |
| Mining, Quarrying, & Extraction | 0 (0.0%) | 0 (0.0%) |
| Construction | 121 (100.0%) | 0 (0.0%) |
| Manufacturing | 191 (74.0%) | 67 (26.0%) |
| Wholesale Trade | 48 (72.7%) | 18 (27.3%) |
| Retail Trade | 60 (46.9%) | 68 (53.1%) |
| Transportation & Warehousing | 28 (52.8%) | 25 (47.2%) |
| Utilities | 0 (0.0%) | 0 (0.0%) |
| Information | 38 (100.0%) | 0 (0.0%) |
| Finance & Insurance | 32 (100.0%) | 0 (0.0%) |
| Real Estate, Rental & Leasing | 0 (0.0%) | 0 (0.0%) |
| Professional & Scientific | 43 (33.3%) | 86 (66.7%) |
| Enterprise Management | 0 (0.0%) | 0 (0.0%) |
| Administrative & Support | 15 (45.5%) | 18 (54.5%) |
| Educational Services | 15 (17.2%) | 72 (82.8%) |
| Health Care & Social Assistance | 54 (18.6%) | 237 (81.4%) |
| Arts, Entertainment & Recreation | 32 (100.0%) | 0 (0.0%) |
| Accommodation & Food Services | 17 (18.7%) | 74 (81.3%) |
| Public Administration | 0 (0.0%) | 43 (100.0%) |
| Total | 755 (49.3%) | 776 (50.7%) |
Education in Mountville borough
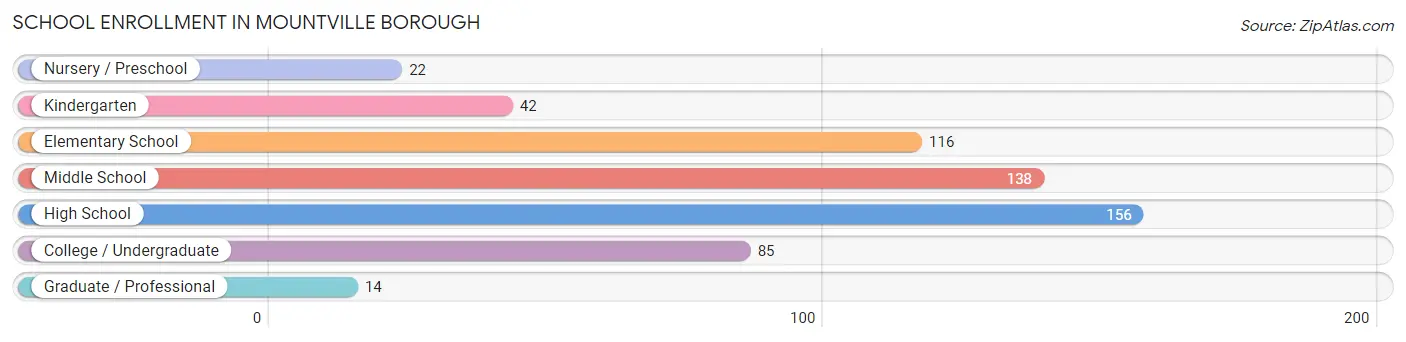
School Enrollment in Mountville borough
The most common levels of schooling among the 573 students in Mountville borough are high school (156 | 27.2%), middle school (138 | 24.1%), and elementary school (116 | 20.2%).
| School Level | # Students | % Students |
| Nursery / Preschool | 22 | 3.8% |
| Kindergarten | 42 | 7.3% |
| Elementary School | 116 | 20.2% |
| Middle School | 138 | 24.1% |
| High School | 156 | 27.2% |
| College / Undergraduate | 85 | 14.8% |
| Graduate / Professional | 14 | 2.4% |
| Total | 573 | 100.0% |
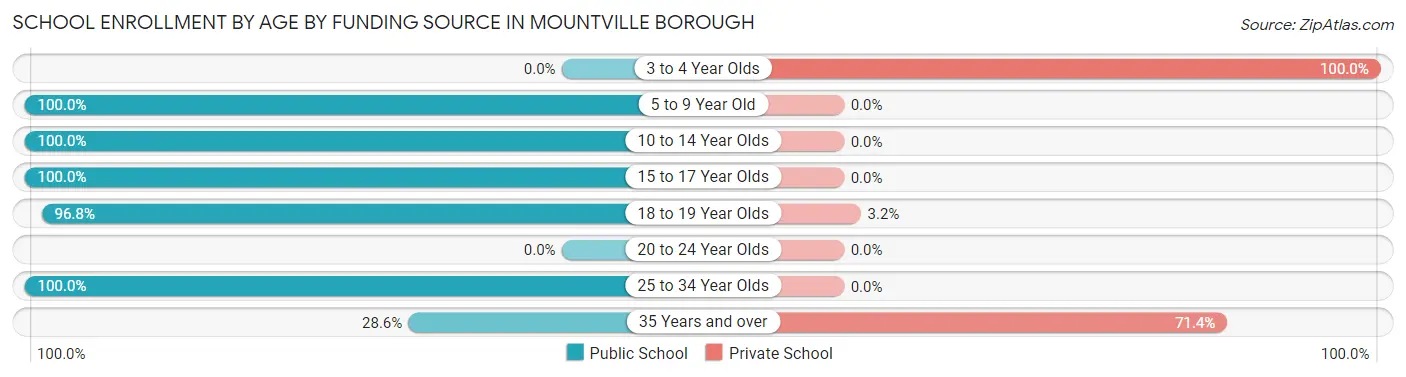
School Enrollment by Age by Funding Source in Mountville borough
Out of a total of 573 students who are enrolled in schools in Mountville borough, 60 (10.5%) attend a private institution, while the remaining 513 (89.5%) are enrolled in public schools. The age group of 3 to 4 year olds has the highest likelihood of being enrolled in private schools, with 22 (100.0% in the age bracket) enrolled. Conversely, the age group of 5 to 9 year old has the lowest likelihood of being enrolled in a private school, with 158 (100.0% in the age bracket) attending a public institution.
| Age Bracket | Public School | Private School |
| 3 to 4 Year Olds | 0 (0.0%) | 22 (100.0%) |
| 5 to 9 Year Old | 158 (100.0%) | 0 (0.0%) |
| 10 to 14 Year Olds | 150 (100.0%) | 0 (0.0%) |
| 15 to 17 Year Olds | 63 (100.0%) | 0 (0.0%) |
| 18 to 19 Year Olds | 92 (96.8%) | 3 (3.2%) |
| 20 to 24 Year Olds | 0 (0.0%) | 0 (0.0%) |
| 25 to 34 Year Olds | 36 (100.0%) | 0 (0.0%) |
| 35 Years and over | 14 (28.6%) | 35 (71.4%) |
| Total | 513 (89.5%) | 60 (10.5%) |
Educational Attainment by Field of Study in Mountville borough
Education (196 | 31.3%), science & technology (103 | 16.4%), visual & performing arts (63 | 10.1%), social sciences (41 | 6.5%), and liberal arts & history (40 | 6.4%) are the most common fields of study among 627 individuals in Mountville borough who have obtained a bachelor's degree or higher.
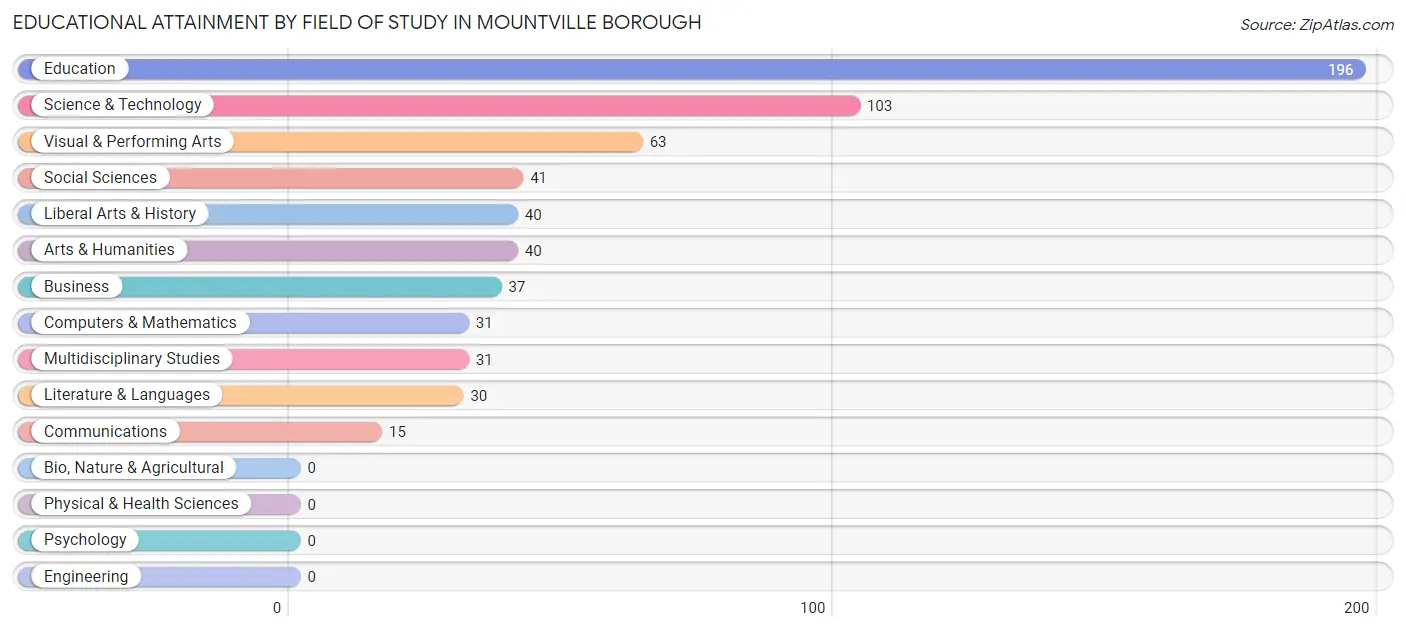
| Field of Study | # Graduates | % Graduates |
| Computers & Mathematics | 31 | 4.9% |
| Bio, Nature & Agricultural | 0 | 0.0% |
| Physical & Health Sciences | 0 | 0.0% |
| Psychology | 0 | 0.0% |
| Social Sciences | 41 | 6.5% |
| Engineering | 0 | 0.0% |
| Multidisciplinary Studies | 31 | 4.9% |
| Science & Technology | 103 | 16.4% |
| Business | 37 | 5.9% |
| Education | 196 | 31.3% |
| Literature & Languages | 30 | 4.8% |
| Liberal Arts & History | 40 | 6.4% |
| Visual & Performing Arts | 63 | 10.1% |
| Communications | 15 | 2.4% |
| Arts & Humanities | 40 | 6.4% |
| Total | 627 | 100.0% |
Transportation & Commute in Mountville borough
Vehicle Availability by Sex in Mountville borough
The most prevalent vehicle ownership categories in Mountville borough are males with 2 vehicles (388, accounting for 51.9%) and females with 2 vehicles (257, making up 51.0%).
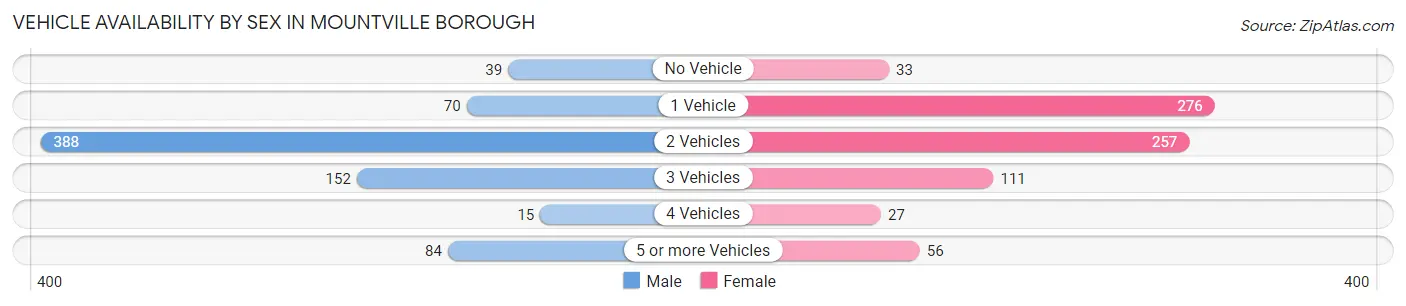
| Vehicles Available | Male | Female |
| No Vehicle | 39 (5.2%) | 33 (4.3%) |
| 1 Vehicle | 70 (9.4%) | 276 (36.3%) |
| 2 Vehicles | 388 (51.9%) | 257 (33.8%) |
| 3 Vehicles | 152 (20.3%) | 111 (14.6%) |
| 4 Vehicles | 15 (2.0%) | 27 (3.5%) |
| 5 or more Vehicles | 84 (11.2%) | 56 (7.4%) |
| Total | 748 (100.0%) | 760 (100.0%) |
Commute Time in Mountville borough
The most frequently occuring commute durations in Mountville borough are 20 to 24 minutes (328 commuters, 24.1%), 30 to 34 minutes (293 commuters, 21.5%), and 15 to 19 minutes (225 commuters, 16.5%).
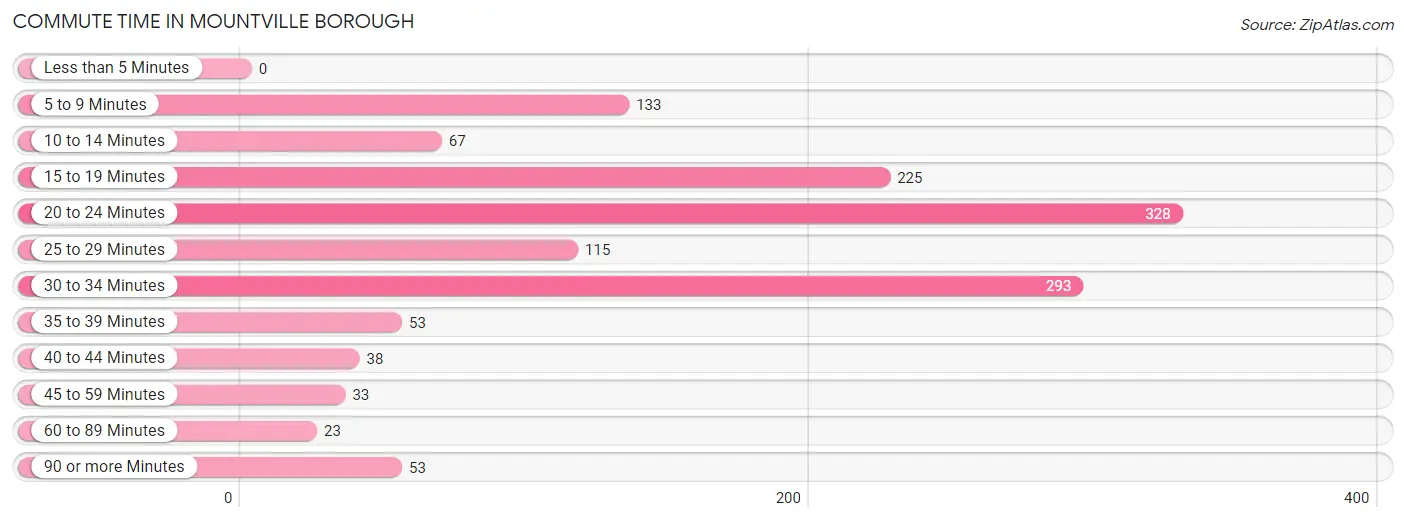
| Commute Time | # Commuters | % Commuters |
| Less than 5 Minutes | 0 | 0.0% |
| 5 to 9 Minutes | 133 | 9.8% |
| 10 to 14 Minutes | 67 | 4.9% |
| 15 to 19 Minutes | 225 | 16.5% |
| 20 to 24 Minutes | 328 | 24.1% |
| 25 to 29 Minutes | 115 | 8.5% |
| 30 to 34 Minutes | 293 | 21.5% |
| 35 to 39 Minutes | 53 | 3.9% |
| 40 to 44 Minutes | 38 | 2.8% |
| 45 to 59 Minutes | 33 | 2.4% |
| 60 to 89 Minutes | 23 | 1.7% |
| 90 or more Minutes | 53 | 3.9% |
Commute Time by Sex in Mountville borough
The most common commute times in Mountville borough are 30 to 34 minutes (152 commuters, 23.0%) for males and 20 to 24 minutes (186 commuters, 26.6%) for females.
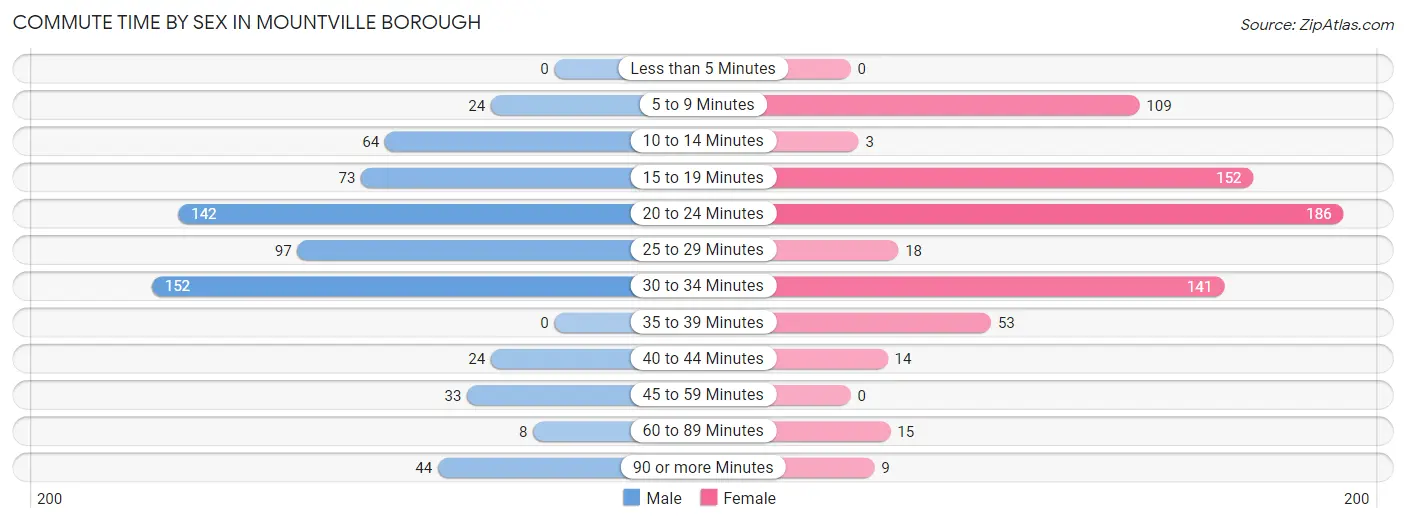
| Commute Time | Male | Female |
| Less than 5 Minutes | 0 (0.0%) | 0 (0.0%) |
| 5 to 9 Minutes | 24 (3.6%) | 109 (15.6%) |
| 10 to 14 Minutes | 64 (9.7%) | 3 (0.4%) |
| 15 to 19 Minutes | 73 (11.0%) | 152 (21.7%) |
| 20 to 24 Minutes | 142 (21.5%) | 186 (26.6%) |
| 25 to 29 Minutes | 97 (14.7%) | 18 (2.6%) |
| 30 to 34 Minutes | 152 (23.0%) | 141 (20.1%) |
| 35 to 39 Minutes | 0 (0.0%) | 53 (7.6%) |
| 40 to 44 Minutes | 24 (3.6%) | 14 (2.0%) |
| 45 to 59 Minutes | 33 (5.0%) | 0 (0.0%) |
| 60 to 89 Minutes | 8 (1.2%) | 15 (2.1%) |
| 90 or more Minutes | 44 (6.7%) | 9 (1.3%) |
Time of Departure to Work by Sex in Mountville borough
The most frequent times of departure to work in Mountville borough are 7:30 AM to 7:59 AM (168, 25.4%) for males and 6:30 AM to 6:59 AM (122, 17.4%) for females.
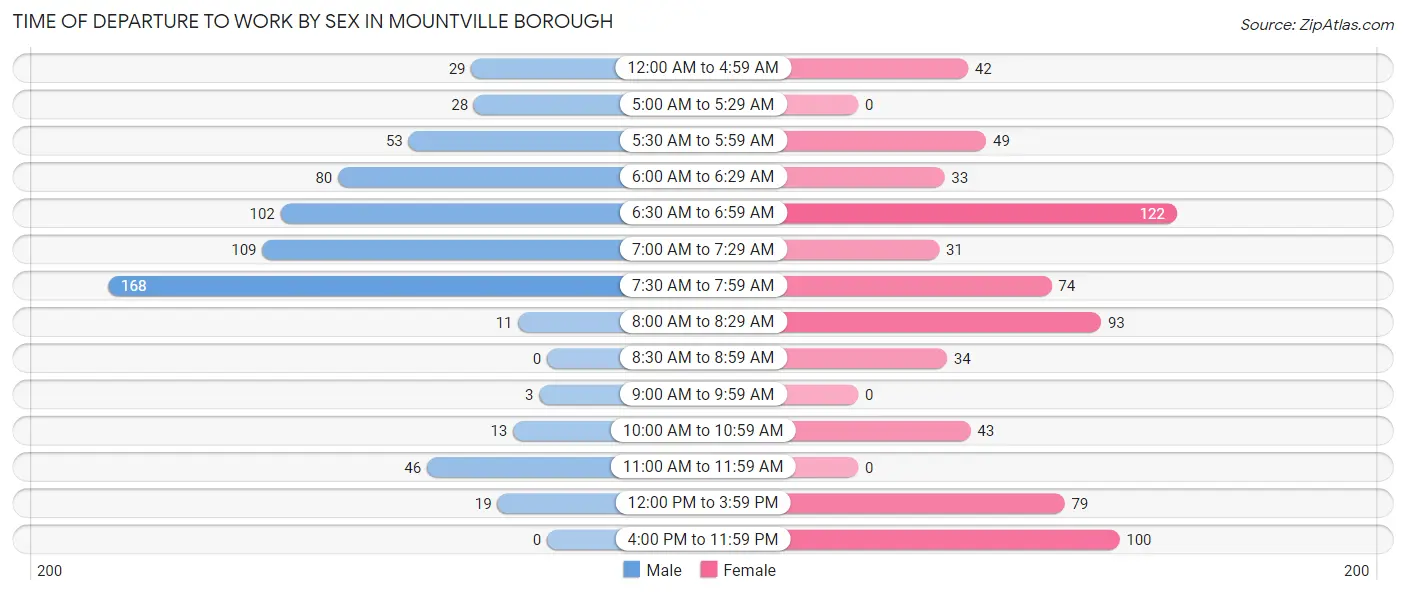
| Time of Departure | Male | Female |
| 12:00 AM to 4:59 AM | 29 (4.4%) | 42 (6.0%) |
| 5:00 AM to 5:29 AM | 28 (4.2%) | 0 (0.0%) |
| 5:30 AM to 5:59 AM | 53 (8.0%) | 49 (7.0%) |
| 6:00 AM to 6:29 AM | 80 (12.1%) | 33 (4.7%) |
| 6:30 AM to 6:59 AM | 102 (15.4%) | 122 (17.4%) |
| 7:00 AM to 7:29 AM | 109 (16.5%) | 31 (4.4%) |
| 7:30 AM to 7:59 AM | 168 (25.4%) | 74 (10.6%) |
| 8:00 AM to 8:29 AM | 11 (1.7%) | 93 (13.3%) |
| 8:30 AM to 8:59 AM | 0 (0.0%) | 34 (4.9%) |
| 9:00 AM to 9:59 AM | 3 (0.4%) | 0 (0.0%) |
| 10:00 AM to 10:59 AM | 13 (2.0%) | 43 (6.1%) |
| 11:00 AM to 11:59 AM | 46 (7.0%) | 0 (0.0%) |
| 12:00 PM to 3:59 PM | 19 (2.9%) | 79 (11.3%) |
| 4:00 PM to 11:59 PM | 0 (0.0%) | 100 (14.3%) |
| Total | 661 (100.0%) | 700 (100.0%) |
Housing Occupancy in Mountville borough
Occupancy by Ownership in Mountville borough
Of the total 1,334 dwellings in Mountville borough, owner-occupied units account for 1,136 (85.2%), while renter-occupied units make up 198 (14.8%).
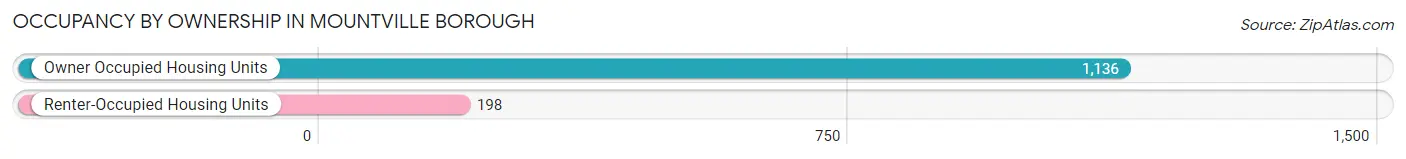
| Occupancy | # Housing Units | % Housing Units |
| Owner Occupied Housing Units | 1,136 | 85.2% |
| Renter-Occupied Housing Units | 198 | 14.8% |
| Total Occupied Housing Units | 1,334 | 100.0% |
Occupancy by Household Size in Mountville borough
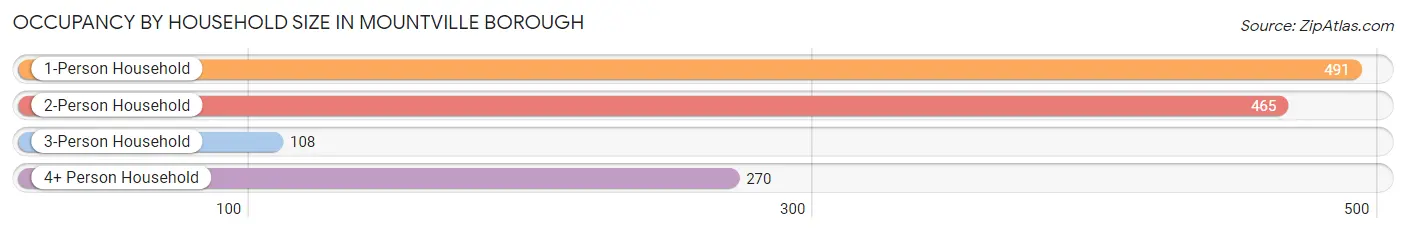
| Household Size | # Housing Units | % Housing Units |
| 1-Person Household | 491 | 36.8% |
| 2-Person Household | 465 | 34.9% |
| 3-Person Household | 108 | 8.1% |
| 4+ Person Household | 270 | 20.2% |
| Total Housing Units | 1,334 | 100.0% |
Occupancy by Ownership by Household Size in Mountville borough
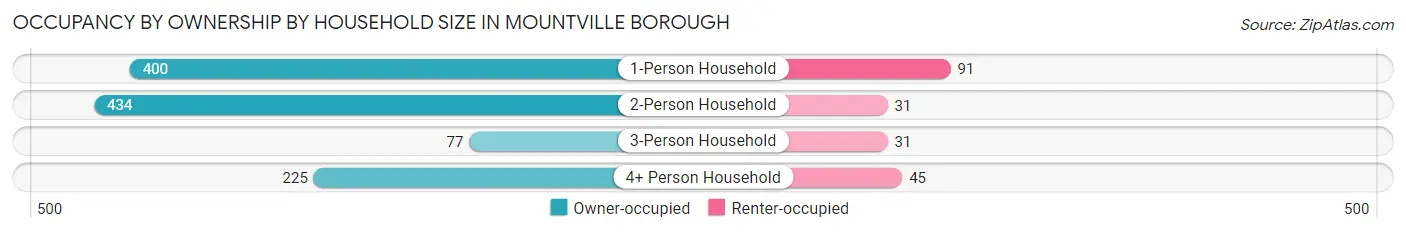
| Household Size | Owner-occupied | Renter-occupied |
| 1-Person Household | 400 (81.5%) | 91 (18.5%) |
| 2-Person Household | 434 (93.3%) | 31 (6.7%) |
| 3-Person Household | 77 (71.3%) | 31 (28.7%) |
| 4+ Person Household | 225 (83.3%) | 45 (16.7%) |
| Total Housing Units | 1,136 (85.2%) | 198 (14.8%) |
Occupancy by Educational Attainment in Mountville borough
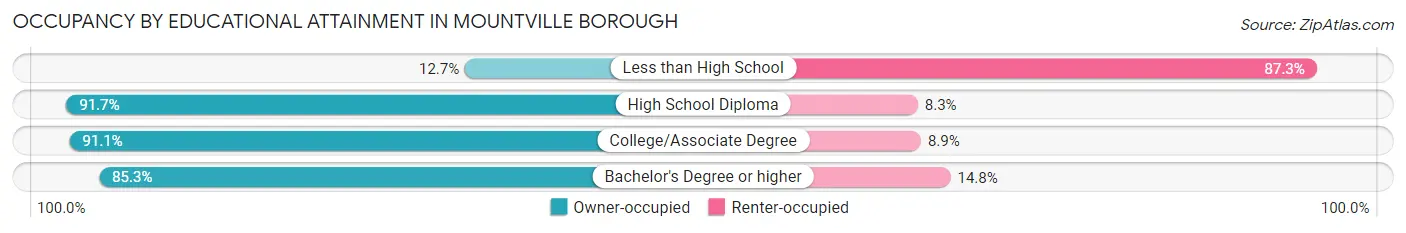
| Household Size | Owner-occupied | Renter-occupied |
| Less than High School | 9 (12.7%) | 62 (87.3%) |
| High School Diploma | 488 (91.7%) | 44 (8.3%) |
| College/Associate Degree | 246 (91.1%) | 24 (8.9%) |
| Bachelor's Degree or higher | 393 (85.3%) | 68 (14.7%) |
Occupancy by Age of Householder in Mountville borough
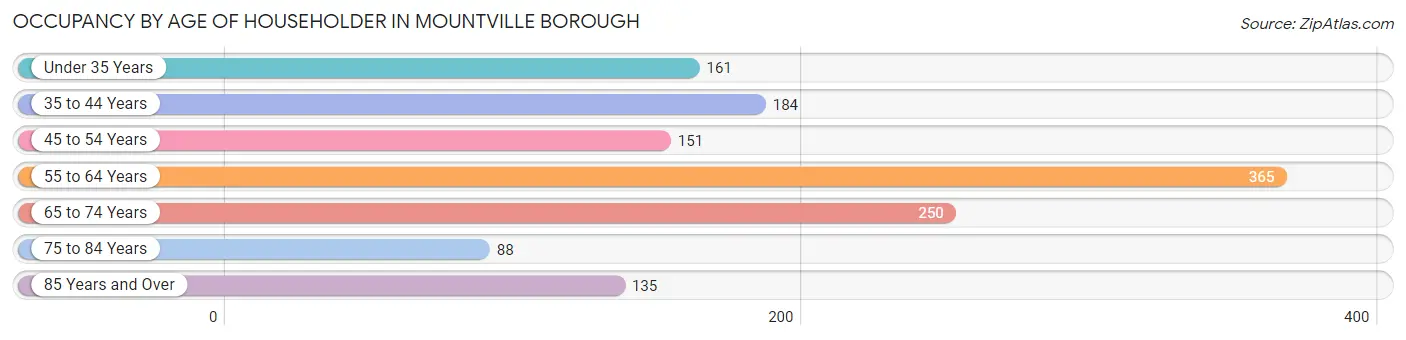
| Age Bracket | # Households | % Households |
| Under 35 Years | 161 | 12.1% |
| 35 to 44 Years | 184 | 13.8% |
| 45 to 54 Years | 151 | 11.3% |
| 55 to 64 Years | 365 | 27.4% |
| 65 to 74 Years | 250 | 18.7% |
| 75 to 84 Years | 88 | 6.6% |
| 85 Years and Over | 135 | 10.1% |
| Total | 1,334 | 100.0% |
Housing Finances in Mountville borough
Median Income by Occupancy in Mountville borough
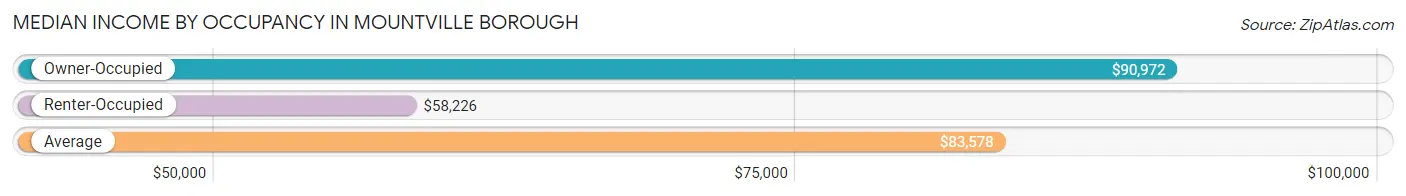
| Occupancy Type | # Households | Median Income |
| Owner-Occupied | 1,136 (85.2%) | $90,972 |
| Renter-Occupied | 198 (14.8%) | $58,226 |
| Average | 1,334 (100.0%) | $83,578 |
Occupancy by Householder Income Bracket in Mountville borough
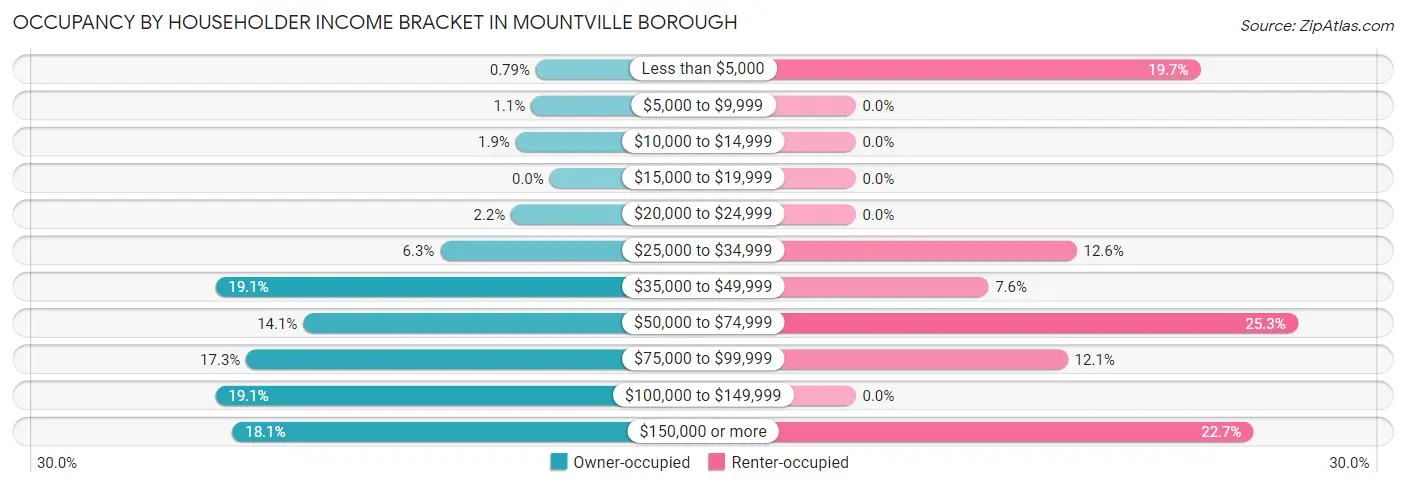
| Income Bracket | Owner-occupied | Renter-occupied |
| Less than $5,000 | 9 (0.8%) | 39 (19.7%) |
| $5,000 to $9,999 | 12 (1.1%) | 0 (0.0%) |
| $10,000 to $14,999 | 22 (1.9%) | 0 (0.0%) |
| $15,000 to $19,999 | 0 (0.0%) | 0 (0.0%) |
| $20,000 to $24,999 | 25 (2.2%) | 0 (0.0%) |
| $25,000 to $34,999 | 71 (6.2%) | 25 (12.6%) |
| $35,000 to $49,999 | 217 (19.1%) | 15 (7.6%) |
| $50,000 to $74,999 | 160 (14.1%) | 50 (25.3%) |
| $75,000 to $99,999 | 197 (17.3%) | 24 (12.1%) |
| $100,000 to $149,999 | 217 (19.1%) | 0 (0.0%) |
| $150,000 or more | 206 (18.1%) | 45 (22.7%) |
| Total | 1,136 (100.0%) | 198 (100.0%) |
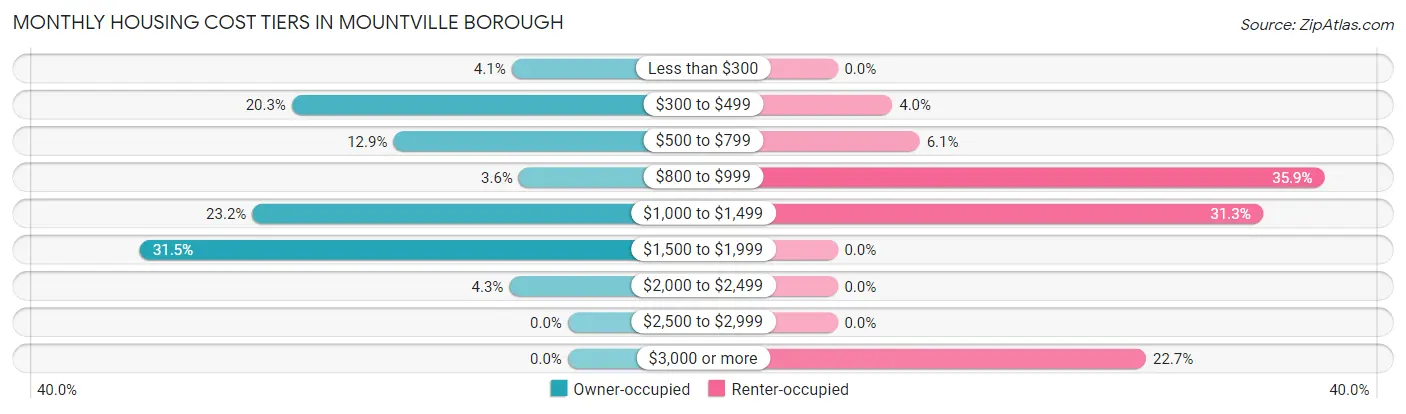
Monthly Housing Cost Tiers in Mountville borough
| Monthly Cost | Owner-occupied | Renter-occupied |
| Less than $300 | 47 (4.1%) | 0 (0.0%) |
| $300 to $499 | 231 (20.3%) | 8 (4.0%) |
| $500 to $799 | 146 (12.9%) | 12 (6.1%) |
| $800 to $999 | 41 (3.6%) | 71 (35.9%) |
| $1,000 to $1,499 | 264 (23.2%) | 62 (31.3%) |
| $1,500 to $1,999 | 358 (31.5%) | 0 (0.0%) |
| $2,000 to $2,499 | 49 (4.3%) | 0 (0.0%) |
| $2,500 to $2,999 | 0 (0.0%) | 0 (0.0%) |
| $3,000 or more | 0 (0.0%) | 45 (22.7%) |
| Total | 1,136 (100.0%) | 198 (100.0%) |
Physical Housing Characteristics in Mountville borough
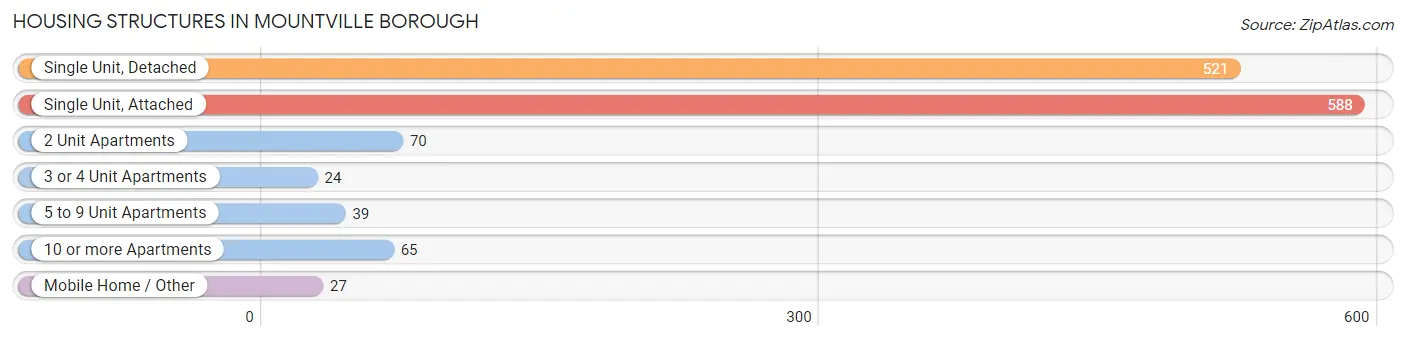
Housing Structures in Mountville borough
| Structure Type | # Housing Units | % Housing Units |
| Single Unit, Detached | 521 | 39.1% |
| Single Unit, Attached | 588 | 44.1% |
| 2 Unit Apartments | 70 | 5.2% |
| 3 or 4 Unit Apartments | 24 | 1.8% |
| 5 to 9 Unit Apartments | 39 | 2.9% |
| 10 or more Apartments | 65 | 4.9% |
| Mobile Home / Other | 27 | 2.0% |
| Total | 1,334 | 100.0% |
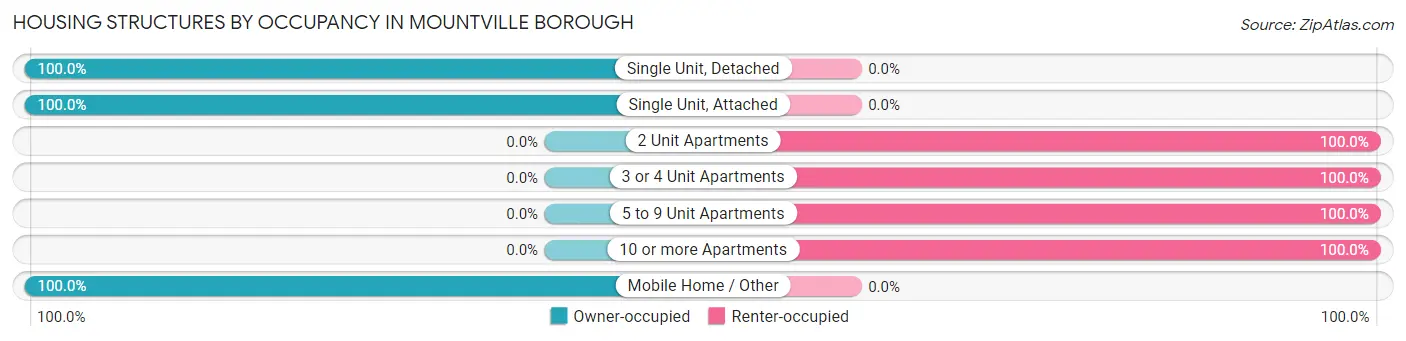
Housing Structures by Occupancy in Mountville borough
| Structure Type | Owner-occupied | Renter-occupied |
| Single Unit, Detached | 521 (100.0%) | 0 (0.0%) |
| Single Unit, Attached | 588 (100.0%) | 0 (0.0%) |
| 2 Unit Apartments | 0 (0.0%) | 70 (100.0%) |
| 3 or 4 Unit Apartments | 0 (0.0%) | 24 (100.0%) |
| 5 to 9 Unit Apartments | 0 (0.0%) | 39 (100.0%) |
| 10 or more Apartments | 0 (0.0%) | 65 (100.0%) |
| Mobile Home / Other | 27 (100.0%) | 0 (0.0%) |
| Total | 1,136 (85.2%) | 198 (14.8%) |
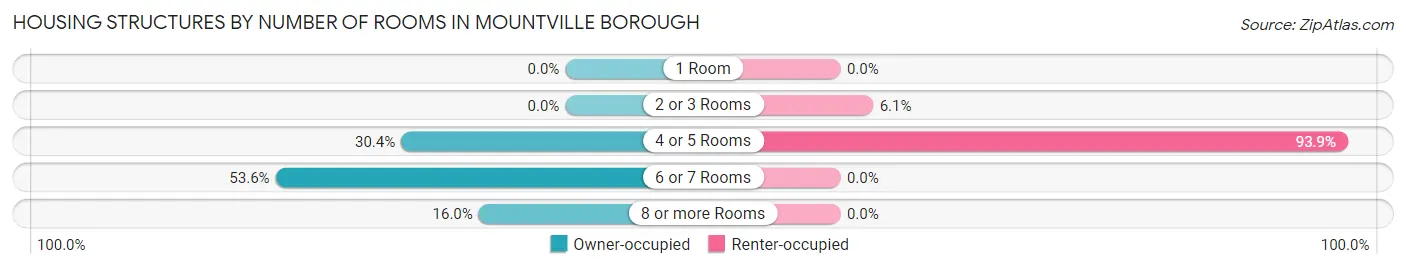
Housing Structures by Number of Rooms in Mountville borough
| Number of Rooms | Owner-occupied | Renter-occupied |
| 1 Room | 0 (0.0%) | 0 (0.0%) |
| 2 or 3 Rooms | 0 (0.0%) | 12 (6.1%) |
| 4 or 5 Rooms | 345 (30.4%) | 186 (93.9%) |
| 6 or 7 Rooms | 609 (53.6%) | 0 (0.0%) |
| 8 or more Rooms | 182 (16.0%) | 0 (0.0%) |
| Total | 1,136 (100.0%) | 198 (100.0%) |
Housing Structure by Heating Type in Mountville borough
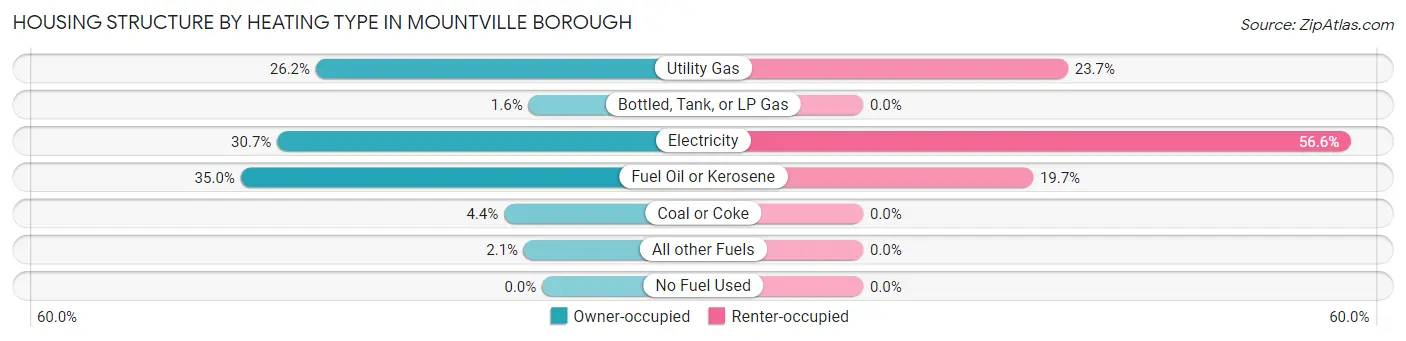
| Heating Type | Owner-occupied | Renter-occupied |
| Utility Gas | 298 (26.2%) | 47 (23.7%) |
| Bottled, Tank, or LP Gas | 18 (1.6%) | 0 (0.0%) |
| Electricity | 349 (30.7%) | 112 (56.6%) |
| Fuel Oil or Kerosene | 397 (34.9%) | 39 (19.7%) |
| Coal or Coke | 50 (4.4%) | 0 (0.0%) |
| All other Fuels | 24 (2.1%) | 0 (0.0%) |
| No Fuel Used | 0 (0.0%) | 0 (0.0%) |
| Total | 1,136 (100.0%) | 198 (100.0%) |
Household Vehicle Usage in Mountville borough
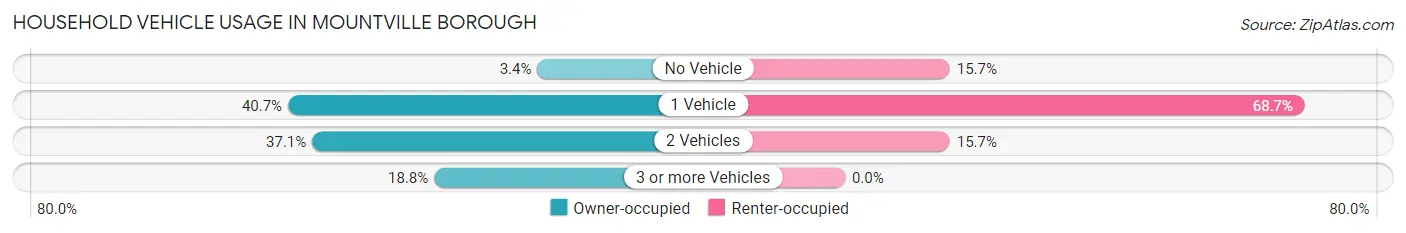
| Vehicles per Household | Owner-occupied | Renter-occupied |
| No Vehicle | 39 (3.4%) | 31 (15.7%) |
| 1 Vehicle | 462 (40.7%) | 136 (68.7%) |
| 2 Vehicles | 421 (37.1%) | 31 (15.7%) |
| 3 or more Vehicles | 214 (18.8%) | 0 (0.0%) |
| Total | 1,136 (100.0%) | 198 (100.0%) |
Real Estate & Mortgages in Mountville borough
Real Estate and Mortgage Overview in Mountville borough
| Characteristic | Without Mortgage | With Mortgage |
| Housing Units | 451 | 685 |
| Median Property Value | $247,500 | $219,600 |
| Median Household Income | - | - |
| Monthly Housing Costs | $475 | $0 |
| Real Estate Taxes | $2,622 | $0 |
Property Value by Mortgage Status in Mountville borough
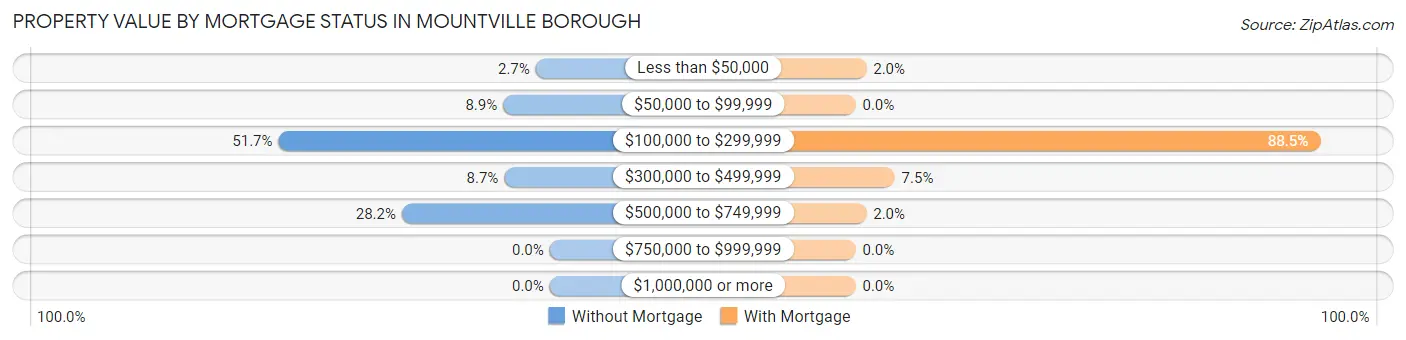
| Property Value | Without Mortgage | With Mortgage |
| Less than $50,000 | 12 (2.7%) | 14 (2.0%) |
| $50,000 to $99,999 | 40 (8.9%) | 0 (0.0%) |
| $100,000 to $299,999 | 233 (51.7%) | 606 (88.5%) |
| $300,000 to $499,999 | 39 (8.6%) | 51 (7.4%) |
| $500,000 to $749,999 | 127 (28.2%) | 14 (2.0%) |
| $750,000 to $999,999 | 0 (0.0%) | 0 (0.0%) |
| $1,000,000 or more | 0 (0.0%) | 0 (0.0%) |
| Total | 451 (100.0%) | 685 (100.0%) |
Household Income by Mortgage Status in Mountville borough
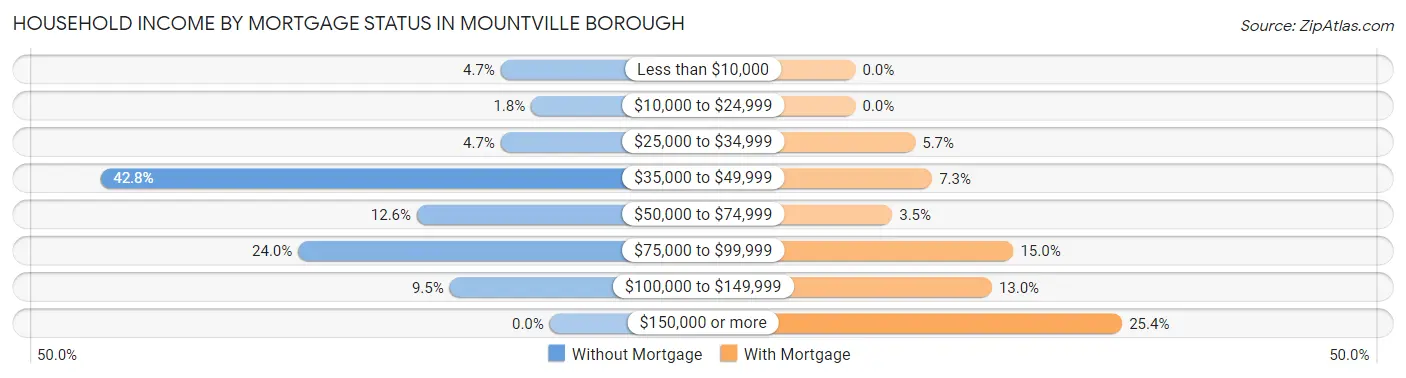
| Household Income | Without Mortgage | With Mortgage |
| Less than $10,000 | 21 (4.7%) | 0 (0.0%) |
| $10,000 to $24,999 | 8 (1.8%) | 0 (0.0%) |
| $25,000 to $34,999 | 21 (4.7%) | 39 (5.7%) |
| $35,000 to $49,999 | 193 (42.8%) | 50 (7.3%) |
| $50,000 to $74,999 | 57 (12.6%) | 24 (3.5%) |
| $75,000 to $99,999 | 108 (23.9%) | 103 (15.0%) |
| $100,000 to $149,999 | 43 (9.5%) | 89 (13.0%) |
| $150,000 or more | 0 (0.0%) | 174 (25.4%) |
| Total | 451 (100.0%) | 685 (100.0%) |
Property Value to Household Income Ratio in Mountville borough
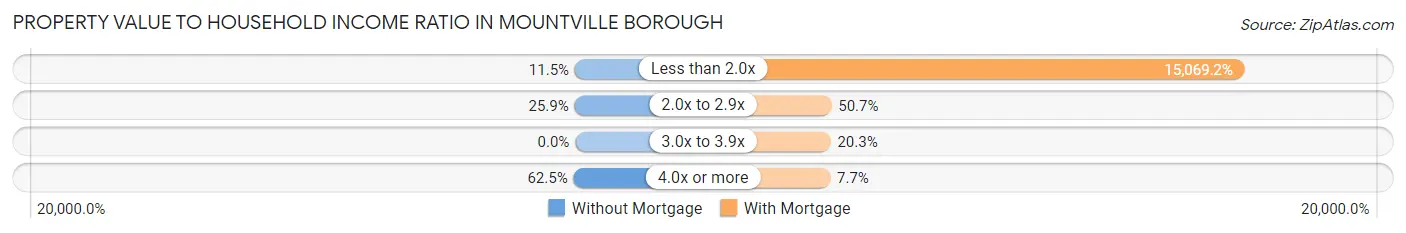
| Value-to-Income Ratio | Without Mortgage | With Mortgage |
| Less than 2.0x | 52 (11.5%) | 103,224 (15,069.2%) |
| 2.0x to 2.9x | 117 (25.9%) | 347 (50.7%) |
| 3.0x to 3.9x | 0 (0.0%) | 139 (20.3%) |
| 4.0x or more | 282 (62.5%) | 53 (7.7%) |
| Total | 451 (100.0%) | 685 (100.0%) |
Real Estate Taxes by Mortgage Status in Mountville borough
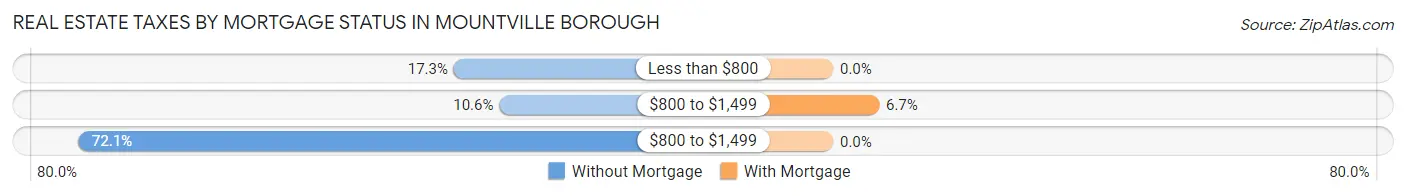
| Property Taxes | Without Mortgage | With Mortgage |
| Less than $800 | 78 (17.3%) | 0 (0.0%) |
| $800 to $1,499 | 48 (10.6%) | 46 (6.7%) |
| $800 to $1,499 | 325 (72.1%) | 0 (0.0%) |
| Total | 451 (100.0%) | 685 (100.0%) |
Health & Disability in Mountville borough
Health Insurance Coverage by Age in Mountville borough
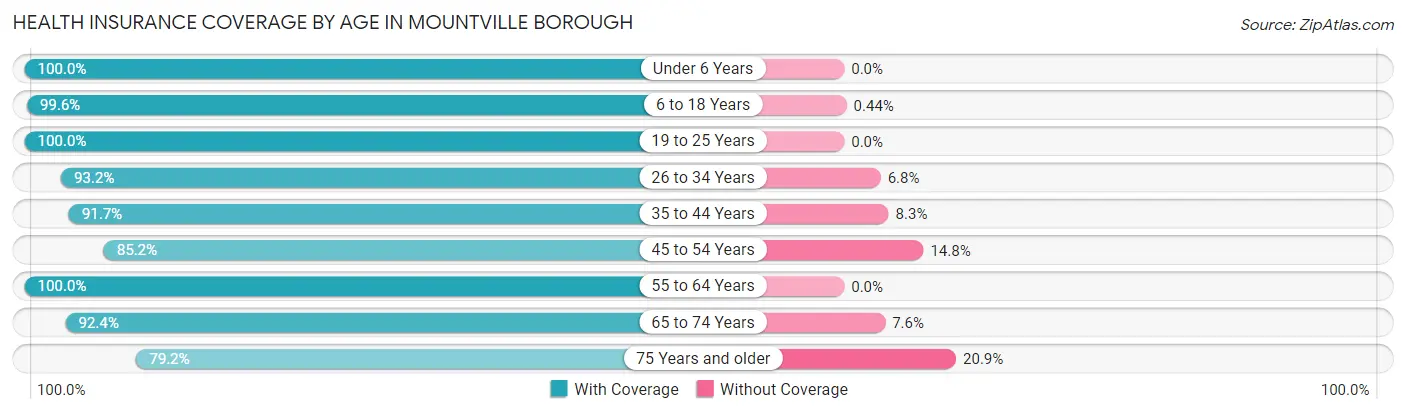
| Age Bracket | With Coverage | Without Coverage |
| Under 6 Years | 183 (100.0%) | 0 (0.0%) |
| 6 to 18 Years | 456 (99.6%) | 2 (0.4%) |
| 19 to 25 Years | 56 (100.0%) | 0 (0.0%) |
| 26 to 34 Years | 343 (93.2%) | 25 (6.8%) |
| 35 to 44 Years | 366 (91.7%) | 33 (8.3%) |
| 45 to 54 Years | 225 (85.2%) | 39 (14.8%) |
| 55 to 64 Years | 482 (100.0%) | 0 (0.0%) |
| 65 to 74 Years | 448 (92.4%) | 37 (7.6%) |
| 75 Years and older | 243 (79.1%) | 64 (20.8%) |
| Total | 2,802 (93.3%) | 200 (6.7%) |
Health Insurance Coverage by Citizenship Status in Mountville borough
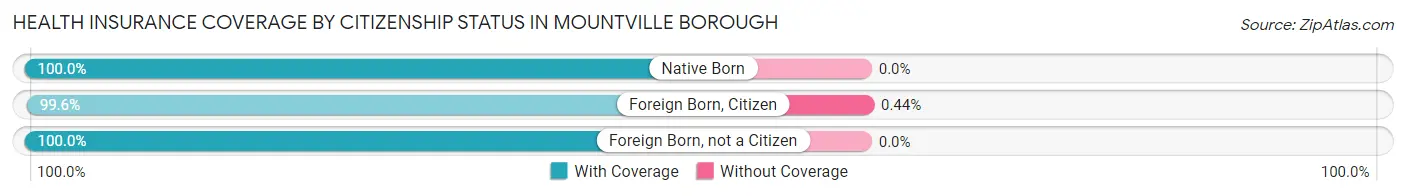
| Citizenship Status | With Coverage | Without Coverage |
| Native Born | 183 (100.0%) | 0 (0.0%) |
| Foreign Born, Citizen | 456 (99.6%) | 2 (0.4%) |
| Foreign Born, not a Citizen | 56 (100.0%) | 0 (0.0%) |
Health Insurance Coverage by Household Income in Mountville borough
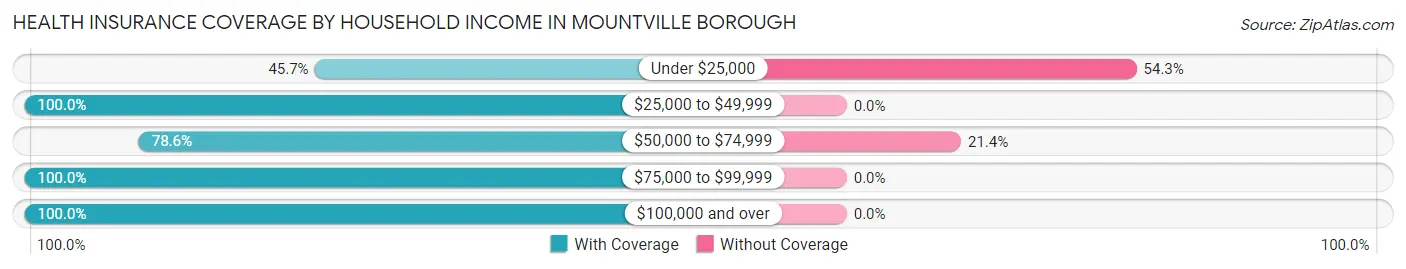
| Household Income | With Coverage | Without Coverage |
| Under $25,000 | 85 (45.7%) | 101 (54.3%) |
| $25,000 to $49,999 | 533 (100.0%) | 0 (0.0%) |
| $50,000 to $74,999 | 356 (78.6%) | 97 (21.4%) |
| $75,000 to $99,999 | 372 (100.0%) | 0 (0.0%) |
| $100,000 and over | 1,328 (100.0%) | 0 (0.0%) |
Public vs Private Health Insurance Coverage by Age in Mountville borough
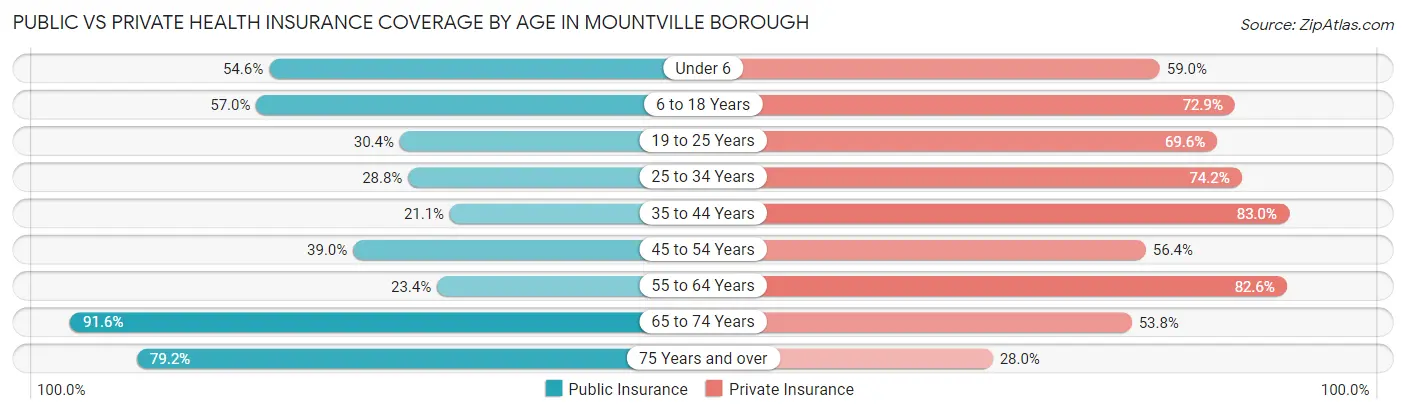
| Age Bracket | Public Insurance | Private Insurance |
| Under 6 | 100 (54.6%) | 108 (59.0%) |
| 6 to 18 Years | 261 (57.0%) | 334 (72.9%) |
| 19 to 25 Years | 17 (30.4%) | 39 (69.6%) |
| 25 to 34 Years | 106 (28.8%) | 273 (74.2%) |
| 35 to 44 Years | 84 (21.0%) | 331 (83.0%) |
| 45 to 54 Years | 103 (39.0%) | 149 (56.4%) |
| 55 to 64 Years | 113 (23.4%) | 398 (82.6%) |
| 65 to 74 Years | 444 (91.5%) | 261 (53.8%) |
| 75 Years and over | 243 (79.1%) | 86 (28.0%) |
| Total | 1,471 (49.0%) | 1,979 (65.9%) |
Disability Status by Sex by Age in Mountville borough
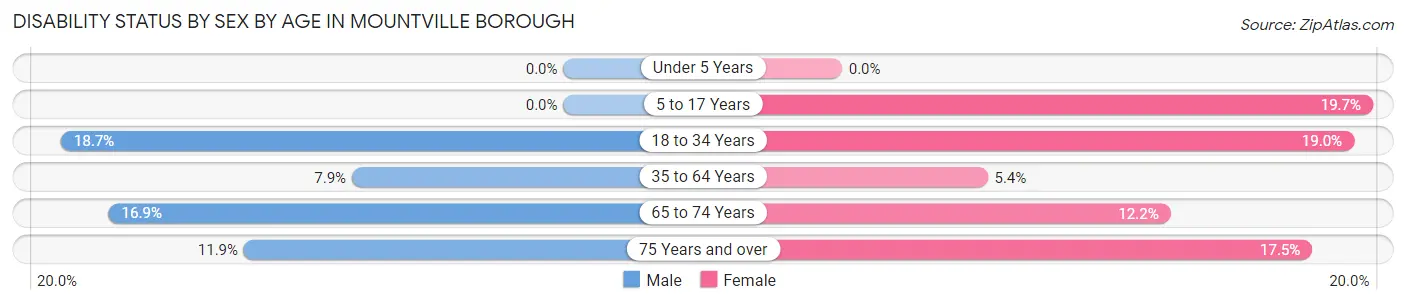
| Age Bracket | Male | Female |
| Under 5 Years | 0 (0.0%) | 0 (0.0%) |
| 5 to 17 Years | 0 (0.0%) | 27 (19.7%) |
| 18 to 34 Years | 47 (18.6%) | 54 (19.0%) |
| 35 to 64 Years | 42 (7.9%) | 33 (5.4%) |
| 65 to 74 Years | 39 (16.9%) | 31 (12.2%) |
| 75 Years and over | 14 (11.9%) | 33 (17.5%) |
Disability Class by Sex by Age in Mountville borough
Disability Class: Hearing Difficulty
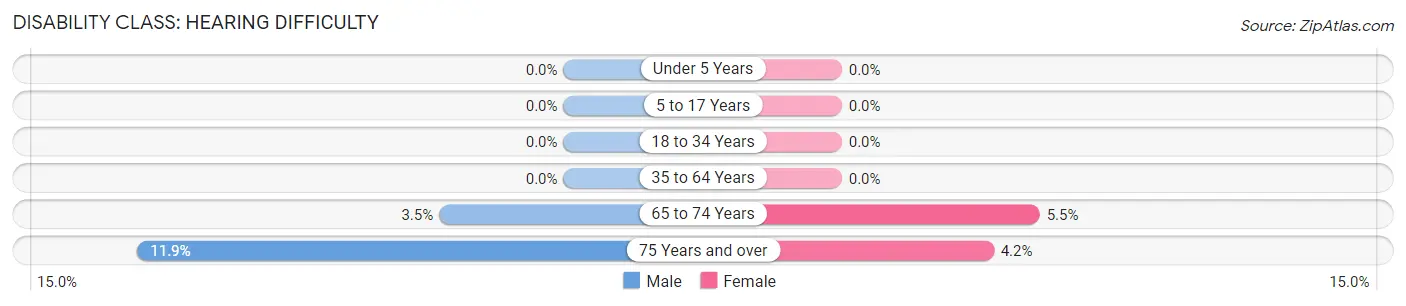
| Age Bracket | Male | Female |
| Under 5 Years | 0 (0.0%) | 0 (0.0%) |
| 5 to 17 Years | 0 (0.0%) | 0 (0.0%) |
| 18 to 34 Years | 0 (0.0%) | 0 (0.0%) |
| 35 to 64 Years | 0 (0.0%) | 0 (0.0%) |
| 65 to 74 Years | 8 (3.5%) | 14 (5.5%) |
| 75 Years and over | 14 (11.9%) | 8 (4.2%) |
Disability Class: Vision Difficulty
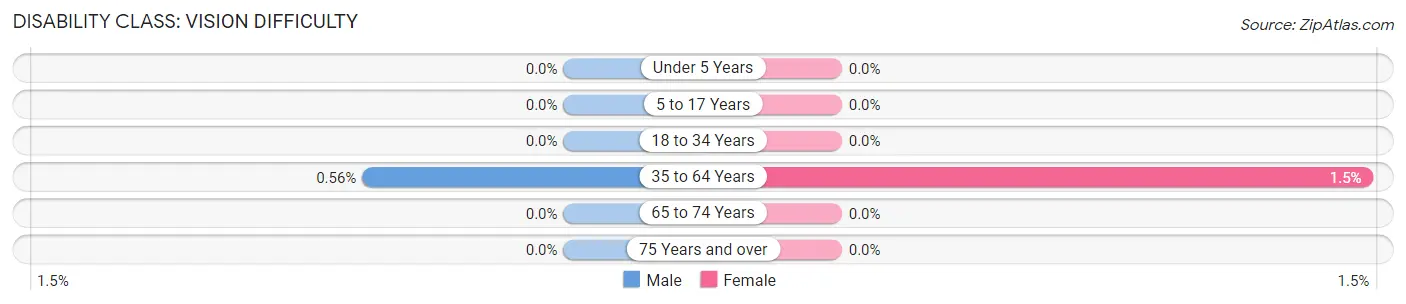
| Age Bracket | Male | Female |
| Under 5 Years | 0 (0.0%) | 0 (0.0%) |
| 5 to 17 Years | 0 (0.0%) | 0 (0.0%) |
| 18 to 34 Years | 0 (0.0%) | 0 (0.0%) |
| 35 to 64 Years | 3 (0.6%) | 9 (1.5%) |
| 65 to 74 Years | 0 (0.0%) | 0 (0.0%) |
| 75 Years and over | 0 (0.0%) | 0 (0.0%) |
Disability Class: Cognitive Difficulty
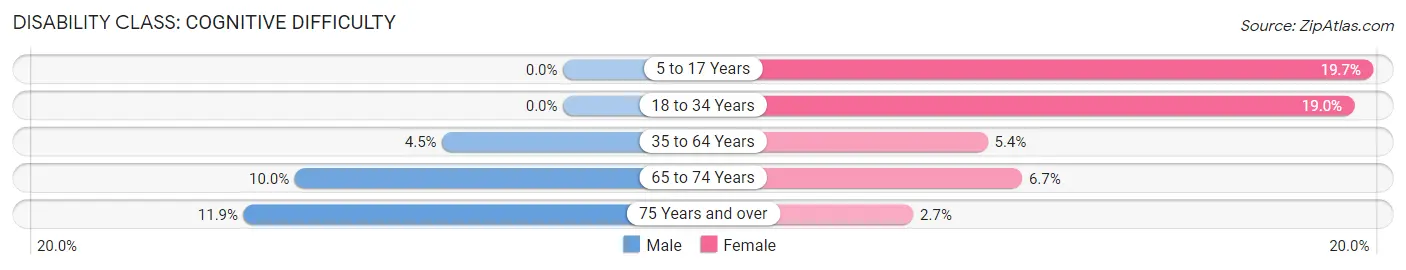
| Age Bracket | Male | Female |
| 5 to 17 Years | 0 (0.0%) | 27 (19.7%) |
| 18 to 34 Years | 0 (0.0%) | 54 (19.0%) |
| 35 to 64 Years | 24 (4.5%) | 33 (5.4%) |
| 65 to 74 Years | 23 (10.0%) | 17 (6.7%) |
| 75 Years and over | 14 (11.9%) | 5 (2.6%) |
Disability Class: Ambulatory Difficulty
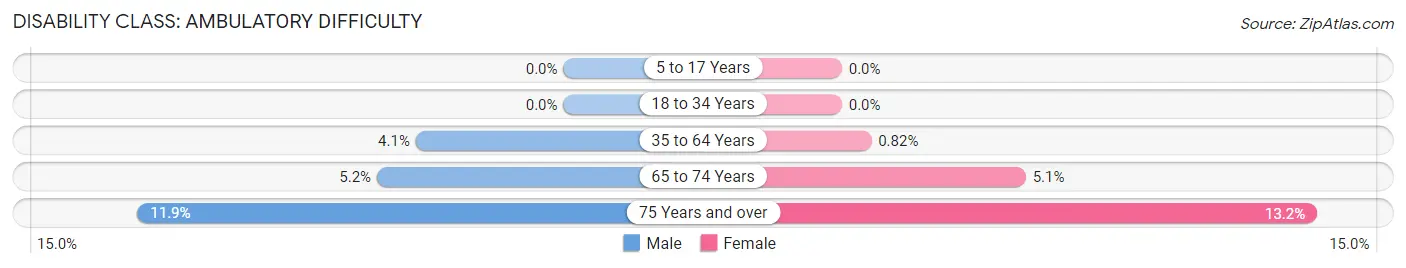
| Age Bracket | Male | Female |
| 5 to 17 Years | 0 (0.0%) | 0 (0.0%) |
| 18 to 34 Years | 0 (0.0%) | 0 (0.0%) |
| 35 to 64 Years | 22 (4.1%) | 5 (0.8%) |
| 65 to 74 Years | 12 (5.2%) | 13 (5.1%) |
| 75 Years and over | 14 (11.9%) | 25 (13.2%) |
Disability Class: Self-Care Difficulty
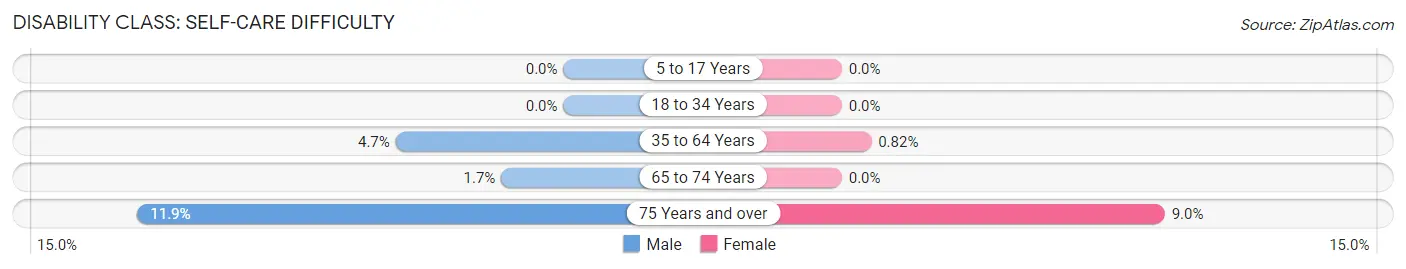
| Age Bracket | Male | Female |
| 5 to 17 Years | 0 (0.0%) | 0 (0.0%) |
| 18 to 34 Years | 0 (0.0%) | 0 (0.0%) |
| 35 to 64 Years | 25 (4.7%) | 5 (0.8%) |
| 65 to 74 Years | 4 (1.7%) | 0 (0.0%) |
| 75 Years and over | 14 (11.9%) | 17 (9.0%) |
Technology Access in Mountville borough
Computing Device Access in Mountville borough
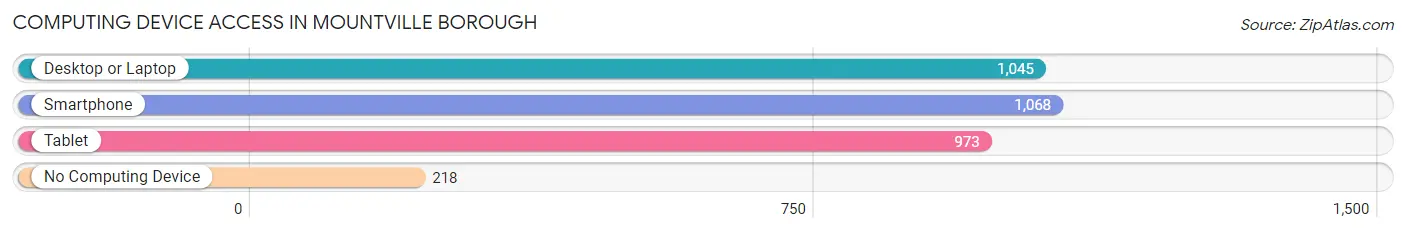
| Device Type | # Households | % Households |
| Desktop or Laptop | 1,045 | 78.3% |
| Smartphone | 1,068 | 80.1% |
| Tablet | 973 | 72.9% |
| No Computing Device | 218 | 16.3% |
| Total | 1,334 | 100.0% |
Internet Access in Mountville borough
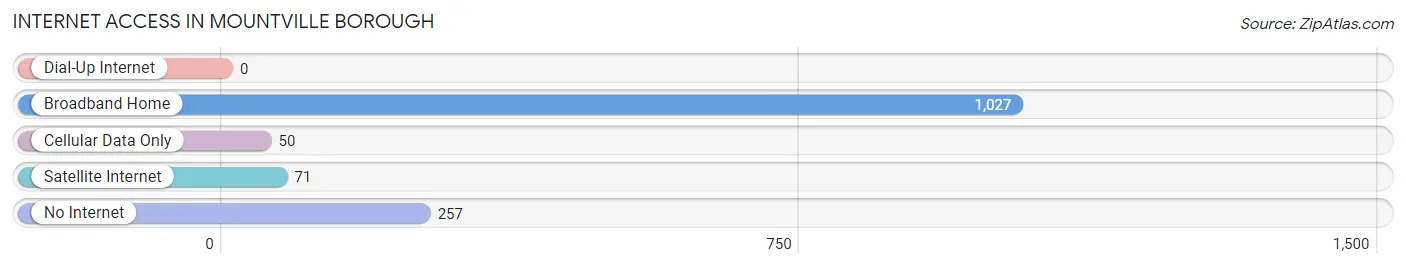
| Internet Type | # Households | % Households |
| Dial-Up Internet | 0 | 0.0% |
| Broadband Home | 1,027 | 77.0% |
| Cellular Data Only | 50 | 3.7% |
| Satellite Internet | 71 | 5.3% |
| No Internet | 257 | 19.3% |
| Total | 1,334 | 100.0% |
Mountville borough Summary
Introduction
Mountville Borough is a small borough located in Lancaster County, Pennsylvania. It is situated in the southeastern part of the county, approximately five miles from the city of Lancaster. The borough is home to a population of approximately 2,000 people and is known for its small-town charm and rural atmosphere. The borough is home to a variety of businesses, including a grocery store, a hardware store, a pharmacy, and several restaurants. The borough is also home to a number of parks and recreational areas, including a public pool, a playground, and a walking trail.
History
Mountville Borough was founded in 1854 by a group of settlers from the nearby town of Mount Joy. The settlers purchased land from the local Native American tribes and began to build homes and businesses in the area. The borough was officially incorporated in 1867 and was named after the nearby mountain, Mount Joy.
The borough grew steadily throughout the 19th century, and by the early 20th century, it had become a thriving community. The borough was home to a variety of businesses, including a flour mill, a sawmill, a tannery, and a brickyard. The borough also had a number of churches, schools, and other civic organizations.
In the mid-20th century, the borough began to experience a decline in population and economic activity. This decline was due in part to the decline of the local industries, as well as the increasing popularity of suburban living. In the late 20th century, the borough began to experience a resurgence in population and economic activity. This resurgence was due in part to the development of new businesses and the revitalization of the downtown area.
Geography
Mountville Borough is located in southeastern Lancaster County, approximately five miles from the city of Lancaster. The borough is situated in a rural area, with rolling hills and farmland surrounding it. The borough is bordered by the townships of East Hempfield, West Hempfield, and Mount Joy. The borough is also located near the Susquehanna River, which provides a scenic backdrop to the borough.
The borough has a total area of 1.2 square miles, all of which is land. The borough is located at an elevation of approximately 500 feet above sea level. The climate in the borough is characterized by hot, humid summers and cold, snowy winters.
Economy
The economy of Mountville Borough is largely based on small businesses and local services. The borough is home to a variety of businesses, including a grocery store, a hardware store, a pharmacy, and several restaurants. The borough is also home to a number of parks and recreational areas, including a public pool, a playground, and a walking trail.
The borough is also home to a number of manufacturing and industrial businesses. These businesses include a printing company, a plastics manufacturer, and a metal fabrication company. The borough is also home to a number of professional services, such as accounting firms, law firms, and medical offices.
Demographics
As of the 2010 census, the population of Mountville Borough was 2,000. The racial makeup of the borough was 95.2% White, 1.2% African American, 0.4% Native American, 0.8% Asian, 0.2% from other races, and 2.4% from two or more races. Hispanic or Latino of any race were 1.2% of the population.
The median household income in the borough was $50,000, and the median family income was $60,000. The per capita income in the borough was $25,000. Approximately 8.5% of the population was below the poverty line.
Conclusion
Mountville Borough is a small borough located in southeastern Lancaster County, Pennsylvania. The borough is home to a population of approximately 2,000 people and is known for its small-town charm and rural atmosphere. The borough is home to a variety of businesses, including a grocery store, a hardware store, a pharmacy, and several restaurants. The borough is also home to a number of parks and recreational areas, including a public pool, a playground, and a walking trail. The economy of the borough is largely based on small businesses and local services. The racial makeup of the borough is predominantly White, with a small percentage of African American, Native American, Asian, and other races. The median household income in the borough is $50,000, and the median family income is $60,000.
Common Questions
What is Per Capita Income in Mountville borough?
Per Capita income in Mountville borough is $38,971.
What is the Median Family Income in Mountville borough?
Median Family Income in Mountville borough is $103,553.
What is the Median Household income in Mountville borough?
Median Household Income in Mountville borough is $83,578.
What is Income or Wage Gap in Mountville borough?
Income or Wage Gap in Mountville borough is 36.8%.
Women in Mountville borough earn 63.2 cents for every dollar earned by a man.
What is Inequality or Gini Index in Mountville borough?
Inequality or Gini Index in Mountville borough is 0.35.
What is the Total Population of Mountville borough?
Total Population of Mountville borough is 3,002.
What is the Total Male Population of Mountville borough?
Total Male Population of Mountville borough is 1,478.
What is the Total Female Population of Mountville borough?
Total Female Population of Mountville borough is 1,524.
What is the Ratio of Males per 100 Females in Mountville borough?
There are 96.98 Males per 100 Females in Mountville borough.
What is the Ratio of Females per 100 Males in Mountville borough?
There are 103.11 Females per 100 Males in Mountville borough.
What is the Median Population Age in Mountville borough?
Median Population Age in Mountville borough is 45.9 Years.
What is the Average Family Size in Mountville borough
Average Family Size in Mountville borough is 2.8 People.
What is the Average Household Size in Mountville borough
Average Household Size in Mountville borough is 2.1 People.
How Large is the Labor Force in Mountville borough?
There are 1,548 People in the Labor Forcein in Mountville borough.
What is the Percentage of People in the Labor Force in Mountville borough?
62.1% of People are in the Labor Force in Mountville borough.
What is the Unemployment Rate in Mountville borough?
Unemployment Rate in Mountville borough is 1.1%.