South Greensburg borough, PA Map & Demographics
South Greensburg borough Overview
$33,188
PER CAPITA INCOME
$70,341
AVG FAMILY INCOME
$58,952
AVG HOUSEHOLD INCOME
36.5%
WAGE / INCOME GAP [ % ]
63.5¢/ $1
WAGE / INCOME GAP [ $ ]
0.39
INEQUALITY / GINI INDEX
2,282
TOTAL POPULATION
1,107
MALE POPULATION
1,175
FEMALE POPULATION
94.21
MALES / 100 FEMALES
106.14
FEMALES / 100 MALES
44.4
MEDIAN AGE
2.9
AVG FAMILY SIZE
2.0
AVG HOUSEHOLD SIZE
1,158
LABOR FORCE [ PEOPLE ]
56.6%
PERCENT IN LABOR FORCE
2.8%
UNEMPLOYMENT RATE
Income in South Greensburg borough
Income Overview in South Greensburg borough
Per Capita Income in South Greensburg borough is $33,188, while median incomes of families and households are $70,341 and $58,952 respectively.
| Characteristic | Number | Measure |
| Per Capita Income | 2,282 | $33,188 |
| Median Family Income | 553 | $70,341 |
| Mean Family Income | 553 | $88,682 |
| Median Household Income | 1,129 | $58,952 |
| Mean Household Income | 1,129 | $65,762 |
| Income Deficit | 553 | $0 |
| Wage / Income Gap (%) | 2,282 | 36.46% |
| Wage / Income Gap ($) | 2,282 | 63.54¢ per $1 |
| Gini / Inequality Index | 2,282 | 0.39 |
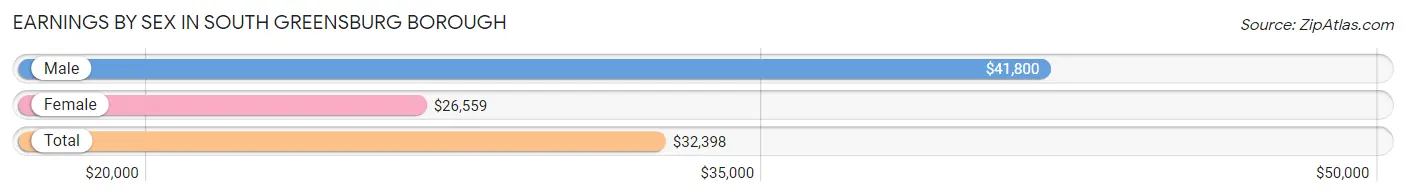
Earnings by Sex in South Greensburg borough
Average Earnings in South Greensburg borough are $32,398, $41,800 for men and $26,559 for women, a difference of 36.5%.
| Sex | Number | Average Earnings |
| Male | 678 (51.2%) | $41,800 |
| Female | 645 (48.7%) | $26,559 |
| Total | 1,323 (100.0%) | $32,398 |
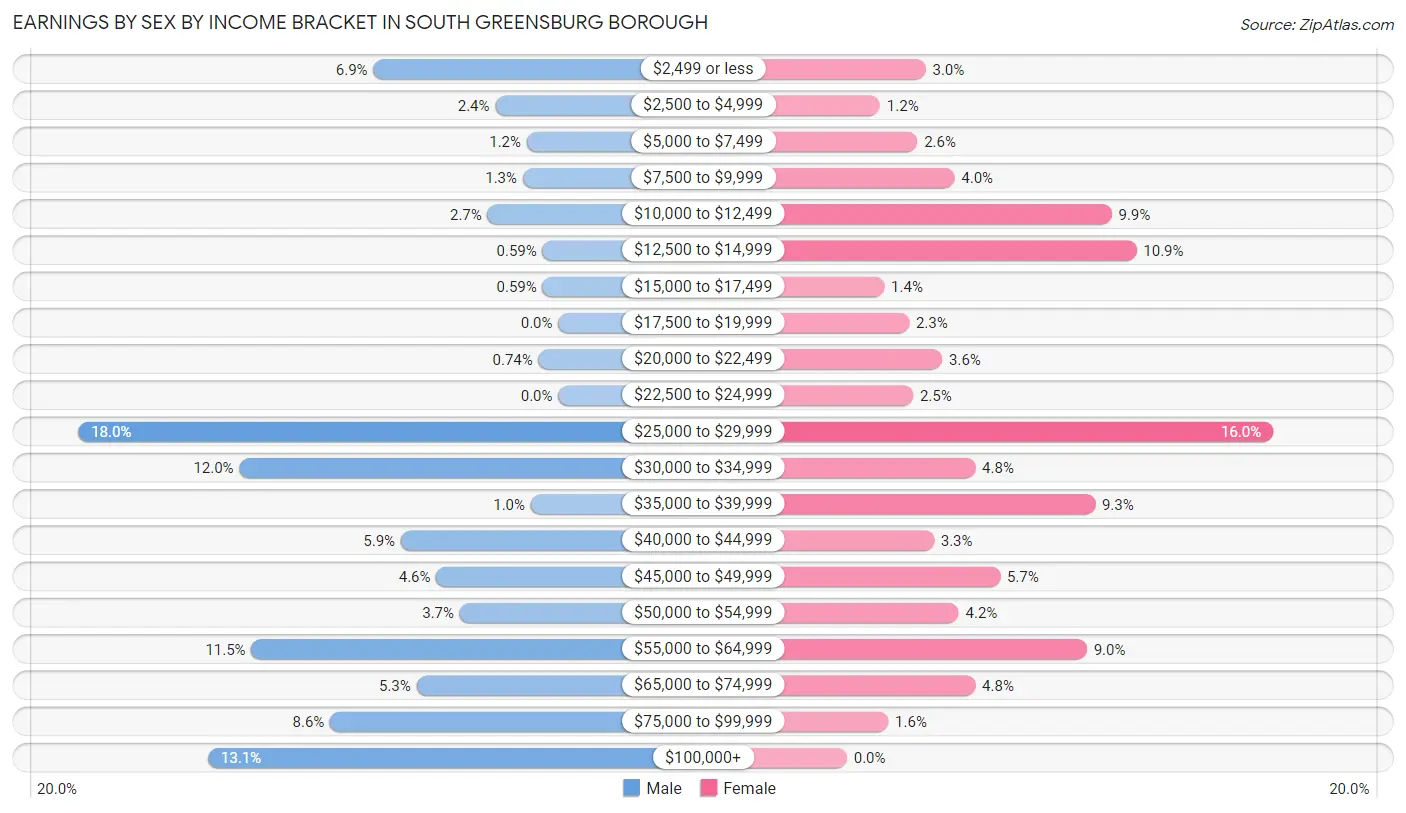
Earnings by Sex by Income Bracket in South Greensburg borough
The most common earnings brackets in South Greensburg borough are $25,000 to $29,999 for men (122 | 18.0%) and $25,000 to $29,999 for women (103 | 16.0%).
| Income | Male | Female |
| $2,499 or less | 47 (6.9%) | 19 (2.9%) |
| $2,500 to $4,999 | 16 (2.4%) | 8 (1.2%) |
| $5,000 to $7,499 | 8 (1.2%) | 17 (2.6%) |
| $7,500 to $9,999 | 9 (1.3%) | 26 (4.0%) |
| $10,000 to $12,499 | 18 (2.6%) | 64 (9.9%) |
| $12,500 to $14,999 | 4 (0.6%) | 70 (10.8%) |
| $15,000 to $17,499 | 4 (0.6%) | 9 (1.4%) |
| $17,500 to $19,999 | 0 (0.0%) | 15 (2.3%) |
| $20,000 to $22,499 | 5 (0.7%) | 23 (3.6%) |
| $22,500 to $24,999 | 0 (0.0%) | 16 (2.5%) |
| $25,000 to $29,999 | 122 (18.0%) | 103 (16.0%) |
| $30,000 to $34,999 | 81 (11.9%) | 31 (4.8%) |
| $35,000 to $39,999 | 7 (1.0%) | 60 (9.3%) |
| $40,000 to $44,999 | 40 (5.9%) | 21 (3.3%) |
| $45,000 to $49,999 | 31 (4.6%) | 37 (5.7%) |
| $50,000 to $54,999 | 25 (3.7%) | 27 (4.2%) |
| $55,000 to $64,999 | 78 (11.5%) | 58 (9.0%) |
| $65,000 to $74,999 | 36 (5.3%) | 31 (4.8%) |
| $75,000 to $99,999 | 58 (8.6%) | 10 (1.5%) |
| $100,000+ | 89 (13.1%) | 0 (0.0%) |
| Total | 678 (100.0%) | 645 (100.0%) |
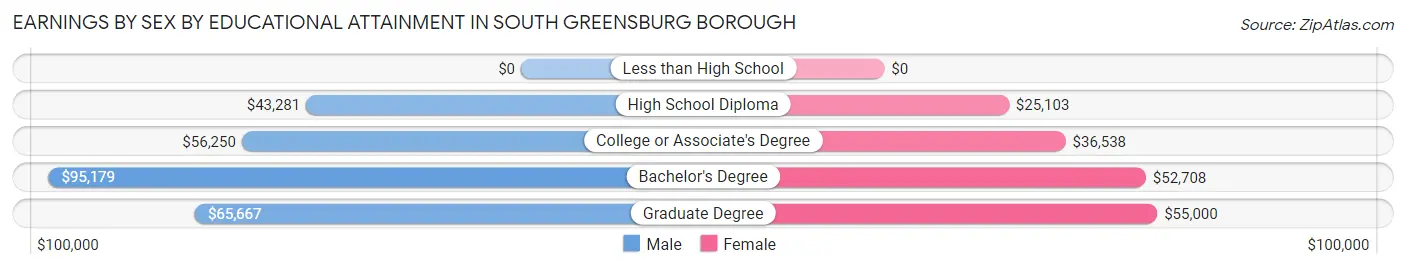
Earnings by Sex by Educational Attainment in South Greensburg borough
Average earnings in South Greensburg borough are $48,688 for men and $27,275 for women, a difference of 44.0%. Men with an educational attainment of bachelor's degree enjoy the highest average annual earnings of $95,179, while those with high school diploma education earn the least with $43,281. Women with an educational attainment of graduate degree earn the most with the average annual earnings of $55,000, while those with high school diploma education have the smallest earnings of $25,103.
| Educational Attainment | Male Income | Female Income |
| Less than High School | - | - |
| High School Diploma | $43,281 | $25,103 |
| College or Associate's Degree | $56,250 | $36,538 |
| Bachelor's Degree | $95,179 | $52,708 |
| Graduate Degree | $65,667 | $55,000 |
| Total | $48,688 | $27,275 |
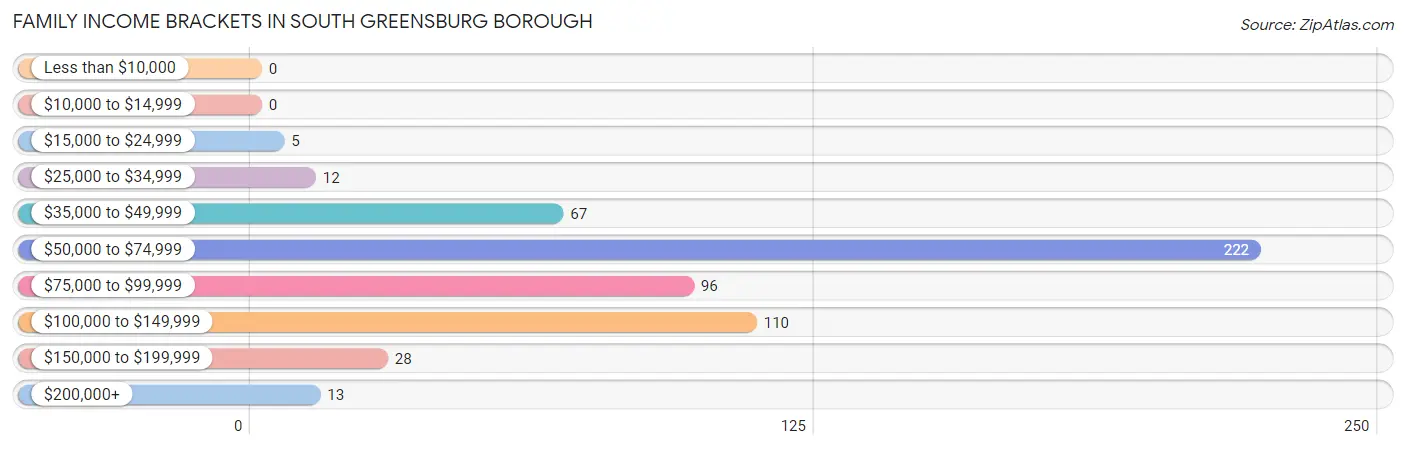
Family Income in South Greensburg borough
Family Income Brackets in South Greensburg borough
According to the South Greensburg borough family income data, there are 222 families falling into the $50,000 to $74,999 income range, which is the most common income bracket and makes up 40.1% of all families.
| Income Bracket | # Families | % Families |
| Less than $10,000 | 0 | 0.0% |
| $10,000 to $14,999 | 0 | 0.0% |
| $15,000 to $24,999 | 5 | 0.9% |
| $25,000 to $34,999 | 12 | 2.2% |
| $35,000 to $49,999 | 67 | 12.1% |
| $50,000 to $74,999 | 222 | 40.1% |
| $75,000 to $99,999 | 96 | 17.4% |
| $100,000 to $149,999 | 110 | 19.9% |
| $150,000 to $199,999 | 28 | 5.1% |
| $200,000+ | 13 | 2.4% |
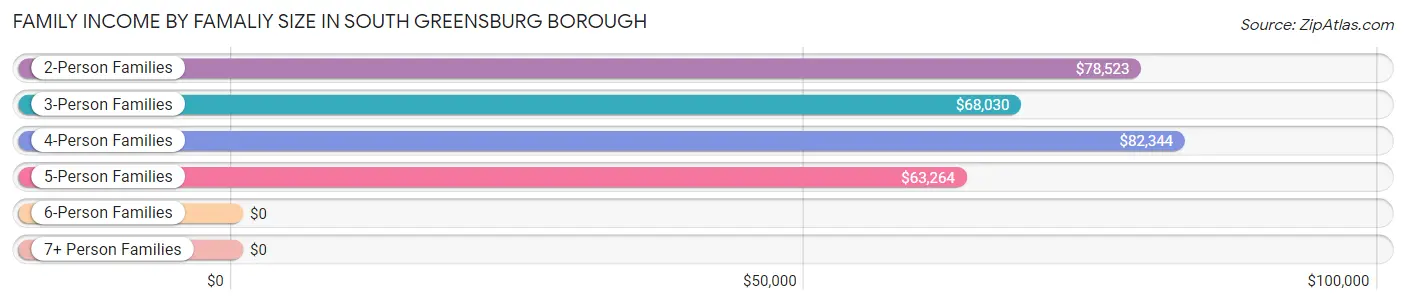
Family Income by Famaliy Size in South Greensburg borough
4-person families (65 | 11.7%) account for the highest median family income in South Greensburg borough with $82,344 per family, while 2-person families (241 | 43.6%) have the highest median income of $39,262 per family member.
| Income Bracket | # Families | Median Income |
| 2-Person Families | 241 (43.6%) | $78,523 |
| 3-Person Families | 210 (38.0%) | $68,030 |
| 4-Person Families | 65 (11.7%) | $82,344 |
| 5-Person Families | 37 (6.7%) | $63,264 |
| 6-Person Families | 0 (0.0%) | $0 |
| 7+ Person Families | 0 (0.0%) | $0 |
| Total | 553 (100.0%) | $70,341 |
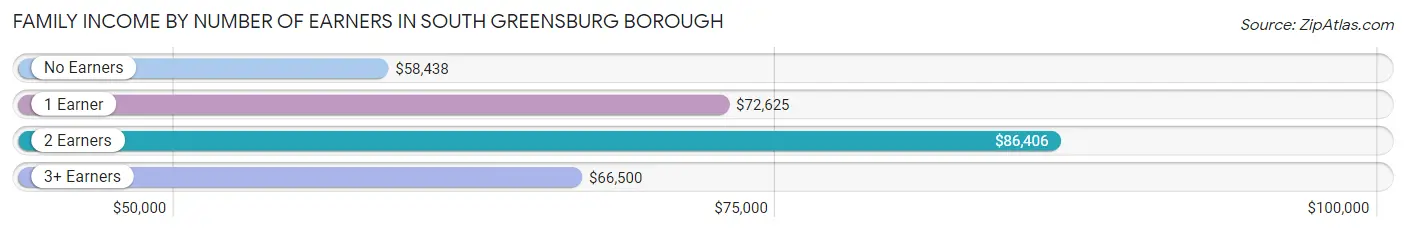
Family Income by Number of Earners in South Greensburg borough
The median family income in South Greensburg borough is $70,341, with families comprising 2 earners (213) having the highest median family income of $86,406, while families with no earners (103) have the lowest median family income of $58,438, accounting for 38.5% and 18.6% of families, respectively.
| Number of Earners | # Families | Median Income |
| No Earners | 103 (18.6%) | $58,438 |
| 1 Earner | 125 (22.6%) | $72,625 |
| 2 Earners | 213 (38.5%) | $86,406 |
| 3+ Earners | 112 (20.3%) | $66,500 |
| Total | 553 (100.0%) | $70,341 |
Household Income in South Greensburg borough
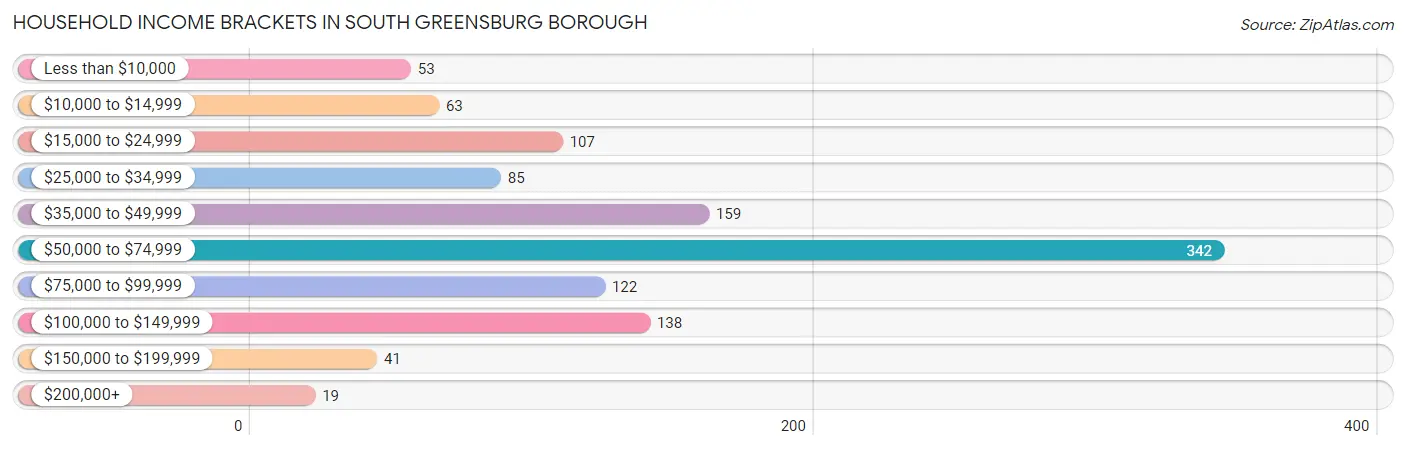
Household Income Brackets in South Greensburg borough
With 342 households falling in the category, the $50,000 to $74,999 income range is the most frequent in South Greensburg borough, accounting for 30.3% of all households. In contrast, only 19 households (1.7%) fall into the $200,000+ income bracket, making it the least populous group.
| Income Bracket | # Households | % Households |
| Less than $10,000 | 53 | 4.7% |
| $10,000 to $14,999 | 63 | 5.6% |
| $15,000 to $24,999 | 107 | 9.5% |
| $25,000 to $34,999 | 85 | 7.5% |
| $35,000 to $49,999 | 159 | 14.1% |
| $50,000 to $74,999 | 342 | 30.3% |
| $75,000 to $99,999 | 122 | 10.8% |
| $100,000 to $149,999 | 138 | 12.2% |
| $150,000 to $199,999 | 41 | 3.6% |
| $200,000+ | 19 | 1.7% |
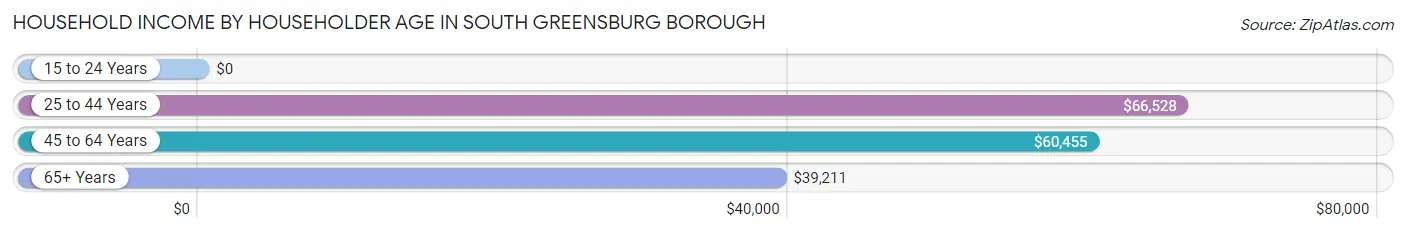
Household Income by Householder Age in South Greensburg borough
The median household income in South Greensburg borough is $58,952, with the highest median household income of $66,528 found in the 25 to 44 years age bracket for the primary householder. A total of 326 households (28.9%) fall into this category. Meanwhile, the 15 to 24 years age bracket for the primary householder has the lowest median household income of $0, with 17 households (1.5%) in this group.
| Income Bracket | # Households | Median Income |
| 15 to 24 Years | 17 (1.5%) | $0 |
| 25 to 44 Years | 326 (28.9%) | $66,528 |
| 45 to 64 Years | 482 (42.7%) | $60,455 |
| 65+ Years | 304 (26.9%) | $39,211 |
| Total | 1,129 (100.0%) | $58,952 |
Poverty in South Greensburg borough
Income Below Poverty by Sex and Age in South Greensburg borough
With 6.1% poverty level for males and 7.7% for females among the residents of South Greensburg borough, 45 to 54 year old males and 18 to 24 year old females are the most vulnerable to poverty, with 46 males (34.1%) and 25 females (29.1%) in their respective age groups living below the poverty level.
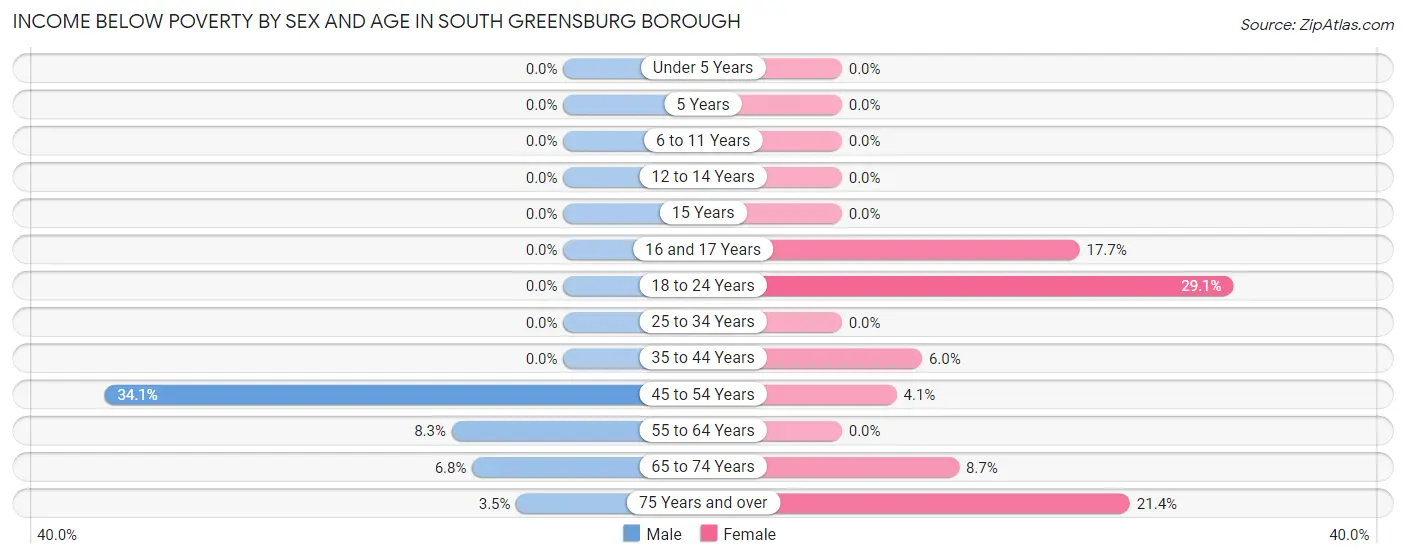
| Age Bracket | Male | Female |
| Under 5 Years | 0 (0.0%) | 0 (0.0%) |
| 5 Years | 0 (0.0%) | 0 (0.0%) |
| 6 to 11 Years | 0 (0.0%) | 0 (0.0%) |
| 12 to 14 Years | 0 (0.0%) | 0 (0.0%) |
| 15 Years | 0 (0.0%) | 0 (0.0%) |
| 16 and 17 Years | 0 (0.0%) | 3 (17.6%) |
| 18 to 24 Years | 0 (0.0%) | 25 (29.1%) |
| 25 to 34 Years | 0 (0.0%) | 0 (0.0%) |
| 35 to 44 Years | 0 (0.0%) | 5 (5.9%) |
| 45 to 54 Years | 46 (34.1%) | 7 (4.1%) |
| 55 to 64 Years | 13 (8.3%) | 0 (0.0%) |
| 65 to 74 Years | 5 (6.8%) | 10 (8.7%) |
| 75 Years and over | 3 (3.5%) | 40 (21.4%) |
| Total | 67 (6.1%) | 90 (7.7%) |
Income Above Poverty by Sex and Age in South Greensburg borough
According to the poverty statistics in South Greensburg borough, males aged under 5 years and females aged under 5 years are the age groups that are most secure financially, with 100.0% of males and 100.0% of females in these age groups living above the poverty line.
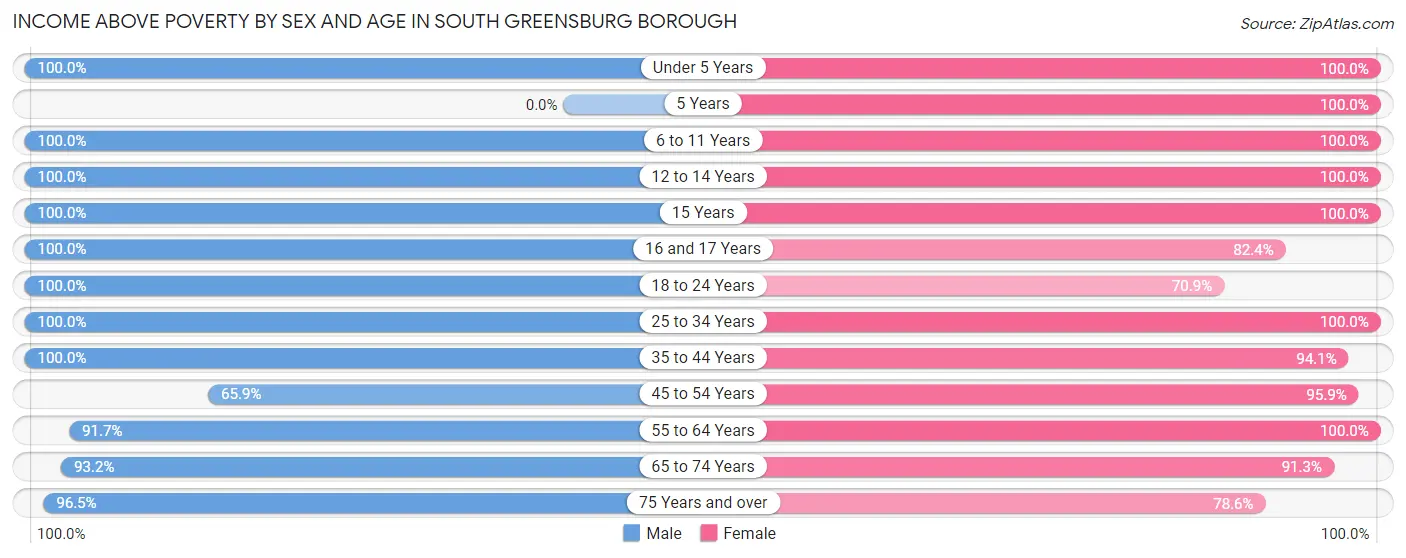
| Age Bracket | Male | Female |
| Under 5 Years | 96 (100.0%) | 23 (100.0%) |
| 5 Years | 0 (0.0%) | 5 (100.0%) |
| 6 to 11 Years | 10 (100.0%) | 8 (100.0%) |
| 12 to 14 Years | 13 (100.0%) | 59 (100.0%) |
| 15 Years | 6 (100.0%) | 6 (100.0%) |
| 16 and 17 Years | 52 (100.0%) | 14 (82.4%) |
| 18 to 24 Years | 88 (100.0%) | 61 (70.9%) |
| 25 to 34 Years | 235 (100.0%) | 209 (100.0%) |
| 35 to 44 Years | 145 (100.0%) | 79 (94.1%) |
| 45 to 54 Years | 89 (65.9%) | 165 (95.9%) |
| 55 to 64 Years | 144 (91.7%) | 204 (100.0%) |
| 65 to 74 Years | 69 (93.2%) | 105 (91.3%) |
| 75 Years and over | 83 (96.5%) | 147 (78.6%) |
| Total | 1,030 (93.9%) | 1,085 (92.3%) |
Income Below Poverty Among Married-Couple Families in South Greensburg borough
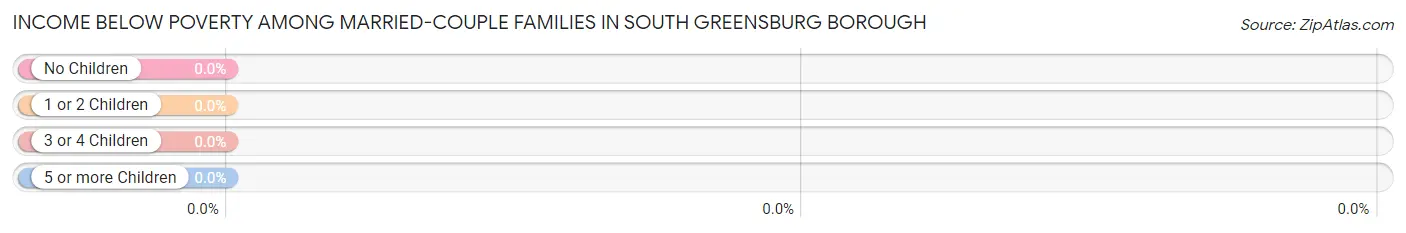
| Children | Above Poverty | Below Poverty |
| No Children | 236 (100.0%) | 0 (0.0%) |
| 1 or 2 Children | 165 (100.0%) | 0 (0.0%) |
| 3 or 4 Children | 0 (0.0%) | 0 (0.0%) |
| 5 or more Children | 0 (0.0%) | 0 (0.0%) |
| Total | 401 (100.0%) | 0 (0.0%) |
Income Below Poverty Among Single-Parent Households in South Greensburg borough
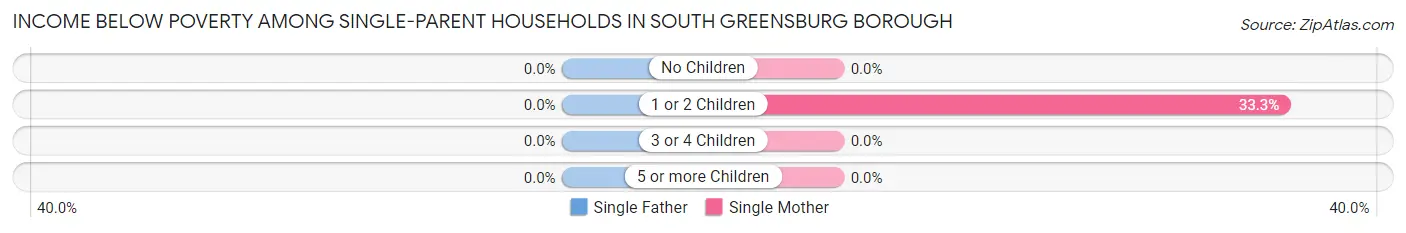
| Children | Single Father | Single Mother |
| No Children | 0 (0.0%) | 0 (0.0%) |
| 1 or 2 Children | 0 (0.0%) | 5 (33.3%) |
| 3 or 4 Children | 0 (0.0%) | 0 (0.0%) |
| 5 or more Children | 0 (0.0%) | 0 (0.0%) |
| Total | 0 (0.0%) | 5 (3.9%) |
Income Below Poverty Among Married-Couple vs Single-Parent Households in South Greensburg borough
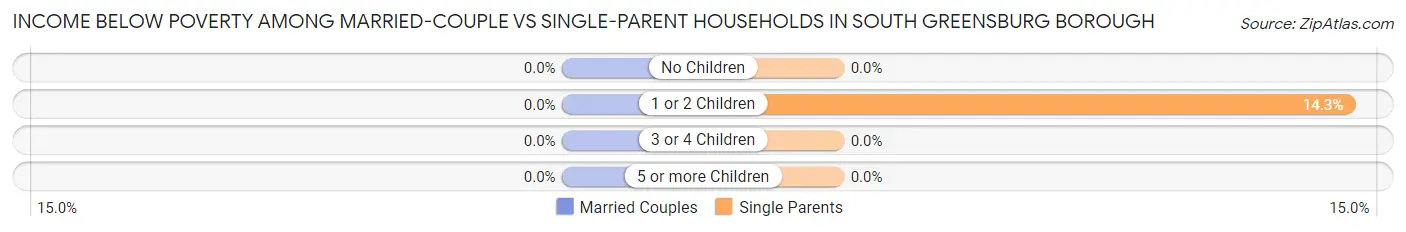
| Children | Married-Couple Families | Single-Parent Households |
| No Children | 0 (0.0%) | 0 (0.0%) |
| 1 or 2 Children | 0 (0.0%) | 5 (14.3%) |
| 3 or 4 Children | 0 (0.0%) | 0 (0.0%) |
| 5 or more Children | 0 (0.0%) | 0 (0.0%) |
| Total | 0 (0.0%) | 5 (3.3%) |
Race in South Greensburg borough
The most populous races in South Greensburg borough are White / Caucasian (2,171 | 95.1%), Hispanic or Latino (85 | 3.7%), and Some other Race (63 | 2.8%).
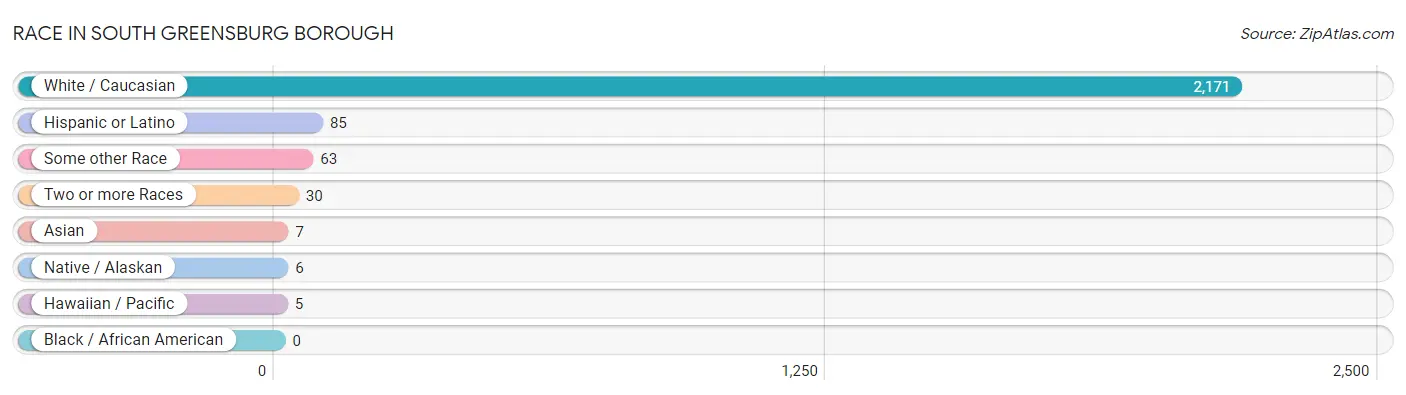
| Race | # Population | % Population |
| Asian | 7 | 0.3% |
| Black / African American | 0 | 0.0% |
| Hawaiian / Pacific | 5 | 0.2% |
| Hispanic or Latino | 85 | 3.7% |
| Native / Alaskan | 6 | 0.3% |
| White / Caucasian | 2,171 | 95.1% |
| Two or more Races | 30 | 1.3% |
| Some other Race | 63 | 2.8% |
| Total | 2,282 | 100.0% |
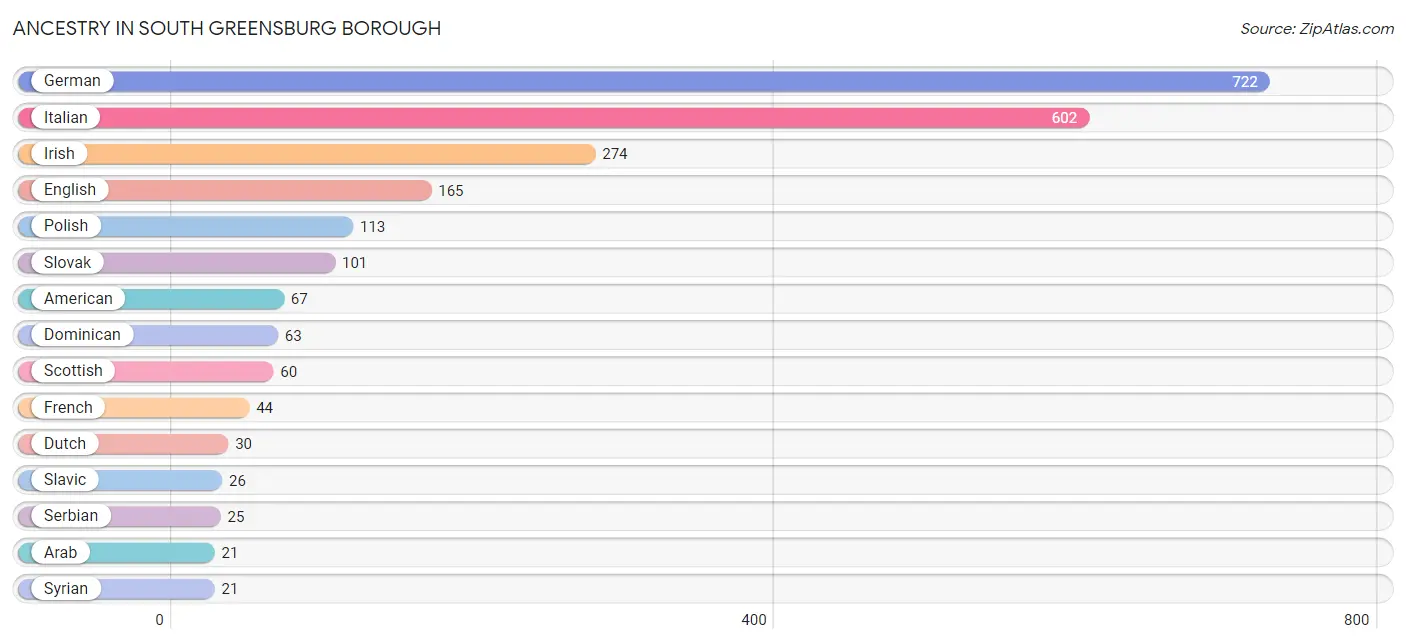
Ancestry in South Greensburg borough
The most populous ancestries reported in South Greensburg borough are German (722 | 31.6%), Italian (602 | 26.4%), Irish (274 | 12.0%), English (165 | 7.2%), and Polish (113 | 5.0%), together accounting for 82.2% of all South Greensburg borough residents.
| Ancestry | # Population | % Population |
| American | 67 | 2.9% |
| Arab | 21 | 0.9% |
| Austrian | 3 | 0.1% |
| Bolivian | 1 | 0.0% |
| British | 7 | 0.3% |
| Burmese | 5 | 0.2% |
| Cherokee | 10 | 0.4% |
| Croatian | 7 | 0.3% |
| Czech | 15 | 0.7% |
| Delaware | 6 | 0.3% |
| Dominican | 63 | 2.8% |
| Dutch | 30 | 1.3% |
| English | 165 | 7.2% |
| Finnish | 5 | 0.2% |
| French | 44 | 1.9% |
| German | 722 | 31.6% |
| Hungarian | 16 | 0.7% |
| Irish | 274 | 12.0% |
| Italian | 602 | 26.4% |
| Native Hawaiian | 5 | 0.2% |
| Northern European | 6 | 0.3% |
| Pennsylvania German | 4 | 0.2% |
| Polish | 113 | 5.0% |
| Puerto Rican | 5 | 0.2% |
| Russian | 10 | 0.4% |
| Scotch-Irish | 12 | 0.5% |
| Scottish | 60 | 2.6% |
| Serbian | 25 | 1.1% |
| Slavic | 26 | 1.1% |
| Slovak | 101 | 4.4% |
| Slovene | 17 | 0.7% |
| South American | 1 | 0.0% |
| Spaniard | 6 | 0.3% |
| Spanish | 10 | 0.4% |
| Swedish | 17 | 0.7% |
| Syrian | 21 | 0.9% |
| Thai | 7 | 0.3% |
| Ukrainian | 10 | 0.4% |
| Welsh | 14 | 0.6% | View All 39 Rows |
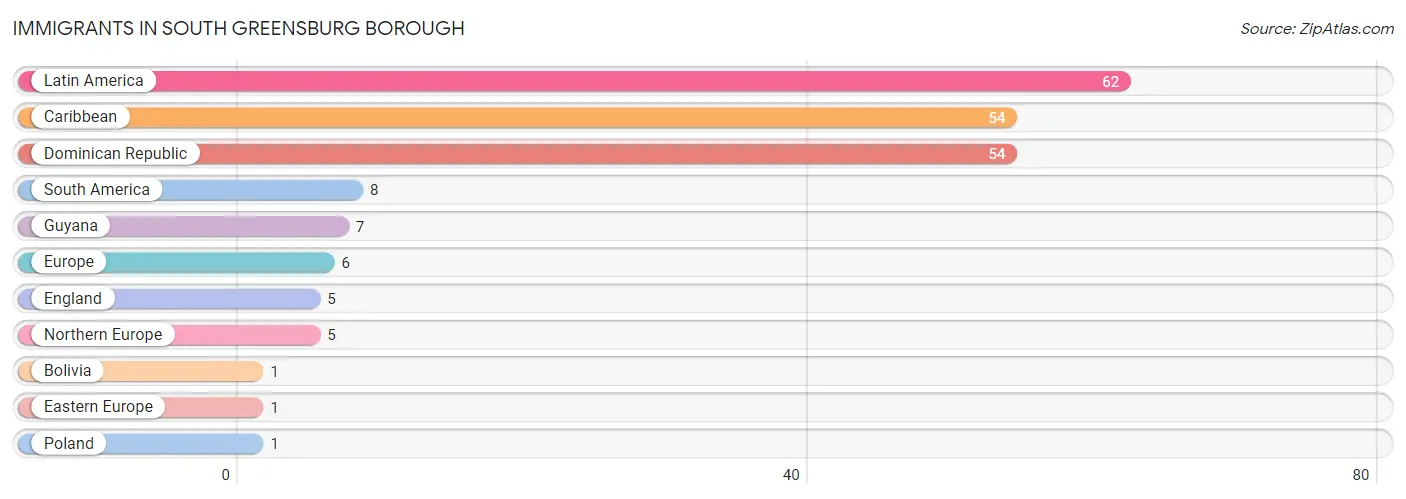
Immigrants in South Greensburg borough
The most numerous immigrant groups reported in South Greensburg borough came from Latin America (62 | 2.7%), Caribbean (54 | 2.4%), Dominican Republic (54 | 2.4%), South America (8 | 0.4%), and Guyana (7 | 0.3%), together accounting for 8.1% of all South Greensburg borough residents.
| Immigration Origin | # Population | % Population |
| Bolivia | 1 | 0.0% |
| Caribbean | 54 | 2.4% |
| Dominican Republic | 54 | 2.4% |
| Eastern Europe | 1 | 0.0% |
| England | 5 | 0.2% |
| Europe | 6 | 0.3% |
| Guyana | 7 | 0.3% |
| Latin America | 62 | 2.7% |
| Northern Europe | 5 | 0.2% |
| Poland | 1 | 0.0% |
| South America | 8 | 0.4% | View All 11 Rows |
Sex and Age in South Greensburg borough
Sex and Age in South Greensburg borough
The most populous age groups in South Greensburg borough are 25 to 29 Years (176 | 15.9%) for men and 25 to 29 Years (159 | 13.5%) for women.
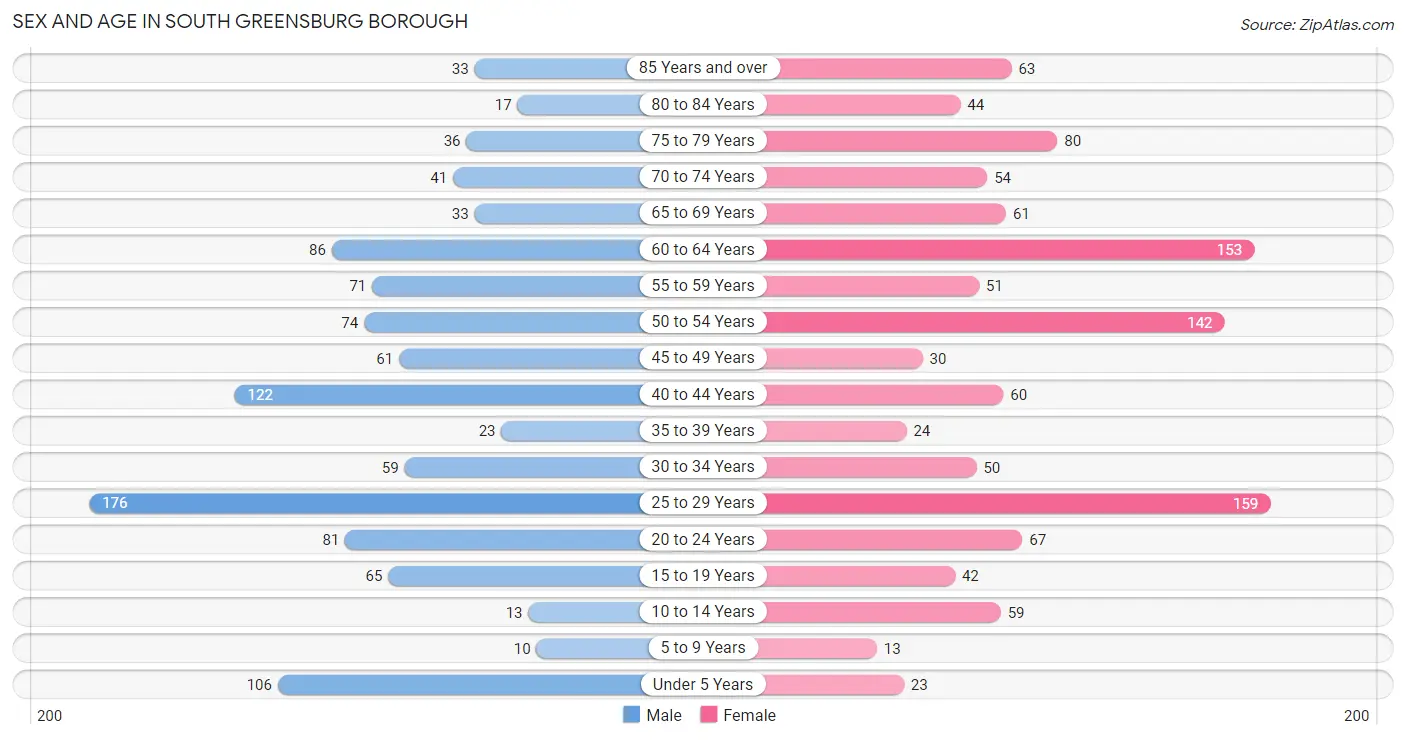
| Age Bracket | Male | Female |
| Under 5 Years | 106 (9.6%) | 23 (2.0%) |
| 5 to 9 Years | 10 (0.9%) | 13 (1.1%) |
| 10 to 14 Years | 13 (1.2%) | 59 (5.0%) |
| 15 to 19 Years | 65 (5.9%) | 42 (3.6%) |
| 20 to 24 Years | 81 (7.3%) | 67 (5.7%) |
| 25 to 29 Years | 176 (15.9%) | 159 (13.5%) |
| 30 to 34 Years | 59 (5.3%) | 50 (4.3%) |
| 35 to 39 Years | 23 (2.1%) | 24 (2.0%) |
| 40 to 44 Years | 122 (11.0%) | 60 (5.1%) |
| 45 to 49 Years | 61 (5.5%) | 30 (2.5%) |
| 50 to 54 Years | 74 (6.7%) | 142 (12.1%) |
| 55 to 59 Years | 71 (6.4%) | 51 (4.3%) |
| 60 to 64 Years | 86 (7.8%) | 153 (13.0%) |
| 65 to 69 Years | 33 (3.0%) | 61 (5.2%) |
| 70 to 74 Years | 41 (3.7%) | 54 (4.6%) |
| 75 to 79 Years | 36 (3.3%) | 80 (6.8%) |
| 80 to 84 Years | 17 (1.5%) | 44 (3.7%) |
| 85 Years and over | 33 (3.0%) | 63 (5.4%) |
| Total | 1,107 (100.0%) | 1,175 (100.0%) |
Families and Households in South Greensburg borough
Median Family Size in South Greensburg borough
The median family size in South Greensburg borough is 2.90 persons per family, with single female/mother families (129 | 23.3%) accounting for the largest median family size of 2.98 persons per family. On the other hand, single male/father families (23 | 4.2%) represent the smallest median family size with 2.65 persons per family.
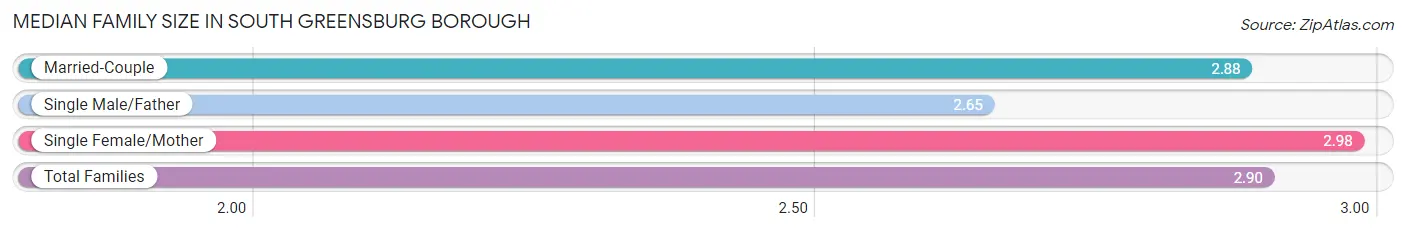
| Family Type | # Families | Family Size |
| Married-Couple | 401 (72.5%) | 2.88 |
| Single Male/Father | 23 (4.2%) | 2.65 |
| Single Female/Mother | 129 (23.3%) | 2.98 |
| Total Families | 553 (100.0%) | 2.90 |
Median Household Size in South Greensburg borough
The median household size in South Greensburg borough is 2.02 persons per household, with single female/mother households (129 | 11.4%) accounting for the largest median household size of 3.04 persons per household. non-family households (576 | 51.0%) represent the smallest median household size with 1.14 persons per household.
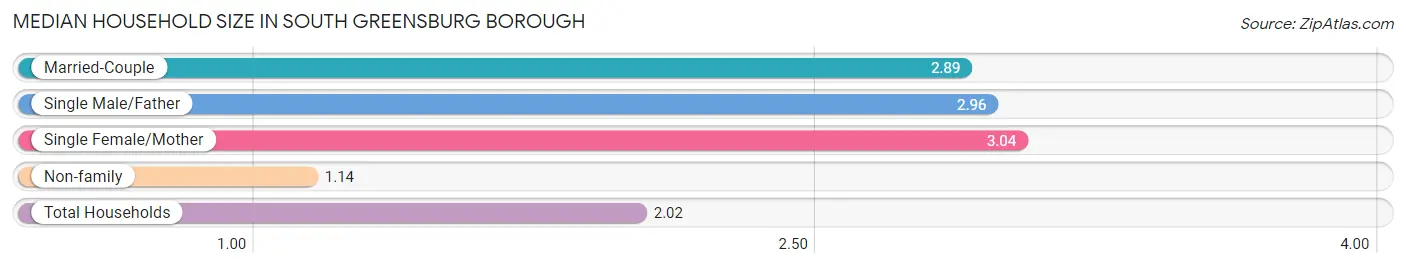
| Household Type | # Households | Household Size |
| Married-Couple | 401 (35.5%) | 2.89 |
| Single Male/Father | 23 (2.0%) | 2.96 |
| Single Female/Mother | 129 (11.4%) | 3.04 |
| Non-family | 576 (51.0%) | 1.14 |
| Total Households | 1,129 (100.0%) | 2.02 |
Household Size by Marriage Status in South Greensburg borough
Out of a total of 1,129 households in South Greensburg borough, 553 (49.0%) are family households, while 576 (51.0%) are nonfamily households. The most numerous type of family households are 2-person households, comprising 238, and the most common type of nonfamily households are 1-person households, comprising 519.
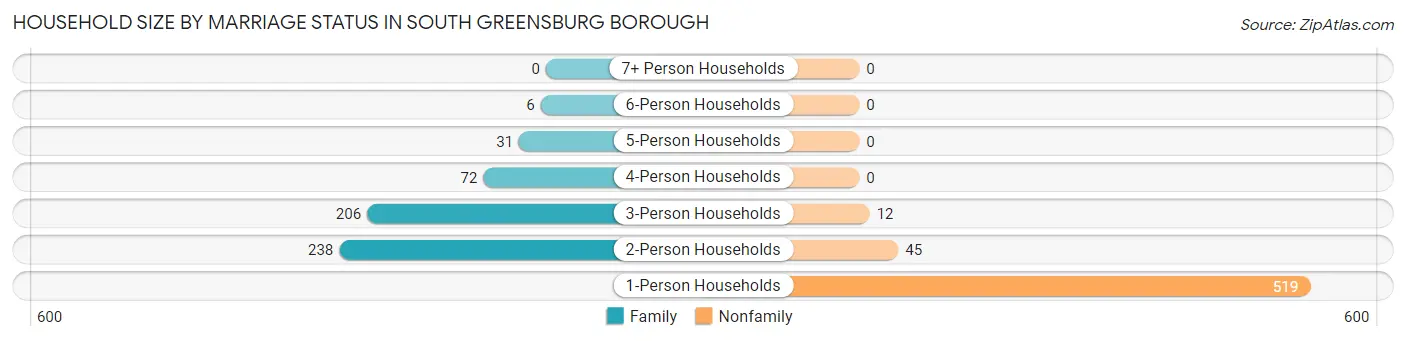
| Household Size | Family Households | Nonfamily Households |
| 1-Person Households | - | 519 (46.0%) |
| 2-Person Households | 238 (21.1%) | 45 (4.0%) |
| 3-Person Households | 206 (18.2%) | 12 (1.1%) |
| 4-Person Households | 72 (6.4%) | 0 (0.0%) |
| 5-Person Households | 31 (2.8%) | 0 (0.0%) |
| 6-Person Households | 6 (0.5%) | 0 (0.0%) |
| 7+ Person Households | 0 (0.0%) | 0 (0.0%) |
| Total | 553 (49.0%) | 576 (51.0%) |
Female Fertility in South Greensburg borough
Fertility by Age in South Greensburg borough
Average fertility rate in South Greensburg borough is 71.0 births per 1,000 women. Women in the age bracket of 20 to 34 years have the highest fertility rate with 116.0 births per 1,000 women. Women in the age bracket of 20 to 34 years acount for 100.0% of all women with births.
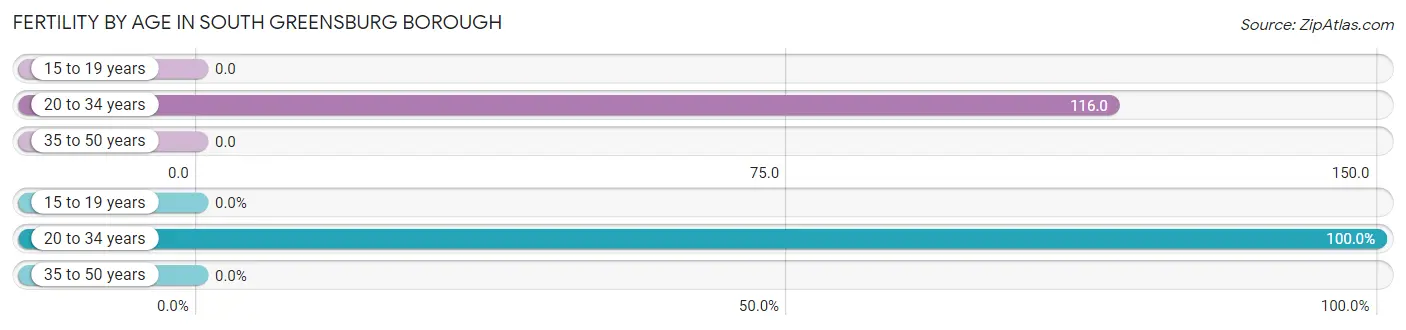
| Age Bracket | Women with Births | Births / 1,000 Women |
| 15 to 19 years | 0 (0.0%) | 0.0 |
| 20 to 34 years | 32 (100.0%) | 116.0 |
| 35 to 50 years | 0 (0.0%) | 0.0 |
| Total | 32 (100.0%) | 71.0 |
Fertility by Age by Marriage Status in South Greensburg borough
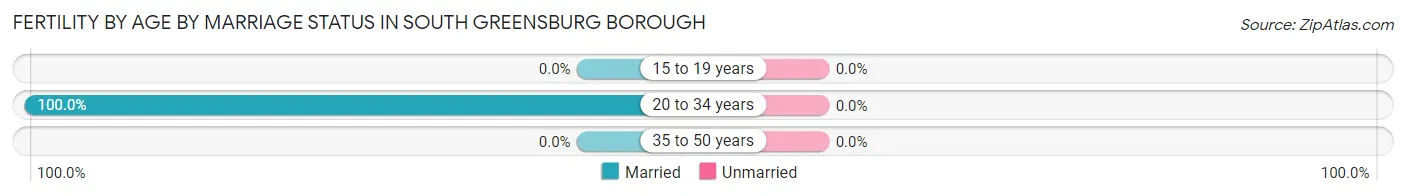
| Age Bracket | Married | Unmarried |
| 15 to 19 years | 0 (0.0%) | 0 (0.0%) |
| 20 to 34 years | 32 (100.0%) | 0 (0.0%) |
| 35 to 50 years | 0 (0.0%) | 0 (0.0%) |
| Total | 32 (100.0%) | 0 (0.0%) |
Fertility by Education in South Greensburg borough
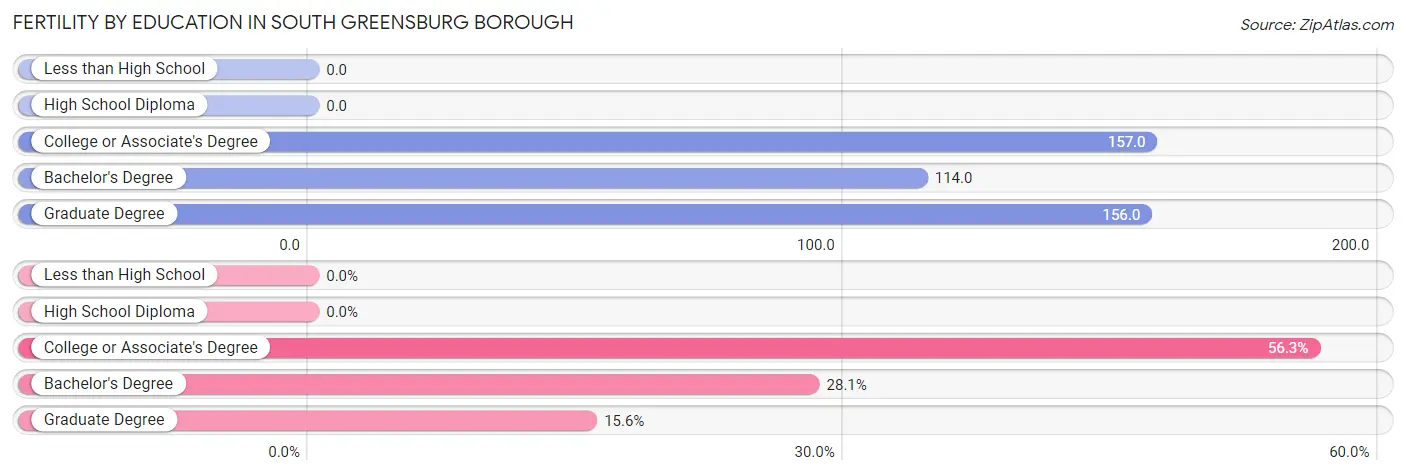
| Educational Attainment | Women with Births | Births / 1,000 Women |
| Less than High School | 0 (0.0%) | 0.0 |
| High School Diploma | 0 (0.0%) | 0.0 |
| College or Associate's Degree | 18 (56.2%) | 157.0 |
| Bachelor's Degree | 9 (28.1%) | 114.0 |
| Graduate Degree | 5 (15.6%) | 156.0 |
| Total | 32 (100.0%) | 71.0 |
Fertility by Education by Marriage Status in South Greensburg borough
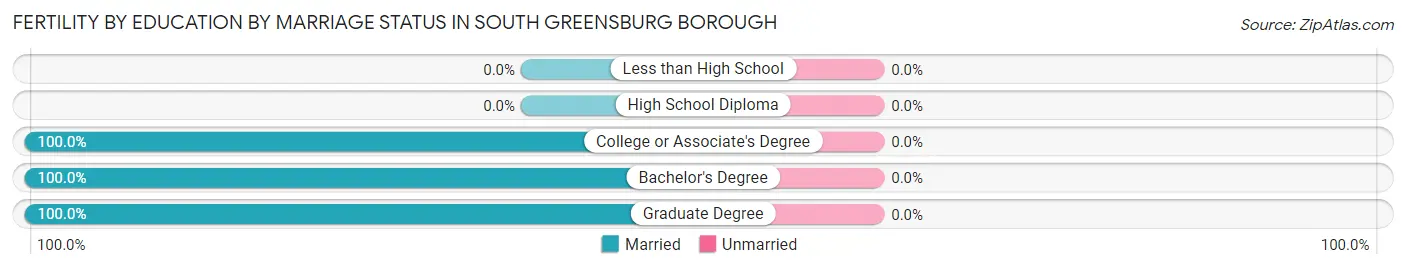
| Educational Attainment | Married | Unmarried |
| Less than High School | 0 (0.0%) | 0 (0.0%) |
| High School Diploma | 0 (0.0%) | 0 (0.0%) |
| College or Associate's Degree | 18 (100.0%) | 0 (0.0%) |
| Bachelor's Degree | 9 (100.0%) | 0 (0.0%) |
| Graduate Degree | 5 (100.0%) | 0 (0.0%) |
| Total | 32 (100.0%) | 0 (0.0%) |
Employment Characteristics in South Greensburg borough
Employment by Class of Employer in South Greensburg borough
Among the 1,115 employed individuals in South Greensburg borough, private company employees (783 | 70.2%), not-for-profit organizations (138 | 12.4%), and self-employed (not incorporated) (69 | 6.2%) make up the most common classes of employment.
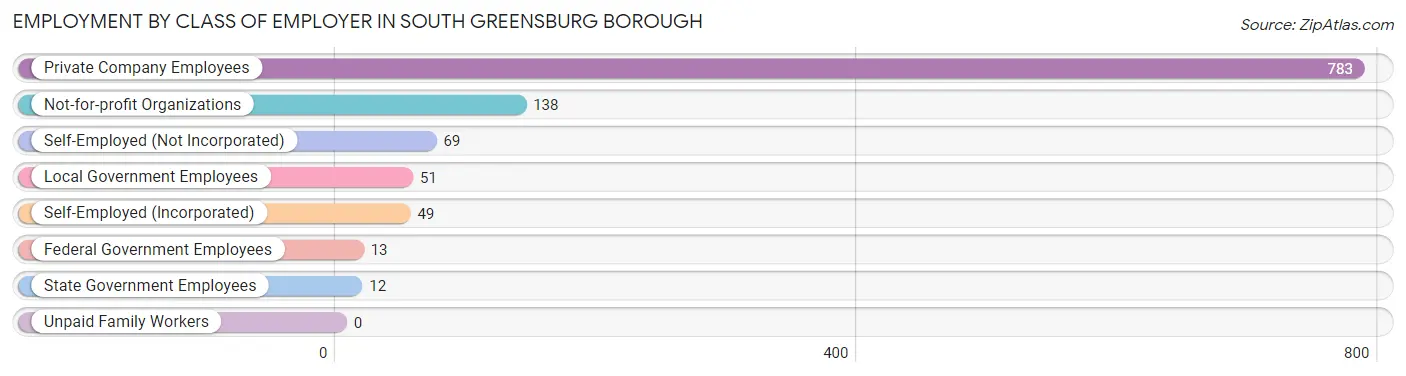
| Employer Class | # Employees | % Employees |
| Private Company Employees | 783 | 70.2% |
| Self-Employed (Incorporated) | 49 | 4.4% |
| Self-Employed (Not Incorporated) | 69 | 6.2% |
| Not-for-profit Organizations | 138 | 12.4% |
| Local Government Employees | 51 | 4.6% |
| State Government Employees | 12 | 1.1% |
| Federal Government Employees | 13 | 1.2% |
| Unpaid Family Workers | 0 | 0.0% |
| Total | 1,115 | 100.0% |
Employment Status by Age in South Greensburg borough
According to the labor force statistics for South Greensburg borough, out of the total population over 16 years of age (2,046), 56.6% or 1,158 individuals are in the labor force, with 2.8% or 32 of them unemployed. The age group with the highest labor force participation rate is 30 to 34 years, with 90.8% or 99 individuals in the labor force. Within the labor force, the 35 to 44 years age range has the highest percentage of unemployed individuals, with 9.1% or 18 of them being unemployed.
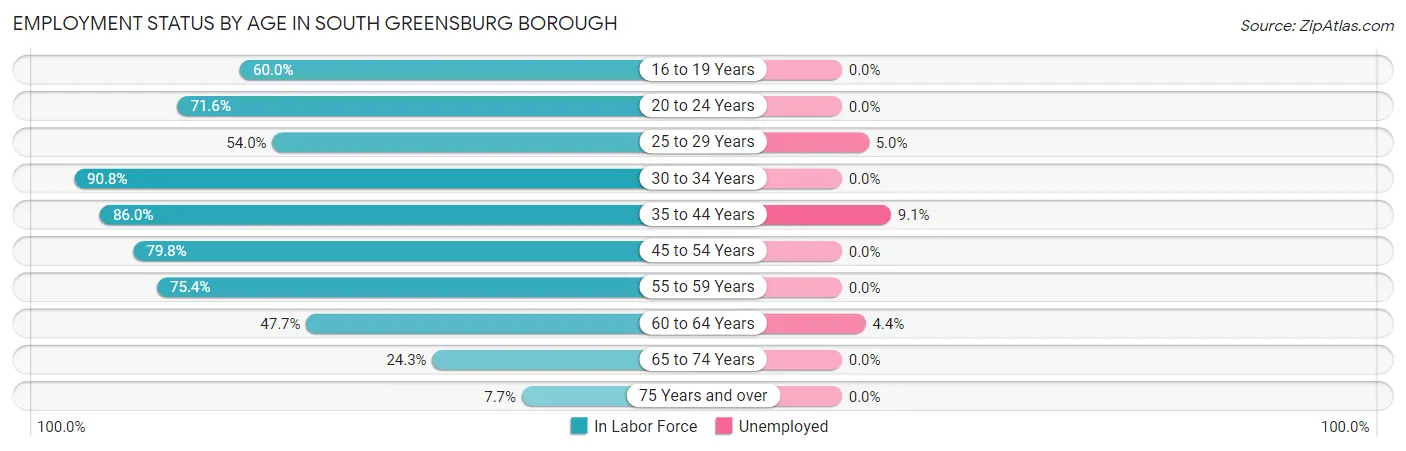
| Age Bracket | In Labor Force | Unemployed |
| 16 to 19 Years | 57 (60.0%) | 0 (0.0%) |
| 20 to 24 Years | 106 (71.6%) | 0 (0.0%) |
| 25 to 29 Years | 181 (54.0%) | 9 (5.0%) |
| 30 to 34 Years | 99 (90.8%) | 0 (0.0%) |
| 35 to 44 Years | 197 (86.0%) | 18 (9.1%) |
| 45 to 54 Years | 245 (79.8%) | 0 (0.0%) |
| 55 to 59 Years | 92 (75.4%) | 0 (0.0%) |
| 60 to 64 Years | 114 (47.7%) | 5 (4.4%) |
| 65 to 74 Years | 46 (24.3%) | 0 (0.0%) |
| 75 Years and over | 21 (7.7%) | 0 (0.0%) |
| Total | 1,158 (56.6%) | 32 (2.8%) |
Employment Status by Educational Attainment in South Greensburg borough
According to labor force statistics for South Greensburg borough, 69.2% of individuals (928) out of the total population between 25 and 64 years of age (1,341) are in the labor force, with 3.4% or 32 of them being unemployed. The group with the highest labor force participation rate are those with the educational attainment of less than high school, with 100.0% or 25 individuals in the labor force. Within the labor force, individuals with high school diploma education have the highest percentage of unemployment, with 5.2% or 19 of them being unemployed.
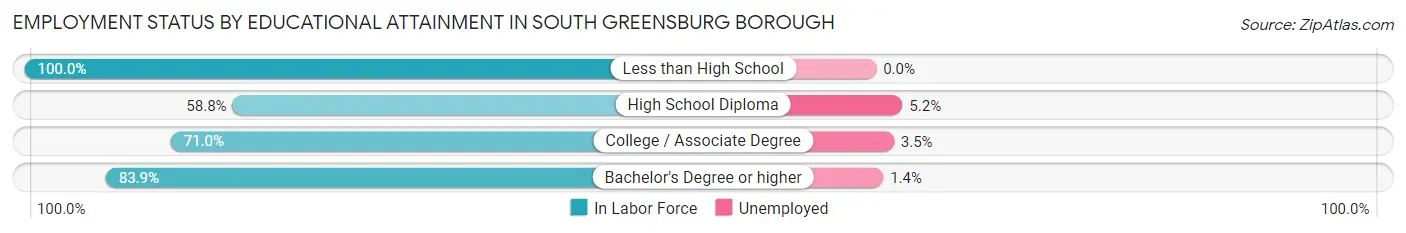
| Educational Attainment | In Labor Force | Unemployed |
| Less than High School | 25 (100.0%) | 0 (0.0%) |
| High School Diploma | 362 (58.8%) | 32 (5.2%) |
| College / Associate Degree | 255 (71.0%) | 13 (3.5%) |
| Bachelor's Degree or higher | 286 (83.9%) | 5 (1.4%) |
| Total | 928 (69.2%) | 46 (3.4%) |
Employment Occupations by Sex in South Greensburg borough
Management, Business, Science and Arts Occupations
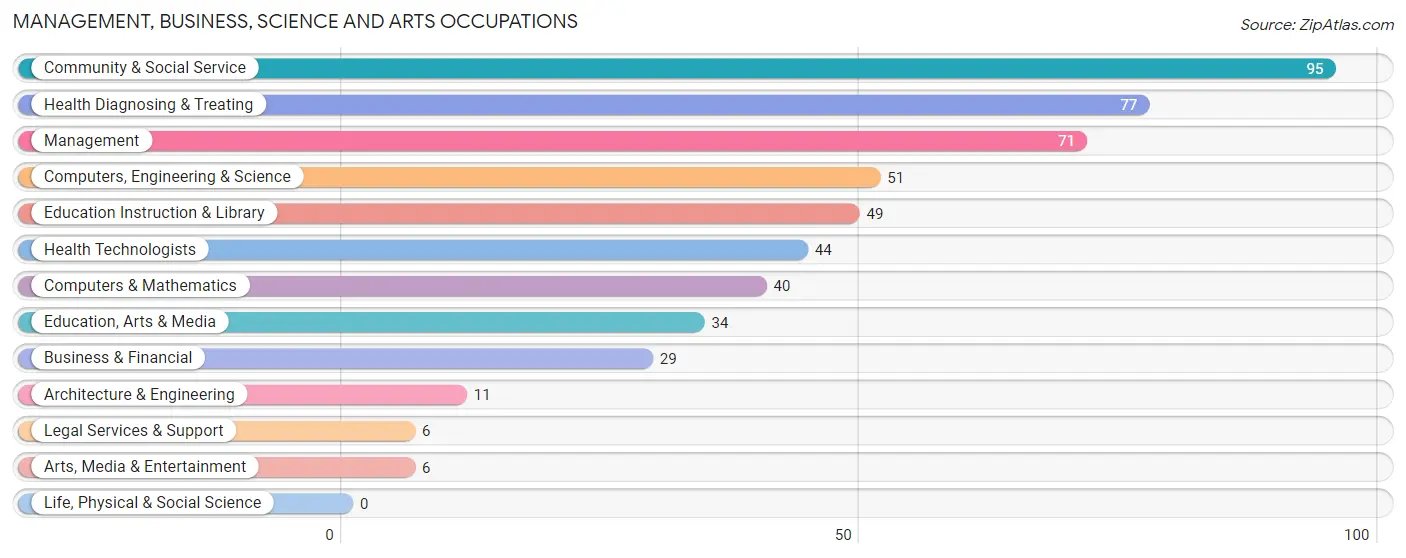
The most common Management, Business, Science and Arts occupations in South Greensburg borough are Community & Social Service (95 | 8.4%), Health Diagnosing & Treating (77 | 6.8%), Management (71 | 6.3%), Computers, Engineering & Science (51 | 4.5%), and Education Instruction & Library (49 | 4.3%).
Management, Business, Science and Arts Occupations by Sex
Within the Management, Business, Science and Arts occupations in South Greensburg borough, the most male-oriented occupations are Architecture & Engineering (100.0%), Arts, Media & Entertainment (100.0%), and Computers, Engineering & Science (92.2%), while the most female-oriented occupations are Legal Services & Support (100.0%), Education, Arts & Media (91.2%), and Health Technologists (79.5%).
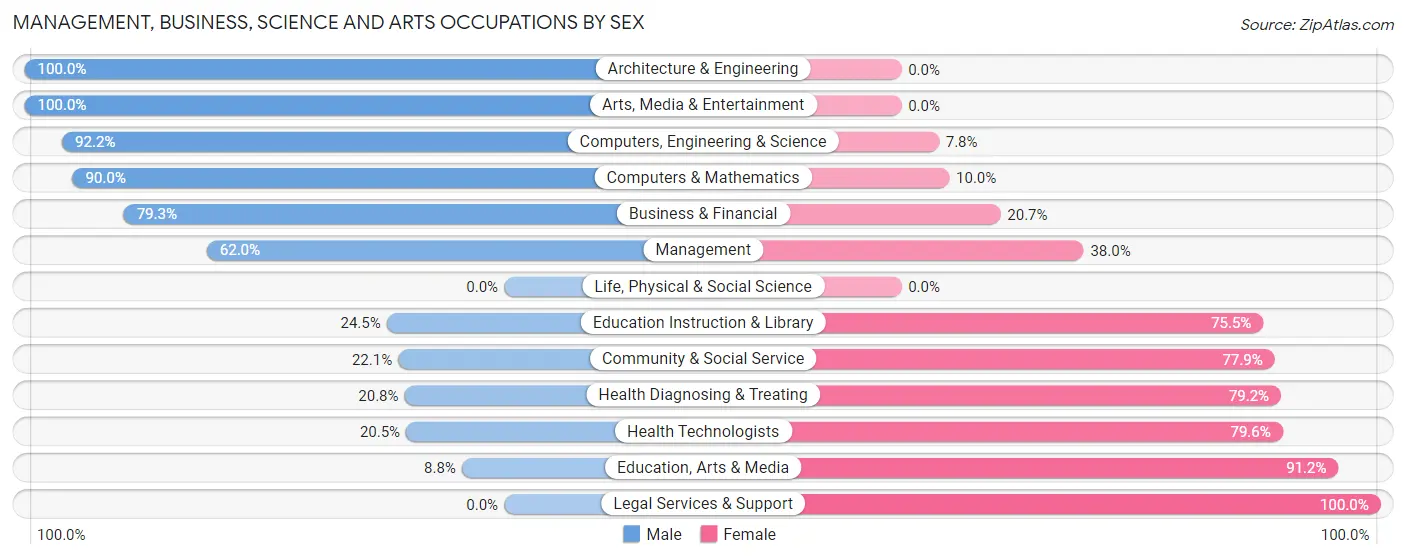
| Occupation | Male | Female |
| Management | 44 (62.0%) | 27 (38.0%) |
| Business & Financial | 23 (79.3%) | 6 (20.7%) |
| Computers, Engineering & Science | 47 (92.2%) | 4 (7.8%) |
| Computers & Mathematics | 36 (90.0%) | 4 (10.0%) |
| Architecture & Engineering | 11 (100.0%) | 0 (0.0%) |
| Life, Physical & Social Science | 0 (0.0%) | 0 (0.0%) |
| Community & Social Service | 21 (22.1%) | 74 (77.9%) |
| Education, Arts & Media | 3 (8.8%) | 31 (91.2%) |
| Legal Services & Support | 0 (0.0%) | 6 (100.0%) |
| Education Instruction & Library | 12 (24.5%) | 37 (75.5%) |
| Arts, Media & Entertainment | 6 (100.0%) | 0 (0.0%) |
| Health Diagnosing & Treating | 16 (20.8%) | 61 (79.2%) |
| Health Technologists | 9 (20.4%) | 35 (79.5%) |
| Total (Category) | 151 (46.8%) | 172 (53.2%) |
| Total (Overall) | 554 (49.2%) | 572 (50.8%) |
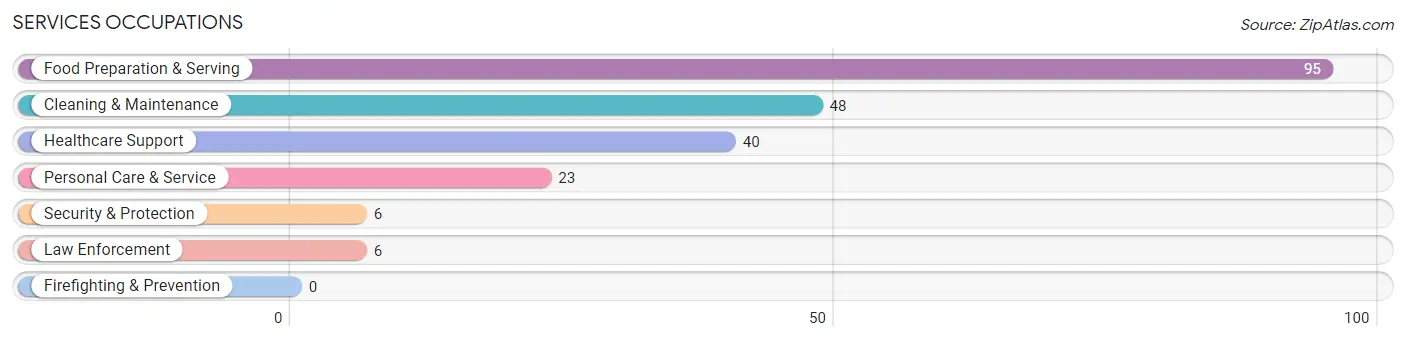
Services Occupations
The most common Services occupations in South Greensburg borough are Food Preparation & Serving (95 | 8.4%), Cleaning & Maintenance (48 | 4.3%), Healthcare Support (40 | 3.5%), Personal Care & Service (23 | 2.0%), and Security & Protection (6 | 0.5%).
Services Occupations by Sex
Within the Services occupations in South Greensburg borough, the most male-oriented occupations are Security & Protection (100.0%), Law Enforcement (100.0%), and Food Preparation & Serving (46.3%), while the most female-oriented occupations are Healthcare Support (100.0%), Cleaning & Maintenance (79.2%), and Personal Care & Service (78.3%).
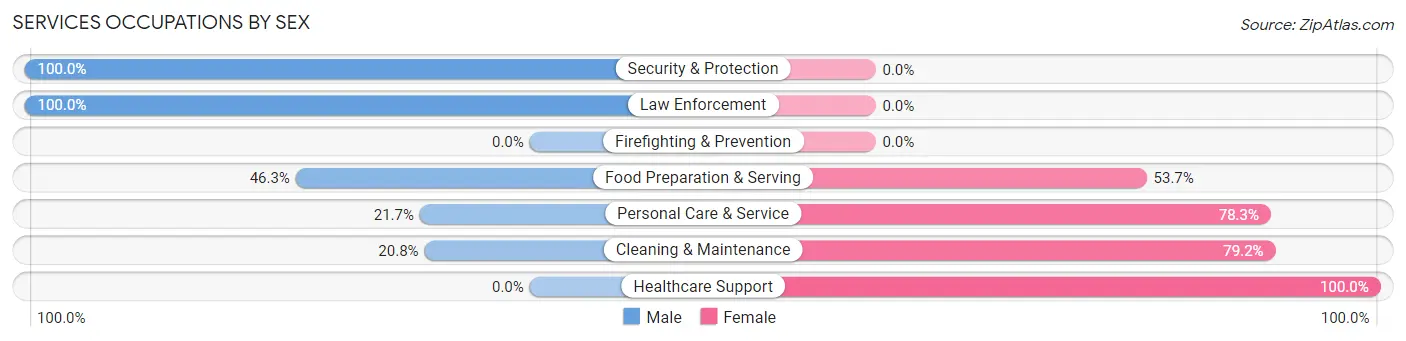
| Occupation | Male | Female |
| Healthcare Support | 0 (0.0%) | 40 (100.0%) |
| Security & Protection | 6 (100.0%) | 0 (0.0%) |
| Firefighting & Prevention | 0 (0.0%) | 0 (0.0%) |
| Law Enforcement | 6 (100.0%) | 0 (0.0%) |
| Food Preparation & Serving | 44 (46.3%) | 51 (53.7%) |
| Cleaning & Maintenance | 10 (20.8%) | 38 (79.2%) |
| Personal Care & Service | 5 (21.7%) | 18 (78.3%) |
| Total (Category) | 65 (30.7%) | 147 (69.3%) |
| Total (Overall) | 554 (49.2%) | 572 (50.8%) |
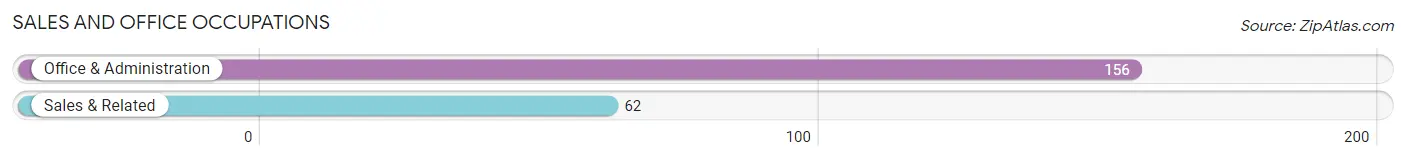
Sales and Office Occupations
The most common Sales and Office occupations in South Greensburg borough are Office & Administration (156 | 13.9%), and Sales & Related (62 | 5.5%).
Sales and Office Occupations by Sex
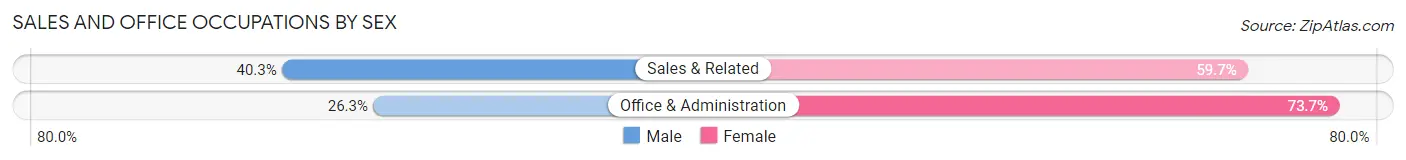
| Occupation | Male | Female |
| Sales & Related | 25 (40.3%) | 37 (59.7%) |
| Office & Administration | 41 (26.3%) | 115 (73.7%) |
| Total (Category) | 66 (30.3%) | 152 (69.7%) |
| Total (Overall) | 554 (49.2%) | 572 (50.8%) |
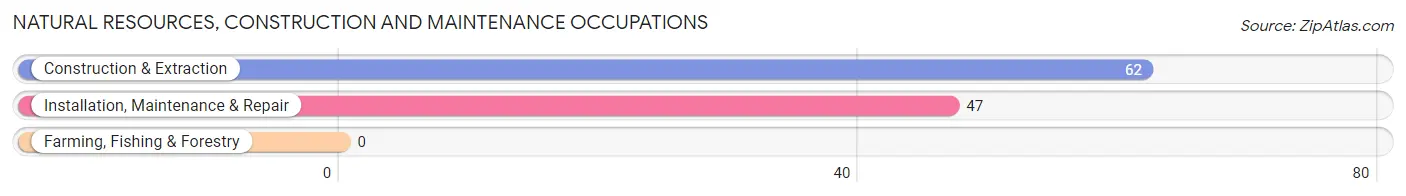
Natural Resources, Construction and Maintenance Occupations
The most common Natural Resources, Construction and Maintenance occupations in South Greensburg borough are Construction & Extraction (62 | 5.5%), and Installation, Maintenance & Repair (47 | 4.2%).
Natural Resources, Construction and Maintenance Occupations by Sex
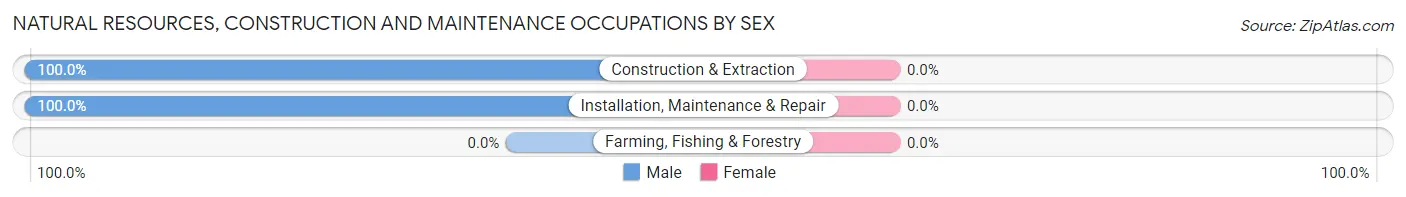
| Occupation | Male | Female |
| Farming, Fishing & Forestry | 0 (0.0%) | 0 (0.0%) |
| Construction & Extraction | 62 (100.0%) | 0 (0.0%) |
| Installation, Maintenance & Repair | 47 (100.0%) | 0 (0.0%) |
| Total (Category) | 109 (100.0%) | 0 (0.0%) |
| Total (Overall) | 554 (49.2%) | 572 (50.8%) |
Production, Transportation and Moving Occupations
The most common Production, Transportation and Moving occupations in South Greensburg borough are Production (155 | 13.8%), Material Moving (63 | 5.6%), and Transportation (46 | 4.1%).
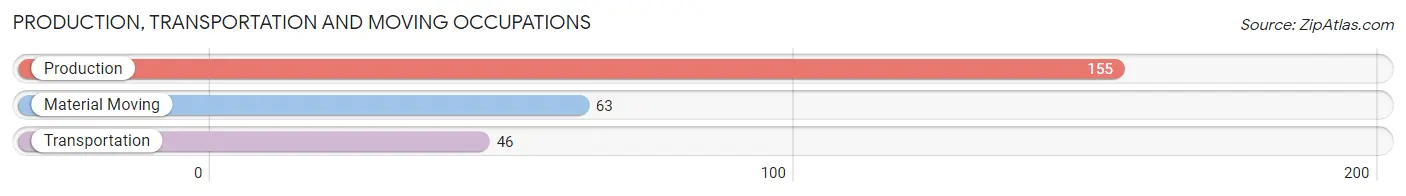
Production, Transportation and Moving Occupations by Sex
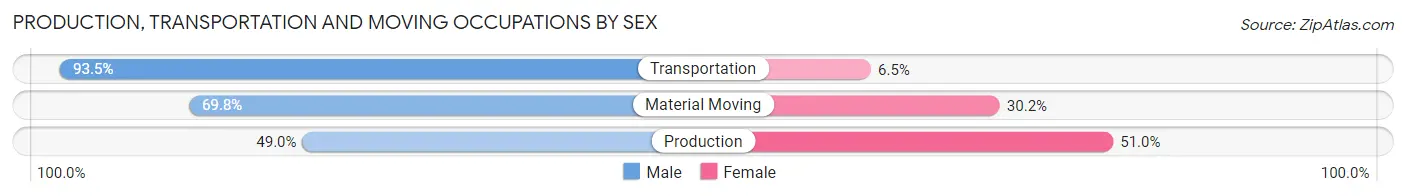
| Occupation | Male | Female |
| Production | 76 (49.0%) | 79 (51.0%) |
| Transportation | 43 (93.5%) | 3 (6.5%) |
| Material Moving | 44 (69.8%) | 19 (30.2%) |
| Total (Category) | 163 (61.7%) | 101 (38.3%) |
| Total (Overall) | 554 (49.2%) | 572 (50.8%) |
Employment Industries by Sex in South Greensburg borough
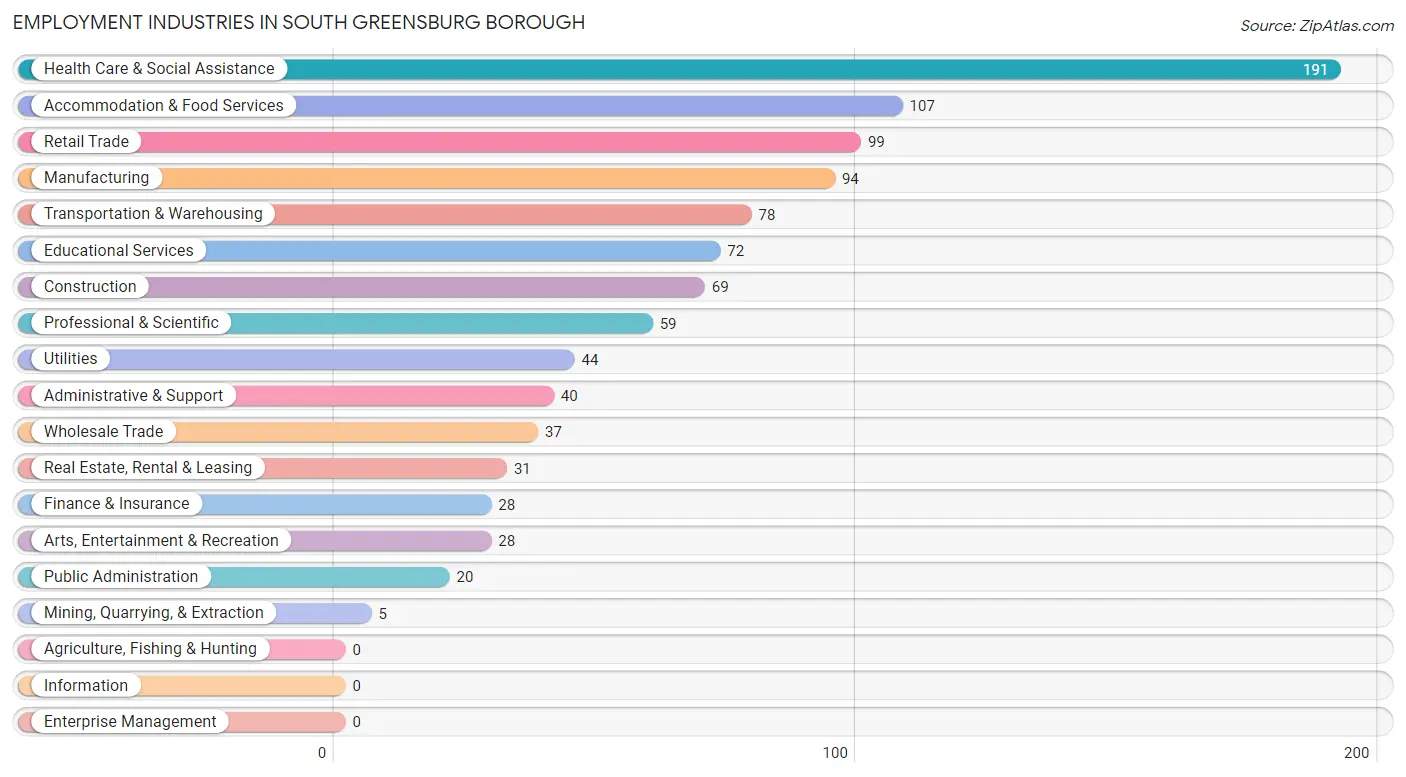
Employment Industries in South Greensburg borough
The major employment industries in South Greensburg borough include Health Care & Social Assistance (191 | 17.0%), Accommodation & Food Services (107 | 9.5%), Retail Trade (99 | 8.8%), Manufacturing (94 | 8.4%), and Transportation & Warehousing (78 | 6.9%).
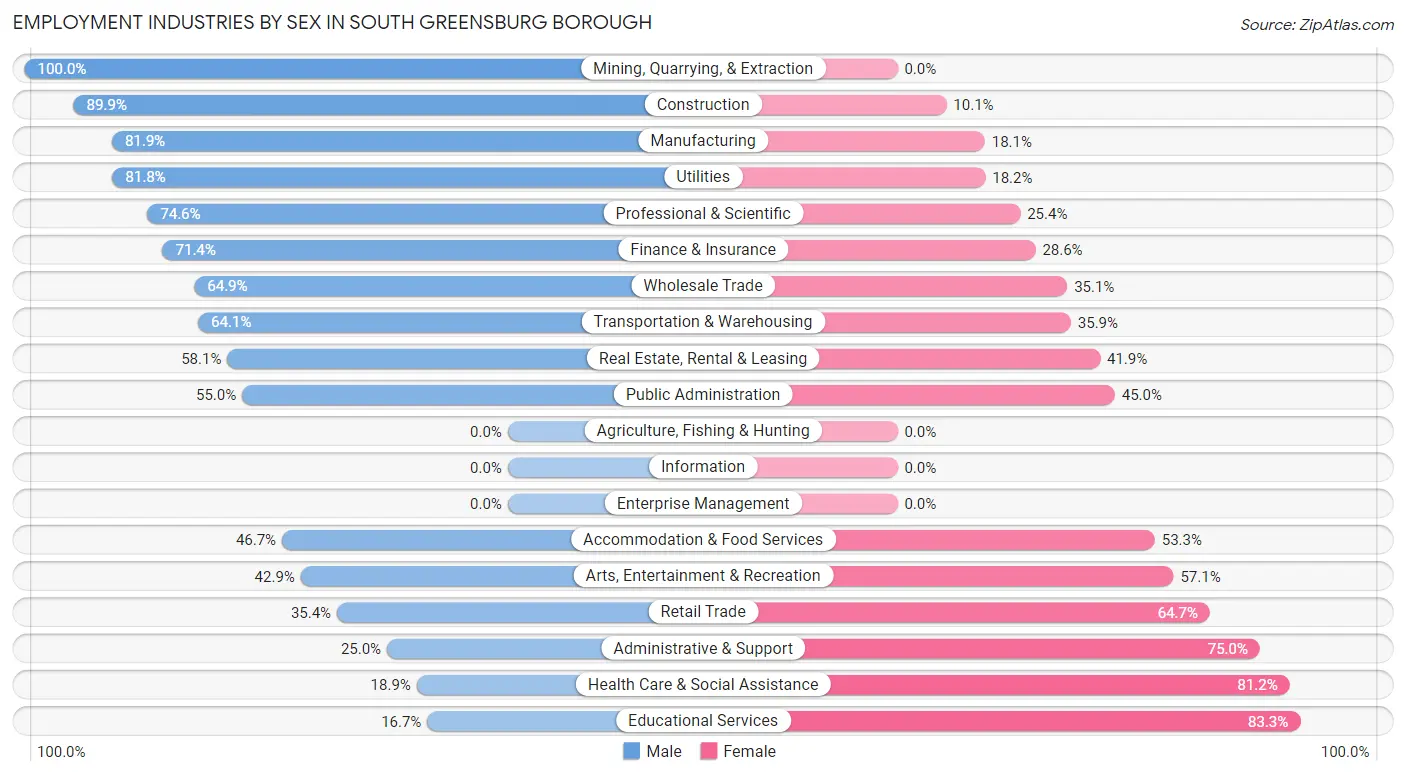
Employment Industries by Sex in South Greensburg borough
The South Greensburg borough industries that see more men than women are Mining, Quarrying, & Extraction (100.0%), Construction (89.9%), and Manufacturing (81.9%), whereas the industries that tend to have a higher number of women are Educational Services (83.3%), Health Care & Social Assistance (81.1%), and Administrative & Support (75.0%).
| Industry | Male | Female |
| Agriculture, Fishing & Hunting | 0 (0.0%) | 0 (0.0%) |
| Mining, Quarrying, & Extraction | 5 (100.0%) | 0 (0.0%) |
| Construction | 62 (89.9%) | 7 (10.1%) |
| Manufacturing | 77 (81.9%) | 17 (18.1%) |
| Wholesale Trade | 24 (64.9%) | 13 (35.1%) |
| Retail Trade | 35 (35.3%) | 64 (64.6%) |
| Transportation & Warehousing | 50 (64.1%) | 28 (35.9%) |
| Utilities | 36 (81.8%) | 8 (18.2%) |
| Information | 0 (0.0%) | 0 (0.0%) |
| Finance & Insurance | 20 (71.4%) | 8 (28.6%) |
| Real Estate, Rental & Leasing | 18 (58.1%) | 13 (41.9%) |
| Professional & Scientific | 44 (74.6%) | 15 (25.4%) |
| Enterprise Management | 0 (0.0%) | 0 (0.0%) |
| Administrative & Support | 10 (25.0%) | 30 (75.0%) |
| Educational Services | 12 (16.7%) | 60 (83.3%) |
| Health Care & Social Assistance | 36 (18.9%) | 155 (81.1%) |
| Arts, Entertainment & Recreation | 12 (42.9%) | 16 (57.1%) |
| Accommodation & Food Services | 50 (46.7%) | 57 (53.3%) |
| Public Administration | 11 (55.0%) | 9 (45.0%) |
| Total | 554 (49.2%) | 572 (50.8%) |
Education in South Greensburg borough
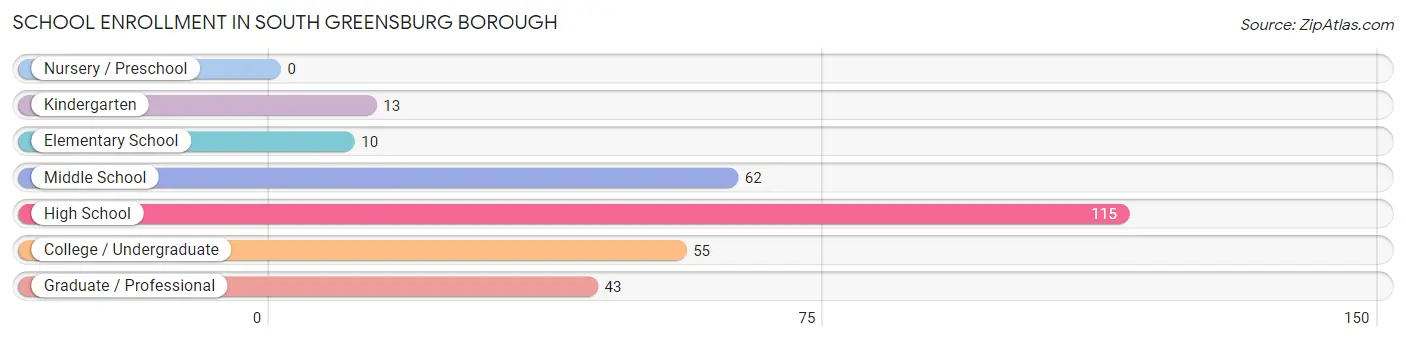
School Enrollment in South Greensburg borough
The most common levels of schooling among the 298 students in South Greensburg borough are high school (115 | 38.6%), middle school (62 | 20.8%), and college / undergraduate (55 | 18.5%).
| School Level | # Students | % Students |
| Nursery / Preschool | 0 | 0.0% |
| Kindergarten | 13 | 4.4% |
| Elementary School | 10 | 3.4% |
| Middle School | 62 | 20.8% |
| High School | 115 | 38.6% |
| College / Undergraduate | 55 | 18.5% |
| Graduate / Professional | 43 | 14.4% |
| Total | 298 | 100.0% |
School Enrollment by Age by Funding Source in South Greensburg borough
Out of a total of 298 students who are enrolled in schools in South Greensburg borough, 70 (23.5%) attend a private institution, while the remaining 228 (76.5%) are enrolled in public schools. The age group of 20 to 24 year olds has the highest likelihood of being enrolled in private schools, with 19 (36.5% in the age bracket) enrolled. Conversely, the age group of 5 to 9 year old has the lowest likelihood of being enrolled in a private school, with 23 (100.0% in the age bracket) attending a public institution.
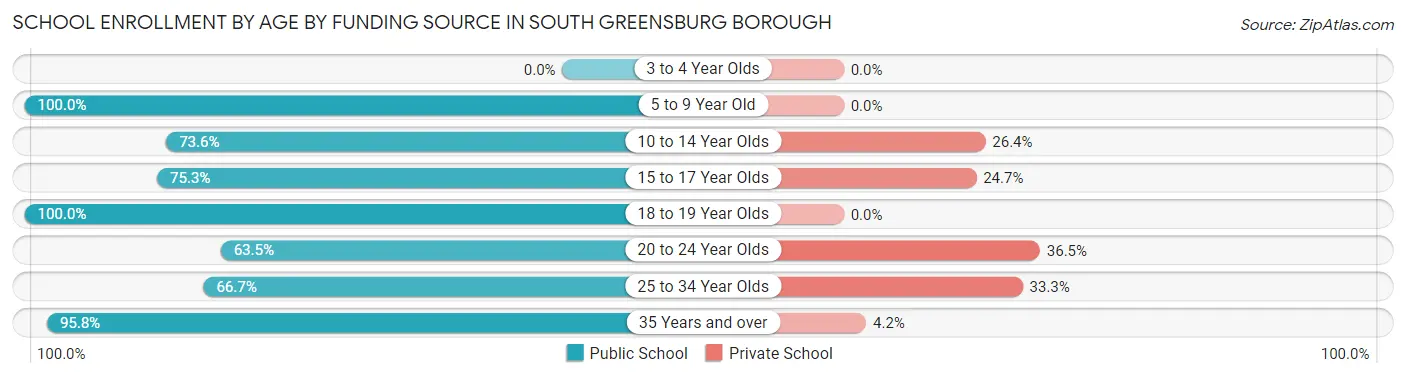
| Age Bracket | Public School | Private School |
| 3 to 4 Year Olds | 0 (0.0%) | 0 (0.0%) |
| 5 to 9 Year Old | 23 (100.0%) | 0 (0.0%) |
| 10 to 14 Year Olds | 53 (73.6%) | 19 (26.4%) |
| 15 to 17 Year Olds | 61 (75.3%) | 20 (24.7%) |
| 18 to 19 Year Olds | 13 (100.0%) | 0 (0.0%) |
| 20 to 24 Year Olds | 33 (63.5%) | 19 (36.5%) |
| 25 to 34 Year Olds | 22 (66.7%) | 11 (33.3%) |
| 35 Years and over | 23 (95.8%) | 1 (4.2%) |
| Total | 228 (76.5%) | 70 (23.5%) |
Educational Attainment by Field of Study in South Greensburg borough
Education (61 | 13.5%), business (55 | 12.2%), visual & performing arts (50 | 11.1%), science & technology (45 | 10.0%), and social sciences (39 | 8.6%) are the most common fields of study among 451 individuals in South Greensburg borough who have obtained a bachelor's degree or higher.
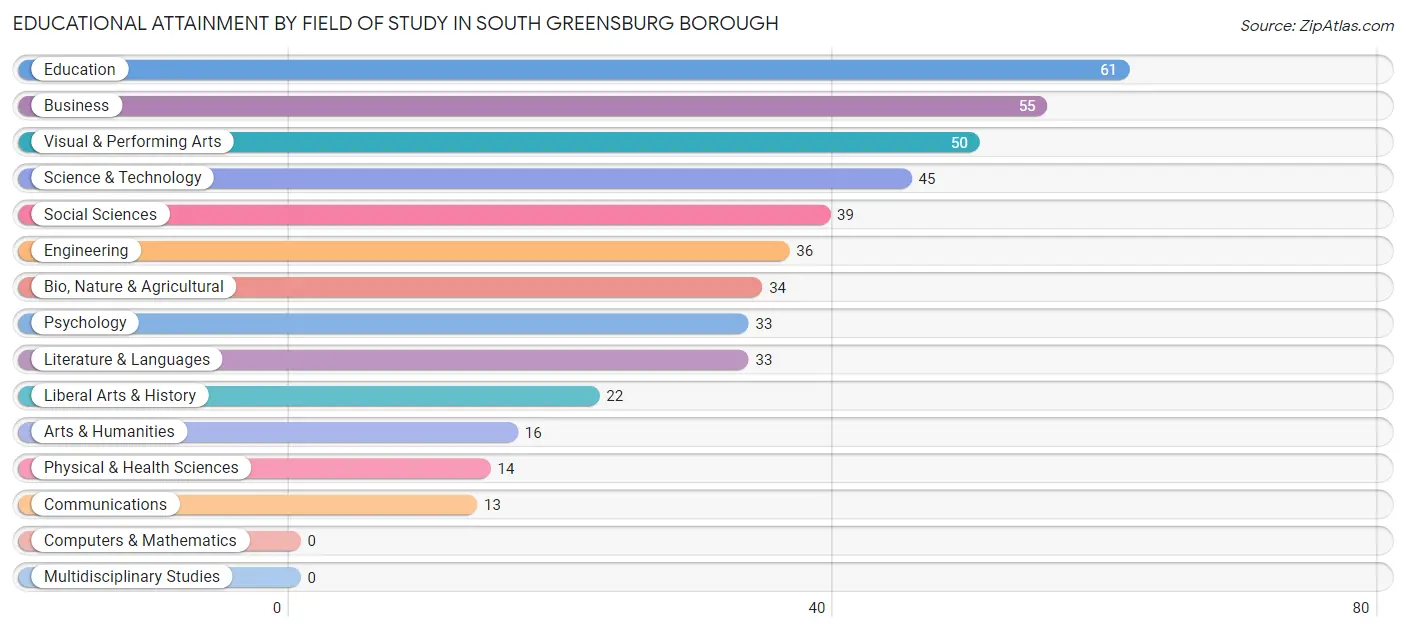
| Field of Study | # Graduates | % Graduates |
| Computers & Mathematics | 0 | 0.0% |
| Bio, Nature & Agricultural | 34 | 7.5% |
| Physical & Health Sciences | 14 | 3.1% |
| Psychology | 33 | 7.3% |
| Social Sciences | 39 | 8.6% |
| Engineering | 36 | 8.0% |
| Multidisciplinary Studies | 0 | 0.0% |
| Science & Technology | 45 | 10.0% |
| Business | 55 | 12.2% |
| Education | 61 | 13.5% |
| Literature & Languages | 33 | 7.3% |
| Liberal Arts & History | 22 | 4.9% |
| Visual & Performing Arts | 50 | 11.1% |
| Communications | 13 | 2.9% |
| Arts & Humanities | 16 | 3.5% |
| Total | 451 | 100.0% |
Transportation & Commute in South Greensburg borough
Vehicle Availability by Sex in South Greensburg borough
The most prevalent vehicle ownership categories in South Greensburg borough are males with 2 vehicles (278, accounting for 51.0%) and females with 2 vehicles (206, making up 49.0%).
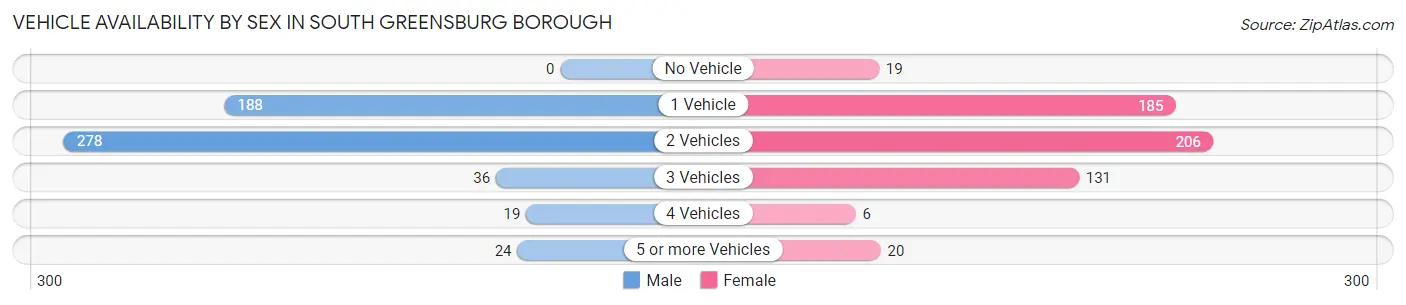
| Vehicles Available | Male | Female |
| No Vehicle | 0 (0.0%) | 19 (3.4%) |
| 1 Vehicle | 188 (34.5%) | 185 (32.6%) |
| 2 Vehicles | 278 (51.0%) | 206 (36.3%) |
| 3 Vehicles | 36 (6.6%) | 131 (23.1%) |
| 4 Vehicles | 19 (3.5%) | 6 (1.1%) |
| 5 or more Vehicles | 24 (4.4%) | 20 (3.5%) |
| Total | 545 (100.0%) | 567 (100.0%) |
Commute Time in South Greensburg borough
The most frequently occuring commute durations in South Greensburg borough are 10 to 14 minutes (319 commuters, 29.8%), 5 to 9 minutes (147 commuters, 13.7%), and 15 to 19 minutes (120 commuters, 11.2%).
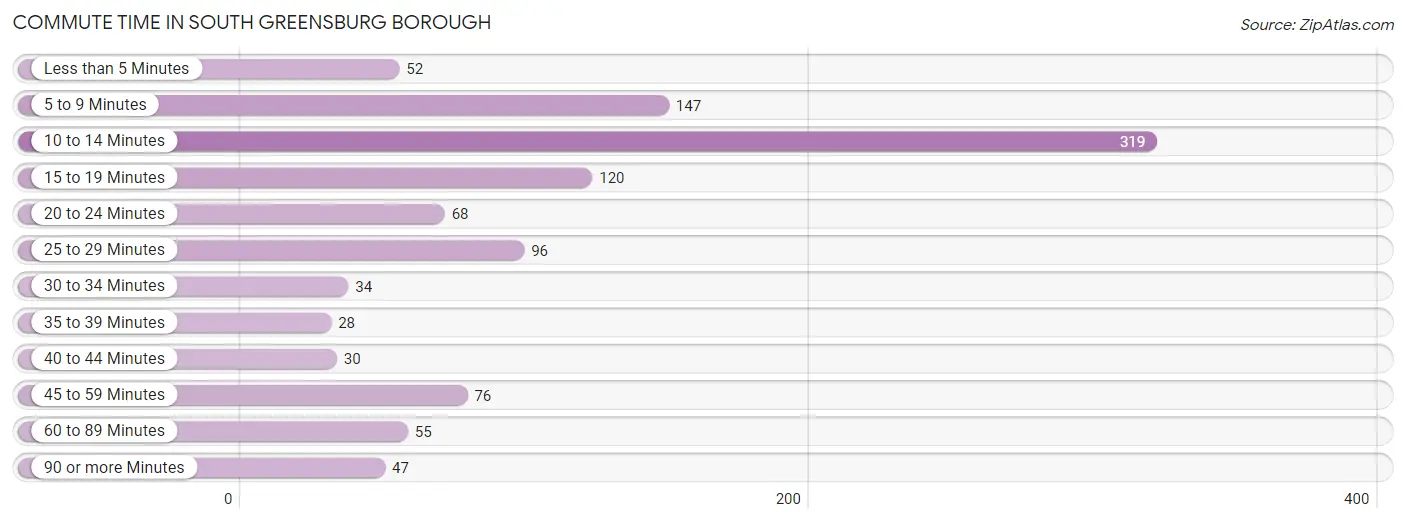
| Commute Time | # Commuters | % Commuters |
| Less than 5 Minutes | 52 | 4.9% |
| 5 to 9 Minutes | 147 | 13.7% |
| 10 to 14 Minutes | 319 | 29.8% |
| 15 to 19 Minutes | 120 | 11.2% |
| 20 to 24 Minutes | 68 | 6.3% |
| 25 to 29 Minutes | 96 | 9.0% |
| 30 to 34 Minutes | 34 | 3.2% |
| 35 to 39 Minutes | 28 | 2.6% |
| 40 to 44 Minutes | 30 | 2.8% |
| 45 to 59 Minutes | 76 | 7.1% |
| 60 to 89 Minutes | 55 | 5.1% |
| 90 or more Minutes | 47 | 4.4% |
Commute Time by Sex in South Greensburg borough
The most common commute times in South Greensburg borough are 10 to 14 minutes (96 commuters, 18.8%) for males and 10 to 14 minutes (223 commuters, 39.7%) for females.
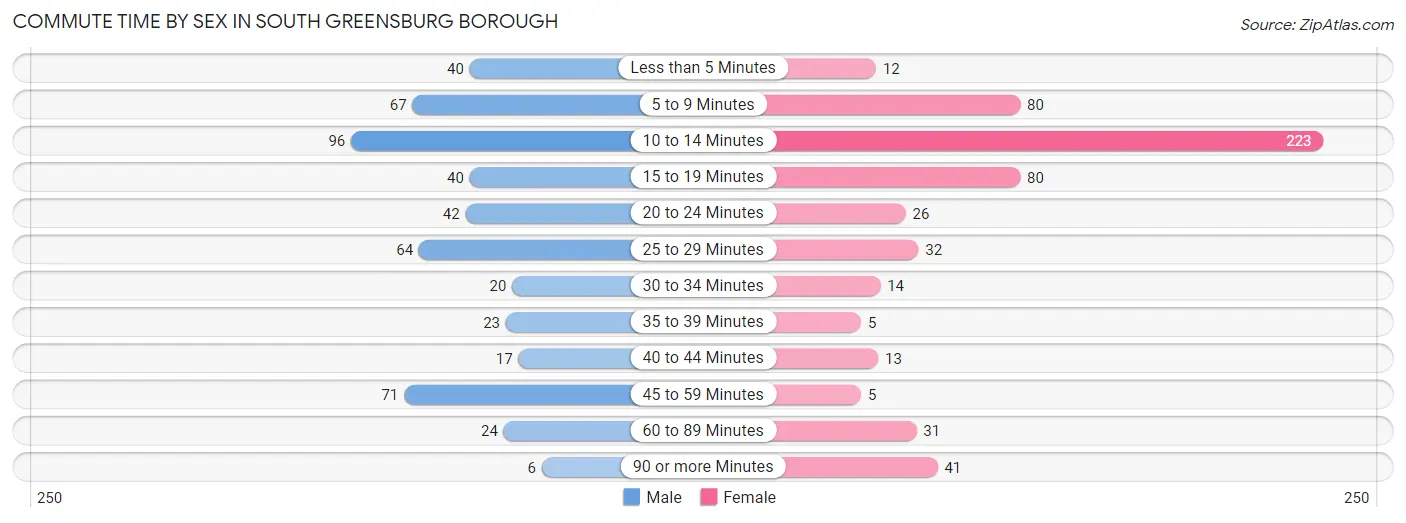
| Commute Time | Male | Female |
| Less than 5 Minutes | 40 (7.8%) | 12 (2.1%) |
| 5 to 9 Minutes | 67 (13.1%) | 80 (14.2%) |
| 10 to 14 Minutes | 96 (18.8%) | 223 (39.7%) |
| 15 to 19 Minutes | 40 (7.8%) | 80 (14.2%) |
| 20 to 24 Minutes | 42 (8.2%) | 26 (4.6%) |
| 25 to 29 Minutes | 64 (12.6%) | 32 (5.7%) |
| 30 to 34 Minutes | 20 (3.9%) | 14 (2.5%) |
| 35 to 39 Minutes | 23 (4.5%) | 5 (0.9%) |
| 40 to 44 Minutes | 17 (3.3%) | 13 (2.3%) |
| 45 to 59 Minutes | 71 (13.9%) | 5 (0.9%) |
| 60 to 89 Minutes | 24 (4.7%) | 31 (5.5%) |
| 90 or more Minutes | 6 (1.2%) | 41 (7.3%) |
Time of Departure to Work by Sex in South Greensburg borough
The most frequent times of departure to work in South Greensburg borough are 6:30 AM to 6:59 AM (81, 15.9%) for males and 12:00 PM to 3:59 PM (132, 23.5%) for females.
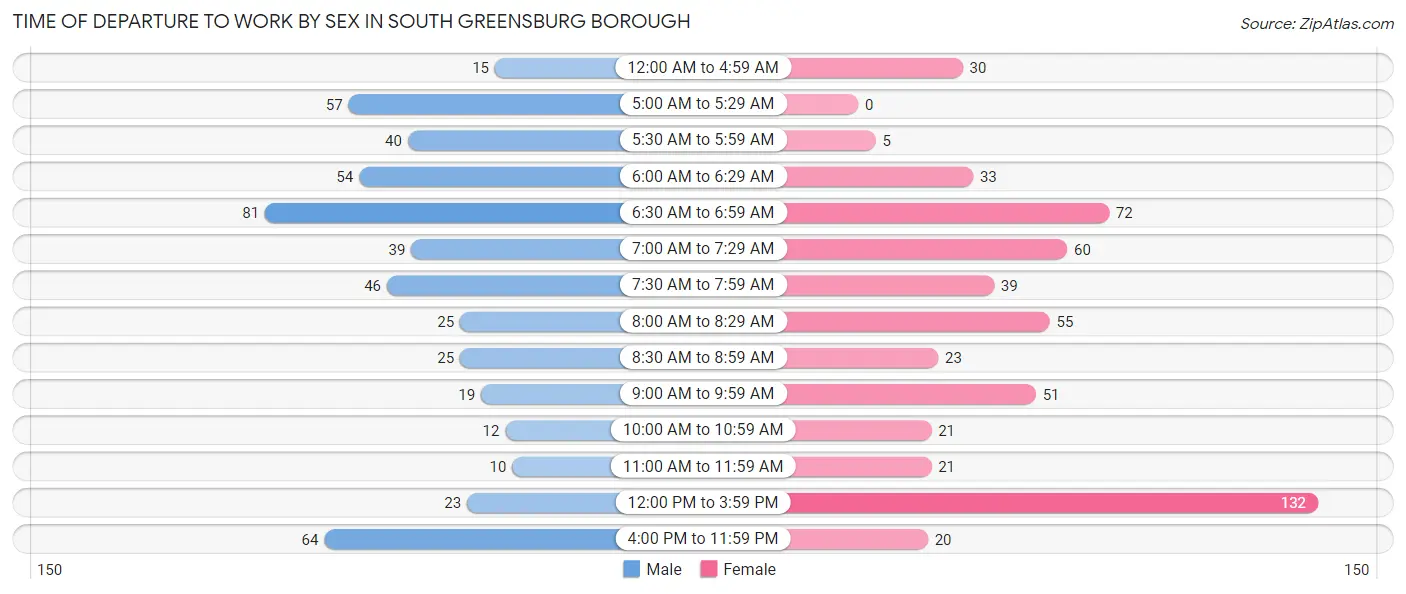
| Time of Departure | Male | Female |
| 12:00 AM to 4:59 AM | 15 (2.9%) | 30 (5.3%) |
| 5:00 AM to 5:29 AM | 57 (11.2%) | 0 (0.0%) |
| 5:30 AM to 5:59 AM | 40 (7.8%) | 5 (0.9%) |
| 6:00 AM to 6:29 AM | 54 (10.6%) | 33 (5.9%) |
| 6:30 AM to 6:59 AM | 81 (15.9%) | 72 (12.8%) |
| 7:00 AM to 7:29 AM | 39 (7.6%) | 60 (10.7%) |
| 7:30 AM to 7:59 AM | 46 (9.0%) | 39 (6.9%) |
| 8:00 AM to 8:29 AM | 25 (4.9%) | 55 (9.8%) |
| 8:30 AM to 8:59 AM | 25 (4.9%) | 23 (4.1%) |
| 9:00 AM to 9:59 AM | 19 (3.7%) | 51 (9.1%) |
| 10:00 AM to 10:59 AM | 12 (2.4%) | 21 (3.7%) |
| 11:00 AM to 11:59 AM | 10 (2.0%) | 21 (3.7%) |
| 12:00 PM to 3:59 PM | 23 (4.5%) | 132 (23.5%) |
| 4:00 PM to 11:59 PM | 64 (12.6%) | 20 (3.6%) |
| Total | 510 (100.0%) | 562 (100.0%) |
Housing Occupancy in South Greensburg borough
Occupancy by Ownership in South Greensburg borough
Of the total 1,129 dwellings in South Greensburg borough, owner-occupied units account for 800 (70.9%), while renter-occupied units make up 329 (29.1%).
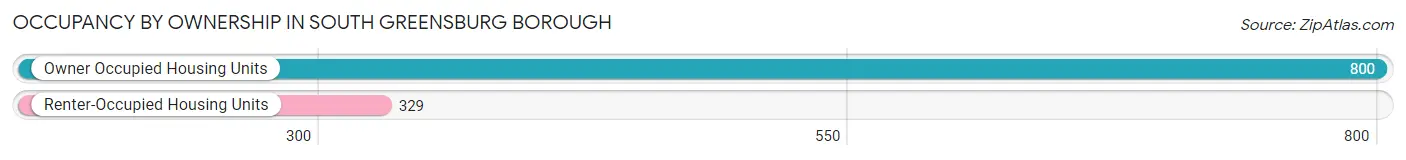
| Occupancy | # Housing Units | % Housing Units |
| Owner Occupied Housing Units | 800 | 70.9% |
| Renter-Occupied Housing Units | 329 | 29.1% |
| Total Occupied Housing Units | 1,129 | 100.0% |
Occupancy by Household Size in South Greensburg borough
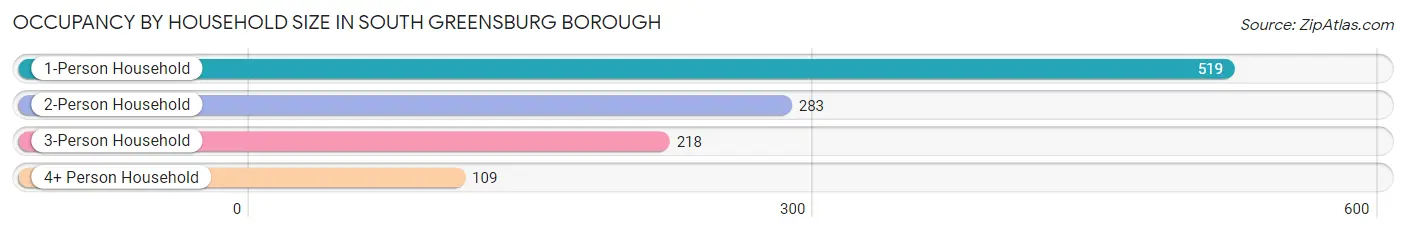
| Household Size | # Housing Units | % Housing Units |
| 1-Person Household | 519 | 46.0% |
| 2-Person Household | 283 | 25.1% |
| 3-Person Household | 218 | 19.3% |
| 4+ Person Household | 109 | 9.7% |
| Total Housing Units | 1,129 | 100.0% |
Occupancy by Ownership by Household Size in South Greensburg borough
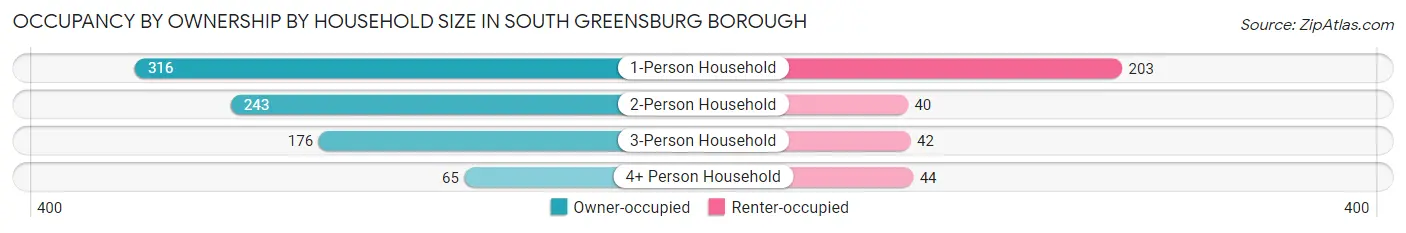
| Household Size | Owner-occupied | Renter-occupied |
| 1-Person Household | 316 (60.9%) | 203 (39.1%) |
| 2-Person Household | 243 (85.9%) | 40 (14.1%) |
| 3-Person Household | 176 (80.7%) | 42 (19.3%) |
| 4+ Person Household | 65 (59.6%) | 44 (40.4%) |
| Total Housing Units | 800 (70.9%) | 329 (29.1%) |
Occupancy by Educational Attainment in South Greensburg borough
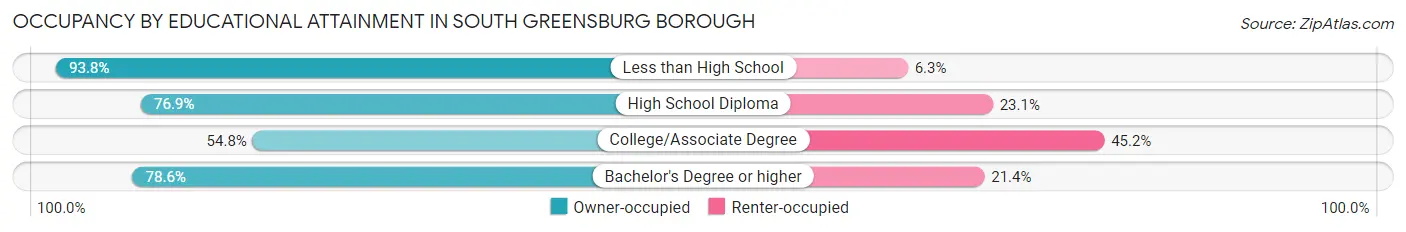
| Household Size | Owner-occupied | Renter-occupied |
| Less than High School | 45 (93.8%) | 3 (6.2%) |
| High School Diploma | 346 (76.9%) | 104 (23.1%) |
| College/Associate Degree | 200 (54.8%) | 165 (45.2%) |
| Bachelor's Degree or higher | 209 (78.6%) | 57 (21.4%) |
Occupancy by Age of Householder in South Greensburg borough
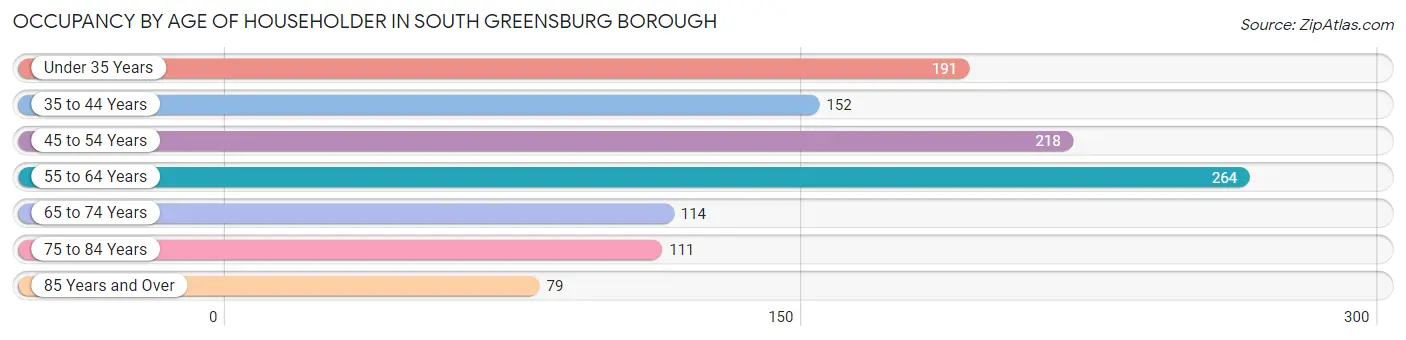
| Age Bracket | # Households | % Households |
| Under 35 Years | 191 | 16.9% |
| 35 to 44 Years | 152 | 13.5% |
| 45 to 54 Years | 218 | 19.3% |
| 55 to 64 Years | 264 | 23.4% |
| 65 to 74 Years | 114 | 10.1% |
| 75 to 84 Years | 111 | 9.8% |
| 85 Years and Over | 79 | 7.0% |
| Total | 1,129 | 100.0% |
Housing Finances in South Greensburg borough
Median Income by Occupancy in South Greensburg borough
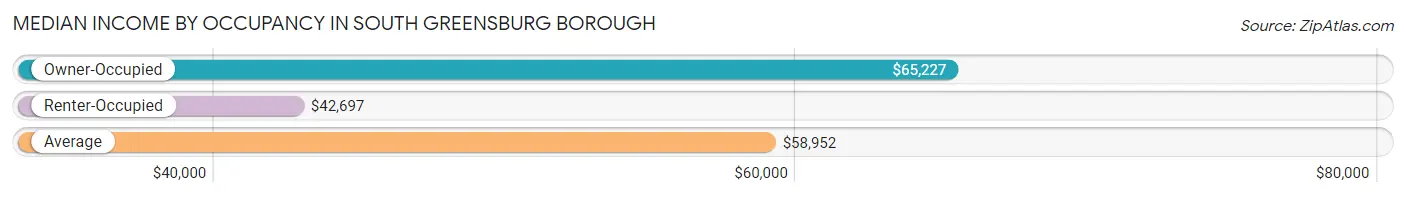
| Occupancy Type | # Households | Median Income |
| Owner-Occupied | 800 (70.9%) | $65,227 |
| Renter-Occupied | 329 (29.1%) | $42,697 |
| Average | 1,129 (100.0%) | $58,952 |
Occupancy by Householder Income Bracket in South Greensburg borough
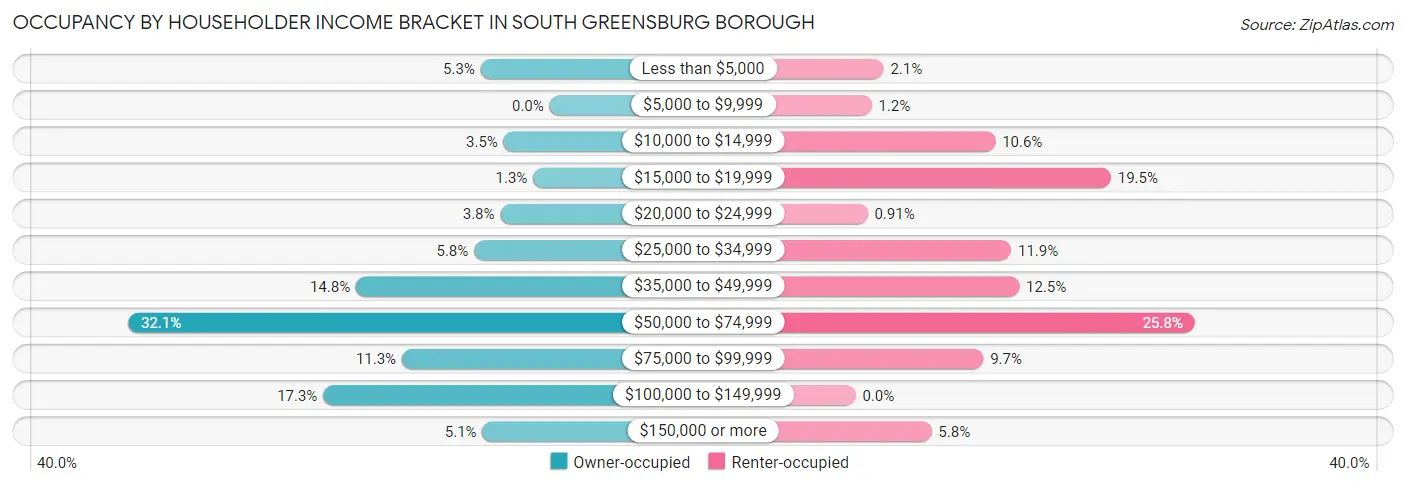
| Income Bracket | Owner-occupied | Renter-occupied |
| Less than $5,000 | 42 (5.2%) | 7 (2.1%) |
| $5,000 to $9,999 | 0 (0.0%) | 4 (1.2%) |
| $10,000 to $14,999 | 28 (3.5%) | 35 (10.6%) |
| $15,000 to $19,999 | 10 (1.3%) | 64 (19.5%) |
| $20,000 to $24,999 | 30 (3.7%) | 3 (0.9%) |
| $25,000 to $34,999 | 46 (5.8%) | 39 (11.8%) |
| $35,000 to $49,999 | 118 (14.7%) | 41 (12.5%) |
| $50,000 to $74,999 | 257 (32.1%) | 85 (25.8%) |
| $75,000 to $99,999 | 90 (11.3%) | 32 (9.7%) |
| $100,000 to $149,999 | 138 (17.2%) | 0 (0.0%) |
| $150,000 or more | 41 (5.1%) | 19 (5.8%) |
| Total | 800 (100.0%) | 329 (100.0%) |
Monthly Housing Cost Tiers in South Greensburg borough
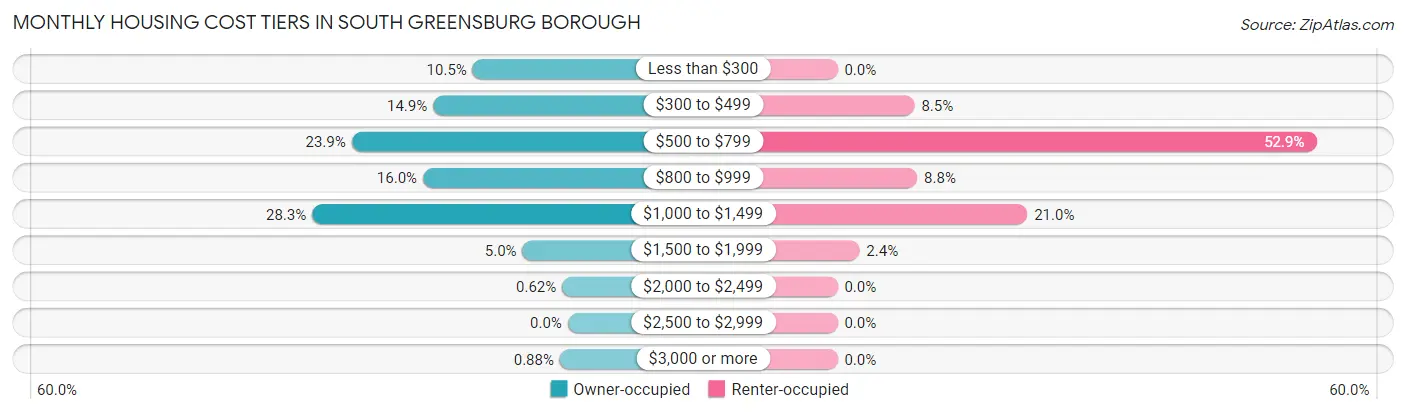
| Monthly Cost | Owner-occupied | Renter-occupied |
| Less than $300 | 84 (10.5%) | 0 (0.0%) |
| $300 to $499 | 119 (14.9%) | 28 (8.5%) |
| $500 to $799 | 191 (23.9%) | 174 (52.9%) |
| $800 to $999 | 128 (16.0%) | 29 (8.8%) |
| $1,000 to $1,499 | 226 (28.2%) | 69 (21.0%) |
| $1,500 to $1,999 | 40 (5.0%) | 8 (2.4%) |
| $2,000 to $2,499 | 5 (0.6%) | 0 (0.0%) |
| $2,500 to $2,999 | 0 (0.0%) | 0 (0.0%) |
| $3,000 or more | 7 (0.9%) | 0 (0.0%) |
| Total | 800 (100.0%) | 329 (100.0%) |
Physical Housing Characteristics in South Greensburg borough
Housing Structures in South Greensburg borough
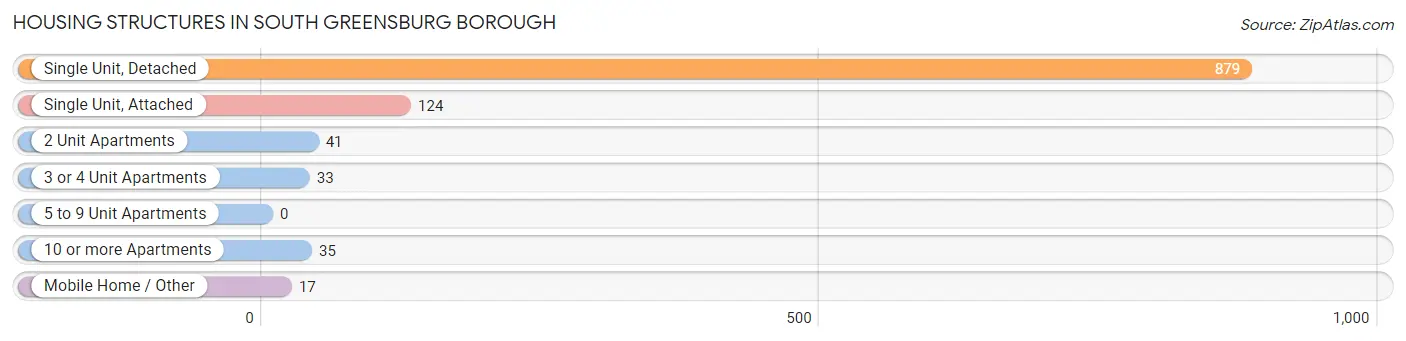
| Structure Type | # Housing Units | % Housing Units |
| Single Unit, Detached | 879 | 77.9% |
| Single Unit, Attached | 124 | 11.0% |
| 2 Unit Apartments | 41 | 3.6% |
| 3 or 4 Unit Apartments | 33 | 2.9% |
| 5 to 9 Unit Apartments | 0 | 0.0% |
| 10 or more Apartments | 35 | 3.1% |
| Mobile Home / Other | 17 | 1.5% |
| Total | 1,129 | 100.0% |
Housing Structures by Occupancy in South Greensburg borough
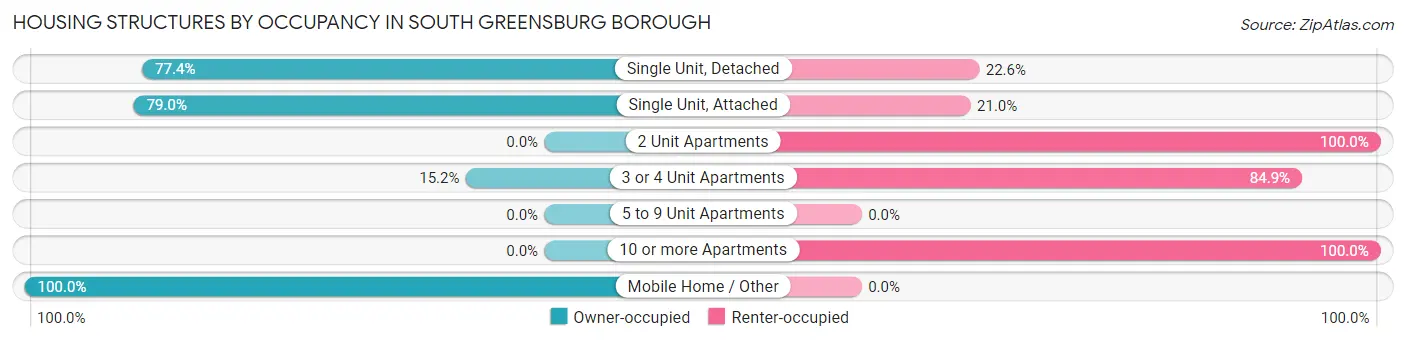
| Structure Type | Owner-occupied | Renter-occupied |
| Single Unit, Detached | 680 (77.4%) | 199 (22.6%) |
| Single Unit, Attached | 98 (79.0%) | 26 (21.0%) |
| 2 Unit Apartments | 0 (0.0%) | 41 (100.0%) |
| 3 or 4 Unit Apartments | 5 (15.1%) | 28 (84.9%) |
| 5 to 9 Unit Apartments | 0 (0.0%) | 0 (0.0%) |
| 10 or more Apartments | 0 (0.0%) | 35 (100.0%) |
| Mobile Home / Other | 17 (100.0%) | 0 (0.0%) |
| Total | 800 (70.9%) | 329 (29.1%) |
Housing Structures by Number of Rooms in South Greensburg borough
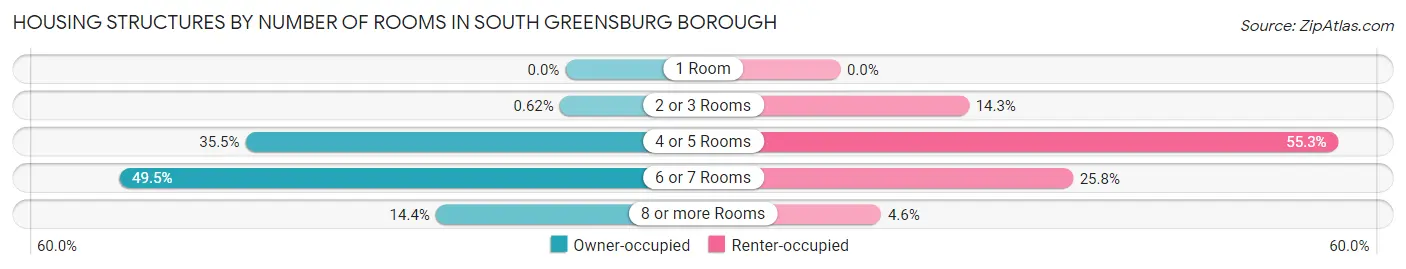
| Number of Rooms | Owner-occupied | Renter-occupied |
| 1 Room | 0 (0.0%) | 0 (0.0%) |
| 2 or 3 Rooms | 5 (0.6%) | 47 (14.3%) |
| 4 or 5 Rooms | 284 (35.5%) | 182 (55.3%) |
| 6 or 7 Rooms | 396 (49.5%) | 85 (25.8%) |
| 8 or more Rooms | 115 (14.4%) | 15 (4.6%) |
| Total | 800 (100.0%) | 329 (100.0%) |
Housing Structure by Heating Type in South Greensburg borough

| Heating Type | Owner-occupied | Renter-occupied |
| Utility Gas | 692 (86.5%) | 219 (66.6%) |
| Bottled, Tank, or LP Gas | 11 (1.4%) | 0 (0.0%) |
| Electricity | 79 (9.9%) | 59 (17.9%) |
| Fuel Oil or Kerosene | 18 (2.2%) | 51 (15.5%) |
| Coal or Coke | 0 (0.0%) | 0 (0.0%) |
| All other Fuels | 0 (0.0%) | 0 (0.0%) |
| No Fuel Used | 0 (0.0%) | 0 (0.0%) |
| Total | 800 (100.0%) | 329 (100.0%) |
Household Vehicle Usage in South Greensburg borough
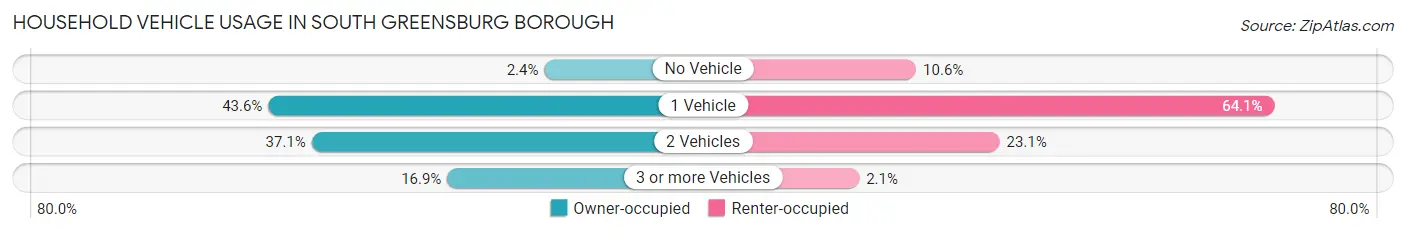
| Vehicles per Household | Owner-occupied | Renter-occupied |
| No Vehicle | 19 (2.4%) | 35 (10.6%) |
| 1 Vehicle | 349 (43.6%) | 211 (64.1%) |
| 2 Vehicles | 297 (37.1%) | 76 (23.1%) |
| 3 or more Vehicles | 135 (16.9%) | 7 (2.1%) |
| Total | 800 (100.0%) | 329 (100.0%) |
Real Estate & Mortgages in South Greensburg borough
Real Estate and Mortgage Overview in South Greensburg borough
| Characteristic | Without Mortgage | With Mortgage |
| Housing Units | 338 | 462 |
| Median Property Value | $110,800 | $145,700 |
| Median Household Income | $50,263 | $26 |
| Monthly Housing Costs | $460 | $7 |
| Real Estate Taxes | $1,653 | $10 |
Property Value by Mortgage Status in South Greensburg borough
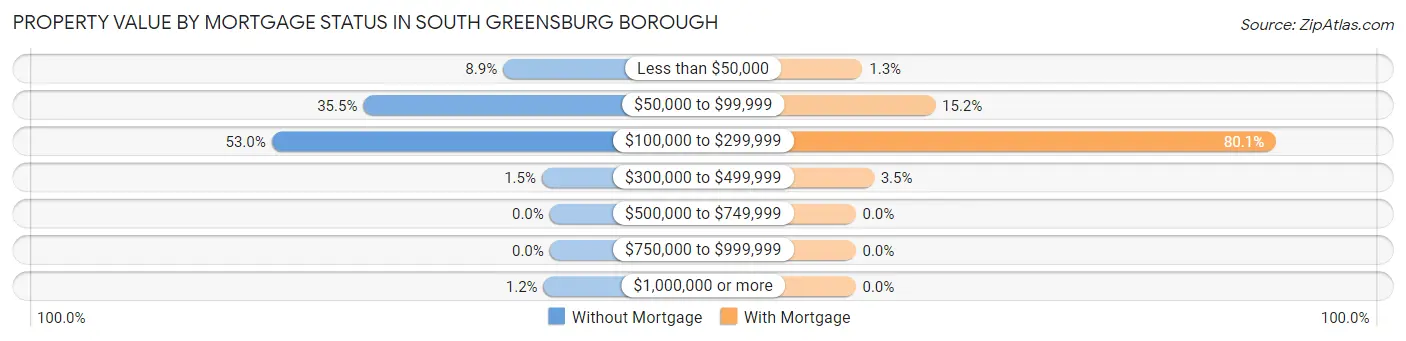
| Property Value | Without Mortgage | With Mortgage |
| Less than $50,000 | 30 (8.9%) | 6 (1.3%) |
| $50,000 to $99,999 | 120 (35.5%) | 70 (15.1%) |
| $100,000 to $299,999 | 179 (53.0%) | 370 (80.1%) |
| $300,000 to $499,999 | 5 (1.5%) | 16 (3.5%) |
| $500,000 to $749,999 | 0 (0.0%) | 0 (0.0%) |
| $750,000 to $999,999 | 0 (0.0%) | 0 (0.0%) |
| $1,000,000 or more | 4 (1.2%) | 0 (0.0%) |
| Total | 338 (100.0%) | 462 (100.0%) |
Household Income by Mortgage Status in South Greensburg borough
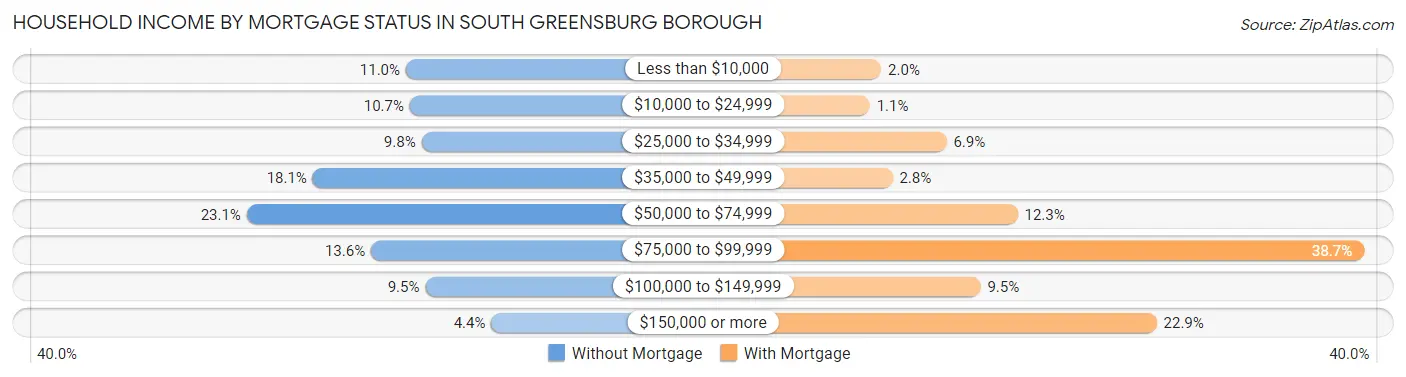
| Household Income | Without Mortgage | With Mortgage |
| Less than $10,000 | 37 (11.0%) | 9 (1.9%) |
| $10,000 to $24,999 | 36 (10.6%) | 5 (1.1%) |
| $25,000 to $34,999 | 33 (9.8%) | 32 (6.9%) |
| $35,000 to $49,999 | 61 (18.0%) | 13 (2.8%) |
| $50,000 to $74,999 | 78 (23.1%) | 57 (12.3%) |
| $75,000 to $99,999 | 46 (13.6%) | 179 (38.7%) |
| $100,000 to $149,999 | 32 (9.5%) | 44 (9.5%) |
| $150,000 or more | 15 (4.4%) | 106 (22.9%) |
| Total | 338 (100.0%) | 462 (100.0%) |
Property Value to Household Income Ratio in South Greensburg borough
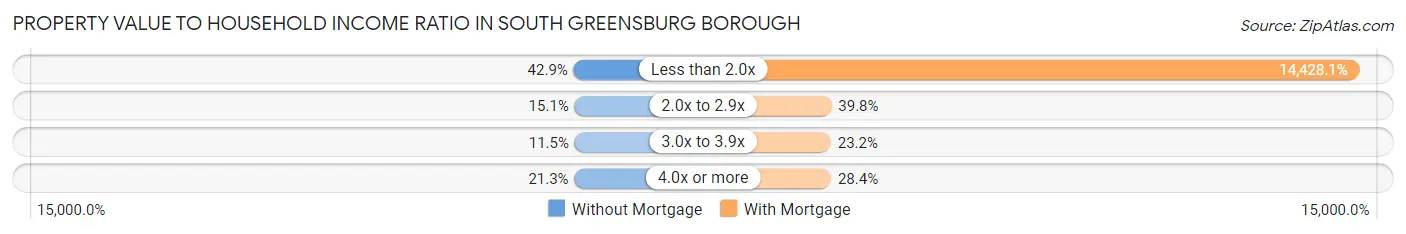
| Value-to-Income Ratio | Without Mortgage | With Mortgage |
| Less than 2.0x | 145 (42.9%) | 66,658 (14,428.1%) |
| 2.0x to 2.9x | 51 (15.1%) | 184 (39.8%) |
| 3.0x to 3.9x | 39 (11.5%) | 107 (23.2%) |
| 4.0x or more | 72 (21.3%) | 131 (28.3%) |
| Total | 338 (100.0%) | 462 (100.0%) |
Real Estate Taxes by Mortgage Status in South Greensburg borough
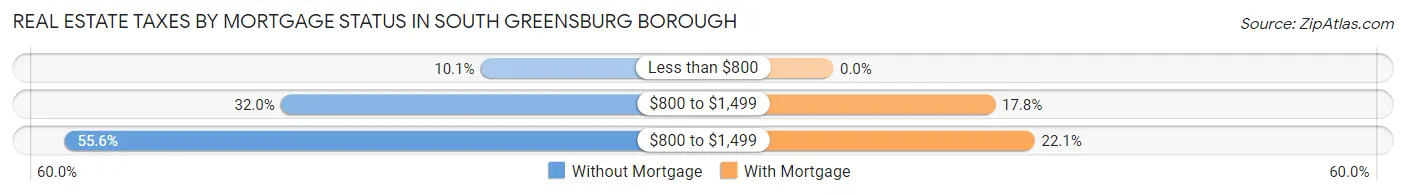
| Property Taxes | Without Mortgage | With Mortgage |
| Less than $800 | 34 (10.1%) | 0 (0.0%) |
| $800 to $1,499 | 108 (32.0%) | 82 (17.7%) |
| $800 to $1,499 | 188 (55.6%) | 102 (22.1%) |
| Total | 338 (100.0%) | 462 (100.0%) |
Health & Disability in South Greensburg borough
Health Insurance Coverage by Age in South Greensburg borough
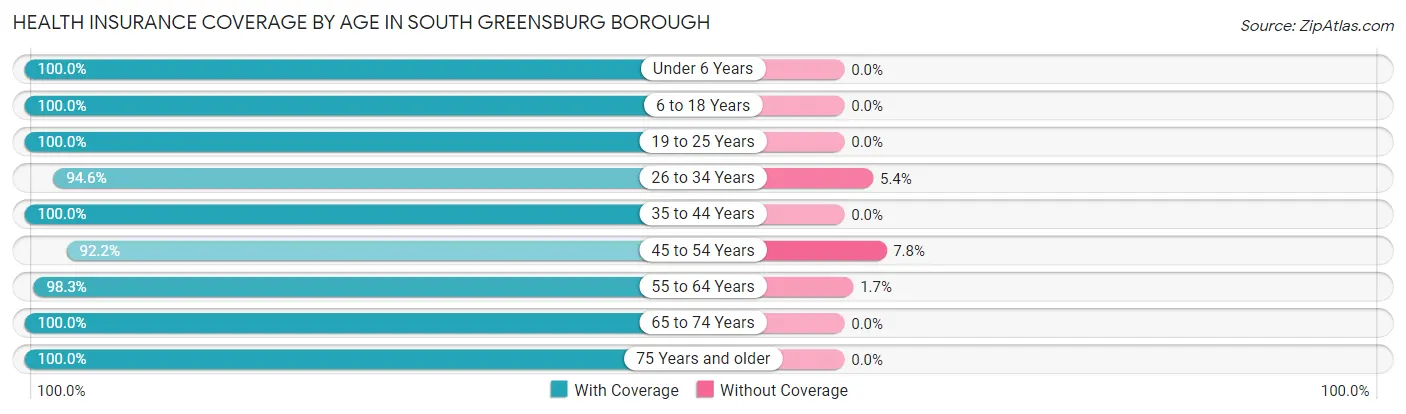
| Age Bracket | With Coverage | Without Coverage |
| Under 6 Years | 134 (100.0%) | 0 (0.0%) |
| 6 to 18 Years | 184 (100.0%) | 0 (0.0%) |
| 19 to 25 Years | 232 (100.0%) | 0 (0.0%) |
| 26 to 34 Years | 353 (94.6%) | 20 (5.4%) |
| 35 to 44 Years | 229 (100.0%) | 0 (0.0%) |
| 45 to 54 Years | 283 (92.2%) | 24 (7.8%) |
| 55 to 64 Years | 355 (98.3%) | 6 (1.7%) |
| 65 to 74 Years | 189 (100.0%) | 0 (0.0%) |
| 75 Years and older | 273 (100.0%) | 0 (0.0%) |
| Total | 2,232 (97.8%) | 50 (2.2%) |
Health Insurance Coverage by Citizenship Status in South Greensburg borough
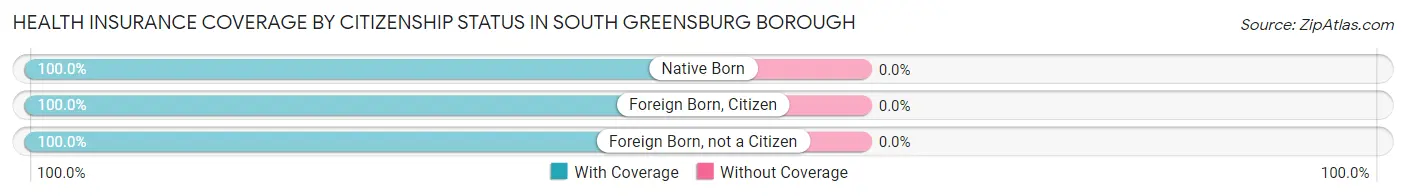
| Citizenship Status | With Coverage | Without Coverage |
| Native Born | 134 (100.0%) | 0 (0.0%) |
| Foreign Born, Citizen | 184 (100.0%) | 0 (0.0%) |
| Foreign Born, not a Citizen | 232 (100.0%) | 0 (0.0%) |
Health Insurance Coverage by Household Income in South Greensburg borough
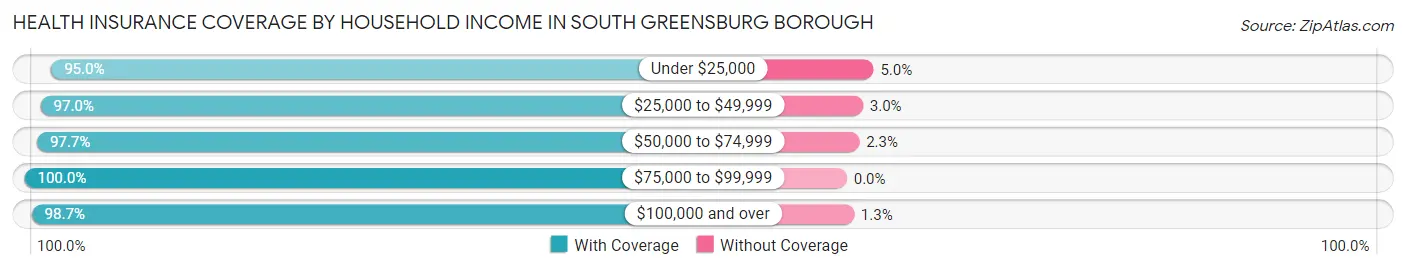
| Household Income | With Coverage | Without Coverage |
| Under $25,000 | 228 (95.0%) | 12 (5.0%) |
| $25,000 to $49,999 | 354 (97.0%) | 11 (3.0%) |
| $50,000 to $74,999 | 838 (97.7%) | 20 (2.3%) |
| $75,000 to $99,999 | 288 (100.0%) | 0 (0.0%) |
| $100,000 and over | 520 (98.7%) | 7 (1.3%) |
Public vs Private Health Insurance Coverage by Age in South Greensburg borough
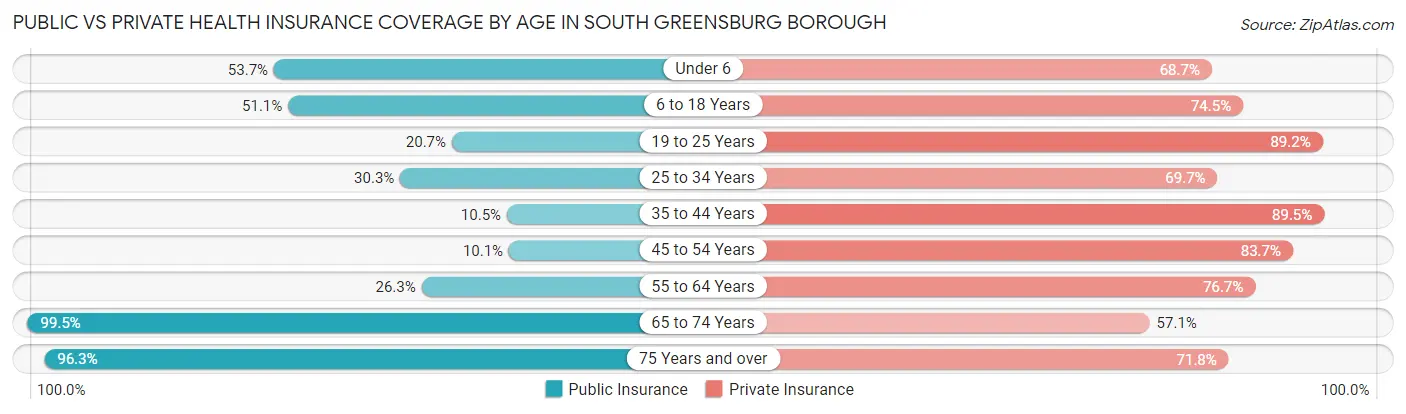
| Age Bracket | Public Insurance | Private Insurance |
| Under 6 | 72 (53.7%) | 92 (68.7%) |
| 6 to 18 Years | 94 (51.1%) | 137 (74.5%) |
| 19 to 25 Years | 48 (20.7%) | 207 (89.2%) |
| 25 to 34 Years | 113 (30.3%) | 260 (69.7%) |
| 35 to 44 Years | 24 (10.5%) | 205 (89.5%) |
| 45 to 54 Years | 31 (10.1%) | 257 (83.7%) |
| 55 to 64 Years | 95 (26.3%) | 277 (76.7%) |
| 65 to 74 Years | 188 (99.5%) | 108 (57.1%) |
| 75 Years and over | 263 (96.3%) | 196 (71.8%) |
| Total | 928 (40.7%) | 1,739 (76.2%) |
Disability Status by Sex by Age in South Greensburg borough
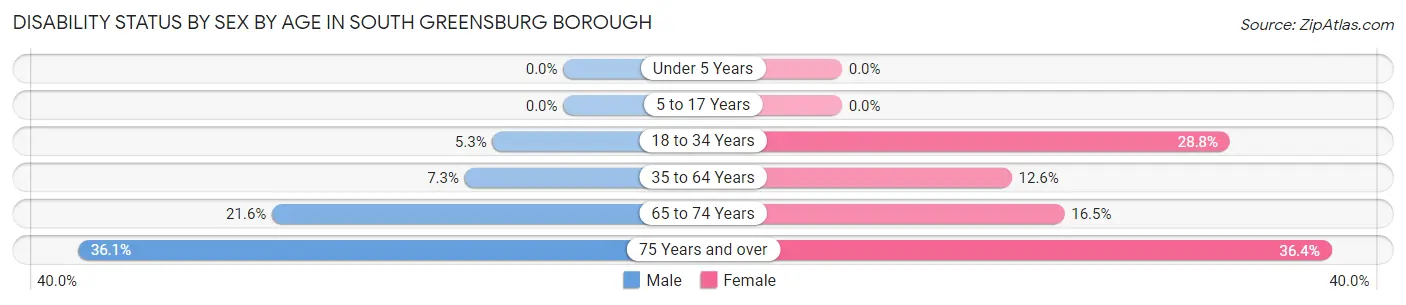
| Age Bracket | Male | Female |
| Under 5 Years | 0 (0.0%) | 0 (0.0%) |
| 5 to 17 Years | 0 (0.0%) | 0 (0.0%) |
| 18 to 34 Years | 17 (5.3%) | 85 (28.8%) |
| 35 to 64 Years | 32 (7.3%) | 58 (12.6%) |
| 65 to 74 Years | 16 (21.6%) | 19 (16.5%) |
| 75 Years and over | 31 (36.0%) | 68 (36.4%) |
Disability Class by Sex by Age in South Greensburg borough
Disability Class: Hearing Difficulty
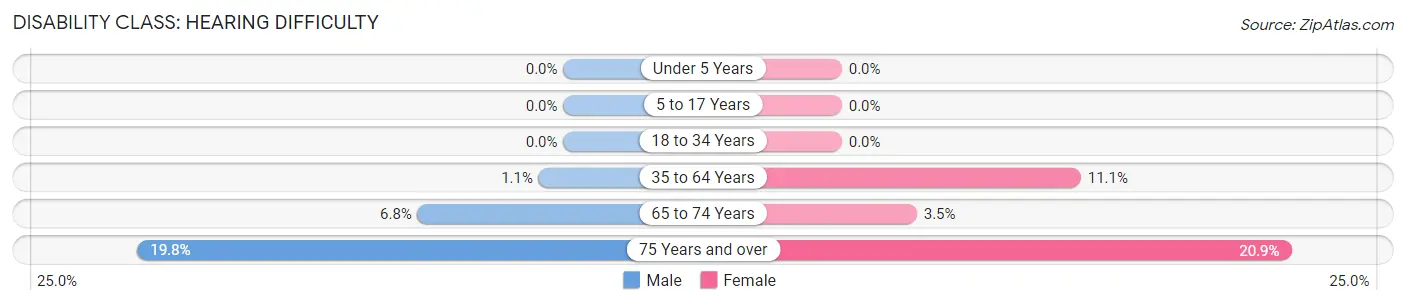
| Age Bracket | Male | Female |
| Under 5 Years | 0 (0.0%) | 0 (0.0%) |
| 5 to 17 Years | 0 (0.0%) | 0 (0.0%) |
| 18 to 34 Years | 0 (0.0%) | 0 (0.0%) |
| 35 to 64 Years | 5 (1.1%) | 51 (11.1%) |
| 65 to 74 Years | 5 (6.8%) | 4 (3.5%) |
| 75 Years and over | 17 (19.8%) | 39 (20.9%) |
Disability Class: Vision Difficulty
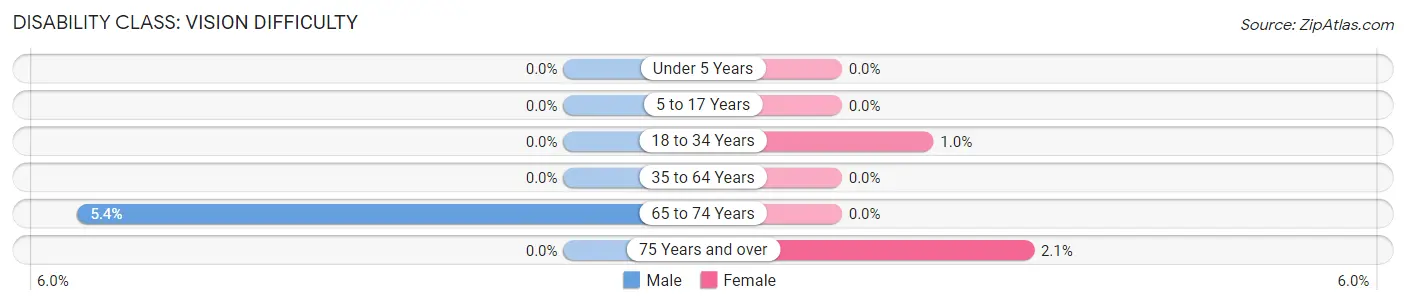
| Age Bracket | Male | Female |
| Under 5 Years | 0 (0.0%) | 0 (0.0%) |
| 5 to 17 Years | 0 (0.0%) | 0 (0.0%) |
| 18 to 34 Years | 0 (0.0%) | 3 (1.0%) |
| 35 to 64 Years | 0 (0.0%) | 0 (0.0%) |
| 65 to 74 Years | 4 (5.4%) | 0 (0.0%) |
| 75 Years and over | 0 (0.0%) | 4 (2.1%) |
Disability Class: Cognitive Difficulty
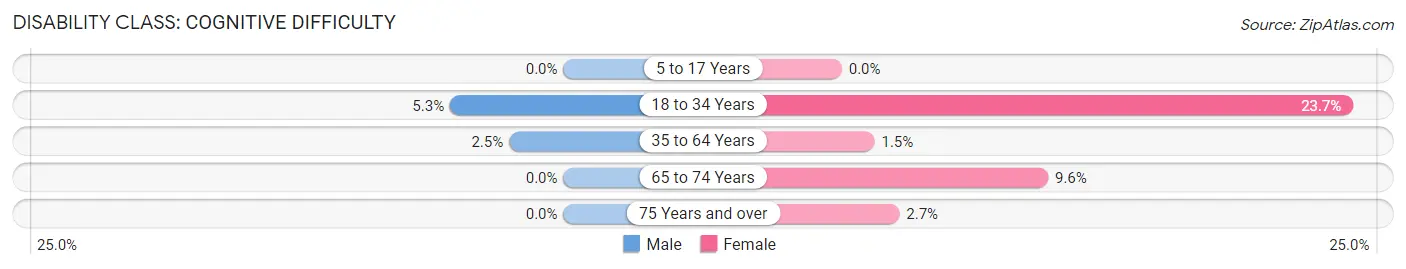
| Age Bracket | Male | Female |
| 5 to 17 Years | 0 (0.0%) | 0 (0.0%) |
| 18 to 34 Years | 17 (5.3%) | 70 (23.7%) |
| 35 to 64 Years | 11 (2.5%) | 7 (1.5%) |
| 65 to 74 Years | 0 (0.0%) | 11 (9.6%) |
| 75 Years and over | 0 (0.0%) | 5 (2.7%) |
Disability Class: Ambulatory Difficulty
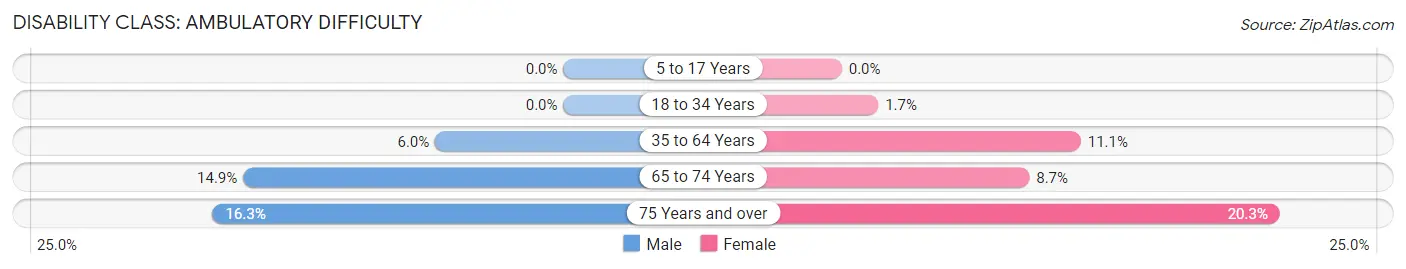
| Age Bracket | Male | Female |
| 5 to 17 Years | 0 (0.0%) | 0 (0.0%) |
| 18 to 34 Years | 0 (0.0%) | 5 (1.7%) |
| 35 to 64 Years | 26 (5.9%) | 51 (11.1%) |
| 65 to 74 Years | 11 (14.9%) | 10 (8.7%) |
| 75 Years and over | 14 (16.3%) | 38 (20.3%) |
Disability Class: Self-Care Difficulty
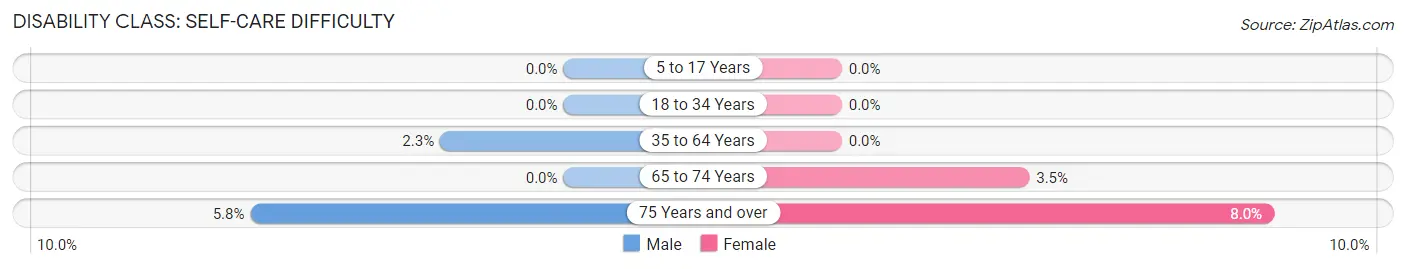
| Age Bracket | Male | Female |
| 5 to 17 Years | 0 (0.0%) | 0 (0.0%) |
| 18 to 34 Years | 0 (0.0%) | 0 (0.0%) |
| 35 to 64 Years | 10 (2.3%) | 0 (0.0%) |
| 65 to 74 Years | 0 (0.0%) | 4 (3.5%) |
| 75 Years and over | 5 (5.8%) | 15 (8.0%) |
Technology Access in South Greensburg borough
Computing Device Access in South Greensburg borough
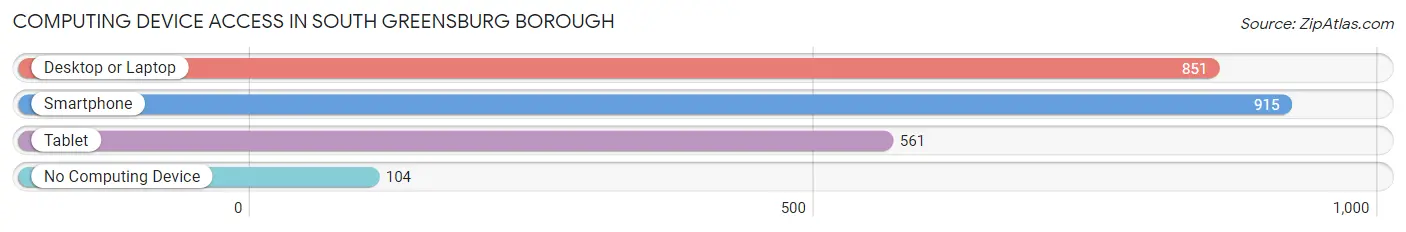
| Device Type | # Households | % Households |
| Desktop or Laptop | 851 | 75.4% |
| Smartphone | 915 | 81.0% |
| Tablet | 561 | 49.7% |
| No Computing Device | 104 | 9.2% |
| Total | 1,129 | 100.0% |
Internet Access in South Greensburg borough
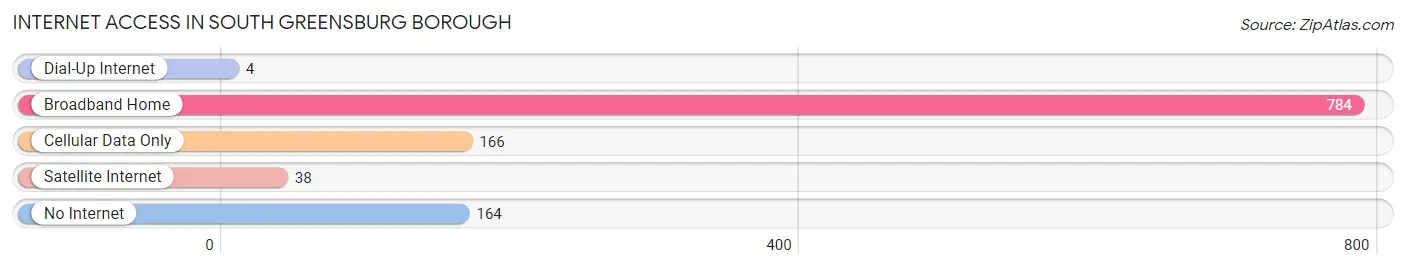
| Internet Type | # Households | % Households |
| Dial-Up Internet | 4 | 0.4% |
| Broadband Home | 784 | 69.4% |
| Cellular Data Only | 166 | 14.7% |
| Satellite Internet | 38 | 3.4% |
| No Internet | 164 | 14.5% |
| Total | 1,129 | 100.0% |
South Greensburg borough Summary
History
South Greensburg Borough is a small borough located in Westmoreland County, Pennsylvania. It is situated approximately seven miles southeast of the city of Greensburg. The borough was incorporated in 1891 and has a population of 1,845 as of the 2010 census.
The area that is now South Greensburg was first settled in the late 1700s by German and Scotch-Irish immigrants. The first settlers were primarily farmers, and the area was known as “Greensburg” after the nearby city of Greensburg. In 1891, the area was officially incorporated as South Greensburg Borough.
The borough was primarily an agricultural community until the early 1900s, when the coal industry began to take off in the area. The coal industry brought a large influx of immigrants to the area, primarily from Eastern Europe. This influx of immigrants helped to shape the culture and economy of South Greensburg.
The borough was also home to several manufacturing companies, including the South Greensburg Glass Company, which operated from the early 1900s until the late 1950s. The glass company was a major employer in the area and helped to shape the economy of South Greensburg.
The borough was also home to several churches, including the First Presbyterian Church, which was founded in 1891. The church is still active today and is a major part of the community.
Geography
South Greensburg Borough is located in Westmoreland County, Pennsylvania. It is situated approximately seven miles southeast of the city of Greensburg. The borough is bordered by the boroughs of Youngwood to the north, Southwest Greensburg to the east, and Hempfield Township to the south and west.
The borough is located in the Allegheny Plateau region of Pennsylvania and is characterized by rolling hills and valleys. The borough is located in the Monongahela River watershed and is home to several creeks, including Brush Run, Little Brush Run, and Big Brush Run.
The borough has a total area of 1.2 square miles, all of which is land. The borough is located at an elevation of 1,068 feet above sea level.
Economy
South Greensburg Borough has a diverse economy. The borough is home to several small businesses, including restaurants, retail stores, and professional services. The borough is also home to several manufacturing companies, including the South Greensburg Glass Company, which operated from the early 1900s until the late 1950s.
The borough is also home to several churches, including the First Presbyterian Church, which was founded in 1891. The church is still active today and is a major part of the community.
The borough is also home to several parks, including the South Greensburg Community Park, which features a playground, basketball court, and picnic pavilion. The borough is also home to the South Greensburg Historical Society, which is dedicated to preserving the history of the borough.
Demographics
As of the 2010 census, South Greensburg Borough had a population of 1,845. The racial makeup of the borough was 97.3% White, 0.9% African American, 0.2% Native American, 0.3% Asian, 0.1% from other races, and 1.2% from two or more races. Hispanic or Latino of any race were 0.7% of the population.
The median household income in the borough was $41,250, and the median family income was $50,000. The per capita income in the borough was $20,845. About 8.3% of families and 10.2% of the population were below the poverty line, including 14.3% of those under age 18 and 5.2% of those age 65 or over.
Common Questions
What is Per Capita Income in South Greensburg borough?
Per Capita income in South Greensburg borough is $33,188.
What is the Median Family Income in South Greensburg borough?
Median Family Income in South Greensburg borough is $70,341.
What is the Median Household income in South Greensburg borough?
Median Household Income in South Greensburg borough is $58,952.
What is Income or Wage Gap in South Greensburg borough?
Income or Wage Gap in South Greensburg borough is 36.5%.
Women in South Greensburg borough earn 63.5 cents for every dollar earned by a man.
What is Inequality or Gini Index in South Greensburg borough?
Inequality or Gini Index in South Greensburg borough is 0.39.
What is the Total Population of South Greensburg borough?
Total Population of South Greensburg borough is 2,282.
What is the Total Male Population of South Greensburg borough?
Total Male Population of South Greensburg borough is 1,107.
What is the Total Female Population of South Greensburg borough?
Total Female Population of South Greensburg borough is 1,175.
What is the Ratio of Males per 100 Females in South Greensburg borough?
There are 94.21 Males per 100 Females in South Greensburg borough.
What is the Ratio of Females per 100 Males in South Greensburg borough?
There are 106.14 Females per 100 Males in South Greensburg borough.
What is the Median Population Age in South Greensburg borough?
Median Population Age in South Greensburg borough is 44.4 Years.
What is the Average Family Size in South Greensburg borough
Average Family Size in South Greensburg borough is 2.9 People.
What is the Average Household Size in South Greensburg borough
Average Household Size in South Greensburg borough is 2.0 People.
How Large is the Labor Force in South Greensburg borough?
There are 1,158 People in the Labor Forcein in South Greensburg borough.
What is the Percentage of People in the Labor Force in South Greensburg borough?
56.6% of People are in the Labor Force in South Greensburg borough.
What is the Unemployment Rate in South Greensburg borough?
Unemployment Rate in South Greensburg borough is 2.8%.