Youngwood borough, PA Map & Demographics
Youngwood borough Overview
$35,041
PER CAPITA INCOME
$82,556
AVG FAMILY INCOME
$67,917
AVG HOUSEHOLD INCOME
44.6%
WAGE / INCOME GAP [ % ]
55.4¢/ $1
WAGE / INCOME GAP [ $ ]
0.36
INEQUALITY / GINI INDEX
2,955
TOTAL POPULATION
1,317
MALE POPULATION
1,638
FEMALE POPULATION
80.40
MALES / 100 FEMALES
124.37
FEMALES / 100 MALES
45.0
MEDIAN AGE
2.7
AVG FAMILY SIZE
2.1
AVG HOUSEHOLD SIZE
1,749
LABOR FORCE [ PEOPLE ]
69.7%
PERCENT IN LABOR FORCE
Income in Youngwood borough
Income Overview in Youngwood borough
Per Capita Income in Youngwood borough is $35,041, while median incomes of families and households are $82,556 and $67,917 respectively.
| Characteristic | Number | Measure |
| Per Capita Income | 2,955 | $35,041 |
| Median Family Income | 802 | $82,556 |
| Mean Family Income | 802 | $92,075 |
| Median Household Income | 1,371 | $67,917 |
| Mean Household Income | 1,371 | $74,306 |
| Income Deficit | 802 | $0 |
| Wage / Income Gap (%) | 2,955 | 44.58% |
| Wage / Income Gap ($) | 2,955 | 55.42¢ per $1 |
| Gini / Inequality Index | 2,955 | 0.36 |
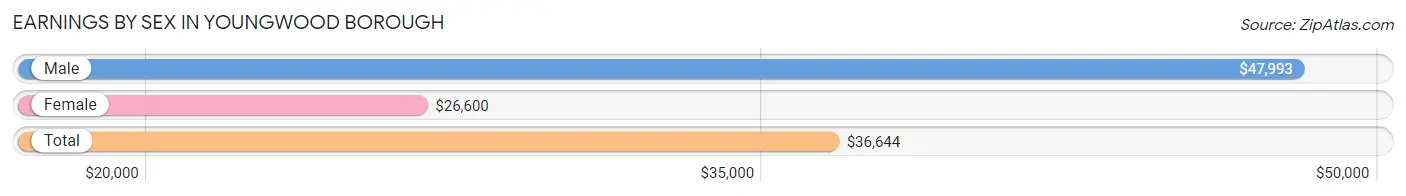
Earnings by Sex in Youngwood borough
Average Earnings in Youngwood borough are $36,644, $47,993 for men and $26,600 for women, a difference of 44.6%.
| Sex | Number | Average Earnings |
| Male | 977 (52.8%) | $47,993 |
| Female | 874 (47.2%) | $26,600 |
| Total | 1,851 (100.0%) | $36,644 |
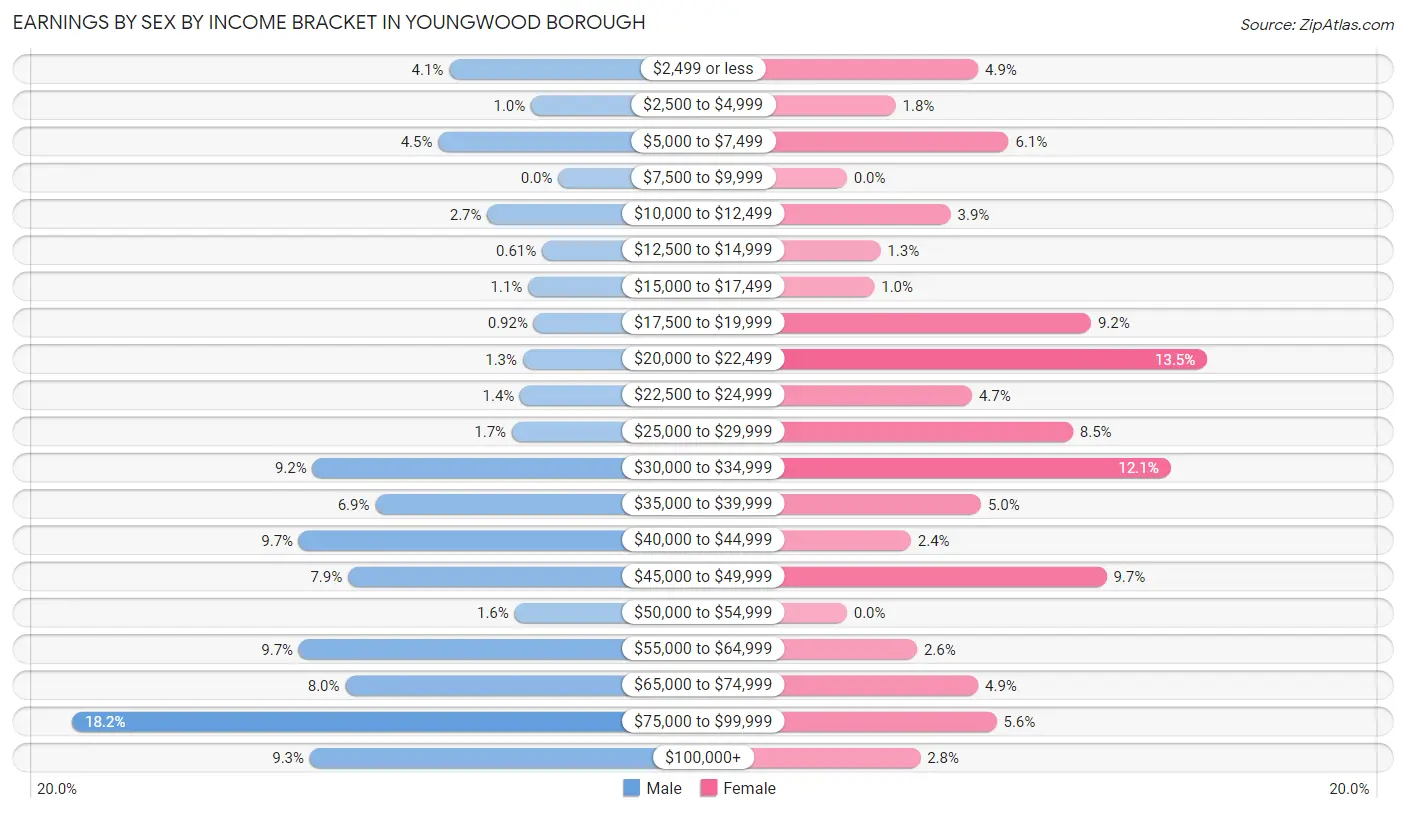
Earnings by Sex by Income Bracket in Youngwood borough
The most common earnings brackets in Youngwood borough are $75,000 to $99,999 for men (178 | 18.2%) and $20,000 to $22,499 for women (118 | 13.5%).
| Income | Male | Female |
| $2,499 or less | 40 (4.1%) | 43 (4.9%) |
| $2,500 to $4,999 | 10 (1.0%) | 16 (1.8%) |
| $5,000 to $7,499 | 44 (4.5%) | 53 (6.1%) |
| $7,500 to $9,999 | 0 (0.0%) | 0 (0.0%) |
| $10,000 to $12,499 | 26 (2.7%) | 34 (3.9%) |
| $12,500 to $14,999 | 6 (0.6%) | 11 (1.3%) |
| $15,000 to $17,499 | 11 (1.1%) | 9 (1.0%) |
| $17,500 to $19,999 | 9 (0.9%) | 80 (9.1%) |
| $20,000 to $22,499 | 13 (1.3%) | 118 (13.5%) |
| $22,500 to $24,999 | 14 (1.4%) | 41 (4.7%) |
| $25,000 to $29,999 | 17 (1.7%) | 74 (8.5%) |
| $30,000 to $34,999 | 90 (9.2%) | 106 (12.1%) |
| $35,000 to $39,999 | 67 (6.9%) | 44 (5.0%) |
| $40,000 to $44,999 | 95 (9.7%) | 21 (2.4%) |
| $45,000 to $49,999 | 77 (7.9%) | 85 (9.7%) |
| $50,000 to $54,999 | 16 (1.6%) | 0 (0.0%) |
| $55,000 to $64,999 | 95 (9.7%) | 23 (2.6%) |
| $65,000 to $74,999 | 78 (8.0%) | 43 (4.9%) |
| $75,000 to $99,999 | 178 (18.2%) | 49 (5.6%) |
| $100,000+ | 91 (9.3%) | 24 (2.8%) |
| Total | 977 (100.0%) | 874 (100.0%) |
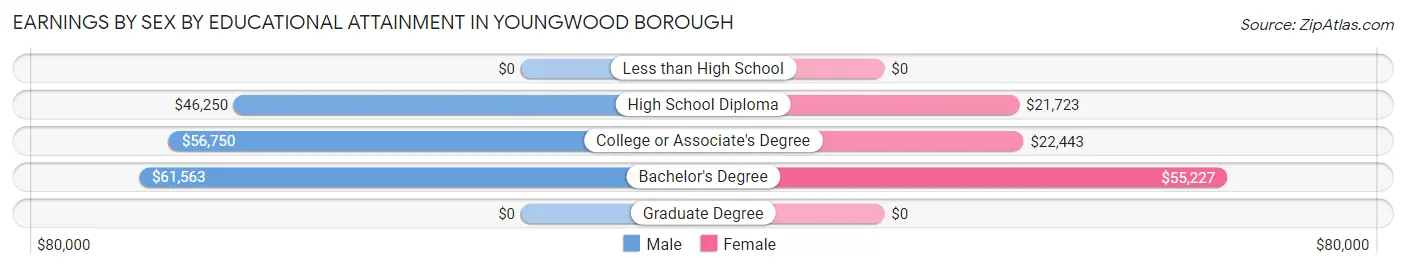
Earnings by Sex by Educational Attainment in Youngwood borough
Average earnings in Youngwood borough are $56,722 for men and $31,642 for women, a difference of 44.2%. Men with an educational attainment of bachelor's degree enjoy the highest average annual earnings of $61,563, while those with high school diploma education earn the least with $46,250. Women with an educational attainment of bachelor's degree earn the most with the average annual earnings of $55,227, while those with high school diploma education have the smallest earnings of $21,723.
| Educational Attainment | Male Income | Female Income |
| Less than High School | - | - |
| High School Diploma | $46,250 | $21,723 |
| College or Associate's Degree | $56,750 | $22,443 |
| Bachelor's Degree | $61,563 | $55,227 |
| Graduate Degree | - | - |
| Total | $56,722 | $31,642 |
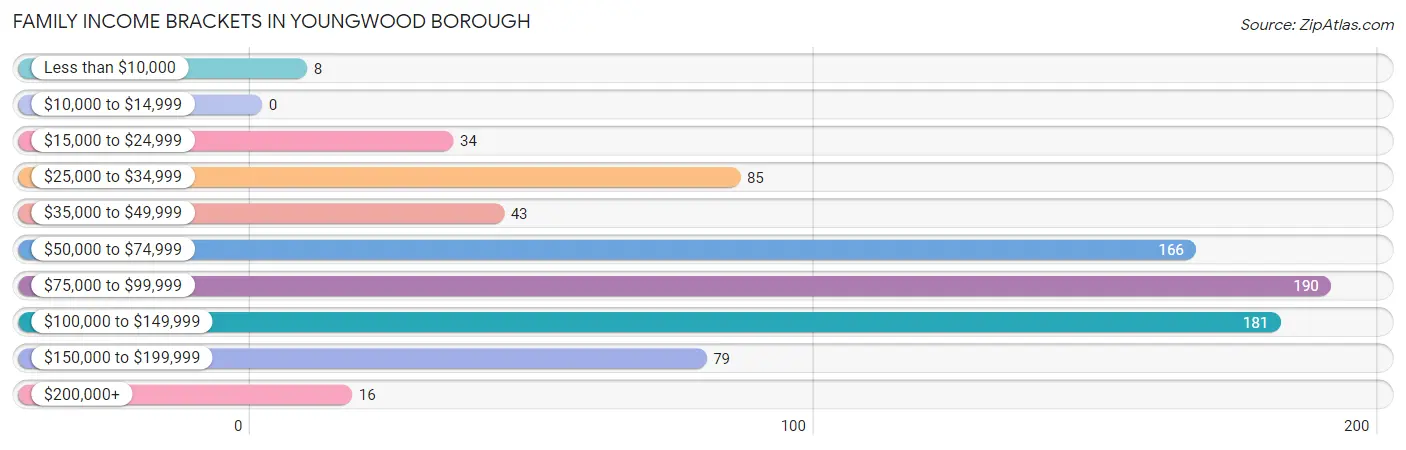
Family Income in Youngwood borough
Family Income Brackets in Youngwood borough
According to the Youngwood borough family income data, there are 190 families falling into the $75,000 to $99,999 income range, which is the most common income bracket and makes up 23.7% of all families.
| Income Bracket | # Families | % Families |
| Less than $10,000 | 8 | 1.0% |
| $10,000 to $14,999 | 0 | 0.0% |
| $15,000 to $24,999 | 34 | 4.2% |
| $25,000 to $34,999 | 85 | 10.6% |
| $35,000 to $49,999 | 43 | 5.4% |
| $50,000 to $74,999 | 166 | 20.7% |
| $75,000 to $99,999 | 190 | 23.7% |
| $100,000 to $149,999 | 181 | 22.6% |
| $150,000 to $199,999 | 79 | 9.9% |
| $200,000+ | 16 | 2.0% |
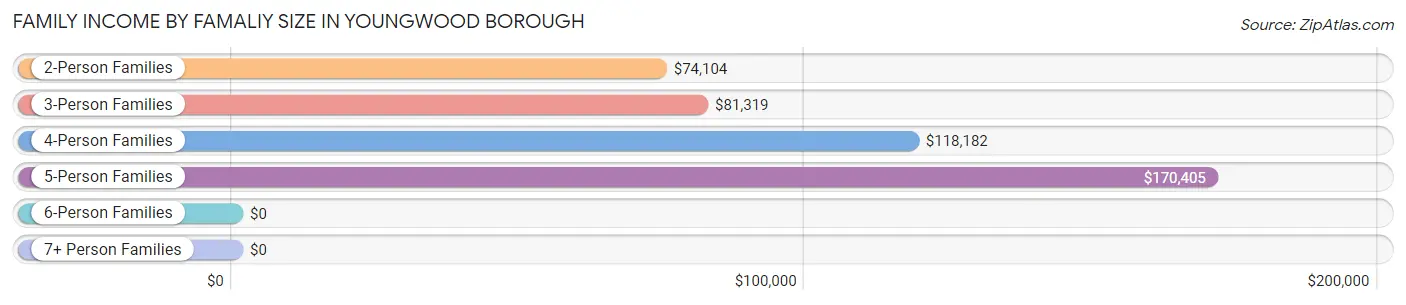
Family Income by Famaliy Size in Youngwood borough
5-person families (62 | 7.7%) account for the highest median family income in Youngwood borough with $170,405 per family, while 2-person families (454 | 56.6%) have the highest median income of $37,052 per family member.
| Income Bracket | # Families | Median Income |
| 2-Person Families | 454 (56.6%) | $74,104 |
| 3-Person Families | 218 (27.2%) | $81,319 |
| 4-Person Families | 68 (8.5%) | $118,182 |
| 5-Person Families | 62 (7.7%) | $170,405 |
| 6-Person Families | 0 (0.0%) | $0 |
| 7+ Person Families | 0 (0.0%) | $0 |
| Total | 802 (100.0%) | $82,556 |
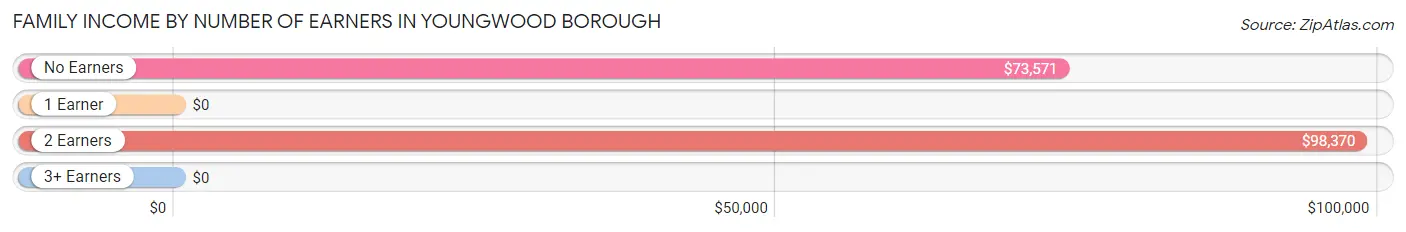
Family Income by Number of Earners in Youngwood borough
| Number of Earners | # Families | Median Income |
| No Earners | 110 (13.7%) | $73,571 |
| 1 Earner | 172 (21.4%) | $0 |
| 2 Earners | 452 (56.4%) | $98,370 |
| 3+ Earners | 68 (8.5%) | $0 |
| Total | 802 (100.0%) | $82,556 |
Household Income in Youngwood borough
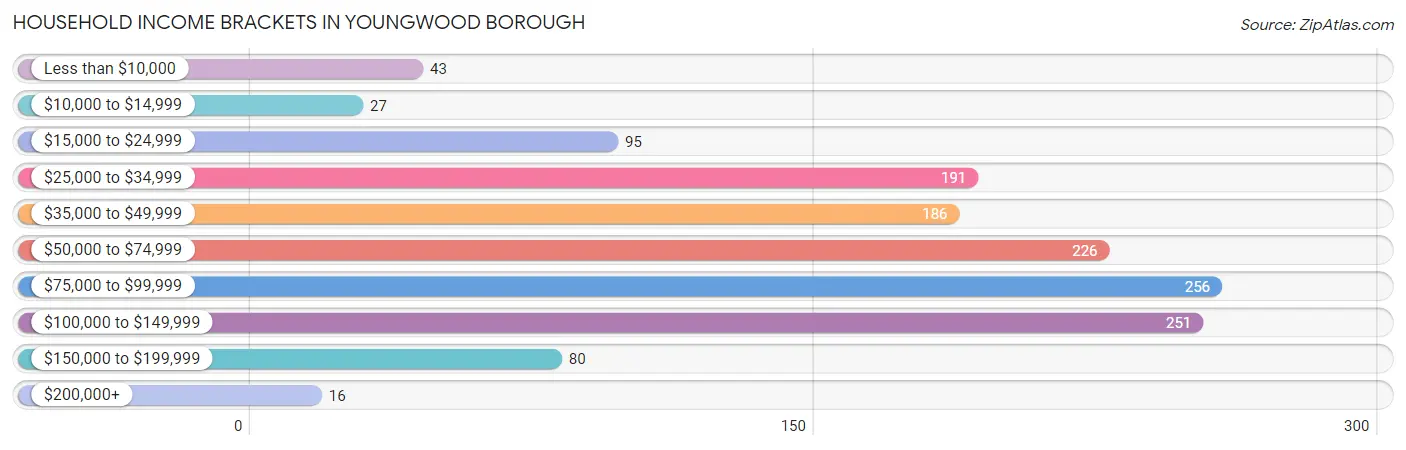
Household Income Brackets in Youngwood borough
With 256 households falling in the category, the $75,000 to $99,999 income range is the most frequent in Youngwood borough, accounting for 18.7% of all households. In contrast, only 16 households (1.2%) fall into the $200,000+ income bracket, making it the least populous group.
| Income Bracket | # Households | % Households |
| Less than $10,000 | 43 | 3.1% |
| $10,000 to $14,999 | 27 | 2.0% |
| $15,000 to $24,999 | 95 | 6.9% |
| $25,000 to $34,999 | 191 | 13.9% |
| $35,000 to $49,999 | 186 | 13.6% |
| $50,000 to $74,999 | 226 | 16.5% |
| $75,000 to $99,999 | 256 | 18.7% |
| $100,000 to $149,999 | 251 | 18.3% |
| $150,000 to $199,999 | 80 | 5.8% |
| $200,000+ | 16 | 1.2% |
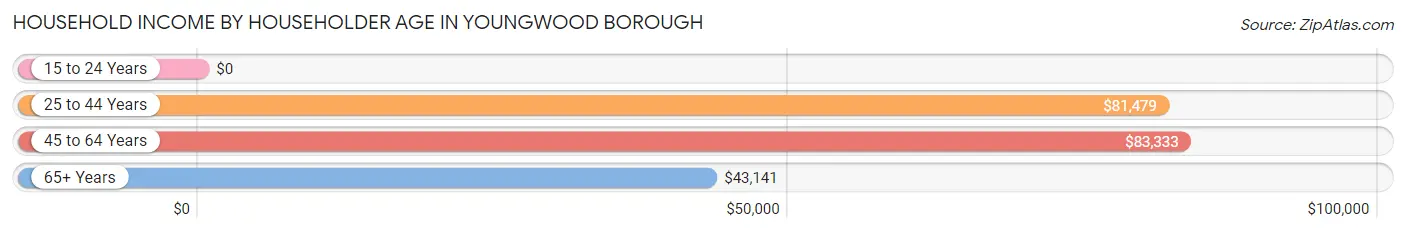
Household Income by Householder Age in Youngwood borough
The median household income in Youngwood borough is $67,917, with the highest median household income of $83,333 found in the 45 to 64 years age bracket for the primary householder. A total of 504 households (36.8%) fall into this category. Meanwhile, the 15 to 24 years age bracket for the primary householder has the lowest median household income of $0, with 100 households (7.3%) in this group.
| Income Bracket | # Households | Median Income |
| 15 to 24 Years | 100 (7.3%) | $0 |
| 25 to 44 Years | 395 (28.8%) | $81,479 |
| 45 to 64 Years | 504 (36.8%) | $83,333 |
| 65+ Years | 372 (27.1%) | $43,141 |
| Total | 1,371 (100.0%) | $67,917 |
Poverty in Youngwood borough
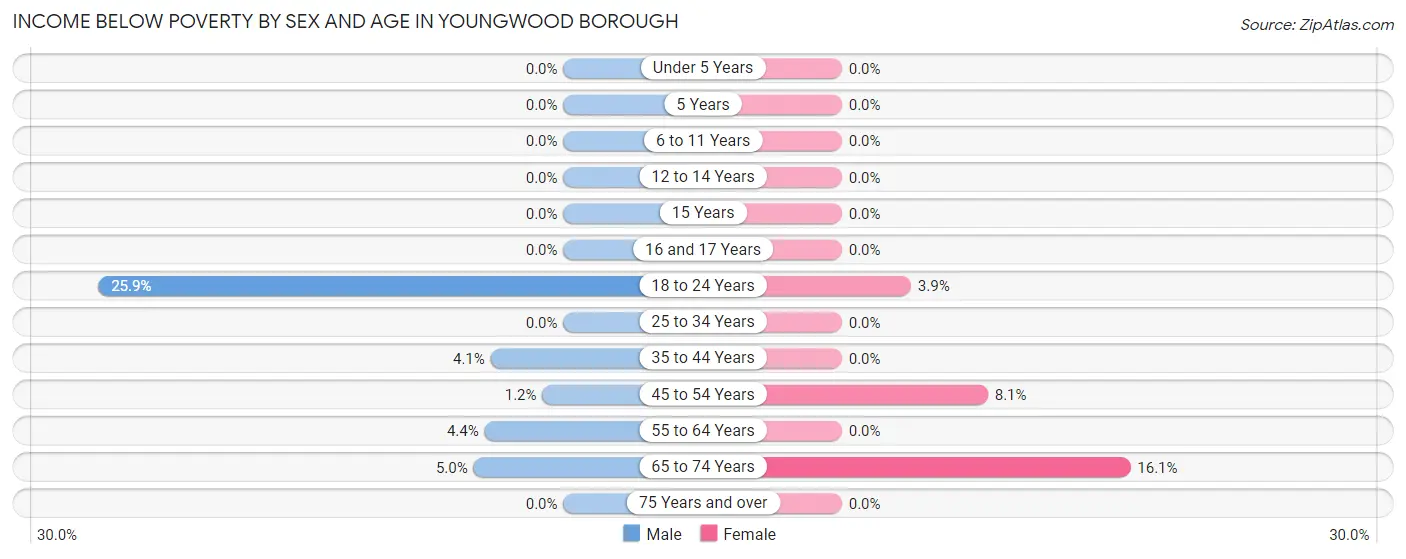
Income Below Poverty by Sex and Age in Youngwood borough
With 5.1% poverty level for males and 3.3% for females among the residents of Youngwood borough, 18 to 24 year old males and 65 to 74 year old females are the most vulnerable to poverty, with 43 males (25.9%) and 27 females (16.1%) in their respective age groups living below the poverty level.
| Age Bracket | Male | Female |
| Under 5 Years | 0 (0.0%) | 0 (0.0%) |
| 5 Years | 0 (0.0%) | 0 (0.0%) |
| 6 to 11 Years | 0 (0.0%) | 0 (0.0%) |
| 12 to 14 Years | 0 (0.0%) | 0 (0.0%) |
| 15 Years | 0 (0.0%) | 0 (0.0%) |
| 16 and 17 Years | 0 (0.0%) | 0 (0.0%) |
| 18 to 24 Years | 43 (25.9%) | 6 (3.8%) |
| 25 to 34 Years | 0 (0.0%) | 0 (0.0%) |
| 35 to 44 Years | 6 (4.1%) | 0 (0.0%) |
| 45 to 54 Years | 3 (1.2%) | 20 (8.1%) |
| 55 to 64 Years | 9 (4.4%) | 0 (0.0%) |
| 65 to 74 Years | 5 (5.0%) | 27 (16.1%) |
| 75 Years and over | 0 (0.0%) | 0 (0.0%) |
| Total | 66 (5.1%) | 53 (3.3%) |
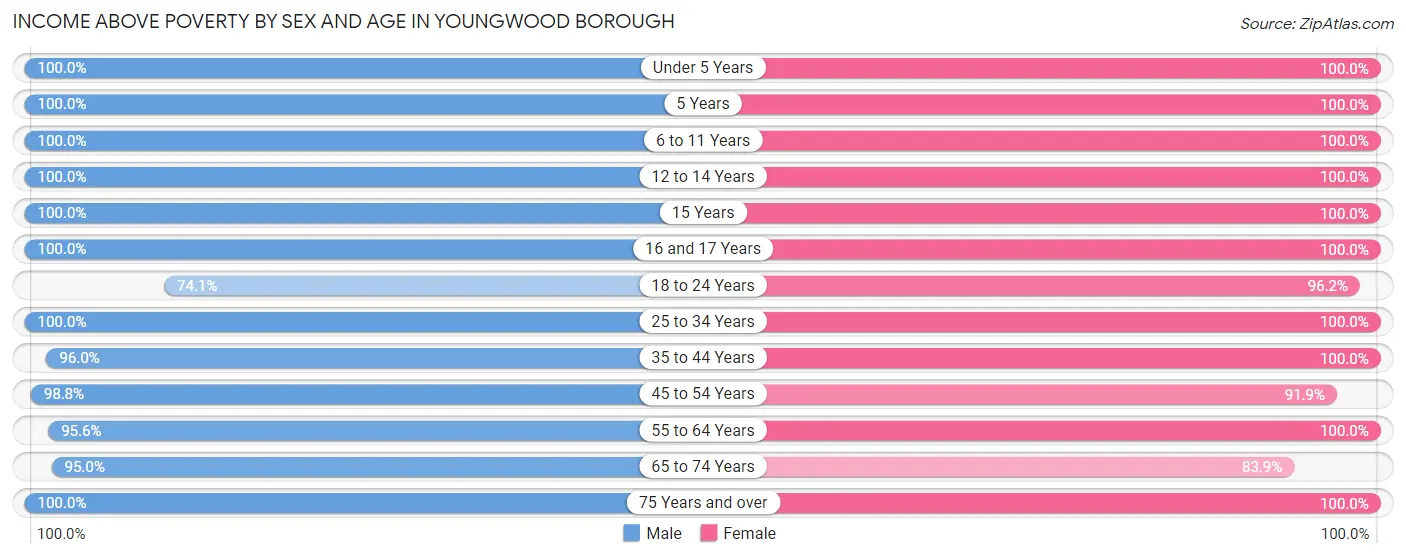
Income Above Poverty by Sex and Age in Youngwood borough
According to the poverty statistics in Youngwood borough, males aged under 5 years and females aged under 5 years are the age groups that are most secure financially, with 100.0% of males and 100.0% of females in these age groups living above the poverty line.
| Age Bracket | Male | Female |
| Under 5 Years | 20 (100.0%) | 10 (100.0%) |
| 5 Years | 14 (100.0%) | 23 (100.0%) |
| 6 to 11 Years | 33 (100.0%) | 168 (100.0%) |
| 12 to 14 Years | 39 (100.0%) | 81 (100.0%) |
| 15 Years | 25 (100.0%) | 5 (100.0%) |
| 16 and 17 Years | 14 (100.0%) | 49 (100.0%) |
| 18 to 24 Years | 123 (74.1%) | 150 (96.2%) |
| 25 to 34 Years | 175 (100.0%) | 174 (100.0%) |
| 35 to 44 Years | 142 (96.0%) | 147 (100.0%) |
| 45 to 54 Years | 254 (98.8%) | 226 (91.9%) |
| 55 to 64 Years | 196 (95.6%) | 194 (100.0%) |
| 65 to 74 Years | 95 (95.0%) | 141 (83.9%) |
| 75 Years and over | 90 (100.0%) | 179 (100.0%) |
| Total | 1,220 (94.9%) | 1,547 (96.7%) |
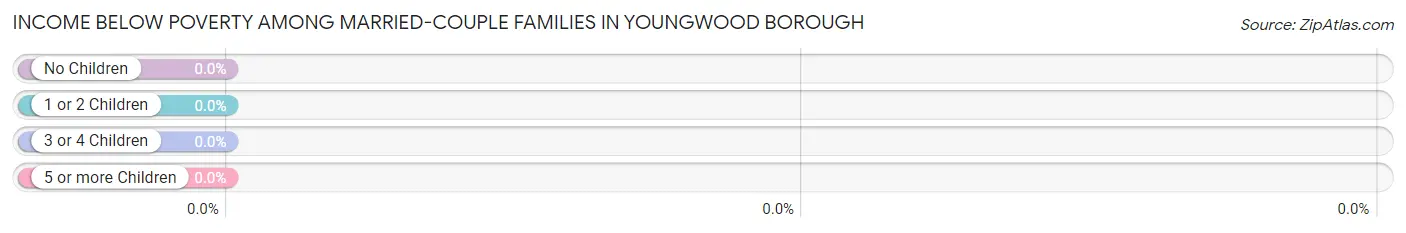
Income Below Poverty Among Married-Couple Families in Youngwood borough
| Children | Above Poverty | Below Poverty |
| No Children | 418 (100.0%) | 0 (0.0%) |
| 1 or 2 Children | 126 (100.0%) | 0 (0.0%) |
| 3 or 4 Children | 57 (100.0%) | 0 (0.0%) |
| 5 or more Children | 0 (0.0%) | 0 (0.0%) |
| Total | 601 (100.0%) | 0 (0.0%) |
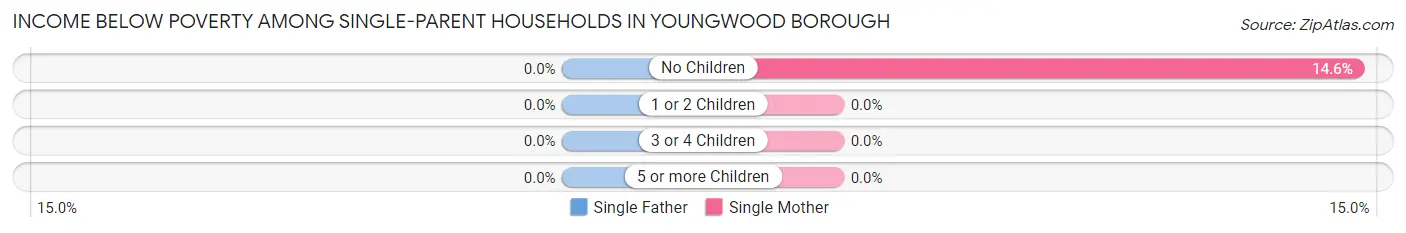
Income Below Poverty Among Single-Parent Households in Youngwood borough
| Children | Single Father | Single Mother |
| No Children | 0 (0.0%) | 8 (14.5%) |
| 1 or 2 Children | 0 (0.0%) | 0 (0.0%) |
| 3 or 4 Children | 0 (0.0%) | 0 (0.0%) |
| 5 or more Children | 0 (0.0%) | 0 (0.0%) |
| Total | 0 (0.0%) | 8 (7.1%) |
Income Below Poverty Among Married-Couple vs Single-Parent Households in Youngwood borough
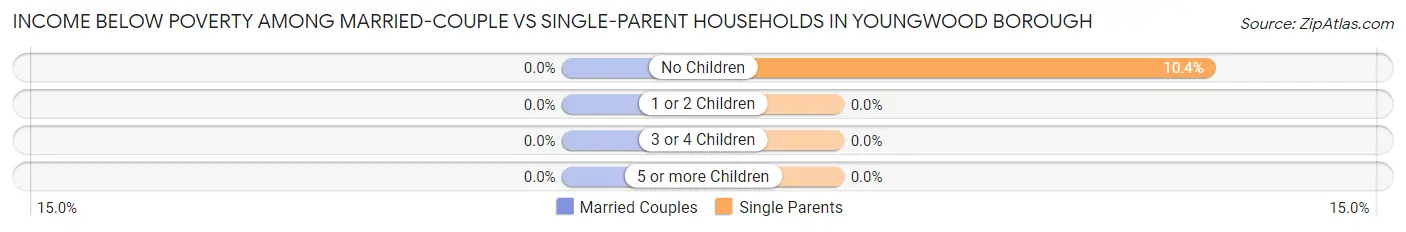
| Children | Married-Couple Families | Single-Parent Households |
| No Children | 0 (0.0%) | 8 (10.4%) |
| 1 or 2 Children | 0 (0.0%) | 0 (0.0%) |
| 3 or 4 Children | 0 (0.0%) | 0 (0.0%) |
| 5 or more Children | 0 (0.0%) | 0 (0.0%) |
| Total | 0 (0.0%) | 8 (4.0%) |
Race in Youngwood borough
The most populous races in Youngwood borough are White / Caucasian (2,763 | 93.5%), Two or more Races (139 | 4.7%), and Some other Race (28 | 0.9%).
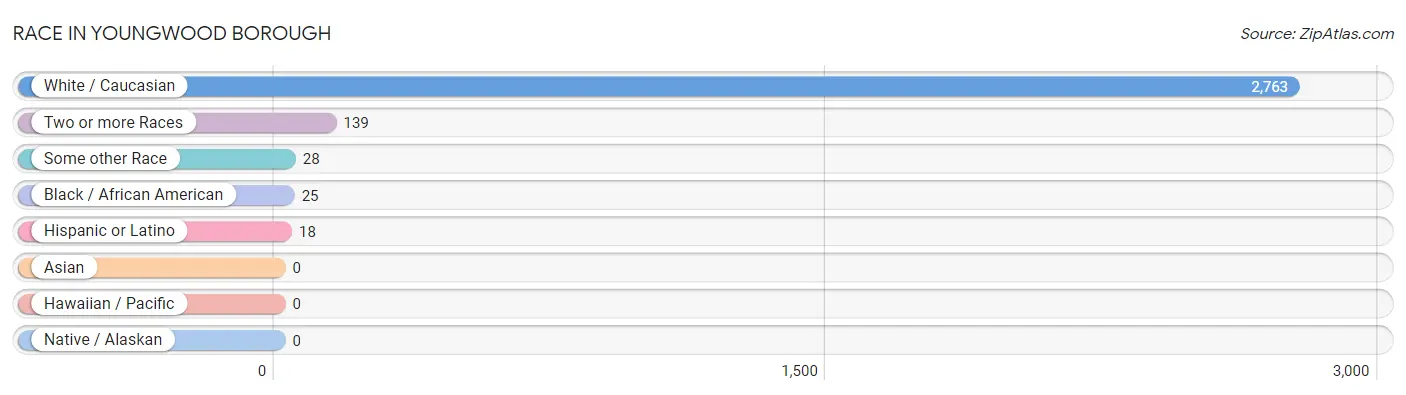
| Race | # Population | % Population |
| Asian | 0 | 0.0% |
| Black / African American | 25 | 0.9% |
| Hawaiian / Pacific | 0 | 0.0% |
| Hispanic or Latino | 18 | 0.6% |
| Native / Alaskan | 0 | 0.0% |
| White / Caucasian | 2,763 | 93.5% |
| Two or more Races | 139 | 4.7% |
| Some other Race | 28 | 0.9% |
| Total | 2,955 | 100.0% |
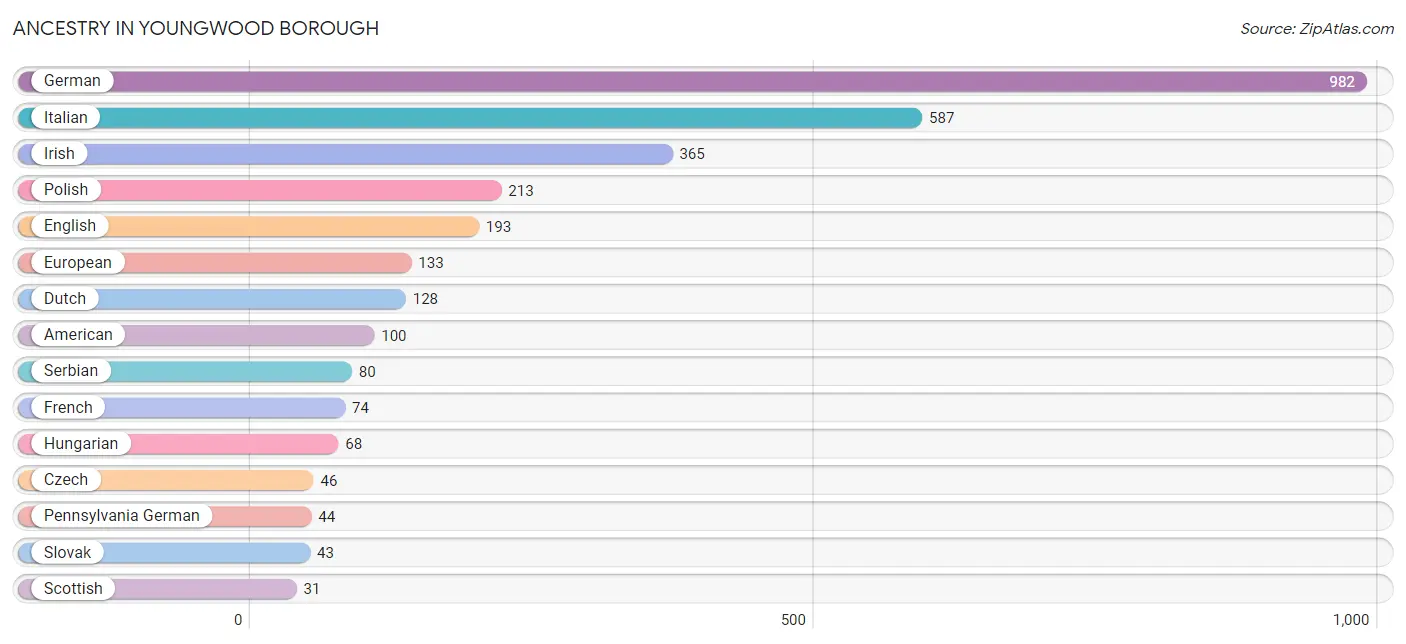
Ancestry in Youngwood borough
The most populous ancestries reported in Youngwood borough are German (982 | 33.2%), Italian (587 | 19.9%), Irish (365 | 12.3%), Polish (213 | 7.2%), and English (193 | 6.5%), together accounting for 79.2% of all Youngwood borough residents.
| Ancestry | # Population | % Population |
| American | 100 | 3.4% |
| Arab | 11 | 0.4% |
| Barbadian | 25 | 0.9% |
| Belgian | 8 | 0.3% |
| British | 25 | 0.9% |
| Canadian | 5 | 0.2% |
| Cherokee | 15 | 0.5% |
| Croatian | 3 | 0.1% |
| Czech | 46 | 1.6% |
| Czechoslovakian | 24 | 0.8% |
| Dutch | 128 | 4.3% |
| Eastern European | 24 | 0.8% |
| English | 193 | 6.5% |
| European | 133 | 4.5% |
| French | 74 | 2.5% |
| French Canadian | 16 | 0.5% |
| German | 982 | 33.2% |
| Hungarian | 68 | 2.3% |
| Irish | 365 | 12.3% |
| Italian | 587 | 19.9% |
| Pennsylvania German | 44 | 1.5% |
| Polish | 213 | 7.2% |
| Puerto Rican | 18 | 0.6% |
| Russian | 13 | 0.4% |
| Scotch-Irish | 17 | 0.6% |
| Scottish | 31 | 1.1% |
| Serbian | 80 | 2.7% |
| Slovak | 43 | 1.5% |
| Slovene | 21 | 0.7% |
| Swedish | 9 | 0.3% |
| Syrian | 11 | 0.4% |
| Ukrainian | 13 | 0.4% |
| Yugoslavian | 29 | 1.0% | View All 33 Rows |
Immigrants in Youngwood borough
The most numerous immigrant groups reported in Youngwood borough came from Europe (3 | 0.1%), Northern Europe (3 | 0.1%), and Scotland (3 | 0.1%), together accounting for 0.3% of all Youngwood borough residents.
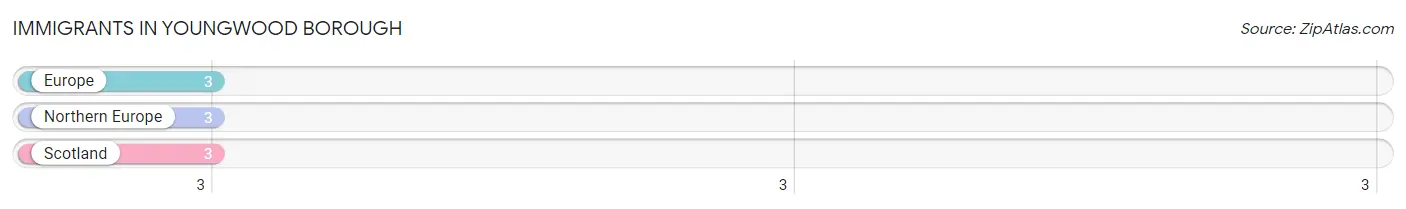
| Immigration Origin | # Population | % Population |
| Europe | 3 | 0.1% |
| Northern Europe | 3 | 0.1% |
| Scotland | 3 | 0.1% | View All 3 Rows |
Sex and Age in Youngwood borough
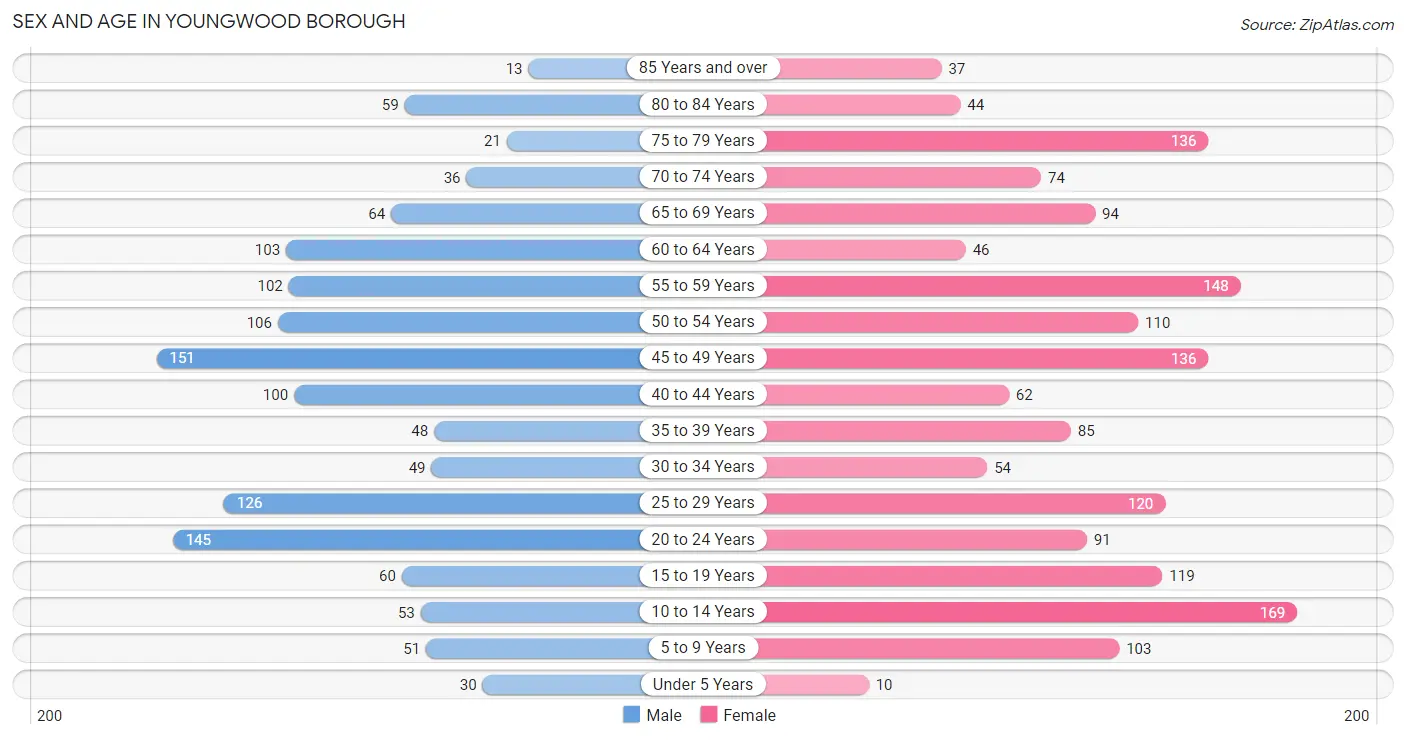
Sex and Age in Youngwood borough
The most populous age groups in Youngwood borough are 45 to 49 Years (151 | 11.5%) for men and 10 to 14 Years (169 | 10.3%) for women.
| Age Bracket | Male | Female |
| Under 5 Years | 30 (2.3%) | 10 (0.6%) |
| 5 to 9 Years | 51 (3.9%) | 103 (6.3%) |
| 10 to 14 Years | 53 (4.0%) | 169 (10.3%) |
| 15 to 19 Years | 60 (4.6%) | 119 (7.3%) |
| 20 to 24 Years | 145 (11.0%) | 91 (5.6%) |
| 25 to 29 Years | 126 (9.6%) | 120 (7.3%) |
| 30 to 34 Years | 49 (3.7%) | 54 (3.3%) |
| 35 to 39 Years | 48 (3.6%) | 85 (5.2%) |
| 40 to 44 Years | 100 (7.6%) | 62 (3.8%) |
| 45 to 49 Years | 151 (11.5%) | 136 (8.3%) |
| 50 to 54 Years | 106 (8.1%) | 110 (6.7%) |
| 55 to 59 Years | 102 (7.7%) | 148 (9.0%) |
| 60 to 64 Years | 103 (7.8%) | 46 (2.8%) |
| 65 to 69 Years | 64 (4.9%) | 94 (5.7%) |
| 70 to 74 Years | 36 (2.7%) | 74 (4.5%) |
| 75 to 79 Years | 21 (1.6%) | 136 (8.3%) |
| 80 to 84 Years | 59 (4.5%) | 44 (2.7%) |
| 85 Years and over | 13 (1.0%) | 37 (2.3%) |
| Total | 1,317 (100.0%) | 1,638 (100.0%) |
Families and Households in Youngwood borough
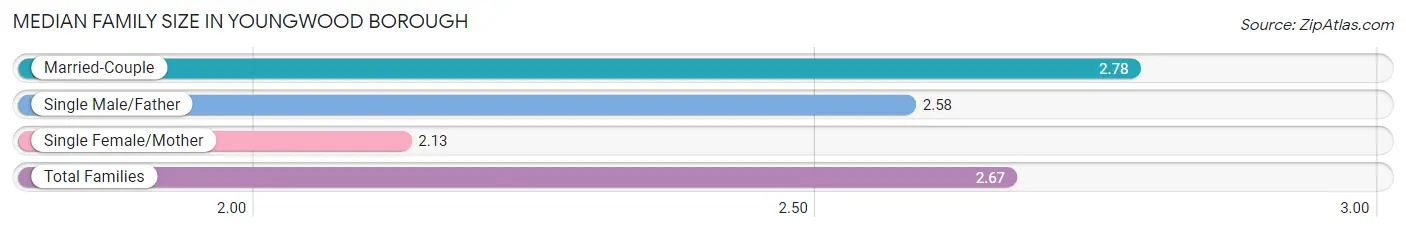
Median Family Size in Youngwood borough
The median family size in Youngwood borough is 2.67 persons per family, with married-couple families (601 | 74.9%) accounting for the largest median family size of 2.78 persons per family. On the other hand, single female/mother families (112 | 14.0%) represent the smallest median family size with 2.13 persons per family.
| Family Type | # Families | Family Size |
| Married-Couple | 601 (74.9%) | 2.78 |
| Single Male/Father | 89 (11.1%) | 2.58 |
| Single Female/Mother | 112 (14.0%) | 2.13 |
| Total Families | 802 (100.0%) | 2.67 |
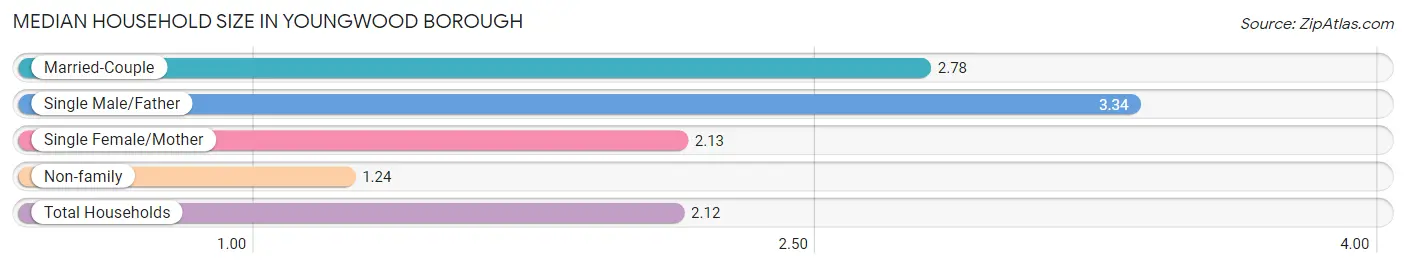
Median Household Size in Youngwood borough
The median household size in Youngwood borough is 2.12 persons per household, with single male/father households (89 | 6.5%) accounting for the largest median household size of 3.34 persons per household. non-family households (569 | 41.5%) represent the smallest median household size with 1.24 persons per household.
| Household Type | # Households | Household Size |
| Married-Couple | 601 (43.8%) | 2.78 |
| Single Male/Father | 89 (6.5%) | 3.34 |
| Single Female/Mother | 112 (8.2%) | 2.13 |
| Non-family | 569 (41.5%) | 1.24 |
| Total Households | 1,371 (100.0%) | 2.12 |
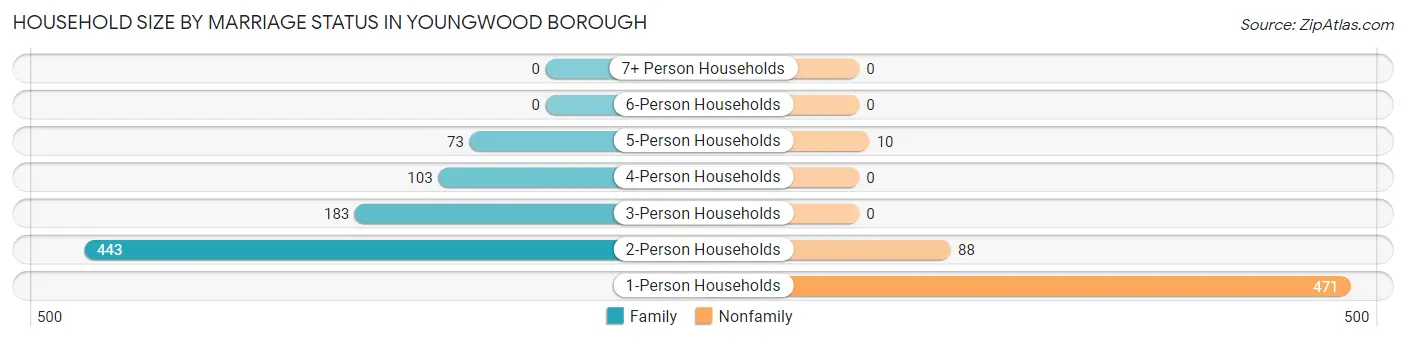
Household Size by Marriage Status in Youngwood borough
Out of a total of 1,371 households in Youngwood borough, 802 (58.5%) are family households, while 569 (41.5%) are nonfamily households. The most numerous type of family households are 2-person households, comprising 443, and the most common type of nonfamily households are 1-person households, comprising 471.
| Household Size | Family Households | Nonfamily Households |
| 1-Person Households | - | 471 (34.4%) |
| 2-Person Households | 443 (32.3%) | 88 (6.4%) |
| 3-Person Households | 183 (13.4%) | 0 (0.0%) |
| 4-Person Households | 103 (7.5%) | 0 (0.0%) |
| 5-Person Households | 73 (5.3%) | 10 (0.7%) |
| 6-Person Households | 0 (0.0%) | 0 (0.0%) |
| 7+ Person Households | 0 (0.0%) | 0 (0.0%) |
| Total | 802 (58.5%) | 569 (41.5%) |
Female Fertility in Youngwood borough
Fertility by Age in Youngwood borough
Average fertility rate in Youngwood borough is 63.0 births per 1,000 women. Women in the age bracket of 15 to 19 years have the highest fertility rate with 210.0 births per 1,000 women. Women in the age bracket of 15 to 19 years acount for 59.5% of all women with births.
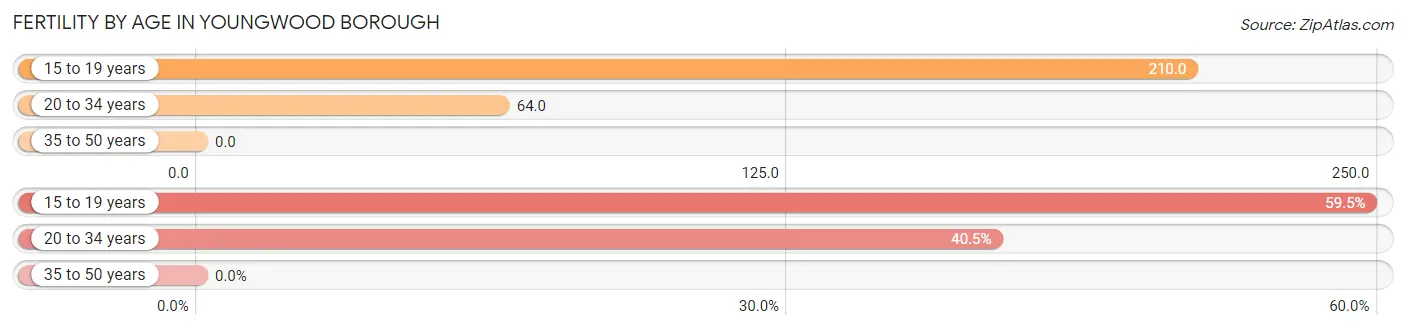
| Age Bracket | Women with Births | Births / 1,000 Women |
| 15 to 19 years | 25 (59.5%) | 210.0 |
| 20 to 34 years | 17 (40.5%) | 64.0 |
| 35 to 50 years | 0 (0.0%) | 0.0 |
| Total | 42 (100.0%) | 63.0 |
Fertility by Age by Marriage Status in Youngwood borough
40.5% of women with births (42) in Youngwood borough are married. The highest percentage of unmarried women with births falls into 15 to 19 years age bracket with 100.0% of them unmarried at the time of birth, while the lowest percentage of unmarried women with births belong to 20 to 34 years age bracket with 0.0% of them unmarried.
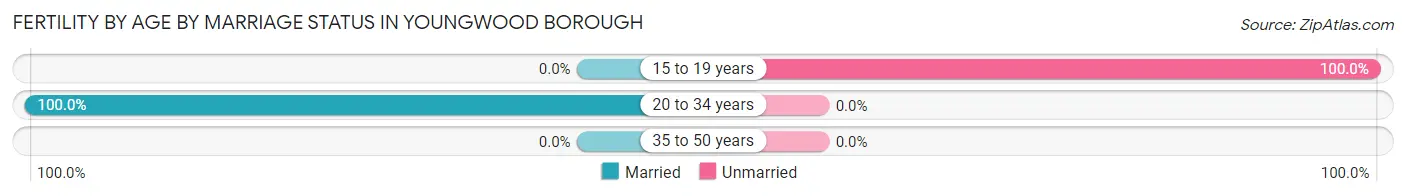
| Age Bracket | Married | Unmarried |
| 15 to 19 years | 0 (0.0%) | 25 (100.0%) |
| 20 to 34 years | 17 (100.0%) | 0 (0.0%) |
| 35 to 50 years | 0 (0.0%) | 0 (0.0%) |
| Total | 17 (40.5%) | 25 (59.5%) |
Fertility by Education in Youngwood borough
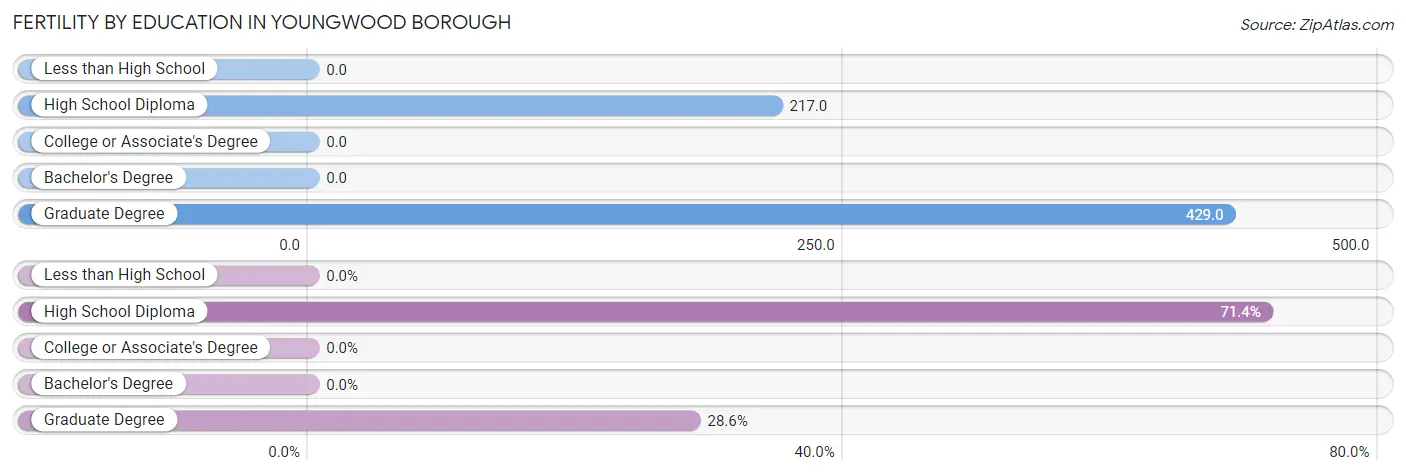
| Educational Attainment | Women with Births | Births / 1,000 Women |
| Less than High School | 0 (0.0%) | 0.0 |
| High School Diploma | 30 (71.4%) | 217.0 |
| College or Associate's Degree | 0 (0.0%) | 0.0 |
| Bachelor's Degree | 0 (0.0%) | 0.0 |
| Graduate Degree | 12 (28.6%) | 429.0 |
| Total | 42 (100.0%) | 63.0 |
Fertility by Education by Marriage Status in Youngwood borough
59.5% of women with births in Youngwood borough are unmarried. Women with the educational attainment of graduate degree are most likely to be married with 100.0% of them married at childbirth, while women with the educational attainment of high school diploma are least likely to be married with 83.3% of them unmarried at childbirth.
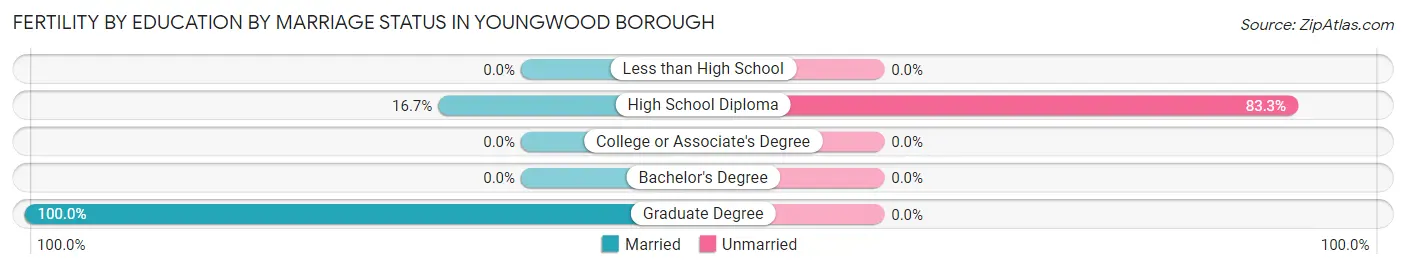
| Educational Attainment | Married | Unmarried |
| Less than High School | 0 (0.0%) | 0 (0.0%) |
| High School Diploma | 5 (16.7%) | 25 (83.3%) |
| College or Associate's Degree | 0 (0.0%) | 0 (0.0%) |
| Bachelor's Degree | 0 (0.0%) | 0 (0.0%) |
| Graduate Degree | 12 (100.0%) | 0 (0.0%) |
| Total | 17 (40.5%) | 25 (59.5%) |
Employment Characteristics in Youngwood borough
Employment by Class of Employer in Youngwood borough
Among the 1,712 employed individuals in Youngwood borough, private company employees (1,247 | 72.8%), not-for-profit organizations (289 | 16.9%), and local government employees (82 | 4.8%) make up the most common classes of employment.
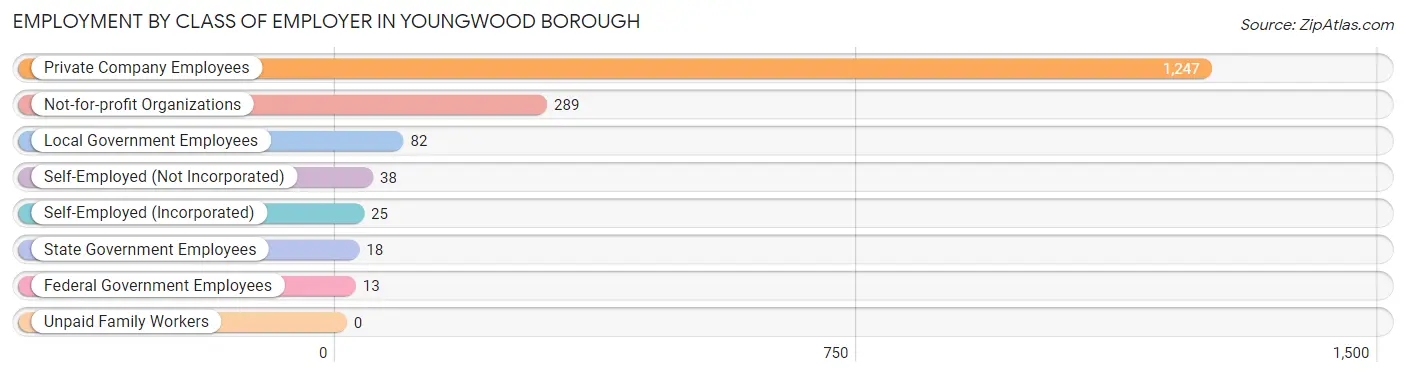
| Employer Class | # Employees | % Employees |
| Private Company Employees | 1,247 | 72.8% |
| Self-Employed (Incorporated) | 25 | 1.5% |
| Self-Employed (Not Incorporated) | 38 | 2.2% |
| Not-for-profit Organizations | 289 | 16.9% |
| Local Government Employees | 82 | 4.8% |
| State Government Employees | 18 | 1.1% |
| Federal Government Employees | 13 | 0.8% |
| Unpaid Family Workers | 0 | 0.0% |
| Total | 1,712 | 100.0% |
Employment Status by Age in Youngwood borough
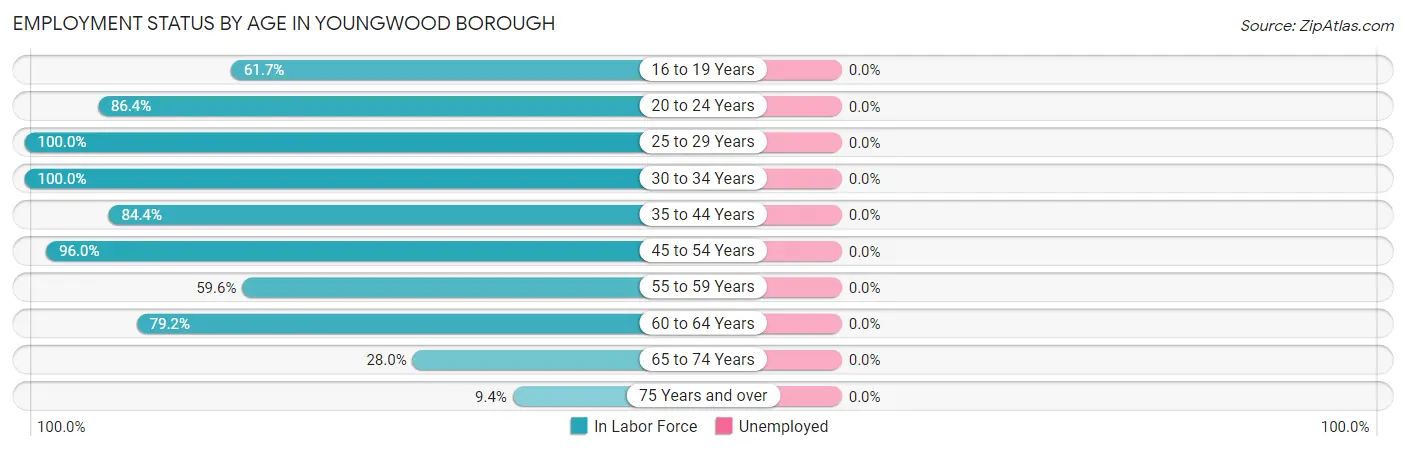
| Age Bracket | In Labor Force | Unemployed |
| 16 to 19 Years | 92 (61.7%) | 0 (0.0%) |
| 20 to 24 Years | 204 (86.4%) | 0 (0.0%) |
| 25 to 29 Years | 246 (100.0%) | 0 (0.0%) |
| 30 to 34 Years | 103 (100.0%) | 0 (0.0%) |
| 35 to 44 Years | 249 (84.4%) | 0 (0.0%) |
| 45 to 54 Years | 483 (96.0%) | 0 (0.0%) |
| 55 to 59 Years | 149 (59.6%) | 0 (0.0%) |
| 60 to 64 Years | 118 (79.2%) | 0 (0.0%) |
| 65 to 74 Years | 75 (28.0%) | 0 (0.0%) |
| 75 Years and over | 29 (9.4%) | 0 (0.0%) |
| Total | 1,749 (69.7%) | 0 (0.0%) |
Employment Status by Educational Attainment in Youngwood borough
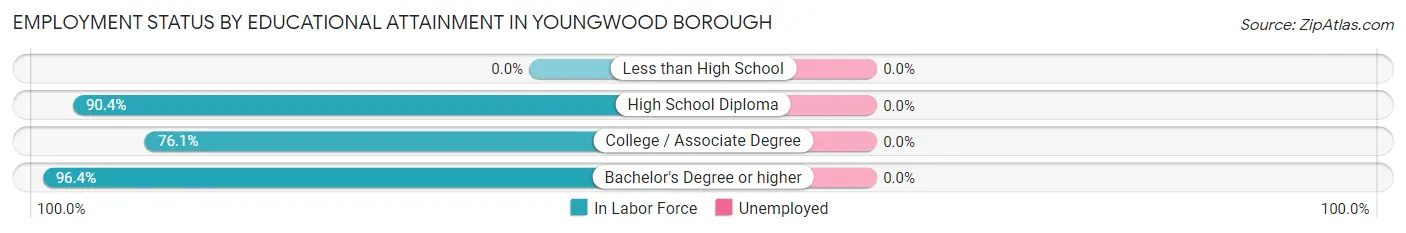
| Educational Attainment | In Labor Force | Unemployed |
| Less than High School | 0 (0.0%) | 0 (0.0%) |
| High School Diploma | 549 (90.4%) | 0 (0.0%) |
| College / Associate Degree | 367 (76.1%) | 0 (0.0%) |
| Bachelor's Degree or higher | 432 (96.4%) | 0 (0.0%) |
| Total | 1,348 (87.2%) | 0 (0.0%) |
Employment Occupations by Sex in Youngwood borough
Management, Business, Science and Arts Occupations
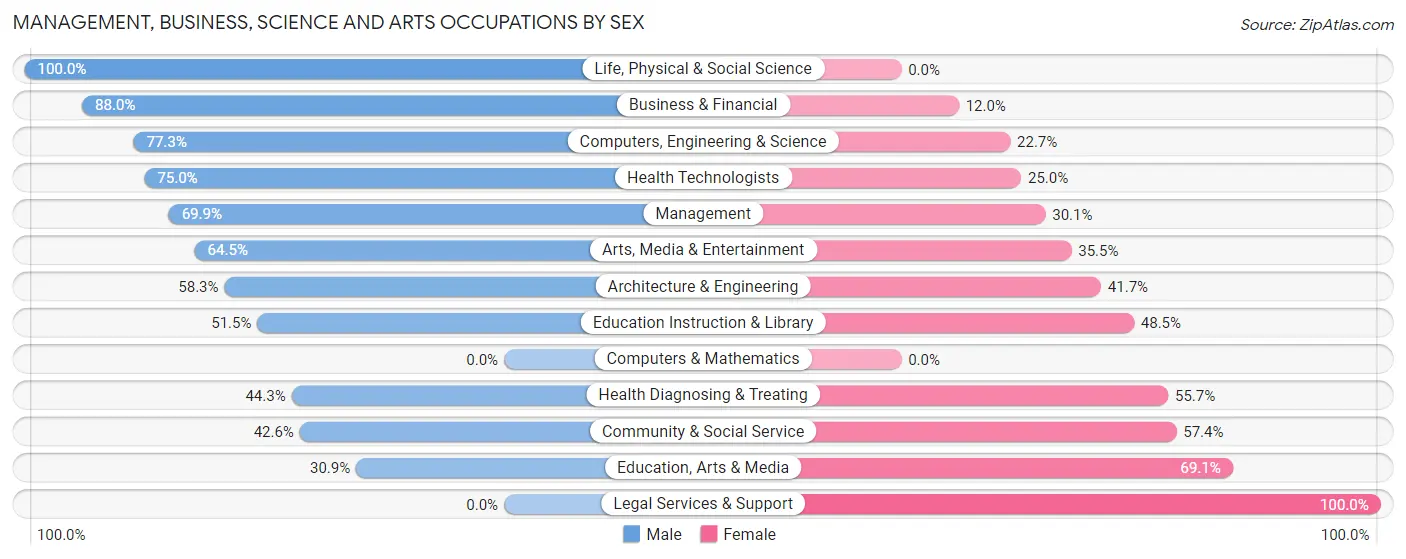
The most common Management, Business, Science and Arts occupations in Youngwood borough are Community & Social Service (230 | 13.2%), Management (143 | 8.2%), Education Instruction & Library (103 | 5.9%), Health Diagnosing & Treating (97 | 5.6%), and Education, Arts & Media (81 | 4.6%).
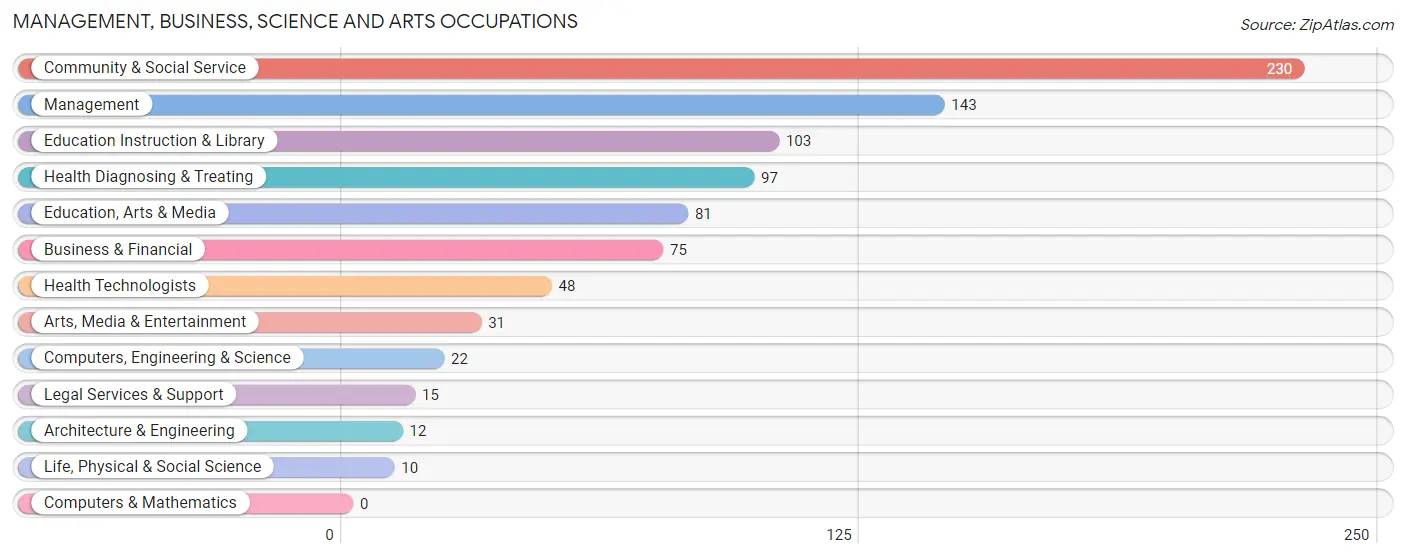
Management, Business, Science and Arts Occupations by Sex
Within the Management, Business, Science and Arts occupations in Youngwood borough, the most male-oriented occupations are Life, Physical & Social Science (100.0%), Business & Financial (88.0%), and Computers, Engineering & Science (77.3%), while the most female-oriented occupations are Legal Services & Support (100.0%), Education, Arts & Media (69.1%), and Community & Social Service (57.4%).
| Occupation | Male | Female |
| Management | 100 (69.9%) | 43 (30.1%) |
| Business & Financial | 66 (88.0%) | 9 (12.0%) |
| Computers, Engineering & Science | 17 (77.3%) | 5 (22.7%) |
| Computers & Mathematics | 0 (0.0%) | 0 (0.0%) |
| Architecture & Engineering | 7 (58.3%) | 5 (41.7%) |
| Life, Physical & Social Science | 10 (100.0%) | 0 (0.0%) |
| Community & Social Service | 98 (42.6%) | 132 (57.4%) |
| Education, Arts & Media | 25 (30.9%) | 56 (69.1%) |
| Legal Services & Support | 0 (0.0%) | 15 (100.0%) |
| Education Instruction & Library | 53 (51.5%) | 50 (48.5%) |
| Arts, Media & Entertainment | 20 (64.5%) | 11 (35.5%) |
| Health Diagnosing & Treating | 43 (44.3%) | 54 (55.7%) |
| Health Technologists | 36 (75.0%) | 12 (25.0%) |
| Total (Category) | 324 (57.1%) | 243 (42.9%) |
| Total (Overall) | 956 (54.7%) | 792 (45.3%) |
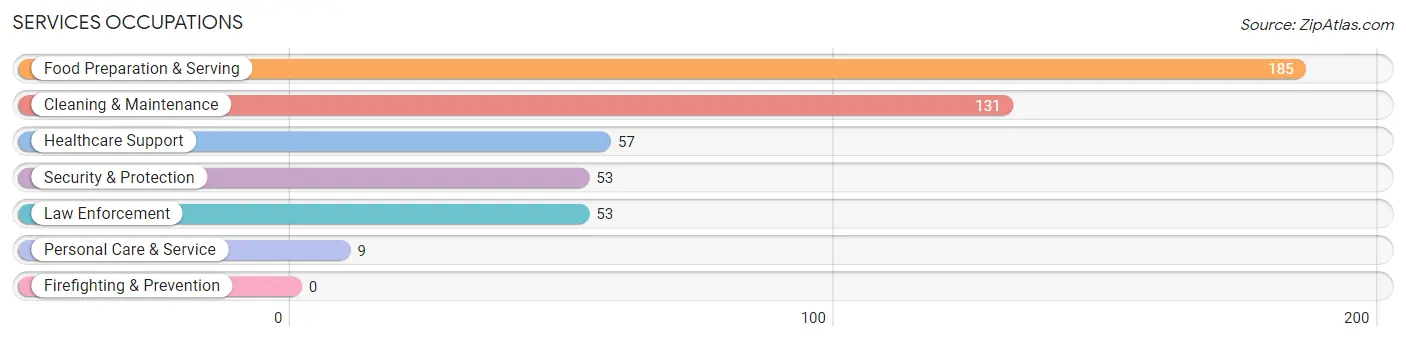
Services Occupations
The most common Services occupations in Youngwood borough are Food Preparation & Serving (185 | 10.6%), Cleaning & Maintenance (131 | 7.5%), Healthcare Support (57 | 3.3%), Security & Protection (53 | 3.0%), and Law Enforcement (53 | 3.0%).
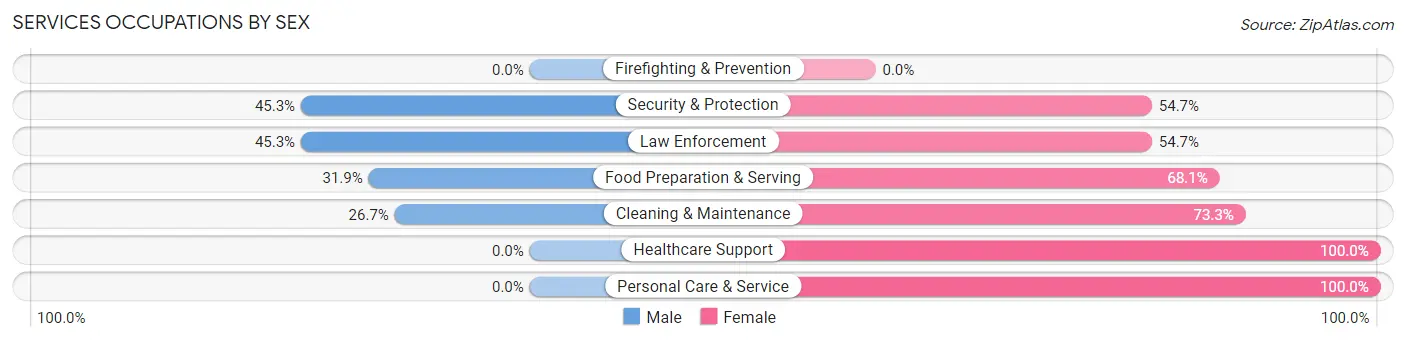
Services Occupations by Sex
Within the Services occupations in Youngwood borough, the most male-oriented occupations are Security & Protection (45.3%), Law Enforcement (45.3%), and Food Preparation & Serving (31.9%), while the most female-oriented occupations are Healthcare Support (100.0%), Personal Care & Service (100.0%), and Cleaning & Maintenance (73.3%).
| Occupation | Male | Female |
| Healthcare Support | 0 (0.0%) | 57 (100.0%) |
| Security & Protection | 24 (45.3%) | 29 (54.7%) |
| Firefighting & Prevention | 0 (0.0%) | 0 (0.0%) |
| Law Enforcement | 24 (45.3%) | 29 (54.7%) |
| Food Preparation & Serving | 59 (31.9%) | 126 (68.1%) |
| Cleaning & Maintenance | 35 (26.7%) | 96 (73.3%) |
| Personal Care & Service | 0 (0.0%) | 9 (100.0%) |
| Total (Category) | 118 (27.1%) | 317 (72.9%) |
| Total (Overall) | 956 (54.7%) | 792 (45.3%) |
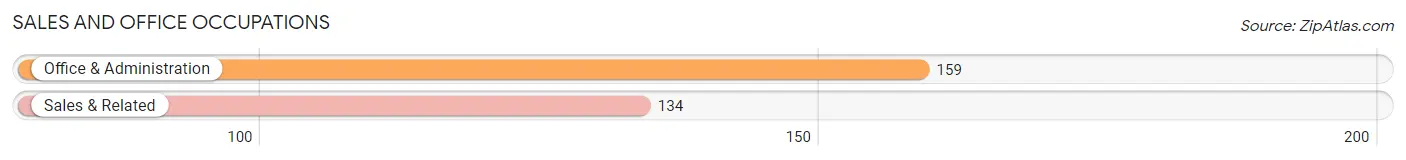
Sales and Office Occupations
The most common Sales and Office occupations in Youngwood borough are Office & Administration (159 | 9.1%), and Sales & Related (134 | 7.7%).
Sales and Office Occupations by Sex
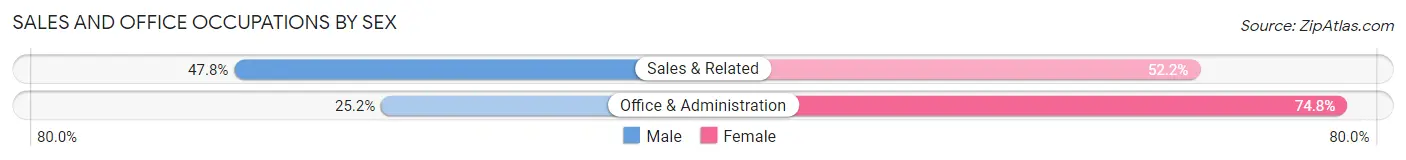
| Occupation | Male | Female |
| Sales & Related | 64 (47.8%) | 70 (52.2%) |
| Office & Administration | 40 (25.2%) | 119 (74.8%) |
| Total (Category) | 104 (35.5%) | 189 (64.5%) |
| Total (Overall) | 956 (54.7%) | 792 (45.3%) |
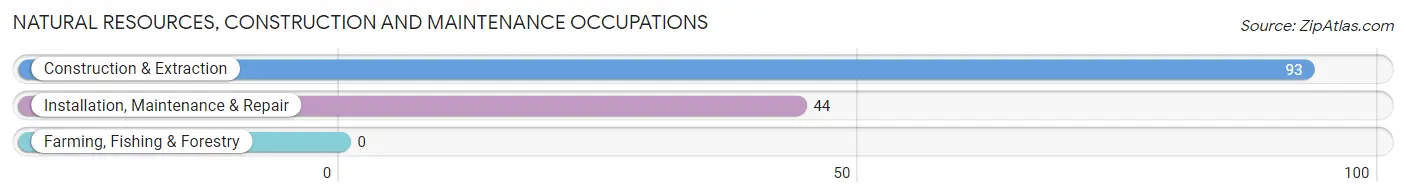
Natural Resources, Construction and Maintenance Occupations
The most common Natural Resources, Construction and Maintenance occupations in Youngwood borough are Construction & Extraction (93 | 5.3%), and Installation, Maintenance & Repair (44 | 2.5%).
Natural Resources, Construction and Maintenance Occupations by Sex
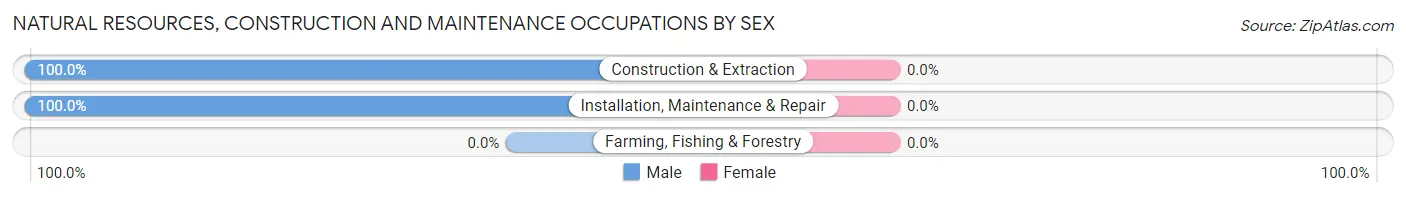
| Occupation | Male | Female |
| Farming, Fishing & Forestry | 0 (0.0%) | 0 (0.0%) |
| Construction & Extraction | 93 (100.0%) | 0 (0.0%) |
| Installation, Maintenance & Repair | 44 (100.0%) | 0 (0.0%) |
| Total (Category) | 137 (100.0%) | 0 (0.0%) |
| Total (Overall) | 956 (54.7%) | 792 (45.3%) |
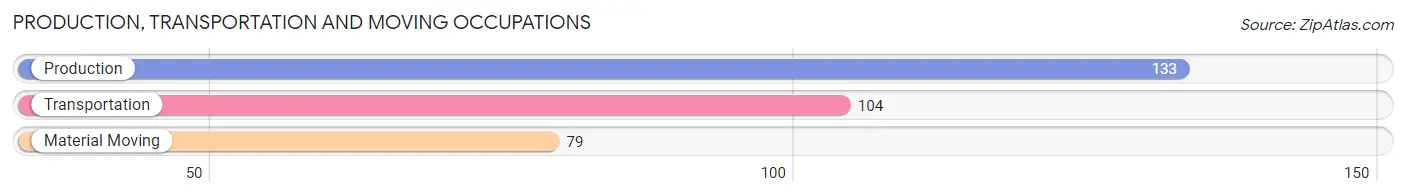
Production, Transportation and Moving Occupations
The most common Production, Transportation and Moving occupations in Youngwood borough are Production (133 | 7.6%), Transportation (104 | 5.9%), and Material Moving (79 | 4.5%).
Production, Transportation and Moving Occupations by Sex
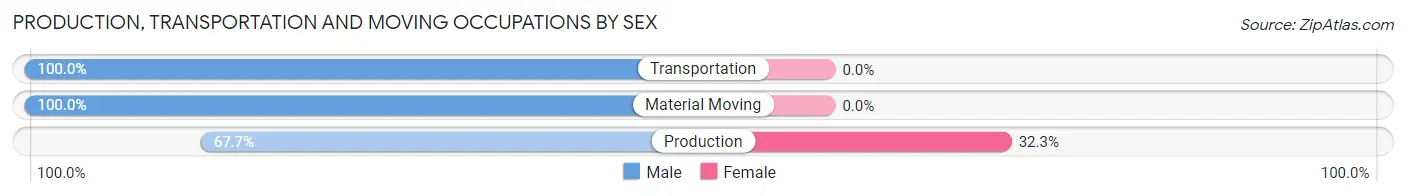
| Occupation | Male | Female |
| Production | 90 (67.7%) | 43 (32.3%) |
| Transportation | 104 (100.0%) | 0 (0.0%) |
| Material Moving | 79 (100.0%) | 0 (0.0%) |
| Total (Category) | 273 (86.4%) | 43 (13.6%) |
| Total (Overall) | 956 (54.7%) | 792 (45.3%) |
Employment Industries by Sex in Youngwood borough
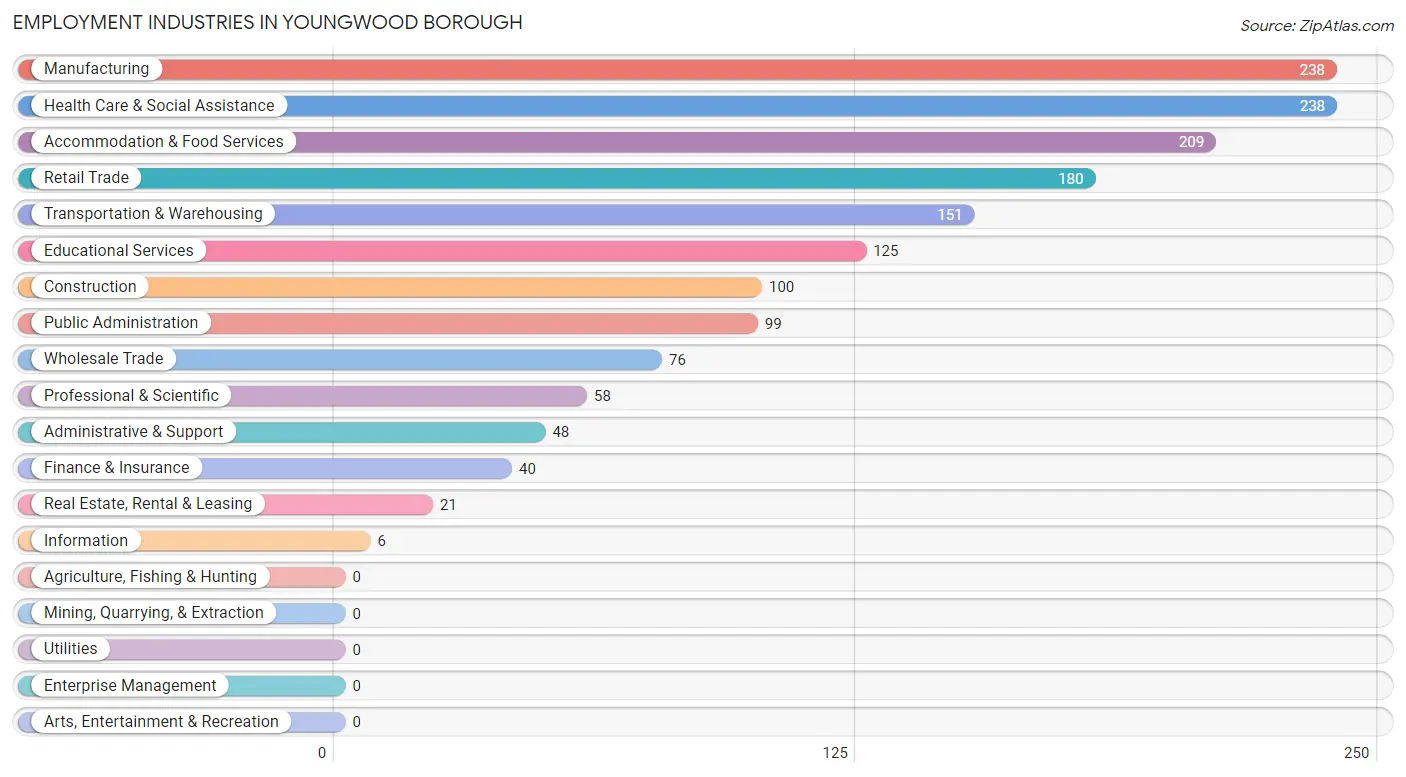
Employment Industries in Youngwood borough
The major employment industries in Youngwood borough include Manufacturing (238 | 13.6%), Health Care & Social Assistance (238 | 13.6%), Accommodation & Food Services (209 | 12.0%), Retail Trade (180 | 10.3%), and Transportation & Warehousing (151 | 8.6%).
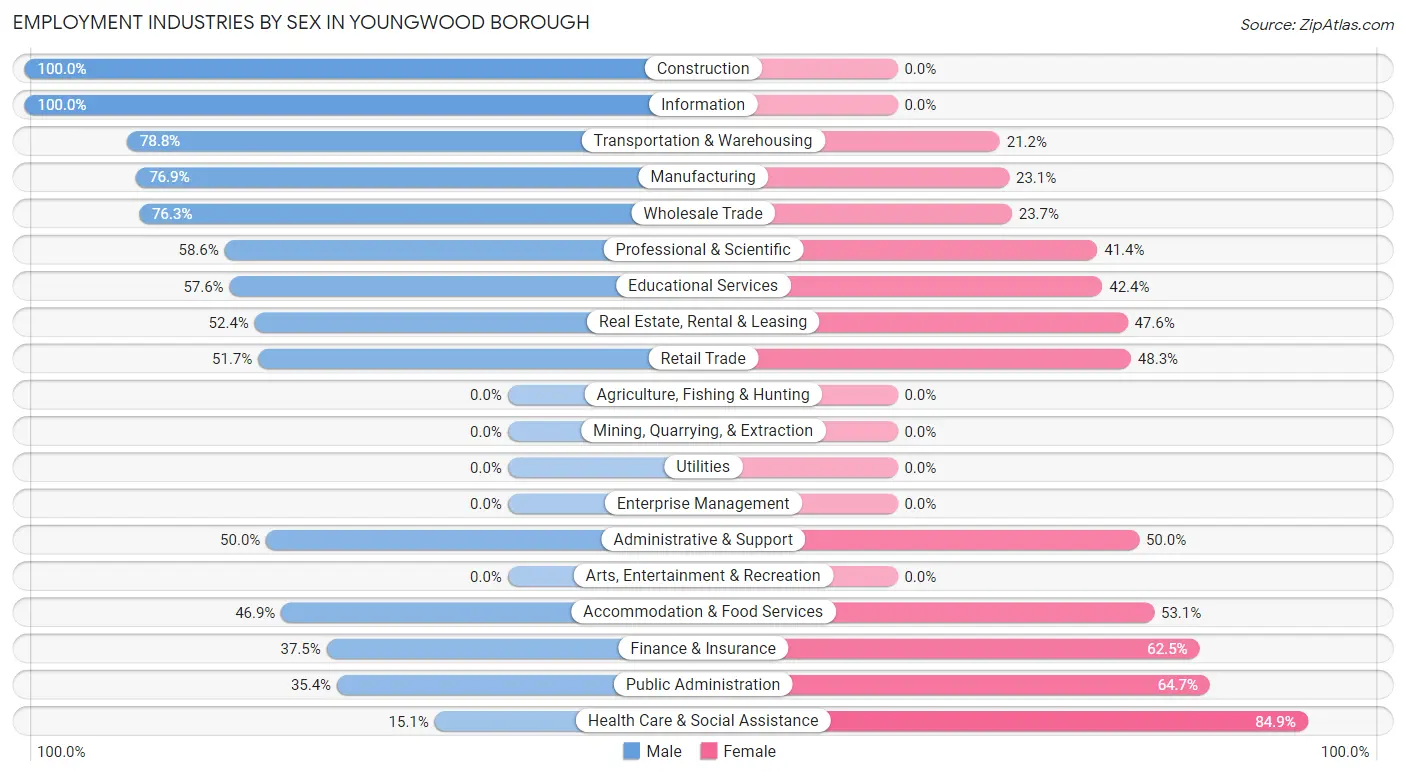
Employment Industries by Sex in Youngwood borough
The Youngwood borough industries that see more men than women are Construction (100.0%), Information (100.0%), and Transportation & Warehousing (78.8%), whereas the industries that tend to have a higher number of women are Health Care & Social Assistance (84.9%), Public Administration (64.6%), and Finance & Insurance (62.5%).
| Industry | Male | Female |
| Agriculture, Fishing & Hunting | 0 (0.0%) | 0 (0.0%) |
| Mining, Quarrying, & Extraction | 0 (0.0%) | 0 (0.0%) |
| Construction | 100 (100.0%) | 0 (0.0%) |
| Manufacturing | 183 (76.9%) | 55 (23.1%) |
| Wholesale Trade | 58 (76.3%) | 18 (23.7%) |
| Retail Trade | 93 (51.7%) | 87 (48.3%) |
| Transportation & Warehousing | 119 (78.8%) | 32 (21.2%) |
| Utilities | 0 (0.0%) | 0 (0.0%) |
| Information | 6 (100.0%) | 0 (0.0%) |
| Finance & Insurance | 15 (37.5%) | 25 (62.5%) |
| Real Estate, Rental & Leasing | 11 (52.4%) | 10 (47.6%) |
| Professional & Scientific | 34 (58.6%) | 24 (41.4%) |
| Enterprise Management | 0 (0.0%) | 0 (0.0%) |
| Administrative & Support | 24 (50.0%) | 24 (50.0%) |
| Educational Services | 72 (57.6%) | 53 (42.4%) |
| Health Care & Social Assistance | 36 (15.1%) | 202 (84.9%) |
| Arts, Entertainment & Recreation | 0 (0.0%) | 0 (0.0%) |
| Accommodation & Food Services | 98 (46.9%) | 111 (53.1%) |
| Public Administration | 35 (35.3%) | 64 (64.6%) |
| Total | 956 (54.7%) | 792 (45.3%) |
Education in Youngwood borough
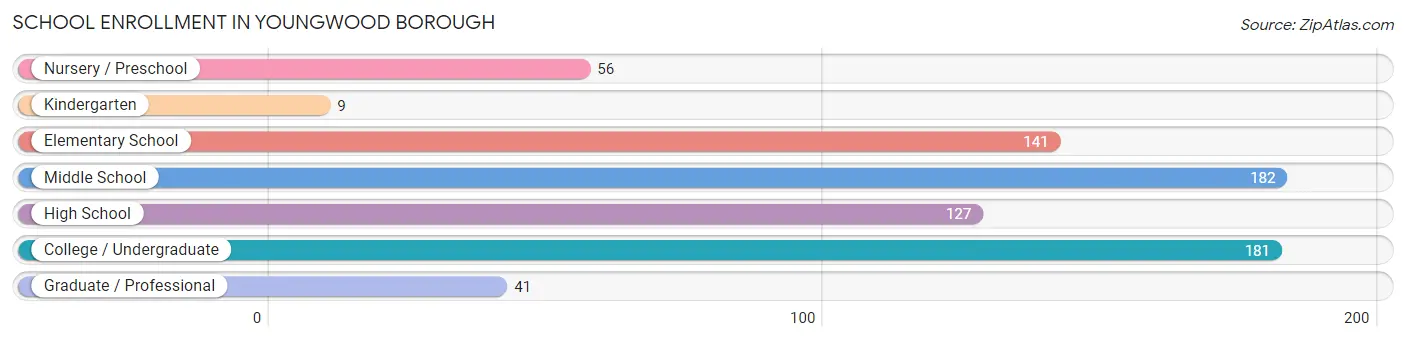
School Enrollment in Youngwood borough
The most common levels of schooling among the 737 students in Youngwood borough are middle school (182 | 24.7%), college / undergraduate (181 | 24.6%), and elementary school (141 | 19.1%).
| School Level | # Students | % Students |
| Nursery / Preschool | 56 | 7.6% |
| Kindergarten | 9 | 1.2% |
| Elementary School | 141 | 19.1% |
| Middle School | 182 | 24.7% |
| High School | 127 | 17.2% |
| College / Undergraduate | 181 | 24.6% |
| Graduate / Professional | 41 | 5.6% |
| Total | 737 | 100.0% |
School Enrollment by Age by Funding Source in Youngwood borough
Out of a total of 737 students who are enrolled in schools in Youngwood borough, 99 (13.4%) attend a private institution, while the remaining 638 (86.6%) are enrolled in public schools. The age group of 35 years and over has the highest likelihood of being enrolled in private schools, with 37 (77.1% in the age bracket) enrolled. Conversely, the age group of 3 to 4 year olds has the lowest likelihood of being enrolled in a private school, with 19 (100.0% in the age bracket) attending a public institution.
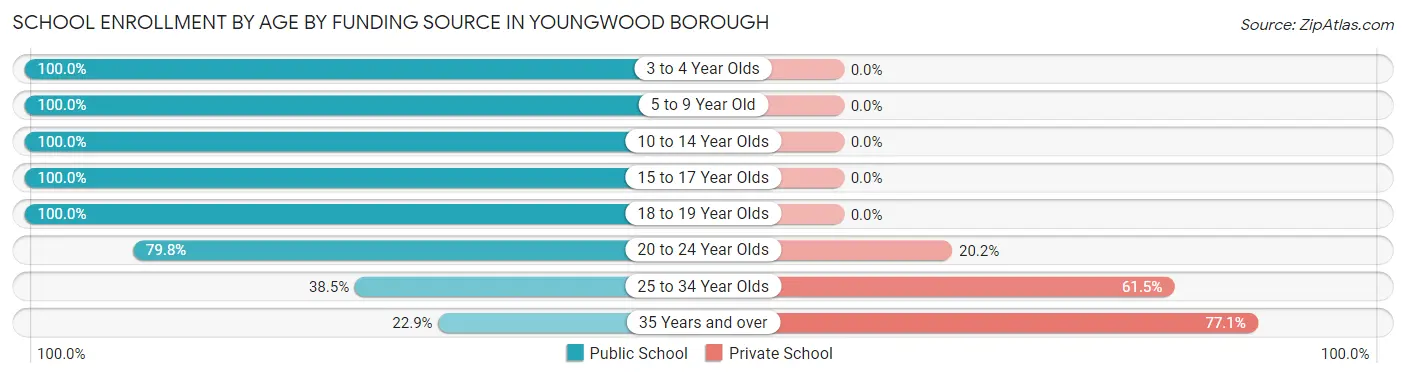
| Age Bracket | Public School | Private School |
| 3 to 4 Year Olds | 19 (100.0%) | 0 (0.0%) |
| 5 to 9 Year Old | 154 (100.0%) | 0 (0.0%) |
| 10 to 14 Year Olds | 222 (100.0%) | 0 (0.0%) |
| 15 to 17 Year Olds | 93 (100.0%) | 0 (0.0%) |
| 18 to 19 Year Olds | 27 (100.0%) | 0 (0.0%) |
| 20 to 24 Year Olds | 87 (79.8%) | 22 (20.2%) |
| 25 to 34 Year Olds | 25 (38.5%) | 40 (61.5%) |
| 35 Years and over | 11 (22.9%) | 37 (77.1%) |
| Total | 638 (86.6%) | 99 (13.4%) |
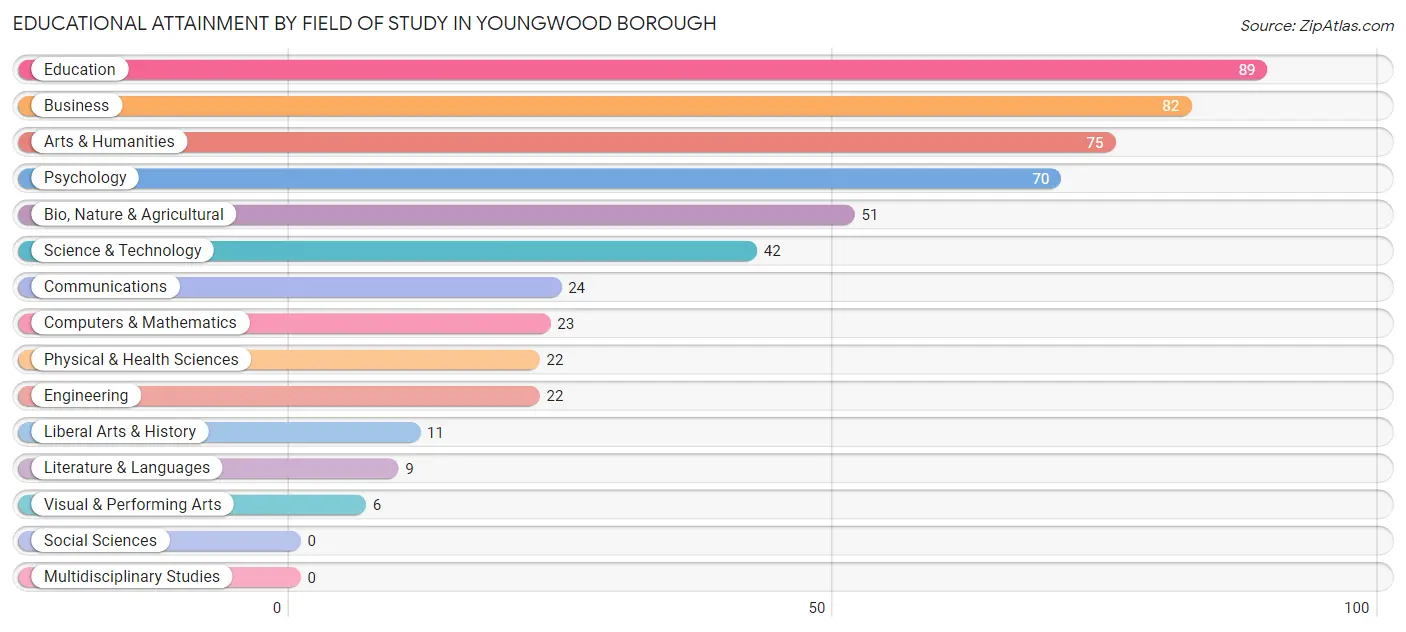
Educational Attainment by Field of Study in Youngwood borough
Education (89 | 16.9%), business (82 | 15.6%), arts & humanities (75 | 14.3%), psychology (70 | 13.3%), and bio, nature & agricultural (51 | 9.7%) are the most common fields of study among 526 individuals in Youngwood borough who have obtained a bachelor's degree or higher.
| Field of Study | # Graduates | % Graduates |
| Computers & Mathematics | 23 | 4.4% |
| Bio, Nature & Agricultural | 51 | 9.7% |
| Physical & Health Sciences | 22 | 4.2% |
| Psychology | 70 | 13.3% |
| Social Sciences | 0 | 0.0% |
| Engineering | 22 | 4.2% |
| Multidisciplinary Studies | 0 | 0.0% |
| Science & Technology | 42 | 8.0% |
| Business | 82 | 15.6% |
| Education | 89 | 16.9% |
| Literature & Languages | 9 | 1.7% |
| Liberal Arts & History | 11 | 2.1% |
| Visual & Performing Arts | 6 | 1.1% |
| Communications | 24 | 4.6% |
| Arts & Humanities | 75 | 14.3% |
| Total | 526 | 100.0% |
Transportation & Commute in Youngwood borough
Vehicle Availability by Sex in Youngwood borough
The most prevalent vehicle ownership categories in Youngwood borough are males with 2 vehicles (427, accounting for 46.5%) and females with 2 vehicles (435, making up 53.9%).
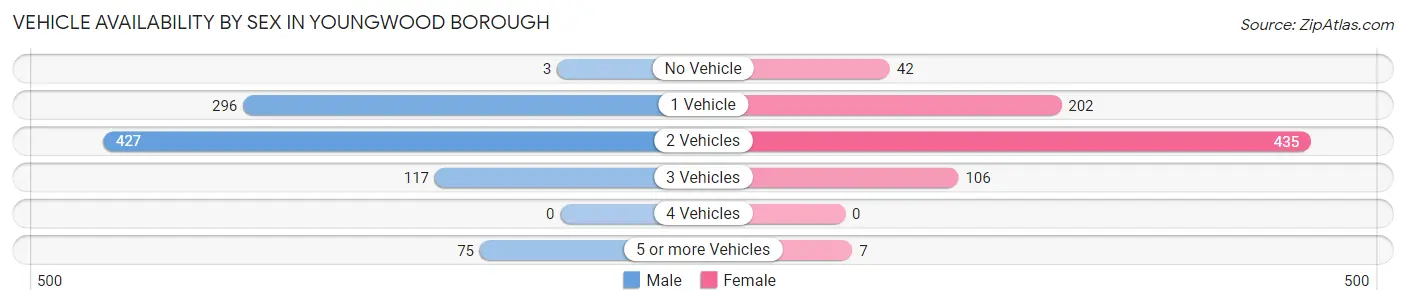
| Vehicles Available | Male | Female |
| No Vehicle | 3 (0.3%) | 42 (5.3%) |
| 1 Vehicle | 296 (32.2%) | 202 (25.5%) |
| 2 Vehicles | 427 (46.5%) | 435 (54.9%) |
| 3 Vehicles | 117 (12.8%) | 106 (13.4%) |
| 4 Vehicles | 0 (0.0%) | 0 (0.0%) |
| 5 or more Vehicles | 75 (8.2%) | 7 (0.9%) |
| Total | 918 (100.0%) | 792 (100.0%) |
Commute Time in Youngwood borough
The most frequently occuring commute durations in Youngwood borough are 15 to 19 minutes (467 commuters, 28.4%), 10 to 14 minutes (378 commuters, 23.0%), and 20 to 24 minutes (242 commuters, 14.7%).
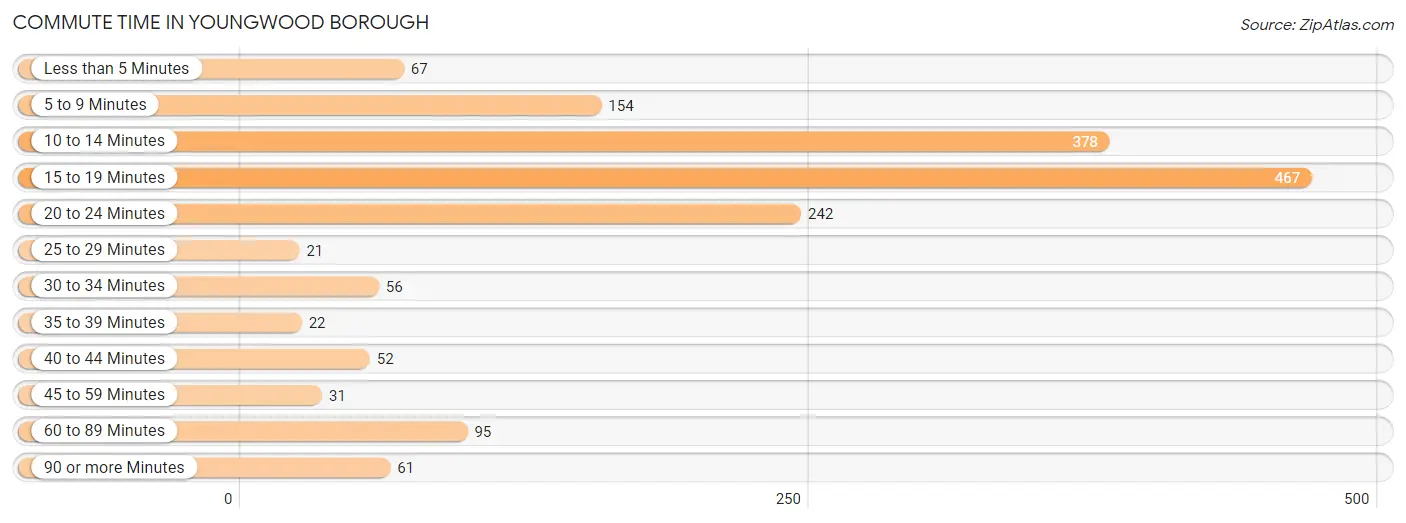
| Commute Time | # Commuters | % Commuters |
| Less than 5 Minutes | 67 | 4.1% |
| 5 to 9 Minutes | 154 | 9.4% |
| 10 to 14 Minutes | 378 | 23.0% |
| 15 to 19 Minutes | 467 | 28.4% |
| 20 to 24 Minutes | 242 | 14.7% |
| 25 to 29 Minutes | 21 | 1.3% |
| 30 to 34 Minutes | 56 | 3.4% |
| 35 to 39 Minutes | 22 | 1.3% |
| 40 to 44 Minutes | 52 | 3.2% |
| 45 to 59 Minutes | 31 | 1.9% |
| 60 to 89 Minutes | 95 | 5.8% |
| 90 or more Minutes | 61 | 3.7% |
Commute Time by Sex in Youngwood borough
The most common commute times in Youngwood borough are 10 to 14 minutes (240 commuters, 27.2%) for males and 15 to 19 minutes (296 commuters, 38.7%) for females.
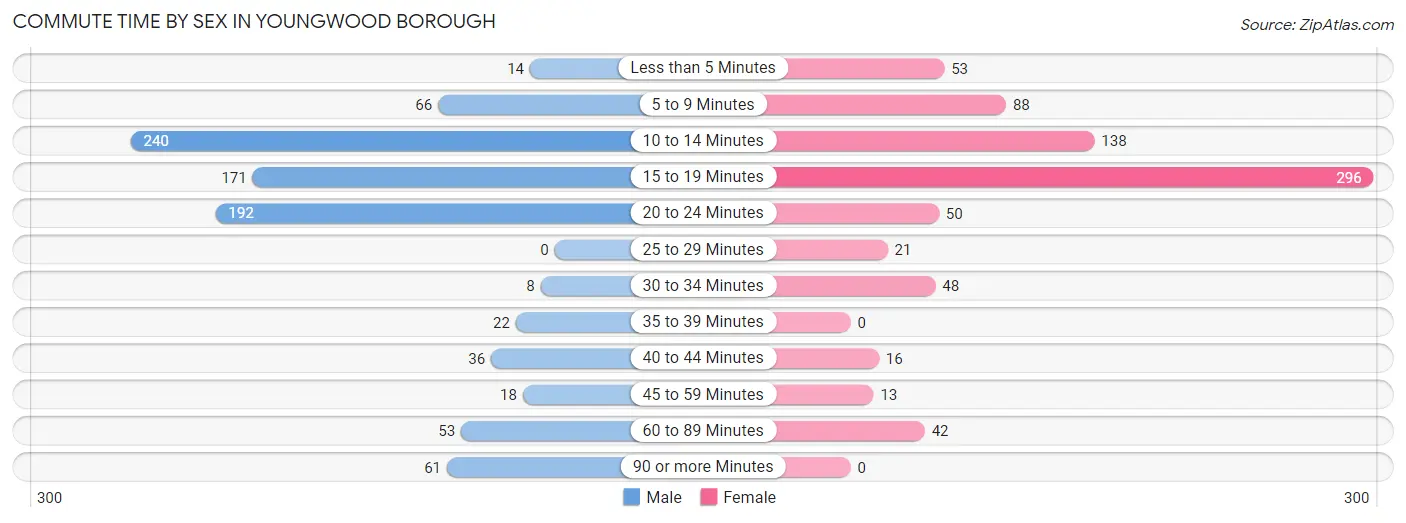
| Commute Time | Male | Female |
| Less than 5 Minutes | 14 (1.6%) | 53 (6.9%) |
| 5 to 9 Minutes | 66 (7.5%) | 88 (11.5%) |
| 10 to 14 Minutes | 240 (27.2%) | 138 (18.0%) |
| 15 to 19 Minutes | 171 (19.4%) | 296 (38.7%) |
| 20 to 24 Minutes | 192 (21.8%) | 50 (6.5%) |
| 25 to 29 Minutes | 0 (0.0%) | 21 (2.8%) |
| 30 to 34 Minutes | 8 (0.9%) | 48 (6.3%) |
| 35 to 39 Minutes | 22 (2.5%) | 0 (0.0%) |
| 40 to 44 Minutes | 36 (4.1%) | 16 (2.1%) |
| 45 to 59 Minutes | 18 (2.0%) | 13 (1.7%) |
| 60 to 89 Minutes | 53 (6.0%) | 42 (5.5%) |
| 90 or more Minutes | 61 (6.9%) | 0 (0.0%) |
Time of Departure to Work by Sex in Youngwood borough
The most frequent times of departure to work in Youngwood borough are 6:30 AM to 6:59 AM (157, 17.8%) for males and 6:30 AM to 6:59 AM (118, 15.4%) for females.
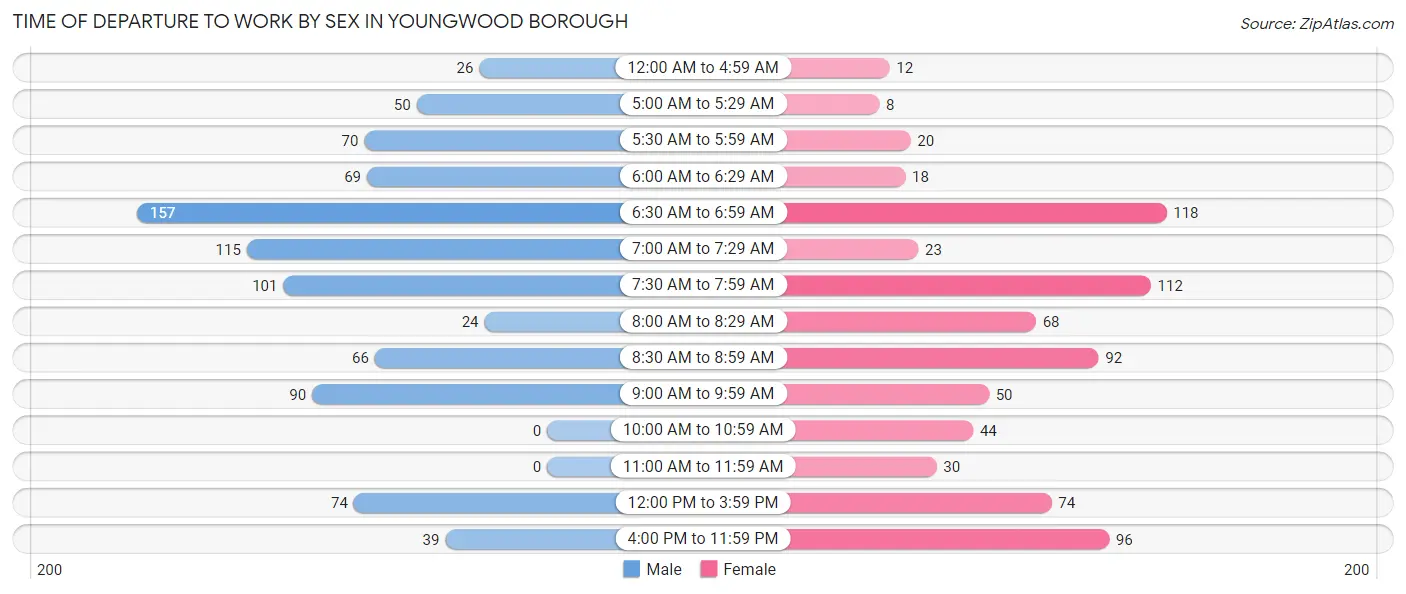
| Time of Departure | Male | Female |
| 12:00 AM to 4:59 AM | 26 (2.9%) | 12 (1.6%) |
| 5:00 AM to 5:29 AM | 50 (5.7%) | 8 (1.1%) |
| 5:30 AM to 5:59 AM | 70 (8.0%) | 20 (2.6%) |
| 6:00 AM to 6:29 AM | 69 (7.8%) | 18 (2.4%) |
| 6:30 AM to 6:59 AM | 157 (17.8%) | 118 (15.4%) |
| 7:00 AM to 7:29 AM | 115 (13.1%) | 23 (3.0%) |
| 7:30 AM to 7:59 AM | 101 (11.5%) | 112 (14.6%) |
| 8:00 AM to 8:29 AM | 24 (2.7%) | 68 (8.9%) |
| 8:30 AM to 8:59 AM | 66 (7.5%) | 92 (12.0%) |
| 9:00 AM to 9:59 AM | 90 (10.2%) | 50 (6.5%) |
| 10:00 AM to 10:59 AM | 0 (0.0%) | 44 (5.8%) |
| 11:00 AM to 11:59 AM | 0 (0.0%) | 30 (3.9%) |
| 12:00 PM to 3:59 PM | 74 (8.4%) | 74 (9.7%) |
| 4:00 PM to 11:59 PM | 39 (4.4%) | 96 (12.6%) |
| Total | 881 (100.0%) | 765 (100.0%) |
Housing Occupancy in Youngwood borough
Occupancy by Ownership in Youngwood borough
Of the total 1,371 dwellings in Youngwood borough, owner-occupied units account for 838 (61.1%), while renter-occupied units make up 533 (38.9%).
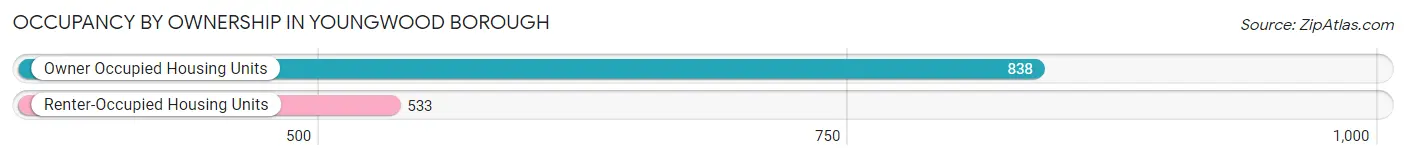
| Occupancy | # Housing Units | % Housing Units |
| Owner Occupied Housing Units | 838 | 61.1% |
| Renter-Occupied Housing Units | 533 | 38.9% |
| Total Occupied Housing Units | 1,371 | 100.0% |
Occupancy by Household Size in Youngwood borough
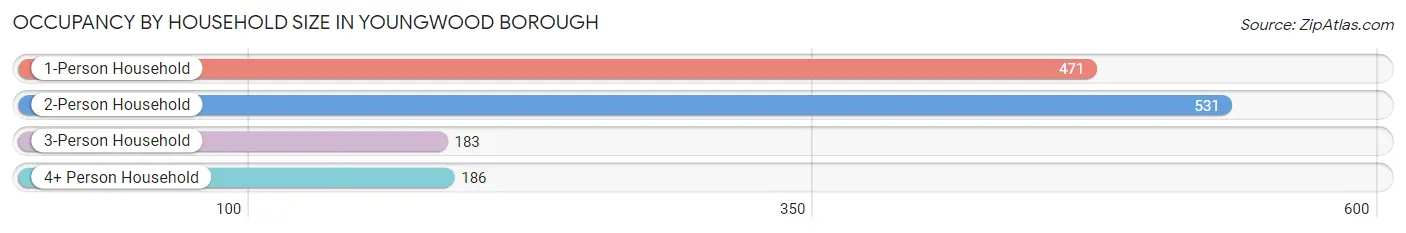
| Household Size | # Housing Units | % Housing Units |
| 1-Person Household | 471 | 34.4% |
| 2-Person Household | 531 | 38.7% |
| 3-Person Household | 183 | 13.4% |
| 4+ Person Household | 186 | 13.6% |
| Total Housing Units | 1,371 | 100.0% |
Occupancy by Ownership by Household Size in Youngwood borough
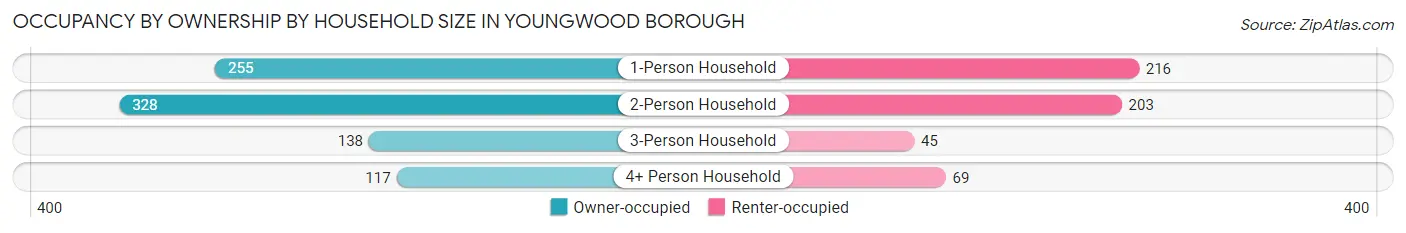
| Household Size | Owner-occupied | Renter-occupied |
| 1-Person Household | 255 (54.1%) | 216 (45.9%) |
| 2-Person Household | 328 (61.8%) | 203 (38.2%) |
| 3-Person Household | 138 (75.4%) | 45 (24.6%) |
| 4+ Person Household | 117 (62.9%) | 69 (37.1%) |
| Total Housing Units | 838 (61.1%) | 533 (38.9%) |
Occupancy by Educational Attainment in Youngwood borough
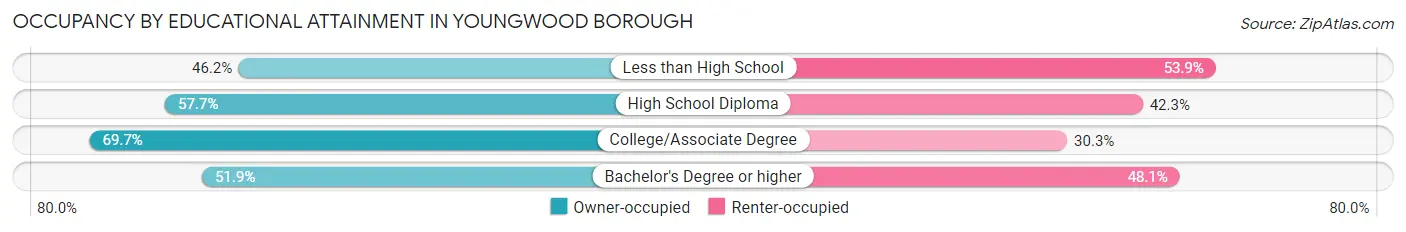
| Household Size | Owner-occupied | Renter-occupied |
| Less than High School | 12 (46.2%) | 14 (53.8%) |
| High School Diploma | 284 (57.7%) | 208 (42.3%) |
| College/Associate Degree | 389 (69.7%) | 169 (30.3%) |
| Bachelor's Degree or higher | 153 (51.9%) | 142 (48.1%) |
Occupancy by Age of Householder in Youngwood borough
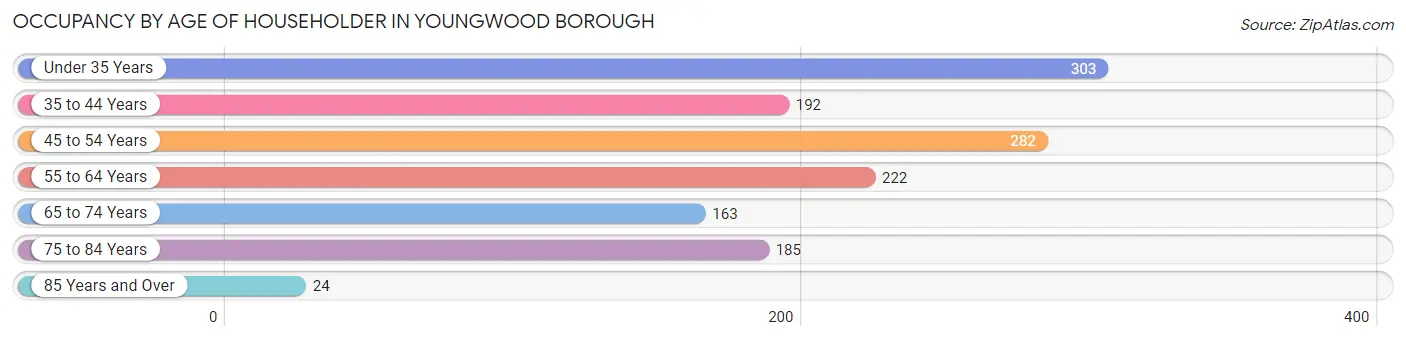
| Age Bracket | # Households | % Households |
| Under 35 Years | 303 | 22.1% |
| 35 to 44 Years | 192 | 14.0% |
| 45 to 54 Years | 282 | 20.6% |
| 55 to 64 Years | 222 | 16.2% |
| 65 to 74 Years | 163 | 11.9% |
| 75 to 84 Years | 185 | 13.5% |
| 85 Years and Over | 24 | 1.8% |
| Total | 1,371 | 100.0% |
Housing Finances in Youngwood borough
Median Income by Occupancy in Youngwood borough
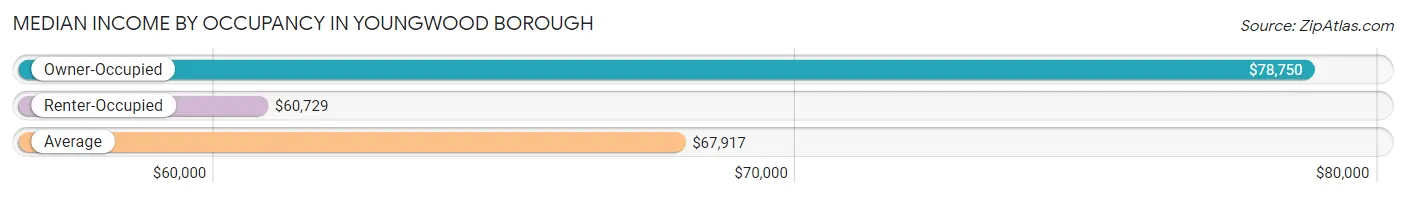
| Occupancy Type | # Households | Median Income |
| Owner-Occupied | 838 (61.1%) | $78,750 |
| Renter-Occupied | 533 (38.9%) | $60,729 |
| Average | 1,371 (100.0%) | $67,917 |
Occupancy by Householder Income Bracket in Youngwood borough
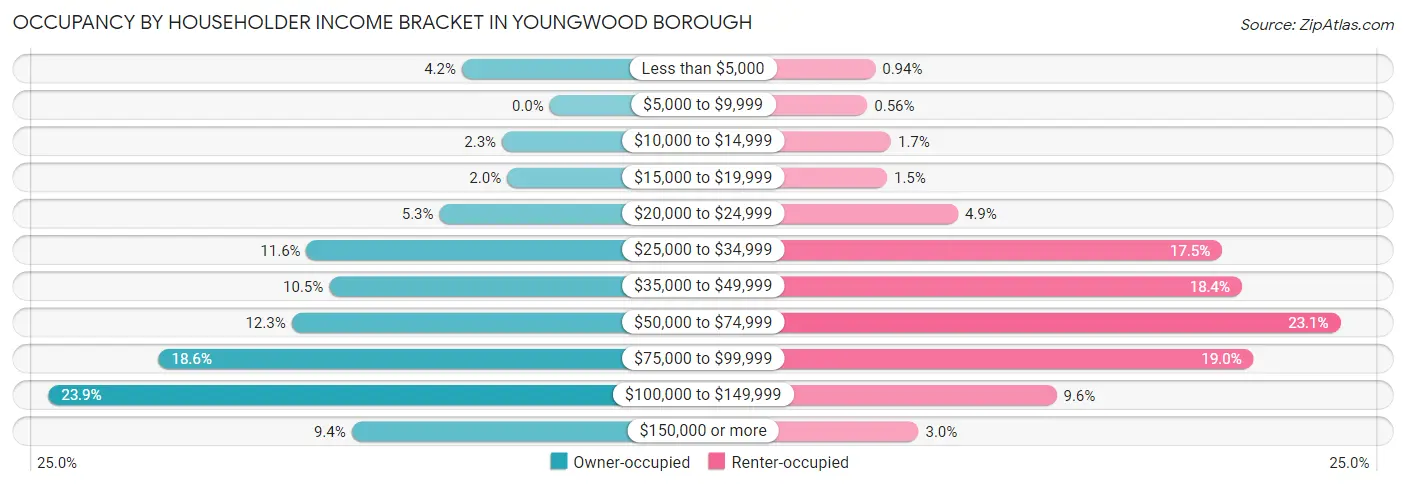
| Income Bracket | Owner-occupied | Renter-occupied |
| Less than $5,000 | 35 (4.2%) | 5 (0.9%) |
| $5,000 to $9,999 | 0 (0.0%) | 3 (0.6%) |
| $10,000 to $14,999 | 19 (2.3%) | 9 (1.7%) |
| $15,000 to $19,999 | 17 (2.0%) | 8 (1.5%) |
| $20,000 to $24,999 | 44 (5.2%) | 26 (4.9%) |
| $25,000 to $34,999 | 97 (11.6%) | 93 (17.4%) |
| $35,000 to $49,999 | 88 (10.5%) | 98 (18.4%) |
| $50,000 to $74,999 | 103 (12.3%) | 123 (23.1%) |
| $75,000 to $99,999 | 156 (18.6%) | 101 (19.0%) |
| $100,000 to $149,999 | 200 (23.9%) | 51 (9.6%) |
| $150,000 or more | 79 (9.4%) | 16 (3.0%) |
| Total | 838 (100.0%) | 533 (100.0%) |
Monthly Housing Cost Tiers in Youngwood borough
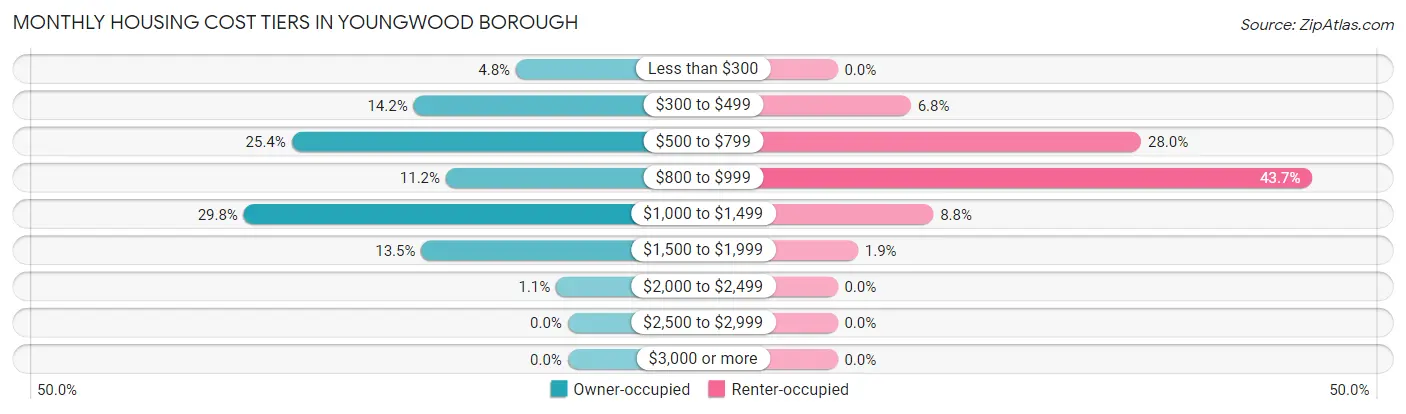
| Monthly Cost | Owner-occupied | Renter-occupied |
| Less than $300 | 40 (4.8%) | 0 (0.0%) |
| $300 to $499 | 119 (14.2%) | 36 (6.8%) |
| $500 to $799 | 213 (25.4%) | 149 (28.0%) |
| $800 to $999 | 94 (11.2%) | 233 (43.7%) |
| $1,000 to $1,499 | 250 (29.8%) | 47 (8.8%) |
| $1,500 to $1,999 | 113 (13.5%) | 10 (1.9%) |
| $2,000 to $2,499 | 9 (1.1%) | 0 (0.0%) |
| $2,500 to $2,999 | 0 (0.0%) | 0 (0.0%) |
| $3,000 or more | 0 (0.0%) | 0 (0.0%) |
| Total | 838 (100.0%) | 533 (100.0%) |
Physical Housing Characteristics in Youngwood borough
Housing Structures in Youngwood borough
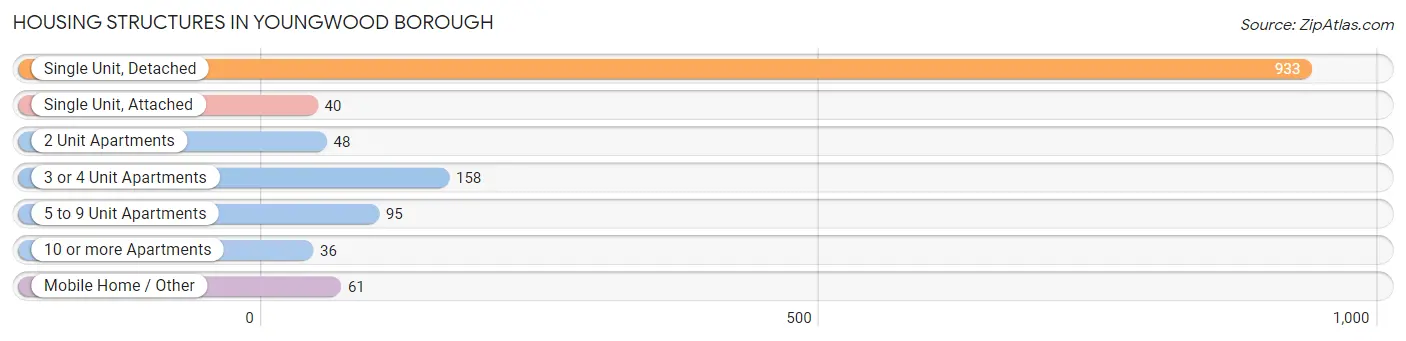
| Structure Type | # Housing Units | % Housing Units |
| Single Unit, Detached | 933 | 68.0% |
| Single Unit, Attached | 40 | 2.9% |
| 2 Unit Apartments | 48 | 3.5% |
| 3 or 4 Unit Apartments | 158 | 11.5% |
| 5 to 9 Unit Apartments | 95 | 6.9% |
| 10 or more Apartments | 36 | 2.6% |
| Mobile Home / Other | 61 | 4.4% |
| Total | 1,371 | 100.0% |
Housing Structures by Occupancy in Youngwood borough
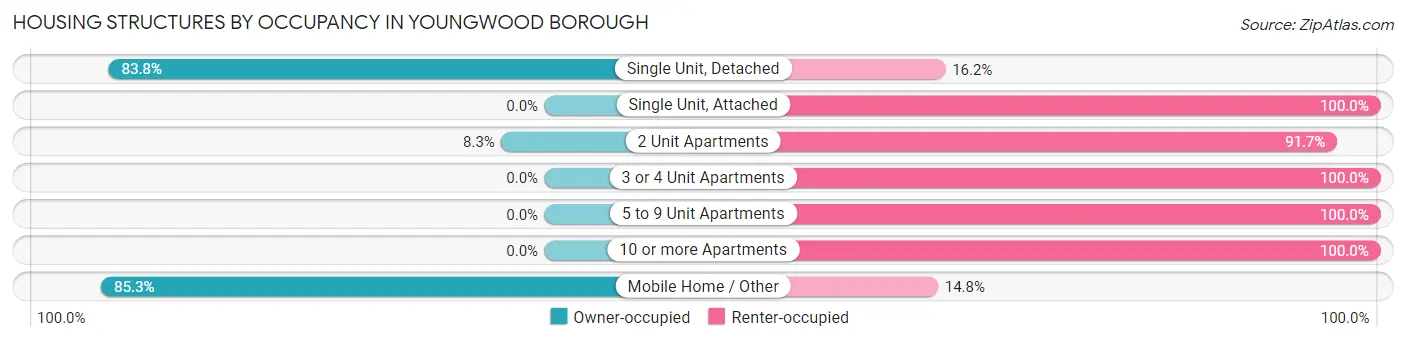
| Structure Type | Owner-occupied | Renter-occupied |
| Single Unit, Detached | 782 (83.8%) | 151 (16.2%) |
| Single Unit, Attached | 0 (0.0%) | 40 (100.0%) |
| 2 Unit Apartments | 4 (8.3%) | 44 (91.7%) |
| 3 or 4 Unit Apartments | 0 (0.0%) | 158 (100.0%) |
| 5 to 9 Unit Apartments | 0 (0.0%) | 95 (100.0%) |
| 10 or more Apartments | 0 (0.0%) | 36 (100.0%) |
| Mobile Home / Other | 52 (85.3%) | 9 (14.7%) |
| Total | 838 (61.1%) | 533 (38.9%) |
Housing Structures by Number of Rooms in Youngwood borough
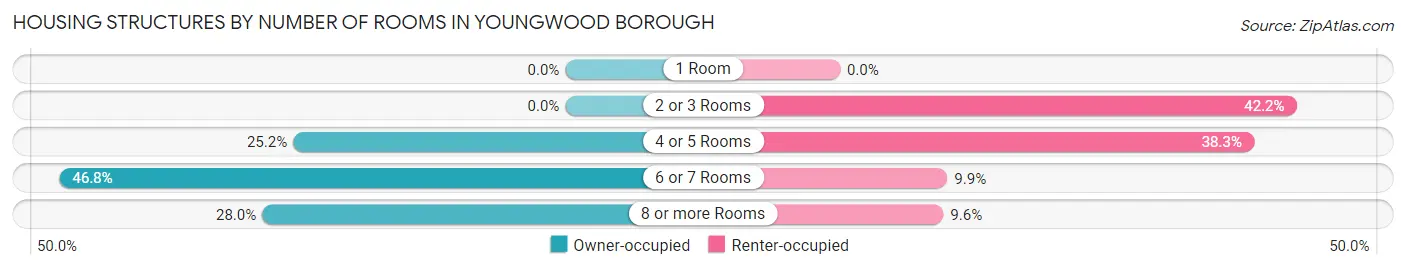
| Number of Rooms | Owner-occupied | Renter-occupied |
| 1 Room | 0 (0.0%) | 0 (0.0%) |
| 2 or 3 Rooms | 0 (0.0%) | 225 (42.2%) |
| 4 or 5 Rooms | 211 (25.2%) | 204 (38.3%) |
| 6 or 7 Rooms | 392 (46.8%) | 53 (9.9%) |
| 8 or more Rooms | 235 (28.0%) | 51 (9.6%) |
| Total | 838 (100.0%) | 533 (100.0%) |
Housing Structure by Heating Type in Youngwood borough
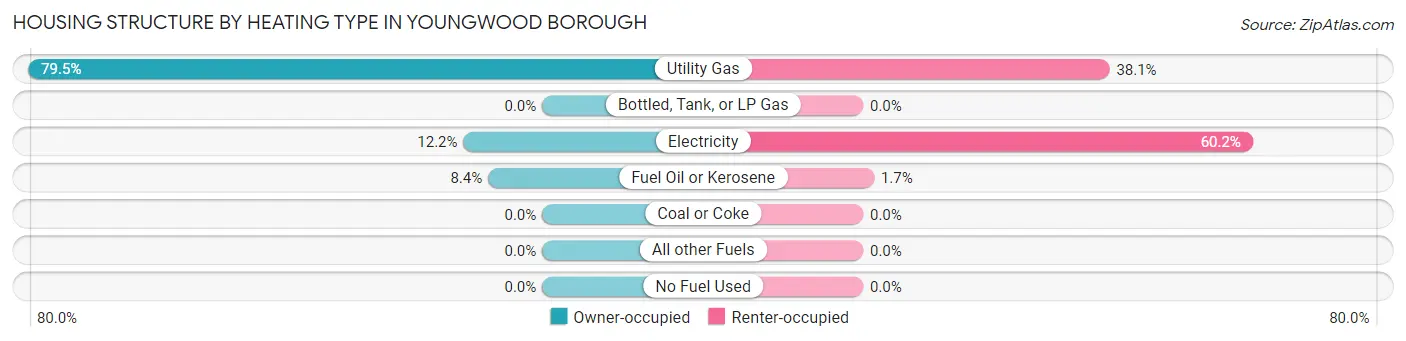
| Heating Type | Owner-occupied | Renter-occupied |
| Utility Gas | 666 (79.5%) | 203 (38.1%) |
| Bottled, Tank, or LP Gas | 0 (0.0%) | 0 (0.0%) |
| Electricity | 102 (12.2%) | 321 (60.2%) |
| Fuel Oil or Kerosene | 70 (8.4%) | 9 (1.7%) |
| Coal or Coke | 0 (0.0%) | 0 (0.0%) |
| All other Fuels | 0 (0.0%) | 0 (0.0%) |
| No Fuel Used | 0 (0.0%) | 0 (0.0%) |
| Total | 838 (100.0%) | 533 (100.0%) |
Household Vehicle Usage in Youngwood borough
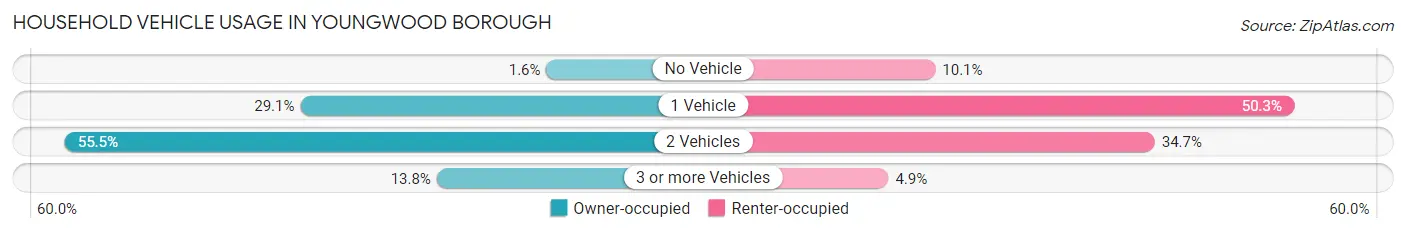
| Vehicles per Household | Owner-occupied | Renter-occupied |
| No Vehicle | 13 (1.5%) | 54 (10.1%) |
| 1 Vehicle | 244 (29.1%) | 268 (50.3%) |
| 2 Vehicles | 465 (55.5%) | 185 (34.7%) |
| 3 or more Vehicles | 116 (13.8%) | 26 (4.9%) |
| Total | 838 (100.0%) | 533 (100.0%) |
Real Estate & Mortgages in Youngwood borough
Real Estate and Mortgage Overview in Youngwood borough
| Characteristic | Without Mortgage | With Mortgage |
| Housing Units | 381 | 457 |
| Median Property Value | $124,700 | $152,900 |
| Median Household Income | $43,237 | $60 |
| Monthly Housing Costs | $524 | $0 |
| Real Estate Taxes | $2,250 | $18 |
Property Value by Mortgage Status in Youngwood borough
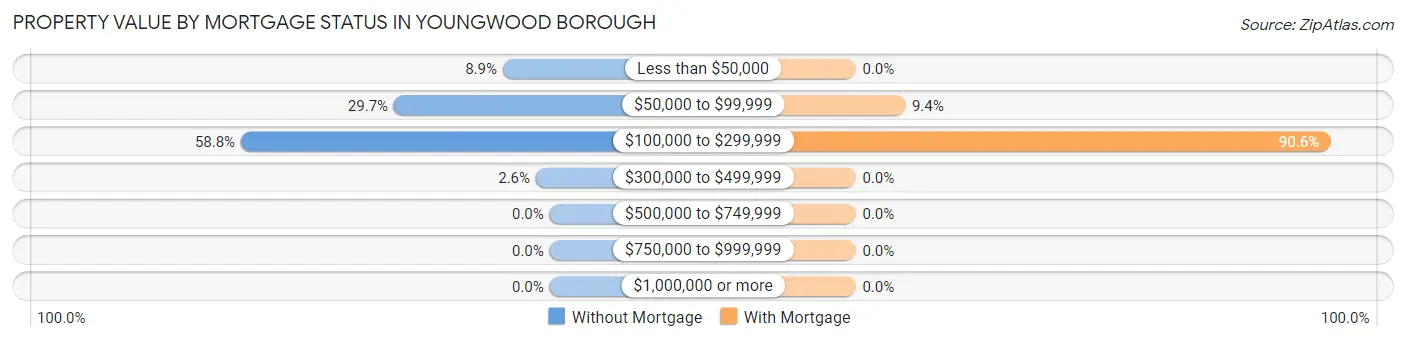
| Property Value | Without Mortgage | With Mortgage |
| Less than $50,000 | 34 (8.9%) | 0 (0.0%) |
| $50,000 to $99,999 | 113 (29.7%) | 43 (9.4%) |
| $100,000 to $299,999 | 224 (58.8%) | 414 (90.6%) |
| $300,000 to $499,999 | 10 (2.6%) | 0 (0.0%) |
| $500,000 to $749,999 | 0 (0.0%) | 0 (0.0%) |
| $750,000 to $999,999 | 0 (0.0%) | 0 (0.0%) |
| $1,000,000 or more | 0 (0.0%) | 0 (0.0%) |
| Total | 381 (100.0%) | 457 (100.0%) |
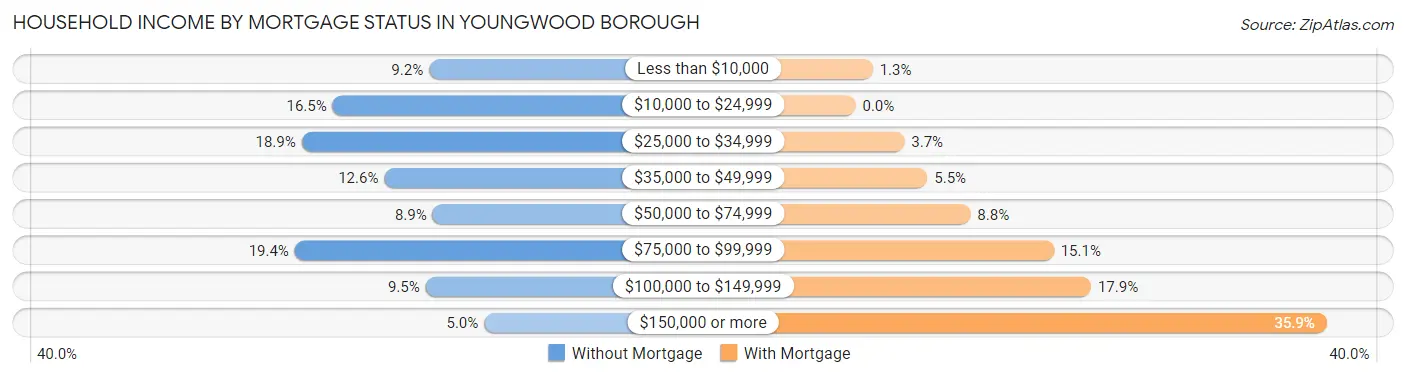
Household Income by Mortgage Status in Youngwood borough
| Household Income | Without Mortgage | With Mortgage |
| Less than $10,000 | 35 (9.2%) | 6 (1.3%) |
| $10,000 to $24,999 | 63 (16.5%) | 0 (0.0%) |
| $25,000 to $34,999 | 72 (18.9%) | 17 (3.7%) |
| $35,000 to $49,999 | 48 (12.6%) | 25 (5.5%) |
| $50,000 to $74,999 | 34 (8.9%) | 40 (8.7%) |
| $75,000 to $99,999 | 74 (19.4%) | 69 (15.1%) |
| $100,000 to $149,999 | 36 (9.5%) | 82 (17.9%) |
| $150,000 or more | 19 (5.0%) | 164 (35.9%) |
| Total | 381 (100.0%) | 457 (100.0%) |
Property Value to Household Income Ratio in Youngwood borough
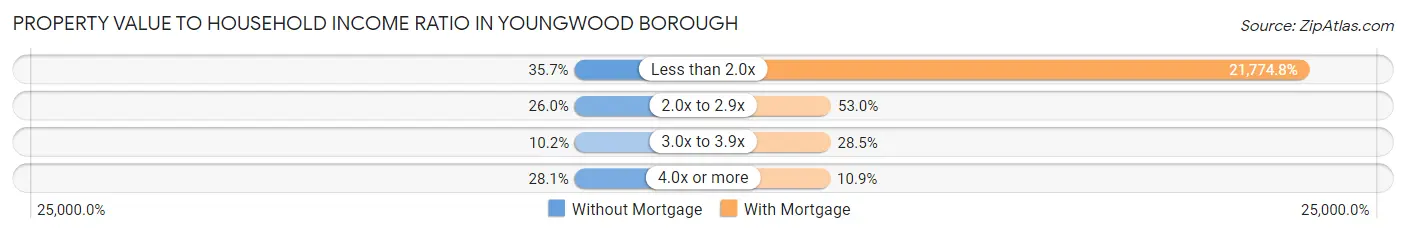
| Value-to-Income Ratio | Without Mortgage | With Mortgage |
| Less than 2.0x | 136 (35.7%) | 99,511 (21,774.8%) |
| 2.0x to 2.9x | 99 (26.0%) | 242 (52.9%) |
| 3.0x to 3.9x | 39 (10.2%) | 130 (28.4%) |
| 4.0x or more | 107 (28.1%) | 50 (10.9%) |
| Total | 381 (100.0%) | 457 (100.0%) |
Real Estate Taxes by Mortgage Status in Youngwood borough
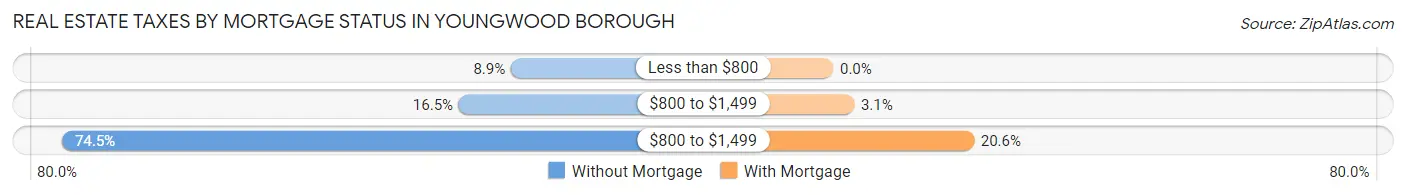
| Property Taxes | Without Mortgage | With Mortgage |
| Less than $800 | 34 (8.9%) | 0 (0.0%) |
| $800 to $1,499 | 63 (16.5%) | 14 (3.1%) |
| $800 to $1,499 | 284 (74.5%) | 94 (20.6%) |
| Total | 381 (100.0%) | 457 (100.0%) |
Health & Disability in Youngwood borough
Health Insurance Coverage by Age in Youngwood borough
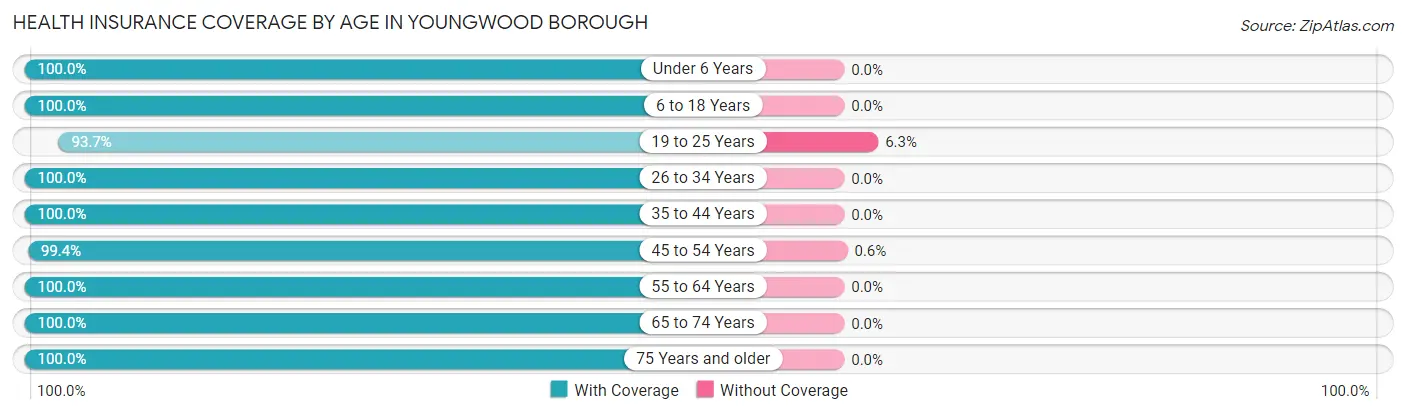
| Age Bracket | With Coverage | Without Coverage |
| Under 6 Years | 77 (100.0%) | 0 (0.0%) |
| 6 to 18 Years | 459 (100.0%) | 0 (0.0%) |
| 19 to 25 Years | 326 (93.7%) | 22 (6.3%) |
| 26 to 34 Years | 296 (100.0%) | 0 (0.0%) |
| 35 to 44 Years | 295 (100.0%) | 0 (0.0%) |
| 45 to 54 Years | 500 (99.4%) | 3 (0.6%) |
| 55 to 64 Years | 399 (100.0%) | 0 (0.0%) |
| 65 to 74 Years | 268 (100.0%) | 0 (0.0%) |
| 75 Years and older | 269 (100.0%) | 0 (0.0%) |
| Total | 2,889 (99.1%) | 25 (0.9%) |
Health Insurance Coverage by Citizenship Status in Youngwood borough
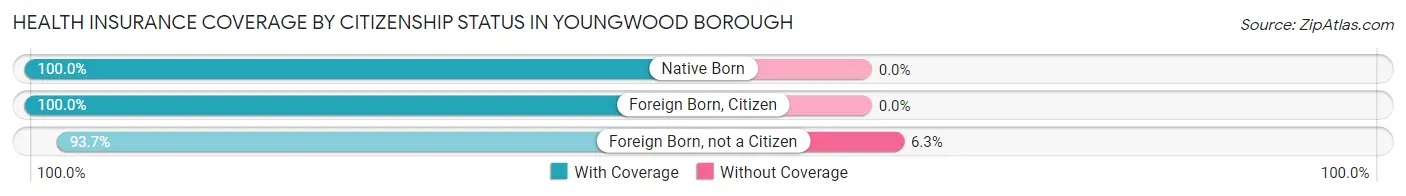
| Citizenship Status | With Coverage | Without Coverage |
| Native Born | 77 (100.0%) | 0 (0.0%) |
| Foreign Born, Citizen | 459 (100.0%) | 0 (0.0%) |
| Foreign Born, not a Citizen | 326 (93.7%) | 22 (6.3%) |
Health Insurance Coverage by Household Income in Youngwood borough
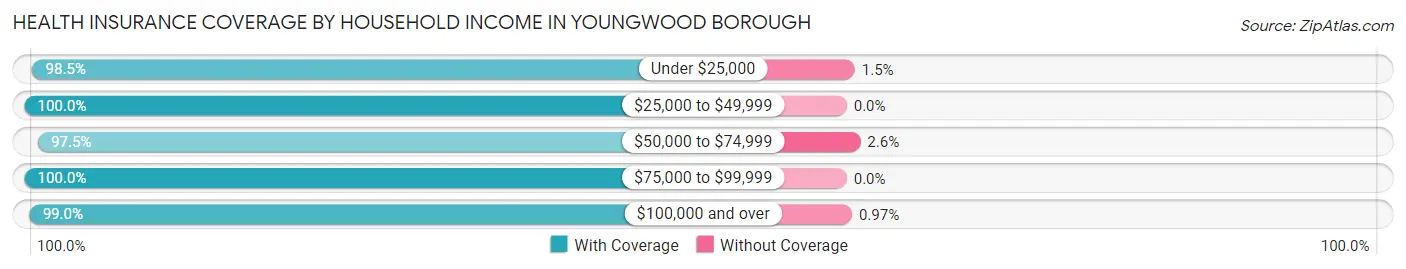
| Household Income | With Coverage | Without Coverage |
| Under $25,000 | 196 (98.5%) | 3 (1.5%) |
| $25,000 to $49,999 | 568 (100.0%) | 0 (0.0%) |
| $50,000 to $74,999 | 496 (97.5%) | 13 (2.5%) |
| $75,000 to $99,999 | 706 (100.0%) | 0 (0.0%) |
| $100,000 and over | 920 (99.0%) | 9 (1.0%) |
Public vs Private Health Insurance Coverage by Age in Youngwood borough
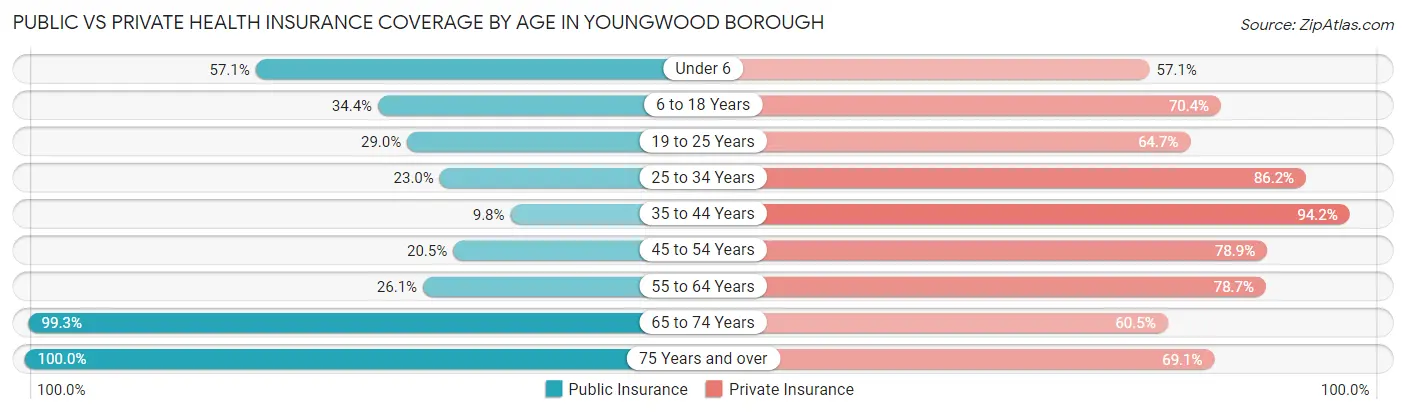
| Age Bracket | Public Insurance | Private Insurance |
| Under 6 | 44 (57.1%) | 44 (57.1%) |
| 6 to 18 Years | 158 (34.4%) | 323 (70.4%) |
| 19 to 25 Years | 101 (29.0%) | 225 (64.7%) |
| 25 to 34 Years | 68 (23.0%) | 255 (86.2%) |
| 35 to 44 Years | 29 (9.8%) | 278 (94.2%) |
| 45 to 54 Years | 103 (20.5%) | 397 (78.9%) |
| 55 to 64 Years | 104 (26.1%) | 314 (78.7%) |
| 65 to 74 Years | 266 (99.3%) | 162 (60.5%) |
| 75 Years and over | 269 (100.0%) | 186 (69.1%) |
| Total | 1,142 (39.2%) | 2,184 (75.0%) |
Disability Status by Sex by Age in Youngwood borough
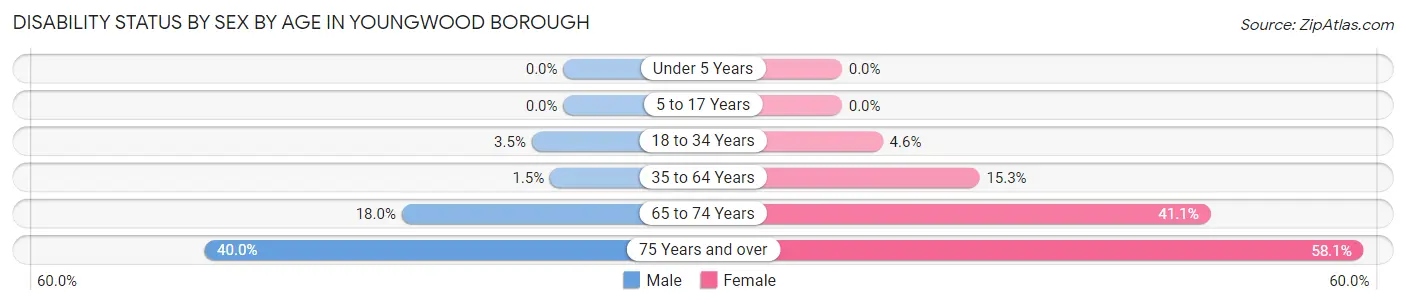
| Age Bracket | Male | Female |
| Under 5 Years | 0 (0.0%) | 0 (0.0%) |
| 5 to 17 Years | 0 (0.0%) | 0 (0.0%) |
| 18 to 34 Years | 12 (3.5%) | 15 (4.5%) |
| 35 to 64 Years | 9 (1.5%) | 90 (15.3%) |
| 65 to 74 Years | 18 (18.0%) | 69 (41.1%) |
| 75 Years and over | 36 (40.0%) | 104 (58.1%) |
Disability Class by Sex by Age in Youngwood borough
Disability Class: Hearing Difficulty
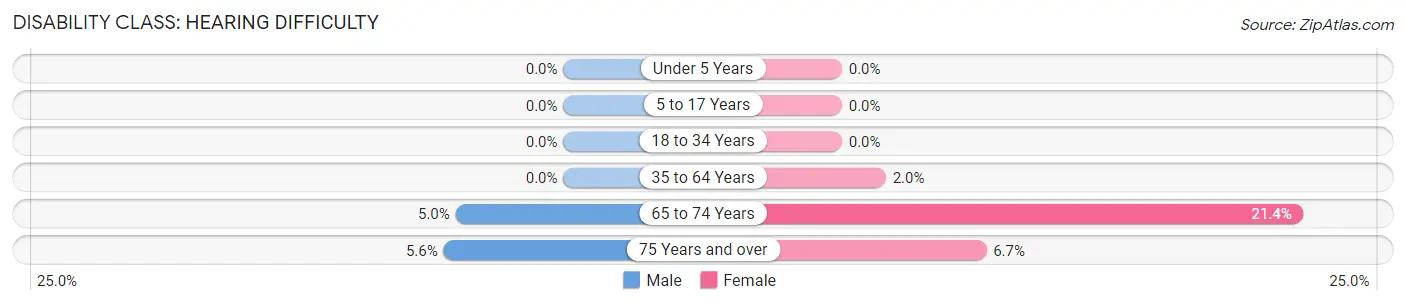
| Age Bracket | Male | Female |
| Under 5 Years | 0 (0.0%) | 0 (0.0%) |
| 5 to 17 Years | 0 (0.0%) | 0 (0.0%) |
| 18 to 34 Years | 0 (0.0%) | 0 (0.0%) |
| 35 to 64 Years | 0 (0.0%) | 12 (2.0%) |
| 65 to 74 Years | 5 (5.0%) | 36 (21.4%) |
| 75 Years and over | 5 (5.6%) | 12 (6.7%) |
Disability Class: Vision Difficulty
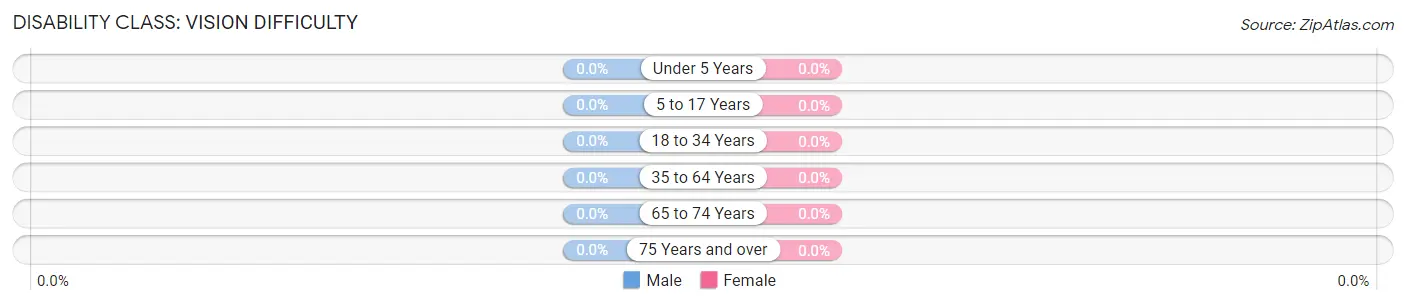
| Age Bracket | Male | Female |
| Under 5 Years | 0 (0.0%) | 0 (0.0%) |
| 5 to 17 Years | 0 (0.0%) | 0 (0.0%) |
| 18 to 34 Years | 0 (0.0%) | 0 (0.0%) |
| 35 to 64 Years | 0 (0.0%) | 0 (0.0%) |
| 65 to 74 Years | 0 (0.0%) | 0 (0.0%) |
| 75 Years and over | 0 (0.0%) | 0 (0.0%) |
Disability Class: Cognitive Difficulty
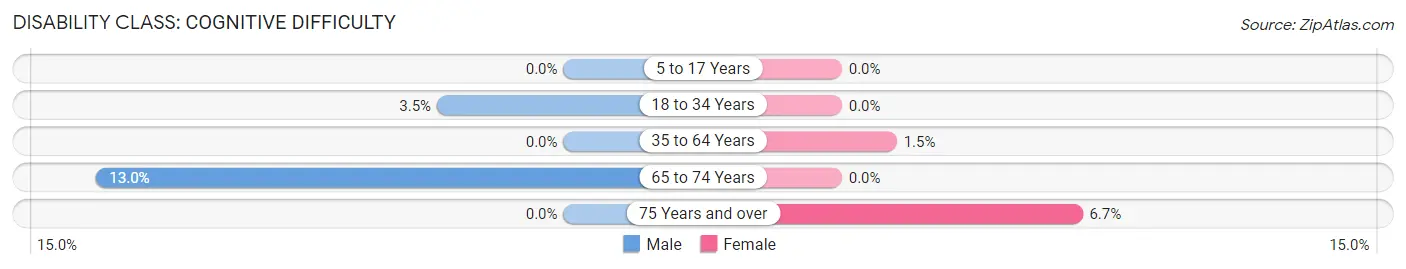
| Age Bracket | Male | Female |
| 5 to 17 Years | 0 (0.0%) | 0 (0.0%) |
| 18 to 34 Years | 12 (3.5%) | 0 (0.0%) |
| 35 to 64 Years | 0 (0.0%) | 9 (1.5%) |
| 65 to 74 Years | 13 (13.0%) | 0 (0.0%) |
| 75 Years and over | 0 (0.0%) | 12 (6.7%) |
Disability Class: Ambulatory Difficulty
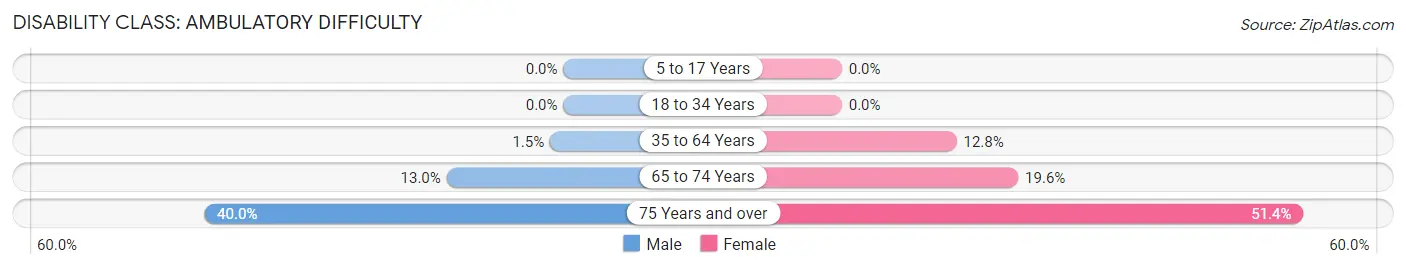
| Age Bracket | Male | Female |
| 5 to 17 Years | 0 (0.0%) | 0 (0.0%) |
| 18 to 34 Years | 0 (0.0%) | 0 (0.0%) |
| 35 to 64 Years | 9 (1.5%) | 75 (12.8%) |
| 65 to 74 Years | 13 (13.0%) | 33 (19.6%) |
| 75 Years and over | 36 (40.0%) | 92 (51.4%) |
Disability Class: Self-Care Difficulty
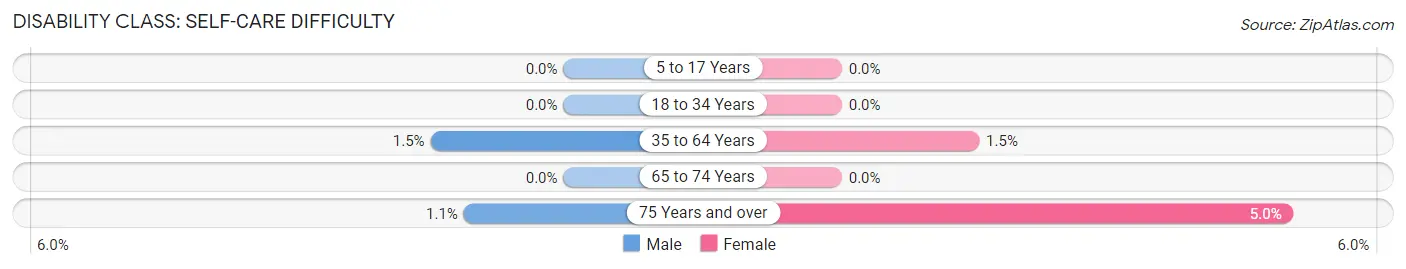
| Age Bracket | Male | Female |
| 5 to 17 Years | 0 (0.0%) | 0 (0.0%) |
| 18 to 34 Years | 0 (0.0%) | 0 (0.0%) |
| 35 to 64 Years | 9 (1.5%) | 9 (1.5%) |
| 65 to 74 Years | 0 (0.0%) | 0 (0.0%) |
| 75 Years and over | 1 (1.1%) | 9 (5.0%) |
Technology Access in Youngwood borough
Computing Device Access in Youngwood borough
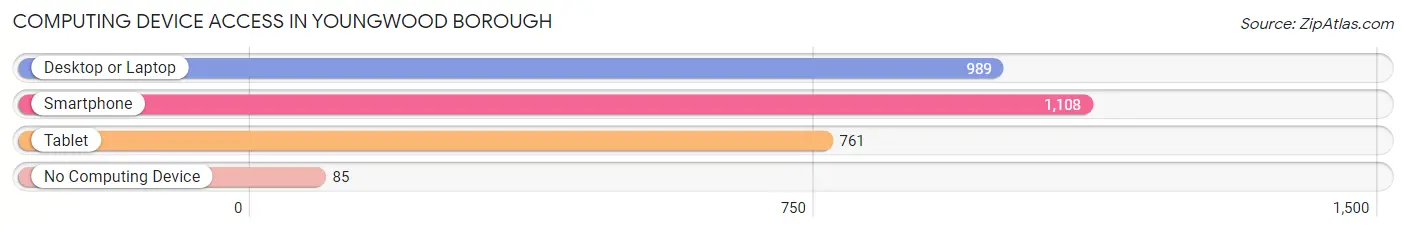
| Device Type | # Households | % Households |
| Desktop or Laptop | 989 | 72.1% |
| Smartphone | 1,108 | 80.8% |
| Tablet | 761 | 55.5% |
| No Computing Device | 85 | 6.2% |
| Total | 1,371 | 100.0% |
Internet Access in Youngwood borough
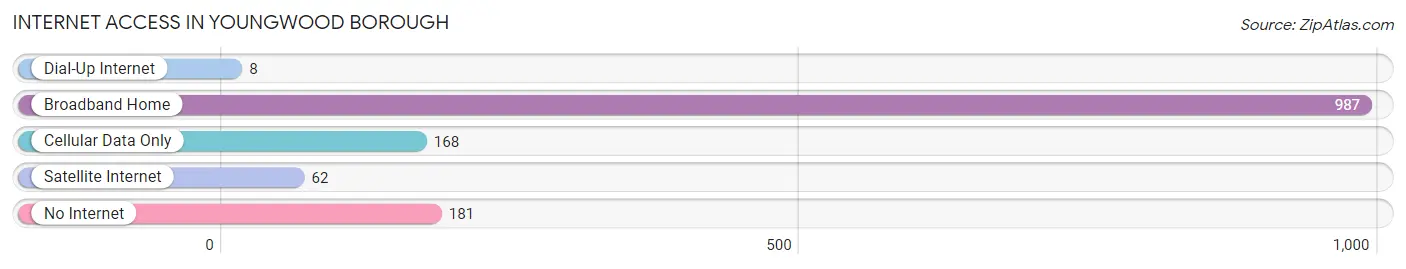
| Internet Type | # Households | % Households |
| Dial-Up Internet | 8 | 0.6% |
| Broadband Home | 987 | 72.0% |
| Cellular Data Only | 168 | 12.2% |
| Satellite Internet | 62 | 4.5% |
| No Internet | 181 | 13.2% |
| Total | 1,371 | 100.0% |
Youngwood borough Summary
Youngwood Borough is a small borough located in Westmoreland County, Pennsylvania. It is situated in the southwestern part of the county, approximately 25 miles southeast of Pittsburgh. The borough is bordered by the townships of Hempfield, South Huntingdon, and Sewickley. As of the 2010 census, the population of Youngwood Borough was 2,062.
History
Youngwood Borough was founded in 1851 by a group of settlers from the nearby town of Greensburg. The town was named after the Young family, who were among the first settlers. The Young family owned a large tract of land in the area, and the town was laid out on their property.
The first post office in Youngwood was established in 1853, and the first school was built in 1854. The town was incorporated as a borough in 1872.
In the late 19th century, Youngwood was a thriving industrial center. The town was home to several factories, including a glassworks, a brickyard, and a tannery. The town also had a number of stores and businesses, including a hotel, a bank, and a newspaper.
In the early 20th century, the town's economy began to decline. The factories closed, and many of the businesses moved away. The population of Youngwood began to decline as well, and by the 1950s the town was in decline.
In the late 20th century, Youngwood began to experience a resurgence. The town was revitalized with the construction of a new shopping center and the opening of a new hospital. The population of Youngwood began to increase, and the town is now a thriving community.
Geography
Youngwood Borough is located at 40°14'N 79°37'W (40.2333, -79.6167). The borough has a total area of 0.9 square miles, all of which is land.
The borough is located in the southwestern part of Westmoreland County, approximately 25 miles southeast of Pittsburgh. The borough is bordered by the townships of Hempfield, South Huntingdon, and Sewickley.
Economy
The economy of Youngwood Borough is largely based on the service industry. The town is home to a number of restaurants, retail stores, and other businesses. The town also has a number of medical facilities, including a hospital and a number of doctor's offices.
The town is also home to a number of manufacturing companies, including a glassworks, a brickyard, and a tannery.
Demographics
As of the 2010 census, the population of Youngwood Borough was 2,062. The racial makeup of the borough was 97.3% White, 0.9% African American, 0.2% Native American, 0.4% Asian, 0.1% Pacific Islander, 0.2% from other races, and 0.9% from two or more races. Hispanic or Latino of any race were 0.9% of the population.
The median household income in Youngwood Borough was $41,250, and the median family income was $50,000. The per capita income in the borough was $20,945. About 8.3% of families and 10.2% of the population were below the poverty line, including 14.2% of those under age 18 and 5.2% of those age 65 or over.
Common Questions
What is Per Capita Income in Youngwood borough?
Per Capita income in Youngwood borough is $35,041.
What is the Median Family Income in Youngwood borough?
Median Family Income in Youngwood borough is $82,556.
What is the Median Household income in Youngwood borough?
Median Household Income in Youngwood borough is $67,917.
What is Income or Wage Gap in Youngwood borough?
Income or Wage Gap in Youngwood borough is 44.6%.
Women in Youngwood borough earn 55.4 cents for every dollar earned by a man.
What is Inequality or Gini Index in Youngwood borough?
Inequality or Gini Index in Youngwood borough is 0.36.
What is the Total Population of Youngwood borough?
Total Population of Youngwood borough is 2,955.
What is the Total Male Population of Youngwood borough?
Total Male Population of Youngwood borough is 1,317.
What is the Total Female Population of Youngwood borough?
Total Female Population of Youngwood borough is 1,638.
What is the Ratio of Males per 100 Females in Youngwood borough?
There are 80.40 Males per 100 Females in Youngwood borough.
What is the Ratio of Females per 100 Males in Youngwood borough?
There are 124.37 Females per 100 Males in Youngwood borough.
What is the Median Population Age in Youngwood borough?
Median Population Age in Youngwood borough is 45.0 Years.
What is the Average Family Size in Youngwood borough
Average Family Size in Youngwood borough is 2.7 People.
What is the Average Household Size in Youngwood borough
Average Household Size in Youngwood borough is 2.1 People.
How Large is the Labor Force in Youngwood borough?
There are 1,749 People in the Labor Forcein in Youngwood borough.
What is the Percentage of People in the Labor Force in Youngwood borough?
69.7% of People are in the Labor Force in Youngwood borough.