Stillwater borough, PA Map & Demographics
Stillwater borough Overview
$33,458
PER CAPITA INCOME
$70,625
AVG FAMILY INCOME
$70,000
AVG HOUSEHOLD INCOME
35.5%
WAGE / INCOME GAP [ % ]
64.5¢/ $1
WAGE / INCOME GAP [ $ ]
0.37
INEQUALITY / GINI INDEX
221
TOTAL POPULATION
102
MALE POPULATION
119
FEMALE POPULATION
85.71
MALES / 100 FEMALES
116.67
FEMALES / 100 MALES
45.8
MEDIAN AGE
2.7
AVG FAMILY SIZE
2.5
AVG HOUSEHOLD SIZE
108
LABOR FORCE [ PEOPLE ]
62.8%
PERCENT IN LABOR FORCE
0.9%
UNEMPLOYMENT RATE
Income in Stillwater borough
Income Overview in Stillwater borough
Per Capita Income in Stillwater borough is $33,458, while median incomes of families and households are $70,625 and $70,000 respectively.
| Characteristic | Number | Measure |
| Per Capita Income | 221 | $33,458 |
| Median Family Income | 73 | $70,625 |
| Mean Family Income | 73 | $91,200 |
| Median Household Income | 88 | $70,000 |
| Mean Household Income | 88 | $85,830 |
| Income Deficit | 73 | $0 |
| Wage / Income Gap (%) | 221 | 35.50% |
| Wage / Income Gap ($) | 221 | 64.50¢ per $1 |
| Gini / Inequality Index | 221 | 0.37 |
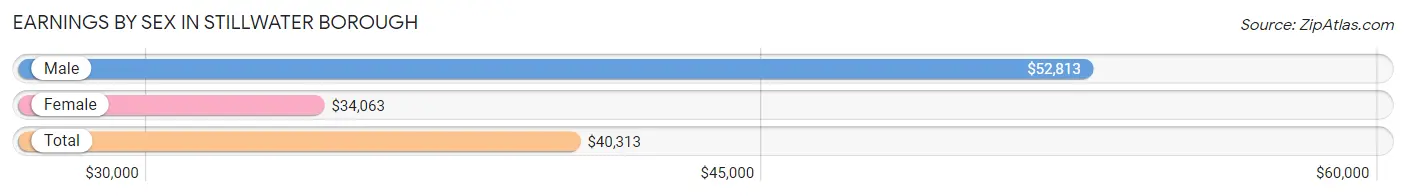
Earnings by Sex in Stillwater borough
Average Earnings in Stillwater borough are $40,313, $52,813 for men and $34,063 for women, a difference of 35.5%.
| Sex | Number | Average Earnings |
| Male | 43 (38.1%) | $52,813 |
| Female | 70 (62.0%) | $34,063 |
| Total | 113 (100.0%) | $40,313 |
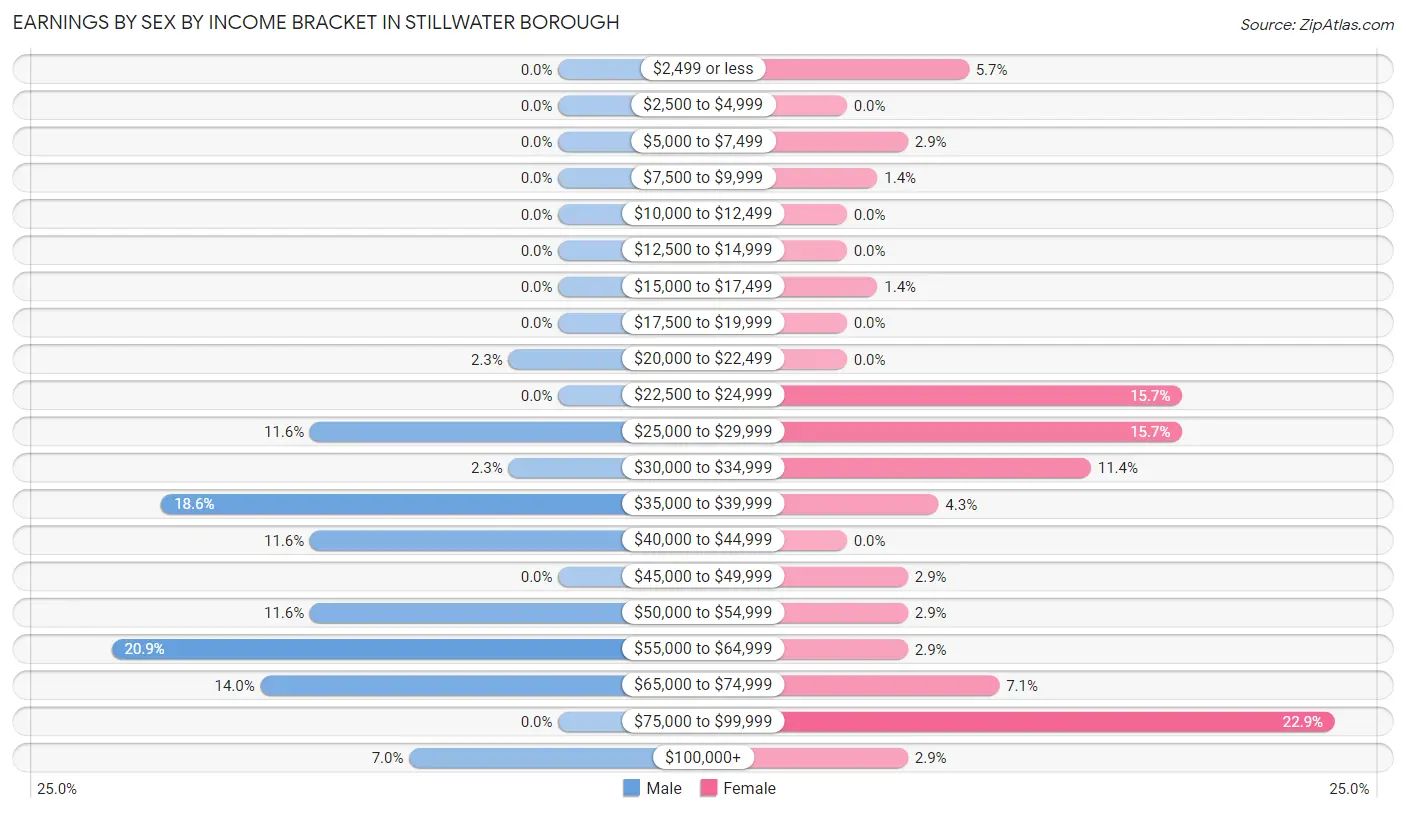
Earnings by Sex by Income Bracket in Stillwater borough
The most common earnings brackets in Stillwater borough are $55,000 to $64,999 for men (9 | 20.9%) and $75,000 to $99,999 for women (16 | 22.9%).
| Income | Male | Female |
| $2,499 or less | 0 (0.0%) | 4 (5.7%) |
| $2,500 to $4,999 | 0 (0.0%) | 0 (0.0%) |
| $5,000 to $7,499 | 0 (0.0%) | 2 (2.9%) |
| $7,500 to $9,999 | 0 (0.0%) | 1 (1.4%) |
| $10,000 to $12,499 | 0 (0.0%) | 0 (0.0%) |
| $12,500 to $14,999 | 0 (0.0%) | 0 (0.0%) |
| $15,000 to $17,499 | 0 (0.0%) | 1 (1.4%) |
| $17,500 to $19,999 | 0 (0.0%) | 0 (0.0%) |
| $20,000 to $22,499 | 1 (2.3%) | 0 (0.0%) |
| $22,500 to $24,999 | 0 (0.0%) | 11 (15.7%) |
| $25,000 to $29,999 | 5 (11.6%) | 11 (15.7%) |
| $30,000 to $34,999 | 1 (2.3%) | 8 (11.4%) |
| $35,000 to $39,999 | 8 (18.6%) | 3 (4.3%) |
| $40,000 to $44,999 | 5 (11.6%) | 0 (0.0%) |
| $45,000 to $49,999 | 0 (0.0%) | 2 (2.9%) |
| $50,000 to $54,999 | 5 (11.6%) | 2 (2.9%) |
| $55,000 to $64,999 | 9 (20.9%) | 2 (2.9%) |
| $65,000 to $74,999 | 6 (14.0%) | 5 (7.1%) |
| $75,000 to $99,999 | 0 (0.0%) | 16 (22.9%) |
| $100,000+ | 3 (7.0%) | 2 (2.9%) |
| Total | 43 (100.0%) | 70 (100.0%) |
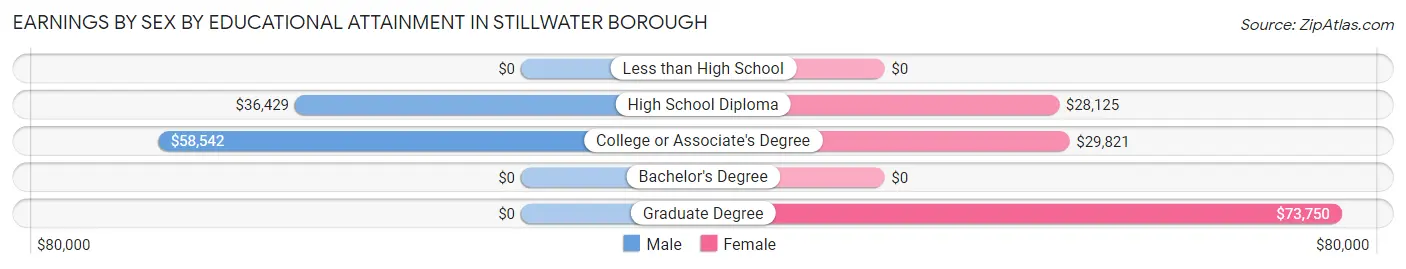
Earnings by Sex by Educational Attainment in Stillwater borough
Average earnings in Stillwater borough are $53,438 for men and $34,531 for women, a difference of 35.4%. Men with an educational attainment of college or associate's degree enjoy the highest average annual earnings of $58,542, while those with high school diploma education earn the least with $36,429. Women with an educational attainment of graduate degree earn the most with the average annual earnings of $73,750, while those with high school diploma education have the smallest earnings of $28,125.
| Educational Attainment | Male Income | Female Income |
| Less than High School | - | - |
| High School Diploma | $36,429 | $28,125 |
| College or Associate's Degree | $58,542 | $29,821 |
| Bachelor's Degree | - | - |
| Graduate Degree | - | - |
| Total | $53,438 | $34,531 |
Family Income in Stillwater borough
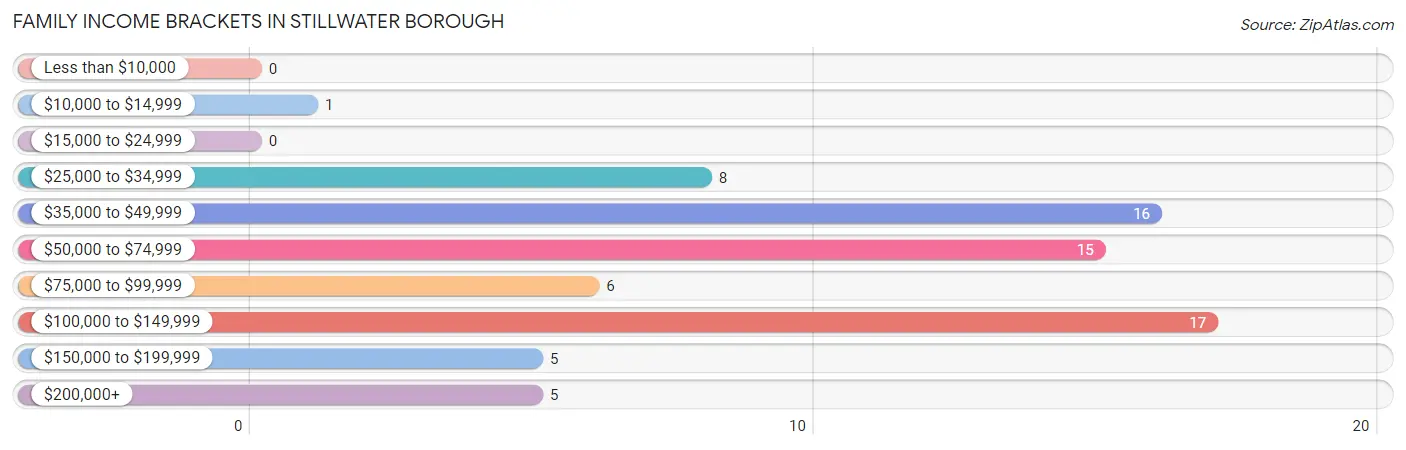
Family Income Brackets in Stillwater borough
According to the Stillwater borough family income data, there are 17 families falling into the $100,000 to $149,999 income range, which is the most common income bracket and makes up 23.3% of all families.
| Income Bracket | # Families | % Families |
| Less than $10,000 | 0 | 0.0% |
| $10,000 to $14,999 | 1 | 1.4% |
| $15,000 to $24,999 | 0 | 0.0% |
| $25,000 to $34,999 | 8 | 11.0% |
| $35,000 to $49,999 | 16 | 21.9% |
| $50,000 to $74,999 | 15 | 20.5% |
| $75,000 to $99,999 | 6 | 8.2% |
| $100,000 to $149,999 | 17 | 23.3% |
| $150,000 to $199,999 | 5 | 6.8% |
| $200,000+ | 5 | 6.8% |
Family Income by Famaliy Size in Stillwater borough
2-person families (37 | 50.7%) account for the highest median family income in Stillwater borough with $115,625 per family, while 2-person families (37 | 50.7%) have the highest median income of $57,812 per family member.
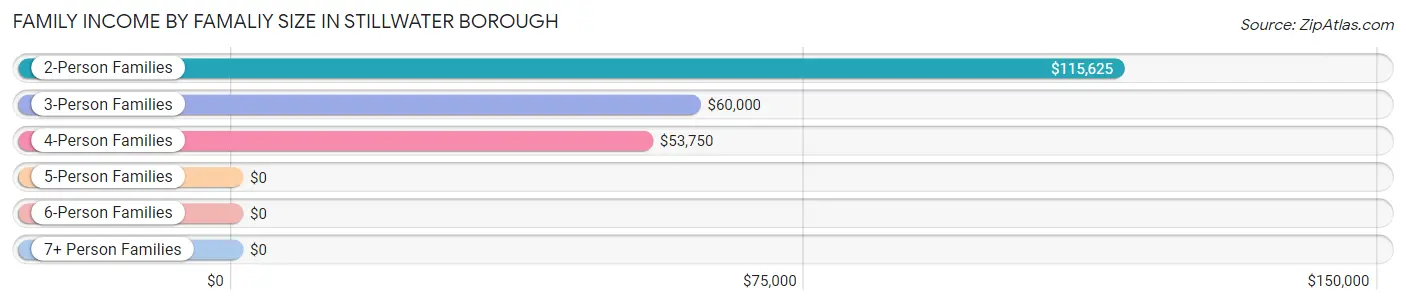
| Income Bracket | # Families | Median Income |
| 2-Person Families | 37 (50.7%) | $115,625 |
| 3-Person Families | 16 (21.9%) | $60,000 |
| 4-Person Families | 19 (26.0%) | $53,750 |
| 5-Person Families | 0 (0.0%) | $0 |
| 6-Person Families | 1 (1.4%) | $0 |
| 7+ Person Families | 0 (0.0%) | $0 |
| Total | 73 (100.0%) | $70,625 |
Family Income by Number of Earners in Stillwater borough
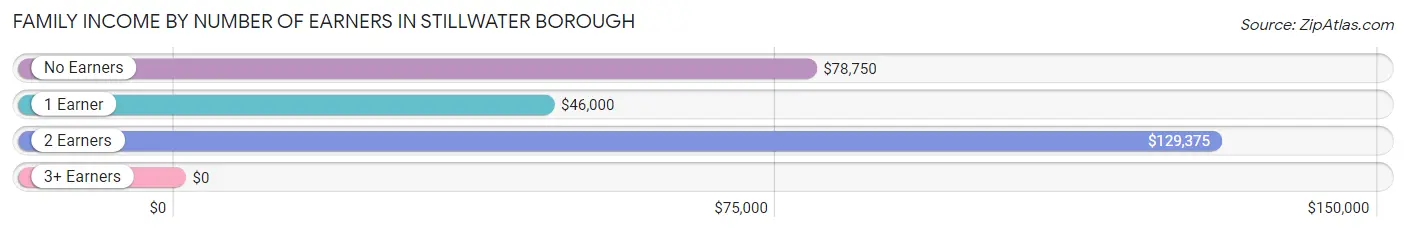
| Number of Earners | # Families | Median Income |
| No Earners | 4 (5.5%) | $78,750 |
| 1 Earner | 36 (49.3%) | $46,000 |
| 2 Earners | 31 (42.5%) | $129,375 |
| 3+ Earners | 2 (2.7%) | $0 |
| Total | 73 (100.0%) | $70,625 |
Household Income in Stillwater borough
Household Income Brackets in Stillwater borough
With 20 households falling in the category, the $100,000 to $149,999 income range is the most frequent in Stillwater borough, accounting for 22.7% of all households.
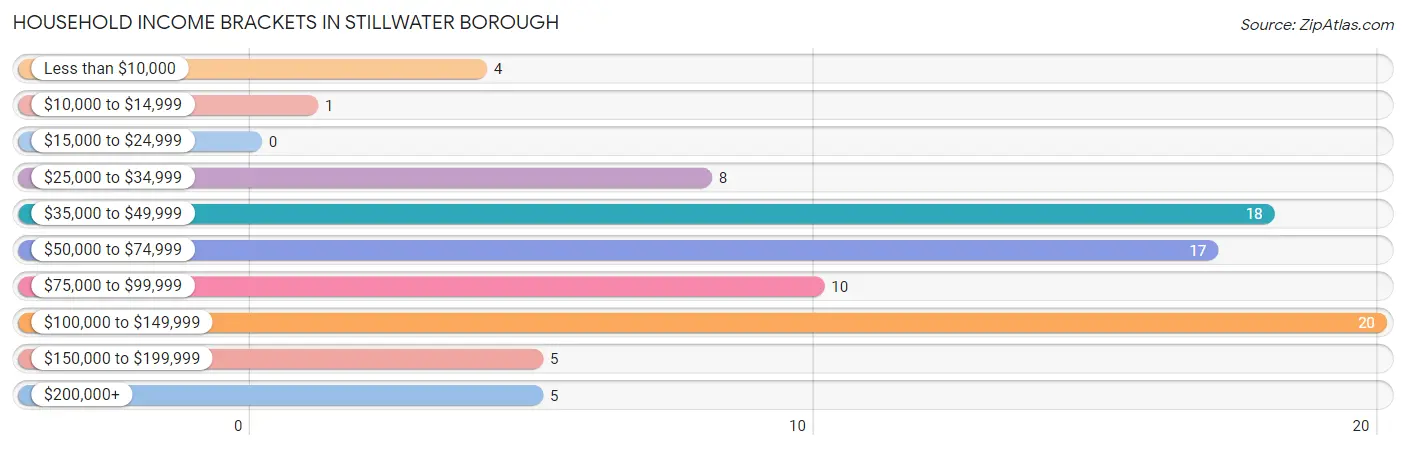
| Income Bracket | # Households | % Households |
| Less than $10,000 | 4 | 4.5% |
| $10,000 to $14,999 | 1 | 1.1% |
| $15,000 to $24,999 | 0 | 0.0% |
| $25,000 to $34,999 | 8 | 9.1% |
| $35,000 to $49,999 | 18 | 20.5% |
| $50,000 to $74,999 | 17 | 19.3% |
| $75,000 to $99,999 | 10 | 11.4% |
| $100,000 to $149,999 | 20 | 22.7% |
| $150,000 to $199,999 | 5 | 5.7% |
| $200,000+ | 5 | 5.7% |
Household Income by Householder Age in Stillwater borough
The median household income in Stillwater borough is $70,000, with the highest median household income of $93,750 found in the 45 to 64 years age bracket for the primary householder. A total of 47 households (53.4%) fall into this category.
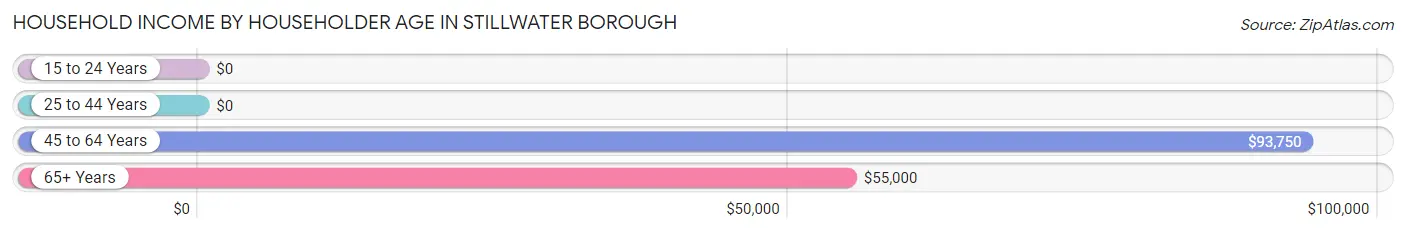
| Income Bracket | # Households | Median Income |
| 15 to 24 Years | 0 (0.0%) | $0 |
| 25 to 44 Years | 21 (23.9%) | $0 |
| 45 to 64 Years | 47 (53.4%) | $93,750 |
| 65+ Years | 20 (22.7%) | $55,000 |
| Total | 88 (100.0%) | $70,000 |
Poverty in Stillwater borough
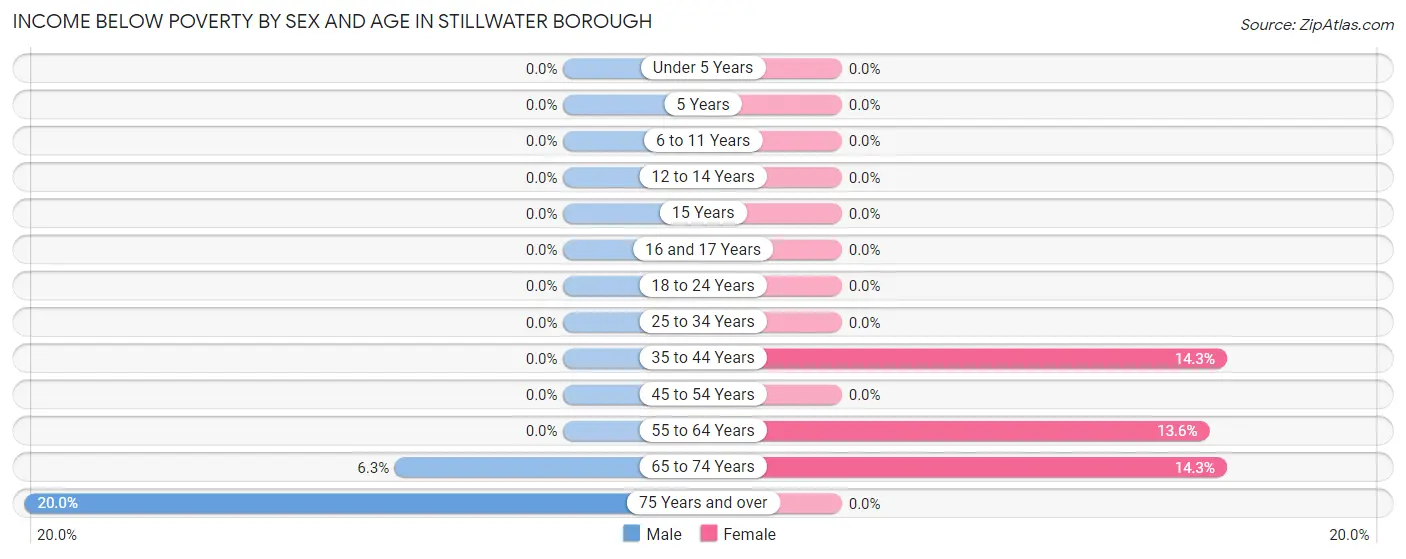
Income Below Poverty by Sex and Age in Stillwater borough
With 2.0% poverty level for males and 4.2% for females among the residents of Stillwater borough, 75 year old and over males and 35 to 44 year old females are the most vulnerable to poverty, with 1 males (20.0%) and 1 females (14.3%) in their respective age groups living below the poverty level.
| Age Bracket | Male | Female |
| Under 5 Years | 0 (0.0%) | 0 (0.0%) |
| 5 Years | 0 (0.0%) | 0 (0.0%) |
| 6 to 11 Years | 0 (0.0%) | 0 (0.0%) |
| 12 to 14 Years | 0 (0.0%) | 0 (0.0%) |
| 15 Years | 0 (0.0%) | 0 (0.0%) |
| 16 and 17 Years | 0 (0.0%) | 0 (0.0%) |
| 18 to 24 Years | 0 (0.0%) | 0 (0.0%) |
| 25 to 34 Years | 0 (0.0%) | 0 (0.0%) |
| 35 to 44 Years | 0 (0.0%) | 1 (14.3%) |
| 45 to 54 Years | 0 (0.0%) | 0 (0.0%) |
| 55 to 64 Years | 0 (0.0%) | 3 (13.6%) |
| 65 to 74 Years | 1 (6.2%) | 1 (14.3%) |
| 75 Years and over | 1 (20.0%) | 0 (0.0%) |
| Total | 2 (2.0%) | 5 (4.2%) |
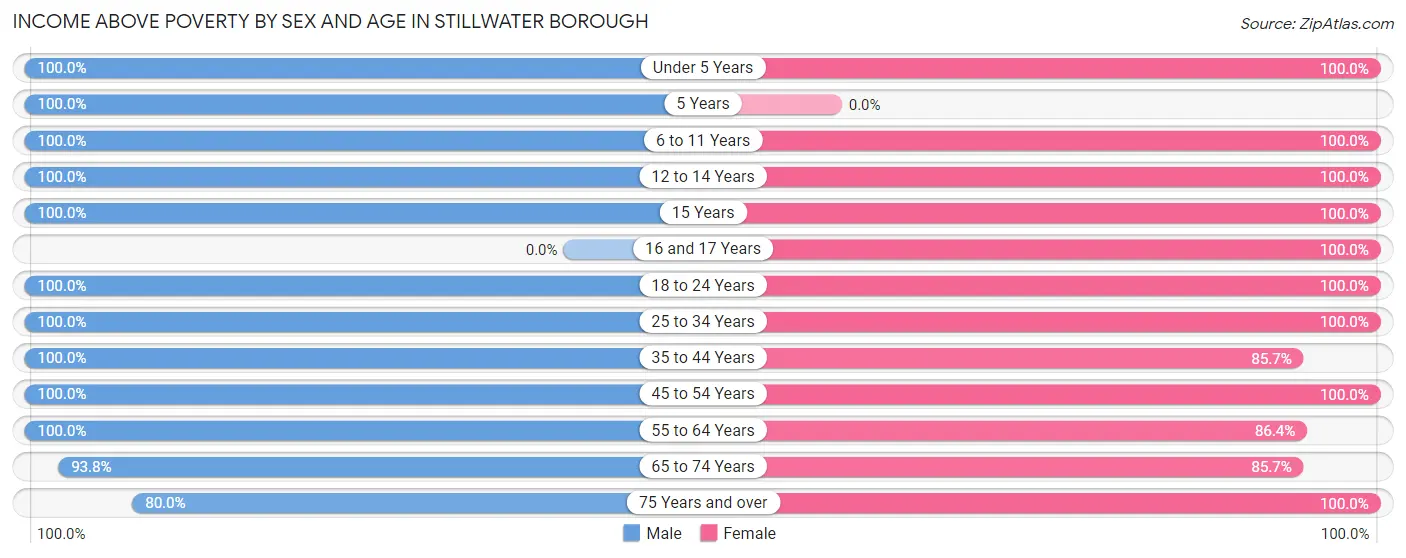
Income Above Poverty by Sex and Age in Stillwater borough
According to the poverty statistics in Stillwater borough, males aged under 5 years and females aged under 5 years are the age groups that are most secure financially, with 100.0% of males and 100.0% of females in these age groups living above the poverty line.
| Age Bracket | Male | Female |
| Under 5 Years | 8 (100.0%) | 5 (100.0%) |
| 5 Years | 1 (100.0%) | 0 (0.0%) |
| 6 to 11 Years | 10 (100.0%) | 7 (100.0%) |
| 12 to 14 Years | 8 (100.0%) | 2 (100.0%) |
| 15 Years | 6 (100.0%) | 2 (100.0%) |
| 16 and 17 Years | 0 (0.0%) | 10 (100.0%) |
| 18 to 24 Years | 2 (100.0%) | 3 (100.0%) |
| 25 to 34 Years | 10 (100.0%) | 16 (100.0%) |
| 35 to 44 Years | 6 (100.0%) | 6 (85.7%) |
| 45 to 54 Years | 14 (100.0%) | 34 (100.0%) |
| 55 to 64 Years | 16 (100.0%) | 19 (86.4%) |
| 65 to 74 Years | 15 (93.8%) | 6 (85.7%) |
| 75 Years and over | 4 (80.0%) | 4 (100.0%) |
| Total | 100 (98.0%) | 114 (95.8%) |
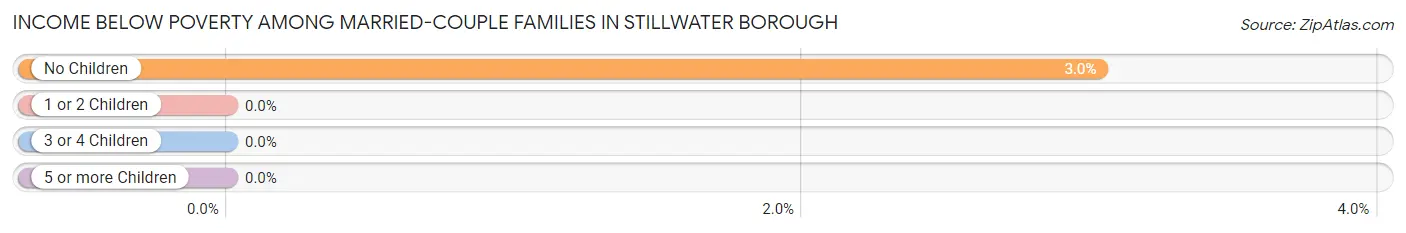
Income Below Poverty Among Married-Couple Families in Stillwater borough
The poverty statistics for married-couple families in Stillwater borough show that 1.7% or 1 of the total 58 families live below the poverty line. Families with no children have the highest poverty rate of 3.0%, comprising of 1 families. On the other hand, families with 1 or 2 children have the lowest poverty rate of 0.0%, which includes 0 families.
| Children | Above Poverty | Below Poverty |
| No Children | 32 (97.0%) | 1 (3.0%) |
| 1 or 2 Children | 24 (100.0%) | 0 (0.0%) |
| 3 or 4 Children | 1 (100.0%) | 0 (0.0%) |
| 5 or more Children | 0 (0.0%) | 0 (0.0%) |
| Total | 57 (98.3%) | 1 (1.7%) |
Income Below Poverty Among Single-Parent Households in Stillwater borough
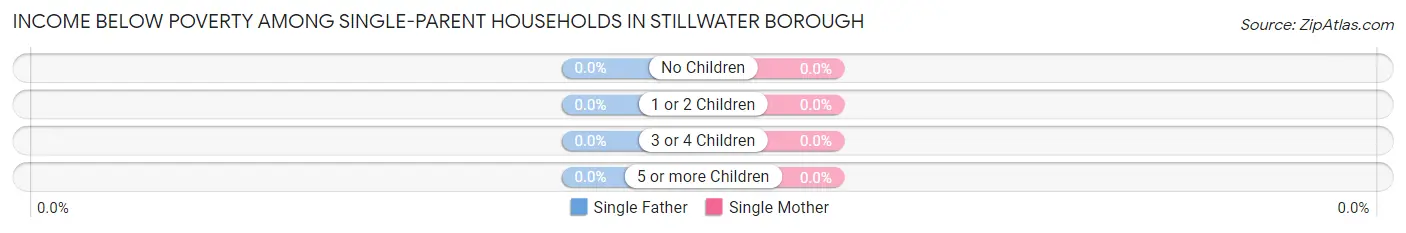
| Children | Single Father | Single Mother |
| No Children | 0 (0.0%) | 0 (0.0%) |
| 1 or 2 Children | 0 (0.0%) | 0 (0.0%) |
| 3 or 4 Children | 0 (0.0%) | 0 (0.0%) |
| 5 or more Children | 0 (0.0%) | 0 (0.0%) |
| Total | 0 (0.0%) | 0 (0.0%) |
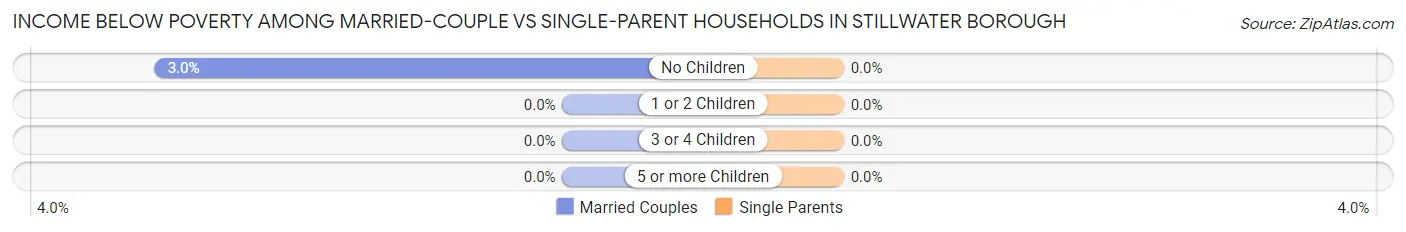
Income Below Poverty Among Married-Couple vs Single-Parent Households in Stillwater borough
| Children | Married-Couple Families | Single-Parent Households |
| No Children | 1 (3.0%) | 0 (0.0%) |
| 1 or 2 Children | 0 (0.0%) | 0 (0.0%) |
| 3 or 4 Children | 0 (0.0%) | 0 (0.0%) |
| 5 or more Children | 0 (0.0%) | 0 (0.0%) |
| Total | 1 (1.7%) | 0 (0.0%) |
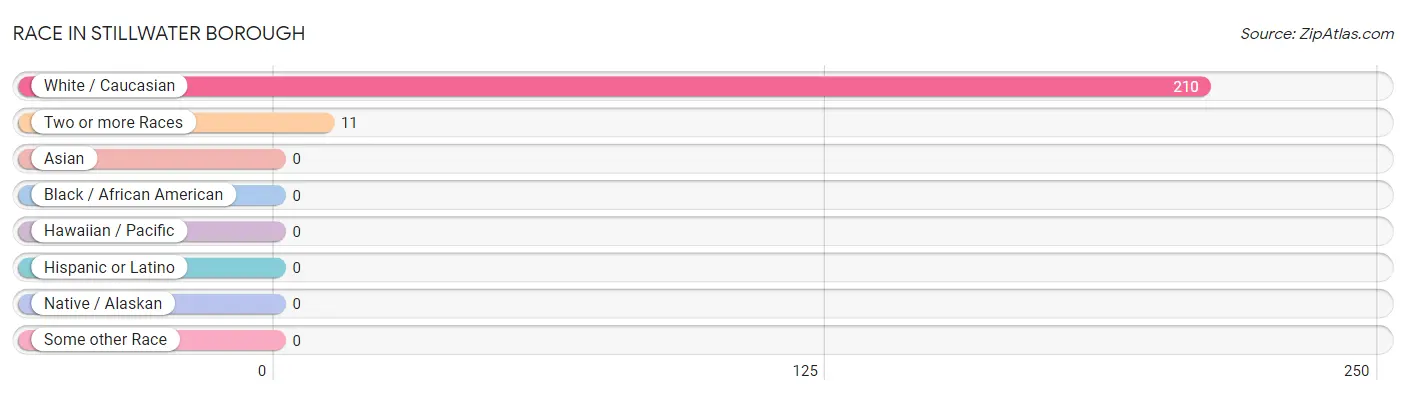
Race in Stillwater borough
The most populous races in Stillwater borough are White / Caucasian (210 | 95.0%), and Two or more Races (11 | 5.0%).
| Race | # Population | % Population |
| Asian | 0 | 0.0% |
| Black / African American | 0 | 0.0% |
| Hawaiian / Pacific | 0 | 0.0% |
| Hispanic or Latino | 0 | 0.0% |
| Native / Alaskan | 0 | 0.0% |
| White / Caucasian | 210 | 95.0% |
| Two or more Races | 11 | 5.0% |
| Some other Race | 0 | 0.0% |
| Total | 221 | 100.0% |
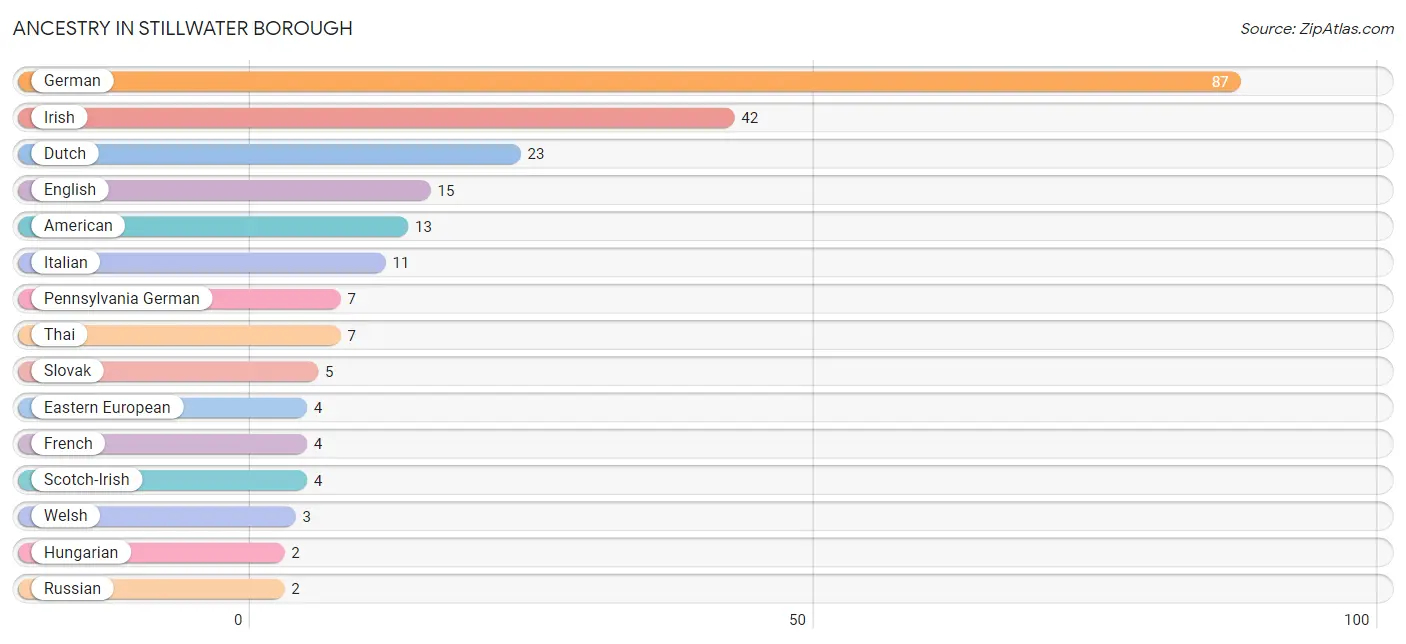
Ancestry in Stillwater borough
The most populous ancestries reported in Stillwater borough are German (87 | 39.4%), Irish (42 | 19.0%), Dutch (23 | 10.4%), English (15 | 6.8%), and American (13 | 5.9%), together accounting for 81.4% of all Stillwater borough residents.
| Ancestry | # Population | % Population |
| American | 13 | 5.9% |
| Dutch | 23 | 10.4% |
| Eastern European | 4 | 1.8% |
| English | 15 | 6.8% |
| French | 4 | 1.8% |
| German | 87 | 39.4% |
| Hungarian | 2 | 0.9% |
| Irish | 42 | 19.0% |
| Italian | 11 | 5.0% |
| Pennsylvania German | 7 | 3.2% |
| Polish | 1 | 0.4% |
| Russian | 2 | 0.9% |
| Scotch-Irish | 4 | 1.8% |
| Slavic | 2 | 0.9% |
| Slovak | 5 | 2.3% |
| Swiss | 2 | 0.9% |
| Thai | 7 | 3.2% |
| Welsh | 3 | 1.4% | View All 18 Rows |
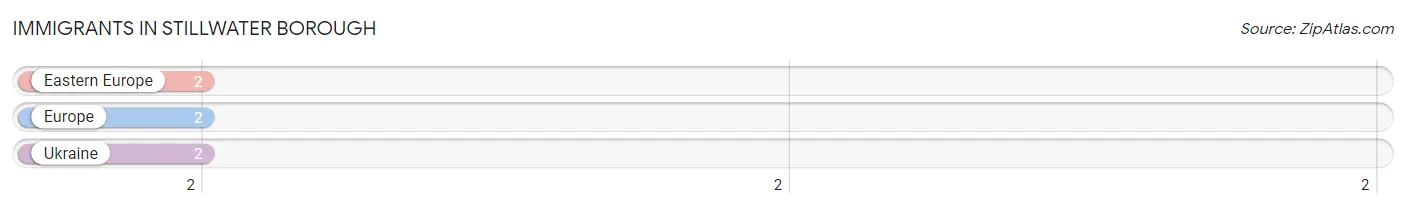
Immigrants in Stillwater borough
The most numerous immigrant groups reported in Stillwater borough came from Eastern Europe (2 | 0.9%), Europe (2 | 0.9%), and Ukraine (2 | 0.9%), together accounting for 2.7% of all Stillwater borough residents.
| Immigration Origin | # Population | % Population |
| Eastern Europe | 2 | 0.9% |
| Europe | 2 | 0.9% |
| Ukraine | 2 | 0.9% | View All 3 Rows |
Sex and Age in Stillwater borough
Sex and Age in Stillwater borough
The most populous age groups in Stillwater borough are 65 to 69 Years (14 | 13.7%) for men and 50 to 54 Years (18 | 15.1%) for women.
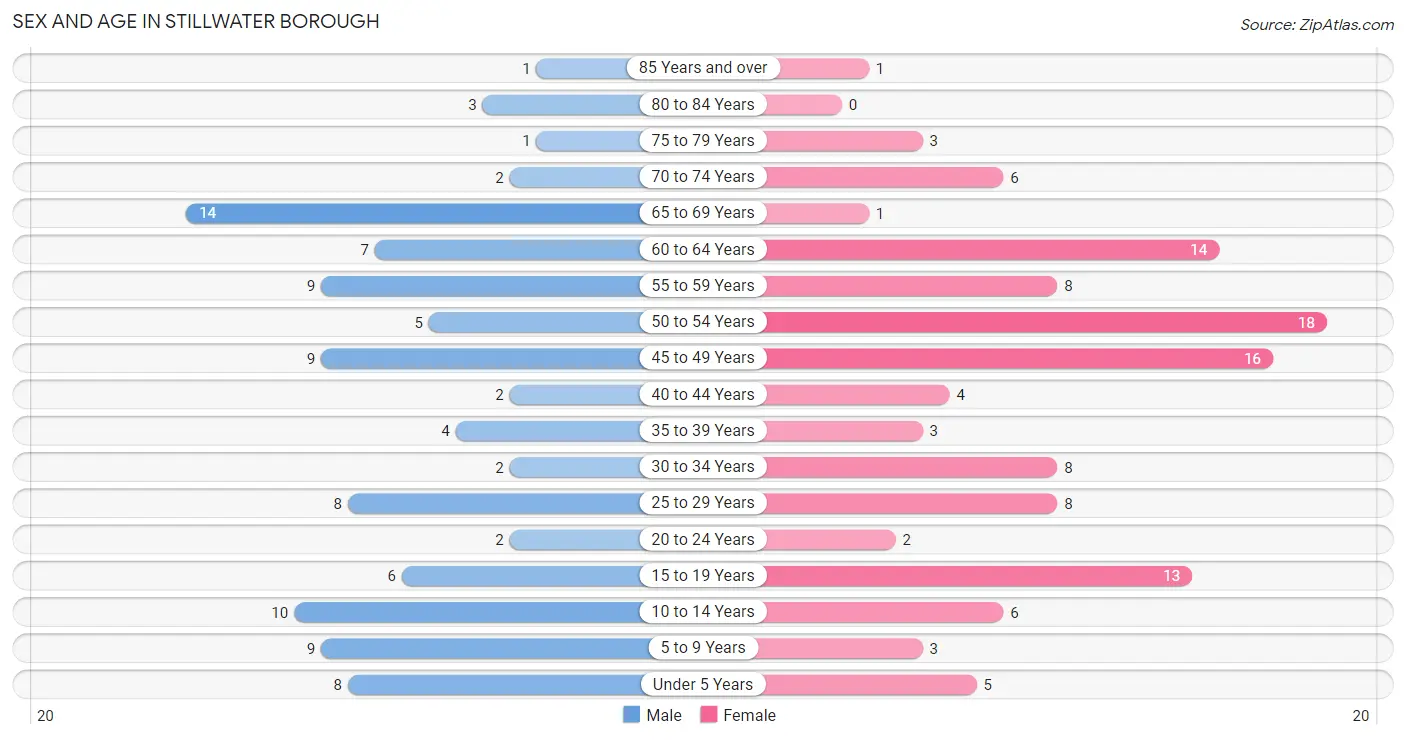
| Age Bracket | Male | Female |
| Under 5 Years | 8 (7.8%) | 5 (4.2%) |
| 5 to 9 Years | 9 (8.8%) | 3 (2.5%) |
| 10 to 14 Years | 10 (9.8%) | 6 (5.0%) |
| 15 to 19 Years | 6 (5.9%) | 13 (10.9%) |
| 20 to 24 Years | 2 (2.0%) | 2 (1.7%) |
| 25 to 29 Years | 8 (7.8%) | 8 (6.7%) |
| 30 to 34 Years | 2 (2.0%) | 8 (6.7%) |
| 35 to 39 Years | 4 (3.9%) | 3 (2.5%) |
| 40 to 44 Years | 2 (2.0%) | 4 (3.4%) |
| 45 to 49 Years | 9 (8.8%) | 16 (13.5%) |
| 50 to 54 Years | 5 (4.9%) | 18 (15.1%) |
| 55 to 59 Years | 9 (8.8%) | 8 (6.7%) |
| 60 to 64 Years | 7 (6.9%) | 14 (11.8%) |
| 65 to 69 Years | 14 (13.7%) | 1 (0.8%) |
| 70 to 74 Years | 2 (2.0%) | 6 (5.0%) |
| 75 to 79 Years | 1 (1.0%) | 3 (2.5%) |
| 80 to 84 Years | 3 (2.9%) | 0 (0.0%) |
| 85 Years and over | 1 (1.0%) | 1 (0.8%) |
| Total | 102 (100.0%) | 119 (100.0%) |
Families and Households in Stillwater borough
Median Family Size in Stillwater borough
The median family size in Stillwater borough is 2.74 persons per family, with single male/father families (2 | 2.7%) accounting for the largest median family size of 3 persons per family. On the other hand, single female/mother families (13 | 17.8%) represent the smallest median family size with 2.23 persons per family.
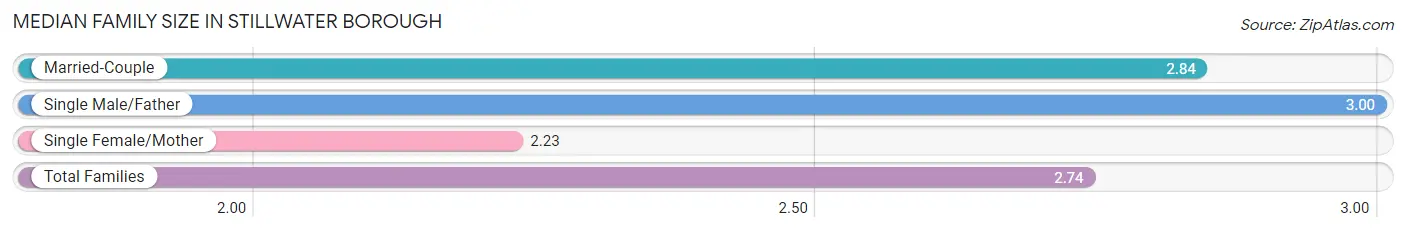
| Family Type | # Families | Family Size |
| Married-Couple | 58 (79.4%) | 2.84 |
| Single Male/Father | 2 (2.7%) | 3.00 |
| Single Female/Mother | 13 (17.8%) | 2.23 |
| Total Families | 73 (100.0%) | 2.74 |
Median Household Size in Stillwater borough
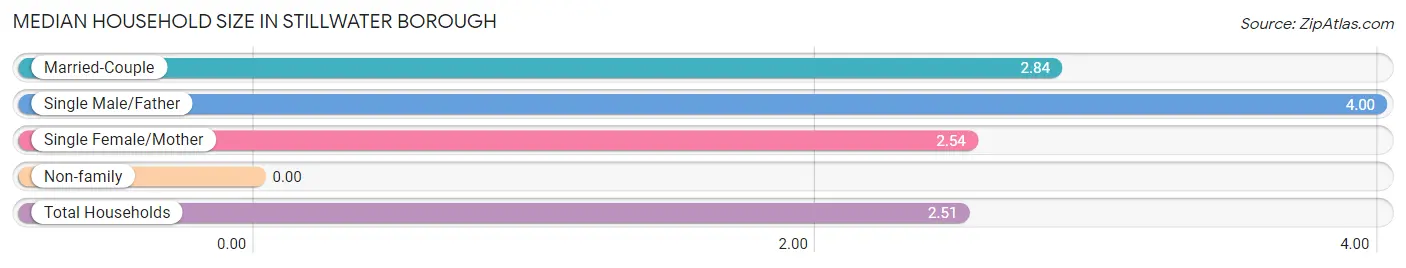
| Household Type | # Households | Household Size |
| Married-Couple | 58 (65.9%) | 2.84 |
| Single Male/Father | 2 (2.3%) | 4.00 |
| Single Female/Mother | 13 (14.8%) | 2.54 |
| Non-family | 15 (17.1%) | - |
| Total Households | 88 (100.0%) | 2.51 |
Household Size by Marriage Status in Stillwater borough
Out of a total of 88 households in Stillwater borough, 73 (83.0%) are family households, while 15 (17.1%) are nonfamily households. The most numerous type of family households are 2-person households, comprising 35, and the most common type of nonfamily households are 1-person households, comprising 15.
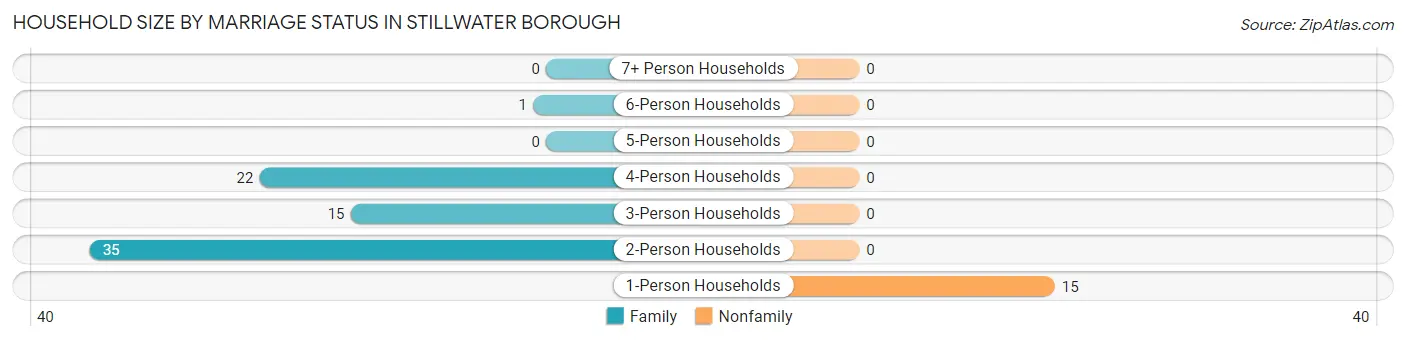
| Household Size | Family Households | Nonfamily Households |
| 1-Person Households | - | 15 (17.1%) |
| 2-Person Households | 35 (39.8%) | 0 (0.0%) |
| 3-Person Households | 15 (17.1%) | 0 (0.0%) |
| 4-Person Households | 22 (25.0%) | 0 (0.0%) |
| 5-Person Households | 0 (0.0%) | 0 (0.0%) |
| 6-Person Households | 1 (1.1%) | 0 (0.0%) |
| 7+ Person Households | 0 (0.0%) | 0 (0.0%) |
| Total | 73 (83.0%) | 15 (17.1%) |
Female Fertility in Stillwater borough
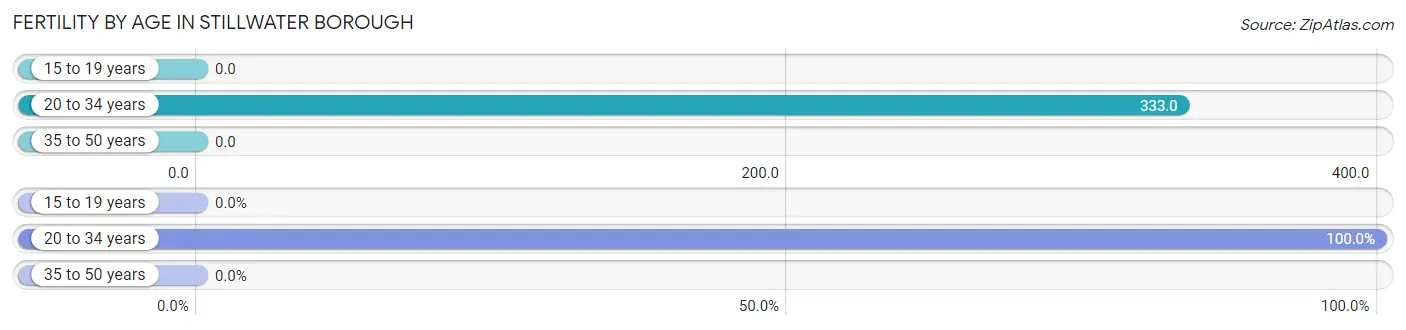
Fertility by Age in Stillwater borough
Average fertility rate in Stillwater borough is 98.0 births per 1,000 women. Women in the age bracket of 20 to 34 years have the highest fertility rate with 333.0 births per 1,000 women. Women in the age bracket of 20 to 34 years acount for 100.0% of all women with births.
| Age Bracket | Women with Births | Births / 1,000 Women |
| 15 to 19 years | 0 (0.0%) | 0.0 |
| 20 to 34 years | 6 (100.0%) | 333.0 |
| 35 to 50 years | 0 (0.0%) | 0.0 |
| Total | 6 (100.0%) | 98.0 |
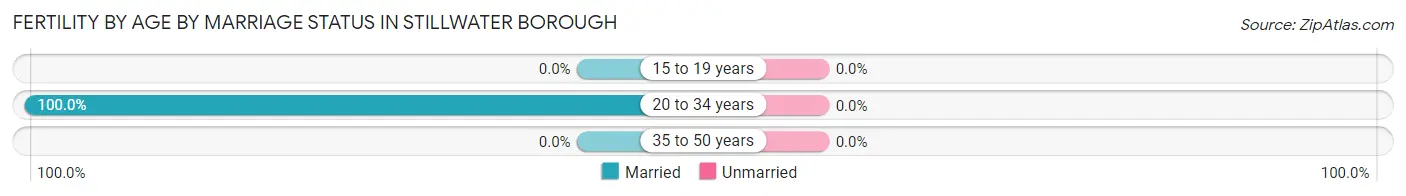
Fertility by Age by Marriage Status in Stillwater borough
| Age Bracket | Married | Unmarried |
| 15 to 19 years | 0 (0.0%) | 0 (0.0%) |
| 20 to 34 years | 6 (100.0%) | 0 (0.0%) |
| 35 to 50 years | 0 (0.0%) | 0 (0.0%) |
| Total | 6 (100.0%) | 0 (0.0%) |
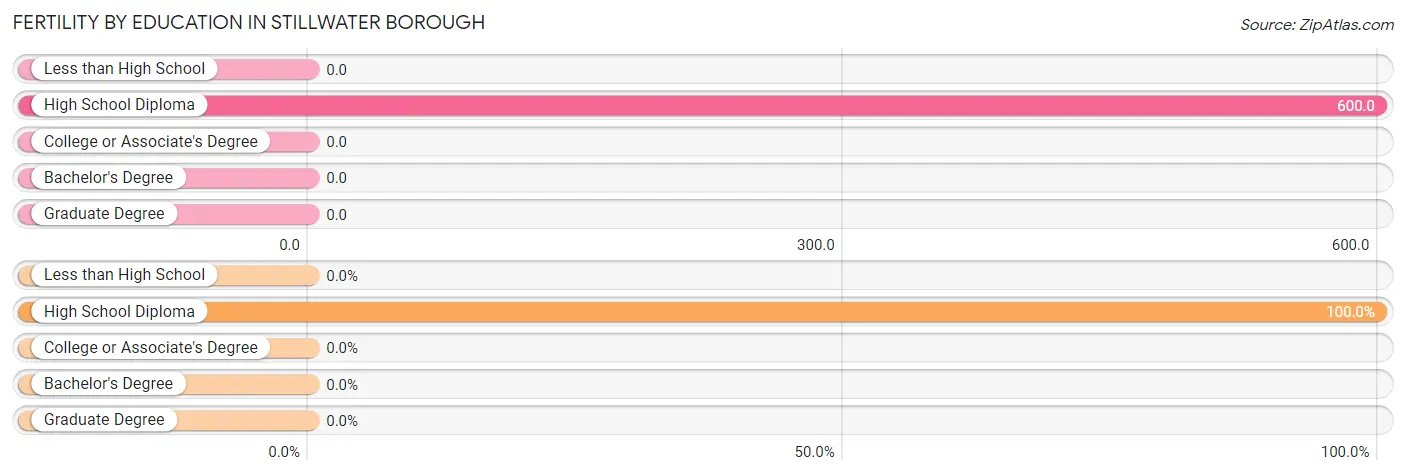
Fertility by Education in Stillwater borough
| Educational Attainment | Women with Births | Births / 1,000 Women |
| Less than High School | 0 (0.0%) | 0.0 |
| High School Diploma | 6 (100.0%) | 600.0 |
| College or Associate's Degree | 0 (0.0%) | 0.0 |
| Bachelor's Degree | 0 (0.0%) | 0.0 |
| Graduate Degree | 0 (0.0%) | 0.0 |
| Total | 6 (100.0%) | 98.0 |
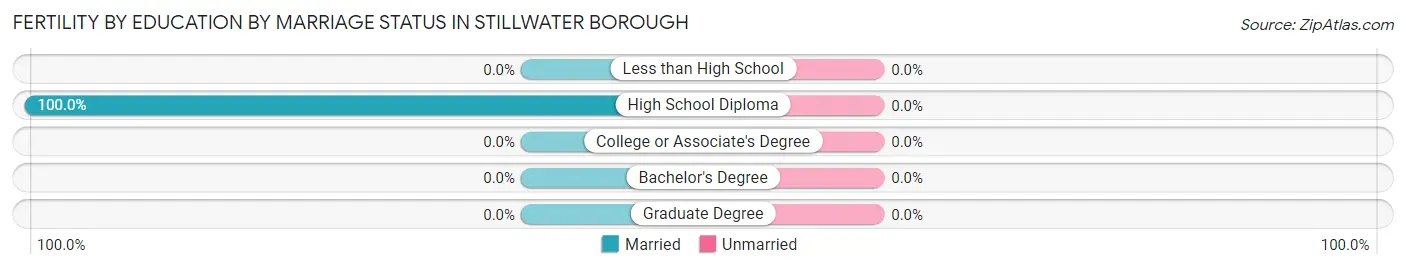
Fertility by Education by Marriage Status in Stillwater borough
| Educational Attainment | Married | Unmarried |
| Less than High School | 0 (0.0%) | 0 (0.0%) |
| High School Diploma | 6 (100.0%) | 0 (0.0%) |
| College or Associate's Degree | 0 (0.0%) | 0 (0.0%) |
| Bachelor's Degree | 0 (0.0%) | 0 (0.0%) |
| Graduate Degree | 0 (0.0%) | 0 (0.0%) |
| Total | 6 (100.0%) | 0 (0.0%) |
Employment Characteristics in Stillwater borough
Employment by Class of Employer in Stillwater borough
Among the 107 employed individuals in Stillwater borough, private company employees (65 | 60.8%), not-for-profit organizations (24 | 22.4%), and local government employees (7 | 6.5%) make up the most common classes of employment.
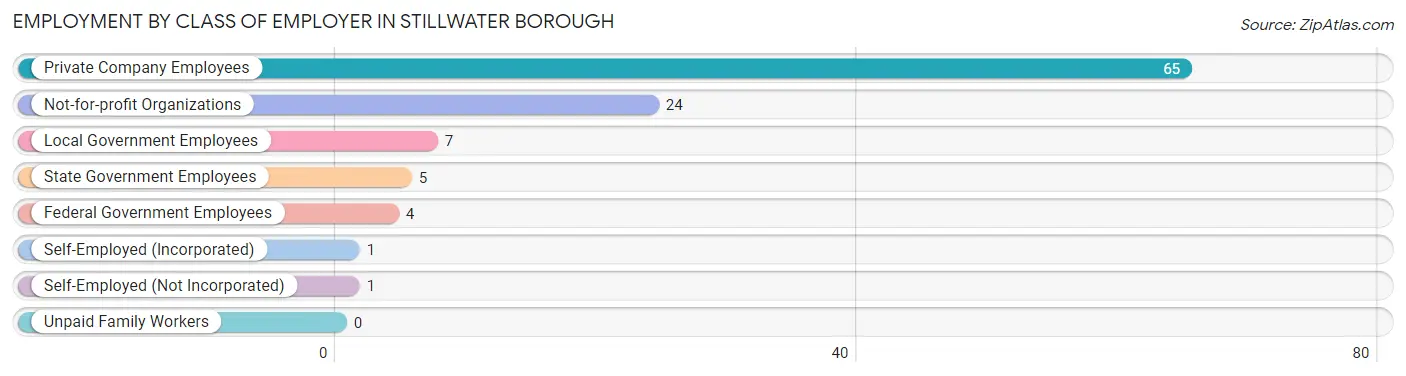
| Employer Class | # Employees | % Employees |
| Private Company Employees | 65 | 60.8% |
| Self-Employed (Incorporated) | 1 | 0.9% |
| Self-Employed (Not Incorporated) | 1 | 0.9% |
| Not-for-profit Organizations | 24 | 22.4% |
| Local Government Employees | 7 | 6.5% |
| State Government Employees | 5 | 4.7% |
| Federal Government Employees | 4 | 3.7% |
| Unpaid Family Workers | 0 | 0.0% |
| Total | 107 | 100.0% |
Employment Status by Age in Stillwater borough
According to the labor force statistics for Stillwater borough, out of the total population over 16 years of age (172), 62.8% or 108 individuals are in the labor force, with 0.9% or 1 of them unemployed. The age group with the highest labor force participation rate is 45 to 54 years, with 97.9% or 47 individuals in the labor force. Within the labor force, the 35 to 44 years age range has the highest percentage of unemployed individuals, with 8.3% or 1 of them being unemployed.
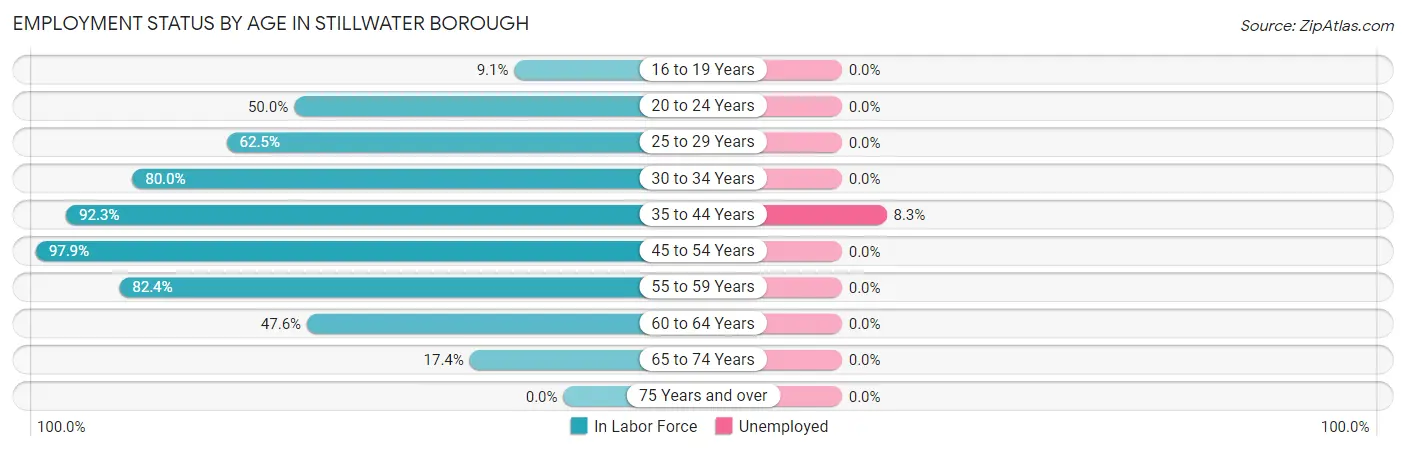
| Age Bracket | In Labor Force | Unemployed |
| 16 to 19 Years | 1 (9.1%) | 0 (0.0%) |
| 20 to 24 Years | 2 (50.0%) | 0 (0.0%) |
| 25 to 29 Years | 10 (62.5%) | 0 (0.0%) |
| 30 to 34 Years | 8 (80.0%) | 0 (0.0%) |
| 35 to 44 Years | 12 (92.3%) | 1 (8.3%) |
| 45 to 54 Years | 47 (97.9%) | 0 (0.0%) |
| 55 to 59 Years | 14 (82.4%) | 0 (0.0%) |
| 60 to 64 Years | 10 (47.6%) | 0 (0.0%) |
| 65 to 74 Years | 4 (17.4%) | 0 (0.0%) |
| 75 Years and over | 0 (0.0%) | 0 (0.0%) |
| Total | 108 (62.8%) | 1 (0.9%) |
Employment Status by Educational Attainment in Stillwater borough
According to labor force statistics for Stillwater borough, 80.8% of individuals (101) out of the total population between 25 and 64 years of age (125) are in the labor force, with 1.0% or 1 of them being unemployed. The group with the highest labor force participation rate are those with the educational attainment of bachelor's degree or higher, with 95.5% or 21 individuals in the labor force. Within the labor force, individuals with college / associate degree education have the highest percentage of unemployment, with 1.9% or 1 of them being unemployed.
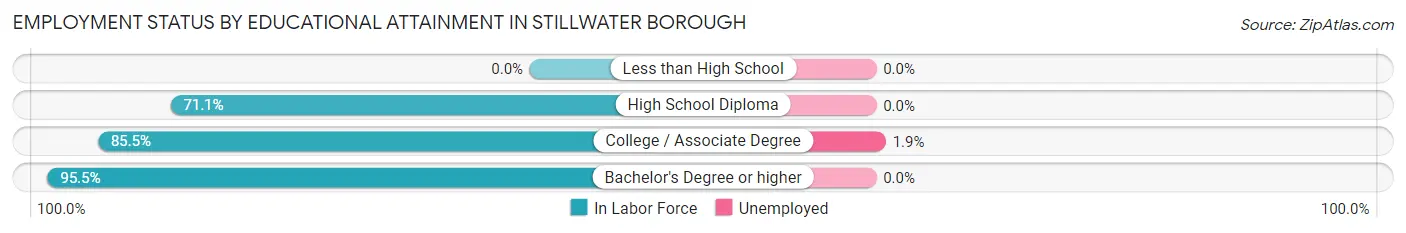
| Educational Attainment | In Labor Force | Unemployed |
| Less than High School | 0 (0.0%) | 0 (0.0%) |
| High School Diploma | 27 (71.1%) | 0 (0.0%) |
| College / Associate Degree | 53 (85.5%) | 1 (1.9%) |
| Bachelor's Degree or higher | 21 (95.5%) | 0 (0.0%) |
| Total | 101 (80.8%) | 1 (1.0%) |
Employment Occupations by Sex in Stillwater borough
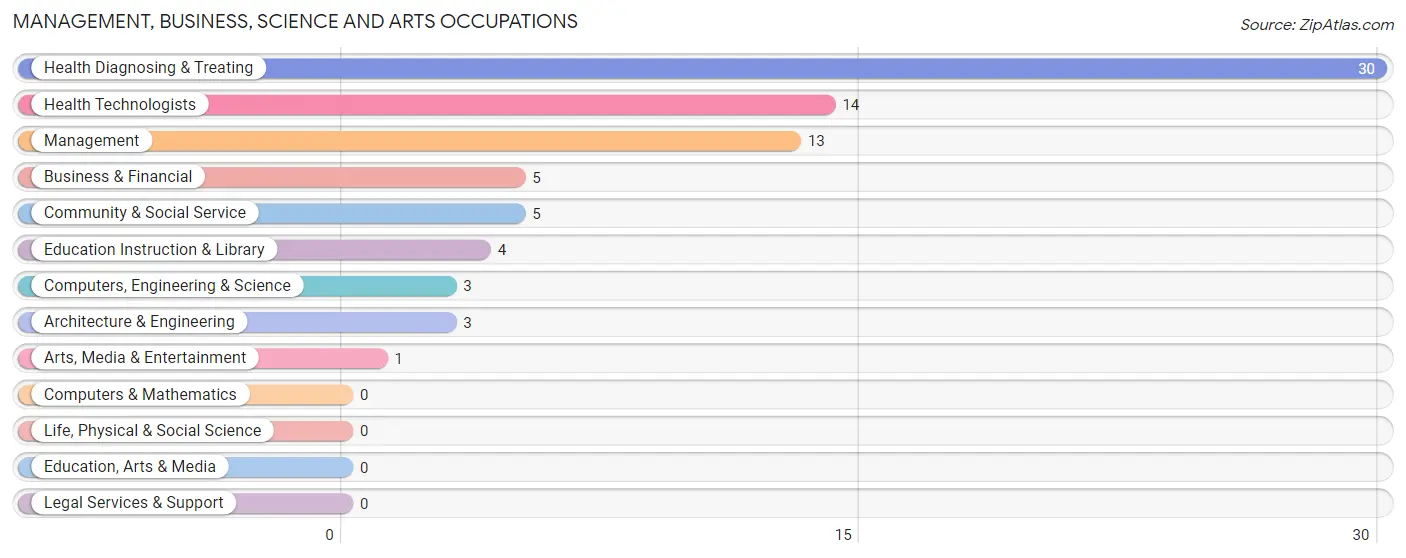
Management, Business, Science and Arts Occupations
The most common Management, Business, Science and Arts occupations in Stillwater borough are Health Diagnosing & Treating (30 | 28.0%), Health Technologists (14 | 13.1%), Management (13 | 12.1%), Business & Financial (5 | 4.7%), and Community & Social Service (5 | 4.7%).
Management, Business, Science and Arts Occupations by Sex
Within the Management, Business, Science and Arts occupations in Stillwater borough, the most male-oriented occupations are Arts, Media & Entertainment (100.0%), Management (69.2%), and Computers, Engineering & Science (33.3%), while the most female-oriented occupations are Education Instruction & Library (100.0%), Health Diagnosing & Treating (100.0%), and Health Technologists (100.0%).
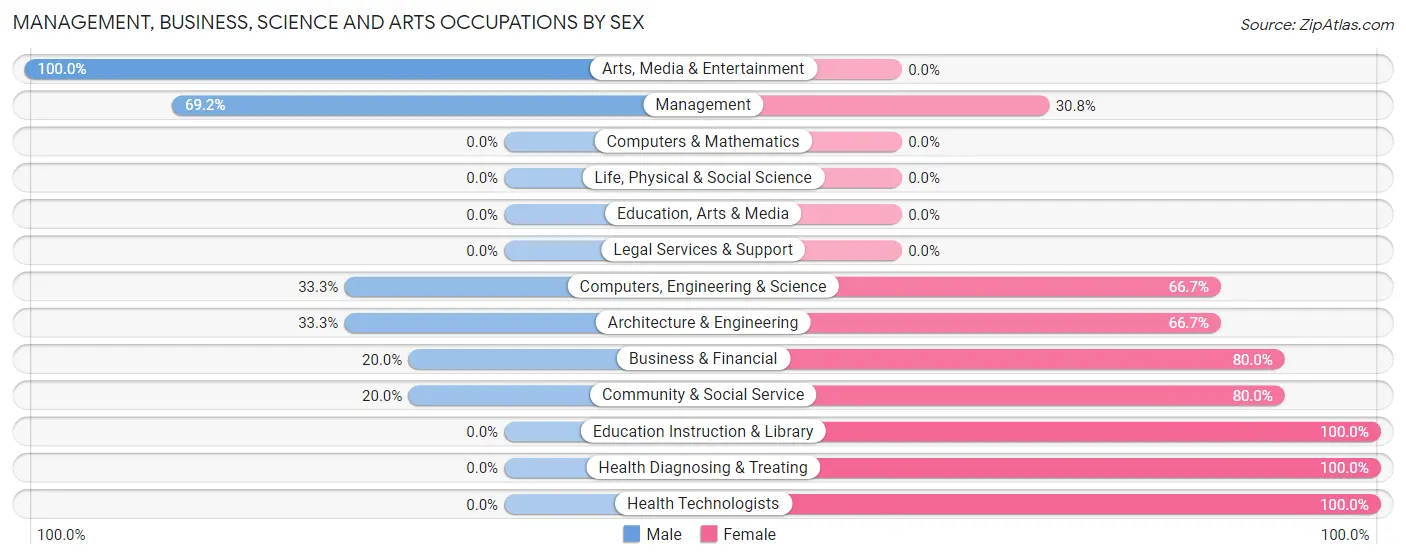
| Occupation | Male | Female |
| Management | 9 (69.2%) | 4 (30.8%) |
| Business & Financial | 1 (20.0%) | 4 (80.0%) |
| Computers, Engineering & Science | 1 (33.3%) | 2 (66.7%) |
| Computers & Mathematics | 0 (0.0%) | 0 (0.0%) |
| Architecture & Engineering | 1 (33.3%) | 2 (66.7%) |
| Life, Physical & Social Science | 0 (0.0%) | 0 (0.0%) |
| Community & Social Service | 1 (20.0%) | 4 (80.0%) |
| Education, Arts & Media | 0 (0.0%) | 0 (0.0%) |
| Legal Services & Support | 0 (0.0%) | 0 (0.0%) |
| Education Instruction & Library | 0 (0.0%) | 4 (100.0%) |
| Arts, Media & Entertainment | 1 (100.0%) | 0 (0.0%) |
| Health Diagnosing & Treating | 0 (0.0%) | 30 (100.0%) |
| Health Technologists | 0 (0.0%) | 14 (100.0%) |
| Total (Category) | 12 (21.4%) | 44 (78.6%) |
| Total (Overall) | 41 (38.3%) | 66 (61.7%) |
Services Occupations
The most common Services occupations in Stillwater borough are Healthcare Support (8 | 7.5%), and Personal Care & Service (1 | 0.9%).
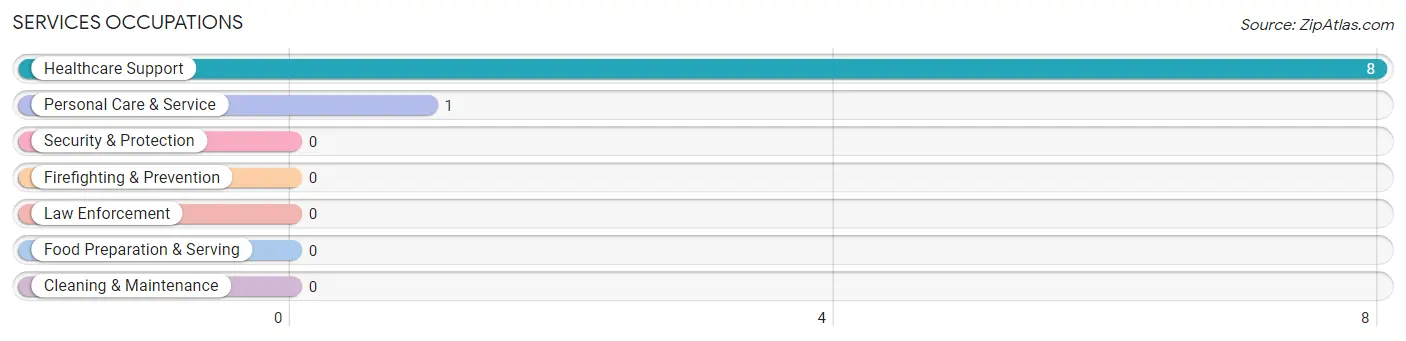
Services Occupations by Sex
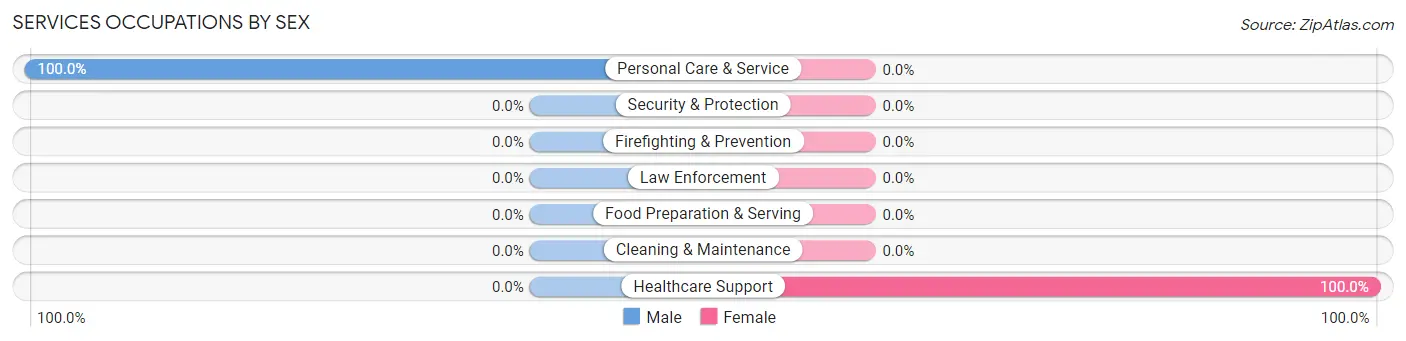
| Occupation | Male | Female |
| Healthcare Support | 0 (0.0%) | 8 (100.0%) |
| Security & Protection | 0 (0.0%) | 0 (0.0%) |
| Firefighting & Prevention | 0 (0.0%) | 0 (0.0%) |
| Law Enforcement | 0 (0.0%) | 0 (0.0%) |
| Food Preparation & Serving | 0 (0.0%) | 0 (0.0%) |
| Cleaning & Maintenance | 0 (0.0%) | 0 (0.0%) |
| Personal Care & Service | 1 (100.0%) | 0 (0.0%) |
| Total (Category) | 1 (11.1%) | 8 (88.9%) |
| Total (Overall) | 41 (38.3%) | 66 (61.7%) |
Sales and Office Occupations
The most common Sales and Office occupations in Stillwater borough are Sales & Related (7 | 6.5%), and Office & Administration (5 | 4.7%).
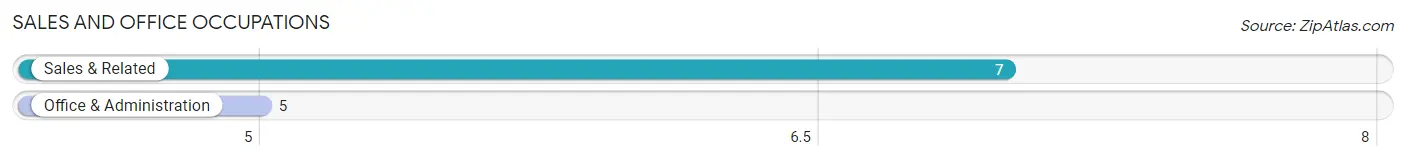
Sales and Office Occupations by Sex
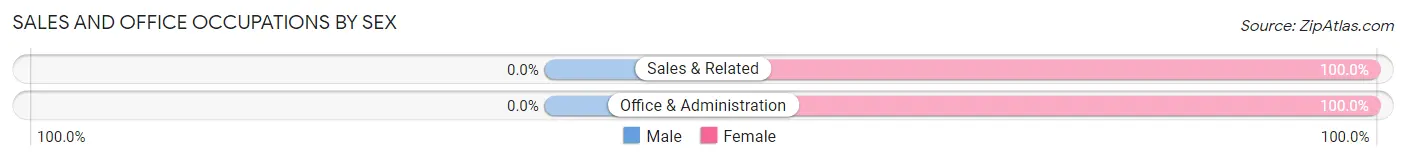
| Occupation | Male | Female |
| Sales & Related | 0 (0.0%) | 7 (100.0%) |
| Office & Administration | 0 (0.0%) | 5 (100.0%) |
| Total (Category) | 0 (0.0%) | 12 (100.0%) |
| Total (Overall) | 41 (38.3%) | 66 (61.7%) |
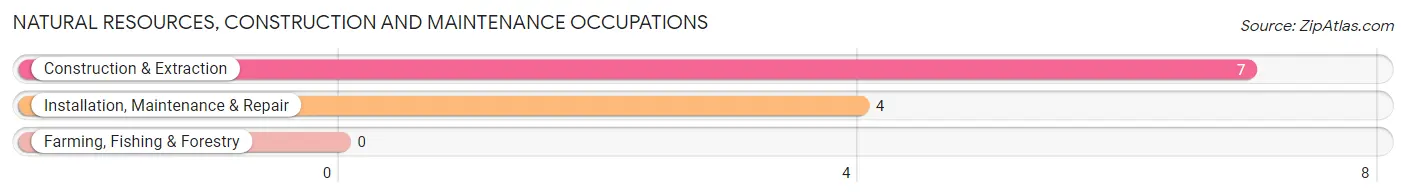
Natural Resources, Construction and Maintenance Occupations
The most common Natural Resources, Construction and Maintenance occupations in Stillwater borough are Construction & Extraction (7 | 6.5%), and Installation, Maintenance & Repair (4 | 3.7%).
Natural Resources, Construction and Maintenance Occupations by Sex
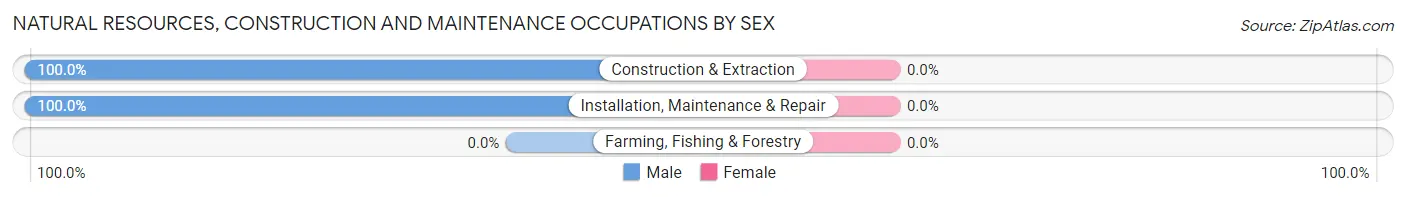
| Occupation | Male | Female |
| Farming, Fishing & Forestry | 0 (0.0%) | 0 (0.0%) |
| Construction & Extraction | 7 (100.0%) | 0 (0.0%) |
| Installation, Maintenance & Repair | 4 (100.0%) | 0 (0.0%) |
| Total (Category) | 11 (100.0%) | 0 (0.0%) |
| Total (Overall) | 41 (38.3%) | 66 (61.7%) |
Production, Transportation and Moving Occupations
The most common Production, Transportation and Moving occupations in Stillwater borough are Production (13 | 12.1%), Transportation (5 | 4.7%), and Material Moving (1 | 0.9%).
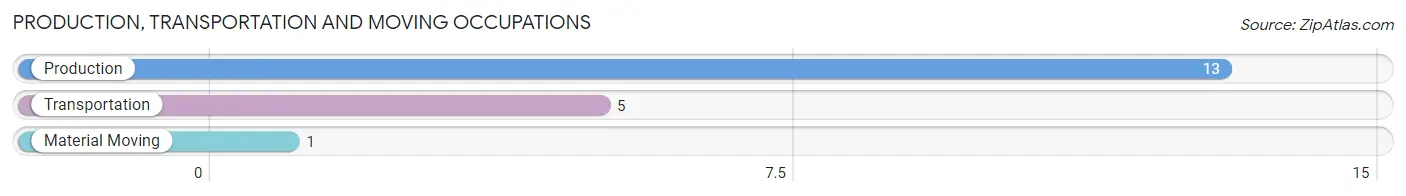
Production, Transportation and Moving Occupations by Sex
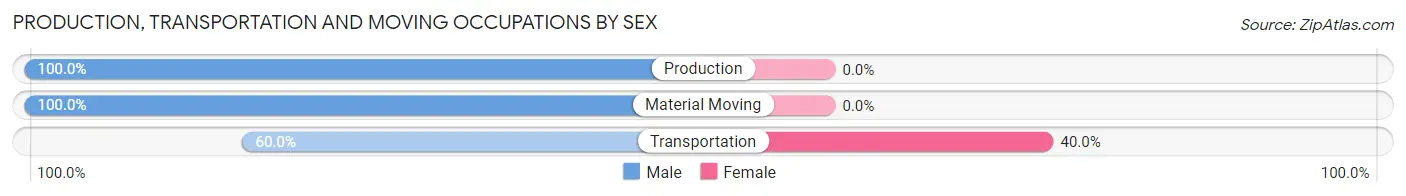
| Occupation | Male | Female |
| Production | 13 (100.0%) | 0 (0.0%) |
| Transportation | 3 (60.0%) | 2 (40.0%) |
| Material Moving | 1 (100.0%) | 0 (0.0%) |
| Total (Category) | 17 (89.5%) | 2 (10.5%) |
| Total (Overall) | 41 (38.3%) | 66 (61.7%) |
Employment Industries by Sex in Stillwater borough
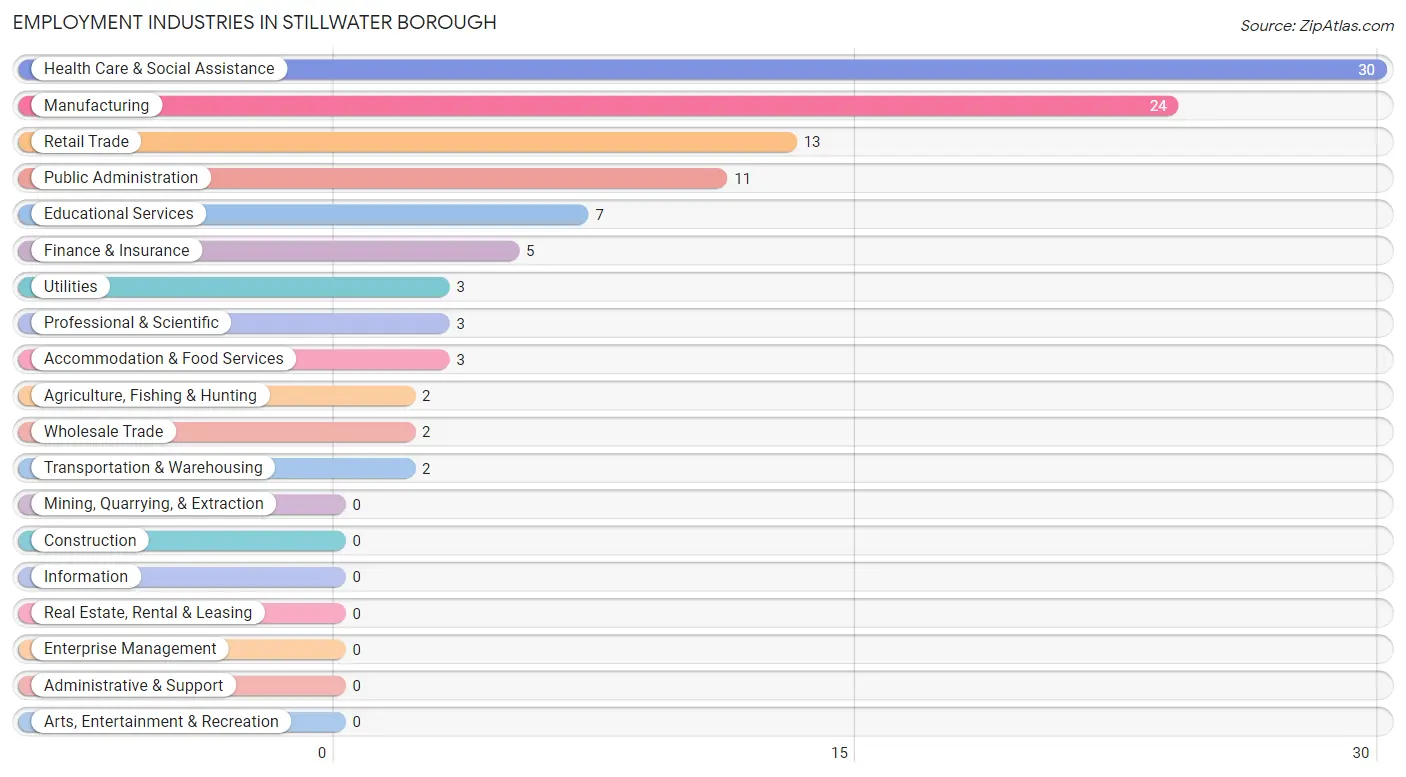
Employment Industries in Stillwater borough
The major employment industries in Stillwater borough include Health Care & Social Assistance (30 | 28.0%), Manufacturing (24 | 22.4%), Retail Trade (13 | 12.1%), Public Administration (11 | 10.3%), and Educational Services (7 | 6.5%).
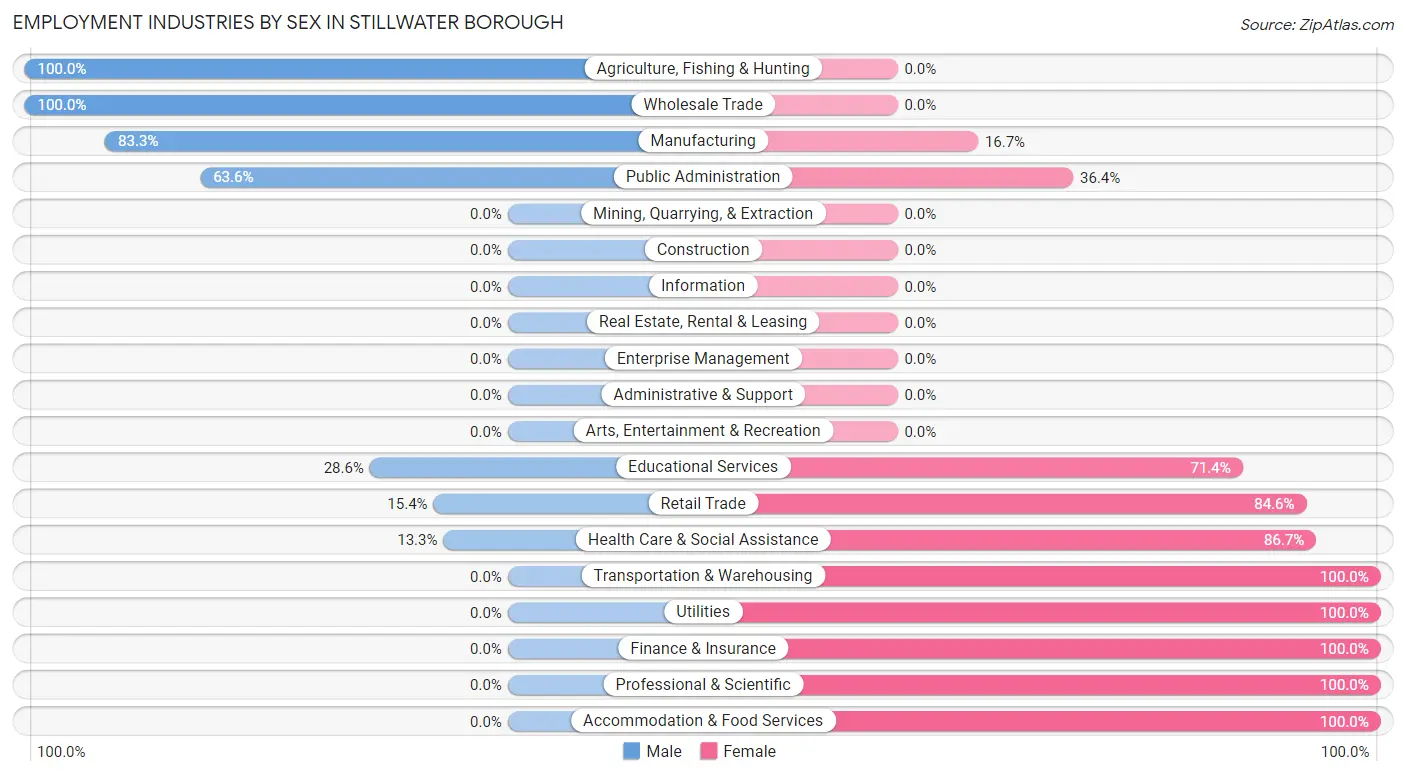
Employment Industries by Sex in Stillwater borough
The Stillwater borough industries that see more men than women are Agriculture, Fishing & Hunting (100.0%), Wholesale Trade (100.0%), and Manufacturing (83.3%), whereas the industries that tend to have a higher number of women are Transportation & Warehousing (100.0%), Utilities (100.0%), and Finance & Insurance (100.0%).
| Industry | Male | Female |
| Agriculture, Fishing & Hunting | 2 (100.0%) | 0 (0.0%) |
| Mining, Quarrying, & Extraction | 0 (0.0%) | 0 (0.0%) |
| Construction | 0 (0.0%) | 0 (0.0%) |
| Manufacturing | 20 (83.3%) | 4 (16.7%) |
| Wholesale Trade | 2 (100.0%) | 0 (0.0%) |
| Retail Trade | 2 (15.4%) | 11 (84.6%) |
| Transportation & Warehousing | 0 (0.0%) | 2 (100.0%) |
| Utilities | 0 (0.0%) | 3 (100.0%) |
| Information | 0 (0.0%) | 0 (0.0%) |
| Finance & Insurance | 0 (0.0%) | 5 (100.0%) |
| Real Estate, Rental & Leasing | 0 (0.0%) | 0 (0.0%) |
| Professional & Scientific | 0 (0.0%) | 3 (100.0%) |
| Enterprise Management | 0 (0.0%) | 0 (0.0%) |
| Administrative & Support | 0 (0.0%) | 0 (0.0%) |
| Educational Services | 2 (28.6%) | 5 (71.4%) |
| Health Care & Social Assistance | 4 (13.3%) | 26 (86.7%) |
| Arts, Entertainment & Recreation | 0 (0.0%) | 0 (0.0%) |
| Accommodation & Food Services | 0 (0.0%) | 3 (100.0%) |
| Public Administration | 7 (63.6%) | 4 (36.4%) |
| Total | 41 (38.3%) | 66 (61.7%) |
Education in Stillwater borough
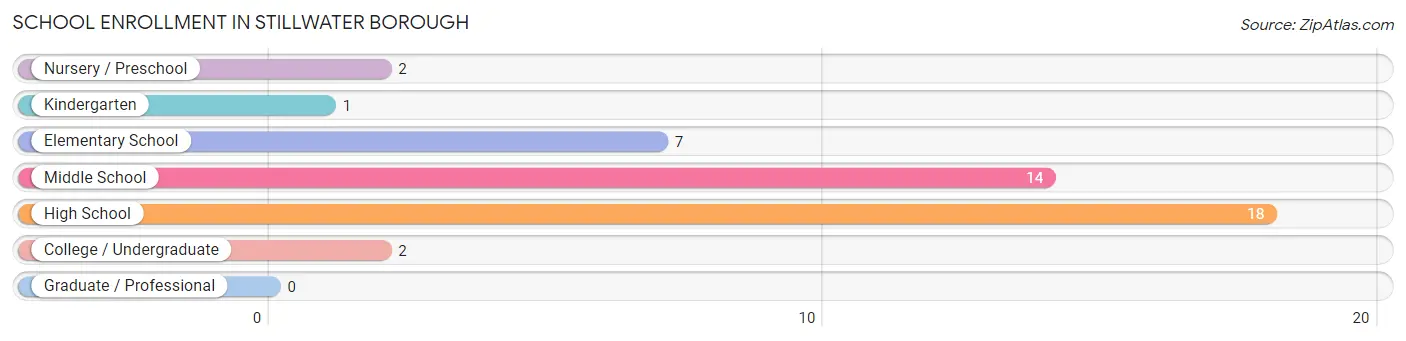
School Enrollment in Stillwater borough
The most common levels of schooling among the 44 students in Stillwater borough are high school (18 | 40.9%), middle school (14 | 31.8%), and elementary school (7 | 15.9%).
| School Level | # Students | % Students |
| Nursery / Preschool | 2 | 4.5% |
| Kindergarten | 1 | 2.3% |
| Elementary School | 7 | 15.9% |
| Middle School | 14 | 31.8% |
| High School | 18 | 40.9% |
| College / Undergraduate | 2 | 4.5% |
| Graduate / Professional | 0 | 0.0% |
| Total | 44 | 100.0% |
School Enrollment by Age by Funding Source in Stillwater borough
Out of a total of 44 students who are enrolled in schools in Stillwater borough, 1 (2.3%) attend a private institution, while the remaining 43 (97.7%) are enrolled in public schools. The age group of 15 to 17 year olds has the highest likelihood of being enrolled in private schools, with 1 (5.6% in the age bracket) enrolled. Conversely, the age group of 3 to 4 year olds has the lowest likelihood of being enrolled in a private school, with 2 (100.0% in the age bracket) attending a public institution.
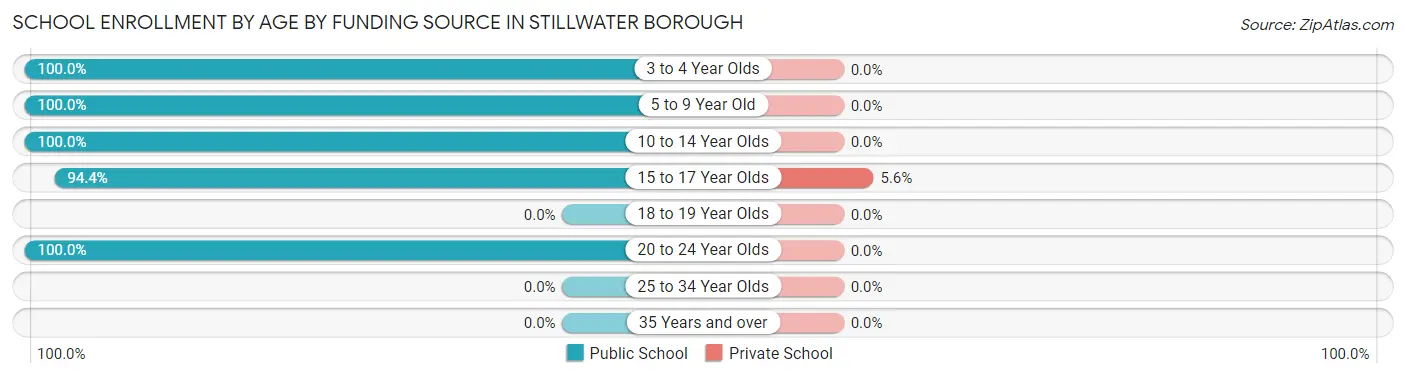
| Age Bracket | Public School | Private School |
| 3 to 4 Year Olds | 2 (100.0%) | 0 (0.0%) |
| 5 to 9 Year Old | 6 (100.0%) | 0 (0.0%) |
| 10 to 14 Year Olds | 16 (100.0%) | 0 (0.0%) |
| 15 to 17 Year Olds | 17 (94.4%) | 1 (5.6%) |
| 18 to 19 Year Olds | 0 (0.0%) | 0 (0.0%) |
| 20 to 24 Year Olds | 2 (100.0%) | 0 (0.0%) |
| 25 to 34 Year Olds | 0 (0.0%) | 0 (0.0%) |
| 35 Years and over | 0 (0.0%) | 0 (0.0%) |
| Total | 43 (97.7%) | 1 (2.3%) |
Educational Attainment by Field of Study in Stillwater borough
Science & technology (11 | 37.9%), education (7 | 24.1%), business (4 | 13.8%), bio, nature & agricultural (2 | 6.9%), and psychology (2 | 6.9%) are the most common fields of study among 29 individuals in Stillwater borough who have obtained a bachelor's degree or higher.
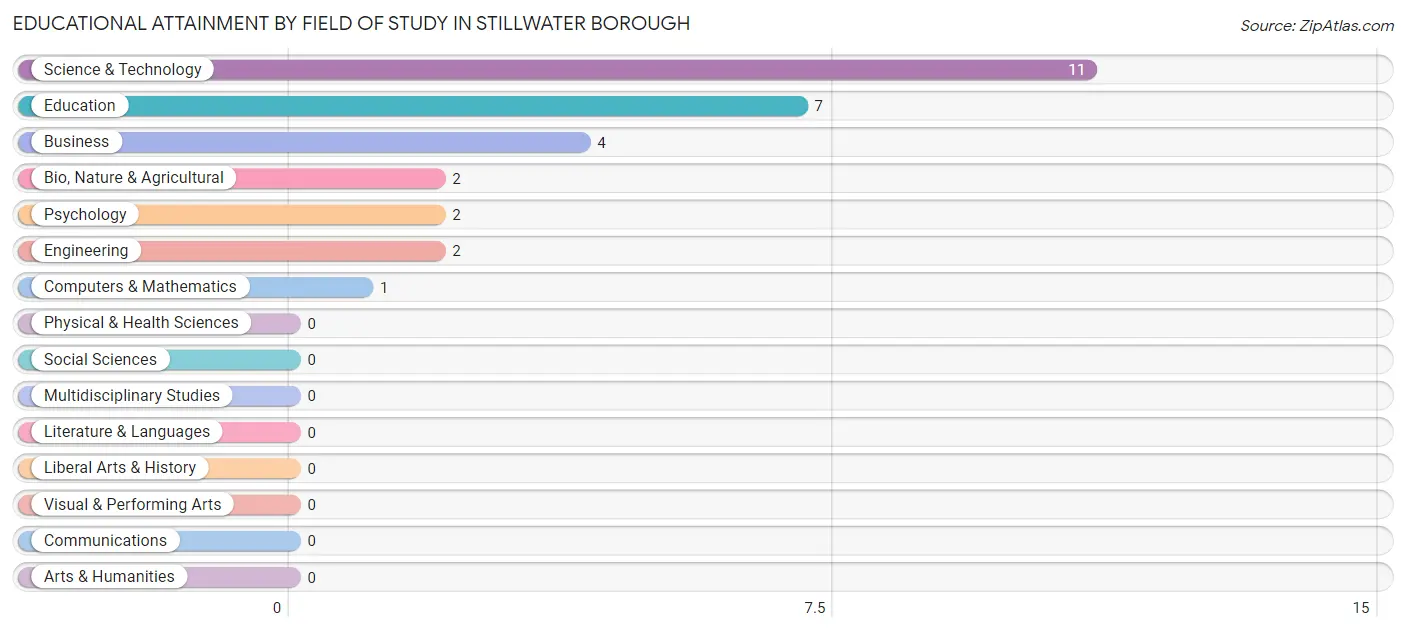
| Field of Study | # Graduates | % Graduates |
| Computers & Mathematics | 1 | 3.5% |
| Bio, Nature & Agricultural | 2 | 6.9% |
| Physical & Health Sciences | 0 | 0.0% |
| Psychology | 2 | 6.9% |
| Social Sciences | 0 | 0.0% |
| Engineering | 2 | 6.9% |
| Multidisciplinary Studies | 0 | 0.0% |
| Science & Technology | 11 | 37.9% |
| Business | 4 | 13.8% |
| Education | 7 | 24.1% |
| Literature & Languages | 0 | 0.0% |
| Liberal Arts & History | 0 | 0.0% |
| Visual & Performing Arts | 0 | 0.0% |
| Communications | 0 | 0.0% |
| Arts & Humanities | 0 | 0.0% |
| Total | 29 | 100.0% |
Transportation & Commute in Stillwater borough
Vehicle Availability by Sex in Stillwater borough
The most prevalent vehicle ownership categories in Stillwater borough are males with 3 vehicles (19, accounting for 46.3%) and females with 3 vehicles (17, making up 28.8%).
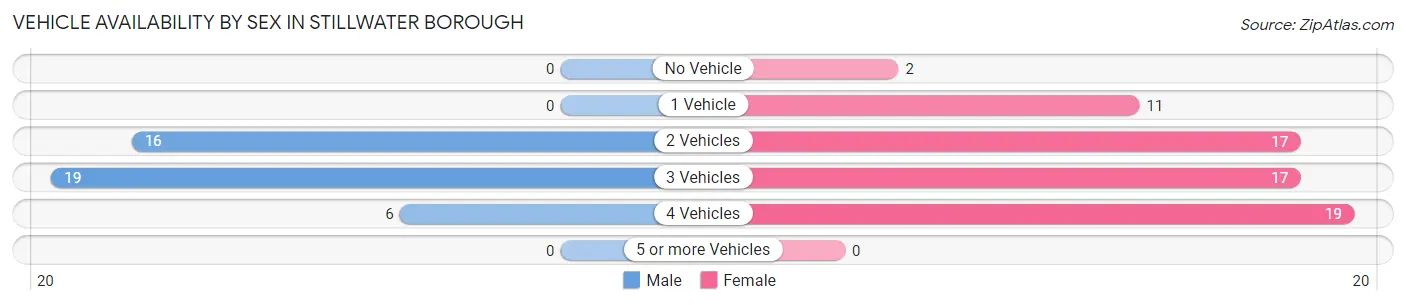
| Vehicles Available | Male | Female |
| No Vehicle | 0 (0.0%) | 2 (3.0%) |
| 1 Vehicle | 0 (0.0%) | 11 (16.7%) |
| 2 Vehicles | 16 (39.0%) | 17 (25.8%) |
| 3 Vehicles | 19 (46.3%) | 17 (25.8%) |
| 4 Vehicles | 6 (14.6%) | 19 (28.8%) |
| 5 or more Vehicles | 0 (0.0%) | 0 (0.0%) |
| Total | 41 (100.0%) | 66 (100.0%) |
Commute Time in Stillwater borough
The most frequently occuring commute durations in Stillwater borough are 15 to 19 minutes (15 commuters, 15.8%), 10 to 14 minutes (13 commuters, 13.7%), and 25 to 29 minutes (12 commuters, 12.6%).
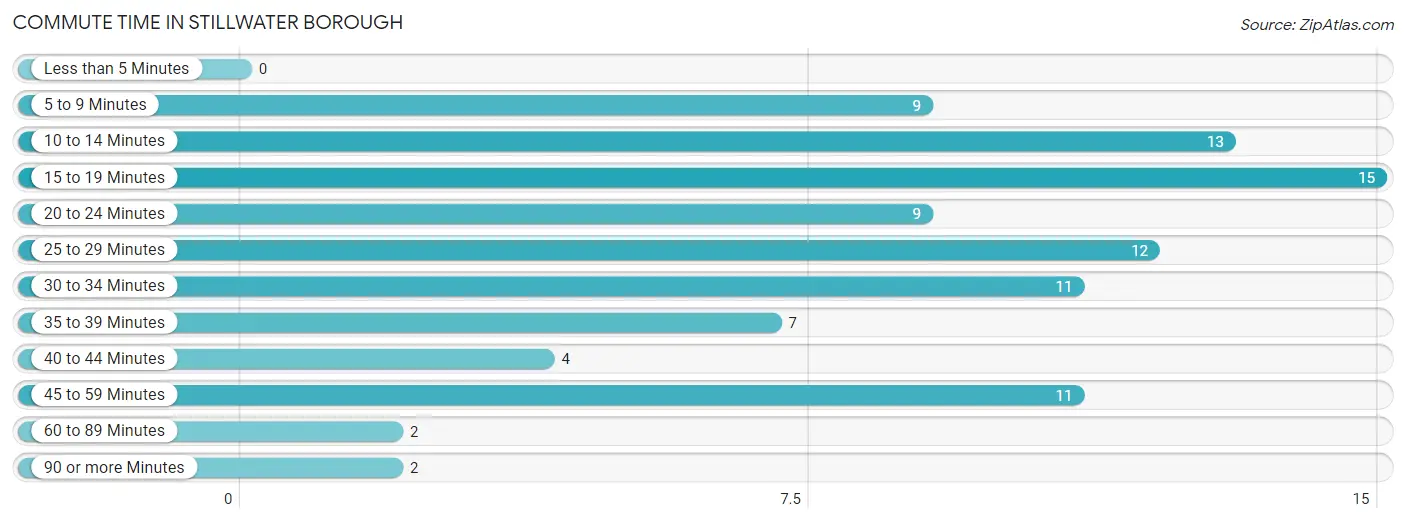
| Commute Time | # Commuters | % Commuters |
| Less than 5 Minutes | 0 | 0.0% |
| 5 to 9 Minutes | 9 | 9.5% |
| 10 to 14 Minutes | 13 | 13.7% |
| 15 to 19 Minutes | 15 | 15.8% |
| 20 to 24 Minutes | 9 | 9.5% |
| 25 to 29 Minutes | 12 | 12.6% |
| 30 to 34 Minutes | 11 | 11.6% |
| 35 to 39 Minutes | 7 | 7.4% |
| 40 to 44 Minutes | 4 | 4.2% |
| 45 to 59 Minutes | 11 | 11.6% |
| 60 to 89 Minutes | 2 | 2.1% |
| 90 or more Minutes | 2 | 2.1% |
Commute Time by Sex in Stillwater borough
The most common commute times in Stillwater borough are 25 to 29 minutes (12 commuters, 33.3%) for males and 45 to 59 minutes (10 commuters, 17.0%) for females.
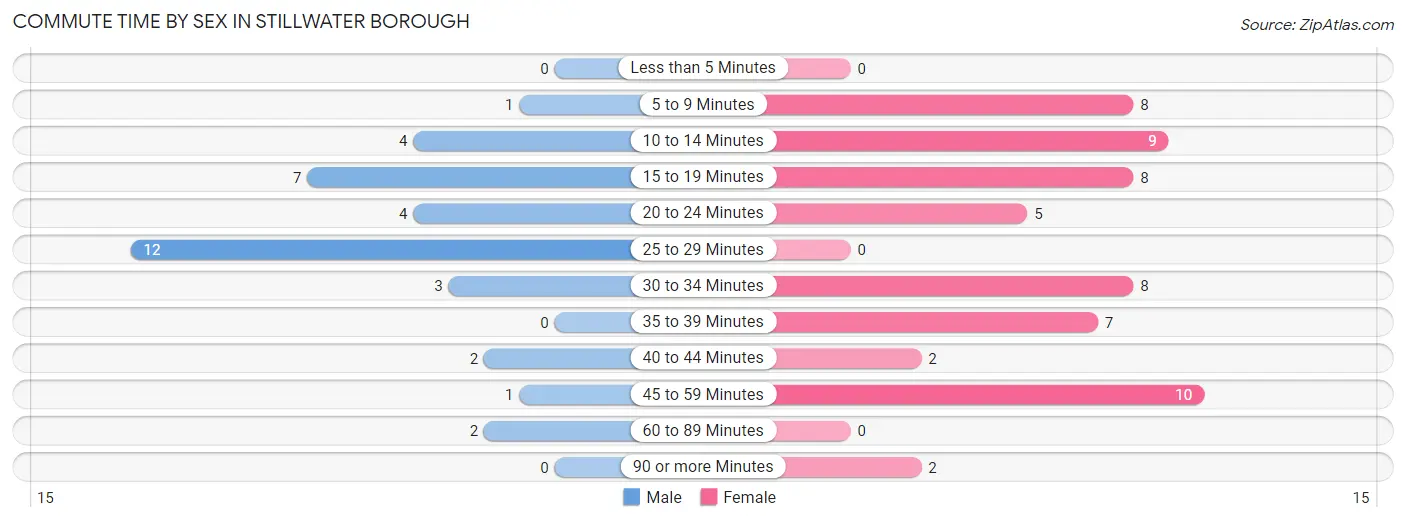
| Commute Time | Male | Female |
| Less than 5 Minutes | 0 (0.0%) | 0 (0.0%) |
| 5 to 9 Minutes | 1 (2.8%) | 8 (13.6%) |
| 10 to 14 Minutes | 4 (11.1%) | 9 (15.2%) |
| 15 to 19 Minutes | 7 (19.4%) | 8 (13.6%) |
| 20 to 24 Minutes | 4 (11.1%) | 5 (8.5%) |
| 25 to 29 Minutes | 12 (33.3%) | 0 (0.0%) |
| 30 to 34 Minutes | 3 (8.3%) | 8 (13.6%) |
| 35 to 39 Minutes | 0 (0.0%) | 7 (11.9%) |
| 40 to 44 Minutes | 2 (5.6%) | 2 (3.4%) |
| 45 to 59 Minutes | 1 (2.8%) | 10 (17.0%) |
| 60 to 89 Minutes | 2 (5.6%) | 0 (0.0%) |
| 90 or more Minutes | 0 (0.0%) | 2 (3.4%) |
Time of Departure to Work by Sex in Stillwater borough
The most frequent times of departure to work in Stillwater borough are 7:00 AM to 7:29 AM (9, 25.0%) for males and 6:00 AM to 6:29 AM (16, 27.1%) for females.
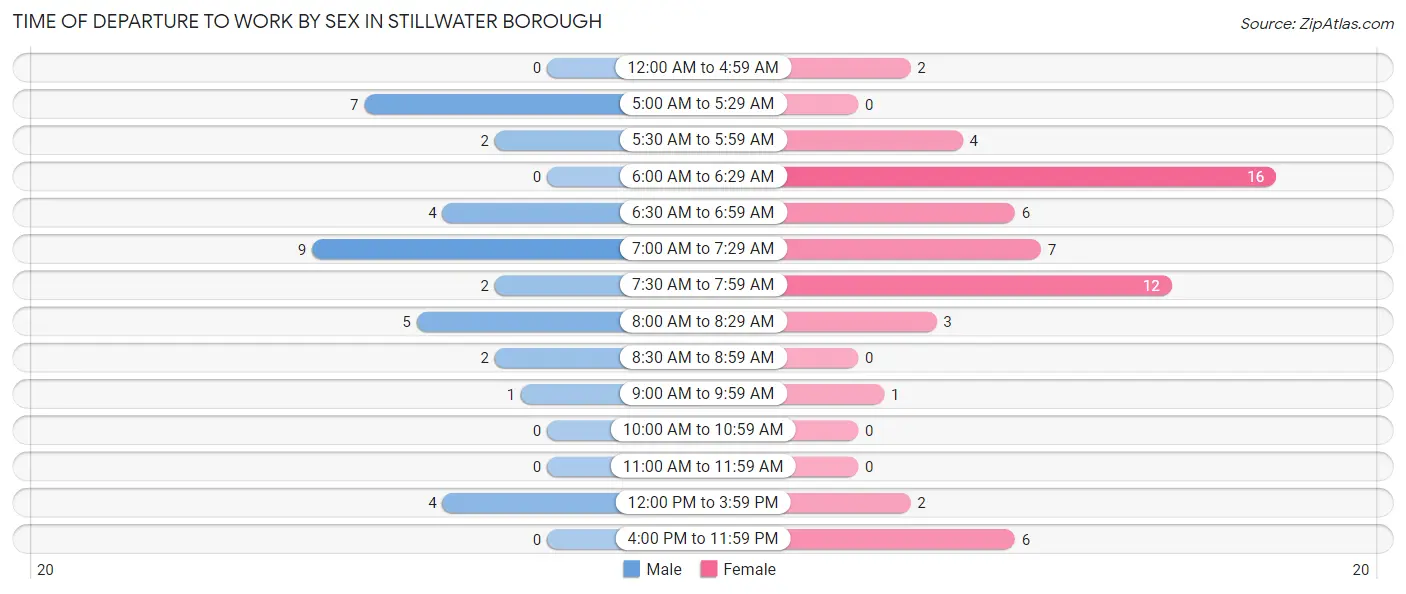
| Time of Departure | Male | Female |
| 12:00 AM to 4:59 AM | 0 (0.0%) | 2 (3.4%) |
| 5:00 AM to 5:29 AM | 7 (19.4%) | 0 (0.0%) |
| 5:30 AM to 5:59 AM | 2 (5.6%) | 4 (6.8%) |
| 6:00 AM to 6:29 AM | 0 (0.0%) | 16 (27.1%) |
| 6:30 AM to 6:59 AM | 4 (11.1%) | 6 (10.2%) |
| 7:00 AM to 7:29 AM | 9 (25.0%) | 7 (11.9%) |
| 7:30 AM to 7:59 AM | 2 (5.6%) | 12 (20.3%) |
| 8:00 AM to 8:29 AM | 5 (13.9%) | 3 (5.1%) |
| 8:30 AM to 8:59 AM | 2 (5.6%) | 0 (0.0%) |
| 9:00 AM to 9:59 AM | 1 (2.8%) | 1 (1.7%) |
| 10:00 AM to 10:59 AM | 0 (0.0%) | 0 (0.0%) |
| 11:00 AM to 11:59 AM | 0 (0.0%) | 0 (0.0%) |
| 12:00 PM to 3:59 PM | 4 (11.1%) | 2 (3.4%) |
| 4:00 PM to 11:59 PM | 0 (0.0%) | 6 (10.2%) |
| Total | 36 (100.0%) | 59 (100.0%) |
Housing Occupancy in Stillwater borough
Occupancy by Ownership in Stillwater borough
Of the total 88 dwellings in Stillwater borough, owner-occupied units account for 78 (88.6%), while renter-occupied units make up 10 (11.4%).
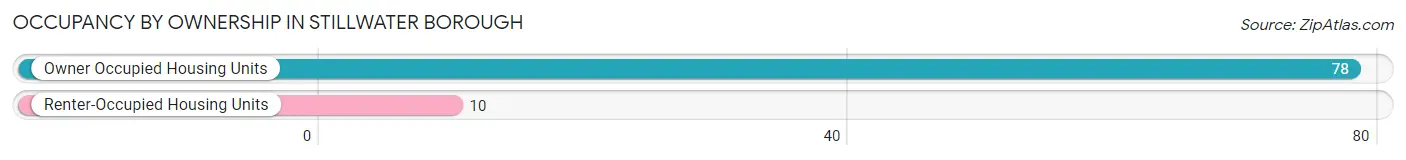
| Occupancy | # Housing Units | % Housing Units |
| Owner Occupied Housing Units | 78 | 88.6% |
| Renter-Occupied Housing Units | 10 | 11.4% |
| Total Occupied Housing Units | 88 | 100.0% |
Occupancy by Household Size in Stillwater borough
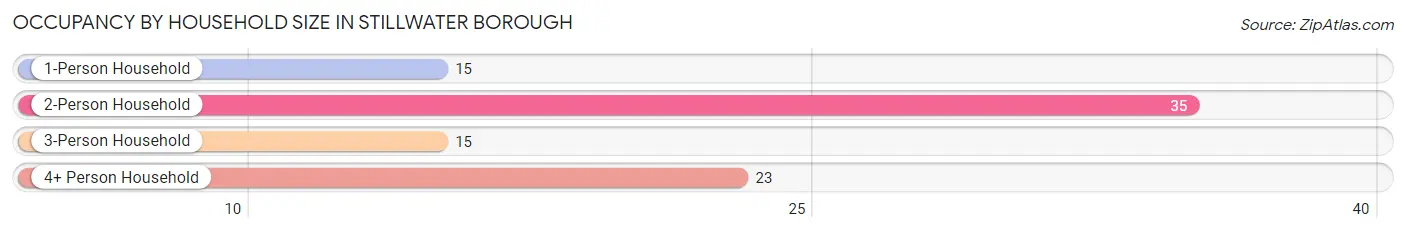
| Household Size | # Housing Units | % Housing Units |
| 1-Person Household | 15 | 17.1% |
| 2-Person Household | 35 | 39.8% |
| 3-Person Household | 15 | 17.1% |
| 4+ Person Household | 23 | 26.1% |
| Total Housing Units | 88 | 100.0% |
Occupancy by Ownership by Household Size in Stillwater borough
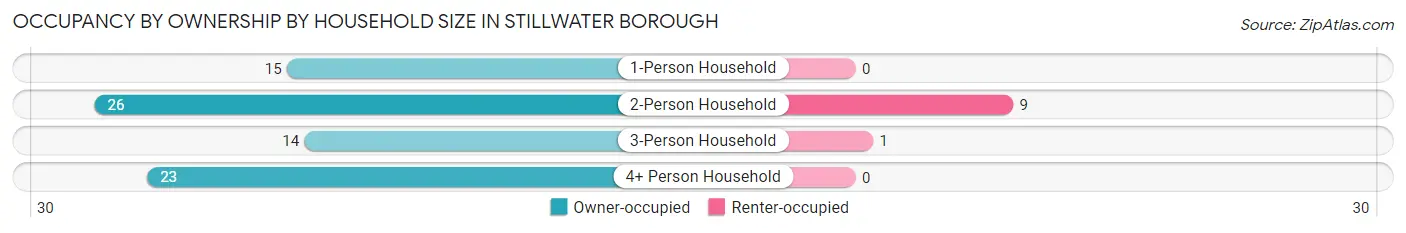
| Household Size | Owner-occupied | Renter-occupied |
| 1-Person Household | 15 (100.0%) | 0 (0.0%) |
| 2-Person Household | 26 (74.3%) | 9 (25.7%) |
| 3-Person Household | 14 (93.3%) | 1 (6.7%) |
| 4+ Person Household | 23 (100.0%) | 0 (0.0%) |
| Total Housing Units | 78 (88.6%) | 10 (11.4%) |
Occupancy by Educational Attainment in Stillwater borough
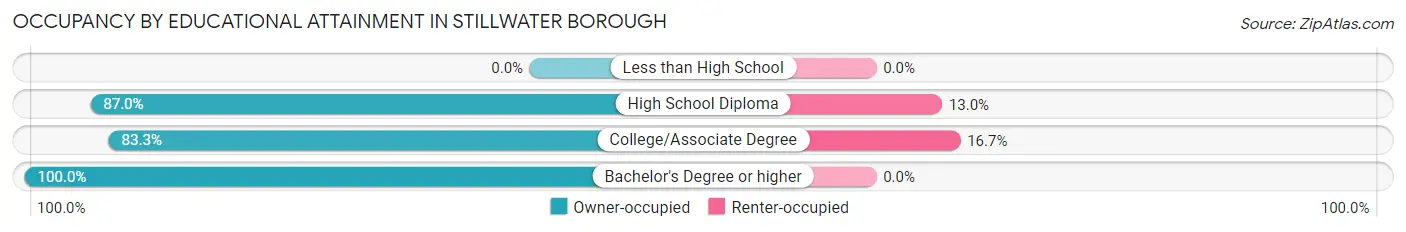
| Household Size | Owner-occupied | Renter-occupied |
| Less than High School | 0 (0.0%) | 0 (0.0%) |
| High School Diploma | 20 (87.0%) | 3 (13.0%) |
| College/Associate Degree | 35 (83.3%) | 7 (16.7%) |
| Bachelor's Degree or higher | 23 (100.0%) | 0 (0.0%) |
Occupancy by Age of Householder in Stillwater borough
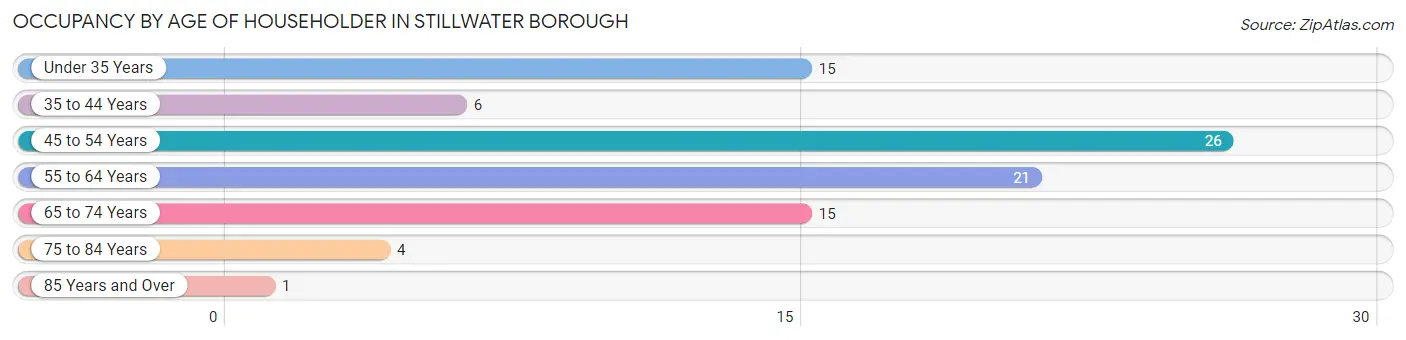
| Age Bracket | # Households | % Households |
| Under 35 Years | 15 | 17.1% |
| 35 to 44 Years | 6 | 6.8% |
| 45 to 54 Years | 26 | 29.5% |
| 55 to 64 Years | 21 | 23.9% |
| 65 to 74 Years | 15 | 17.1% |
| 75 to 84 Years | 4 | 4.5% |
| 85 Years and Over | 1 | 1.1% |
| Total | 88 | 100.0% |
Housing Finances in Stillwater borough
Median Income by Occupancy in Stillwater borough
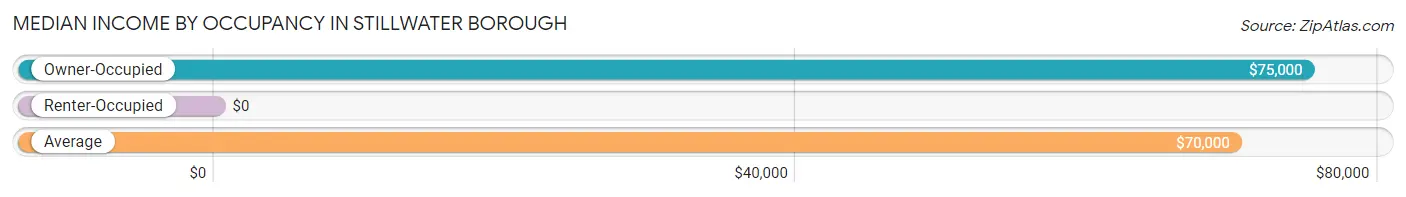
| Occupancy Type | # Households | Median Income |
| Owner-Occupied | 78 (88.6%) | $75,000 |
| Renter-Occupied | 10 (11.4%) | $0 |
| Average | 88 (100.0%) | $70,000 |
Occupancy by Householder Income Bracket in Stillwater borough
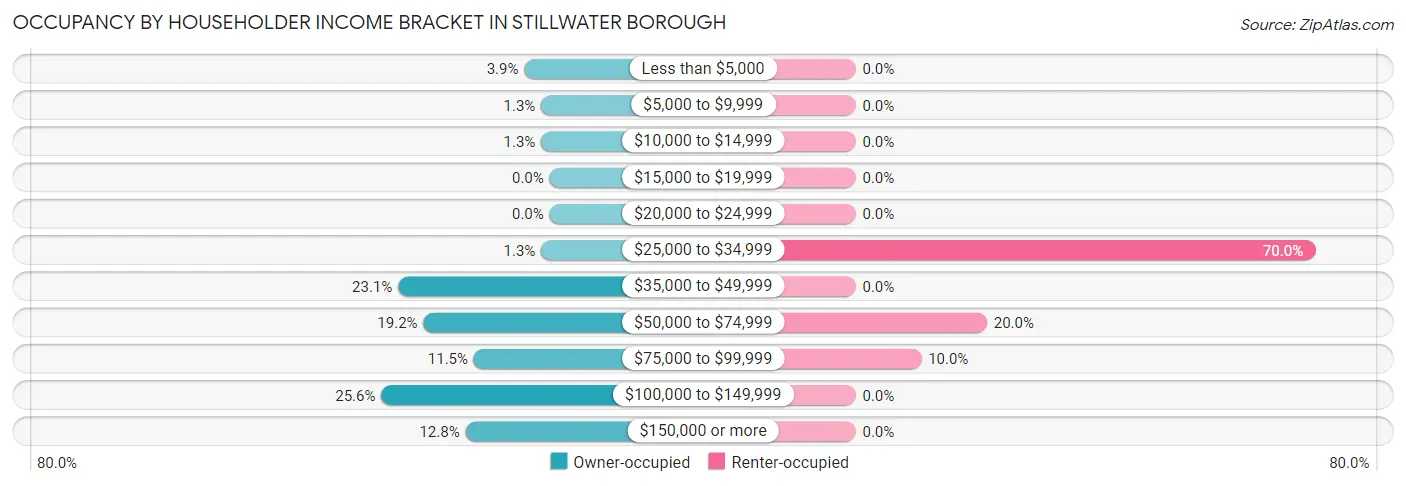
| Income Bracket | Owner-occupied | Renter-occupied |
| Less than $5,000 | 3 (3.8%) | 0 (0.0%) |
| $5,000 to $9,999 | 1 (1.3%) | 0 (0.0%) |
| $10,000 to $14,999 | 1 (1.3%) | 0 (0.0%) |
| $15,000 to $19,999 | 0 (0.0%) | 0 (0.0%) |
| $20,000 to $24,999 | 0 (0.0%) | 0 (0.0%) |
| $25,000 to $34,999 | 1 (1.3%) | 7 (70.0%) |
| $35,000 to $49,999 | 18 (23.1%) | 0 (0.0%) |
| $50,000 to $74,999 | 15 (19.2%) | 2 (20.0%) |
| $75,000 to $99,999 | 9 (11.5%) | 1 (10.0%) |
| $100,000 to $149,999 | 20 (25.6%) | 0 (0.0%) |
| $150,000 or more | 10 (12.8%) | 0 (0.0%) |
| Total | 78 (100.0%) | 10 (100.0%) |
Monthly Housing Cost Tiers in Stillwater borough
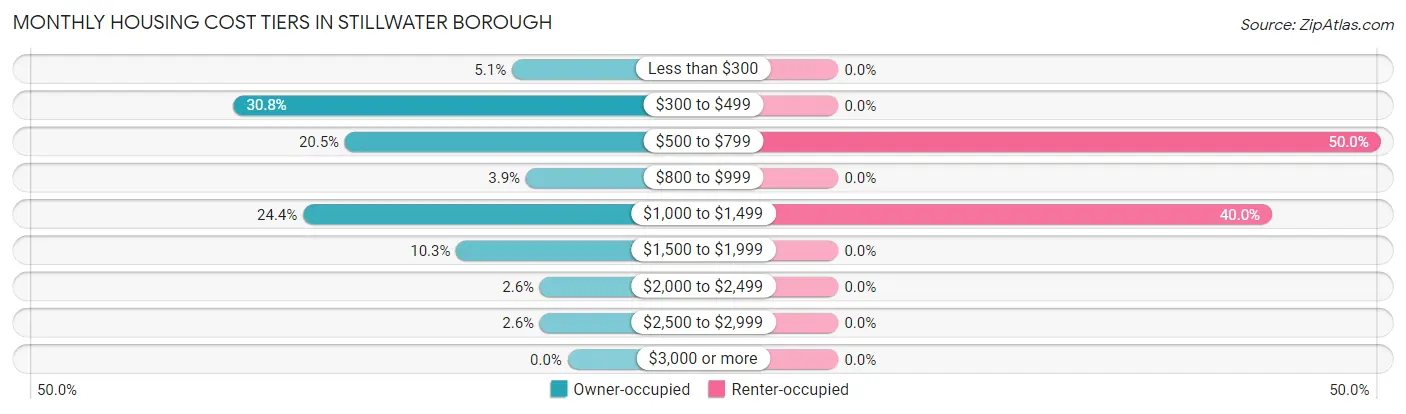
| Monthly Cost | Owner-occupied | Renter-occupied |
| Less than $300 | 4 (5.1%) | 0 (0.0%) |
| $300 to $499 | 24 (30.8%) | 0 (0.0%) |
| $500 to $799 | 16 (20.5%) | 5 (50.0%) |
| $800 to $999 | 3 (3.8%) | 0 (0.0%) |
| $1,000 to $1,499 | 19 (24.4%) | 4 (40.0%) |
| $1,500 to $1,999 | 8 (10.3%) | 0 (0.0%) |
| $2,000 to $2,499 | 2 (2.6%) | 0 (0.0%) |
| $2,500 to $2,999 | 2 (2.6%) | 0 (0.0%) |
| $3,000 or more | 0 (0.0%) | 0 (0.0%) |
| Total | 78 (100.0%) | 10 (100.0%) |
Physical Housing Characteristics in Stillwater borough
Housing Structures in Stillwater borough
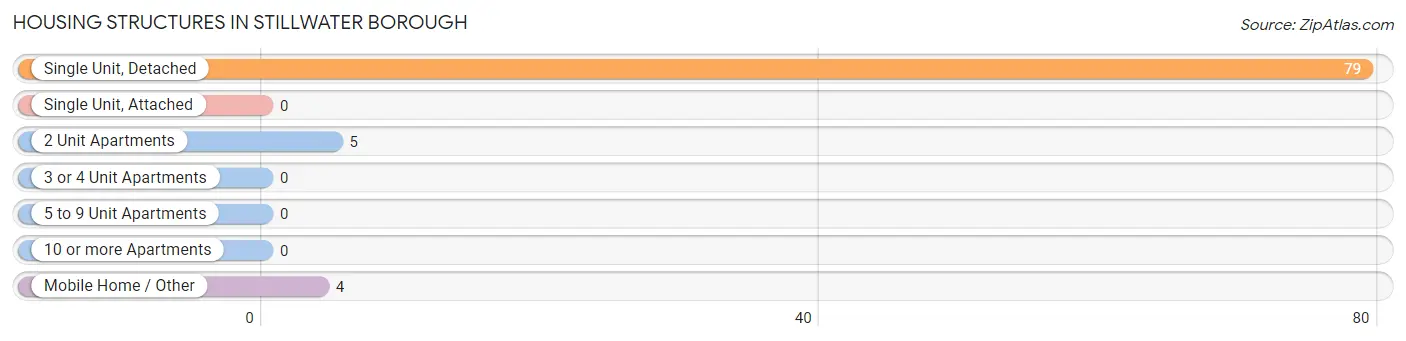
| Structure Type | # Housing Units | % Housing Units |
| Single Unit, Detached | 79 | 89.8% |
| Single Unit, Attached | 0 | 0.0% |
| 2 Unit Apartments | 5 | 5.7% |
| 3 or 4 Unit Apartments | 0 | 0.0% |
| 5 to 9 Unit Apartments | 0 | 0.0% |
| 10 or more Apartments | 0 | 0.0% |
| Mobile Home / Other | 4 | 4.5% |
| Total | 88 | 100.0% |
Housing Structures by Occupancy in Stillwater borough
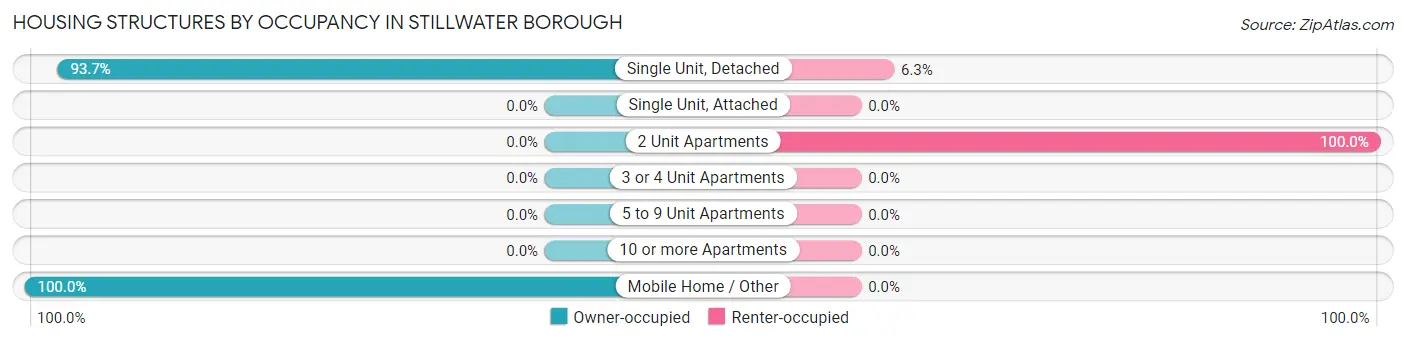
| Structure Type | Owner-occupied | Renter-occupied |
| Single Unit, Detached | 74 (93.7%) | 5 (6.3%) |
| Single Unit, Attached | 0 (0.0%) | 0 (0.0%) |
| 2 Unit Apartments | 0 (0.0%) | 5 (100.0%) |
| 3 or 4 Unit Apartments | 0 (0.0%) | 0 (0.0%) |
| 5 to 9 Unit Apartments | 0 (0.0%) | 0 (0.0%) |
| 10 or more Apartments | 0 (0.0%) | 0 (0.0%) |
| Mobile Home / Other | 4 (100.0%) | 0 (0.0%) |
| Total | 78 (88.6%) | 10 (11.4%) |
Housing Structures by Number of Rooms in Stillwater borough
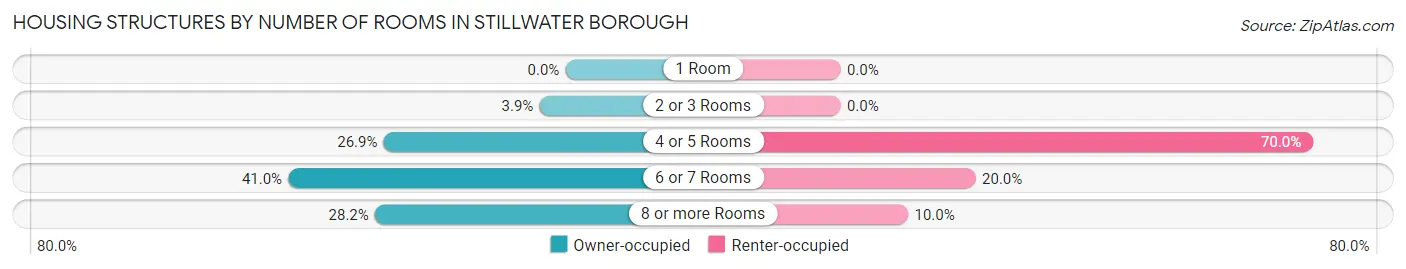
| Number of Rooms | Owner-occupied | Renter-occupied |
| 1 Room | 0 (0.0%) | 0 (0.0%) |
| 2 or 3 Rooms | 3 (3.8%) | 0 (0.0%) |
| 4 or 5 Rooms | 21 (26.9%) | 7 (70.0%) |
| 6 or 7 Rooms | 32 (41.0%) | 2 (20.0%) |
| 8 or more Rooms | 22 (28.2%) | 1 (10.0%) |
| Total | 78 (100.0%) | 10 (100.0%) |
Housing Structure by Heating Type in Stillwater borough
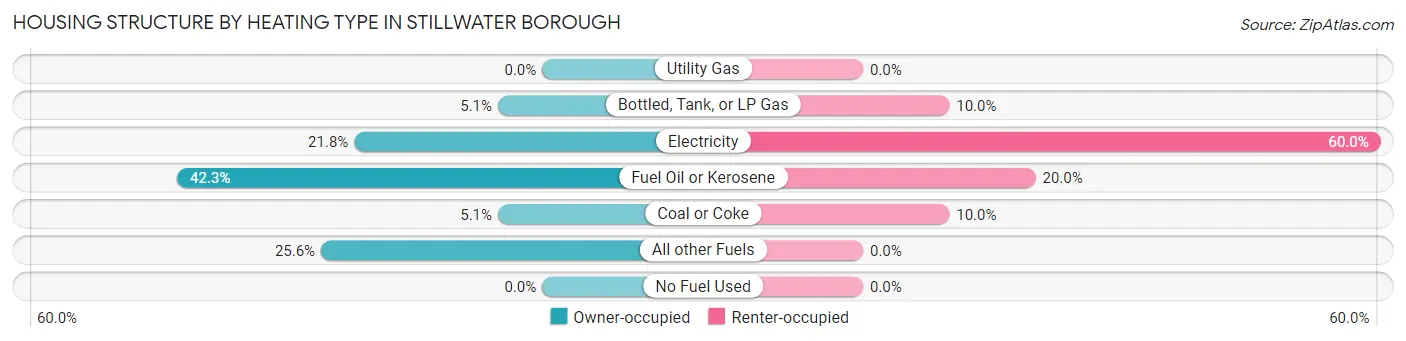
| Heating Type | Owner-occupied | Renter-occupied |
| Utility Gas | 0 (0.0%) | 0 (0.0%) |
| Bottled, Tank, or LP Gas | 4 (5.1%) | 1 (10.0%) |
| Electricity | 17 (21.8%) | 6 (60.0%) |
| Fuel Oil or Kerosene | 33 (42.3%) | 2 (20.0%) |
| Coal or Coke | 4 (5.1%) | 1 (10.0%) |
| All other Fuels | 20 (25.6%) | 0 (0.0%) |
| No Fuel Used | 0 (0.0%) | 0 (0.0%) |
| Total | 78 (100.0%) | 10 (100.0%) |
Household Vehicle Usage in Stillwater borough
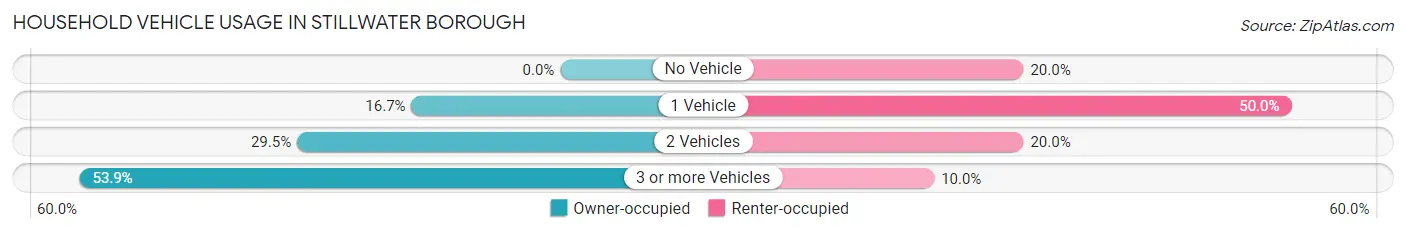
| Vehicles per Household | Owner-occupied | Renter-occupied |
| No Vehicle | 0 (0.0%) | 2 (20.0%) |
| 1 Vehicle | 13 (16.7%) | 5 (50.0%) |
| 2 Vehicles | 23 (29.5%) | 2 (20.0%) |
| 3 or more Vehicles | 42 (53.8%) | 1 (10.0%) |
| Total | 78 (100.0%) | 10 (100.0%) |
Real Estate & Mortgages in Stillwater borough
Real Estate and Mortgage Overview in Stillwater borough
| Characteristic | Without Mortgage | With Mortgage |
| Housing Units | 43 | 35 |
| Median Property Value | $127,100 | $179,700 |
| Median Household Income | $75,938 | $5 |
| Monthly Housing Costs | $439 | $0 |
| Real Estate Taxes | $1,750 | $0 |
Property Value by Mortgage Status in Stillwater borough
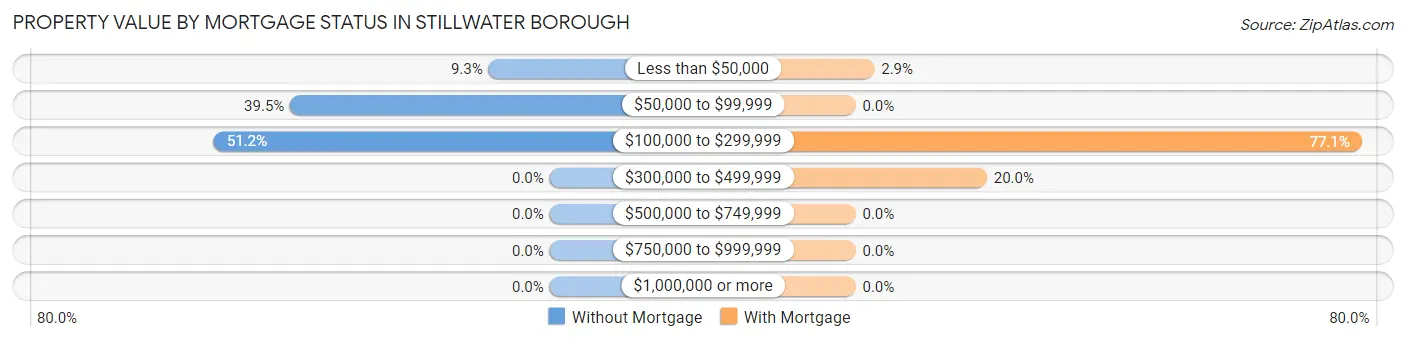
| Property Value | Without Mortgage | With Mortgage |
| Less than $50,000 | 4 (9.3%) | 1 (2.9%) |
| $50,000 to $99,999 | 17 (39.5%) | 0 (0.0%) |
| $100,000 to $299,999 | 22 (51.2%) | 27 (77.1%) |
| $300,000 to $499,999 | 0 (0.0%) | 7 (20.0%) |
| $500,000 to $749,999 | 0 (0.0%) | 0 (0.0%) |
| $750,000 to $999,999 | 0 (0.0%) | 0 (0.0%) |
| $1,000,000 or more | 0 (0.0%) | 0 (0.0%) |
| Total | 43 (100.0%) | 35 (100.0%) |
Household Income by Mortgage Status in Stillwater borough
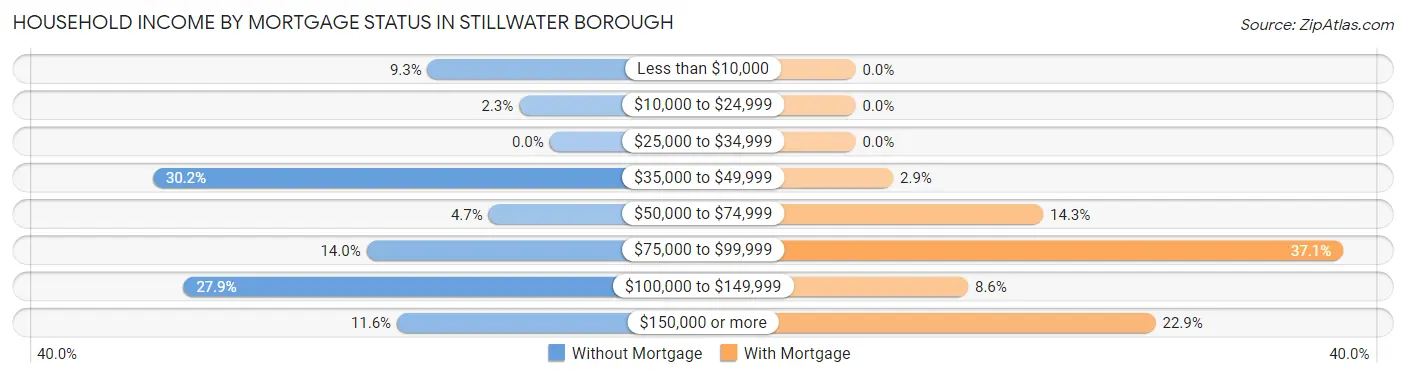
| Household Income | Without Mortgage | With Mortgage |
| Less than $10,000 | 4 (9.3%) | 0 (0.0%) |
| $10,000 to $24,999 | 1 (2.3%) | 0 (0.0%) |
| $25,000 to $34,999 | 0 (0.0%) | 0 (0.0%) |
| $35,000 to $49,999 | 13 (30.2%) | 1 (2.9%) |
| $50,000 to $74,999 | 2 (4.6%) | 5 (14.3%) |
| $75,000 to $99,999 | 6 (14.0%) | 13 (37.1%) |
| $100,000 to $149,999 | 12 (27.9%) | 3 (8.6%) |
| $150,000 or more | 5 (11.6%) | 8 (22.9%) |
| Total | 43 (100.0%) | 35 (100.0%) |
Property Value to Household Income Ratio in Stillwater borough
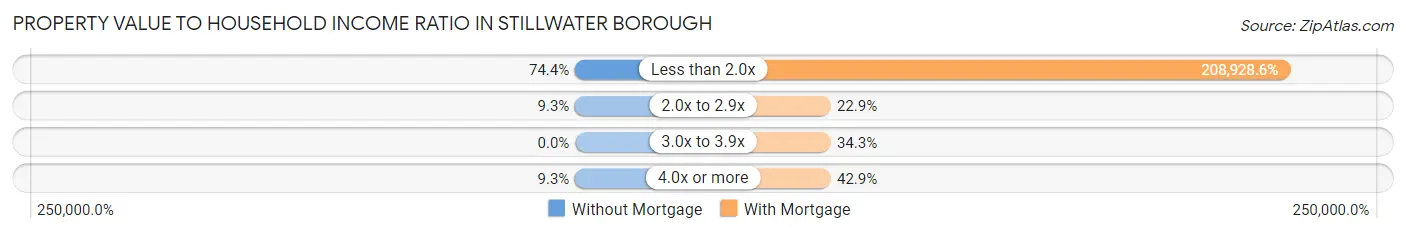
| Value-to-Income Ratio | Without Mortgage | With Mortgage |
| Less than 2.0x | 32 (74.4%) | 73,125 (208,928.6%) |
| 2.0x to 2.9x | 4 (9.3%) | 8 (22.9%) |
| 3.0x to 3.9x | 0 (0.0%) | 12 (34.3%) |
| 4.0x or more | 4 (9.3%) | 15 (42.9%) |
| Total | 43 (100.0%) | 35 (100.0%) |
Real Estate Taxes by Mortgage Status in Stillwater borough
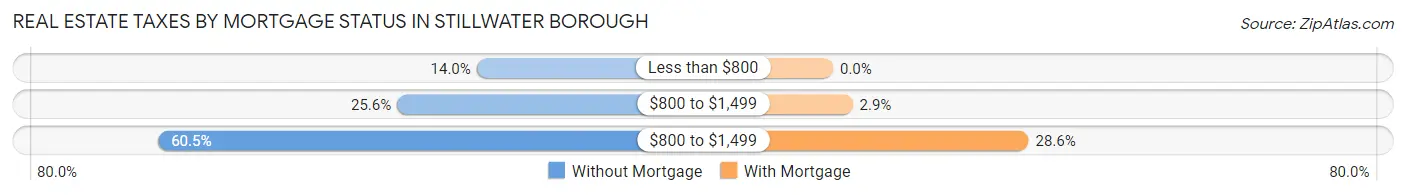
| Property Taxes | Without Mortgage | With Mortgage |
| Less than $800 | 6 (14.0%) | 0 (0.0%) |
| $800 to $1,499 | 11 (25.6%) | 1 (2.9%) |
| $800 to $1,499 | 26 (60.5%) | 10 (28.6%) |
| Total | 43 (100.0%) | 35 (100.0%) |
Health & Disability in Stillwater borough
Health Insurance Coverage by Age in Stillwater borough
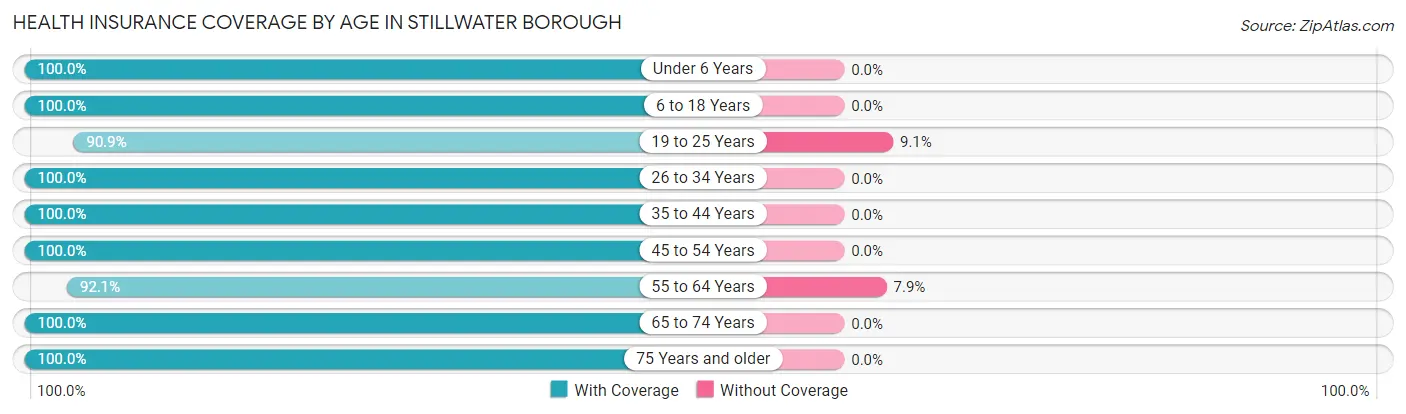
| Age Bracket | With Coverage | Without Coverage |
| Under 6 Years | 14 (100.0%) | 0 (0.0%) |
| 6 to 18 Years | 45 (100.0%) | 0 (0.0%) |
| 19 to 25 Years | 10 (90.9%) | 1 (9.1%) |
| 26 to 34 Years | 20 (100.0%) | 0 (0.0%) |
| 35 to 44 Years | 13 (100.0%) | 0 (0.0%) |
| 45 to 54 Years | 48 (100.0%) | 0 (0.0%) |
| 55 to 64 Years | 35 (92.1%) | 3 (7.9%) |
| 65 to 74 Years | 23 (100.0%) | 0 (0.0%) |
| 75 Years and older | 9 (100.0%) | 0 (0.0%) |
| Total | 217 (98.2%) | 4 (1.8%) |
Health Insurance Coverage by Citizenship Status in Stillwater borough
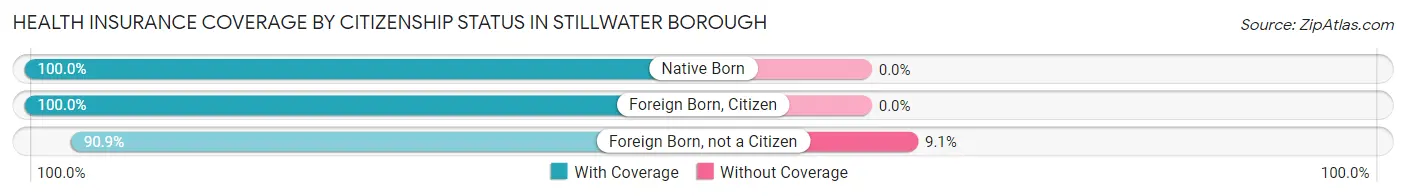
| Citizenship Status | With Coverage | Without Coverage |
| Native Born | 14 (100.0%) | 0 (0.0%) |
| Foreign Born, Citizen | 45 (100.0%) | 0 (0.0%) |
| Foreign Born, not a Citizen | 10 (90.9%) | 1 (9.1%) |
Health Insurance Coverage by Household Income in Stillwater borough
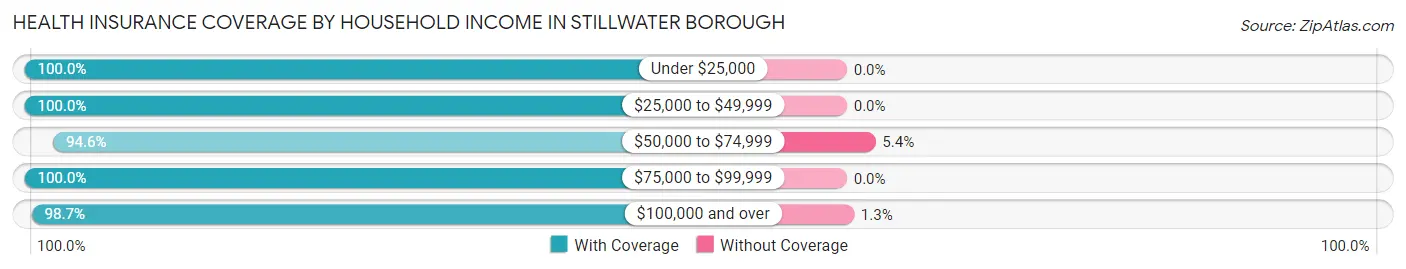
| Household Income | With Coverage | Without Coverage |
| Under $25,000 | 6 (100.0%) | 0 (0.0%) |
| $25,000 to $49,999 | 67 (100.0%) | 0 (0.0%) |
| $50,000 to $74,999 | 53 (94.6%) | 3 (5.4%) |
| $75,000 to $99,999 | 17 (100.0%) | 0 (0.0%) |
| $100,000 and over | 74 (98.7%) | 1 (1.3%) |
Public vs Private Health Insurance Coverage by Age in Stillwater borough
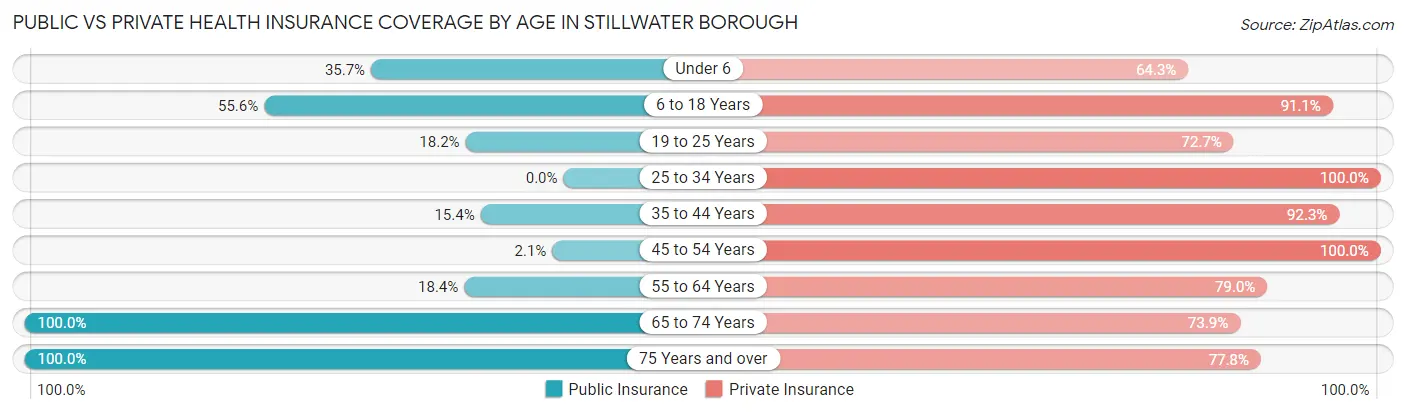
| Age Bracket | Public Insurance | Private Insurance |
| Under 6 | 5 (35.7%) | 9 (64.3%) |
| 6 to 18 Years | 25 (55.6%) | 41 (91.1%) |
| 19 to 25 Years | 2 (18.2%) | 8 (72.7%) |
| 25 to 34 Years | 0 (0.0%) | 20 (100.0%) |
| 35 to 44 Years | 2 (15.4%) | 12 (92.3%) |
| 45 to 54 Years | 1 (2.1%) | 48 (100.0%) |
| 55 to 64 Years | 7 (18.4%) | 30 (78.9%) |
| 65 to 74 Years | 23 (100.0%) | 17 (73.9%) |
| 75 Years and over | 9 (100.0%) | 7 (77.8%) |
| Total | 74 (33.5%) | 192 (86.9%) |
Disability Status by Sex by Age in Stillwater borough
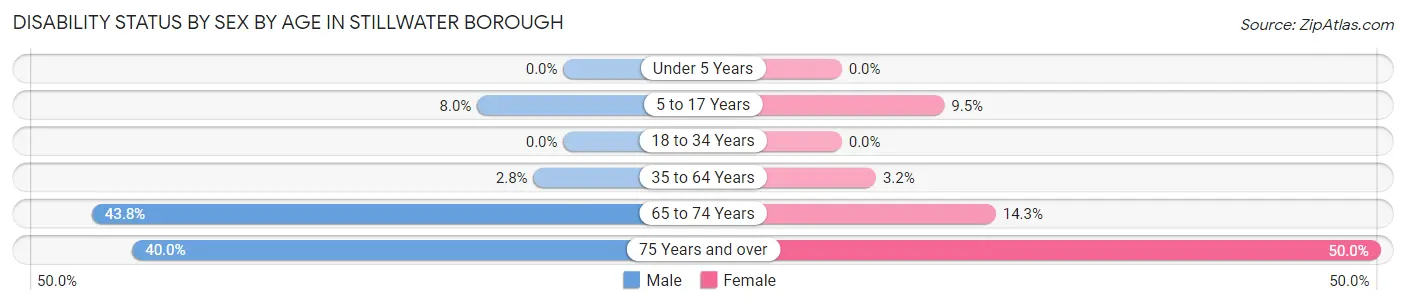
| Age Bracket | Male | Female |
| Under 5 Years | 0 (0.0%) | 0 (0.0%) |
| 5 to 17 Years | 2 (8.0%) | 2 (9.5%) |
| 18 to 34 Years | 0 (0.0%) | 0 (0.0%) |
| 35 to 64 Years | 1 (2.8%) | 2 (3.2%) |
| 65 to 74 Years | 7 (43.8%) | 1 (14.3%) |
| 75 Years and over | 2 (40.0%) | 2 (50.0%) |
Disability Class by Sex by Age in Stillwater borough
Disability Class: Hearing Difficulty
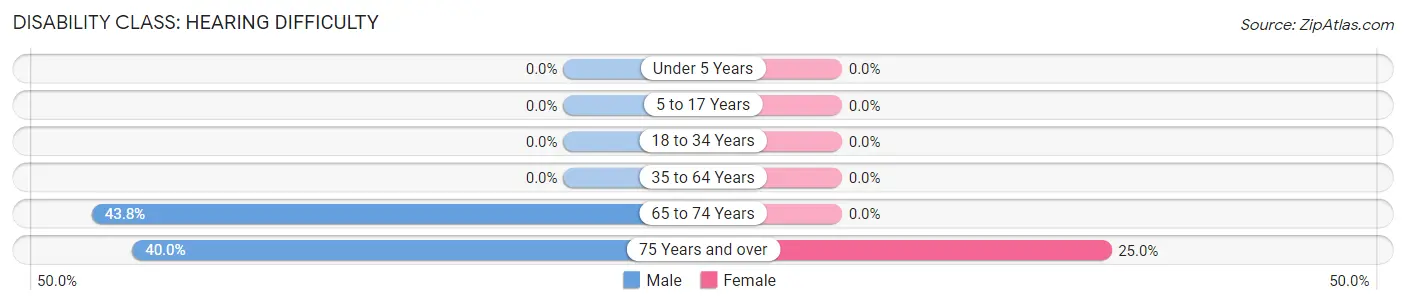
| Age Bracket | Male | Female |
| Under 5 Years | 0 (0.0%) | 0 (0.0%) |
| 5 to 17 Years | 0 (0.0%) | 0 (0.0%) |
| 18 to 34 Years | 0 (0.0%) | 0 (0.0%) |
| 35 to 64 Years | 0 (0.0%) | 0 (0.0%) |
| 65 to 74 Years | 7 (43.8%) | 0 (0.0%) |
| 75 Years and over | 2 (40.0%) | 1 (25.0%) |
Disability Class: Vision Difficulty
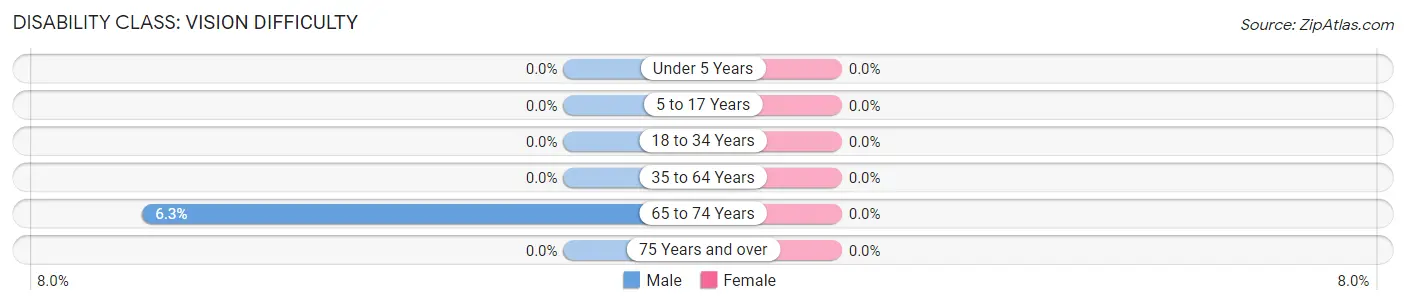
| Age Bracket | Male | Female |
| Under 5 Years | 0 (0.0%) | 0 (0.0%) |
| 5 to 17 Years | 0 (0.0%) | 0 (0.0%) |
| 18 to 34 Years | 0 (0.0%) | 0 (0.0%) |
| 35 to 64 Years | 0 (0.0%) | 0 (0.0%) |
| 65 to 74 Years | 1 (6.2%) | 0 (0.0%) |
| 75 Years and over | 0 (0.0%) | 0 (0.0%) |
Disability Class: Cognitive Difficulty
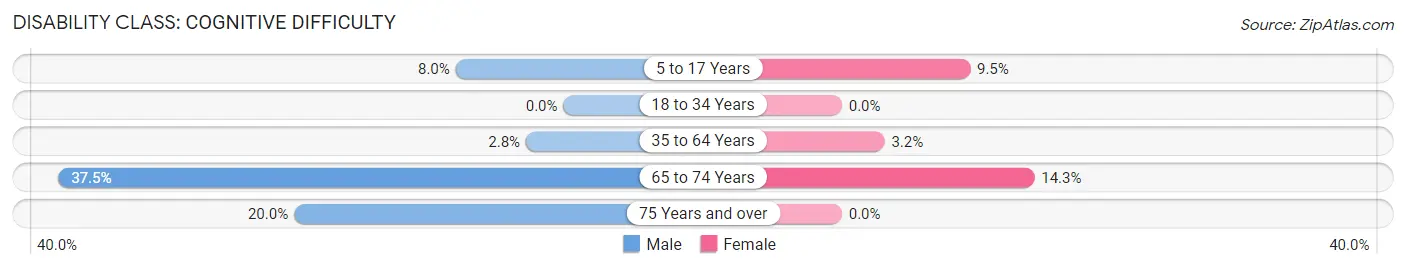
| Age Bracket | Male | Female |
| 5 to 17 Years | 2 (8.0%) | 2 (9.5%) |
| 18 to 34 Years | 0 (0.0%) | 0 (0.0%) |
| 35 to 64 Years | 1 (2.8%) | 2 (3.2%) |
| 65 to 74 Years | 6 (37.5%) | 1 (14.3%) |
| 75 Years and over | 1 (20.0%) | 0 (0.0%) |
Disability Class: Ambulatory Difficulty
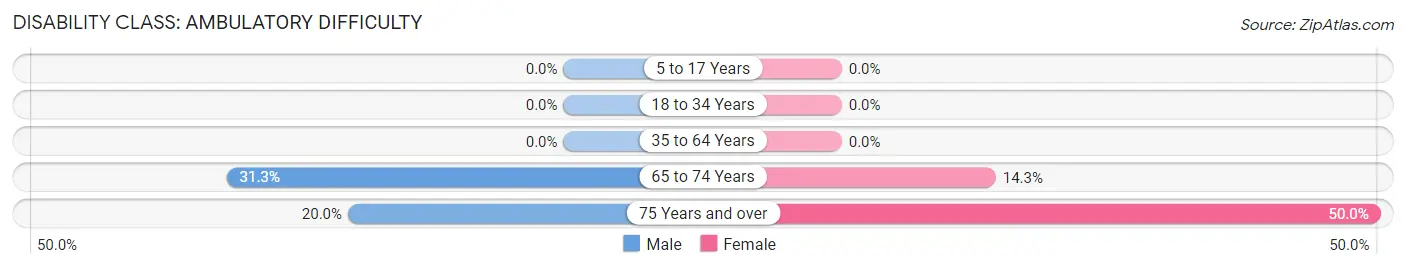
| Age Bracket | Male | Female |
| 5 to 17 Years | 0 (0.0%) | 0 (0.0%) |
| 18 to 34 Years | 0 (0.0%) | 0 (0.0%) |
| 35 to 64 Years | 0 (0.0%) | 0 (0.0%) |
| 65 to 74 Years | 5 (31.2%) | 1 (14.3%) |
| 75 Years and over | 1 (20.0%) | 2 (50.0%) |
Disability Class: Self-Care Difficulty
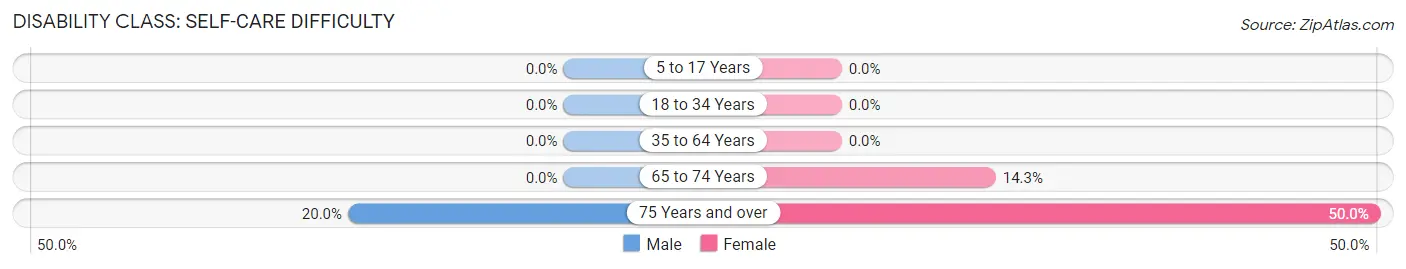
| Age Bracket | Male | Female |
| 5 to 17 Years | 0 (0.0%) | 0 (0.0%) |
| 18 to 34 Years | 0 (0.0%) | 0 (0.0%) |
| 35 to 64 Years | 0 (0.0%) | 0 (0.0%) |
| 65 to 74 Years | 0 (0.0%) | 1 (14.3%) |
| 75 Years and over | 1 (20.0%) | 2 (50.0%) |
Technology Access in Stillwater borough
Computing Device Access in Stillwater borough
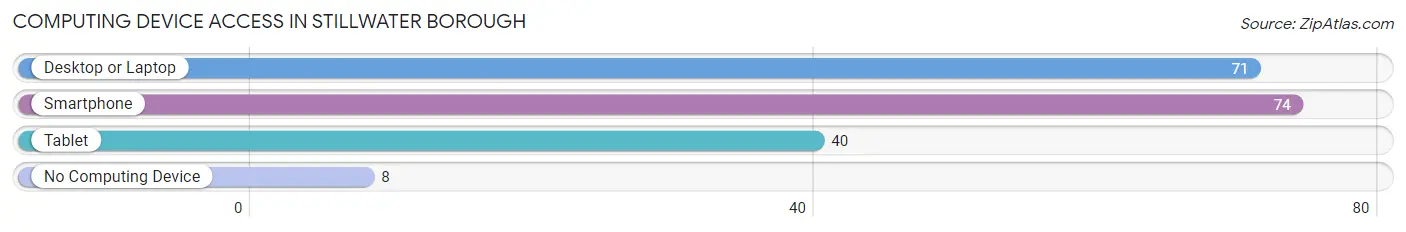
| Device Type | # Households | % Households |
| Desktop or Laptop | 71 | 80.7% |
| Smartphone | 74 | 84.1% |
| Tablet | 40 | 45.5% |
| No Computing Device | 8 | 9.1% |
| Total | 88 | 100.0% |
Internet Access in Stillwater borough
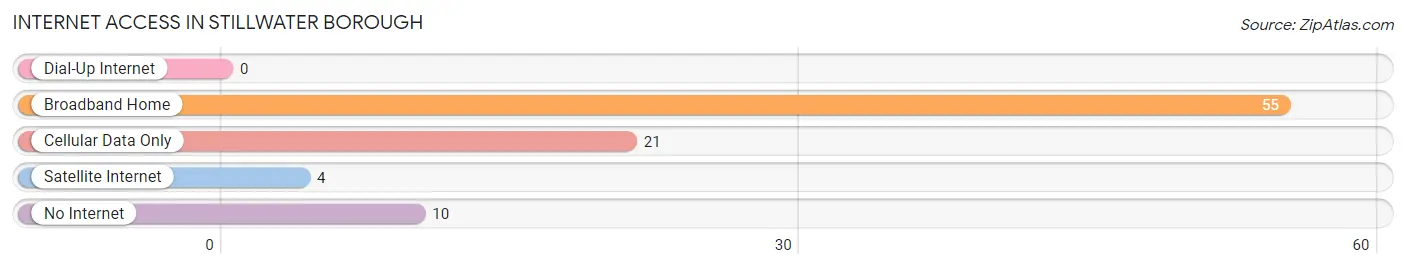
| Internet Type | # Households | % Households |
| Dial-Up Internet | 0 | 0.0% |
| Broadband Home | 55 | 62.5% |
| Cellular Data Only | 21 | 23.9% |
| Satellite Internet | 4 | 4.5% |
| No Internet | 10 | 11.4% |
| Total | 88 | 100.0% |
Stillwater borough Summary
Introduction
Stillwater Borough is a small borough located in the state of Pennsylvania. It is situated in the northern part of the state, in the county of Bradford. The borough is located in the Endless Mountains region of the state, and is surrounded by the Susquehanna River. The population of Stillwater Borough was 1,845 in the year 2000, according to the United States Census Bureau.
History
The history of Stillwater Borough dates back to the late 1700s, when the area was first settled by European settlers. The first settlers were mostly of German and Dutch descent, and they established a small farming community in the area. The first permanent settlement in the area was established in 1790, and the town was officially incorporated as a borough in 1845.
The town was named after the nearby Stillwater Creek, which was named for its still waters. The creek was a popular spot for fishing and swimming, and it was also used as a source of power for the local mills.
The town grew slowly over the years, and by the early 1900s, it had become a popular tourist destination. The town was known for its scenic beauty, and it was also home to several resorts and hotels. The town also had a thriving lumber industry, and it was home to several sawmills.
Geography
Stillwater Borough is located in the northern part of the state of Pennsylvania, in the county of Bradford. The borough is situated in the Endless Mountains region of the state, and is surrounded by the Susquehanna River. The borough covers an area of 1.3 square miles, and has an elevation of 1,845 feet.
The borough is located in a rural area, and is surrounded by forests and rolling hills. The town is located near several state parks, including Ricketts Glen State Park and Worlds End State Park. The borough is also located near several lakes, including Lake Jean and Lake Carey.
Economy
The economy of Stillwater Borough is largely based on tourism and agriculture. The town is home to several resorts and hotels, which attract visitors from all over the state. The town is also home to several farms, which produce a variety of crops, including corn, soybeans, and hay.
The town is also home to several small businesses, including restaurants, shops, and other services. The town is also home to several manufacturing companies, which produce a variety of products, including furniture, clothing, and electronics.
Demographics
The population of Stillwater Borough was 1,845 in the year 2000, according to the United States Census Bureau. The population is largely white, with a small percentage of African Americans and Hispanics. The median household income in the borough is $37,000, and the median age is 44.
Conclusion
Stillwater Borough is a small borough located in the state of Pennsylvania. It is situated in the northern part of the state, in the county of Bradford. The borough is located in the Endless Mountains region of the state, and is surrounded by the Susquehanna River. The population of Stillwater Borough was 1,845 in the year 2000, according to the United States Census Bureau. The economy of Stillwater Borough is largely based on tourism and agriculture, and the town is home to several resorts and hotels, as well as several small businesses. The population of the borough is largely white, with a small percentage of African Americans and Hispanics.
Common Questions
What is Per Capita Income in Stillwater borough?
Per Capita income in Stillwater borough is $33,458.
What is the Median Family Income in Stillwater borough?
Median Family Income in Stillwater borough is $70,625.
What is the Median Household income in Stillwater borough?
Median Household Income in Stillwater borough is $70,000.
What is Income or Wage Gap in Stillwater borough?
Income or Wage Gap in Stillwater borough is 35.5%.
Women in Stillwater borough earn 64.5 cents for every dollar earned by a man.
What is Inequality or Gini Index in Stillwater borough?
Inequality or Gini Index in Stillwater borough is 0.37.
What is the Total Population of Stillwater borough?
Total Population of Stillwater borough is 221.
What is the Total Male Population of Stillwater borough?
Total Male Population of Stillwater borough is 102.
What is the Total Female Population of Stillwater borough?
Total Female Population of Stillwater borough is 119.
What is the Ratio of Males per 100 Females in Stillwater borough?
There are 85.71 Males per 100 Females in Stillwater borough.
What is the Ratio of Females per 100 Males in Stillwater borough?
There are 116.67 Females per 100 Males in Stillwater borough.
What is the Median Population Age in Stillwater borough?
Median Population Age in Stillwater borough is 45.8 Years.
What is the Average Family Size in Stillwater borough
Average Family Size in Stillwater borough is 2.7 People.
What is the Average Household Size in Stillwater borough
Average Household Size in Stillwater borough is 2.5 People.
How Large is the Labor Force in Stillwater borough?
There are 108 People in the Labor Forcein in Stillwater borough.
What is the Percentage of People in the Labor Force in Stillwater borough?
62.8% of People are in the Labor Force in Stillwater borough.
What is the Unemployment Rate in Stillwater borough?
Unemployment Rate in Stillwater borough is 0.9%.