Annville, PA Map & Demographics
Annville Map
Annville Overview
$26,041
PER CAPITA INCOME
$100,333
AVG FAMILY INCOME
$64,732
AVG HOUSEHOLD INCOME
38.2%
WAGE / INCOME GAP [ % ]
61.8¢/ $1
WAGE / INCOME GAP [ $ ]
0.38
INEQUALITY / GINI INDEX
4,829
TOTAL POPULATION
2,294
MALE POPULATION
2,535
FEMALE POPULATION
90.49
MALES / 100 FEMALES
110.51
FEMALES / 100 MALES
24.3
MEDIAN AGE
3.0
AVG FAMILY SIZE
2.2
AVG HOUSEHOLD SIZE
2,725
LABOR FORCE [ PEOPLE ]
64.6%
PERCENT IN LABOR FORCE
5.3%
UNEMPLOYMENT RATE
Annville Zip Codes
Annville Area Codes
Income in Annville
Income Overview in Annville
Per Capita Income in Annville is $26,041, while median incomes of families and households are $100,333 and $64,732 respectively.
| Characteristic | Number | Measure |
| Per Capita Income | 4,829 | $26,041 |
| Median Family Income | 826 | $100,333 |
| Mean Family Income | 826 | $106,477 |
| Median Household Income | 1,478 | $64,732 |
| Mean Household Income | 1,478 | $78,840 |
| Income Deficit | 826 | $0 |
| Wage / Income Gap (%) | 4,829 | 38.24% |
| Wage / Income Gap ($) | 4,829 | 61.76¢ per $1 |
| Gini / Inequality Index | 4,829 | 0.38 |
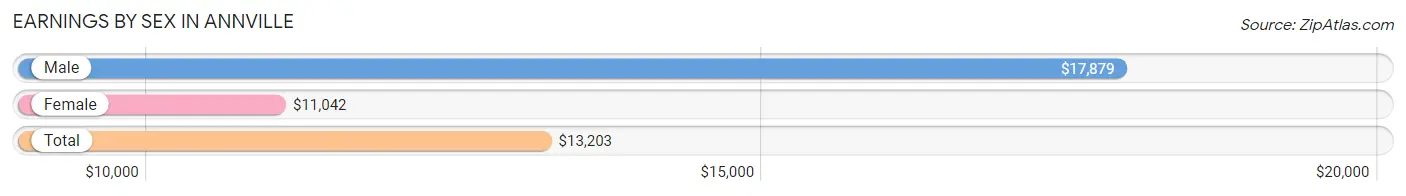
Earnings by Sex in Annville
Average Earnings in Annville are $13,203, $17,879 for men and $11,042 for women, a difference of 38.2%.
| Sex | Number | Average Earnings |
| Male | 1,662 (49.0%) | $17,879 |
| Female | 1,727 (51.0%) | $11,042 |
| Total | 3,389 (100.0%) | $13,203 |
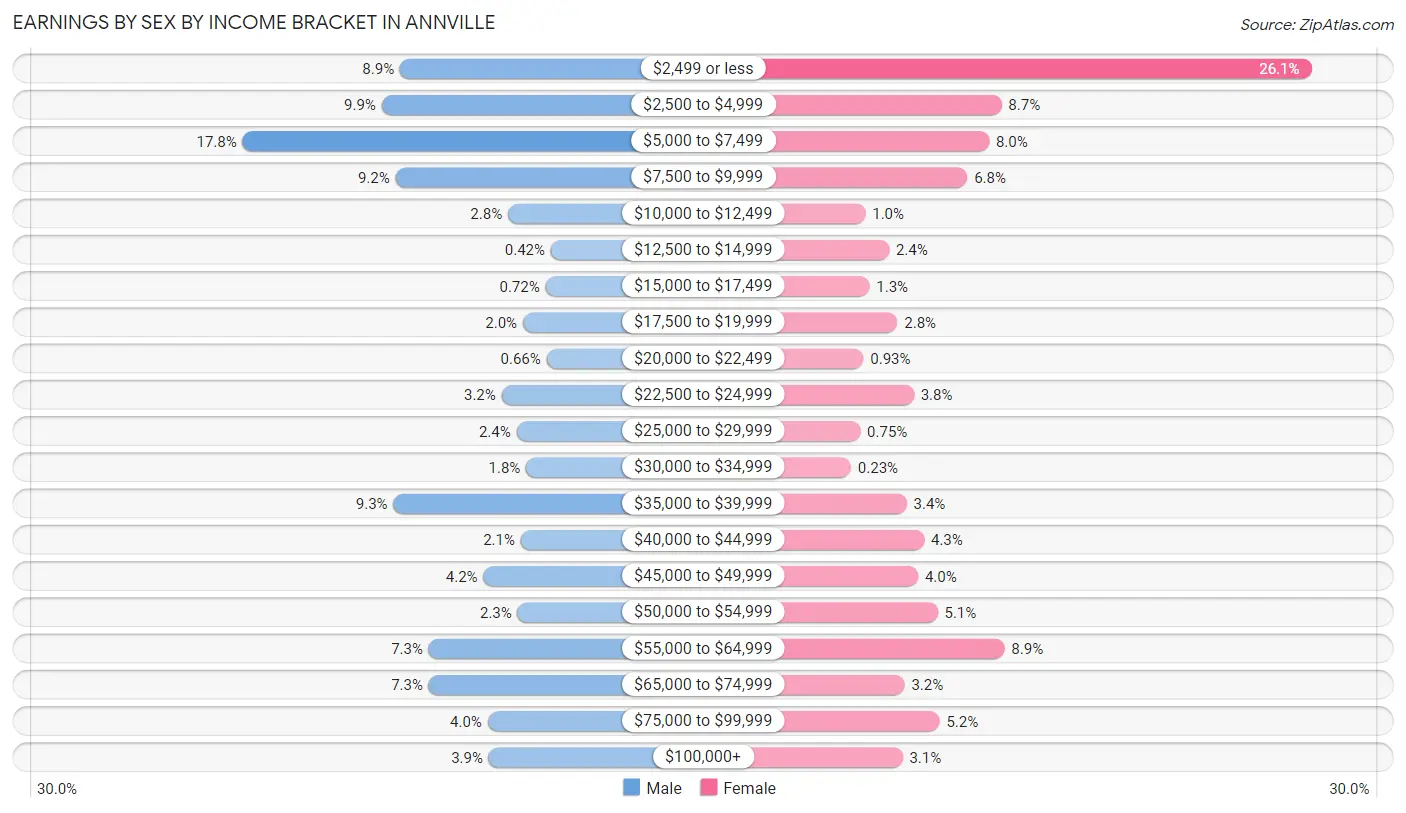
Earnings by Sex by Income Bracket in Annville
The most common earnings brackets in Annville are $5,000 to $7,499 for men (295 | 17.7%) and $2,499 or less for women (451 | 26.1%).
| Income | Male | Female |
| $2,499 or less | 148 (8.9%) | 451 (26.1%) |
| $2,500 to $4,999 | 165 (9.9%) | 150 (8.7%) |
| $5,000 to $7,499 | 295 (17.7%) | 138 (8.0%) |
| $7,500 to $9,999 | 152 (9.1%) | 117 (6.8%) |
| $10,000 to $12,499 | 47 (2.8%) | 18 (1.0%) |
| $12,500 to $14,999 | 7 (0.4%) | 41 (2.4%) |
| $15,000 to $17,499 | 12 (0.7%) | 22 (1.3%) |
| $17,500 to $19,999 | 33 (2.0%) | 49 (2.8%) |
| $20,000 to $22,499 | 11 (0.7%) | 16 (0.9%) |
| $22,500 to $24,999 | 53 (3.2%) | 65 (3.8%) |
| $25,000 to $29,999 | 39 (2.4%) | 13 (0.7%) |
| $30,000 to $34,999 | 30 (1.8%) | 4 (0.2%) |
| $35,000 to $39,999 | 154 (9.3%) | 58 (3.4%) |
| $40,000 to $44,999 | 35 (2.1%) | 75 (4.3%) |
| $45,000 to $49,999 | 70 (4.2%) | 69 (4.0%) |
| $50,000 to $54,999 | 38 (2.3%) | 88 (5.1%) |
| $55,000 to $64,999 | 121 (7.3%) | 153 (8.9%) |
| $65,000 to $74,999 | 121 (7.3%) | 56 (3.2%) |
| $75,000 to $99,999 | 66 (4.0%) | 90 (5.2%) |
| $100,000+ | 65 (3.9%) | 54 (3.1%) |
| Total | 1,662 (100.0%) | 1,727 (100.0%) |
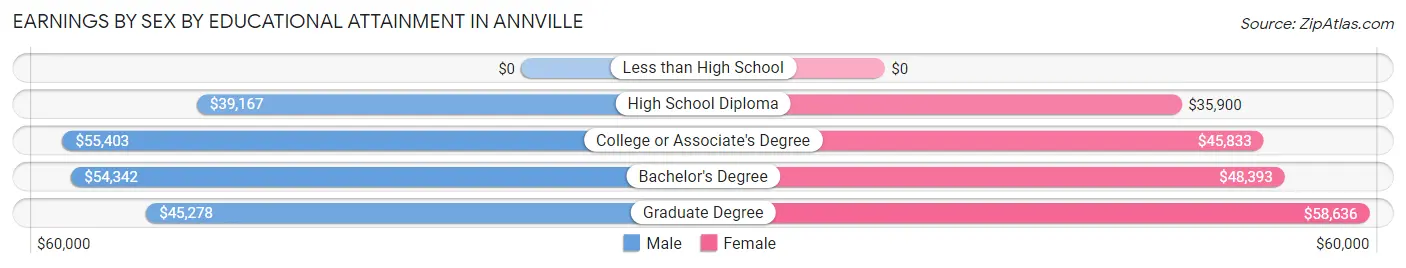
Earnings by Sex by Educational Attainment in Annville
Average earnings in Annville are $49,219 for men and $45,781 for women, a difference of 7.0%. Men with an educational attainment of college or associate's degree enjoy the highest average annual earnings of $55,403, while those with high school diploma education earn the least with $39,167. Women with an educational attainment of graduate degree earn the most with the average annual earnings of $58,636, while those with high school diploma education have the smallest earnings of $35,900.
| Educational Attainment | Male Income | Female Income |
| Less than High School | - | - |
| High School Diploma | $39,167 | $35,900 |
| College or Associate's Degree | $55,403 | $45,833 |
| Bachelor's Degree | $54,342 | $48,393 |
| Graduate Degree | $45,278 | $58,636 |
| Total | $49,219 | $45,781 |
Family Income in Annville
Family Income Brackets in Annville
According to the Annville family income data, there are 325 families falling into the $100,000 to $149,999 income range, which is the most common income bracket and makes up 39.4% of all families.
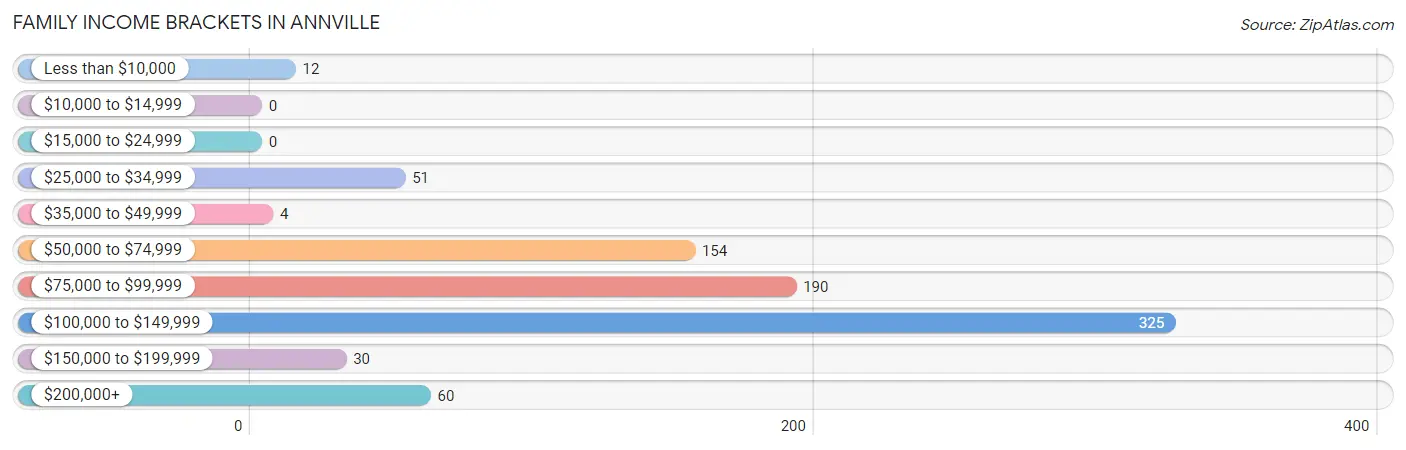
| Income Bracket | # Families | % Families |
| Less than $10,000 | 12 | 1.5% |
| $10,000 to $14,999 | 0 | 0.0% |
| $15,000 to $24,999 | 0 | 0.0% |
| $25,000 to $34,999 | 51 | 6.2% |
| $35,000 to $49,999 | 4 | 0.5% |
| $50,000 to $74,999 | 154 | 18.6% |
| $75,000 to $99,999 | 190 | 23.0% |
| $100,000 to $149,999 | 325 | 39.3% |
| $150,000 to $199,999 | 30 | 3.6% |
| $200,000+ | 60 | 7.3% |
Family Income by Famaliy Size in Annville
5-person families (62 | 7.5%) account for the highest median family income in Annville with $140,921 per family, while 2-person families (376 | 45.5%) have the highest median income of $44,621 per family member.
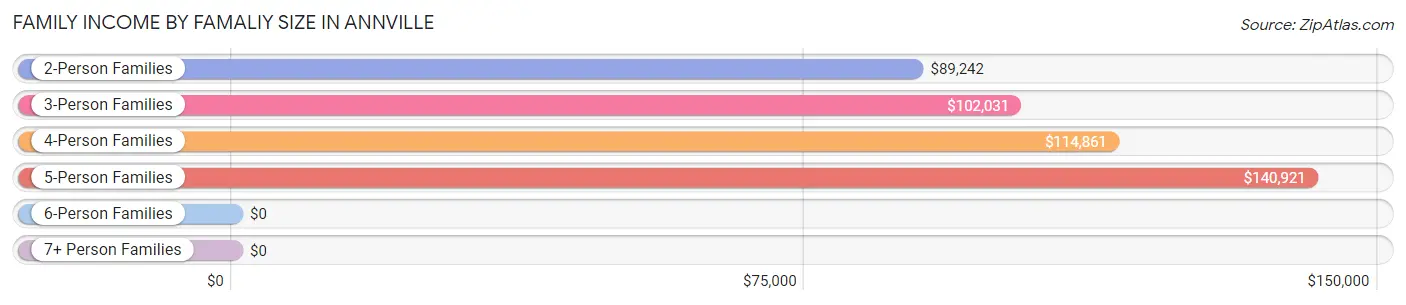
| Income Bracket | # Families | Median Income |
| 2-Person Families | 376 (45.5%) | $89,242 |
| 3-Person Families | 173 (20.9%) | $102,031 |
| 4-Person Families | 189 (22.9%) | $114,861 |
| 5-Person Families | 62 (7.5%) | $140,921 |
| 6-Person Families | 26 (3.2%) | $0 |
| 7+ Person Families | 0 (0.0%) | $0 |
| Total | 826 (100.0%) | $100,333 |
Family Income by Number of Earners in Annville
The median family income in Annville is $100,333, with families comprising 3+ earners (120) having the highest median family income of $118,750, while families with 1 earner (108) have the lowest median family income of $91,750, accounting for 14.5% and 13.1% of families, respectively.
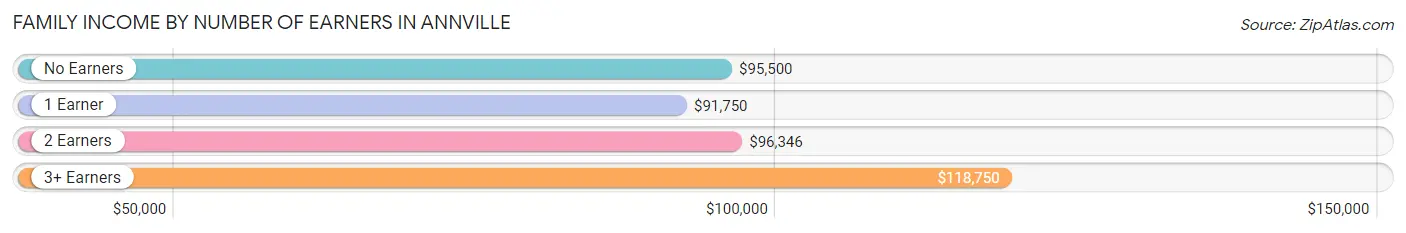
| Number of Earners | # Families | Median Income |
| No Earners | 54 (6.5%) | $95,500 |
| 1 Earner | 108 (13.1%) | $91,750 |
| 2 Earners | 544 (65.9%) | $96,346 |
| 3+ Earners | 120 (14.5%) | $118,750 |
| Total | 826 (100.0%) | $100,333 |
Household Income in Annville
Household Income Brackets in Annville
With 334 households falling in the category, the $100,000 to $149,999 income range is the most frequent in Annville, accounting for 22.6% of all households. In contrast, only 12 households (0.8%) fall into the $10,000 to $14,999 income bracket, making it the least populous group.
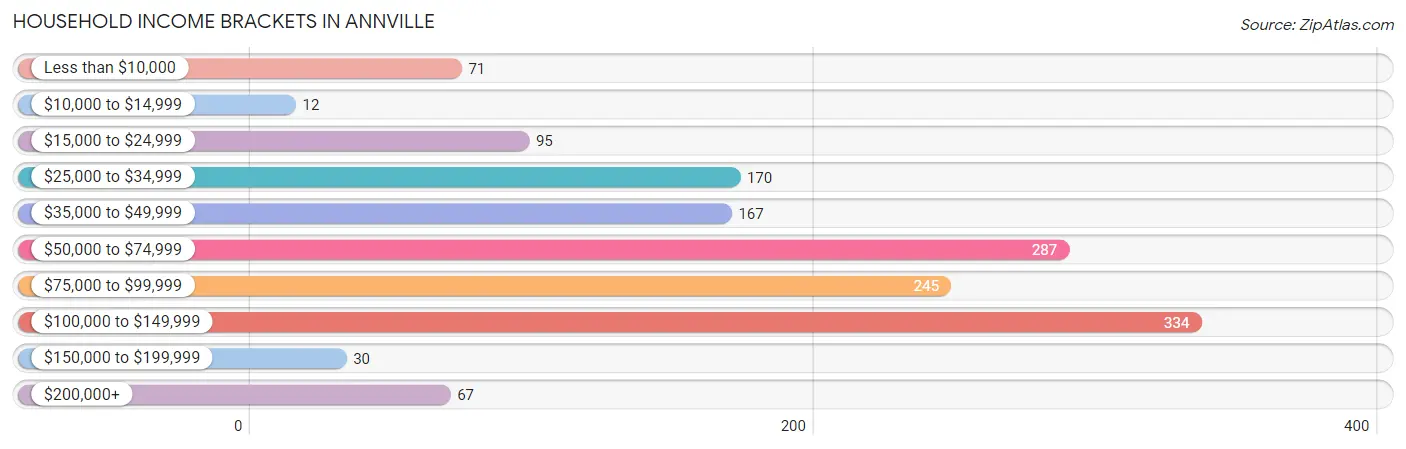
| Income Bracket | # Households | % Households |
| Less than $10,000 | 71 | 4.8% |
| $10,000 to $14,999 | 12 | 0.8% |
| $15,000 to $24,999 | 95 | 6.4% |
| $25,000 to $34,999 | 170 | 11.5% |
| $35,000 to $49,999 | 167 | 11.3% |
| $50,000 to $74,999 | 287 | 19.4% |
| $75,000 to $99,999 | 245 | 16.6% |
| $100,000 to $149,999 | 334 | 22.6% |
| $150,000 to $199,999 | 30 | 2.0% |
| $200,000+ | 67 | 4.5% |
Household Income by Householder Age in Annville
The median household income in Annville is $64,732, with the highest median household income of $88,250 found in the 25 to 44 years age bracket for the primary householder. A total of 444 households (30.0%) fall into this category. Meanwhile, the 15 to 24 years age bracket for the primary householder has the lowest median household income of $0, with 163 households (11.0%) in this group.
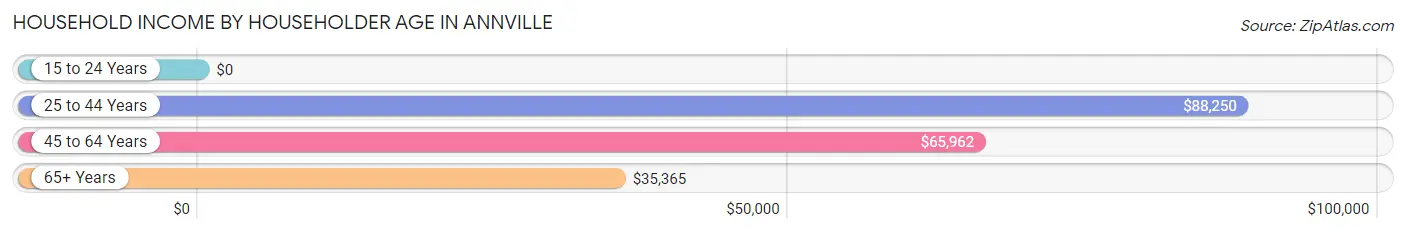
| Income Bracket | # Households | Median Income |
| 15 to 24 Years | 163 (11.0%) | $0 |
| 25 to 44 Years | 444 (30.0%) | $88,250 |
| 45 to 64 Years | 476 (32.2%) | $65,962 |
| 65+ Years | 395 (26.7%) | $35,365 |
| Total | 1,478 (100.0%) | $64,732 |
Poverty in Annville
Income Below Poverty by Sex and Age in Annville
With 3.3% poverty level for males and 6.5% for females among the residents of Annville, 15 year old males and 25 to 34 year old females are the most vulnerable to poverty, with 4 males (22.2%) and 40 females (20.6%) in their respective age groups living below the poverty level.
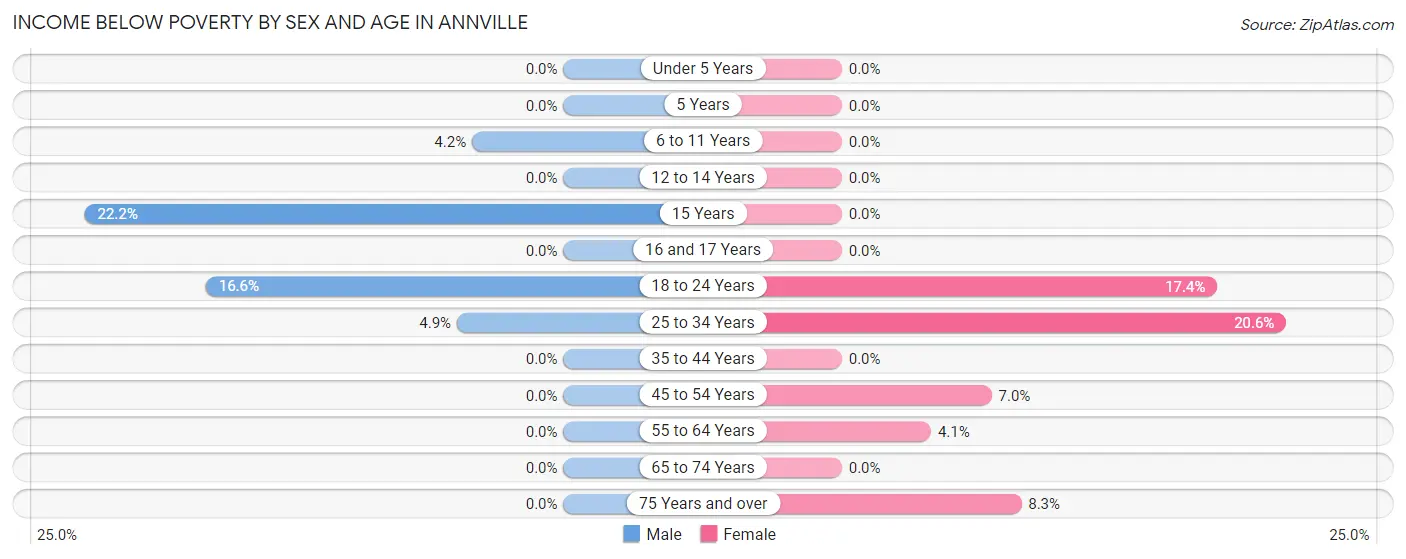
| Age Bracket | Male | Female |
| Under 5 Years | 0 (0.0%) | 0 (0.0%) |
| 5 Years | 0 (0.0%) | 0 (0.0%) |
| 6 to 11 Years | 5 (4.2%) | 0 (0.0%) |
| 12 to 14 Years | 0 (0.0%) | 0 (0.0%) |
| 15 Years | 4 (22.2%) | 0 (0.0%) |
| 16 and 17 Years | 0 (0.0%) | 0 (0.0%) |
| 18 to 24 Years | 36 (16.6%) | 27 (17.4%) |
| 25 to 34 Years | 8 (4.9%) | 40 (20.6%) |
| 35 to 44 Years | 0 (0.0%) | 0 (0.0%) |
| 45 to 54 Years | 0 (0.0%) | 18 (7.0%) |
| 55 to 64 Years | 0 (0.0%) | 6 (4.1%) |
| 65 to 74 Years | 0 (0.0%) | 0 (0.0%) |
| 75 Years and over | 0 (0.0%) | 16 (8.3%) |
| Total | 53 (3.3%) | 107 (6.5%) |
Income Above Poverty by Sex and Age in Annville
According to the poverty statistics in Annville, males aged under 5 years and females aged under 5 years are the age groups that are most secure financially, with 100.0% of males and 100.0% of females in these age groups living above the poverty line.
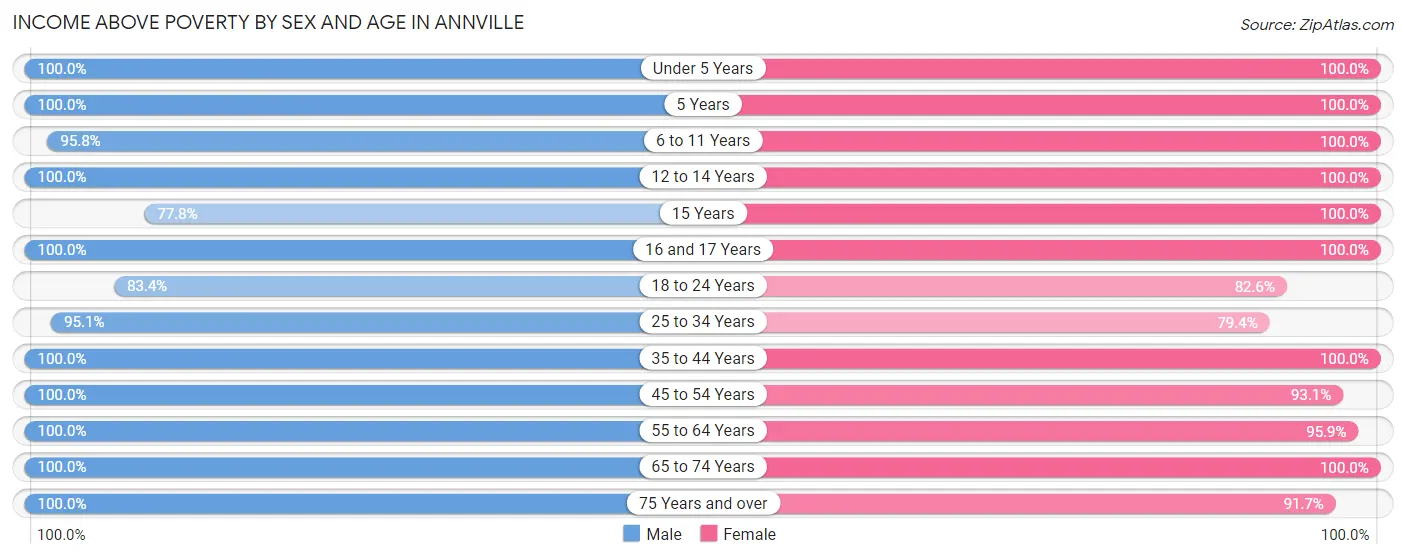
| Age Bracket | Male | Female |
| Under 5 Years | 142 (100.0%) | 11 (100.0%) |
| 5 Years | 32 (100.0%) | 14 (100.0%) |
| 6 to 11 Years | 113 (95.8%) | 121 (100.0%) |
| 12 to 14 Years | 65 (100.0%) | 67 (100.0%) |
| 15 Years | 14 (77.8%) | 22 (100.0%) |
| 16 and 17 Years | 11 (100.0%) | 35 (100.0%) |
| 18 to 24 Years | 181 (83.4%) | 128 (82.6%) |
| 25 to 34 Years | 154 (95.1%) | 154 (79.4%) |
| 35 to 44 Years | 259 (100.0%) | 271 (100.0%) |
| 45 to 54 Years | 311 (100.0%) | 241 (93.0%) |
| 55 to 64 Years | 121 (100.0%) | 139 (95.9%) |
| 65 to 74 Years | 86 (100.0%) | 173 (100.0%) |
| 75 Years and over | 65 (100.0%) | 176 (91.7%) |
| Total | 1,554 (96.7%) | 1,552 (93.5%) |
Income Below Poverty Among Married-Couple Families in Annville
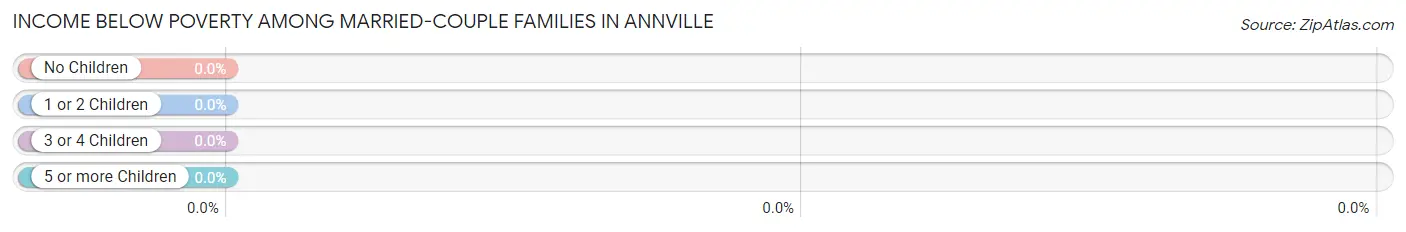
| Children | Above Poverty | Below Poverty |
| No Children | 411 (100.0%) | 0 (0.0%) |
| 1 or 2 Children | 221 (100.0%) | 0 (0.0%) |
| 3 or 4 Children | 63 (100.0%) | 0 (0.0%) |
| 5 or more Children | 0 (0.0%) | 0 (0.0%) |
| Total | 695 (100.0%) | 0 (0.0%) |
Income Below Poverty Among Single-Parent Households in Annville
According to the poverty data in Annville, 19.1% or 8 single-father households and 4.5% or 4 single-mother households are living below the poverty line. Among single-father households, those with no children have the highest poverty rate, with 8 households (47.1%) experiencing poverty. Likewise, among single-mother households, those with 1 or 2 children have the highest poverty rate, with 4 households (22.2%) falling below the poverty line.
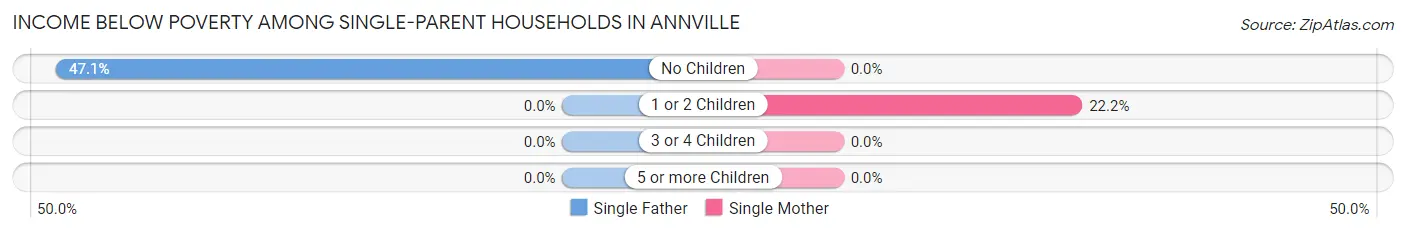
| Children | Single Father | Single Mother |
| No Children | 8 (47.1%) | 0 (0.0%) |
| 1 or 2 Children | 0 (0.0%) | 4 (22.2%) |
| 3 or 4 Children | 0 (0.0%) | 0 (0.0%) |
| 5 or more Children | 0 (0.0%) | 0 (0.0%) |
| Total | 8 (19.1%) | 4 (4.5%) |
Income Below Poverty Among Married-Couple vs Single-Parent Households in Annville
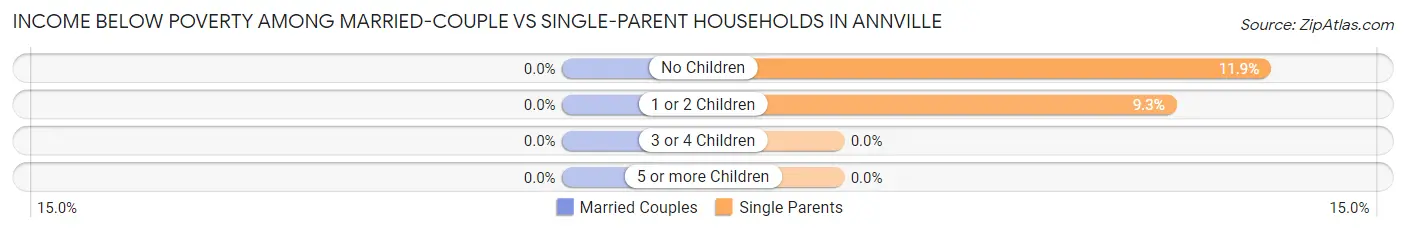
| Children | Married-Couple Families | Single-Parent Households |
| No Children | 0 (0.0%) | 8 (11.9%) |
| 1 or 2 Children | 0 (0.0%) | 4 (9.3%) |
| 3 or 4 Children | 0 (0.0%) | 0 (0.0%) |
| 5 or more Children | 0 (0.0%) | 0 (0.0%) |
| Total | 0 (0.0%) | 12 (9.2%) |
Race in Annville
The most populous races in Annville are White / Caucasian (4,303 | 89.1%), Hispanic or Latino (447 | 9.3%), and Some other Race (230 | 4.8%).
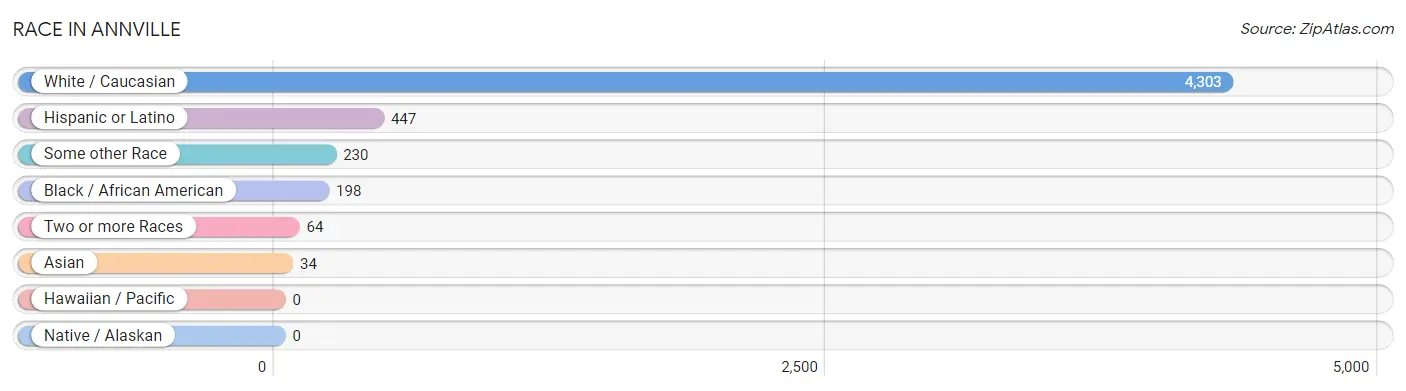
| Race | # Population | % Population |
| Asian | 34 | 0.7% |
| Black / African American | 198 | 4.1% |
| Hawaiian / Pacific | 0 | 0.0% |
| Hispanic or Latino | 447 | 9.3% |
| Native / Alaskan | 0 | 0.0% |
| White / Caucasian | 4,303 | 89.1% |
| Two or more Races | 64 | 1.3% |
| Some other Race | 230 | 4.8% |
| Total | 4,829 | 100.0% |
Ancestry in Annville
The most populous ancestries reported in Annville are German (1,447 | 30.0%), Italian (370 | 7.7%), Irish (301 | 6.2%), American (242 | 5.0%), and Polish (223 | 4.6%), together accounting for 53.5% of all Annville residents.
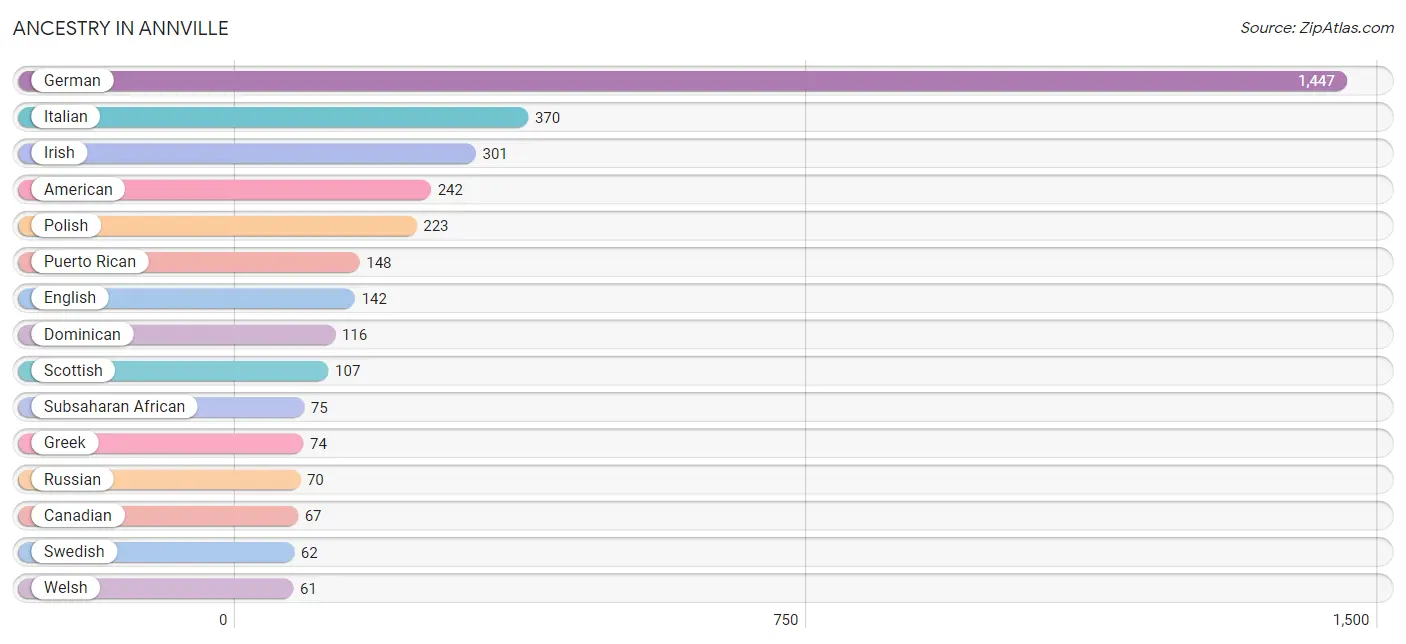
| Ancestry | # Population | % Population |
| African | 17 | 0.4% |
| American | 242 | 5.0% |
| Australian | 10 | 0.2% |
| British | 37 | 0.8% |
| Canadian | 67 | 1.4% |
| Central American | 59 | 1.2% |
| Costa Rican | 11 | 0.2% |
| Croatian | 42 | 0.9% |
| Cuban | 22 | 0.5% |
| Czech | 4 | 0.1% |
| Danish | 35 | 0.7% |
| Dominican | 116 | 2.4% |
| Dutch | 37 | 0.8% |
| Ecuadorian | 5 | 0.1% |
| English | 142 | 2.9% |
| European | 21 | 0.4% |
| French | 40 | 0.8% |
| German | 1,447 | 30.0% |
| Greek | 74 | 1.5% |
| Hungarian | 3 | 0.1% |
| Indian (Asian) | 7 | 0.1% |
| Indonesian | 17 | 0.4% |
| Irish | 301 | 6.2% |
| Italian | 370 | 7.7% |
| Kenyan | 6 | 0.1% |
| Lithuanian | 60 | 1.2% |
| Nigerian | 12 | 0.3% |
| Norwegian | 28 | 0.6% |
| Pakistani | 10 | 0.2% |
| Panamanian | 48 | 1.0% |
| Pennsylvania German | 13 | 0.3% |
| Polish | 223 | 4.6% |
| Puerto Rican | 148 | 3.1% |
| Russian | 70 | 1.5% |
| Scotch-Irish | 28 | 0.6% |
| Scottish | 107 | 2.2% |
| Slavic | 4 | 0.1% |
| South American | 5 | 0.1% |
| Subsaharan African | 75 | 1.5% |
| Swedish | 62 | 1.3% |
| Swiss | 11 | 0.2% |
| Welsh | 61 | 1.3% |
| West Indian | 15 | 0.3% | View All 43 Rows |
Immigrants in Annville
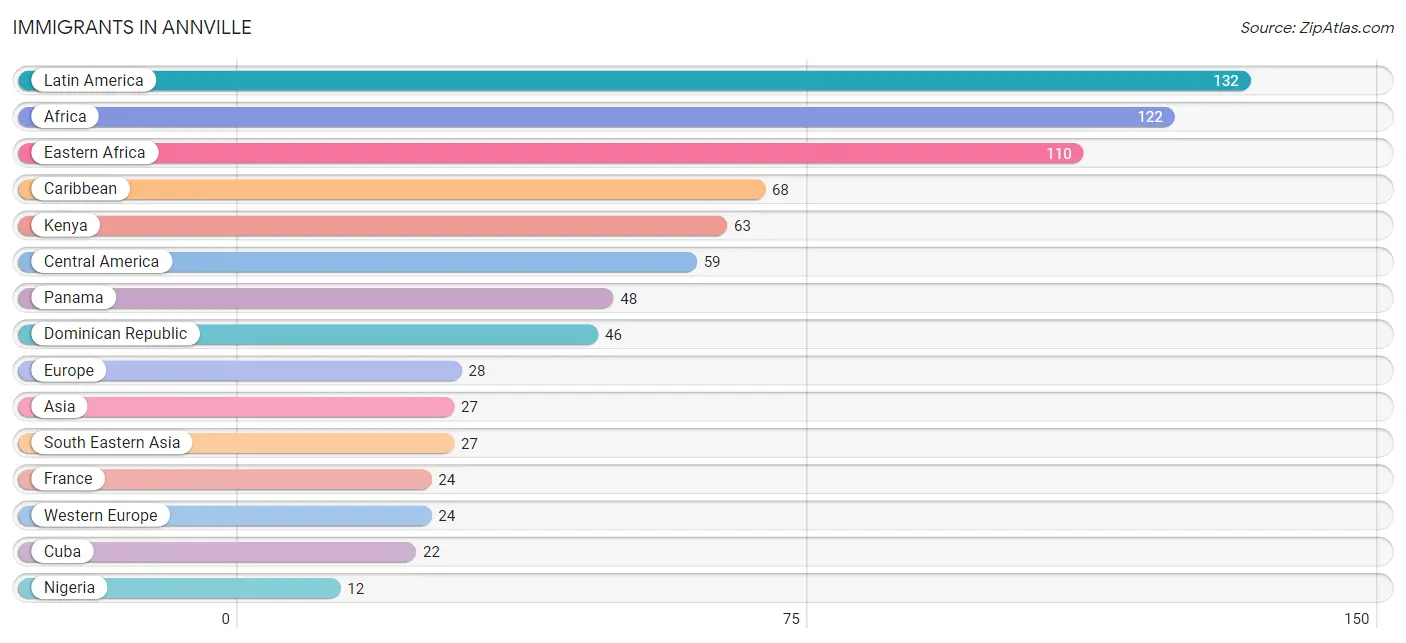
The most numerous immigrant groups reported in Annville came from Latin America (132 | 2.7%), Africa (122 | 2.5%), Eastern Africa (110 | 2.3%), Caribbean (68 | 1.4%), and Kenya (63 | 1.3%), together accounting for 10.2% of all Annville residents.
| Immigration Origin | # Population | % Population |
| Africa | 122 | 2.5% |
| Asia | 27 | 0.6% |
| Australia | 10 | 0.2% |
| Caribbean | 68 | 1.4% |
| Central America | 59 | 1.2% |
| Costa Rica | 11 | 0.2% |
| Cuba | 22 | 0.5% |
| Dominican Republic | 46 | 0.9% |
| Eastern Africa | 110 | 2.3% |
| Eastern Europe | 4 | 0.1% |
| Ecuador | 5 | 0.1% |
| Europe | 28 | 0.6% |
| France | 24 | 0.5% |
| Kenya | 63 | 1.3% |
| Latin America | 132 | 2.7% |
| Nigeria | 12 | 0.3% |
| Oceania | 10 | 0.2% |
| Panama | 48 | 1.0% |
| Russia | 4 | 0.1% |
| South America | 5 | 0.1% |
| South Eastern Asia | 27 | 0.6% |
| Thailand | 10 | 0.2% |
| Western Africa | 12 | 0.3% |
| Western Europe | 24 | 0.5% | View All 24 Rows |
Sex and Age in Annville
Sex and Age in Annville
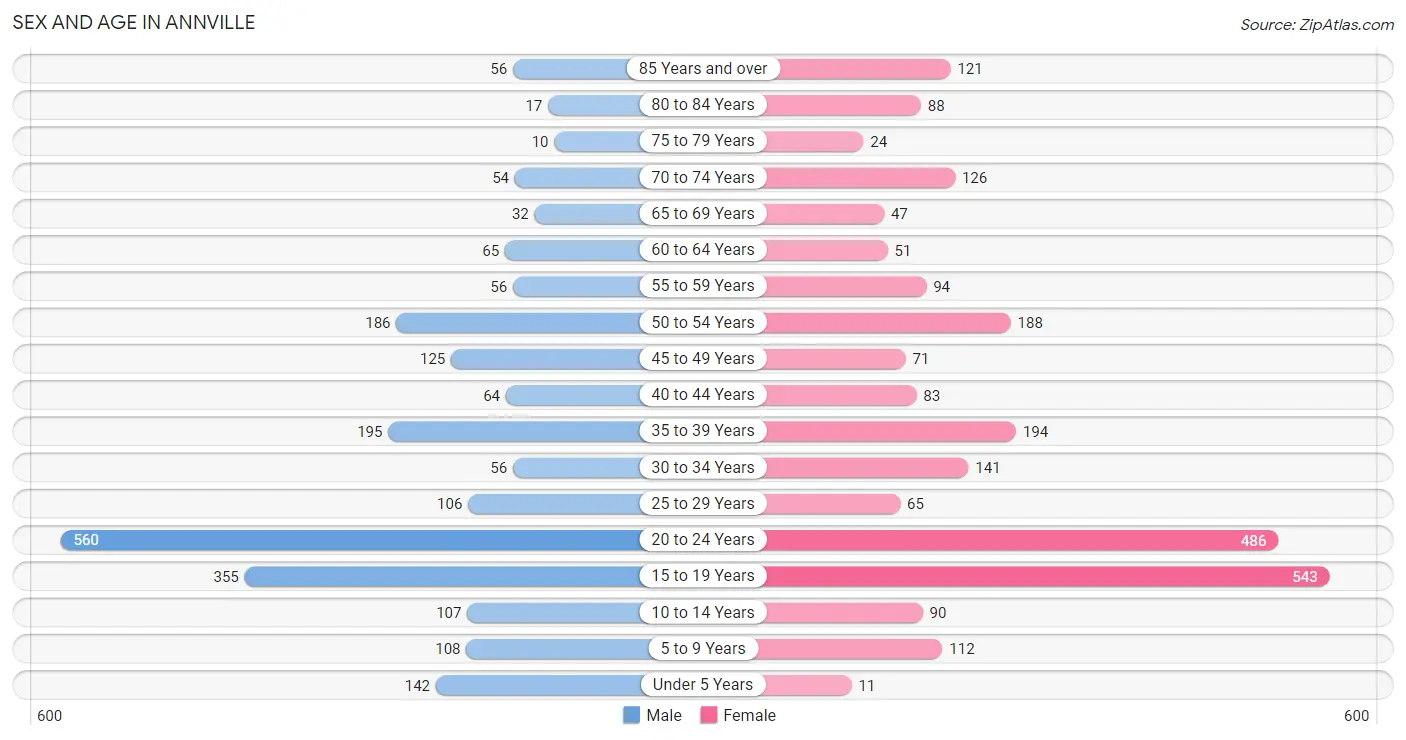
The most populous age groups in Annville are 20 to 24 Years (560 | 24.4%) for men and 15 to 19 Years (543 | 21.4%) for women.
| Age Bracket | Male | Female |
| Under 5 Years | 142 (6.2%) | 11 (0.4%) |
| 5 to 9 Years | 108 (4.7%) | 112 (4.4%) |
| 10 to 14 Years | 107 (4.7%) | 90 (3.5%) |
| 15 to 19 Years | 355 (15.5%) | 543 (21.4%) |
| 20 to 24 Years | 560 (24.4%) | 486 (19.2%) |
| 25 to 29 Years | 106 (4.6%) | 65 (2.6%) |
| 30 to 34 Years | 56 (2.4%) | 141 (5.6%) |
| 35 to 39 Years | 195 (8.5%) | 194 (7.6%) |
| 40 to 44 Years | 64 (2.8%) | 83 (3.3%) |
| 45 to 49 Years | 125 (5.4%) | 71 (2.8%) |
| 50 to 54 Years | 186 (8.1%) | 188 (7.4%) |
| 55 to 59 Years | 56 (2.4%) | 94 (3.7%) |
| 60 to 64 Years | 65 (2.8%) | 51 (2.0%) |
| 65 to 69 Years | 32 (1.4%) | 47 (1.8%) |
| 70 to 74 Years | 54 (2.4%) | 126 (5.0%) |
| 75 to 79 Years | 10 (0.4%) | 24 (0.9%) |
| 80 to 84 Years | 17 (0.7%) | 88 (3.5%) |
| 85 Years and over | 56 (2.4%) | 121 (4.8%) |
| Total | 2,294 (100.0%) | 2,535 (100.0%) |
Families and Households in Annville
Median Family Size in Annville
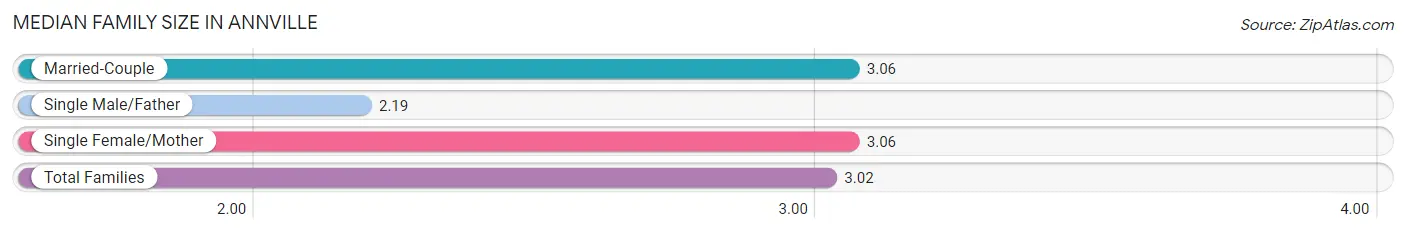
The median family size in Annville is 3.02 persons per family, with married-couple families (695 | 84.1%) accounting for the largest median family size of 3.06 persons per family. On the other hand, single male/father families (42 | 5.1%) represent the smallest median family size with 2.19 persons per family.
| Family Type | # Families | Family Size |
| Married-Couple | 695 (84.1%) | 3.06 |
| Single Male/Father | 42 (5.1%) | 2.19 |
| Single Female/Mother | 89 (10.8%) | 3.06 |
| Total Families | 826 (100.0%) | 3.02 |
Median Household Size in Annville
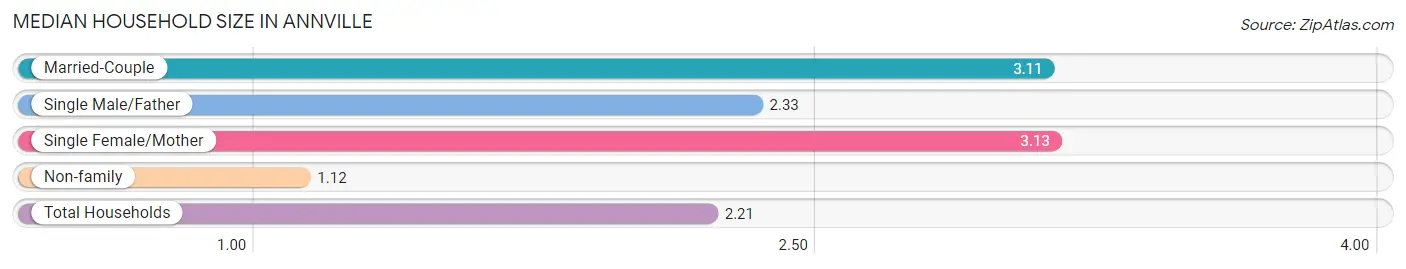
The median household size in Annville is 2.21 persons per household, with single female/mother households (89 | 6.0%) accounting for the largest median household size of 3.13 persons per household. non-family households (652 | 44.1%) represent the smallest median household size with 1.12 persons per household.
| Household Type | # Households | Household Size |
| Married-Couple | 695 (47.0%) | 3.11 |
| Single Male/Father | 42 (2.8%) | 2.33 |
| Single Female/Mother | 89 (6.0%) | 3.13 |
| Non-family | 652 (44.1%) | 1.12 |
| Total Households | 1,478 (100.0%) | 2.21 |
Household Size by Marriage Status in Annville
Out of a total of 1,478 households in Annville, 826 (55.9%) are family households, while 652 (44.1%) are nonfamily households. The most numerous type of family households are 2-person households, comprising 371, and the most common type of nonfamily households are 1-person households, comprising 599.
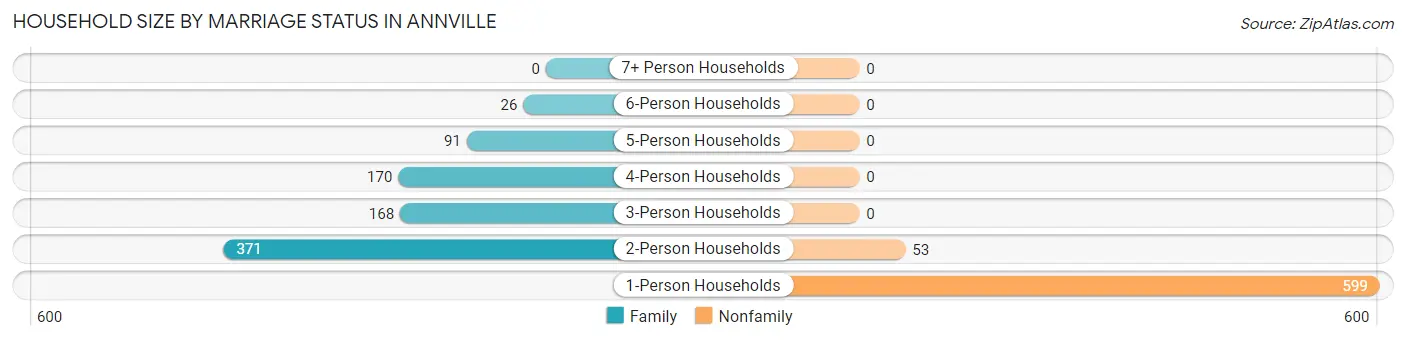
| Household Size | Family Households | Nonfamily Households |
| 1-Person Households | - | 599 (40.5%) |
| 2-Person Households | 371 (25.1%) | 53 (3.6%) |
| 3-Person Households | 168 (11.4%) | 0 (0.0%) |
| 4-Person Households | 170 (11.5%) | 0 (0.0%) |
| 5-Person Households | 91 (6.2%) | 0 (0.0%) |
| 6-Person Households | 26 (1.8%) | 0 (0.0%) |
| 7+ Person Households | 0 (0.0%) | 0 (0.0%) |
| Total | 826 (55.9%) | 652 (44.1%) |
Female Fertility in Annville
Fertility by Age in Annville
Average fertility rate in Annville is 7.0 births per 1,000 women. Women in the age bracket of 35 to 50 years have the highest fertility rate with 12.0 births per 1,000 women. Women in the age bracket of 20 to 34 years acount for 54.5% of all women with births.
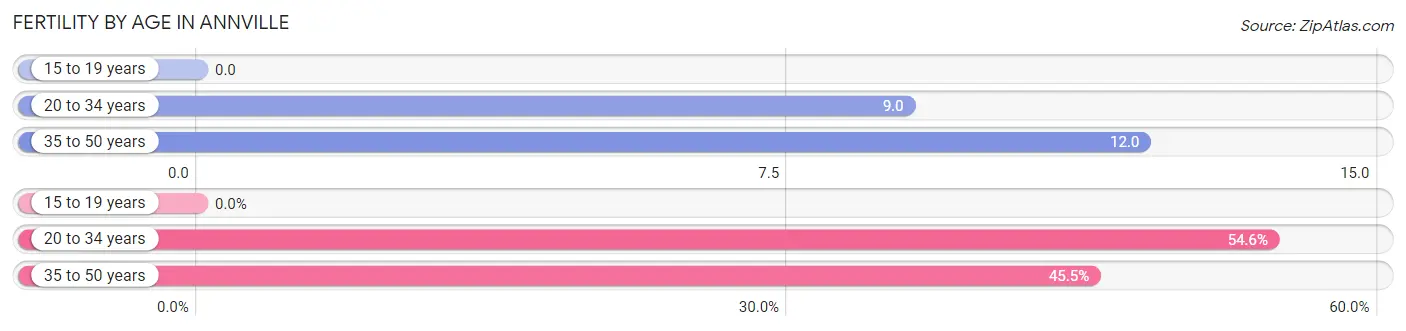
| Age Bracket | Women with Births | Births / 1,000 Women |
| 15 to 19 years | 0 (0.0%) | 0.0 |
| 20 to 34 years | 6 (54.5%) | 9.0 |
| 35 to 50 years | 5 (45.5%) | 12.0 |
| Total | 11 (100.0%) | 7.0 |
Fertility by Age by Marriage Status in Annville
45.5% of women with births (11) in Annville are married. The highest percentage of unmarried women with births falls into 20 to 34 years age bracket with 100.0% of them unmarried at the time of birth, while the lowest percentage of unmarried women with births belong to 35 to 50 years age bracket with 0.0% of them unmarried.
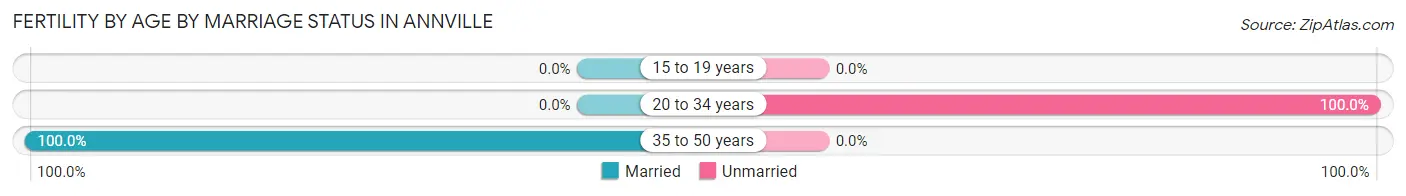
| Age Bracket | Married | Unmarried |
| 15 to 19 years | 0 (0.0%) | 0 (0.0%) |
| 20 to 34 years | 0 (0.0%) | 6 (100.0%) |
| 35 to 50 years | 5 (100.0%) | 0 (0.0%) |
| Total | 5 (45.5%) | 6 (54.5%) |
Fertility by Education in Annville
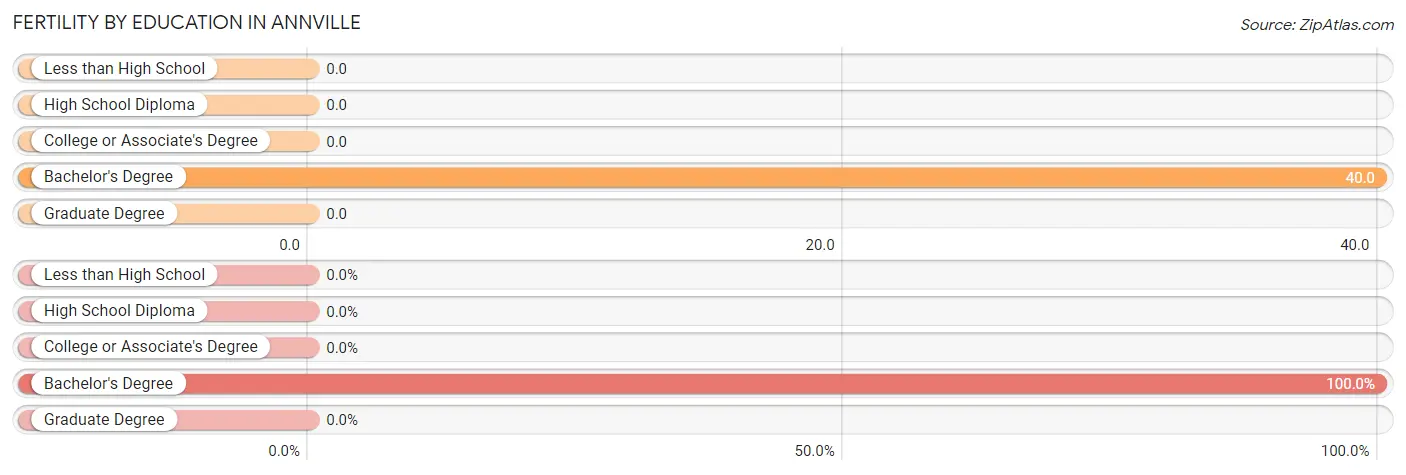
| Educational Attainment | Women with Births | Births / 1,000 Women |
| Less than High School | 0 (0.0%) | 0.0 |
| High School Diploma | 0 (0.0%) | 0.0 |
| College or Associate's Degree | 0 (0.0%) | 0.0 |
| Bachelor's Degree | 11 (100.0%) | 40.0 |
| Graduate Degree | 0 (0.0%) | 0.0 |
| Total | 11 (100.0%) | 7.0 |
Fertility by Education by Marriage Status in Annville
54.5% of women with births in Annville are unmarried. Women with the educational attainment of bachelor's degree are most likely to be married with 45.5% of them married at childbirth, while women with the educational attainment of bachelor's degree are least likely to be married with 54.5% of them unmarried at childbirth.
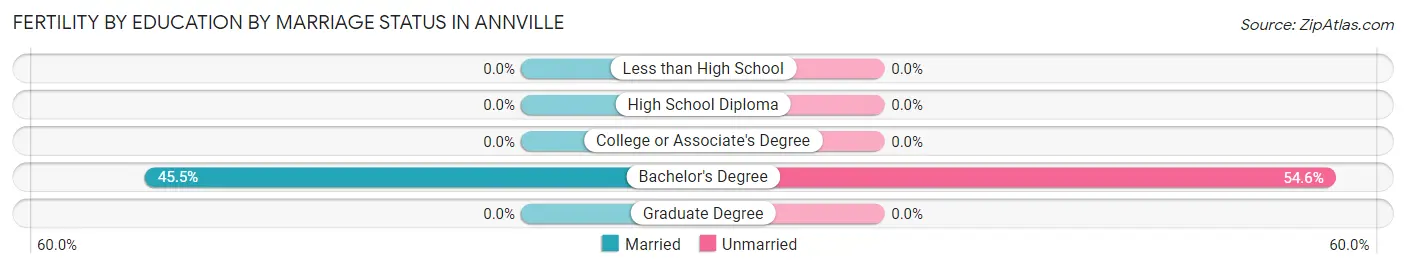
| Educational Attainment | Married | Unmarried |
| Less than High School | 0 (0.0%) | 0 (0.0%) |
| High School Diploma | 0 (0.0%) | 0 (0.0%) |
| College or Associate's Degree | 0 (0.0%) | 0 (0.0%) |
| Bachelor's Degree | 5 (45.5%) | 6 (54.5%) |
| Graduate Degree | 0 (0.0%) | 0 (0.0%) |
| Total | 5 (45.5%) | 6 (54.5%) |
Employment Characteristics in Annville
Employment by Class of Employer in Annville
Among the 2,529 employed individuals in Annville, private company employees (1,642 | 64.9%), not-for-profit organizations (550 | 21.7%), and local government employees (154 | 6.1%) make up the most common classes of employment.
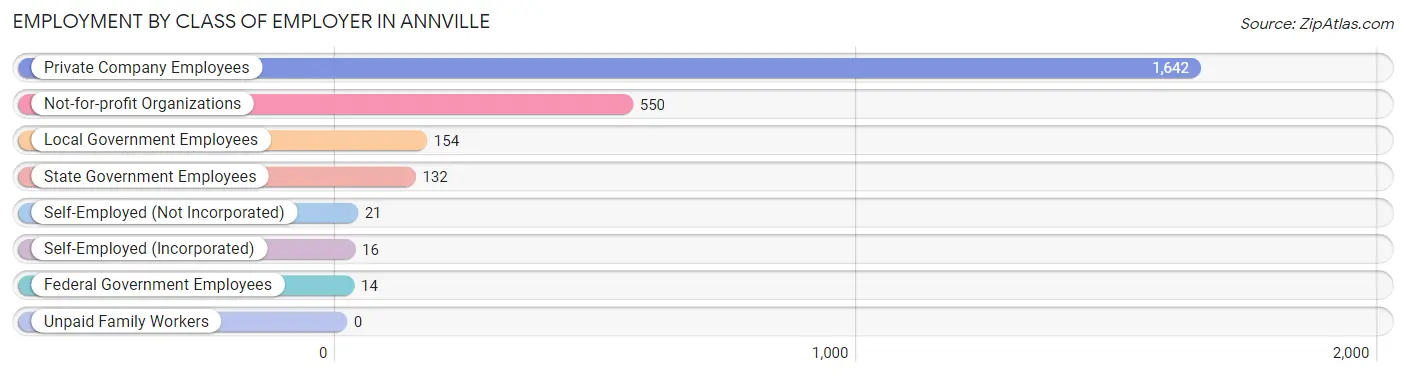
| Employer Class | # Employees | % Employees |
| Private Company Employees | 1,642 | 64.9% |
| Self-Employed (Incorporated) | 16 | 0.6% |
| Self-Employed (Not Incorporated) | 21 | 0.8% |
| Not-for-profit Organizations | 550 | 21.7% |
| Local Government Employees | 154 | 6.1% |
| State Government Employees | 132 | 5.2% |
| Federal Government Employees | 14 | 0.5% |
| Unpaid Family Workers | 0 | 0.0% |
| Total | 2,529 | 100.0% |
Employment Status by Age in Annville
According to the labor force statistics for Annville, out of the total population over 16 years of age (4,219), 64.6% or 2,725 individuals are in the labor force, with 5.3% or 144 of them unemployed. The age group with the highest labor force participation rate is 45 to 54 years, with 96.7% or 551 individuals in the labor force. Within the labor force, the 75 years and over age range has the highest percentage of unemployed individuals, with 56.3% or 9 of them being unemployed.
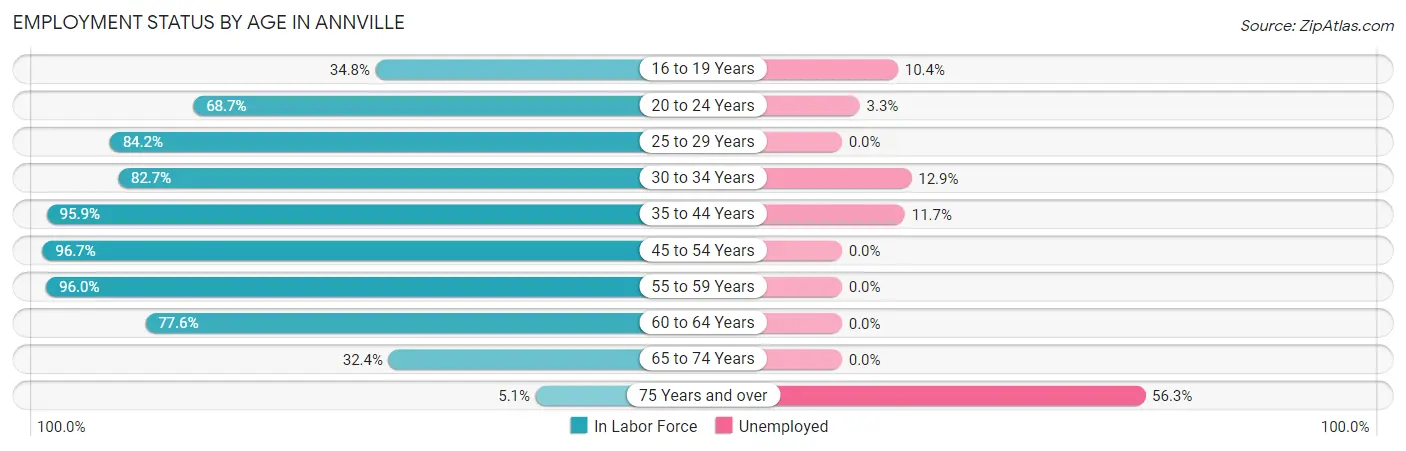
| Age Bracket | In Labor Force | Unemployed |
| 16 to 19 Years | 299 (34.8%) | 31 (10.4%) |
| 20 to 24 Years | 719 (68.7%) | 24 (3.3%) |
| 25 to 29 Years | 144 (84.2%) | 0 (0.0%) |
| 30 to 34 Years | 163 (82.7%) | 21 (12.9%) |
| 35 to 44 Years | 514 (95.9%) | 60 (11.7%) |
| 45 to 54 Years | 551 (96.7%) | 0 (0.0%) |
| 55 to 59 Years | 144 (96.0%) | 0 (0.0%) |
| 60 to 64 Years | 90 (77.6%) | 0 (0.0%) |
| 65 to 74 Years | 84 (32.4%) | 0 (0.0%) |
| 75 Years and over | 16 (5.1%) | 9 (56.3%) |
| Total | 2,725 (64.6%) | 144 (5.3%) |
Employment Status by Educational Attainment in Annville
According to labor force statistics for Annville, 92.3% of individuals (1,606) out of the total population between 25 and 64 years of age (1,740) are in the labor force, with 5.0% or 80 of them being unemployed. The group with the highest labor force participation rate are those with the educational attainment of less than high school, with 92.9% or 52 individuals in the labor force. Within the labor force, individuals with bachelor's degree or higher education have the highest percentage of unemployment, with 7.0% or 46 of them being unemployed.
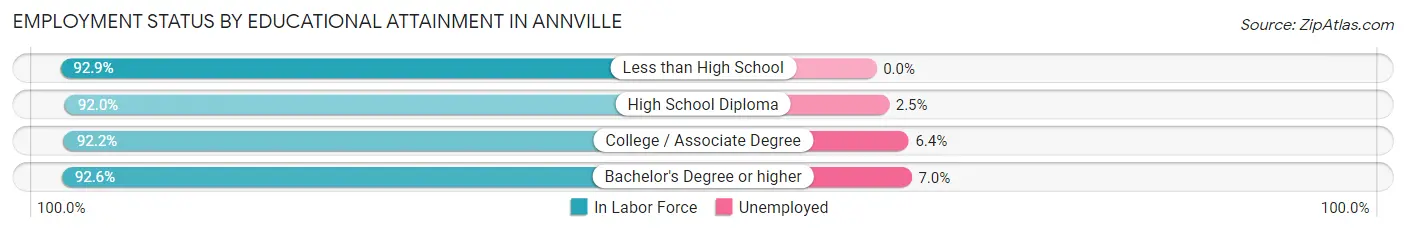
| Educational Attainment | In Labor Force | Unemployed |
| Less than High School | 52 (92.9%) | 0 (0.0%) |
| High School Diploma | 566 (92.0%) | 15 (2.5%) |
| College / Associate Degree | 329 (92.2%) | 23 (6.4%) |
| Bachelor's Degree or higher | 659 (92.6%) | 50 (7.0%) |
| Total | 1,606 (92.3%) | 87 (5.0%) |
Employment Occupations by Sex in Annville
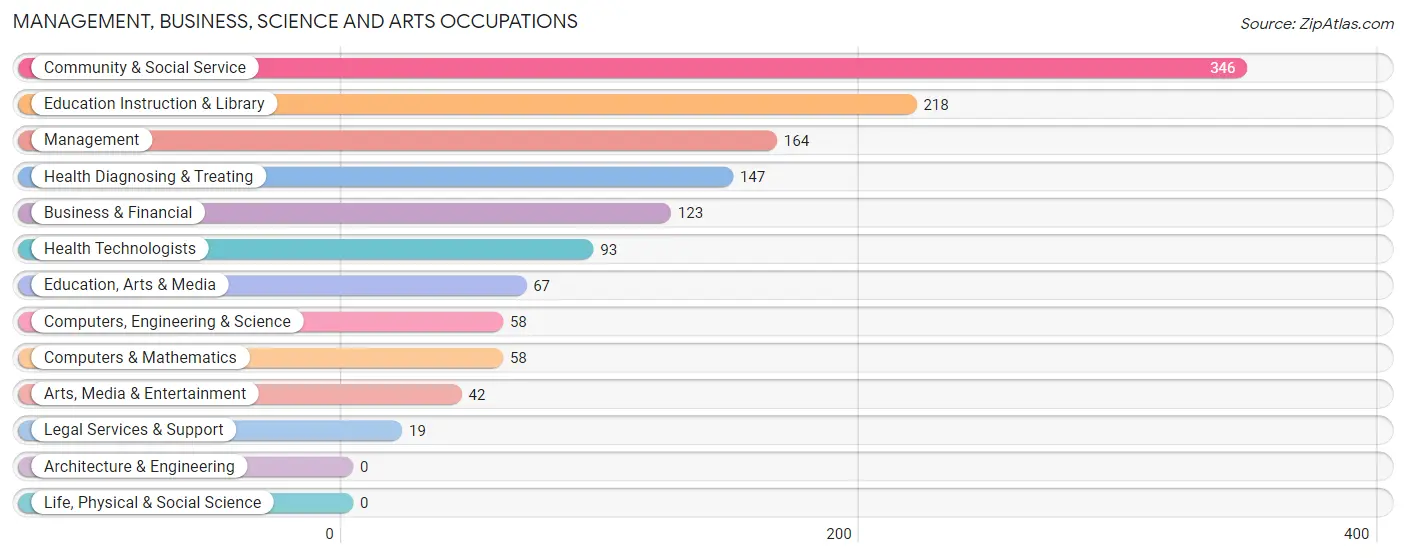
Management, Business, Science and Arts Occupations
The most common Management, Business, Science and Arts occupations in Annville are Community & Social Service (346 | 13.4%), Education Instruction & Library (218 | 8.5%), Management (164 | 6.4%), Health Diagnosing & Treating (147 | 5.7%), and Business & Financial (123 | 4.8%).
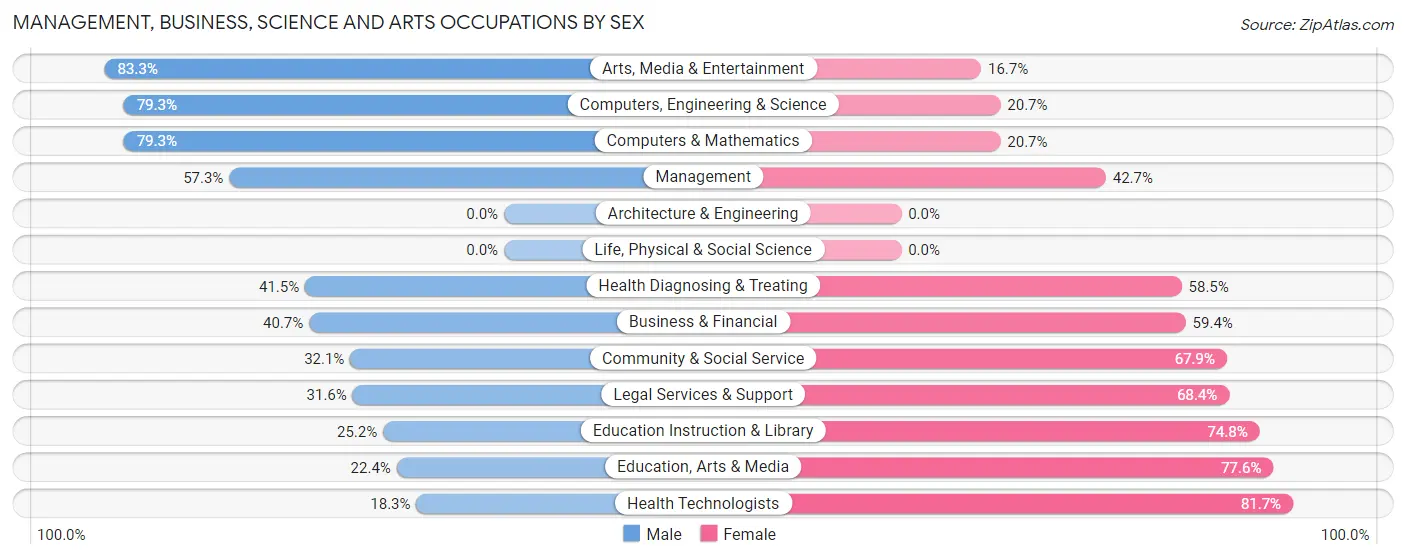
Management, Business, Science and Arts Occupations by Sex
Within the Management, Business, Science and Arts occupations in Annville, the most male-oriented occupations are Arts, Media & Entertainment (83.3%), Computers, Engineering & Science (79.3%), and Computers & Mathematics (79.3%), while the most female-oriented occupations are Health Technologists (81.7%), Education, Arts & Media (77.6%), and Education Instruction & Library (74.8%).
| Occupation | Male | Female |
| Management | 94 (57.3%) | 70 (42.7%) |
| Business & Financial | 50 (40.6%) | 73 (59.4%) |
| Computers, Engineering & Science | 46 (79.3%) | 12 (20.7%) |
| Computers & Mathematics | 46 (79.3%) | 12 (20.7%) |
| Architecture & Engineering | 0 (0.0%) | 0 (0.0%) |
| Life, Physical & Social Science | 0 (0.0%) | 0 (0.0%) |
| Community & Social Service | 111 (32.1%) | 235 (67.9%) |
| Education, Arts & Media | 15 (22.4%) | 52 (77.6%) |
| Legal Services & Support | 6 (31.6%) | 13 (68.4%) |
| Education Instruction & Library | 55 (25.2%) | 163 (74.8%) |
| Arts, Media & Entertainment | 35 (83.3%) | 7 (16.7%) |
| Health Diagnosing & Treating | 61 (41.5%) | 86 (58.5%) |
| Health Technologists | 17 (18.3%) | 76 (81.7%) |
| Total (Category) | 362 (43.2%) | 476 (56.8%) |
| Total (Overall) | 1,340 (52.0%) | 1,239 (48.0%) |
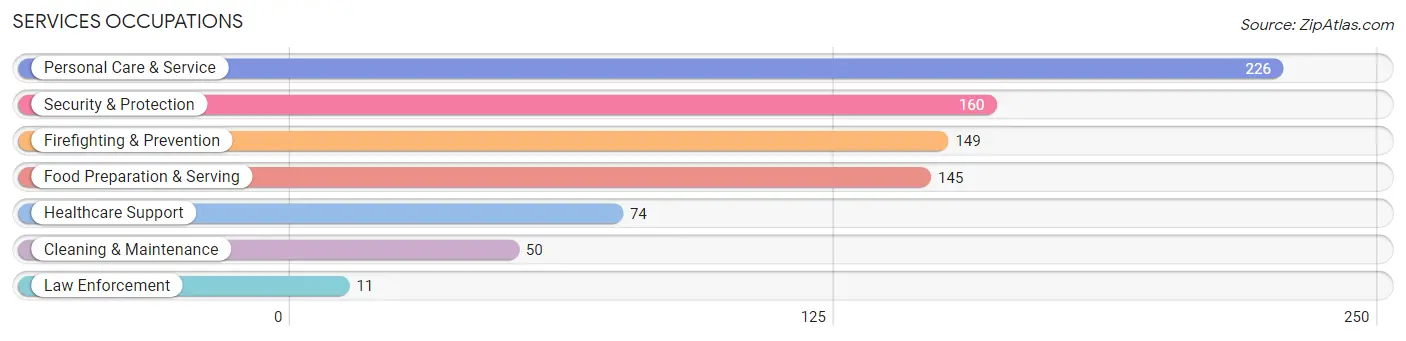
Services Occupations
The most common Services occupations in Annville are Personal Care & Service (226 | 8.8%), Security & Protection (160 | 6.2%), Firefighting & Prevention (149 | 5.8%), Food Preparation & Serving (145 | 5.6%), and Healthcare Support (74 | 2.9%).
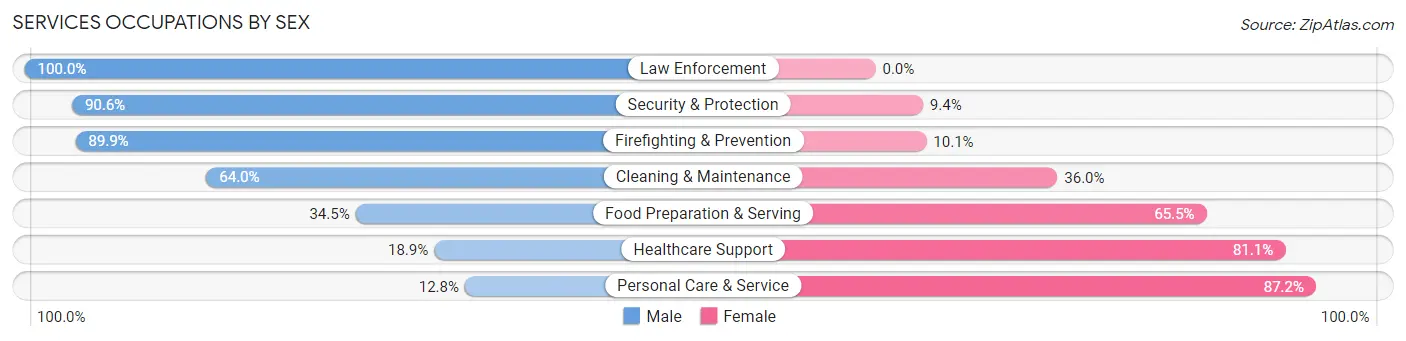
Services Occupations by Sex
Within the Services occupations in Annville, the most male-oriented occupations are Law Enforcement (100.0%), Security & Protection (90.6%), and Firefighting & Prevention (89.9%), while the most female-oriented occupations are Personal Care & Service (87.2%), Healthcare Support (81.1%), and Food Preparation & Serving (65.5%).
| Occupation | Male | Female |
| Healthcare Support | 14 (18.9%) | 60 (81.1%) |
| Security & Protection | 145 (90.6%) | 15 (9.4%) |
| Firefighting & Prevention | 134 (89.9%) | 15 (10.1%) |
| Law Enforcement | 11 (100.0%) | 0 (0.0%) |
| Food Preparation & Serving | 50 (34.5%) | 95 (65.5%) |
| Cleaning & Maintenance | 32 (64.0%) | 18 (36.0%) |
| Personal Care & Service | 29 (12.8%) | 197 (87.2%) |
| Total (Category) | 270 (41.2%) | 385 (58.8%) |
| Total (Overall) | 1,340 (52.0%) | 1,239 (48.0%) |
Sales and Office Occupations
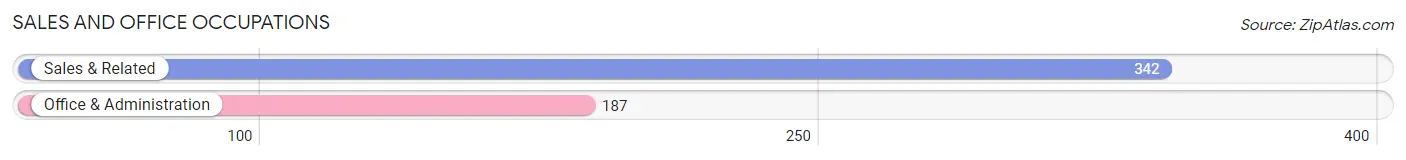
The most common Sales and Office occupations in Annville are Sales & Related (342 | 13.3%), and Office & Administration (187 | 7.2%).
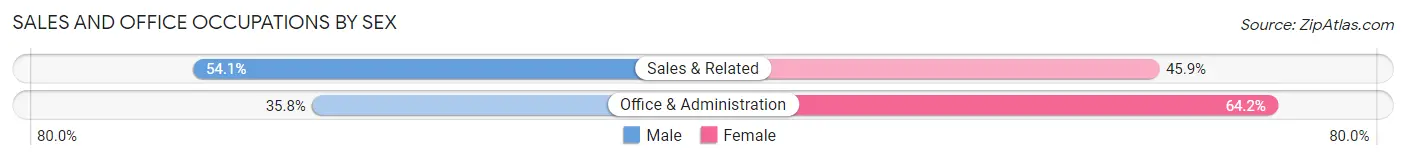
Sales and Office Occupations by Sex
| Occupation | Male | Female |
| Sales & Related | 185 (54.1%) | 157 (45.9%) |
| Office & Administration | 67 (35.8%) | 120 (64.2%) |
| Total (Category) | 252 (47.6%) | 277 (52.4%) |
| Total (Overall) | 1,340 (52.0%) | 1,239 (48.0%) |
Natural Resources, Construction and Maintenance Occupations
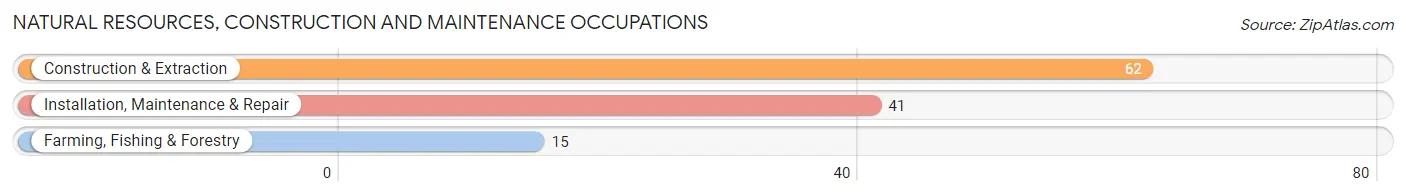
The most common Natural Resources, Construction and Maintenance occupations in Annville are Construction & Extraction (62 | 2.4%), Installation, Maintenance & Repair (41 | 1.6%), and Farming, Fishing & Forestry (15 | 0.6%).
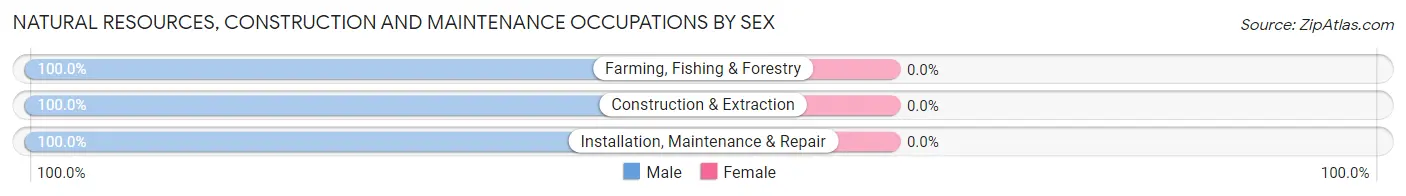
Natural Resources, Construction and Maintenance Occupations by Sex
| Occupation | Male | Female |
| Farming, Fishing & Forestry | 15 (100.0%) | 0 (0.0%) |
| Construction & Extraction | 62 (100.0%) | 0 (0.0%) |
| Installation, Maintenance & Repair | 41 (100.0%) | 0 (0.0%) |
| Total (Category) | 118 (100.0%) | 0 (0.0%) |
| Total (Overall) | 1,340 (52.0%) | 1,239 (48.0%) |
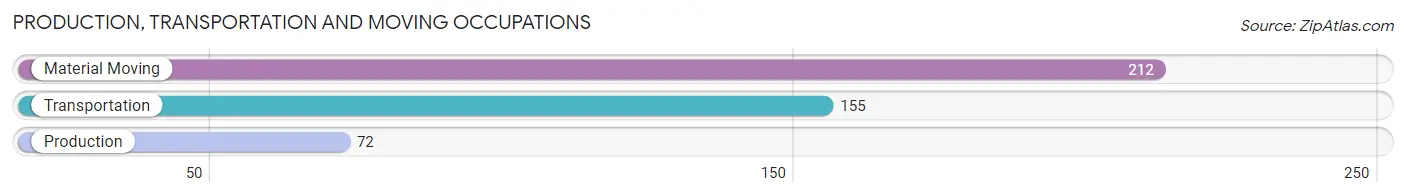
Production, Transportation and Moving Occupations
The most common Production, Transportation and Moving occupations in Annville are Material Moving (212 | 8.2%), Transportation (155 | 6.0%), and Production (72 | 2.8%).
Production, Transportation and Moving Occupations by Sex
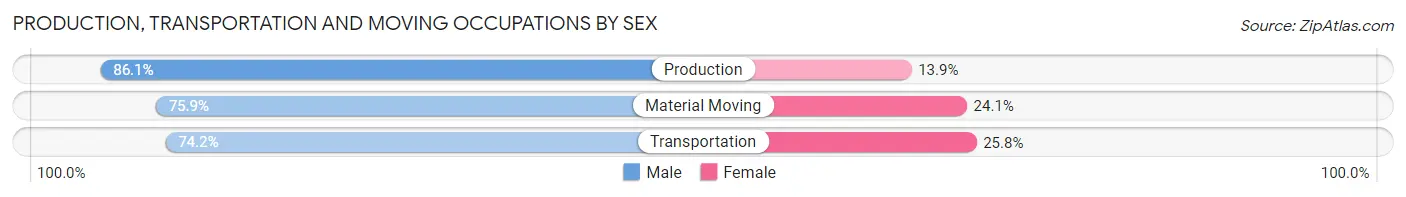
| Occupation | Male | Female |
| Production | 62 (86.1%) | 10 (13.9%) |
| Transportation | 115 (74.2%) | 40 (25.8%) |
| Material Moving | 161 (75.9%) | 51 (24.1%) |
| Total (Category) | 338 (77.0%) | 101 (23.0%) |
| Total (Overall) | 1,340 (52.0%) | 1,239 (48.0%) |
Employment Industries by Sex in Annville
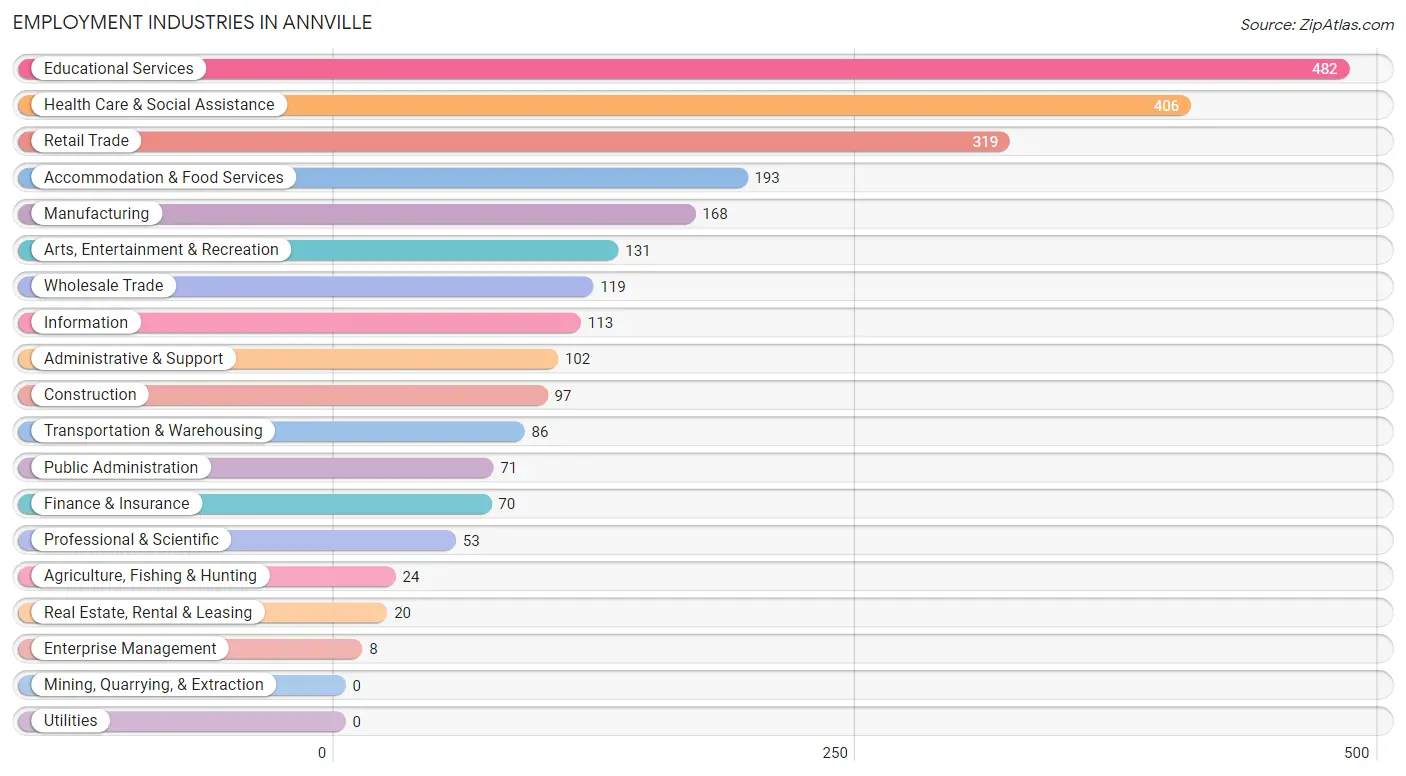
Employment Industries in Annville
The major employment industries in Annville include Educational Services (482 | 18.7%), Health Care & Social Assistance (406 | 15.7%), Retail Trade (319 | 12.4%), Accommodation & Food Services (193 | 7.5%), and Manufacturing (168 | 6.5%).
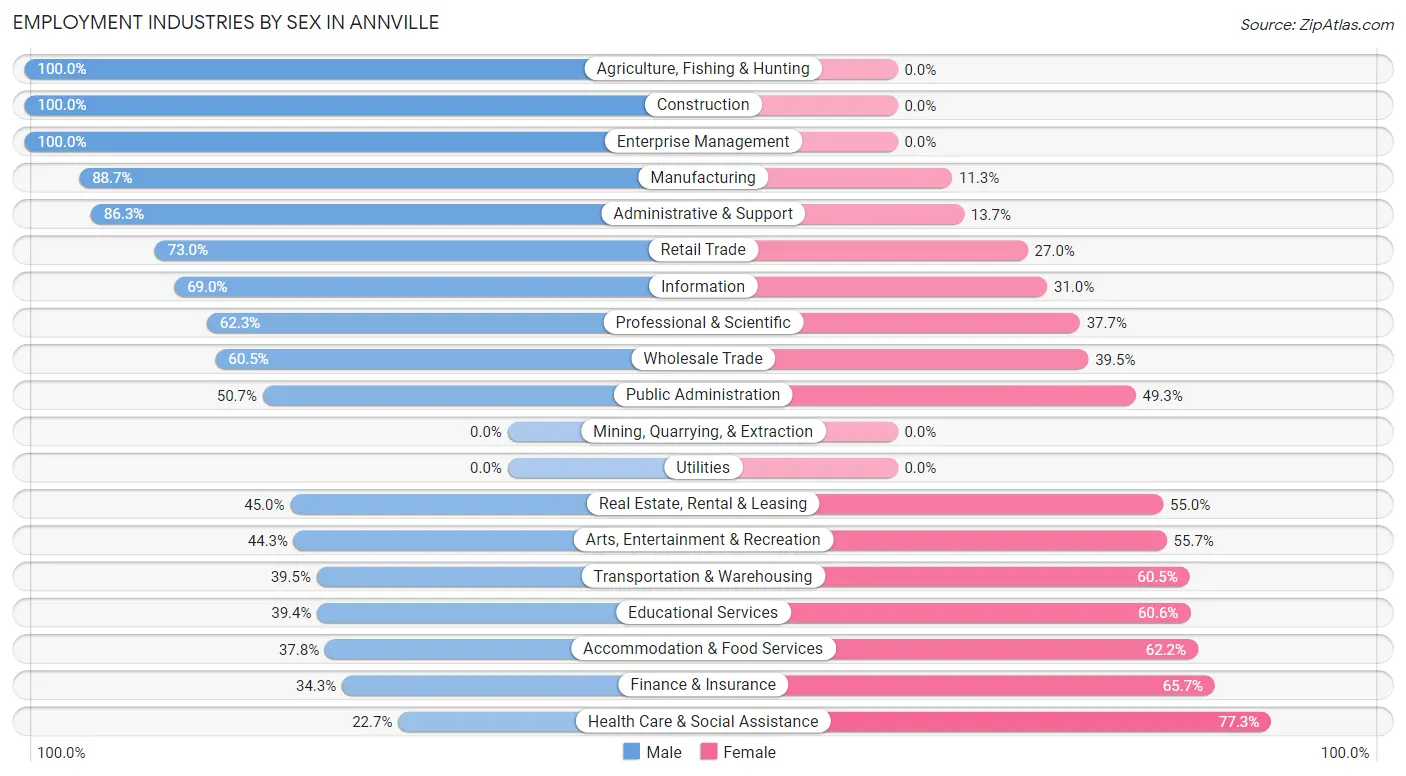
Employment Industries by Sex in Annville
The Annville industries that see more men than women are Agriculture, Fishing & Hunting (100.0%), Construction (100.0%), and Enterprise Management (100.0%), whereas the industries that tend to have a higher number of women are Health Care & Social Assistance (77.3%), Finance & Insurance (65.7%), and Accommodation & Food Services (62.2%).
| Industry | Male | Female |
| Agriculture, Fishing & Hunting | 24 (100.0%) | 0 (0.0%) |
| Mining, Quarrying, & Extraction | 0 (0.0%) | 0 (0.0%) |
| Construction | 97 (100.0%) | 0 (0.0%) |
| Manufacturing | 149 (88.7%) | 19 (11.3%) |
| Wholesale Trade | 72 (60.5%) | 47 (39.5%) |
| Retail Trade | 233 (73.0%) | 86 (27.0%) |
| Transportation & Warehousing | 34 (39.5%) | 52 (60.5%) |
| Utilities | 0 (0.0%) | 0 (0.0%) |
| Information | 78 (69.0%) | 35 (31.0%) |
| Finance & Insurance | 24 (34.3%) | 46 (65.7%) |
| Real Estate, Rental & Leasing | 9 (45.0%) | 11 (55.0%) |
| Professional & Scientific | 33 (62.3%) | 20 (37.7%) |
| Enterprise Management | 8 (100.0%) | 0 (0.0%) |
| Administrative & Support | 88 (86.3%) | 14 (13.7%) |
| Educational Services | 190 (39.4%) | 292 (60.6%) |
| Health Care & Social Assistance | 92 (22.7%) | 314 (77.3%) |
| Arts, Entertainment & Recreation | 58 (44.3%) | 73 (55.7%) |
| Accommodation & Food Services | 73 (37.8%) | 120 (62.2%) |
| Public Administration | 36 (50.7%) | 35 (49.3%) |
| Total | 1,340 (52.0%) | 1,239 (48.0%) |
Education in Annville
School Enrollment in Annville
The most common levels of schooling among the 2,266 students in Annville are college / undergraduate (1,668 | 73.6%), middle school (184 | 8.1%), and elementary school (154 | 6.8%).
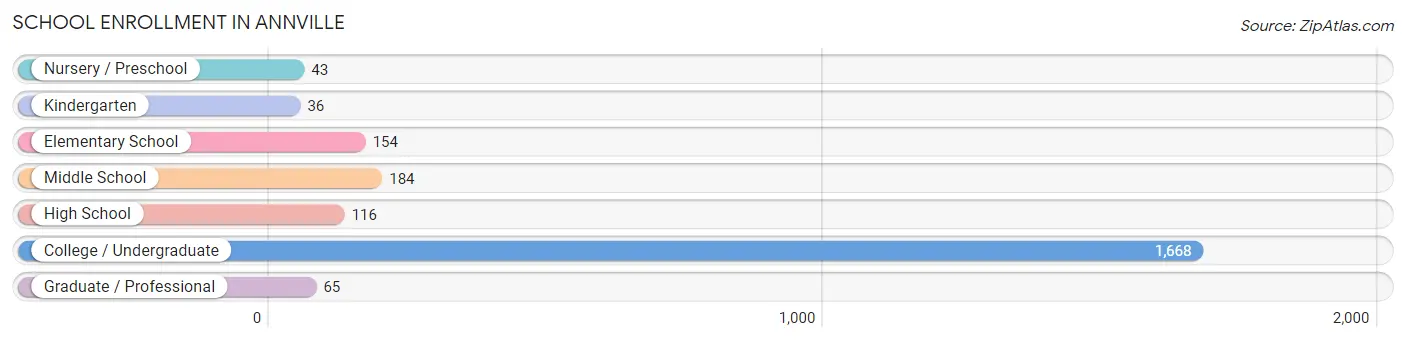
| School Level | # Students | % Students |
| Nursery / Preschool | 43 | 1.9% |
| Kindergarten | 36 | 1.6% |
| Elementary School | 154 | 6.8% |
| Middle School | 184 | 8.1% |
| High School | 116 | 5.1% |
| College / Undergraduate | 1,668 | 73.6% |
| Graduate / Professional | 65 | 2.9% |
| Total | 2,266 | 100.0% |
School Enrollment by Age by Funding Source in Annville
Out of a total of 2,266 students who are enrolled in schools in Annville, 1,727 (76.2%) attend a private institution, while the remaining 539 (23.8%) are enrolled in public schools. The age group of 3 to 4 year olds has the highest likelihood of being enrolled in private schools, with 52 (100.0% in the age bracket) enrolled. Conversely, the age group of 5 to 9 year old has the lowest likelihood of being enrolled in a private school, with 173 (100.0% in the age bracket) attending a public institution.
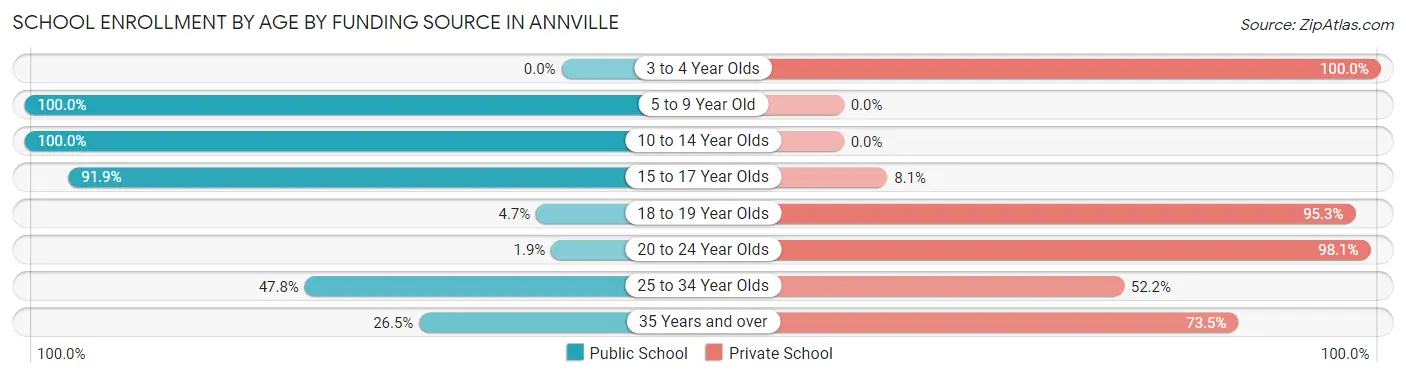
| Age Bracket | Public School | Private School |
| 3 to 4 Year Olds | 0 (0.0%) | 52 (100.0%) |
| 5 to 9 Year Old | 173 (100.0%) | 0 (0.0%) |
| 10 to 14 Year Olds | 192 (100.0%) | 0 (0.0%) |
| 15 to 17 Year Olds | 79 (91.9%) | 7 (8.1%) |
| 18 to 19 Year Olds | 37 (4.7%) | 747 (95.3%) |
| 20 to 24 Year Olds | 16 (1.9%) | 823 (98.1%) |
| 25 to 34 Year Olds | 11 (47.8%) | 12 (52.2%) |
| 35 Years and over | 31 (26.5%) | 86 (73.5%) |
| Total | 539 (23.8%) | 1,727 (76.2%) |
Educational Attainment by Field of Study in Annville
Education (238 | 27.0%), business (117 | 13.3%), social sciences (92 | 10.4%), arts & humanities (72 | 8.2%), and psychology (71 | 8.0%) are the most common fields of study among 883 individuals in Annville who have obtained a bachelor's degree or higher.
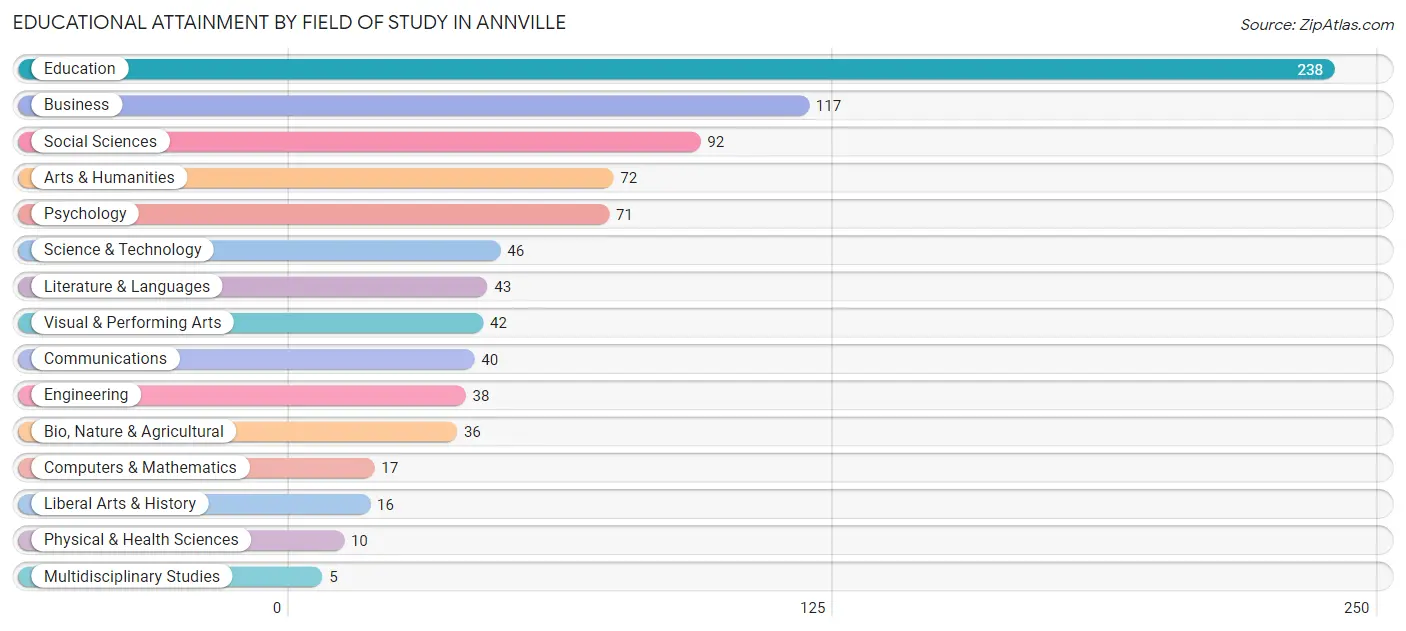
| Field of Study | # Graduates | % Graduates |
| Computers & Mathematics | 17 | 1.9% |
| Bio, Nature & Agricultural | 36 | 4.1% |
| Physical & Health Sciences | 10 | 1.1% |
| Psychology | 71 | 8.0% |
| Social Sciences | 92 | 10.4% |
| Engineering | 38 | 4.3% |
| Multidisciplinary Studies | 5 | 0.6% |
| Science & Technology | 46 | 5.2% |
| Business | 117 | 13.3% |
| Education | 238 | 27.0% |
| Literature & Languages | 43 | 4.9% |
| Liberal Arts & History | 16 | 1.8% |
| Visual & Performing Arts | 42 | 4.8% |
| Communications | 40 | 4.5% |
| Arts & Humanities | 72 | 8.2% |
| Total | 883 | 100.0% |
Transportation & Commute in Annville
Vehicle Availability by Sex in Annville
The most prevalent vehicle ownership categories in Annville are males with 2 vehicles (471, accounting for 48.1%) and females with 2 vehicles (475, making up 51.5%).
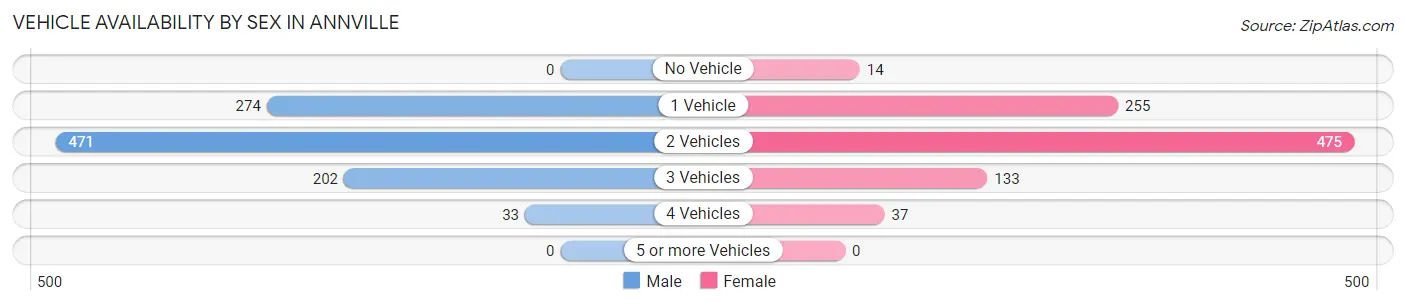
| Vehicles Available | Male | Female |
| No Vehicle | 0 (0.0%) | 14 (1.5%) |
| 1 Vehicle | 274 (28.0%) | 255 (27.9%) |
| 2 Vehicles | 471 (48.1%) | 475 (52.0%) |
| 3 Vehicles | 202 (20.6%) | 133 (14.5%) |
| 4 Vehicles | 33 (3.4%) | 37 (4.1%) |
| 5 or more Vehicles | 0 (0.0%) | 0 (0.0%) |
| Total | 980 (100.0%) | 914 (100.0%) |
Commute Time in Annville
The most frequently occuring commute durations in Annville are 5 to 9 minutes (410 commuters, 17.3%), 10 to 14 minutes (360 commuters, 15.2%), and 15 to 19 minutes (312 commuters, 13.2%).

| Commute Time | # Commuters | % Commuters |
| Less than 5 Minutes | 103 | 4.4% |
| 5 to 9 Minutes | 410 | 17.3% |
| 10 to 14 Minutes | 360 | 15.2% |
| 15 to 19 Minutes | 312 | 13.2% |
| 20 to 24 Minutes | 310 | 13.1% |
| 25 to 29 Minutes | 90 | 3.8% |
| 30 to 34 Minutes | 247 | 10.4% |
| 35 to 39 Minutes | 80 | 3.4% |
| 40 to 44 Minutes | 264 | 11.2% |
| 45 to 59 Minutes | 150 | 6.3% |
| 60 to 89 Minutes | 32 | 1.3% |
| 90 or more Minutes | 7 | 0.3% |
Commute Time by Sex in Annville
The most common commute times in Annville are 5 to 9 minutes (232 commuters, 18.6%) for males and 10 to 14 minutes (179 commuters, 16.0%) for females.
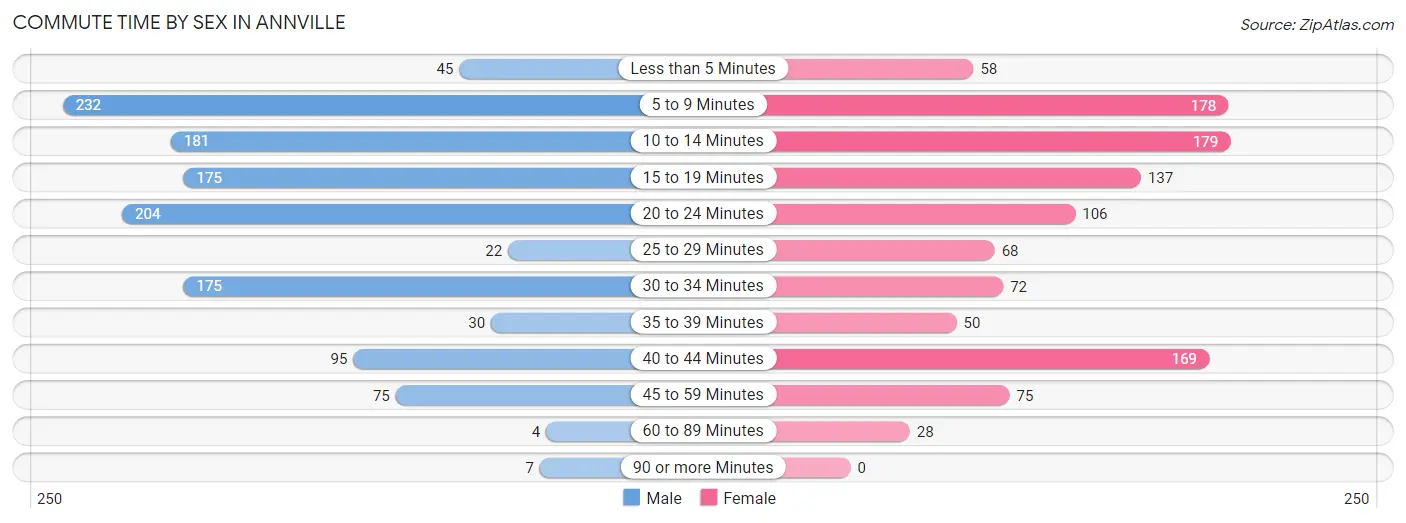
| Commute Time | Male | Female |
| Less than 5 Minutes | 45 (3.6%) | 58 (5.2%) |
| 5 to 9 Minutes | 232 (18.6%) | 178 (15.9%) |
| 10 to 14 Minutes | 181 (14.5%) | 179 (16.0%) |
| 15 to 19 Minutes | 175 (14.1%) | 137 (12.2%) |
| 20 to 24 Minutes | 204 (16.4%) | 106 (9.5%) |
| 25 to 29 Minutes | 22 (1.8%) | 68 (6.1%) |
| 30 to 34 Minutes | 175 (14.1%) | 72 (6.4%) |
| 35 to 39 Minutes | 30 (2.4%) | 50 (4.5%) |
| 40 to 44 Minutes | 95 (7.6%) | 169 (15.1%) |
| 45 to 59 Minutes | 75 (6.0%) | 75 (6.7%) |
| 60 to 89 Minutes | 4 (0.3%) | 28 (2.5%) |
| 90 or more Minutes | 7 (0.6%) | 0 (0.0%) |
Time of Departure to Work by Sex in Annville
The most frequent times of departure to work in Annville are 12:00 PM to 3:59 PM (180, 14.5%) for males and 6:00 AM to 6:29 AM (151, 13.5%) for females.
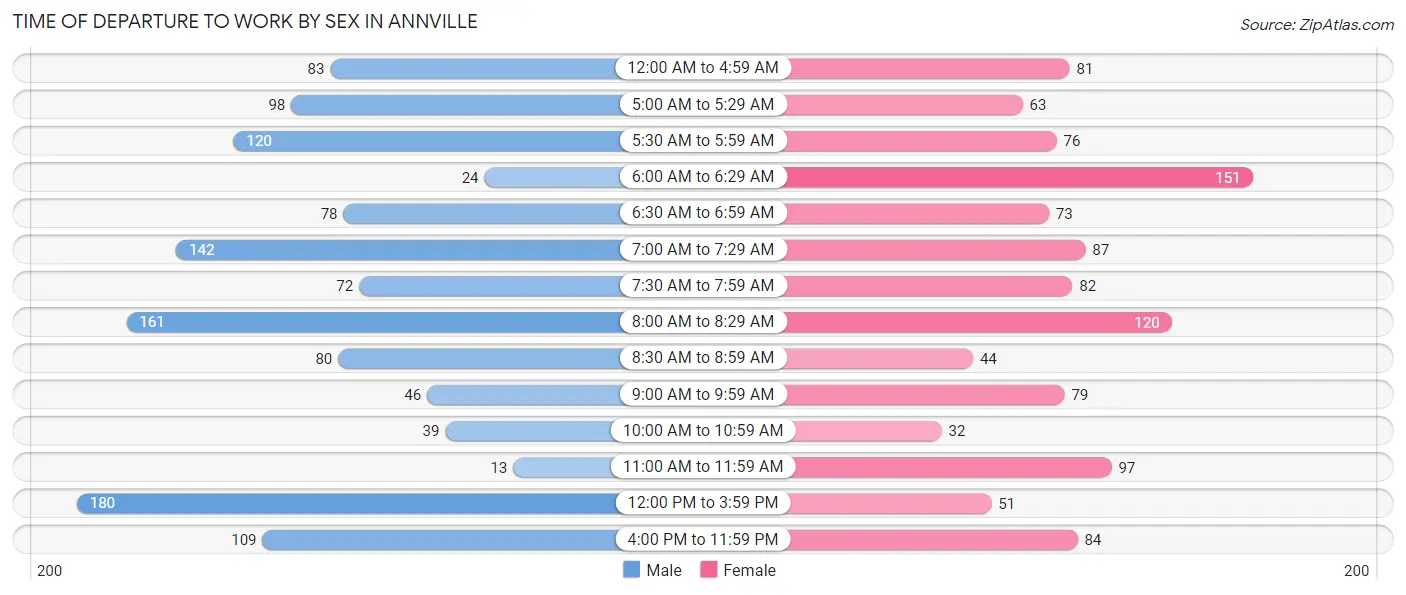
| Time of Departure | Male | Female |
| 12:00 AM to 4:59 AM | 83 (6.7%) | 81 (7.2%) |
| 5:00 AM to 5:29 AM | 98 (7.9%) | 63 (5.6%) |
| 5:30 AM to 5:59 AM | 120 (9.6%) | 76 (6.8%) |
| 6:00 AM to 6:29 AM | 24 (1.9%) | 151 (13.5%) |
| 6:30 AM to 6:59 AM | 78 (6.3%) | 73 (6.5%) |
| 7:00 AM to 7:29 AM | 142 (11.4%) | 87 (7.8%) |
| 7:30 AM to 7:59 AM | 72 (5.8%) | 82 (7.3%) |
| 8:00 AM to 8:29 AM | 161 (12.9%) | 120 (10.7%) |
| 8:30 AM to 8:59 AM | 80 (6.4%) | 44 (3.9%) |
| 9:00 AM to 9:59 AM | 46 (3.7%) | 79 (7.0%) |
| 10:00 AM to 10:59 AM | 39 (3.1%) | 32 (2.9%) |
| 11:00 AM to 11:59 AM | 13 (1.0%) | 97 (8.7%) |
| 12:00 PM to 3:59 PM | 180 (14.5%) | 51 (4.5%) |
| 4:00 PM to 11:59 PM | 109 (8.8%) | 84 (7.5%) |
| Total | 1,245 (100.0%) | 1,120 (100.0%) |
Housing Occupancy in Annville
Occupancy by Ownership in Annville
Of the total 1,478 dwellings in Annville, owner-occupied units account for 873 (59.1%), while renter-occupied units make up 605 (40.9%).
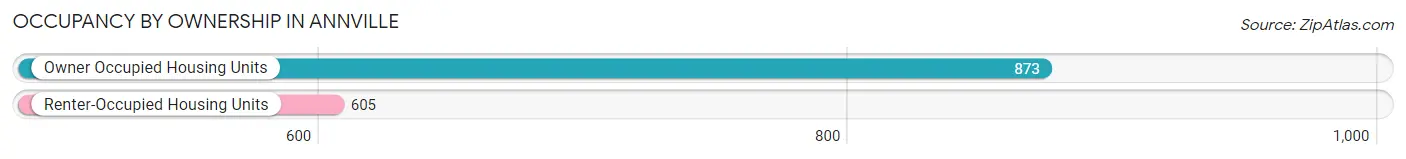
| Occupancy | # Housing Units | % Housing Units |
| Owner Occupied Housing Units | 873 | 59.1% |
| Renter-Occupied Housing Units | 605 | 40.9% |
| Total Occupied Housing Units | 1,478 | 100.0% |
Occupancy by Household Size in Annville
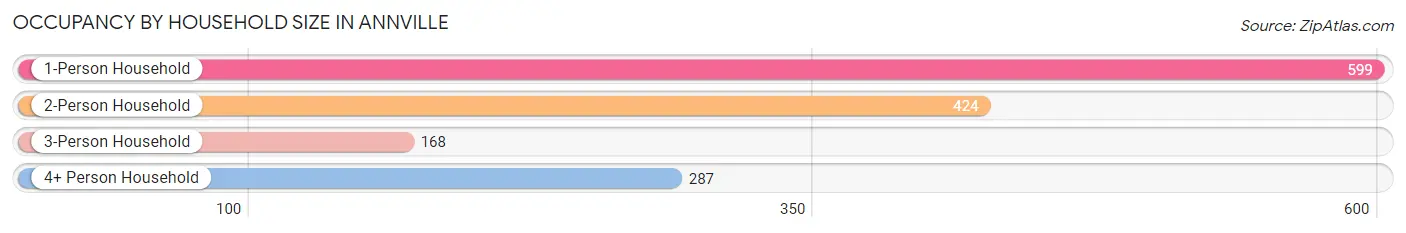
| Household Size | # Housing Units | % Housing Units |
| 1-Person Household | 599 | 40.5% |
| 2-Person Household | 424 | 28.7% |
| 3-Person Household | 168 | 11.4% |
| 4+ Person Household | 287 | 19.4% |
| Total Housing Units | 1,478 | 100.0% |
Occupancy by Ownership by Household Size in Annville
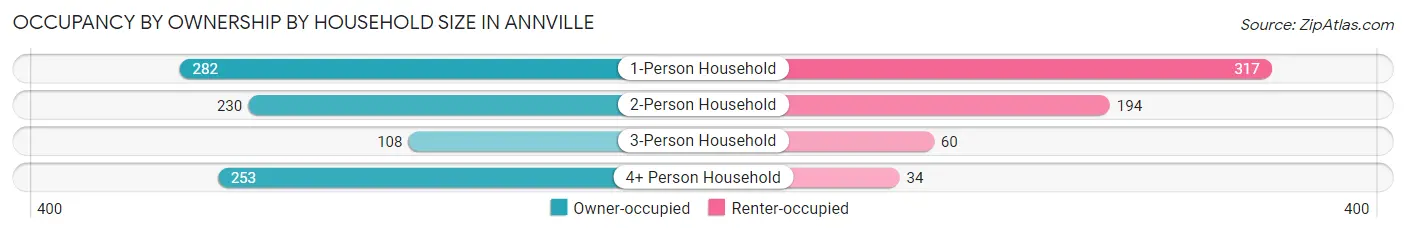
| Household Size | Owner-occupied | Renter-occupied |
| 1-Person Household | 282 (47.1%) | 317 (52.9%) |
| 2-Person Household | 230 (54.2%) | 194 (45.8%) |
| 3-Person Household | 108 (64.3%) | 60 (35.7%) |
| 4+ Person Household | 253 (88.1%) | 34 (11.8%) |
| Total Housing Units | 873 (59.1%) | 605 (40.9%) |
Occupancy by Educational Attainment in Annville
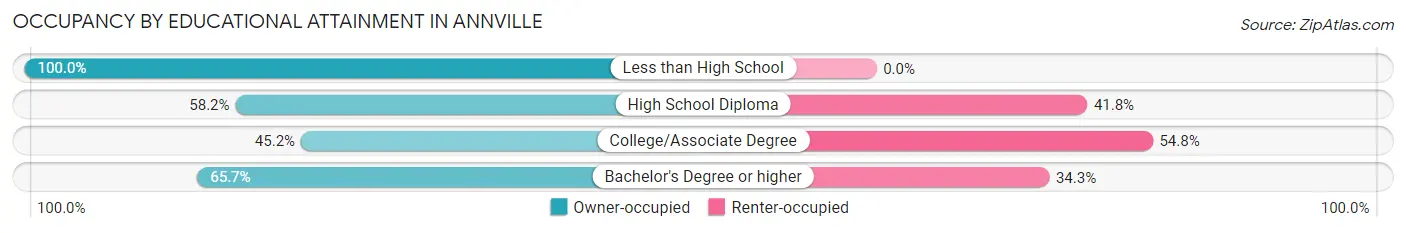
| Household Size | Owner-occupied | Renter-occupied |
| Less than High School | 31 (100.0%) | 0 (0.0%) |
| High School Diploma | 280 (58.2%) | 201 (41.8%) |
| College/Associate Degree | 161 (45.2%) | 195 (54.8%) |
| Bachelor's Degree or higher | 401 (65.7%) | 209 (34.3%) |
Occupancy by Age of Householder in Annville
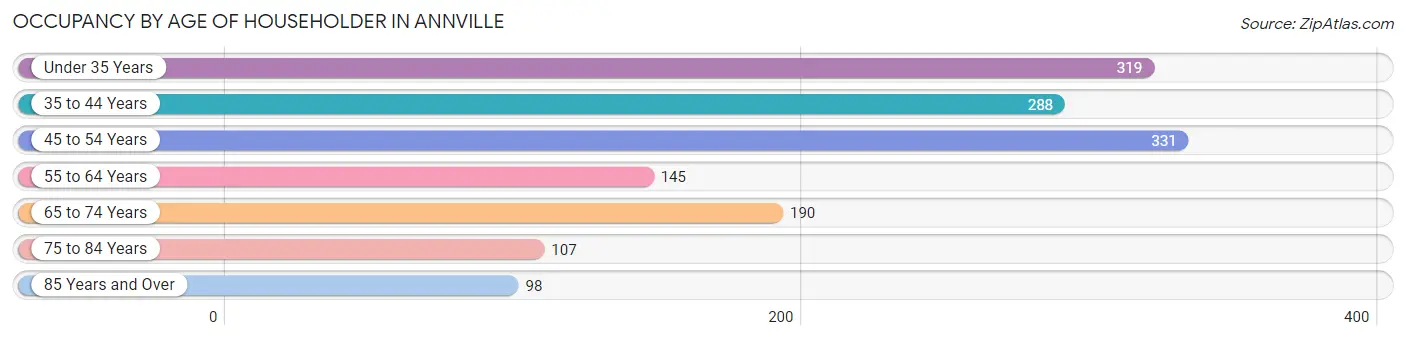
| Age Bracket | # Households | % Households |
| Under 35 Years | 319 | 21.6% |
| 35 to 44 Years | 288 | 19.5% |
| 45 to 54 Years | 331 | 22.4% |
| 55 to 64 Years | 145 | 9.8% |
| 65 to 74 Years | 190 | 12.9% |
| 75 to 84 Years | 107 | 7.2% |
| 85 Years and Over | 98 | 6.6% |
| Total | 1,478 | 100.0% |
Housing Finances in Annville
Median Income by Occupancy in Annville
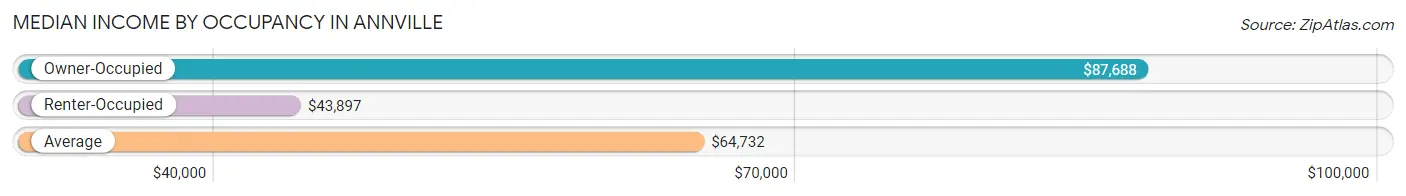
| Occupancy Type | # Households | Median Income |
| Owner-Occupied | 873 (59.1%) | $87,688 |
| Renter-Occupied | 605 (40.9%) | $43,897 |
| Average | 1,478 (100.0%) | $64,732 |
Occupancy by Householder Income Bracket in Annville
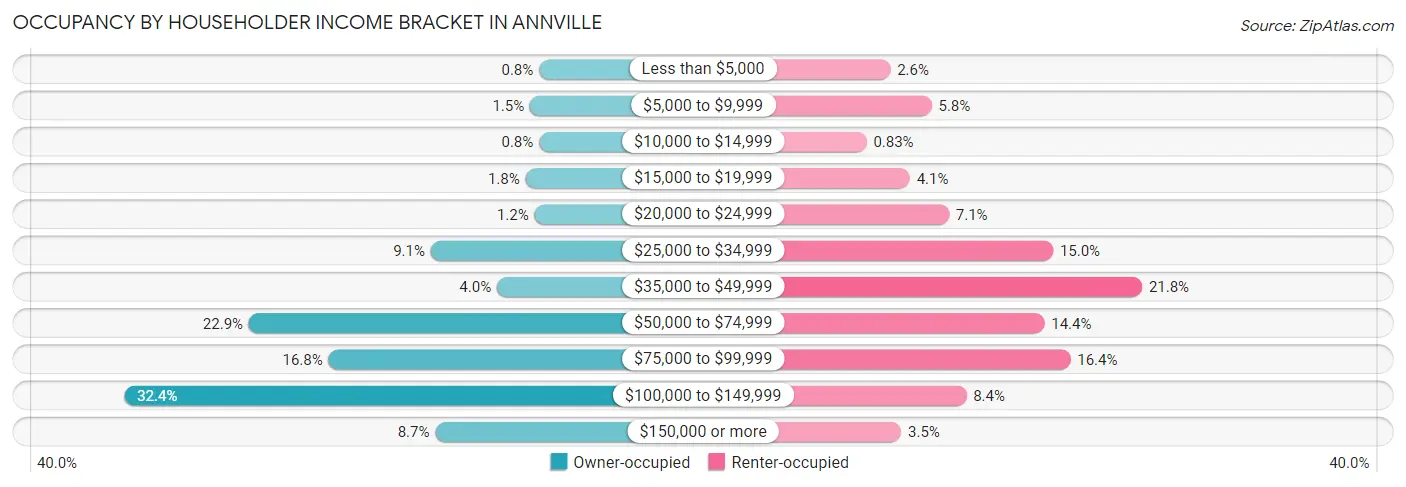
| Income Bracket | Owner-occupied | Renter-occupied |
| Less than $5,000 | 7 (0.8%) | 16 (2.6%) |
| $5,000 to $9,999 | 13 (1.5%) | 35 (5.8%) |
| $10,000 to $14,999 | 7 (0.8%) | 5 (0.8%) |
| $15,000 to $19,999 | 16 (1.8%) | 25 (4.1%) |
| $20,000 to $24,999 | 10 (1.1%) | 43 (7.1%) |
| $25,000 to $34,999 | 79 (9.0%) | 91 (15.0%) |
| $35,000 to $49,999 | 35 (4.0%) | 132 (21.8%) |
| $50,000 to $74,999 | 200 (22.9%) | 87 (14.4%) |
| $75,000 to $99,999 | 147 (16.8%) | 99 (16.4%) |
| $100,000 to $149,999 | 283 (32.4%) | 51 (8.4%) |
| $150,000 or more | 76 (8.7%) | 21 (3.5%) |
| Total | 873 (100.0%) | 605 (100.0%) |
Monthly Housing Cost Tiers in Annville
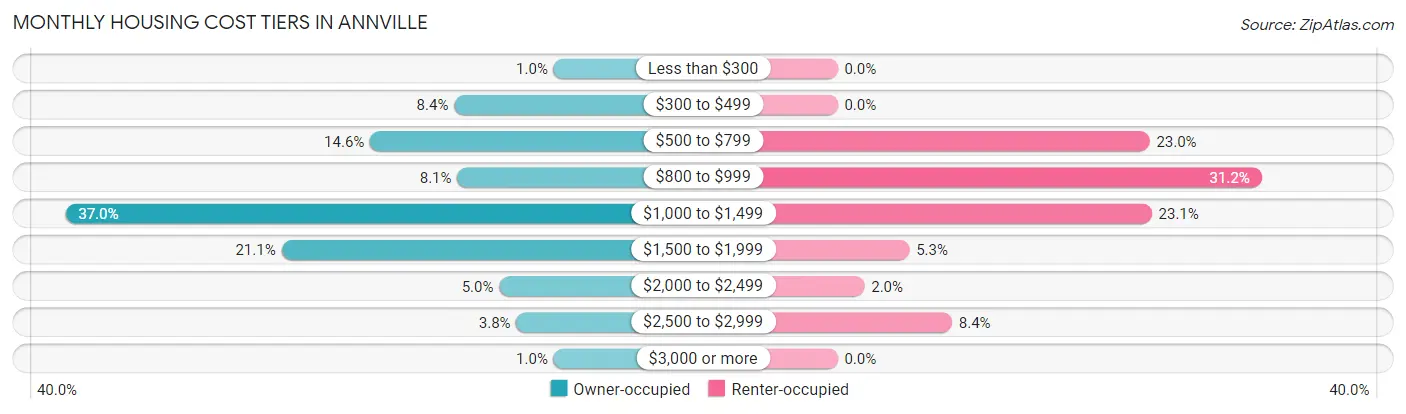
| Monthly Cost | Owner-occupied | Renter-occupied |
| Less than $300 | 9 (1.0%) | 0 (0.0%) |
| $300 to $499 | 73 (8.4%) | 0 (0.0%) |
| $500 to $799 | 127 (14.5%) | 139 (23.0%) |
| $800 to $999 | 71 (8.1%) | 189 (31.2%) |
| $1,000 to $1,499 | 323 (37.0%) | 140 (23.1%) |
| $1,500 to $1,999 | 184 (21.1%) | 32 (5.3%) |
| $2,000 to $2,499 | 44 (5.0%) | 12 (2.0%) |
| $2,500 to $2,999 | 33 (3.8%) | 51 (8.4%) |
| $3,000 or more | 9 (1.0%) | 0 (0.0%) |
| Total | 873 (100.0%) | 605 (100.0%) |
Physical Housing Characteristics in Annville
Housing Structures in Annville
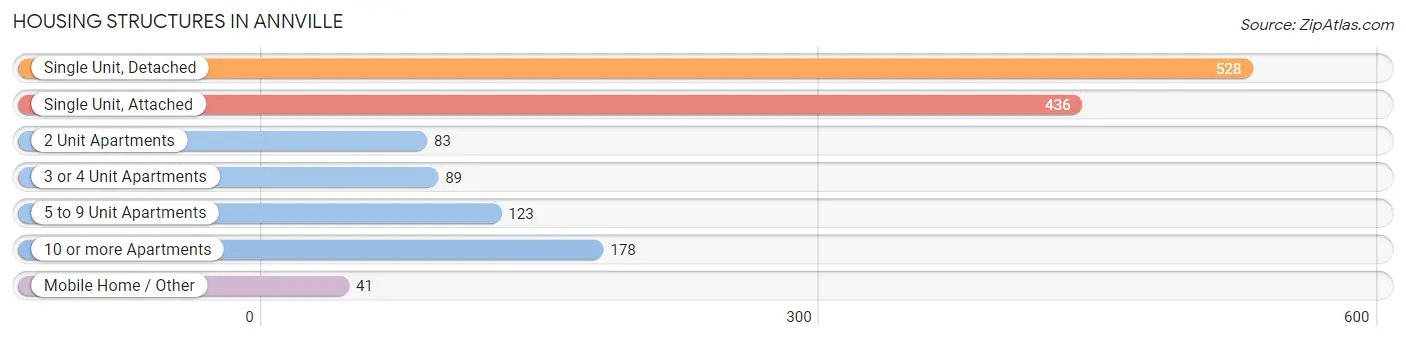
| Structure Type | # Housing Units | % Housing Units |
| Single Unit, Detached | 528 | 35.7% |
| Single Unit, Attached | 436 | 29.5% |
| 2 Unit Apartments | 83 | 5.6% |
| 3 or 4 Unit Apartments | 89 | 6.0% |
| 5 to 9 Unit Apartments | 123 | 8.3% |
| 10 or more Apartments | 178 | 12.0% |
| Mobile Home / Other | 41 | 2.8% |
| Total | 1,478 | 100.0% |
Housing Structures by Occupancy in Annville
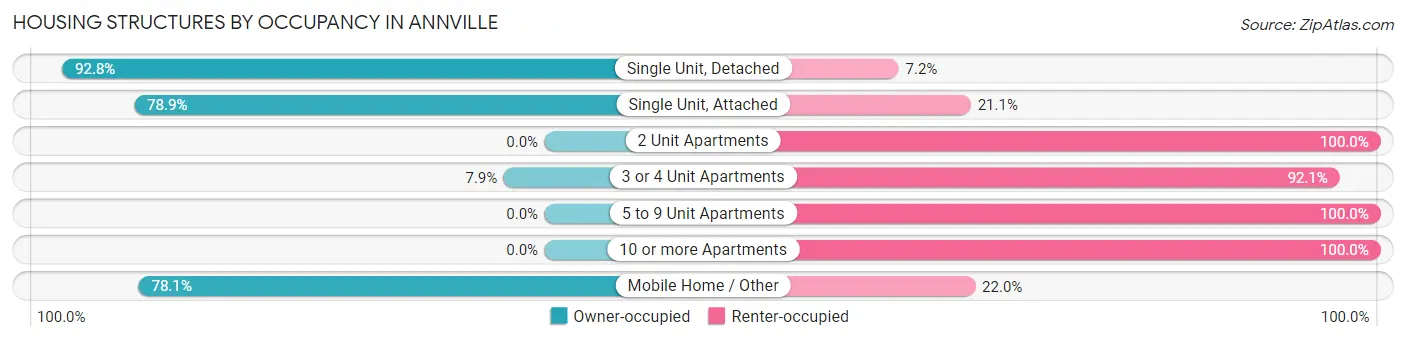
| Structure Type | Owner-occupied | Renter-occupied |
| Single Unit, Detached | 490 (92.8%) | 38 (7.2%) |
| Single Unit, Attached | 344 (78.9%) | 92 (21.1%) |
| 2 Unit Apartments | 0 (0.0%) | 83 (100.0%) |
| 3 or 4 Unit Apartments | 7 (7.9%) | 82 (92.1%) |
| 5 to 9 Unit Apartments | 0 (0.0%) | 123 (100.0%) |
| 10 or more Apartments | 0 (0.0%) | 178 (100.0%) |
| Mobile Home / Other | 32 (78.0%) | 9 (22.0%) |
| Total | 873 (59.1%) | 605 (40.9%) |
Housing Structures by Number of Rooms in Annville
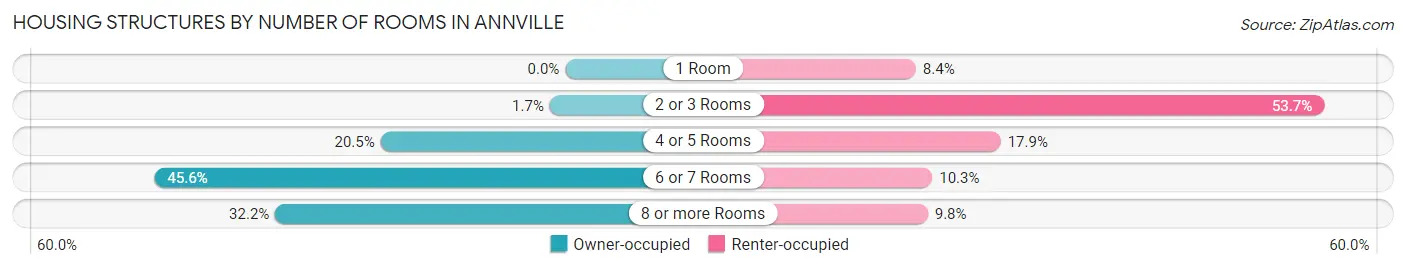
| Number of Rooms | Owner-occupied | Renter-occupied |
| 1 Room | 0 (0.0%) | 51 (8.4%) |
| 2 or 3 Rooms | 15 (1.7%) | 325 (53.7%) |
| 4 or 5 Rooms | 179 (20.5%) | 108 (17.8%) |
| 6 or 7 Rooms | 398 (45.6%) | 62 (10.2%) |
| 8 or more Rooms | 281 (32.2%) | 59 (9.8%) |
| Total | 873 (100.0%) | 605 (100.0%) |
Housing Structure by Heating Type in Annville
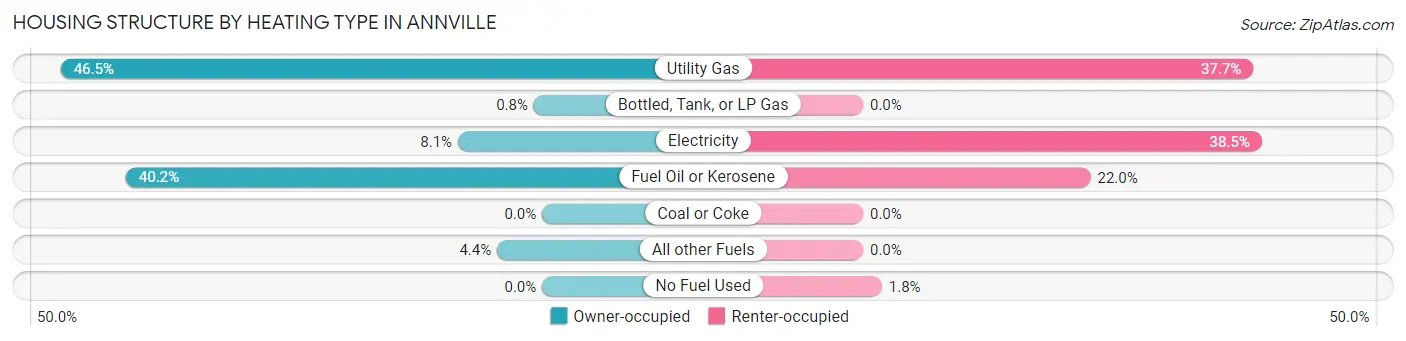
| Heating Type | Owner-occupied | Renter-occupied |
| Utility Gas | 406 (46.5%) | 228 (37.7%) |
| Bottled, Tank, or LP Gas | 7 (0.8%) | 0 (0.0%) |
| Electricity | 71 (8.1%) | 233 (38.5%) |
| Fuel Oil or Kerosene | 351 (40.2%) | 133 (22.0%) |
| Coal or Coke | 0 (0.0%) | 0 (0.0%) |
| All other Fuels | 38 (4.3%) | 0 (0.0%) |
| No Fuel Used | 0 (0.0%) | 11 (1.8%) |
| Total | 873 (100.0%) | 605 (100.0%) |
Household Vehicle Usage in Annville
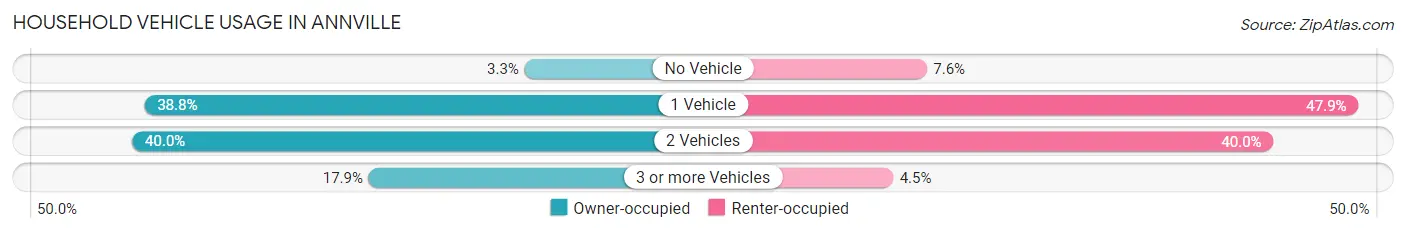
| Vehicles per Household | Owner-occupied | Renter-occupied |
| No Vehicle | 29 (3.3%) | 46 (7.6%) |
| 1 Vehicle | 339 (38.8%) | 290 (47.9%) |
| 2 Vehicles | 349 (40.0%) | 242 (40.0%) |
| 3 or more Vehicles | 156 (17.9%) | 27 (4.5%) |
| Total | 873 (100.0%) | 605 (100.0%) |
Real Estate & Mortgages in Annville
Real Estate and Mortgage Overview in Annville
| Characteristic | Without Mortgage | With Mortgage |
| Housing Units | 226 | 647 |
| Median Property Value | $180,600 | $179,600 |
| Median Household Income | $60,714 | $51 |
| Monthly Housing Costs | $562 | $9 |
| Real Estate Taxes | $2,745 | $7 |
Property Value by Mortgage Status in Annville
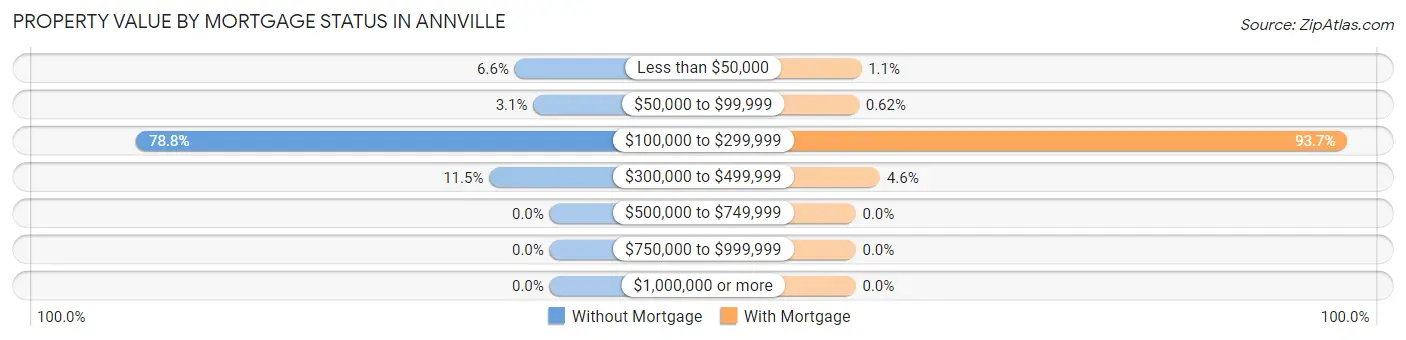
| Property Value | Without Mortgage | With Mortgage |
| Less than $50,000 | 15 (6.6%) | 7 (1.1%) |
| $50,000 to $99,999 | 7 (3.1%) | 4 (0.6%) |
| $100,000 to $299,999 | 178 (78.8%) | 606 (93.7%) |
| $300,000 to $499,999 | 26 (11.5%) | 30 (4.6%) |
| $500,000 to $749,999 | 0 (0.0%) | 0 (0.0%) |
| $750,000 to $999,999 | 0 (0.0%) | 0 (0.0%) |
| $1,000,000 or more | 0 (0.0%) | 0 (0.0%) |
| Total | 226 (100.0%) | 647 (100.0%) |
Household Income by Mortgage Status in Annville
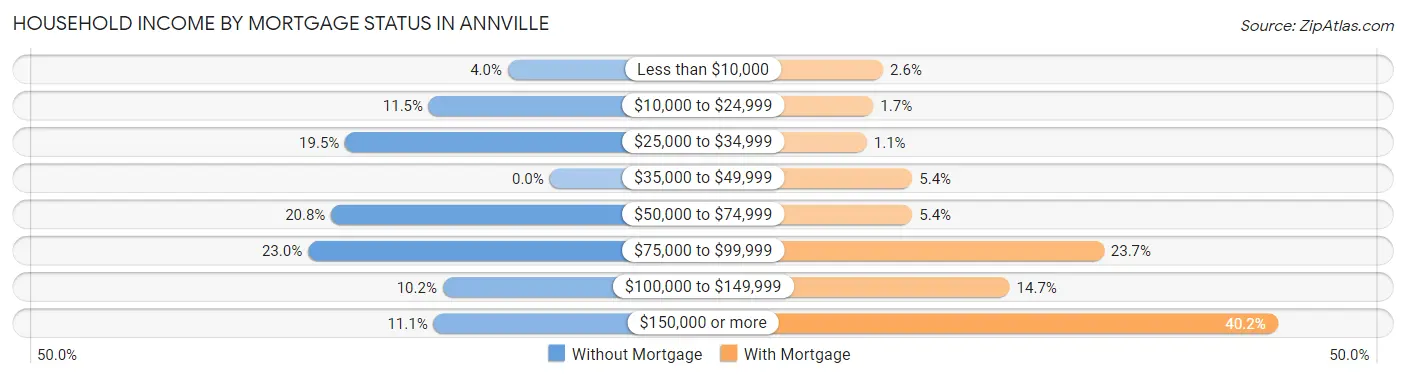
| Household Income | Without Mortgage | With Mortgage |
| Less than $10,000 | 9 (4.0%) | 17 (2.6%) |
| $10,000 to $24,999 | 26 (11.5%) | 11 (1.7%) |
| $25,000 to $34,999 | 44 (19.5%) | 7 (1.1%) |
| $35,000 to $49,999 | 0 (0.0%) | 35 (5.4%) |
| $50,000 to $74,999 | 47 (20.8%) | 35 (5.4%) |
| $75,000 to $99,999 | 52 (23.0%) | 153 (23.6%) |
| $100,000 to $149,999 | 23 (10.2%) | 95 (14.7%) |
| $150,000 or more | 25 (11.1%) | 260 (40.2%) |
| Total | 226 (100.0%) | 647 (100.0%) |
Property Value to Household Income Ratio in Annville
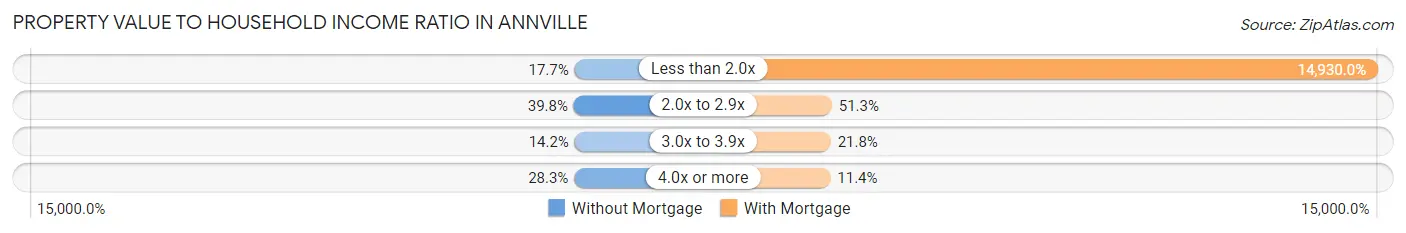
| Value-to-Income Ratio | Without Mortgage | With Mortgage |
| Less than 2.0x | 40 (17.7%) | 96,597 (14,930.0%) |
| 2.0x to 2.9x | 90 (39.8%) | 332 (51.3%) |
| 3.0x to 3.9x | 32 (14.2%) | 141 (21.8%) |
| 4.0x or more | 64 (28.3%) | 74 (11.4%) |
| Total | 226 (100.0%) | 647 (100.0%) |
Real Estate Taxes by Mortgage Status in Annville
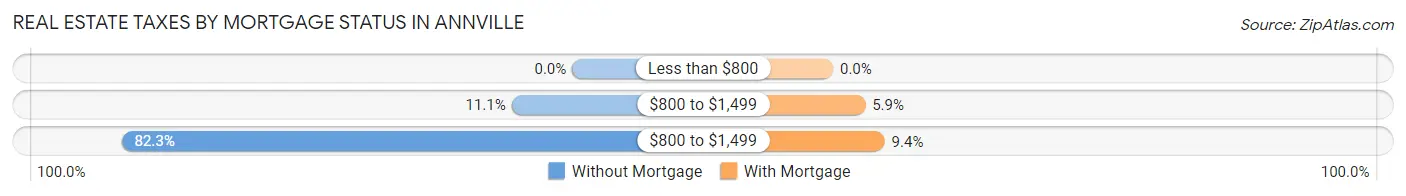
| Property Taxes | Without Mortgage | With Mortgage |
| Less than $800 | 0 (0.0%) | 0 (0.0%) |
| $800 to $1,499 | 25 (11.1%) | 38 (5.9%) |
| $800 to $1,499 | 186 (82.3%) | 61 (9.4%) |
| Total | 226 (100.0%) | 647 (100.0%) |
Health & Disability in Annville
Health Insurance Coverage by Age in Annville
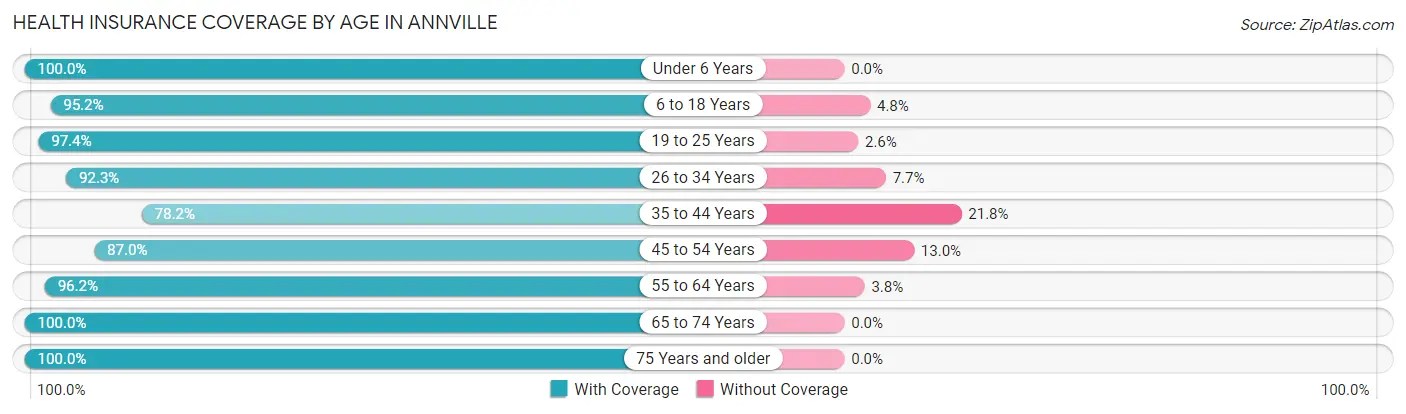
| Age Bracket | With Coverage | Without Coverage |
| Under 6 Years | 199 (100.0%) | 0 (0.0%) |
| 6 to 18 Years | 734 (95.2%) | 37 (4.8%) |
| 19 to 25 Years | 1,560 (97.4%) | 41 (2.6%) |
| 26 to 34 Years | 287 (92.3%) | 24 (7.7%) |
| 35 to 44 Years | 419 (78.2%) | 117 (21.8%) |
| 45 to 54 Years | 496 (87.0%) | 74 (13.0%) |
| 55 to 64 Years | 256 (96.2%) | 10 (3.8%) |
| 65 to 74 Years | 259 (100.0%) | 0 (0.0%) |
| 75 Years and older | 257 (100.0%) | 0 (0.0%) |
| Total | 4,467 (93.6%) | 303 (6.4%) |
Health Insurance Coverage by Citizenship Status in Annville
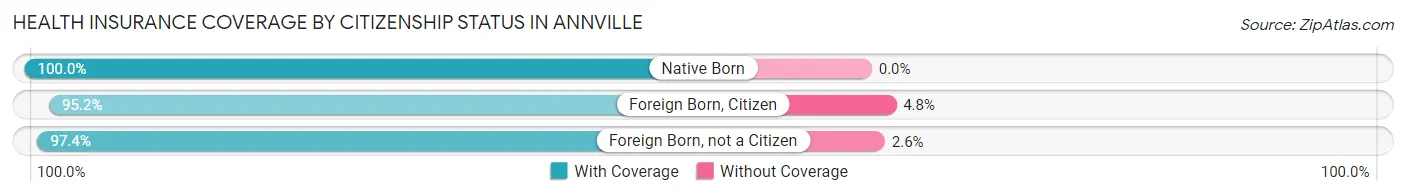
| Citizenship Status | With Coverage | Without Coverage |
| Native Born | 199 (100.0%) | 0 (0.0%) |
| Foreign Born, Citizen | 734 (95.2%) | 37 (4.8%) |
| Foreign Born, not a Citizen | 1,560 (97.4%) | 41 (2.6%) |
Health Insurance Coverage by Household Income in Annville
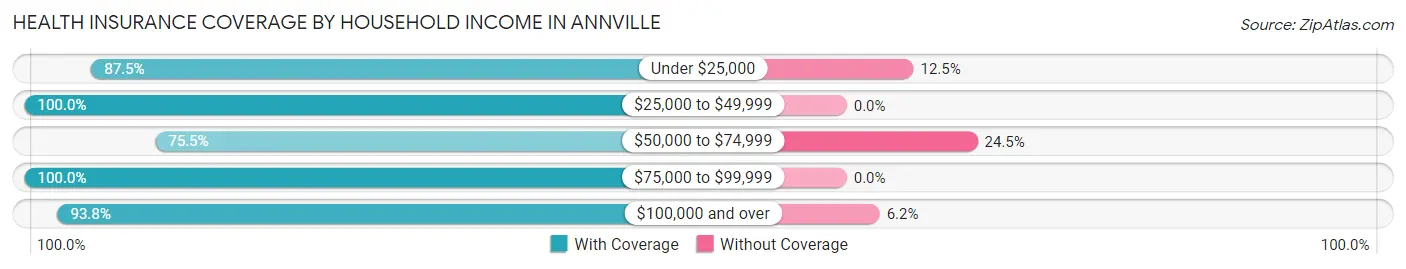
| Household Income | With Coverage | Without Coverage |
| Under $25,000 | 175 (87.5%) | 25 (12.5%) |
| $25,000 to $49,999 | 423 (100.0%) | 0 (0.0%) |
| $50,000 to $74,999 | 487 (75.5%) | 158 (24.5%) |
| $75,000 to $99,999 | 540 (100.0%) | 0 (0.0%) |
| $100,000 and over | 1,368 (93.8%) | 90 (6.2%) |
Public vs Private Health Insurance Coverage by Age in Annville
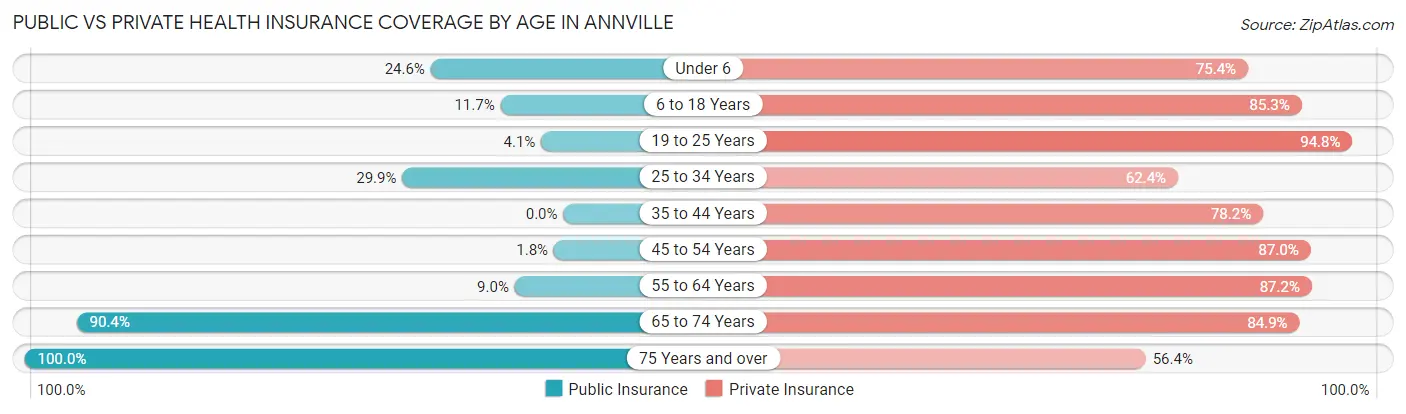
| Age Bracket | Public Insurance | Private Insurance |
| Under 6 | 49 (24.6%) | 150 (75.4%) |
| 6 to 18 Years | 90 (11.7%) | 658 (85.3%) |
| 19 to 25 Years | 66 (4.1%) | 1,517 (94.8%) |
| 25 to 34 Years | 93 (29.9%) | 194 (62.4%) |
| 35 to 44 Years | 0 (0.0%) | 419 (78.2%) |
| 45 to 54 Years | 10 (1.8%) | 496 (87.0%) |
| 55 to 64 Years | 24 (9.0%) | 232 (87.2%) |
| 65 to 74 Years | 234 (90.3%) | 220 (84.9%) |
| 75 Years and over | 257 (100.0%) | 145 (56.4%) |
| Total | 823 (17.2%) | 4,031 (84.5%) |
Disability Status by Sex by Age in Annville
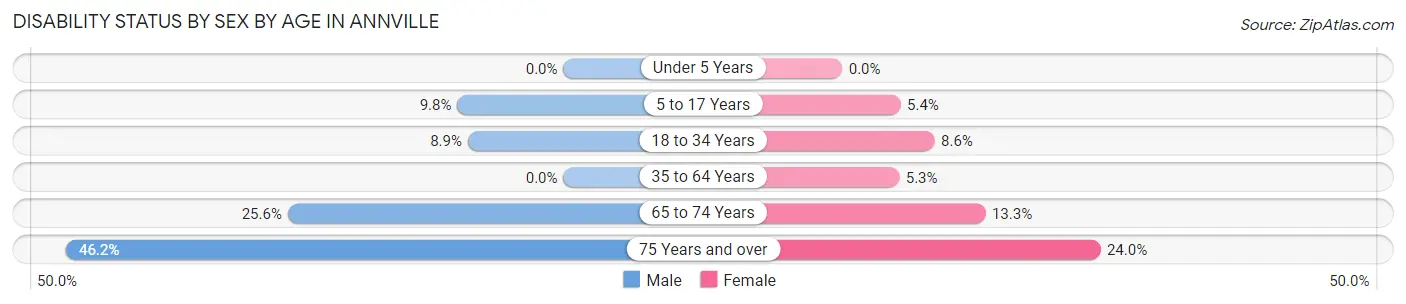
| Age Bracket | Male | Female |
| Under 5 Years | 0 (0.0%) | 0 (0.0%) |
| 5 to 17 Years | 24 (9.8%) | 14 (5.4%) |
| 18 to 34 Years | 93 (8.9%) | 101 (8.6%) |
| 35 to 64 Years | 0 (0.0%) | 36 (5.3%) |
| 65 to 74 Years | 22 (25.6%) | 23 (13.3%) |
| 75 Years and over | 30 (46.2%) | 46 (24.0%) |
Disability Class by Sex by Age in Annville
Disability Class: Hearing Difficulty
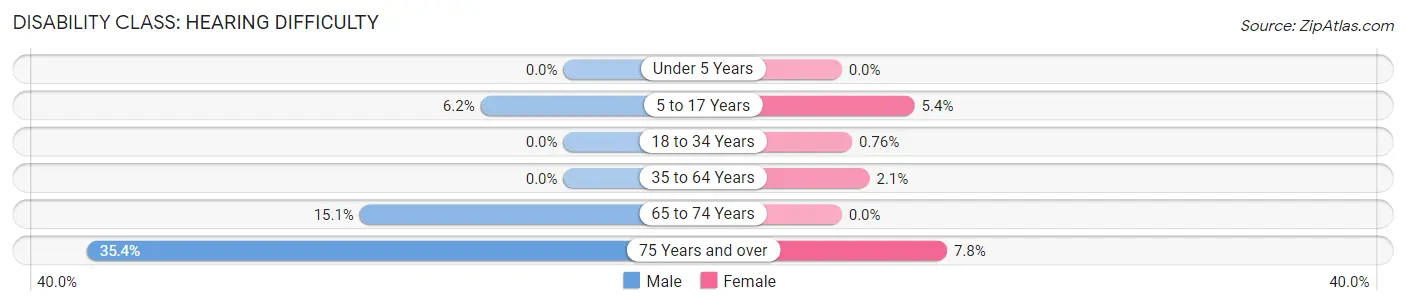
| Age Bracket | Male | Female |
| Under 5 Years | 0 (0.0%) | 0 (0.0%) |
| 5 to 17 Years | 15 (6.1%) | 14 (5.4%) |
| 18 to 34 Years | 0 (0.0%) | 9 (0.8%) |
| 35 to 64 Years | 0 (0.0%) | 14 (2.1%) |
| 65 to 74 Years | 13 (15.1%) | 0 (0.0%) |
| 75 Years and over | 23 (35.4%) | 15 (7.8%) |
Disability Class: Vision Difficulty
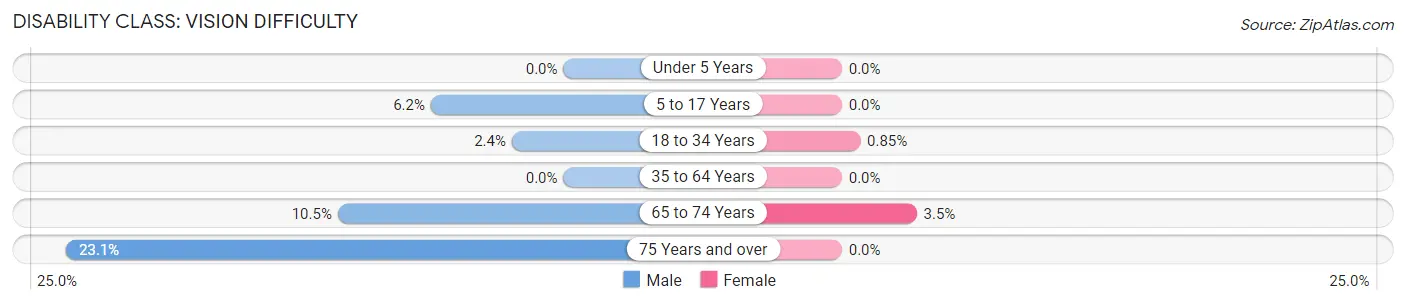
| Age Bracket | Male | Female |
| Under 5 Years | 0 (0.0%) | 0 (0.0%) |
| 5 to 17 Years | 15 (6.1%) | 0 (0.0%) |
| 18 to 34 Years | 25 (2.4%) | 10 (0.9%) |
| 35 to 64 Years | 0 (0.0%) | 0 (0.0%) |
| 65 to 74 Years | 9 (10.5%) | 6 (3.5%) |
| 75 Years and over | 15 (23.1%) | 0 (0.0%) |
Disability Class: Cognitive Difficulty
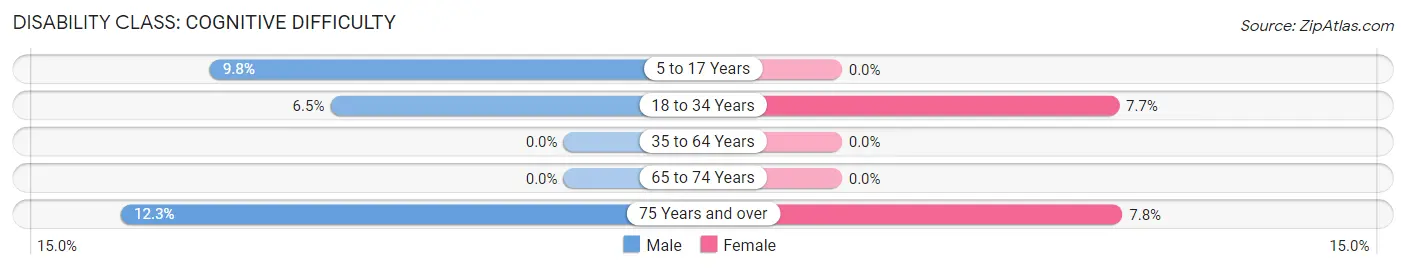
| Age Bracket | Male | Female |
| 5 to 17 Years | 24 (9.8%) | 0 (0.0%) |
| 18 to 34 Years | 68 (6.5%) | 91 (7.7%) |
| 35 to 64 Years | 0 (0.0%) | 0 (0.0%) |
| 65 to 74 Years | 0 (0.0%) | 0 (0.0%) |
| 75 Years and over | 8 (12.3%) | 15 (7.8%) |
Disability Class: Ambulatory Difficulty
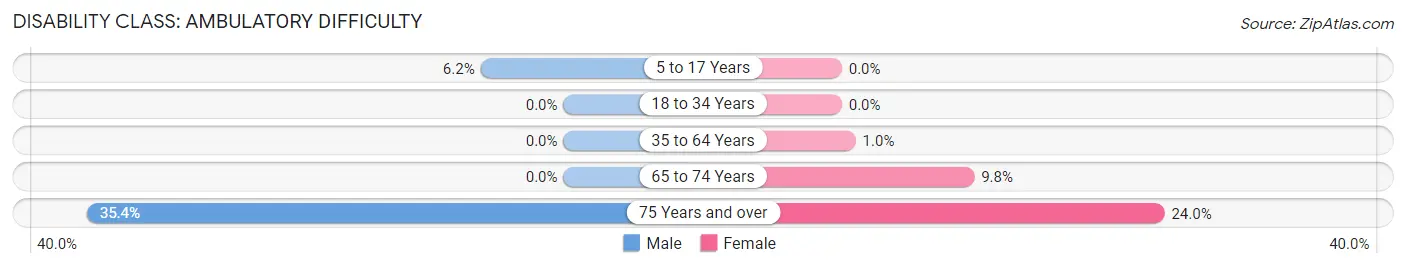
| Age Bracket | Male | Female |
| 5 to 17 Years | 15 (6.1%) | 0 (0.0%) |
| 18 to 34 Years | 0 (0.0%) | 0 (0.0%) |
| 35 to 64 Years | 0 (0.0%) | 7 (1.0%) |
| 65 to 74 Years | 0 (0.0%) | 17 (9.8%) |
| 75 Years and over | 23 (35.4%) | 46 (24.0%) |
Disability Class: Self-Care Difficulty
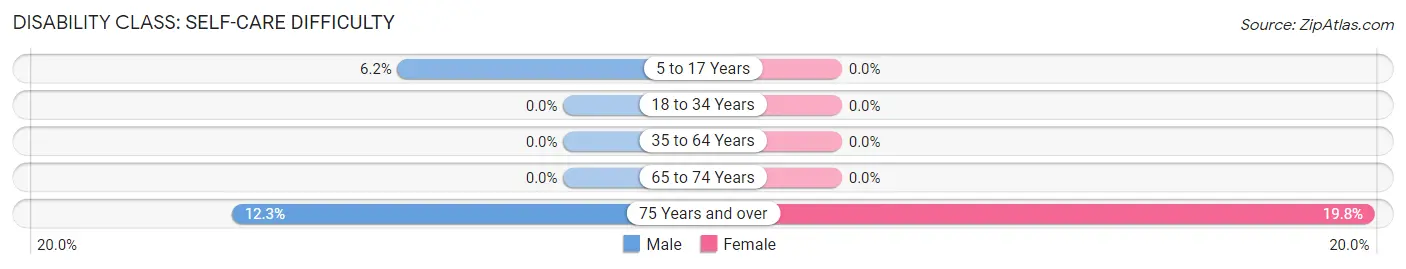
| Age Bracket | Male | Female |
| 5 to 17 Years | 15 (6.1%) | 0 (0.0%) |
| 18 to 34 Years | 0 (0.0%) | 0 (0.0%) |
| 35 to 64 Years | 0 (0.0%) | 0 (0.0%) |
| 65 to 74 Years | 0 (0.0%) | 0 (0.0%) |
| 75 Years and over | 8 (12.3%) | 38 (19.8%) |
Technology Access in Annville
Computing Device Access in Annville
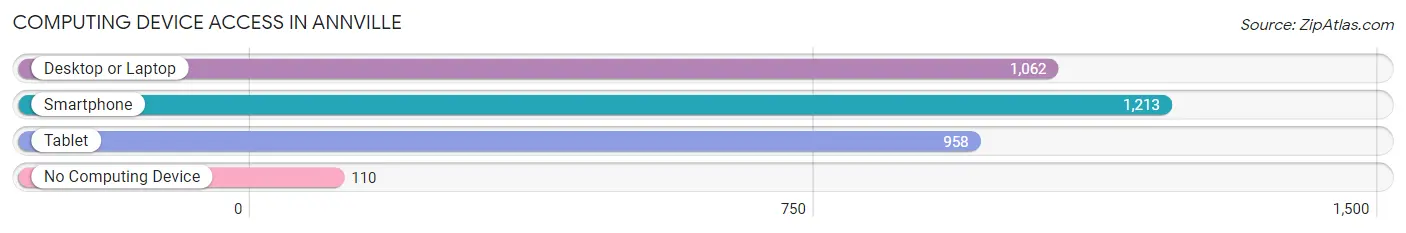
| Device Type | # Households | % Households |
| Desktop or Laptop | 1,062 | 71.9% |
| Smartphone | 1,213 | 82.1% |
| Tablet | 958 | 64.8% |
| No Computing Device | 110 | 7.4% |
| Total | 1,478 | 100.0% |
Internet Access in Annville
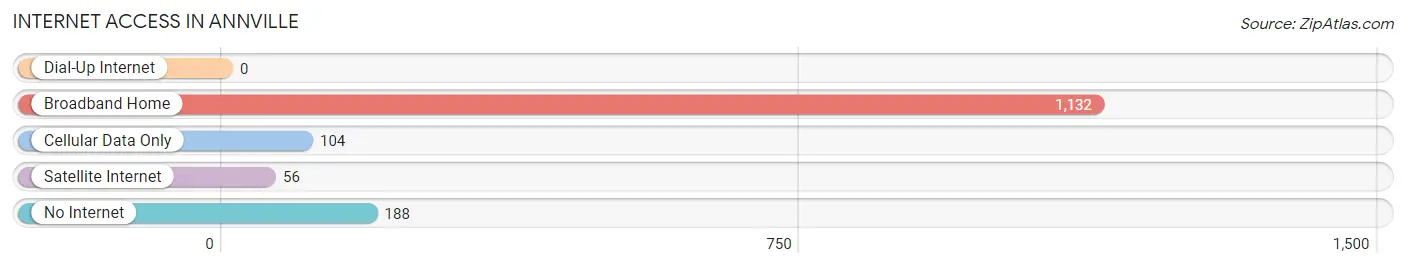
| Internet Type | # Households | % Households |
| Dial-Up Internet | 0 | 0.0% |
| Broadband Home | 1,132 | 76.6% |
| Cellular Data Only | 104 | 7.0% |
| Satellite Internet | 56 | 3.8% |
| No Internet | 188 | 12.7% |
| Total | 1,478 | 100.0% |
Annville Summary
Annville, Pennsylvania is a small borough located in Lebanon County, Pennsylvania. It is situated in the heart of the Lebanon Valley, approximately 10 miles east of the city of Harrisburg. Annville is a quaint, rural community with a population of just over 4,000 people.
History
Annville was founded in 1762 by a group of German settlers led by John and Jacob Light. The town was named after Ann Light, the wife of John Light. The Light family was one of the first families to settle in the area and their descendants still live in the area today.
Annville was an important stop on the Underground Railroad during the Civil War. The town was a safe haven for escaped slaves and many of the townspeople were active in the abolitionist movement.
Geography
Annville is located in the heart of the Lebanon Valley, approximately 10 miles east of the city of Harrisburg. The town is situated in a rural area and is surrounded by rolling hills and farmland. The town is located along the Quittapahilla Creek, which is a tributary of the Susquehanna River.
The climate in Annville is typical of the mid-Atlantic region. Summers are hot and humid, while winters are cold and snowy. The average annual temperature is around 50 degrees Fahrenheit.
Economy
Annville’s economy is largely based on agriculture and tourism. The town is home to several small businesses, including restaurants, shops, and a local winery. The town is also home to a number of small manufacturing companies, including a furniture factory and a printing company.
The town is also home to Lebanon Valley College, a private liberal arts college. The college is a major employer in the area and provides a number of jobs for local residents.
Demographics
As of the 2010 census, the population of Annville was 4,085. The racial makeup of the town was 95.3% White, 1.2% African American, 0.3% Native American, 0.7% Asian, 0.1% Pacific Islander, and 2.4% from other races. Hispanic or Latino of any race were 2.7% of the population.
The median household income in Annville was $45,938, and the median family income was $54,844. The per capita income for the town was $20,945. About 8.2% of families and 10.3% of the population were below the poverty line, including 14.2% of those under age 18 and 6.2% of those age 65 or over.
Annville is a small, rural community with a rich history and a strong sense of community. The town is home to a diverse population and a vibrant economy. Annville is a great place to live, work, and raise a family.
Common Questions
What is Per Capita Income in Annville?
Per Capita income in Annville is $26,041.
What is the Median Family Income in Annville?
Median Family Income in Annville is $100,333.
What is the Median Household income in Annville?
Median Household Income in Annville is $64,732.
What is Income or Wage Gap in Annville?
Income or Wage Gap in Annville is 38.2%.
Women in Annville earn 61.8 cents for every dollar earned by a man.
What is Inequality or Gini Index in Annville?
Inequality or Gini Index in Annville is 0.38.
What is the Total Population of Annville?
Total Population of Annville is 4,829.
What is the Total Male Population of Annville?
Total Male Population of Annville is 2,294.
What is the Total Female Population of Annville?
Total Female Population of Annville is 2,535.
What is the Ratio of Males per 100 Females in Annville?
There are 90.49 Males per 100 Females in Annville.
What is the Ratio of Females per 100 Males in Annville?
There are 110.51 Females per 100 Males in Annville.
What is the Median Population Age in Annville?
Median Population Age in Annville is 24.3 Years.
What is the Average Family Size in Annville
Average Family Size in Annville is 3.0 People.
What is the Average Household Size in Annville
Average Household Size in Annville is 2.2 People.
How Large is the Labor Force in Annville?
There are 2,725 People in the Labor Forcein in Annville.
What is the Percentage of People in the Labor Force in Annville?
64.6% of People are in the Labor Force in Annville.
What is the Unemployment Rate in Annville?
Unemployment Rate in Annville is 5.3%.