Shanor Northvue, PA Map & Demographics
Shanor Northvue Map
Shanor Northvue Overview
$45,480
PER CAPITA INCOME
$124,186
AVG FAMILY INCOME
$98,403
AVG HOUSEHOLD INCOME
40.3%
WAGE / INCOME GAP [ % ]
59.7¢/ $1
WAGE / INCOME GAP [ $ ]
0.38
INEQUALITY / GINI INDEX
5,147
TOTAL POPULATION
2,540
MALE POPULATION
2,607
FEMALE POPULATION
97.43
MALES / 100 FEMALES
102.64
FEMALES / 100 MALES
43.4
MEDIAN AGE
3.0
AVG FAMILY SIZE
2.3
AVG HOUSEHOLD SIZE
2,381
LABOR FORCE [ PEOPLE ]
58.9%
PERCENT IN LABOR FORCE
1.5%
UNEMPLOYMENT RATE
Income in Shanor Northvue
Income Overview in Shanor Northvue
Per Capita Income in Shanor Northvue is $45,480, while median incomes of families and households are $124,186 and $98,403 respectively.
| Characteristic | Number | Measure |
| Per Capita Income | 5,147 | $45,480 |
| Median Family Income | 1,412 | $124,186 |
| Mean Family Income | 1,412 | $130,039 |
| Median Household Income | 2,233 | $98,403 |
| Mean Household Income | 2,233 | $104,396 |
| Income Deficit | 1,412 | $0 |
| Wage / Income Gap (%) | 5,147 | 40.27% |
| Wage / Income Gap ($) | 5,147 | 59.73¢ per $1 |
| Gini / Inequality Index | 5,147 | 0.38 |
Earnings by Sex in Shanor Northvue
Average Earnings in Shanor Northvue are $56,477, $76,667 for men and $45,797 for women, a difference of 40.3%.
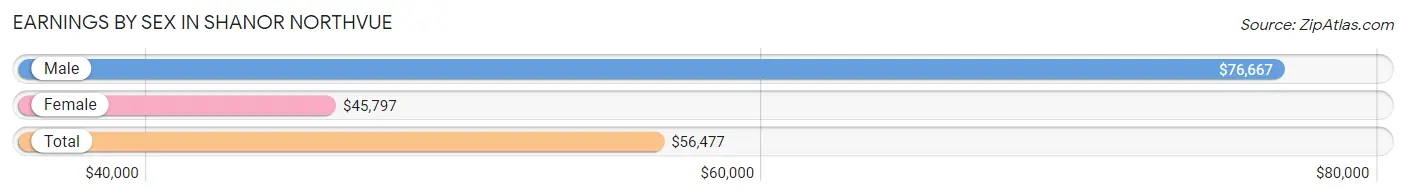
| Sex | Number | Average Earnings |
| Male | 1,320 (53.5%) | $76,667 |
| Female | 1,146 (46.5%) | $45,797 |
| Total | 2,466 (100.0%) | $56,477 |
Earnings by Sex by Income Bracket in Shanor Northvue
The most common earnings brackets in Shanor Northvue are $100,000+ for men (517 | 39.2%) and $45,000 to $49,999 for women (137 | 11.9%).
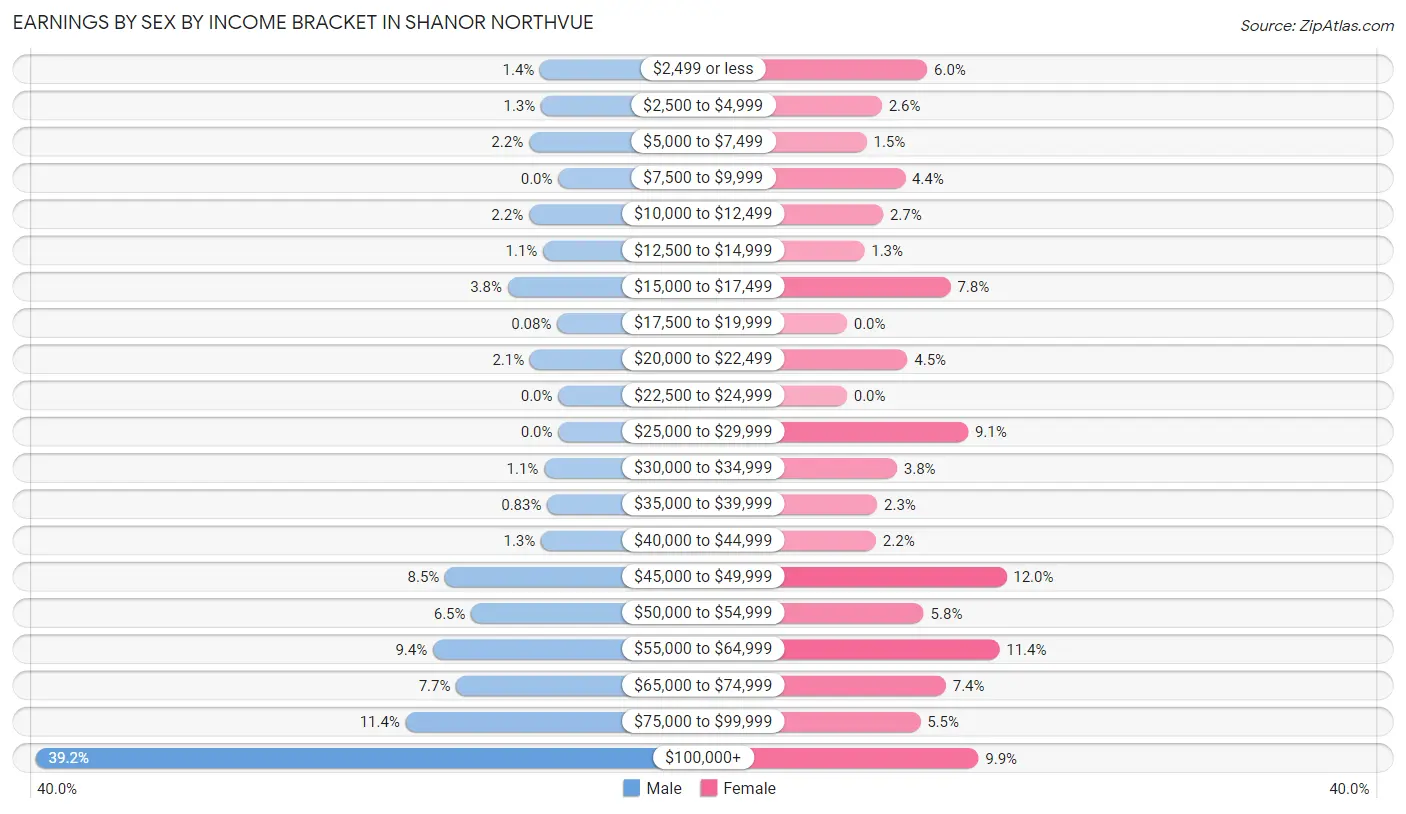
| Income | Male | Female |
| $2,499 or less | 18 (1.4%) | 69 (6.0%) |
| $2,500 to $4,999 | 17 (1.3%) | 30 (2.6%) |
| $5,000 to $7,499 | 29 (2.2%) | 17 (1.5%) |
| $7,500 to $9,999 | 0 (0.0%) | 50 (4.4%) |
| $10,000 to $12,499 | 29 (2.2%) | 31 (2.7%) |
| $12,500 to $14,999 | 15 (1.1%) | 15 (1.3%) |
| $15,000 to $17,499 | 50 (3.8%) | 89 (7.8%) |
| $17,500 to $19,999 | 1 (0.1%) | 0 (0.0%) |
| $20,000 to $22,499 | 28 (2.1%) | 52 (4.5%) |
| $22,500 to $24,999 | 0 (0.0%) | 0 (0.0%) |
| $25,000 to $29,999 | 0 (0.0%) | 104 (9.1%) |
| $30,000 to $34,999 | 14 (1.1%) | 43 (3.7%) |
| $35,000 to $39,999 | 11 (0.8%) | 26 (2.3%) |
| $40,000 to $44,999 | 17 (1.3%) | 25 (2.2%) |
| $45,000 to $49,999 | 112 (8.5%) | 137 (11.9%) |
| $50,000 to $54,999 | 86 (6.5%) | 66 (5.8%) |
| $55,000 to $64,999 | 124 (9.4%) | 131 (11.4%) |
| $65,000 to $74,999 | 101 (7.6%) | 85 (7.4%) |
| $75,000 to $99,999 | 151 (11.4%) | 63 (5.5%) |
| $100,000+ | 517 (39.2%) | 113 (9.9%) |
| Total | 1,320 (100.0%) | 1,146 (100.0%) |
Earnings by Sex by Educational Attainment in Shanor Northvue
Average earnings in Shanor Northvue are $89,926 for men and $47,047 for women, a difference of 47.7%. Men with an educational attainment of graduate degree enjoy the highest average annual earnings of $117,917, while those with high school diploma education earn the least with $56,250. Women with an educational attainment of graduate degree earn the most with the average annual earnings of $69,266, while those with college or associate's degree education have the smallest earnings of $47,524.
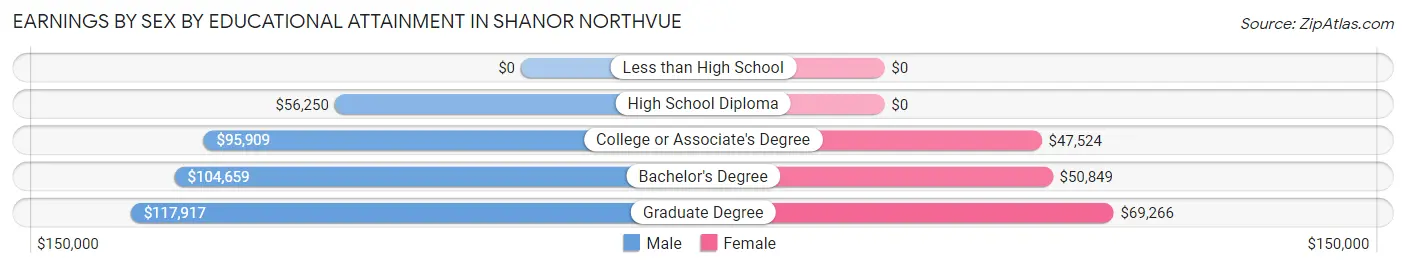
| Educational Attainment | Male Income | Female Income |
| Less than High School | - | - |
| High School Diploma | $56,250 | $0 |
| College or Associate's Degree | $95,909 | $47,524 |
| Bachelor's Degree | $104,659 | $50,849 |
| Graduate Degree | $117,917 | $69,266 |
| Total | $89,926 | $47,047 |
Family Income in Shanor Northvue
Family Income Brackets in Shanor Northvue
According to the Shanor Northvue family income data, there are 505 families falling into the $100,000 to $149,999 income range, which is the most common income bracket and makes up 35.8% of all families.
| Income Bracket | # Families | % Families |
| Less than $10,000 | 17 | 1.2% |
| $10,000 to $14,999 | 0 | 0.0% |
| $15,000 to $24,999 | 25 | 1.8% |
| $25,000 to $34,999 | 106 | 7.5% |
| $35,000 to $49,999 | 52 | 3.7% |
| $50,000 to $74,999 | 103 | 7.3% |
| $75,000 to $99,999 | 186 | 13.2% |
| $100,000 to $149,999 | 505 | 35.8% |
| $150,000 to $199,999 | 219 | 15.5% |
| $200,000+ | 198 | 14.0% |
Family Income by Famaliy Size in Shanor Northvue
5-person families (95 | 6.7%) account for the highest median family income in Shanor Northvue with $225,764 per family, while 2-person families (645 | 45.7%) have the highest median income of $47,117 per family member.
| Income Bracket | # Families | Median Income |
| 2-Person Families | 645 (45.7%) | $94,234 |
| 3-Person Families | 277 (19.6%) | $125,662 |
| 4-Person Families | 366 (25.9%) | $155,227 |
| 5-Person Families | 95 (6.7%) | $225,764 |
| 6-Person Families | 29 (2.1%) | $0 |
| 7+ Person Families | 0 (0.0%) | $0 |
| Total | 1,412 (100.0%) | $124,186 |
Family Income by Number of Earners in Shanor Northvue
The median family income in Shanor Northvue is $124,186, with families comprising 3+ earners (142) having the highest median family income of $165,769, while families with 1 earner (365) have the lowest median family income of $84,095, accounting for 10.1% and 25.9% of families, respectively.
| Number of Earners | # Families | Median Income |
| No Earners | 272 (19.3%) | $92,984 |
| 1 Earner | 365 (25.9%) | $84,095 |
| 2 Earners | 633 (44.8%) | $145,190 |
| 3+ Earners | 142 (10.1%) | $165,769 |
| Total | 1,412 (100.0%) | $124,186 |
Household Income in Shanor Northvue
Household Income Brackets in Shanor Northvue
With 661 households falling in the category, the $100,000 to $149,999 income range is the most frequent in Shanor Northvue, accounting for 29.6% of all households. In contrast, only 31 households (1.4%) fall into the less than $10,000 income bracket, making it the least populous group.
| Income Bracket | # Households | % Households |
| Less than $10,000 | 31 | 1.4% |
| $10,000 to $14,999 | 92 | 4.1% |
| $15,000 to $24,999 | 163 | 7.3% |
| $25,000 to $34,999 | 156 | 7.0% |
| $35,000 to $49,999 | 210 | 9.4% |
| $50,000 to $74,999 | 176 | 7.9% |
| $75,000 to $99,999 | 299 | 13.4% |
| $100,000 to $149,999 | 661 | 29.6% |
| $150,000 to $199,999 | 246 | 11.0% |
| $200,000+ | 199 | 8.9% |
Household Income by Householder Age in Shanor Northvue
The median household income in Shanor Northvue is $98,403, with the highest median household income of $130,063 found in the 25 to 44 years age bracket for the primary householder. A total of 657 households (29.4%) fall into this category. Meanwhile, the 15 to 24 years age bracket for the primary householder has the lowest median household income of $0, with 15 households (0.7%) in this group.
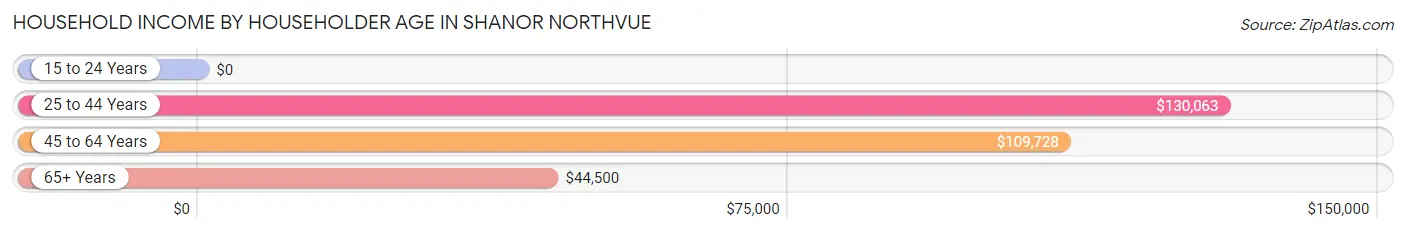
| Income Bracket | # Households | Median Income |
| 15 to 24 Years | 15 (0.7%) | $0 |
| 25 to 44 Years | 657 (29.4%) | $130,063 |
| 45 to 64 Years | 781 (35.0%) | $109,728 |
| 65+ Years | 780 (34.9%) | $44,500 |
| Total | 2,233 (100.0%) | $98,403 |
Poverty in Shanor Northvue
Income Below Poverty by Sex and Age in Shanor Northvue
With 2.5% poverty level for males and 3.1% for females among the residents of Shanor Northvue, 18 to 24 year old males and 65 to 74 year old females are the most vulnerable to poverty, with 15 males (10.4%) and 35 females (13.5%) in their respective age groups living below the poverty level.
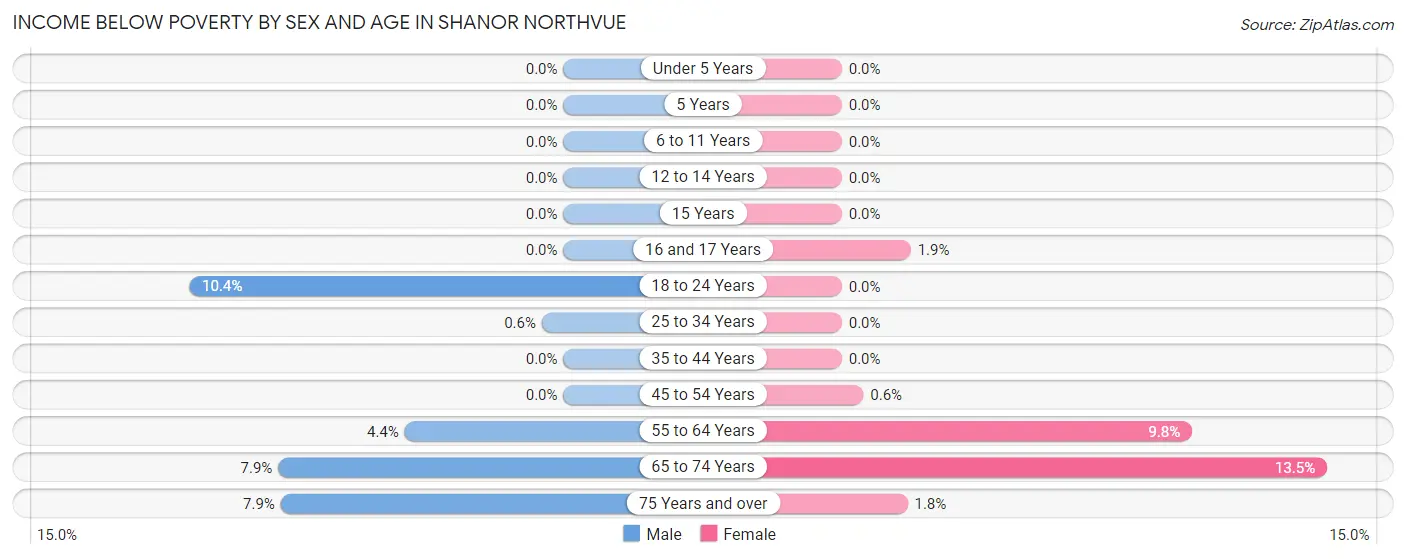
| Age Bracket | Male | Female |
| Under 5 Years | 0 (0.0%) | 0 (0.0%) |
| 5 Years | 0 (0.0%) | 0 (0.0%) |
| 6 to 11 Years | 0 (0.0%) | 0 (0.0%) |
| 12 to 14 Years | 0 (0.0%) | 0 (0.0%) |
| 15 Years | 0 (0.0%) | 0 (0.0%) |
| 16 and 17 Years | 0 (0.0%) | 1 (1.9%) |
| 18 to 24 Years | 15 (10.4%) | 0 (0.0%) |
| 25 to 34 Years | 2 (0.6%) | 0 (0.0%) |
| 35 to 44 Years | 0 (0.0%) | 0 (0.0%) |
| 45 to 54 Years | 0 (0.0%) | 2 (0.6%) |
| 55 to 64 Years | 13 (4.4%) | 35 (9.8%) |
| 65 to 74 Years | 17 (7.9%) | 35 (13.5%) |
| 75 Years and over | 17 (7.9%) | 8 (1.8%) |
| Total | 64 (2.5%) | 81 (3.1%) |
Income Above Poverty by Sex and Age in Shanor Northvue
According to the poverty statistics in Shanor Northvue, males aged under 5 years and females aged under 5 years are the age groups that are most secure financially, with 100.0% of males and 100.0% of females in these age groups living above the poverty line.
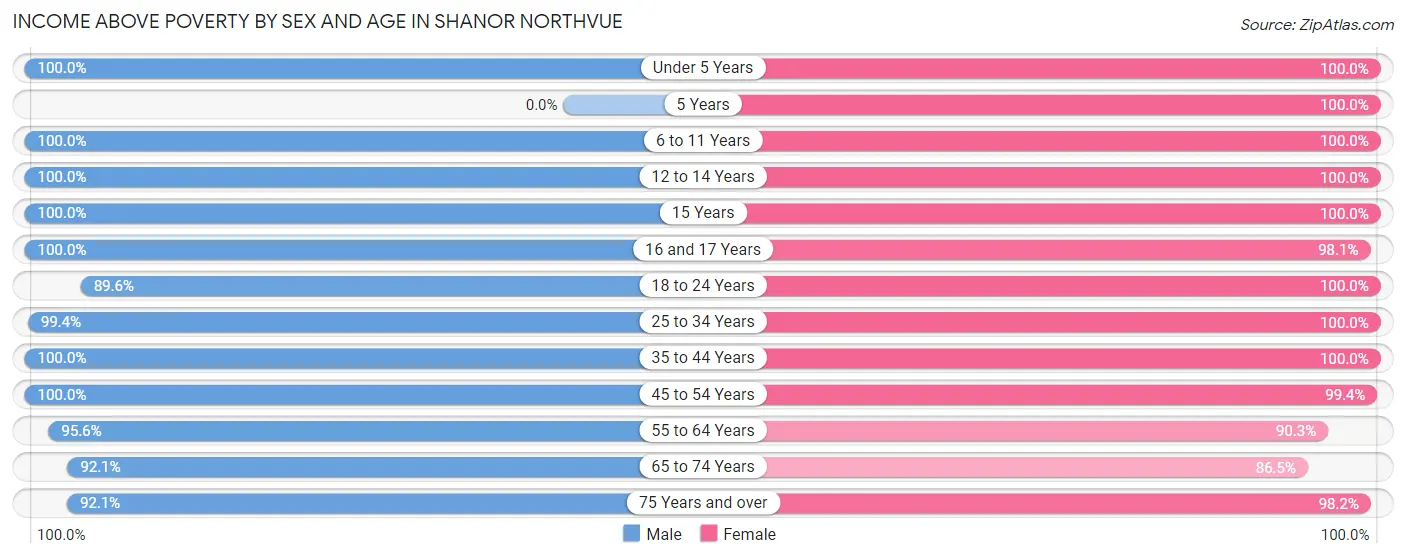
| Age Bracket | Male | Female |
| Under 5 Years | 157 (100.0%) | 213 (100.0%) |
| 5 Years | 0 (0.0%) | 22 (100.0%) |
| 6 to 11 Years | 169 (100.0%) | 245 (100.0%) |
| 12 to 14 Years | 169 (100.0%) | 24 (100.0%) |
| 15 Years | 92 (100.0%) | 13 (100.0%) |
| 16 and 17 Years | 33 (100.0%) | 51 (98.1%) |
| 18 to 24 Years | 129 (89.6%) | 105 (100.0%) |
| 25 to 34 Years | 332 (99.4%) | 236 (100.0%) |
| 35 to 44 Years | 402 (100.0%) | 308 (100.0%) |
| 45 to 54 Years | 316 (100.0%) | 333 (99.4%) |
| 55 to 64 Years | 281 (95.6%) | 324 (90.2%) |
| 65 to 74 Years | 197 (92.1%) | 224 (86.5%) |
| 75 Years and over | 199 (92.1%) | 428 (98.2%) |
| Total | 2,476 (97.5%) | 2,526 (96.9%) |
Income Below Poverty Among Married-Couple Families in Shanor Northvue
The poverty statistics for married-couple families in Shanor Northvue show that 1.4% or 17 of the total 1,237 families live below the poverty line. Families with no children have the highest poverty rate of 2.6%, comprising of 17 families. On the other hand, families with 1 or 2 children have the lowest poverty rate of 0.0%, which includes 0 families.
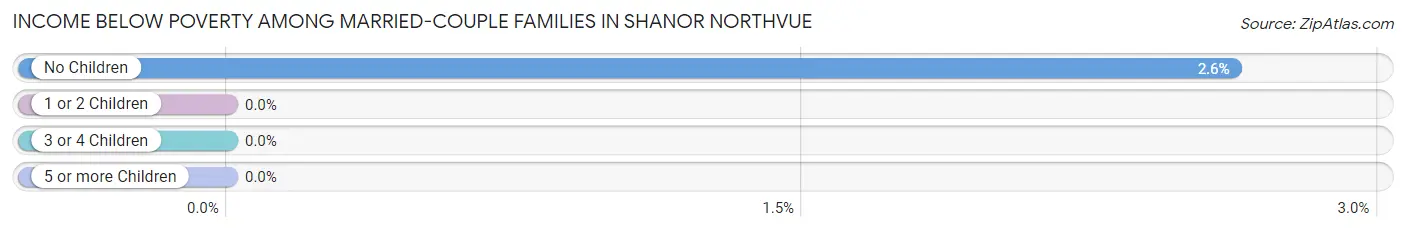
| Children | Above Poverty | Below Poverty |
| No Children | 631 (97.4%) | 17 (2.6%) |
| 1 or 2 Children | 491 (100.0%) | 0 (0.0%) |
| 3 or 4 Children | 98 (100.0%) | 0 (0.0%) |
| 5 or more Children | 0 (0.0%) | 0 (0.0%) |
| Total | 1,220 (98.6%) | 17 (1.4%) |
Income Below Poverty Among Single-Parent Households in Shanor Northvue
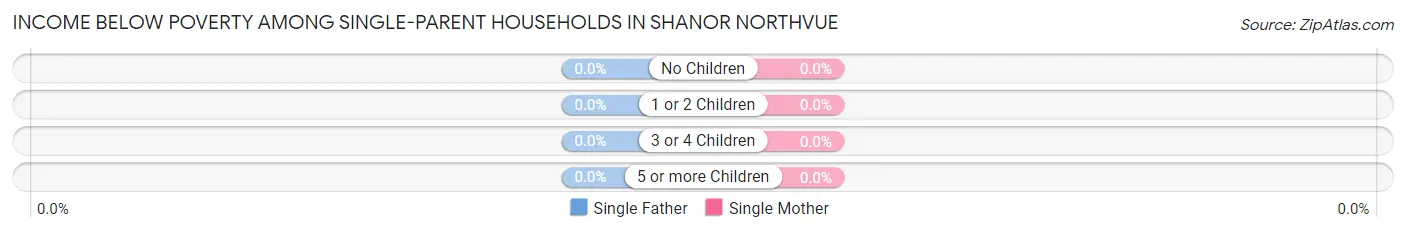
| Children | Single Father | Single Mother |
| No Children | 0 (0.0%) | 0 (0.0%) |
| 1 or 2 Children | 0 (0.0%) | 0 (0.0%) |
| 3 or 4 Children | 0 (0.0%) | 0 (0.0%) |
| 5 or more Children | 0 (0.0%) | 0 (0.0%) |
| Total | 0 (0.0%) | 0 (0.0%) |
Income Below Poverty Among Married-Couple vs Single-Parent Households in Shanor Northvue
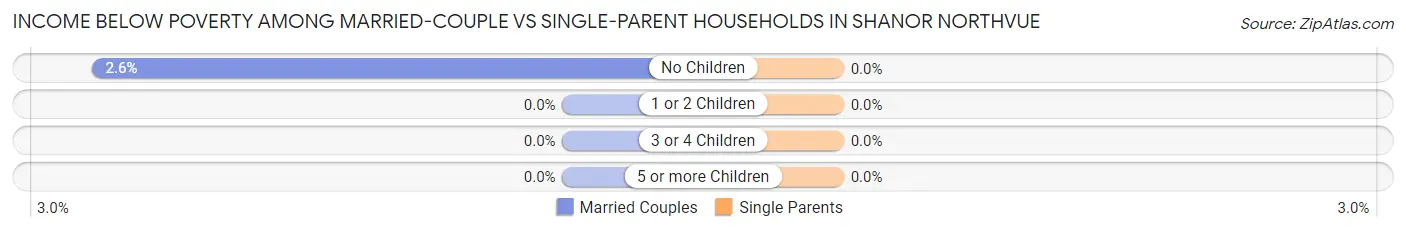
| Children | Married-Couple Families | Single-Parent Households |
| No Children | 17 (2.6%) | 0 (0.0%) |
| 1 or 2 Children | 0 (0.0%) | 0 (0.0%) |
| 3 or 4 Children | 0 (0.0%) | 0 (0.0%) |
| 5 or more Children | 0 (0.0%) | 0 (0.0%) |
| Total | 17 (1.4%) | 0 (0.0%) |
Race in Shanor Northvue
The most populous races in Shanor Northvue are White / Caucasian (5,105 | 99.2%), Hispanic or Latino (138 | 2.7%), and Black / African American (15 | 0.3%).
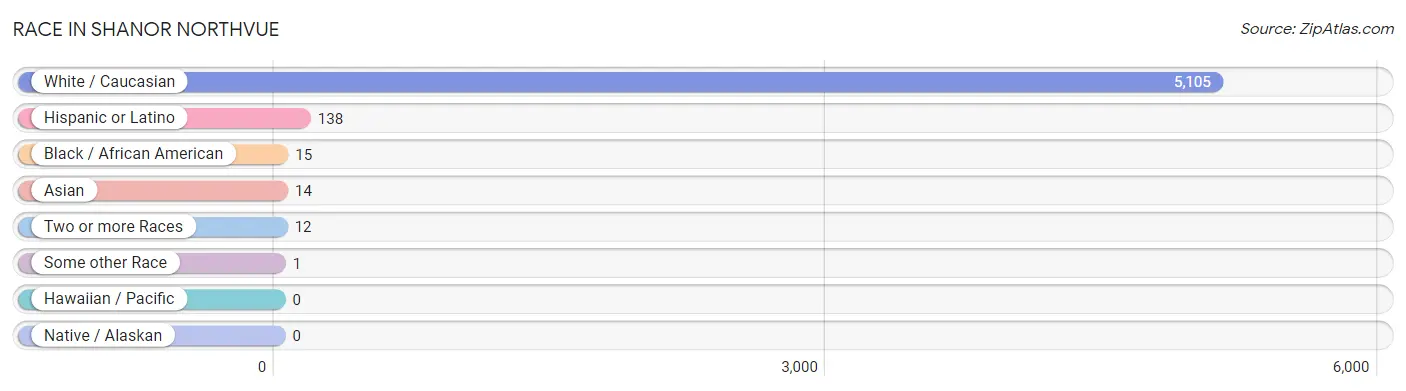
| Race | # Population | % Population |
| Asian | 14 | 0.3% |
| Black / African American | 15 | 0.3% |
| Hawaiian / Pacific | 0 | 0.0% |
| Hispanic or Latino | 138 | 2.7% |
| Native / Alaskan | 0 | 0.0% |
| White / Caucasian | 5,105 | 99.2% |
| Two or more Races | 12 | 0.2% |
| Some other Race | 1 | 0.0% |
| Total | 5,147 | 100.0% |
Ancestry in Shanor Northvue
The most populous ancestries reported in Shanor Northvue are German (2,351 | 45.7%), Italian (1,060 | 20.6%), Irish (741 | 14.4%), English (608 | 11.8%), and Polish (428 | 8.3%), together accounting for 100.8% of all Shanor Northvue residents.
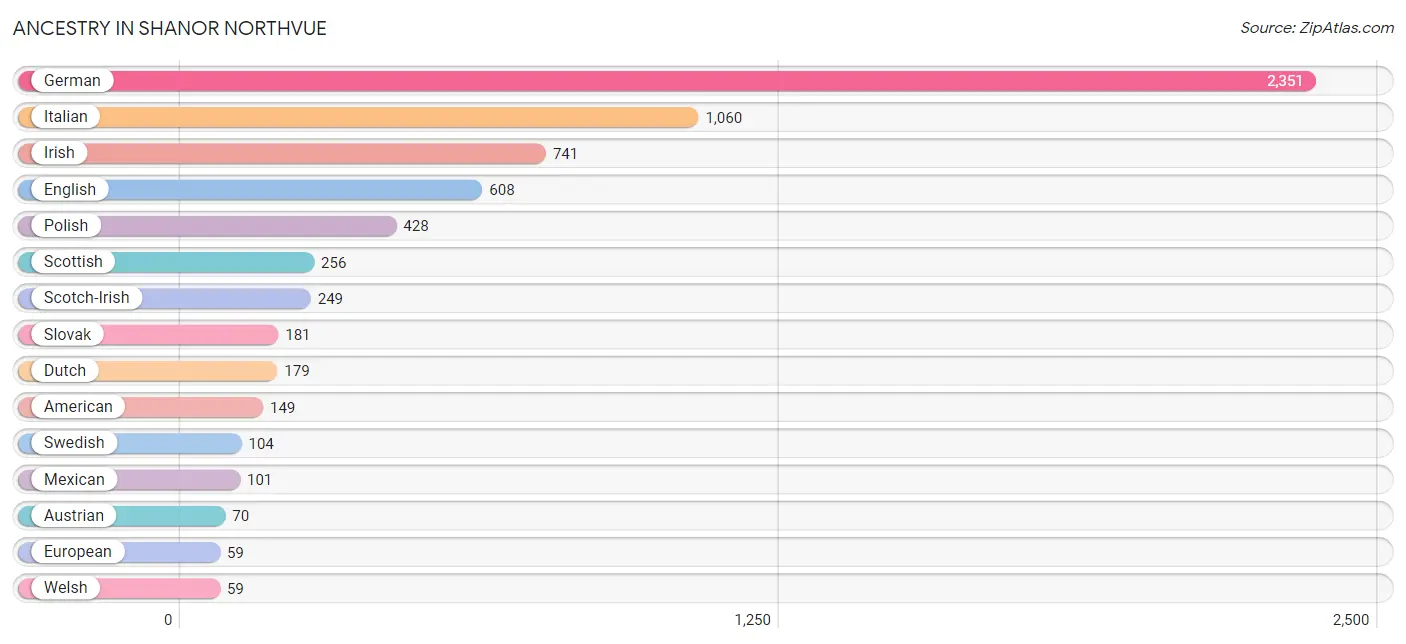
| Ancestry | # Population | % Population |
| American | 149 | 2.9% |
| Austrian | 70 | 1.4% |
| Bhutanese | 12 | 0.2% |
| British | 35 | 0.7% |
| Croatian | 30 | 0.6% |
| Czechoslovakian | 26 | 0.5% |
| Dutch | 179 | 3.5% |
| Eastern European | 58 | 1.1% |
| English | 608 | 11.8% |
| European | 59 | 1.1% |
| Finnish | 35 | 0.7% |
| French | 30 | 0.6% |
| German | 2,351 | 45.7% |
| Hungarian | 18 | 0.4% |
| Irish | 741 | 14.4% |
| Italian | 1,060 | 20.6% |
| Japanese | 14 | 0.3% |
| Lithuanian | 46 | 0.9% |
| Mexican | 101 | 2.0% |
| Norwegian | 42 | 0.8% |
| Pennsylvania German | 15 | 0.3% |
| Polish | 428 | 8.3% |
| Portuguese | 43 | 0.8% |
| Puerto Rican | 36 | 0.7% |
| Russian | 35 | 0.7% |
| Scotch-Irish | 249 | 4.8% |
| Scottish | 256 | 5.0% |
| Serbian | 19 | 0.4% |
| Slavic | 18 | 0.4% |
| Slovak | 181 | 3.5% |
| Slovene | 14 | 0.3% |
| Swedish | 104 | 2.0% |
| Swiss | 16 | 0.3% |
| Ukrainian | 34 | 0.7% |
| Welsh | 59 | 1.1% | View All 35 Rows |
Immigrants in Shanor Northvue
The most numerous immigrant groups reported in Shanor Northvue came from Europe (46 | 0.9%), Germany (46 | 0.9%), Western Europe (46 | 0.9%), Asia (14 | 0.3%), and Cambodia (14 | 0.3%), together accounting for 3.2% of all Shanor Northvue residents.
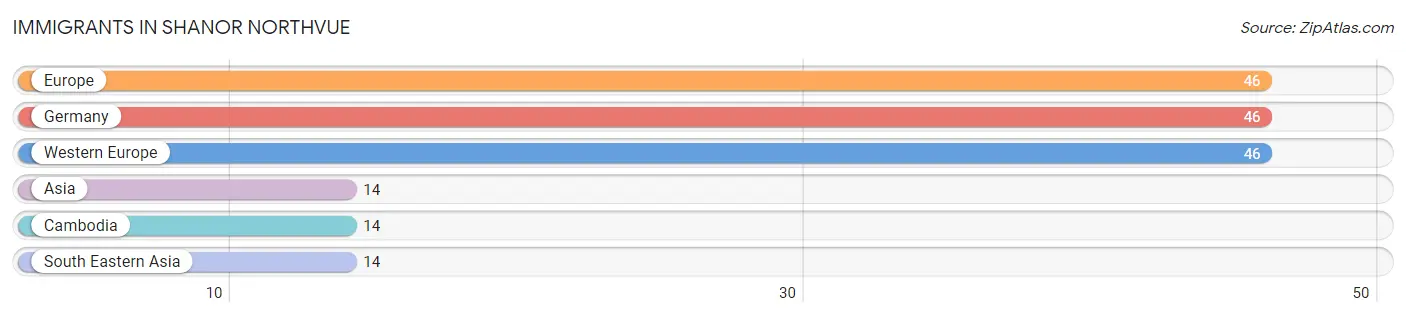
| Immigration Origin | # Population | % Population |
| Asia | 14 | 0.3% |
| Cambodia | 14 | 0.3% |
| Europe | 46 | 0.9% |
| Germany | 46 | 0.9% |
| South Eastern Asia | 14 | 0.3% |
| Western Europe | 46 | 0.9% | View All 6 Rows |
Sex and Age in Shanor Northvue
Sex and Age in Shanor Northvue
The most populous age groups in Shanor Northvue are 35 to 39 Years (237 | 9.3%) for men and 50 to 54 Years (257 | 9.9%) for women.
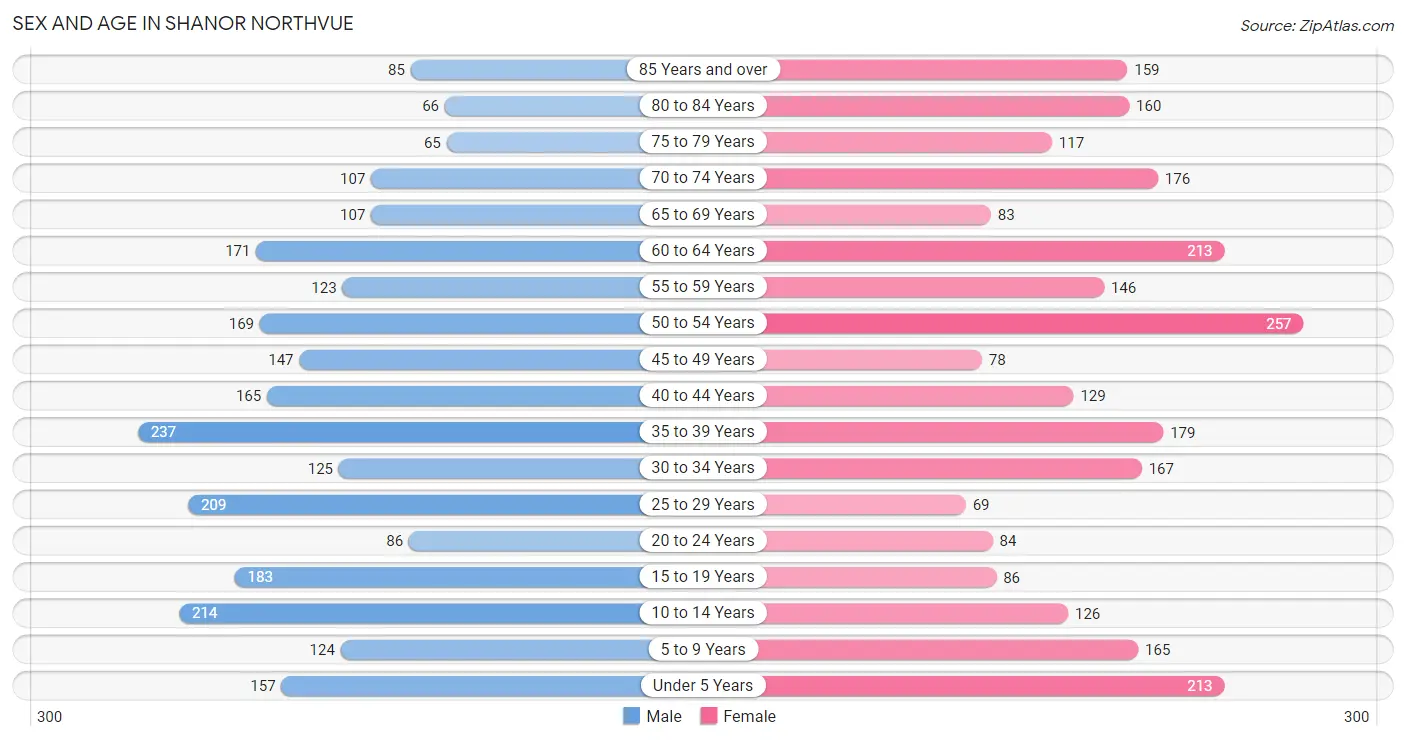
| Age Bracket | Male | Female |
| Under 5 Years | 157 (6.2%) | 213 (8.2%) |
| 5 to 9 Years | 124 (4.9%) | 165 (6.3%) |
| 10 to 14 Years | 214 (8.4%) | 126 (4.8%) |
| 15 to 19 Years | 183 (7.2%) | 86 (3.3%) |
| 20 to 24 Years | 86 (3.4%) | 84 (3.2%) |
| 25 to 29 Years | 209 (8.2%) | 69 (2.6%) |
| 30 to 34 Years | 125 (4.9%) | 167 (6.4%) |
| 35 to 39 Years | 237 (9.3%) | 179 (6.9%) |
| 40 to 44 Years | 165 (6.5%) | 129 (5.0%) |
| 45 to 49 Years | 147 (5.8%) | 78 (3.0%) |
| 50 to 54 Years | 169 (6.7%) | 257 (9.9%) |
| 55 to 59 Years | 123 (4.8%) | 146 (5.6%) |
| 60 to 64 Years | 171 (6.7%) | 213 (8.2%) |
| 65 to 69 Years | 107 (4.2%) | 83 (3.2%) |
| 70 to 74 Years | 107 (4.2%) | 176 (6.8%) |
| 75 to 79 Years | 65 (2.6%) | 117 (4.5%) |
| 80 to 84 Years | 66 (2.6%) | 160 (6.1%) |
| 85 Years and over | 85 (3.4%) | 159 (6.1%) |
| Total | 2,540 (100.0%) | 2,607 (100.0%) |
Families and Households in Shanor Northvue
Median Family Size in Shanor Northvue
The median family size in Shanor Northvue is 2.98 persons per family, with married-couple families (1,237 | 87.6%) accounting for the largest median family size of 3.02 persons per family. On the other hand, single male/father families (33 | 2.3%) represent the smallest median family size with 2.55 persons per family.
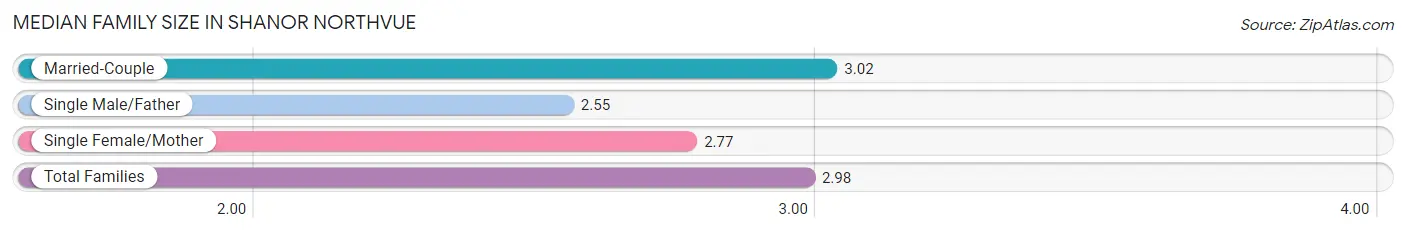
| Family Type | # Families | Family Size |
| Married-Couple | 1,237 (87.6%) | 3.02 |
| Single Male/Father | 33 (2.3%) | 2.55 |
| Single Female/Mother | 142 (10.1%) | 2.77 |
| Total Families | 1,412 (100.0%) | 2.98 |
Median Household Size in Shanor Northvue
The median household size in Shanor Northvue is 2.30 persons per household, with single female/mother households (142 | 6.4%) accounting for the largest median household size of 3.15 persons per household. non-family households (821 | 36.8%) represent the smallest median household size with 1.05 persons per household.
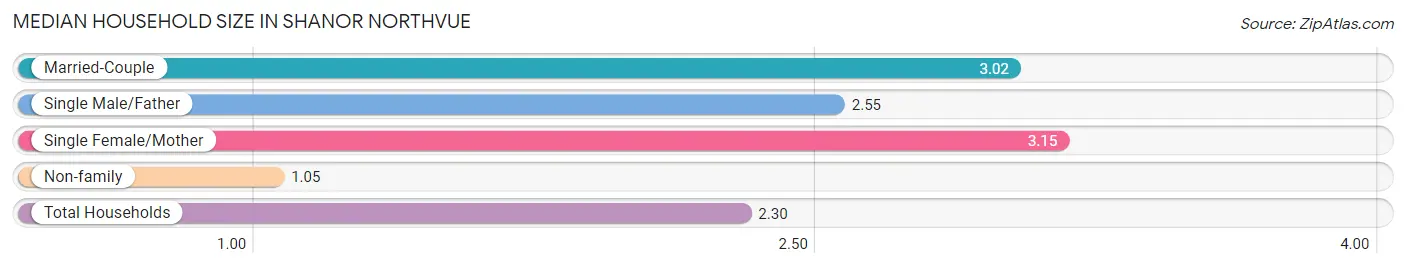
| Household Type | # Households | Household Size |
| Married-Couple | 1,237 (55.4%) | 3.02 |
| Single Male/Father | 33 (1.5%) | 2.55 |
| Single Female/Mother | 142 (6.4%) | 3.15 |
| Non-family | 821 (36.8%) | 1.05 |
| Total Households | 2,233 (100.0%) | 2.30 |
Household Size by Marriage Status in Shanor Northvue
Out of a total of 2,233 households in Shanor Northvue, 1,412 (63.2%) are family households, while 821 (36.8%) are nonfamily households. The most numerous type of family households are 2-person households, comprising 645, and the most common type of nonfamily households are 1-person households, comprising 770.
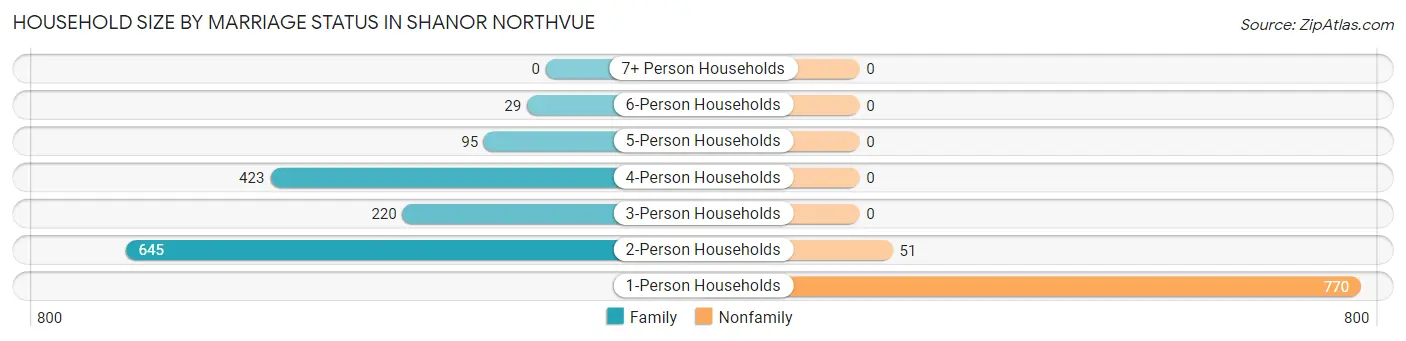
| Household Size | Family Households | Nonfamily Households |
| 1-Person Households | - | 770 (34.5%) |
| 2-Person Households | 645 (28.9%) | 51 (2.3%) |
| 3-Person Households | 220 (9.9%) | 0 (0.0%) |
| 4-Person Households | 423 (18.9%) | 0 (0.0%) |
| 5-Person Households | 95 (4.3%) | 0 (0.0%) |
| 6-Person Households | 29 (1.3%) | 0 (0.0%) |
| 7+ Person Households | 0 (0.0%) | 0 (0.0%) |
| Total | 1,412 (63.2%) | 821 (36.8%) |
Female Fertility in Shanor Northvue
Fertility by Age in Shanor Northvue
Average fertility rate in Shanor Northvue is 133.0 births per 1,000 women. Women in the age bracket of 20 to 34 years have the highest fertility rate with 234.0 births per 1,000 women. Women in the age bracket of 20 to 34 years acount for 65.2% of all women with births.
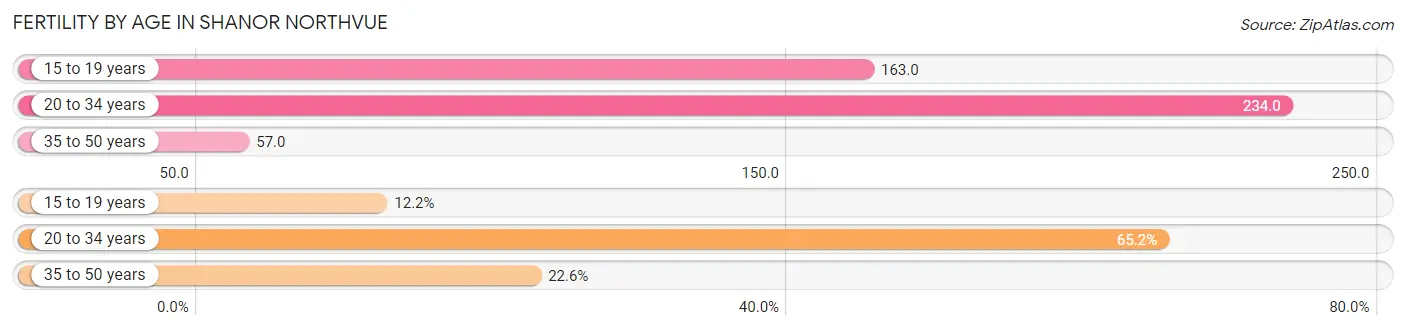
| Age Bracket | Women with Births | Births / 1,000 Women |
| 15 to 19 years | 14 (12.2%) | 163.0 |
| 20 to 34 years | 75 (65.2%) | 234.0 |
| 35 to 50 years | 26 (22.6%) | 57.0 |
| Total | 115 (100.0%) | 133.0 |
Fertility by Age by Marriage Status in Shanor Northvue
38.3% of women with births (115) in Shanor Northvue are married. The highest percentage of unmarried women with births falls into 15 to 19 years age bracket with 100.0% of them unmarried at the time of birth, while the lowest percentage of unmarried women with births belong to 35 to 50 years age bracket with 0.0% of them unmarried.
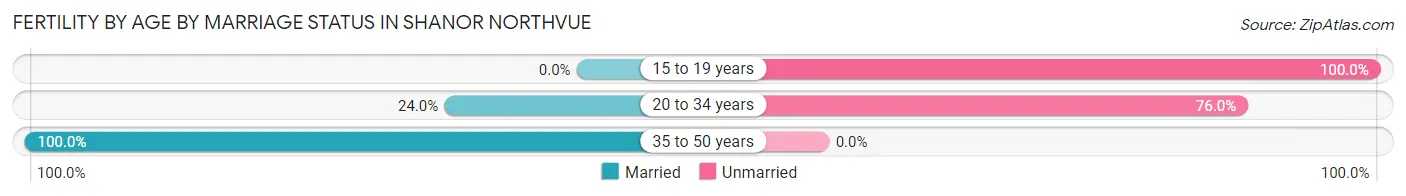
| Age Bracket | Married | Unmarried |
| 15 to 19 years | 0 (0.0%) | 14 (100.0%) |
| 20 to 34 years | 18 (24.0%) | 57 (76.0%) |
| 35 to 50 years | 26 (100.0%) | 0 (0.0%) |
| Total | 44 (38.3%) | 71 (61.7%) |
Fertility by Education in Shanor Northvue
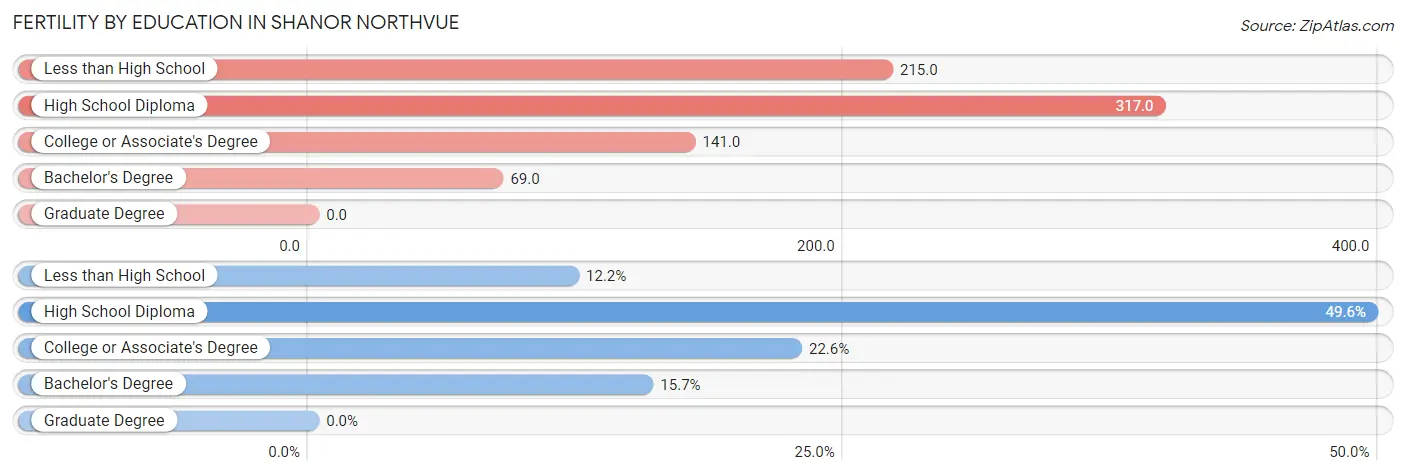
| Educational Attainment | Women with Births | Births / 1,000 Women |
| Less than High School | 14 (12.2%) | 215.0 |
| High School Diploma | 57 (49.6%) | 317.0 |
| College or Associate's Degree | 26 (22.6%) | 141.0 |
| Bachelor's Degree | 18 (15.7%) | 69.0 |
| Graduate Degree | 0 (0.0%) | 0.0 |
| Total | 115 (100.0%) | 133.0 |
Fertility by Education by Marriage Status in Shanor Northvue
61.7% of women with births in Shanor Northvue are unmarried. Women with the educational attainment of college or associate's degree are most likely to be married with 100.0% of them married at childbirth, while women with the educational attainment of less than high school are least likely to be married with 100.0% of them unmarried at childbirth.
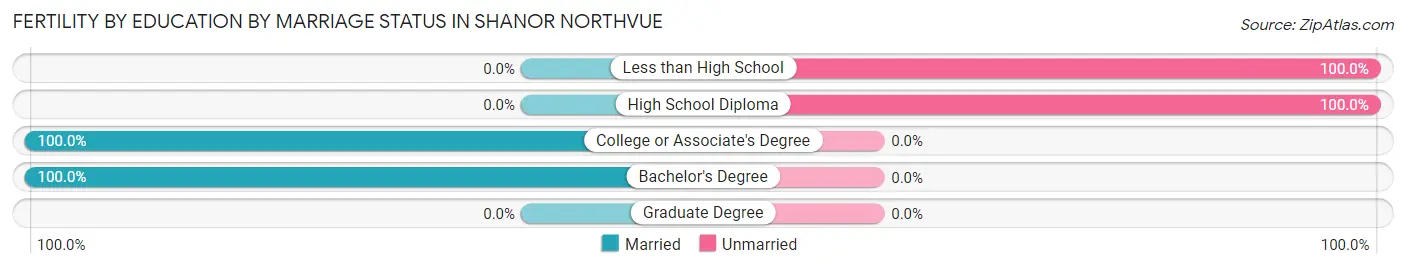
| Educational Attainment | Married | Unmarried |
| Less than High School | 0 (0.0%) | 14 (100.0%) |
| High School Diploma | 0 (0.0%) | 57 (100.0%) |
| College or Associate's Degree | 26 (100.0%) | 0 (0.0%) |
| Bachelor's Degree | 18 (100.0%) | 0 (0.0%) |
| Graduate Degree | 0 (0.0%) | 0 (0.0%) |
| Total | 44 (38.3%) | 71 (61.7%) |
Employment Characteristics in Shanor Northvue
Employment by Class of Employer in Shanor Northvue
Among the 2,295 employed individuals in Shanor Northvue, private company employees (1,312 | 57.2%), not-for-profit organizations (266 | 11.6%), and federal government employees (210 | 9.1%) make up the most common classes of employment.
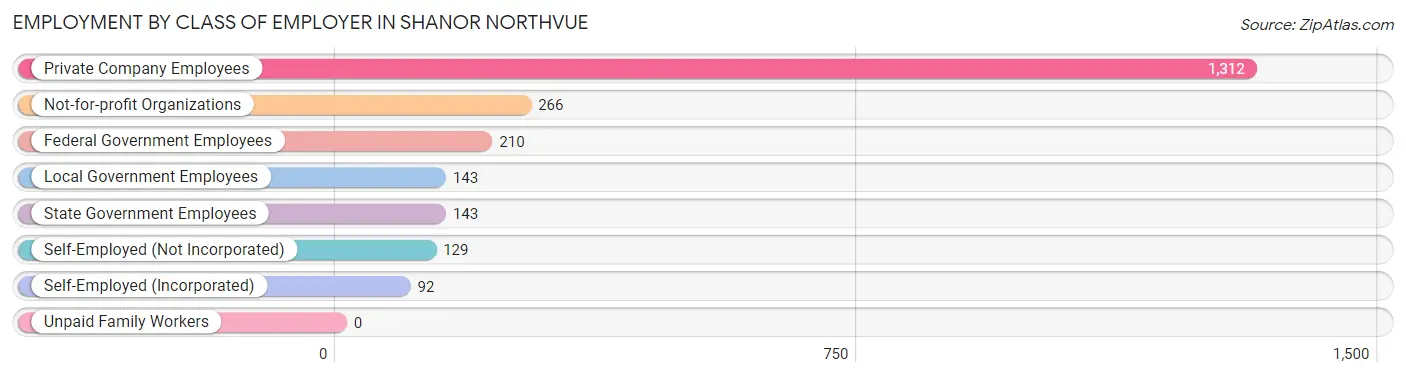
| Employer Class | # Employees | % Employees |
| Private Company Employees | 1,312 | 57.2% |
| Self-Employed (Incorporated) | 92 | 4.0% |
| Self-Employed (Not Incorporated) | 129 | 5.6% |
| Not-for-profit Organizations | 266 | 11.6% |
| Local Government Employees | 143 | 6.2% |
| State Government Employees | 143 | 6.2% |
| Federal Government Employees | 210 | 9.1% |
| Unpaid Family Workers | 0 | 0.0% |
| Total | 2,295 | 100.0% |
Employment Status by Age in Shanor Northvue
According to the labor force statistics for Shanor Northvue, out of the total population over 16 years of age (4,043), 58.9% or 2,381 individuals are in the labor force, with 1.5% or 36 of them unemployed. The age group with the highest labor force participation rate is 30 to 34 years, with 96.2% or 281 individuals in the labor force. Within the labor force, the 55 to 59 years age range has the highest percentage of unemployed individuals, with 7.3% or 9 of them being unemployed.
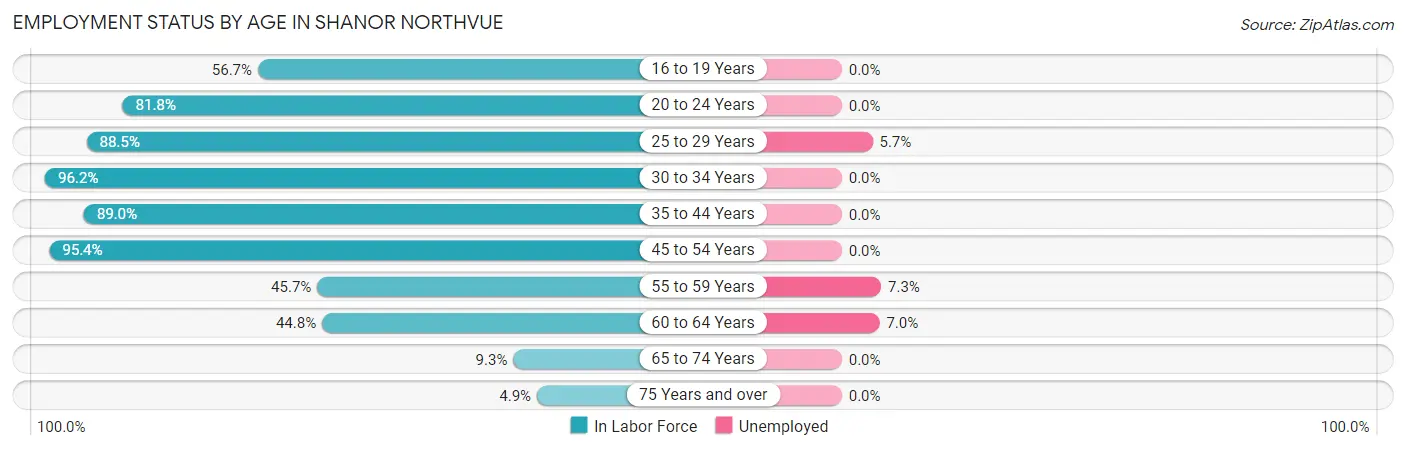
| Age Bracket | In Labor Force | Unemployed |
| 16 to 19 Years | 93 (56.7%) | 0 (0.0%) |
| 20 to 24 Years | 139 (81.8%) | 0 (0.0%) |
| 25 to 29 Years | 246 (88.5%) | 14 (5.7%) |
| 30 to 34 Years | 281 (96.2%) | 0 (0.0%) |
| 35 to 44 Years | 632 (89.0%) | 0 (0.0%) |
| 45 to 54 Years | 621 (95.4%) | 0 (0.0%) |
| 55 to 59 Years | 123 (45.7%) | 9 (7.3%) |
| 60 to 64 Years | 172 (44.8%) | 12 (7.0%) |
| 65 to 74 Years | 44 (9.3%) | 0 (0.0%) |
| 75 Years and over | 32 (4.9%) | 0 (0.0%) |
| Total | 2,381 (58.9%) | 36 (1.5%) |
Employment Status by Educational Attainment in Shanor Northvue
According to labor force statistics for Shanor Northvue, 80.3% of individuals (2,075) out of the total population between 25 and 64 years of age (2,584) are in the labor force, with 1.7% or 35 of them being unemployed. The group with the highest labor force participation rate are those with the educational attainment of college / associate degree, with 91.5% or 528 individuals in the labor force. Within the labor force, individuals with college / associate degree education have the highest percentage of unemployment, with 4.4% or 23 of them being unemployed.
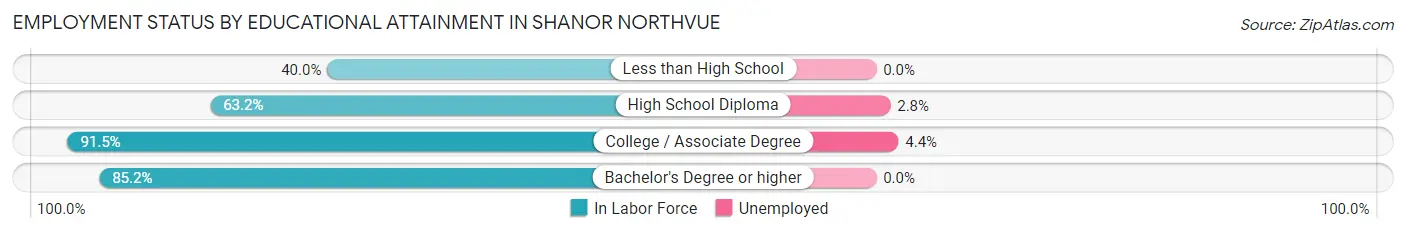
| Educational Attainment | In Labor Force | Unemployed |
| Less than High School | 14 (40.0%) | 0 (0.0%) |
| High School Diploma | 422 (63.2%) | 19 (2.8%) |
| College / Associate Degree | 528 (91.5%) | 25 (4.4%) |
| Bachelor's Degree or higher | 1,111 (85.2%) | 0 (0.0%) |
| Total | 2,075 (80.3%) | 44 (1.7%) |
Employment Occupations by Sex in Shanor Northvue
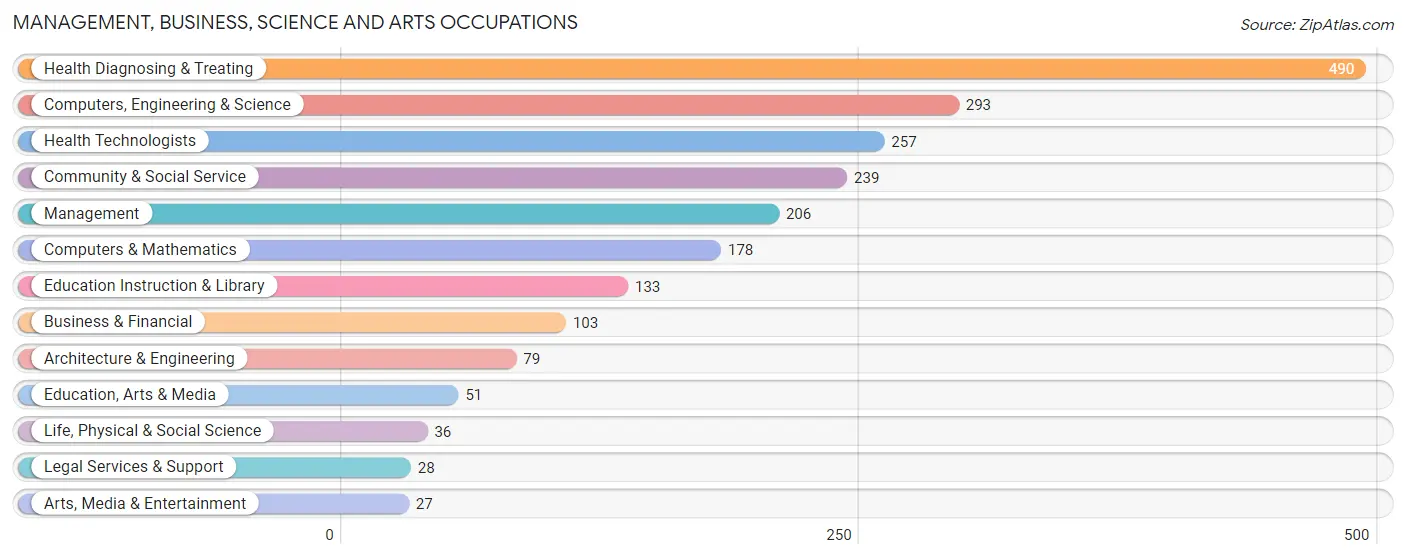
Management, Business, Science and Arts Occupations
The most common Management, Business, Science and Arts occupations in Shanor Northvue are Health Diagnosing & Treating (490 | 20.9%), Computers, Engineering & Science (293 | 12.5%), Health Technologists (257 | 11.0%), Community & Social Service (239 | 10.2%), and Management (206 | 8.8%).
Management, Business, Science and Arts Occupations by Sex
Within the Management, Business, Science and Arts occupations in Shanor Northvue, the most male-oriented occupations are Life, Physical & Social Science (100.0%), Legal Services & Support (100.0%), and Arts, Media & Entertainment (100.0%), while the most female-oriented occupations are Health Technologists (80.9%), Business & Financial (75.7%), and Education Instruction & Library (68.4%).
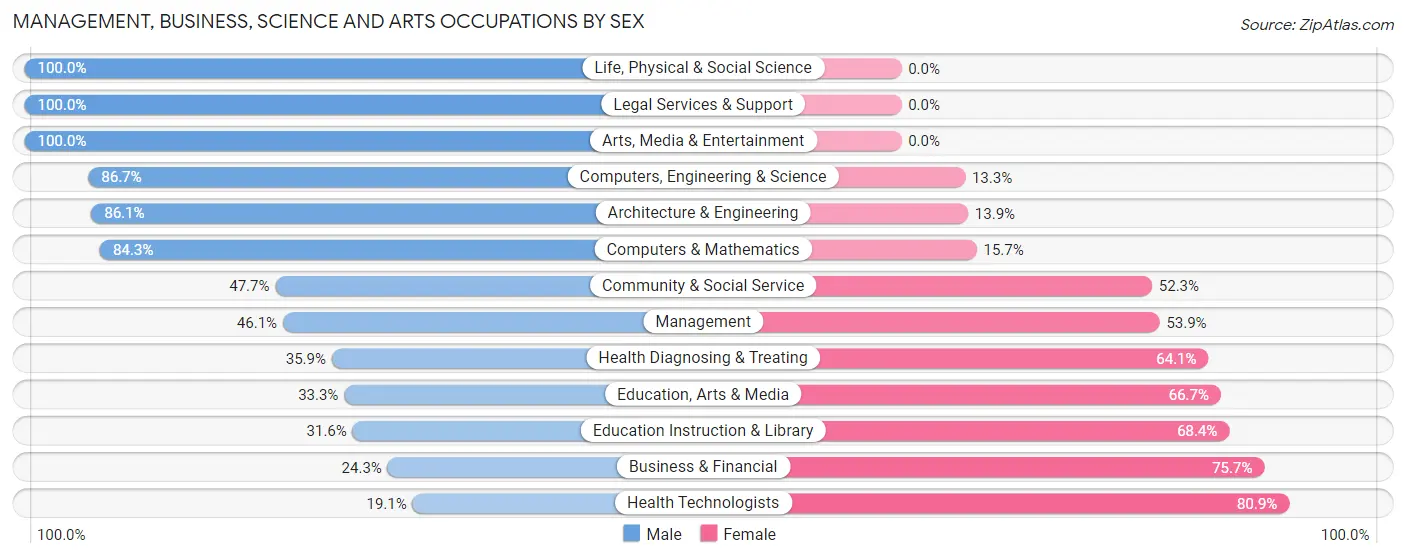
| Occupation | Male | Female |
| Management | 95 (46.1%) | 111 (53.9%) |
| Business & Financial | 25 (24.3%) | 78 (75.7%) |
| Computers, Engineering & Science | 254 (86.7%) | 39 (13.3%) |
| Computers & Mathematics | 150 (84.3%) | 28 (15.7%) |
| Architecture & Engineering | 68 (86.1%) | 11 (13.9%) |
| Life, Physical & Social Science | 36 (100.0%) | 0 (0.0%) |
| Community & Social Service | 114 (47.7%) | 125 (52.3%) |
| Education, Arts & Media | 17 (33.3%) | 34 (66.7%) |
| Legal Services & Support | 28 (100.0%) | 0 (0.0%) |
| Education Instruction & Library | 42 (31.6%) | 91 (68.4%) |
| Arts, Media & Entertainment | 27 (100.0%) | 0 (0.0%) |
| Health Diagnosing & Treating | 176 (35.9%) | 314 (64.1%) |
| Health Technologists | 49 (19.1%) | 208 (80.9%) |
| Total (Category) | 664 (49.9%) | 667 (50.1%) |
| Total (Overall) | 1,306 (55.6%) | 1,042 (44.4%) |
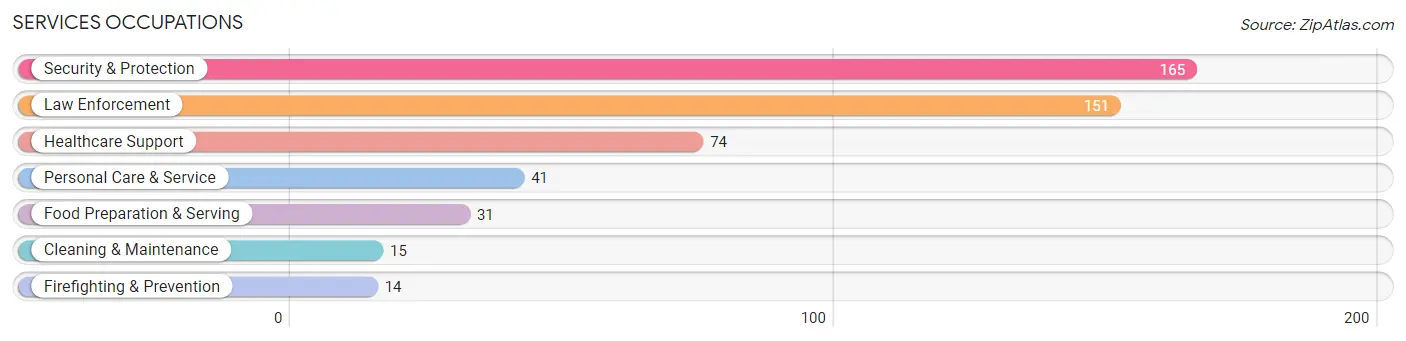
Services Occupations
The most common Services occupations in Shanor Northvue are Security & Protection (165 | 7.0%), Law Enforcement (151 | 6.4%), Healthcare Support (74 | 3.2%), Personal Care & Service (41 | 1.8%), and Food Preparation & Serving (31 | 1.3%).
Services Occupations by Sex
Within the Services occupations in Shanor Northvue, the most male-oriented occupations are Firefighting & Prevention (100.0%), Security & Protection (80.0%), and Law Enforcement (78.1%), while the most female-oriented occupations are Healthcare Support (100.0%), Food Preparation & Serving (100.0%), and Cleaning & Maintenance (100.0%).
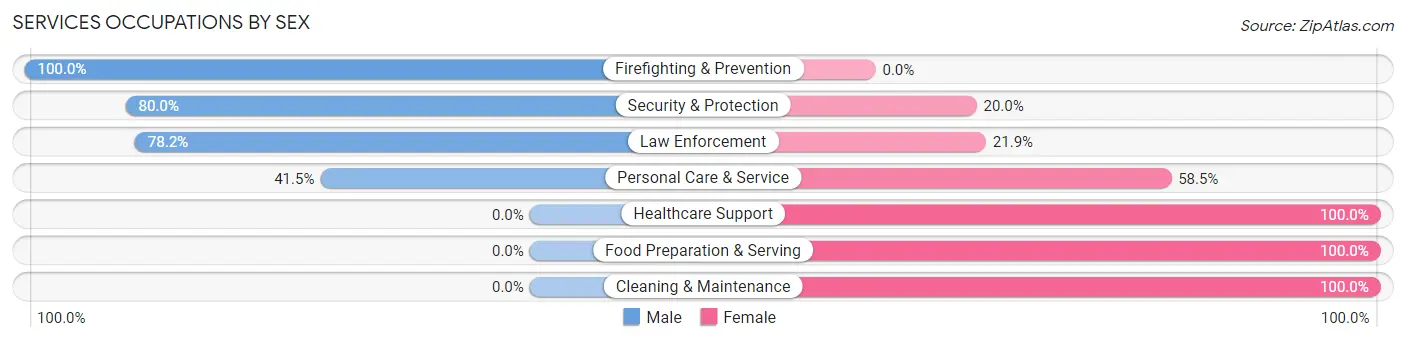
| Occupation | Male | Female |
| Healthcare Support | 0 (0.0%) | 74 (100.0%) |
| Security & Protection | 132 (80.0%) | 33 (20.0%) |
| Firefighting & Prevention | 14 (100.0%) | 0 (0.0%) |
| Law Enforcement | 118 (78.1%) | 33 (21.8%) |
| Food Preparation & Serving | 0 (0.0%) | 31 (100.0%) |
| Cleaning & Maintenance | 0 (0.0%) | 15 (100.0%) |
| Personal Care & Service | 17 (41.5%) | 24 (58.5%) |
| Total (Category) | 149 (45.7%) | 177 (54.3%) |
| Total (Overall) | 1,306 (55.6%) | 1,042 (44.4%) |
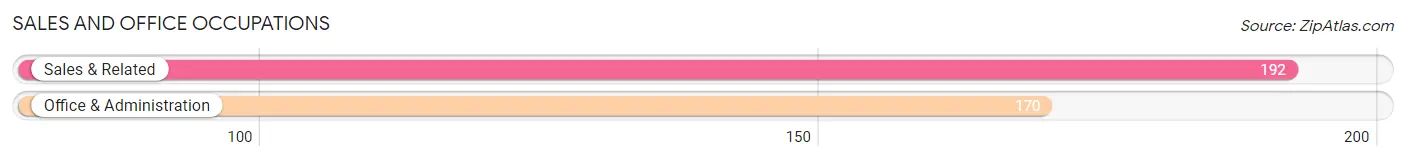
Sales and Office Occupations
The most common Sales and Office occupations in Shanor Northvue are Sales & Related (192 | 8.2%), and Office & Administration (170 | 7.2%).
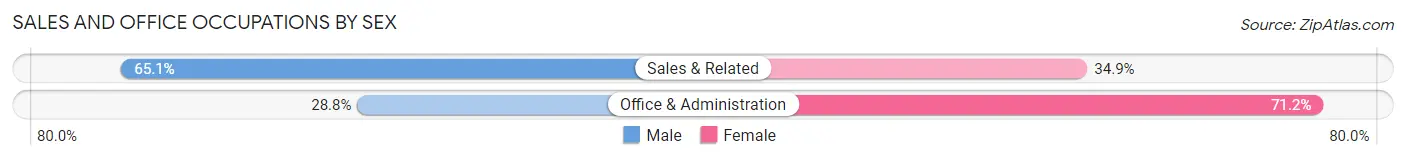
Sales and Office Occupations by Sex
| Occupation | Male | Female |
| Sales & Related | 125 (65.1%) | 67 (34.9%) |
| Office & Administration | 49 (28.8%) | 121 (71.2%) |
| Total (Category) | 174 (48.1%) | 188 (51.9%) |
| Total (Overall) | 1,306 (55.6%) | 1,042 (44.4%) |
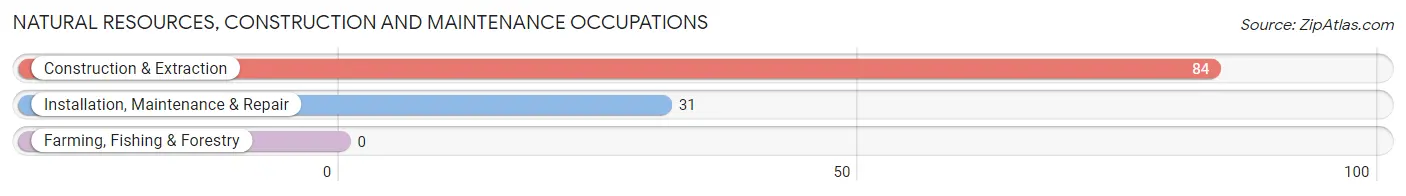
Natural Resources, Construction and Maintenance Occupations
The most common Natural Resources, Construction and Maintenance occupations in Shanor Northvue are Construction & Extraction (84 | 3.6%), and Installation, Maintenance & Repair (31 | 1.3%).
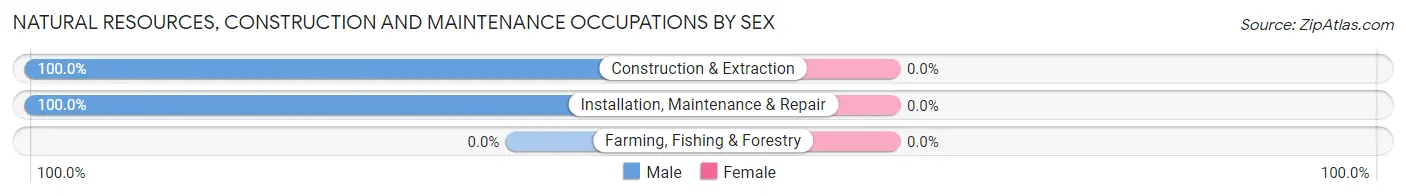
Natural Resources, Construction and Maintenance Occupations by Sex
| Occupation | Male | Female |
| Farming, Fishing & Forestry | 0 (0.0%) | 0 (0.0%) |
| Construction & Extraction | 84 (100.0%) | 0 (0.0%) |
| Installation, Maintenance & Repair | 31 (100.0%) | 0 (0.0%) |
| Total (Category) | 115 (100.0%) | 0 (0.0%) |
| Total (Overall) | 1,306 (55.6%) | 1,042 (44.4%) |
Production, Transportation and Moving Occupations
The most common Production, Transportation and Moving occupations in Shanor Northvue are Transportation (119 | 5.1%), Production (74 | 3.2%), and Material Moving (21 | 0.9%).
Production, Transportation and Moving Occupations by Sex
| Occupation | Male | Female |
| Production | 74 (100.0%) | 0 (0.0%) |
| Transportation | 119 (100.0%) | 0 (0.0%) |
| Material Moving | 11 (52.4%) | 10 (47.6%) |
| Total (Category) | 204 (95.3%) | 10 (4.7%) |
| Total (Overall) | 1,306 (55.6%) | 1,042 (44.4%) |
Employment Industries by Sex in Shanor Northvue
Employment Industries in Shanor Northvue
The major employment industries in Shanor Northvue include Health Care & Social Assistance (584 | 24.9%), Public Administration (280 | 11.9%), Manufacturing (244 | 10.4%), Retail Trade (200 | 8.5%), and Professional & Scientific (183 | 7.8%).
Employment Industries by Sex in Shanor Northvue
The Shanor Northvue industries that see more men than women are Mining, Quarrying, & Extraction (100.0%), Construction (100.0%), and Utilities (100.0%), whereas the industries that tend to have a higher number of women are Real Estate, Rental & Leasing (100.0%), Arts, Entertainment & Recreation (100.0%), and Educational Services (85.1%).

| Industry | Male | Female |
| Agriculture, Fishing & Hunting | 0 (0.0%) | 0 (0.0%) |
| Mining, Quarrying, & Extraction | 23 (100.0%) | 0 (0.0%) |
| Construction | 88 (100.0%) | 0 (0.0%) |
| Manufacturing | 195 (79.9%) | 49 (20.1%) |
| Wholesale Trade | 0 (0.0%) | 0 (0.0%) |
| Retail Trade | 160 (80.0%) | 40 (20.0%) |
| Transportation & Warehousing | 97 (78.9%) | 26 (21.1%) |
| Utilities | 20 (100.0%) | 0 (0.0%) |
| Information | 14 (50.0%) | 14 (50.0%) |
| Finance & Insurance | 32 (54.2%) | 27 (45.8%) |
| Real Estate, Rental & Leasing | 0 (0.0%) | 38 (100.0%) |
| Professional & Scientific | 160 (87.4%) | 23 (12.6%) |
| Enterprise Management | 0 (0.0%) | 0 (0.0%) |
| Administrative & Support | 86 (67.7%) | 41 (32.3%) |
| Educational Services | 27 (14.9%) | 154 (85.1%) |
| Health Care & Social Assistance | 180 (30.8%) | 404 (69.2%) |
| Arts, Entertainment & Recreation | 0 (0.0%) | 13 (100.0%) |
| Accommodation & Food Services | 35 (42.2%) | 48 (57.8%) |
| Public Administration | 155 (55.4%) | 125 (44.6%) |
| Total | 1,306 (55.6%) | 1,042 (44.4%) |
Education in Shanor Northvue
School Enrollment in Shanor Northvue
The most common levels of schooling among the 1,089 students in Shanor Northvue are middle school (278 | 25.5%), elementary school (234 | 21.5%), and high school (230 | 21.1%).
| School Level | # Students | % Students |
| Nursery / Preschool | 144 | 13.2% |
| Kindergarten | 50 | 4.6% |
| Elementary School | 234 | 21.5% |
| Middle School | 278 | 25.5% |
| High School | 230 | 21.1% |
| College / Undergraduate | 140 | 12.9% |
| Graduate / Professional | 13 | 1.2% |
| Total | 1,089 | 100.0% |
School Enrollment by Age by Funding Source in Shanor Northvue
Out of a total of 1,089 students who are enrolled in schools in Shanor Northvue, 207 (19.0%) attend a private institution, while the remaining 882 (81.0%) are enrolled in public schools. The age group of 20 to 24 year olds has the highest likelihood of being enrolled in private schools, with 31 (67.4% in the age bracket) enrolled. Conversely, the age group of 3 to 4 year olds has the lowest likelihood of being enrolled in a private school, with 132 (100.0% in the age bracket) attending a public institution.
| Age Bracket | Public School | Private School |
| 3 to 4 Year Olds | 132 (100.0%) | 0 (0.0%) |
| 5 to 9 Year Old | 220 (81.2%) | 51 (18.8%) |
| 10 to 14 Year Olds | 323 (95.0%) | 17 (5.0%) |
| 15 to 17 Year Olds | 96 (58.5%) | 68 (41.5%) |
| 18 to 19 Year Olds | 69 (100.0%) | 0 (0.0%) |
| 20 to 24 Year Olds | 15 (32.6%) | 31 (67.4%) |
| 25 to 34 Year Olds | 14 (43.8%) | 18 (56.2%) |
| 35 Years and over | 13 (37.1%) | 22 (62.9%) |
| Total | 882 (81.0%) | 207 (19.0%) |
Educational Attainment by Field of Study in Shanor Northvue
Science & technology (306 | 17.9%), business (290 | 17.0%), education (231 | 13.5%), social sciences (177 | 10.4%), and psychology (143 | 8.4%) are the most common fields of study among 1,709 individuals in Shanor Northvue who have obtained a bachelor's degree or higher.
| Field of Study | # Graduates | % Graduates |
| Computers & Mathematics | 125 | 7.3% |
| Bio, Nature & Agricultural | 16 | 0.9% |
| Physical & Health Sciences | 24 | 1.4% |
| Psychology | 143 | 8.4% |
| Social Sciences | 177 | 10.4% |
| Engineering | 108 | 6.3% |
| Multidisciplinary Studies | 0 | 0.0% |
| Science & Technology | 306 | 17.9% |
| Business | 290 | 17.0% |
| Education | 231 | 13.5% |
| Literature & Languages | 65 | 3.8% |
| Liberal Arts & History | 52 | 3.0% |
| Visual & Performing Arts | 55 | 3.2% |
| Communications | 70 | 4.1% |
| Arts & Humanities | 47 | 2.8% |
| Total | 1,709 | 100.0% |
Transportation & Commute in Shanor Northvue
Vehicle Availability by Sex in Shanor Northvue
The most prevalent vehicle ownership categories in Shanor Northvue are males with 2 vehicles (548, accounting for 43.8%) and females with 2 vehicles (547, making up 52.6%).
| Vehicles Available | Male | Female |
| No Vehicle | 0 (0.0%) | 0 (0.0%) |
| 1 Vehicle | 166 (13.3%) | 58 (5.6%) |
| 2 Vehicles | 548 (43.8%) | 547 (52.5%) |
| 3 Vehicles | 419 (33.5%) | 368 (35.3%) |
| 4 Vehicles | 101 (8.1%) | 51 (4.9%) |
| 5 or more Vehicles | 18 (1.4%) | 18 (1.7%) |
| Total | 1,252 (100.0%) | 1,042 (100.0%) |
Commute Time in Shanor Northvue
The most frequently occuring commute durations in Shanor Northvue are 10 to 14 minutes (482 commuters, 23.5%), 15 to 19 minutes (325 commuters, 15.9%), and 60 to 89 minutes (283 commuters, 13.8%).
| Commute Time | # Commuters | % Commuters |
| Less than 5 Minutes | 49 | 2.4% |
| 5 to 9 Minutes | 105 | 5.1% |
| 10 to 14 Minutes | 482 | 23.5% |
| 15 to 19 Minutes | 325 | 15.9% |
| 20 to 24 Minutes | 187 | 9.1% |
| 25 to 29 Minutes | 87 | 4.3% |
| 30 to 34 Minutes | 115 | 5.6% |
| 35 to 39 Minutes | 69 | 3.4% |
| 40 to 44 Minutes | 44 | 2.1% |
| 45 to 59 Minutes | 273 | 13.3% |
| 60 to 89 Minutes | 283 | 13.8% |
| 90 or more Minutes | 28 | 1.4% |
Commute Time by Sex in Shanor Northvue
The most common commute times in Shanor Northvue are 60 to 89 minutes (177 commuters, 16.2%) for males and 10 to 14 minutes (336 commuters, 35.1%) for females.
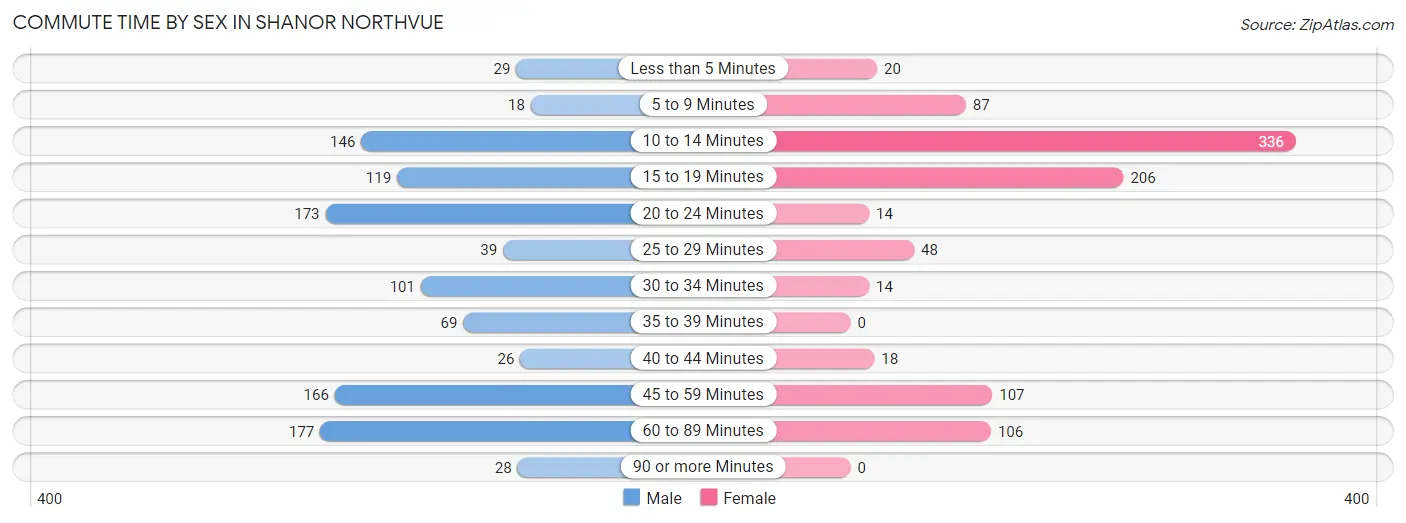
| Commute Time | Male | Female |
| Less than 5 Minutes | 29 (2.7%) | 20 (2.1%) |
| 5 to 9 Minutes | 18 (1.7%) | 87 (9.1%) |
| 10 to 14 Minutes | 146 (13.4%) | 336 (35.1%) |
| 15 to 19 Minutes | 119 (10.9%) | 206 (21.5%) |
| 20 to 24 Minutes | 173 (15.9%) | 14 (1.5%) |
| 25 to 29 Minutes | 39 (3.6%) | 48 (5.0%) |
| 30 to 34 Minutes | 101 (9.3%) | 14 (1.5%) |
| 35 to 39 Minutes | 69 (6.3%) | 0 (0.0%) |
| 40 to 44 Minutes | 26 (2.4%) | 18 (1.9%) |
| 45 to 59 Minutes | 166 (15.2%) | 107 (11.2%) |
| 60 to 89 Minutes | 177 (16.2%) | 106 (11.1%) |
| 90 or more Minutes | 28 (2.6%) | 0 (0.0%) |
Time of Departure to Work by Sex in Shanor Northvue
The most frequent times of departure to work in Shanor Northvue are 6:00 AM to 6:29 AM (182, 16.7%) for males and 7:00 AM to 7:29 AM (312, 32.6%) for females.
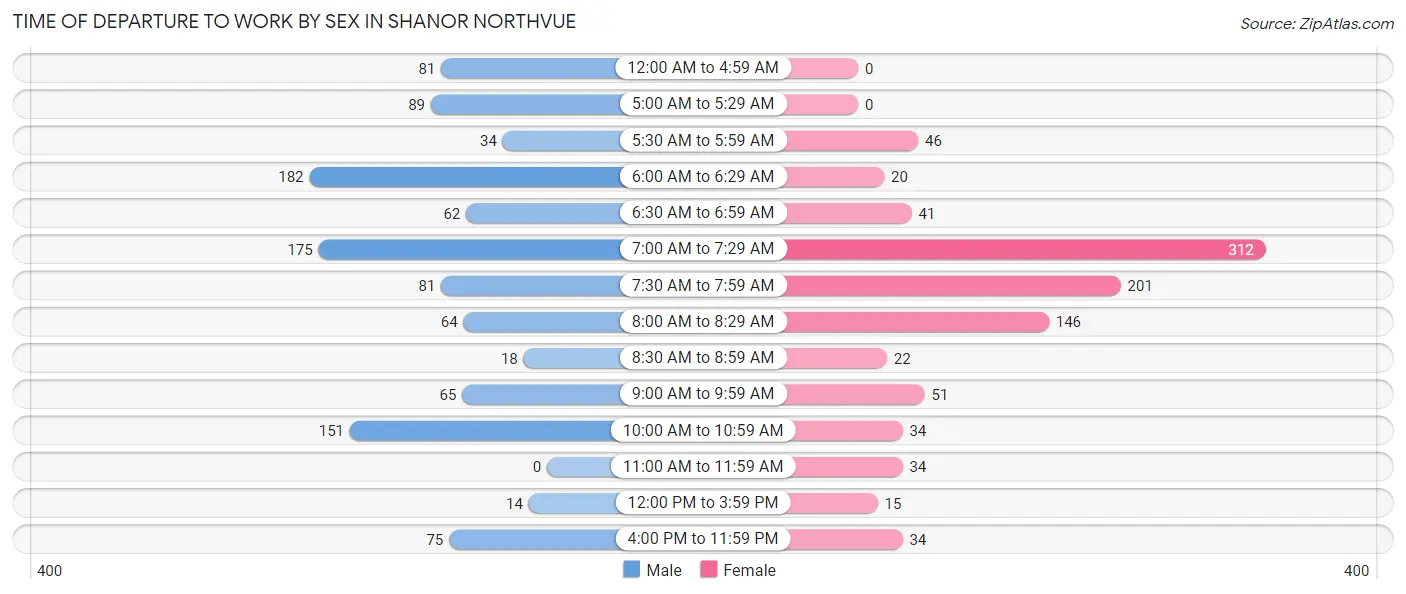
| Time of Departure | Male | Female |
| 12:00 AM to 4:59 AM | 81 (7.4%) | 0 (0.0%) |
| 5:00 AM to 5:29 AM | 89 (8.2%) | 0 (0.0%) |
| 5:30 AM to 5:59 AM | 34 (3.1%) | 46 (4.8%) |
| 6:00 AM to 6:29 AM | 182 (16.7%) | 20 (2.1%) |
| 6:30 AM to 6:59 AM | 62 (5.7%) | 41 (4.3%) |
| 7:00 AM to 7:29 AM | 175 (16.0%) | 312 (32.6%) |
| 7:30 AM to 7:59 AM | 81 (7.4%) | 201 (21.0%) |
| 8:00 AM to 8:29 AM | 64 (5.9%) | 146 (15.3%) |
| 8:30 AM to 8:59 AM | 18 (1.7%) | 22 (2.3%) |
| 9:00 AM to 9:59 AM | 65 (6.0%) | 51 (5.3%) |
| 10:00 AM to 10:59 AM | 151 (13.8%) | 34 (3.6%) |
| 11:00 AM to 11:59 AM | 0 (0.0%) | 34 (3.6%) |
| 12:00 PM to 3:59 PM | 14 (1.3%) | 15 (1.6%) |
| 4:00 PM to 11:59 PM | 75 (6.9%) | 34 (3.6%) |
| Total | 1,091 (100.0%) | 956 (100.0%) |
Housing Occupancy in Shanor Northvue
Occupancy by Ownership in Shanor Northvue
Of the total 2,233 dwellings in Shanor Northvue, owner-occupied units account for 1,782 (79.8%), while renter-occupied units make up 451 (20.2%).
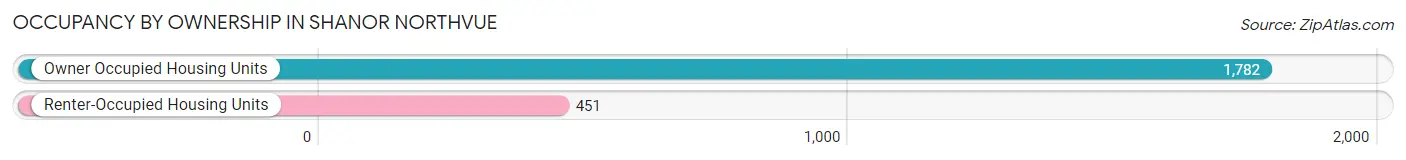
| Occupancy | # Housing Units | % Housing Units |
| Owner Occupied Housing Units | 1,782 | 79.8% |
| Renter-Occupied Housing Units | 451 | 20.2% |
| Total Occupied Housing Units | 2,233 | 100.0% |
Occupancy by Household Size in Shanor Northvue
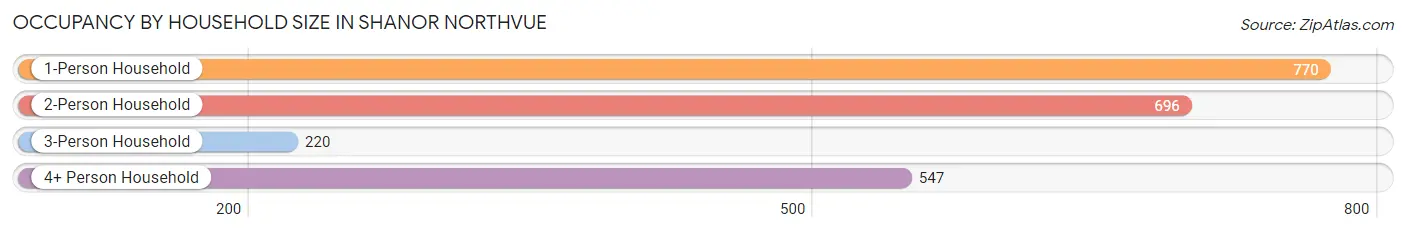
| Household Size | # Housing Units | % Housing Units |
| 1-Person Household | 770 | 34.5% |
| 2-Person Household | 696 | 31.2% |
| 3-Person Household | 220 | 9.9% |
| 4+ Person Household | 547 | 24.5% |
| Total Housing Units | 2,233 | 100.0% |
Occupancy by Ownership by Household Size in Shanor Northvue
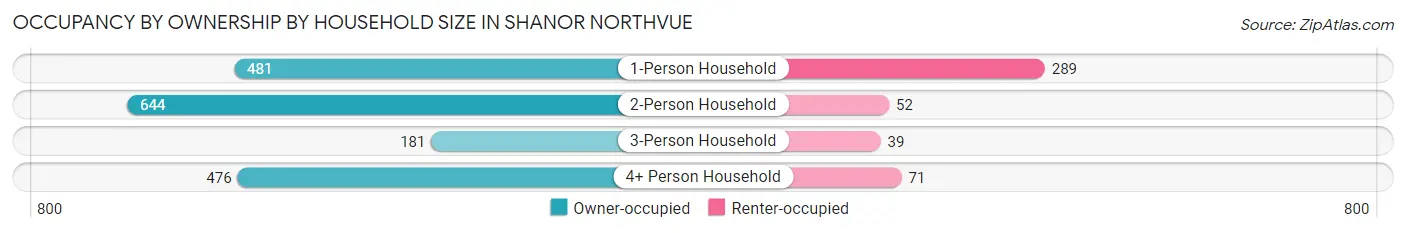
| Household Size | Owner-occupied | Renter-occupied |
| 1-Person Household | 481 (62.5%) | 289 (37.5%) |
| 2-Person Household | 644 (92.5%) | 52 (7.5%) |
| 3-Person Household | 181 (82.3%) | 39 (17.7%) |
| 4+ Person Household | 476 (87.0%) | 71 (13.0%) |
| Total Housing Units | 1,782 (79.8%) | 451 (20.2%) |
Occupancy by Educational Attainment in Shanor Northvue
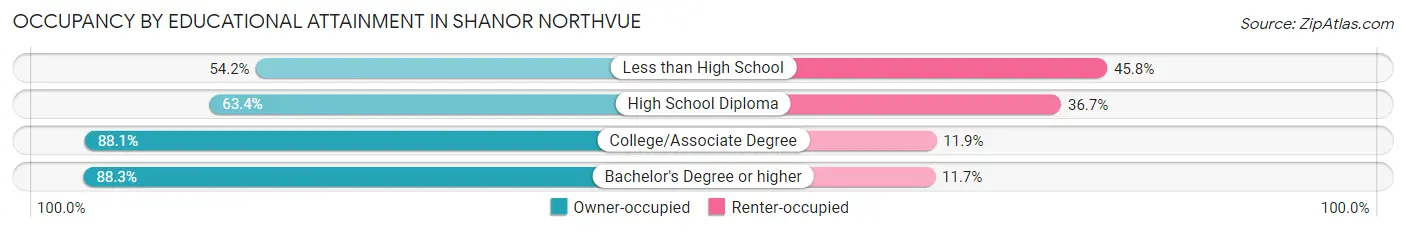
| Household Size | Owner-occupied | Renter-occupied |
| Less than High School | 77 (54.2%) | 65 (45.8%) |
| High School Diploma | 356 (63.3%) | 206 (36.6%) |
| College/Associate Degree | 502 (88.1%) | 68 (11.9%) |
| Bachelor's Degree or higher | 847 (88.3%) | 112 (11.7%) |
Occupancy by Age of Householder in Shanor Northvue
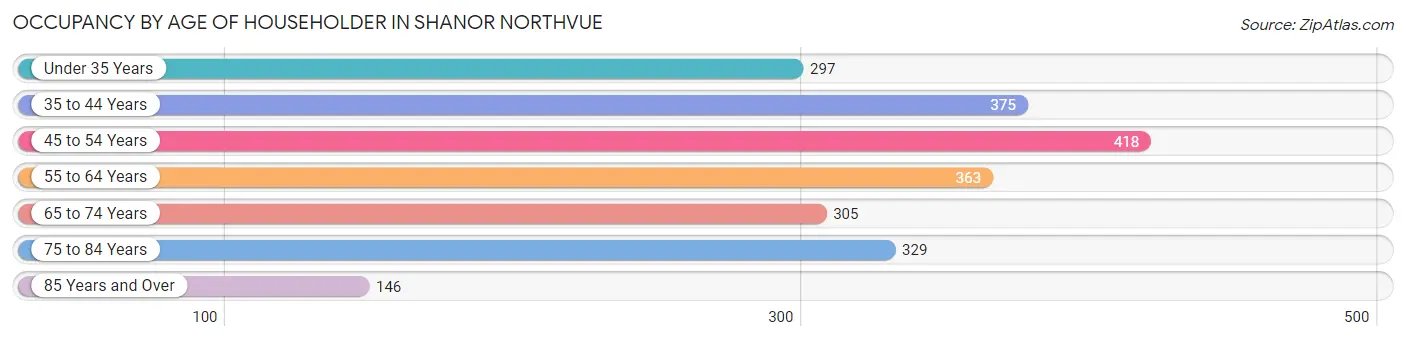
| Age Bracket | # Households | % Households |
| Under 35 Years | 297 | 13.3% |
| 35 to 44 Years | 375 | 16.8% |
| 45 to 54 Years | 418 | 18.7% |
| 55 to 64 Years | 363 | 16.3% |
| 65 to 74 Years | 305 | 13.7% |
| 75 to 84 Years | 329 | 14.7% |
| 85 Years and Over | 146 | 6.5% |
| Total | 2,233 | 100.0% |
Housing Finances in Shanor Northvue
Median Income by Occupancy in Shanor Northvue
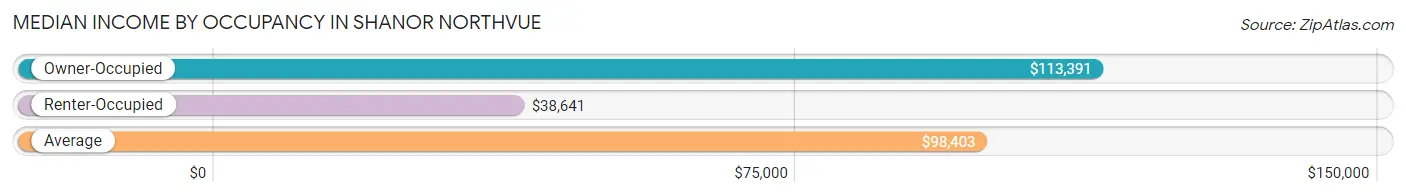
| Occupancy Type | # Households | Median Income |
| Owner-Occupied | 1,782 (79.8%) | $113,391 |
| Renter-Occupied | 451 (20.2%) | $38,641 |
| Average | 2,233 (100.0%) | $98,403 |
Occupancy by Householder Income Bracket in Shanor Northvue
| Income Bracket | Owner-occupied | Renter-occupied |
| Less than $5,000 | 17 (0.9%) | 15 (3.3%) |
| $5,000 to $9,999 | 0 (0.0%) | 0 (0.0%) |
| $10,000 to $14,999 | 17 (0.9%) | 75 (16.6%) |
| $15,000 to $19,999 | 67 (3.8%) | 17 (3.8%) |
| $20,000 to $24,999 | 17 (0.9%) | 61 (13.5%) |
| $25,000 to $34,999 | 109 (6.1%) | 47 (10.4%) |
| $35,000 to $49,999 | 170 (9.5%) | 40 (8.9%) |
| $50,000 to $74,999 | 111 (6.2%) | 65 (14.4%) |
| $75,000 to $99,999 | 225 (12.6%) | 75 (16.6%) |
| $100,000 to $149,999 | 630 (35.3%) | 32 (7.1%) |
| $150,000 or more | 419 (23.5%) | 24 (5.3%) |
| Total | 1,782 (100.0%) | 451 (100.0%) |
Monthly Housing Cost Tiers in Shanor Northvue
| Monthly Cost | Owner-occupied | Renter-occupied |
| Less than $300 | 17 (0.9%) | 21 (4.7%) |
| $300 to $499 | 218 (12.2%) | 15 (3.3%) |
| $500 to $799 | 359 (20.2%) | 156 (34.6%) |
| $800 to $999 | 142 (8.0%) | 0 (0.0%) |
| $1,000 to $1,499 | 243 (13.6%) | 171 (37.9%) |
| $1,500 to $1,999 | 244 (13.7%) | 13 (2.9%) |
| $2,000 to $2,499 | 251 (14.1%) | 15 (3.3%) |
| $2,500 to $2,999 | 173 (9.7%) | 14 (3.1%) |
| $3,000 or more | 135 (7.6%) | 12 (2.7%) |
| Total | 1,782 (100.0%) | 451 (100.0%) |
Physical Housing Characteristics in Shanor Northvue
Housing Structures in Shanor Northvue
| Structure Type | # Housing Units | % Housing Units |
| Single Unit, Detached | 1,778 | 79.6% |
| Single Unit, Attached | 93 | 4.2% |
| 2 Unit Apartments | 27 | 1.2% |
| 3 or 4 Unit Apartments | 112 | 5.0% |
| 5 to 9 Unit Apartments | 83 | 3.7% |
| 10 or more Apartments | 108 | 4.8% |
| Mobile Home / Other | 32 | 1.4% |
| Total | 2,233 | 100.0% |
Housing Structures by Occupancy in Shanor Northvue
| Structure Type | Owner-occupied | Renter-occupied |
| Single Unit, Detached | 1,643 (92.4%) | 135 (7.6%) |
| Single Unit, Attached | 78 (83.9%) | 15 (16.1%) |
| 2 Unit Apartments | 14 (51.8%) | 13 (48.1%) |
| 3 or 4 Unit Apartments | 30 (26.8%) | 82 (73.2%) |
| 5 to 9 Unit Apartments | 0 (0.0%) | 83 (100.0%) |
| 10 or more Apartments | 0 (0.0%) | 108 (100.0%) |
| Mobile Home / Other | 17 (53.1%) | 15 (46.9%) |
| Total | 1,782 (79.8%) | 451 (20.2%) |
Housing Structures by Number of Rooms in Shanor Northvue
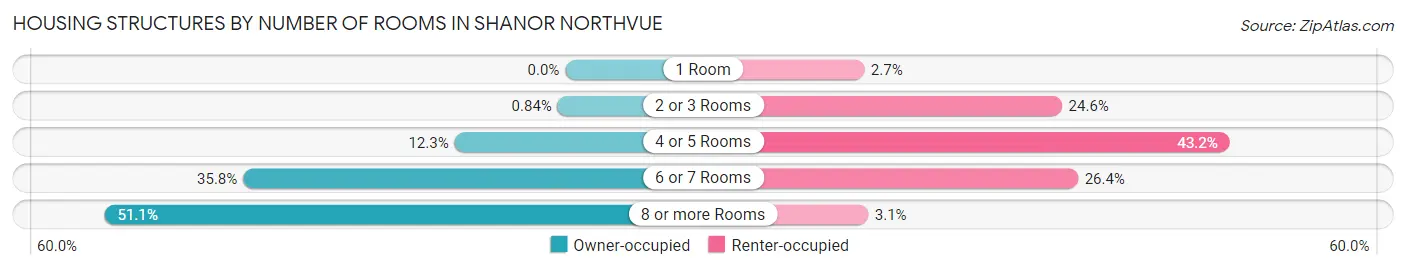
| Number of Rooms | Owner-occupied | Renter-occupied |
| 1 Room | 0 (0.0%) | 12 (2.7%) |
| 2 or 3 Rooms | 15 (0.8%) | 111 (24.6%) |
| 4 or 5 Rooms | 219 (12.3%) | 195 (43.2%) |
| 6 or 7 Rooms | 637 (35.7%) | 119 (26.4%) |
| 8 or more Rooms | 911 (51.1%) | 14 (3.1%) |
| Total | 1,782 (100.0%) | 451 (100.0%) |
Housing Structure by Heating Type in Shanor Northvue
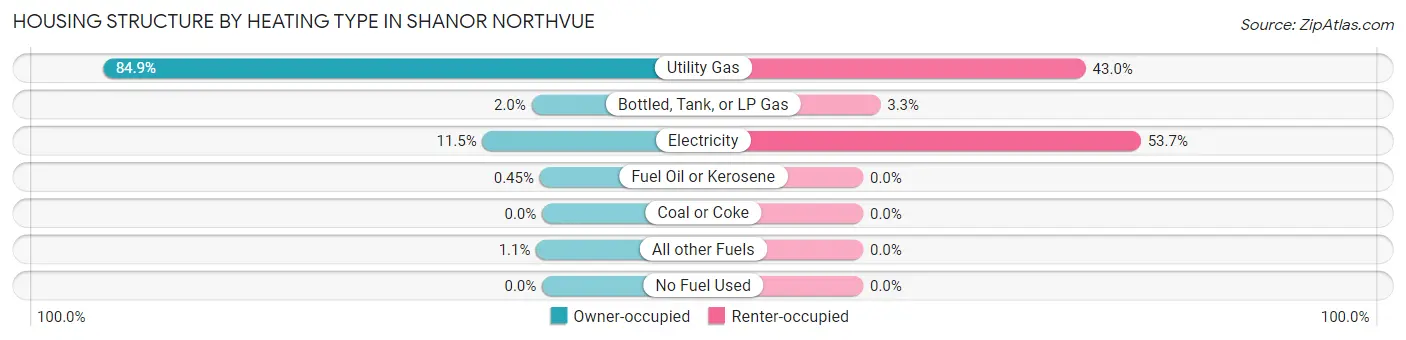
| Heating Type | Owner-occupied | Renter-occupied |
| Utility Gas | 1,513 (84.9%) | 194 (43.0%) |
| Bottled, Tank, or LP Gas | 36 (2.0%) | 15 (3.3%) |
| Electricity | 205 (11.5%) | 242 (53.7%) |
| Fuel Oil or Kerosene | 8 (0.4%) | 0 (0.0%) |
| Coal or Coke | 0 (0.0%) | 0 (0.0%) |
| All other Fuels | 20 (1.1%) | 0 (0.0%) |
| No Fuel Used | 0 (0.0%) | 0 (0.0%) |
| Total | 1,782 (100.0%) | 451 (100.0%) |
Household Vehicle Usage in Shanor Northvue
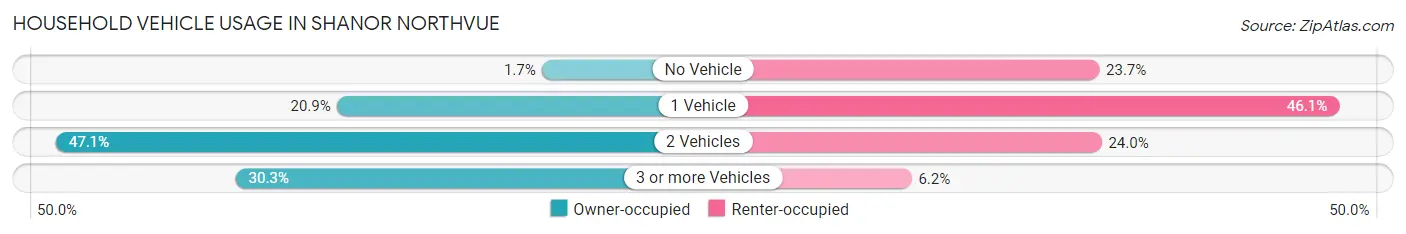
| Vehicles per Household | Owner-occupied | Renter-occupied |
| No Vehicle | 31 (1.7%) | 107 (23.7%) |
| 1 Vehicle | 372 (20.9%) | 208 (46.1%) |
| 2 Vehicles | 839 (47.1%) | 108 (23.9%) |
| 3 or more Vehicles | 540 (30.3%) | 28 (6.2%) |
| Total | 1,782 (100.0%) | 451 (100.0%) |
Real Estate & Mortgages in Shanor Northvue
Real Estate and Mortgage Overview in Shanor Northvue
| Characteristic | Without Mortgage | With Mortgage |
| Housing Units | 718 | 1,064 |
| Median Property Value | $197,000 | $264,300 |
| Median Household Income | $81,389 | $329 |
| Monthly Housing Costs | $589 | $135 |
| Real Estate Taxes | $3,079 | $74 |
Property Value by Mortgage Status in Shanor Northvue
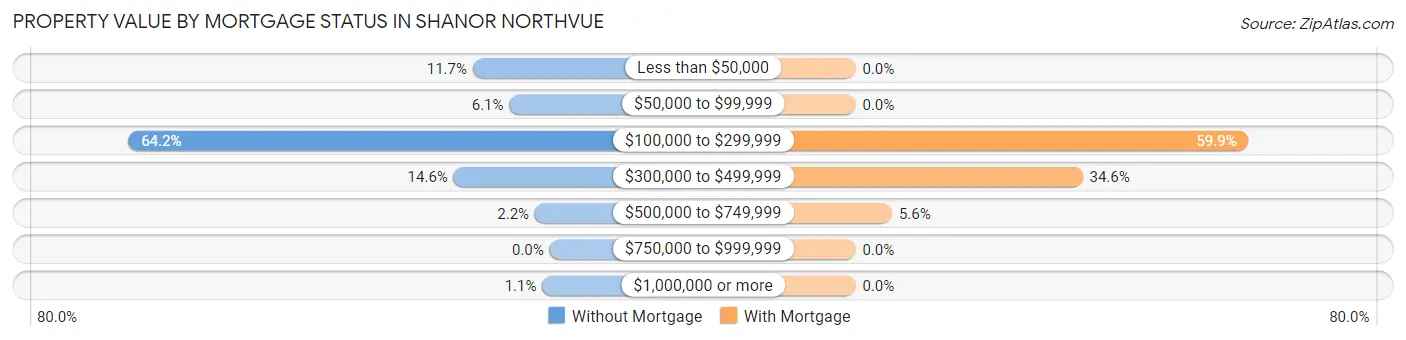
| Property Value | Without Mortgage | With Mortgage |
| Less than $50,000 | 84 (11.7%) | 0 (0.0%) |
| $50,000 to $99,999 | 44 (6.1%) | 0 (0.0%) |
| $100,000 to $299,999 | 461 (64.2%) | 637 (59.9%) |
| $300,000 to $499,999 | 105 (14.6%) | 368 (34.6%) |
| $500,000 to $749,999 | 16 (2.2%) | 59 (5.6%) |
| $750,000 to $999,999 | 0 (0.0%) | 0 (0.0%) |
| $1,000,000 or more | 8 (1.1%) | 0 (0.0%) |
| Total | 718 (100.0%) | 1,064 (100.0%) |
Household Income by Mortgage Status in Shanor Northvue
| Household Income | Without Mortgage | With Mortgage |
| Less than $10,000 | 0 (0.0%) | 29 (2.7%) |
| $10,000 to $24,999 | 58 (8.1%) | 17 (1.6%) |
| $25,000 to $34,999 | 51 (7.1%) | 43 (4.0%) |
| $35,000 to $49,999 | 170 (23.7%) | 58 (5.4%) |
| $50,000 to $74,999 | 70 (9.8%) | 0 (0.0%) |
| $75,000 to $99,999 | 112 (15.6%) | 41 (3.8%) |
| $100,000 to $149,999 | 167 (23.3%) | 113 (10.6%) |
| $150,000 or more | 90 (12.5%) | 463 (43.5%) |
| Total | 718 (100.0%) | 1,064 (100.0%) |
Property Value to Household Income Ratio in Shanor Northvue
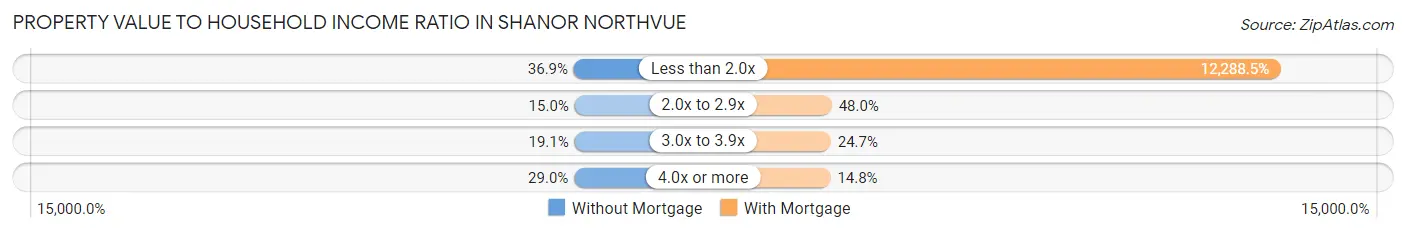
| Value-to-Income Ratio | Without Mortgage | With Mortgage |
| Less than 2.0x | 265 (36.9%) | 130,750 (12,288.5%) |
| 2.0x to 2.9x | 108 (15.0%) | 511 (48.0%) |
| 3.0x to 3.9x | 137 (19.1%) | 263 (24.7%) |
| 4.0x or more | 208 (29.0%) | 157 (14.8%) |
| Total | 718 (100.0%) | 1,064 (100.0%) |
Real Estate Taxes by Mortgage Status in Shanor Northvue
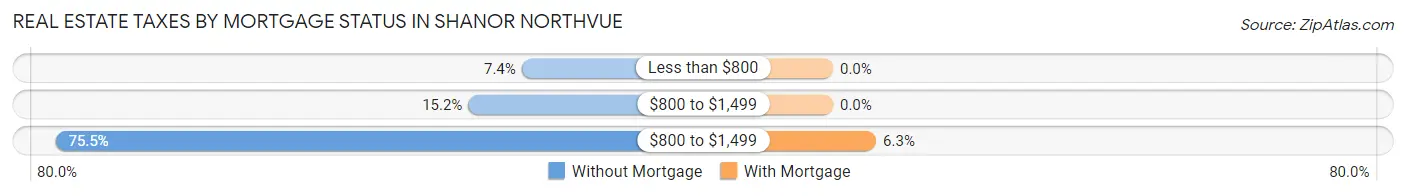
| Property Taxes | Without Mortgage | With Mortgage |
| Less than $800 | 53 (7.4%) | 0 (0.0%) |
| $800 to $1,499 | 109 (15.2%) | 0 (0.0%) |
| $800 to $1,499 | 542 (75.5%) | 67 (6.3%) |
| Total | 718 (100.0%) | 1,064 (100.0%) |
Health & Disability in Shanor Northvue
Health Insurance Coverage by Age in Shanor Northvue
| Age Bracket | With Coverage | Without Coverage |
| Under 6 Years | 392 (100.0%) | 0 (0.0%) |
| 6 to 18 Years | 840 (100.0%) | 0 (0.0%) |
| 19 to 25 Years | 285 (100.0%) | 0 (0.0%) |
| 26 to 34 Years | 491 (100.0%) | 0 (0.0%) |
| 35 to 44 Years | 710 (100.0%) | 0 (0.0%) |
| 45 to 54 Years | 651 (100.0%) | 0 (0.0%) |
| 55 to 64 Years | 640 (98.0%) | 13 (2.0%) |
| 65 to 74 Years | 473 (100.0%) | 0 (0.0%) |
| 75 Years and older | 652 (100.0%) | 0 (0.0%) |
| Total | 5,134 (99.8%) | 13 (0.3%) |
Health Insurance Coverage by Citizenship Status in Shanor Northvue
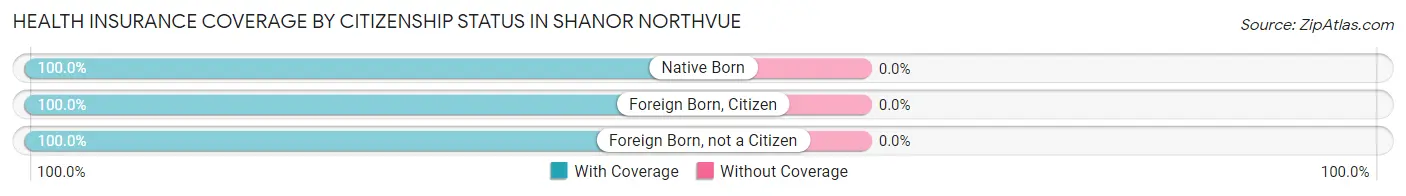
| Citizenship Status | With Coverage | Without Coverage |
| Native Born | 392 (100.0%) | 0 (0.0%) |
| Foreign Born, Citizen | 840 (100.0%) | 0 (0.0%) |
| Foreign Born, not a Citizen | 285 (100.0%) | 0 (0.0%) |
Health Insurance Coverage by Household Income in Shanor Northvue
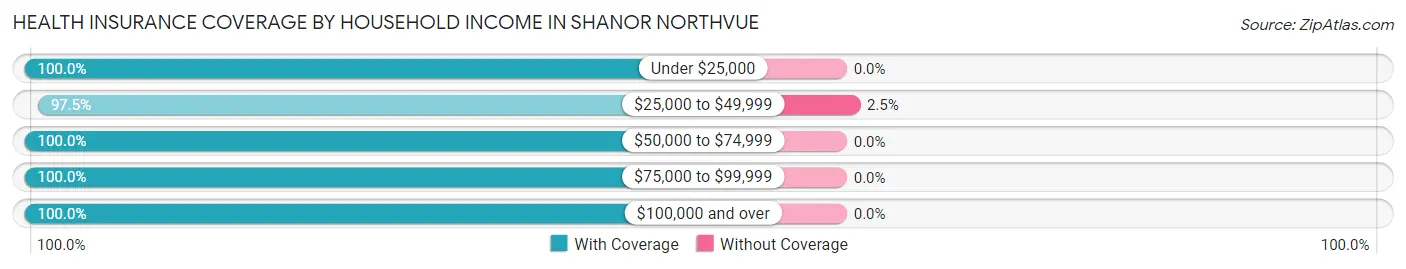
| Household Income | With Coverage | Without Coverage |
| Under $25,000 | 323 (100.0%) | 0 (0.0%) |
| $25,000 to $49,999 | 514 (97.5%) | 13 (2.5%) |
| $50,000 to $74,999 | 303 (100.0%) | 0 (0.0%) |
| $75,000 to $99,999 | 799 (100.0%) | 0 (0.0%) |
| $100,000 and over | 3,179 (100.0%) | 0 (0.0%) |
Public vs Private Health Insurance Coverage by Age in Shanor Northvue
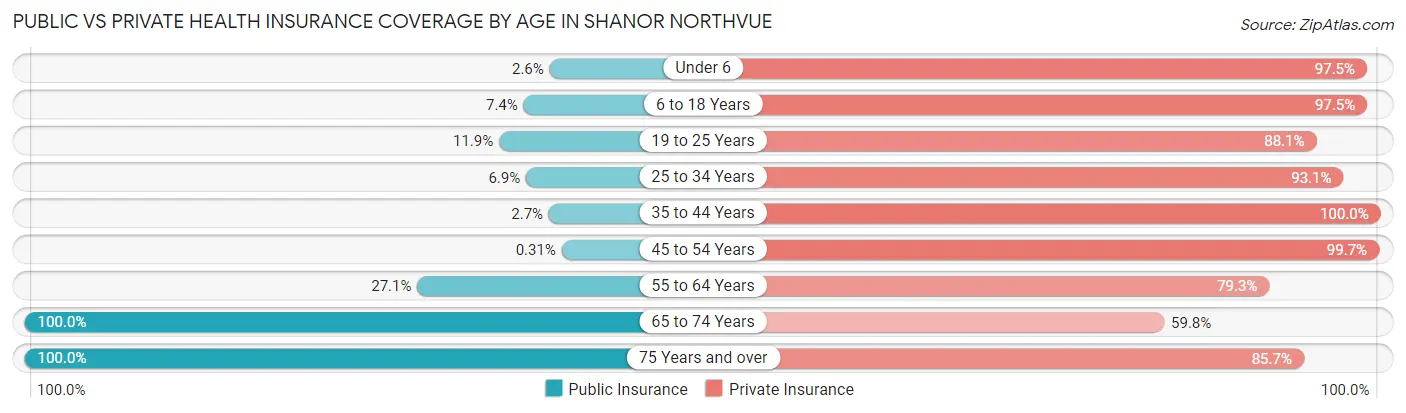
| Age Bracket | Public Insurance | Private Insurance |
| Under 6 | 10 (2.5%) | 382 (97.5%) |
| 6 to 18 Years | 62 (7.4%) | 819 (97.5%) |
| 19 to 25 Years | 34 (11.9%) | 251 (88.1%) |
| 25 to 34 Years | 34 (6.9%) | 457 (93.1%) |
| 35 to 44 Years | 19 (2.7%) | 710 (100.0%) |
| 45 to 54 Years | 2 (0.3%) | 649 (99.7%) |
| 55 to 64 Years | 177 (27.1%) | 518 (79.3%) |
| 65 to 74 Years | 473 (100.0%) | 283 (59.8%) |
| 75 Years and over | 652 (100.0%) | 559 (85.7%) |
| Total | 1,463 (28.4%) | 4,628 (89.9%) |
Disability Status by Sex by Age in Shanor Northvue
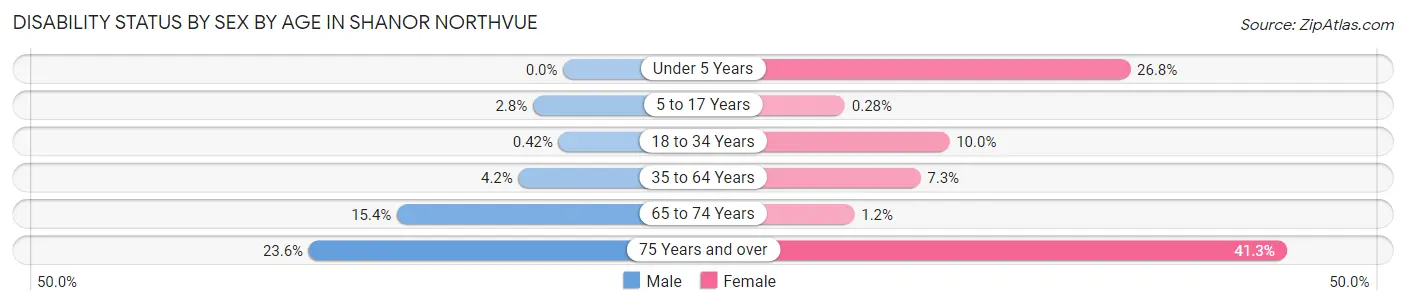
| Age Bracket | Male | Female |
| Under 5 Years | 0 (0.0%) | 57 (26.8%) |
| 5 to 17 Years | 13 (2.8%) | 1 (0.3%) |
| 18 to 34 Years | 2 (0.4%) | 34 (10.0%) |
| 35 to 64 Years | 42 (4.2%) | 73 (7.3%) |
| 65 to 74 Years | 33 (15.4%) | 3 (1.2%) |
| 75 Years and over | 51 (23.6%) | 180 (41.3%) |
Disability Class by Sex by Age in Shanor Northvue
Disability Class: Hearing Difficulty
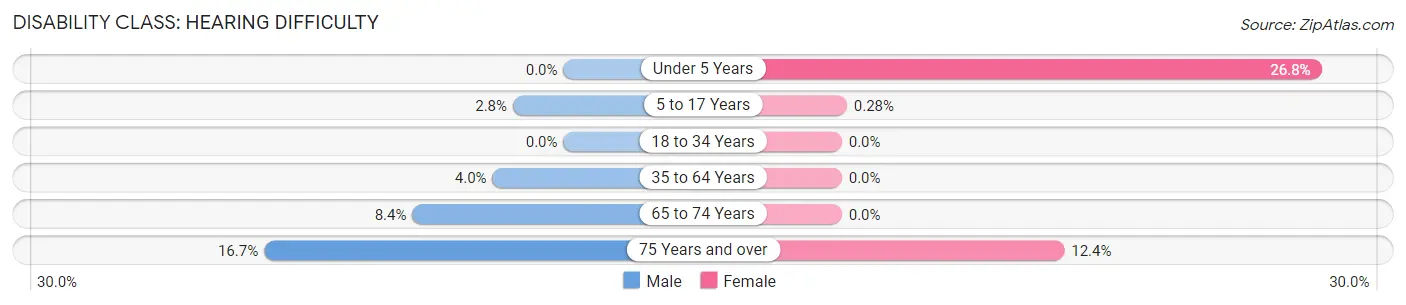
| Age Bracket | Male | Female |
| Under 5 Years | 0 (0.0%) | 57 (26.8%) |
| 5 to 17 Years | 13 (2.8%) | 1 (0.3%) |
| 18 to 34 Years | 0 (0.0%) | 0 (0.0%) |
| 35 to 64 Years | 40 (4.0%) | 0 (0.0%) |
| 65 to 74 Years | 18 (8.4%) | 0 (0.0%) |
| 75 Years and over | 36 (16.7%) | 54 (12.4%) |
Disability Class: Vision Difficulty
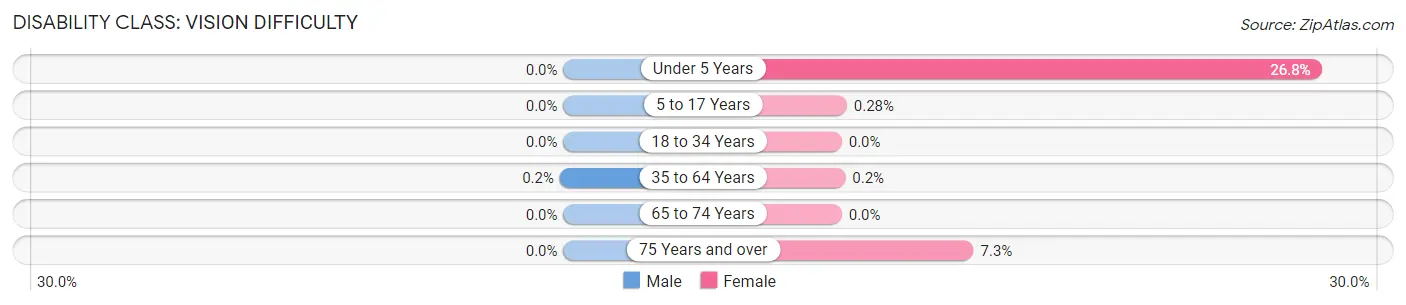
| Age Bracket | Male | Female |
| Under 5 Years | 0 (0.0%) | 57 (26.8%) |
| 5 to 17 Years | 0 (0.0%) | 1 (0.3%) |
| 18 to 34 Years | 0 (0.0%) | 0 (0.0%) |
| 35 to 64 Years | 2 (0.2%) | 2 (0.2%) |
| 65 to 74 Years | 0 (0.0%) | 0 (0.0%) |
| 75 Years and over | 0 (0.0%) | 32 (7.3%) |
Disability Class: Cognitive Difficulty
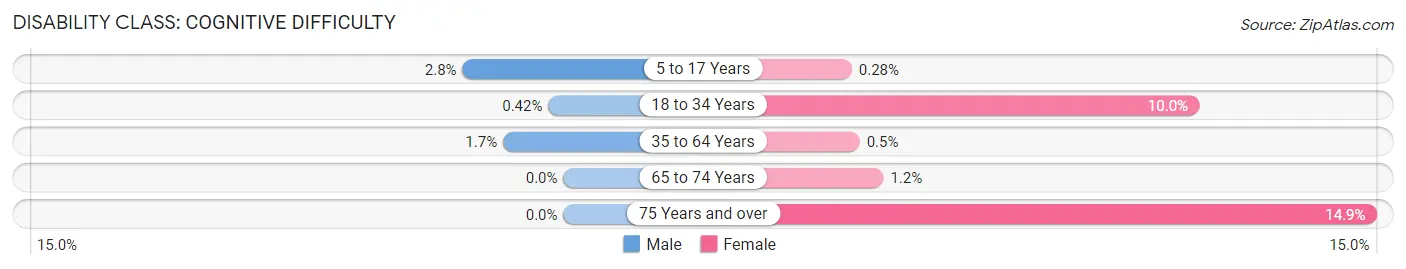
| Age Bracket | Male | Female |
| 5 to 17 Years | 13 (2.8%) | 1 (0.3%) |
| 18 to 34 Years | 2 (0.4%) | 34 (10.0%) |
| 35 to 64 Years | 17 (1.7%) | 5 (0.5%) |
| 65 to 74 Years | 0 (0.0%) | 3 (1.2%) |
| 75 Years and over | 0 (0.0%) | 65 (14.9%) |
Disability Class: Ambulatory Difficulty
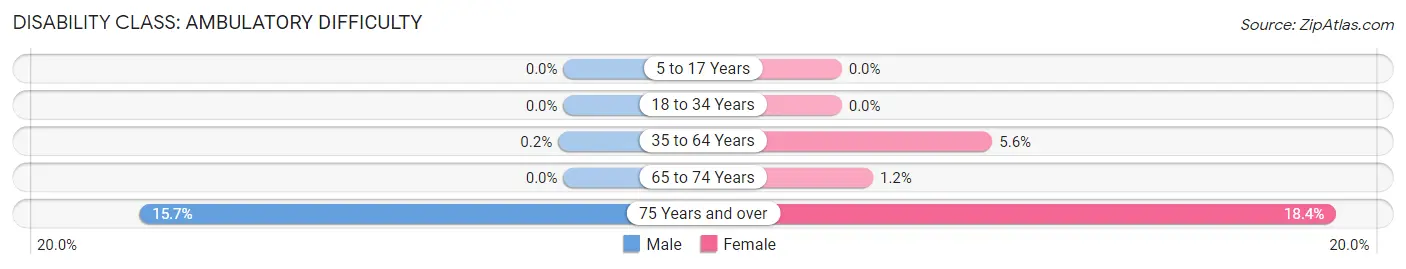
| Age Bracket | Male | Female |
| 5 to 17 Years | 0 (0.0%) | 0 (0.0%) |
| 18 to 34 Years | 0 (0.0%) | 0 (0.0%) |
| 35 to 64 Years | 2 (0.2%) | 56 (5.6%) |
| 65 to 74 Years | 0 (0.0%) | 3 (1.2%) |
| 75 Years and over | 34 (15.7%) | 80 (18.3%) |
Disability Class: Self-Care Difficulty
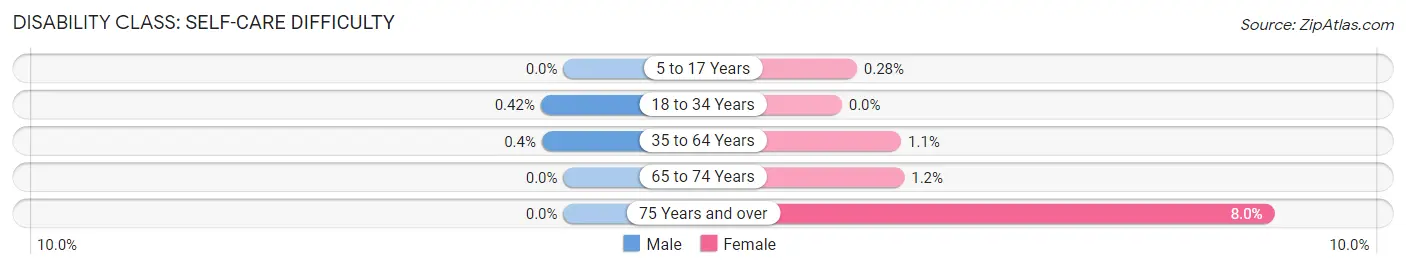
| Age Bracket | Male | Female |
| 5 to 17 Years | 0 (0.0%) | 1 (0.3%) |
| 18 to 34 Years | 2 (0.4%) | 0 (0.0%) |
| 35 to 64 Years | 4 (0.4%) | 11 (1.1%) |
| 65 to 74 Years | 0 (0.0%) | 3 (1.2%) |
| 75 Years and over | 0 (0.0%) | 35 (8.0%) |
Technology Access in Shanor Northvue
Computing Device Access in Shanor Northvue
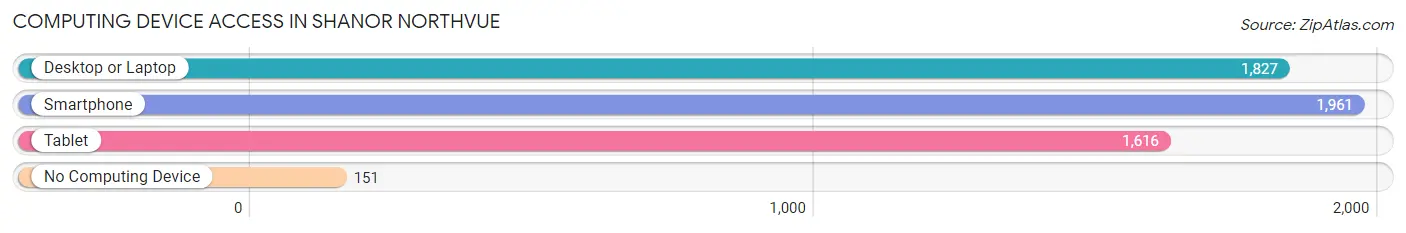
| Device Type | # Households | % Households |
| Desktop or Laptop | 1,827 | 81.8% |
| Smartphone | 1,961 | 87.8% |
| Tablet | 1,616 | 72.4% |
| No Computing Device | 151 | 6.8% |
| Total | 2,233 | 100.0% |
Internet Access in Shanor Northvue
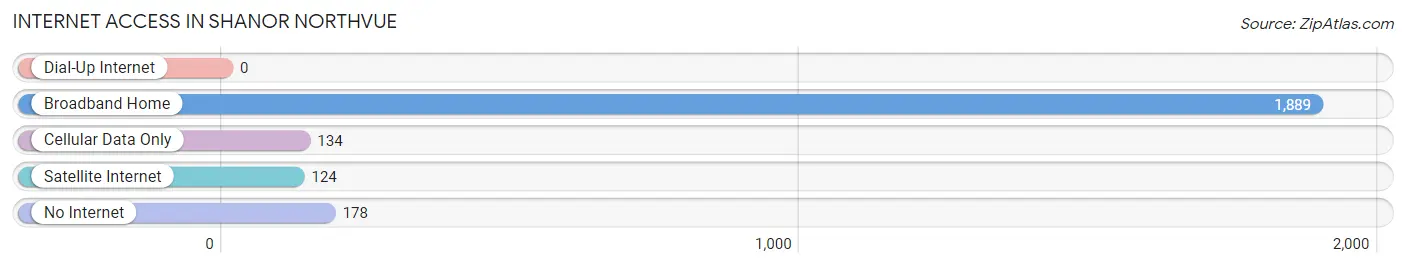
| Internet Type | # Households | % Households |
| Dial-Up Internet | 0 | 0.0% |
| Broadband Home | 1,889 | 84.6% |
| Cellular Data Only | 134 | 6.0% |
| Satellite Internet | 124 | 5.6% |
| No Internet | 178 | 8.0% |
| Total | 2,233 | 100.0% |
Shanor Northvue Summary
Shanor Northvue is a small borough located in Butler County, Pennsylvania. It is situated in the western part of the state, approximately 30 miles north of Pittsburgh. The borough was incorporated in 1891 and has a population of approximately 1,000 people.
Geography
Shanor Northvue is located in the western part of Butler County, Pennsylvania. It is situated in the foothills of the Allegheny Mountains, approximately 30 miles north of Pittsburgh. The borough is bordered by the boroughs of Prospect and West Sunbury to the north, the boroughs of Karns City and Petrolia to the east, the boroughs of Chicora and Fairview to the south, and the boroughs of Bruin and Parker to the west. The terrain of the borough is mostly hilly, with some flat areas in the valleys. The highest point in the borough is located at the intersection of Shanor Road and Northvue Road, at an elevation of 1,400 feet.
Economy
The economy of Shanor Northvue is largely based on agriculture and light industry. The borough is home to several small businesses, including a grocery store, a hardware store, a gas station, and a few restaurants. The borough also has a few small manufacturing plants, which produce a variety of products, including furniture, clothing, and automotive parts.
Demographics
As of the 2010 census, the population of Shanor Northvue was 1,000 people. The racial makeup of the borough was 97.2% White, 0.7% African American, 0.3% Native American, 0.3% Asian, and 1.5% from other races. The median household income was $41,250, and the median family income was $50,000. The per capita income was $20,000.
History
Shanor Northvue was first settled in the late 1700s by a group of German immigrants. The borough was officially incorporated in 1891 and was named after the Shanor family, who were one of the first settlers in the area. The borough was originally a farming community, but in the early 1900s, the economy shifted to light industry. The borough experienced a period of growth in the 1950s and 1960s, when several new businesses were established. In the late 1970s, the borough began to decline, as many of the businesses closed or moved away. In recent years, the borough has seen a resurgence, with several new businesses opening and the population increasing.
Common Questions
What is Per Capita Income in Shanor Northvue?
Per Capita income in Shanor Northvue is $45,480.
What is the Median Family Income in Shanor Northvue?
Median Family Income in Shanor Northvue is $124,186.
What is the Median Household income in Shanor Northvue?
Median Household Income in Shanor Northvue is $98,403.
What is Income or Wage Gap in Shanor Northvue?
Income or Wage Gap in Shanor Northvue is 40.3%.
Women in Shanor Northvue earn 59.7 cents for every dollar earned by a man.
What is Inequality or Gini Index in Shanor Northvue?
Inequality or Gini Index in Shanor Northvue is 0.38.
What is the Total Population of Shanor Northvue?
Total Population of Shanor Northvue is 5,147.
What is the Total Male Population of Shanor Northvue?
Total Male Population of Shanor Northvue is 2,540.
What is the Total Female Population of Shanor Northvue?
Total Female Population of Shanor Northvue is 2,607.
What is the Ratio of Males per 100 Females in Shanor Northvue?
There are 97.43 Males per 100 Females in Shanor Northvue.
What is the Ratio of Females per 100 Males in Shanor Northvue?
There are 102.64 Females per 100 Males in Shanor Northvue.
What is the Median Population Age in Shanor Northvue?
Median Population Age in Shanor Northvue is 43.4 Years.
What is the Average Family Size in Shanor Northvue
Average Family Size in Shanor Northvue is 3.0 People.
What is the Average Household Size in Shanor Northvue
Average Household Size in Shanor Northvue is 2.3 People.
How Large is the Labor Force in Shanor Northvue?
There are 2,381 People in the Labor Forcein in Shanor Northvue.
What is the Percentage of People in the Labor Force in Shanor Northvue?
58.9% of People are in the Labor Force in Shanor Northvue.
What is the Unemployment Rate in Shanor Northvue?
Unemployment Rate in Shanor Northvue is 1.5%.