Lake Latonka, PA Map & Demographics
Lake Latonka Map
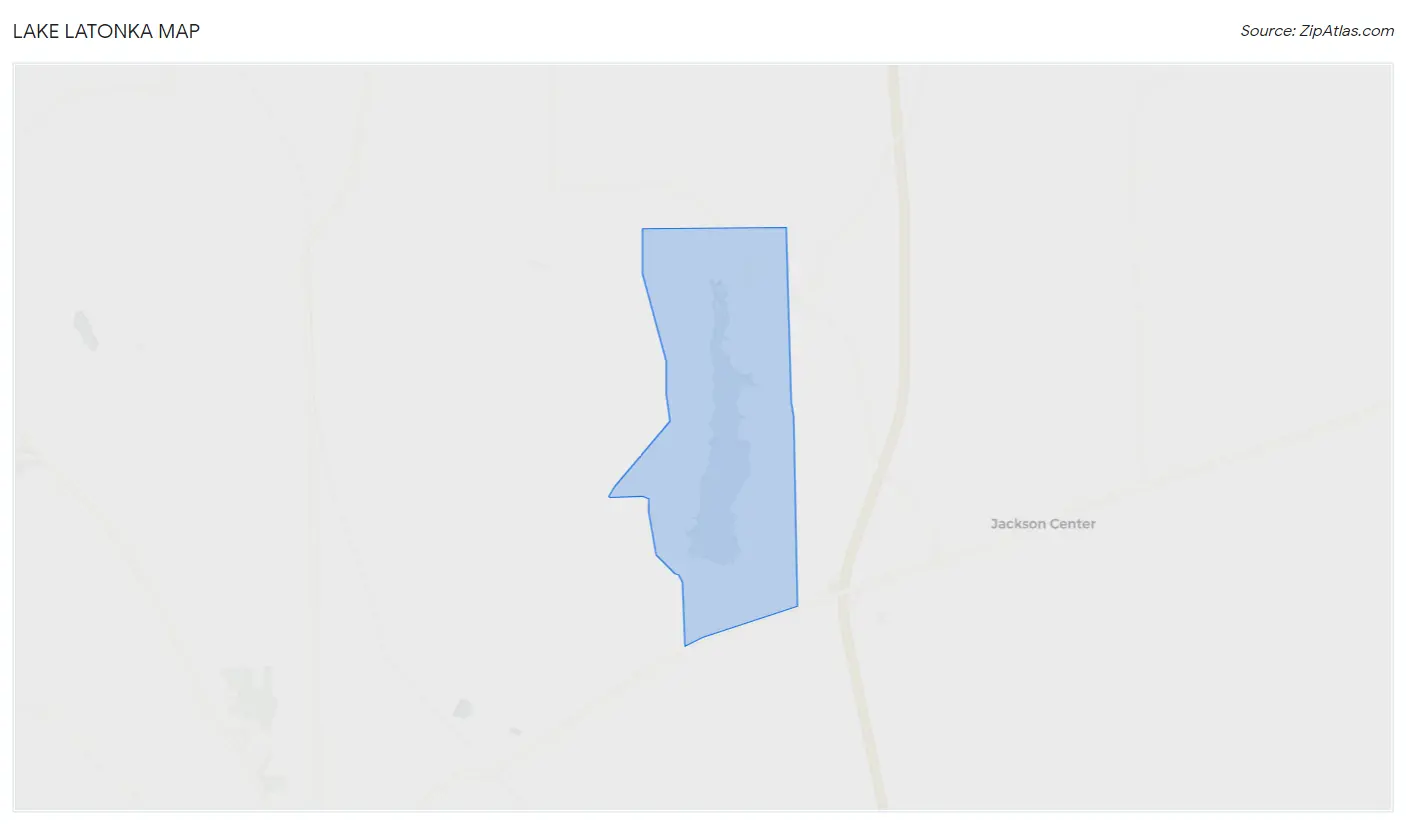
Lake Latonka Overview
$58,769
PER CAPITA INCOME
$116,250
AVG FAMILY INCOME
$91,667
AVG HOUSEHOLD INCOME
32.6%
WAGE / INCOME GAP [ % ]
67.4¢/ $1
WAGE / INCOME GAP [ $ ]
0.35
INEQUALITY / GINI INDEX
724
TOTAL POPULATION
355
MALE POPULATION
369
FEMALE POPULATION
96.21
MALES / 100 FEMALES
103.94
FEMALES / 100 MALES
55.5
MEDIAN AGE
2.5
AVG FAMILY SIZE
2.1
AVG HOUSEHOLD SIZE
350
LABOR FORCE [ PEOPLE ]
54.4%
PERCENT IN LABOR FORCE
Income in Lake Latonka
Income Overview in Lake Latonka
Per Capita Income in Lake Latonka is $58,769, while median incomes of families and households are $116,250 and $91,667 respectively.
| Characteristic | Number | Measure |
| Per Capita Income | 724 | $58,769 |
| Median Family Income | 236 | $116,250 |
| Mean Family Income | 236 | $143,295 |
| Median Household Income | 346 | $91,667 |
| Mean Household Income | 346 | $123,697 |
| Income Deficit | 236 | $0 |
| Wage / Income Gap (%) | 724 | 32.56% |
| Wage / Income Gap ($) | 724 | 67.44¢ per $1 |
| Gini / Inequality Index | 724 | 0.35 |
Earnings by Sex in Lake Latonka
Average Earnings in Lake Latonka are $58,125, $69,688 for men and $47,000 for women, a difference of 32.6%.
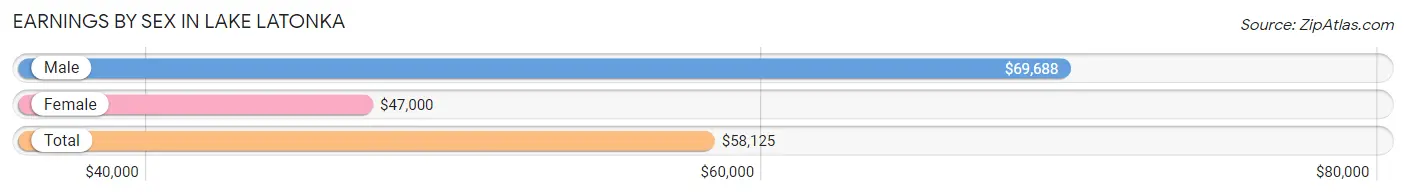
| Sex | Number | Average Earnings |
| Male | 203 (52.7%) | $69,688 |
| Female | 182 (47.3%) | $47,000 |
| Total | 385 (100.0%) | $58,125 |
Earnings by Sex by Income Bracket in Lake Latonka
The most common earnings brackets in Lake Latonka are $100,000+ for men (60 | 29.6%) and $100,000+ for women (26 | 14.3%).
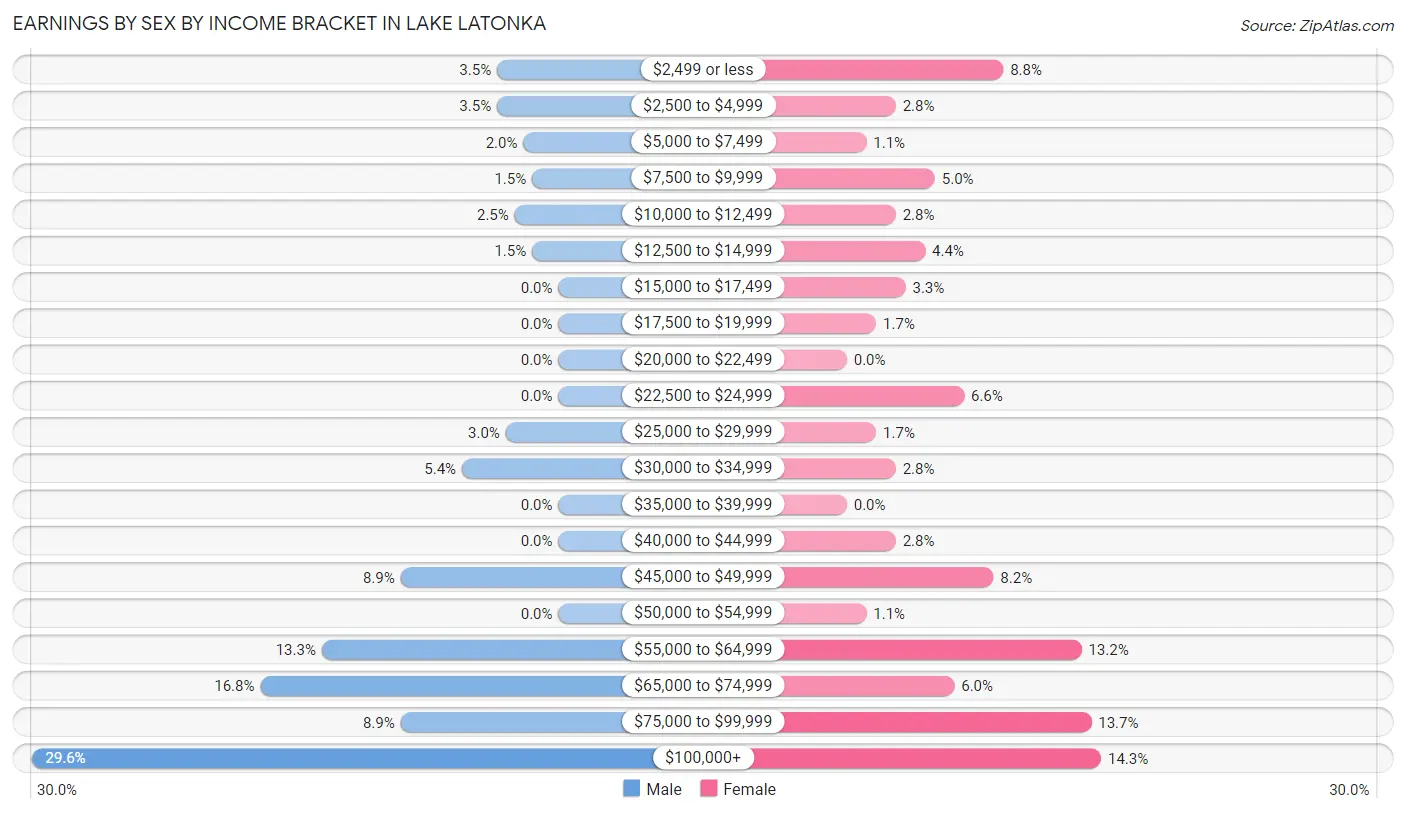
| Income | Male | Female |
| $2,499 or less | 7 (3.5%) | 16 (8.8%) |
| $2,500 to $4,999 | 7 (3.5%) | 5 (2.8%) |
| $5,000 to $7,499 | 4 (2.0%) | 2 (1.1%) |
| $7,500 to $9,999 | 3 (1.5%) | 9 (5.0%) |
| $10,000 to $12,499 | 5 (2.5%) | 5 (2.8%) |
| $12,500 to $14,999 | 3 (1.5%) | 8 (4.4%) |
| $15,000 to $17,499 | 0 (0.0%) | 6 (3.3%) |
| $17,500 to $19,999 | 0 (0.0%) | 3 (1.7%) |
| $20,000 to $22,499 | 0 (0.0%) | 0 (0.0%) |
| $22,500 to $24,999 | 0 (0.0%) | 12 (6.6%) |
| $25,000 to $29,999 | 6 (3.0%) | 3 (1.7%) |
| $30,000 to $34,999 | 11 (5.4%) | 5 (2.8%) |
| $35,000 to $39,999 | 0 (0.0%) | 0 (0.0%) |
| $40,000 to $44,999 | 0 (0.0%) | 5 (2.8%) |
| $45,000 to $49,999 | 18 (8.9%) | 15 (8.2%) |
| $50,000 to $54,999 | 0 (0.0%) | 2 (1.1%) |
| $55,000 to $64,999 | 27 (13.3%) | 24 (13.2%) |
| $65,000 to $74,999 | 34 (16.8%) | 11 (6.0%) |
| $75,000 to $99,999 | 18 (8.9%) | 25 (13.7%) |
| $100,000+ | 60 (29.6%) | 26 (14.3%) |
| Total | 203 (100.0%) | 182 (100.0%) |
Earnings by Sex by Educational Attainment in Lake Latonka
Average earnings in Lake Latonka are $70,852 for men and $55,875 for women, a difference of 21.1%. Men with an educational attainment of bachelor's degree enjoy the highest average annual earnings of $102,917, while those with high school diploma education earn the least with $47,000. Women with an educational attainment of bachelor's degree earn the most with the average annual earnings of $76,250, while those with high school diploma education have the smallest earnings of $43,500.
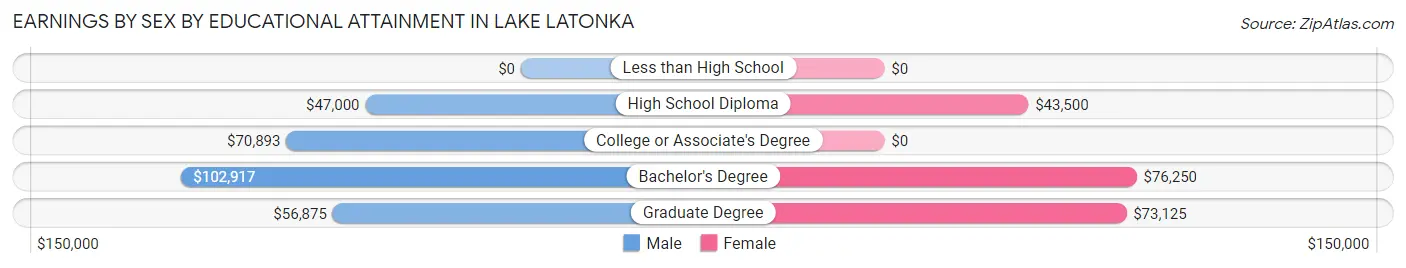
| Educational Attainment | Male Income | Female Income |
| Less than High School | - | - |
| High School Diploma | $47,000 | $43,500 |
| College or Associate's Degree | $70,893 | $0 |
| Bachelor's Degree | $102,917 | $76,250 |
| Graduate Degree | $56,875 | $73,125 |
| Total | $70,852 | $55,875 |
Family Income in Lake Latonka
Family Income Brackets in Lake Latonka
According to the Lake Latonka family income data, there are 59 families falling into the $100,000 to $149,999 income range, which is the most common income bracket and makes up 25.0% of all families.
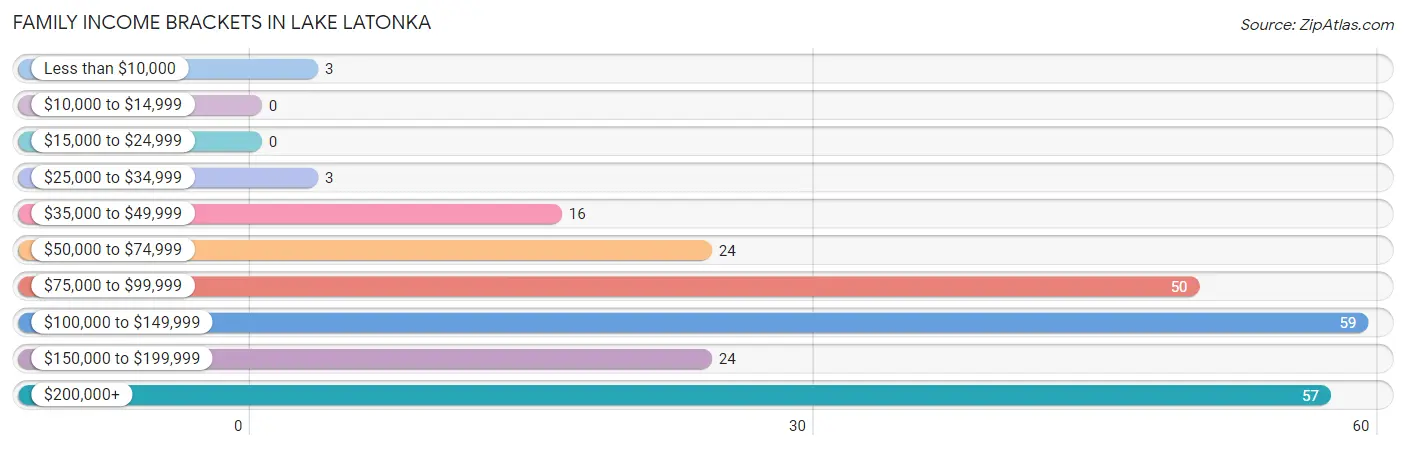
| Income Bracket | # Families | % Families |
| Less than $10,000 | 3 | 1.3% |
| $10,000 to $14,999 | 0 | 0.0% |
| $15,000 to $24,999 | 0 | 0.0% |
| $25,000 to $34,999 | 3 | 1.3% |
| $35,000 to $49,999 | 16 | 6.8% |
| $50,000 to $74,999 | 24 | 10.2% |
| $75,000 to $99,999 | 50 | 21.2% |
| $100,000 to $149,999 | 59 | 25.0% |
| $150,000 to $199,999 | 24 | 10.2% |
| $200,000+ | 57 | 24.2% |
Family Income by Famaliy Size in Lake Latonka
4-person families (36 | 15.2%) account for the highest median family income in Lake Latonka with $139,000 per family, while 2-person families (157 | 66.5%) have the highest median income of $55,521 per family member.
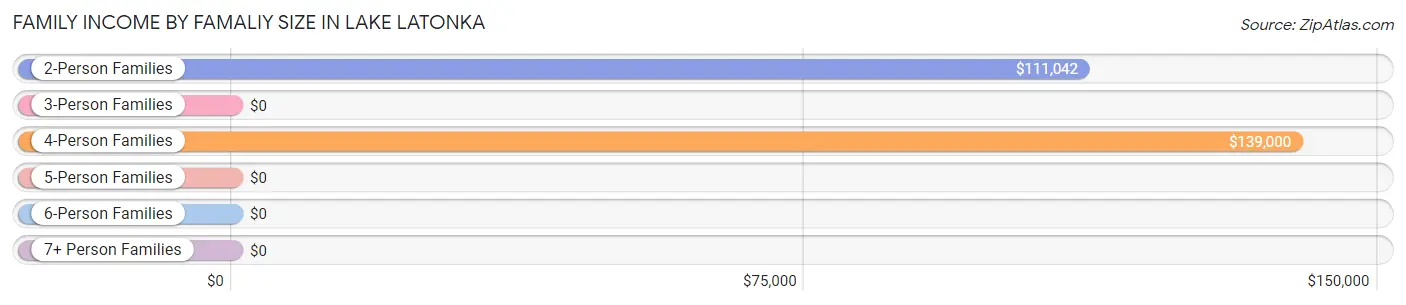
| Income Bracket | # Families | Median Income |
| 2-Person Families | 157 (66.5%) | $111,042 |
| 3-Person Families | 37 (15.7%) | $0 |
| 4-Person Families | 36 (15.2%) | $139,000 |
| 5-Person Families | 0 (0.0%) | $0 |
| 6-Person Families | 6 (2.5%) | $0 |
| 7+ Person Families | 0 (0.0%) | $0 |
| Total | 236 (100.0%) | $116,250 |
Family Income by Number of Earners in Lake Latonka
The median family income in Lake Latonka is $116,250, with families comprising 3+ earners (26) having the highest median family income of $235,833, while families with no earners (70) have the lowest median family income of $88,500, accounting for 11.0% and 29.7% of families, respectively.
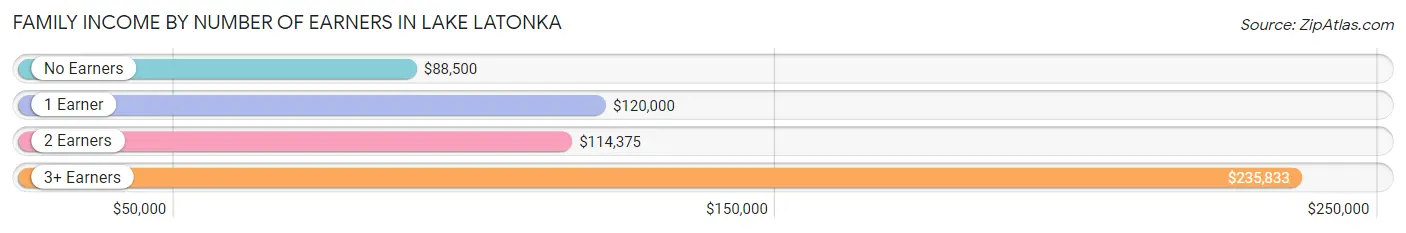
| Number of Earners | # Families | Median Income |
| No Earners | 70 (29.7%) | $88,500 |
| 1 Earner | 58 (24.6%) | $120,000 |
| 2 Earners | 82 (34.7%) | $114,375 |
| 3+ Earners | 26 (11.0%) | $235,833 |
| Total | 236 (100.0%) | $116,250 |
Household Income in Lake Latonka
Household Income Brackets in Lake Latonka
With 88 households falling in the category, the $50,000 to $74,999 income range is the most frequent in Lake Latonka, accounting for 25.4% of all households.
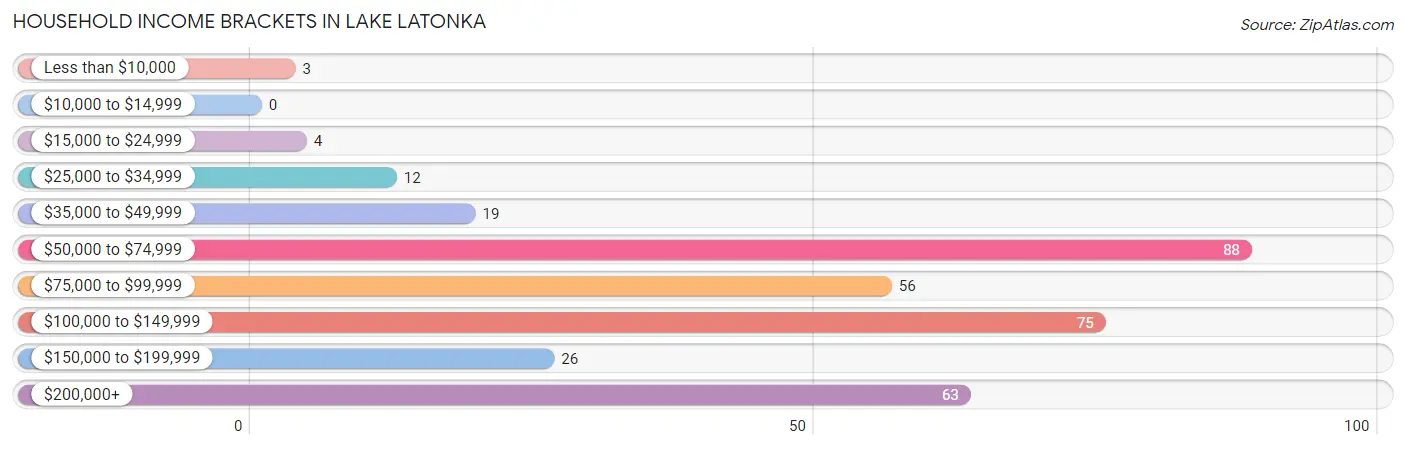
| Income Bracket | # Households | % Households |
| Less than $10,000 | 3 | 0.9% |
| $10,000 to $14,999 | 0 | 0.0% |
| $15,000 to $24,999 | 4 | 1.2% |
| $25,000 to $34,999 | 12 | 3.5% |
| $35,000 to $49,999 | 19 | 5.5% |
| $50,000 to $74,999 | 88 | 25.4% |
| $75,000 to $99,999 | 56 | 16.2% |
| $100,000 to $149,999 | 75 | 21.7% |
| $150,000 to $199,999 | 26 | 7.5% |
| $200,000+ | 63 | 18.2% |
Household Income by Householder Age in Lake Latonka
The median household income in Lake Latonka is $91,667, with the highest median household income of $142,639 found in the 45 to 64 years age bracket for the primary householder. A total of 145 households (41.9%) fall into this category.
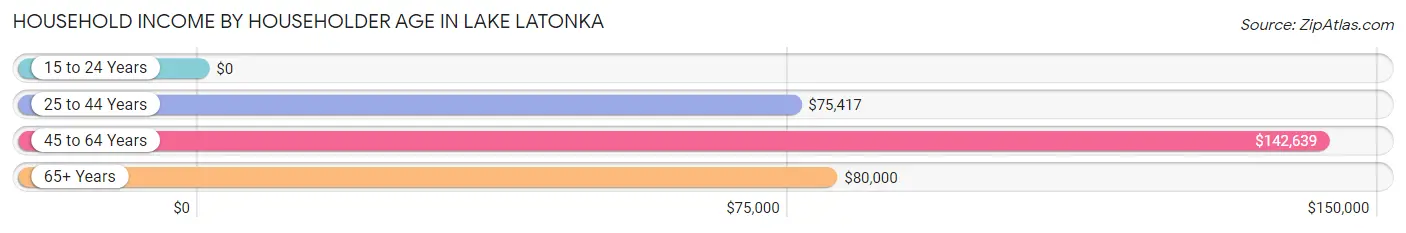
| Income Bracket | # Households | Median Income |
| 15 to 24 Years | 0 (0.0%) | $0 |
| 25 to 44 Years | 57 (16.5%) | $75,417 |
| 45 to 64 Years | 145 (41.9%) | $142,639 |
| 65+ Years | 144 (41.6%) | $80,000 |
| Total | 346 (100.0%) | $91,667 |
Poverty in Lake Latonka
Income Below Poverty by Sex and Age in Lake Latonka
With 0.9% poverty level for males and 2.8% for females among the residents of Lake Latonka, 65 to 74 year old males and under 5 year old females are the most vulnerable to poverty, with 3 males (4.1%) and 3 females (42.9%) in their respective age groups living below the poverty level.
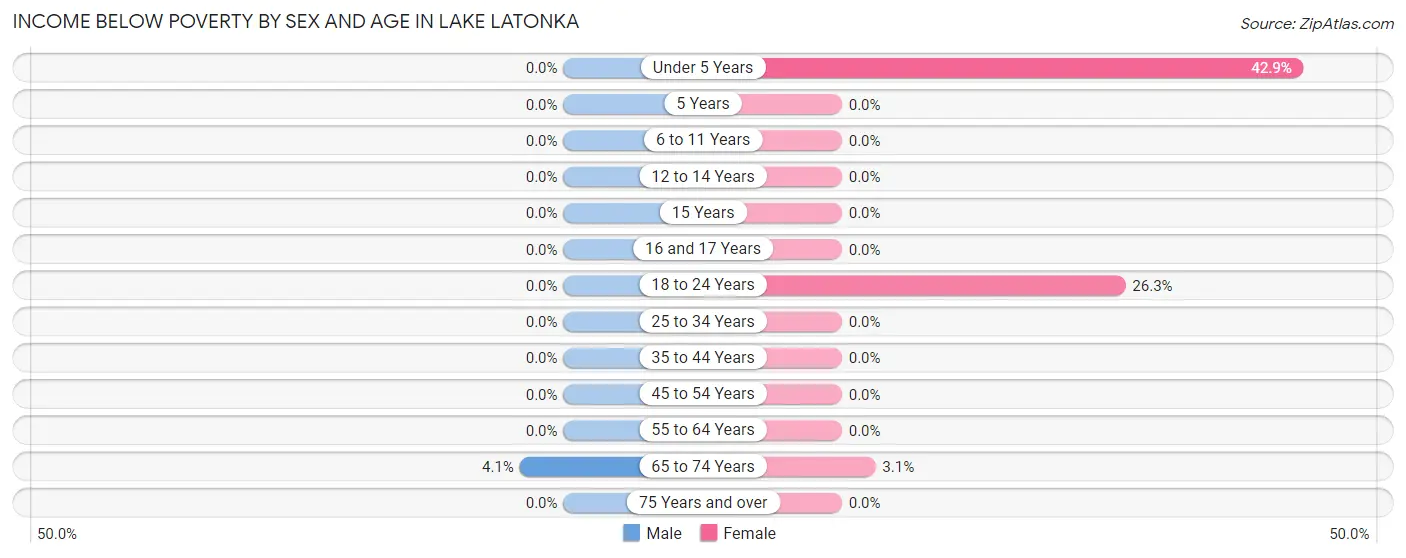
| Age Bracket | Male | Female |
| Under 5 Years | 0 (0.0%) | 3 (42.9%) |
| 5 Years | 0 (0.0%) | 0 (0.0%) |
| 6 to 11 Years | 0 (0.0%) | 0 (0.0%) |
| 12 to 14 Years | 0 (0.0%) | 0 (0.0%) |
| 15 Years | 0 (0.0%) | 0 (0.0%) |
| 16 and 17 Years | 0 (0.0%) | 0 (0.0%) |
| 18 to 24 Years | 0 (0.0%) | 5 (26.3%) |
| 25 to 34 Years | 0 (0.0%) | 0 (0.0%) |
| 35 to 44 Years | 0 (0.0%) | 0 (0.0%) |
| 45 to 54 Years | 0 (0.0%) | 0 (0.0%) |
| 55 to 64 Years | 0 (0.0%) | 0 (0.0%) |
| 65 to 74 Years | 3 (4.1%) | 2 (3.1%) |
| 75 Years and over | 0 (0.0%) | 0 (0.0%) |
| Total | 3 (0.9%) | 10 (2.8%) |
Income Above Poverty by Sex and Age in Lake Latonka
According to the poverty statistics in Lake Latonka, males aged under 5 years and females aged 6 to 11 years are the age groups that are most secure financially, with 100.0% of males and 100.0% of females in these age groups living above the poverty line.
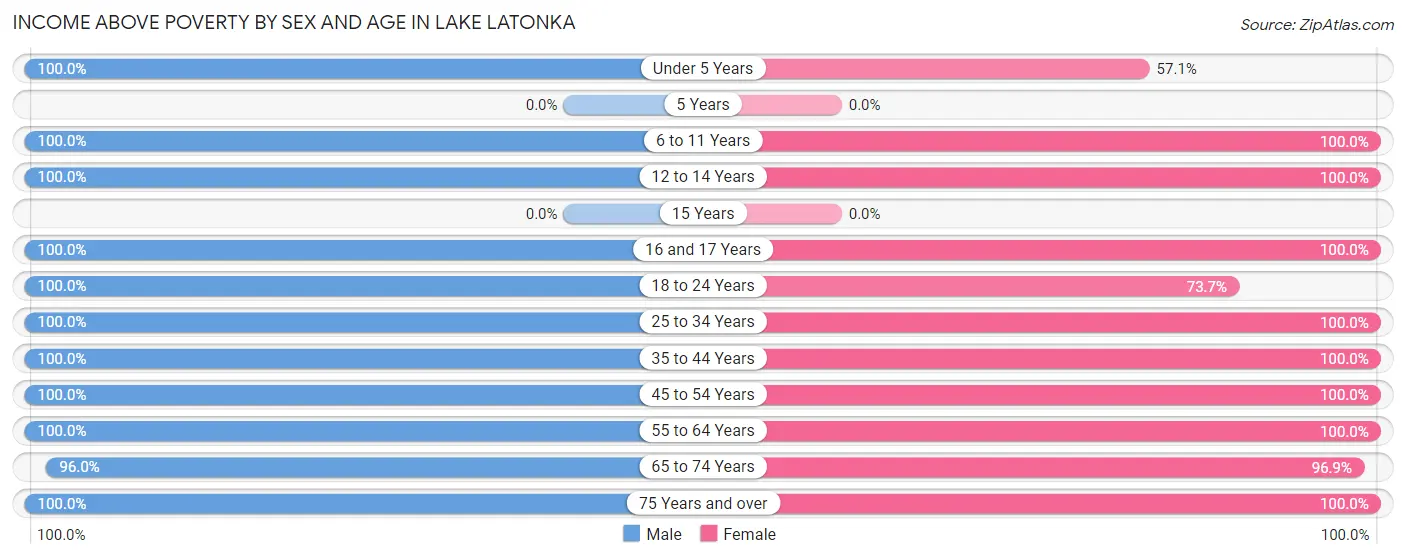
| Age Bracket | Male | Female |
| Under 5 Years | 3 (100.0%) | 4 (57.1%) |
| 5 Years | 0 (0.0%) | 0 (0.0%) |
| 6 to 11 Years | 26 (100.0%) | 7 (100.0%) |
| 12 to 14 Years | 8 (100.0%) | 24 (100.0%) |
| 15 Years | 0 (0.0%) | 0 (0.0%) |
| 16 and 17 Years | 5 (100.0%) | 10 (100.0%) |
| 18 to 24 Years | 18 (100.0%) | 14 (73.7%) |
| 25 to 34 Years | 31 (100.0%) | 22 (100.0%) |
| 35 to 44 Years | 31 (100.0%) | 23 (100.0%) |
| 45 to 54 Years | 46 (100.0%) | 73 (100.0%) |
| 55 to 64 Years | 78 (100.0%) | 78 (100.0%) |
| 65 to 74 Years | 71 (96.0%) | 62 (96.9%) |
| 75 Years and over | 35 (100.0%) | 36 (100.0%) |
| Total | 352 (99.2%) | 353 (97.3%) |
Income Below Poverty Among Married-Couple Families in Lake Latonka
The poverty statistics for married-couple families in Lake Latonka show that 1.4% or 3 of the total 214 families live below the poverty line. Families with 1 or 2 children have the highest poverty rate of 6.5%, comprising of 3 families. On the other hand, families with no children have the lowest poverty rate of 0.0%, which includes 0 families.
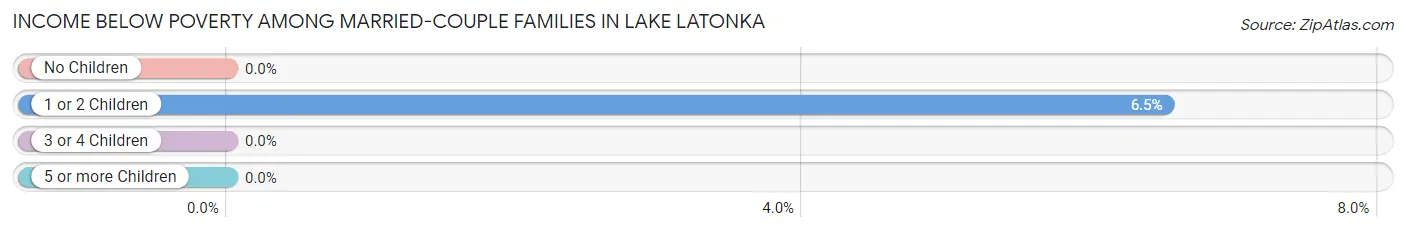
| Children | Above Poverty | Below Poverty |
| No Children | 162 (100.0%) | 0 (0.0%) |
| 1 or 2 Children | 43 (93.5%) | 3 (6.5%) |
| 3 or 4 Children | 6 (100.0%) | 0 (0.0%) |
| 5 or more Children | 0 (0.0%) | 0 (0.0%) |
| Total | 211 (98.6%) | 3 (1.4%) |
Income Below Poverty Among Single-Parent Households in Lake Latonka
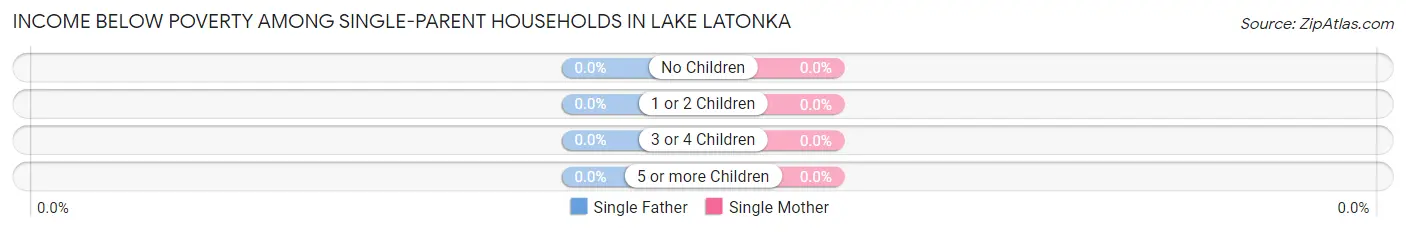
| Children | Single Father | Single Mother |
| No Children | 0 (0.0%) | 0 (0.0%) |
| 1 or 2 Children | 0 (0.0%) | 0 (0.0%) |
| 3 or 4 Children | 0 (0.0%) | 0 (0.0%) |
| 5 or more Children | 0 (0.0%) | 0 (0.0%) |
| Total | 0 (0.0%) | 0 (0.0%) |
Income Below Poverty Among Married-Couple vs Single-Parent Households in Lake Latonka
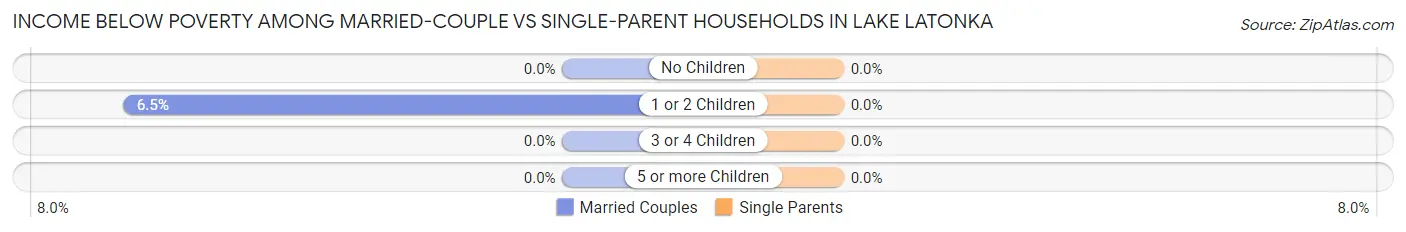
| Children | Married-Couple Families | Single-Parent Households |
| No Children | 0 (0.0%) | 0 (0.0%) |
| 1 or 2 Children | 3 (6.5%) | 0 (0.0%) |
| 3 or 4 Children | 0 (0.0%) | 0 (0.0%) |
| 5 or more Children | 0 (0.0%) | 0 (0.0%) |
| Total | 3 (1.4%) | 0 (0.0%) |
Race in Lake Latonka
The most populous races in Lake Latonka are White / Caucasian (698 | 96.4%), Asian (15 | 2.1%), and Hispanic or Latino (14 | 1.9%).
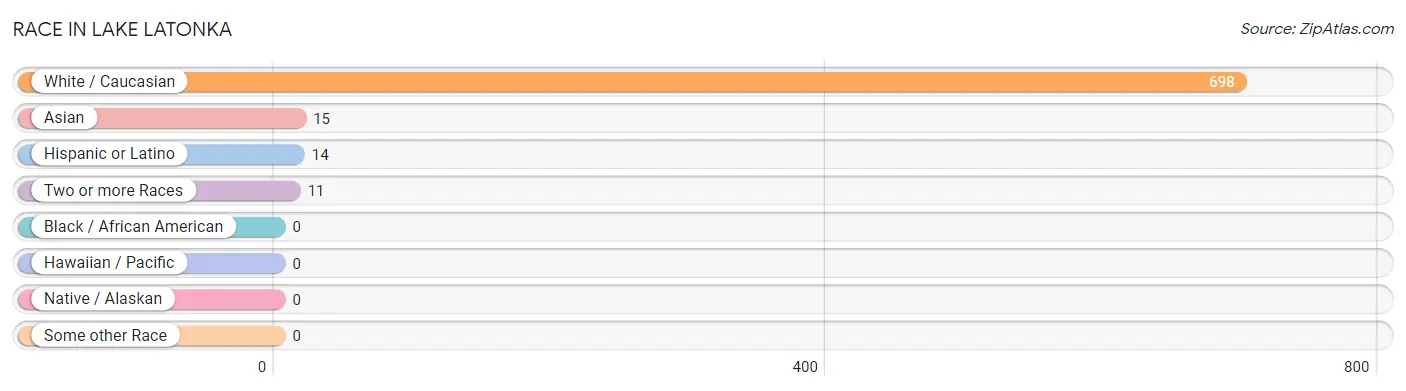
| Race | # Population | % Population |
| Asian | 15 | 2.1% |
| Black / African American | 0 | 0.0% |
| Hawaiian / Pacific | 0 | 0.0% |
| Hispanic or Latino | 14 | 1.9% |
| Native / Alaskan | 0 | 0.0% |
| White / Caucasian | 698 | 96.4% |
| Two or more Races | 11 | 1.5% |
| Some other Race | 0 | 0.0% |
| Total | 724 | 100.0% |
Ancestry in Lake Latonka
The most populous ancestries reported in Lake Latonka are German (142 | 19.6%), English (126 | 17.4%), Italian (104 | 14.4%), Irish (96 | 13.3%), and Scotch-Irish (58 | 8.0%), together accounting for 72.6% of all Lake Latonka residents.
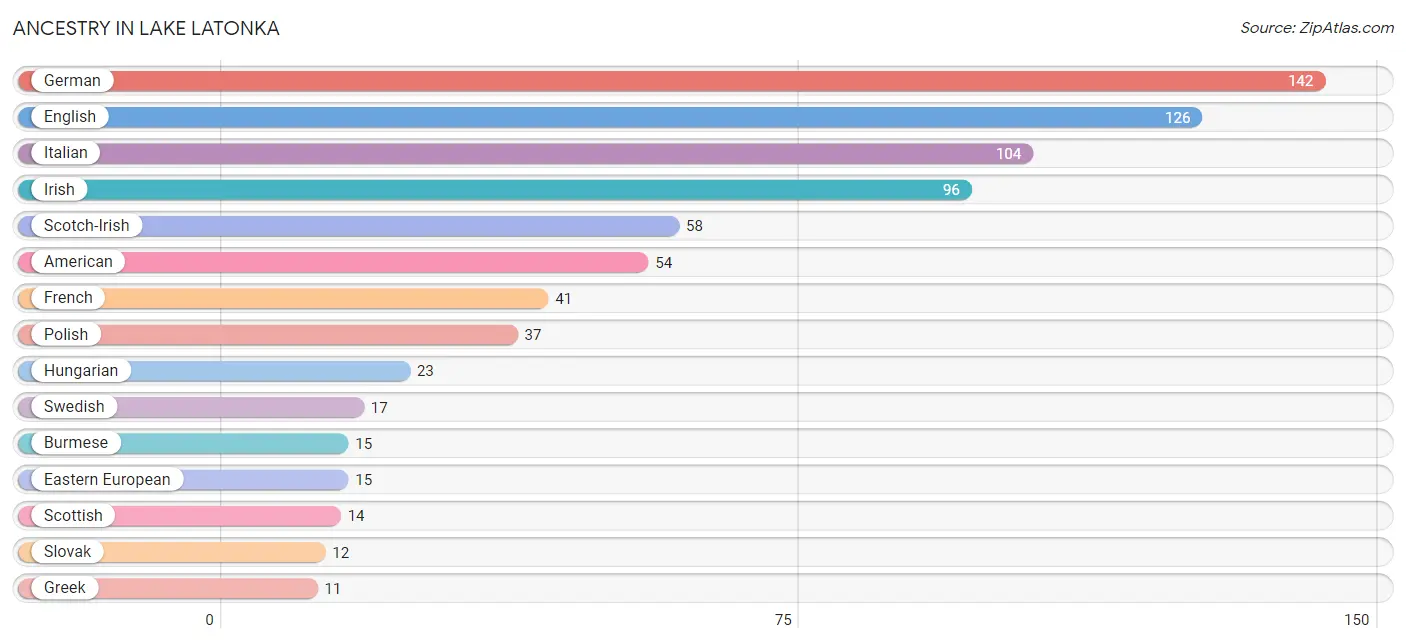
| Ancestry | # Population | % Population |
| American | 54 | 7.5% |
| Austrian | 5 | 0.7% |
| Burmese | 15 | 2.1% |
| Croatian | 8 | 1.1% |
| Czech | 3 | 0.4% |
| Czechoslovakian | 6 | 0.8% |
| Danish | 4 | 0.5% |
| Dutch | 9 | 1.2% |
| Eastern European | 15 | 2.1% |
| English | 126 | 17.4% |
| European | 6 | 0.8% |
| French | 41 | 5.7% |
| German | 142 | 19.6% |
| Greek | 11 | 1.5% |
| Hungarian | 23 | 3.2% |
| Irish | 96 | 13.3% |
| Italian | 104 | 14.4% |
| Lithuanian | 5 | 0.7% |
| Polish | 37 | 5.1% |
| Russian | 2 | 0.3% |
| Scotch-Irish | 58 | 8.0% |
| Scottish | 14 | 1.9% |
| Slovak | 12 | 1.7% |
| Slovene | 7 | 1.0% |
| Swedish | 17 | 2.4% |
| Ukrainian | 3 | 0.4% |
| Welsh | 6 | 0.8% | View All 27 Rows |
Immigrants in Lake Latonka
The most numerous immigrant groups reported in Lake Latonka came from Asia (8 | 1.1%), Eastern Asia (8 | 1.1%), and Korea (8 | 1.1%), together accounting for 3.3% of all Lake Latonka residents.
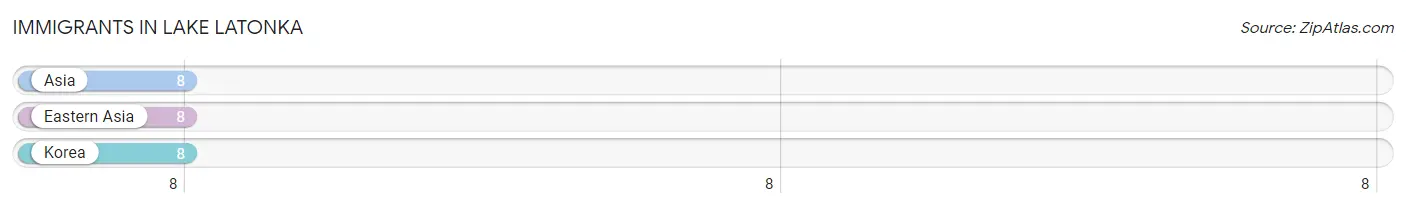
| Immigration Origin | # Population | % Population |
| Asia | 8 | 1.1% |
| Eastern Asia | 8 | 1.1% |
| Korea | 8 | 1.1% | View All 3 Rows |
Sex and Age in Lake Latonka
Sex and Age in Lake Latonka
The most populous age groups in Lake Latonka are 55 to 59 Years (43 | 12.1%) for men and 60 to 64 Years (52 | 14.1%) for women.
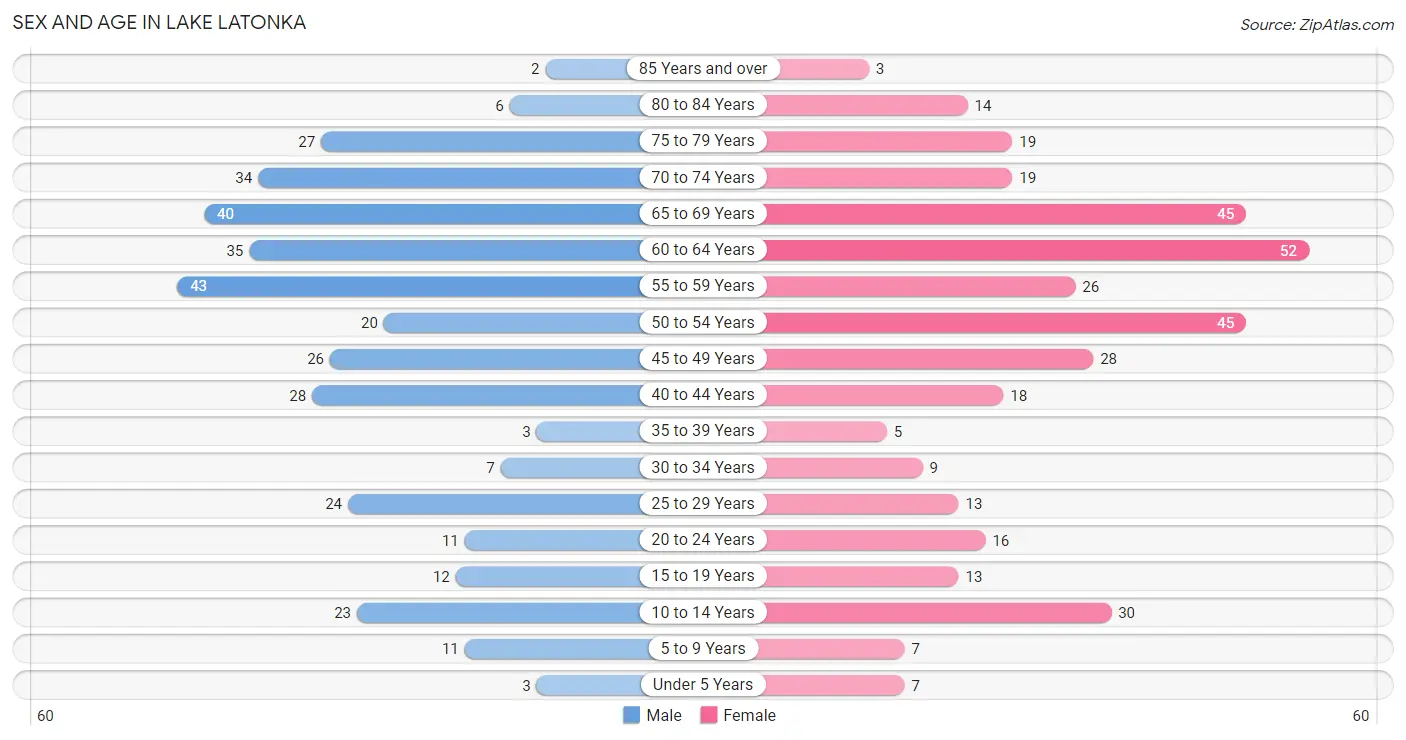
| Age Bracket | Male | Female |
| Under 5 Years | 3 (0.9%) | 7 (1.9%) |
| 5 to 9 Years | 11 (3.1%) | 7 (1.9%) |
| 10 to 14 Years | 23 (6.5%) | 30 (8.1%) |
| 15 to 19 Years | 12 (3.4%) | 13 (3.5%) |
| 20 to 24 Years | 11 (3.1%) | 16 (4.3%) |
| 25 to 29 Years | 24 (6.8%) | 13 (3.5%) |
| 30 to 34 Years | 7 (2.0%) | 9 (2.4%) |
| 35 to 39 Years | 3 (0.9%) | 5 (1.4%) |
| 40 to 44 Years | 28 (7.9%) | 18 (4.9%) |
| 45 to 49 Years | 26 (7.3%) | 28 (7.6%) |
| 50 to 54 Years | 20 (5.6%) | 45 (12.2%) |
| 55 to 59 Years | 43 (12.1%) | 26 (7.0%) |
| 60 to 64 Years | 35 (9.9%) | 52 (14.1%) |
| 65 to 69 Years | 40 (11.3%) | 45 (12.2%) |
| 70 to 74 Years | 34 (9.6%) | 19 (5.1%) |
| 75 to 79 Years | 27 (7.6%) | 19 (5.1%) |
| 80 to 84 Years | 6 (1.7%) | 14 (3.8%) |
| 85 Years and over | 2 (0.6%) | 3 (0.8%) |
| Total | 355 (100.0%) | 369 (100.0%) |
Families and Households in Lake Latonka
Median Family Size in Lake Latonka
The median family size in Lake Latonka is 2.51 persons per family, with married-couple families (214 | 90.7%) accounting for the largest median family size of 2.55 persons per family. On the other hand, single female/mother families (18 | 7.6%) represent the smallest median family size with 2.11 persons per family.
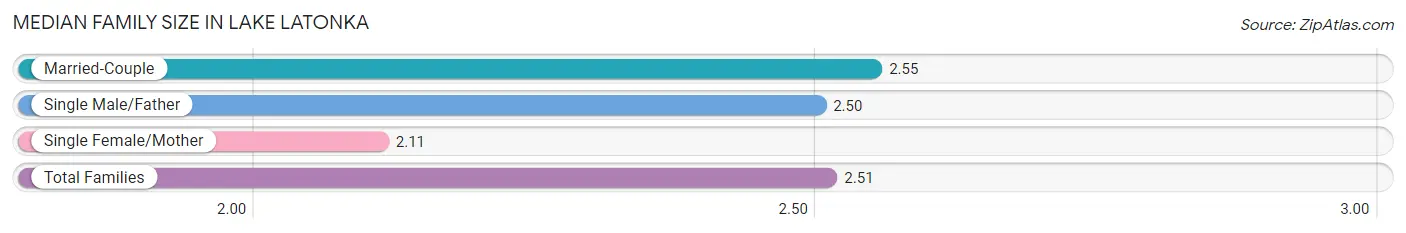
| Family Type | # Families | Family Size |
| Married-Couple | 214 (90.7%) | 2.55 |
| Single Male/Father | 4 (1.7%) | 2.50 |
| Single Female/Mother | 18 (7.6%) | 2.11 |
| Total Families | 236 (100.0%) | 2.51 |
Median Household Size in Lake Latonka
The median household size in Lake Latonka is 2.09 persons per household, with single male/father households (4 | 1.2%) accounting for the largest median household size of 3.75 persons per household. non-family households (110 | 31.8%) represent the smallest median household size with 1.15 persons per household.
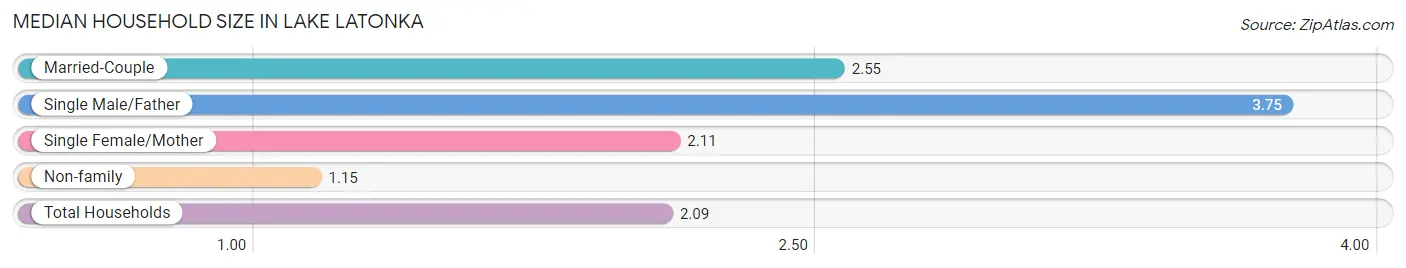
| Household Type | # Households | Household Size |
| Married-Couple | 214 (61.9%) | 2.55 |
| Single Male/Father | 4 (1.2%) | 3.75 |
| Single Female/Mother | 18 (5.2%) | 2.11 |
| Non-family | 110 (31.8%) | 1.15 |
| Total Households | 346 (100.0%) | 2.09 |
Household Size by Marriage Status in Lake Latonka
Out of a total of 346 households in Lake Latonka, 236 (68.2%) are family households, while 110 (31.8%) are nonfamily households. The most numerous type of family households are 2-person households, comprising 153, and the most common type of nonfamily households are 1-person households, comprising 101.
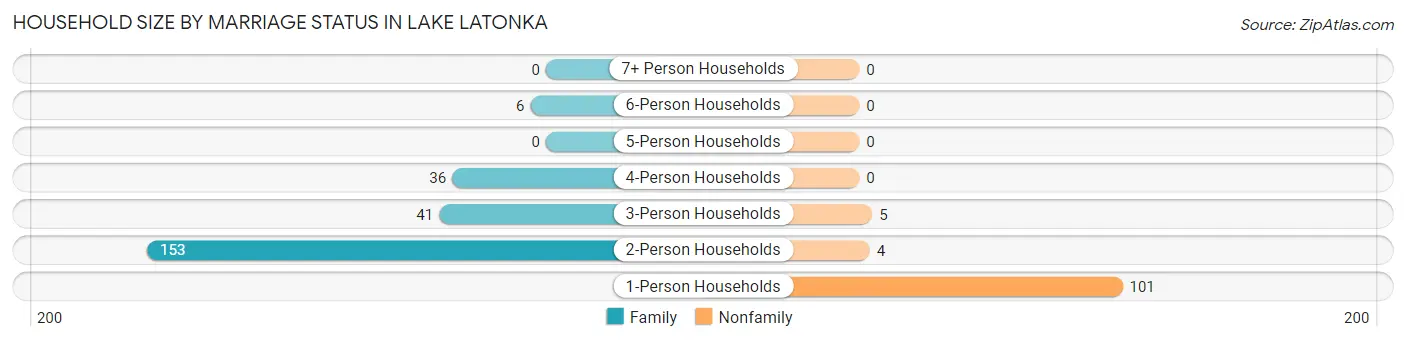
| Household Size | Family Households | Nonfamily Households |
| 1-Person Households | - | 101 (29.2%) |
| 2-Person Households | 153 (44.2%) | 4 (1.2%) |
| 3-Person Households | 41 (11.8%) | 5 (1.5%) |
| 4-Person Households | 36 (10.4%) | 0 (0.0%) |
| 5-Person Households | 0 (0.0%) | 0 (0.0%) |
| 6-Person Households | 6 (1.7%) | 0 (0.0%) |
| 7+ Person Households | 0 (0.0%) | 0 (0.0%) |
| Total | 236 (68.2%) | 110 (31.8%) |
Female Fertility in Lake Latonka
Fertility by Age in Lake Latonka
Average fertility rate in Lake Latonka is 74.0 births per 1,000 women. Women in the age bracket of 20 to 34 years have the highest fertility rate with 211.0 births per 1,000 women. Women in the age bracket of 20 to 34 years acount for 100.0% of all women with births.
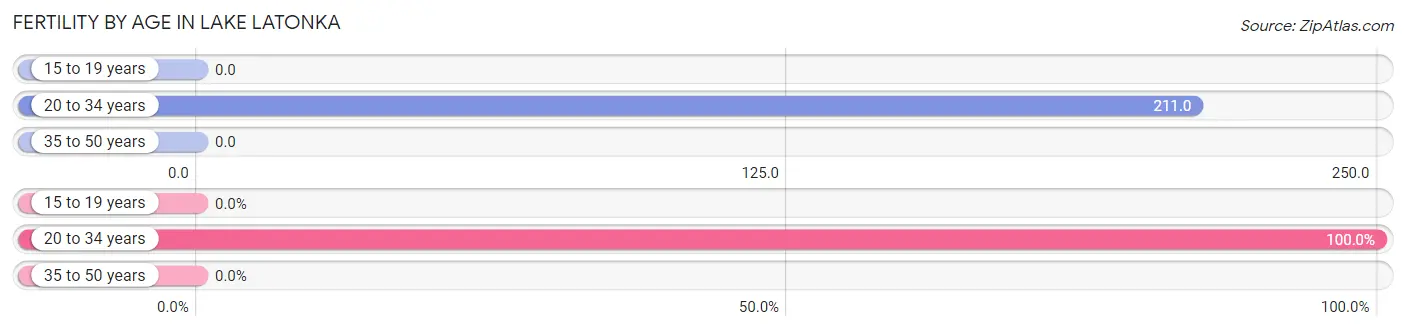
| Age Bracket | Women with Births | Births / 1,000 Women |
| 15 to 19 years | 0 (0.0%) | 0.0 |
| 20 to 34 years | 8 (100.0%) | 211.0 |
| 35 to 50 years | 0 (0.0%) | 0.0 |
| Total | 8 (100.0%) | 74.0 |
Fertility by Age by Marriage Status in Lake Latonka
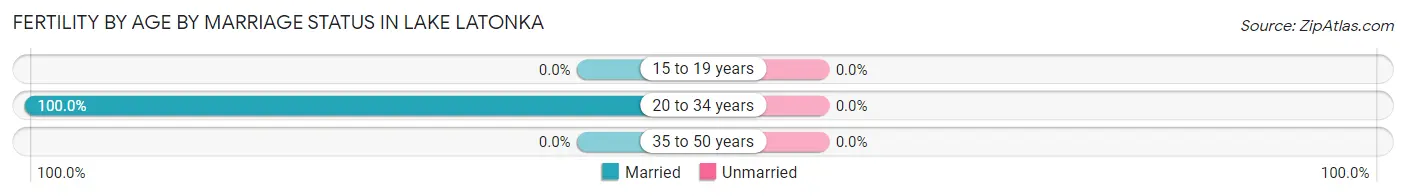
| Age Bracket | Married | Unmarried |
| 15 to 19 years | 0 (0.0%) | 0 (0.0%) |
| 20 to 34 years | 8 (100.0%) | 0 (0.0%) |
| 35 to 50 years | 0 (0.0%) | 0 (0.0%) |
| Total | 8 (100.0%) | 0 (0.0%) |
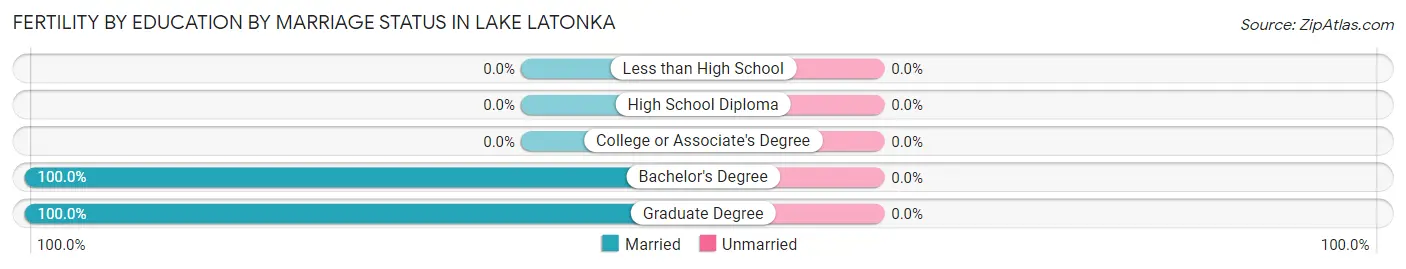
Fertility by Education in Lake Latonka
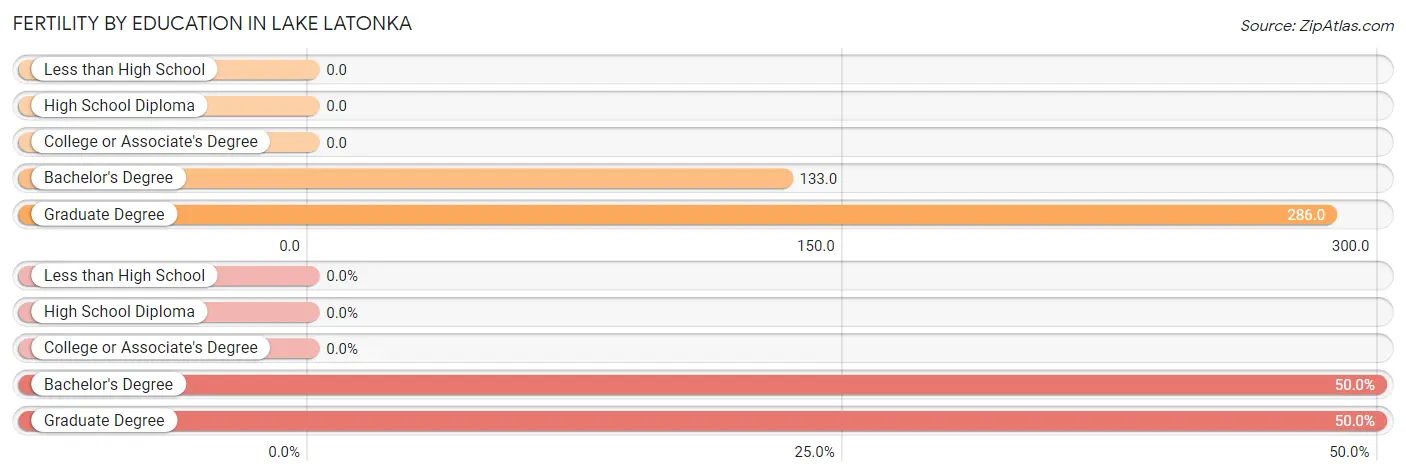
| Educational Attainment | Women with Births | Births / 1,000 Women |
| Less than High School | 0 (0.0%) | 0.0 |
| High School Diploma | 0 (0.0%) | 0.0 |
| College or Associate's Degree | 0 (0.0%) | 0.0 |
| Bachelor's Degree | 4 (50.0%) | 133.0 |
| Graduate Degree | 4 (50.0%) | 286.0 |
| Total | 8 (100.0%) | 74.0 |
Fertility by Education by Marriage Status in Lake Latonka
| Educational Attainment | Married | Unmarried |
| Less than High School | 0 (0.0%) | 0 (0.0%) |
| High School Diploma | 0 (0.0%) | 0 (0.0%) |
| College or Associate's Degree | 0 (0.0%) | 0 (0.0%) |
| Bachelor's Degree | 4 (100.0%) | 0 (0.0%) |
| Graduate Degree | 4 (100.0%) | 0 (0.0%) |
| Total | 8 (100.0%) | 0 (0.0%) |
Employment Characteristics in Lake Latonka
Employment by Class of Employer in Lake Latonka
Among the 348 employed individuals in Lake Latonka, private company employees (221 | 63.5%), self-employed (not incorporated) (32 | 9.2%), and self-employed (incorporated) (26 | 7.5%) make up the most common classes of employment.
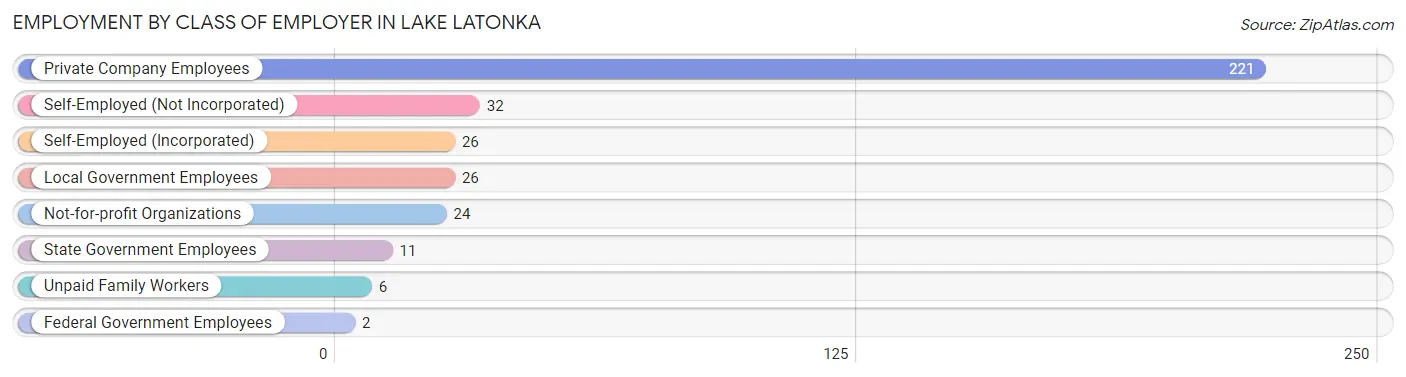
| Employer Class | # Employees | % Employees |
| Private Company Employees | 221 | 63.5% |
| Self-Employed (Incorporated) | 26 | 7.5% |
| Self-Employed (Not Incorporated) | 32 | 9.2% |
| Not-for-profit Organizations | 24 | 6.9% |
| Local Government Employees | 26 | 7.5% |
| State Government Employees | 11 | 3.2% |
| Federal Government Employees | 2 | 0.6% |
| Unpaid Family Workers | 6 | 1.7% |
| Total | 348 | 100.0% |
Employment Status by Age in Lake Latonka
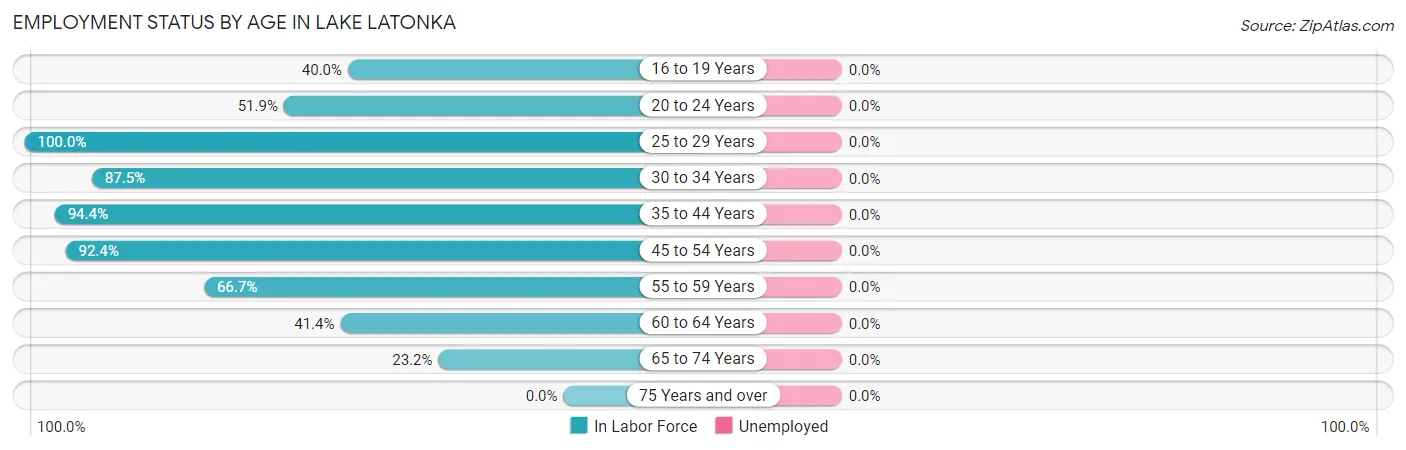
| Age Bracket | In Labor Force | Unemployed |
| 16 to 19 Years | 10 (40.0%) | 0 (0.0%) |
| 20 to 24 Years | 14 (51.9%) | 0 (0.0%) |
| 25 to 29 Years | 37 (100.0%) | 0 (0.0%) |
| 30 to 34 Years | 14 (87.5%) | 0 (0.0%) |
| 35 to 44 Years | 51 (94.4%) | 0 (0.0%) |
| 45 to 54 Years | 110 (92.4%) | 0 (0.0%) |
| 55 to 59 Years | 46 (66.7%) | 0 (0.0%) |
| 60 to 64 Years | 36 (41.4%) | 0 (0.0%) |
| 65 to 74 Years | 32 (23.2%) | 0 (0.0%) |
| 75 Years and over | 0 (0.0%) | 0 (0.0%) |
| Total | 350 (54.4%) | 0 (0.0%) |
Employment Status by Educational Attainment in Lake Latonka
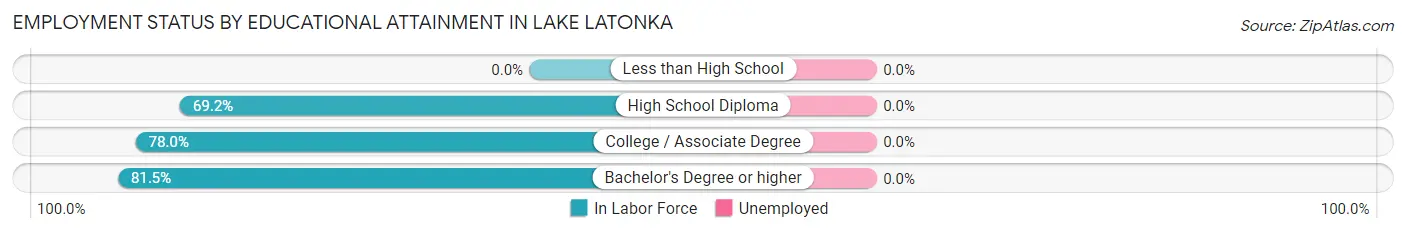
| Educational Attainment | In Labor Force | Unemployed |
| Less than High School | 0 (0.0%) | 0 (0.0%) |
| High School Diploma | 72 (69.2%) | 0 (0.0%) |
| College / Associate Degree | 103 (78.0%) | 0 (0.0%) |
| Bachelor's Degree or higher | 119 (81.5%) | 0 (0.0%) |
| Total | 294 (77.0%) | 0 (0.0%) |
Employment Occupations by Sex in Lake Latonka
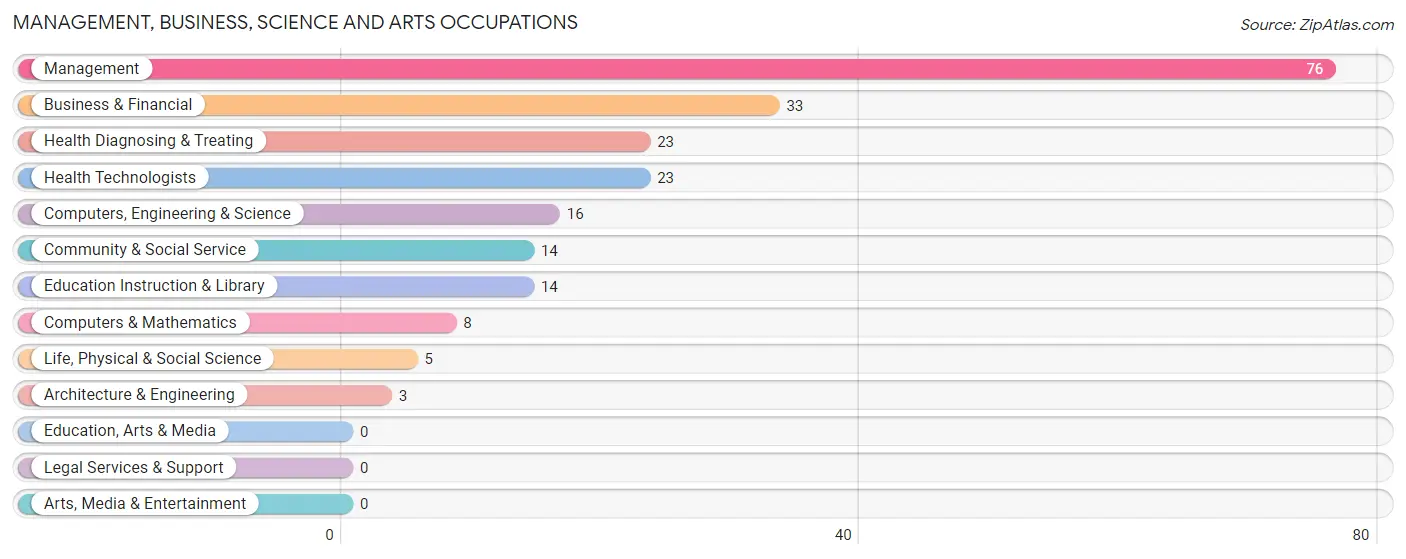
Management, Business, Science and Arts Occupations
The most common Management, Business, Science and Arts occupations in Lake Latonka are Management (76 | 21.7%), Business & Financial (33 | 9.4%), Health Diagnosing & Treating (23 | 6.6%), Health Technologists (23 | 6.6%), and Computers, Engineering & Science (16 | 4.6%).
Management, Business, Science and Arts Occupations by Sex
Within the Management, Business, Science and Arts occupations in Lake Latonka, the most male-oriented occupations are Computers, Engineering & Science (100.0%), Computers & Mathematics (100.0%), and Architecture & Engineering (100.0%), while the most female-oriented occupations are Community & Social Service (100.0%), Education Instruction & Library (100.0%), and Health Diagnosing & Treating (78.3%).
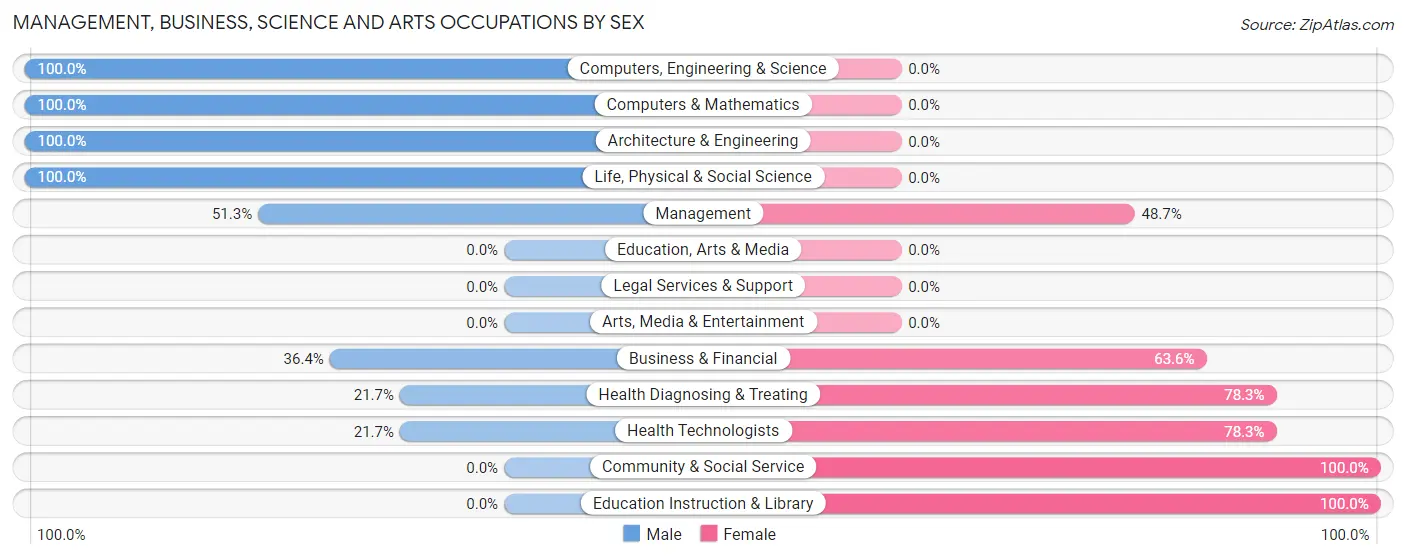
| Occupation | Male | Female |
| Management | 39 (51.3%) | 37 (48.7%) |
| Business & Financial | 12 (36.4%) | 21 (63.6%) |
| Computers, Engineering & Science | 16 (100.0%) | 0 (0.0%) |
| Computers & Mathematics | 8 (100.0%) | 0 (0.0%) |
| Architecture & Engineering | 3 (100.0%) | 0 (0.0%) |
| Life, Physical & Social Science | 5 (100.0%) | 0 (0.0%) |
| Community & Social Service | 0 (0.0%) | 14 (100.0%) |
| Education, Arts & Media | 0 (0.0%) | 0 (0.0%) |
| Legal Services & Support | 0 (0.0%) | 0 (0.0%) |
| Education Instruction & Library | 0 (0.0%) | 14 (100.0%) |
| Arts, Media & Entertainment | 0 (0.0%) | 0 (0.0%) |
| Health Diagnosing & Treating | 5 (21.7%) | 18 (78.3%) |
| Health Technologists | 5 (21.7%) | 18 (78.3%) |
| Total (Category) | 72 (44.4%) | 90 (55.6%) |
| Total (Overall) | 190 (54.3%) | 160 (45.7%) |
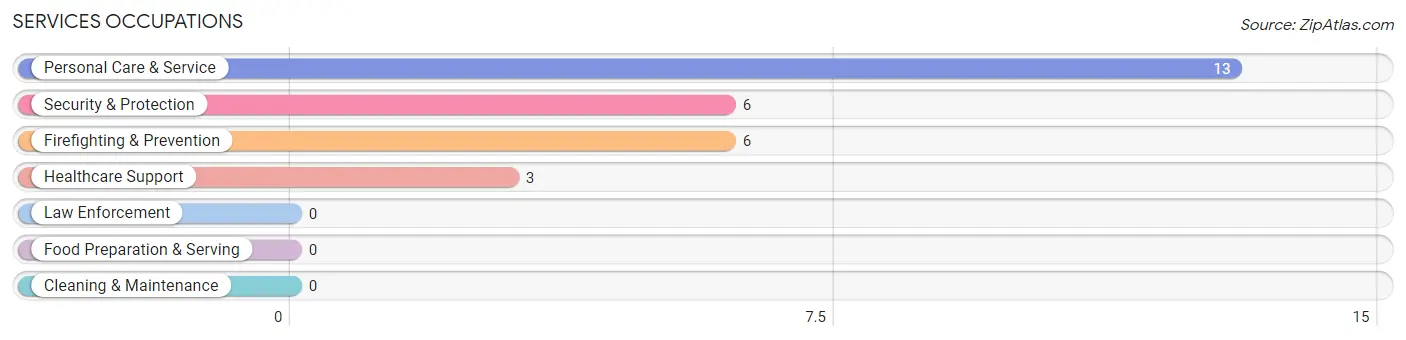
Services Occupations
The most common Services occupations in Lake Latonka are Personal Care & Service (13 | 3.7%), Security & Protection (6 | 1.7%), Firefighting & Prevention (6 | 1.7%), and Healthcare Support (3 | 0.9%).
Services Occupations by Sex
Within the Services occupations in Lake Latonka, the most male-oriented occupations are Security & Protection (100.0%), and Firefighting & Prevention (100.0%), while the most female-oriented occupations are Healthcare Support (100.0%), and Personal Care & Service (100.0%).
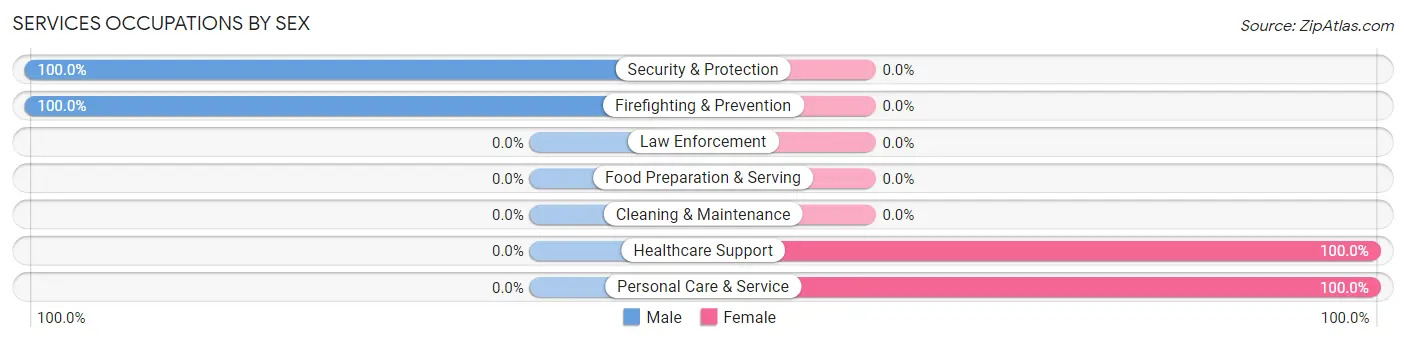
| Occupation | Male | Female |
| Healthcare Support | 0 (0.0%) | 3 (100.0%) |
| Security & Protection | 6 (100.0%) | 0 (0.0%) |
| Firefighting & Prevention | 6 (100.0%) | 0 (0.0%) |
| Law Enforcement | 0 (0.0%) | 0 (0.0%) |
| Food Preparation & Serving | 0 (0.0%) | 0 (0.0%) |
| Cleaning & Maintenance | 0 (0.0%) | 0 (0.0%) |
| Personal Care & Service | 0 (0.0%) | 13 (100.0%) |
| Total (Category) | 6 (27.3%) | 16 (72.7%) |
| Total (Overall) | 190 (54.3%) | 160 (45.7%) |
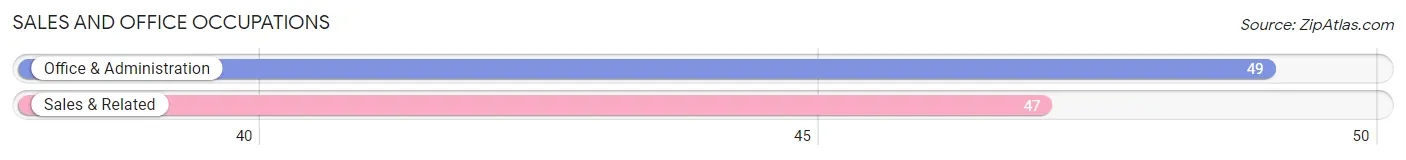
Sales and Office Occupations
The most common Sales and Office occupations in Lake Latonka are Office & Administration (49 | 14.0%), and Sales & Related (47 | 13.4%).
Sales and Office Occupations by Sex
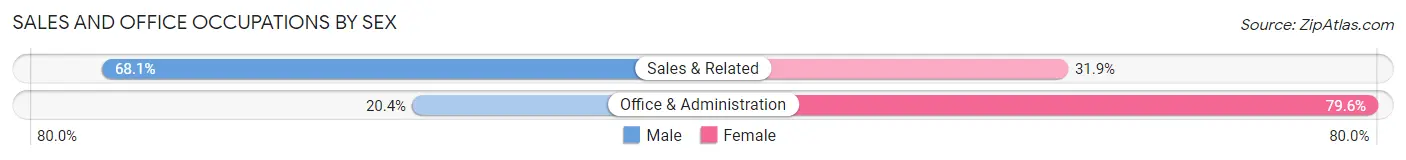
| Occupation | Male | Female |
| Sales & Related | 32 (68.1%) | 15 (31.9%) |
| Office & Administration | 10 (20.4%) | 39 (79.6%) |
| Total (Category) | 42 (43.8%) | 54 (56.2%) |
| Total (Overall) | 190 (54.3%) | 160 (45.7%) |
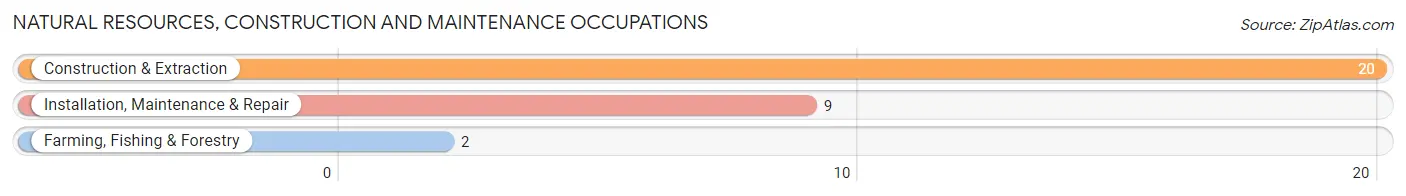
Natural Resources, Construction and Maintenance Occupations
The most common Natural Resources, Construction and Maintenance occupations in Lake Latonka are Construction & Extraction (20 | 5.7%), Installation, Maintenance & Repair (9 | 2.6%), and Farming, Fishing & Forestry (2 | 0.6%).
Natural Resources, Construction and Maintenance Occupations by Sex
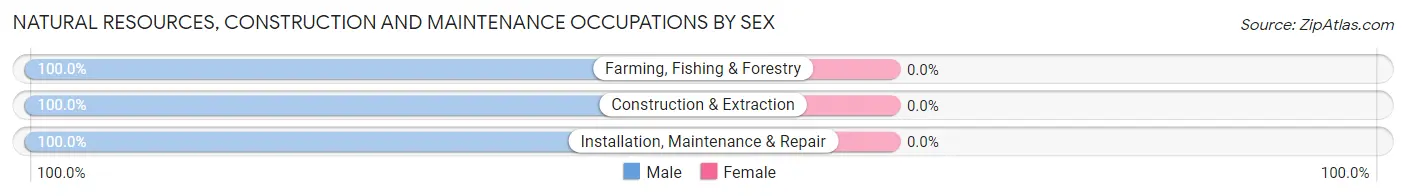
| Occupation | Male | Female |
| Farming, Fishing & Forestry | 2 (100.0%) | 0 (0.0%) |
| Construction & Extraction | 20 (100.0%) | 0 (0.0%) |
| Installation, Maintenance & Repair | 9 (100.0%) | 0 (0.0%) |
| Total (Category) | 31 (100.0%) | 0 (0.0%) |
| Total (Overall) | 190 (54.3%) | 160 (45.7%) |
Production, Transportation and Moving Occupations
The most common Production, Transportation and Moving occupations in Lake Latonka are Production (20 | 5.7%), Material Moving (10 | 2.9%), and Transportation (9 | 2.6%).
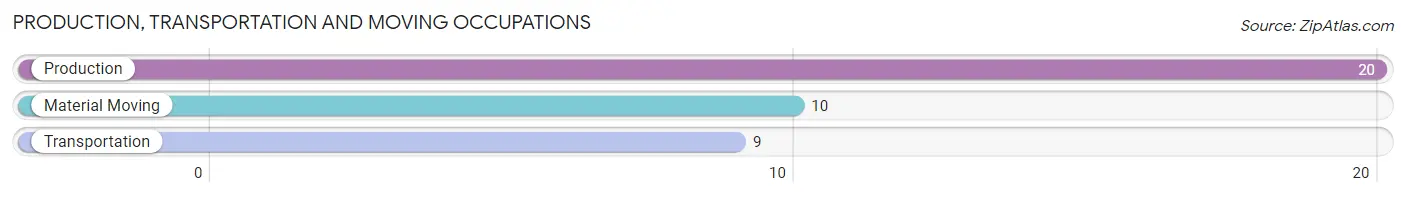
Production, Transportation and Moving Occupations by Sex
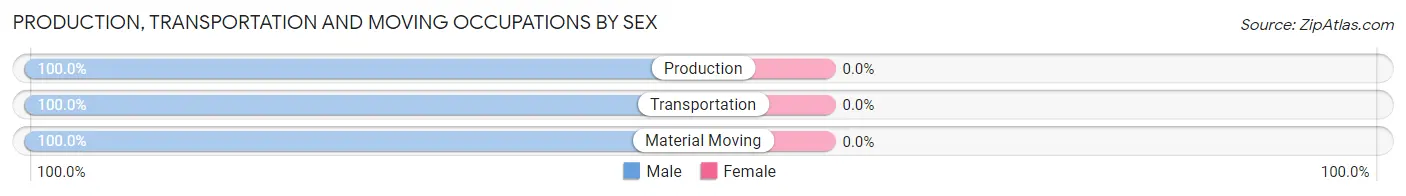
| Occupation | Male | Female |
| Production | 20 (100.0%) | 0 (0.0%) |
| Transportation | 9 (100.0%) | 0 (0.0%) |
| Material Moving | 10 (100.0%) | 0 (0.0%) |
| Total (Category) | 39 (100.0%) | 0 (0.0%) |
| Total (Overall) | 190 (54.3%) | 160 (45.7%) |
Employment Industries by Sex in Lake Latonka
Employment Industries in Lake Latonka
The major employment industries in Lake Latonka include Manufacturing (80 | 22.9%), Construction (45 | 12.9%), Retail Trade (34 | 9.7%), Educational Services (28 | 8.0%), and Professional & Scientific (27 | 7.7%).
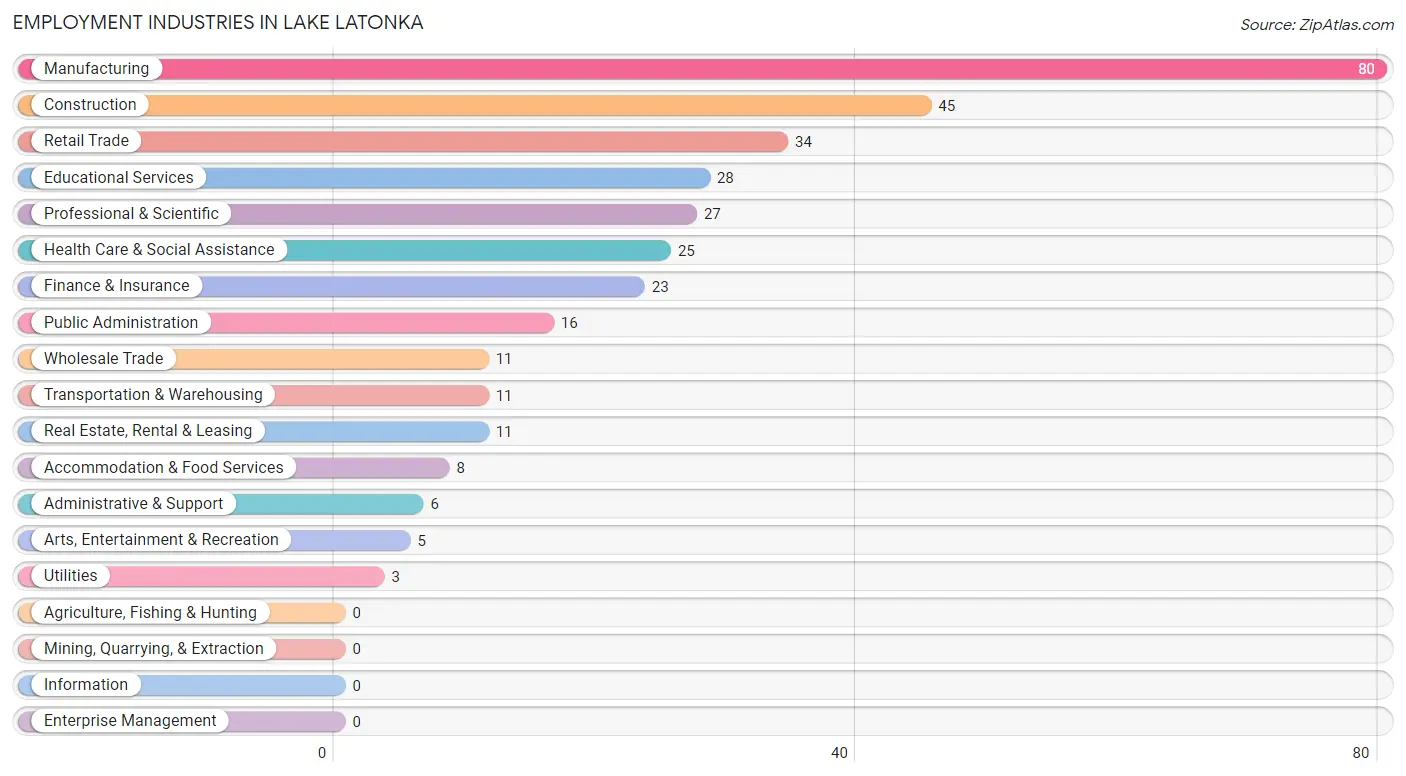
Employment Industries by Sex in Lake Latonka
The Lake Latonka industries that see more men than women are Transportation & Warehousing (100.0%), Utilities (100.0%), and Administrative & Support (100.0%), whereas the industries that tend to have a higher number of women are Real Estate, Rental & Leasing (100.0%), Arts, Entertainment & Recreation (100.0%), and Public Administration (87.5%).
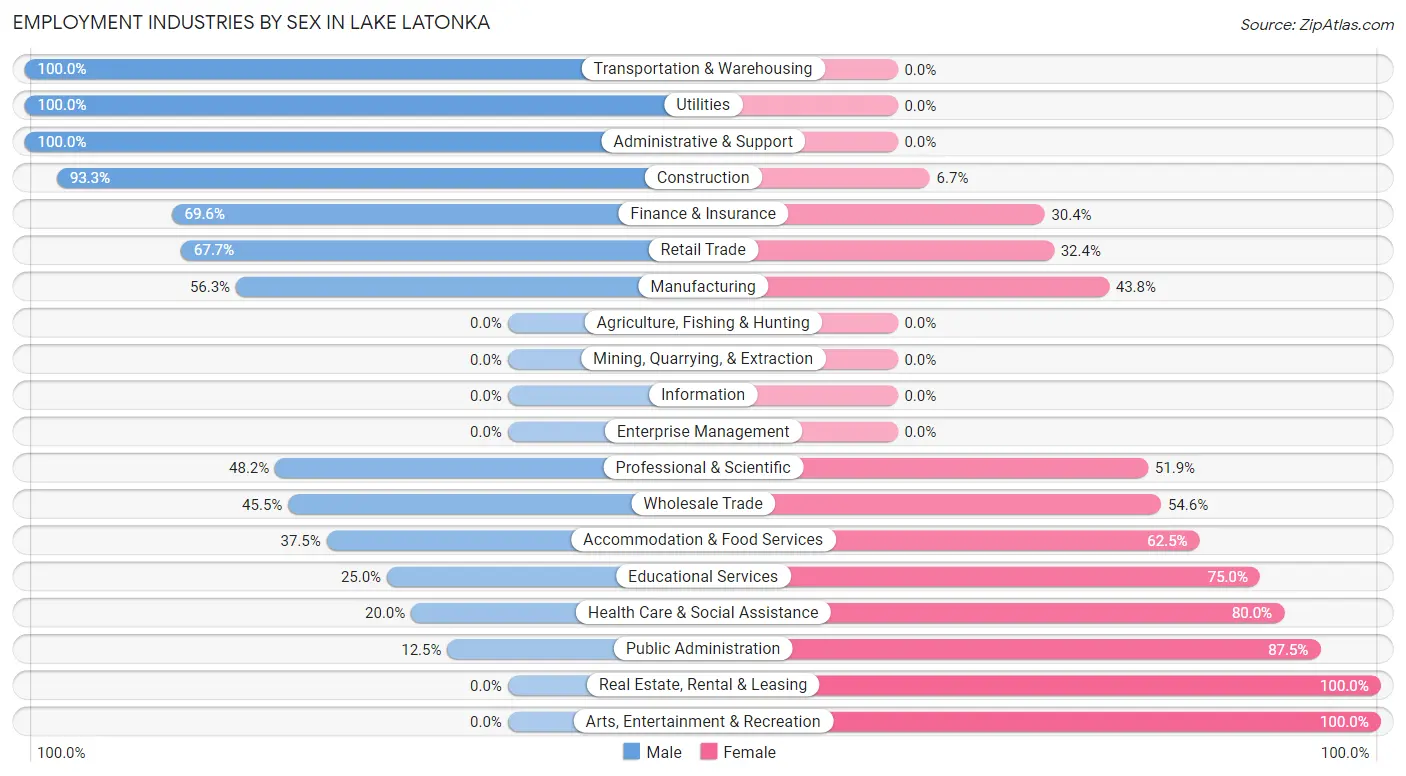
| Industry | Male | Female |
| Agriculture, Fishing & Hunting | 0 (0.0%) | 0 (0.0%) |
| Mining, Quarrying, & Extraction | 0 (0.0%) | 0 (0.0%) |
| Construction | 42 (93.3%) | 3 (6.7%) |
| Manufacturing | 45 (56.2%) | 35 (43.8%) |
| Wholesale Trade | 5 (45.5%) | 6 (54.5%) |
| Retail Trade | 23 (67.6%) | 11 (32.4%) |
| Transportation & Warehousing | 11 (100.0%) | 0 (0.0%) |
| Utilities | 3 (100.0%) | 0 (0.0%) |
| Information | 0 (0.0%) | 0 (0.0%) |
| Finance & Insurance | 16 (69.6%) | 7 (30.4%) |
| Real Estate, Rental & Leasing | 0 (0.0%) | 11 (100.0%) |
| Professional & Scientific | 13 (48.1%) | 14 (51.8%) |
| Enterprise Management | 0 (0.0%) | 0 (0.0%) |
| Administrative & Support | 6 (100.0%) | 0 (0.0%) |
| Educational Services | 7 (25.0%) | 21 (75.0%) |
| Health Care & Social Assistance | 5 (20.0%) | 20 (80.0%) |
| Arts, Entertainment & Recreation | 0 (0.0%) | 5 (100.0%) |
| Accommodation & Food Services | 3 (37.5%) | 5 (62.5%) |
| Public Administration | 2 (12.5%) | 14 (87.5%) |
| Total | 190 (54.3%) | 160 (45.7%) |
Education in Lake Latonka
School Enrollment in Lake Latonka
The most common levels of schooling among the 96 students in Lake Latonka are middle school (33 | 34.4%), high school (22 | 22.9%), and college / undergraduate (22 | 22.9%).
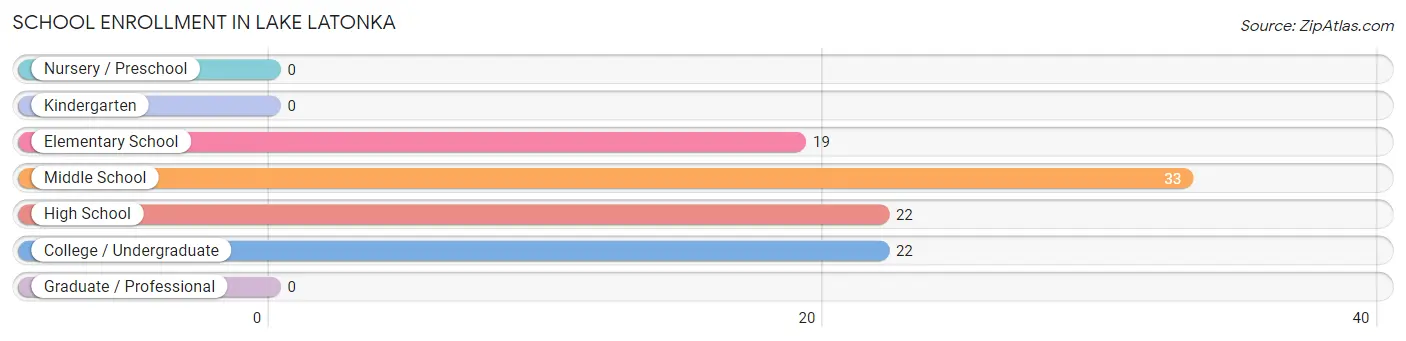
| School Level | # Students | % Students |
| Nursery / Preschool | 0 | 0.0% |
| Kindergarten | 0 | 0.0% |
| Elementary School | 19 | 19.8% |
| Middle School | 33 | 34.4% |
| High School | 22 | 22.9% |
| College / Undergraduate | 22 | 22.9% |
| Graduate / Professional | 0 | 0.0% |
| Total | 96 | 100.0% |
School Enrollment by Age by Funding Source in Lake Latonka
Out of a total of 96 students who are enrolled in schools in Lake Latonka, 25 (26.0%) attend a private institution, while the remaining 71 (74.0%) are enrolled in public schools. The age group of 15 to 17 year olds has the highest likelihood of being enrolled in private schools, with 7 (58.3% in the age bracket) enrolled. Conversely, the age group of 5 to 9 year old has the lowest likelihood of being enrolled in a private school, with 15 (100.0% in the age bracket) attending a public institution.
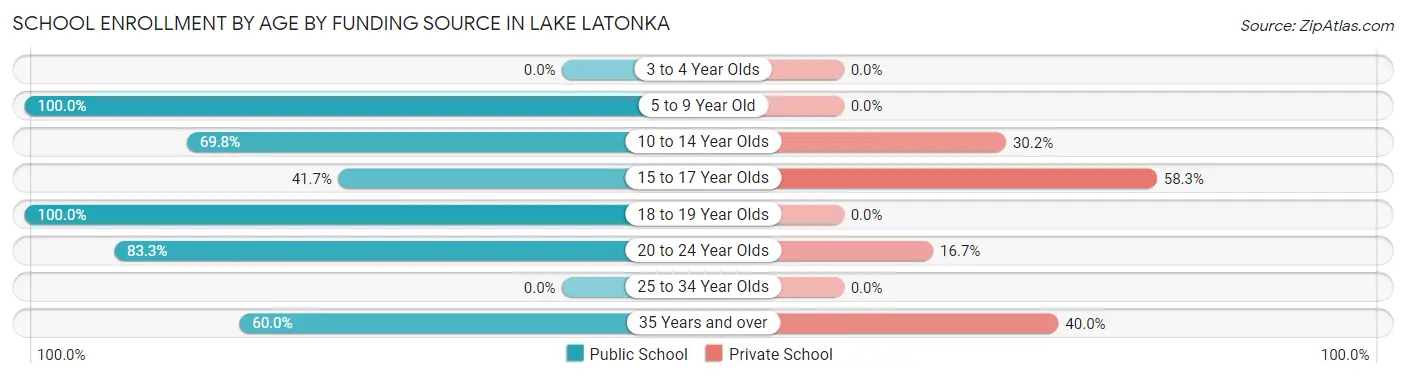
| Age Bracket | Public School | Private School |
| 3 to 4 Year Olds | 0 (0.0%) | 0 (0.0%) |
| 5 to 9 Year Old | 15 (100.0%) | 0 (0.0%) |
| 10 to 14 Year Olds | 30 (69.8%) | 13 (30.2%) |
| 15 to 17 Year Olds | 5 (41.7%) | 7 (58.3%) |
| 18 to 19 Year Olds | 3 (100.0%) | 0 (0.0%) |
| 20 to 24 Year Olds | 15 (83.3%) | 3 (16.7%) |
| 25 to 34 Year Olds | 0 (0.0%) | 0 (0.0%) |
| 35 Years and over | 3 (60.0%) | 2 (40.0%) |
| Total | 71 (74.0%) | 25 (26.0%) |
Educational Attainment by Field of Study in Lake Latonka
Business (79 | 29.6%), education (57 | 21.3%), science & technology (35 | 13.1%), computers & mathematics (25 | 9.4%), and arts & humanities (18 | 6.7%) are the most common fields of study among 267 individuals in Lake Latonka who have obtained a bachelor's degree or higher.
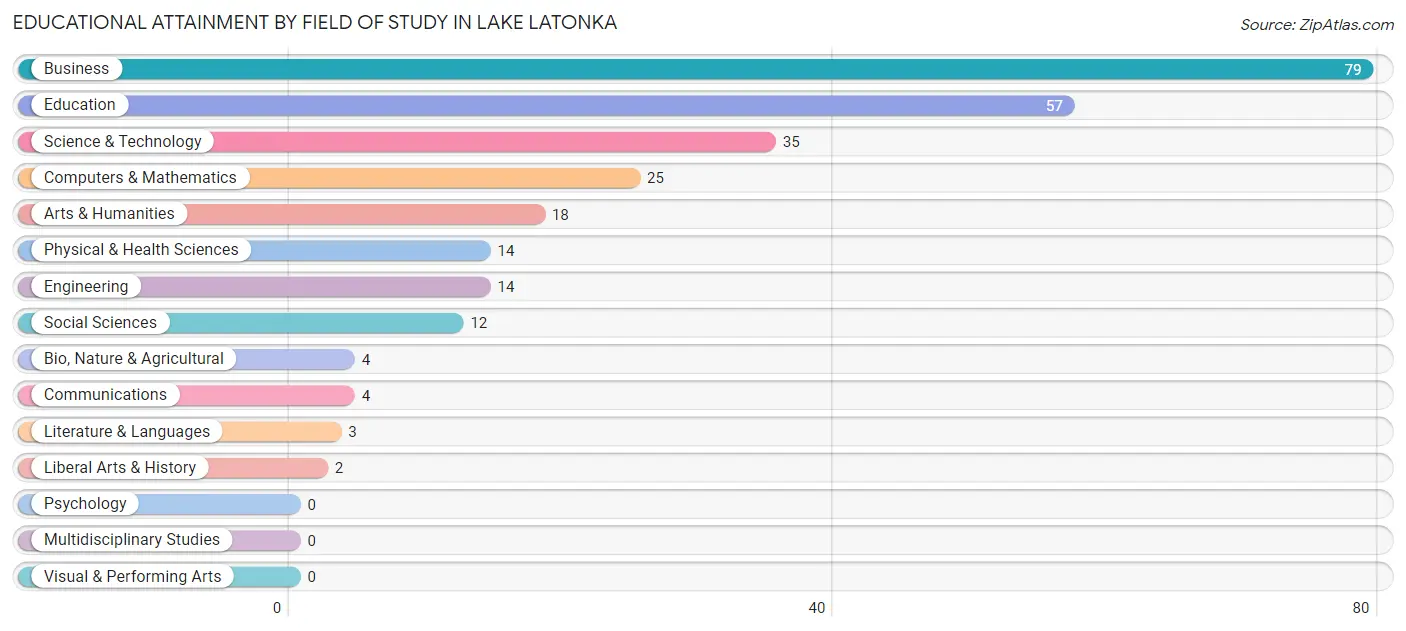
| Field of Study | # Graduates | % Graduates |
| Computers & Mathematics | 25 | 9.4% |
| Bio, Nature & Agricultural | 4 | 1.5% |
| Physical & Health Sciences | 14 | 5.2% |
| Psychology | 0 | 0.0% |
| Social Sciences | 12 | 4.5% |
| Engineering | 14 | 5.2% |
| Multidisciplinary Studies | 0 | 0.0% |
| Science & Technology | 35 | 13.1% |
| Business | 79 | 29.6% |
| Education | 57 | 21.3% |
| Literature & Languages | 3 | 1.1% |
| Liberal Arts & History | 2 | 0.7% |
| Visual & Performing Arts | 0 | 0.0% |
| Communications | 4 | 1.5% |
| Arts & Humanities | 18 | 6.7% |
| Total | 267 | 100.0% |
Transportation & Commute in Lake Latonka
Vehicle Availability by Sex in Lake Latonka
The most prevalent vehicle ownership categories in Lake Latonka are males with 2 vehicles (94, accounting for 49.5%) and females with 2 vehicles (85, making up 59.5%).
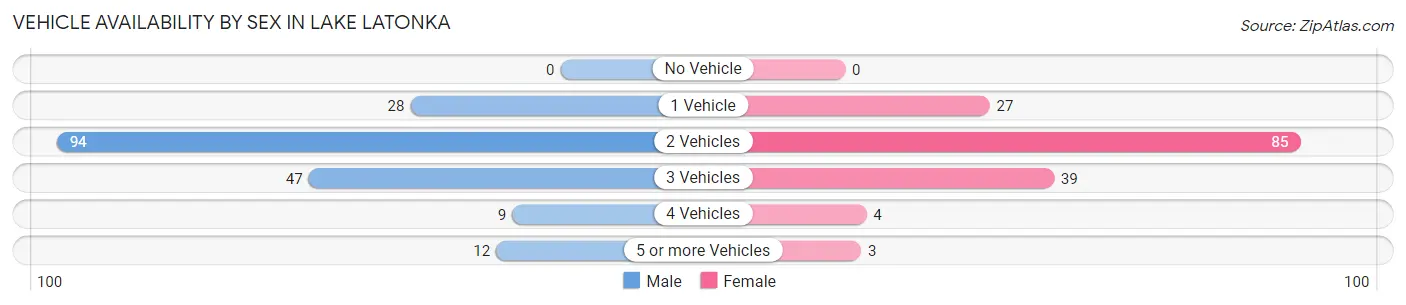
| Vehicles Available | Male | Female |
| No Vehicle | 0 (0.0%) | 0 (0.0%) |
| 1 Vehicle | 28 (14.7%) | 27 (17.1%) |
| 2 Vehicles | 94 (49.5%) | 85 (53.8%) |
| 3 Vehicles | 47 (24.7%) | 39 (24.7%) |
| 4 Vehicles | 9 (4.7%) | 4 (2.5%) |
| 5 or more Vehicles | 12 (6.3%) | 3 (1.9%) |
| Total | 190 (100.0%) | 158 (100.0%) |
Commute Time in Lake Latonka
The most frequently occuring commute durations in Lake Latonka are 60 to 89 minutes (60 commuters, 19.9%), 20 to 24 minutes (34 commuters, 11.3%), and 45 to 59 minutes (31 commuters, 10.3%).
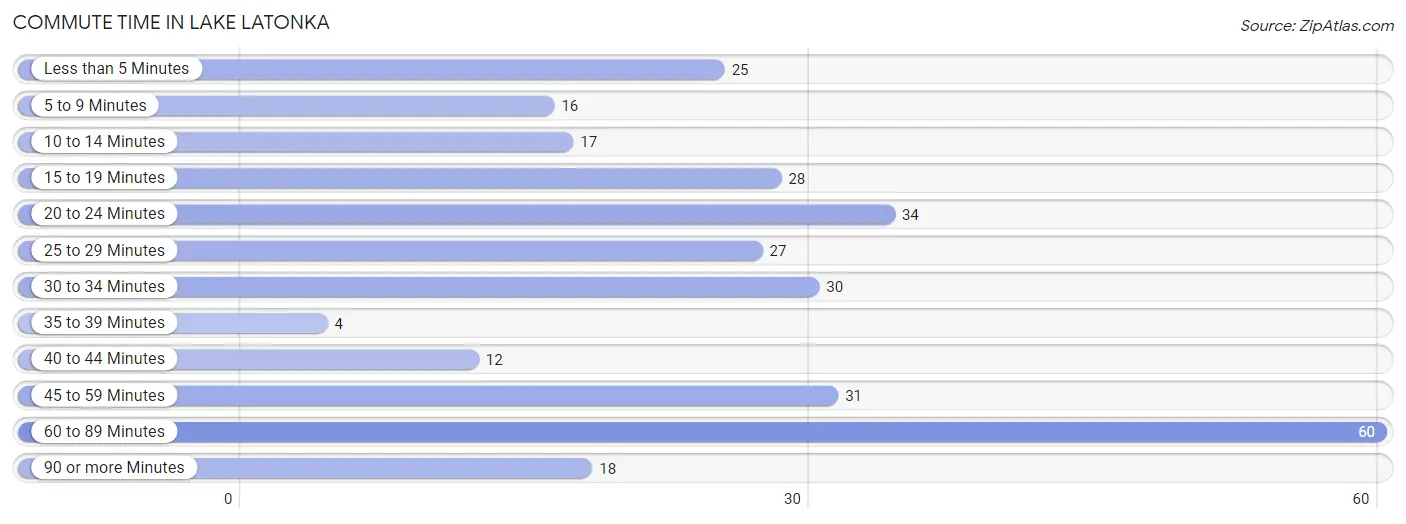
| Commute Time | # Commuters | % Commuters |
| Less than 5 Minutes | 25 | 8.3% |
| 5 to 9 Minutes | 16 | 5.3% |
| 10 to 14 Minutes | 17 | 5.6% |
| 15 to 19 Minutes | 28 | 9.3% |
| 20 to 24 Minutes | 34 | 11.3% |
| 25 to 29 Minutes | 27 | 8.9% |
| 30 to 34 Minutes | 30 | 9.9% |
| 35 to 39 Minutes | 4 | 1.3% |
| 40 to 44 Minutes | 12 | 4.0% |
| 45 to 59 Minutes | 31 | 10.3% |
| 60 to 89 Minutes | 60 | 19.9% |
| 90 or more Minutes | 18 | 6.0% |
Commute Time by Sex in Lake Latonka
The most common commute times in Lake Latonka are 60 to 89 minutes (48 commuters, 27.3%) for males and 20 to 24 minutes (23 commuters, 18.2%) for females.
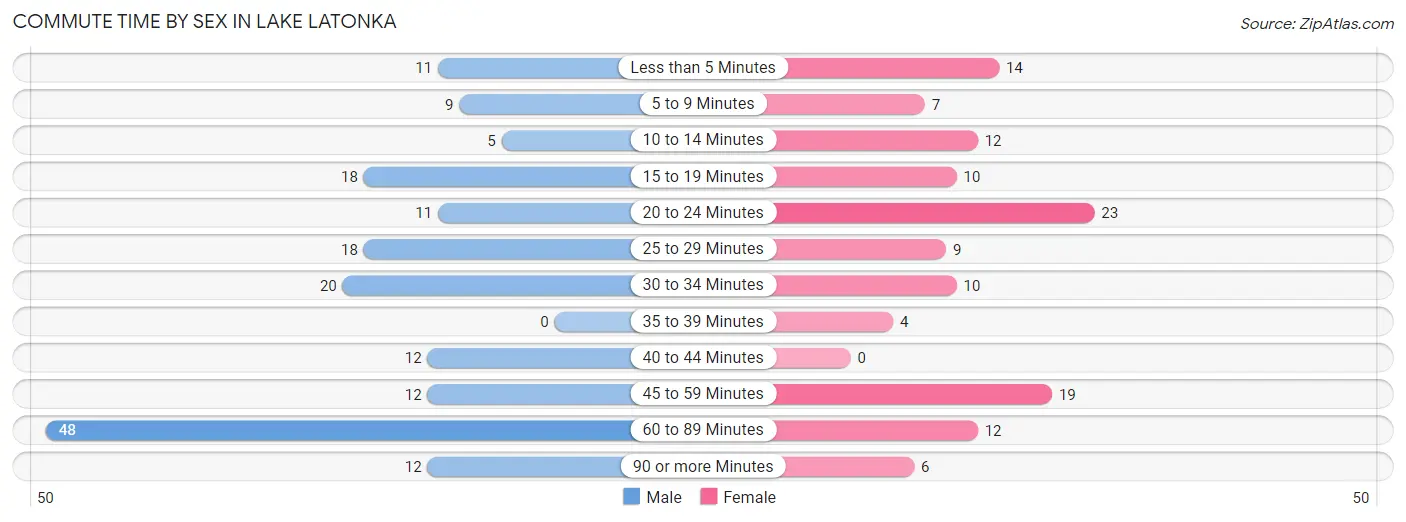
| Commute Time | Male | Female |
| Less than 5 Minutes | 11 (6.2%) | 14 (11.1%) |
| 5 to 9 Minutes | 9 (5.1%) | 7 (5.6%) |
| 10 to 14 Minutes | 5 (2.8%) | 12 (9.5%) |
| 15 to 19 Minutes | 18 (10.2%) | 10 (7.9%) |
| 20 to 24 Minutes | 11 (6.2%) | 23 (18.2%) |
| 25 to 29 Minutes | 18 (10.2%) | 9 (7.1%) |
| 30 to 34 Minutes | 20 (11.4%) | 10 (7.9%) |
| 35 to 39 Minutes | 0 (0.0%) | 4 (3.2%) |
| 40 to 44 Minutes | 12 (6.8%) | 0 (0.0%) |
| 45 to 59 Minutes | 12 (6.8%) | 19 (15.1%) |
| 60 to 89 Minutes | 48 (27.3%) | 12 (9.5%) |
| 90 or more Minutes | 12 (6.8%) | 6 (4.8%) |
Time of Departure to Work by Sex in Lake Latonka
The most frequent times of departure to work in Lake Latonka are 7:00 AM to 7:29 AM (42, 23.9%) for males and 9:00 AM to 9:59 AM (33, 26.2%) for females.
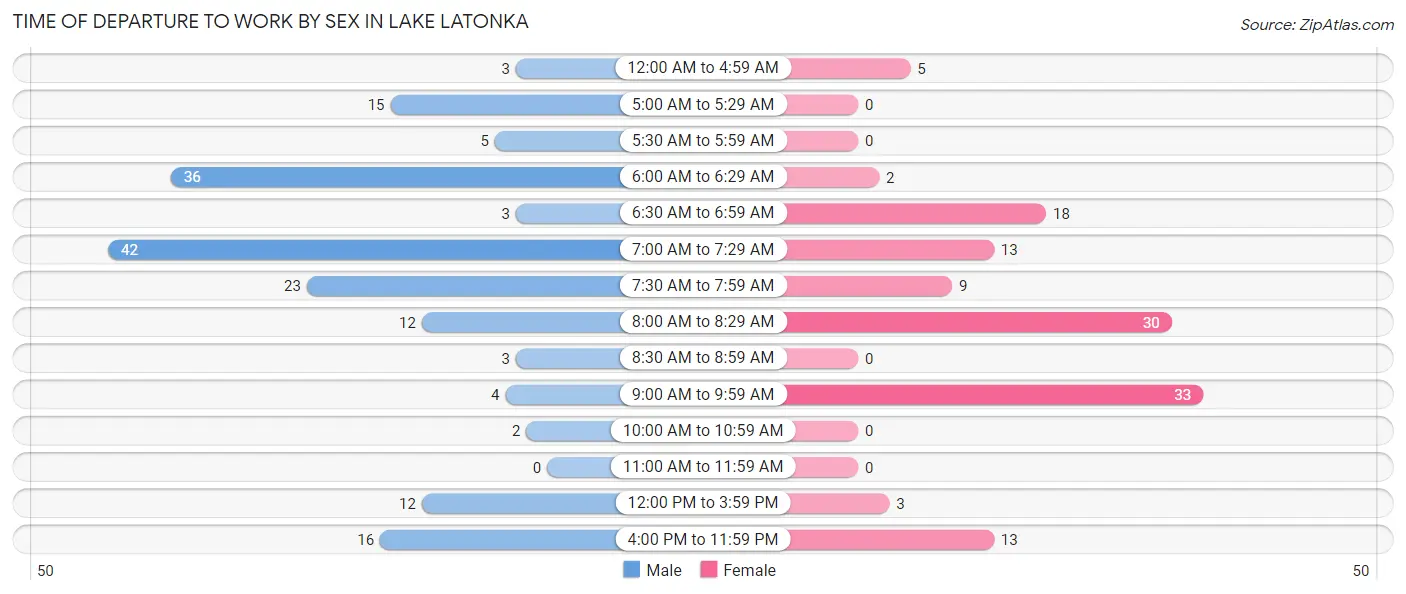
| Time of Departure | Male | Female |
| 12:00 AM to 4:59 AM | 3 (1.7%) | 5 (4.0%) |
| 5:00 AM to 5:29 AM | 15 (8.5%) | 0 (0.0%) |
| 5:30 AM to 5:59 AM | 5 (2.8%) | 0 (0.0%) |
| 6:00 AM to 6:29 AM | 36 (20.4%) | 2 (1.6%) |
| 6:30 AM to 6:59 AM | 3 (1.7%) | 18 (14.3%) |
| 7:00 AM to 7:29 AM | 42 (23.9%) | 13 (10.3%) |
| 7:30 AM to 7:59 AM | 23 (13.1%) | 9 (7.1%) |
| 8:00 AM to 8:29 AM | 12 (6.8%) | 30 (23.8%) |
| 8:30 AM to 8:59 AM | 3 (1.7%) | 0 (0.0%) |
| 9:00 AM to 9:59 AM | 4 (2.3%) | 33 (26.2%) |
| 10:00 AM to 10:59 AM | 2 (1.1%) | 0 (0.0%) |
| 11:00 AM to 11:59 AM | 0 (0.0%) | 0 (0.0%) |
| 12:00 PM to 3:59 PM | 12 (6.8%) | 3 (2.4%) |
| 4:00 PM to 11:59 PM | 16 (9.1%) | 13 (10.3%) |
| Total | 176 (100.0%) | 126 (100.0%) |
Housing Occupancy in Lake Latonka
Occupancy by Ownership in Lake Latonka
Of the total 346 dwellings in Lake Latonka, owner-occupied units account for 339 (98.0%), while renter-occupied units make up 7 (2.0%).
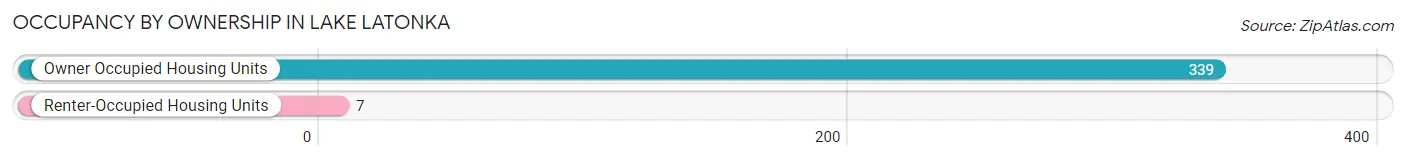
| Occupancy | # Housing Units | % Housing Units |
| Owner Occupied Housing Units | 339 | 98.0% |
| Renter-Occupied Housing Units | 7 | 2.0% |
| Total Occupied Housing Units | 346 | 100.0% |
Occupancy by Household Size in Lake Latonka
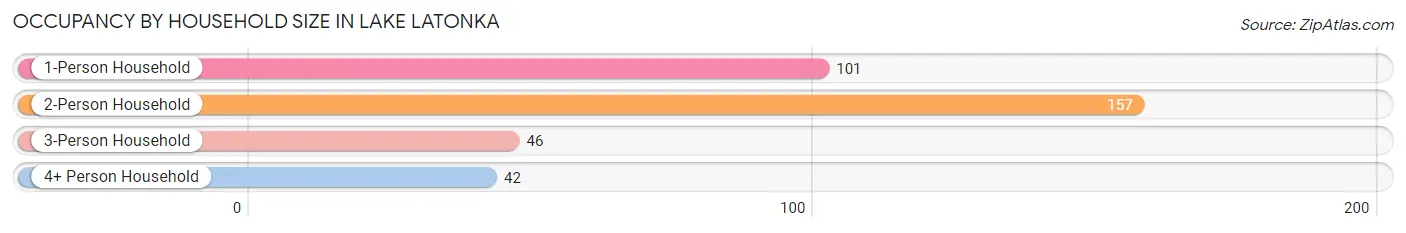
| Household Size | # Housing Units | % Housing Units |
| 1-Person Household | 101 | 29.2% |
| 2-Person Household | 157 | 45.4% |
| 3-Person Household | 46 | 13.3% |
| 4+ Person Household | 42 | 12.1% |
| Total Housing Units | 346 | 100.0% |
Occupancy by Ownership by Household Size in Lake Latonka
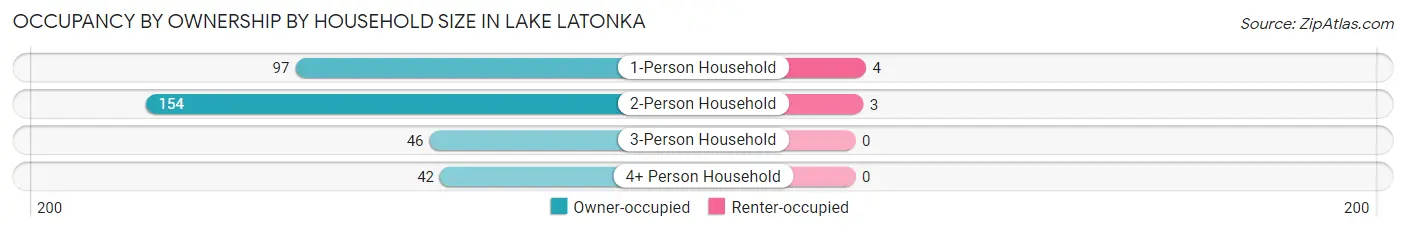
| Household Size | Owner-occupied | Renter-occupied |
| 1-Person Household | 97 (96.0%) | 4 (4.0%) |
| 2-Person Household | 154 (98.1%) | 3 (1.9%) |
| 3-Person Household | 46 (100.0%) | 0 (0.0%) |
| 4+ Person Household | 42 (100.0%) | 0 (0.0%) |
| Total Housing Units | 339 (98.0%) | 7 (2.0%) |
Occupancy by Educational Attainment in Lake Latonka
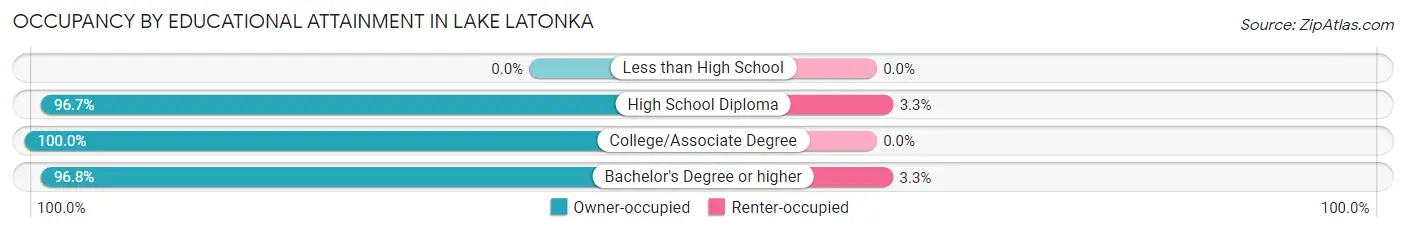
| Household Size | Owner-occupied | Renter-occupied |
| Less than High School | 0 (0.0%) | 0 (0.0%) |
| High School Diploma | 59 (96.7%) | 2 (3.3%) |
| College/Associate Degree | 131 (100.0%) | 0 (0.0%) |
| Bachelor's Degree or higher | 149 (96.8%) | 5 (3.3%) |
Occupancy by Age of Householder in Lake Latonka
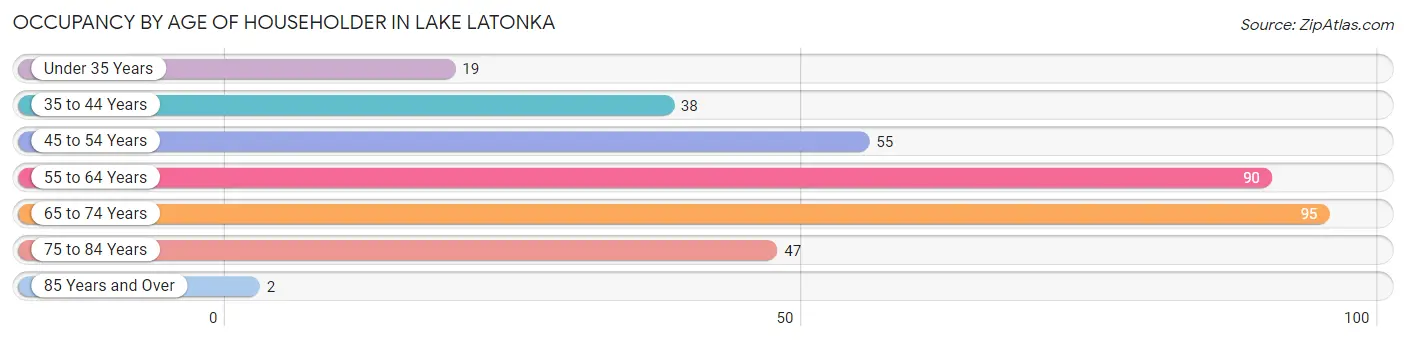
| Age Bracket | # Households | % Households |
| Under 35 Years | 19 | 5.5% |
| 35 to 44 Years | 38 | 11.0% |
| 45 to 54 Years | 55 | 15.9% |
| 55 to 64 Years | 90 | 26.0% |
| 65 to 74 Years | 95 | 27.5% |
| 75 to 84 Years | 47 | 13.6% |
| 85 Years and Over | 2 | 0.6% |
| Total | 346 | 100.0% |
Housing Finances in Lake Latonka
Median Income by Occupancy in Lake Latonka
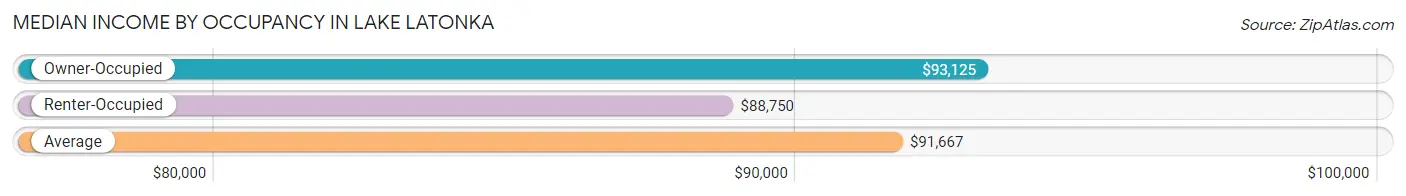
| Occupancy Type | # Households | Median Income |
| Owner-Occupied | 339 (98.0%) | $93,125 |
| Renter-Occupied | 7 (2.0%) | $88,750 |
| Average | 346 (100.0%) | $91,667 |
Occupancy by Householder Income Bracket in Lake Latonka
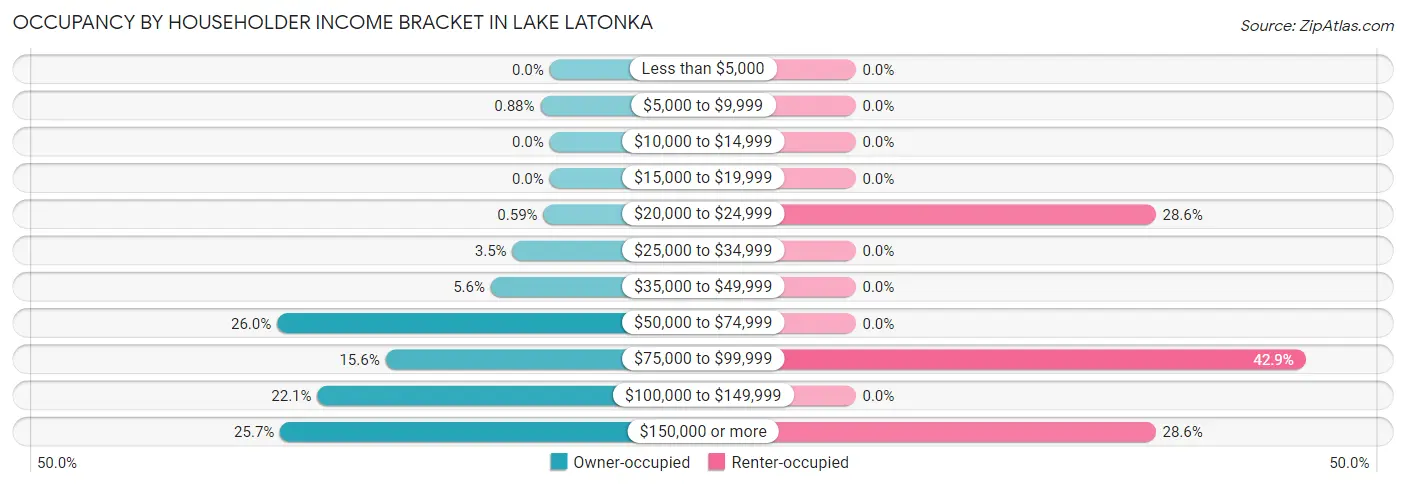
| Income Bracket | Owner-occupied | Renter-occupied |
| Less than $5,000 | 0 (0.0%) | 0 (0.0%) |
| $5,000 to $9,999 | 3 (0.9%) | 0 (0.0%) |
| $10,000 to $14,999 | 0 (0.0%) | 0 (0.0%) |
| $15,000 to $19,999 | 0 (0.0%) | 0 (0.0%) |
| $20,000 to $24,999 | 2 (0.6%) | 2 (28.6%) |
| $25,000 to $34,999 | 12 (3.5%) | 0 (0.0%) |
| $35,000 to $49,999 | 19 (5.6%) | 0 (0.0%) |
| $50,000 to $74,999 | 88 (26.0%) | 0 (0.0%) |
| $75,000 to $99,999 | 53 (15.6%) | 3 (42.9%) |
| $100,000 to $149,999 | 75 (22.1%) | 0 (0.0%) |
| $150,000 or more | 87 (25.7%) | 2 (28.6%) |
| Total | 339 (100.0%) | 7 (100.0%) |
Monthly Housing Cost Tiers in Lake Latonka
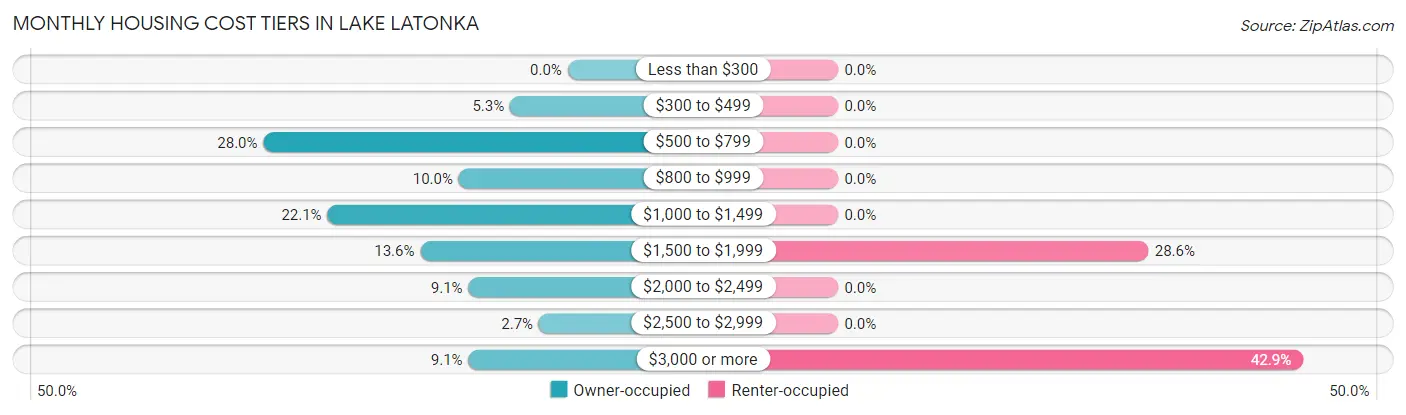
| Monthly Cost | Owner-occupied | Renter-occupied |
| Less than $300 | 0 (0.0%) | 0 (0.0%) |
| $300 to $499 | 18 (5.3%) | 0 (0.0%) |
| $500 to $799 | 95 (28.0%) | 0 (0.0%) |
| $800 to $999 | 34 (10.0%) | 0 (0.0%) |
| $1,000 to $1,499 | 75 (22.1%) | 0 (0.0%) |
| $1,500 to $1,999 | 46 (13.6%) | 2 (28.6%) |
| $2,000 to $2,499 | 31 (9.1%) | 0 (0.0%) |
| $2,500 to $2,999 | 9 (2.6%) | 0 (0.0%) |
| $3,000 or more | 31 (9.1%) | 3 (42.9%) |
| Total | 339 (100.0%) | 7 (100.0%) |
Physical Housing Characteristics in Lake Latonka
Housing Structures in Lake Latonka
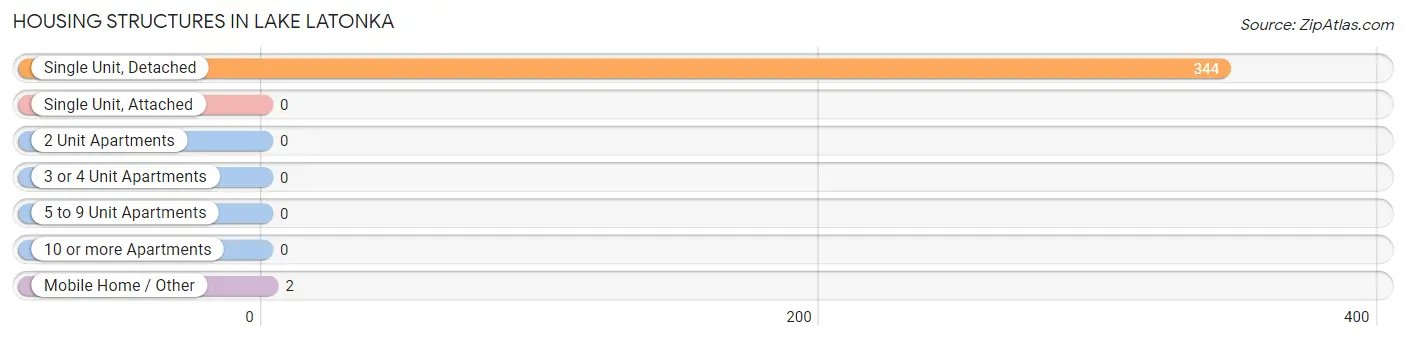
| Structure Type | # Housing Units | % Housing Units |
| Single Unit, Detached | 344 | 99.4% |
| Single Unit, Attached | 0 | 0.0% |
| 2 Unit Apartments | 0 | 0.0% |
| 3 or 4 Unit Apartments | 0 | 0.0% |
| 5 to 9 Unit Apartments | 0 | 0.0% |
| 10 or more Apartments | 0 | 0.0% |
| Mobile Home / Other | 2 | 0.6% |
| Total | 346 | 100.0% |
Housing Structures by Occupancy in Lake Latonka
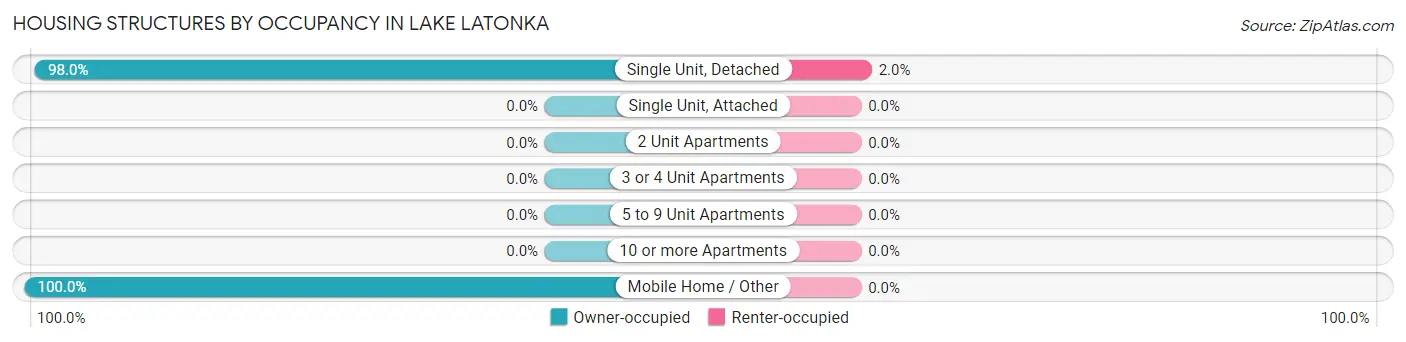
| Structure Type | Owner-occupied | Renter-occupied |
| Single Unit, Detached | 337 (98.0%) | 7 (2.0%) |
| Single Unit, Attached | 0 (0.0%) | 0 (0.0%) |
| 2 Unit Apartments | 0 (0.0%) | 0 (0.0%) |
| 3 or 4 Unit Apartments | 0 (0.0%) | 0 (0.0%) |
| 5 to 9 Unit Apartments | 0 (0.0%) | 0 (0.0%) |
| 10 or more Apartments | 0 (0.0%) | 0 (0.0%) |
| Mobile Home / Other | 2 (100.0%) | 0 (0.0%) |
| Total | 339 (98.0%) | 7 (2.0%) |
Housing Structures by Number of Rooms in Lake Latonka
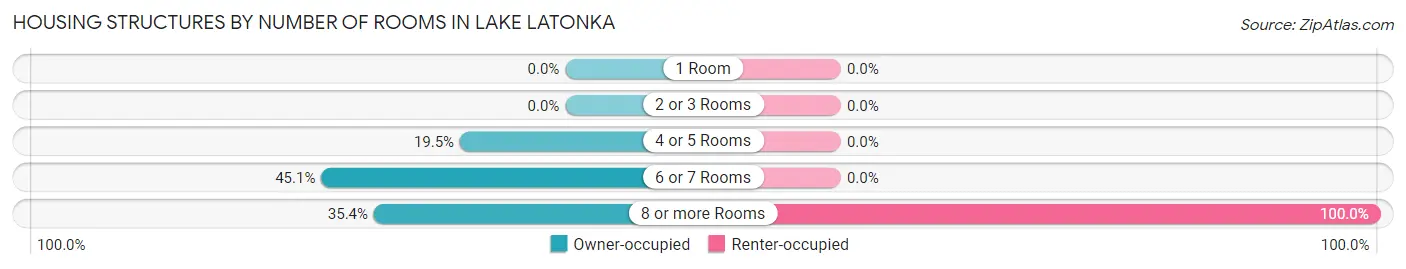
| Number of Rooms | Owner-occupied | Renter-occupied |
| 1 Room | 0 (0.0%) | 0 (0.0%) |
| 2 or 3 Rooms | 0 (0.0%) | 0 (0.0%) |
| 4 or 5 Rooms | 66 (19.5%) | 0 (0.0%) |
| 6 or 7 Rooms | 153 (45.1%) | 0 (0.0%) |
| 8 or more Rooms | 120 (35.4%) | 7 (100.0%) |
| Total | 339 (100.0%) | 7 (100.0%) |
Housing Structure by Heating Type in Lake Latonka
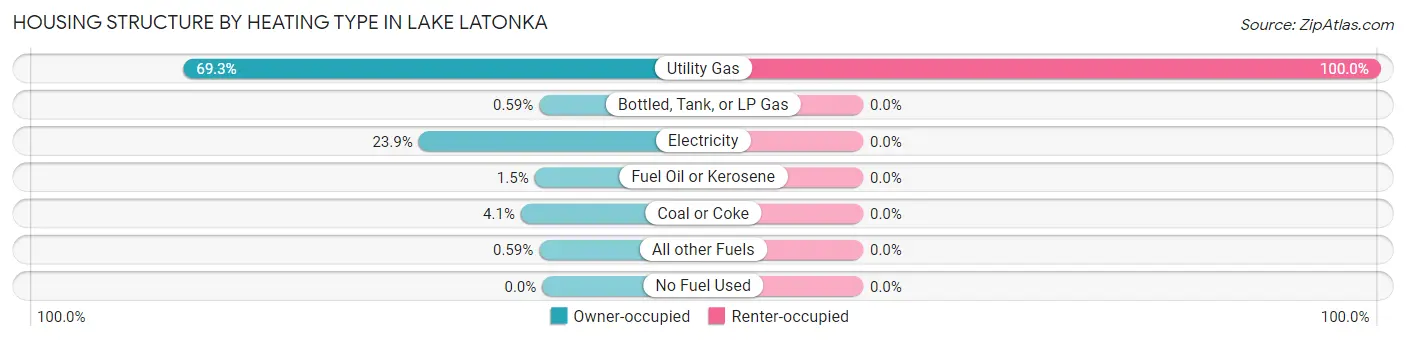
| Heating Type | Owner-occupied | Renter-occupied |
| Utility Gas | 235 (69.3%) | 7 (100.0%) |
| Bottled, Tank, or LP Gas | 2 (0.6%) | 0 (0.0%) |
| Electricity | 81 (23.9%) | 0 (0.0%) |
| Fuel Oil or Kerosene | 5 (1.5%) | 0 (0.0%) |
| Coal or Coke | 14 (4.1%) | 0 (0.0%) |
| All other Fuels | 2 (0.6%) | 0 (0.0%) |
| No Fuel Used | 0 (0.0%) | 0 (0.0%) |
| Total | 339 (100.0%) | 7 (100.0%) |
Household Vehicle Usage in Lake Latonka
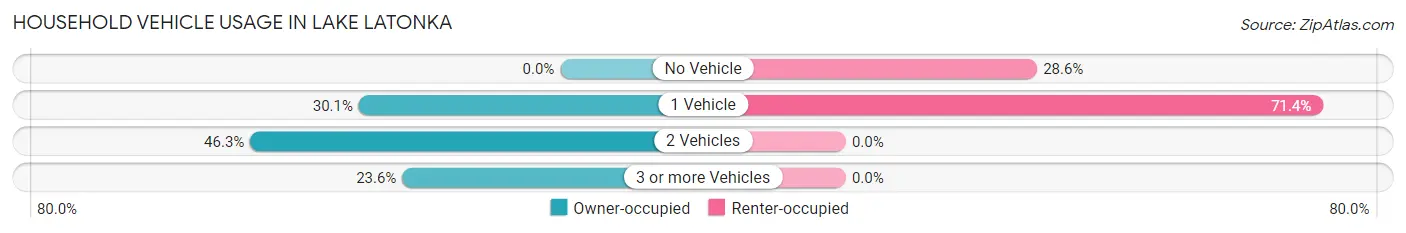
| Vehicles per Household | Owner-occupied | Renter-occupied |
| No Vehicle | 0 (0.0%) | 2 (28.6%) |
| 1 Vehicle | 102 (30.1%) | 5 (71.4%) |
| 2 Vehicles | 157 (46.3%) | 0 (0.0%) |
| 3 or more Vehicles | 80 (23.6%) | 0 (0.0%) |
| Total | 339 (100.0%) | 7 (100.0%) |
Real Estate & Mortgages in Lake Latonka
Real Estate and Mortgage Overview in Lake Latonka
| Characteristic | Without Mortgage | With Mortgage |
| Housing Units | 134 | 205 |
| Median Property Value | $437,000 | $282,400 |
| Median Household Income | $91,667 | $45 |
| Monthly Housing Costs | $586 | $31 |
| Real Estate Taxes | $3,000 | $0 |
Property Value by Mortgage Status in Lake Latonka
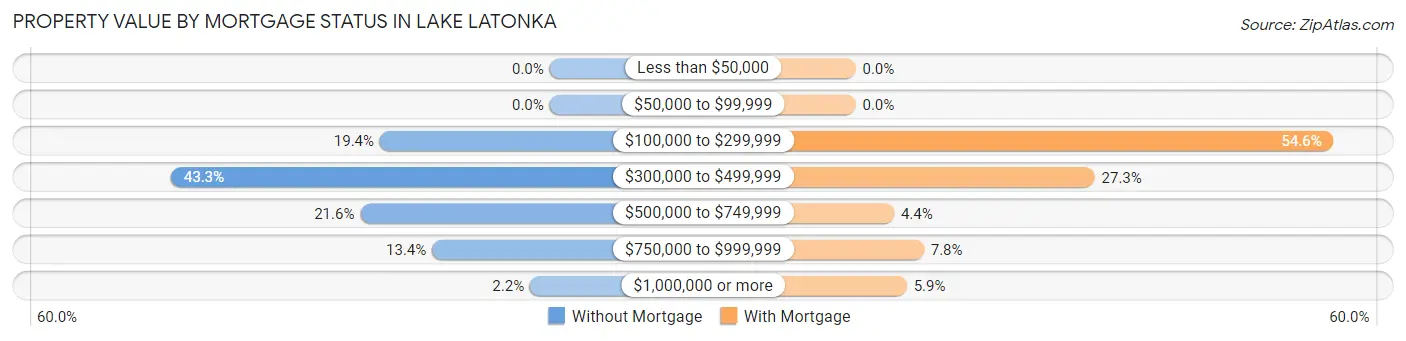
| Property Value | Without Mortgage | With Mortgage |
| Less than $50,000 | 0 (0.0%) | 0 (0.0%) |
| $50,000 to $99,999 | 0 (0.0%) | 0 (0.0%) |
| $100,000 to $299,999 | 26 (19.4%) | 112 (54.6%) |
| $300,000 to $499,999 | 58 (43.3%) | 56 (27.3%) |
| $500,000 to $749,999 | 29 (21.6%) | 9 (4.4%) |
| $750,000 to $999,999 | 18 (13.4%) | 16 (7.8%) |
| $1,000,000 or more | 3 (2.2%) | 12 (5.9%) |
| Total | 134 (100.0%) | 205 (100.0%) |
Household Income by Mortgage Status in Lake Latonka
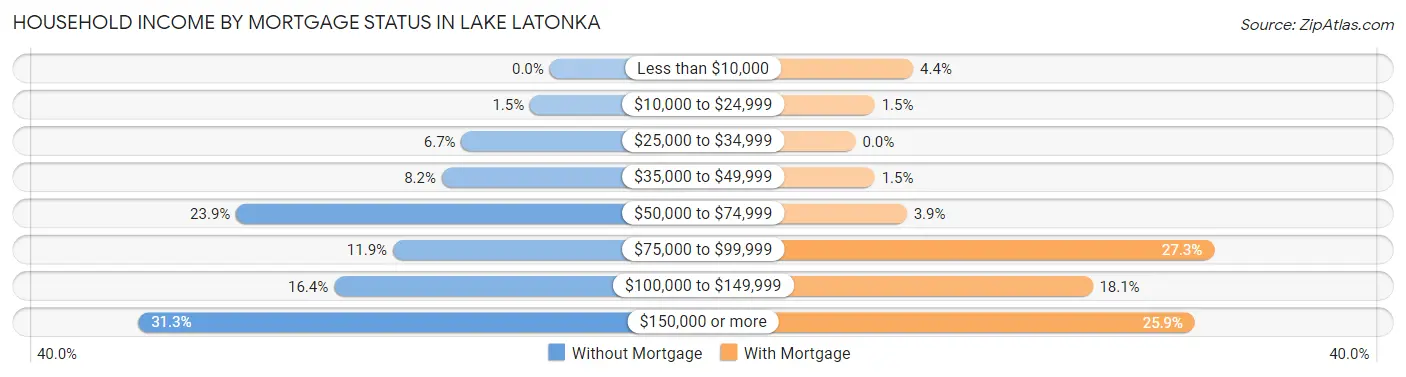
| Household Income | Without Mortgage | With Mortgage |
| Less than $10,000 | 0 (0.0%) | 9 (4.4%) |
| $10,000 to $24,999 | 2 (1.5%) | 3 (1.5%) |
| $25,000 to $34,999 | 9 (6.7%) | 0 (0.0%) |
| $35,000 to $49,999 | 11 (8.2%) | 3 (1.5%) |
| $50,000 to $74,999 | 32 (23.9%) | 8 (3.9%) |
| $75,000 to $99,999 | 16 (11.9%) | 56 (27.3%) |
| $100,000 to $149,999 | 22 (16.4%) | 37 (18.0%) |
| $150,000 or more | 42 (31.3%) | 53 (25.9%) |
| Total | 134 (100.0%) | 205 (100.0%) |
Property Value to Household Income Ratio in Lake Latonka
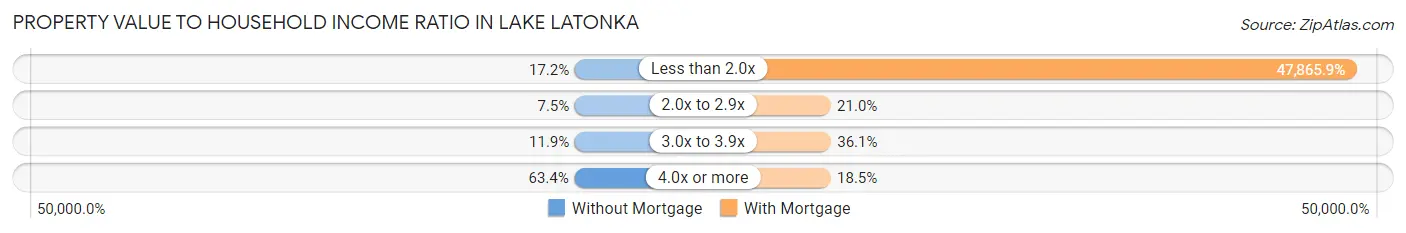
| Value-to-Income Ratio | Without Mortgage | With Mortgage |
| Less than 2.0x | 23 (17.2%) | 98,125 (47,865.9%) |
| 2.0x to 2.9x | 10 (7.5%) | 43 (21.0%) |
| 3.0x to 3.9x | 16 (11.9%) | 74 (36.1%) |
| 4.0x or more | 85 (63.4%) | 38 (18.5%) |
| Total | 134 (100.0%) | 205 (100.0%) |
Real Estate Taxes by Mortgage Status in Lake Latonka
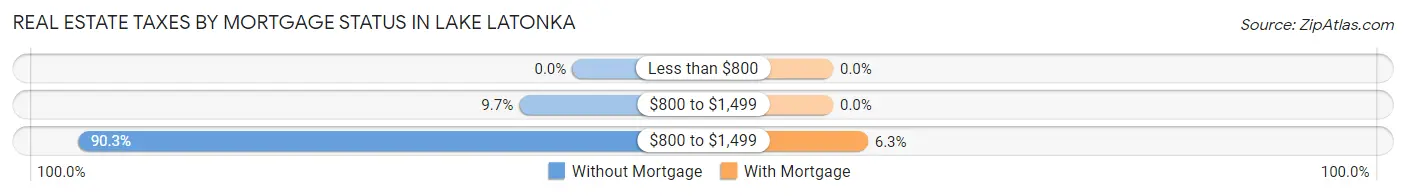
| Property Taxes | Without Mortgage | With Mortgage |
| Less than $800 | 0 (0.0%) | 0 (0.0%) |
| $800 to $1,499 | 13 (9.7%) | 0 (0.0%) |
| $800 to $1,499 | 121 (90.3%) | 13 (6.3%) |
| Total | 134 (100.0%) | 205 (100.0%) |
Health & Disability in Lake Latonka
Health Insurance Coverage by Age in Lake Latonka
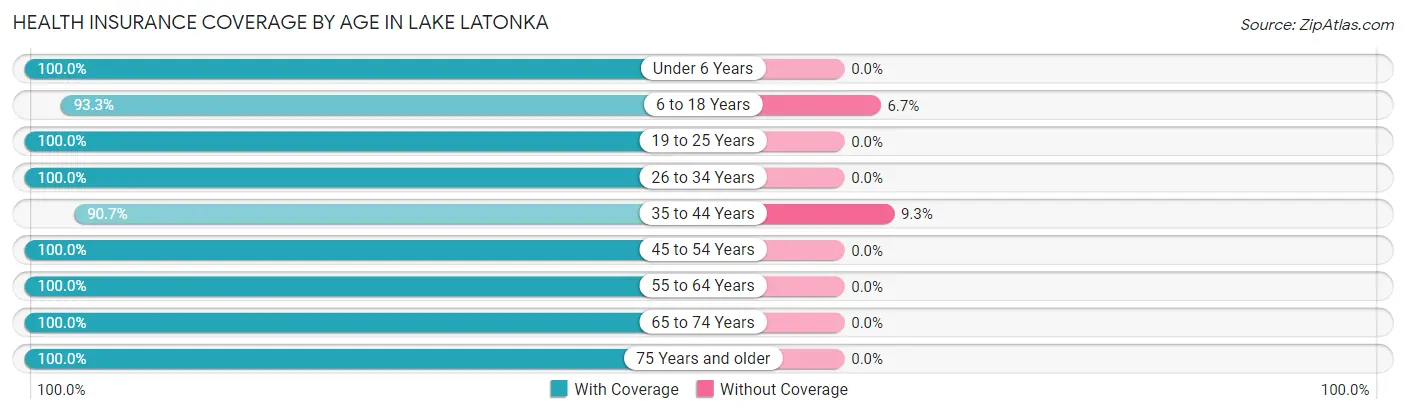
| Age Bracket | With Coverage | Without Coverage |
| Under 6 Years | 10 (100.0%) | 0 (0.0%) |
| 6 to 18 Years | 83 (93.3%) | 6 (6.7%) |
| 19 to 25 Years | 34 (100.0%) | 0 (0.0%) |
| 26 to 34 Years | 53 (100.0%) | 0 (0.0%) |
| 35 to 44 Years | 49 (90.7%) | 5 (9.3%) |
| 45 to 54 Years | 119 (100.0%) | 0 (0.0%) |
| 55 to 64 Years | 156 (100.0%) | 0 (0.0%) |
| 65 to 74 Years | 138 (100.0%) | 0 (0.0%) |
| 75 Years and older | 71 (100.0%) | 0 (0.0%) |
| Total | 713 (98.5%) | 11 (1.5%) |
Health Insurance Coverage by Citizenship Status in Lake Latonka
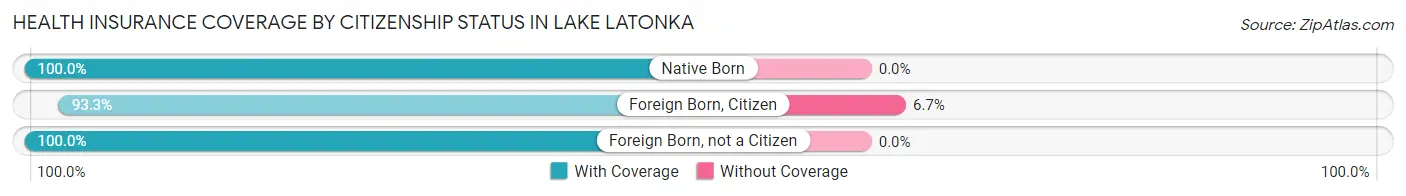
| Citizenship Status | With Coverage | Without Coverage |
| Native Born | 10 (100.0%) | 0 (0.0%) |
| Foreign Born, Citizen | 83 (93.3%) | 6 (6.7%) |
| Foreign Born, not a Citizen | 34 (100.0%) | 0 (0.0%) |
Health Insurance Coverage by Household Income in Lake Latonka
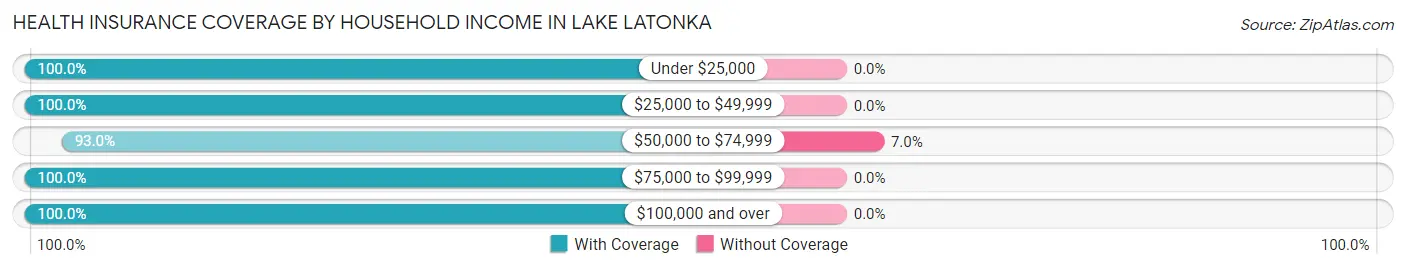
| Household Income | With Coverage | Without Coverage |
| Under $25,000 | 12 (100.0%) | 0 (0.0%) |
| $25,000 to $49,999 | 51 (100.0%) | 0 (0.0%) |
| $50,000 to $74,999 | 147 (93.0%) | 11 (7.0%) |
| $75,000 to $99,999 | 120 (100.0%) | 0 (0.0%) |
| $100,000 and over | 383 (100.0%) | 0 (0.0%) |
Public vs Private Health Insurance Coverage by Age in Lake Latonka
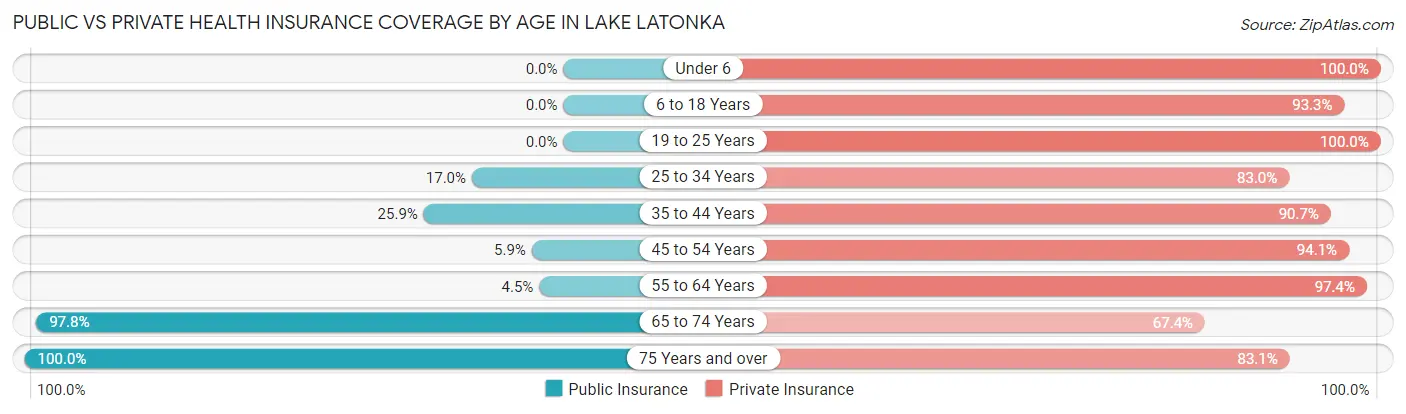
| Age Bracket | Public Insurance | Private Insurance |
| Under 6 | 0 (0.0%) | 10 (100.0%) |
| 6 to 18 Years | 0 (0.0%) | 83 (93.3%) |
| 19 to 25 Years | 0 (0.0%) | 34 (100.0%) |
| 25 to 34 Years | 9 (17.0%) | 44 (83.0%) |
| 35 to 44 Years | 14 (25.9%) | 49 (90.7%) |
| 45 to 54 Years | 7 (5.9%) | 112 (94.1%) |
| 55 to 64 Years | 7 (4.5%) | 152 (97.4%) |
| 65 to 74 Years | 135 (97.8%) | 93 (67.4%) |
| 75 Years and over | 71 (100.0%) | 59 (83.1%) |
| Total | 243 (33.6%) | 636 (87.8%) |
Disability Status by Sex by Age in Lake Latonka
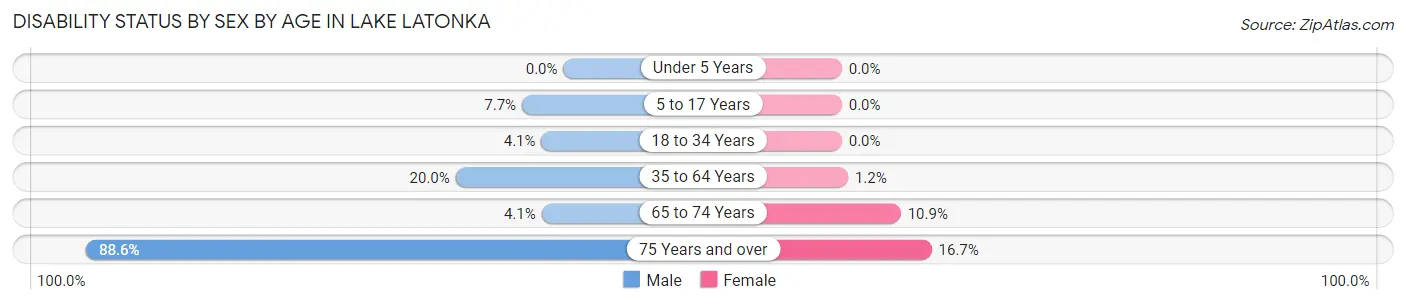
| Age Bracket | Male | Female |
| Under 5 Years | 0 (0.0%) | 0 (0.0%) |
| 5 to 17 Years | 3 (7.7%) | 0 (0.0%) |
| 18 to 34 Years | 2 (4.1%) | 0 (0.0%) |
| 35 to 64 Years | 31 (20.0%) | 2 (1.1%) |
| 65 to 74 Years | 3 (4.1%) | 7 (10.9%) |
| 75 Years and over | 31 (88.6%) | 6 (16.7%) |
Disability Class by Sex by Age in Lake Latonka
Disability Class: Hearing Difficulty
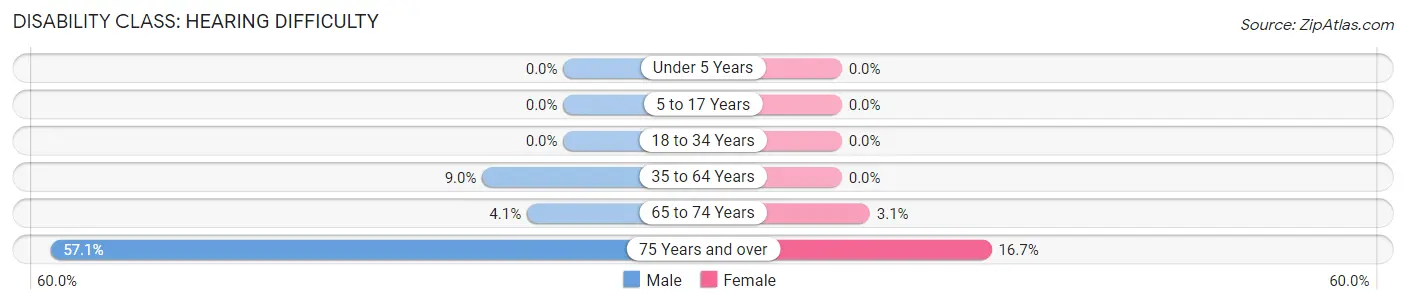
| Age Bracket | Male | Female |
| Under 5 Years | 0 (0.0%) | 0 (0.0%) |
| 5 to 17 Years | 0 (0.0%) | 0 (0.0%) |
| 18 to 34 Years | 0 (0.0%) | 0 (0.0%) |
| 35 to 64 Years | 14 (9.0%) | 0 (0.0%) |
| 65 to 74 Years | 3 (4.1%) | 2 (3.1%) |
| 75 Years and over | 20 (57.1%) | 6 (16.7%) |
Disability Class: Vision Difficulty
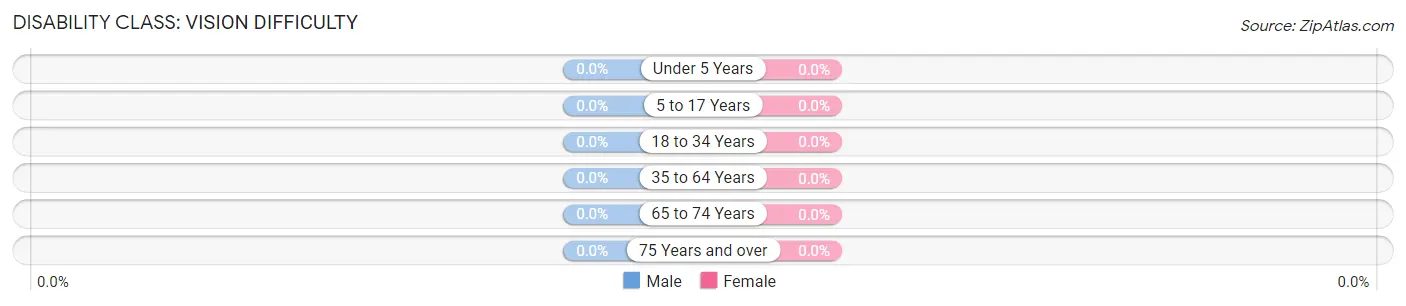
| Age Bracket | Male | Female |
| Under 5 Years | 0 (0.0%) | 0 (0.0%) |
| 5 to 17 Years | 0 (0.0%) | 0 (0.0%) |
| 18 to 34 Years | 0 (0.0%) | 0 (0.0%) |
| 35 to 64 Years | 0 (0.0%) | 0 (0.0%) |
| 65 to 74 Years | 0 (0.0%) | 0 (0.0%) |
| 75 Years and over | 0 (0.0%) | 0 (0.0%) |
Disability Class: Cognitive Difficulty
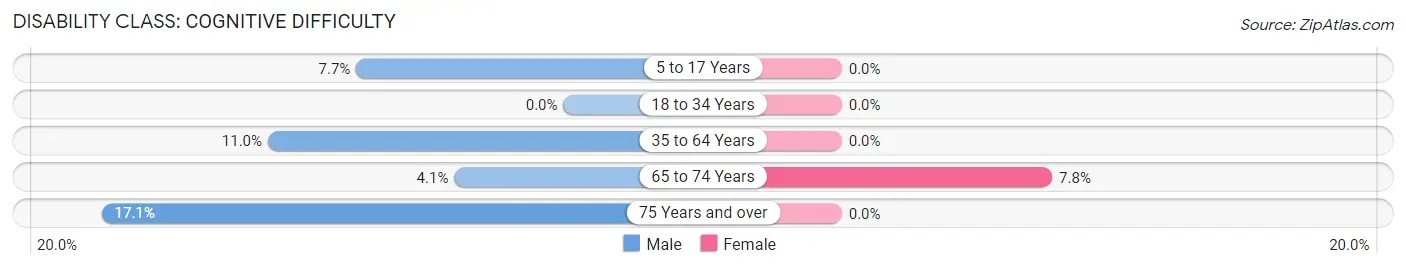
| Age Bracket | Male | Female |
| 5 to 17 Years | 3 (7.7%) | 0 (0.0%) |
| 18 to 34 Years | 0 (0.0%) | 0 (0.0%) |
| 35 to 64 Years | 17 (11.0%) | 0 (0.0%) |
| 65 to 74 Years | 3 (4.1%) | 5 (7.8%) |
| 75 Years and over | 6 (17.1%) | 0 (0.0%) |
Disability Class: Ambulatory Difficulty
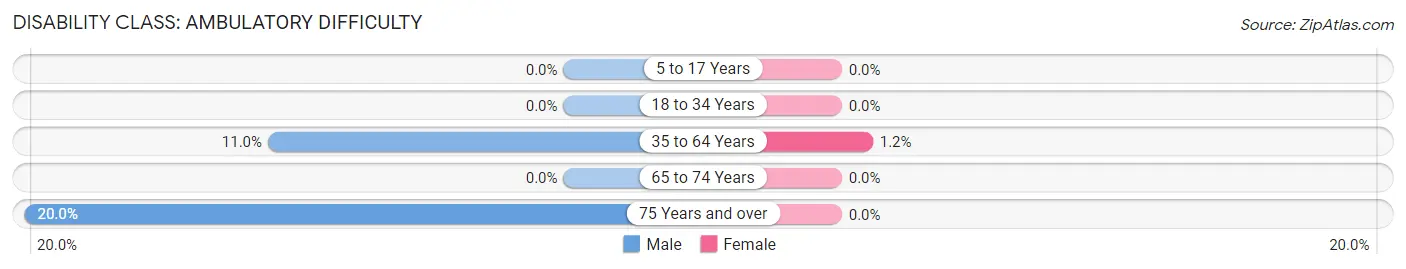
| Age Bracket | Male | Female |
| 5 to 17 Years | 0 (0.0%) | 0 (0.0%) |
| 18 to 34 Years | 0 (0.0%) | 0 (0.0%) |
| 35 to 64 Years | 17 (11.0%) | 2 (1.1%) |
| 65 to 74 Years | 0 (0.0%) | 0 (0.0%) |
| 75 Years and over | 7 (20.0%) | 0 (0.0%) |
Disability Class: Self-Care Difficulty
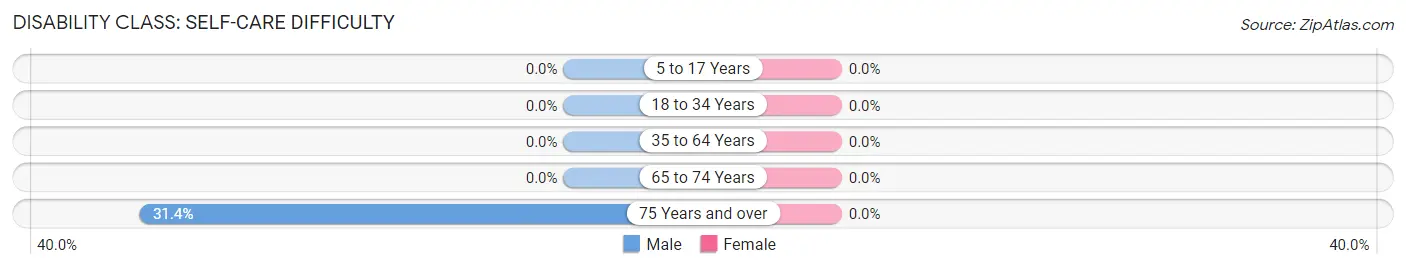
| Age Bracket | Male | Female |
| 5 to 17 Years | 0 (0.0%) | 0 (0.0%) |
| 18 to 34 Years | 0 (0.0%) | 0 (0.0%) |
| 35 to 64 Years | 0 (0.0%) | 0 (0.0%) |
| 65 to 74 Years | 0 (0.0%) | 0 (0.0%) |
| 75 Years and over | 11 (31.4%) | 0 (0.0%) |
Technology Access in Lake Latonka
Computing Device Access in Lake Latonka
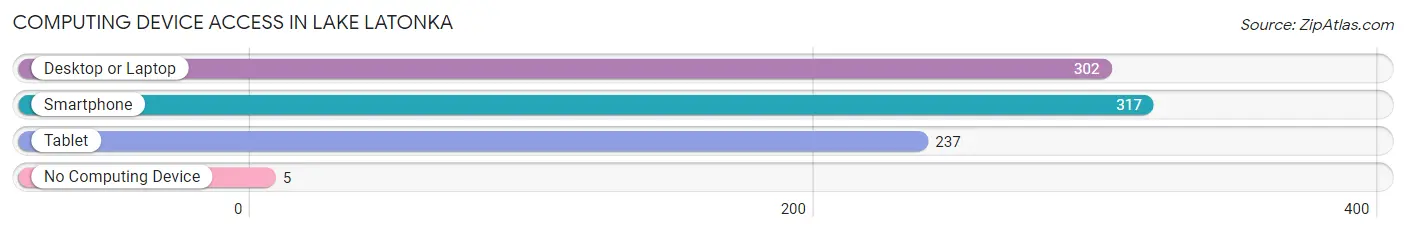
| Device Type | # Households | % Households |
| Desktop or Laptop | 302 | 87.3% |
| Smartphone | 317 | 91.6% |
| Tablet | 237 | 68.5% |
| No Computing Device | 5 | 1.5% |
| Total | 346 | 100.0% |
Internet Access in Lake Latonka
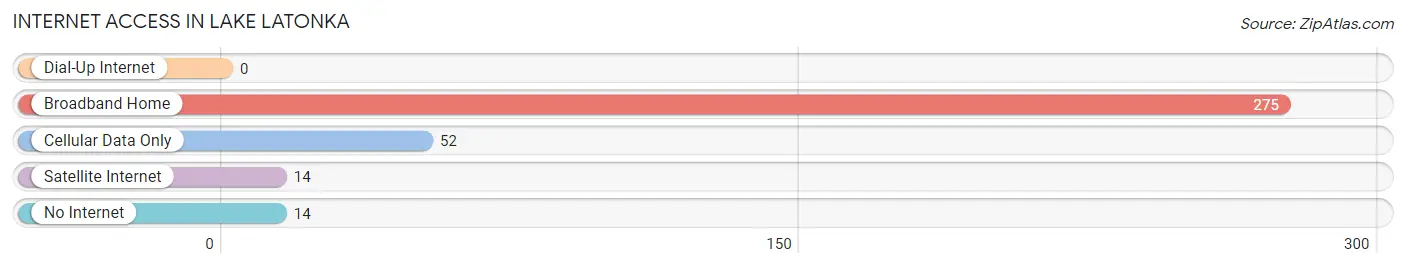
| Internet Type | # Households | % Households |
| Dial-Up Internet | 0 | 0.0% |
| Broadband Home | 275 | 79.5% |
| Cellular Data Only | 52 | 15.0% |
| Satellite Internet | 14 | 4.1% |
| No Internet | 14 | 4.1% |
| Total | 346 | 100.0% |
Lake Latonka Summary
Lake Latonka is a small borough located in Mercer County, Pennsylvania. It is situated in the northwest corner of the county, approximately 20 miles from the city of Pittsburgh. The borough is bordered by the Shenango River to the north and the Shenango Valley to the south. The population of Lake Latonka was 1,845 at the 2010 census.
History
The area that is now Lake Latonka was originally inhabited by the Seneca Indians. The first settlers arrived in the area in the late 1700s and early 1800s. The first settler was a man named John Latonka, who arrived in 1802. He built a log cabin on the banks of the Shenango River and named the area Latonka.
In 1820, the first post office was established in the area. The post office was named Latonka, after John Latonka. In 1845, the first school was built in the area. The school was named Latonka Academy.
In 1872, the borough of Lake Latonka was officially incorporated. The borough was named after the lake that was located in the center of the borough. The lake was named after John Latonka.
Geography
Lake Latonka is located at 41°14'N 80°25'W (41.2333, -80.4167). According to the United States Census Bureau, the borough has a total area of 1.2 square miles (3.1 km2), all of it land.
The borough is located in the northwest corner of Mercer County. It is bordered by the Shenango River to the north and the Shenango Valley to the south. The borough is located approximately 20 miles from the city of Pittsburgh.
Economy
The economy of Lake Latonka is largely based on agriculture and tourism. The borough is home to several farms, which produce a variety of crops, including corn, soybeans, wheat, and hay. The borough is also home to several wineries, which produce a variety of wines.
The borough is also home to several tourist attractions, including the Lake Latonka Historical Society Museum, the Lake Latonka Nature Center, and the Lake Latonka Marina. The borough also hosts several annual events, including the Lake Latonka Arts and Crafts Festival and the Lake Latonka Music Festival.
Demographics
As of the 2010 census, there were 1,845 people, 745 households, and 486 families residing in the borough. The population density was 1,541.7 people per square mile (595.2/km2). There were 817 housing units at an average density of 677.5 per square mile (262.2/km2). The racial makeup of the borough was 97.2% White, 0.7% African American, 0.2% Native American, 0.4% Asian, 0.1% Pacific Islander, 0.4% from other races, and 1.0% from two or more races. Hispanic or Latino of any race were 1.2% of the population.
There were 745 households, out of which 28.2% had children under the age of 18 living with them, 46.2% were married couples living together, 13.2% had a female householder with no husband present, and 35.2% were non-families. 30.2% of all households were made up of individuals, and 14.2% had someone living alone who was 65 years of age or older. The average household size was 2.45 and the average family size was 3.03.
In the borough, the population was spread out, with 24.2% under the age of 18, 7.2% from 18 to 24, 28.2% from 25 to 44, 22.7% from 45 to 64, and 17.7% who were 65 years of age or older. The median age was 38 years. For every 100 females, there were 91.2 males. For every 100 females age 18 and over, there were 87.2 males.
The median income for a household in the borough was $33,750, and the median income for a family was $41,250. Males had a median income of $31,250 versus $22,500 for females. The per capita income for the borough was $17,845. About 8.2% of families and 10.2% of the population were below the poverty line, including 14.2% of those under age 18 and 8.2% of those age 65 or over.
Common Questions
What is Per Capita Income in Lake Latonka?
Per Capita income in Lake Latonka is $58,769.
What is the Median Family Income in Lake Latonka?
Median Family Income in Lake Latonka is $116,250.
What is the Median Household income in Lake Latonka?
Median Household Income in Lake Latonka is $91,667.
What is Income or Wage Gap in Lake Latonka?
Income or Wage Gap in Lake Latonka is 32.6%.
Women in Lake Latonka earn 67.4 cents for every dollar earned by a man.
What is Inequality or Gini Index in Lake Latonka?
Inequality or Gini Index in Lake Latonka is 0.35.
What is the Total Population of Lake Latonka?
Total Population of Lake Latonka is 724.
What is the Total Male Population of Lake Latonka?
Total Male Population of Lake Latonka is 355.
What is the Total Female Population of Lake Latonka?
Total Female Population of Lake Latonka is 369.
What is the Ratio of Males per 100 Females in Lake Latonka?
There are 96.21 Males per 100 Females in Lake Latonka.
What is the Ratio of Females per 100 Males in Lake Latonka?
There are 103.94 Females per 100 Males in Lake Latonka.
What is the Median Population Age in Lake Latonka?
Median Population Age in Lake Latonka is 55.5 Years.
What is the Average Family Size in Lake Latonka
Average Family Size in Lake Latonka is 2.5 People.
What is the Average Household Size in Lake Latonka
Average Household Size in Lake Latonka is 2.1 People.
How Large is the Labor Force in Lake Latonka?
There are 350 People in the Labor Forcein in Lake Latonka.
What is the Percentage of People in the Labor Force in Lake Latonka?
54.4% of People are in the Labor Force in Lake Latonka.