Old Orchard, PA Map & Demographics
Old Orchard Map
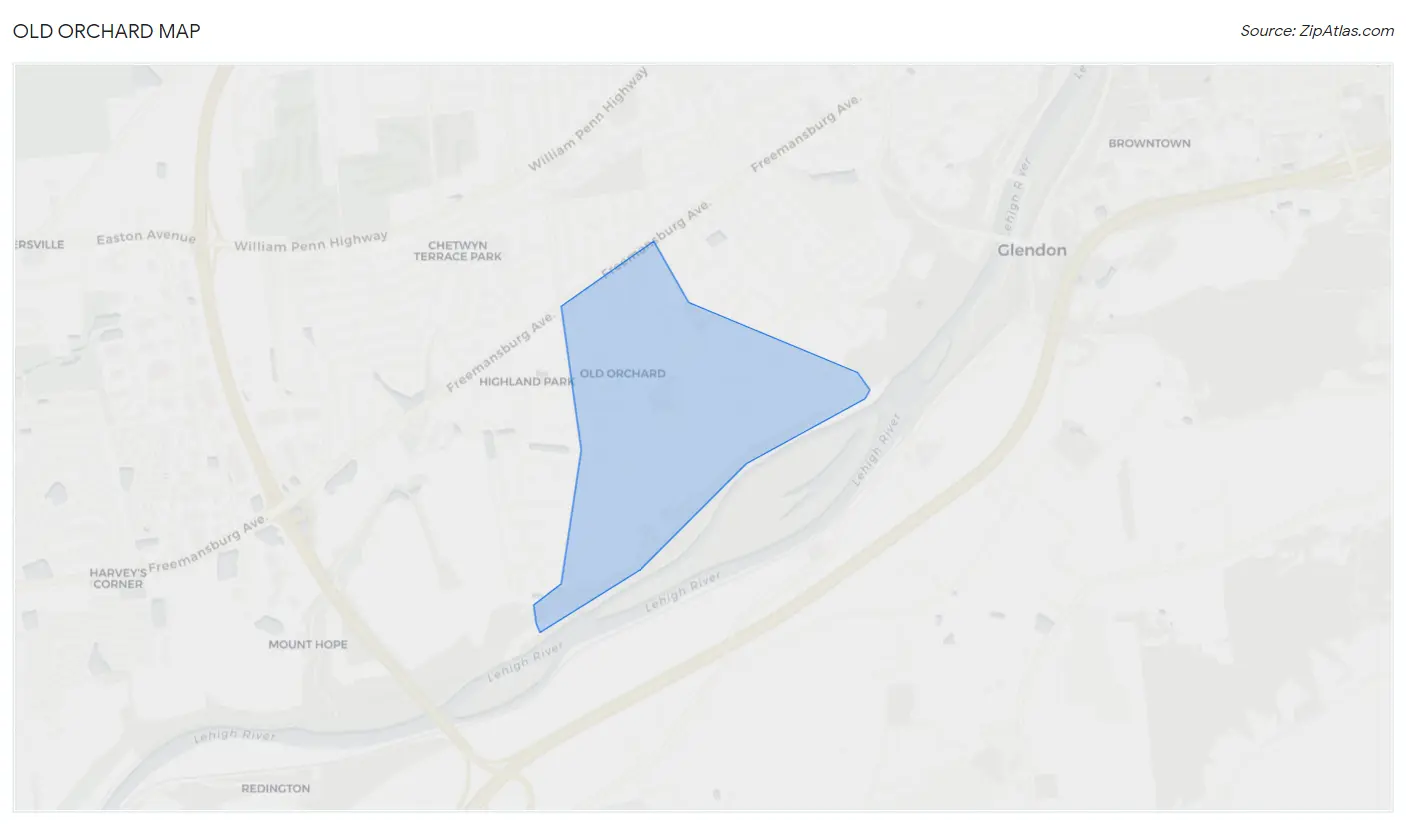
Old Orchard Overview
$56,023
PER CAPITA INCOME
$125,272
AVG FAMILY INCOME
$106,172
AVG HOUSEHOLD INCOME
13.2%
WAGE / INCOME GAP [ % ]
86.8¢/ $1
WAGE / INCOME GAP [ $ ]
0.40
INEQUALITY / GINI INDEX
1,826
TOTAL POPULATION
1,005
MALE POPULATION
821
FEMALE POPULATION
122.41
MALES / 100 FEMALES
81.69
FEMALES / 100 MALES
53.3
MEDIAN AGE
2.9
AVG FAMILY SIZE
2.4
AVG HOUSEHOLD SIZE
854
LABOR FORCE [ PEOPLE ]
58.4%
PERCENT IN LABOR FORCE
4.1%
UNEMPLOYMENT RATE
Income in Old Orchard
Income Overview in Old Orchard
Per Capita Income in Old Orchard is $56,023, while median incomes of families and households are $125,272 and $106,172 respectively.
| Characteristic | Number | Measure |
| Per Capita Income | 1,826 | $56,023 |
| Median Family Income | 541 | $125,272 |
| Mean Family Income | 541 | $152,402 |
| Median Household Income | 761 | $106,172 |
| Mean Household Income | 761 | $132,219 |
| Income Deficit | 541 | $0 |
| Wage / Income Gap (%) | 1,826 | 13.17% |
| Wage / Income Gap ($) | 1,826 | 86.83¢ per $1 |
| Gini / Inequality Index | 1,826 | 0.40 |
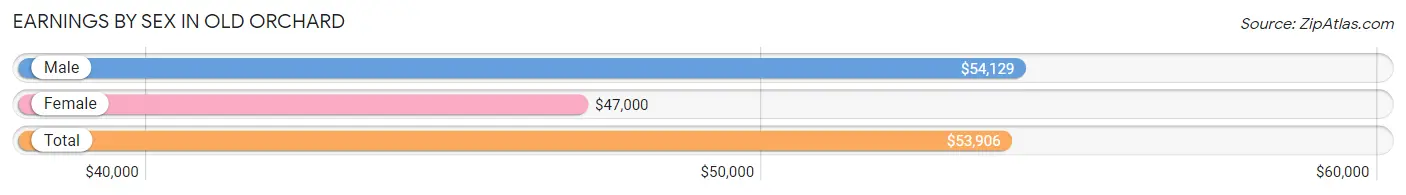
Earnings by Sex in Old Orchard
Average Earnings in Old Orchard are $53,906, $54,129 for men and $47,000 for women, a difference of 13.2%.
| Sex | Number | Average Earnings |
| Male | 503 (53.1%) | $54,129 |
| Female | 444 (46.9%) | $47,000 |
| Total | 947 (100.0%) | $53,906 |
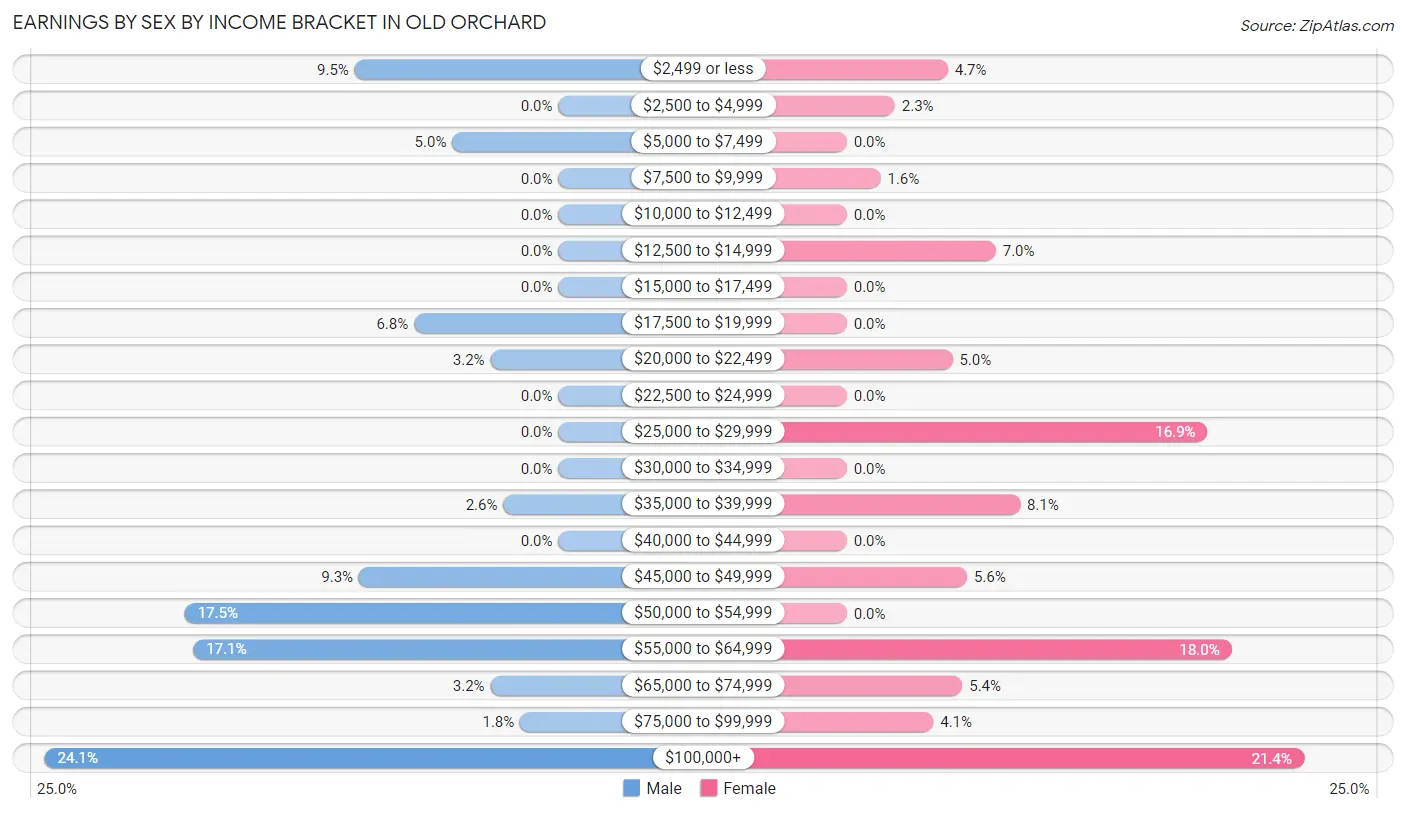
Earnings by Sex by Income Bracket in Old Orchard
The most common earnings brackets in Old Orchard are $100,000+ for men (121 | 24.1%) and $100,000+ for women (95 | 21.4%).
| Income | Male | Female |
| $2,499 or less | 48 (9.5%) | 21 (4.7%) |
| $2,500 to $4,999 | 0 (0.0%) | 10 (2.2%) |
| $5,000 to $7,499 | 25 (5.0%) | 0 (0.0%) |
| $7,500 to $9,999 | 0 (0.0%) | 7 (1.6%) |
| $10,000 to $12,499 | 0 (0.0%) | 0 (0.0%) |
| $12,500 to $14,999 | 0 (0.0%) | 31 (7.0%) |
| $15,000 to $17,499 | 0 (0.0%) | 0 (0.0%) |
| $17,500 to $19,999 | 34 (6.8%) | 0 (0.0%) |
| $20,000 to $22,499 | 16 (3.2%) | 22 (5.0%) |
| $22,500 to $24,999 | 0 (0.0%) | 0 (0.0%) |
| $25,000 to $29,999 | 0 (0.0%) | 75 (16.9%) |
| $30,000 to $34,999 | 0 (0.0%) | 0 (0.0%) |
| $35,000 to $39,999 | 13 (2.6%) | 36 (8.1%) |
| $40,000 to $44,999 | 0 (0.0%) | 0 (0.0%) |
| $45,000 to $49,999 | 47 (9.3%) | 25 (5.6%) |
| $50,000 to $54,999 | 88 (17.5%) | 0 (0.0%) |
| $55,000 to $64,999 | 86 (17.1%) | 80 (18.0%) |
| $65,000 to $74,999 | 16 (3.2%) | 24 (5.4%) |
| $75,000 to $99,999 | 9 (1.8%) | 18 (4.1%) |
| $100,000+ | 121 (24.1%) | 95 (21.4%) |
| Total | 503 (100.0%) | 444 (100.0%) |
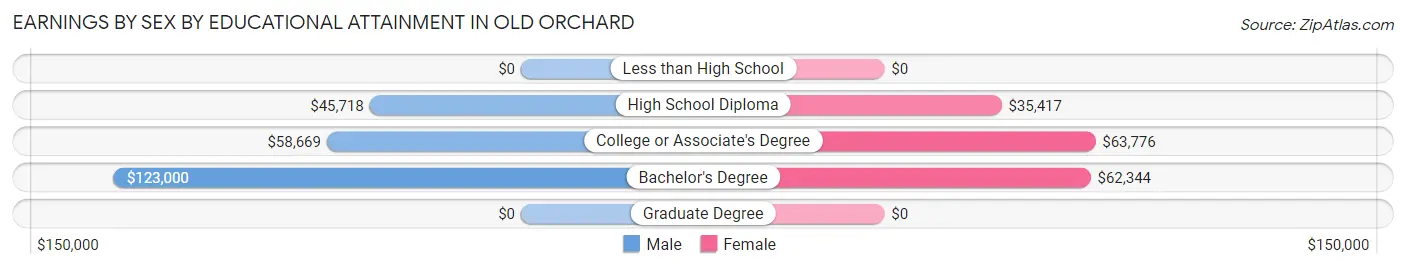
Earnings by Sex by Educational Attainment in Old Orchard
Average earnings in Old Orchard are $54,129 for men and $46,050 for women, a difference of 14.9%. Men with an educational attainment of bachelor's degree enjoy the highest average annual earnings of $123,000, while those with high school diploma education earn the least with $45,718. Women with an educational attainment of college or associate's degree earn the most with the average annual earnings of $63,776, while those with high school diploma education have the smallest earnings of $35,417.
| Educational Attainment | Male Income | Female Income |
| Less than High School | - | - |
| High School Diploma | $45,718 | $35,417 |
| College or Associate's Degree | $58,669 | $63,776 |
| Bachelor's Degree | $123,000 | $62,344 |
| Graduate Degree | - | - |
| Total | $54,129 | $46,050 |
Family Income in Old Orchard
Family Income Brackets in Old Orchard
According to the Old Orchard family income data, there are 134 families falling into the $150,000 to $199,999 income range, which is the most common income bracket and makes up 24.8% of all families.
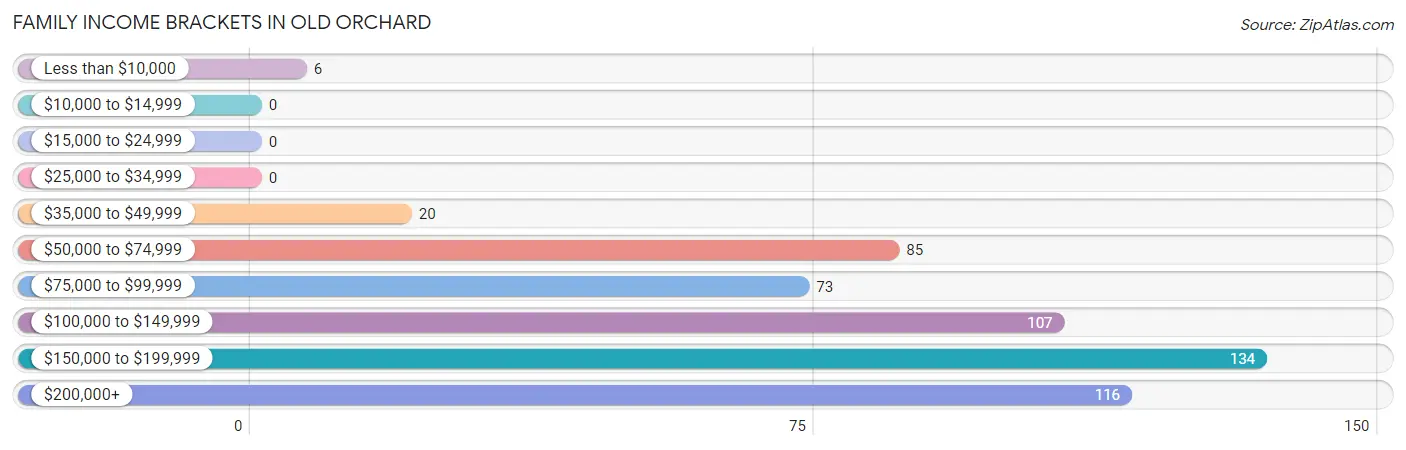
| Income Bracket | # Families | % Families |
| Less than $10,000 | 6 | 1.1% |
| $10,000 to $14,999 | 0 | 0.0% |
| $15,000 to $24,999 | 0 | 0.0% |
| $25,000 to $34,999 | 0 | 0.0% |
| $35,000 to $49,999 | 20 | 3.7% |
| $50,000 to $74,999 | 85 | 15.7% |
| $75,000 to $99,999 | 73 | 13.5% |
| $100,000 to $149,999 | 107 | 19.8% |
| $150,000 to $199,999 | 134 | 24.8% |
| $200,000+ | 116 | 21.4% |
Family Income by Famaliy Size in Old Orchard
4-person families (74 | 13.7%) account for the highest median family income in Old Orchard with $221,250 per family, while 4-person families (74 | 13.7%) have the highest median income of $55,312 per family member.
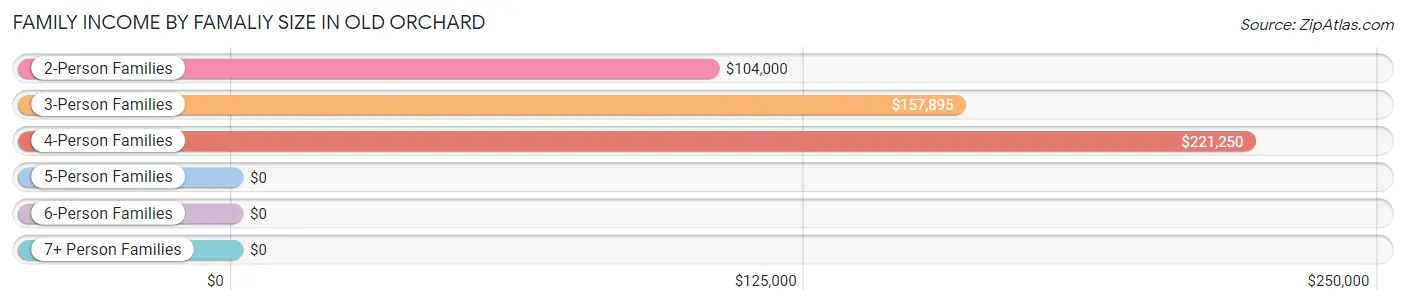
| Income Bracket | # Families | Median Income |
| 2-Person Families | 302 (55.8%) | $104,000 |
| 3-Person Families | 124 (22.9%) | $157,895 |
| 4-Person Families | 74 (13.7%) | $221,250 |
| 5-Person Families | 28 (5.2%) | $0 |
| 6-Person Families | 13 (2.4%) | $0 |
| 7+ Person Families | 0 (0.0%) | $0 |
| Total | 541 (100.0%) | $125,272 |
Family Income by Number of Earners in Old Orchard
The median family income in Old Orchard is $125,272, with families comprising 3+ earners (60) having the highest median family income of $190,556, while families with no earners (66) have the lowest median family income of $51,167, accounting for 11.1% and 12.2% of families, respectively.
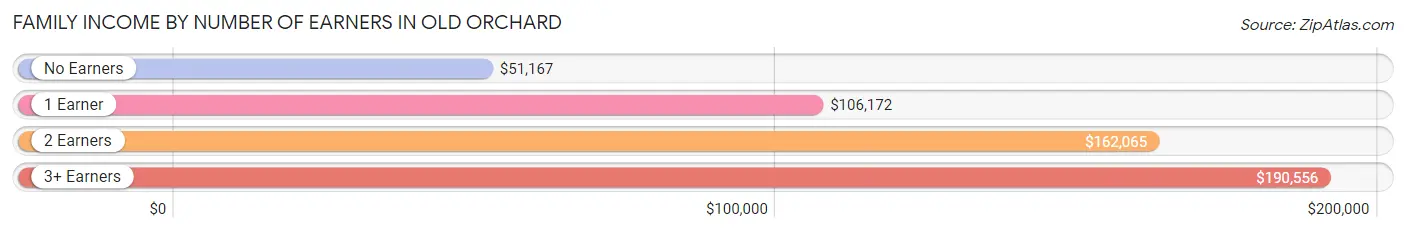
| Number of Earners | # Families | Median Income |
| No Earners | 66 (12.2%) | $51,167 |
| 1 Earner | 227 (42.0%) | $106,172 |
| 2 Earners | 188 (34.7%) | $162,065 |
| 3+ Earners | 60 (11.1%) | $190,556 |
| Total | 541 (100.0%) | $125,272 |
Household Income in Old Orchard
Household Income Brackets in Old Orchard
With 155 households falling in the category, the $50,000 to $74,999 income range is the most frequent in Old Orchard, accounting for 20.4% of all households.
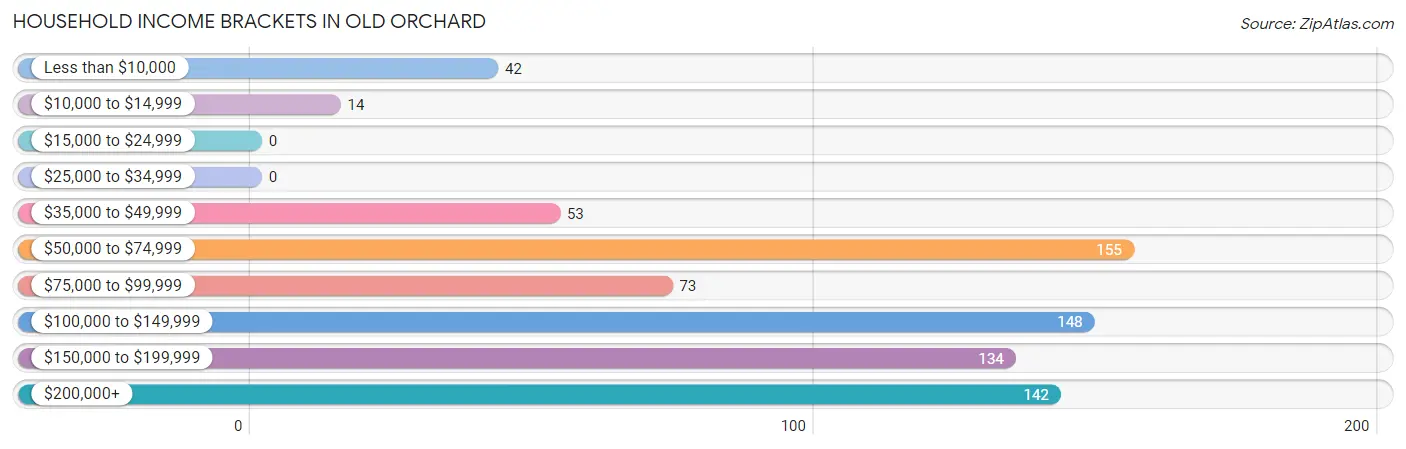
| Income Bracket | # Households | % Households |
| Less than $10,000 | 42 | 5.5% |
| $10,000 to $14,999 | 14 | 1.8% |
| $15,000 to $24,999 | 0 | 0.0% |
| $25,000 to $34,999 | 0 | 0.0% |
| $35,000 to $49,999 | 53 | 7.0% |
| $50,000 to $74,999 | 155 | 20.4% |
| $75,000 to $99,999 | 73 | 9.6% |
| $100,000 to $149,999 | 148 | 19.4% |
| $150,000 to $199,999 | 134 | 17.6% |
| $200,000+ | 142 | 18.7% |
Household Income by Householder Age in Old Orchard
The median household income in Old Orchard is $106,172, with the highest median household income of $155,625 found in the 45 to 64 years age bracket for the primary householder. A total of 203 households (26.7%) fall into this category. Meanwhile, the 15 to 24 years age bracket for the primary householder has the lowest median household income of $0, with 40 households (5.3%) in this group.
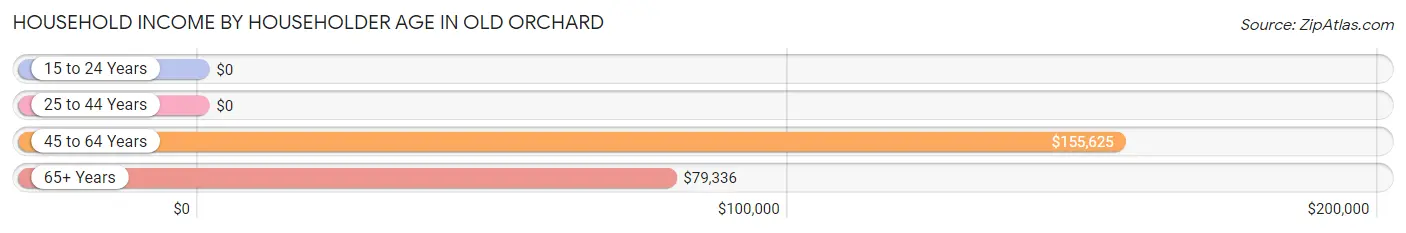
| Income Bracket | # Households | Median Income |
| 15 to 24 Years | 40 (5.3%) | $0 |
| 25 to 44 Years | 155 (20.4%) | $0 |
| 45 to 64 Years | 203 (26.7%) | $155,625 |
| 65+ Years | 363 (47.7%) | $79,336 |
| Total | 761 (100.0%) | $106,172 |
Poverty in Old Orchard
Income Below Poverty by Sex and Age in Old Orchard
With 3.6% poverty level for males and 3.4% for females among the residents of Old Orchard, 65 to 74 year old males and 75 year old and over females are the most vulnerable to poverty, with 36 males (19.5%) and 22 females (23.9%) in their respective age groups living below the poverty level.
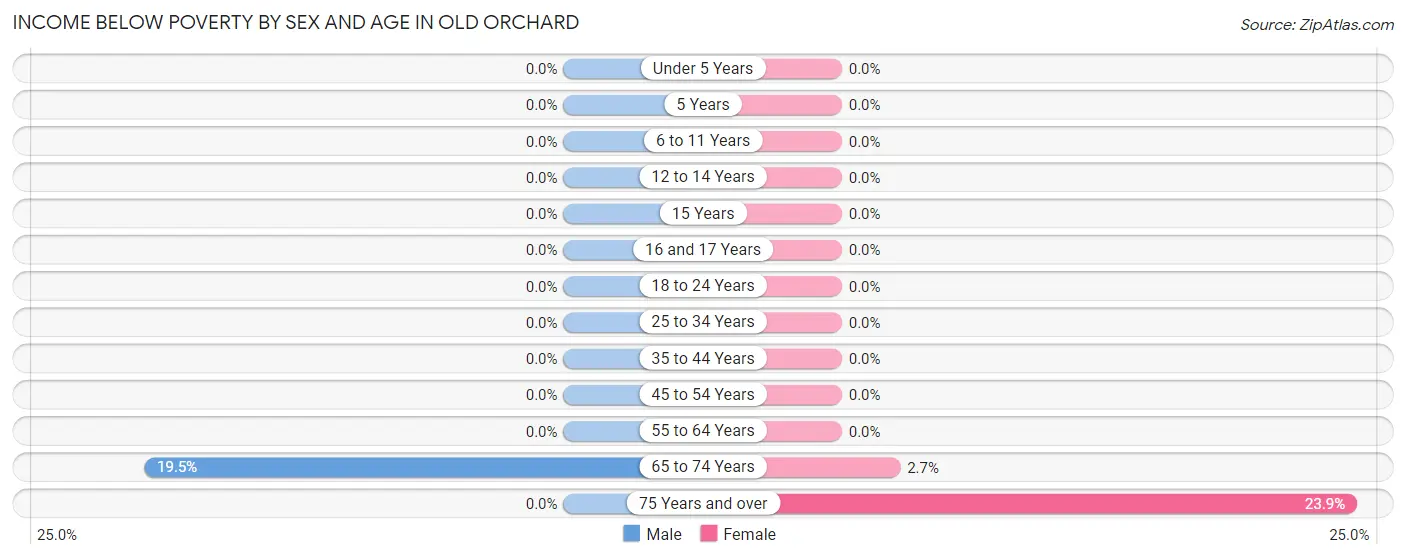
| Age Bracket | Male | Female |
| Under 5 Years | 0 (0.0%) | 0 (0.0%) |
| 5 Years | 0 (0.0%) | 0 (0.0%) |
| 6 to 11 Years | 0 (0.0%) | 0 (0.0%) |
| 12 to 14 Years | 0 (0.0%) | 0 (0.0%) |
| 15 Years | 0 (0.0%) | 0 (0.0%) |
| 16 and 17 Years | 0 (0.0%) | 0 (0.0%) |
| 18 to 24 Years | 0 (0.0%) | 0 (0.0%) |
| 25 to 34 Years | 0 (0.0%) | 0 (0.0%) |
| 35 to 44 Years | 0 (0.0%) | 0 (0.0%) |
| 45 to 54 Years | 0 (0.0%) | 0 (0.0%) |
| 55 to 64 Years | 0 (0.0%) | 0 (0.0%) |
| 65 to 74 Years | 36 (19.5%) | 6 (2.7%) |
| 75 Years and over | 0 (0.0%) | 22 (23.9%) |
| Total | 36 (3.6%) | 28 (3.4%) |
Income Above Poverty by Sex and Age in Old Orchard
According to the poverty statistics in Old Orchard, males aged under 5 years and females aged 6 to 11 years are the age groups that are most secure financially, with 100.0% of males and 100.0% of females in these age groups living above the poverty line.
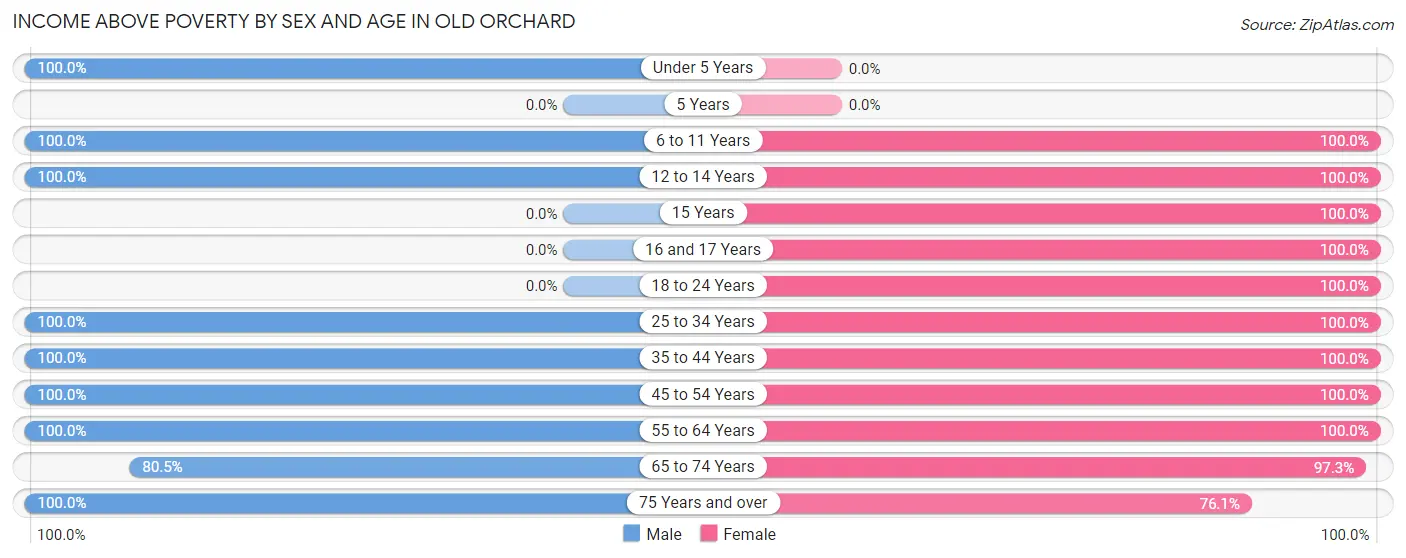
| Age Bracket | Male | Female |
| Under 5 Years | 203 (100.0%) | 0 (0.0%) |
| 5 Years | 0 (0.0%) | 0 (0.0%) |
| 6 to 11 Years | 25 (100.0%) | 38 (100.0%) |
| 12 to 14 Years | 43 (100.0%) | 37 (100.0%) |
| 15 Years | 0 (0.0%) | 18 (100.0%) |
| 16 and 17 Years | 0 (0.0%) | 9 (100.0%) |
| 18 to 24 Years | 0 (0.0%) | 61 (100.0%) |
| 25 to 34 Years | 38 (100.0%) | 29 (100.0%) |
| 35 to 44 Years | 140 (100.0%) | 134 (100.0%) |
| 45 to 54 Years | 81 (100.0%) | 95 (100.0%) |
| 55 to 64 Years | 172 (100.0%) | 87 (100.0%) |
| 65 to 74 Years | 149 (80.5%) | 215 (97.3%) |
| 75 Years and over | 118 (100.0%) | 70 (76.1%) |
| Total | 969 (96.4%) | 793 (96.6%) |
Income Below Poverty Among Married-Couple Families in Old Orchard
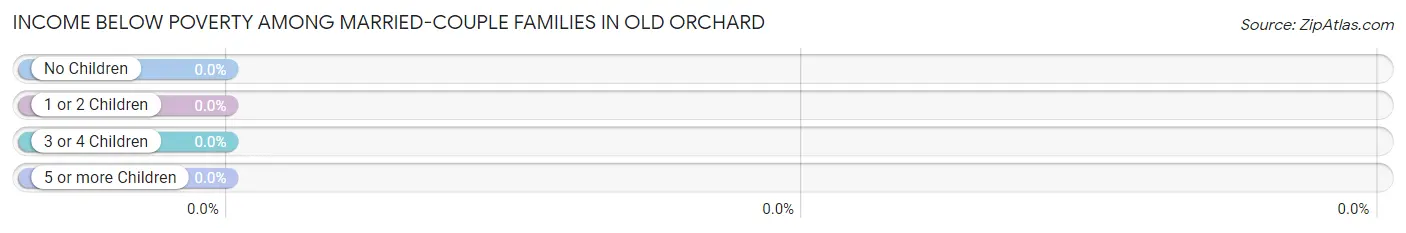
| Children | Above Poverty | Below Poverty |
| No Children | 326 (100.0%) | 0 (0.0%) |
| 1 or 2 Children | 134 (100.0%) | 0 (0.0%) |
| 3 or 4 Children | 0 (0.0%) | 0 (0.0%) |
| 5 or more Children | 0 (0.0%) | 0 (0.0%) |
| Total | 460 (100.0%) | 0 (0.0%) |
Income Below Poverty Among Single-Parent Households in Old Orchard
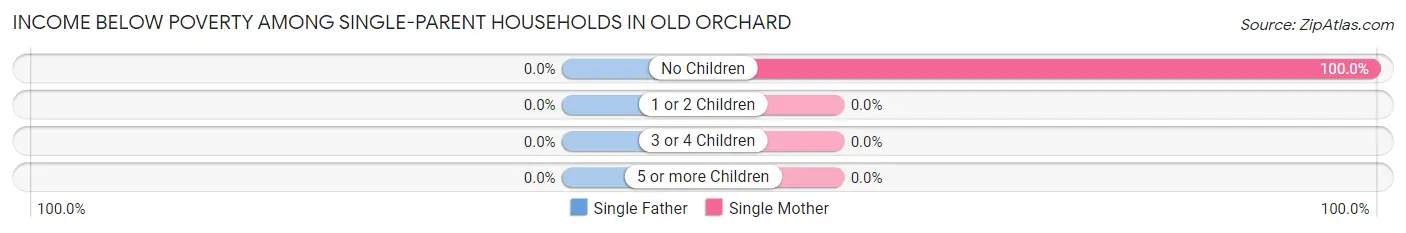
| Children | Single Father | Single Mother |
| No Children | 0 (0.0%) | 6 (100.0%) |
| 1 or 2 Children | 0 (0.0%) | 0 (0.0%) |
| 3 or 4 Children | 0 (0.0%) | 0 (0.0%) |
| 5 or more Children | 0 (0.0%) | 0 (0.0%) |
| Total | 0 (0.0%) | 6 (7.4%) |
Income Below Poverty Among Married-Couple vs Single-Parent Households in Old Orchard
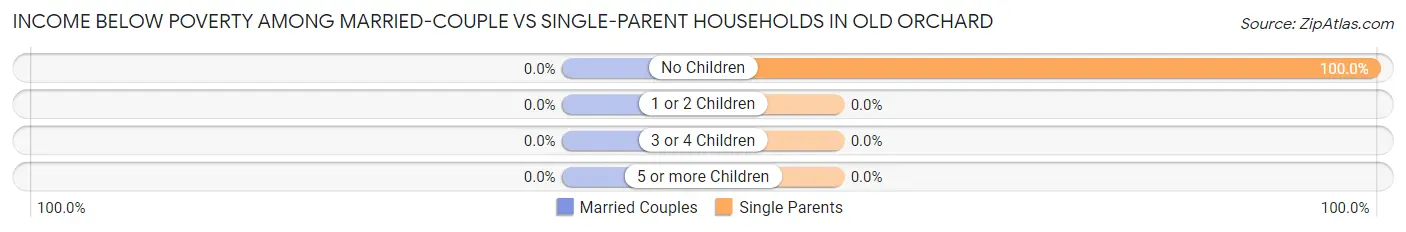
| Children | Married-Couple Families | Single-Parent Households |
| No Children | 0 (0.0%) | 6 (100.0%) |
| 1 or 2 Children | 0 (0.0%) | 0 (0.0%) |
| 3 or 4 Children | 0 (0.0%) | 0 (0.0%) |
| 5 or more Children | 0 (0.0%) | 0 (0.0%) |
| Total | 0 (0.0%) | 6 (7.4%) |
Race in Old Orchard
The most populous races in Old Orchard are White / Caucasian (1,556 | 85.2%), Two or more Races (207 | 11.3%), and Hispanic or Latino (80 | 4.4%).
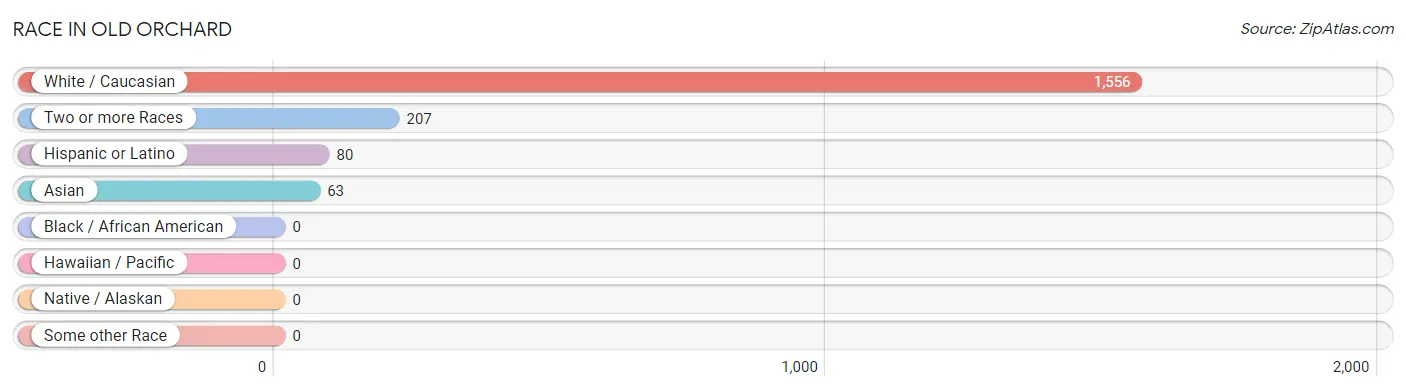
| Race | # Population | % Population |
| Asian | 63 | 3.5% |
| Black / African American | 0 | 0.0% |
| Hawaiian / Pacific | 0 | 0.0% |
| Hispanic or Latino | 80 | 4.4% |
| Native / Alaskan | 0 | 0.0% |
| White / Caucasian | 1,556 | 85.2% |
| Two or more Races | 207 | 11.3% |
| Some other Race | 0 | 0.0% |
| Total | 1,826 | 100.0% |
Ancestry in Old Orchard
The most populous ancestries reported in Old Orchard are Irish (419 | 23.0%), Italian (413 | 22.6%), German (285 | 15.6%), Polish (228 | 12.5%), and English (159 | 8.7%), together accounting for 82.4% of all Old Orchard residents.
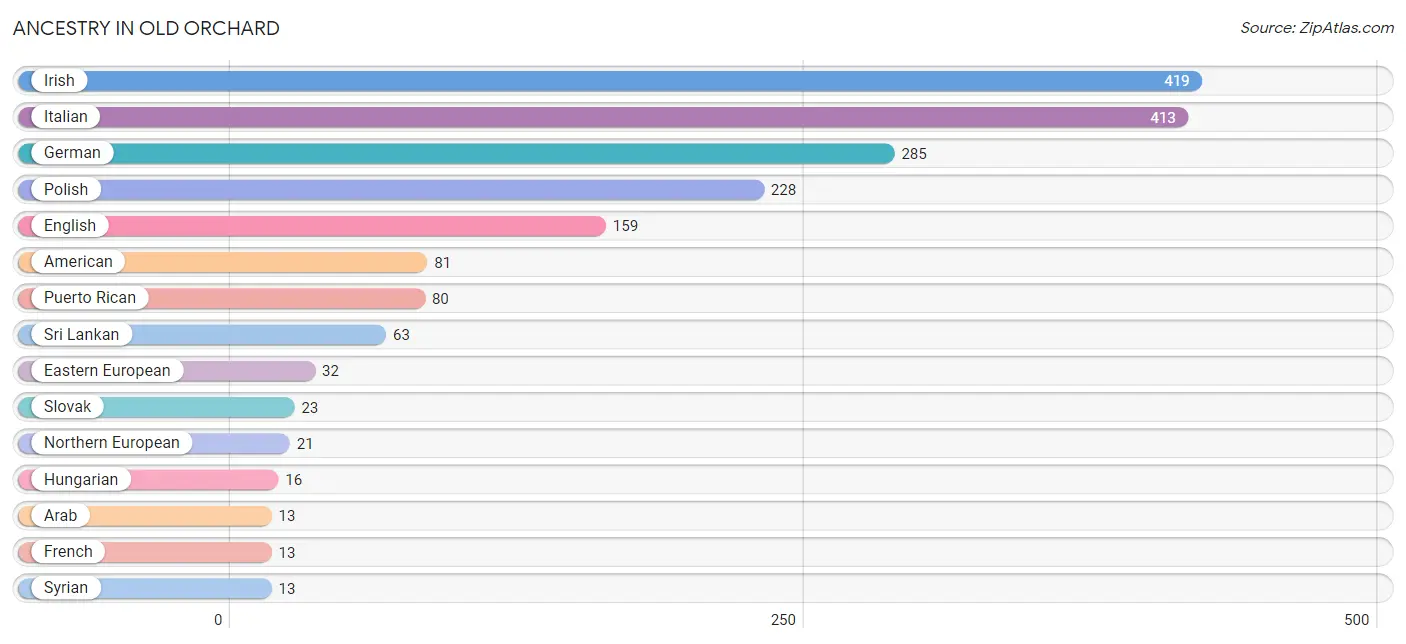
| Ancestry | # Population | % Population |
| American | 81 | 4.4% |
| Arab | 13 | 0.7% |
| Eastern European | 32 | 1.8% |
| English | 159 | 8.7% |
| French | 13 | 0.7% |
| German | 285 | 15.6% |
| Greek | 4 | 0.2% |
| Hungarian | 16 | 0.9% |
| Icelander | 11 | 0.6% |
| Irish | 419 | 23.0% |
| Italian | 413 | 22.6% |
| Northern European | 21 | 1.1% |
| Polish | 228 | 12.5% |
| Puerto Rican | 80 | 4.4% |
| Slovak | 23 | 1.3% |
| Sri Lankan | 63 | 3.5% |
| Syrian | 13 | 0.7% |
| Ukrainian | 11 | 0.6% | View All 18 Rows |
Immigrants in Old Orchard
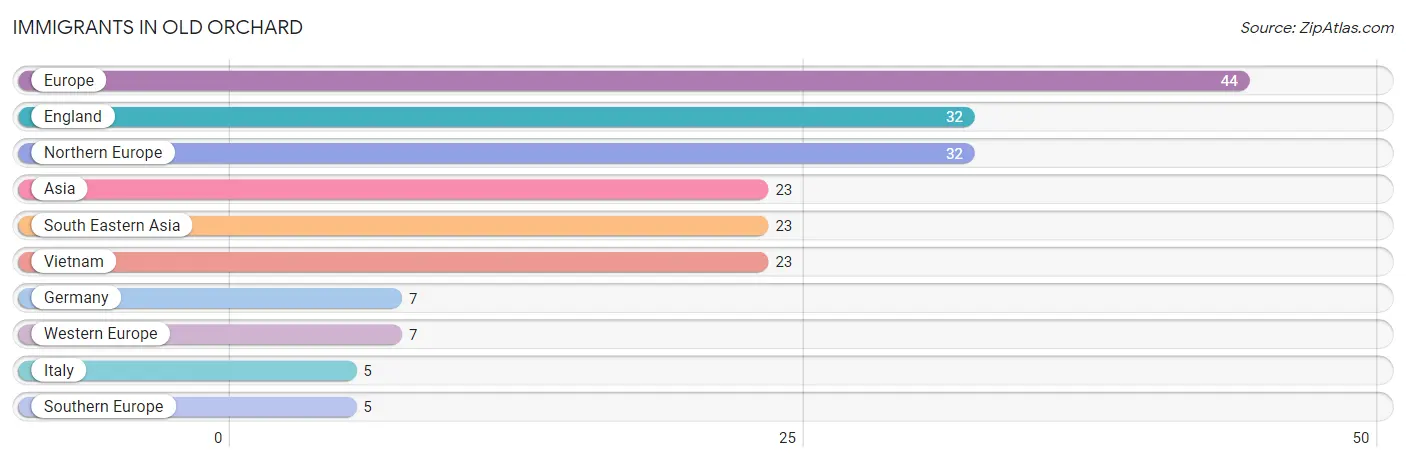
The most numerous immigrant groups reported in Old Orchard came from Europe (44 | 2.4%), England (32 | 1.8%), Northern Europe (32 | 1.8%), Asia (23 | 1.3%), and South Eastern Asia (23 | 1.3%), together accounting for 8.4% of all Old Orchard residents.
| Immigration Origin | # Population | % Population |
| Asia | 23 | 1.3% |
| England | 32 | 1.8% |
| Europe | 44 | 2.4% |
| Germany | 7 | 0.4% |
| Italy | 5 | 0.3% |
| Northern Europe | 32 | 1.8% |
| South Eastern Asia | 23 | 1.3% |
| Southern Europe | 5 | 0.3% |
| Vietnam | 23 | 1.3% |
| Western Europe | 7 | 0.4% | View All 10 Rows |
Sex and Age in Old Orchard
Sex and Age in Old Orchard
The most populous age groups in Old Orchard are Under 5 Years (203 | 20.2%) for men and 65 to 69 Years (164 | 20.0%) for women.
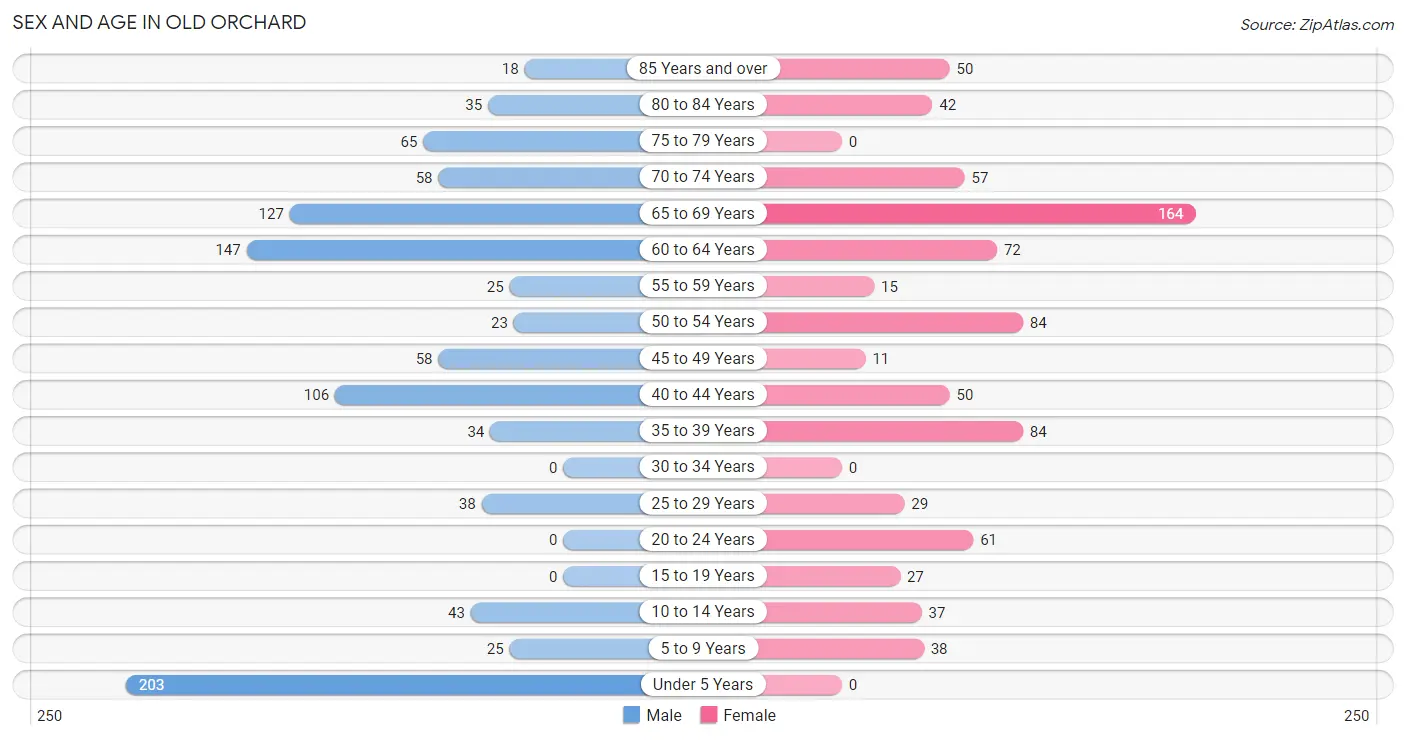
| Age Bracket | Male | Female |
| Under 5 Years | 203 (20.2%) | 0 (0.0%) |
| 5 to 9 Years | 25 (2.5%) | 38 (4.6%) |
| 10 to 14 Years | 43 (4.3%) | 37 (4.5%) |
| 15 to 19 Years | 0 (0.0%) | 27 (3.3%) |
| 20 to 24 Years | 0 (0.0%) | 61 (7.4%) |
| 25 to 29 Years | 38 (3.8%) | 29 (3.5%) |
| 30 to 34 Years | 0 (0.0%) | 0 (0.0%) |
| 35 to 39 Years | 34 (3.4%) | 84 (10.2%) |
| 40 to 44 Years | 106 (10.5%) | 50 (6.1%) |
| 45 to 49 Years | 58 (5.8%) | 11 (1.3%) |
| 50 to 54 Years | 23 (2.3%) | 84 (10.2%) |
| 55 to 59 Years | 25 (2.5%) | 15 (1.8%) |
| 60 to 64 Years | 147 (14.6%) | 72 (8.8%) |
| 65 to 69 Years | 127 (12.6%) | 164 (20.0%) |
| 70 to 74 Years | 58 (5.8%) | 57 (6.9%) |
| 75 to 79 Years | 65 (6.5%) | 0 (0.0%) |
| 80 to 84 Years | 35 (3.5%) | 42 (5.1%) |
| 85 Years and over | 18 (1.8%) | 50 (6.1%) |
| Total | 1,005 (100.0%) | 821 (100.0%) |
Families and Households in Old Orchard
Median Family Size in Old Orchard
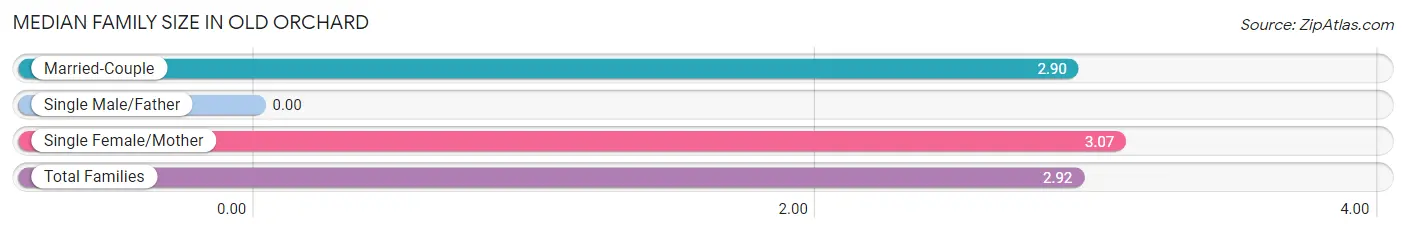
| Family Type | # Families | Family Size |
| Married-Couple | 460 (85.0%) | 2.90 |
| Single Male/Father | 0 (0.0%) | - |
| Single Female/Mother | 81 (15.0%) | 3.07 |
| Total Families | 541 (100.0%) | 2.92 |
Median Household Size in Old Orchard
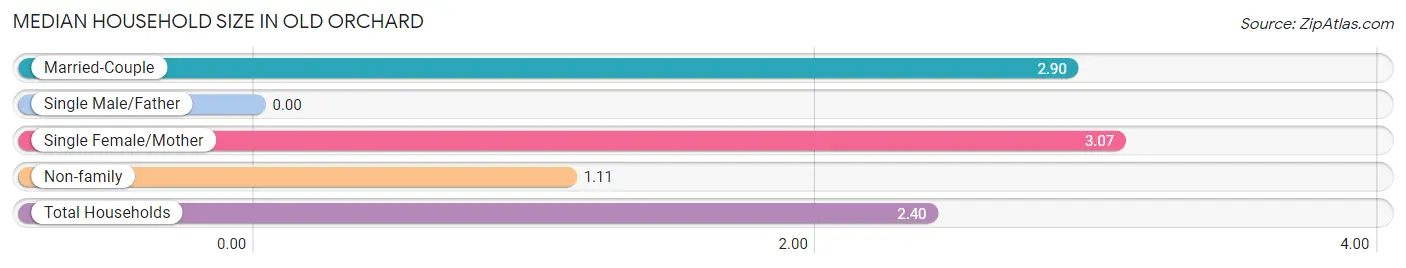
| Household Type | # Households | Household Size |
| Married-Couple | 460 (60.5%) | 2.90 |
| Single Male/Father | 0 (0.0%) | - |
| Single Female/Mother | 81 (10.6%) | 3.07 |
| Non-family | 220 (28.9%) | 1.11 |
| Total Households | 761 (100.0%) | 2.40 |
Household Size by Marriage Status in Old Orchard
Out of a total of 761 households in Old Orchard, 541 (71.1%) are family households, while 220 (28.9%) are nonfamily households. The most numerous type of family households are 2-person households, comprising 302, and the most common type of nonfamily households are 1-person households, comprising 194.
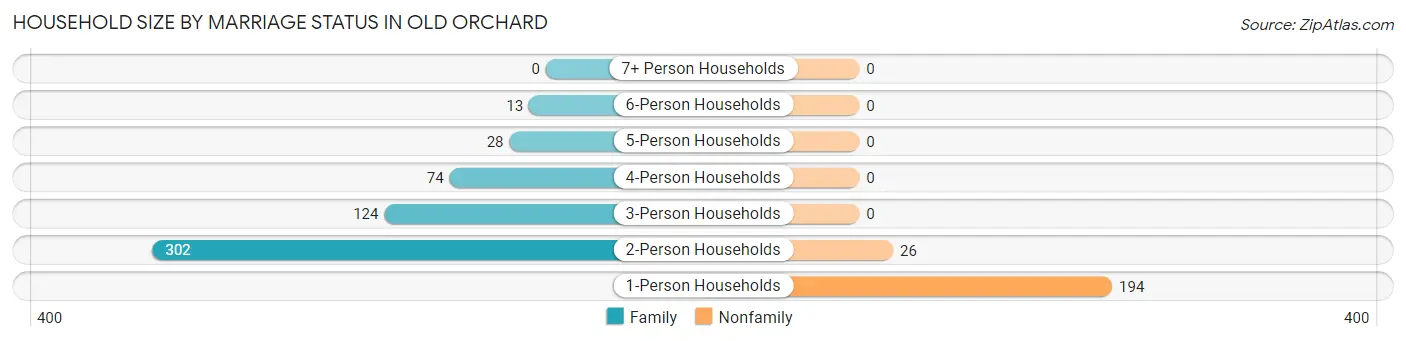
| Household Size | Family Households | Nonfamily Households |
| 1-Person Households | - | 194 (25.5%) |
| 2-Person Households | 302 (39.7%) | 26 (3.4%) |
| 3-Person Households | 124 (16.3%) | 0 (0.0%) |
| 4-Person Households | 74 (9.7%) | 0 (0.0%) |
| 5-Person Households | 28 (3.7%) | 0 (0.0%) |
| 6-Person Households | 13 (1.7%) | 0 (0.0%) |
| 7+ Person Households | 0 (0.0%) | 0 (0.0%) |
| Total | 541 (71.1%) | 220 (28.9%) |
Female Fertility in Old Orchard
Fertility by Age in Old Orchard
Average fertility rate in Old Orchard is 97.0 births per 1,000 women. Women in the age bracket of 20 to 34 years have the highest fertility rate with 322.0 births per 1,000 women. Women in the age bracket of 20 to 34 years acount for 100.0% of all women with births.
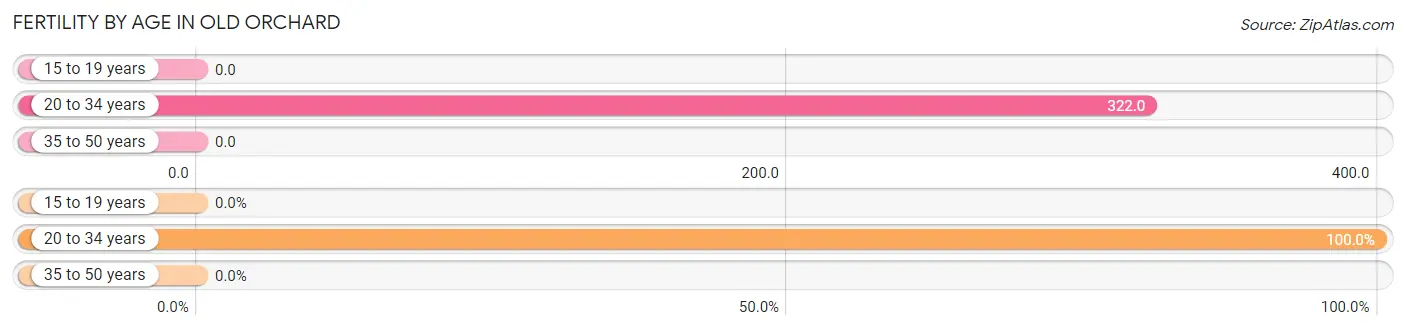
| Age Bracket | Women with Births | Births / 1,000 Women |
| 15 to 19 years | 0 (0.0%) | 0.0 |
| 20 to 34 years | 29 (100.0%) | 322.0 |
| 35 to 50 years | 0 (0.0%) | 0.0 |
| Total | 29 (100.0%) | 97.0 |
Fertility by Age by Marriage Status in Old Orchard
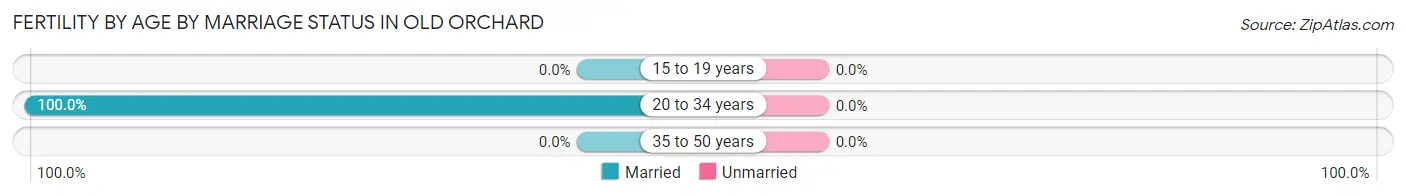
| Age Bracket | Married | Unmarried |
| 15 to 19 years | 0 (0.0%) | 0 (0.0%) |
| 20 to 34 years | 29 (100.0%) | 0 (0.0%) |
| 35 to 50 years | 0 (0.0%) | 0 (0.0%) |
| Total | 29 (100.0%) | 0 (0.0%) |
Fertility by Education in Old Orchard
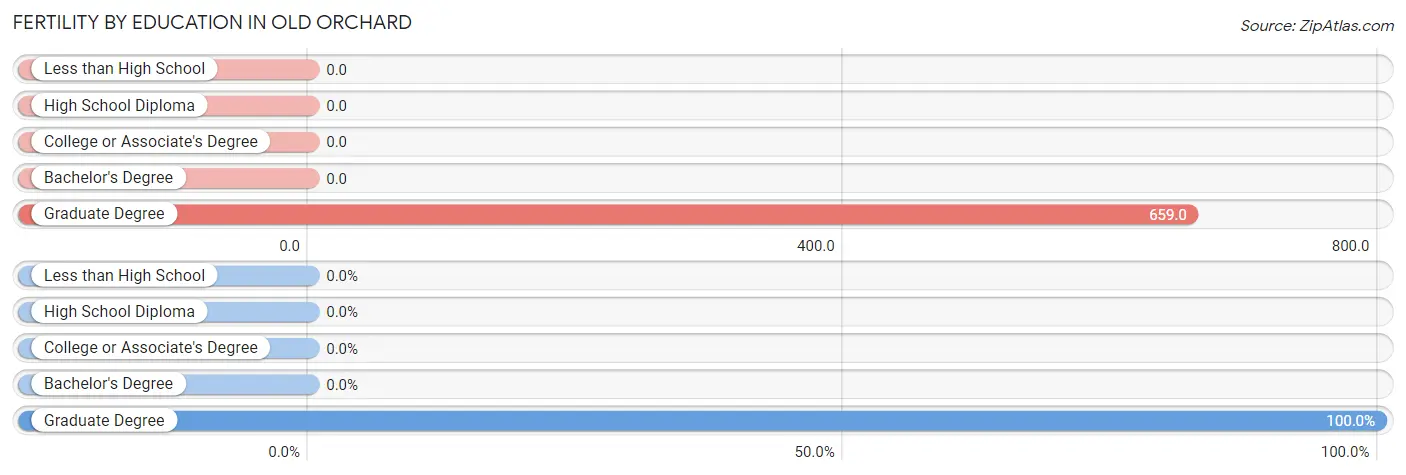
| Educational Attainment | Women with Births | Births / 1,000 Women |
| Less than High School | 0 (0.0%) | 0.0 |
| High School Diploma | 0 (0.0%) | 0.0 |
| College or Associate's Degree | 0 (0.0%) | 0.0 |
| Bachelor's Degree | 0 (0.0%) | 0.0 |
| Graduate Degree | 29 (100.0%) | 659.0 |
| Total | 29 (100.0%) | 97.0 |
Fertility by Education by Marriage Status in Old Orchard
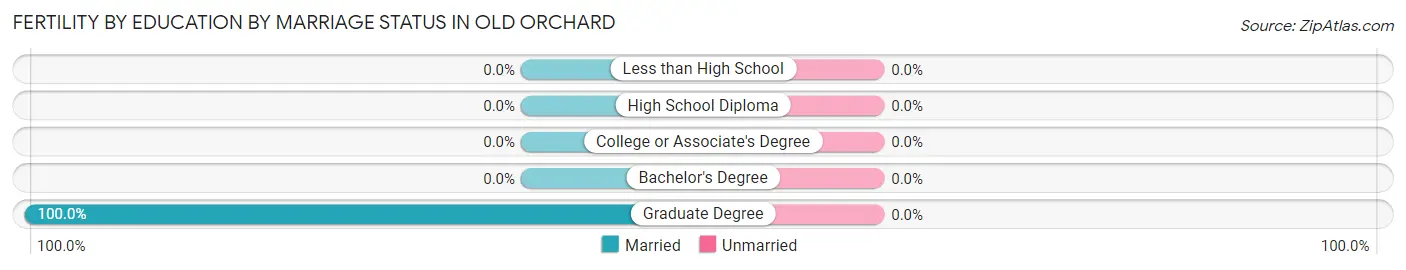
| Educational Attainment | Married | Unmarried |
| Less than High School | 0 (0.0%) | 0 (0.0%) |
| High School Diploma | 0 (0.0%) | 0 (0.0%) |
| College or Associate's Degree | 0 (0.0%) | 0 (0.0%) |
| Bachelor's Degree | 0 (0.0%) | 0 (0.0%) |
| Graduate Degree | 29 (100.0%) | 0 (0.0%) |
| Total | 29 (100.0%) | 0 (0.0%) |
Employment Characteristics in Old Orchard
Employment by Class of Employer in Old Orchard
Among the 803 employed individuals in Old Orchard, private company employees (519 | 64.6%), not-for-profit organizations (105 | 13.1%), and local government employees (83 | 10.3%) make up the most common classes of employment.
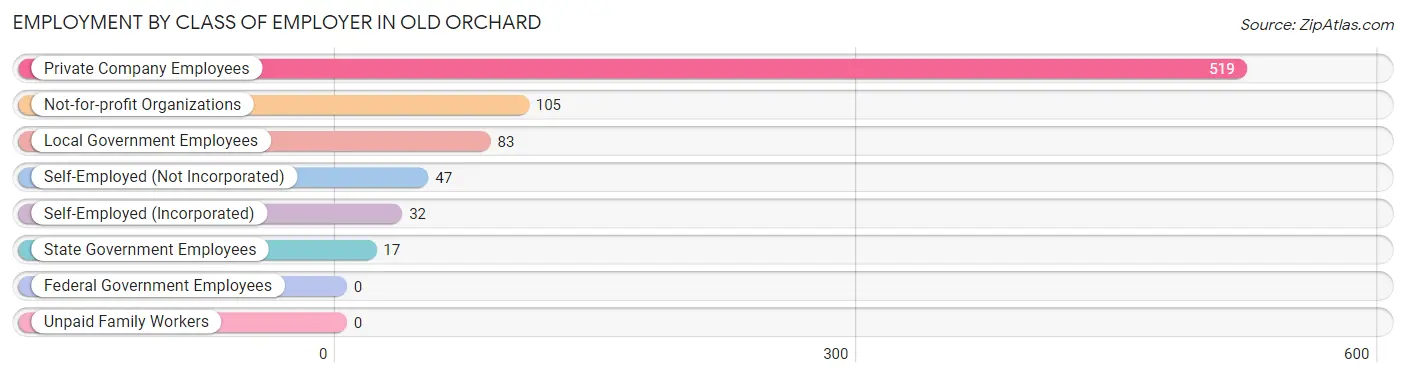
| Employer Class | # Employees | % Employees |
| Private Company Employees | 519 | 64.6% |
| Self-Employed (Incorporated) | 32 | 4.0% |
| Self-Employed (Not Incorporated) | 47 | 5.9% |
| Not-for-profit Organizations | 105 | 13.1% |
| Local Government Employees | 83 | 10.3% |
| State Government Employees | 17 | 2.1% |
| Federal Government Employees | 0 | 0.0% |
| Unpaid Family Workers | 0 | 0.0% |
| Total | 803 | 100.0% |
Employment Status by Age in Old Orchard
According to the labor force statistics for Old Orchard, out of the total population over 16 years of age (1,462), 58.4% or 854 individuals are in the labor force, with 4.1% or 35 of them unemployed. The age group with the highest labor force participation rate is 25 to 29 years, with 100.0% or 67 individuals in the labor force. Within the labor force, the 55 to 59 years age range has the highest percentage of unemployed individuals, with 62.5% or 25 of them being unemployed.
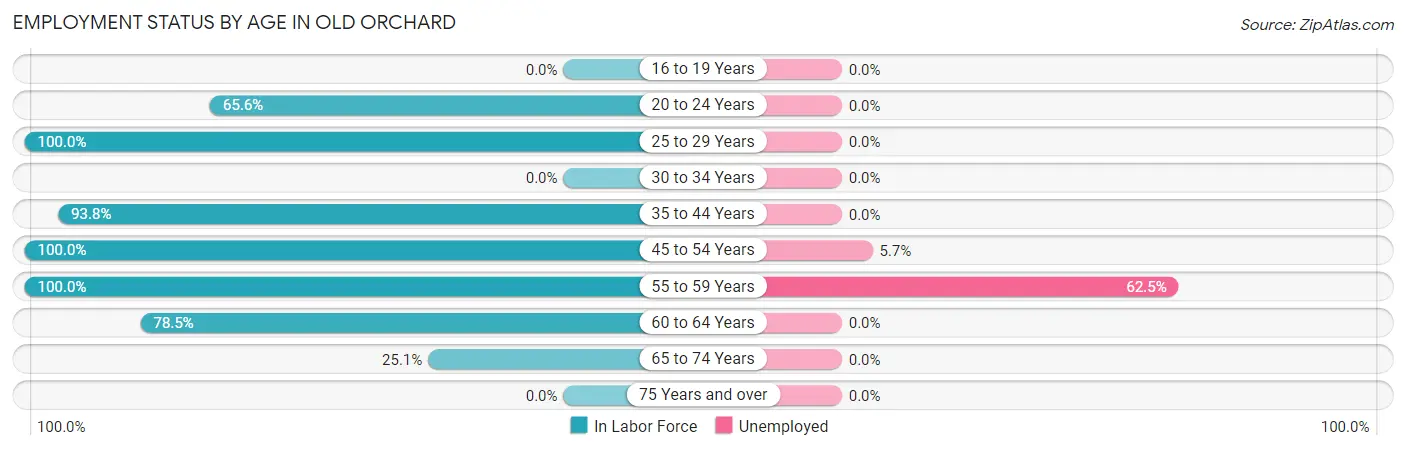
| Age Bracket | In Labor Force | Unemployed |
| 16 to 19 Years | 0 (0.0%) | 0 (0.0%) |
| 20 to 24 Years | 40 (65.6%) | 0 (0.0%) |
| 25 to 29 Years | 67 (100.0%) | 0 (0.0%) |
| 30 to 34 Years | 0 (0.0%) | 0 (0.0%) |
| 35 to 44 Years | 257 (93.8%) | 0 (0.0%) |
| 45 to 54 Years | 176 (100.0%) | 10 (5.7%) |
| 55 to 59 Years | 40 (100.0%) | 25 (62.5%) |
| 60 to 64 Years | 172 (78.5%) | 0 (0.0%) |
| 65 to 74 Years | 102 (25.1%) | 0 (0.0%) |
| 75 Years and over | 0 (0.0%) | 0 (0.0%) |
| Total | 854 (58.4%) | 35 (4.1%) |
Employment Status by Educational Attainment in Old Orchard
According to labor force statistics for Old Orchard, 91.8% of individuals (712) out of the total population between 25 and 64 years of age (776) are in the labor force, with 4.9% or 35 of them being unemployed. The group with the highest labor force participation rate are those with the educational attainment of bachelor's degree or higher, with 100.0% or 228 individuals in the labor force. Within the labor force, individuals with college / associate degree education have the highest percentage of unemployment, with 13.2% or 35 of them being unemployed.
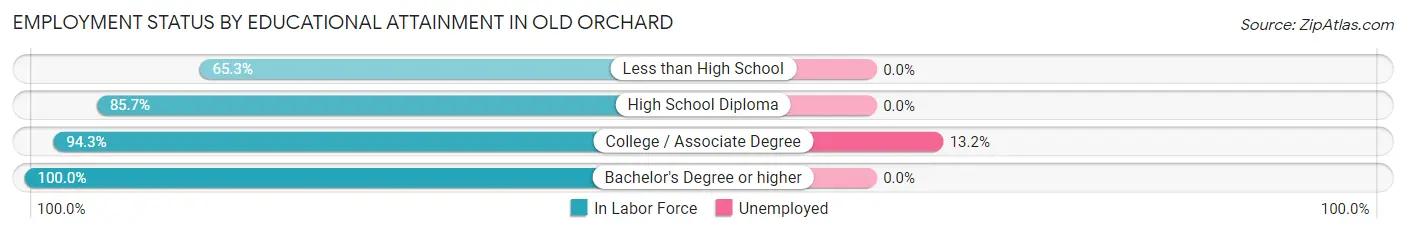
| Educational Attainment | In Labor Force | Unemployed |
| Less than High School | 32 (65.3%) | 0 (0.0%) |
| High School Diploma | 186 (85.7%) | 0 (0.0%) |
| College / Associate Degree | 266 (94.3%) | 37 (13.2%) |
| Bachelor's Degree or higher | 228 (100.0%) | 0 (0.0%) |
| Total | 712 (91.8%) | 38 (4.9%) |
Employment Occupations by Sex in Old Orchard
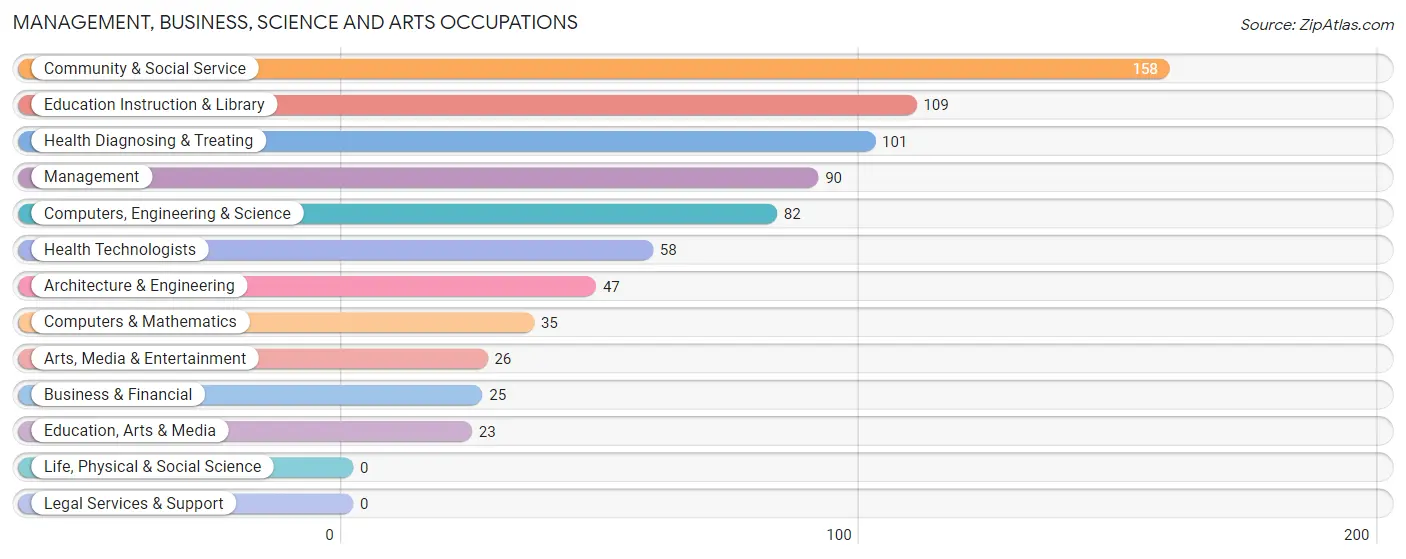
Management, Business, Science and Arts Occupations
The most common Management, Business, Science and Arts occupations in Old Orchard are Community & Social Service (158 | 19.3%), Education Instruction & Library (109 | 13.3%), Health Diagnosing & Treating (101 | 12.3%), Management (90 | 11.0%), and Computers, Engineering & Science (82 | 10.0%).
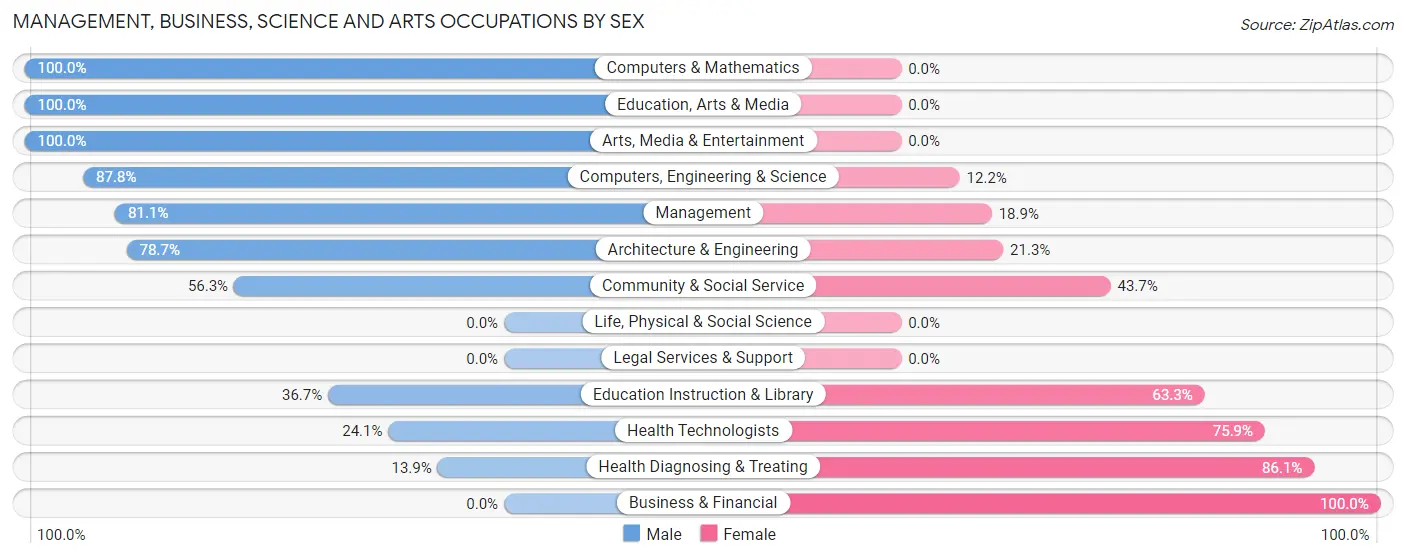
Management, Business, Science and Arts Occupations by Sex
Within the Management, Business, Science and Arts occupations in Old Orchard, the most male-oriented occupations are Computers & Mathematics (100.0%), Education, Arts & Media (100.0%), and Arts, Media & Entertainment (100.0%), while the most female-oriented occupations are Business & Financial (100.0%), Health Diagnosing & Treating (86.1%), and Health Technologists (75.9%).
| Occupation | Male | Female |
| Management | 73 (81.1%) | 17 (18.9%) |
| Business & Financial | 0 (0.0%) | 25 (100.0%) |
| Computers, Engineering & Science | 72 (87.8%) | 10 (12.2%) |
| Computers & Mathematics | 35 (100.0%) | 0 (0.0%) |
| Architecture & Engineering | 37 (78.7%) | 10 (21.3%) |
| Life, Physical & Social Science | 0 (0.0%) | 0 (0.0%) |
| Community & Social Service | 89 (56.3%) | 69 (43.7%) |
| Education, Arts & Media | 23 (100.0%) | 0 (0.0%) |
| Legal Services & Support | 0 (0.0%) | 0 (0.0%) |
| Education Instruction & Library | 40 (36.7%) | 69 (63.3%) |
| Arts, Media & Entertainment | 26 (100.0%) | 0 (0.0%) |
| Health Diagnosing & Treating | 14 (13.9%) | 87 (86.1%) |
| Health Technologists | 14 (24.1%) | 44 (75.9%) |
| Total (Category) | 248 (54.4%) | 208 (45.6%) |
| Total (Overall) | 427 (52.1%) | 392 (47.9%) |
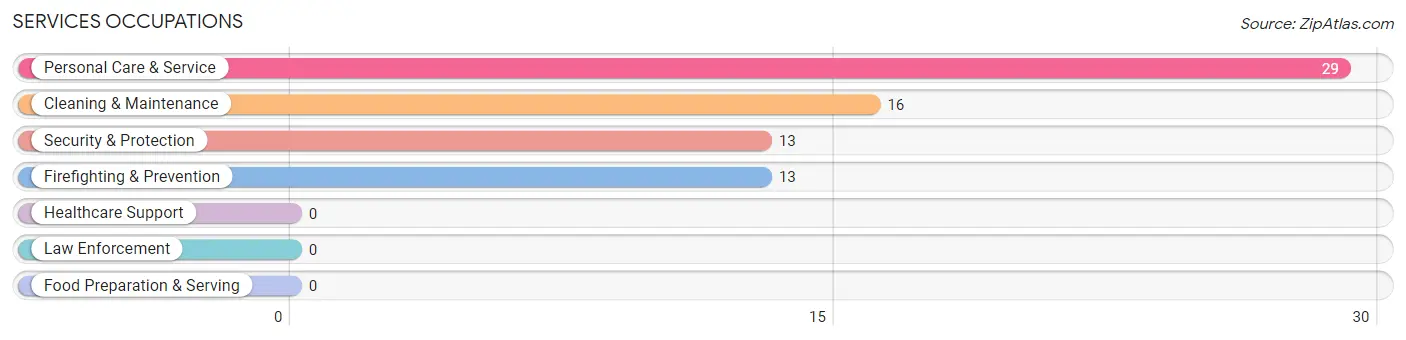
Services Occupations
The most common Services occupations in Old Orchard are Personal Care & Service (29 | 3.5%), Cleaning & Maintenance (16 | 1.9%), Security & Protection (13 | 1.6%), and Firefighting & Prevention (13 | 1.6%).
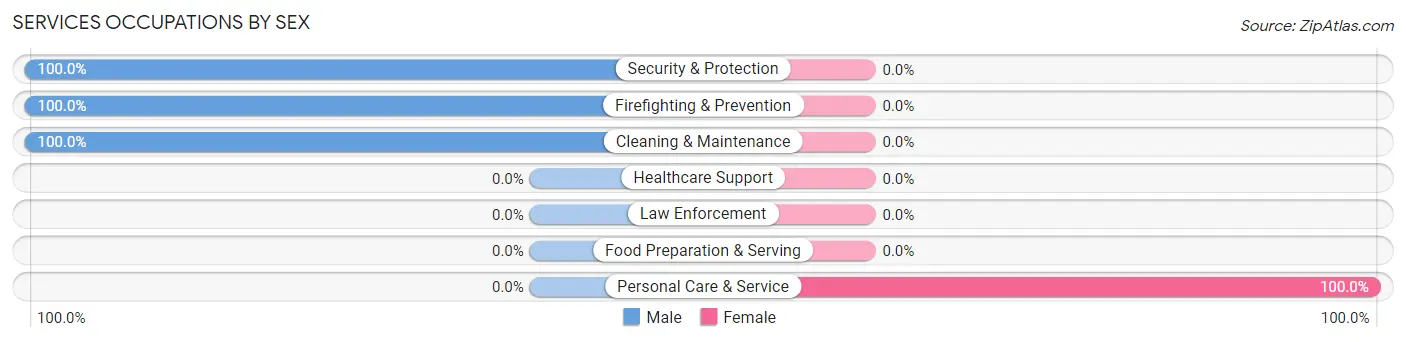
Services Occupations by Sex
| Occupation | Male | Female |
| Healthcare Support | 0 (0.0%) | 0 (0.0%) |
| Security & Protection | 13 (100.0%) | 0 (0.0%) |
| Firefighting & Prevention | 13 (100.0%) | 0 (0.0%) |
| Law Enforcement | 0 (0.0%) | 0 (0.0%) |
| Food Preparation & Serving | 0 (0.0%) | 0 (0.0%) |
| Cleaning & Maintenance | 16 (100.0%) | 0 (0.0%) |
| Personal Care & Service | 0 (0.0%) | 29 (100.0%) |
| Total (Category) | 29 (50.0%) | 29 (50.0%) |
| Total (Overall) | 427 (52.1%) | 392 (47.9%) |
Sales and Office Occupations
The most common Sales and Office occupations in Old Orchard are Office & Administration (155 | 18.9%), and Sales & Related (71 | 8.7%).
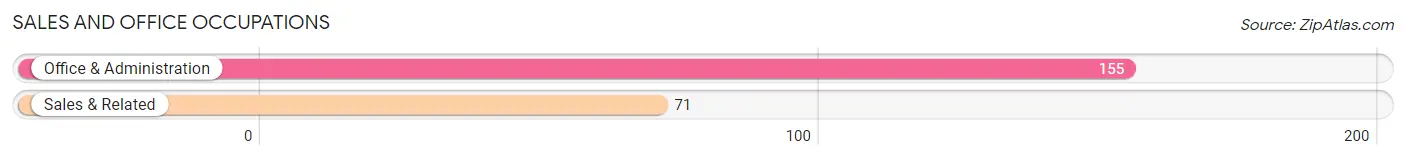
Sales and Office Occupations by Sex

| Occupation | Male | Female |
| Sales & Related | 71 (100.0%) | 0 (0.0%) |
| Office & Administration | 0 (0.0%) | 155 (100.0%) |
| Total (Category) | 71 (31.4%) | 155 (68.6%) |
| Total (Overall) | 427 (52.1%) | 392 (47.9%) |
Natural Resources, Construction and Maintenance Occupations
The most common Natural Resources, Construction and Maintenance occupations in Old Orchard are , and Construction & Extraction (9 | 1.1%).
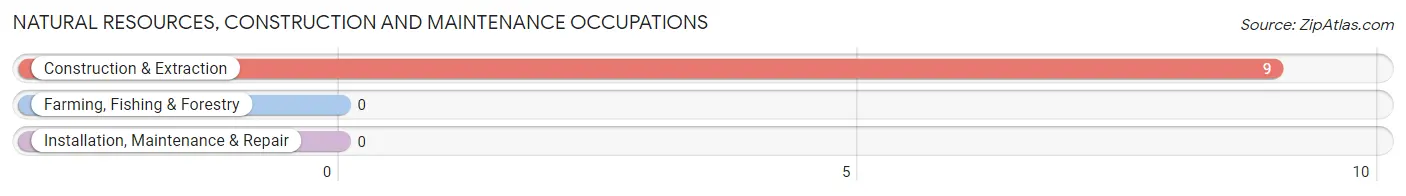
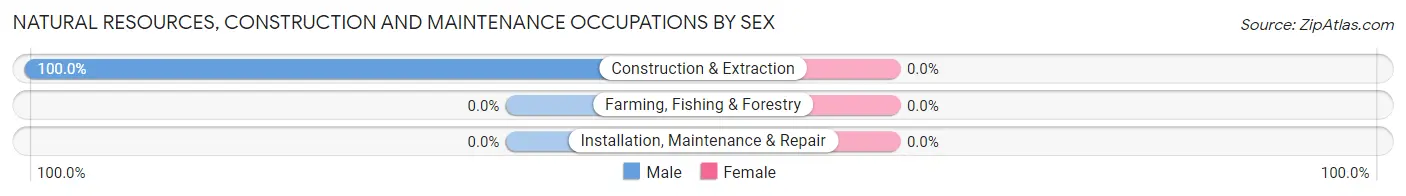
Natural Resources, Construction and Maintenance Occupations by Sex
| Occupation | Male | Female |
| Farming, Fishing & Forestry | 0 (0.0%) | 0 (0.0%) |
| Construction & Extraction | 9 (100.0%) | 0 (0.0%) |
| Installation, Maintenance & Repair | 0 (0.0%) | 0 (0.0%) |
| Total (Category) | 9 (100.0%) | 0 (0.0%) |
| Total (Overall) | 427 (52.1%) | 392 (47.9%) |
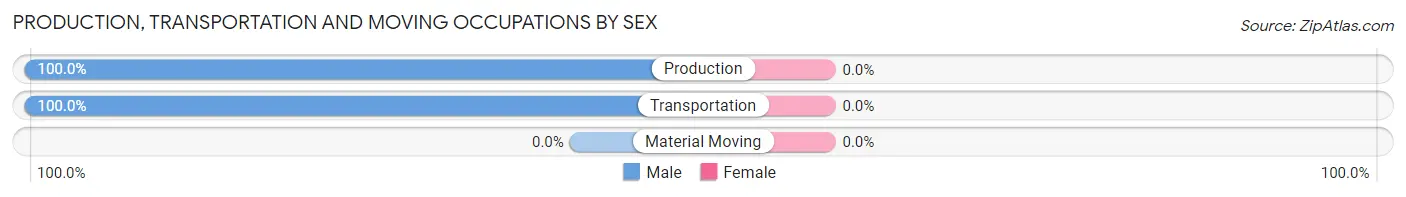
Production, Transportation and Moving Occupations
The most common Production, Transportation and Moving occupations in Old Orchard are Production (51 | 6.2%), and Transportation (19 | 2.3%).
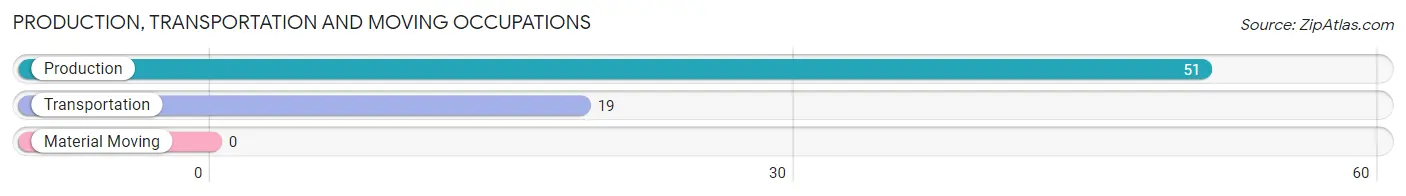
Production, Transportation and Moving Occupations by Sex
| Occupation | Male | Female |
| Production | 51 (100.0%) | 0 (0.0%) |
| Transportation | 19 (100.0%) | 0 (0.0%) |
| Material Moving | 0 (0.0%) | 0 (0.0%) |
| Total (Category) | 70 (100.0%) | 0 (0.0%) |
| Total (Overall) | 427 (52.1%) | 392 (47.9%) |
Employment Industries by Sex in Old Orchard
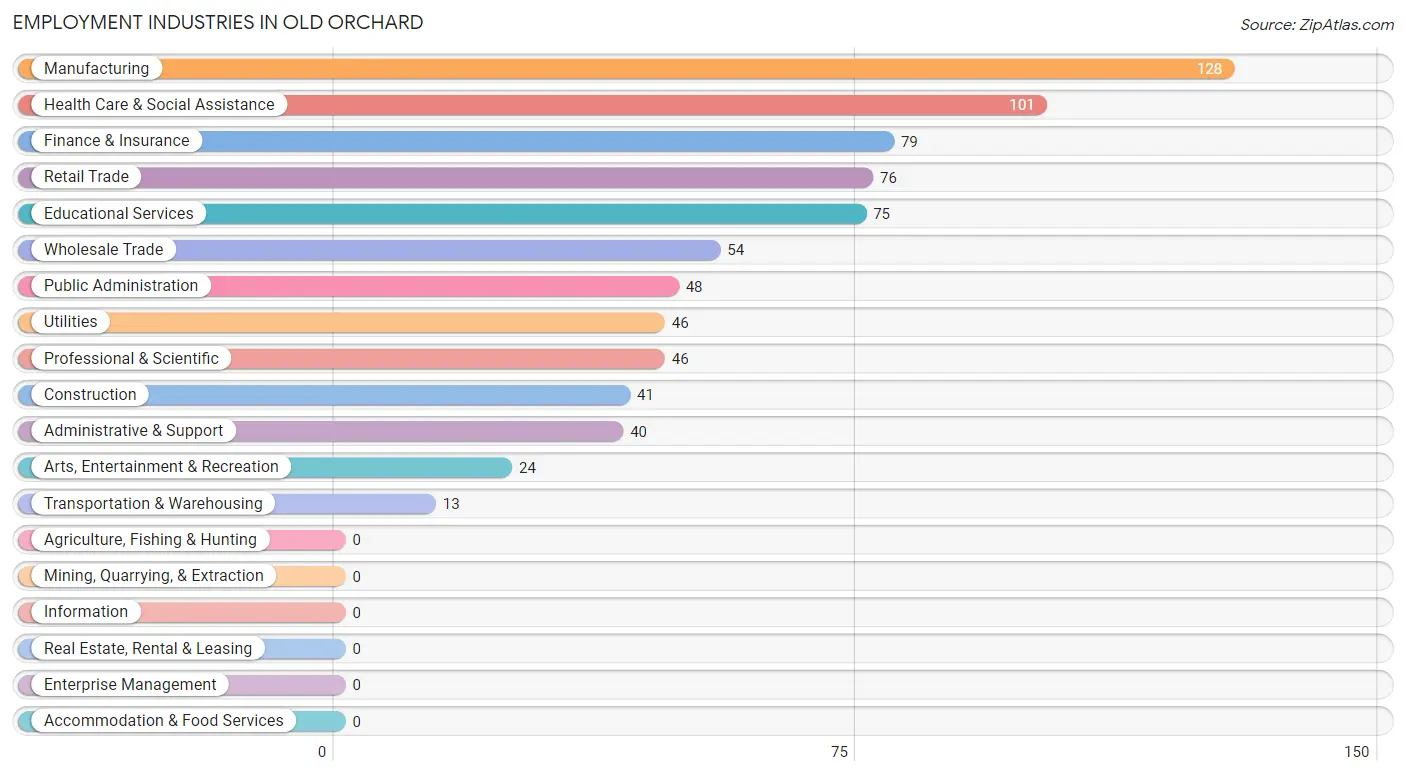
Employment Industries in Old Orchard
The major employment industries in Old Orchard include Manufacturing (128 | 15.6%), Health Care & Social Assistance (101 | 12.3%), Finance & Insurance (79 | 9.7%), Retail Trade (76 | 9.3%), and Educational Services (75 | 9.2%).
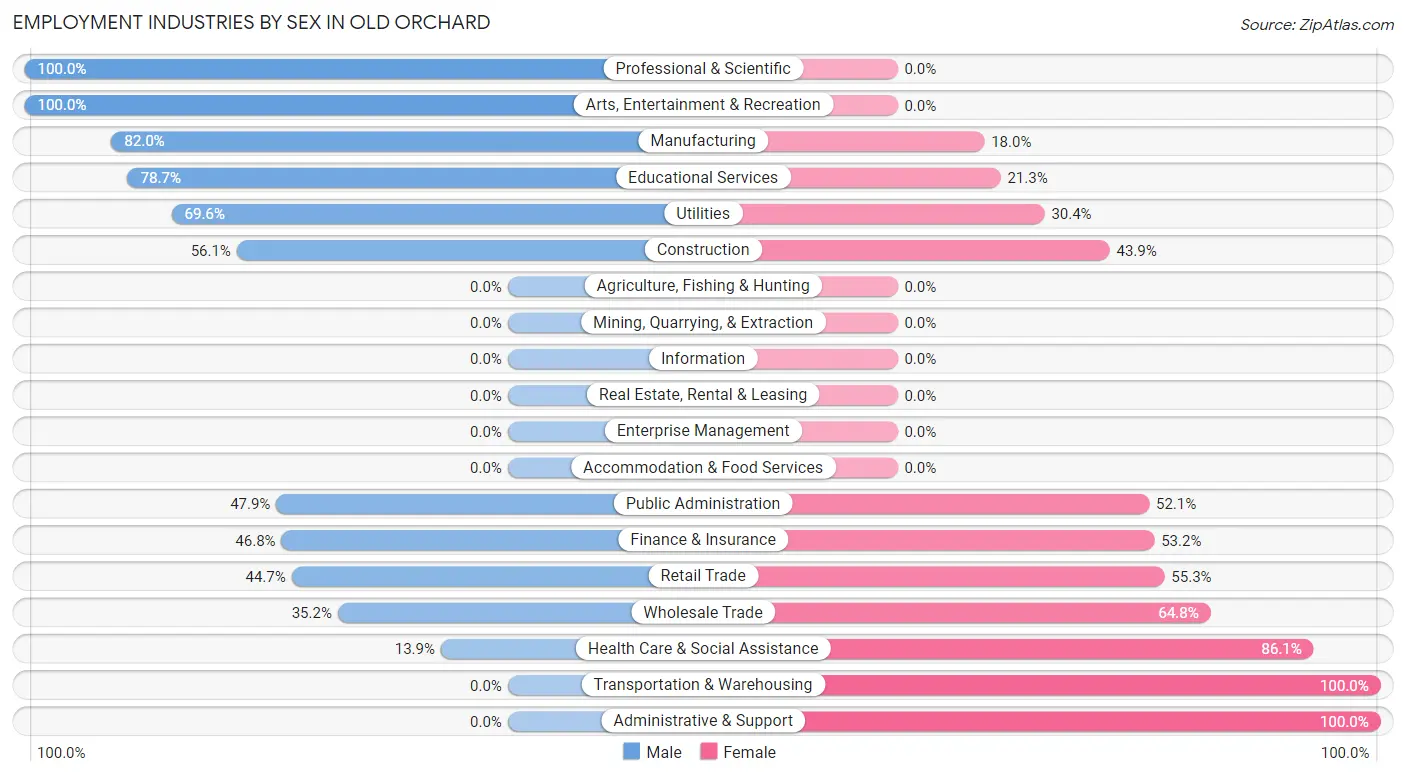
Employment Industries by Sex in Old Orchard
The Old Orchard industries that see more men than women are Professional & Scientific (100.0%), Arts, Entertainment & Recreation (100.0%), and Manufacturing (82.0%), whereas the industries that tend to have a higher number of women are Transportation & Warehousing (100.0%), Administrative & Support (100.0%), and Health Care & Social Assistance (86.1%).
| Industry | Male | Female |
| Agriculture, Fishing & Hunting | 0 (0.0%) | 0 (0.0%) |
| Mining, Quarrying, & Extraction | 0 (0.0%) | 0 (0.0%) |
| Construction | 23 (56.1%) | 18 (43.9%) |
| Manufacturing | 105 (82.0%) | 23 (18.0%) |
| Wholesale Trade | 19 (35.2%) | 35 (64.8%) |
| Retail Trade | 34 (44.7%) | 42 (55.3%) |
| Transportation & Warehousing | 0 (0.0%) | 13 (100.0%) |
| Utilities | 32 (69.6%) | 14 (30.4%) |
| Information | 0 (0.0%) | 0 (0.0%) |
| Finance & Insurance | 37 (46.8%) | 42 (53.2%) |
| Real Estate, Rental & Leasing | 0 (0.0%) | 0 (0.0%) |
| Professional & Scientific | 46 (100.0%) | 0 (0.0%) |
| Enterprise Management | 0 (0.0%) | 0 (0.0%) |
| Administrative & Support | 0 (0.0%) | 40 (100.0%) |
| Educational Services | 59 (78.7%) | 16 (21.3%) |
| Health Care & Social Assistance | 14 (13.9%) | 87 (86.1%) |
| Arts, Entertainment & Recreation | 24 (100.0%) | 0 (0.0%) |
| Accommodation & Food Services | 0 (0.0%) | 0 (0.0%) |
| Public Administration | 23 (47.9%) | 25 (52.1%) |
| Total | 427 (52.1%) | 392 (47.9%) |
Education in Old Orchard
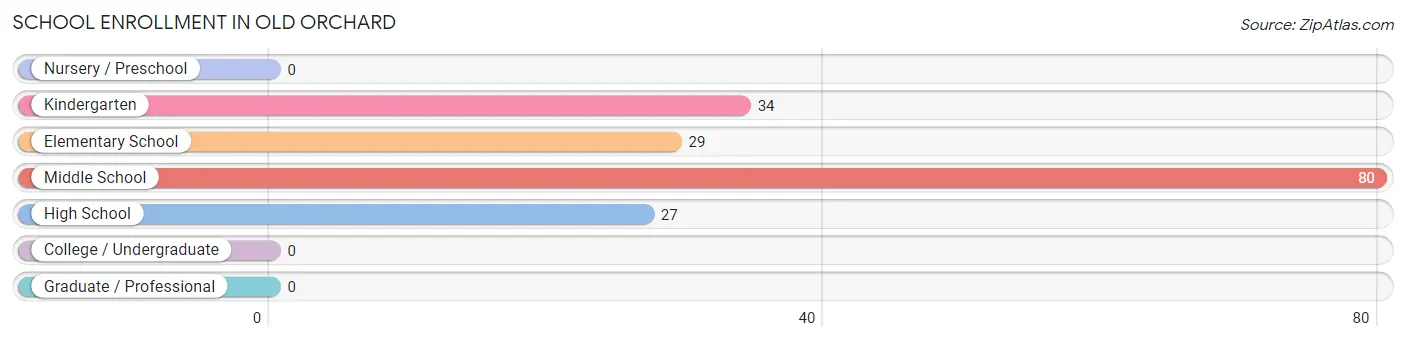
School Enrollment in Old Orchard
The most common levels of schooling among the 170 students in Old Orchard are middle school (80 | 47.1%), kindergarten (34 | 20.0%), and elementary school (29 | 17.1%).
| School Level | # Students | % Students |
| Nursery / Preschool | 0 | 0.0% |
| Kindergarten | 34 | 20.0% |
| Elementary School | 29 | 17.1% |
| Middle School | 80 | 47.1% |
| High School | 27 | 15.9% |
| College / Undergraduate | 0 | 0.0% |
| Graduate / Professional | 0 | 0.0% |
| Total | 170 | 100.0% |
School Enrollment by Age by Funding Source in Old Orchard
Out of a total of 170 students who are enrolled in schools in Old Orchard, 25 (14.7%) attend a private institution, while the remaining 145 (85.3%) are enrolled in public schools. The age group of 15 to 17 year olds has the highest likelihood of being enrolled in private schools, with 9 (33.3% in the age bracket) enrolled. Conversely, the age group of 10 to 14 year olds has the lowest likelihood of being enrolled in a private school, with 80 (100.0% in the age bracket) attending a public institution.
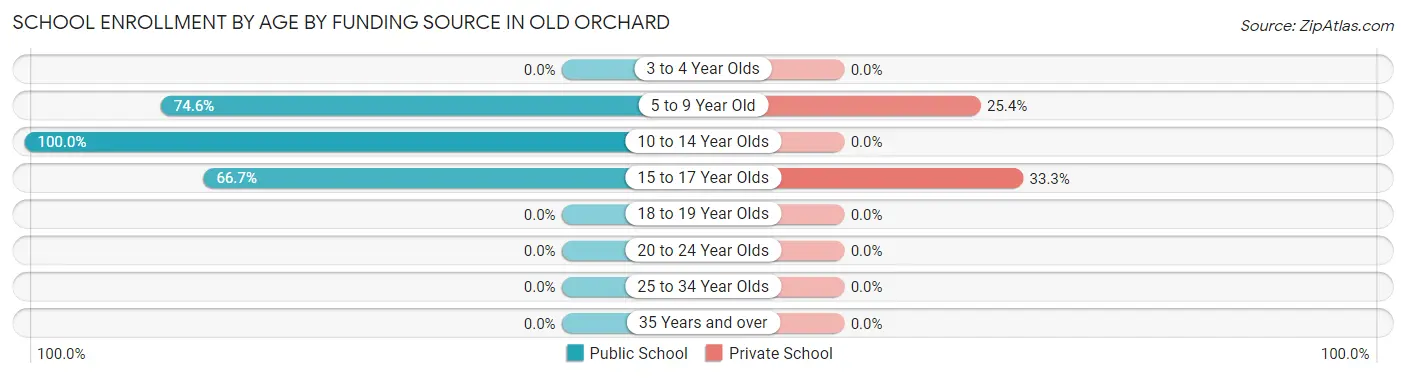
| Age Bracket | Public School | Private School |
| 3 to 4 Year Olds | 0 (0.0%) | 0 (0.0%) |
| 5 to 9 Year Old | 47 (74.6%) | 16 (25.4%) |
| 10 to 14 Year Olds | 80 (100.0%) | 0 (0.0%) |
| 15 to 17 Year Olds | 18 (66.7%) | 9 (33.3%) |
| 18 to 19 Year Olds | 0 (0.0%) | 0 (0.0%) |
| 20 to 24 Year Olds | 0 (0.0%) | 0 (0.0%) |
| 25 to 34 Year Olds | 0 (0.0%) | 0 (0.0%) |
| 35 Years and over | 0 (0.0%) | 0 (0.0%) |
| Total | 145 (85.3%) | 25 (14.7%) |
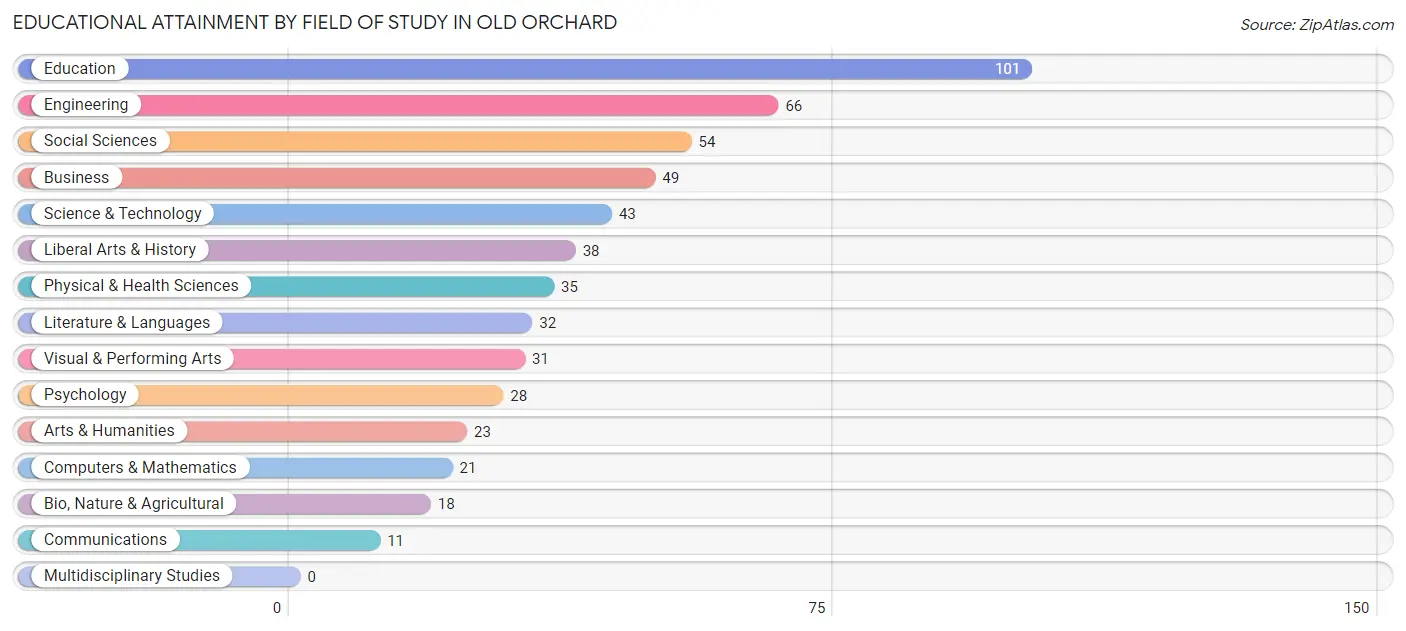
Educational Attainment by Field of Study in Old Orchard
Education (101 | 18.4%), engineering (66 | 12.0%), social sciences (54 | 9.8%), business (49 | 8.9%), and science & technology (43 | 7.8%) are the most common fields of study among 550 individuals in Old Orchard who have obtained a bachelor's degree or higher.
| Field of Study | # Graduates | % Graduates |
| Computers & Mathematics | 21 | 3.8% |
| Bio, Nature & Agricultural | 18 | 3.3% |
| Physical & Health Sciences | 35 | 6.4% |
| Psychology | 28 | 5.1% |
| Social Sciences | 54 | 9.8% |
| Engineering | 66 | 12.0% |
| Multidisciplinary Studies | 0 | 0.0% |
| Science & Technology | 43 | 7.8% |
| Business | 49 | 8.9% |
| Education | 101 | 18.4% |
| Literature & Languages | 32 | 5.8% |
| Liberal Arts & History | 38 | 6.9% |
| Visual & Performing Arts | 31 | 5.6% |
| Communications | 11 | 2.0% |
| Arts & Humanities | 23 | 4.2% |
| Total | 550 | 100.0% |
Transportation & Commute in Old Orchard
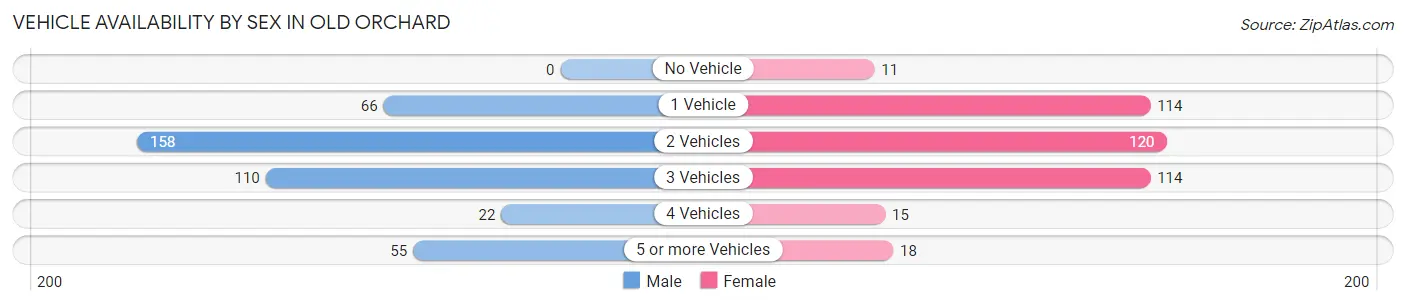
Vehicle Availability by Sex in Old Orchard
The most prevalent vehicle ownership categories in Old Orchard are males with 2 vehicles (158, accounting for 38.4%) and females with 2 vehicles (120, making up 40.3%).
| Vehicles Available | Male | Female |
| No Vehicle | 0 (0.0%) | 11 (2.8%) |
| 1 Vehicle | 66 (16.1%) | 114 (29.1%) |
| 2 Vehicles | 158 (38.4%) | 120 (30.6%) |
| 3 Vehicles | 110 (26.8%) | 114 (29.1%) |
| 4 Vehicles | 22 (5.3%) | 15 (3.8%) |
| 5 or more Vehicles | 55 (13.4%) | 18 (4.6%) |
| Total | 411 (100.0%) | 392 (100.0%) |
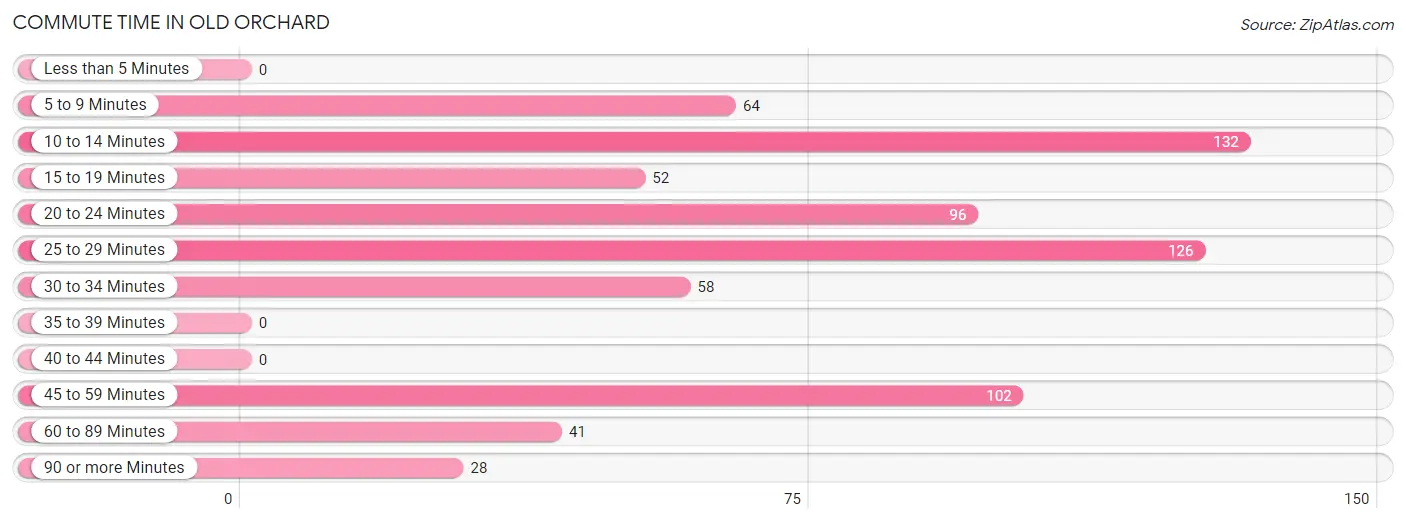
Commute Time in Old Orchard
The most frequently occuring commute durations in Old Orchard are 10 to 14 minutes (132 commuters, 18.9%), 25 to 29 minutes (126 commuters, 18.0%), and 45 to 59 minutes (102 commuters, 14.6%).
| Commute Time | # Commuters | % Commuters |
| Less than 5 Minutes | 0 | 0.0% |
| 5 to 9 Minutes | 64 | 9.2% |
| 10 to 14 Minutes | 132 | 18.9% |
| 15 to 19 Minutes | 52 | 7.4% |
| 20 to 24 Minutes | 96 | 13.7% |
| 25 to 29 Minutes | 126 | 18.0% |
| 30 to 34 Minutes | 58 | 8.3% |
| 35 to 39 Minutes | 0 | 0.0% |
| 40 to 44 Minutes | 0 | 0.0% |
| 45 to 59 Minutes | 102 | 14.6% |
| 60 to 89 Minutes | 41 | 5.9% |
| 90 or more Minutes | 28 | 4.0% |
Commute Time by Sex in Old Orchard
The most common commute times in Old Orchard are 25 to 29 minutes (74 commuters, 22.1%) for males and 10 to 14 minutes (64 commuters, 17.6%) for females.
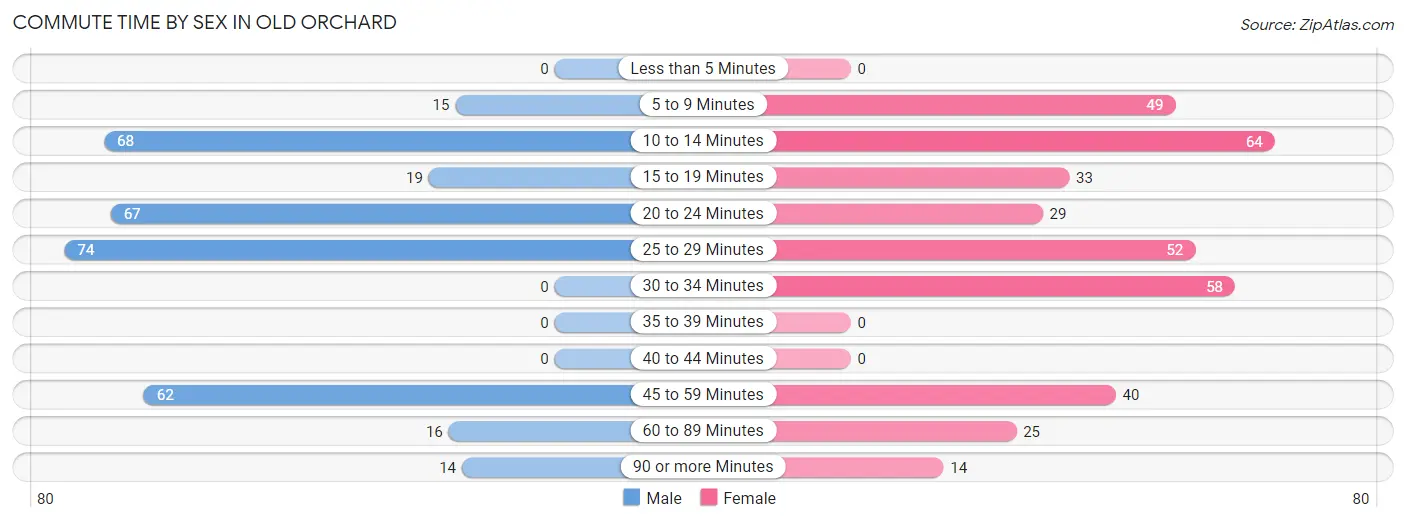
| Commute Time | Male | Female |
| Less than 5 Minutes | 0 (0.0%) | 0 (0.0%) |
| 5 to 9 Minutes | 15 (4.5%) | 49 (13.5%) |
| 10 to 14 Minutes | 68 (20.3%) | 64 (17.6%) |
| 15 to 19 Minutes | 19 (5.7%) | 33 (9.1%) |
| 20 to 24 Minutes | 67 (20.0%) | 29 (8.0%) |
| 25 to 29 Minutes | 74 (22.1%) | 52 (14.3%) |
| 30 to 34 Minutes | 0 (0.0%) | 58 (15.9%) |
| 35 to 39 Minutes | 0 (0.0%) | 0 (0.0%) |
| 40 to 44 Minutes | 0 (0.0%) | 0 (0.0%) |
| 45 to 59 Minutes | 62 (18.5%) | 40 (11.0%) |
| 60 to 89 Minutes | 16 (4.8%) | 25 (6.9%) |
| 90 or more Minutes | 14 (4.2%) | 14 (3.8%) |
Time of Departure to Work by Sex in Old Orchard
The most frequent times of departure to work in Old Orchard are 8:00 AM to 8:29 AM (92, 27.5%) for males and 7:00 AM to 7:29 AM (141, 38.7%) for females.
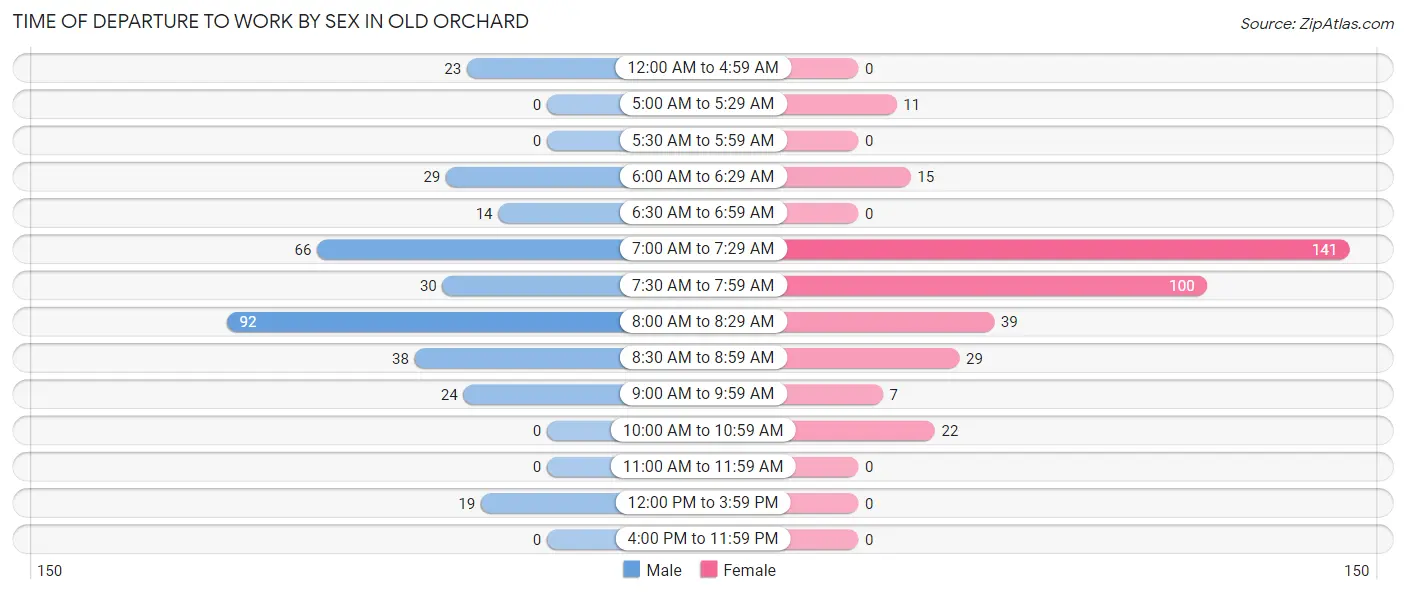
| Time of Departure | Male | Female |
| 12:00 AM to 4:59 AM | 23 (6.9%) | 0 (0.0%) |
| 5:00 AM to 5:29 AM | 0 (0.0%) | 11 (3.0%) |
| 5:30 AM to 5:59 AM | 0 (0.0%) | 0 (0.0%) |
| 6:00 AM to 6:29 AM | 29 (8.7%) | 15 (4.1%) |
| 6:30 AM to 6:59 AM | 14 (4.2%) | 0 (0.0%) |
| 7:00 AM to 7:29 AM | 66 (19.7%) | 141 (38.7%) |
| 7:30 AM to 7:59 AM | 30 (9.0%) | 100 (27.5%) |
| 8:00 AM to 8:29 AM | 92 (27.5%) | 39 (10.7%) |
| 8:30 AM to 8:59 AM | 38 (11.3%) | 29 (8.0%) |
| 9:00 AM to 9:59 AM | 24 (7.2%) | 7 (1.9%) |
| 10:00 AM to 10:59 AM | 0 (0.0%) | 22 (6.0%) |
| 11:00 AM to 11:59 AM | 0 (0.0%) | 0 (0.0%) |
| 12:00 PM to 3:59 PM | 19 (5.7%) | 0 (0.0%) |
| 4:00 PM to 11:59 PM | 0 (0.0%) | 0 (0.0%) |
| Total | 335 (100.0%) | 364 (100.0%) |
Housing Occupancy in Old Orchard
Occupancy by Ownership in Old Orchard
Of the total 761 dwellings in Old Orchard, owner-occupied units account for 672 (88.3%), while renter-occupied units make up 89 (11.7%).
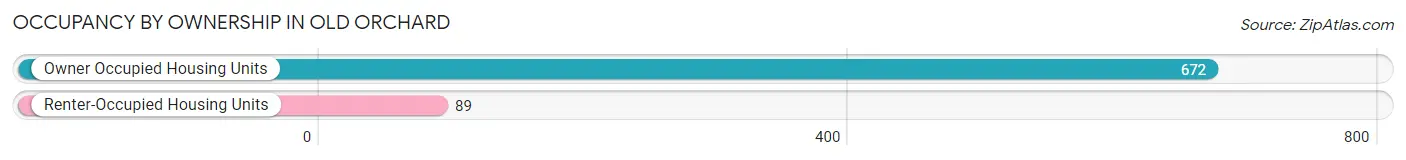
| Occupancy | # Housing Units | % Housing Units |
| Owner Occupied Housing Units | 672 | 88.3% |
| Renter-Occupied Housing Units | 89 | 11.7% |
| Total Occupied Housing Units | 761 | 100.0% |
Occupancy by Household Size in Old Orchard
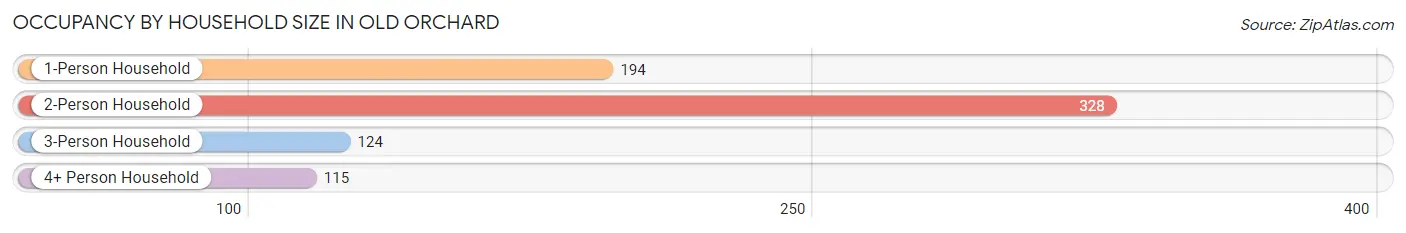
| Household Size | # Housing Units | % Housing Units |
| 1-Person Household | 194 | 25.5% |
| 2-Person Household | 328 | 43.1% |
| 3-Person Household | 124 | 16.3% |
| 4+ Person Household | 115 | 15.1% |
| Total Housing Units | 761 | 100.0% |
Occupancy by Ownership by Household Size in Old Orchard
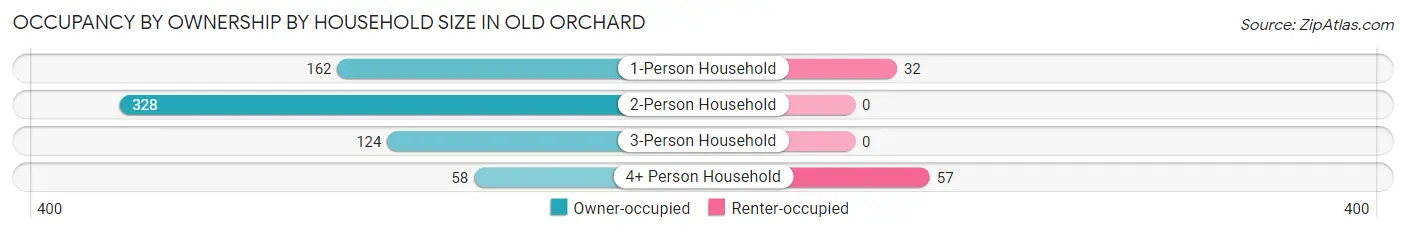
| Household Size | Owner-occupied | Renter-occupied |
| 1-Person Household | 162 (83.5%) | 32 (16.5%) |
| 2-Person Household | 328 (100.0%) | 0 (0.0%) |
| 3-Person Household | 124 (100.0%) | 0 (0.0%) |
| 4+ Person Household | 58 (50.4%) | 57 (49.6%) |
| Total Housing Units | 672 (88.3%) | 89 (11.7%) |
Occupancy by Educational Attainment in Old Orchard
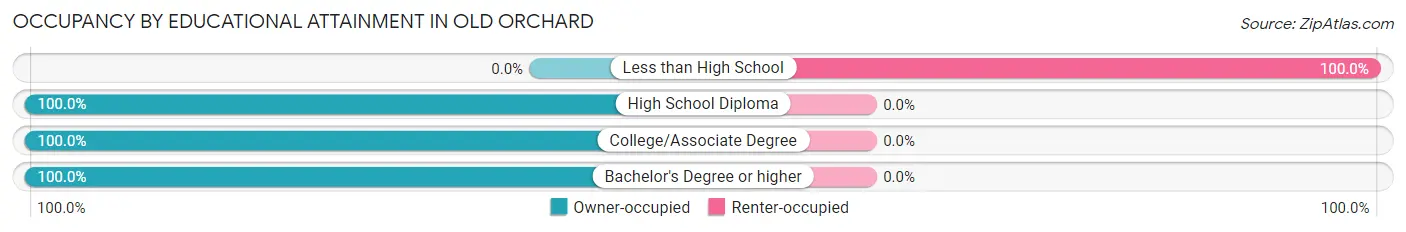
| Household Size | Owner-occupied | Renter-occupied |
| Less than High School | 0 (0.0%) | 89 (100.0%) |
| High School Diploma | 196 (100.0%) | 0 (0.0%) |
| College/Associate Degree | 227 (100.0%) | 0 (0.0%) |
| Bachelor's Degree or higher | 249 (100.0%) | 0 (0.0%) |
Occupancy by Age of Householder in Old Orchard
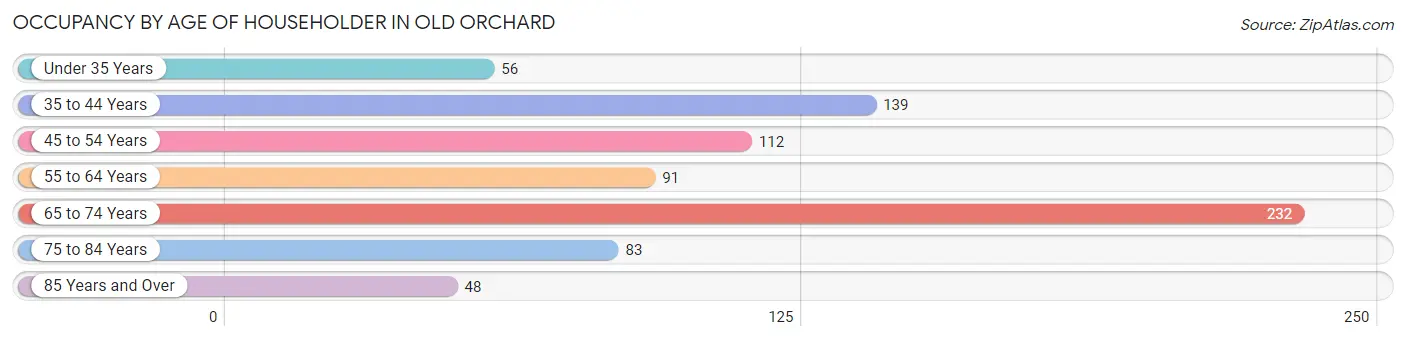
| Age Bracket | # Households | % Households |
| Under 35 Years | 56 | 7.4% |
| 35 to 44 Years | 139 | 18.3% |
| 45 to 54 Years | 112 | 14.7% |
| 55 to 64 Years | 91 | 12.0% |
| 65 to 74 Years | 232 | 30.5% |
| 75 to 84 Years | 83 | 10.9% |
| 85 Years and Over | 48 | 6.3% |
| Total | 761 | 100.0% |
Housing Finances in Old Orchard
Median Income by Occupancy in Old Orchard
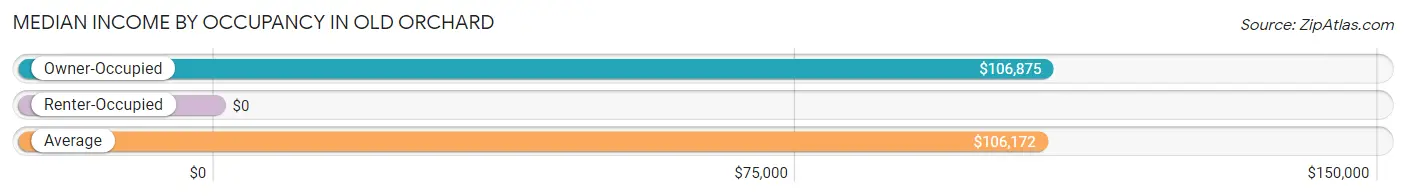
| Occupancy Type | # Households | Median Income |
| Owner-Occupied | 672 (88.3%) | $106,875 |
| Renter-Occupied | 89 (11.7%) | $0 |
| Average | 761 (100.0%) | $106,172 |
Occupancy by Householder Income Bracket in Old Orchard
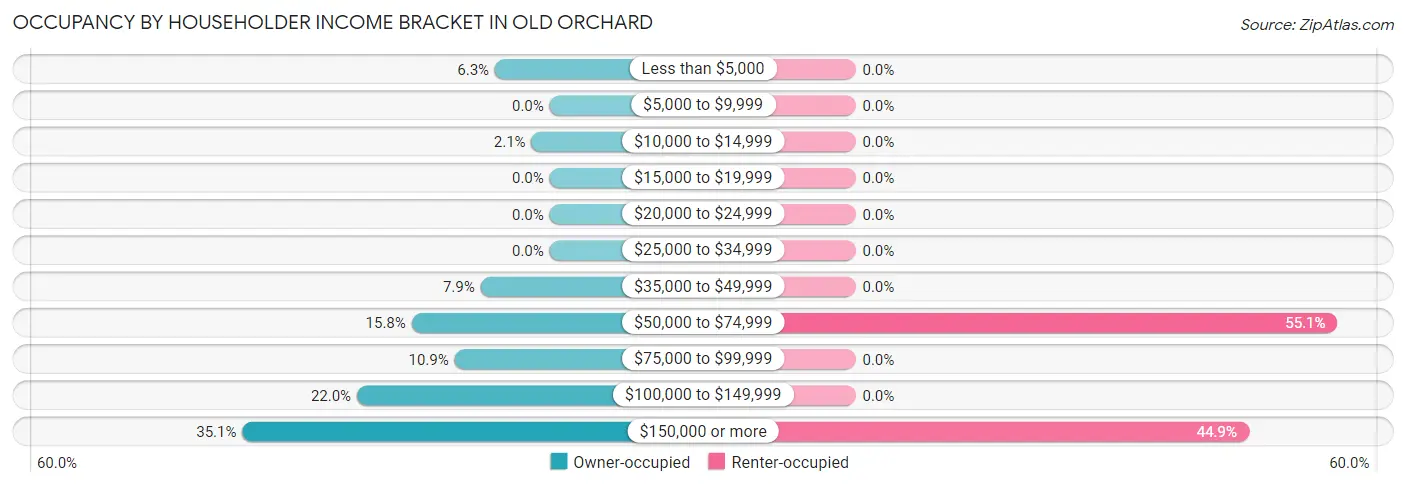
| Income Bracket | Owner-occupied | Renter-occupied |
| Less than $5,000 | 42 (6.2%) | 0 (0.0%) |
| $5,000 to $9,999 | 0 (0.0%) | 0 (0.0%) |
| $10,000 to $14,999 | 14 (2.1%) | 0 (0.0%) |
| $15,000 to $19,999 | 0 (0.0%) | 0 (0.0%) |
| $20,000 to $24,999 | 0 (0.0%) | 0 (0.0%) |
| $25,000 to $34,999 | 0 (0.0%) | 0 (0.0%) |
| $35,000 to $49,999 | 53 (7.9%) | 0 (0.0%) |
| $50,000 to $74,999 | 106 (15.8%) | 49 (55.1%) |
| $75,000 to $99,999 | 73 (10.9%) | 0 (0.0%) |
| $100,000 to $149,999 | 148 (22.0%) | 0 (0.0%) |
| $150,000 or more | 236 (35.1%) | 40 (44.9%) |
| Total | 672 (100.0%) | 89 (100.0%) |
Monthly Housing Cost Tiers in Old Orchard
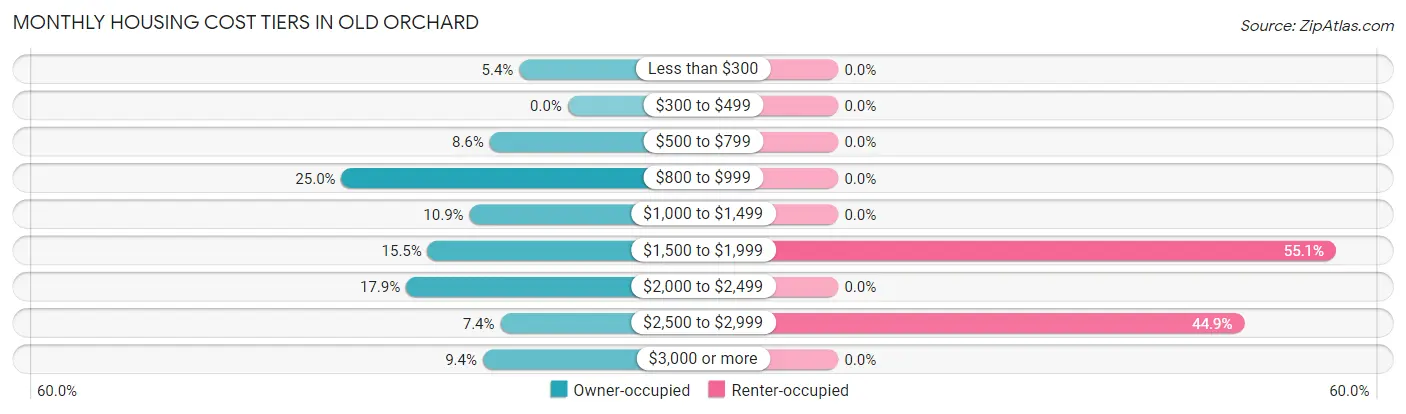
| Monthly Cost | Owner-occupied | Renter-occupied |
| Less than $300 | 36 (5.4%) | 0 (0.0%) |
| $300 to $499 | 0 (0.0%) | 0 (0.0%) |
| $500 to $799 | 58 (8.6%) | 0 (0.0%) |
| $800 to $999 | 168 (25.0%) | 0 (0.0%) |
| $1,000 to $1,499 | 73 (10.9%) | 0 (0.0%) |
| $1,500 to $1,999 | 104 (15.5%) | 49 (55.1%) |
| $2,000 to $2,499 | 120 (17.9%) | 0 (0.0%) |
| $2,500 to $2,999 | 50 (7.4%) | 40 (44.9%) |
| $3,000 or more | 63 (9.4%) | 0 (0.0%) |
| Total | 672 (100.0%) | 89 (100.0%) |
Physical Housing Characteristics in Old Orchard
Housing Structures in Old Orchard
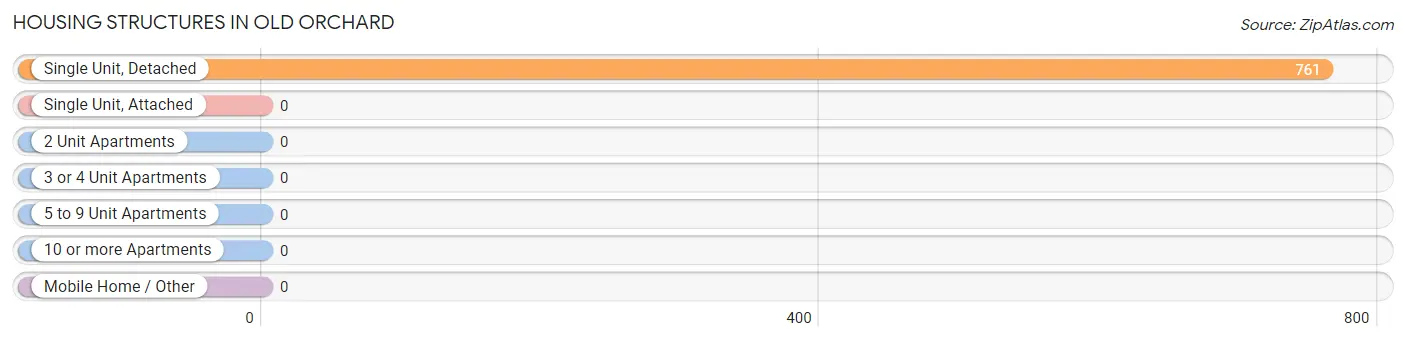
| Structure Type | # Housing Units | % Housing Units |
| Single Unit, Detached | 761 | 100.0% |
| Single Unit, Attached | 0 | 0.0% |
| 2 Unit Apartments | 0 | 0.0% |
| 3 or 4 Unit Apartments | 0 | 0.0% |
| 5 to 9 Unit Apartments | 0 | 0.0% |
| 10 or more Apartments | 0 | 0.0% |
| Mobile Home / Other | 0 | 0.0% |
| Total | 761 | 100.0% |
Housing Structures by Occupancy in Old Orchard
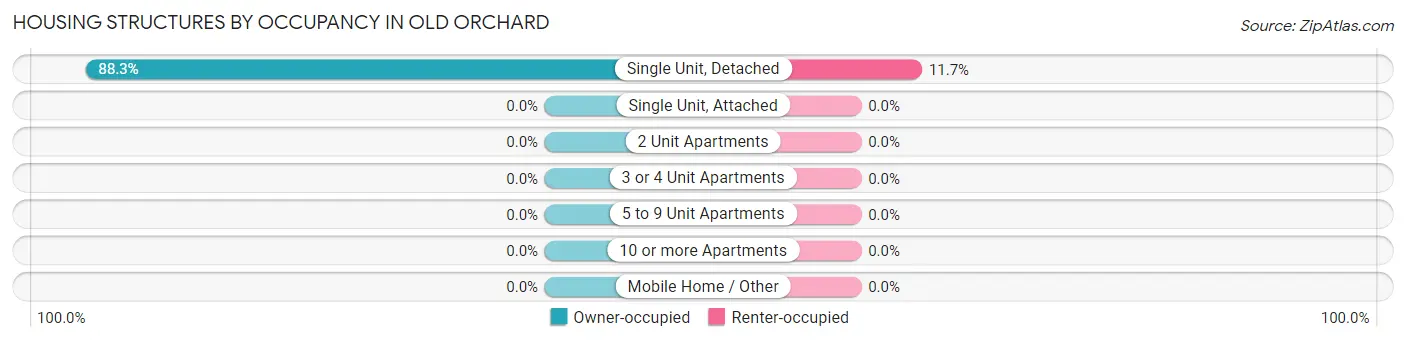
| Structure Type | Owner-occupied | Renter-occupied |
| Single Unit, Detached | 672 (88.3%) | 89 (11.7%) |
| Single Unit, Attached | 0 (0.0%) | 0 (0.0%) |
| 2 Unit Apartments | 0 (0.0%) | 0 (0.0%) |
| 3 or 4 Unit Apartments | 0 (0.0%) | 0 (0.0%) |
| 5 to 9 Unit Apartments | 0 (0.0%) | 0 (0.0%) |
| 10 or more Apartments | 0 (0.0%) | 0 (0.0%) |
| Mobile Home / Other | 0 (0.0%) | 0 (0.0%) |
| Total | 672 (88.3%) | 89 (11.7%) |
Housing Structures by Number of Rooms in Old Orchard
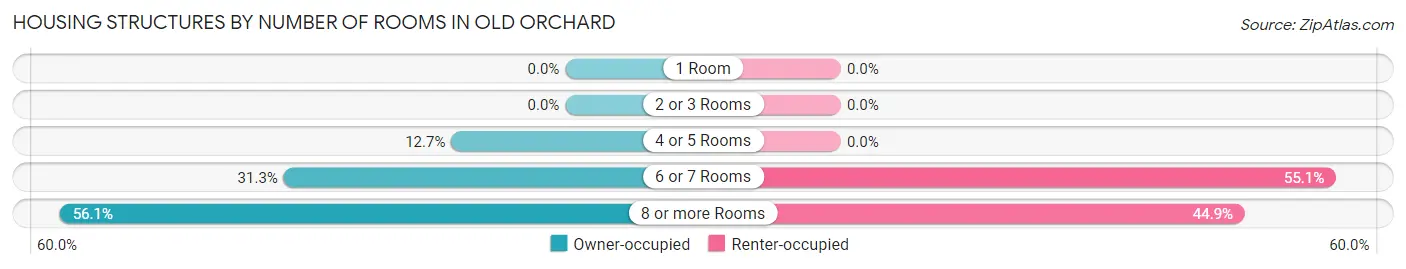
| Number of Rooms | Owner-occupied | Renter-occupied |
| 1 Room | 0 (0.0%) | 0 (0.0%) |
| 2 or 3 Rooms | 0 (0.0%) | 0 (0.0%) |
| 4 or 5 Rooms | 85 (12.7%) | 0 (0.0%) |
| 6 or 7 Rooms | 210 (31.2%) | 49 (55.1%) |
| 8 or more Rooms | 377 (56.1%) | 40 (44.9%) |
| Total | 672 (100.0%) | 89 (100.0%) |
Housing Structure by Heating Type in Old Orchard
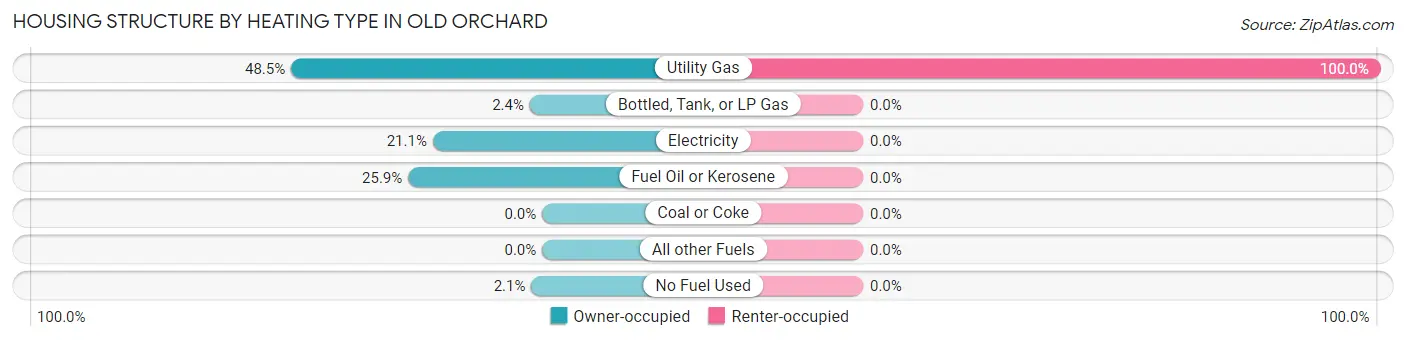
| Heating Type | Owner-occupied | Renter-occupied |
| Utility Gas | 326 (48.5%) | 89 (100.0%) |
| Bottled, Tank, or LP Gas | 16 (2.4%) | 0 (0.0%) |
| Electricity | 142 (21.1%) | 0 (0.0%) |
| Fuel Oil or Kerosene | 174 (25.9%) | 0 (0.0%) |
| Coal or Coke | 0 (0.0%) | 0 (0.0%) |
| All other Fuels | 0 (0.0%) | 0 (0.0%) |
| No Fuel Used | 14 (2.1%) | 0 (0.0%) |
| Total | 672 (100.0%) | 89 (100.0%) |
Household Vehicle Usage in Old Orchard
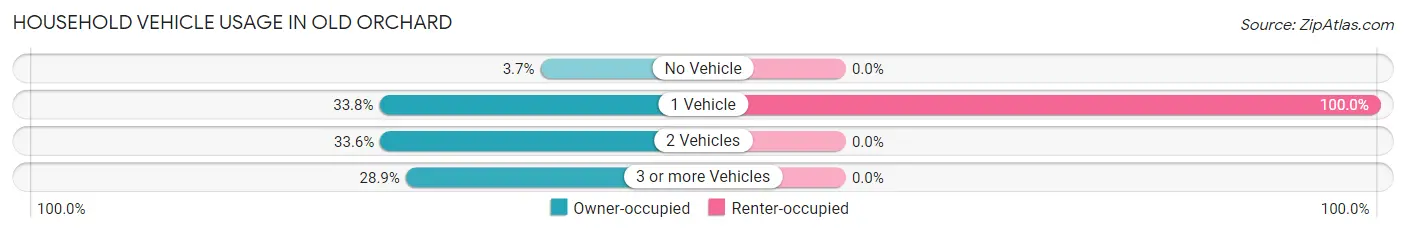
| Vehicles per Household | Owner-occupied | Renter-occupied |
| No Vehicle | 25 (3.7%) | 0 (0.0%) |
| 1 Vehicle | 227 (33.8%) | 89 (100.0%) |
| 2 Vehicles | 226 (33.6%) | 0 (0.0%) |
| 3 or more Vehicles | 194 (28.9%) | 0 (0.0%) |
| Total | 672 (100.0%) | 89 (100.0%) |
Real Estate & Mortgages in Old Orchard
Real Estate and Mortgage Overview in Old Orchard
| Characteristic | Without Mortgage | With Mortgage |
| Housing Units | 299 | 373 |
| Median Property Value | $389,600 | $307,900 |
| Median Household Income | $79,570 | $156 |
| Monthly Housing Costs | $852 | $63 |
| Real Estate Taxes | $5,428 | $0 |
Property Value by Mortgage Status in Old Orchard
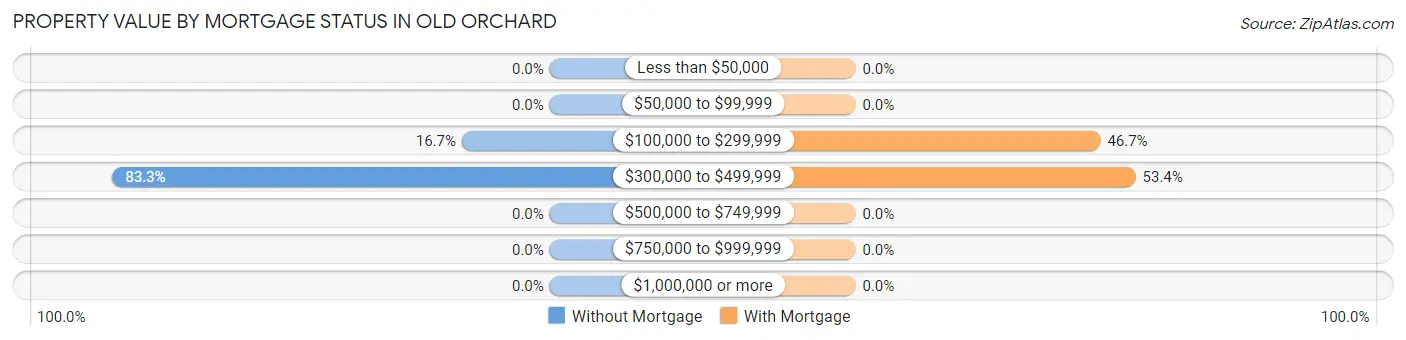
| Property Value | Without Mortgage | With Mortgage |
| Less than $50,000 | 0 (0.0%) | 0 (0.0%) |
| $50,000 to $99,999 | 0 (0.0%) | 0 (0.0%) |
| $100,000 to $299,999 | 50 (16.7%) | 174 (46.7%) |
| $300,000 to $499,999 | 249 (83.3%) | 199 (53.3%) |
| $500,000 to $749,999 | 0 (0.0%) | 0 (0.0%) |
| $750,000 to $999,999 | 0 (0.0%) | 0 (0.0%) |
| $1,000,000 or more | 0 (0.0%) | 0 (0.0%) |
| Total | 299 (100.0%) | 373 (100.0%) |
Household Income by Mortgage Status in Old Orchard
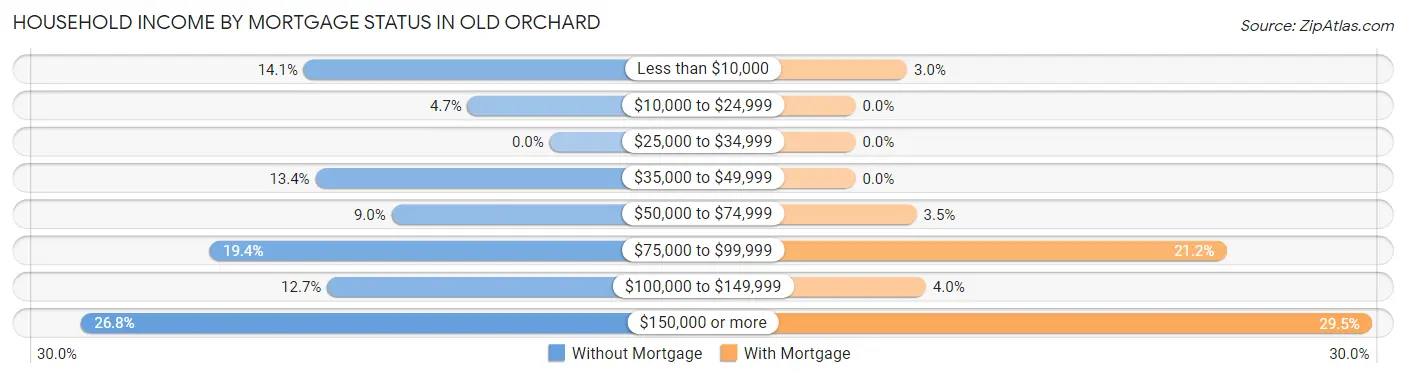
| Household Income | Without Mortgage | With Mortgage |
| Less than $10,000 | 42 (14.1%) | 11 (2.9%) |
| $10,000 to $24,999 | 14 (4.7%) | 0 (0.0%) |
| $25,000 to $34,999 | 0 (0.0%) | 0 (0.0%) |
| $35,000 to $49,999 | 40 (13.4%) | 0 (0.0%) |
| $50,000 to $74,999 | 27 (9.0%) | 13 (3.5%) |
| $75,000 to $99,999 | 58 (19.4%) | 79 (21.2%) |
| $100,000 to $149,999 | 38 (12.7%) | 15 (4.0%) |
| $150,000 or more | 80 (26.8%) | 110 (29.5%) |
| Total | 299 (100.0%) | 373 (100.0%) |
Property Value to Household Income Ratio in Old Orchard
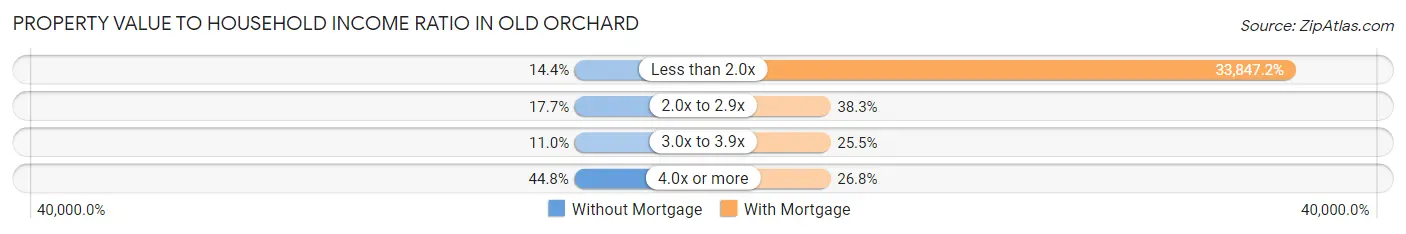
| Value-to-Income Ratio | Without Mortgage | With Mortgage |
| Less than 2.0x | 43 (14.4%) | 126,250 (33,847.2%) |
| 2.0x to 2.9x | 53 (17.7%) | 143 (38.3%) |
| 3.0x to 3.9x | 33 (11.0%) | 95 (25.5%) |
| 4.0x or more | 134 (44.8%) | 100 (26.8%) |
| Total | 299 (100.0%) | 373 (100.0%) |
Real Estate Taxes by Mortgage Status in Old Orchard
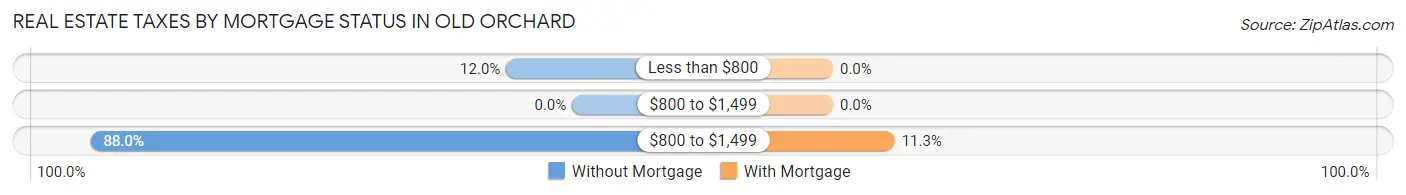
| Property Taxes | Without Mortgage | With Mortgage |
| Less than $800 | 36 (12.0%) | 0 (0.0%) |
| $800 to $1,499 | 0 (0.0%) | 0 (0.0%) |
| $800 to $1,499 | 263 (88.0%) | 42 (11.3%) |
| Total | 299 (100.0%) | 373 (100.0%) |
Health & Disability in Old Orchard
Health Insurance Coverage by Age in Old Orchard
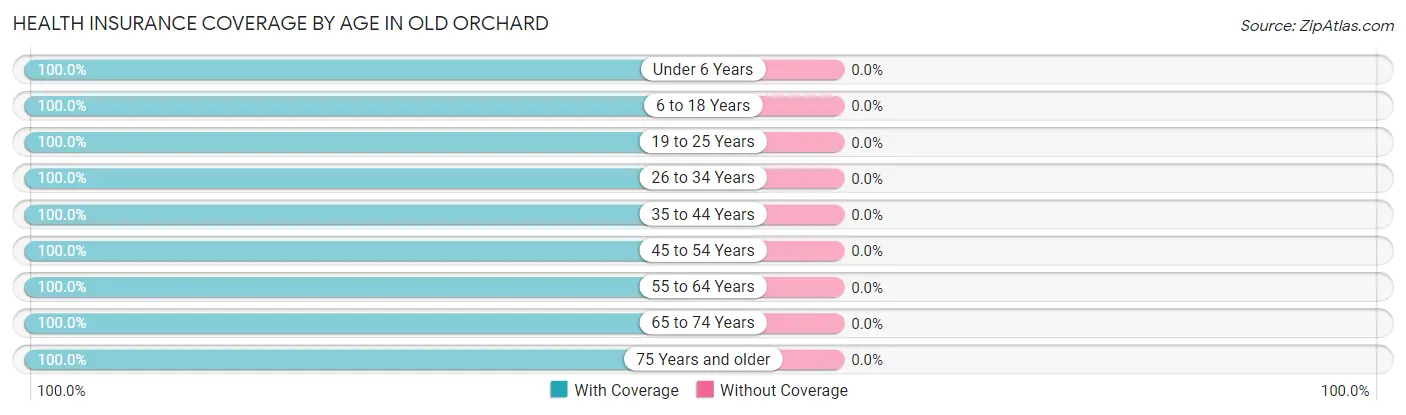
| Age Bracket | With Coverage | Without Coverage |
| Under 6 Years | 203 (100.0%) | 0 (0.0%) |
| 6 to 18 Years | 170 (100.0%) | 0 (0.0%) |
| 19 to 25 Years | 61 (100.0%) | 0 (0.0%) |
| 26 to 34 Years | 67 (100.0%) | 0 (0.0%) |
| 35 to 44 Years | 274 (100.0%) | 0 (0.0%) |
| 45 to 54 Years | 176 (100.0%) | 0 (0.0%) |
| 55 to 64 Years | 259 (100.0%) | 0 (0.0%) |
| 65 to 74 Years | 406 (100.0%) | 0 (0.0%) |
| 75 Years and older | 210 (100.0%) | 0 (0.0%) |
| Total | 1,826 (100.0%) | 0 (0.0%) |
Health Insurance Coverage by Citizenship Status in Old Orchard
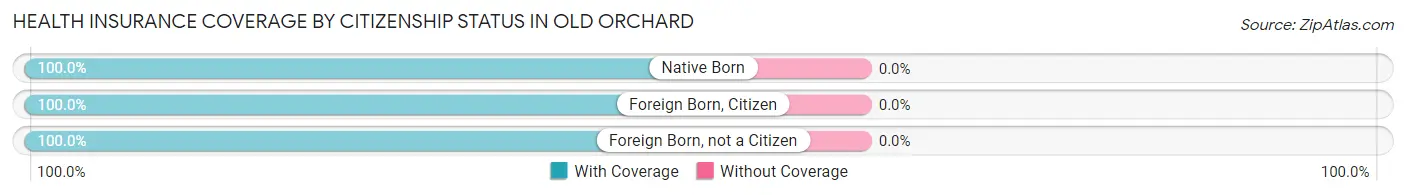
| Citizenship Status | With Coverage | Without Coverage |
| Native Born | 203 (100.0%) | 0 (0.0%) |
| Foreign Born, Citizen | 170 (100.0%) | 0 (0.0%) |
| Foreign Born, not a Citizen | 61 (100.0%) | 0 (0.0%) |
Health Insurance Coverage by Household Income in Old Orchard
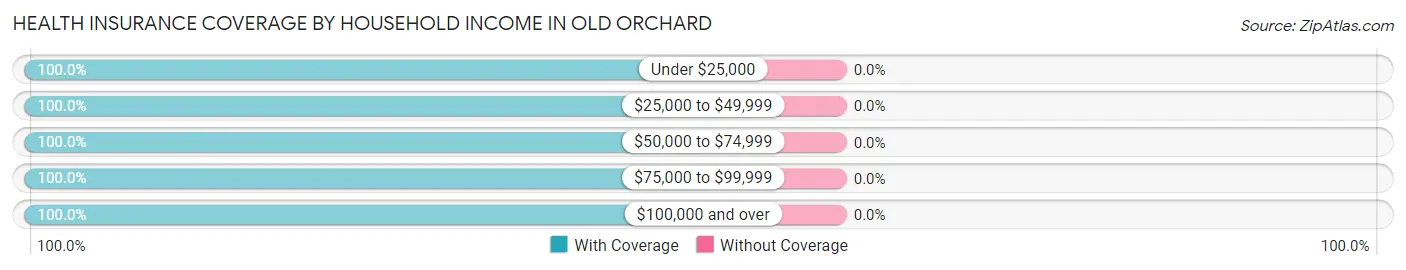
| Household Income | With Coverage | Without Coverage |
| Under $25,000 | 64 (100.0%) | 0 (0.0%) |
| $25,000 to $49,999 | 74 (100.0%) | 0 (0.0%) |
| $50,000 to $74,999 | 270 (100.0%) | 0 (0.0%) |
| $75,000 to $99,999 | 166 (100.0%) | 0 (0.0%) |
| $100,000 and over | 1,252 (100.0%) | 0 (0.0%) |
Public vs Private Health Insurance Coverage by Age in Old Orchard
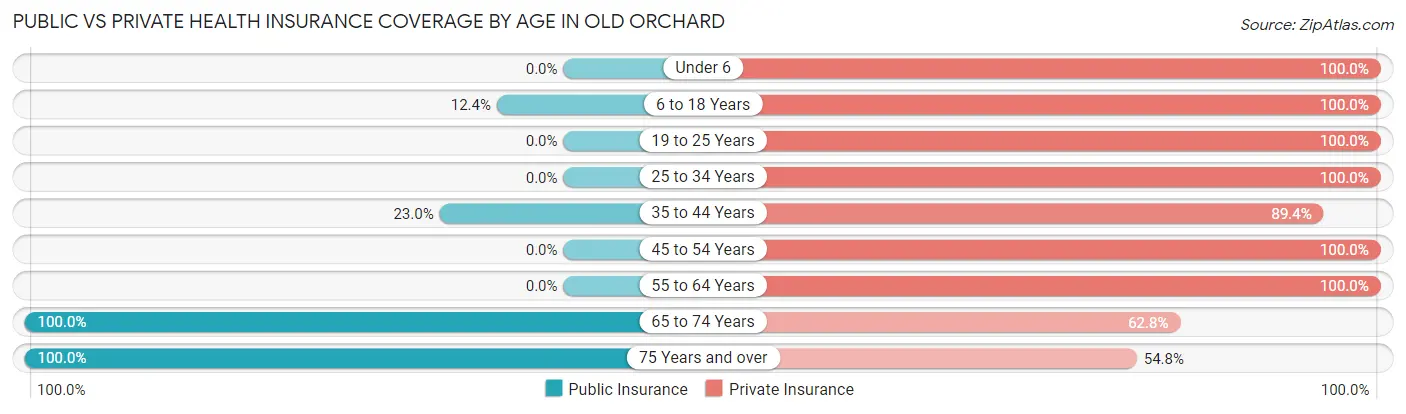
| Age Bracket | Public Insurance | Private Insurance |
| Under 6 | 0 (0.0%) | 203 (100.0%) |
| 6 to 18 Years | 21 (12.3%) | 170 (100.0%) |
| 19 to 25 Years | 0 (0.0%) | 61 (100.0%) |
| 25 to 34 Years | 0 (0.0%) | 67 (100.0%) |
| 35 to 44 Years | 63 (23.0%) | 245 (89.4%) |
| 45 to 54 Years | 0 (0.0%) | 176 (100.0%) |
| 55 to 64 Years | 0 (0.0%) | 259 (100.0%) |
| 65 to 74 Years | 406 (100.0%) | 255 (62.8%) |
| 75 Years and over | 210 (100.0%) | 115 (54.8%) |
| Total | 700 (38.3%) | 1,551 (84.9%) |
Disability Status by Sex by Age in Old Orchard
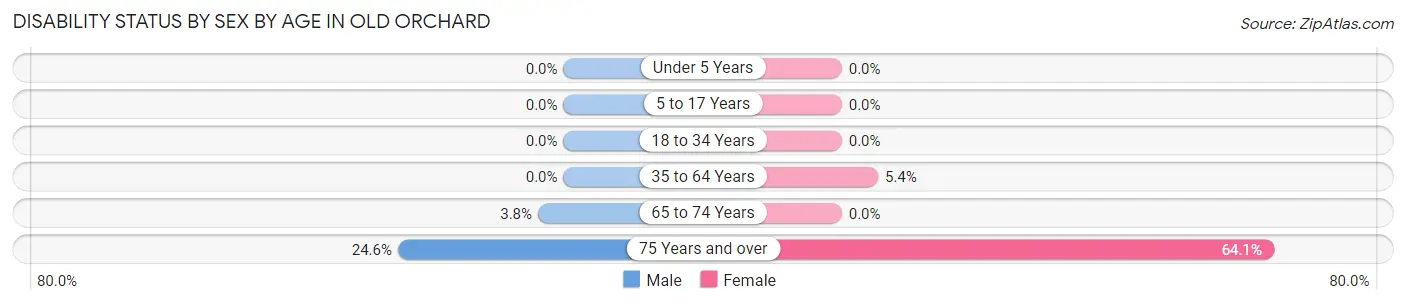
| Age Bracket | Male | Female |
| Under 5 Years | 0 (0.0%) | 0 (0.0%) |
| 5 to 17 Years | 0 (0.0%) | 0 (0.0%) |
| 18 to 34 Years | 0 (0.0%) | 0 (0.0%) |
| 35 to 64 Years | 0 (0.0%) | 17 (5.4%) |
| 65 to 74 Years | 7 (3.8%) | 0 (0.0%) |
| 75 Years and over | 29 (24.6%) | 59 (64.1%) |
Disability Class by Sex by Age in Old Orchard
Disability Class: Hearing Difficulty
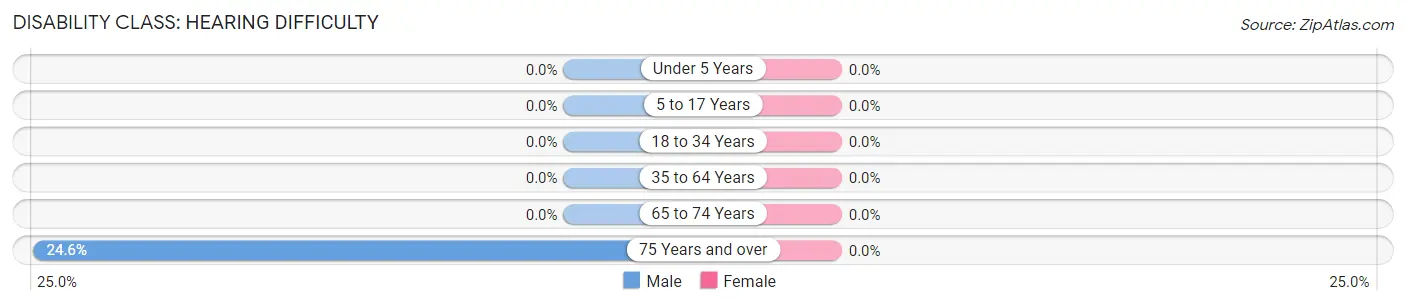
| Age Bracket | Male | Female |
| Under 5 Years | 0 (0.0%) | 0 (0.0%) |
| 5 to 17 Years | 0 (0.0%) | 0 (0.0%) |
| 18 to 34 Years | 0 (0.0%) | 0 (0.0%) |
| 35 to 64 Years | 0 (0.0%) | 0 (0.0%) |
| 65 to 74 Years | 0 (0.0%) | 0 (0.0%) |
| 75 Years and over | 29 (24.6%) | 0 (0.0%) |
Disability Class: Vision Difficulty
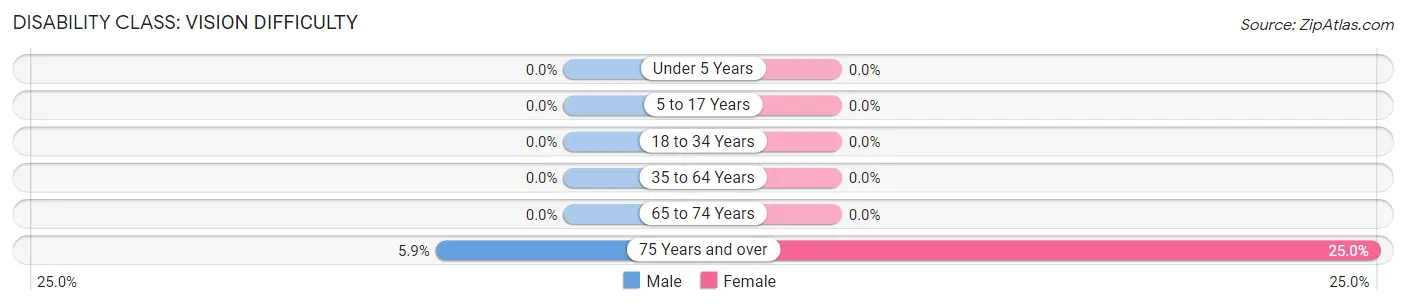
| Age Bracket | Male | Female |
| Under 5 Years | 0 (0.0%) | 0 (0.0%) |
| 5 to 17 Years | 0 (0.0%) | 0 (0.0%) |
| 18 to 34 Years | 0 (0.0%) | 0 (0.0%) |
| 35 to 64 Years | 0 (0.0%) | 0 (0.0%) |
| 65 to 74 Years | 0 (0.0%) | 0 (0.0%) |
| 75 Years and over | 7 (5.9%) | 23 (25.0%) |
Disability Class: Cognitive Difficulty
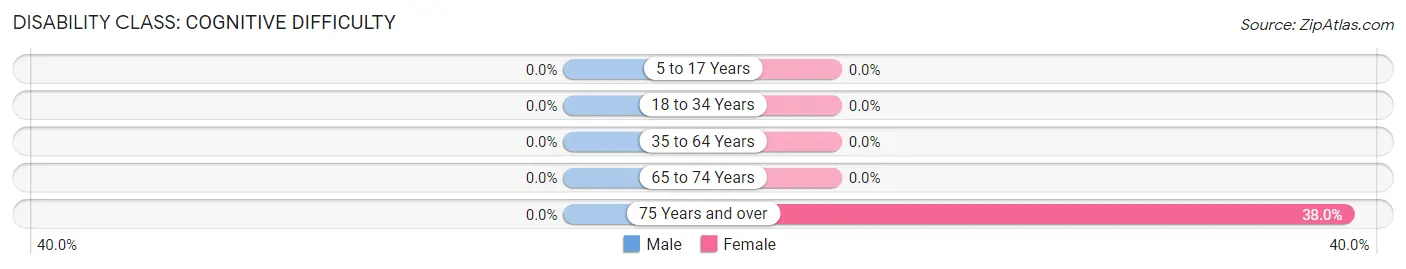
| Age Bracket | Male | Female |
| 5 to 17 Years | 0 (0.0%) | 0 (0.0%) |
| 18 to 34 Years | 0 (0.0%) | 0 (0.0%) |
| 35 to 64 Years | 0 (0.0%) | 0 (0.0%) |
| 65 to 74 Years | 0 (0.0%) | 0 (0.0%) |
| 75 Years and over | 0 (0.0%) | 35 (38.0%) |
Disability Class: Ambulatory Difficulty
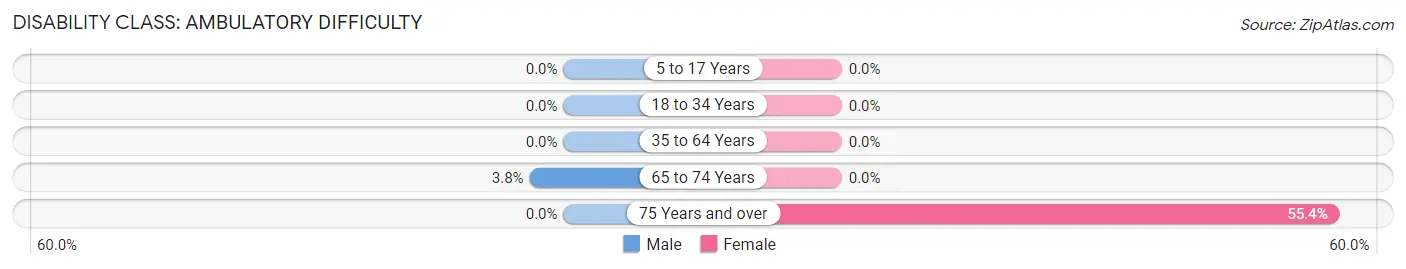
| Age Bracket | Male | Female |
| 5 to 17 Years | 0 (0.0%) | 0 (0.0%) |
| 18 to 34 Years | 0 (0.0%) | 0 (0.0%) |
| 35 to 64 Years | 0 (0.0%) | 0 (0.0%) |
| 65 to 74 Years | 7 (3.8%) | 0 (0.0%) |
| 75 Years and over | 0 (0.0%) | 51 (55.4%) |
Disability Class: Self-Care Difficulty
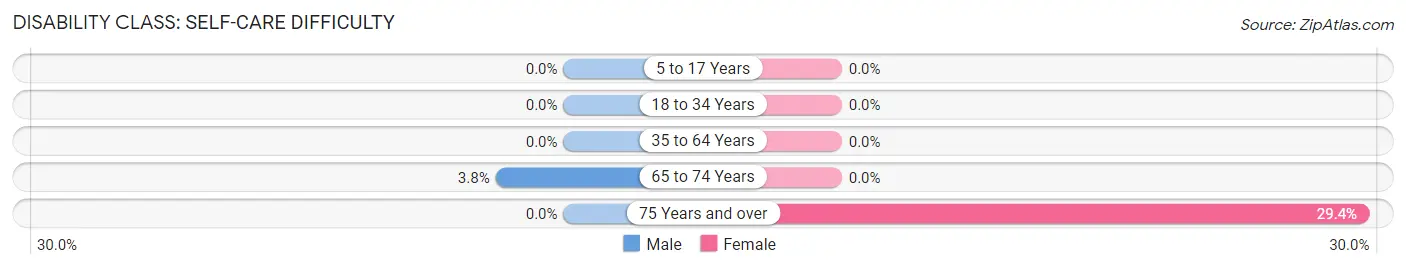
| Age Bracket | Male | Female |
| 5 to 17 Years | 0 (0.0%) | 0 (0.0%) |
| 18 to 34 Years | 0 (0.0%) | 0 (0.0%) |
| 35 to 64 Years | 0 (0.0%) | 0 (0.0%) |
| 65 to 74 Years | 7 (3.8%) | 0 (0.0%) |
| 75 Years and over | 0 (0.0%) | 27 (29.3%) |
Technology Access in Old Orchard
Computing Device Access in Old Orchard
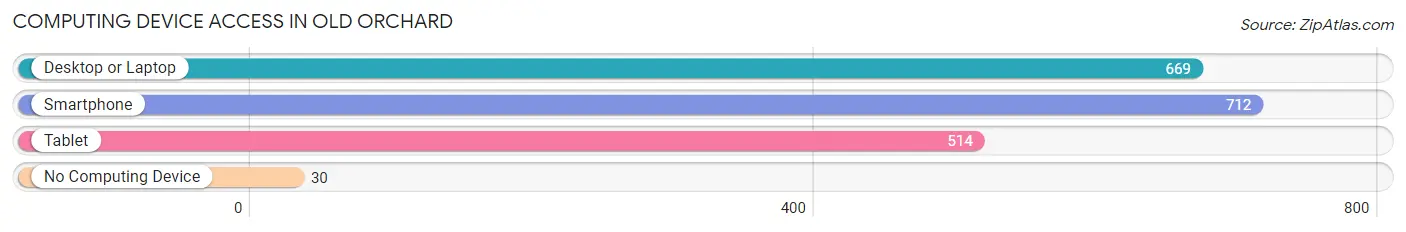
| Device Type | # Households | % Households |
| Desktop or Laptop | 669 | 87.9% |
| Smartphone | 712 | 93.6% |
| Tablet | 514 | 67.5% |
| No Computing Device | 30 | 3.9% |
| Total | 761 | 100.0% |
Internet Access in Old Orchard
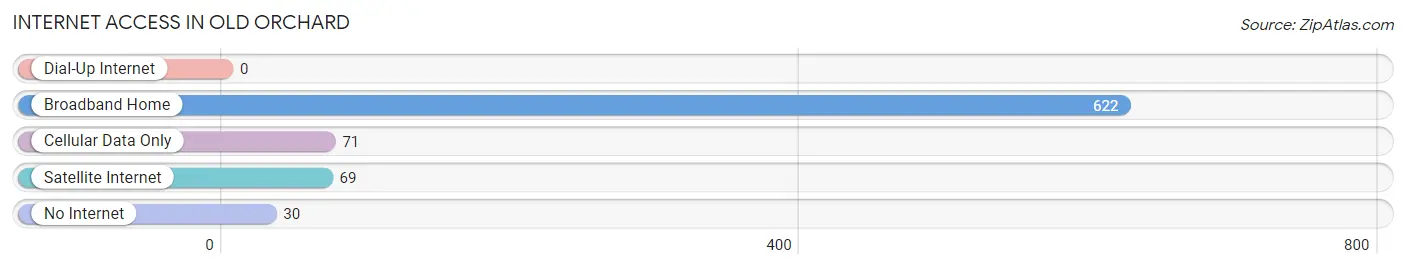
| Internet Type | # Households | % Households |
| Dial-Up Internet | 0 | 0.0% |
| Broadband Home | 622 | 81.7% |
| Cellular Data Only | 71 | 9.3% |
| Satellite Internet | 69 | 9.1% |
| No Internet | 30 | 3.9% |
| Total | 761 | 100.0% |
Old Orchard Summary
Old Orchard is a small borough located in Allegheny County, Pennsylvania. It is situated in the southwestern corner of the county, just north of the city of Pittsburgh. The borough was incorporated in 1891 and has a population of approximately 1,400 people.
Geography
Old Orchard is located in the southwestern corner of Allegheny County, Pennsylvania. It is situated on the banks of the Allegheny River, just north of the city of Pittsburgh. The borough is bordered by the boroughs of Etna and Millvale to the north, the city of Pittsburgh to the south, and the boroughs of Sharpsburg and Aspinwall to the east. The borough covers an area of 0.6 square miles and is located at an elevation of 890 feet above sea level.
The terrain of Old Orchard is mostly flat, with some rolling hills in the northern part of the borough. The borough is located in the Allegheny Plateau region of Pennsylvania, and is part of the Allegheny River watershed. The borough is home to several small creeks, including Mill Creek, which flows through the borough from the north to the south.
Economy
Old Orchard is a small, rural borough with a limited economy. The borough is home to several small businesses, including a few restaurants, a grocery store, and a few retail stores. The borough also has a few industrial businesses, including a steel mill and a manufacturing plant.
The borough is also home to a few small farms, which produce a variety of crops, including corn, soybeans, and hay. The borough is also home to a few small wineries, which produce a variety of wines.
Demographics
As of the 2010 census, Old Orchard had a population of 1,400 people. The racial makeup of the borough was 97.3% White, 0.9% African American, 0.3% Native American, 0.3% Asian, and 0.9% from two or more races. Hispanic or Latino of any race were 0.7% of the population.
The median household income in Old Orchard was $41,250, and the median family income was $50,000. The per capita income for the borough was $20,945. About 8.3% of families and 10.3% of the population were below the poverty line, including 14.3% of those under age 18 and 6.3% of those age 65 or over.
Conclusion
Old Orchard is a small borough located in Allegheny County, Pennsylvania. It is situated on the banks of the Allegheny River, just north of the city of Pittsburgh. The borough was incorporated in 1891 and has a population of approximately 1,400 people. The borough is mostly flat, with some rolling hills in the northern part of the borough. The economy of Old Orchard is limited, with a few small businesses, industrial businesses, and farms. The racial makeup of the borough is mostly White, with a small percentage of African American, Native American, Asian, and other races. The median household income in Old Orchard is $41,250, and the median family income is $50,000.
Common Questions
What is Per Capita Income in Old Orchard?
Per Capita income in Old Orchard is $56,023.
What is the Median Family Income in Old Orchard?
Median Family Income in Old Orchard is $125,272.
What is the Median Household income in Old Orchard?
Median Household Income in Old Orchard is $106,172.
What is Income or Wage Gap in Old Orchard?
Income or Wage Gap in Old Orchard is 13.2%.
Women in Old Orchard earn 86.8 cents for every dollar earned by a man.
What is Inequality or Gini Index in Old Orchard?
Inequality or Gini Index in Old Orchard is 0.40.
What is the Total Population of Old Orchard?
Total Population of Old Orchard is 1,826.
What is the Total Male Population of Old Orchard?
Total Male Population of Old Orchard is 1,005.
What is the Total Female Population of Old Orchard?
Total Female Population of Old Orchard is 821.
What is the Ratio of Males per 100 Females in Old Orchard?
There are 122.41 Males per 100 Females in Old Orchard.
What is the Ratio of Females per 100 Males in Old Orchard?
There are 81.69 Females per 100 Males in Old Orchard.
What is the Median Population Age in Old Orchard?
Median Population Age in Old Orchard is 53.3 Years.
What is the Average Family Size in Old Orchard
Average Family Size in Old Orchard is 2.9 People.
What is the Average Household Size in Old Orchard
Average Household Size in Old Orchard is 2.4 People.
How Large is the Labor Force in Old Orchard?
There are 854 People in the Labor Forcein in Old Orchard.
What is the Percentage of People in the Labor Force in Old Orchard?
58.4% of People are in the Labor Force in Old Orchard.
What is the Unemployment Rate in Old Orchard?
Unemployment Rate in Old Orchard is 4.1%.