Deersville, OH Map & Demographics
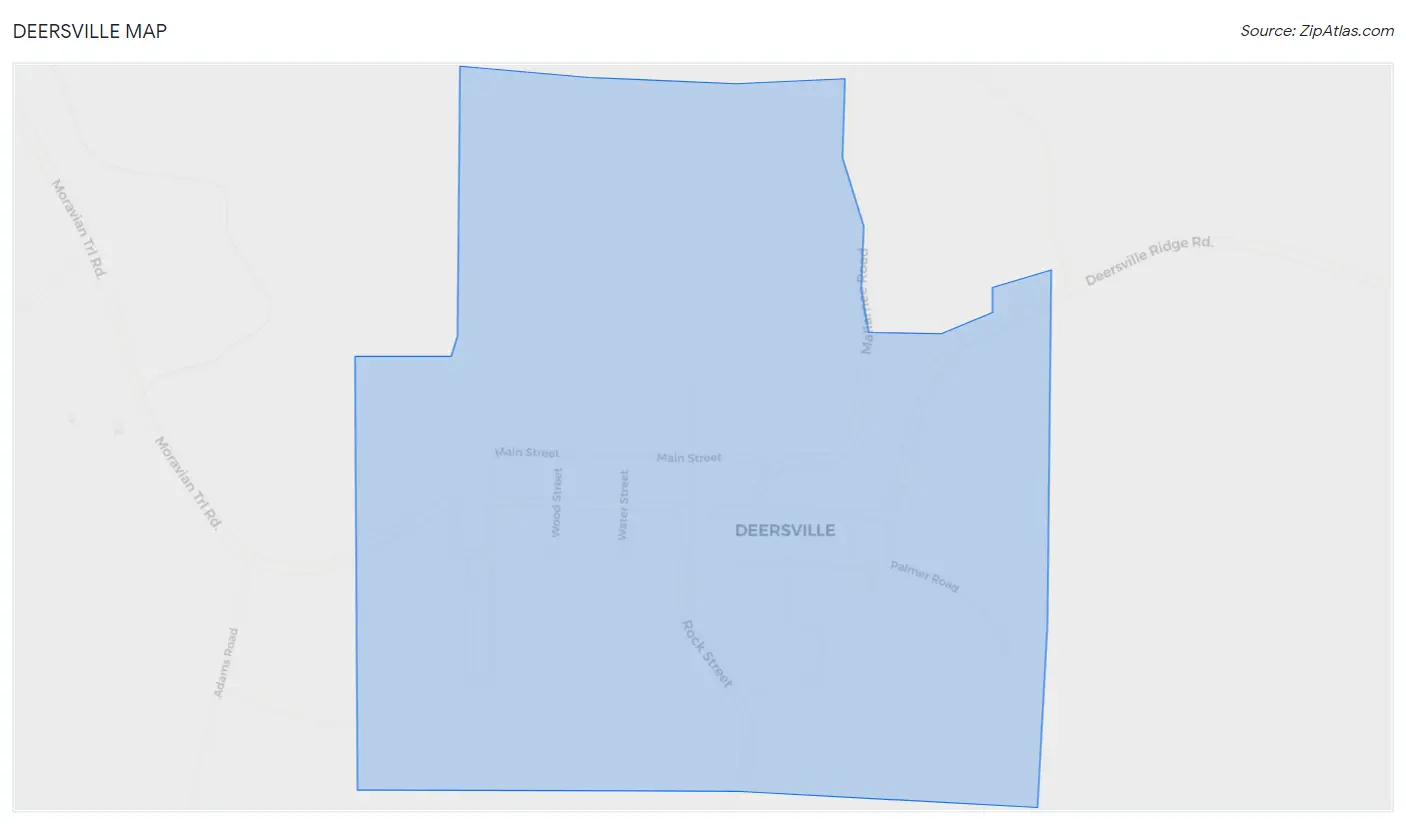
Deersville Map
Deersville Overview
$36,319
PER CAPITA INCOME
$106,042
AVG FAMILY INCOME
$96,250
AVG HOUSEHOLD INCOME
68.1%
WAGE / INCOME GAP [ % ]
31.9¢/ $1
WAGE / INCOME GAP [ $ ]
0.11
INEQUALITY / GINI INDEX
42
TOTAL POPULATION
17
MALE POPULATION
25
FEMALE POPULATION
68.00
MALES / 100 FEMALES
147.06
FEMALES / 100 MALES
34.8
MEDIAN AGE
3.8
AVG FAMILY SIZE
3.0
AVG HOUSEHOLD SIZE
27
LABOR FORCE [ PEOPLE ]
75.0%
PERCENT IN LABOR FORCE
Deersville Zip Codes
Deersville Area Codes
Income in Deersville
Income Overview in Deersville
Per Capita Income in Deersville is $36,319, while median incomes of families and households are $106,042 and $96,250 respectively.
| Characteristic | Number | Measure |
| Per Capita Income | 42 | $36,319 |
| Median Family Income | 9 | $106,042 |
| Mean Family Income | 9 | $107,978 |
| Median Household Income | 14 | $96,250 |
| Mean Household Income | 14 | $99,586 |
| Income Deficit | 9 | $0 |
| Wage / Income Gap (%) | 42 | 68.09% |
| Wage / Income Gap ($) | 42 | 31.91¢ per $1 |
| Gini / Inequality Index | 42 | 0.11 |
Earnings by Sex in Deersville
Average Earnings in Deersville are $50,625, $58,750 for men and $18,750 for women, a difference of 68.1%.
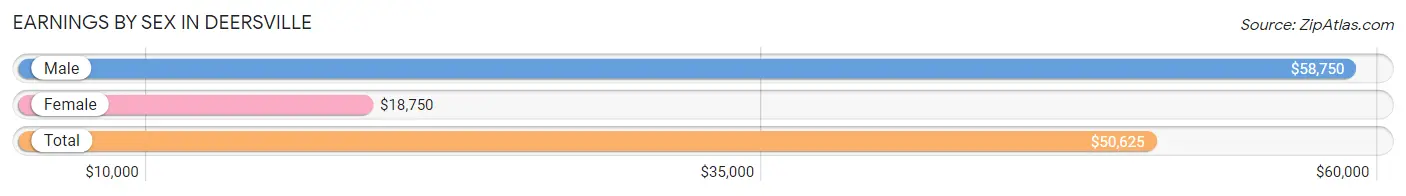
| Sex | Number | Average Earnings |
| Male | 16 (57.1%) | $58,750 |
| Female | 12 (42.9%) | $18,750 |
| Total | 28 (100.0%) | $50,625 |
Earnings by Sex by Income Bracket in Deersville
The most common earnings brackets in Deersville are $50,000 to $54,999 for men (8 | 50.0%) and $20,000 to $22,499 for women (6 | 50.0%).
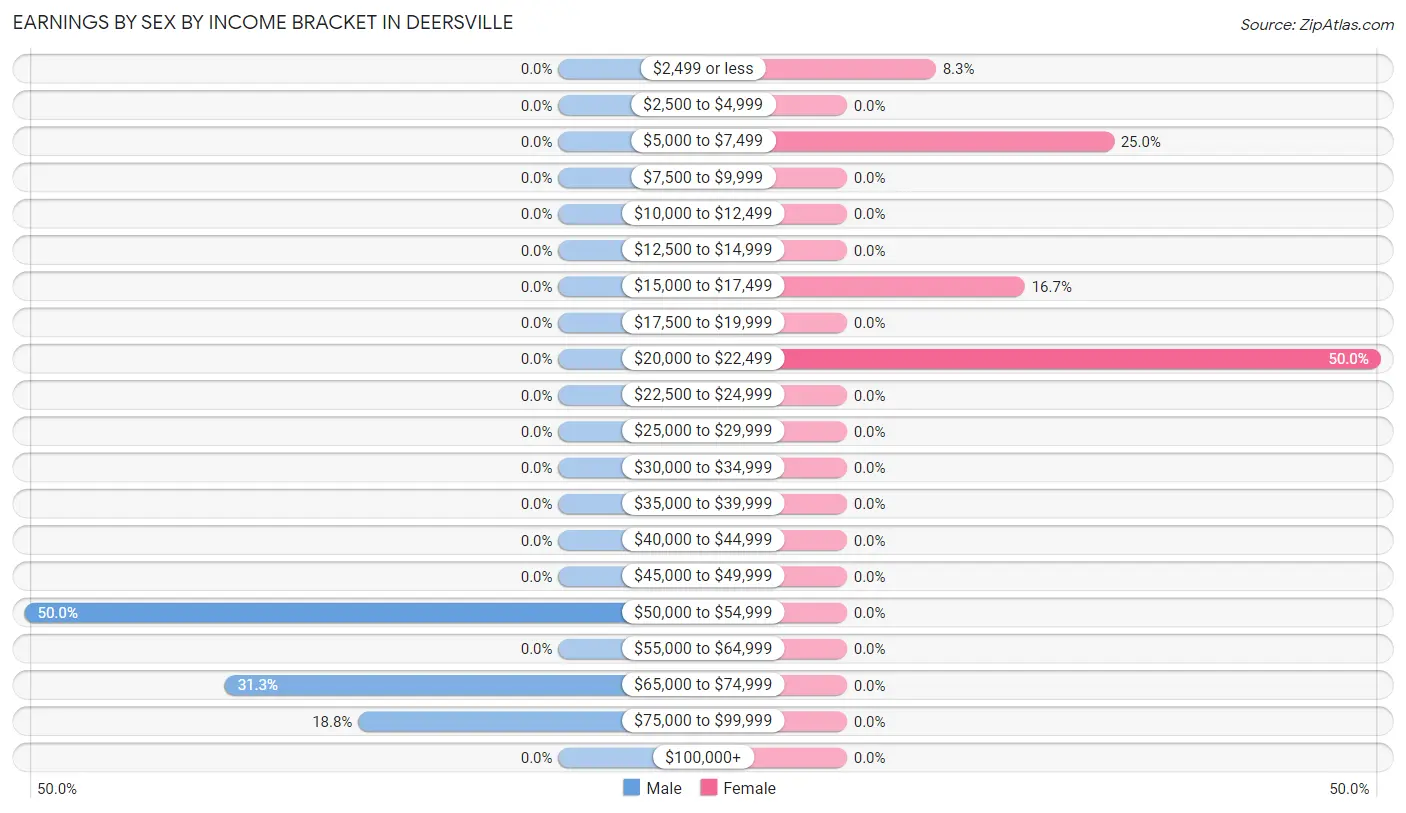
| Income | Male | Female |
| $2,499 or less | 0 (0.0%) | 1 (8.3%) |
| $2,500 to $4,999 | 0 (0.0%) | 0 (0.0%) |
| $5,000 to $7,499 | 0 (0.0%) | 3 (25.0%) |
| $7,500 to $9,999 | 0 (0.0%) | 0 (0.0%) |
| $10,000 to $12,499 | 0 (0.0%) | 0 (0.0%) |
| $12,500 to $14,999 | 0 (0.0%) | 0 (0.0%) |
| $15,000 to $17,499 | 0 (0.0%) | 2 (16.7%) |
| $17,500 to $19,999 | 0 (0.0%) | 0 (0.0%) |
| $20,000 to $22,499 | 0 (0.0%) | 6 (50.0%) |
| $22,500 to $24,999 | 0 (0.0%) | 0 (0.0%) |
| $25,000 to $29,999 | 0 (0.0%) | 0 (0.0%) |
| $30,000 to $34,999 | 0 (0.0%) | 0 (0.0%) |
| $35,000 to $39,999 | 0 (0.0%) | 0 (0.0%) |
| $40,000 to $44,999 | 0 (0.0%) | 0 (0.0%) |
| $45,000 to $49,999 | 0 (0.0%) | 0 (0.0%) |
| $50,000 to $54,999 | 8 (50.0%) | 0 (0.0%) |
| $55,000 to $64,999 | 0 (0.0%) | 0 (0.0%) |
| $65,000 to $74,999 | 5 (31.2%) | 0 (0.0%) |
| $75,000 to $99,999 | 3 (18.8%) | 0 (0.0%) |
| $100,000+ | 0 (0.0%) | 0 (0.0%) |
| Total | 16 (100.0%) | 12 (100.0%) |
Earnings by Sex by Educational Attainment in Deersville
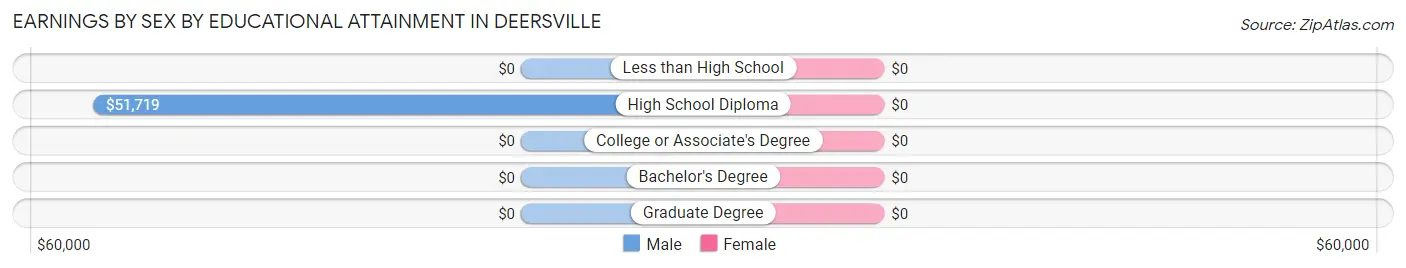
| Educational Attainment | Male Income | Female Income |
| Less than High School | - | - |
| High School Diploma | $51,719 | $0 |
| College or Associate's Degree | - | - |
| Bachelor's Degree | - | - |
| Graduate Degree | - | - |
| Total | $51,719 | $20,625 |
Family Income in Deersville
Family Income Brackets in Deersville
According to the Deersville family income data, there are 6 families falling into the $100,000 to $149,999 income range, which is the most common income bracket and makes up 66.7% of all families.
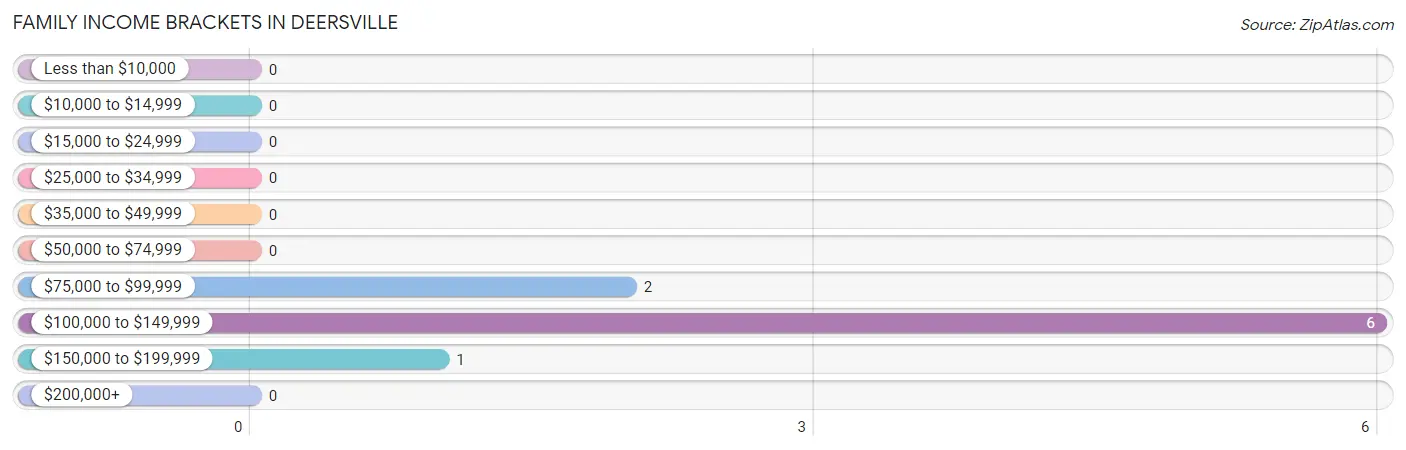
| Income Bracket | # Families | % Families |
| Less than $10,000 | 0 | 0.0% |
| $10,000 to $14,999 | 0 | 0.0% |
| $15,000 to $24,999 | 0 | 0.0% |
| $25,000 to $34,999 | 0 | 0.0% |
| $35,000 to $49,999 | 0 | 0.0% |
| $50,000 to $74,999 | 0 | 0.0% |
| $75,000 to $99,999 | 2 | 22.2% |
| $100,000 to $149,999 | 6 | 66.7% |
| $150,000 to $199,999 | 1 | 11.1% |
| $200,000+ | 0 | 0.0% |
Family Income by Famaliy Size in Deersville
| Income Bracket | # Families | Median Income |
| 2-Person Families | 3 (33.3%) | $0 |
| 3-Person Families | 0 (0.0%) | $0 |
| 4-Person Families | 6 (66.7%) | $0 |
| 5-Person Families | 0 (0.0%) | $0 |
| 6-Person Families | 0 (0.0%) | $0 |
| 7+ Person Families | 0 (0.0%) | $0 |
| Total | 9 (100.0%) | $106,042 |
Family Income by Number of Earners in Deersville
| Number of Earners | # Families | Median Income |
| No Earners | 1 (11.1%) | $0 |
| 1 Earner | 2 (22.2%) | $0 |
| 2 Earners | 5 (55.6%) | $0 |
| 3+ Earners | 1 (11.1%) | $0 |
| Total | 9 (100.0%) | $106,042 |
Household Income in Deersville
Household Income Brackets in Deersville
With 7 households falling in the category, the $75,000 to $99,999 income range is the most frequent in Deersville, accounting for 50.0% of all households.
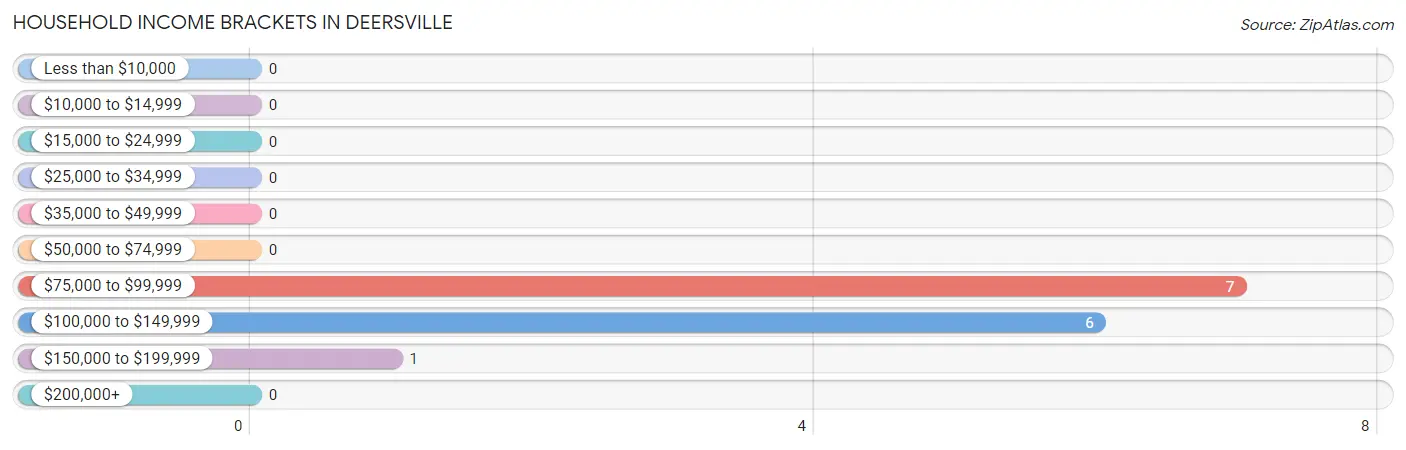
| Income Bracket | # Households | % Households |
| Less than $10,000 | 0 | 0.0% |
| $10,000 to $14,999 | 0 | 0.0% |
| $15,000 to $24,999 | 0 | 0.0% |
| $25,000 to $34,999 | 0 | 0.0% |
| $35,000 to $49,999 | 0 | 0.0% |
| $50,000 to $74,999 | 0 | 0.0% |
| $75,000 to $99,999 | 7 | 50.0% |
| $100,000 to $149,999 | 6 | 42.9% |
| $150,000 to $199,999 | 1 | 7.1% |
| $200,000+ | 0 | 0.0% |
Household Income by Householder Age in Deersville
| Income Bracket | # Households | Median Income |
| 15 to 24 Years | 5 (35.7%) | $0 |
| 25 to 44 Years | 0 (0.0%) | $0 |
| 45 to 64 Years | 3 (21.4%) | $0 |
| 65+ Years | 6 (42.9%) | $0 |
| Total | 14 (100.0%) | $96,250 |
Poverty in Deersville
Income Below Poverty by Sex and Age in Deersville
| Age Bracket | Male | Female |
| Under 5 Years | 0 (0.0%) | 0 (0.0%) |
| 5 Years | 0 (0.0%) | 0 (0.0%) |
| 6 to 11 Years | 0 (0.0%) | 0 (0.0%) |
| 12 to 14 Years | 0 (0.0%) | 0 (0.0%) |
| 15 Years | 0 (0.0%) | 0 (0.0%) |
| 16 and 17 Years | 0 (0.0%) | 0 (0.0%) |
| 18 to 24 Years | 0 (0.0%) | 3 (100.0%) |
| 25 to 34 Years | 0 (0.0%) | 0 (0.0%) |
| 35 to 44 Years | 0 (0.0%) | 0 (0.0%) |
| 45 to 54 Years | 0 (0.0%) | 0 (0.0%) |
| 55 to 64 Years | 0 (0.0%) | 0 (0.0%) |
| 65 to 74 Years | 0 (0.0%) | 0 (0.0%) |
| 75 Years and over | 0 (0.0%) | 0 (0.0%) |
| Total | 0 (0.0%) | 3 (12.0%) |
Income Above Poverty by Sex and Age in Deersville
According to the poverty statistics in Deersville, males aged 18 to 24 years and females aged 6 to 11 years are the age groups that are most secure financially, with 100.0% of males and 100.0% of females in these age groups living above the poverty line.
| Age Bracket | Male | Female |
| Under 5 Years | 0 (0.0%) | 0 (0.0%) |
| 5 Years | 0 (0.0%) | 0 (0.0%) |
| 6 to 11 Years | 0 (0.0%) | 6 (100.0%) |
| 12 to 14 Years | 0 (0.0%) | 0 (0.0%) |
| 15 Years | 0 (0.0%) | 0 (0.0%) |
| 16 and 17 Years | 0 (0.0%) | 0 (0.0%) |
| 18 to 24 Years | 5 (100.0%) | 0 (0.0%) |
| 25 to 34 Years | 0 (0.0%) | 8 (100.0%) |
| 35 to 44 Years | 3 (100.0%) | 0 (0.0%) |
| 45 to 54 Years | 0 (0.0%) | 0 (0.0%) |
| 55 to 64 Years | 3 (100.0%) | 5 (100.0%) |
| 65 to 74 Years | 6 (100.0%) | 3 (100.0%) |
| 75 Years and over | 0 (0.0%) | 0 (0.0%) |
| Total | 17 (100.0%) | 22 (88.0%) |
Income Below Poverty Among Married-Couple Families in Deersville
| Children | Above Poverty | Below Poverty |
| No Children | 4 (100.0%) | 0 (0.0%) |
| 1 or 2 Children | 5 (100.0%) | 0 (0.0%) |
| 3 or 4 Children | 0 (0.0%) | 0 (0.0%) |
| 5 or more Children | 0 (0.0%) | 0 (0.0%) |
| Total | 9 (100.0%) | 0 (0.0%) |
Income Below Poverty Among Single-Parent Households in Deersville
| Children | Single Father | Single Mother |
| No Children | 0 (0.0%) | 0 (0.0%) |
| 1 or 2 Children | 0 (0.0%) | 0 (0.0%) |
| 3 or 4 Children | 0 (0.0%) | 0 (0.0%) |
| 5 or more Children | 0 (0.0%) | 0 (0.0%) |
| Total | 0 (0.0%) | 0 (0.0%) |
Income Below Poverty Among Married-Couple vs Single-Parent Households in Deersville
| Children | Married-Couple Families | Single-Parent Households |
| No Children | 0 (0.0%) | 0 (0.0%) |
| 1 or 2 Children | 0 (0.0%) | 0 (0.0%) |
| 3 or 4 Children | 0 (0.0%) | 0 (0.0%) |
| 5 or more Children | 0 (0.0%) | 0 (0.0%) |
| Total | 0 (0.0%) | 0 (0.0%) |
Race in Deersville
The most populous races in Deersville are , and White / Caucasian (42 | 100.0%).
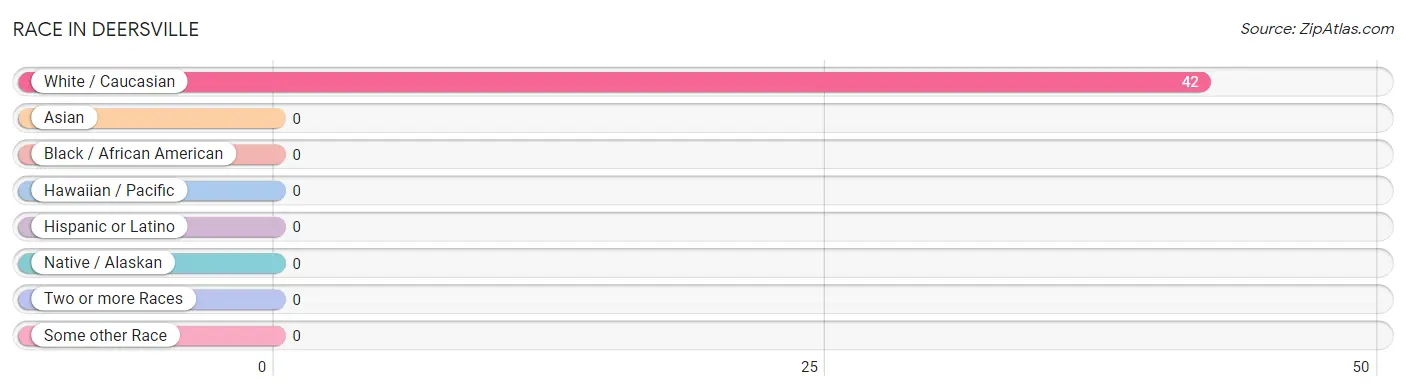
| Race | # Population | % Population |
| Asian | 0 | 0.0% |
| Black / African American | 0 | 0.0% |
| Hawaiian / Pacific | 0 | 0.0% |
| Hispanic or Latino | 0 | 0.0% |
| Native / Alaskan | 0 | 0.0% |
| White / Caucasian | 42 | 100.0% |
| Two or more Races | 0 | 0.0% |
| Some other Race | 0 | 0.0% |
| Total | 42 | 100.0% |
Ancestry in Deersville
The most populous ancestries reported in Deersville are English (9 | 21.4%), German (7 | 16.7%), Czech (3 | 7.1%), Hungarian (3 | 7.1%), and Italian (3 | 7.1%), together accounting for 59.5% of all Deersville residents.
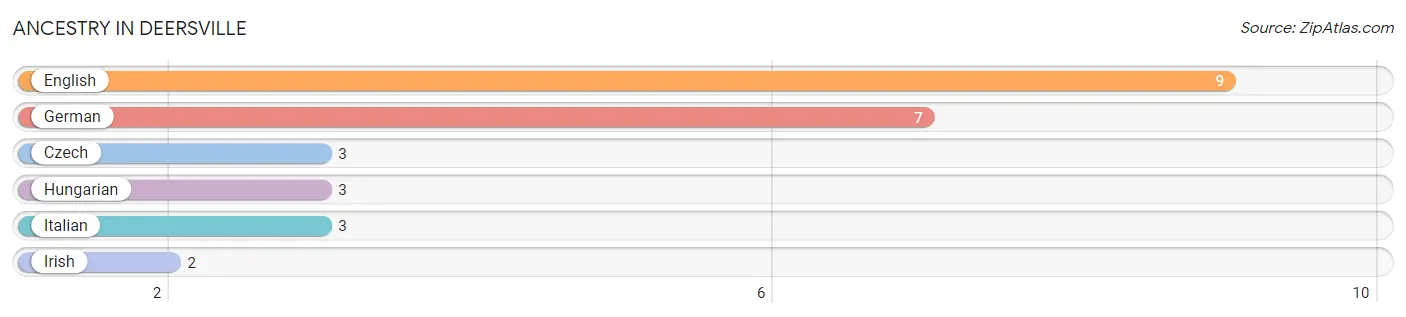
| Ancestry | # Population | % Population |
| Czech | 3 | 7.1% |
| English | 9 | 21.4% |
| German | 7 | 16.7% |
| Hungarian | 3 | 7.1% |
| Irish | 2 | 4.8% |
| Italian | 3 | 7.1% | View All 6 Rows |
Immigrants in Deersville

| Immigration Origin | # Population | % Population | View All 0 Rows |
Sex and Age in Deersville
Sex and Age in Deersville
The most populous age groups in Deersville are 65 to 69 Years (6 | 35.3%) for men and 5 to 9 Years (6 | 24.0%) for women.
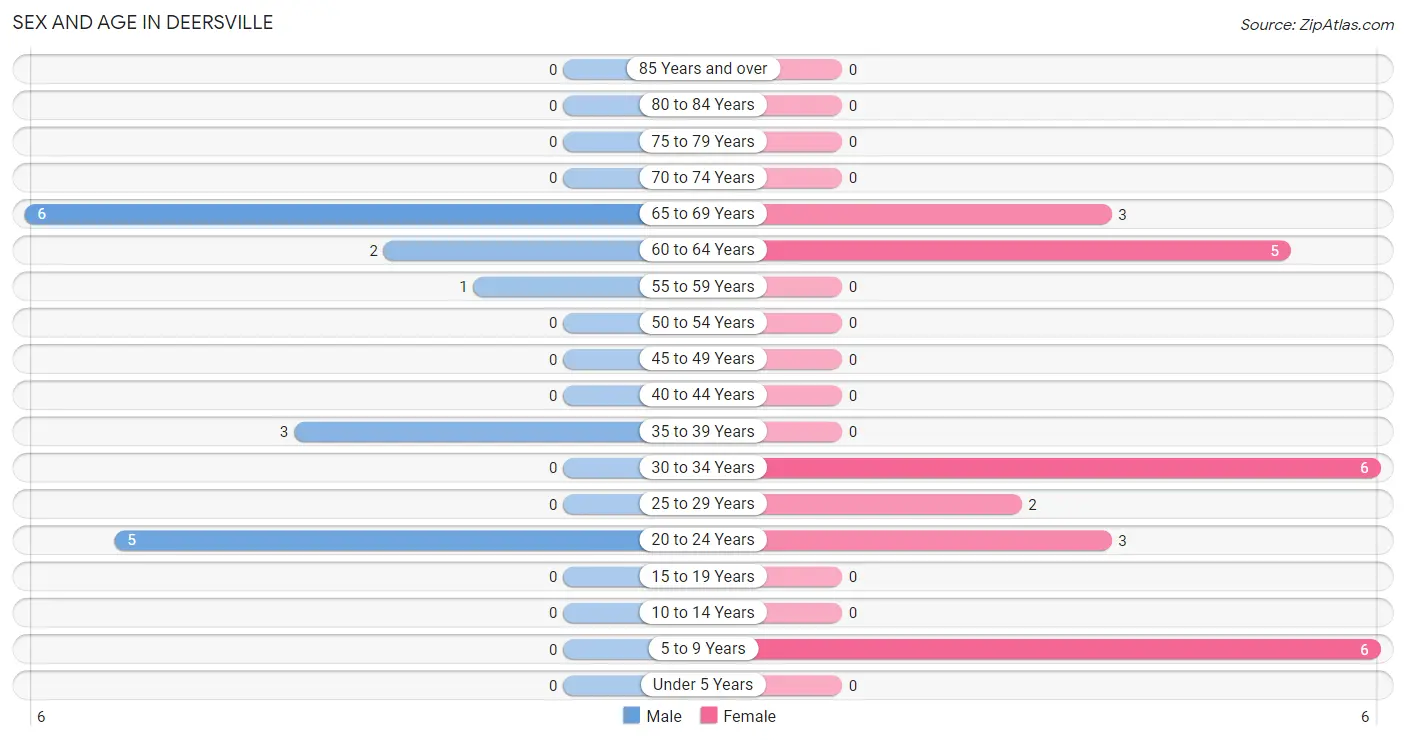
| Age Bracket | Male | Female |
| Under 5 Years | 0 (0.0%) | 0 (0.0%) |
| 5 to 9 Years | 0 (0.0%) | 6 (24.0%) |
| 10 to 14 Years | 0 (0.0%) | 0 (0.0%) |
| 15 to 19 Years | 0 (0.0%) | 0 (0.0%) |
| 20 to 24 Years | 5 (29.4%) | 3 (12.0%) |
| 25 to 29 Years | 0 (0.0%) | 2 (8.0%) |
| 30 to 34 Years | 0 (0.0%) | 6 (24.0%) |
| 35 to 39 Years | 3 (17.6%) | 0 (0.0%) |
| 40 to 44 Years | 0 (0.0%) | 0 (0.0%) |
| 45 to 49 Years | 0 (0.0%) | 0 (0.0%) |
| 50 to 54 Years | 0 (0.0%) | 0 (0.0%) |
| 55 to 59 Years | 1 (5.9%) | 0 (0.0%) |
| 60 to 64 Years | 2 (11.8%) | 5 (20.0%) |
| 65 to 69 Years | 6 (35.3%) | 3 (12.0%) |
| 70 to 74 Years | 0 (0.0%) | 0 (0.0%) |
| 75 to 79 Years | 0 (0.0%) | 0 (0.0%) |
| 80 to 84 Years | 0 (0.0%) | 0 (0.0%) |
| 85 Years and over | 0 (0.0%) | 0 (0.0%) |
| Total | 17 (100.0%) | 25 (100.0%) |
Families and Households in Deersville
Median Family Size in Deersville
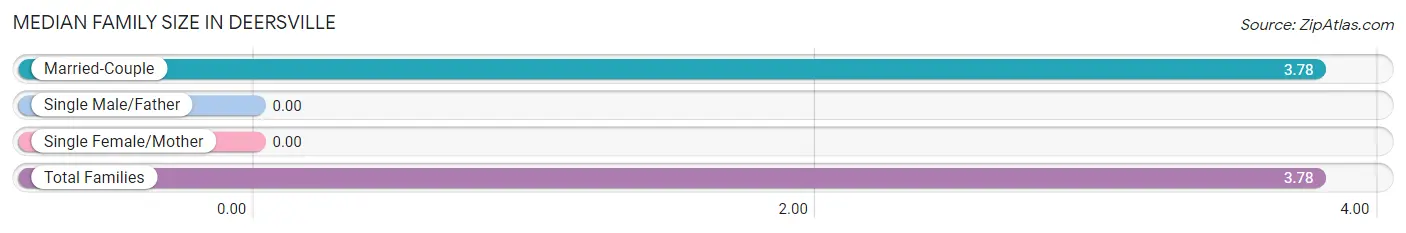
| Family Type | # Families | Family Size |
| Married-Couple | 9 (100.0%) | 3.78 |
| Single Male/Father | 0 (0.0%) | - |
| Single Female/Mother | 0 (0.0%) | - |
| Total Families | 9 (100.0%) | 3.78 |
Median Household Size in Deersville
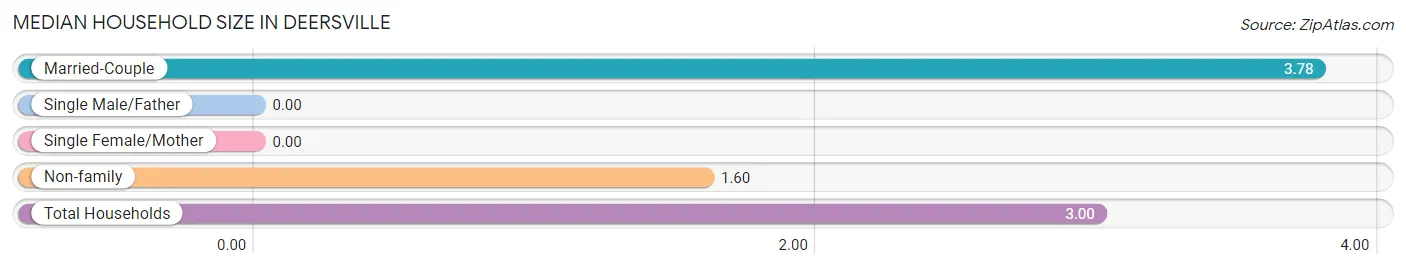
| Household Type | # Households | Household Size |
| Married-Couple | 9 (64.3%) | 3.78 |
| Single Male/Father | 0 (0.0%) | - |
| Single Female/Mother | 0 (0.0%) | - |
| Non-family | 5 (35.7%) | 1.60 |
| Total Households | 14 (100.0%) | 3.00 |
Household Size by Marriage Status in Deersville
Out of a total of 14 households in Deersville, 9 (64.3%) are family households, while 5 (35.7%) are nonfamily households. The most numerous type of family households are 4-person households, comprising 6, and the most common type of nonfamily households are 2-person households, comprising 3.
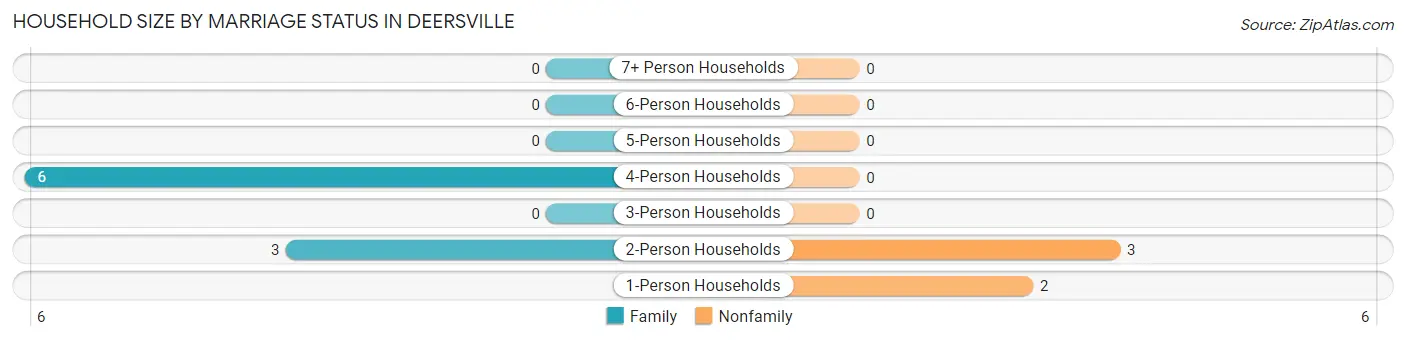
| Household Size | Family Households | Nonfamily Households |
| 1-Person Households | - | 2 (14.3%) |
| 2-Person Households | 3 (21.4%) | 3 (21.4%) |
| 3-Person Households | 0 (0.0%) | 0 (0.0%) |
| 4-Person Households | 6 (42.9%) | 0 (0.0%) |
| 5-Person Households | 0 (0.0%) | 0 (0.0%) |
| 6-Person Households | 0 (0.0%) | 0 (0.0%) |
| 7+ Person Households | 0 (0.0%) | 0 (0.0%) |
| Total | 9 (64.3%) | 5 (35.7%) |
Female Fertility in Deersville
Fertility by Age in Deersville

| Age Bracket | Women with Births | Births / 1,000 Women |
| 15 to 19 years | 0 (0.0%) | 0.0 |
| 20 to 34 years | 0 (0.0%) | 0.0 |
| 35 to 50 years | 0 (0.0%) | 0.0 |
| Total | 0 (0.0%) | 0.0 |
Fertility by Age by Marriage Status in Deersville
| Age Bracket | Married | Unmarried |
| 15 to 19 years | 0 (0.0%) | 0 (0.0%) |
| 20 to 34 years | 0 (0.0%) | 0 (0.0%) |
| 35 to 50 years | 0 (0.0%) | 0 (0.0%) |
| Total | 0 (0.0%) | 0 (0.0%) |
Fertility by Education in Deersville
| Educational Attainment | Women with Births | Births / 1,000 Women |
| Less than High School | 0 (0.0%) | 0.0 |
| High School Diploma | 0 (0.0%) | 0.0 |
| College or Associate's Degree | 0 (0.0%) | 0.0 |
| Bachelor's Degree | 0 (0.0%) | 0.0 |
| Graduate Degree | 0 (0.0%) | 0.0 |
| Total | 0 (0.0%) | 0.0 |
Fertility by Education by Marriage Status in Deersville
| Educational Attainment | Married | Unmarried |
| Less than High School | 0 (0.0%) | 0 (0.0%) |
| High School Diploma | 0 (0.0%) | 0 (0.0%) |
| College or Associate's Degree | 0 (0.0%) | 0 (0.0%) |
| Bachelor's Degree | 0 (0.0%) | 0 (0.0%) |
| Graduate Degree | 0 (0.0%) | 0 (0.0%) |
| Total | 0 (0.0%) | 0 (0.0%) |
Employment Characteristics in Deersville
Employment by Class of Employer in Deersville
Among the 27 employed individuals in Deersville, private company employees (24 | 88.9%), and local government employees (3 | 11.1%) make up the most common classes of employment.
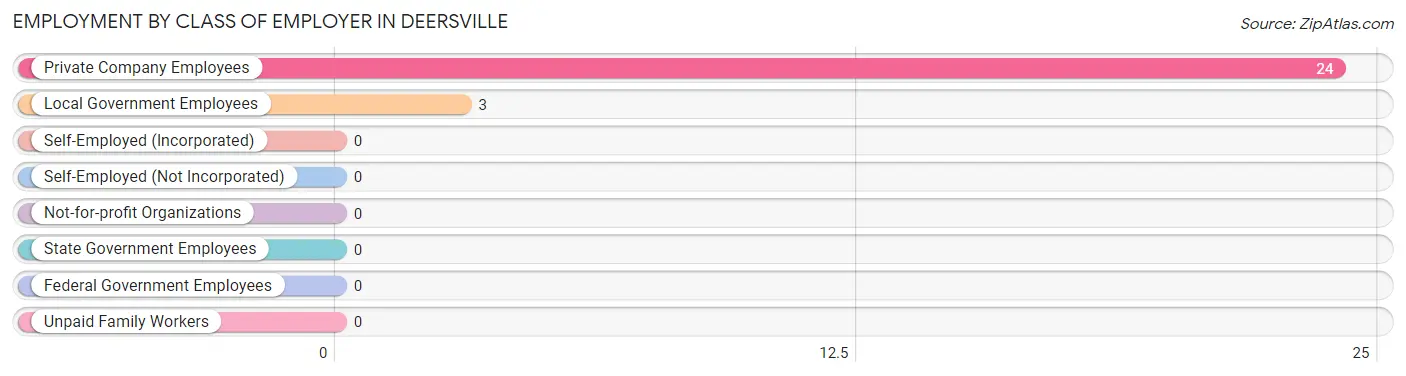
| Employer Class | # Employees | % Employees |
| Private Company Employees | 24 | 88.9% |
| Self-Employed (Incorporated) | 0 | 0.0% |
| Self-Employed (Not Incorporated) | 0 | 0.0% |
| Not-for-profit Organizations | 0 | 0.0% |
| Local Government Employees | 3 | 11.1% |
| State Government Employees | 0 | 0.0% |
| Federal Government Employees | 0 | 0.0% |
| Unpaid Family Workers | 0 | 0.0% |
| Total | 27 | 100.0% |
Employment Status by Age in Deersville
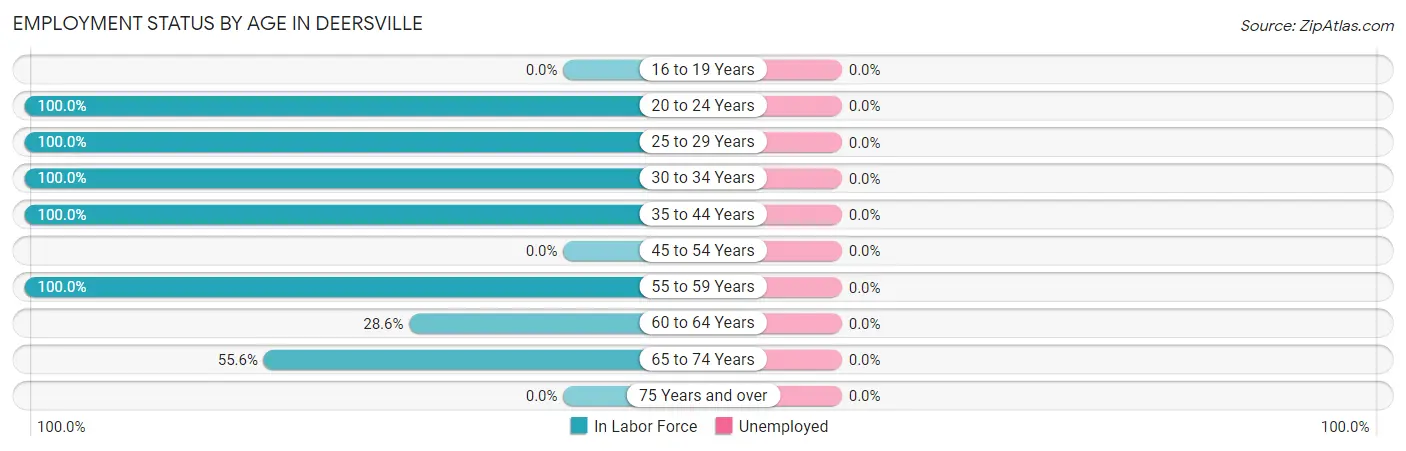
| Age Bracket | In Labor Force | Unemployed |
| 16 to 19 Years | 0 (0.0%) | 0 (0.0%) |
| 20 to 24 Years | 8 (100.0%) | 0 (0.0%) |
| 25 to 29 Years | 2 (100.0%) | 0 (0.0%) |
| 30 to 34 Years | 6 (100.0%) | 0 (0.0%) |
| 35 to 44 Years | 3 (100.0%) | 0 (0.0%) |
| 45 to 54 Years | 0 (0.0%) | 0 (0.0%) |
| 55 to 59 Years | 1 (100.0%) | 0 (0.0%) |
| 60 to 64 Years | 2 (28.6%) | 0 (0.0%) |
| 65 to 74 Years | 5 (55.6%) | 0 (0.0%) |
| 75 Years and over | 0 (0.0%) | 0 (0.0%) |
| Total | 27 (75.0%) | 0 (0.0%) |
Employment Status by Educational Attainment in Deersville
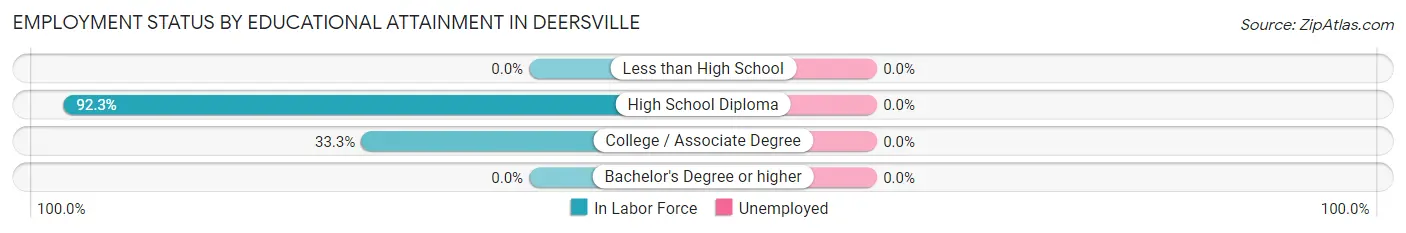
| Educational Attainment | In Labor Force | Unemployed |
| Less than High School | 0 (0.0%) | 0 (0.0%) |
| High School Diploma | 12 (92.3%) | 0 (0.0%) |
| College / Associate Degree | 2 (33.3%) | 0 (0.0%) |
| Bachelor's Degree or higher | 0 (0.0%) | 0 (0.0%) |
| Total | 14 (73.7%) | 0 (0.0%) |
Employment Occupations by Sex in Deersville
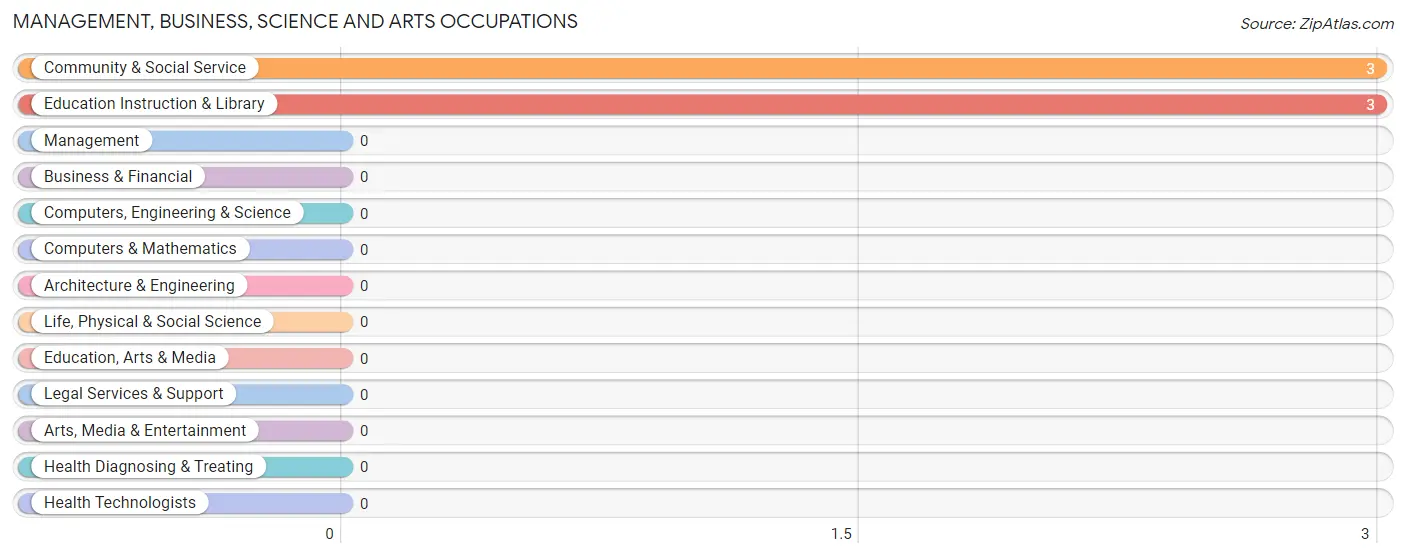
Management, Business, Science and Arts Occupations
The most common Management, Business, Science and Arts occupations in Deersville are Community & Social Service (3 | 11.1%), and Education Instruction & Library (3 | 11.1%).
Management, Business, Science and Arts Occupations by Sex
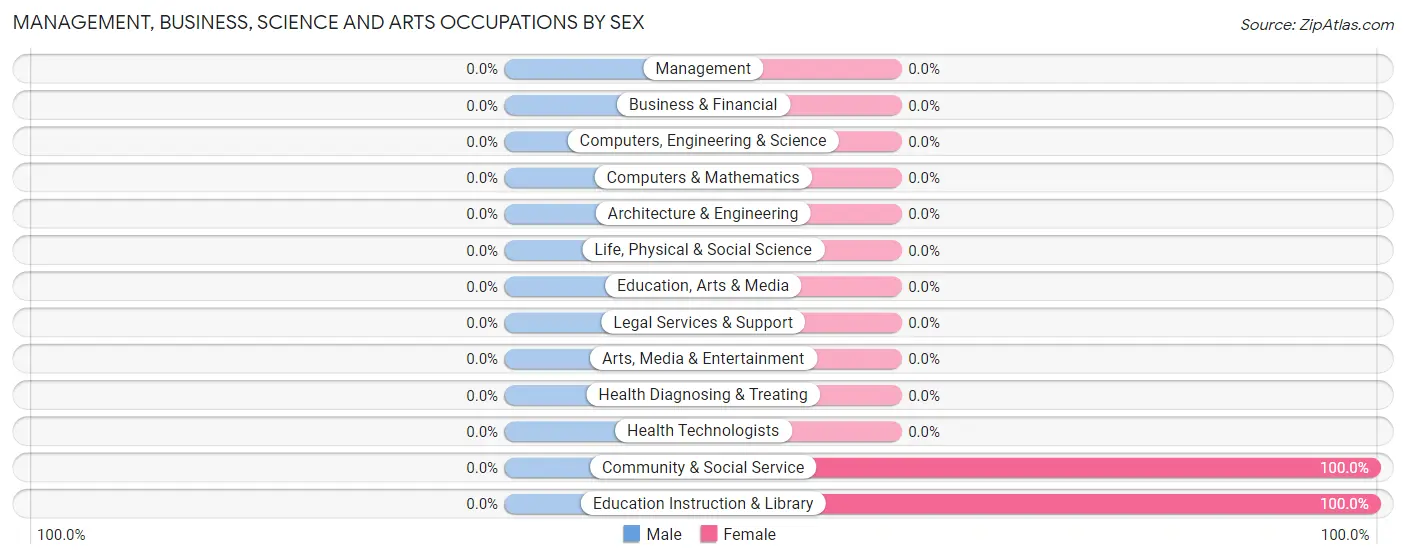
| Occupation | Male | Female |
| Management | 0 (0.0%) | 0 (0.0%) |
| Business & Financial | 0 (0.0%) | 0 (0.0%) |
| Computers, Engineering & Science | 0 (0.0%) | 0 (0.0%) |
| Computers & Mathematics | 0 (0.0%) | 0 (0.0%) |
| Architecture & Engineering | 0 (0.0%) | 0 (0.0%) |
| Life, Physical & Social Science | 0 (0.0%) | 0 (0.0%) |
| Community & Social Service | 0 (0.0%) | 3 (100.0%) |
| Education, Arts & Media | 0 (0.0%) | 0 (0.0%) |
| Legal Services & Support | 0 (0.0%) | 0 (0.0%) |
| Education Instruction & Library | 0 (0.0%) | 3 (100.0%) |
| Arts, Media & Entertainment | 0 (0.0%) | 0 (0.0%) |
| Health Diagnosing & Treating | 0 (0.0%) | 0 (0.0%) |
| Health Technologists | 0 (0.0%) | 0 (0.0%) |
| Total (Category) | 0 (0.0%) | 3 (100.0%) |
| Total (Overall) | 16 (59.3%) | 11 (40.7%) |
Services Occupations
The most common Services occupations in Deersville are , and Healthcare Support (8 | 29.6%).
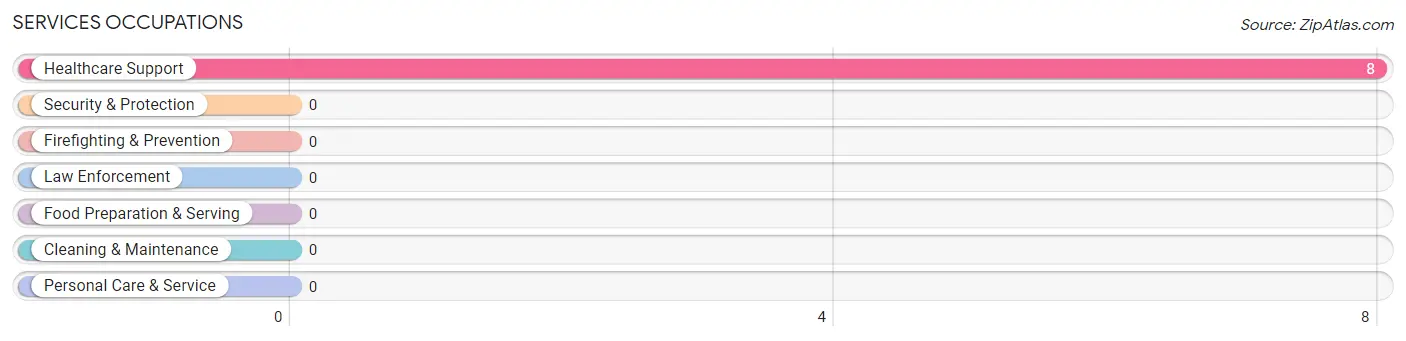
Services Occupations by Sex
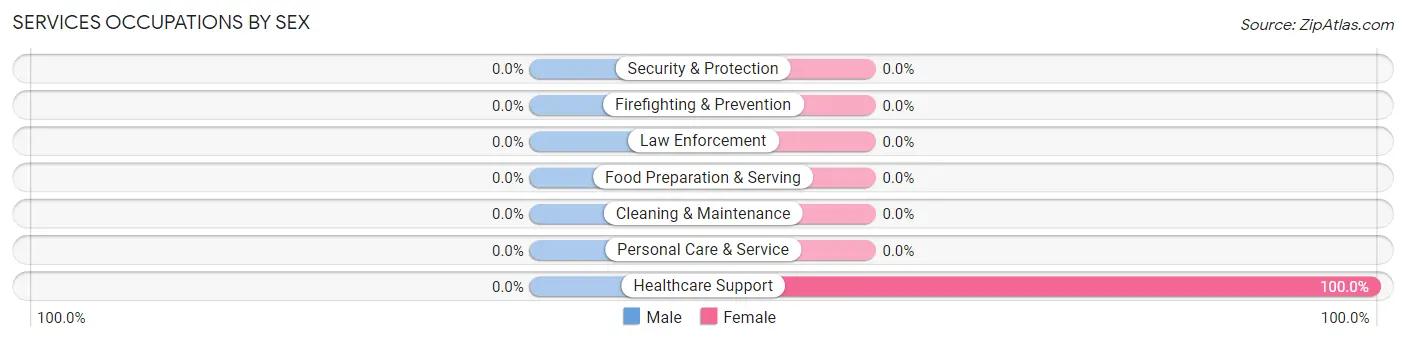
| Occupation | Male | Female |
| Healthcare Support | 0 (0.0%) | 8 (100.0%) |
| Security & Protection | 0 (0.0%) | 0 (0.0%) |
| Firefighting & Prevention | 0 (0.0%) | 0 (0.0%) |
| Law Enforcement | 0 (0.0%) | 0 (0.0%) |
| Food Preparation & Serving | 0 (0.0%) | 0 (0.0%) |
| Cleaning & Maintenance | 0 (0.0%) | 0 (0.0%) |
| Personal Care & Service | 0 (0.0%) | 0 (0.0%) |
| Total (Category) | 0 (0.0%) | 8 (100.0%) |
| Total (Overall) | 16 (59.3%) | 11 (40.7%) |
Sales and Office Occupations
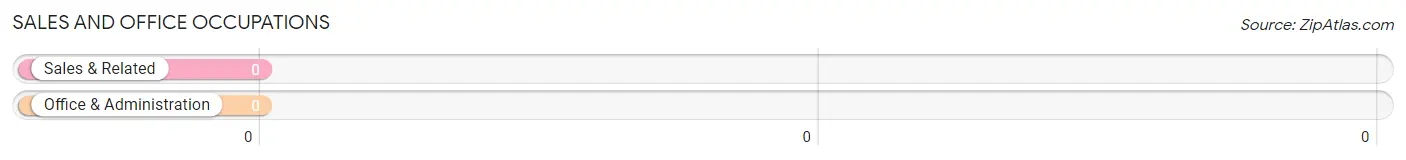
Sales and Office Occupations by Sex
| Occupation | Male | Female |
| Sales & Related | 0 (0.0%) | 0 (0.0%) |
| Office & Administration | 0 (0.0%) | 0 (0.0%) |
| Total (Category) | 0 (0.0%) | 0 (0.0%) |
| Total (Overall) | 16 (59.3%) | 11 (40.7%) |
Natural Resources, Construction and Maintenance Occupations
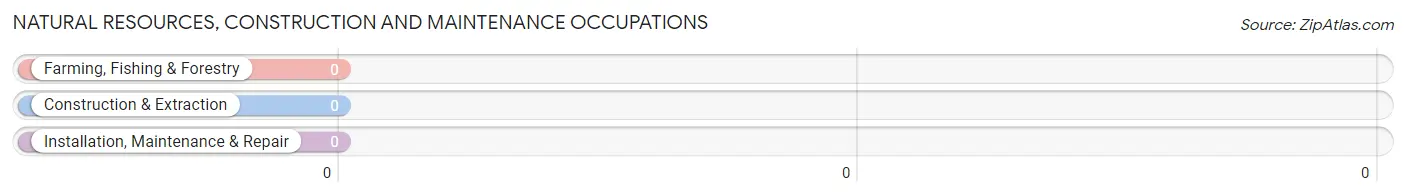
Natural Resources, Construction and Maintenance Occupations by Sex
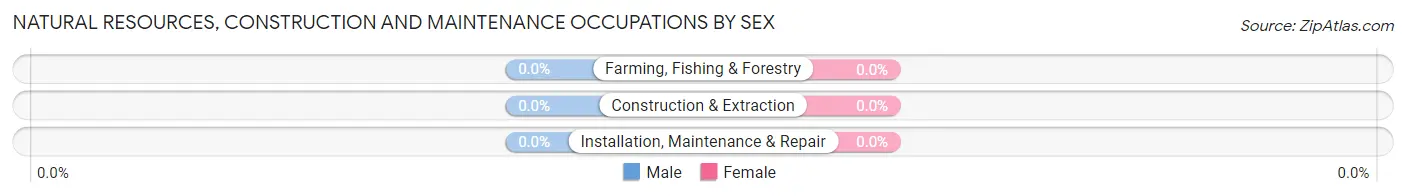
| Occupation | Male | Female |
| Farming, Fishing & Forestry | 0 (0.0%) | 0 (0.0%) |
| Construction & Extraction | 0 (0.0%) | 0 (0.0%) |
| Installation, Maintenance & Repair | 0 (0.0%) | 0 (0.0%) |
| Total (Category) | 0 (0.0%) | 0 (0.0%) |
| Total (Overall) | 16 (59.3%) | 11 (40.7%) |
Production, Transportation and Moving Occupations
The most common Production, Transportation and Moving occupations in Deersville are Transportation (11 | 40.7%), and Production (5 | 18.5%).
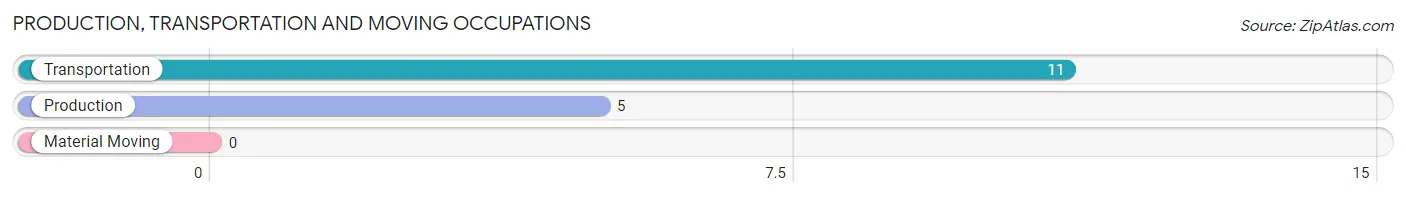
Production, Transportation and Moving Occupations by Sex
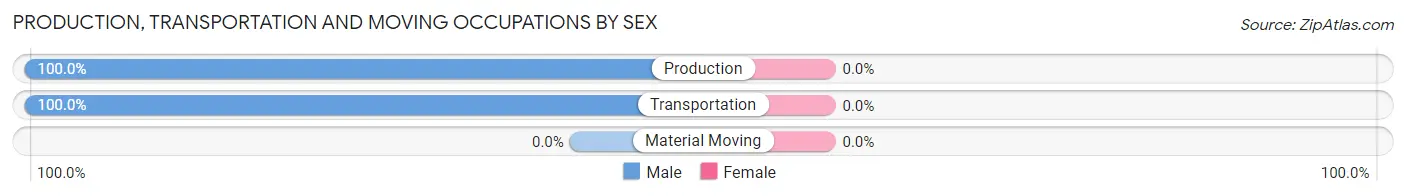
| Occupation | Male | Female |
| Production | 5 (100.0%) | 0 (0.0%) |
| Transportation | 11 (100.0%) | 0 (0.0%) |
| Material Moving | 0 (0.0%) | 0 (0.0%) |
| Total (Category) | 16 (100.0%) | 0 (0.0%) |
| Total (Overall) | 16 (59.3%) | 11 (40.7%) |
Employment Industries by Sex in Deersville
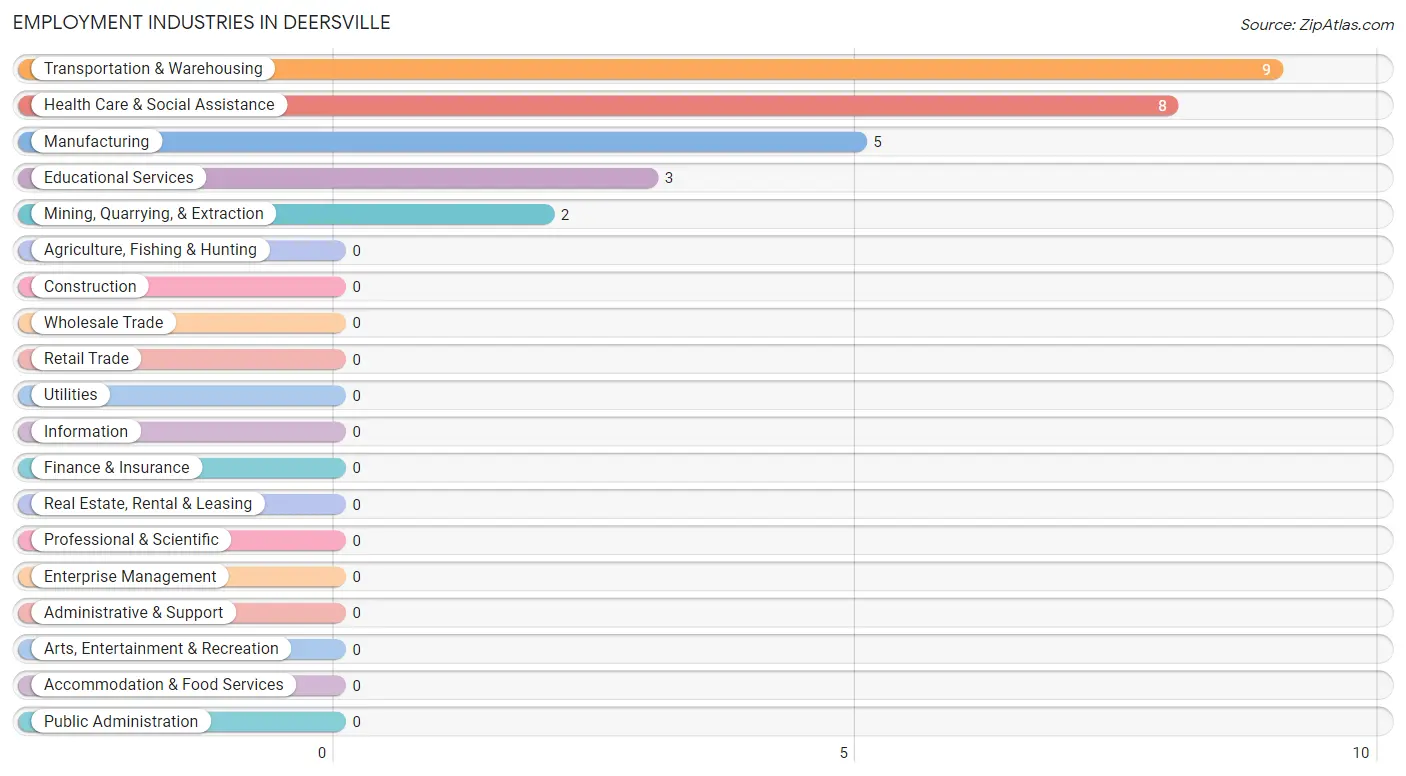
Employment Industries in Deersville
The major employment industries in Deersville include Transportation & Warehousing (9 | 33.3%), Health Care & Social Assistance (8 | 29.6%), Manufacturing (5 | 18.5%), Educational Services (3 | 11.1%), and Mining, Quarrying, & Extraction (2 | 7.4%).
Employment Industries by Sex in Deersville
The Deersville industries that see more men than women are Mining, Quarrying, & Extraction (100.0%), Manufacturing (100.0%), and Transportation & Warehousing (100.0%), whereas the industries that tend to have a higher number of women are Educational Services (100.0%), and Health Care & Social Assistance (100.0%).
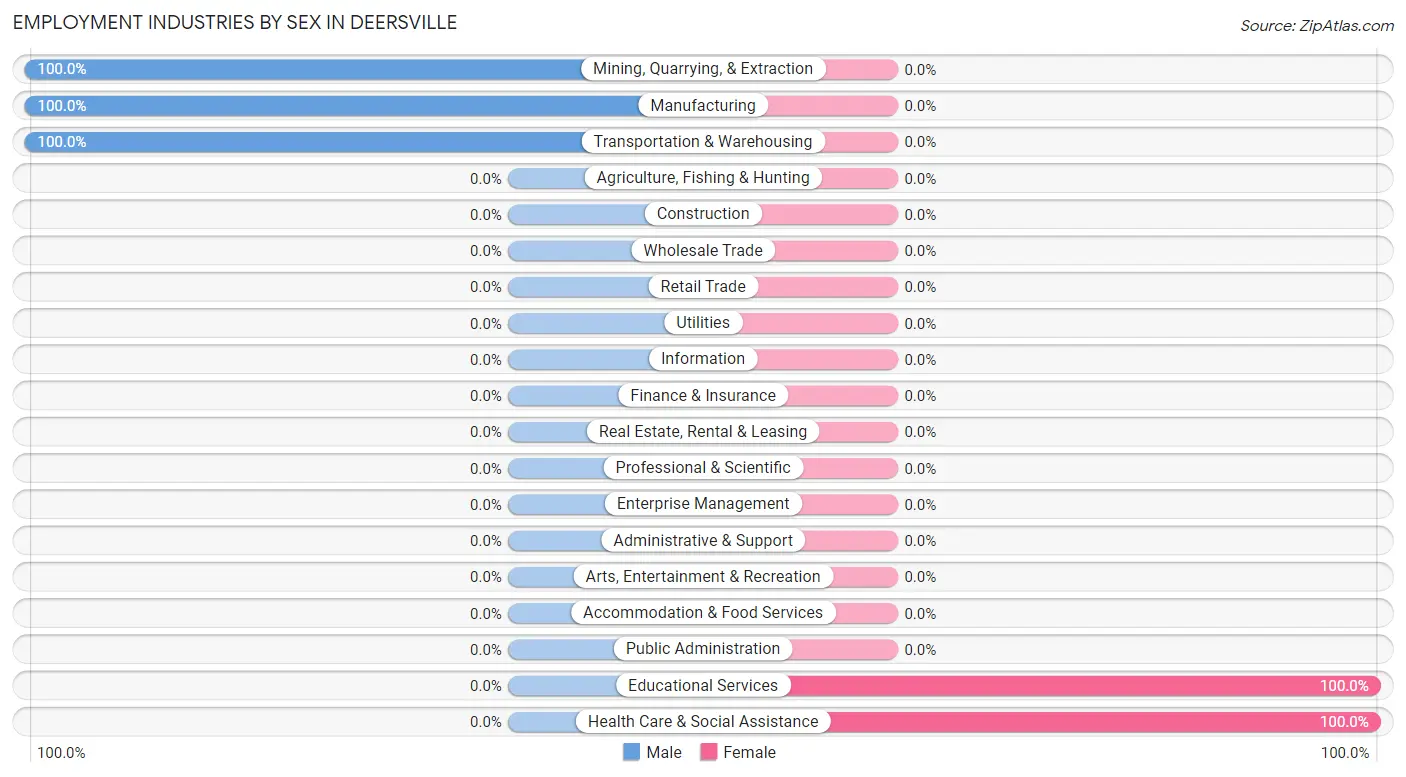
| Industry | Male | Female |
| Agriculture, Fishing & Hunting | 0 (0.0%) | 0 (0.0%) |
| Mining, Quarrying, & Extraction | 2 (100.0%) | 0 (0.0%) |
| Construction | 0 (0.0%) | 0 (0.0%) |
| Manufacturing | 5 (100.0%) | 0 (0.0%) |
| Wholesale Trade | 0 (0.0%) | 0 (0.0%) |
| Retail Trade | 0 (0.0%) | 0 (0.0%) |
| Transportation & Warehousing | 9 (100.0%) | 0 (0.0%) |
| Utilities | 0 (0.0%) | 0 (0.0%) |
| Information | 0 (0.0%) | 0 (0.0%) |
| Finance & Insurance | 0 (0.0%) | 0 (0.0%) |
| Real Estate, Rental & Leasing | 0 (0.0%) | 0 (0.0%) |
| Professional & Scientific | 0 (0.0%) | 0 (0.0%) |
| Enterprise Management | 0 (0.0%) | 0 (0.0%) |
| Administrative & Support | 0 (0.0%) | 0 (0.0%) |
| Educational Services | 0 (0.0%) | 3 (100.0%) |
| Health Care & Social Assistance | 0 (0.0%) | 8 (100.0%) |
| Arts, Entertainment & Recreation | 0 (0.0%) | 0 (0.0%) |
| Accommodation & Food Services | 0 (0.0%) | 0 (0.0%) |
| Public Administration | 0 (0.0%) | 0 (0.0%) |
| Total | 16 (59.3%) | 11 (40.7%) |
Education in Deersville
School Enrollment in Deersville
The most common levels of schooling among the 9 students in Deersville are elementary school (6 | 66.7%), and college / undergraduate (3 | 33.3%).
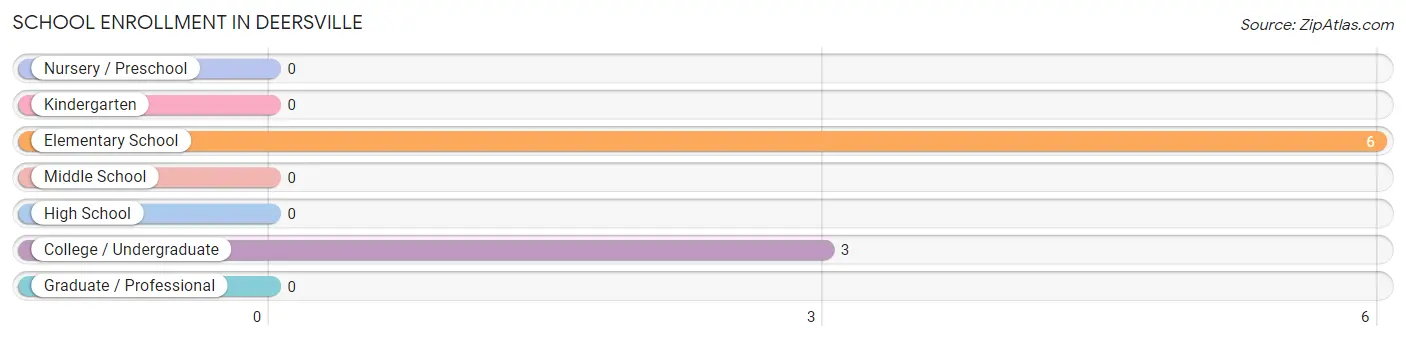
| School Level | # Students | % Students |
| Nursery / Preschool | 0 | 0.0% |
| Kindergarten | 0 | 0.0% |
| Elementary School | 6 | 66.7% |
| Middle School | 0 | 0.0% |
| High School | 0 | 0.0% |
| College / Undergraduate | 3 | 33.3% |
| Graduate / Professional | 0 | 0.0% |
| Total | 9 | 100.0% |
School Enrollment by Age by Funding Source in Deersville
Out of a total of 9 students who are enrolled in schools in Deersville, 3 (33.3%) attend a private institution, while the remaining 6 (66.7%) are enrolled in public schools. The age group of 20 to 24 year olds has the highest likelihood of being enrolled in private schools, with 3 (100.0% in the age bracket) enrolled. Conversely, the age group of 5 to 9 year old has the lowest likelihood of being enrolled in a private school, with 6 (100.0% in the age bracket) attending a public institution.
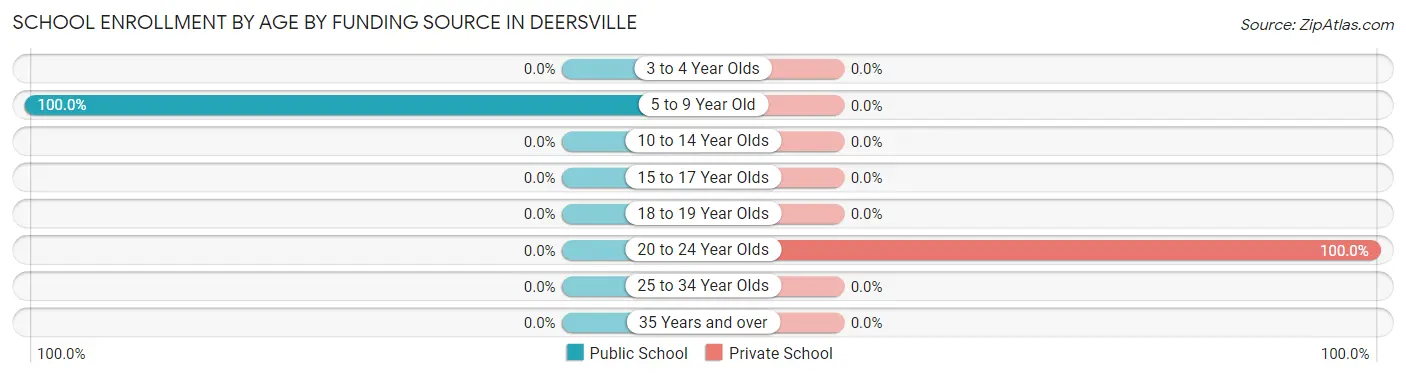
| Age Bracket | Public School | Private School |
| 3 to 4 Year Olds | 0 (0.0%) | 0 (0.0%) |
| 5 to 9 Year Old | 6 (100.0%) | 0 (0.0%) |
| 10 to 14 Year Olds | 0 (0.0%) | 0 (0.0%) |
| 15 to 17 Year Olds | 0 (0.0%) | 0 (0.0%) |
| 18 to 19 Year Olds | 0 (0.0%) | 0 (0.0%) |
| 20 to 24 Year Olds | 0 (0.0%) | 3 (100.0%) |
| 25 to 34 Year Olds | 0 (0.0%) | 0 (0.0%) |
| 35 Years and over | 0 (0.0%) | 0 (0.0%) |
| Total | 6 (66.7%) | 3 (33.3%) |
Educational Attainment by Field of Study in Deersville
| Field of Study | # Graduates | % Graduates |
| Computers & Mathematics | 0 | 0.0% |
| Bio, Nature & Agricultural | 0 | 0.0% |
| Physical & Health Sciences | 0 | 0.0% |
| Psychology | 0 | 0.0% |
| Social Sciences | 0 | 0.0% |
| Engineering | 0 | 0.0% |
| Multidisciplinary Studies | 0 | 0.0% |
| Science & Technology | 0 | 0.0% |
| Business | 0 | 0.0% |
| Education | 0 | 0.0% |
| Literature & Languages | 0 | 0.0% |
| Liberal Arts & History | 0 | 0.0% |
| Visual & Performing Arts | 0 | 0.0% |
| Communications | 0 | 0.0% |
| Arts & Humanities | 0 | 0.0% |
| Total | 0 | 0.0% |
Transportation & Commute in Deersville
Vehicle Availability by Sex in Deersville
The most prevalent vehicle ownership categories in Deersville are males with 2 vehicles (13, accounting for 81.2%) and females with 2 vehicles (8, making up 118.2%).
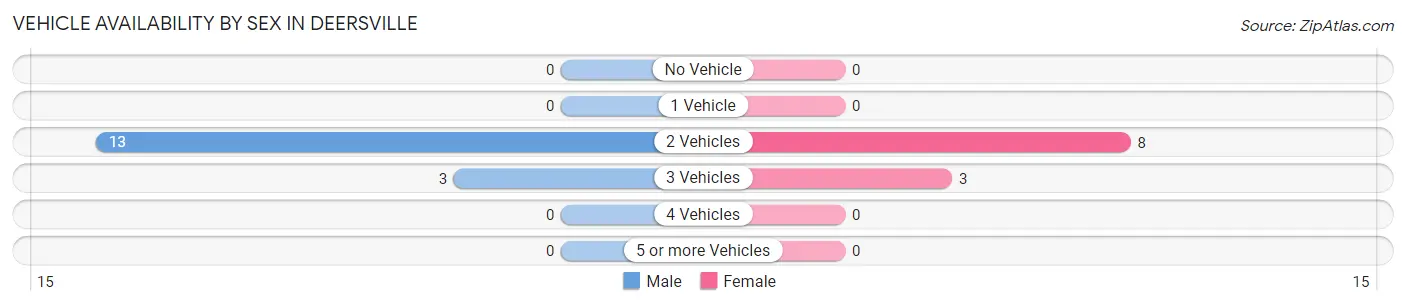
| Vehicles Available | Male | Female |
| No Vehicle | 0 (0.0%) | 0 (0.0%) |
| 1 Vehicle | 0 (0.0%) | 0 (0.0%) |
| 2 Vehicles | 13 (81.2%) | 8 (72.7%) |
| 3 Vehicles | 3 (18.8%) | 3 (27.3%) |
| 4 Vehicles | 0 (0.0%) | 0 (0.0%) |
| 5 or more Vehicles | 0 (0.0%) | 0 (0.0%) |
| Total | 16 (100.0%) | 11 (100.0%) |
Commute Time in Deersville
The most frequently occuring commute durations in Deersville are 20 to 24 minutes (13 commuters, 61.9%), 15 to 19 minutes (3 commuters, 14.3%), and 35 to 39 minutes (3 commuters, 14.3%).
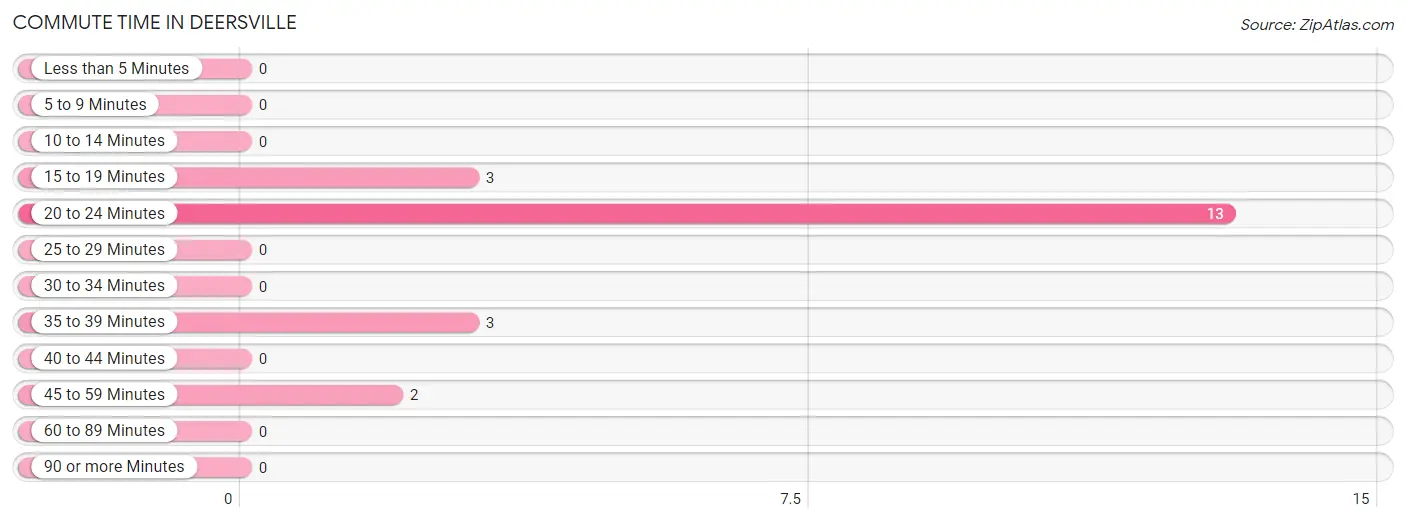
| Commute Time | # Commuters | % Commuters |
| Less than 5 Minutes | 0 | 0.0% |
| 5 to 9 Minutes | 0 | 0.0% |
| 10 to 14 Minutes | 0 | 0.0% |
| 15 to 19 Minutes | 3 | 14.3% |
| 20 to 24 Minutes | 13 | 61.9% |
| 25 to 29 Minutes | 0 | 0.0% |
| 30 to 34 Minutes | 0 | 0.0% |
| 35 to 39 Minutes | 3 | 14.3% |
| 40 to 44 Minutes | 0 | 0.0% |
| 45 to 59 Minutes | 2 | 9.5% |
| 60 to 89 Minutes | 0 | 0.0% |
| 90 or more Minutes | 0 | 0.0% |
Commute Time by Sex in Deersville
The most common commute times in Deersville are 20 to 24 minutes (11 commuters, 68.8%) for males and 15 to 19 minutes (3 commuters, 60.0%) for females.
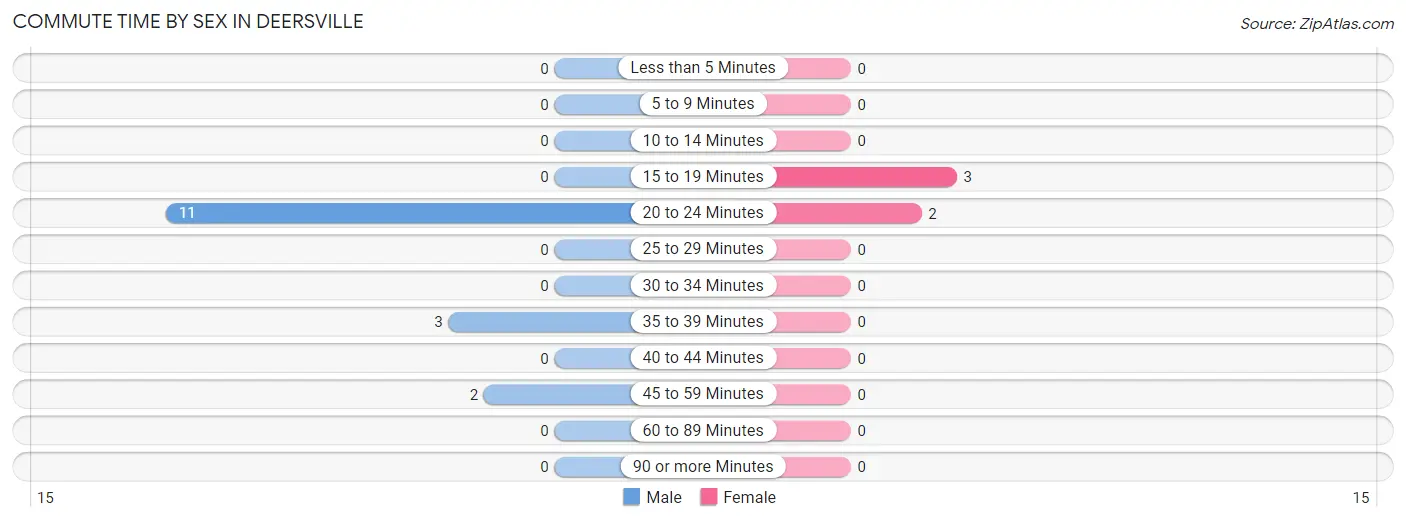
| Commute Time | Male | Female |
| Less than 5 Minutes | 0 (0.0%) | 0 (0.0%) |
| 5 to 9 Minutes | 0 (0.0%) | 0 (0.0%) |
| 10 to 14 Minutes | 0 (0.0%) | 0 (0.0%) |
| 15 to 19 Minutes | 0 (0.0%) | 3 (60.0%) |
| 20 to 24 Minutes | 11 (68.8%) | 2 (40.0%) |
| 25 to 29 Minutes | 0 (0.0%) | 0 (0.0%) |
| 30 to 34 Minutes | 0 (0.0%) | 0 (0.0%) |
| 35 to 39 Minutes | 3 (18.8%) | 0 (0.0%) |
| 40 to 44 Minutes | 0 (0.0%) | 0 (0.0%) |
| 45 to 59 Minutes | 2 (12.5%) | 0 (0.0%) |
| 60 to 89 Minutes | 0 (0.0%) | 0 (0.0%) |
| 90 or more Minutes | 0 (0.0%) | 0 (0.0%) |
Time of Departure to Work by Sex in Deersville
The most frequent times of departure to work in Deersville are 12:00 AM to 4:59 AM (7, 43.8%) for males and 7:00 AM to 7:29 AM (3, 60.0%) for females.
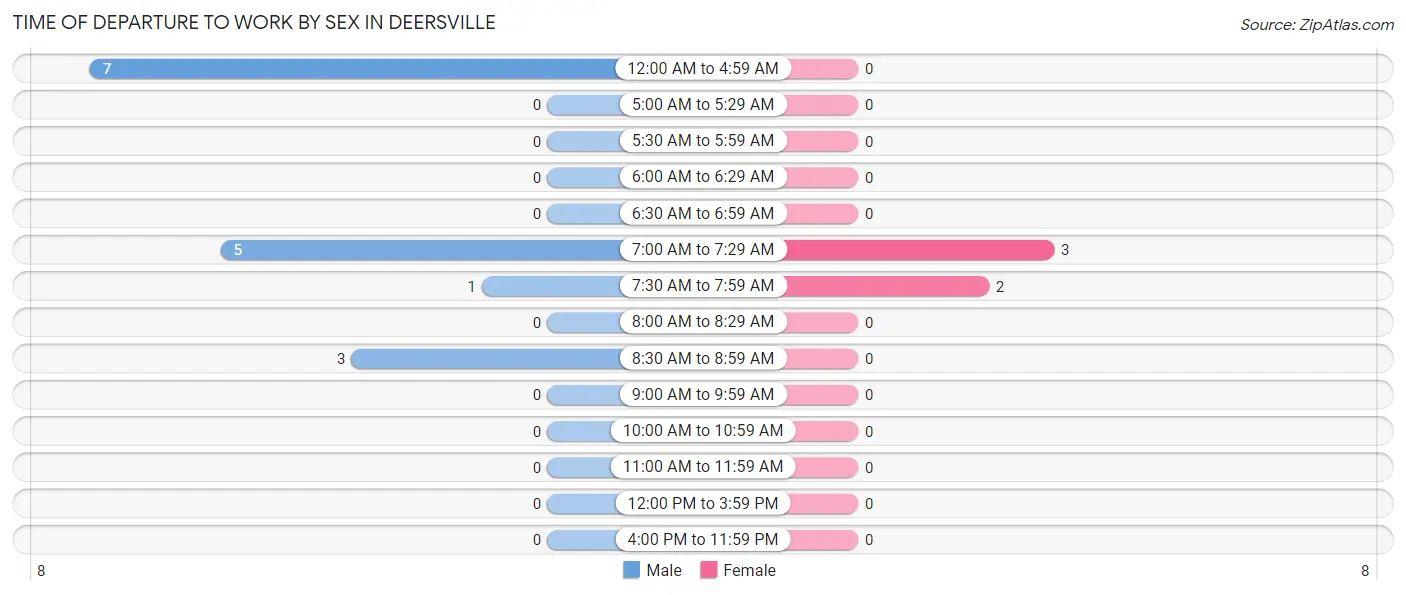
| Time of Departure | Male | Female |
| 12:00 AM to 4:59 AM | 7 (43.8%) | 0 (0.0%) |
| 5:00 AM to 5:29 AM | 0 (0.0%) | 0 (0.0%) |
| 5:30 AM to 5:59 AM | 0 (0.0%) | 0 (0.0%) |
| 6:00 AM to 6:29 AM | 0 (0.0%) | 0 (0.0%) |
| 6:30 AM to 6:59 AM | 0 (0.0%) | 0 (0.0%) |
| 7:00 AM to 7:29 AM | 5 (31.2%) | 3 (60.0%) |
| 7:30 AM to 7:59 AM | 1 (6.2%) | 2 (40.0%) |
| 8:00 AM to 8:29 AM | 0 (0.0%) | 0 (0.0%) |
| 8:30 AM to 8:59 AM | 3 (18.8%) | 0 (0.0%) |
| 9:00 AM to 9:59 AM | 0 (0.0%) | 0 (0.0%) |
| 10:00 AM to 10:59 AM | 0 (0.0%) | 0 (0.0%) |
| 11:00 AM to 11:59 AM | 0 (0.0%) | 0 (0.0%) |
| 12:00 PM to 3:59 PM | 0 (0.0%) | 0 (0.0%) |
| 4:00 PM to 11:59 PM | 0 (0.0%) | 0 (0.0%) |
| Total | 16 (100.0%) | 5 (100.0%) |
Housing Occupancy in Deersville
Occupancy by Ownership in Deersville
Of the total 14 dwellings in Deersville, owner-occupied units account for 9 (64.3%), while renter-occupied units make up 5 (35.7%).
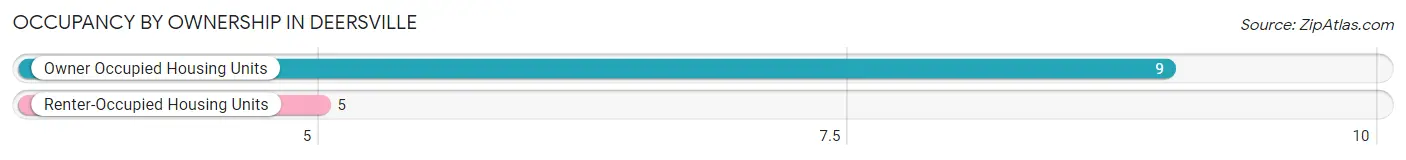
| Occupancy | # Housing Units | % Housing Units |
| Owner Occupied Housing Units | 9 | 64.3% |
| Renter-Occupied Housing Units | 5 | 35.7% |
| Total Occupied Housing Units | 14 | 100.0% |
Occupancy by Household Size in Deersville
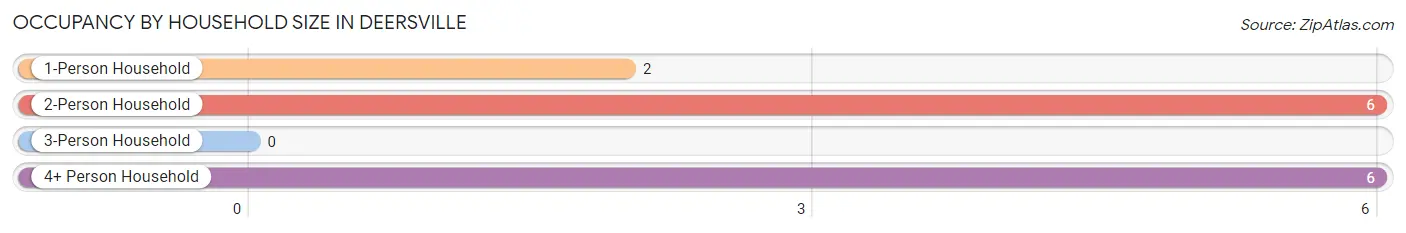
| Household Size | # Housing Units | % Housing Units |
| 1-Person Household | 2 | 14.3% |
| 2-Person Household | 6 | 42.9% |
| 3-Person Household | 0 | 0.0% |
| 4+ Person Household | 6 | 42.9% |
| Total Housing Units | 14 | 100.0% |
Occupancy by Ownership by Household Size in Deersville
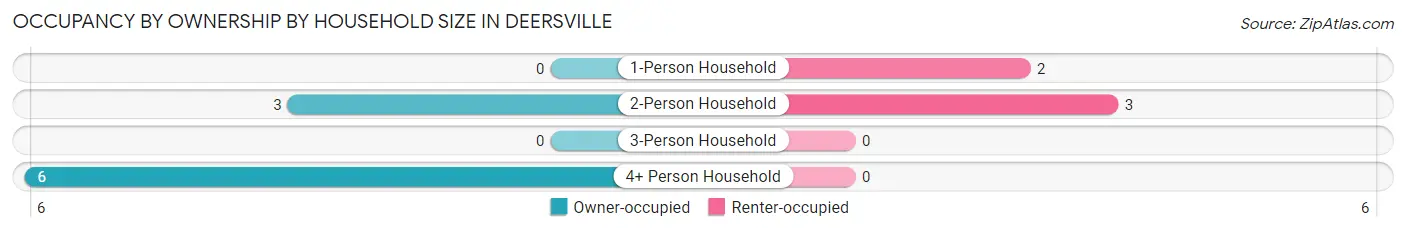
| Household Size | Owner-occupied | Renter-occupied |
| 1-Person Household | 0 (0.0%) | 2 (100.0%) |
| 2-Person Household | 3 (50.0%) | 3 (50.0%) |
| 3-Person Household | 0 (0.0%) | 0 (0.0%) |
| 4+ Person Household | 6 (100.0%) | 0 (0.0%) |
| Total Housing Units | 9 (64.3%) | 5 (35.7%) |
Occupancy by Educational Attainment in Deersville
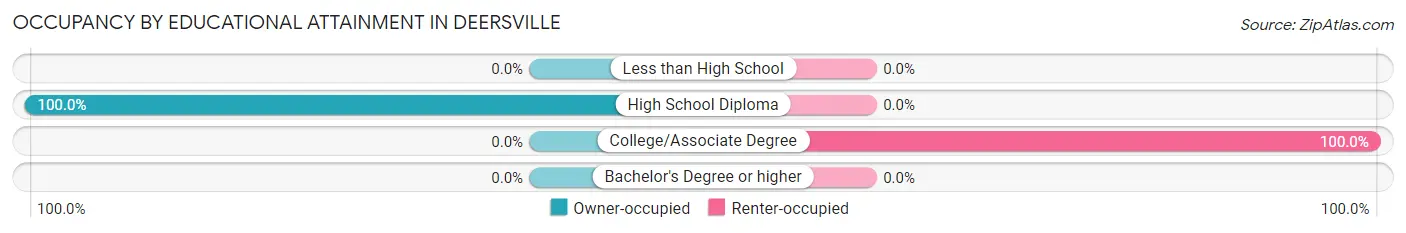
| Household Size | Owner-occupied | Renter-occupied |
| Less than High School | 0 (0.0%) | 0 (0.0%) |
| High School Diploma | 9 (100.0%) | 0 (0.0%) |
| College/Associate Degree | 0 (0.0%) | 5 (100.0%) |
| Bachelor's Degree or higher | 0 (0.0%) | 0 (0.0%) |
Occupancy by Age of Householder in Deersville
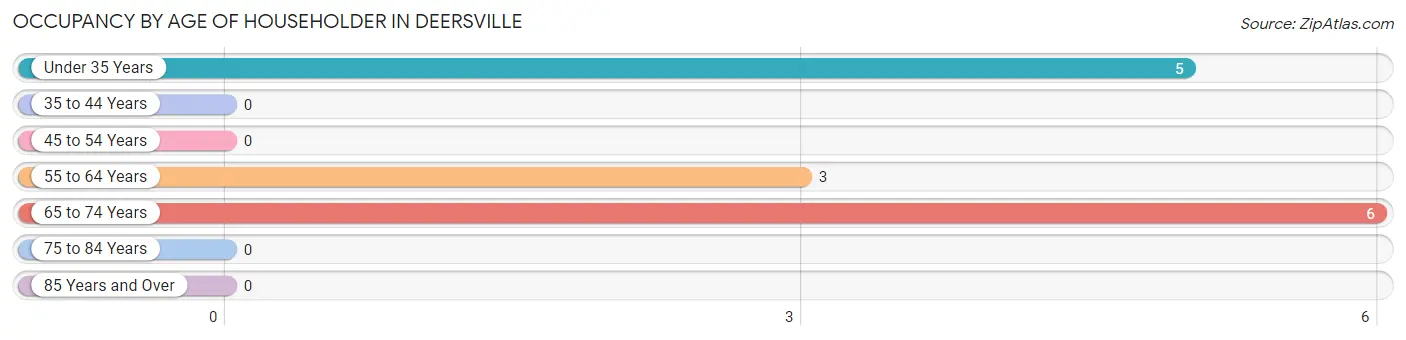
| Age Bracket | # Households | % Households |
| Under 35 Years | 5 | 35.7% |
| 35 to 44 Years | 0 | 0.0% |
| 45 to 54 Years | 0 | 0.0% |
| 55 to 64 Years | 3 | 21.4% |
| 65 to 74 Years | 6 | 42.9% |
| 75 to 84 Years | 0 | 0.0% |
| 85 Years and Over | 0 | 0.0% |
| Total | 14 | 100.0% |
Housing Finances in Deersville
Median Income by Occupancy in Deersville
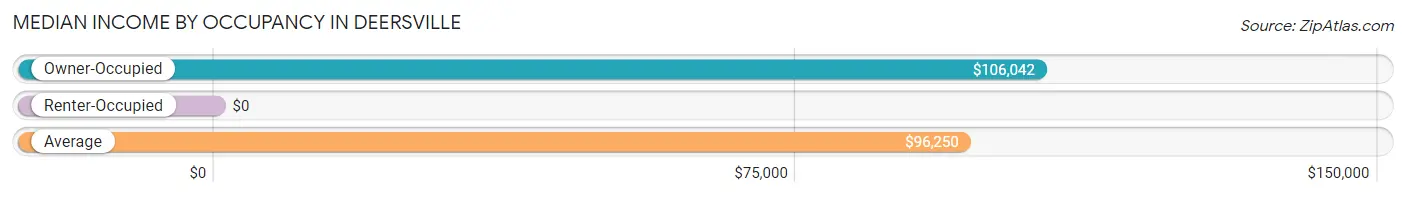
| Occupancy Type | # Households | Median Income |
| Owner-Occupied | 9 (64.3%) | $106,042 |
| Renter-Occupied | 5 (35.7%) | $0 |
| Average | 14 (100.0%) | $96,250 |
Occupancy by Householder Income Bracket in Deersville
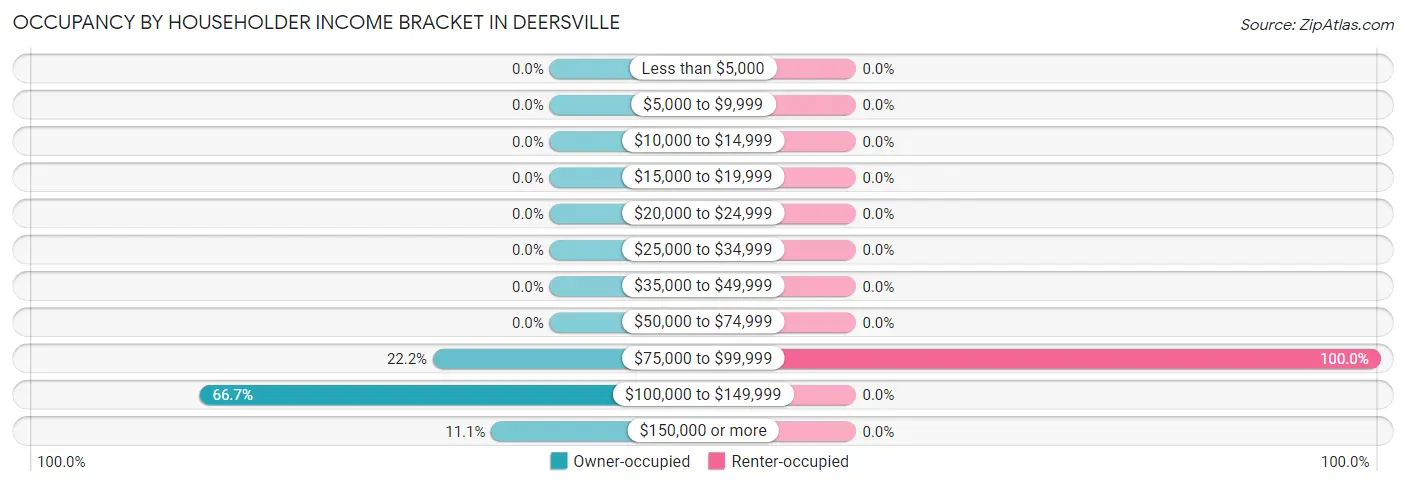
| Income Bracket | Owner-occupied | Renter-occupied |
| Less than $5,000 | 0 (0.0%) | 0 (0.0%) |
| $5,000 to $9,999 | 0 (0.0%) | 0 (0.0%) |
| $10,000 to $14,999 | 0 (0.0%) | 0 (0.0%) |
| $15,000 to $19,999 | 0 (0.0%) | 0 (0.0%) |
| $20,000 to $24,999 | 0 (0.0%) | 0 (0.0%) |
| $25,000 to $34,999 | 0 (0.0%) | 0 (0.0%) |
| $35,000 to $49,999 | 0 (0.0%) | 0 (0.0%) |
| $50,000 to $74,999 | 0 (0.0%) | 0 (0.0%) |
| $75,000 to $99,999 | 2 (22.2%) | 5 (100.0%) |
| $100,000 to $149,999 | 6 (66.7%) | 0 (0.0%) |
| $150,000 or more | 1 (11.1%) | 0 (0.0%) |
| Total | 9 (100.0%) | 5 (100.0%) |
Monthly Housing Cost Tiers in Deersville
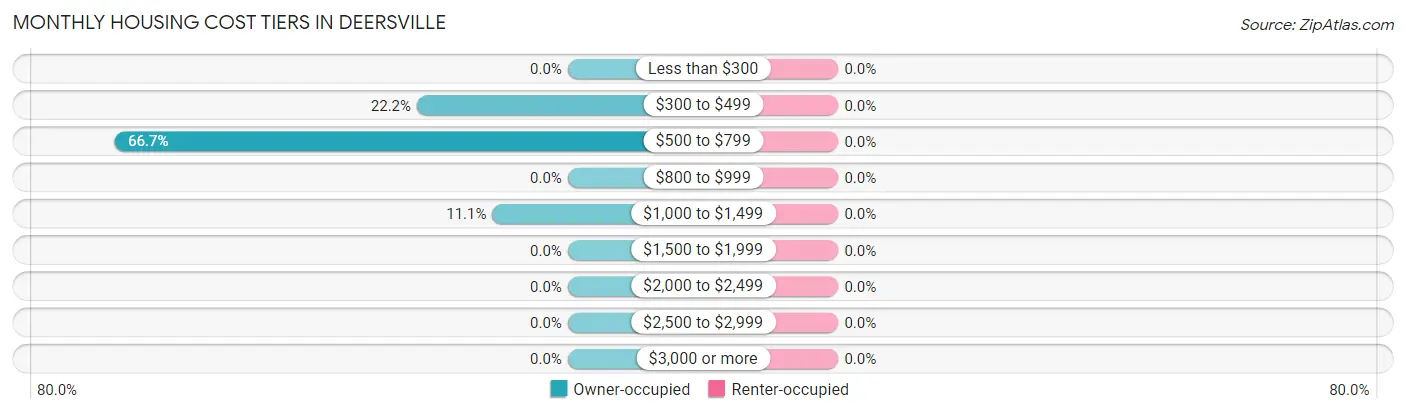
| Monthly Cost | Owner-occupied | Renter-occupied |
| Less than $300 | 0 (0.0%) | 0 (0.0%) |
| $300 to $499 | 2 (22.2%) | 0 (0.0%) |
| $500 to $799 | 6 (66.7%) | 0 (0.0%) |
| $800 to $999 | 0 (0.0%) | 0 (0.0%) |
| $1,000 to $1,499 | 1 (11.1%) | 0 (0.0%) |
| $1,500 to $1,999 | 0 (0.0%) | 0 (0.0%) |
| $2,000 to $2,499 | 0 (0.0%) | 0 (0.0%) |
| $2,500 to $2,999 | 0 (0.0%) | 0 (0.0%) |
| $3,000 or more | 0 (0.0%) | 0 (0.0%) |
| Total | 9 (100.0%) | 5 (100.0%) |
Physical Housing Characteristics in Deersville
Housing Structures in Deersville
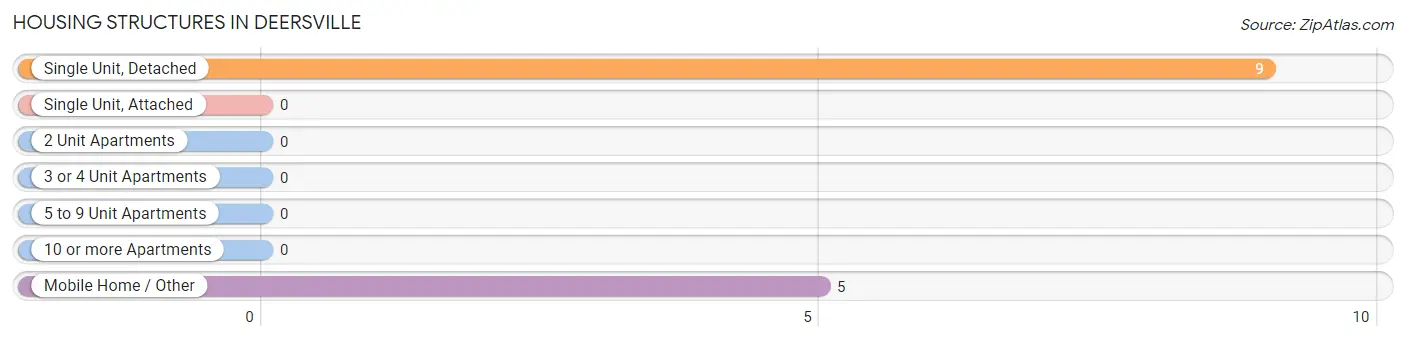
| Structure Type | # Housing Units | % Housing Units |
| Single Unit, Detached | 9 | 64.3% |
| Single Unit, Attached | 0 | 0.0% |
| 2 Unit Apartments | 0 | 0.0% |
| 3 or 4 Unit Apartments | 0 | 0.0% |
| 5 to 9 Unit Apartments | 0 | 0.0% |
| 10 or more Apartments | 0 | 0.0% |
| Mobile Home / Other | 5 | 35.7% |
| Total | 14 | 100.0% |
Housing Structures by Occupancy in Deersville
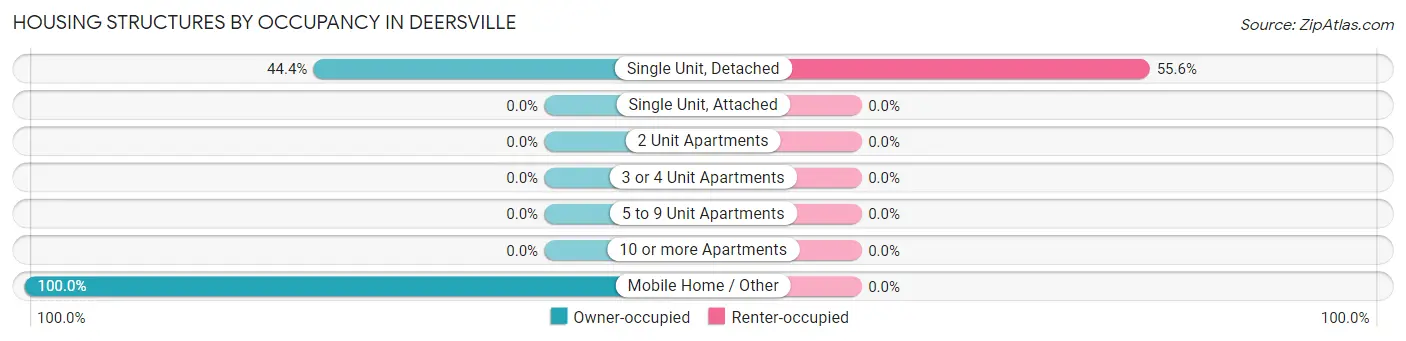
| Structure Type | Owner-occupied | Renter-occupied |
| Single Unit, Detached | 4 (44.4%) | 5 (55.6%) |
| Single Unit, Attached | 0 (0.0%) | 0 (0.0%) |
| 2 Unit Apartments | 0 (0.0%) | 0 (0.0%) |
| 3 or 4 Unit Apartments | 0 (0.0%) | 0 (0.0%) |
| 5 to 9 Unit Apartments | 0 (0.0%) | 0 (0.0%) |
| 10 or more Apartments | 0 (0.0%) | 0 (0.0%) |
| Mobile Home / Other | 5 (100.0%) | 0 (0.0%) |
| Total | 9 (64.3%) | 5 (35.7%) |
Housing Structures by Number of Rooms in Deersville
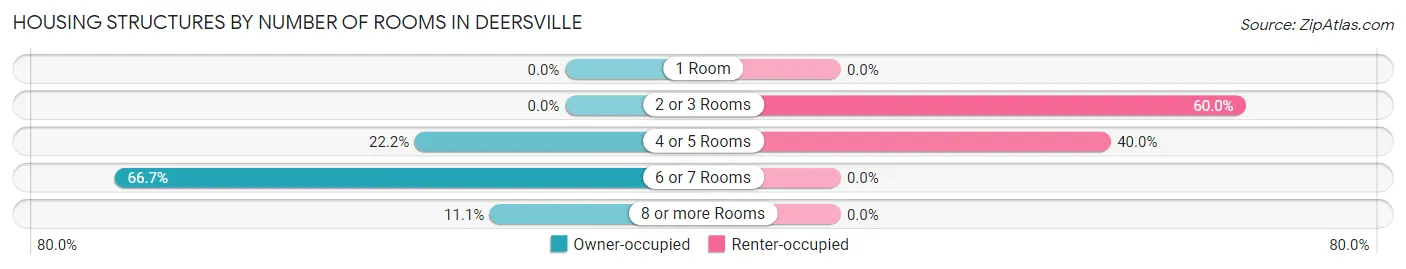
| Number of Rooms | Owner-occupied | Renter-occupied |
| 1 Room | 0 (0.0%) | 0 (0.0%) |
| 2 or 3 Rooms | 0 (0.0%) | 3 (60.0%) |
| 4 or 5 Rooms | 2 (22.2%) | 2 (40.0%) |
| 6 or 7 Rooms | 6 (66.7%) | 0 (0.0%) |
| 8 or more Rooms | 1 (11.1%) | 0 (0.0%) |
| Total | 9 (100.0%) | 5 (100.0%) |
Housing Structure by Heating Type in Deersville
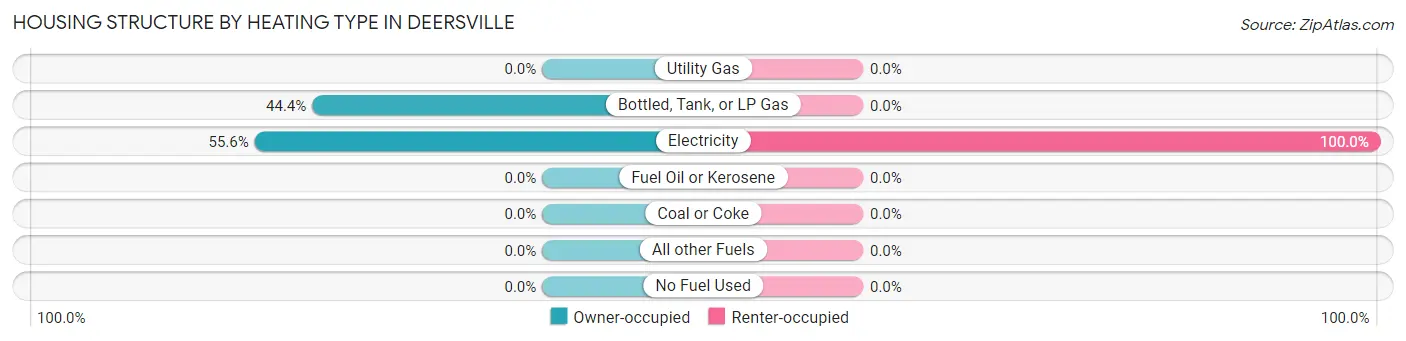
| Heating Type | Owner-occupied | Renter-occupied |
| Utility Gas | 0 (0.0%) | 0 (0.0%) |
| Bottled, Tank, or LP Gas | 4 (44.4%) | 0 (0.0%) |
| Electricity | 5 (55.6%) | 5 (100.0%) |
| Fuel Oil or Kerosene | 0 (0.0%) | 0 (0.0%) |
| Coal or Coke | 0 (0.0%) | 0 (0.0%) |
| All other Fuels | 0 (0.0%) | 0 (0.0%) |
| No Fuel Used | 0 (0.0%) | 0 (0.0%) |
| Total | 9 (100.0%) | 5 (100.0%) |
Household Vehicle Usage in Deersville
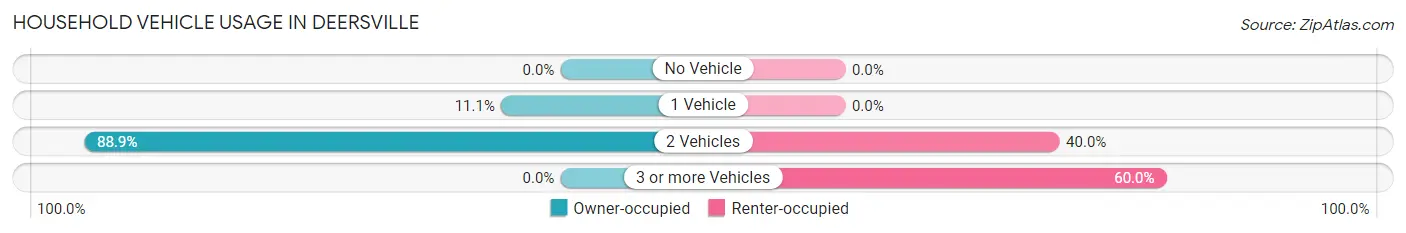
| Vehicles per Household | Owner-occupied | Renter-occupied |
| No Vehicle | 0 (0.0%) | 0 (0.0%) |
| 1 Vehicle | 1 (11.1%) | 0 (0.0%) |
| 2 Vehicles | 8 (88.9%) | 2 (40.0%) |
| 3 or more Vehicles | 0 (0.0%) | 3 (60.0%) |
| Total | 9 (100.0%) | 5 (100.0%) |
Real Estate & Mortgages in Deersville
Real Estate and Mortgage Overview in Deersville
| Characteristic | Without Mortgage | With Mortgage |
| Housing Units | 2 | 7 |
| Median Property Value | - | - |
| Median Household Income | - | - |
| Monthly Housing Costs | - | - |
| Real Estate Taxes | - | - |
Property Value by Mortgage Status in Deersville
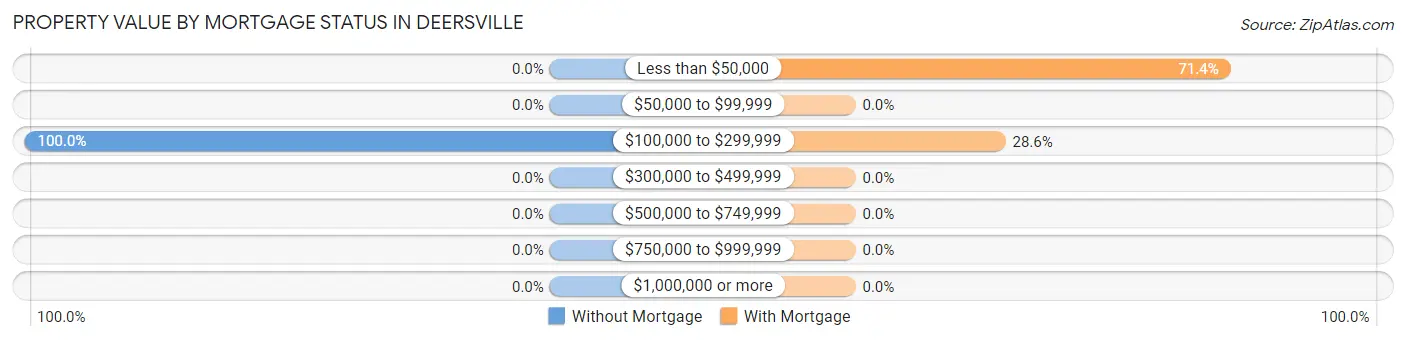
| Property Value | Without Mortgage | With Mortgage |
| Less than $50,000 | 0 (0.0%) | 5 (71.4%) |
| $50,000 to $99,999 | 0 (0.0%) | 0 (0.0%) |
| $100,000 to $299,999 | 2 (100.0%) | 2 (28.6%) |
| $300,000 to $499,999 | 0 (0.0%) | 0 (0.0%) |
| $500,000 to $749,999 | 0 (0.0%) | 0 (0.0%) |
| $750,000 to $999,999 | 0 (0.0%) | 0 (0.0%) |
| $1,000,000 or more | 0 (0.0%) | 0 (0.0%) |
| Total | 2 (100.0%) | 7 (100.0%) |
Household Income by Mortgage Status in Deersville
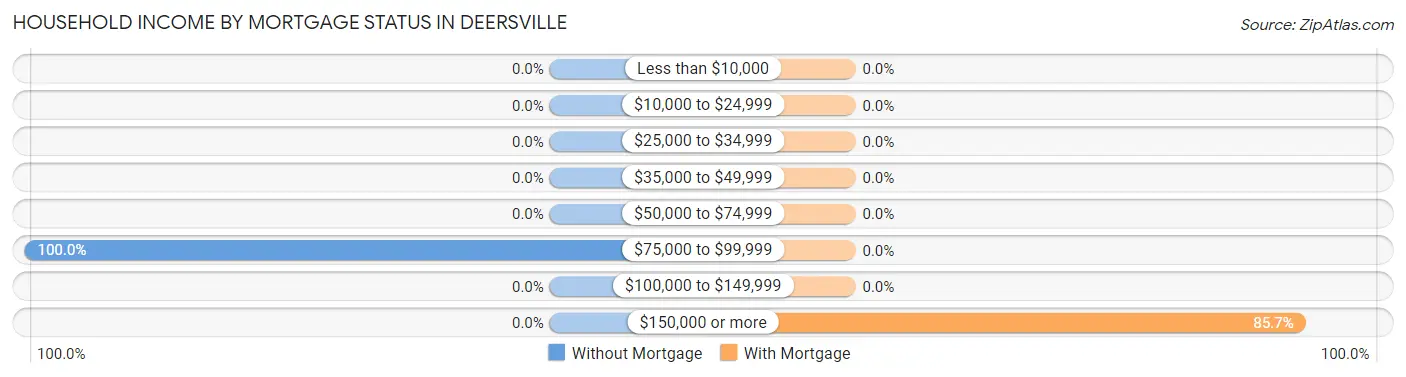
| Household Income | Without Mortgage | With Mortgage |
| Less than $10,000 | 0 (0.0%) | 0 (0.0%) |
| $10,000 to $24,999 | 0 (0.0%) | 0 (0.0%) |
| $25,000 to $34,999 | 0 (0.0%) | 0 (0.0%) |
| $35,000 to $49,999 | 0 (0.0%) | 0 (0.0%) |
| $50,000 to $74,999 | 0 (0.0%) | 0 (0.0%) |
| $75,000 to $99,999 | 2 (100.0%) | 0 (0.0%) |
| $100,000 to $149,999 | 0 (0.0%) | 0 (0.0%) |
| $150,000 or more | 0 (0.0%) | 6 (85.7%) |
| Total | 2 (100.0%) | 7 (100.0%) |
Property Value to Household Income Ratio in Deersville
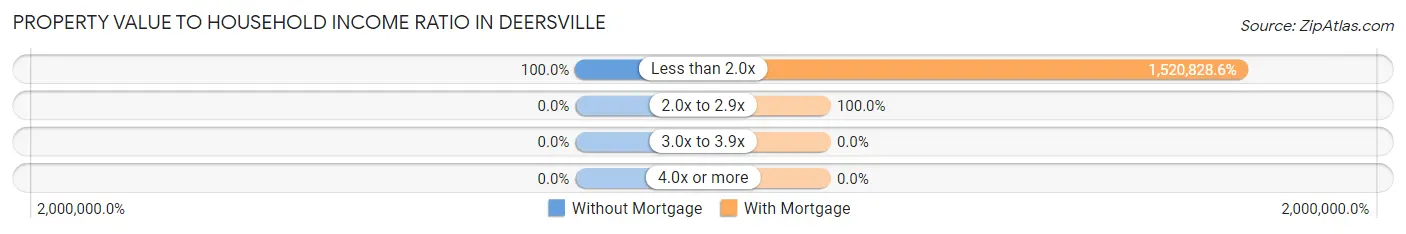
| Value-to-Income Ratio | Without Mortgage | With Mortgage |
| Less than 2.0x | 2 (100.0%) | 106,458 (1,520,828.6%) |
| 2.0x to 2.9x | 0 (0.0%) | 7 (100.0%) |
| 3.0x to 3.9x | 0 (0.0%) | 0 (0.0%) |
| 4.0x or more | 0 (0.0%) | 0 (0.0%) |
| Total | 2 (100.0%) | 7 (100.0%) |
Real Estate Taxes by Mortgage Status in Deersville
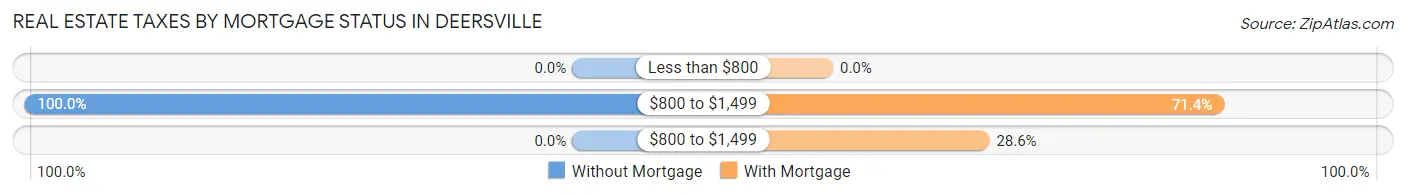
| Property Taxes | Without Mortgage | With Mortgage |
| Less than $800 | 0 (0.0%) | 0 (0.0%) |
| $800 to $1,499 | 2 (100.0%) | 5 (71.4%) |
| $800 to $1,499 | 0 (0.0%) | 2 (28.6%) |
| Total | 2 (100.0%) | 7 (100.0%) |
Health & Disability in Deersville
Health Insurance Coverage by Age in Deersville
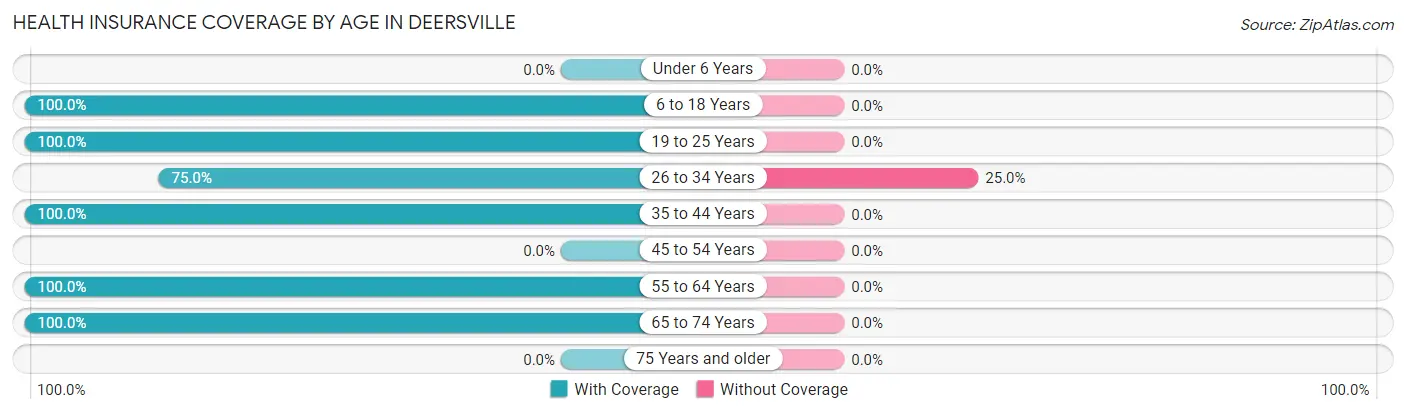
| Age Bracket | With Coverage | Without Coverage |
| Under 6 Years | 0 (0.0%) | 0 (0.0%) |
| 6 to 18 Years | 6 (100.0%) | 0 (0.0%) |
| 19 to 25 Years | 8 (100.0%) | 0 (0.0%) |
| 26 to 34 Years | 6 (75.0%) | 2 (25.0%) |
| 35 to 44 Years | 3 (100.0%) | 0 (0.0%) |
| 45 to 54 Years | 0 (0.0%) | 0 (0.0%) |
| 55 to 64 Years | 8 (100.0%) | 0 (0.0%) |
| 65 to 74 Years | 9 (100.0%) | 0 (0.0%) |
| 75 Years and older | 0 (0.0%) | 0 (0.0%) |
| Total | 40 (95.2%) | 2 (4.8%) |
Health Insurance Coverage by Citizenship Status in Deersville
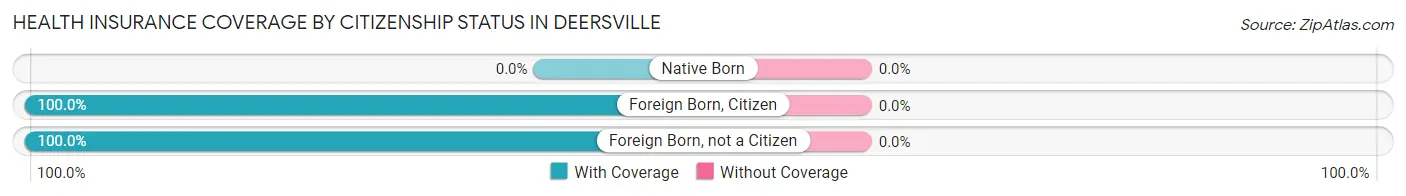
| Citizenship Status | With Coverage | Without Coverage |
| Native Born | 0 (0.0%) | 0 (0.0%) |
| Foreign Born, Citizen | 6 (100.0%) | 0 (0.0%) |
| Foreign Born, not a Citizen | 8 (100.0%) | 0 (0.0%) |
Health Insurance Coverage by Household Income in Deersville
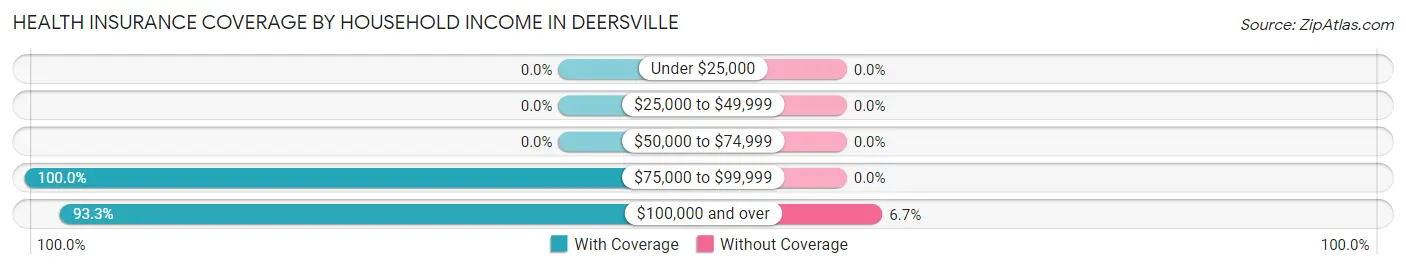
| Household Income | With Coverage | Without Coverage |
| Under $25,000 | 0 (0.0%) | 0 (0.0%) |
| $25,000 to $49,999 | 0 (0.0%) | 0 (0.0%) |
| $50,000 to $74,999 | 0 (0.0%) | 0 (0.0%) |
| $75,000 to $99,999 | 12 (100.0%) | 0 (0.0%) |
| $100,000 and over | 28 (93.3%) | 2 (6.7%) |
Public vs Private Health Insurance Coverage by Age in Deersville
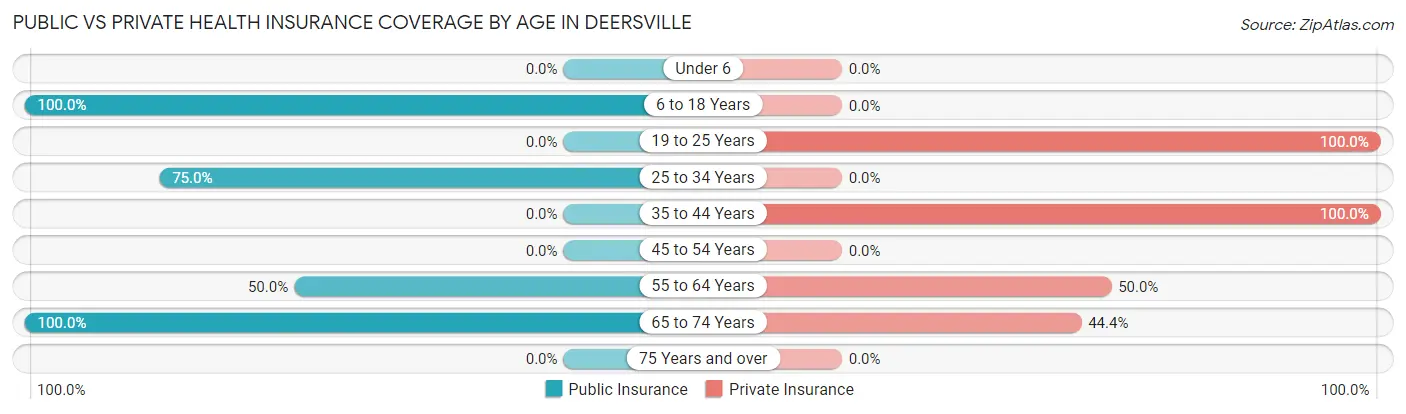
| Age Bracket | Public Insurance | Private Insurance |
| Under 6 | 0 (0.0%) | 0 (0.0%) |
| 6 to 18 Years | 6 (100.0%) | 0 (0.0%) |
| 19 to 25 Years | 0 (0.0%) | 8 (100.0%) |
| 25 to 34 Years | 6 (75.0%) | 0 (0.0%) |
| 35 to 44 Years | 0 (0.0%) | 3 (100.0%) |
| 45 to 54 Years | 0 (0.0%) | 0 (0.0%) |
| 55 to 64 Years | 4 (50.0%) | 4 (50.0%) |
| 65 to 74 Years | 9 (100.0%) | 4 (44.4%) |
| 75 Years and over | 0 (0.0%) | 0 (0.0%) |
| Total | 25 (59.5%) | 19 (45.2%) |
Disability Status by Sex by Age in Deersville
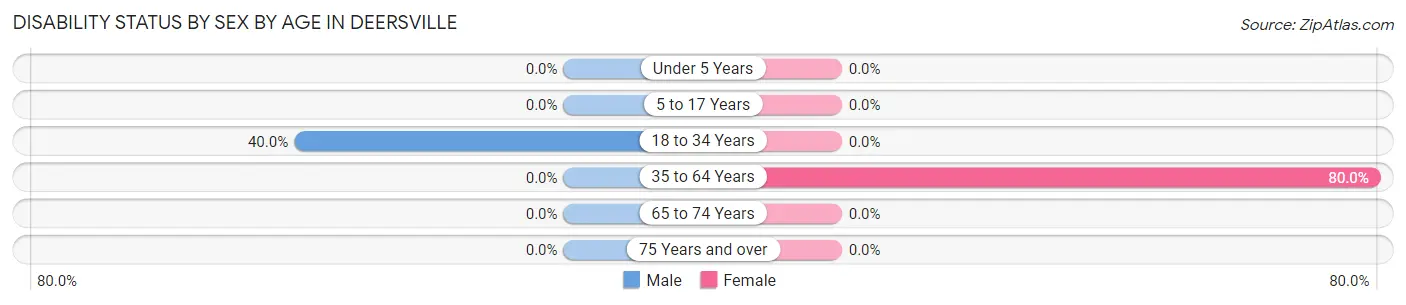
| Age Bracket | Male | Female |
| Under 5 Years | 0 (0.0%) | 0 (0.0%) |
| 5 to 17 Years | 0 (0.0%) | 0 (0.0%) |
| 18 to 34 Years | 2 (40.0%) | 0 (0.0%) |
| 35 to 64 Years | 0 (0.0%) | 4 (80.0%) |
| 65 to 74 Years | 0 (0.0%) | 0 (0.0%) |
| 75 Years and over | 0 (0.0%) | 0 (0.0%) |
Disability Class by Sex by Age in Deersville
Disability Class: Hearing Difficulty
| Age Bracket | Male | Female |
| Under 5 Years | 0 (0.0%) | 0 (0.0%) |
| 5 to 17 Years | 0 (0.0%) | 0 (0.0%) |
| 18 to 34 Years | 0 (0.0%) | 0 (0.0%) |
| 35 to 64 Years | 0 (0.0%) | 0 (0.0%) |
| 65 to 74 Years | 0 (0.0%) | 0 (0.0%) |
| 75 Years and over | 0 (0.0%) | 0 (0.0%) |
Disability Class: Vision Difficulty
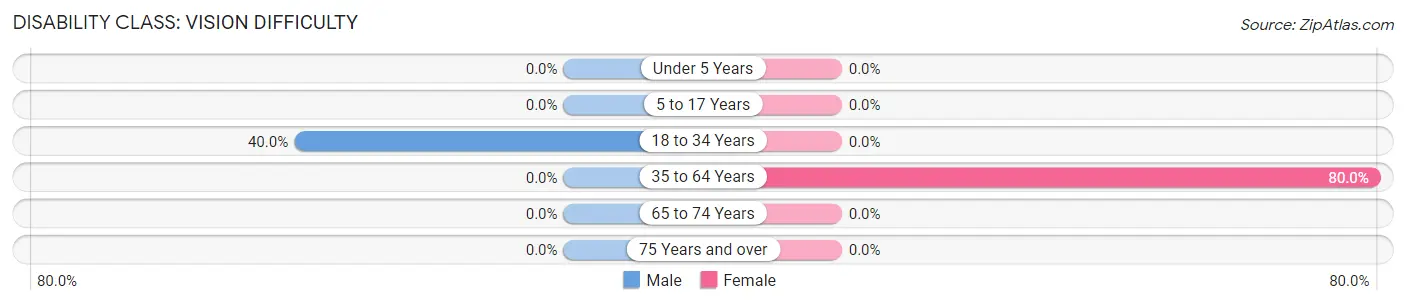
| Age Bracket | Male | Female |
| Under 5 Years | 0 (0.0%) | 0 (0.0%) |
| 5 to 17 Years | 0 (0.0%) | 0 (0.0%) |
| 18 to 34 Years | 2 (40.0%) | 0 (0.0%) |
| 35 to 64 Years | 0 (0.0%) | 4 (80.0%) |
| 65 to 74 Years | 0 (0.0%) | 0 (0.0%) |
| 75 Years and over | 0 (0.0%) | 0 (0.0%) |
Disability Class: Cognitive Difficulty
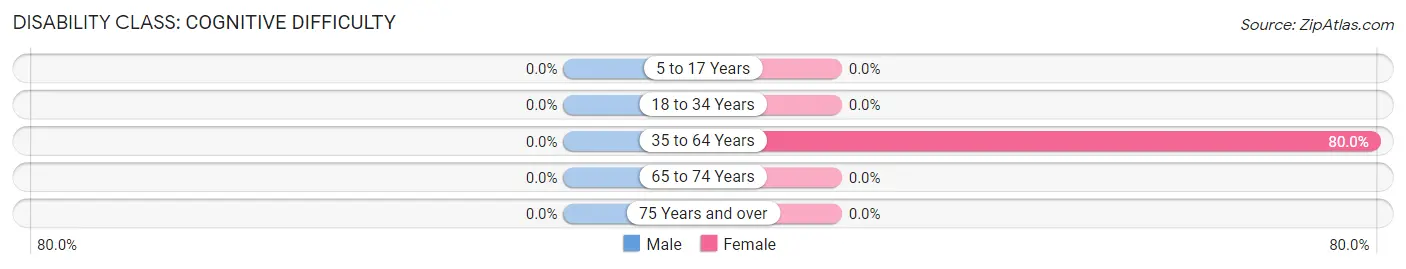
| Age Bracket | Male | Female |
| 5 to 17 Years | 0 (0.0%) | 0 (0.0%) |
| 18 to 34 Years | 0 (0.0%) | 0 (0.0%) |
| 35 to 64 Years | 0 (0.0%) | 4 (80.0%) |
| 65 to 74 Years | 0 (0.0%) | 0 (0.0%) |
| 75 Years and over | 0 (0.0%) | 0 (0.0%) |
Disability Class: Ambulatory Difficulty
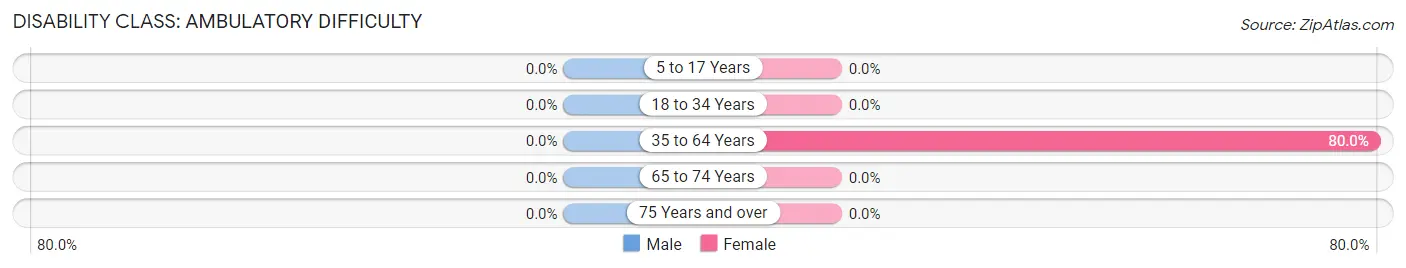
| Age Bracket | Male | Female |
| 5 to 17 Years | 0 (0.0%) | 0 (0.0%) |
| 18 to 34 Years | 0 (0.0%) | 0 (0.0%) |
| 35 to 64 Years | 0 (0.0%) | 4 (80.0%) |
| 65 to 74 Years | 0 (0.0%) | 0 (0.0%) |
| 75 Years and over | 0 (0.0%) | 0 (0.0%) |
Disability Class: Self-Care Difficulty
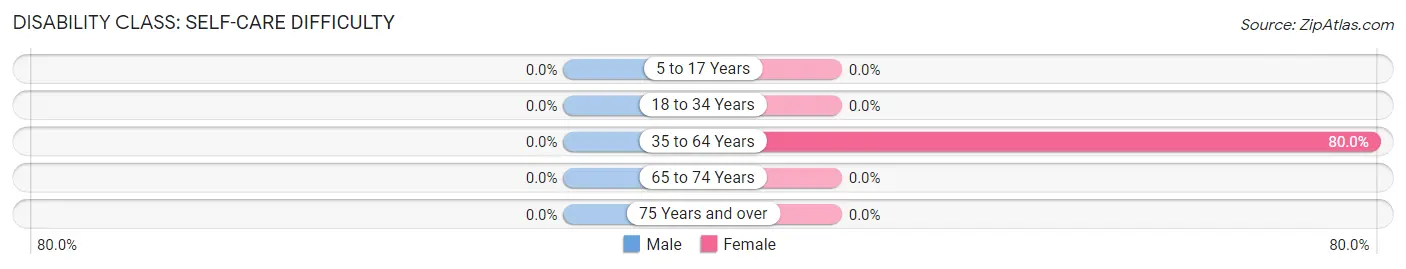
| Age Bracket | Male | Female |
| 5 to 17 Years | 0 (0.0%) | 0 (0.0%) |
| 18 to 34 Years | 0 (0.0%) | 0 (0.0%) |
| 35 to 64 Years | 0 (0.0%) | 4 (80.0%) |
| 65 to 74 Years | 0 (0.0%) | 0 (0.0%) |
| 75 Years and over | 0 (0.0%) | 0 (0.0%) |
Technology Access in Deersville
Computing Device Access in Deersville
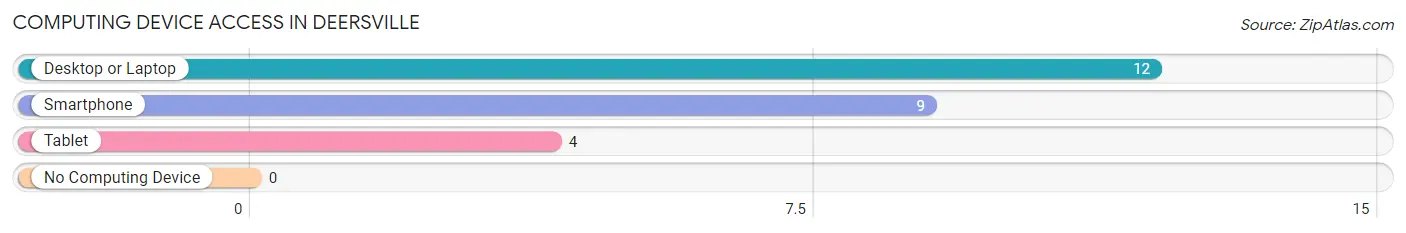
| Device Type | # Households | % Households |
| Desktop or Laptop | 12 | 85.7% |
| Smartphone | 9 | 64.3% |
| Tablet | 4 | 28.6% |
| No Computing Device | 0 | 0.0% |
| Total | 14 | 100.0% |
Internet Access in Deersville
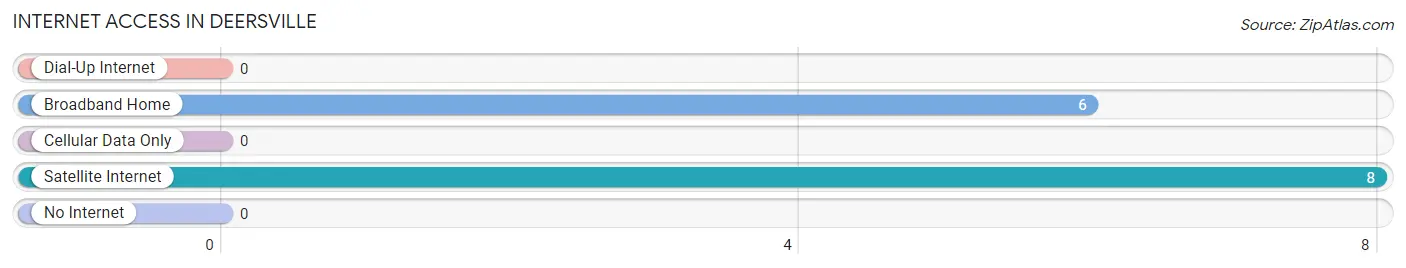
| Internet Type | # Households | % Households |
| Dial-Up Internet | 0 | 0.0% |
| Broadband Home | 6 | 42.9% |
| Cellular Data Only | 0 | 0.0% |
| Satellite Internet | 8 | 57.1% |
| No Internet | 0 | 0.0% |
| Total | 14 | 100.0% |
Deersville Summary
Deersville, Ohio is a small village located in Harrison County, Ohio. It is situated in the Appalachian foothills of eastern Ohio, approximately 30 miles east of the city of Canton. The village has a population of approximately 500 people and is part of the Cadiz-Harrison County Joint Economic Development District.
History
Deersville was founded in 1817 by a group of settlers from Pennsylvania. The village was named after the abundance of deer in the area. The first settlers were primarily farmers and the village grew slowly over the years. In 1845, the village was incorporated and the first post office was established.
In the late 19th century, the village experienced a period of growth due to the development of the coal industry in the area. The village was home to several coal mines and the population increased to over 1,000 people. The village also had several stores, a hotel, a bank, and a school.
In the early 20th century, the coal industry began to decline and the population of the village began to decrease. By the 1950s, the population had dropped to less than 500 people. The village has remained relatively unchanged since then.
Geography
Deersville is located in the Appalachian foothills of eastern Ohio. The village is situated in a valley surrounded by hills and forests. The village is located approximately 30 miles east of the city of Canton and is part of the Cadiz-Harrison County Joint Economic Development District.
The village is located at an elevation of 890 feet above sea level and has an area of 0.6 square miles. The climate is humid continental, with hot summers and cold winters. The average annual temperature is 52 degrees Fahrenheit and the average annual precipitation is 39 inches.
Economy
The economy of Deersville is largely based on agriculture and tourism. The village is home to several farms that produce corn, soybeans, and hay. The village also has several small businesses, including a grocery store, a hardware store, and a restaurant.
Tourism is an important part of the local economy. The village is home to several attractions, including the Deersville Historical Museum, the Deersville Nature Center, and the Deersville Railroad Museum. The village also hosts several annual events, including the Deersville Days Festival and the Deersville Harvest Festival.
Demographics
As of the 2010 census, the population of Deersville was 498 people. The racial makeup of the village was 97.2% White, 0.2% African American, 0.2% Native American, 0.2% Asian, 0.2% from other races, and 1.8% from two or more races. Hispanic or Latino of any race were 0.6% of the population.
The median household income in Deersville was $37,500 and the median family income was $41,250. The per capita income was $17,845. About 11.2% of families and 13.2% of the population were below the poverty line, including 16.2% of those under age 18 and 8.2% of those age 65 or over.
Common Questions
What is Per Capita Income in Deersville?
Per Capita income in Deersville is $36,319.
What is the Median Family Income in Deersville?
Median Family Income in Deersville is $106,042.
What is the Median Household income in Deersville?
Median Household Income in Deersville is $96,250.
What is Income or Wage Gap in Deersville?
Income or Wage Gap in Deersville is 68.1%.
Women in Deersville earn 31.9 cents for every dollar earned by a man.
What is Inequality or Gini Index in Deersville?
Inequality or Gini Index in Deersville is 0.11.
What is the Total Population of Deersville?
Total Population of Deersville is 42.
What is the Total Male Population of Deersville?
Total Male Population of Deersville is 17.
What is the Total Female Population of Deersville?
Total Female Population of Deersville is 25.
What is the Ratio of Males per 100 Females in Deersville?
There are 68.00 Males per 100 Females in Deersville.
What is the Ratio of Females per 100 Males in Deersville?
There are 147.06 Females per 100 Males in Deersville.
What is the Median Population Age in Deersville?
Median Population Age in Deersville is 34.8 Years.
What is the Average Family Size in Deersville
Average Family Size in Deersville is 3.8 People.
What is the Average Household Size in Deersville
Average Household Size in Deersville is 3.0 People.
How Large is the Labor Force in Deersville?
There are 27 People in the Labor Forcein in Deersville.
What is the Percentage of People in the Labor Force in Deersville?
75.0% of People are in the Labor Force in Deersville.