Zip Codes with the Highest Percentage of Families with Income Above $100,000 in Steubenville, OH
RELATED REPORTS & OPTIONS
Family Income | $100k+
Steubenville
Compare Zip Codes
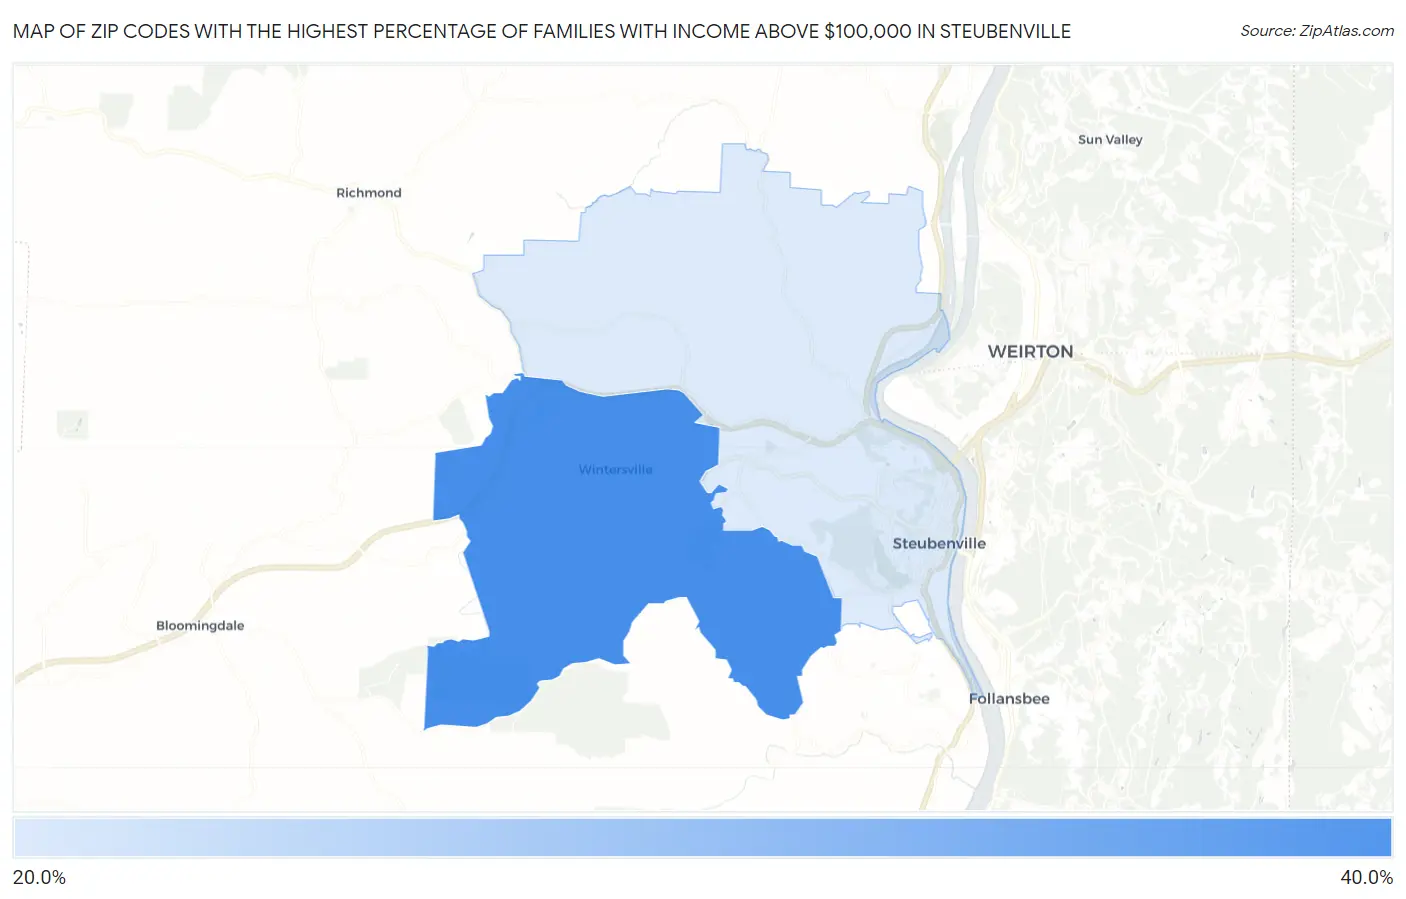
Map of Zip Codes with the Highest Percentage of Families with Income Above $100,000 in Steubenville
27.9%
37.4%
Zip Codes with the Highest Percentage of Families with Income Above $100,000 in Steubenville, OH
| Zip Code | Families with Income > $100k | vs State | vs National | |
| 1. | 43953 | 37.4% | 42.3%(-4.90)#555 | 46.1%(-8.70)#16,203 |
| 2. | 43952 | 27.9% | 42.3%(-14.4)#829 | 46.1%(-18.2)#22,834 |
1
Common Questions
What are the Top Zip Codes with the Highest Percentage of Families with Income Above $100,000 in Steubenville, OH?
Top Zip Codes with the Highest Percentage of Families with Income Above $100,000 in Steubenville, OH are:
What zip code has the Highest Percentage of Families with Income Above $100,000 in Steubenville, OH?
43953 has the Highest Percentage of Families with Income Above $100,000 in Steubenville, OH with 37.4%.
What is the Percentage of Families with Income Above $100,000 in Steubenville, OH?
Percentage of Families with Income Above $100,000 in Steubenville is 26.0%.
What is the Percentage of Families with Income Above $100,000 in Ohio?
Percentage of Families with Income Above $100,000 in Ohio is 42.3%.
What is the Percentage of Families with Income Above $100,000 in the United States?
Percentage of Families with Income Above $100,000 in the United States is 46.1%.