Zip Codes with the Highest Percentage of Families with Income Above $100,000 in Cincinnati, OH
RELATED REPORTS & OPTIONS
Family Income | $100k+
Cincinnati
Compare Zip Codes
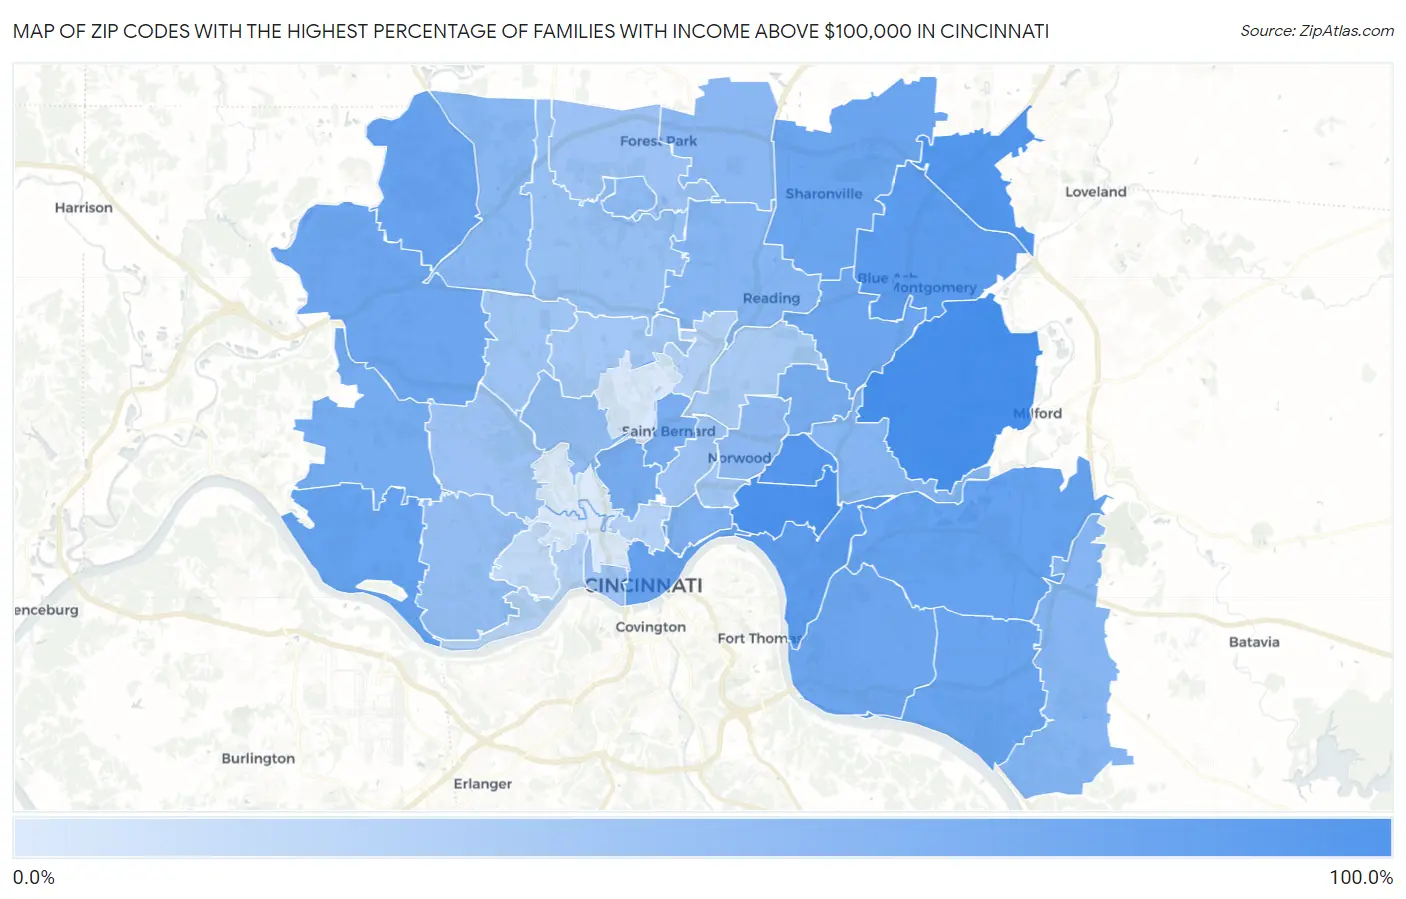
Map of Zip Codes with the Highest Percentage of Families with Income Above $100,000 in Cincinnati
4.3%
81.1%
Zip Codes with the Highest Percentage of Families with Income Above $100,000 in Cincinnati, OH
| Zip Code | Families with Income > $100k | vs State | vs National | |
| 1. | 45243 | 81.1% | 42.3%(+38.8)#17 | 46.1%(+35.0)#906 |
| 2. | 45208 | 77.9% | 42.3%(+35.6)#22 | 46.1%(+31.8)#1,270 |
| 3. | 45249 | 72.9% | 42.3%(+30.6)#39 | 46.1%(+26.8)#2,058 |
| 4. | 45209 | 71.5% | 42.3%(+29.2)#44 | 46.1%(+25.4)#2,313 |
| 5. | 45242 | 68.8% | 42.3%(+26.5)#56 | 46.1%(+22.7)#2,855 |
| 6. | 45226 | 66.1% | 42.3%(+23.8)#68 | 46.1%(+20.0)#3,476 |
| 7. | 45244 | 61.9% | 42.3%(+19.6)#95 | 46.1%(+15.8)#4,575 |
| 8. | 45233 | 61.7% | 42.3%(+19.4)#97 | 46.1%(+15.6)#4,637 |
| 9. | 45252 | 61.3% | 42.3%(+19.0)#104 | 46.1%(+15.2)#4,764 |
| 10. | 45202 | 60.2% | 42.3%(+17.9)#115 | 46.1%(+14.1)#5,074 |
| 11. | 45255 | 59.7% | 42.3%(+17.4)#123 | 46.1%(+13.6)#5,223 |
| 12. | 45241 | 57.7% | 42.3%(+15.4)#143 | 46.1%(+11.6)#5,873 |
| 13. | 45247 | 56.6% | 42.3%(+14.3)#157 | 46.1%(+10.5)#6,225 |
| 14. | 45230 | 56.2% | 42.3%(+13.9)#166 | 46.1%(+10.1)#6,364 |
| 15. | 45236 | 56.1% | 42.3%(+13.8)#167 | 46.1%(+10.0)#6,403 |
| 16. | 45248 | 52.5% | 42.3%(+10.2)#213 | 46.1%(+6.40)#7,752 |
| 17. | 45213 | 51.3% | 42.3%(+9.00)#236 | 46.1%(+5.20)#8,285 |
| 18. | 45220 | 51.0% | 42.3%(+8.70)#242 | 46.1%(+4.90)#8,410 |
| 19. | 45217 | 50.5% | 42.3%(+8.20)#250 | 46.1%(+4.40)#8,624 |
| 20. | 45206 | 48.1% | 42.3%(+5.80)#276 | 46.1%(+2.00)#9,703 |
| 21. | 45215 | 44.5% | 42.3%(+2.20)#347 | 46.1%(-1.60)#11,613 |
| 22. | 45245 | 44.5% | 42.3%(+2.20)#348 | 46.1%(-1.60)#11,614 |
| 23. | 45227 | 44.4% | 42.3%(+2.10)#350 | 46.1%(-1.70)#11,664 |
| 24. | 45251 | 42.2% | 42.3%(-0.100)#409 | 46.1%(-3.90)#12,988 |
| 25. | 45246 | 41.2% | 42.3%(-1.10)#436 | 46.1%(-4.90)#13,598 |
| 26. | 45212 | 40.3% | 42.3%(-2.00)#457 | 46.1%(-5.80)#14,182 |
| 27. | 45218 | 39.0% | 42.3%(-3.30)#500 | 46.1%(-7.10)#15,099 |
| 28. | 45223 | 37.7% | 42.3%(-4.60)#547 | 46.1%(-8.40)#15,976 |
| 29. | 45238 | 37.1% | 42.3%(-5.20)#568 | 46.1%(-9.00)#16,427 |
| 30. | 45231 | 36.1% | 42.3%(-6.20)#597 | 46.1%(-10.0)#17,099 |
| 31. | 45211 | 32.7% | 42.3%(-9.60)#698 | 46.1%(-13.4)#19,502 |
| 32. | 45203 | 32.6% | 42.3%(-9.70)#701 | 46.1%(-13.5)#19,628 |
| 33. | 45240 | 32.3% | 42.3%(-10.0)#707 | 46.1%(-13.8)#19,808 |
| 34. | 45229 | 32.2% | 42.3%(-10.1)#711 | 46.1%(-13.9)#19,901 |
| 35. | 45239 | 31.5% | 42.3%(-10.8)#732 | 46.1%(-14.6)#20,330 |
| 36. | 45207 | 30.3% | 42.3%(-12.0)#776 | 46.1%(-15.8)#21,207 |
| 37. | 45224 | 28.8% | 42.3%(-13.5)#811 | 46.1%(-17.3)#22,245 |
| 38. | 45237 | 27.2% | 42.3%(-15.1)#849 | 46.1%(-18.9)#23,297 |
| 39. | 45216 | 22.1% | 42.3%(-20.2)#975 | 46.1%(-24.0)#26,251 |
| 40. | 45204 | 21.2% | 42.3%(-21.1)#988 | 46.1%(-24.9)#26,706 |
| 41. | 45219 | 20.1% | 42.3%(-22.2)#1,010 | 46.1%(-26.0)#27,185 |
| 42. | 45205 | 15.7% | 42.3%(-26.6)#1,066 | 46.1%(-30.4)#28,875 |
| 43. | 45214 | 5.5% | 42.3%(-36.8)#1,141 | 46.1%(-40.6)#30,932 |
| 44. | 45232 | 5.0% | 42.3%(-37.3)#1,145 | 46.1%(-41.1)#30,984 |
| 45. | 45225 | 4.3% | 42.3%(-38.0)#1,150 | 46.1%(-41.8)#31,055 |
1
Common Questions
What are the Top 10 Zip Codes with the Highest Percentage of Families with Income Above $100,000 in Cincinnati, OH?
Top 10 Zip Codes with the Highest Percentage of Families with Income Above $100,000 in Cincinnati, OH are:
What zip code has the Highest Percentage of Families with Income Above $100,000 in Cincinnati, OH?
45243 has the Highest Percentage of Families with Income Above $100,000 in Cincinnati, OH with 81.1%.
What is the Percentage of Families with Income Above $100,000 in Cincinnati, OH?
Percentage of Families with Income Above $100,000 in Cincinnati is 35.2%.
What is the Percentage of Families with Income Above $100,000 in Ohio?
Percentage of Families with Income Above $100,000 in Ohio is 42.3%.
What is the Percentage of Families with Income Above $100,000 in the United States?
Percentage of Families with Income Above $100,000 in the United States is 46.1%.