Harrisburg, OH Map & Demographics
Harrisburg Map
Harrisburg Overview
$47,195
PER CAPITA INCOME
$195,313
AVG FAMILY INCOME
0.5%
WAGE / INCOME GAP [ % ]
99.5¢/ $1
WAGE / INCOME GAP [ $ ]
0.41
INEQUALITY / GINI INDEX
224
TOTAL POPULATION
83
MALE POPULATION
141
FEMALE POPULATION
58.87
MALES / 100 FEMALES
169.88
FEMALES / 100 MALES
51.4
MEDIAN AGE
3.2
AVG FAMILY SIZE
2.2
AVG HOUSEHOLD SIZE
105
LABOR FORCE [ PEOPLE ]
60.0%
PERCENT IN LABOR FORCE
Harrisburg Zip Codes
Harrisburg Area Codes
Income in Harrisburg
Income Overview in Harrisburg
| Characteristic | Number | Measure |
| Per Capita Income | 224 | $47,195 |
| Median Family Income | 56 | $195,313 |
| Mean Family Income | 56 | $160,477 |
| Median Household Income | 100 | $0 |
| Mean Household Income | 100 | $101,394 |
| Income Deficit | 56 | $0 |
| Wage / Income Gap (%) | 224 | 0.54% |
| Wage / Income Gap ($) | 224 | 99.46¢ per $1 |
| Gini / Inequality Index | 224 | 0.41 |
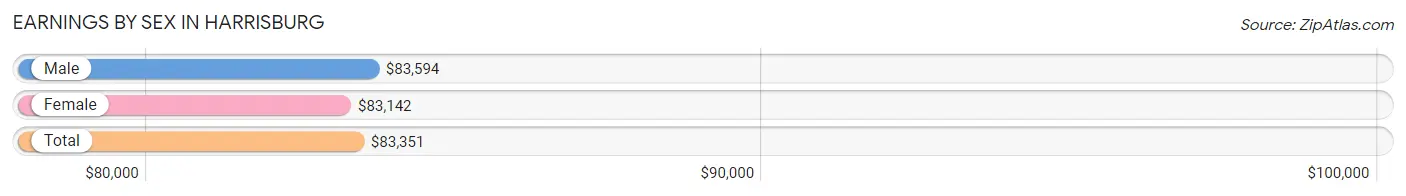
Earnings by Sex in Harrisburg
Average Earnings in Harrisburg are $83,351, $83,594 for men and $83,142 for women, a difference of 0.5%.
| Sex | Number | Average Earnings |
| Male | 50 (47.6%) | $83,594 |
| Female | 55 (52.4%) | $83,142 |
| Total | 105 (100.0%) | $83,351 |
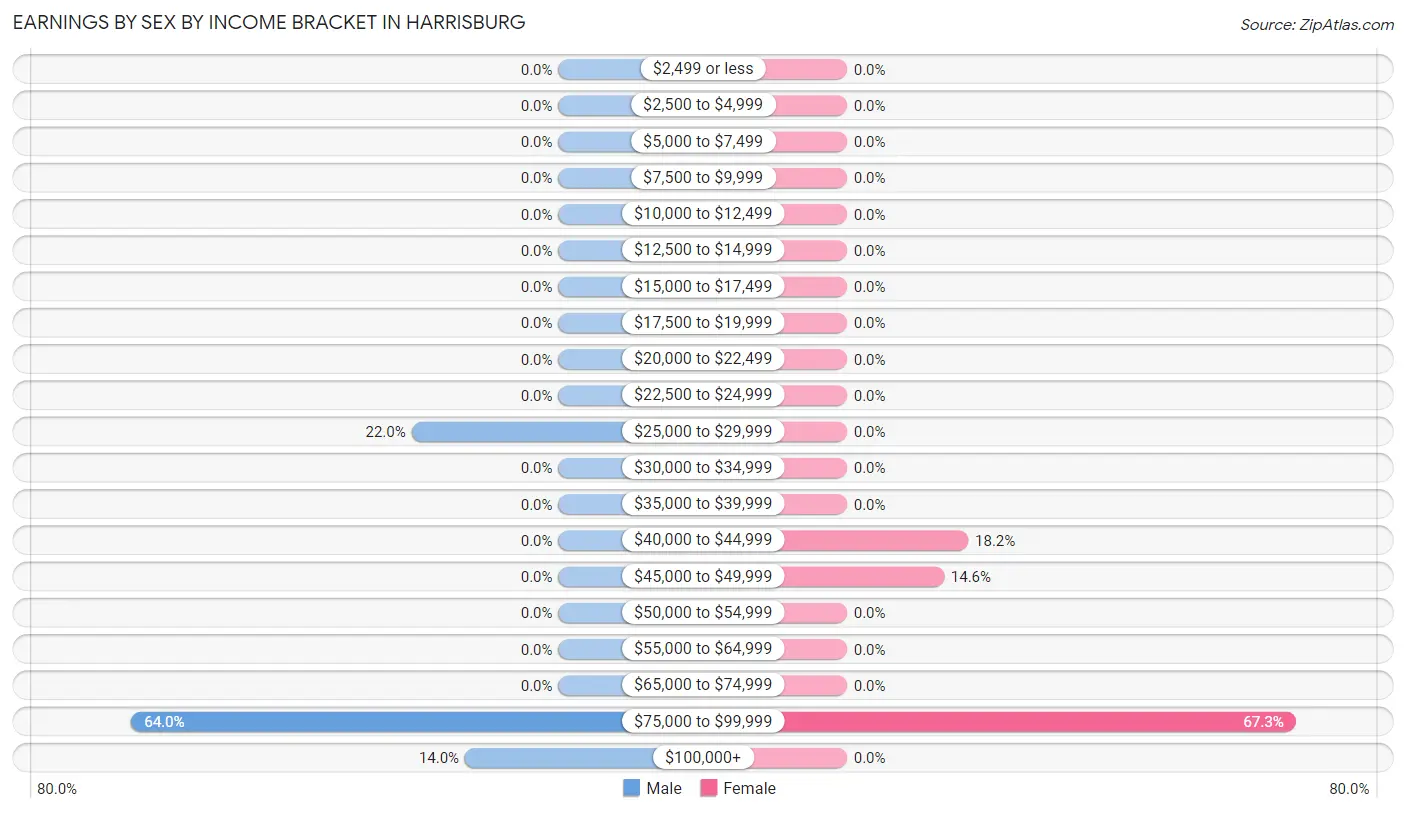
Earnings by Sex by Income Bracket in Harrisburg
The most common earnings brackets in Harrisburg are $75,000 to $99,999 for men (32 | 64.0%) and $75,000 to $99,999 for women (37 | 67.3%).
| Income | Male | Female |
| $2,499 or less | 0 (0.0%) | 0 (0.0%) |
| $2,500 to $4,999 | 0 (0.0%) | 0 (0.0%) |
| $5,000 to $7,499 | 0 (0.0%) | 0 (0.0%) |
| $7,500 to $9,999 | 0 (0.0%) | 0 (0.0%) |
| $10,000 to $12,499 | 0 (0.0%) | 0 (0.0%) |
| $12,500 to $14,999 | 0 (0.0%) | 0 (0.0%) |
| $15,000 to $17,499 | 0 (0.0%) | 0 (0.0%) |
| $17,500 to $19,999 | 0 (0.0%) | 0 (0.0%) |
| $20,000 to $22,499 | 0 (0.0%) | 0 (0.0%) |
| $22,500 to $24,999 | 0 (0.0%) | 0 (0.0%) |
| $25,000 to $29,999 | 11 (22.0%) | 0 (0.0%) |
| $30,000 to $34,999 | 0 (0.0%) | 0 (0.0%) |
| $35,000 to $39,999 | 0 (0.0%) | 0 (0.0%) |
| $40,000 to $44,999 | 0 (0.0%) | 10 (18.2%) |
| $45,000 to $49,999 | 0 (0.0%) | 8 (14.5%) |
| $50,000 to $54,999 | 0 (0.0%) | 0 (0.0%) |
| $55,000 to $64,999 | 0 (0.0%) | 0 (0.0%) |
| $65,000 to $74,999 | 0 (0.0%) | 0 (0.0%) |
| $75,000 to $99,999 | 32 (64.0%) | 37 (67.3%) |
| $100,000+ | 7 (14.0%) | 0 (0.0%) |
| Total | 50 (100.0%) | 55 (100.0%) |
Earnings by Sex by Educational Attainment in Harrisburg
| Educational Attainment | Male Income | Female Income |
| Less than High School | - | - |
| High School Diploma | - | - |
| College or Associate's Degree | - | - |
| Bachelor's Degree | - | - |
| Graduate Degree | - | - |
| Total | $83,594 | $83,142 |
Family Income in Harrisburg
Family Income Brackets in Harrisburg
According to the Harrisburg family income data, there are 40 families falling into the $150,000 to $199,999 income range, which is the most common income bracket and makes up 71.4% of all families.
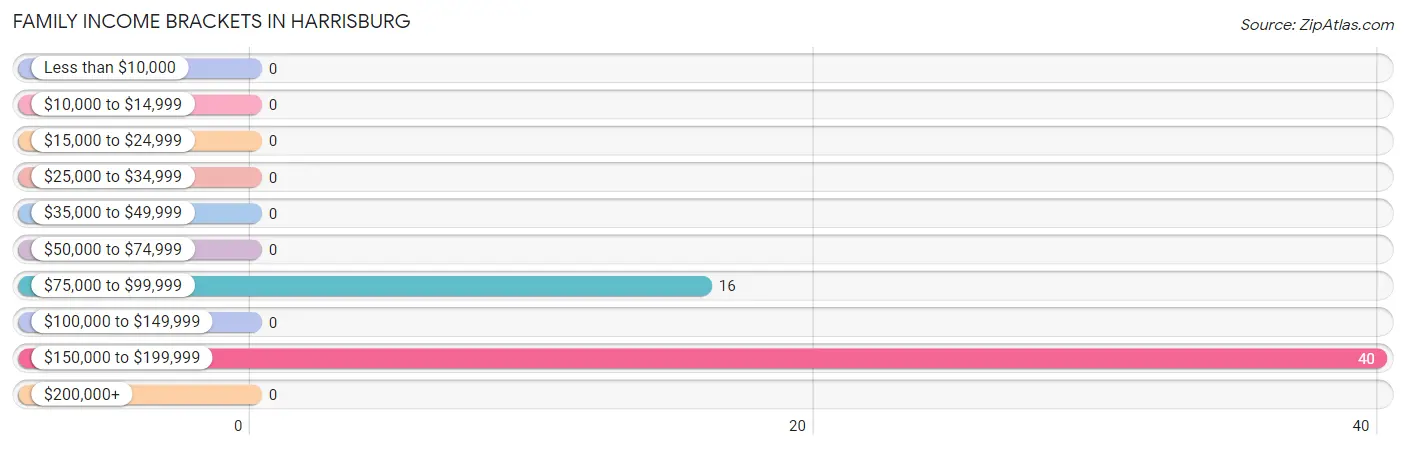
| Income Bracket | # Families | % Families |
| Less than $10,000 | 0 | 0.0% |
| $10,000 to $14,999 | 0 | 0.0% |
| $15,000 to $24,999 | 0 | 0.0% |
| $25,000 to $34,999 | 0 | 0.0% |
| $35,000 to $49,999 | 0 | 0.0% |
| $50,000 to $74,999 | 0 | 0.0% |
| $75,000 to $99,999 | 16 | 28.6% |
| $100,000 to $149,999 | 0 | 0.0% |
| $150,000 to $199,999 | 40 | 71.4% |
| $200,000+ | 0 | 0.0% |
Family Income by Famaliy Size in Harrisburg
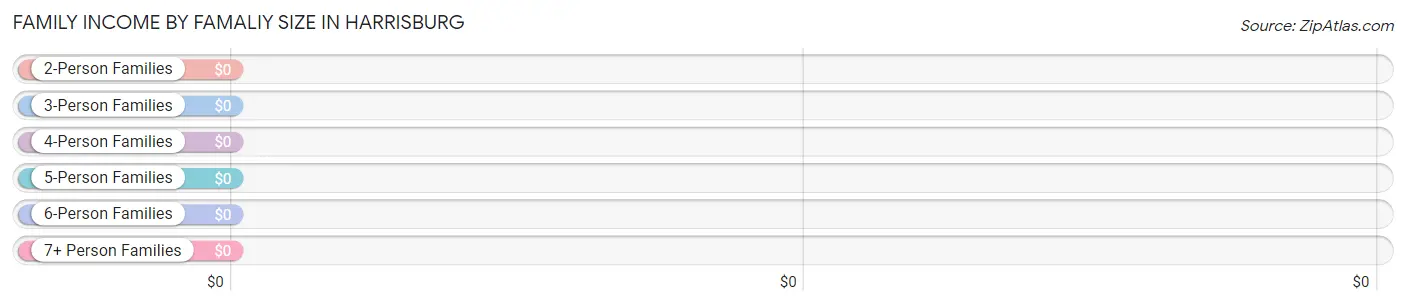
| Income Bracket | # Families | Median Income |
| 2-Person Families | 6 (10.7%) | $0 |
| 3-Person Families | 42 (75.0%) | $0 |
| 4-Person Families | 8 (14.3%) | $0 |
| 5-Person Families | 0 (0.0%) | $0 |
| 6-Person Families | 0 (0.0%) | $0 |
| 7+ Person Families | 0 (0.0%) | $0 |
| Total | 56 (100.0%) | $195,313 |
Family Income by Number of Earners in Harrisburg
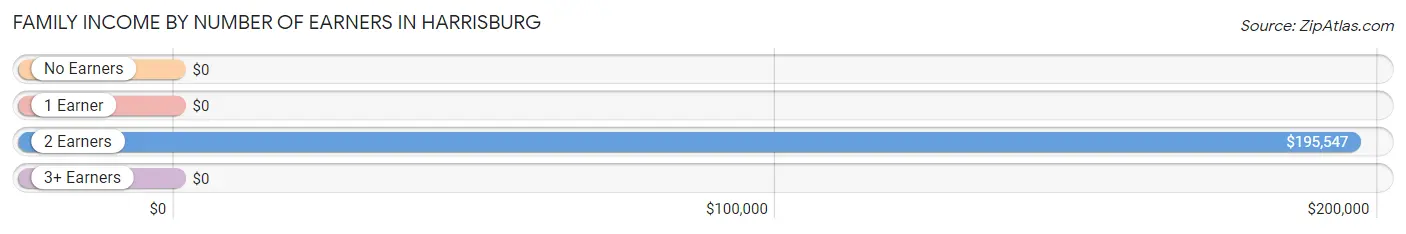
| Number of Earners | # Families | Median Income |
| No Earners | 6 (10.7%) | $0 |
| 1 Earner | 0 (0.0%) | $0 |
| 2 Earners | 50 (89.3%) | $195,547 |
| 3+ Earners | 0 (0.0%) | $0 |
| Total | 56 (100.0%) | $195,313 |
Household Income in Harrisburg
Household Income Brackets in Harrisburg
With 40 households falling in the category, the $150,000 to $199,999 income range is the most frequent in Harrisburg, accounting for 40.0% of all households.
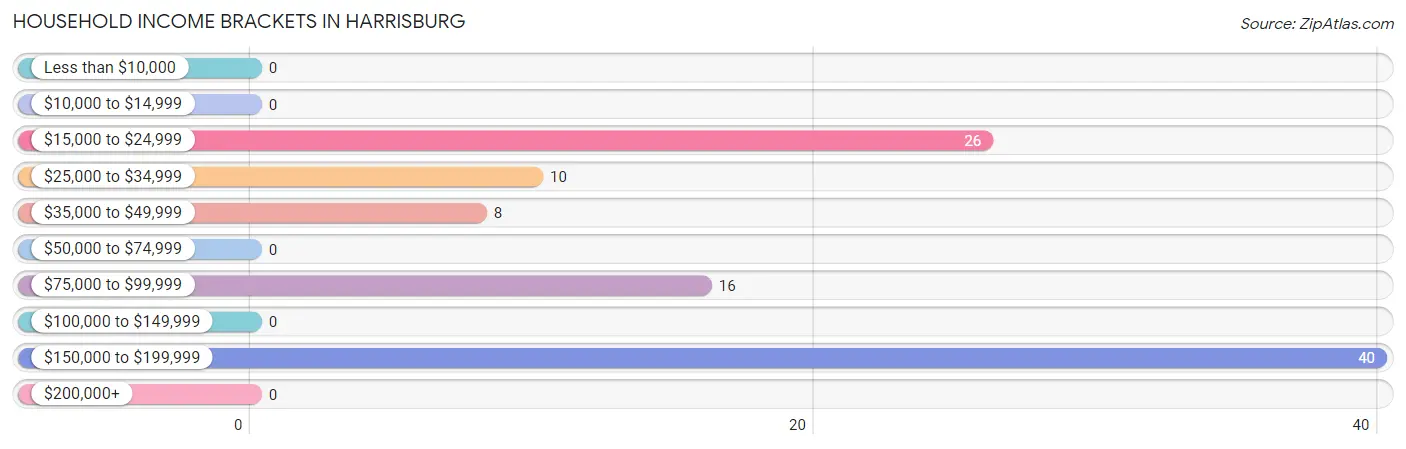
| Income Bracket | # Households | % Households |
| Less than $10,000 | 0 | 0.0% |
| $10,000 to $14,999 | 0 | 0.0% |
| $15,000 to $24,999 | 26 | 26.0% |
| $25,000 to $34,999 | 10 | 10.0% |
| $35,000 to $49,999 | 8 | 8.0% |
| $50,000 to $74,999 | 0 | 0.0% |
| $75,000 to $99,999 | 16 | 16.0% |
| $100,000 to $149,999 | 0 | 0.0% |
| $150,000 to $199,999 | 40 | 40.0% |
| $200,000+ | 0 | 0.0% |
Household Income by Householder Age in Harrisburg
| Income Bracket | # Households | Median Income |
| 15 to 24 Years | 0 (0.0%) | $0 |
| 25 to 44 Years | 8 (8.0%) | $0 |
| 45 to 64 Years | 52 (52.0%) | $0 |
| 65+ Years | 40 (40.0%) | $0 |
| Total | 100 (100.0%) | $0 |
Poverty in Harrisburg
Income Below Poverty by Sex and Age in Harrisburg
| Age Bracket | Male | Female |
| Under 5 Years | 0 (0.0%) | 0 (0.0%) |
| 5 Years | 0 (0.0%) | 0 (0.0%) |
| 6 to 11 Years | 0 (0.0%) | 0 (0.0%) |
| 12 to 14 Years | 0 (0.0%) | 0 (0.0%) |
| 15 Years | 0 (0.0%) | 0 (0.0%) |
| 16 and 17 Years | 0 (0.0%) | 0 (0.0%) |
| 18 to 24 Years | 0 (0.0%) | 0 (0.0%) |
| 25 to 34 Years | 0 (0.0%) | 0 (0.0%) |
| 35 to 44 Years | 0 (0.0%) | 0 (0.0%) |
| 45 to 54 Years | 0 (0.0%) | 0 (0.0%) |
| 55 to 64 Years | 0 (0.0%) | 0 (0.0%) |
| 65 to 74 Years | 0 (0.0%) | 0 (0.0%) |
| 75 Years and over | 0 (0.0%) | 0 (0.0%) |
| Total | 0 (0.0%) | 0 (0.0%) |
Income Above Poverty by Sex and Age in Harrisburg
According to the poverty statistics in Harrisburg, males aged 6 to 11 years and females aged 5 years are the age groups that are most secure financially, with 100.0% of males and 100.0% of females in these age groups living above the poverty line.
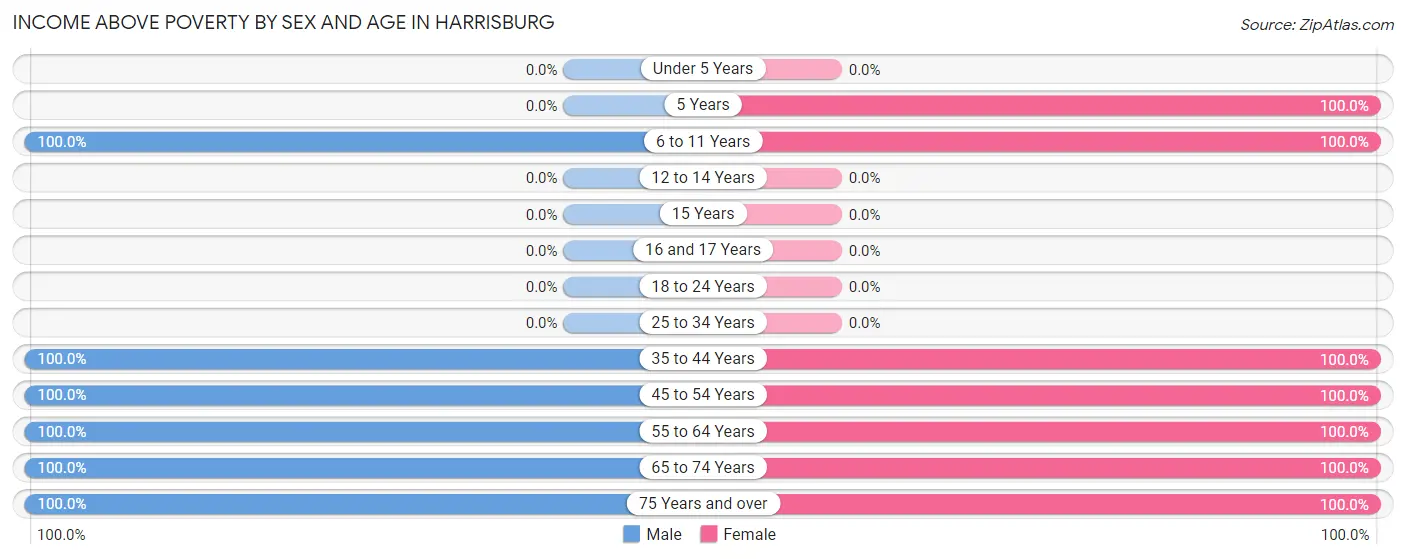
| Age Bracket | Male | Female |
| Under 5 Years | 0 (0.0%) | 0 (0.0%) |
| 5 Years | 0 (0.0%) | 33 (100.0%) |
| 6 to 11 Years | 8 (100.0%) | 8 (100.0%) |
| 12 to 14 Years | 0 (0.0%) | 0 (0.0%) |
| 15 Years | 0 (0.0%) | 0 (0.0%) |
| 16 and 17 Years | 0 (0.0%) | 0 (0.0%) |
| 18 to 24 Years | 0 (0.0%) | 0 (0.0%) |
| 25 to 34 Years | 0 (0.0%) | 0 (0.0%) |
| 35 to 44 Years | 7 (100.0%) | 8 (100.0%) |
| 45 to 54 Years | 32 (100.0%) | 50 (100.0%) |
| 55 to 64 Years | 21 (100.0%) | 10 (100.0%) |
| 65 to 74 Years | 7 (100.0%) | 6 (100.0%) |
| 75 Years and over | 8 (100.0%) | 26 (100.0%) |
| Total | 83 (100.0%) | 141 (100.0%) |
Income Below Poverty Among Married-Couple Families in Harrisburg
| Children | Above Poverty | Below Poverty |
| No Children | 16 (100.0%) | 0 (0.0%) |
| 1 or 2 Children | 40 (100.0%) | 0 (0.0%) |
| 3 or 4 Children | 0 (0.0%) | 0 (0.0%) |
| 5 or more Children | 0 (0.0%) | 0 (0.0%) |
| Total | 56 (100.0%) | 0 (0.0%) |
Income Below Poverty Among Single-Parent Households in Harrisburg
| Children | Single Father | Single Mother |
| No Children | 0 (0.0%) | 0 (0.0%) |
| 1 or 2 Children | 0 (0.0%) | 0 (0.0%) |
| 3 or 4 Children | 0 (0.0%) | 0 (0.0%) |
| 5 or more Children | 0 (0.0%) | 0 (0.0%) |
| Total | 0 (0.0%) | 0 (0.0%) |
Income Below Poverty Among Married-Couple vs Single-Parent Households in Harrisburg
| Children | Married-Couple Families | Single-Parent Households |
| No Children | 0 (0.0%) | 0 (0.0%) |
| 1 or 2 Children | 0 (0.0%) | 0 (0.0%) |
| 3 or 4 Children | 0 (0.0%) | 0 (0.0%) |
| 5 or more Children | 0 (0.0%) | 0 (0.0%) |
| Total | 0 (0.0%) | 0 (0.0%) |
Race in Harrisburg
The most populous races in Harrisburg are , and White / Caucasian (224 | 100.0%).
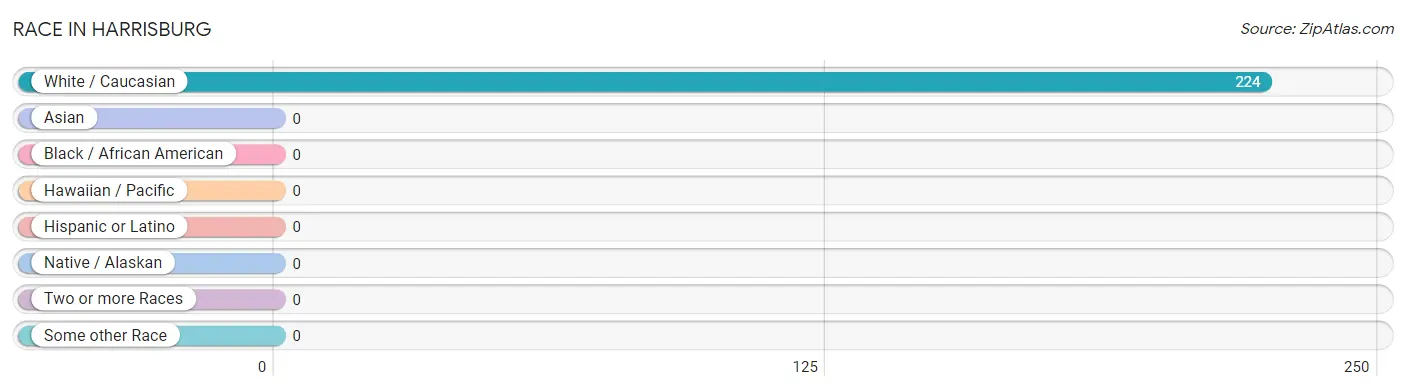
| Race | # Population | % Population |
| Asian | 0 | 0.0% |
| Black / African American | 0 | 0.0% |
| Hawaiian / Pacific | 0 | 0.0% |
| Hispanic or Latino | 0 | 0.0% |
| Native / Alaskan | 0 | 0.0% |
| White / Caucasian | 224 | 100.0% |
| Two or more Races | 0 | 0.0% |
| Some other Race | 0 | 0.0% |
| Total | 224 | 100.0% |
Ancestry in Harrisburg
The most populous ancestries reported in Harrisburg are English (159 | 71.0%), German (78 | 34.8%), and French (8 | 3.6%), together accounting for 109.4% of all Harrisburg residents.
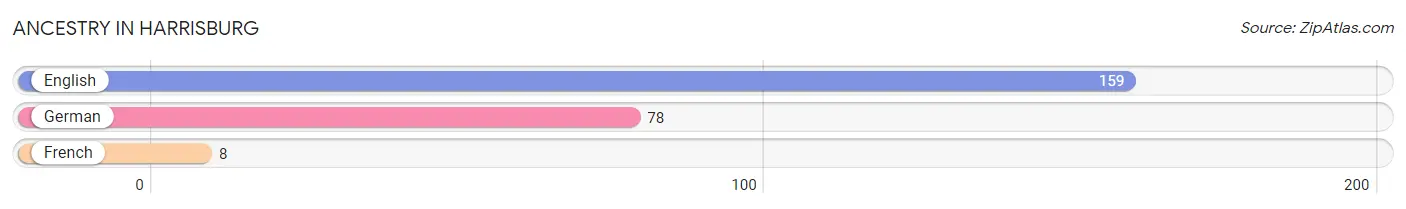
| Ancestry | # Population | % Population |
| English | 159 | 71.0% |
| French | 8 | 3.6% |
| German | 78 | 34.8% | View All 3 Rows |
Immigrants in Harrisburg

| Immigration Origin | # Population | % Population | View All 0 Rows |
Sex and Age in Harrisburg
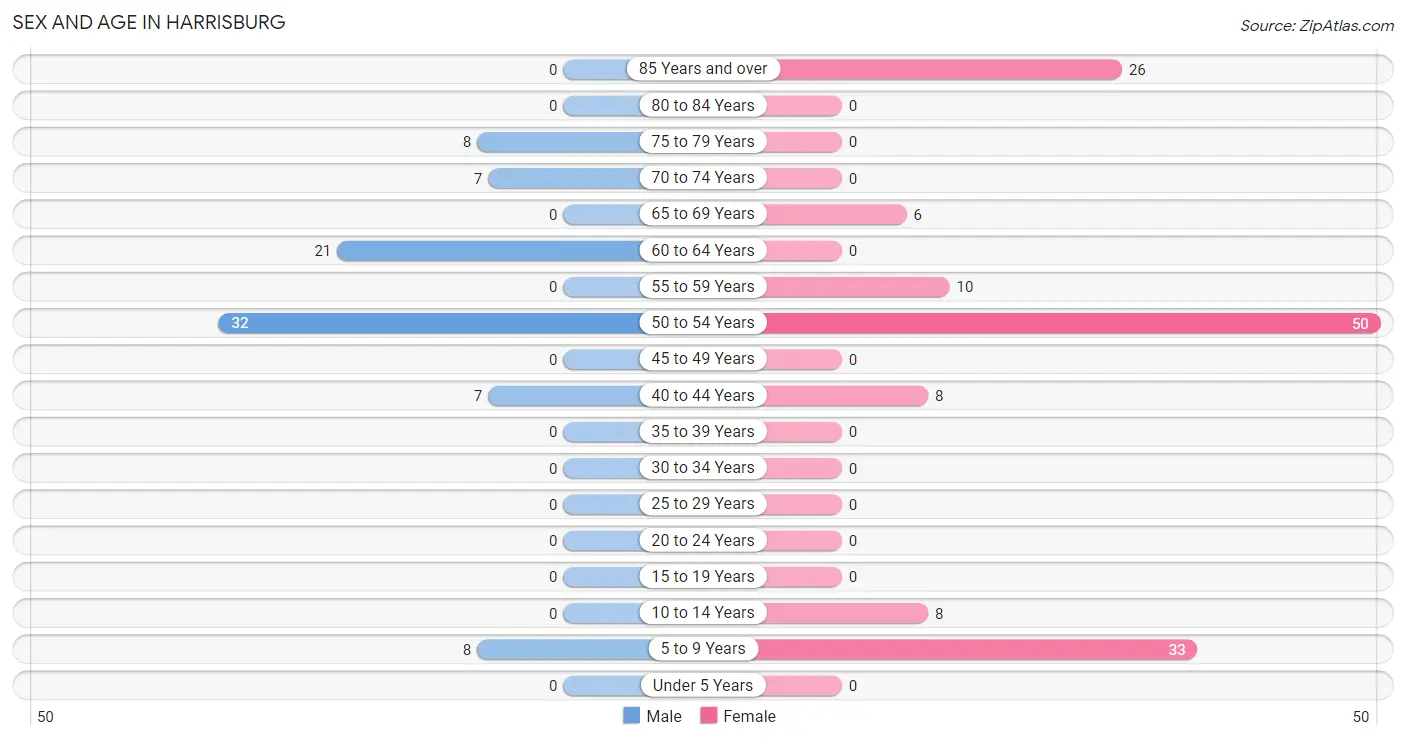
Sex and Age in Harrisburg
The most populous age groups in Harrisburg are 50 to 54 Years (32 | 38.6%) for men and 50 to 54 Years (50 | 35.5%) for women.
| Age Bracket | Male | Female |
| Under 5 Years | 0 (0.0%) | 0 (0.0%) |
| 5 to 9 Years | 8 (9.6%) | 33 (23.4%) |
| 10 to 14 Years | 0 (0.0%) | 8 (5.7%) |
| 15 to 19 Years | 0 (0.0%) | 0 (0.0%) |
| 20 to 24 Years | 0 (0.0%) | 0 (0.0%) |
| 25 to 29 Years | 0 (0.0%) | 0 (0.0%) |
| 30 to 34 Years | 0 (0.0%) | 0 (0.0%) |
| 35 to 39 Years | 0 (0.0%) | 0 (0.0%) |
| 40 to 44 Years | 7 (8.4%) | 8 (5.7%) |
| 45 to 49 Years | 0 (0.0%) | 0 (0.0%) |
| 50 to 54 Years | 32 (38.6%) | 50 (35.5%) |
| 55 to 59 Years | 0 (0.0%) | 10 (7.1%) |
| 60 to 64 Years | 21 (25.3%) | 0 (0.0%) |
| 65 to 69 Years | 0 (0.0%) | 6 (4.3%) |
| 70 to 74 Years | 7 (8.4%) | 0 (0.0%) |
| 75 to 79 Years | 8 (9.6%) | 0 (0.0%) |
| 80 to 84 Years | 0 (0.0%) | 0 (0.0%) |
| 85 Years and over | 0 (0.0%) | 26 (18.4%) |
| Total | 83 (100.0%) | 141 (100.0%) |
Families and Households in Harrisburg
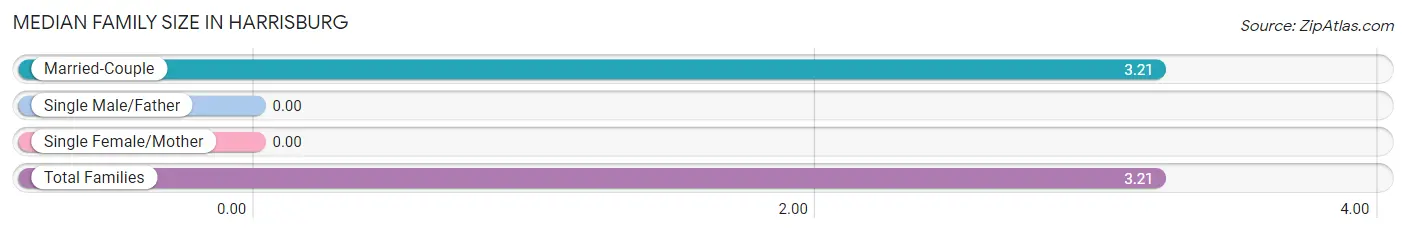
Median Family Size in Harrisburg
| Family Type | # Families | Family Size |
| Married-Couple | 56 (100.0%) | 3.21 |
| Single Male/Father | 0 (0.0%) | - |
| Single Female/Mother | 0 (0.0%) | - |
| Total Families | 56 (100.0%) | 3.21 |
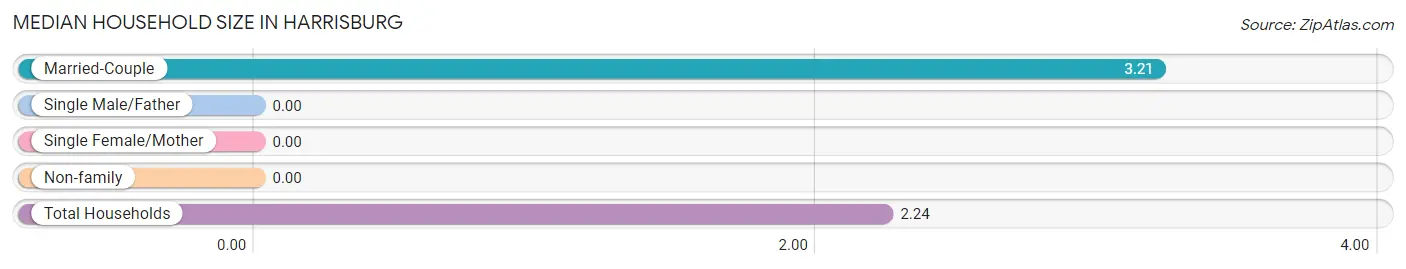
Median Household Size in Harrisburg
| Household Type | # Households | Household Size |
| Married-Couple | 56 (56.0%) | 3.21 |
| Single Male/Father | 0 (0.0%) | - |
| Single Female/Mother | 0 (0.0%) | - |
| Non-family | 44 (44.0%) | - |
| Total Households | 100 (100.0%) | 2.24 |
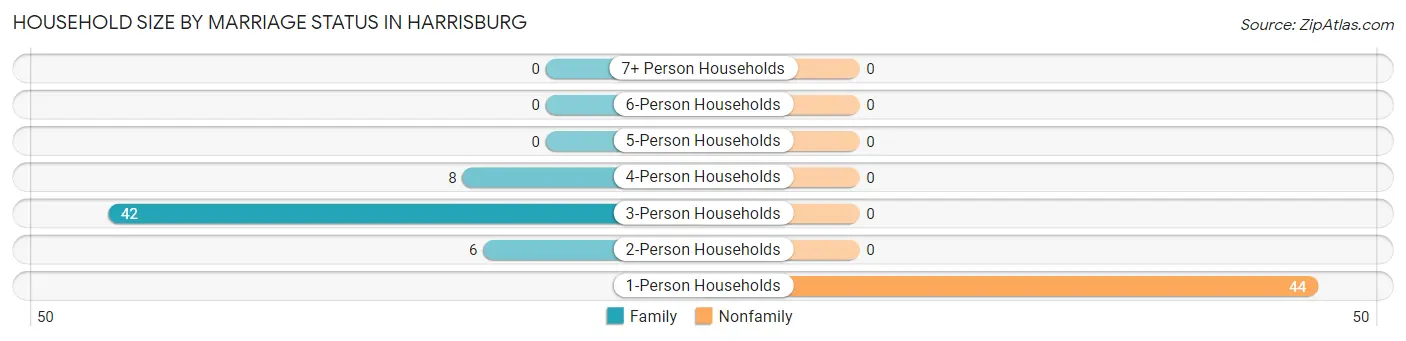
Household Size by Marriage Status in Harrisburg
Out of a total of 100 households in Harrisburg, 56 (56.0%) are family households, while 44 (44.0%) are nonfamily households. The most numerous type of family households are 3-person households, comprising 42, and the most common type of nonfamily households are 1-person households, comprising 44.
| Household Size | Family Households | Nonfamily Households |
| 1-Person Households | - | 44 (44.0%) |
| 2-Person Households | 6 (6.0%) | 0 (0.0%) |
| 3-Person Households | 42 (42.0%) | 0 (0.0%) |
| 4-Person Households | 8 (8.0%) | 0 (0.0%) |
| 5-Person Households | 0 (0.0%) | 0 (0.0%) |
| 6-Person Households | 0 (0.0%) | 0 (0.0%) |
| 7+ Person Households | 0 (0.0%) | 0 (0.0%) |
| Total | 56 (56.0%) | 44 (44.0%) |
Female Fertility in Harrisburg
Fertility by Age in Harrisburg
| Age Bracket | Women with Births | Births / 1,000 Women |
| 15 to 19 years | 0 (0.0%) | 0.0 |
| 20 to 34 years | 0 (0.0%) | 0.0 |
| 35 to 50 years | 0 (0.0%) | 0.0 |
| Total | 0 (0.0%) | 0.0 |
Fertility by Age by Marriage Status in Harrisburg
| Age Bracket | Married | Unmarried |
| 15 to 19 years | 0 (0.0%) | 0 (0.0%) |
| 20 to 34 years | 0 (0.0%) | 0 (0.0%) |
| 35 to 50 years | 0 (0.0%) | 0 (0.0%) |
| Total | 0 (0.0%) | 0 (0.0%) |
Fertility by Education in Harrisburg
| Educational Attainment | Women with Births | Births / 1,000 Women |
| Less than High School | 0 (0.0%) | 0.0 |
| High School Diploma | 0 (0.0%) | 0.0 |
| College or Associate's Degree | 0 (0.0%) | 0.0 |
| Bachelor's Degree | 0 (0.0%) | 0.0 |
| Graduate Degree | 0 (0.0%) | 0.0 |
| Total | 0 (0.0%) | 0.0 |
Fertility by Education by Marriage Status in Harrisburg
| Educational Attainment | Married | Unmarried |
| Less than High School | 0 (0.0%) | 0 (0.0%) |
| High School Diploma | 0 (0.0%) | 0 (0.0%) |
| College or Associate's Degree | 0 (0.0%) | 0 (0.0%) |
| Bachelor's Degree | 0 (0.0%) | 0 (0.0%) |
| Graduate Degree | 0 (0.0%) | 0 (0.0%) |
| Total | 0 (0.0%) | 0 (0.0%) |
Employment Characteristics in Harrisburg
Employment by Class of Employer in Harrisburg
Among the 105 employed individuals in Harrisburg, private company employees (68 | 64.8%), and not-for-profit organizations (37 | 35.2%) make up the most common classes of employment.
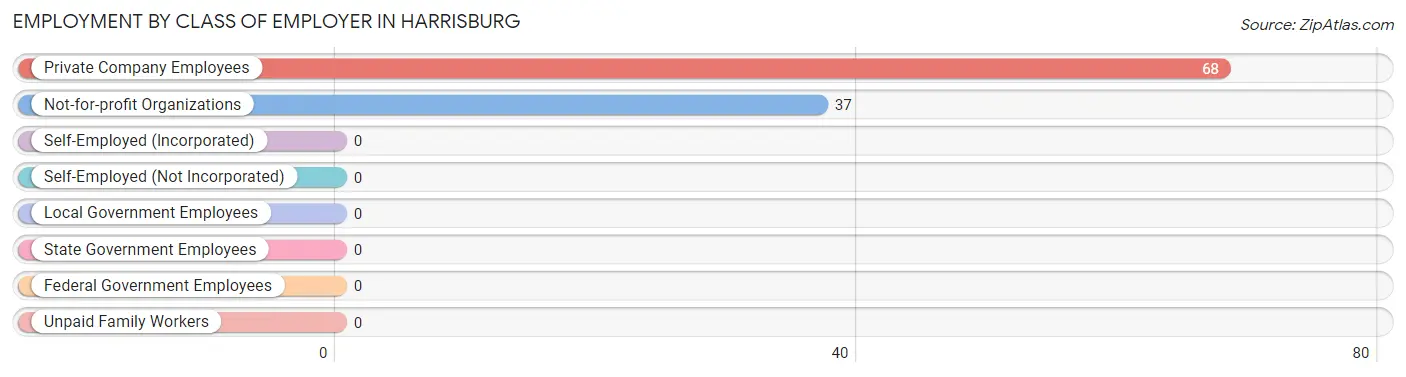
| Employer Class | # Employees | % Employees |
| Private Company Employees | 68 | 64.8% |
| Self-Employed (Incorporated) | 0 | 0.0% |
| Self-Employed (Not Incorporated) | 0 | 0.0% |
| Not-for-profit Organizations | 37 | 35.2% |
| Local Government Employees | 0 | 0.0% |
| State Government Employees | 0 | 0.0% |
| Federal Government Employees | 0 | 0.0% |
| Unpaid Family Workers | 0 | 0.0% |
| Total | 105 | 100.0% |
Employment Status by Age in Harrisburg
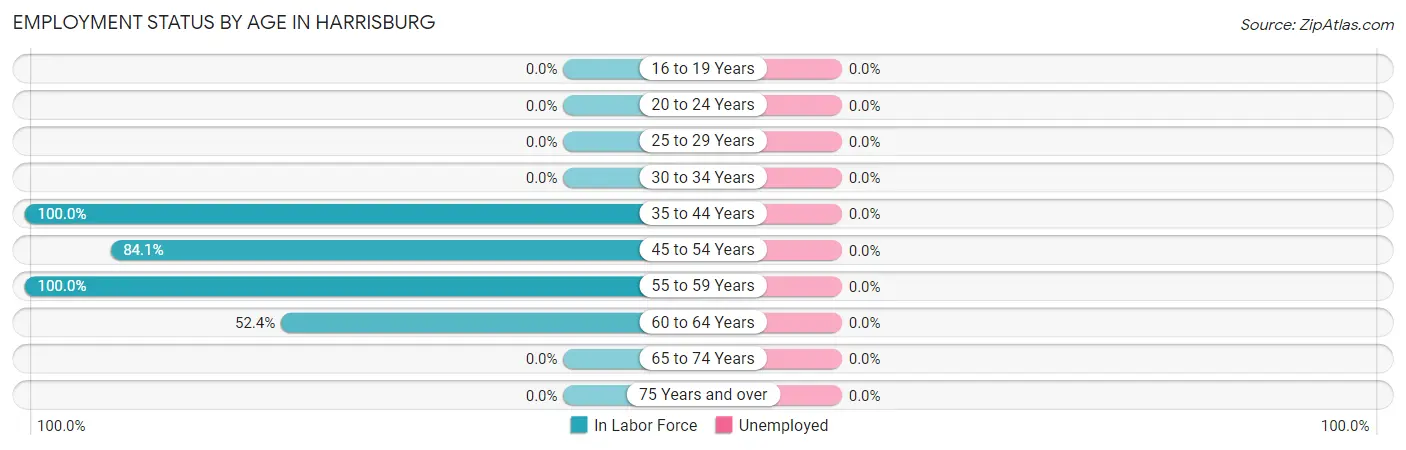
| Age Bracket | In Labor Force | Unemployed |
| 16 to 19 Years | 0 (0.0%) | 0 (0.0%) |
| 20 to 24 Years | 0 (0.0%) | 0 (0.0%) |
| 25 to 29 Years | 0 (0.0%) | 0 (0.0%) |
| 30 to 34 Years | 0 (0.0%) | 0 (0.0%) |
| 35 to 44 Years | 15 (100.0%) | 0 (0.0%) |
| 45 to 54 Years | 69 (84.1%) | 0 (0.0%) |
| 55 to 59 Years | 10 (100.0%) | 0 (0.0%) |
| 60 to 64 Years | 11 (52.4%) | 0 (0.0%) |
| 65 to 74 Years | 0 (0.0%) | 0 (0.0%) |
| 75 Years and over | 0 (0.0%) | 0 (0.0%) |
| Total | 105 (60.0%) | 0 (0.0%) |
Employment Status by Educational Attainment in Harrisburg
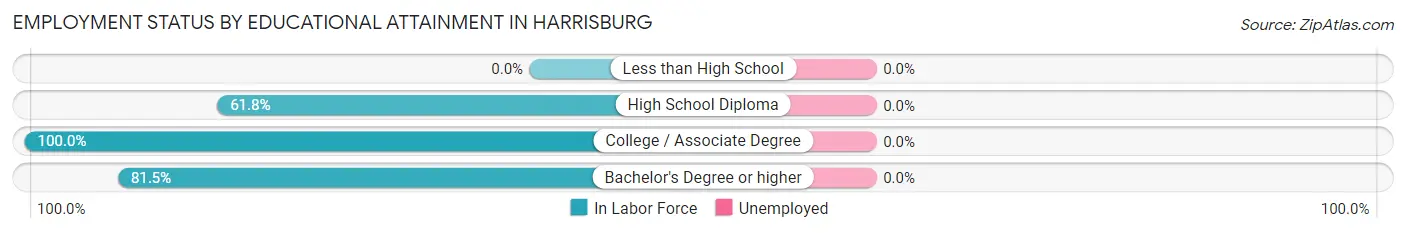
| Educational Attainment | In Labor Force | Unemployed |
| Less than High School | 0 (0.0%) | 0 (0.0%) |
| High School Diploma | 21 (61.8%) | 0 (0.0%) |
| College / Associate Degree | 40 (100.0%) | 0 (0.0%) |
| Bachelor's Degree or higher | 44 (81.5%) | 0 (0.0%) |
| Total | 105 (82.0%) | 0 (0.0%) |
Employment Occupations by Sex in Harrisburg
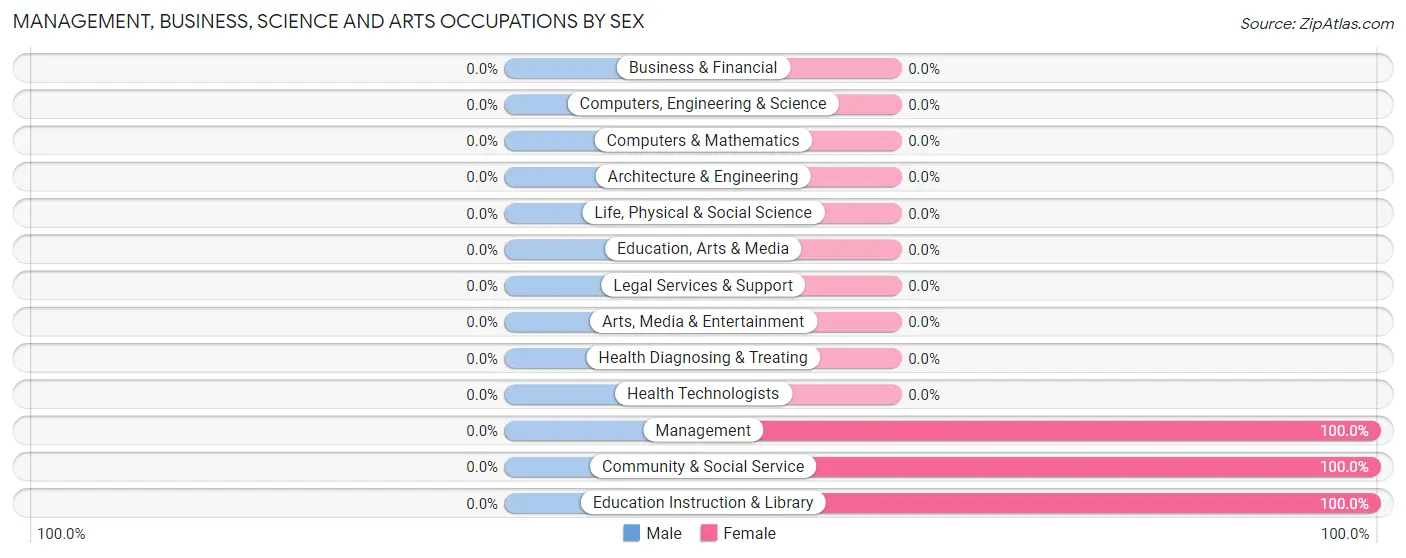
Management, Business, Science and Arts Occupations
The most common Management, Business, Science and Arts occupations in Harrisburg are Community & Social Service (37 | 35.2%), Education Instruction & Library (37 | 35.2%), and Management (10 | 9.5%).
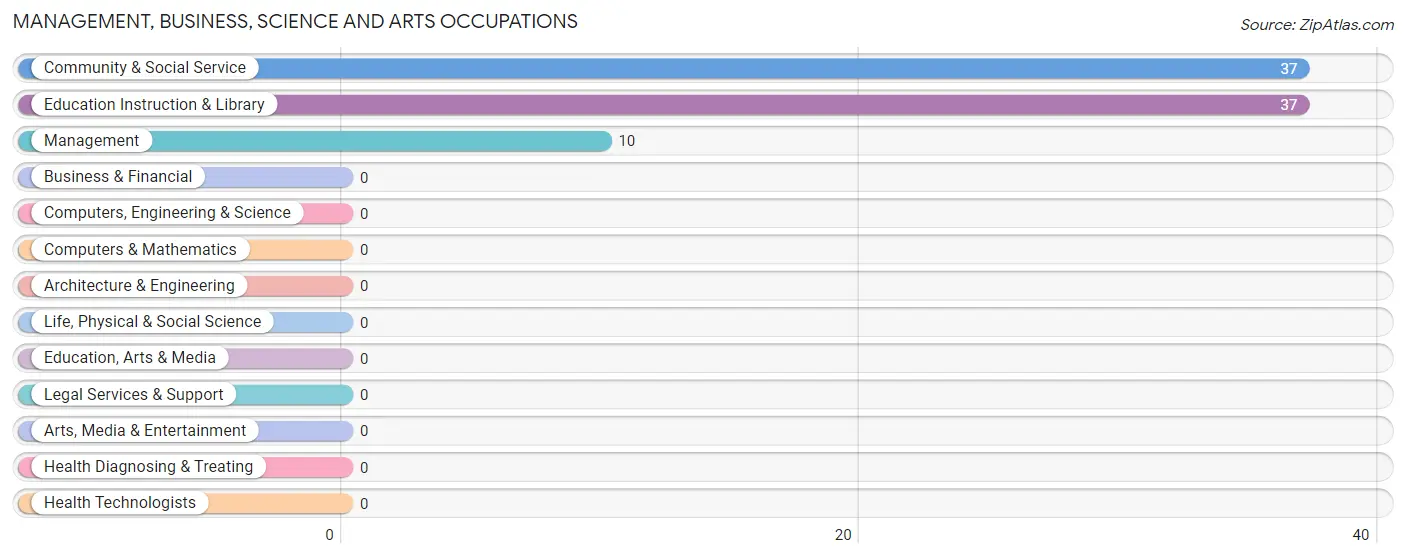
Management, Business, Science and Arts Occupations by Sex
| Occupation | Male | Female |
| Management | 0 (0.0%) | 10 (100.0%) |
| Business & Financial | 0 (0.0%) | 0 (0.0%) |
| Computers, Engineering & Science | 0 (0.0%) | 0 (0.0%) |
| Computers & Mathematics | 0 (0.0%) | 0 (0.0%) |
| Architecture & Engineering | 0 (0.0%) | 0 (0.0%) |
| Life, Physical & Social Science | 0 (0.0%) | 0 (0.0%) |
| Community & Social Service | 0 (0.0%) | 37 (100.0%) |
| Education, Arts & Media | 0 (0.0%) | 0 (0.0%) |
| Legal Services & Support | 0 (0.0%) | 0 (0.0%) |
| Education Instruction & Library | 0 (0.0%) | 37 (100.0%) |
| Arts, Media & Entertainment | 0 (0.0%) | 0 (0.0%) |
| Health Diagnosing & Treating | 0 (0.0%) | 0 (0.0%) |
| Health Technologists | 0 (0.0%) | 0 (0.0%) |
| Total (Category) | 0 (0.0%) | 47 (100.0%) |
| Total (Overall) | 50 (47.6%) | 55 (52.4%) |
Services Occupations
Services Occupations by Sex
| Occupation | Male | Female |
| Healthcare Support | 0 (0.0%) | 0 (0.0%) |
| Security & Protection | 0 (0.0%) | 0 (0.0%) |
| Firefighting & Prevention | 0 (0.0%) | 0 (0.0%) |
| Law Enforcement | 0 (0.0%) | 0 (0.0%) |
| Food Preparation & Serving | 0 (0.0%) | 0 (0.0%) |
| Cleaning & Maintenance | 0 (0.0%) | 0 (0.0%) |
| Personal Care & Service | 0 (0.0%) | 0 (0.0%) |
| Total (Category) | 0 (0.0%) | 0 (0.0%) |
| Total (Overall) | 50 (47.6%) | 55 (52.4%) |
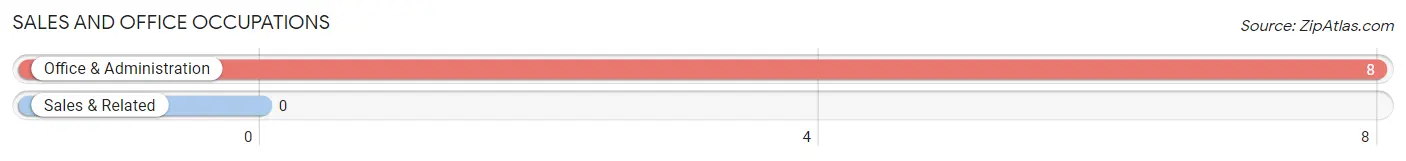
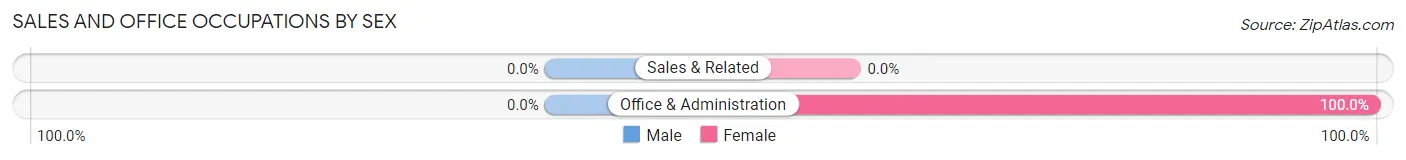
Sales and Office Occupations
The most common Sales and Office occupations in Harrisburg are , and Office & Administration (8 | 7.6%).
Sales and Office Occupations by Sex
| Occupation | Male | Female |
| Sales & Related | 0 (0.0%) | 0 (0.0%) |
| Office & Administration | 0 (0.0%) | 8 (100.0%) |
| Total (Category) | 0 (0.0%) | 8 (100.0%) |
| Total (Overall) | 50 (47.6%) | 55 (52.4%) |
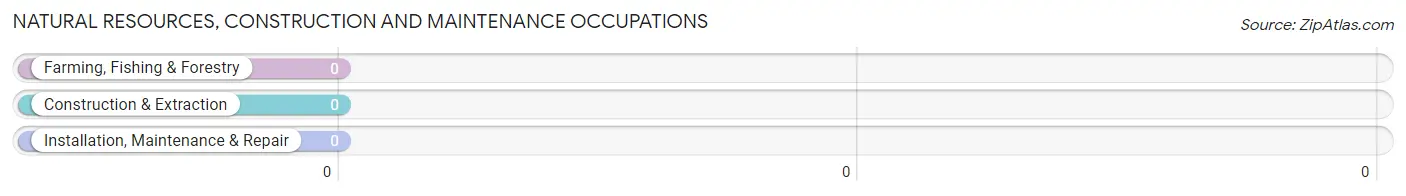
Natural Resources, Construction and Maintenance Occupations
Natural Resources, Construction and Maintenance Occupations by Sex
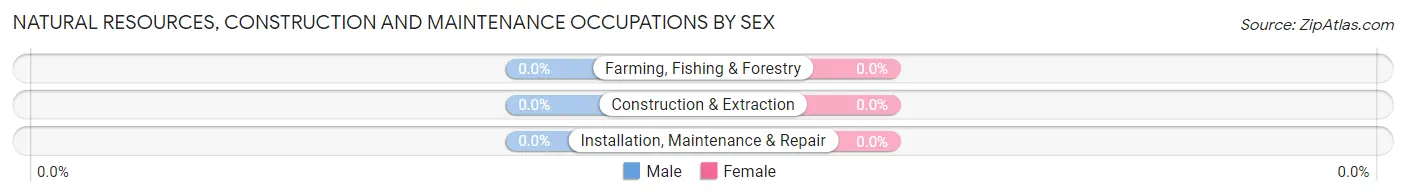
| Occupation | Male | Female |
| Farming, Fishing & Forestry | 0 (0.0%) | 0 (0.0%) |
| Construction & Extraction | 0 (0.0%) | 0 (0.0%) |
| Installation, Maintenance & Repair | 0 (0.0%) | 0 (0.0%) |
| Total (Category) | 0 (0.0%) | 0 (0.0%) |
| Total (Overall) | 50 (47.6%) | 55 (52.4%) |
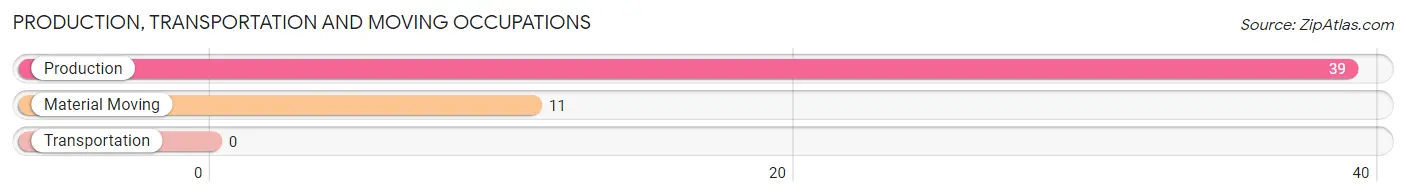
Production, Transportation and Moving Occupations
The most common Production, Transportation and Moving occupations in Harrisburg are Production (39 | 37.1%), and Material Moving (11 | 10.5%).
Production, Transportation and Moving Occupations by Sex
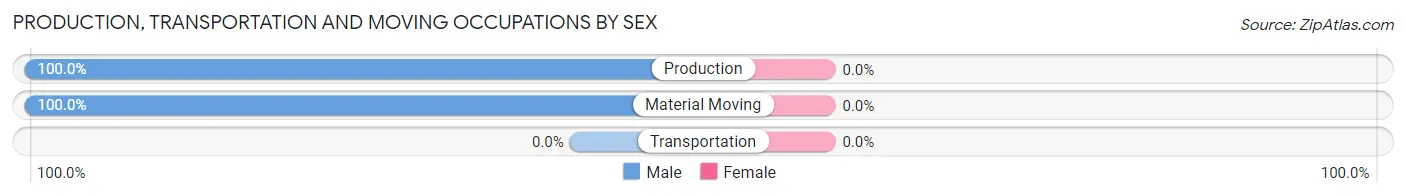
| Occupation | Male | Female |
| Production | 39 (100.0%) | 0 (0.0%) |
| Transportation | 0 (0.0%) | 0 (0.0%) |
| Material Moving | 11 (100.0%) | 0 (0.0%) |
| Total (Category) | 50 (100.0%) | 0 (0.0%) |
| Total (Overall) | 50 (47.6%) | 55 (52.4%) |
Employment Industries by Sex in Harrisburg
Employment Industries in Harrisburg
The major employment industries in Harrisburg include Manufacturing (50 | 47.6%), Educational Services (37 | 35.2%), Health Care & Social Assistance (10 | 9.5%), and Finance & Insurance (8 | 7.6%).
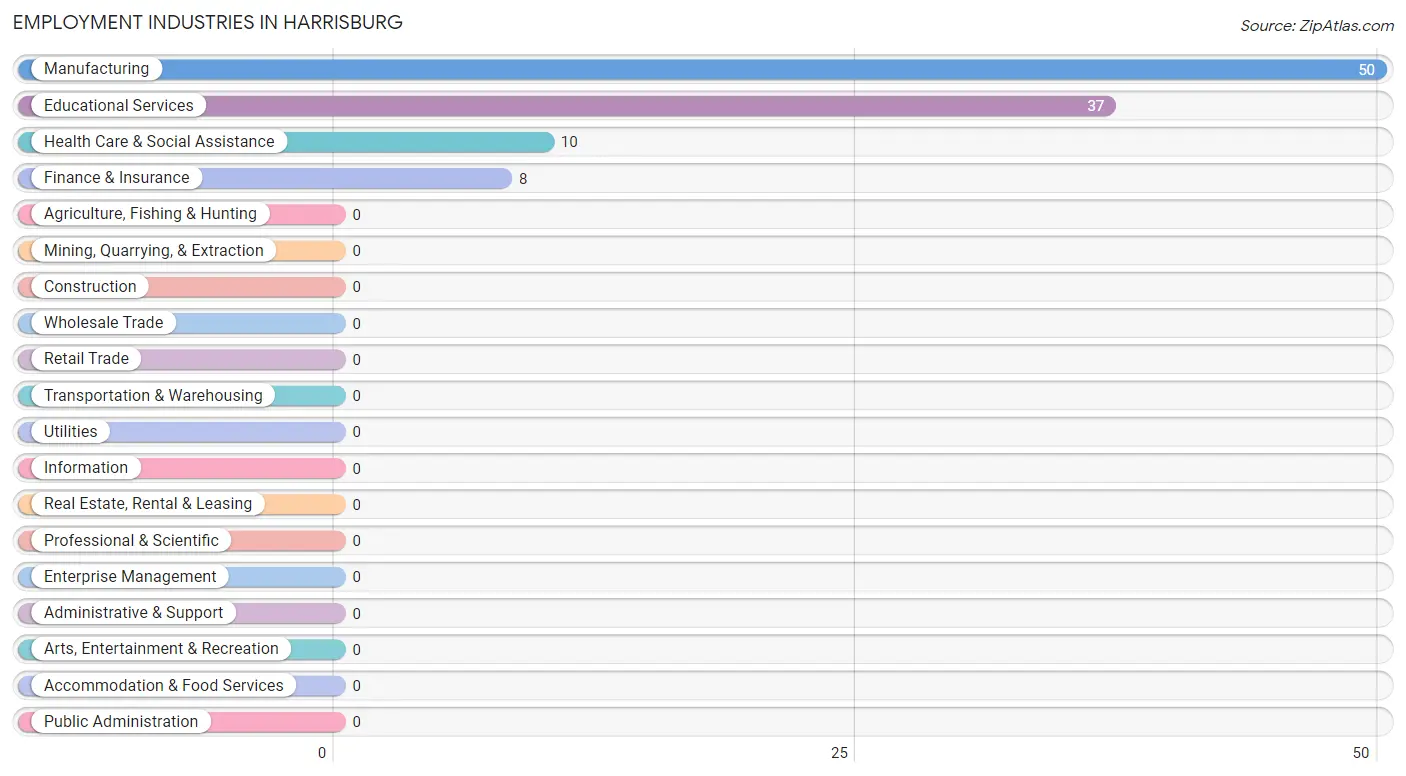
Employment Industries by Sex in Harrisburg
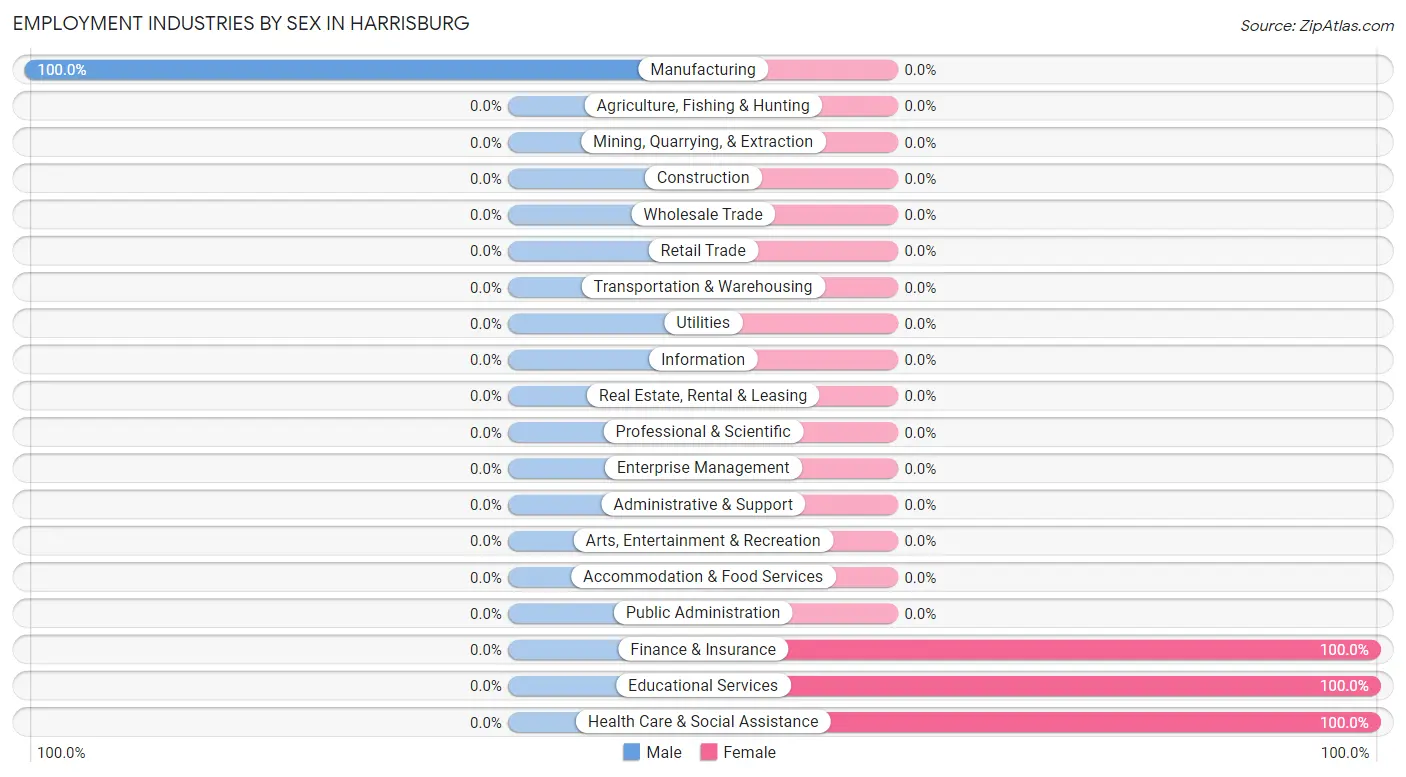
| Industry | Male | Female |
| Agriculture, Fishing & Hunting | 0 (0.0%) | 0 (0.0%) |
| Mining, Quarrying, & Extraction | 0 (0.0%) | 0 (0.0%) |
| Construction | 0 (0.0%) | 0 (0.0%) |
| Manufacturing | 50 (100.0%) | 0 (0.0%) |
| Wholesale Trade | 0 (0.0%) | 0 (0.0%) |
| Retail Trade | 0 (0.0%) | 0 (0.0%) |
| Transportation & Warehousing | 0 (0.0%) | 0 (0.0%) |
| Utilities | 0 (0.0%) | 0 (0.0%) |
| Information | 0 (0.0%) | 0 (0.0%) |
| Finance & Insurance | 0 (0.0%) | 8 (100.0%) |
| Real Estate, Rental & Leasing | 0 (0.0%) | 0 (0.0%) |
| Professional & Scientific | 0 (0.0%) | 0 (0.0%) |
| Enterprise Management | 0 (0.0%) | 0 (0.0%) |
| Administrative & Support | 0 (0.0%) | 0 (0.0%) |
| Educational Services | 0 (0.0%) | 37 (100.0%) |
| Health Care & Social Assistance | 0 (0.0%) | 10 (100.0%) |
| Arts, Entertainment & Recreation | 0 (0.0%) | 0 (0.0%) |
| Accommodation & Food Services | 0 (0.0%) | 0 (0.0%) |
| Public Administration | 0 (0.0%) | 0 (0.0%) |
| Total | 50 (47.6%) | 55 (52.4%) |
Education in Harrisburg
School Enrollment in Harrisburg
The most common levels of schooling among the 49 students in Harrisburg are kindergarten (33 | 67.3%), elementary school (8 | 16.3%), and middle school (8 | 16.3%).
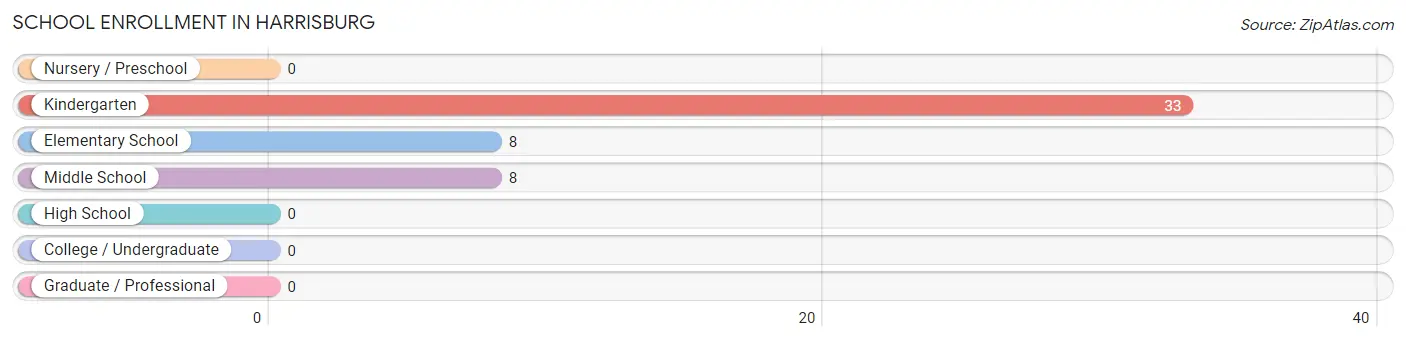
| School Level | # Students | % Students |
| Nursery / Preschool | 0 | 0.0% |
| Kindergarten | 33 | 67.3% |
| Elementary School | 8 | 16.3% |
| Middle School | 8 | 16.3% |
| High School | 0 | 0.0% |
| College / Undergraduate | 0 | 0.0% |
| Graduate / Professional | 0 | 0.0% |
| Total | 49 | 100.0% |
School Enrollment by Age by Funding Source in Harrisburg
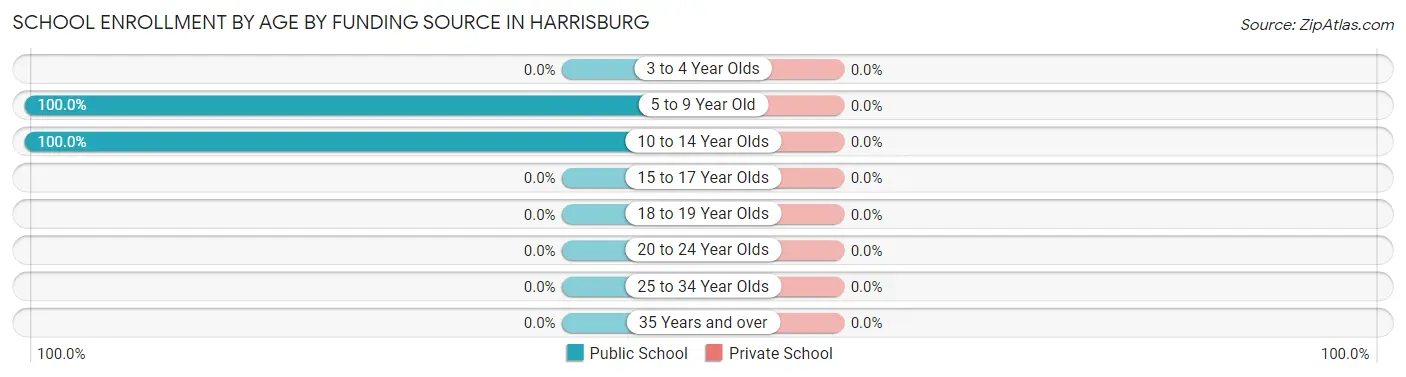
| Age Bracket | Public School | Private School |
| 3 to 4 Year Olds | 0 (0.0%) | 0 (0.0%) |
| 5 to 9 Year Old | 41 (100.0%) | 0 (0.0%) |
| 10 to 14 Year Olds | 8 (100.0%) | 0 (0.0%) |
| 15 to 17 Year Olds | 0 (0.0%) | 0 (0.0%) |
| 18 to 19 Year Olds | 0 (0.0%) | 0 (0.0%) |
| 20 to 24 Year Olds | 0 (0.0%) | 0 (0.0%) |
| 25 to 34 Year Olds | 0 (0.0%) | 0 (0.0%) |
| 35 Years and over | 0 (0.0%) | 0 (0.0%) |
| Total | 49 (100.0%) | 0 (0.0%) |
Educational Attainment by Field of Study in Harrisburg
Science & technology (47 | 75.8%), business (8 | 12.9%), and liberal arts & history (7 | 11.3%) are the most common fields of study among 62 individuals in Harrisburg who have obtained a bachelor's degree or higher.
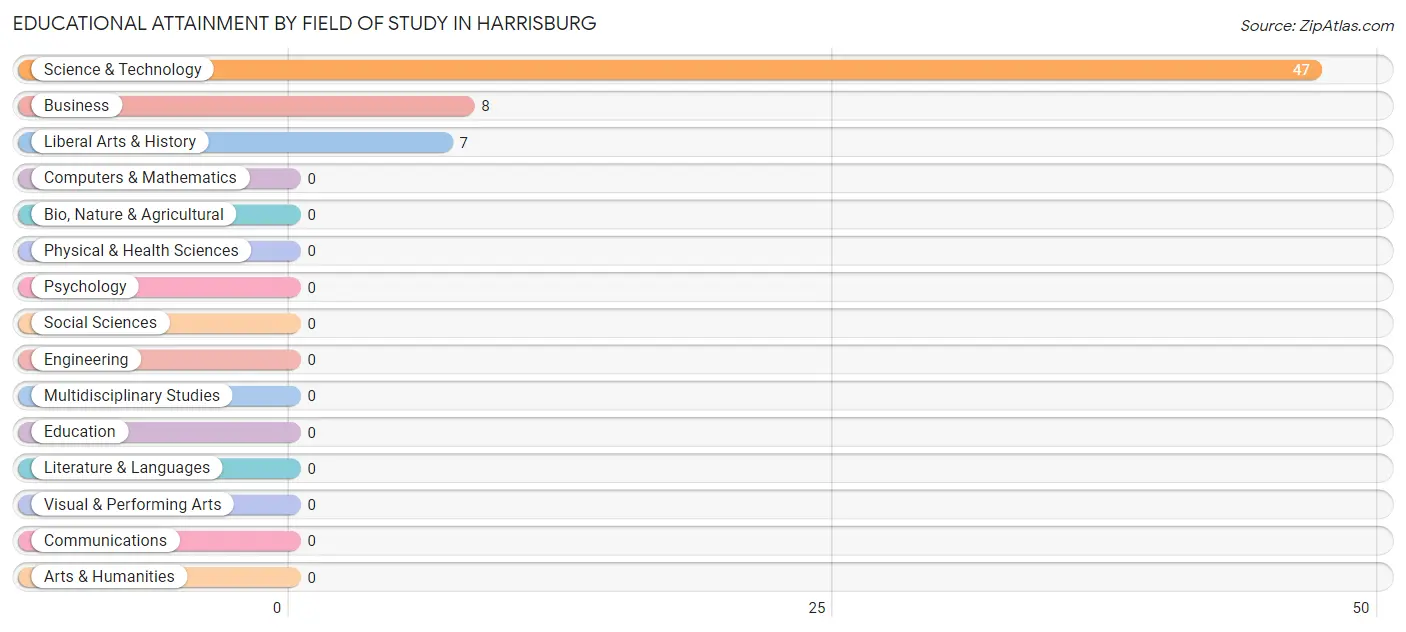
| Field of Study | # Graduates | % Graduates |
| Computers & Mathematics | 0 | 0.0% |
| Bio, Nature & Agricultural | 0 | 0.0% |
| Physical & Health Sciences | 0 | 0.0% |
| Psychology | 0 | 0.0% |
| Social Sciences | 0 | 0.0% |
| Engineering | 0 | 0.0% |
| Multidisciplinary Studies | 0 | 0.0% |
| Science & Technology | 47 | 75.8% |
| Business | 8 | 12.9% |
| Education | 0 | 0.0% |
| Literature & Languages | 0 | 0.0% |
| Liberal Arts & History | 7 | 11.3% |
| Visual & Performing Arts | 0 | 0.0% |
| Communications | 0 | 0.0% |
| Arts & Humanities | 0 | 0.0% |
| Total | 62 | 100.0% |
Transportation & Commute in Harrisburg
Vehicle Availability by Sex in Harrisburg
The most prevalent vehicle ownership categories in Harrisburg are males with 2 vehicles (39, accounting for 78.0%) and females with 2 vehicles (45, making up 70.9%).
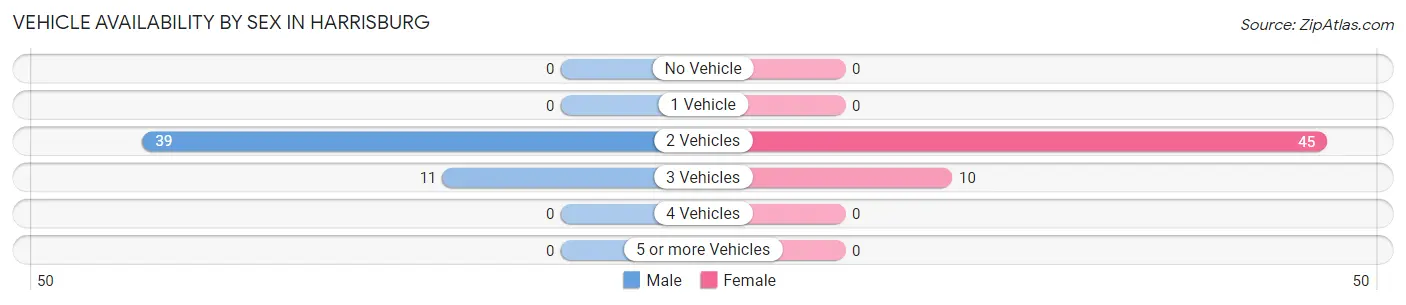
| Vehicles Available | Male | Female |
| No Vehicle | 0 (0.0%) | 0 (0.0%) |
| 1 Vehicle | 0 (0.0%) | 0 (0.0%) |
| 2 Vehicles | 39 (78.0%) | 45 (81.8%) |
| 3 Vehicles | 11 (22.0%) | 10 (18.2%) |
| 4 Vehicles | 0 (0.0%) | 0 (0.0%) |
| 5 or more Vehicles | 0 (0.0%) | 0 (0.0%) |
| Total | 50 (100.0%) | 55 (100.0%) |
Commute Time in Harrisburg
The most frequently occuring commute durations in Harrisburg are 20 to 24 minutes (77 commuters, 73.3%), 25 to 29 minutes (17 commuters, 16.2%), and 60 to 89 minutes (11 commuters, 10.5%).
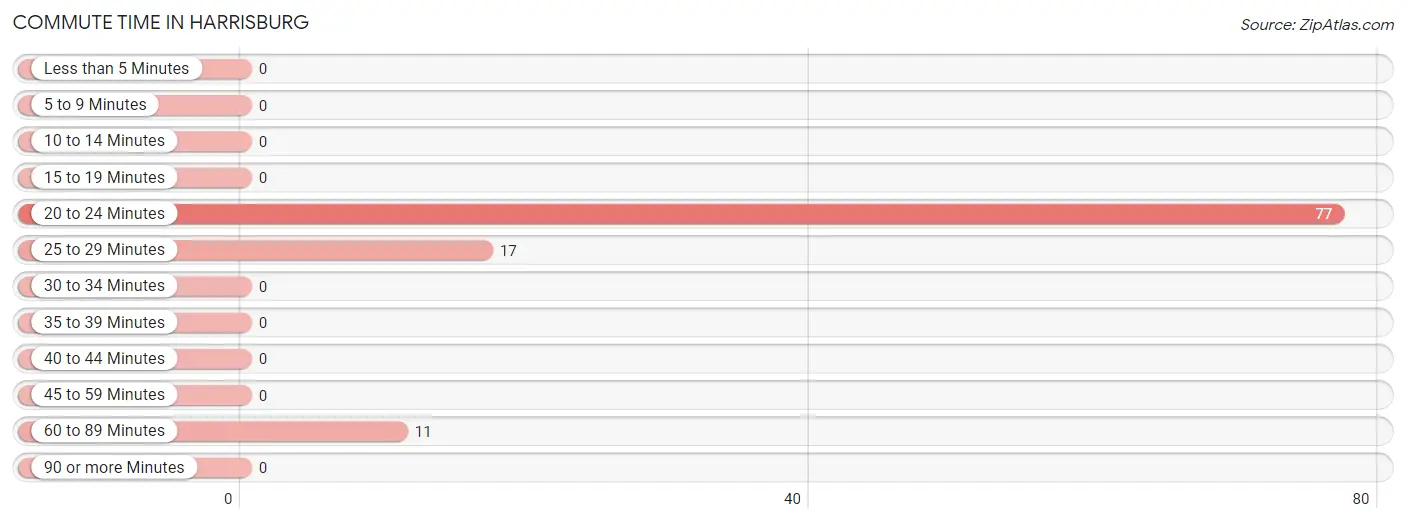
| Commute Time | # Commuters | % Commuters |
| Less than 5 Minutes | 0 | 0.0% |
| 5 to 9 Minutes | 0 | 0.0% |
| 10 to 14 Minutes | 0 | 0.0% |
| 15 to 19 Minutes | 0 | 0.0% |
| 20 to 24 Minutes | 77 | 73.3% |
| 25 to 29 Minutes | 17 | 16.2% |
| 30 to 34 Minutes | 0 | 0.0% |
| 35 to 39 Minutes | 0 | 0.0% |
| 40 to 44 Minutes | 0 | 0.0% |
| 45 to 59 Minutes | 0 | 0.0% |
| 60 to 89 Minutes | 11 | 10.5% |
| 90 or more Minutes | 0 | 0.0% |
Commute Time by Sex in Harrisburg
The most common commute times in Harrisburg are 20 to 24 minutes (32 commuters, 64.0%) for males and 20 to 24 minutes (45 commuters, 81.8%) for females.
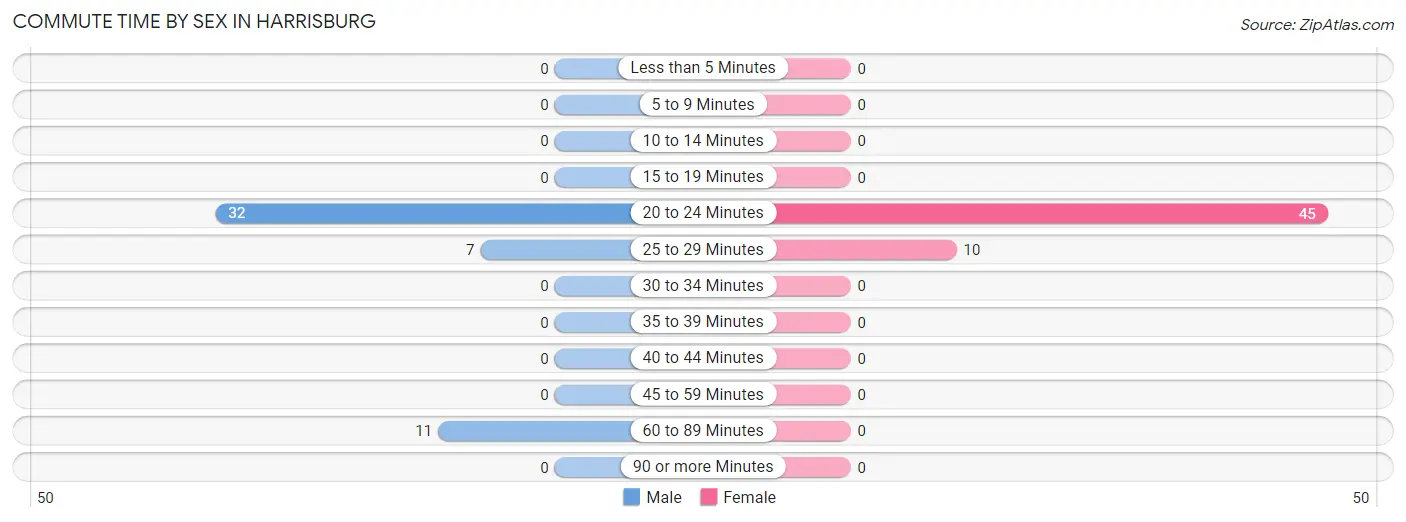
| Commute Time | Male | Female |
| Less than 5 Minutes | 0 (0.0%) | 0 (0.0%) |
| 5 to 9 Minutes | 0 (0.0%) | 0 (0.0%) |
| 10 to 14 Minutes | 0 (0.0%) | 0 (0.0%) |
| 15 to 19 Minutes | 0 (0.0%) | 0 (0.0%) |
| 20 to 24 Minutes | 32 (64.0%) | 45 (81.8%) |
| 25 to 29 Minutes | 7 (14.0%) | 10 (18.2%) |
| 30 to 34 Minutes | 0 (0.0%) | 0 (0.0%) |
| 35 to 39 Minutes | 0 (0.0%) | 0 (0.0%) |
| 40 to 44 Minutes | 0 (0.0%) | 0 (0.0%) |
| 45 to 59 Minutes | 0 (0.0%) | 0 (0.0%) |
| 60 to 89 Minutes | 11 (22.0%) | 0 (0.0%) |
| 90 or more Minutes | 0 (0.0%) | 0 (0.0%) |
Time of Departure to Work by Sex in Harrisburg
The most frequent times of departure to work in Harrisburg are 6:00 AM to 6:29 AM (39, 78.0%) for males and 7:30 AM to 7:59 AM (45, 81.8%) for females.
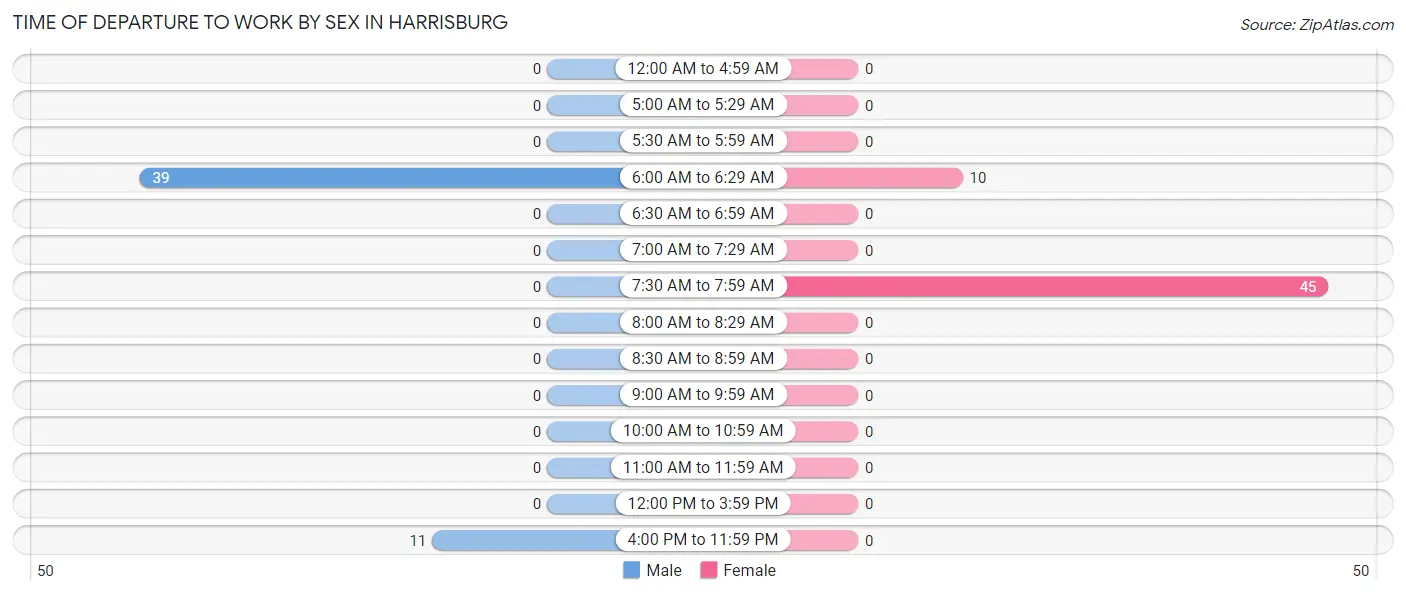
| Time of Departure | Male | Female |
| 12:00 AM to 4:59 AM | 0 (0.0%) | 0 (0.0%) |
| 5:00 AM to 5:29 AM | 0 (0.0%) | 0 (0.0%) |
| 5:30 AM to 5:59 AM | 0 (0.0%) | 0 (0.0%) |
| 6:00 AM to 6:29 AM | 39 (78.0%) | 10 (18.2%) |
| 6:30 AM to 6:59 AM | 0 (0.0%) | 0 (0.0%) |
| 7:00 AM to 7:29 AM | 0 (0.0%) | 0 (0.0%) |
| 7:30 AM to 7:59 AM | 0 (0.0%) | 45 (81.8%) |
| 8:00 AM to 8:29 AM | 0 (0.0%) | 0 (0.0%) |
| 8:30 AM to 8:59 AM | 0 (0.0%) | 0 (0.0%) |
| 9:00 AM to 9:59 AM | 0 (0.0%) | 0 (0.0%) |
| 10:00 AM to 10:59 AM | 0 (0.0%) | 0 (0.0%) |
| 11:00 AM to 11:59 AM | 0 (0.0%) | 0 (0.0%) |
| 12:00 PM to 3:59 PM | 0 (0.0%) | 0 (0.0%) |
| 4:00 PM to 11:59 PM | 11 (22.0%) | 0 (0.0%) |
| Total | 50 (100.0%) | 55 (100.0%) |
Housing Occupancy in Harrisburg
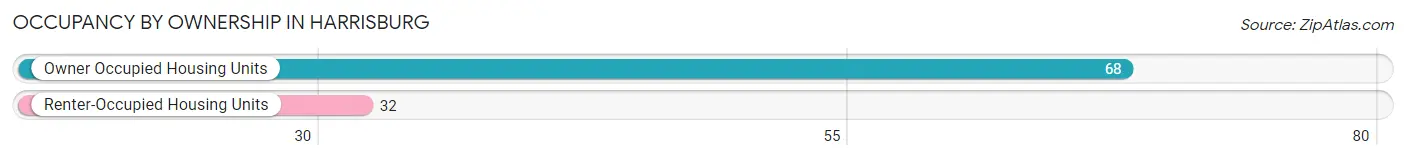
Occupancy by Ownership in Harrisburg
Of the total 100 dwellings in Harrisburg, owner-occupied units account for 68 (68.0%), while renter-occupied units make up 32 (32.0%).
| Occupancy | # Housing Units | % Housing Units |
| Owner Occupied Housing Units | 68 | 68.0% |
| Renter-Occupied Housing Units | 32 | 32.0% |
| Total Occupied Housing Units | 100 | 100.0% |
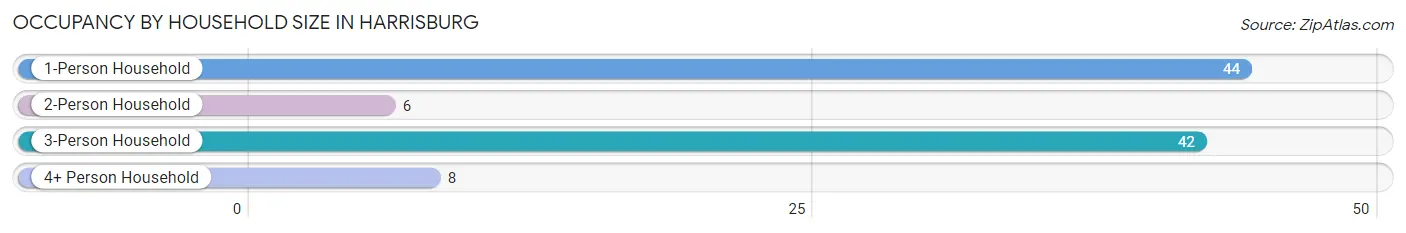
Occupancy by Household Size in Harrisburg
| Household Size | # Housing Units | % Housing Units |
| 1-Person Household | 44 | 44.0% |
| 2-Person Household | 6 | 6.0% |
| 3-Person Household | 42 | 42.0% |
| 4+ Person Household | 8 | 8.0% |
| Total Housing Units | 100 | 100.0% |
Occupancy by Ownership by Household Size in Harrisburg
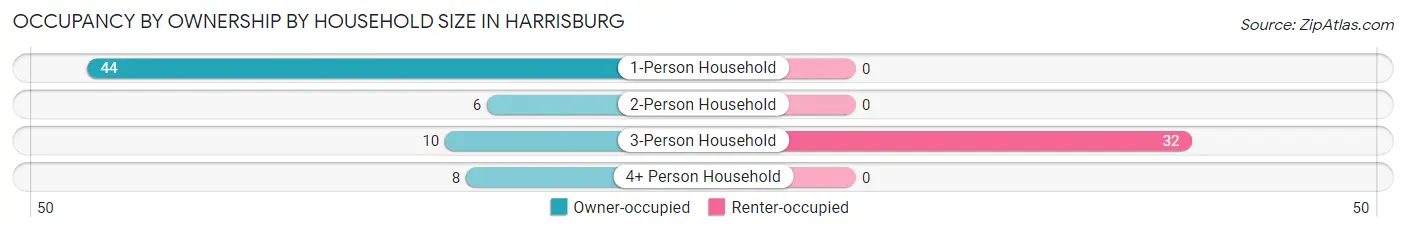
| Household Size | Owner-occupied | Renter-occupied |
| 1-Person Household | 44 (100.0%) | 0 (0.0%) |
| 2-Person Household | 6 (100.0%) | 0 (0.0%) |
| 3-Person Household | 10 (23.8%) | 32 (76.2%) |
| 4+ Person Household | 8 (100.0%) | 0 (0.0%) |
| Total Housing Units | 68 (68.0%) | 32 (32.0%) |
Occupancy by Educational Attainment in Harrisburg
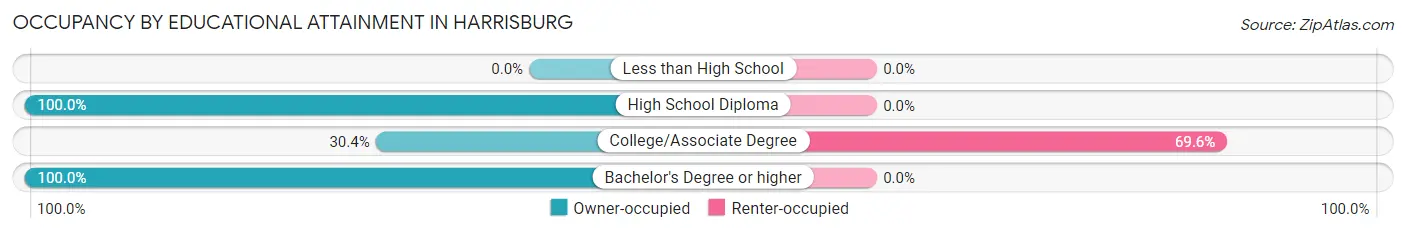
| Household Size | Owner-occupied | Renter-occupied |
| Less than High School | 0 (0.0%) | 0 (0.0%) |
| High School Diploma | 36 (100.0%) | 0 (0.0%) |
| College/Associate Degree | 14 (30.4%) | 32 (69.6%) |
| Bachelor's Degree or higher | 18 (100.0%) | 0 (0.0%) |
Occupancy by Age of Householder in Harrisburg
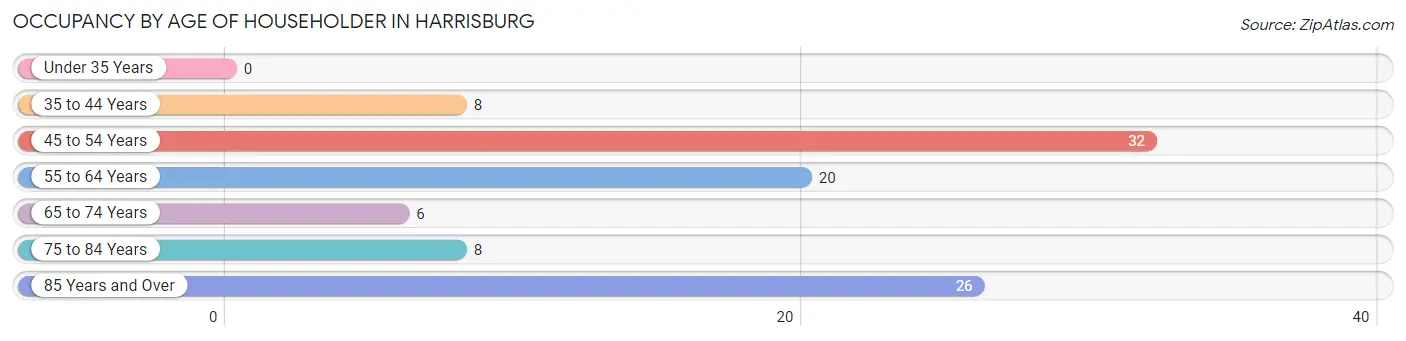
| Age Bracket | # Households | % Households |
| Under 35 Years | 0 | 0.0% |
| 35 to 44 Years | 8 | 8.0% |
| 45 to 54 Years | 32 | 32.0% |
| 55 to 64 Years | 20 | 20.0% |
| 65 to 74 Years | 6 | 6.0% |
| 75 to 84 Years | 8 | 8.0% |
| 85 Years and Over | 26 | 26.0% |
| Total | 100 | 100.0% |
Housing Finances in Harrisburg
Median Income by Occupancy in Harrisburg
| Occupancy Type | # Households | Median Income |
| Owner-Occupied | 68 (68.0%) | $0 |
| Renter-Occupied | 32 (32.0%) | $0 |
| Average | 100 (100.0%) | $0 |
Occupancy by Householder Income Bracket in Harrisburg
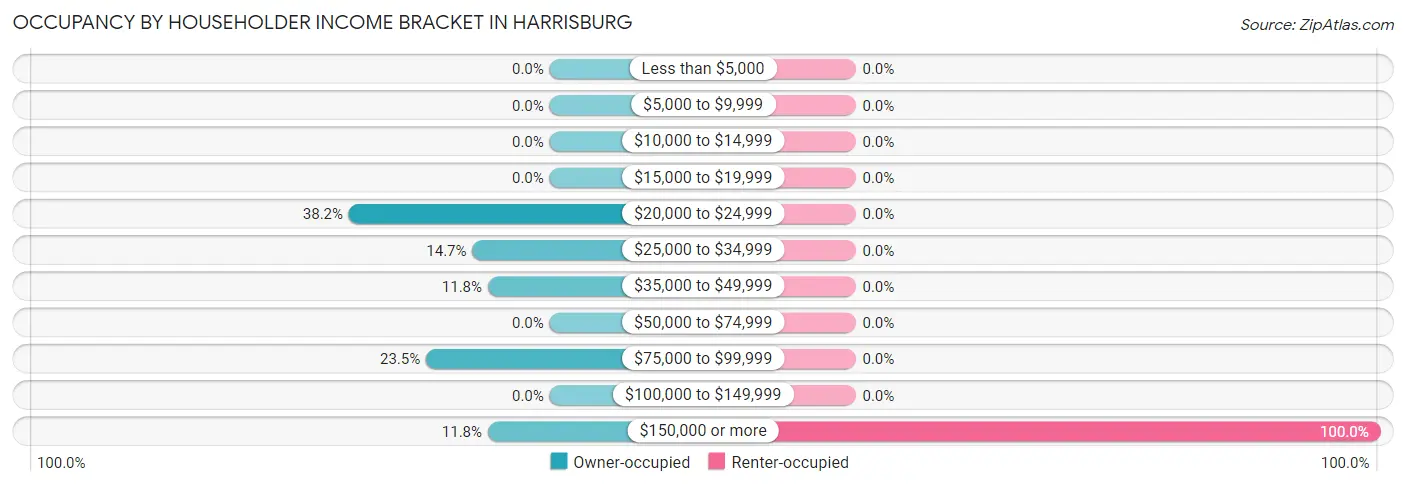
| Income Bracket | Owner-occupied | Renter-occupied |
| Less than $5,000 | 0 (0.0%) | 0 (0.0%) |
| $5,000 to $9,999 | 0 (0.0%) | 0 (0.0%) |
| $10,000 to $14,999 | 0 (0.0%) | 0 (0.0%) |
| $15,000 to $19,999 | 0 (0.0%) | 0 (0.0%) |
| $20,000 to $24,999 | 26 (38.2%) | 0 (0.0%) |
| $25,000 to $34,999 | 10 (14.7%) | 0 (0.0%) |
| $35,000 to $49,999 | 8 (11.8%) | 0 (0.0%) |
| $50,000 to $74,999 | 0 (0.0%) | 0 (0.0%) |
| $75,000 to $99,999 | 16 (23.5%) | 0 (0.0%) |
| $100,000 to $149,999 | 0 (0.0%) | 0 (0.0%) |
| $150,000 or more | 8 (11.8%) | 32 (100.0%) |
| Total | 68 (100.0%) | 32 (100.0%) |
Monthly Housing Cost Tiers in Harrisburg
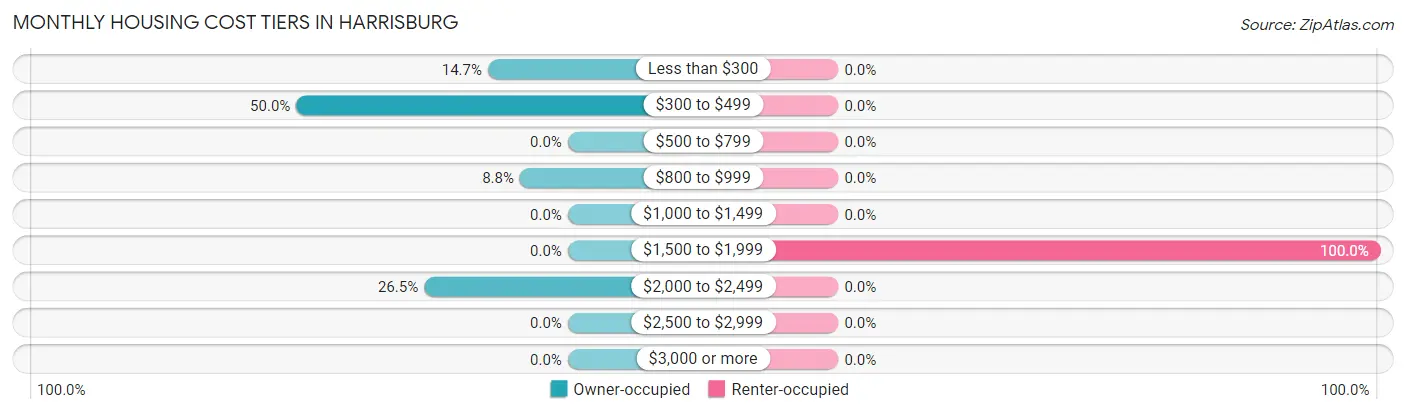
| Monthly Cost | Owner-occupied | Renter-occupied |
| Less than $300 | 10 (14.7%) | 0 (0.0%) |
| $300 to $499 | 34 (50.0%) | 0 (0.0%) |
| $500 to $799 | 0 (0.0%) | 0 (0.0%) |
| $800 to $999 | 6 (8.8%) | 0 (0.0%) |
| $1,000 to $1,499 | 0 (0.0%) | 0 (0.0%) |
| $1,500 to $1,999 | 0 (0.0%) | 32 (100.0%) |
| $2,000 to $2,499 | 18 (26.5%) | 0 (0.0%) |
| $2,500 to $2,999 | 0 (0.0%) | 0 (0.0%) |
| $3,000 or more | 0 (0.0%) | 0 (0.0%) |
| Total | 68 (100.0%) | 32 (100.0%) |
Physical Housing Characteristics in Harrisburg
Housing Structures in Harrisburg
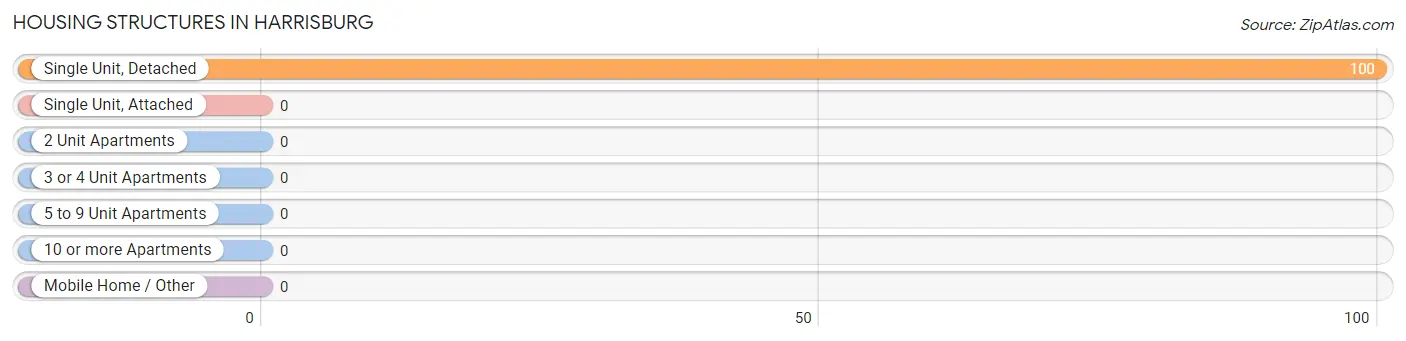
| Structure Type | # Housing Units | % Housing Units |
| Single Unit, Detached | 100 | 100.0% |
| Single Unit, Attached | 0 | 0.0% |
| 2 Unit Apartments | 0 | 0.0% |
| 3 or 4 Unit Apartments | 0 | 0.0% |
| 5 to 9 Unit Apartments | 0 | 0.0% |
| 10 or more Apartments | 0 | 0.0% |
| Mobile Home / Other | 0 | 0.0% |
| Total | 100 | 100.0% |
Housing Structures by Occupancy in Harrisburg
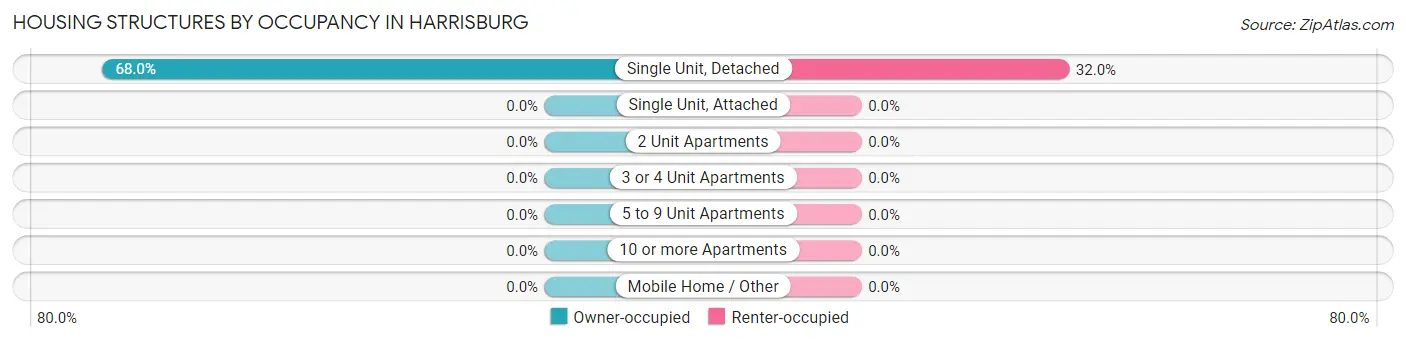
| Structure Type | Owner-occupied | Renter-occupied |
| Single Unit, Detached | 68 (68.0%) | 32 (32.0%) |
| Single Unit, Attached | 0 (0.0%) | 0 (0.0%) |
| 2 Unit Apartments | 0 (0.0%) | 0 (0.0%) |
| 3 or 4 Unit Apartments | 0 (0.0%) | 0 (0.0%) |
| 5 to 9 Unit Apartments | 0 (0.0%) | 0 (0.0%) |
| 10 or more Apartments | 0 (0.0%) | 0 (0.0%) |
| Mobile Home / Other | 0 (0.0%) | 0 (0.0%) |
| Total | 68 (68.0%) | 32 (32.0%) |
Housing Structures by Number of Rooms in Harrisburg

| Number of Rooms | Owner-occupied | Renter-occupied |
| 1 Room | 0 (0.0%) | 0 (0.0%) |
| 2 or 3 Rooms | 0 (0.0%) | 0 (0.0%) |
| 4 or 5 Rooms | 0 (0.0%) | 0 (0.0%) |
| 6 or 7 Rooms | 50 (73.5%) | 32 (100.0%) |
| 8 or more Rooms | 18 (26.5%) | 0 (0.0%) |
| Total | 68 (100.0%) | 32 (100.0%) |
Housing Structure by Heating Type in Harrisburg
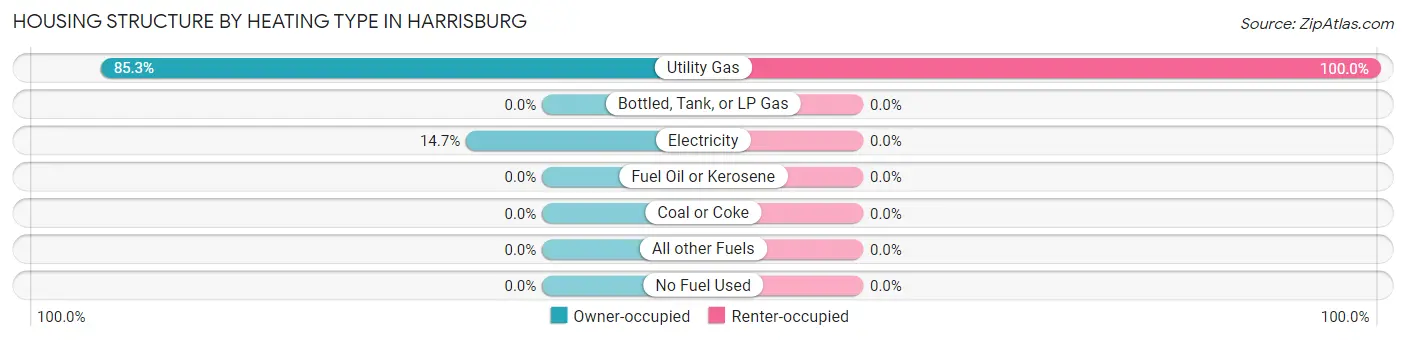
| Heating Type | Owner-occupied | Renter-occupied |
| Utility Gas | 58 (85.3%) | 32 (100.0%) |
| Bottled, Tank, or LP Gas | 0 (0.0%) | 0 (0.0%) |
| Electricity | 10 (14.7%) | 0 (0.0%) |
| Fuel Oil or Kerosene | 0 (0.0%) | 0 (0.0%) |
| Coal or Coke | 0 (0.0%) | 0 (0.0%) |
| All other Fuels | 0 (0.0%) | 0 (0.0%) |
| No Fuel Used | 0 (0.0%) | 0 (0.0%) |
| Total | 68 (100.0%) | 32 (100.0%) |
Household Vehicle Usage in Harrisburg
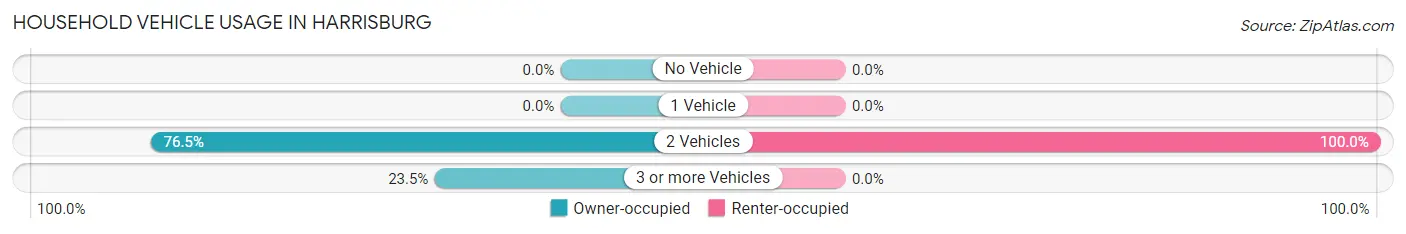
| Vehicles per Household | Owner-occupied | Renter-occupied |
| No Vehicle | 0 (0.0%) | 0 (0.0%) |
| 1 Vehicle | 0 (0.0%) | 0 (0.0%) |
| 2 Vehicles | 52 (76.5%) | 32 (100.0%) |
| 3 or more Vehicles | 16 (23.5%) | 0 (0.0%) |
| Total | 68 (100.0%) | 32 (100.0%) |
Real Estate & Mortgages in Harrisburg
Real Estate and Mortgage Overview in Harrisburg
| Characteristic | Without Mortgage | With Mortgage |
| Housing Units | 54 | 18 |
| Median Property Value | $166,700 | $0 |
| Median Household Income | $72,917 | $8 |
| Monthly Housing Costs | $600 | $0 |
| Real Estate Taxes | $2,600 | $0 |
Property Value by Mortgage Status in Harrisburg
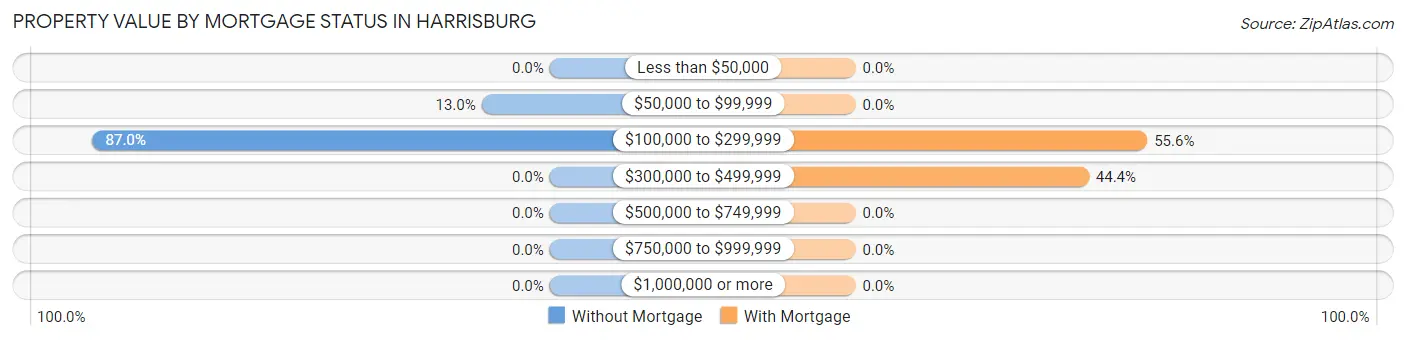
| Property Value | Without Mortgage | With Mortgage |
| Less than $50,000 | 0 (0.0%) | 0 (0.0%) |
| $50,000 to $99,999 | 7 (13.0%) | 0 (0.0%) |
| $100,000 to $299,999 | 47 (87.0%) | 10 (55.6%) |
| $300,000 to $499,999 | 0 (0.0%) | 8 (44.4%) |
| $500,000 to $749,999 | 0 (0.0%) | 0 (0.0%) |
| $750,000 to $999,999 | 0 (0.0%) | 0 (0.0%) |
| $1,000,000 or more | 0 (0.0%) | 0 (0.0%) |
| Total | 54 (100.0%) | 18 (100.0%) |
Household Income by Mortgage Status in Harrisburg
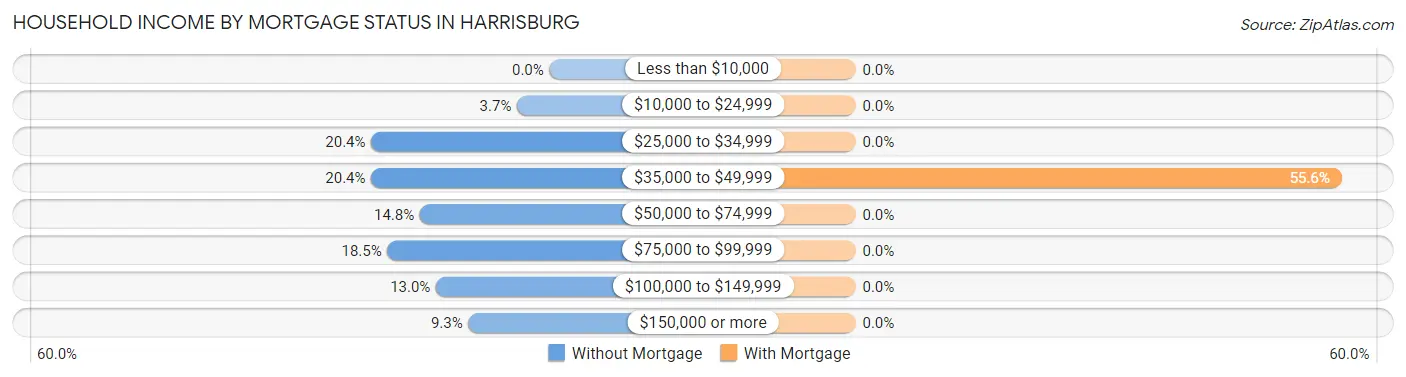
| Household Income | Without Mortgage | With Mortgage |
| Less than $10,000 | 0 (0.0%) | 0 (0.0%) |
| $10,000 to $24,999 | 2 (3.7%) | 0 (0.0%) |
| $25,000 to $34,999 | 11 (20.4%) | 0 (0.0%) |
| $35,000 to $49,999 | 11 (20.4%) | 10 (55.6%) |
| $50,000 to $74,999 | 8 (14.8%) | 0 (0.0%) |
| $75,000 to $99,999 | 10 (18.5%) | 0 (0.0%) |
| $100,000 to $149,999 | 7 (13.0%) | 0 (0.0%) |
| $150,000 or more | 5 (9.3%) | 0 (0.0%) |
| Total | 54 (100.0%) | 18 (100.0%) |
Property Value to Household Income Ratio in Harrisburg
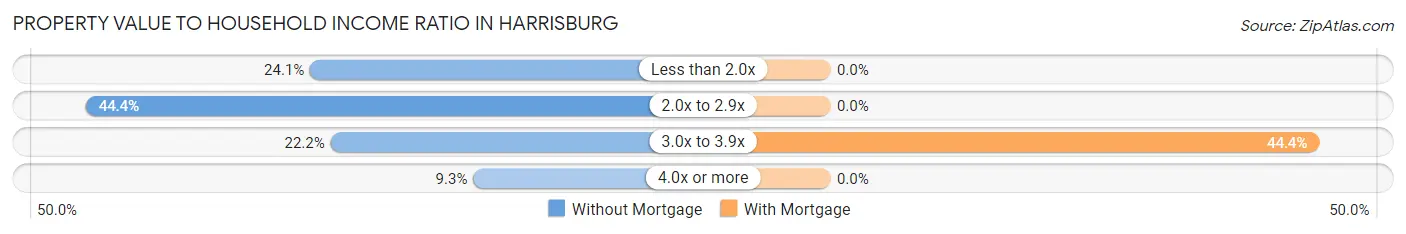
| Value-to-Income Ratio | Without Mortgage | With Mortgage |
| Less than 2.0x | 13 (24.1%) | 0 (0.0%) |
| 2.0x to 2.9x | 24 (44.4%) | 0 (0.0%) |
| 3.0x to 3.9x | 12 (22.2%) | 8 (44.4%) |
| 4.0x or more | 5 (9.3%) | 0 (0.0%) |
| Total | 54 (100.0%) | 18 (100.0%) |
Real Estate Taxes by Mortgage Status in Harrisburg
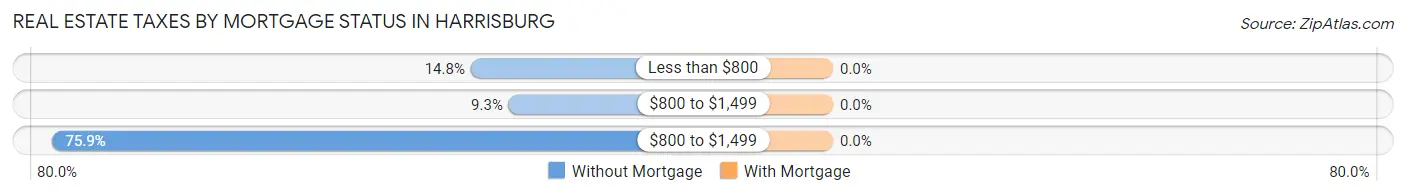
| Property Taxes | Without Mortgage | With Mortgage |
| Less than $800 | 8 (14.8%) | 0 (0.0%) |
| $800 to $1,499 | 5 (9.3%) | 0 (0.0%) |
| $800 to $1,499 | 41 (75.9%) | 0 (0.0%) |
| Total | 54 (100.0%) | 18 (100.0%) |
Health & Disability in Harrisburg
Health Insurance Coverage by Age in Harrisburg
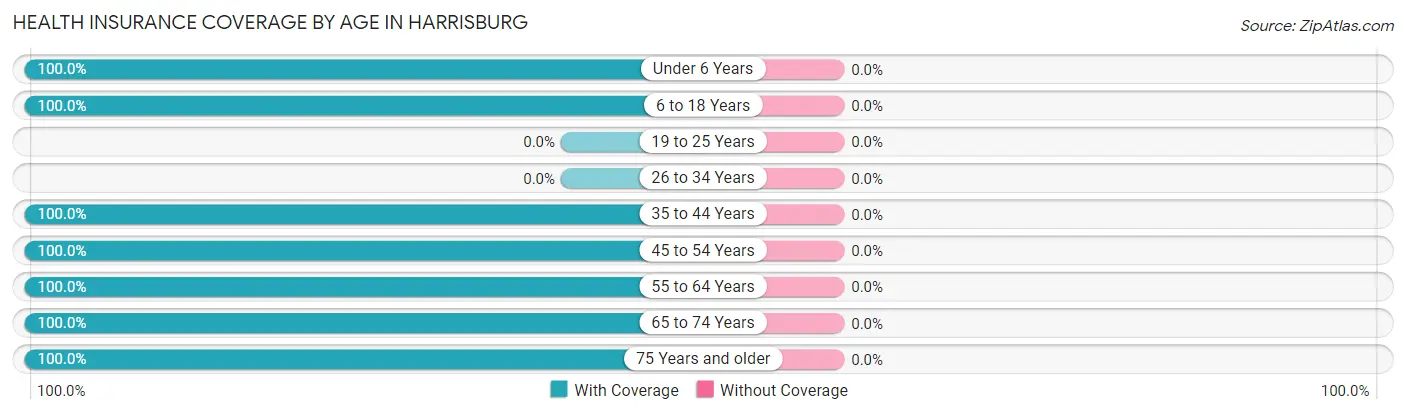
| Age Bracket | With Coverage | Without Coverage |
| Under 6 Years | 33 (100.0%) | 0 (0.0%) |
| 6 to 18 Years | 16 (100.0%) | 0 (0.0%) |
| 19 to 25 Years | 0 (0.0%) | 0 (0.0%) |
| 26 to 34 Years | 0 (0.0%) | 0 (0.0%) |
| 35 to 44 Years | 15 (100.0%) | 0 (0.0%) |
| 45 to 54 Years | 82 (100.0%) | 0 (0.0%) |
| 55 to 64 Years | 31 (100.0%) | 0 (0.0%) |
| 65 to 74 Years | 13 (100.0%) | 0 (0.0%) |
| 75 Years and older | 34 (100.0%) | 0 (0.0%) |
| Total | 224 (100.0%) | 0 (0.0%) |
Health Insurance Coverage by Citizenship Status in Harrisburg
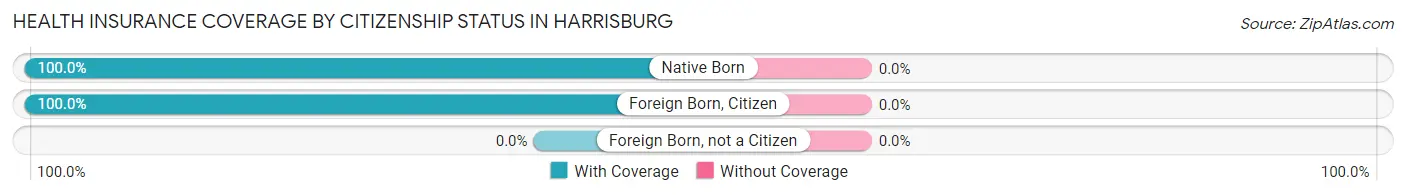
| Citizenship Status | With Coverage | Without Coverage |
| Native Born | 33 (100.0%) | 0 (0.0%) |
| Foreign Born, Citizen | 16 (100.0%) | 0 (0.0%) |
| Foreign Born, not a Citizen | 0 (0.0%) | 0 (0.0%) |
Health Insurance Coverage by Household Income in Harrisburg
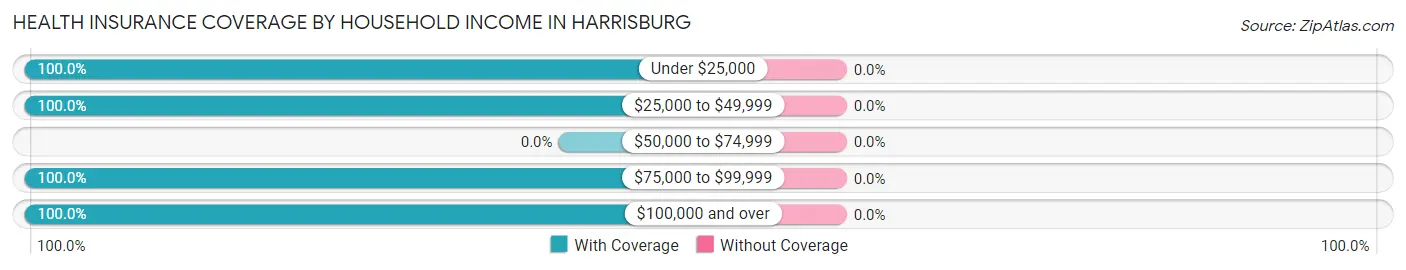
| Household Income | With Coverage | Without Coverage |
| Under $25,000 | 26 (100.0%) | 0 (0.0%) |
| $25,000 to $49,999 | 18 (100.0%) | 0 (0.0%) |
| $50,000 to $74,999 | 0 (0.0%) | 0 (0.0%) |
| $75,000 to $99,999 | 47 (100.0%) | 0 (0.0%) |
| $100,000 and over | 133 (100.0%) | 0 (0.0%) |
Public vs Private Health Insurance Coverage by Age in Harrisburg
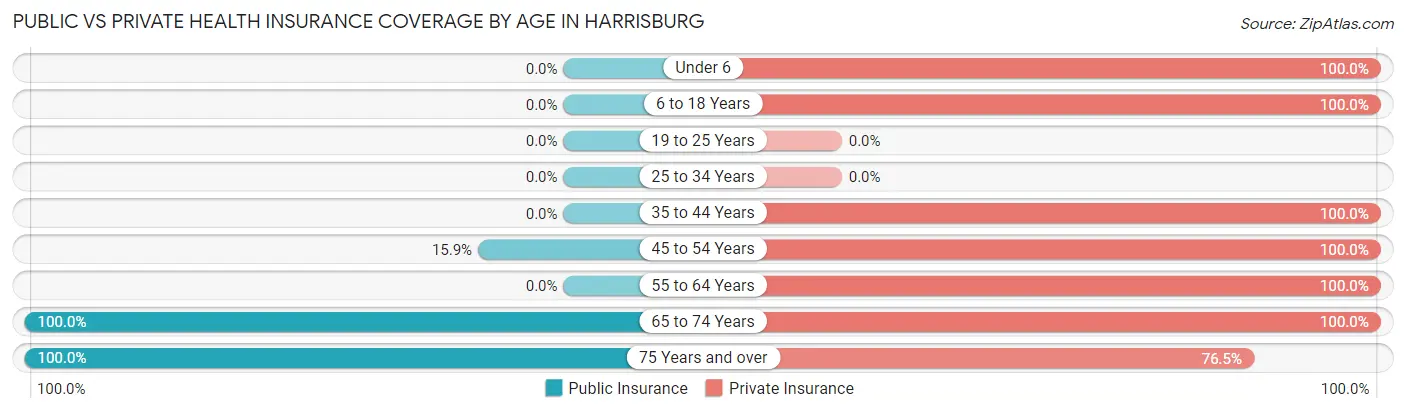
| Age Bracket | Public Insurance | Private Insurance |
| Under 6 | 0 (0.0%) | 33 (100.0%) |
| 6 to 18 Years | 0 (0.0%) | 16 (100.0%) |
| 19 to 25 Years | 0 (0.0%) | 0 (0.0%) |
| 25 to 34 Years | 0 (0.0%) | 0 (0.0%) |
| 35 to 44 Years | 0 (0.0%) | 15 (100.0%) |
| 45 to 54 Years | 13 (15.9%) | 82 (100.0%) |
| 55 to 64 Years | 0 (0.0%) | 31 (100.0%) |
| 65 to 74 Years | 13 (100.0%) | 13 (100.0%) |
| 75 Years and over | 34 (100.0%) | 26 (76.5%) |
| Total | 60 (26.8%) | 216 (96.4%) |
Disability Status by Sex by Age in Harrisburg
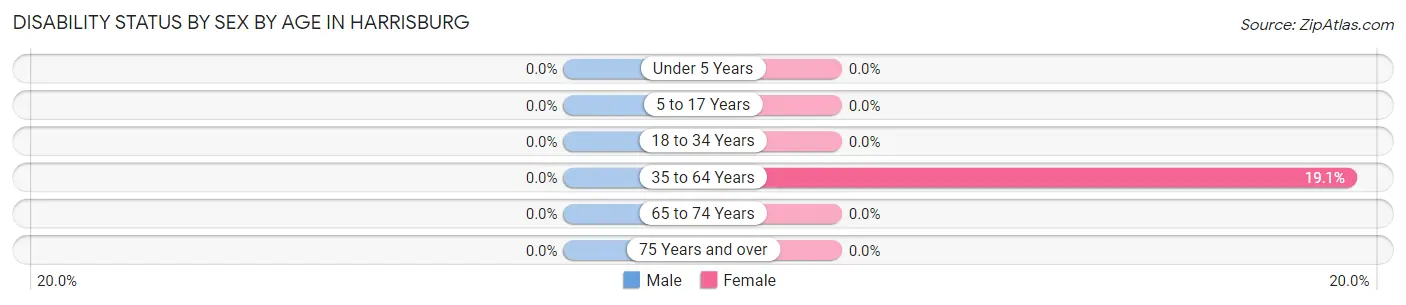
| Age Bracket | Male | Female |
| Under 5 Years | 0 (0.0%) | 0 (0.0%) |
| 5 to 17 Years | 0 (0.0%) | 0 (0.0%) |
| 18 to 34 Years | 0 (0.0%) | 0 (0.0%) |
| 35 to 64 Years | 0 (0.0%) | 13 (19.1%) |
| 65 to 74 Years | 0 (0.0%) | 0 (0.0%) |
| 75 Years and over | 0 (0.0%) | 0 (0.0%) |
Disability Class by Sex by Age in Harrisburg
Disability Class: Hearing Difficulty
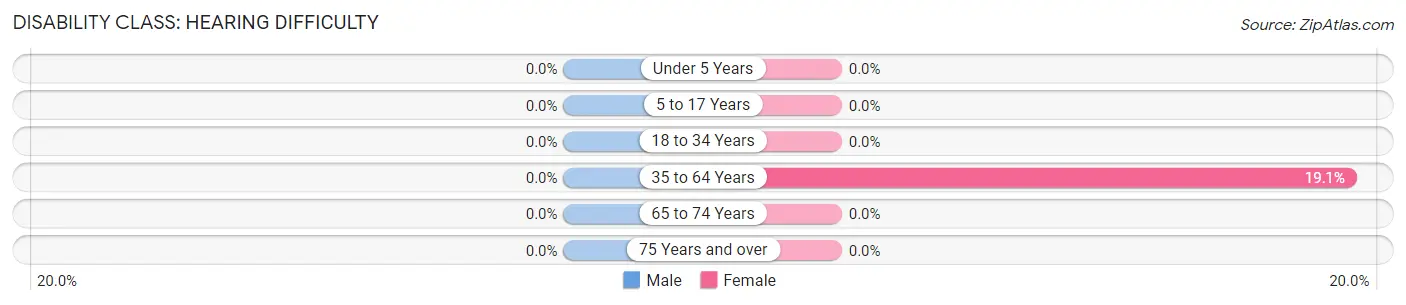
| Age Bracket | Male | Female |
| Under 5 Years | 0 (0.0%) | 0 (0.0%) |
| 5 to 17 Years | 0 (0.0%) | 0 (0.0%) |
| 18 to 34 Years | 0 (0.0%) | 0 (0.0%) |
| 35 to 64 Years | 0 (0.0%) | 13 (19.1%) |
| 65 to 74 Years | 0 (0.0%) | 0 (0.0%) |
| 75 Years and over | 0 (0.0%) | 0 (0.0%) |
Disability Class: Vision Difficulty
| Age Bracket | Male | Female |
| Under 5 Years | 0 (0.0%) | 0 (0.0%) |
| 5 to 17 Years | 0 (0.0%) | 0 (0.0%) |
| 18 to 34 Years | 0 (0.0%) | 0 (0.0%) |
| 35 to 64 Years | 0 (0.0%) | 0 (0.0%) |
| 65 to 74 Years | 0 (0.0%) | 0 (0.0%) |
| 75 Years and over | 0 (0.0%) | 0 (0.0%) |
Disability Class: Cognitive Difficulty
| Age Bracket | Male | Female |
| 5 to 17 Years | 0 (0.0%) | 0 (0.0%) |
| 18 to 34 Years | 0 (0.0%) | 0 (0.0%) |
| 35 to 64 Years | 0 (0.0%) | 0 (0.0%) |
| 65 to 74 Years | 0 (0.0%) | 0 (0.0%) |
| 75 Years and over | 0 (0.0%) | 0 (0.0%) |
Disability Class: Ambulatory Difficulty
| Age Bracket | Male | Female |
| 5 to 17 Years | 0 (0.0%) | 0 (0.0%) |
| 18 to 34 Years | 0 (0.0%) | 0 (0.0%) |
| 35 to 64 Years | 0 (0.0%) | 0 (0.0%) |
| 65 to 74 Years | 0 (0.0%) | 0 (0.0%) |
| 75 Years and over | 0 (0.0%) | 0 (0.0%) |
Disability Class: Self-Care Difficulty
| Age Bracket | Male | Female |
| 5 to 17 Years | 0 (0.0%) | 0 (0.0%) |
| 18 to 34 Years | 0 (0.0%) | 0 (0.0%) |
| 35 to 64 Years | 0 (0.0%) | 0 (0.0%) |
| 65 to 74 Years | 0 (0.0%) | 0 (0.0%) |
| 75 Years and over | 0 (0.0%) | 0 (0.0%) |
Technology Access in Harrisburg
Computing Device Access in Harrisburg
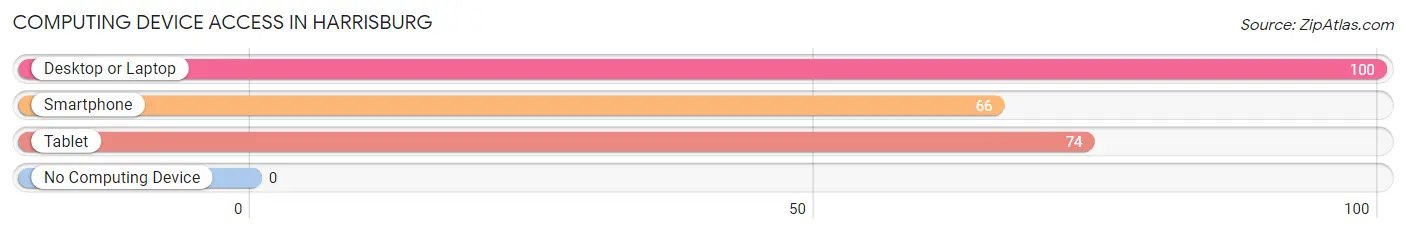
| Device Type | # Households | % Households |
| Desktop or Laptop | 100 | 100.0% |
| Smartphone | 66 | 66.0% |
| Tablet | 74 | 74.0% |
| No Computing Device | 0 | 0.0% |
| Total | 100 | 100.0% |
Internet Access in Harrisburg
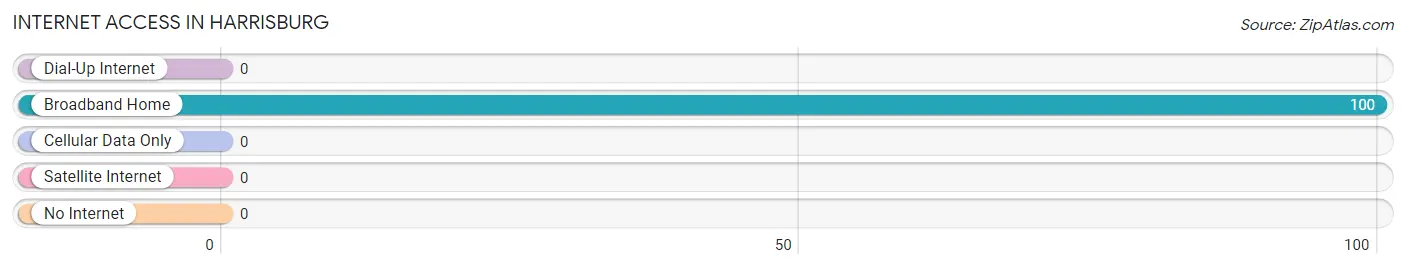
| Internet Type | # Households | % Households |
| Dial-Up Internet | 0 | 0.0% |
| Broadband Home | 100 | 100.0% |
| Cellular Data Only | 0 | 0.0% |
| Satellite Internet | 0 | 0.0% |
| No Internet | 0 | 0.0% |
| Total | 100 | 100.0% |
Harrisburg Summary
Harrisburg, Ohio is a small village located in the southeastern corner of Pickaway County, Ohio. It is situated along the Scioto River, approximately 25 miles south of Columbus. The village has a population of approximately 1,000 people and covers an area of 0.6 square miles.
History
The area that is now Harrisburg was first settled in 1810 by a group of settlers from Pennsylvania. The village was originally known as Harrisburgh, named after the original settler, John Harris. The village was officially incorporated in 1837.
In the early days, Harrisburg was a small farming community. The village was home to several mills, including a grist mill, a saw mill, and a woolen mill. The village also had a blacksmith shop, a general store, and a post office.
In the late 19th century, the village began to grow and develop. The Scioto Valley Railroad was built through the village in 1881, connecting Harrisburg to Columbus and other nearby towns. This allowed the village to become a shipping center for the surrounding area.
In the early 20th century, Harrisburg began to decline. The railroad was abandoned in the 1930s and the mills and other businesses began to close. The village was hit hard by the Great Depression and many of the residents moved away in search of work.
Geography
Harrisburg is located in the southeastern corner of Pickaway County, Ohio. It is situated along the Scioto River, approximately 25 miles south of Columbus. The village has a total area of 0.6 square miles, all of which is land.
The village is located in the Scioto Valley, a region of rolling hills and valleys. The terrain is mostly flat, with some areas of higher elevation. The climate is humid continental, with hot summers and cold winters.
Economy
The economy of Harrisburg is largely based on agriculture. The village is home to several farms, which produce a variety of crops, including corn, soybeans, and wheat. The village also has a few small businesses, including a grocery store, a hardware store, and a few restaurants.
Demographics
As of the 2010 census, the population of Harrisburg was 1,000. The racial makeup of the village was 97.2% White, 0.7% African American, 0.2% Native American, 0.2% Asian, and 1.7% from other races. The median household income was $41,250 and the median family income was $50,000.
Harrisburg is a small, rural village with a close-knit community. The village is home to several churches, a library, and a few parks. The village also has a volunteer fire department and a volunteer ambulance service.
Common Questions
What is Per Capita Income in Harrisburg?
Per Capita income in Harrisburg is $47,195.
What is the Median Family Income in Harrisburg?
Median Family Income in Harrisburg is $195,313.
What is Income or Wage Gap in Harrisburg?
Income or Wage Gap in Harrisburg is 0.5%.
Women in Harrisburg earn 99.5 cents for every dollar earned by a man.
What is Inequality or Gini Index in Harrisburg?
Inequality or Gini Index in Harrisburg is 0.41.
What is the Total Population of Harrisburg?
Total Population of Harrisburg is 224.
What is the Total Male Population of Harrisburg?
Total Male Population of Harrisburg is 83.
What is the Total Female Population of Harrisburg?
Total Female Population of Harrisburg is 141.
What is the Ratio of Males per 100 Females in Harrisburg?
There are 58.87 Males per 100 Females in Harrisburg.
What is the Ratio of Females per 100 Males in Harrisburg?
There are 169.88 Females per 100 Males in Harrisburg.
What is the Median Population Age in Harrisburg?
Median Population Age in Harrisburg is 51.4 Years.
What is the Average Family Size in Harrisburg
Average Family Size in Harrisburg is 3.2 People.
What is the Average Household Size in Harrisburg
Average Household Size in Harrisburg is 2.2 People.
How Large is the Labor Force in Harrisburg?
There are 105 People in the Labor Forcein in Harrisburg.
What is the Percentage of People in the Labor Force in Harrisburg?
60.0% of People are in the Labor Force in Harrisburg.