Miller Place, NY Map & Demographics
Miller Place Map
Miller Place Overview
$53,127
PER CAPITA INCOME
$153,682
AVG FAMILY INCOME
$136,203
AVG HOUSEHOLD INCOME
60.3%
WAGE / INCOME GAP [ % ]
39.7¢/ $1
WAGE / INCOME GAP [ $ ]
$21,398
FAMILY INCOME DEFICIT
0.39
INEQUALITY / GINI INDEX
11,848
TOTAL POPULATION
5,547
MALE POPULATION
6,301
FEMALE POPULATION
88.03
MALES / 100 FEMALES
113.59
FEMALES / 100 MALES
42.5
MEDIAN AGE
3.5
AVG FAMILY SIZE
3.0
AVG HOUSEHOLD SIZE
5,254
LABOR FORCE [ PEOPLE ]
54.5%
PERCENT IN LABOR FORCE
7.6%
UNEMPLOYMENT RATE
Miller Place Zip Codes
Miller Place Area Codes
Income in Miller Place
Income Overview in Miller Place
Per Capita Income in Miller Place is $53,127, while median incomes of families and households are $153,682 and $136,203 respectively.
| Characteristic | Number | Measure |
| Per Capita Income | 11,848 | $53,127 |
| Median Family Income | 2,995 | $153,682 |
| Mean Family Income | 2,995 | $183,669 |
| Median Household Income | 3,937 | $136,203 |
| Mean Household Income | 3,937 | $154,758 |
| Income Deficit | 2,995 | $21,398 |
| Wage / Income Gap (%) | 11,848 | 60.32% |
| Wage / Income Gap ($) | 11,848 | 39.68¢ per $1 |
| Gini / Inequality Index | 11,848 | 0.39 |
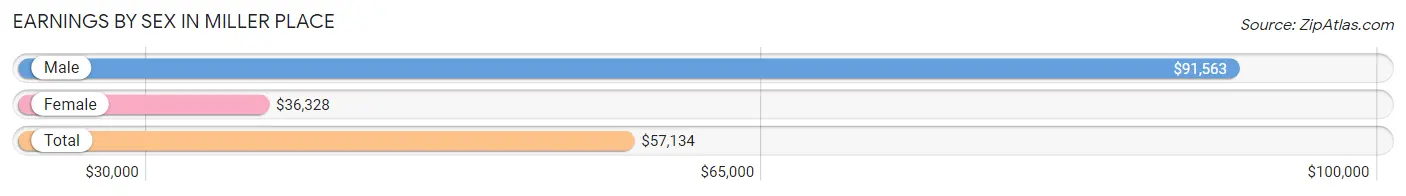
Earnings by Sex in Miller Place
Average Earnings in Miller Place are $57,134, $91,563 for men and $36,328 for women, a difference of 60.3%.
| Sex | Number | Average Earnings |
| Male | 3,049 (54.4%) | $91,563 |
| Female | 2,554 (45.6%) | $36,328 |
| Total | 5,603 (100.0%) | $57,134 |
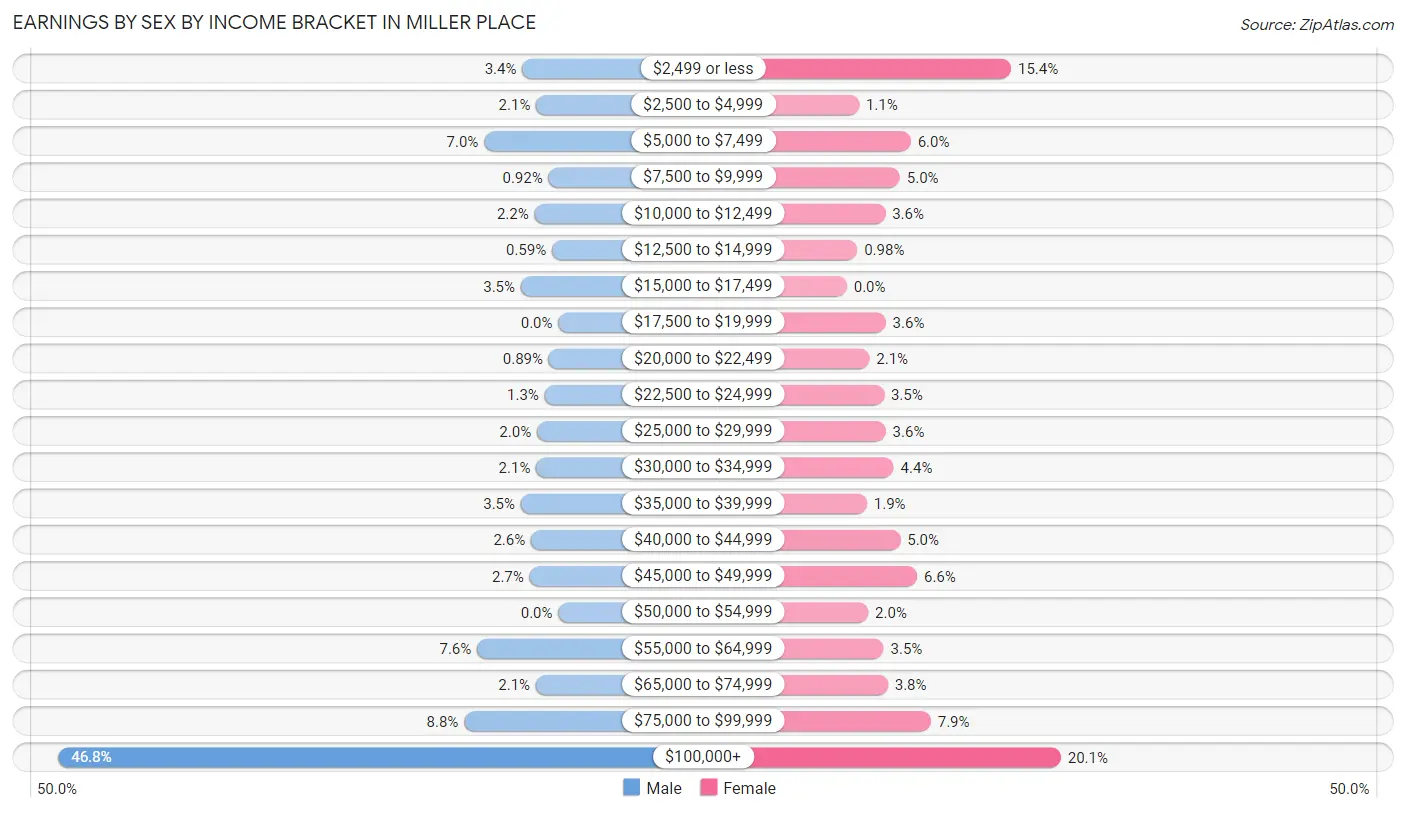
Earnings by Sex by Income Bracket in Miller Place
The most common earnings brackets in Miller Place are $100,000+ for men (1,428 | 46.8%) and $100,000+ for women (512 | 20.1%).
| Income | Male | Female |
| $2,499 or less | 103 (3.4%) | 393 (15.4%) |
| $2,500 to $4,999 | 63 (2.1%) | 29 (1.1%) |
| $5,000 to $7,499 | 212 (7.0%) | 153 (6.0%) |
| $7,500 to $9,999 | 28 (0.9%) | 127 (5.0%) |
| $10,000 to $12,499 | 68 (2.2%) | 92 (3.6%) |
| $12,500 to $14,999 | 18 (0.6%) | 25 (1.0%) |
| $15,000 to $17,499 | 107 (3.5%) | 0 (0.0%) |
| $17,500 to $19,999 | 0 (0.0%) | 93 (3.6%) |
| $20,000 to $22,499 | 27 (0.9%) | 54 (2.1%) |
| $22,500 to $24,999 | 39 (1.3%) | 89 (3.5%) |
| $25,000 to $29,999 | 61 (2.0%) | 93 (3.6%) |
| $30,000 to $34,999 | 63 (2.1%) | 112 (4.4%) |
| $35,000 to $39,999 | 107 (3.5%) | 48 (1.9%) |
| $40,000 to $44,999 | 78 (2.6%) | 128 (5.0%) |
| $45,000 to $49,999 | 82 (2.7%) | 168 (6.6%) |
| $50,000 to $54,999 | 0 (0.0%) | 51 (2.0%) |
| $55,000 to $64,999 | 232 (7.6%) | 88 (3.5%) |
| $65,000 to $74,999 | 64 (2.1%) | 98 (3.8%) |
| $75,000 to $99,999 | 269 (8.8%) | 201 (7.9%) |
| $100,000+ | 1,428 (46.8%) | 512 (20.1%) |
| Total | 3,049 (100.0%) | 2,554 (100.0%) |
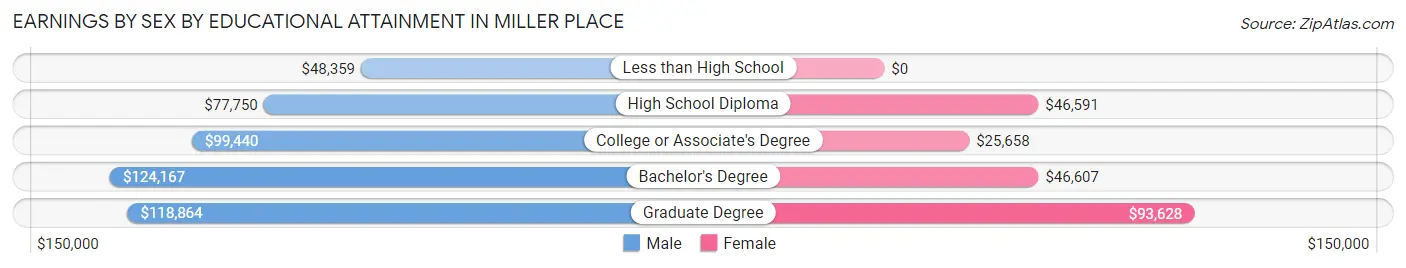
Earnings by Sex by Educational Attainment in Miller Place
Average earnings in Miller Place are $103,984 for men and $48,698 for women, a difference of 53.2%. Men with an educational attainment of bachelor's degree enjoy the highest average annual earnings of $124,167, while those with less than high school education earn the least with $48,359. Women with an educational attainment of graduate degree earn the most with the average annual earnings of $93,628, while those with college or associate's degree education have the smallest earnings of $25,658.
| Educational Attainment | Male Income | Female Income |
| Less than High School | $48,359 | $0 |
| High School Diploma | $77,750 | $46,591 |
| College or Associate's Degree | $99,440 | $25,658 |
| Bachelor's Degree | $124,167 | $46,607 |
| Graduate Degree | $118,864 | $93,628 |
| Total | $103,984 | $48,698 |
Family Income in Miller Place
Family Income Brackets in Miller Place
According to the Miller Place family income data, there are 1,108 families falling into the $200,000+ income range, which is the most common income bracket and makes up 37.0% of all families.
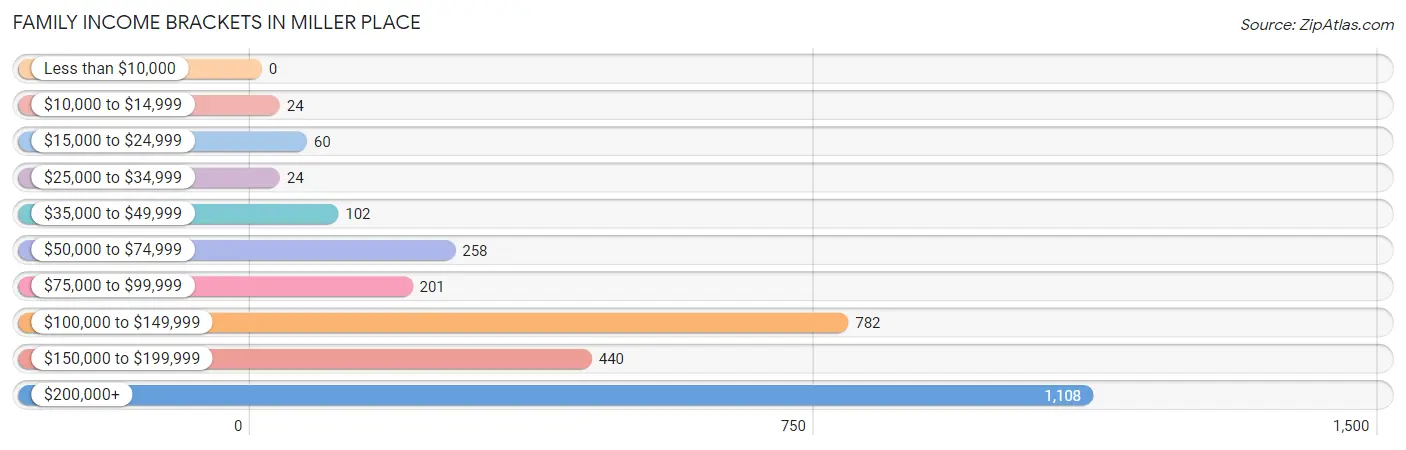
| Income Bracket | # Families | % Families |
| Less than $10,000 | 0 | 0.0% |
| $10,000 to $14,999 | 24 | 0.8% |
| $15,000 to $24,999 | 60 | 2.0% |
| $25,000 to $34,999 | 24 | 0.8% |
| $35,000 to $49,999 | 102 | 3.4% |
| $50,000 to $74,999 | 258 | 8.6% |
| $75,000 to $99,999 | 201 | 6.7% |
| $100,000 to $149,999 | 782 | 26.1% |
| $150,000 to $199,999 | 440 | 14.7% |
| $200,000+ | 1,108 | 37.0% |
Family Income by Famaliy Size in Miller Place
6-person families (210 | 7.0%) account for the highest median family income in Miller Place with $237,125 per family, while 2-person families (1,182 | 39.5%) have the highest median income of $67,022 per family member.
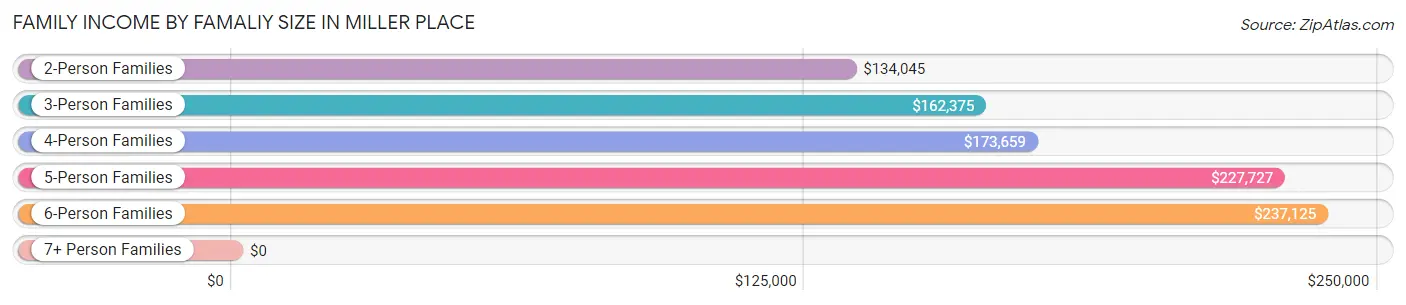
| Income Bracket | # Families | Median Income |
| 2-Person Families | 1,182 (39.5%) | $134,045 |
| 3-Person Families | 484 (16.2%) | $162,375 |
| 4-Person Families | 848 (28.3%) | $173,659 |
| 5-Person Families | 254 (8.5%) | $227,727 |
| 6-Person Families | 210 (7.0%) | $237,125 |
| 7+ Person Families | 17 (0.6%) | $0 |
| Total | 2,995 (100.0%) | $153,682 |
Family Income by Number of Earners in Miller Place
The median family income in Miller Place is $153,682, with families comprising 3+ earners (433) having the highest median family income of $229,367, while families with no earners (396) have the lowest median family income of $88,833, accounting for 14.5% and 13.2% of families, respectively.
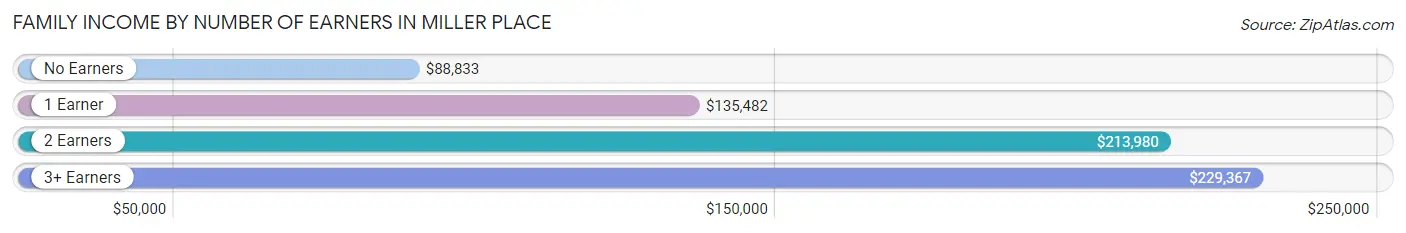
| Number of Earners | # Families | Median Income |
| No Earners | 396 (13.2%) | $88,833 |
| 1 Earner | 1,031 (34.4%) | $135,482 |
| 2 Earners | 1,135 (37.9%) | $213,980 |
| 3+ Earners | 433 (14.5%) | $229,367 |
| Total | 2,995 (100.0%) | $153,682 |
Household Income in Miller Place
Household Income Brackets in Miller Place
With 1,114 households falling in the category, the $200,000+ income range is the most frequent in Miller Place, accounting for 28.3% of all households. In contrast, only 59 households (1.5%) fall into the $15,000 to $24,999 income bracket, making it the least populous group.
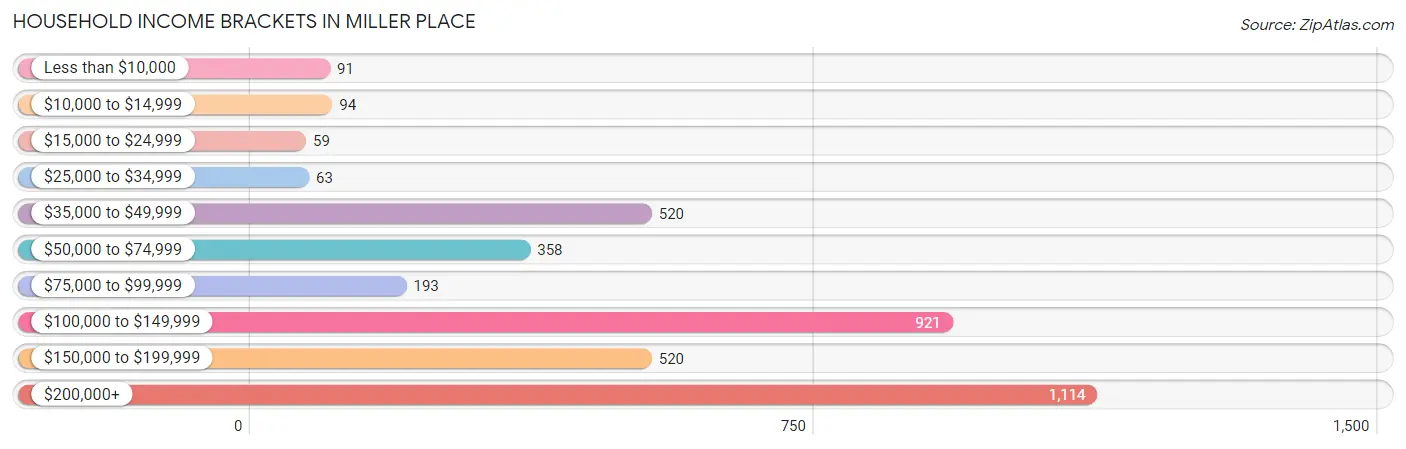
| Income Bracket | # Households | % Households |
| Less than $10,000 | 91 | 2.3% |
| $10,000 to $14,999 | 94 | 2.4% |
| $15,000 to $24,999 | 59 | 1.5% |
| $25,000 to $34,999 | 63 | 1.6% |
| $35,000 to $49,999 | 520 | 13.2% |
| $50,000 to $74,999 | 358 | 9.1% |
| $75,000 to $99,999 | 193 | 4.9% |
| $100,000 to $149,999 | 921 | 23.4% |
| $150,000 to $199,999 | 520 | 13.2% |
| $200,000+ | 1,114 | 28.3% |
Household Income by Householder Age in Miller Place
The median household income in Miller Place is $136,203, with the highest median household income of $173,445 found in the 45 to 64 years age bracket for the primary householder. A total of 1,689 households (42.9%) fall into this category. Meanwhile, the 15 to 24 years age bracket for the primary householder has the lowest median household income of $0, with 11 households (0.3%) in this group.
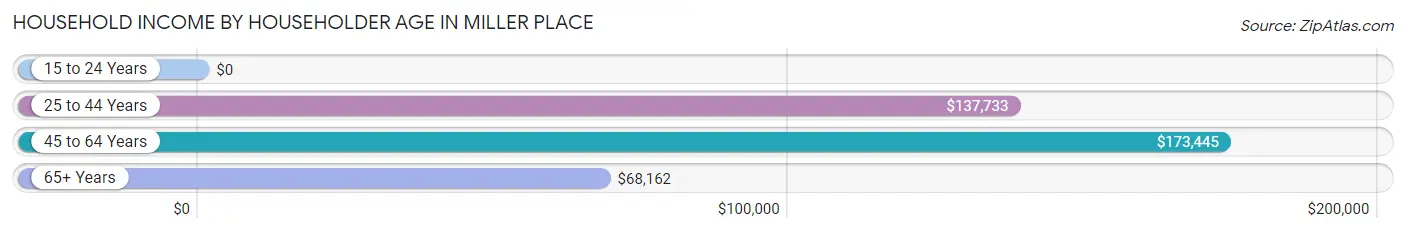
| Income Bracket | # Households | Median Income |
| 15 to 24 Years | 11 (0.3%) | $0 |
| 25 to 44 Years | 860 (21.8%) | $137,733 |
| 45 to 64 Years | 1,689 (42.9%) | $173,445 |
| 65+ Years | 1,377 (35.0%) | $68,162 |
| Total | 3,937 (100.0%) | $136,203 |
Poverty in Miller Place
Income Below Poverty by Sex and Age in Miller Place
With 7.8% poverty level for males and 4.9% for females among the residents of Miller Place, 12 to 14 year old males and 35 to 44 year old females are the most vulnerable to poverty, with 42 males (23.0%) and 74 females (15.8%) in their respective age groups living below the poverty level.
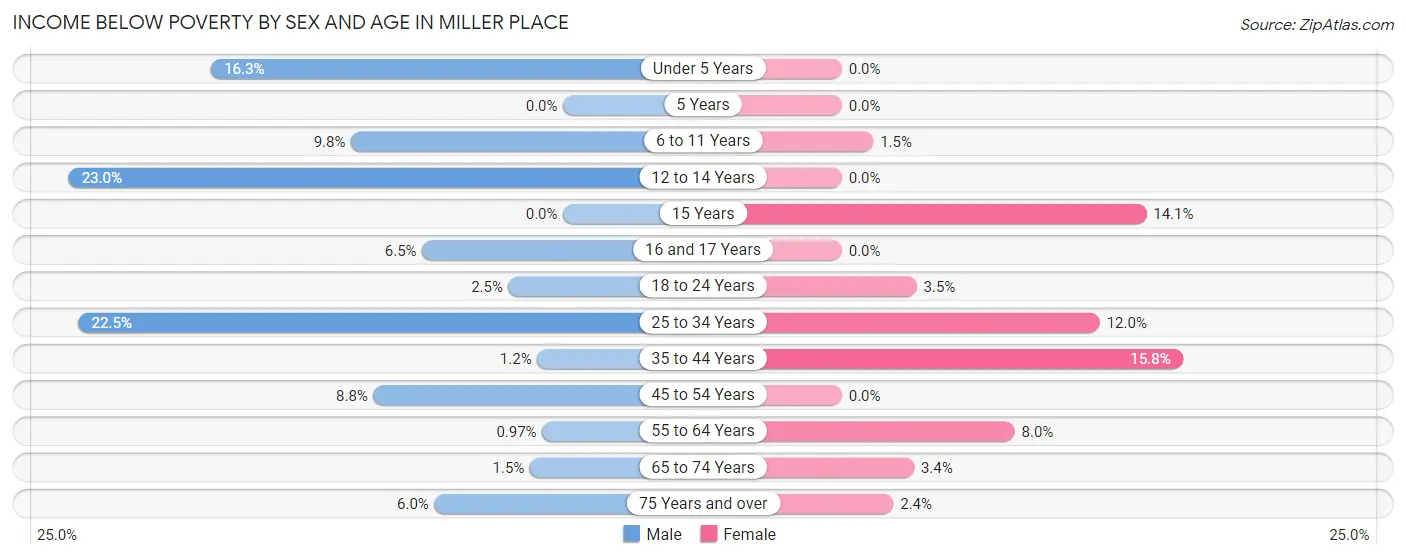
| Age Bracket | Male | Female |
| Under 5 Years | 25 (16.3%) | 0 (0.0%) |
| 5 Years | 0 (0.0%) | 0 (0.0%) |
| 6 to 11 Years | 42 (9.8%) | 7 (1.5%) |
| 12 to 14 Years | 42 (23.0%) | 0 (0.0%) |
| 15 Years | 0 (0.0%) | 39 (14.1%) |
| 16 and 17 Years | 17 (6.5%) | 0 (0.0%) |
| 18 to 24 Years | 11 (2.5%) | 27 (3.5%) |
| 25 to 34 Years | 184 (22.5%) | 51 (12.0%) |
| 35 to 44 Years | 8 (1.2%) | 74 (15.8%) |
| 45 to 54 Years | 66 (8.8%) | 0 (0.0%) |
| 55 to 64 Years | 8 (1.0%) | 65 (8.0%) |
| 65 to 74 Years | 9 (1.5%) | 33 (3.4%) |
| 75 Years and over | 20 (6.0%) | 10 (2.4%) |
| Total | 432 (7.8%) | 306 (4.9%) |
Income Above Poverty by Sex and Age in Miller Place
According to the poverty statistics in Miller Place, males aged 5 years and females aged under 5 years are the age groups that are most secure financially, with 100.0% of males and 100.0% of females in these age groups living above the poverty line.
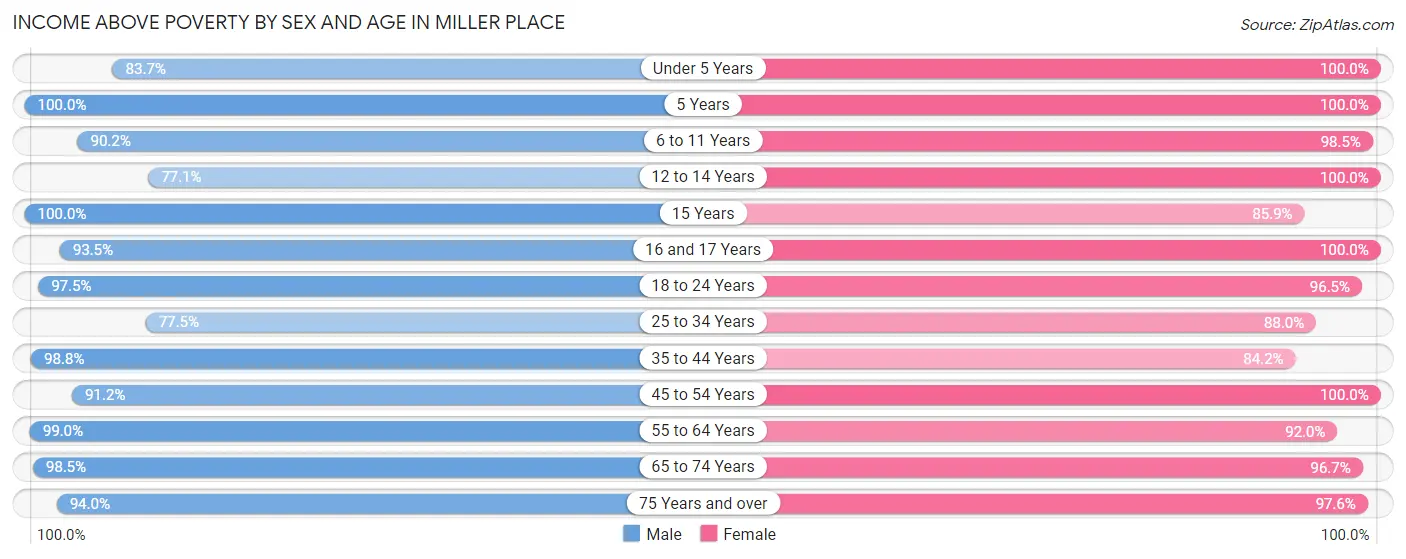
| Age Bracket | Male | Female |
| Under 5 Years | 128 (83.7%) | 172 (100.0%) |
| 5 Years | 45 (100.0%) | 59 (100.0%) |
| 6 to 11 Years | 385 (90.2%) | 472 (98.5%) |
| 12 to 14 Years | 141 (77.0%) | 326 (100.0%) |
| 15 Years | 46 (100.0%) | 237 (85.9%) |
| 16 and 17 Years | 243 (93.5%) | 219 (100.0%) |
| 18 to 24 Years | 423 (97.5%) | 750 (96.5%) |
| 25 to 34 Years | 634 (77.5%) | 375 (88.0%) |
| 35 to 44 Years | 657 (98.8%) | 394 (84.2%) |
| 45 to 54 Years | 684 (91.2%) | 864 (100.0%) |
| 55 to 64 Years | 817 (99.0%) | 745 (92.0%) |
| 65 to 74 Years | 576 (98.5%) | 953 (96.7%) |
| 75 Years and over | 315 (94.0%) | 409 (97.6%) |
| Total | 5,094 (92.2%) | 5,975 (95.1%) |
Income Below Poverty Among Married-Couple Families in Miller Place
The poverty statistics for married-couple families in Miller Place show that 1.9% or 52 of the total 2,702 families live below the poverty line. Families with 3 or 4 children have the highest poverty rate of 18.3%, comprising of 44 families. On the other hand, families with no children have the lowest poverty rate of 0.0%, which includes 0 families.
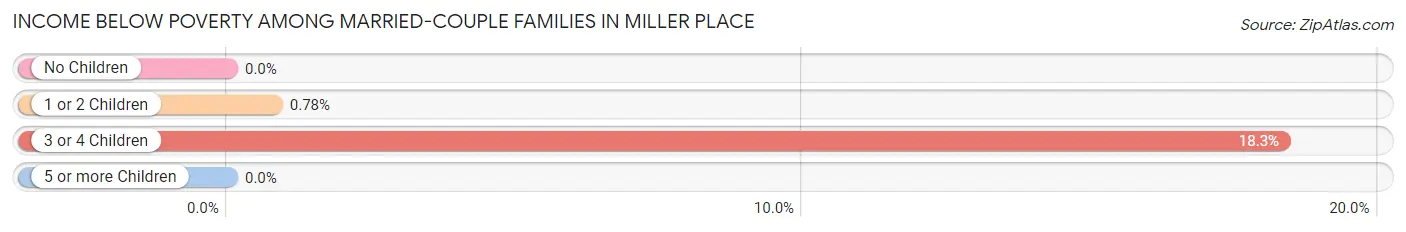
| Children | Above Poverty | Below Poverty |
| No Children | 1,415 (100.0%) | 0 (0.0%) |
| 1 or 2 Children | 1,022 (99.2%) | 8 (0.8%) |
| 3 or 4 Children | 196 (81.7%) | 44 (18.3%) |
| 5 or more Children | 17 (100.0%) | 0 (0.0%) |
| Total | 2,650 (98.1%) | 52 (1.9%) |
Income Below Poverty Among Single-Parent Households in Miller Place
| Children | Single Father | Single Mother |
| No Children | 0 (0.0%) | 0 (0.0%) |
| 1 or 2 Children | 0 (0.0%) | 0 (0.0%) |
| 3 or 4 Children | 0 (0.0%) | 0 (0.0%) |
| 5 or more Children | 0 (0.0%) | 0 (0.0%) |
| Total | 0 (0.0%) | 0 (0.0%) |
Income Below Poverty Among Married-Couple vs Single-Parent Households in Miller Place
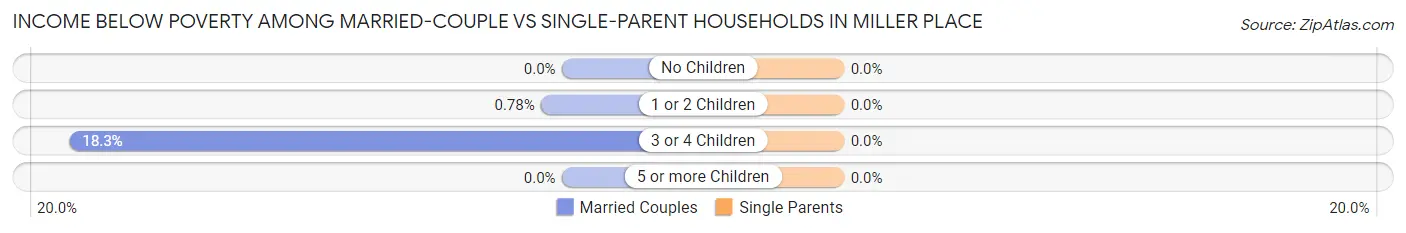
| Children | Married-Couple Families | Single-Parent Households |
| No Children | 0 (0.0%) | 0 (0.0%) |
| 1 or 2 Children | 8 (0.8%) | 0 (0.0%) |
| 3 or 4 Children | 44 (18.3%) | 0 (0.0%) |
| 5 or more Children | 0 (0.0%) | 0 (0.0%) |
| Total | 52 (1.9%) | 0 (0.0%) |
Race in Miller Place
The most populous races in Miller Place are White / Caucasian (10,299 | 86.9%), Hispanic or Latino (1,406 | 11.9%), and Two or more Races (825 | 7.0%).
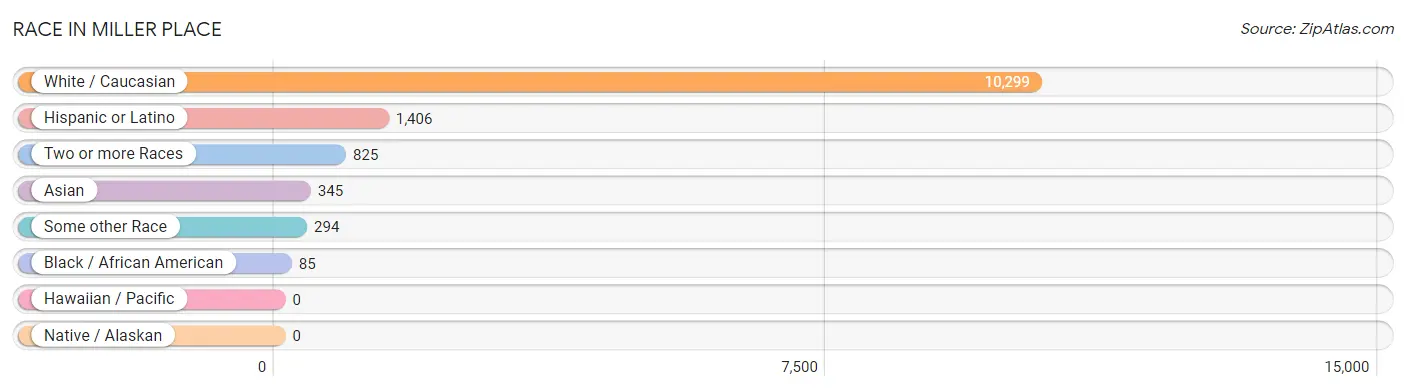
| Race | # Population | % Population |
| Asian | 345 | 2.9% |
| Black / African American | 85 | 0.7% |
| Hawaiian / Pacific | 0 | 0.0% |
| Hispanic or Latino | 1,406 | 11.9% |
| Native / Alaskan | 0 | 0.0% |
| White / Caucasian | 10,299 | 86.9% |
| Two or more Races | 825 | 7.0% |
| Some other Race | 294 | 2.5% |
| Total | 11,848 | 100.0% |
Ancestry in Miller Place
The most populous ancestries reported in Miller Place are Italian (3,263 | 27.5%), Irish (2,974 | 25.1%), German (1,872 | 15.8%), American (868 | 7.3%), and Puerto Rican (817 | 6.9%), together accounting for 82.7% of all Miller Place residents.
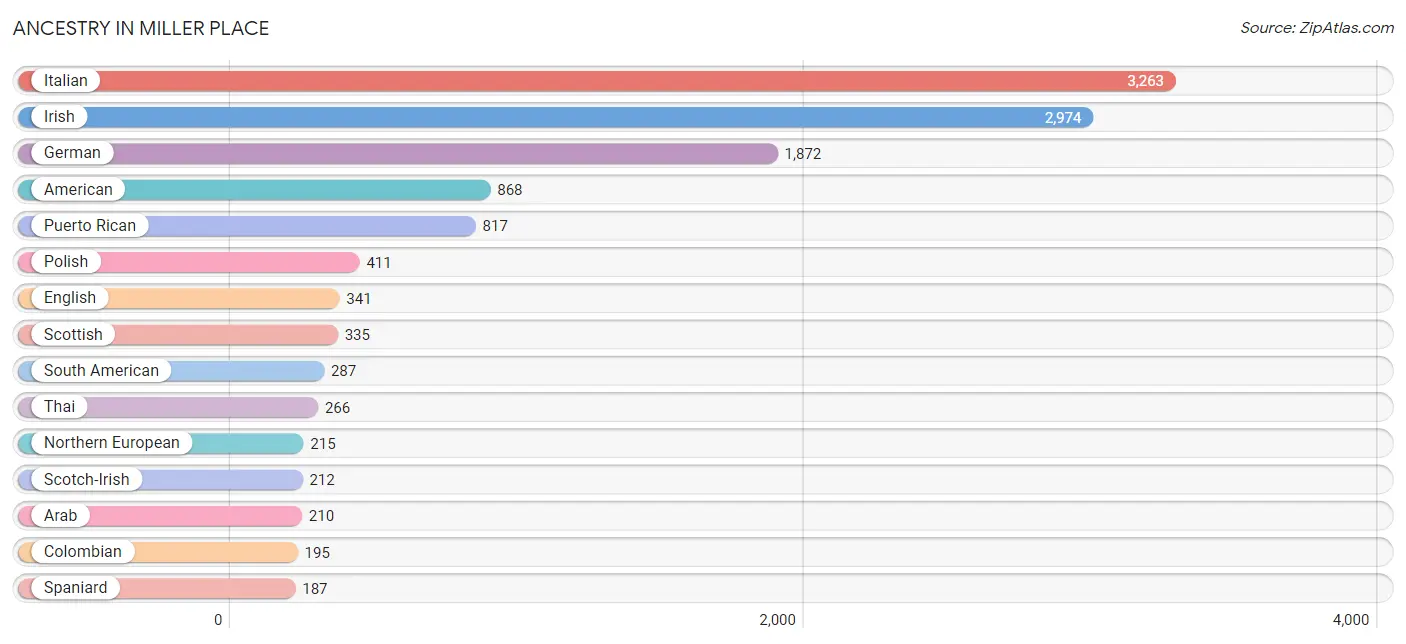
| Ancestry | # Population | % Population |
| American | 868 | 7.3% |
| Arab | 210 | 1.8% |
| Armenian | 37 | 0.3% |
| Australian | 5 | 0.0% |
| Austrian | 54 | 0.5% |
| Belgian | 19 | 0.2% |
| British | 50 | 0.4% |
| Colombian | 195 | 1.7% |
| Croatian | 49 | 0.4% |
| Danish | 17 | 0.1% |
| Dominican | 12 | 0.1% |
| Dutch | 13 | 0.1% |
| Eastern European | 45 | 0.4% |
| Ecuadorian | 92 | 0.8% |
| English | 341 | 2.9% |
| European | 118 | 1.0% |
| Filipino | 13 | 0.1% |
| French | 72 | 0.6% |
| French Canadian | 40 | 0.3% |
| German | 1,872 | 15.8% |
| Greek | 152 | 1.3% |
| Guyanese | 69 | 0.6% |
| Haitian | 47 | 0.4% |
| Hungarian | 108 | 0.9% |
| Icelander | 22 | 0.2% |
| Indian (Asian) | 65 | 0.5% |
| Iranian | 45 | 0.4% |
| Irish | 2,974 | 25.1% |
| Italian | 3,263 | 27.5% |
| Jamaican | 9 | 0.1% |
| Jordanian | 160 | 1.3% |
| Lebanese | 34 | 0.3% |
| Lithuanian | 7 | 0.1% |
| Mexican | 81 | 0.7% |
| Northern European | 215 | 1.8% |
| Norwegian | 68 | 0.6% |
| Polish | 411 | 3.5% |
| Portuguese | 45 | 0.4% |
| Puerto Rican | 817 | 6.9% |
| Romanian | 24 | 0.2% |
| Russian | 177 | 1.5% |
| Scandinavian | 88 | 0.7% |
| Scotch-Irish | 212 | 1.8% |
| Scottish | 335 | 2.8% |
| South American | 287 | 2.4% |
| Spaniard | 187 | 1.6% |
| Spanish | 15 | 0.1% |
| Sri Lankan | 10 | 0.1% |
| Swedish | 45 | 0.4% |
| Swiss | 44 | 0.4% |
| Syrian | 16 | 0.1% |
| Thai | 266 | 2.2% |
| Turkish | 155 | 1.3% |
| Ukrainian | 78 | 0.7% |
| Welsh | 31 | 0.3% |
| Yugoslavian | 44 | 0.4% | View All 56 Rows |
Immigrants in Miller Place
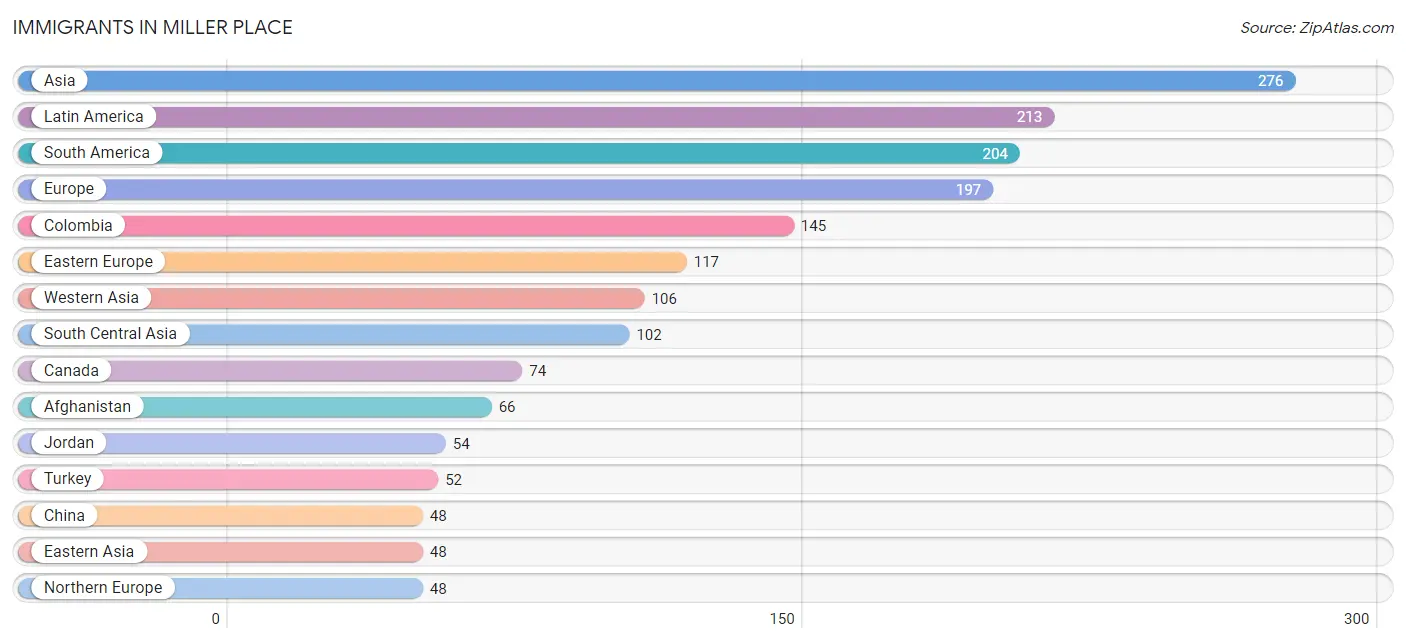
The most numerous immigrant groups reported in Miller Place came from Asia (276 | 2.3%), Latin America (213 | 1.8%), South America (204 | 1.7%), Europe (197 | 1.7%), and Colombia (145 | 1.2%), together accounting for 8.7% of all Miller Place residents.
| Immigration Origin | # Population | % Population |
| Afghanistan | 66 | 0.6% |
| Asia | 276 | 2.3% |
| Bolivia | 16 | 0.1% |
| Canada | 74 | 0.6% |
| Caribbean | 9 | 0.1% |
| China | 48 | 0.4% |
| Colombia | 145 | 1.2% |
| Eastern Asia | 48 | 0.4% |
| Eastern Europe | 117 | 1.0% |
| Ecuador | 25 | 0.2% |
| England | 15 | 0.1% |
| Europe | 197 | 1.7% |
| France | 12 | 0.1% |
| Guyana | 18 | 0.2% |
| Haiti | 9 | 0.1% |
| India | 18 | 0.2% |
| Iran | 18 | 0.2% |
| Ireland | 20 | 0.2% |
| Jordan | 54 | 0.5% |
| Latin America | 213 | 1.8% |
| Northern Europe | 48 | 0.4% |
| Portugal | 20 | 0.2% |
| Russia | 39 | 0.3% |
| Scotland | 13 | 0.1% |
| Singapore | 20 | 0.2% |
| South America | 204 | 1.7% |
| South Central Asia | 102 | 0.9% |
| South Eastern Asia | 20 | 0.2% |
| Southern Europe | 20 | 0.2% |
| Turkey | 52 | 0.4% |
| Ukraine | 12 | 0.1% |
| Western Asia | 106 | 0.9% |
| Western Europe | 12 | 0.1% | View All 33 Rows |
Sex and Age in Miller Place
Sex and Age in Miller Place
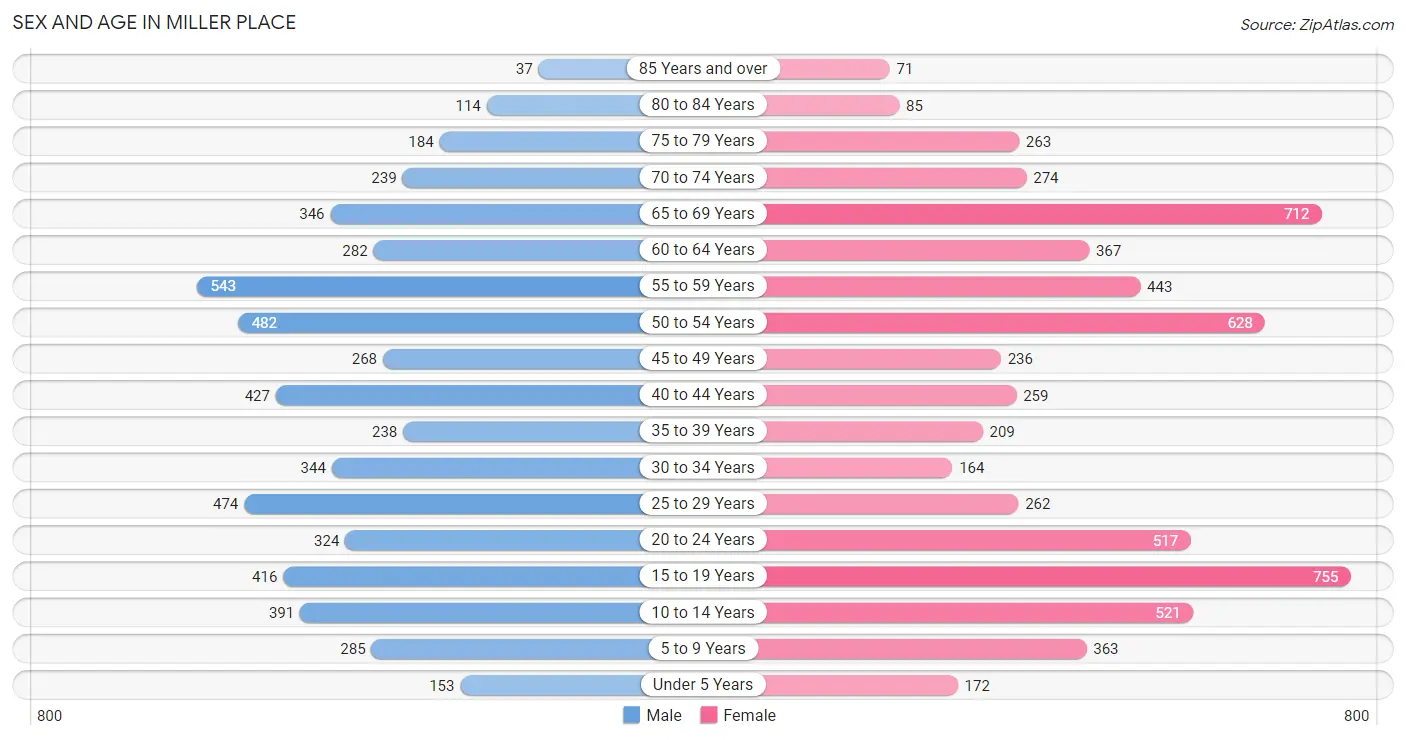
The most populous age groups in Miller Place are 55 to 59 Years (543 | 9.8%) for men and 15 to 19 Years (755 | 12.0%) for women.
| Age Bracket | Male | Female |
| Under 5 Years | 153 (2.8%) | 172 (2.7%) |
| 5 to 9 Years | 285 (5.1%) | 363 (5.8%) |
| 10 to 14 Years | 391 (7.0%) | 521 (8.3%) |
| 15 to 19 Years | 416 (7.5%) | 755 (12.0%) |
| 20 to 24 Years | 324 (5.8%) | 517 (8.2%) |
| 25 to 29 Years | 474 (8.6%) | 262 (4.2%) |
| 30 to 34 Years | 344 (6.2%) | 164 (2.6%) |
| 35 to 39 Years | 238 (4.3%) | 209 (3.3%) |
| 40 to 44 Years | 427 (7.7%) | 259 (4.1%) |
| 45 to 49 Years | 268 (4.8%) | 236 (3.7%) |
| 50 to 54 Years | 482 (8.7%) | 628 (10.0%) |
| 55 to 59 Years | 543 (9.8%) | 443 (7.0%) |
| 60 to 64 Years | 282 (5.1%) | 367 (5.8%) |
| 65 to 69 Years | 346 (6.2%) | 712 (11.3%) |
| 70 to 74 Years | 239 (4.3%) | 274 (4.3%) |
| 75 to 79 Years | 184 (3.3%) | 263 (4.2%) |
| 80 to 84 Years | 114 (2.1%) | 85 (1.3%) |
| 85 Years and over | 37 (0.7%) | 71 (1.1%) |
| Total | 5,547 (100.0%) | 6,301 (100.0%) |
Families and Households in Miller Place
Median Family Size in Miller Place
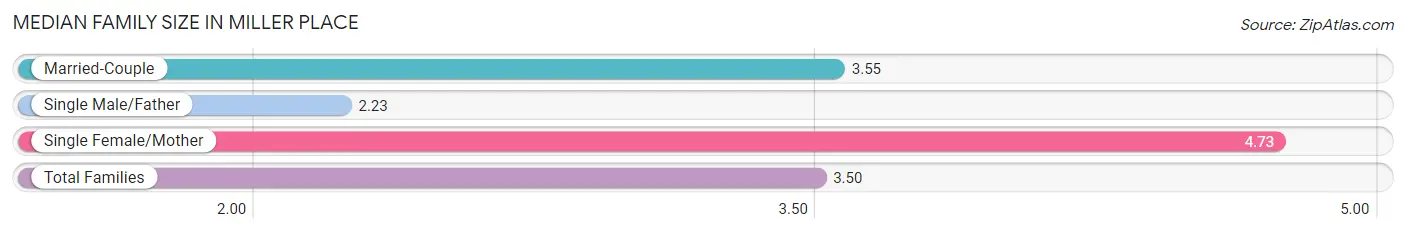
The median family size in Miller Place is 3.50 persons per family, with single female/mother families (95 | 3.2%) accounting for the largest median family size of 4.73 persons per family. On the other hand, single male/father families (198 | 6.6%) represent the smallest median family size with 2.23 persons per family.
| Family Type | # Families | Family Size |
| Married-Couple | 2,702 (90.2%) | 3.55 |
| Single Male/Father | 198 (6.6%) | 2.23 |
| Single Female/Mother | 95 (3.2%) | 4.73 |
| Total Families | 2,995 (100.0%) | 3.50 |
Median Household Size in Miller Place
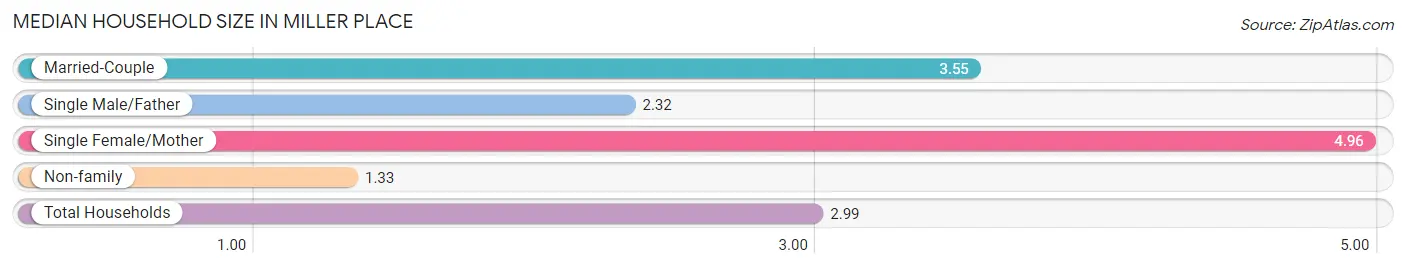
The median household size in Miller Place is 2.99 persons per household, with single female/mother households (95 | 2.4%) accounting for the largest median household size of 4.96 persons per household. non-family households (942 | 23.9%) represent the smallest median household size with 1.33 persons per household.
| Household Type | # Households | Household Size |
| Married-Couple | 2,702 (68.6%) | 3.55 |
| Single Male/Father | 198 (5.0%) | 2.32 |
| Single Female/Mother | 95 (2.4%) | 4.96 |
| Non-family | 942 (23.9%) | 1.33 |
| Total Households | 3,937 (100.0%) | 2.99 |
Household Size by Marriage Status in Miller Place
Out of a total of 3,937 households in Miller Place, 2,995 (76.1%) are family households, while 942 (23.9%) are nonfamily households. The most numerous type of family households are 2-person households, comprising 1,155, and the most common type of nonfamily households are 1-person households, comprising 805.
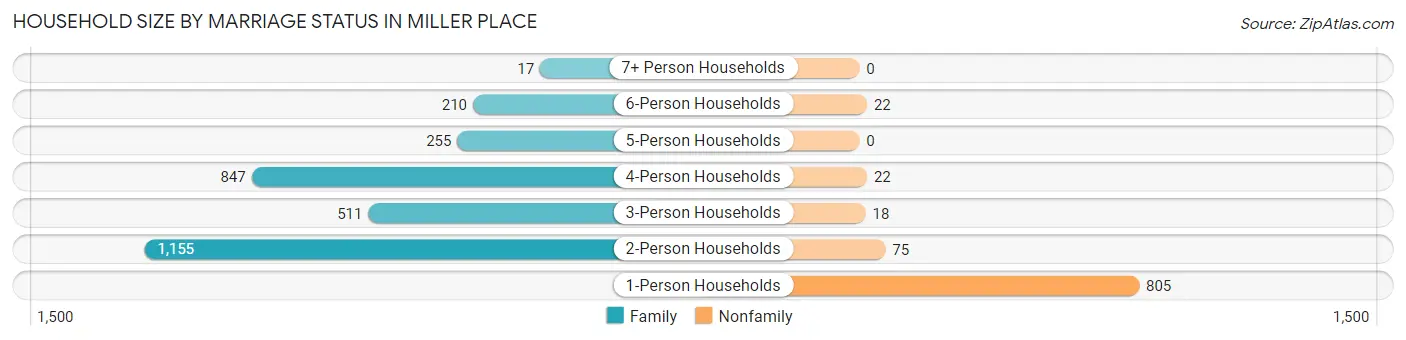
| Household Size | Family Households | Nonfamily Households |
| 1-Person Households | - | 805 (20.4%) |
| 2-Person Households | 1,155 (29.3%) | 75 (1.9%) |
| 3-Person Households | 511 (13.0%) | 18 (0.5%) |
| 4-Person Households | 847 (21.5%) | 22 (0.6%) |
| 5-Person Households | 255 (6.5%) | 0 (0.0%) |
| 6-Person Households | 210 (5.3%) | 22 (0.6%) |
| 7+ Person Households | 17 (0.4%) | 0 (0.0%) |
| Total | 2,995 (76.1%) | 942 (23.9%) |
Female Fertility in Miller Place
Fertility by Age in Miller Place
Average fertility rate in Miller Place is 47.0 births per 1,000 women. Women in the age bracket of 35 to 50 years have the highest fertility rate with 76.0 births per 1,000 women. Women in the age bracket of 35 to 50 years acount for 51.3% of all women with births.
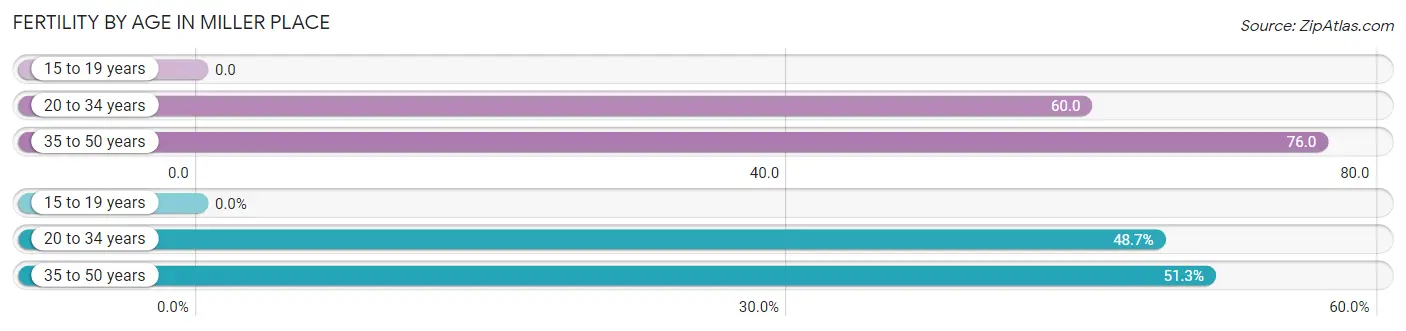
| Age Bracket | Women with Births | Births / 1,000 Women |
| 15 to 19 years | 0 (0.0%) | 0.0 |
| 20 to 34 years | 57 (48.7%) | 60.0 |
| 35 to 50 years | 60 (51.3%) | 76.0 |
| Total | 117 (100.0%) | 47.0 |
Fertility by Age by Marriage Status in Miller Place
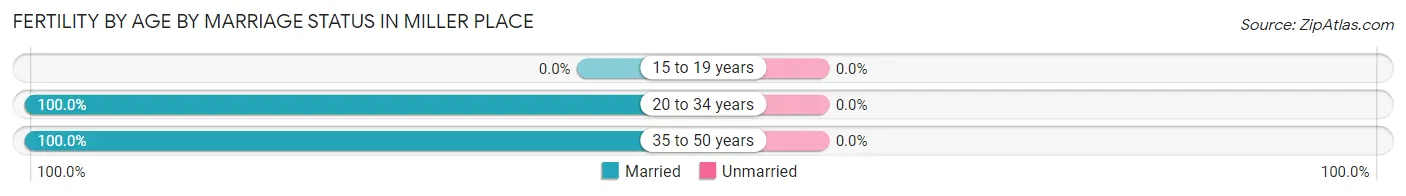
| Age Bracket | Married | Unmarried |
| 15 to 19 years | 0 (0.0%) | 0 (0.0%) |
| 20 to 34 years | 57 (100.0%) | 0 (0.0%) |
| 35 to 50 years | 60 (100.0%) | 0 (0.0%) |
| Total | 117 (100.0%) | 0 (0.0%) |
Fertility by Education in Miller Place
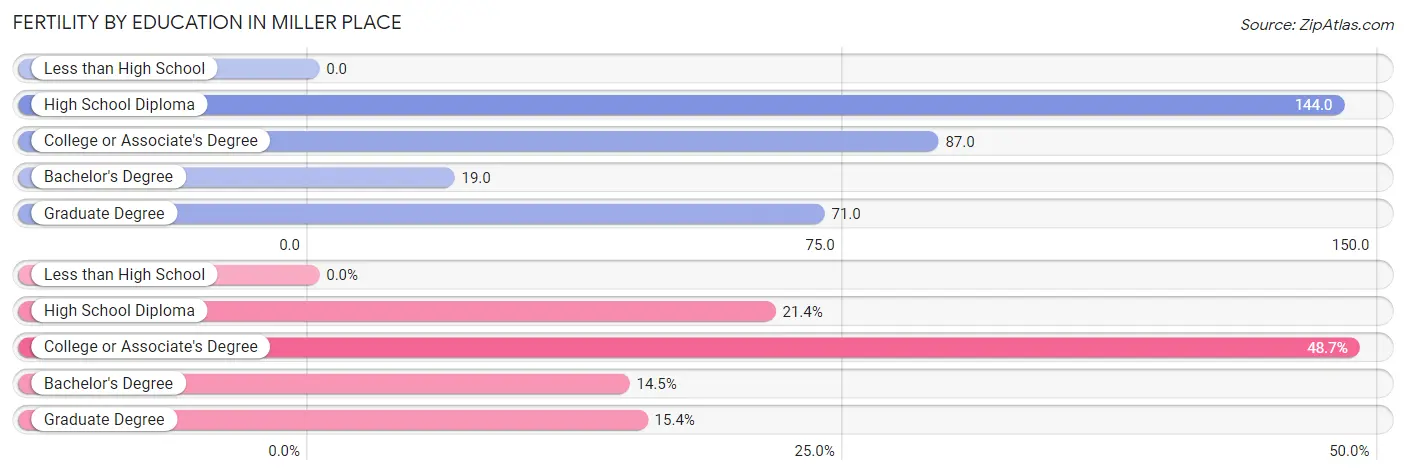
| Educational Attainment | Women with Births | Births / 1,000 Women |
| Less than High School | 0 (0.0%) | 0.0 |
| High School Diploma | 25 (21.4%) | 144.0 |
| College or Associate's Degree | 57 (48.7%) | 87.0 |
| Bachelor's Degree | 17 (14.5%) | 19.0 |
| Graduate Degree | 18 (15.4%) | 71.0 |
| Total | 117 (100.0%) | 47.0 |
Fertility by Education by Marriage Status in Miller Place
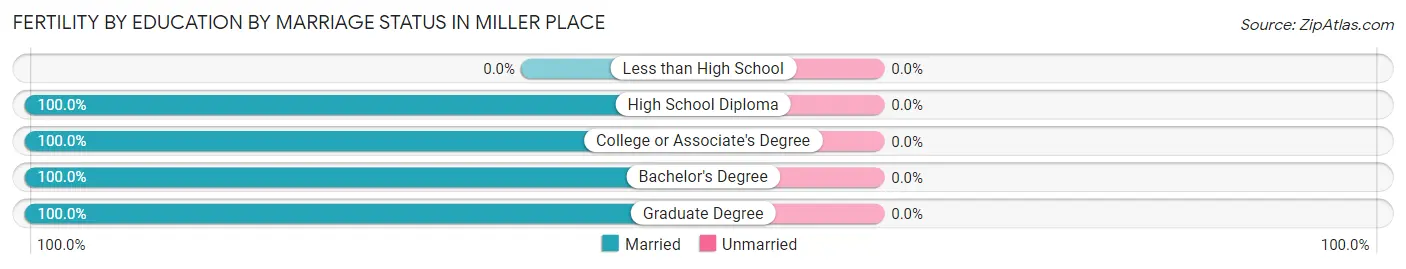
| Educational Attainment | Married | Unmarried |
| Less than High School | 0 (0.0%) | 0 (0.0%) |
| High School Diploma | 25 (100.0%) | 0 (0.0%) |
| College or Associate's Degree | 57 (100.0%) | 0 (0.0%) |
| Bachelor's Degree | 17 (100.0%) | 0 (0.0%) |
| Graduate Degree | 18 (100.0%) | 0 (0.0%) |
| Total | 117 (100.0%) | 0 (0.0%) |
Employment Characteristics in Miller Place
Employment by Class of Employer in Miller Place
Among the 4,781 employed individuals in Miller Place, private company employees (2,666 | 55.8%), local government employees (627 | 13.1%), and state government employees (499 | 10.4%) make up the most common classes of employment.
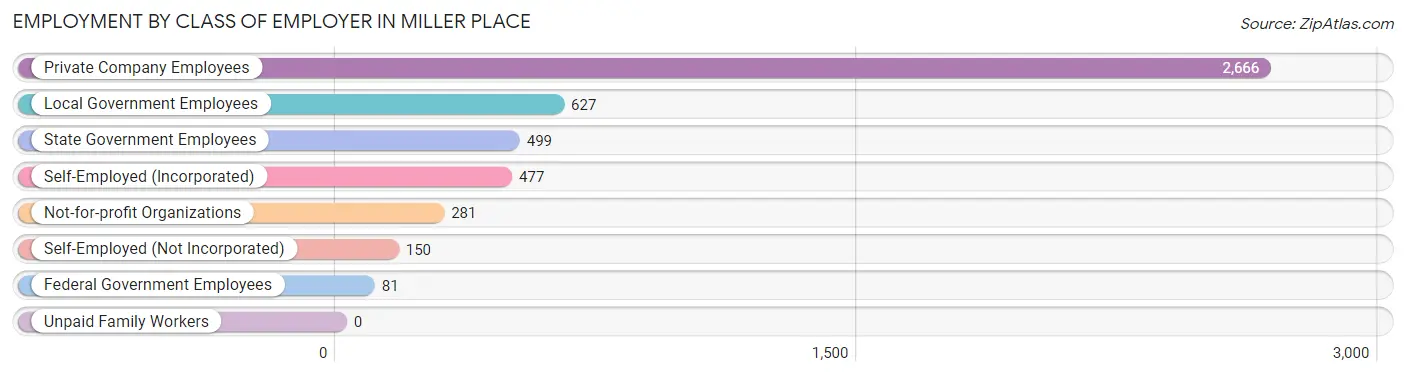
| Employer Class | # Employees | % Employees |
| Private Company Employees | 2,666 | 55.8% |
| Self-Employed (Incorporated) | 477 | 10.0% |
| Self-Employed (Not Incorporated) | 150 | 3.1% |
| Not-for-profit Organizations | 281 | 5.9% |
| Local Government Employees | 627 | 13.1% |
| State Government Employees | 499 | 10.4% |
| Federal Government Employees | 81 | 1.7% |
| Unpaid Family Workers | 0 | 0.0% |
| Total | 4,781 | 100.0% |
Employment Status by Age in Miller Place
According to the labor force statistics for Miller Place, out of the total population over 16 years of age (9,641), 54.5% or 5,254 individuals are in the labor force, with 7.6% or 399 of them unemployed. The age group with the highest labor force participation rate is 35 to 44 years, with 85.8% or 972 individuals in the labor force. Within the labor force, the 20 to 24 years age range has the highest percentage of unemployed individuals, with 17.9% or 81 of them being unemployed.
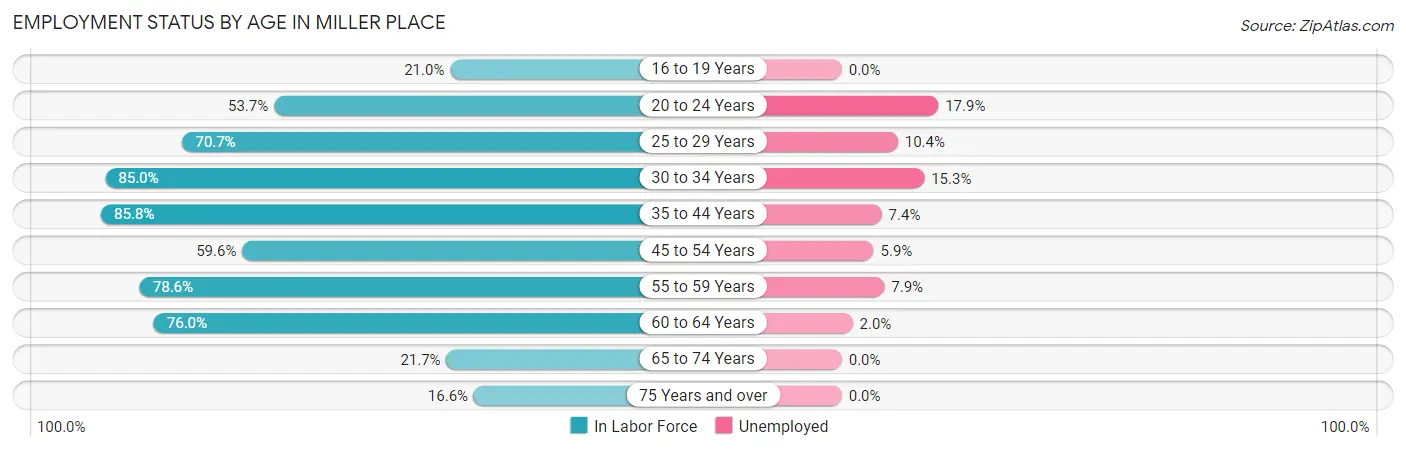
| Age Bracket | In Labor Force | Unemployed |
| 16 to 19 Years | 178 (21.0%) | 0 (0.0%) |
| 20 to 24 Years | 452 (53.7%) | 81 (17.9%) |
| 25 to 29 Years | 520 (70.7%) | 54 (10.4%) |
| 30 to 34 Years | 432 (85.0%) | 66 (15.3%) |
| 35 to 44 Years | 972 (85.8%) | 72 (7.4%) |
| 45 to 54 Years | 962 (59.6%) | 57 (5.9%) |
| 55 to 59 Years | 775 (78.6%) | 61 (7.9%) |
| 60 to 64 Years | 493 (76.0%) | 10 (2.0%) |
| 65 to 74 Years | 341 (21.7%) | 0 (0.0%) |
| 75 Years and over | 125 (16.6%) | 0 (0.0%) |
| Total | 5,254 (54.5%) | 399 (7.6%) |
Employment Status by Educational Attainment in Miller Place
According to labor force statistics for Miller Place, 73.8% of individuals (4,152) out of the total population between 25 and 64 years of age (5,626) are in the labor force, with 7.7% or 320 of them being unemployed. The group with the highest labor force participation rate are those with the educational attainment of bachelor's degree or higher, with 88.4% or 2,404 individuals in the labor force. Within the labor force, individuals with high school diploma education have the highest percentage of unemployment, with 17.2% or 153 of them being unemployed.
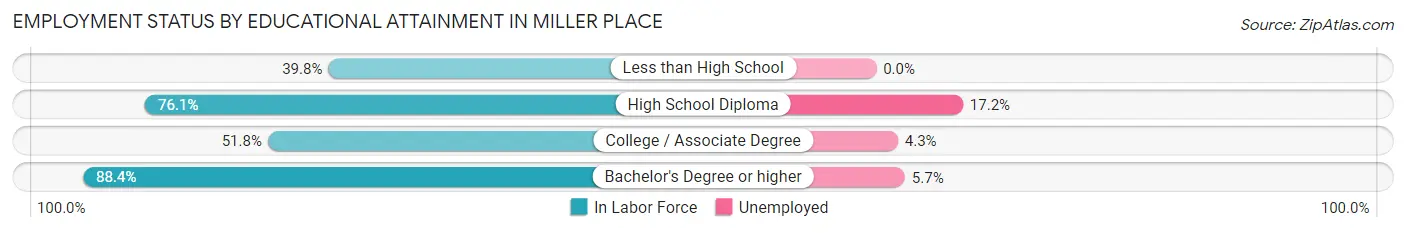
| Educational Attainment | In Labor Force | Unemployed |
| Less than High School | 133 (39.8%) | 0 (0.0%) |
| High School Diploma | 891 (76.1%) | 201 (17.2%) |
| College / Associate Degree | 726 (51.8%) | 60 (4.3%) |
| Bachelor's Degree or higher | 2,404 (88.4%) | 155 (5.7%) |
| Total | 4,152 (73.8%) | 433 (7.7%) |
Employment Occupations by Sex in Miller Place
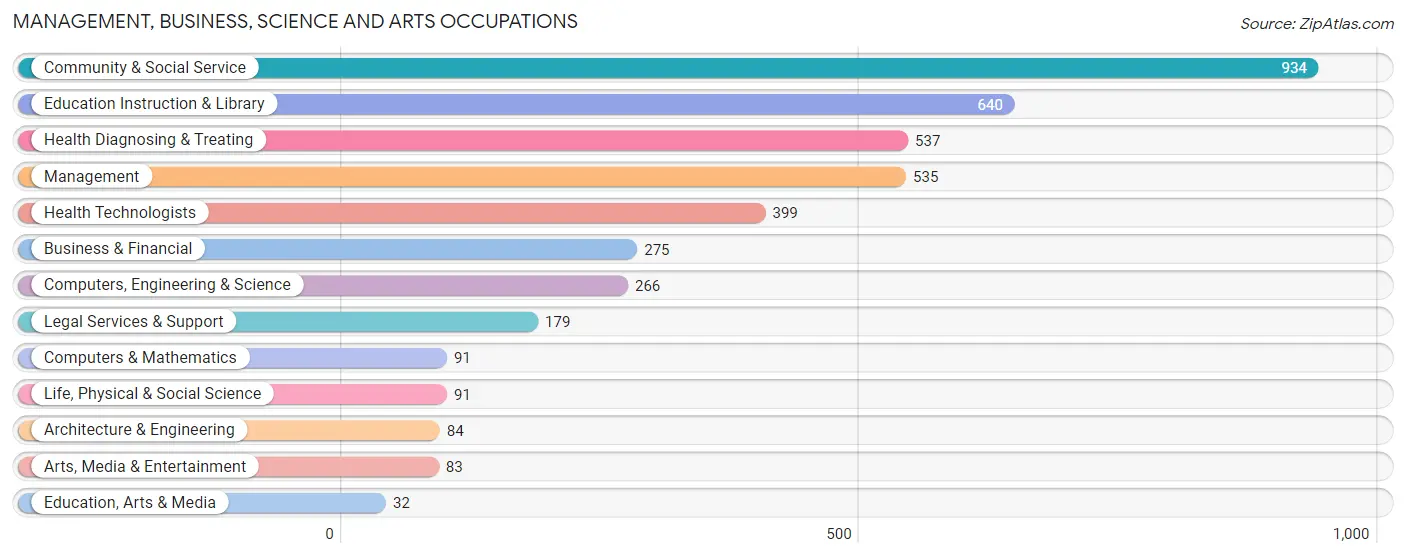
Management, Business, Science and Arts Occupations
The most common Management, Business, Science and Arts occupations in Miller Place are Community & Social Service (934 | 19.3%), Education Instruction & Library (640 | 13.2%), Health Diagnosing & Treating (537 | 11.1%), Management (535 | 11.0%), and Health Technologists (399 | 8.2%).
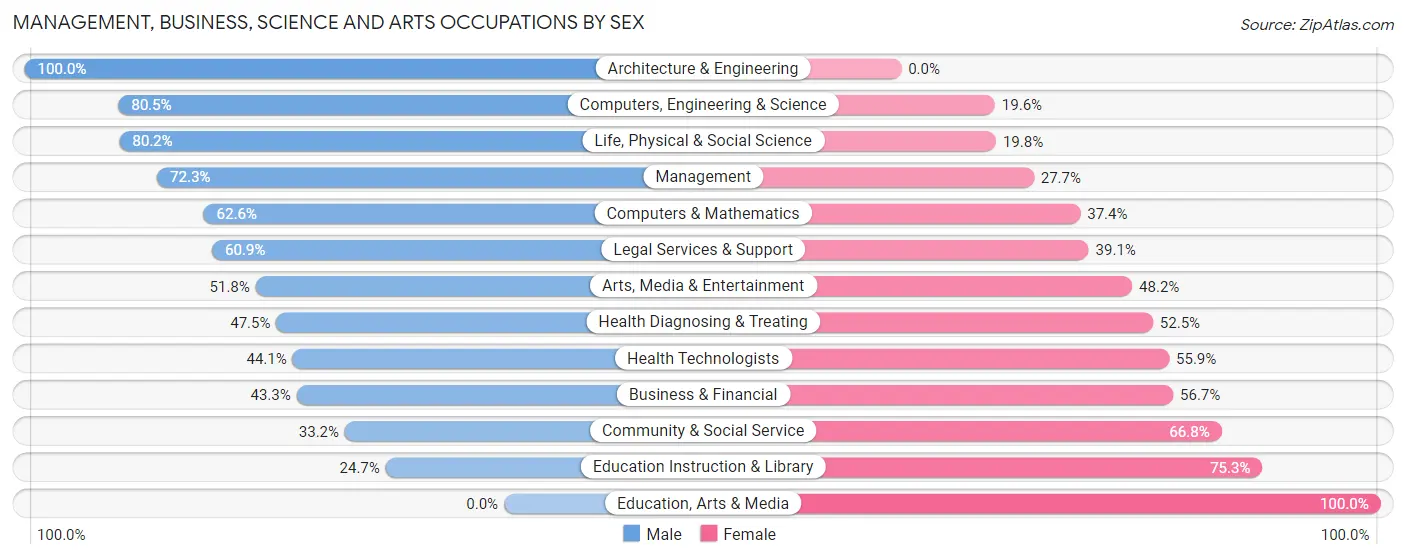
Management, Business, Science and Arts Occupations by Sex
Within the Management, Business, Science and Arts occupations in Miller Place, the most male-oriented occupations are Architecture & Engineering (100.0%), Computers, Engineering & Science (80.4%), and Life, Physical & Social Science (80.2%), while the most female-oriented occupations are Education, Arts & Media (100.0%), Education Instruction & Library (75.3%), and Community & Social Service (66.8%).
| Occupation | Male | Female |
| Management | 387 (72.3%) | 148 (27.7%) |
| Business & Financial | 119 (43.3%) | 156 (56.7%) |
| Computers, Engineering & Science | 214 (80.4%) | 52 (19.6%) |
| Computers & Mathematics | 57 (62.6%) | 34 (37.4%) |
| Architecture & Engineering | 84 (100.0%) | 0 (0.0%) |
| Life, Physical & Social Science | 73 (80.2%) | 18 (19.8%) |
| Community & Social Service | 310 (33.2%) | 624 (66.8%) |
| Education, Arts & Media | 0 (0.0%) | 32 (100.0%) |
| Legal Services & Support | 109 (60.9%) | 70 (39.1%) |
| Education Instruction & Library | 158 (24.7%) | 482 (75.3%) |
| Arts, Media & Entertainment | 43 (51.8%) | 40 (48.2%) |
| Health Diagnosing & Treating | 255 (47.5%) | 282 (52.5%) |
| Health Technologists | 176 (44.1%) | 223 (55.9%) |
| Total (Category) | 1,285 (50.4%) | 1,262 (49.5%) |
| Total (Overall) | 2,741 (56.5%) | 2,108 (43.5%) |
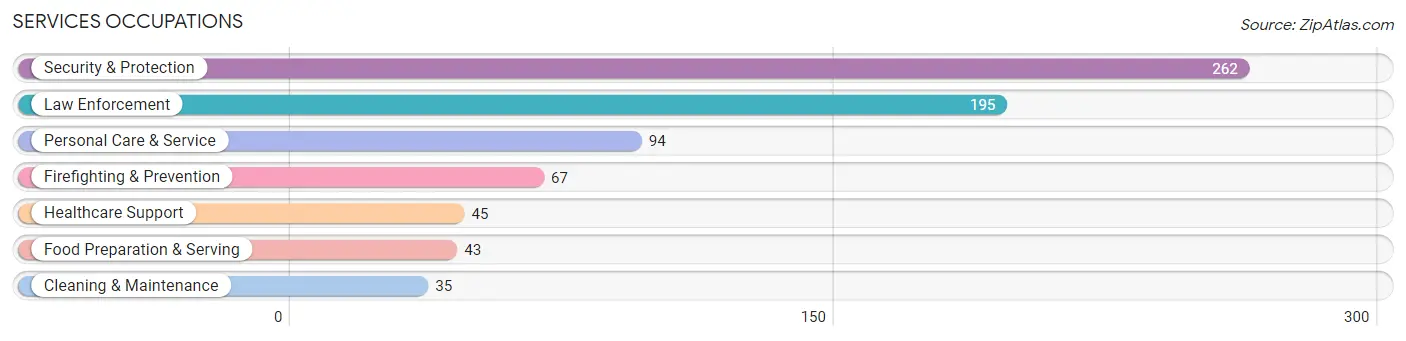
Services Occupations
The most common Services occupations in Miller Place are Security & Protection (262 | 5.4%), Law Enforcement (195 | 4.0%), Personal Care & Service (94 | 1.9%), Firefighting & Prevention (67 | 1.4%), and Healthcare Support (45 | 0.9%).
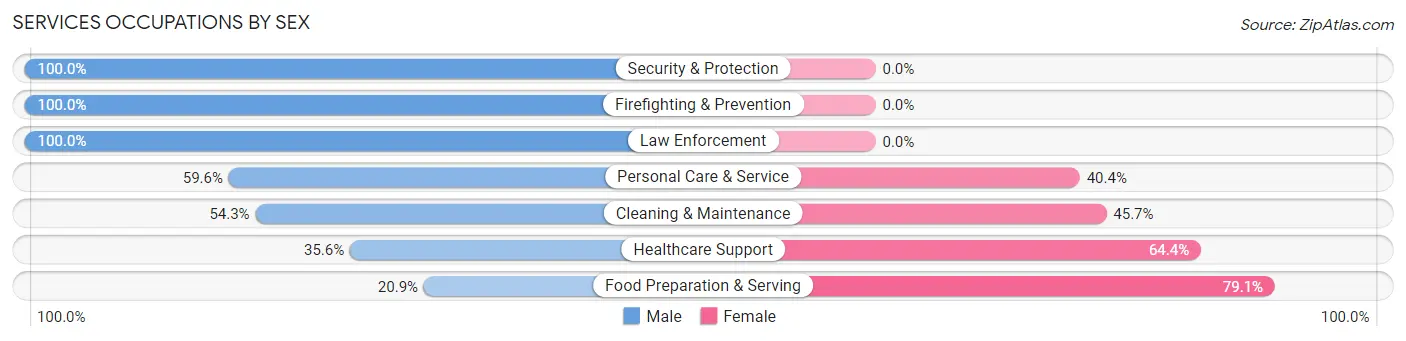
Services Occupations by Sex
Within the Services occupations in Miller Place, the most male-oriented occupations are Security & Protection (100.0%), Firefighting & Prevention (100.0%), and Law Enforcement (100.0%), while the most female-oriented occupations are Food Preparation & Serving (79.1%), Healthcare Support (64.4%), and Cleaning & Maintenance (45.7%).
| Occupation | Male | Female |
| Healthcare Support | 16 (35.6%) | 29 (64.4%) |
| Security & Protection | 262 (100.0%) | 0 (0.0%) |
| Firefighting & Prevention | 67 (100.0%) | 0 (0.0%) |
| Law Enforcement | 195 (100.0%) | 0 (0.0%) |
| Food Preparation & Serving | 9 (20.9%) | 34 (79.1%) |
| Cleaning & Maintenance | 19 (54.3%) | 16 (45.7%) |
| Personal Care & Service | 56 (59.6%) | 38 (40.4%) |
| Total (Category) | 362 (75.6%) | 117 (24.4%) |
| Total (Overall) | 2,741 (56.5%) | 2,108 (43.5%) |
Sales and Office Occupations
The most common Sales and Office occupations in Miller Place are Sales & Related (682 | 14.1%), and Office & Administration (552 | 11.4%).
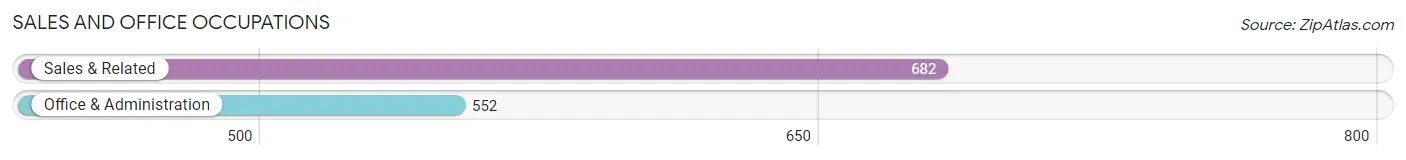
Sales and Office Occupations by Sex
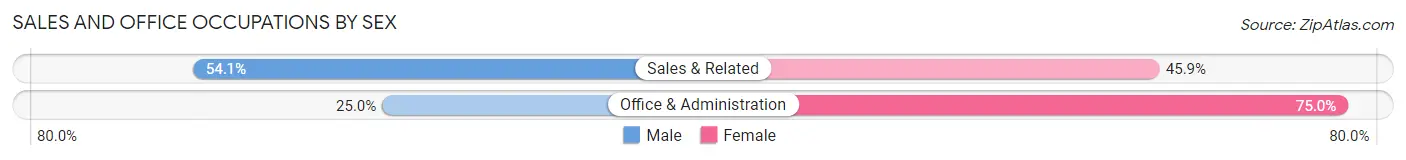
| Occupation | Male | Female |
| Sales & Related | 369 (54.1%) | 313 (45.9%) |
| Office & Administration | 138 (25.0%) | 414 (75.0%) |
| Total (Category) | 507 (41.1%) | 727 (58.9%) |
| Total (Overall) | 2,741 (56.5%) | 2,108 (43.5%) |
Natural Resources, Construction and Maintenance Occupations
The most common Natural Resources, Construction and Maintenance occupations in Miller Place are Construction & Extraction (230 | 4.7%), and Installation, Maintenance & Repair (98 | 2.0%).
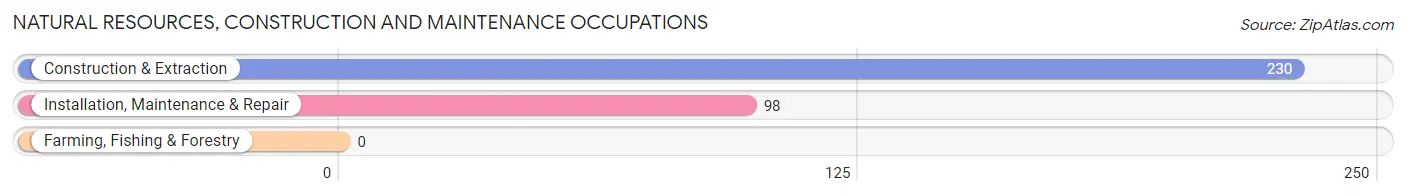
Natural Resources, Construction and Maintenance Occupations by Sex

| Occupation | Male | Female |
| Farming, Fishing & Forestry | 0 (0.0%) | 0 (0.0%) |
| Construction & Extraction | 230 (100.0%) | 0 (0.0%) |
| Installation, Maintenance & Repair | 98 (100.0%) | 0 (0.0%) |
| Total (Category) | 328 (100.0%) | 0 (0.0%) |
| Total (Overall) | 2,741 (56.5%) | 2,108 (43.5%) |
Production, Transportation and Moving Occupations
The most common Production, Transportation and Moving occupations in Miller Place are Production (161 | 3.3%), Material Moving (52 | 1.1%), and Transportation (48 | 1.0%).
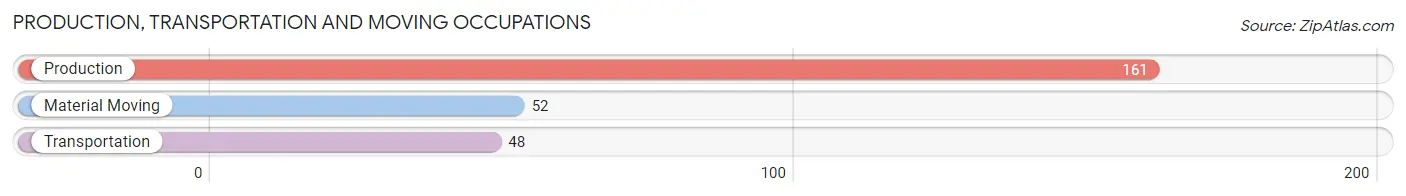
Production, Transportation and Moving Occupations by Sex

| Occupation | Male | Female |
| Production | 159 (98.8%) | 2 (1.2%) |
| Transportation | 48 (100.0%) | 0 (0.0%) |
| Material Moving | 52 (100.0%) | 0 (0.0%) |
| Total (Category) | 259 (99.2%) | 2 (0.8%) |
| Total (Overall) | 2,741 (56.5%) | 2,108 (43.5%) |
Employment Industries by Sex in Miller Place
Employment Industries in Miller Place
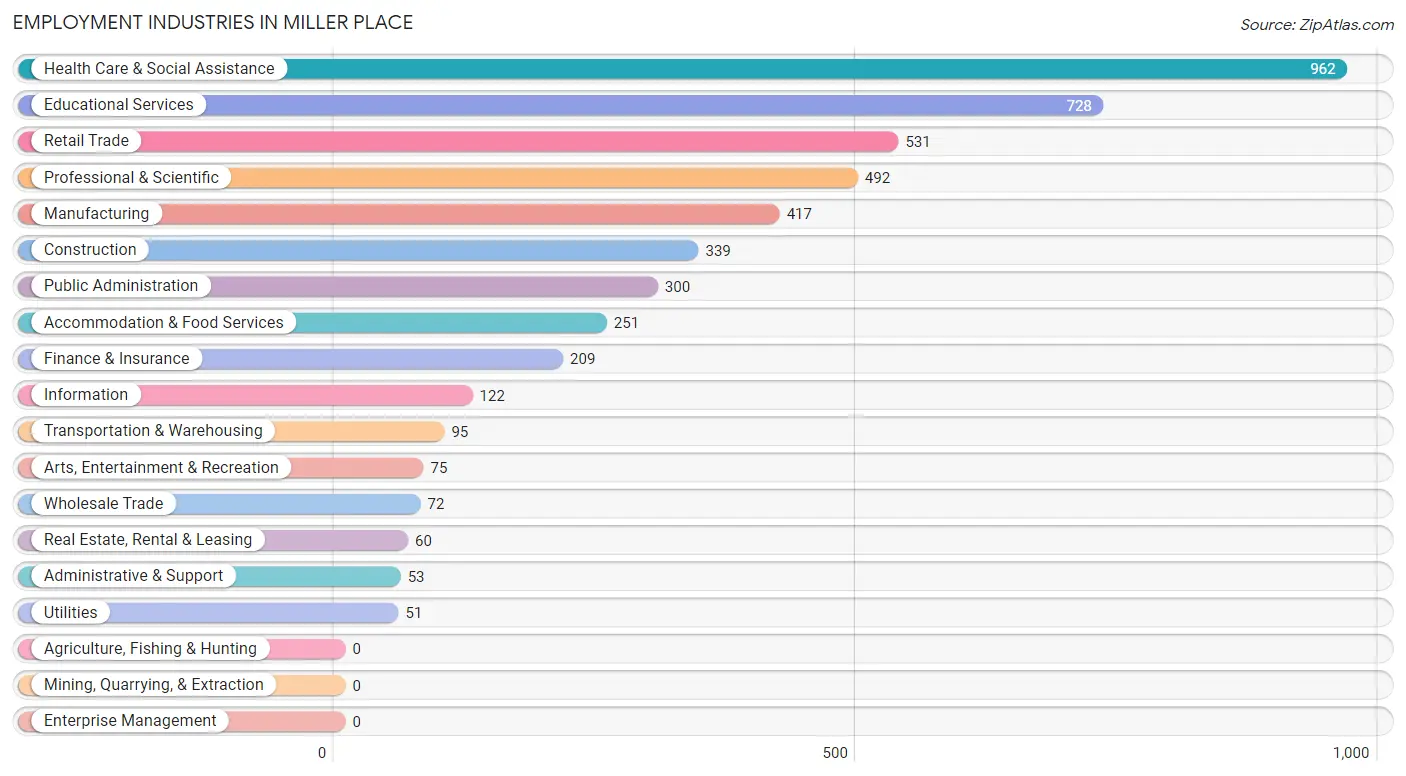
The major employment industries in Miller Place include Health Care & Social Assistance (962 | 19.8%), Educational Services (728 | 15.0%), Retail Trade (531 | 11.0%), Professional & Scientific (492 | 10.2%), and Manufacturing (417 | 8.6%).
Employment Industries by Sex in Miller Place
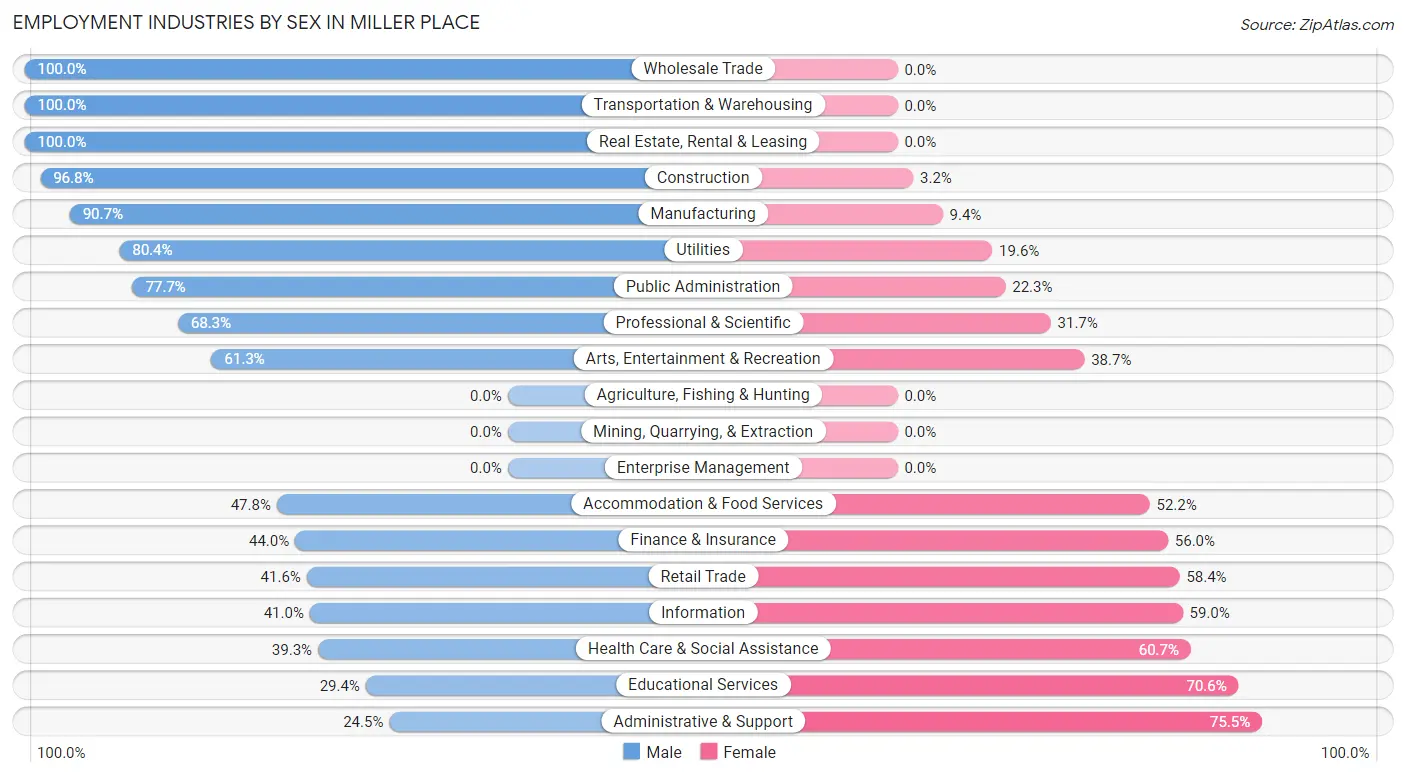
The Miller Place industries that see more men than women are Wholesale Trade (100.0%), Transportation & Warehousing (100.0%), and Real Estate, Rental & Leasing (100.0%), whereas the industries that tend to have a higher number of women are Administrative & Support (75.5%), Educational Services (70.6%), and Health Care & Social Assistance (60.7%).
| Industry | Male | Female |
| Agriculture, Fishing & Hunting | 0 (0.0%) | 0 (0.0%) |
| Mining, Quarrying, & Extraction | 0 (0.0%) | 0 (0.0%) |
| Construction | 328 (96.8%) | 11 (3.2%) |
| Manufacturing | 378 (90.6%) | 39 (9.3%) |
| Wholesale Trade | 72 (100.0%) | 0 (0.0%) |
| Retail Trade | 221 (41.6%) | 310 (58.4%) |
| Transportation & Warehousing | 95 (100.0%) | 0 (0.0%) |
| Utilities | 41 (80.4%) | 10 (19.6%) |
| Information | 50 (41.0%) | 72 (59.0%) |
| Finance & Insurance | 92 (44.0%) | 117 (56.0%) |
| Real Estate, Rental & Leasing | 60 (100.0%) | 0 (0.0%) |
| Professional & Scientific | 336 (68.3%) | 156 (31.7%) |
| Enterprise Management | 0 (0.0%) | 0 (0.0%) |
| Administrative & Support | 13 (24.5%) | 40 (75.5%) |
| Educational Services | 214 (29.4%) | 514 (70.6%) |
| Health Care & Social Assistance | 378 (39.3%) | 584 (60.7%) |
| Arts, Entertainment & Recreation | 46 (61.3%) | 29 (38.7%) |
| Accommodation & Food Services | 120 (47.8%) | 131 (52.2%) |
| Public Administration | 233 (77.7%) | 67 (22.3%) |
| Total | 2,741 (56.5%) | 2,108 (43.5%) |
Education in Miller Place
School Enrollment in Miller Place
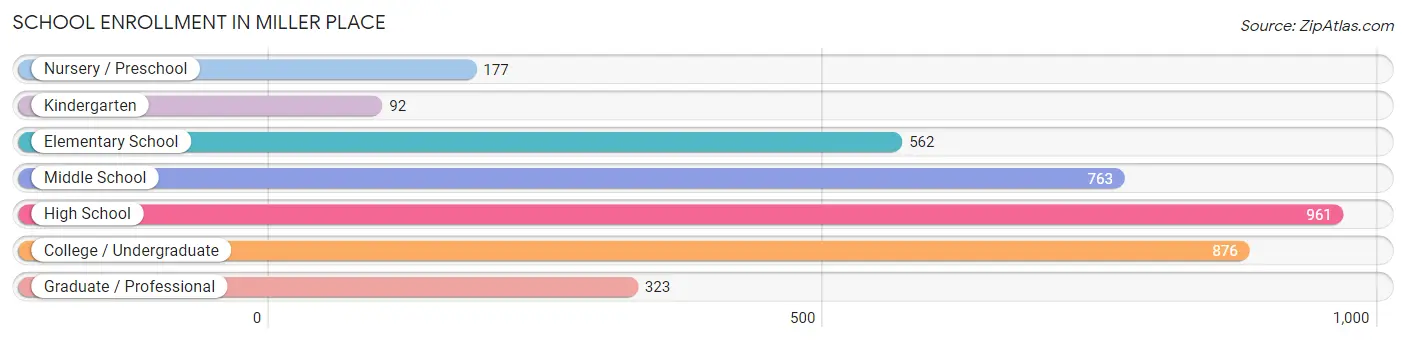
The most common levels of schooling among the 3,754 students in Miller Place are high school (961 | 25.6%), college / undergraduate (876 | 23.3%), and middle school (763 | 20.3%).
| School Level | # Students | % Students |
| Nursery / Preschool | 177 | 4.7% |
| Kindergarten | 92 | 2.5% |
| Elementary School | 562 | 15.0% |
| Middle School | 763 | 20.3% |
| High School | 961 | 25.6% |
| College / Undergraduate | 876 | 23.3% |
| Graduate / Professional | 323 | 8.6% |
| Total | 3,754 | 100.0% |
School Enrollment by Age by Funding Source in Miller Place
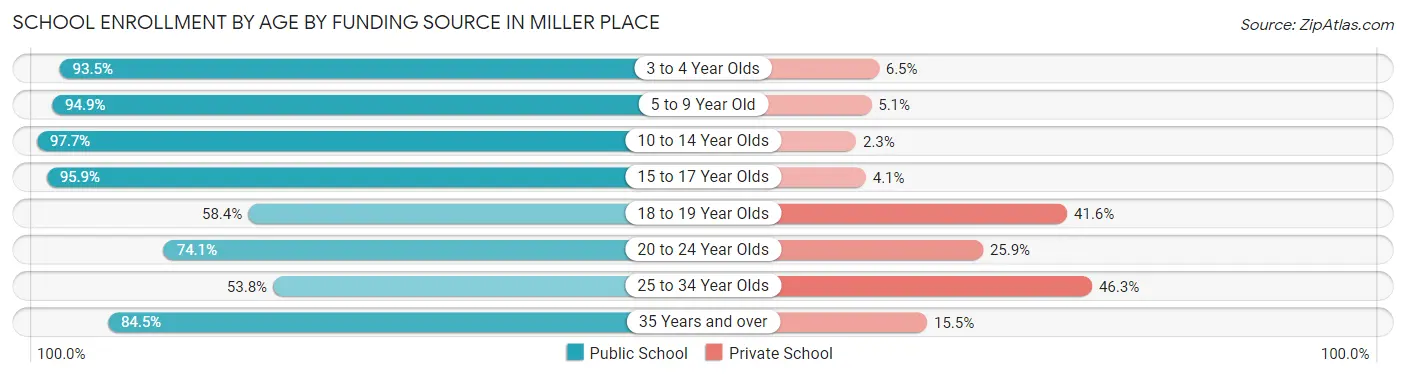
Out of a total of 3,754 students who are enrolled in schools in Miller Place, 526 (14.0%) attend a private institution, while the remaining 3,228 (86.0%) are enrolled in public schools. The age group of 25 to 34 year olds has the highest likelihood of being enrolled in private schools, with 117 (46.3% in the age bracket) enrolled. Conversely, the age group of 10 to 14 year olds has the lowest likelihood of being enrolled in a private school, with 891 (97.7% in the age bracket) attending a public institution.
| Age Bracket | Public School | Private School |
| 3 to 4 Year Olds | 143 (93.5%) | 10 (6.5%) |
| 5 to 9 Year Old | 572 (94.9%) | 31 (5.1%) |
| 10 to 14 Year Olds | 891 (97.7%) | 21 (2.3%) |
| 15 to 17 Year Olds | 768 (95.9%) | 33 (4.1%) |
| 18 to 19 Year Olds | 216 (58.4%) | 154 (41.6%) |
| 20 to 24 Year Olds | 414 (74.1%) | 145 (25.9%) |
| 25 to 34 Year Olds | 136 (53.7%) | 117 (46.3%) |
| 35 Years and over | 87 (84.5%) | 16 (15.5%) |
| Total | 3,228 (86.0%) | 526 (14.0%) |
Educational Attainment by Field of Study in Miller Place
Business (621 | 15.3%), education (575 | 14.1%), science & technology (538 | 13.2%), psychology (315 | 7.7%), and arts & humanities (282 | 6.9%) are the most common fields of study among 4,068 individuals in Miller Place who have obtained a bachelor's degree or higher.
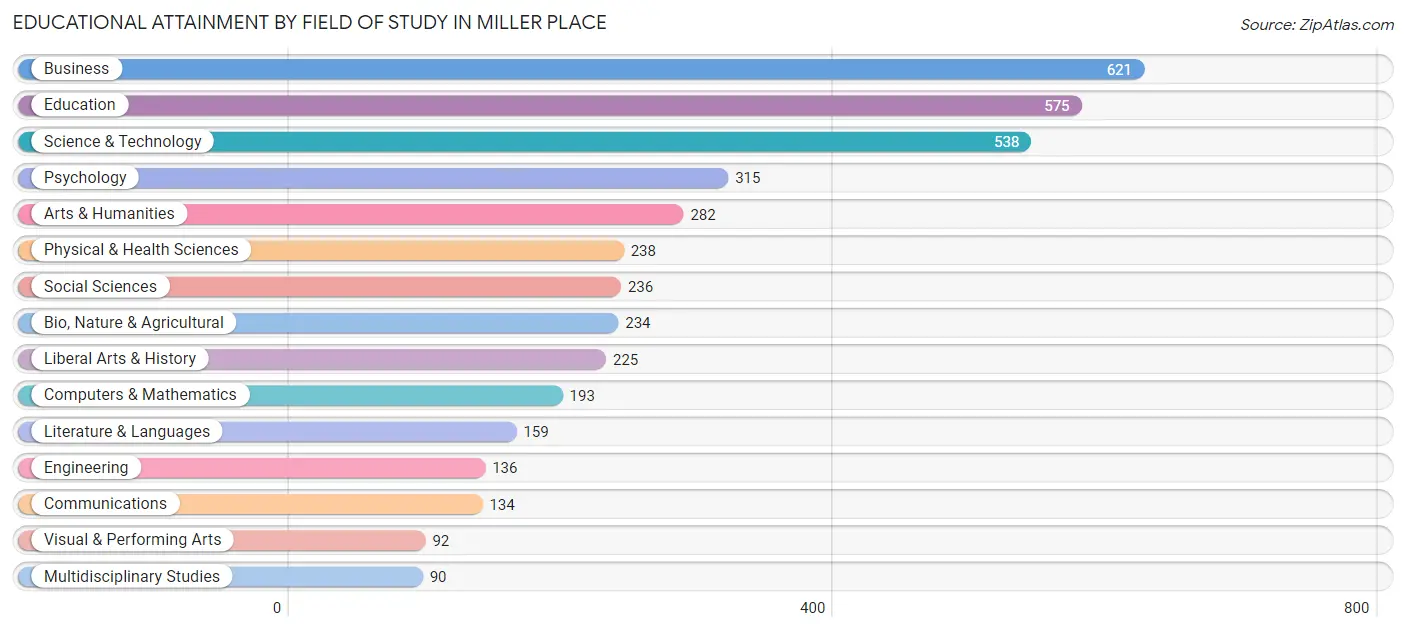
| Field of Study | # Graduates | % Graduates |
| Computers & Mathematics | 193 | 4.7% |
| Bio, Nature & Agricultural | 234 | 5.8% |
| Physical & Health Sciences | 238 | 5.9% |
| Psychology | 315 | 7.7% |
| Social Sciences | 236 | 5.8% |
| Engineering | 136 | 3.3% |
| Multidisciplinary Studies | 90 | 2.2% |
| Science & Technology | 538 | 13.2% |
| Business | 621 | 15.3% |
| Education | 575 | 14.1% |
| Literature & Languages | 159 | 3.9% |
| Liberal Arts & History | 225 | 5.5% |
| Visual & Performing Arts | 92 | 2.3% |
| Communications | 134 | 3.3% |
| Arts & Humanities | 282 | 6.9% |
| Total | 4,068 | 100.0% |
Transportation & Commute in Miller Place
Vehicle Availability by Sex in Miller Place
The most prevalent vehicle ownership categories in Miller Place are males with 2 vehicles (1,014, accounting for 37.5%) and females with 2 vehicles (854, making up 48.8%).
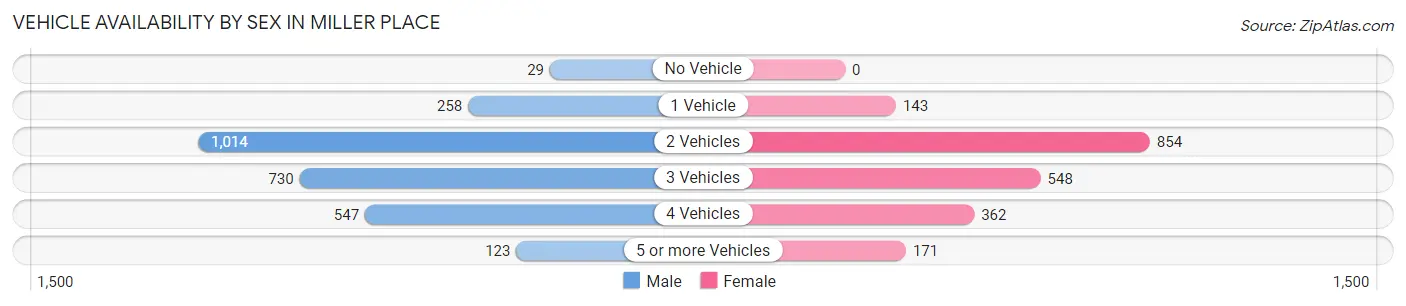
| Vehicles Available | Male | Female |
| No Vehicle | 29 (1.1%) | 0 (0.0%) |
| 1 Vehicle | 258 (9.6%) | 143 (6.9%) |
| 2 Vehicles | 1,014 (37.5%) | 854 (41.1%) |
| 3 Vehicles | 730 (27.0%) | 548 (26.4%) |
| 4 Vehicles | 547 (20.3%) | 362 (17.4%) |
| 5 or more Vehicles | 123 (4.5%) | 171 (8.2%) |
| Total | 2,701 (100.0%) | 2,078 (100.0%) |
Commute Time in Miller Place
The most frequently occuring commute durations in Miller Place are 45 to 59 minutes (772 commuters, 18.2%), 20 to 24 minutes (679 commuters, 16.0%), and 30 to 34 minutes (570 commuters, 13.4%).
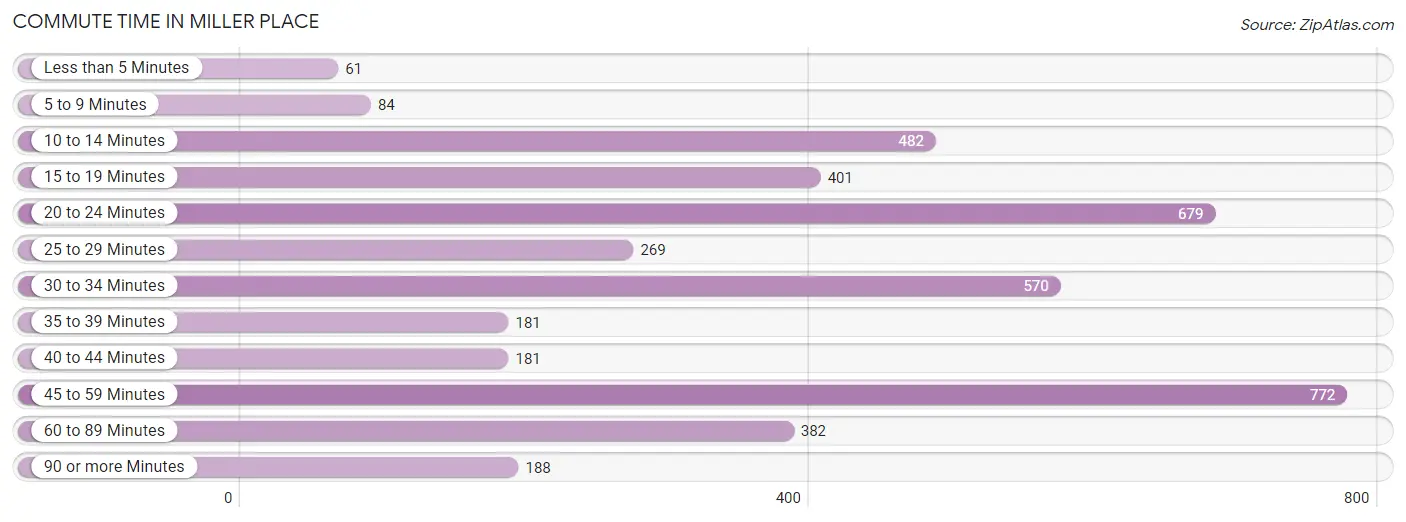
| Commute Time | # Commuters | % Commuters |
| Less than 5 Minutes | 61 | 1.4% |
| 5 to 9 Minutes | 84 | 2.0% |
| 10 to 14 Minutes | 482 | 11.3% |
| 15 to 19 Minutes | 401 | 9.4% |
| 20 to 24 Minutes | 679 | 16.0% |
| 25 to 29 Minutes | 269 | 6.3% |
| 30 to 34 Minutes | 570 | 13.4% |
| 35 to 39 Minutes | 181 | 4.3% |
| 40 to 44 Minutes | 181 | 4.3% |
| 45 to 59 Minutes | 772 | 18.2% |
| 60 to 89 Minutes | 382 | 9.0% |
| 90 or more Minutes | 188 | 4.4% |
Commute Time by Sex in Miller Place
The most common commute times in Miller Place are 45 to 59 minutes (534 commuters, 22.7%) for males and 10 to 14 minutes (301 commuters, 15.9%) for females.

| Commute Time | Male | Female |
| Less than 5 Minutes | 24 (1.0%) | 37 (1.9%) |
| 5 to 9 Minutes | 24 (1.0%) | 60 (3.2%) |
| 10 to 14 Minutes | 181 (7.7%) | 301 (15.9%) |
| 15 to 19 Minutes | 178 (7.5%) | 223 (11.8%) |
| 20 to 24 Minutes | 378 (16.0%) | 301 (15.9%) |
| 25 to 29 Minutes | 250 (10.6%) | 19 (1.0%) |
| 30 to 34 Minutes | 301 (12.8%) | 269 (14.2%) |
| 35 to 39 Minutes | 102 (4.3%) | 79 (4.2%) |
| 40 to 44 Minutes | 60 (2.5%) | 121 (6.4%) |
| 45 to 59 Minutes | 534 (22.7%) | 238 (12.6%) |
| 60 to 89 Minutes | 218 (9.2%) | 164 (8.7%) |
| 90 or more Minutes | 107 (4.5%) | 81 (4.3%) |
Time of Departure to Work by Sex in Miller Place
The most frequent times of departure to work in Miller Place are 7:00 AM to 7:29 AM (371, 15.7%) for males and 8:00 AM to 8:29 AM (455, 24.0%) for females.
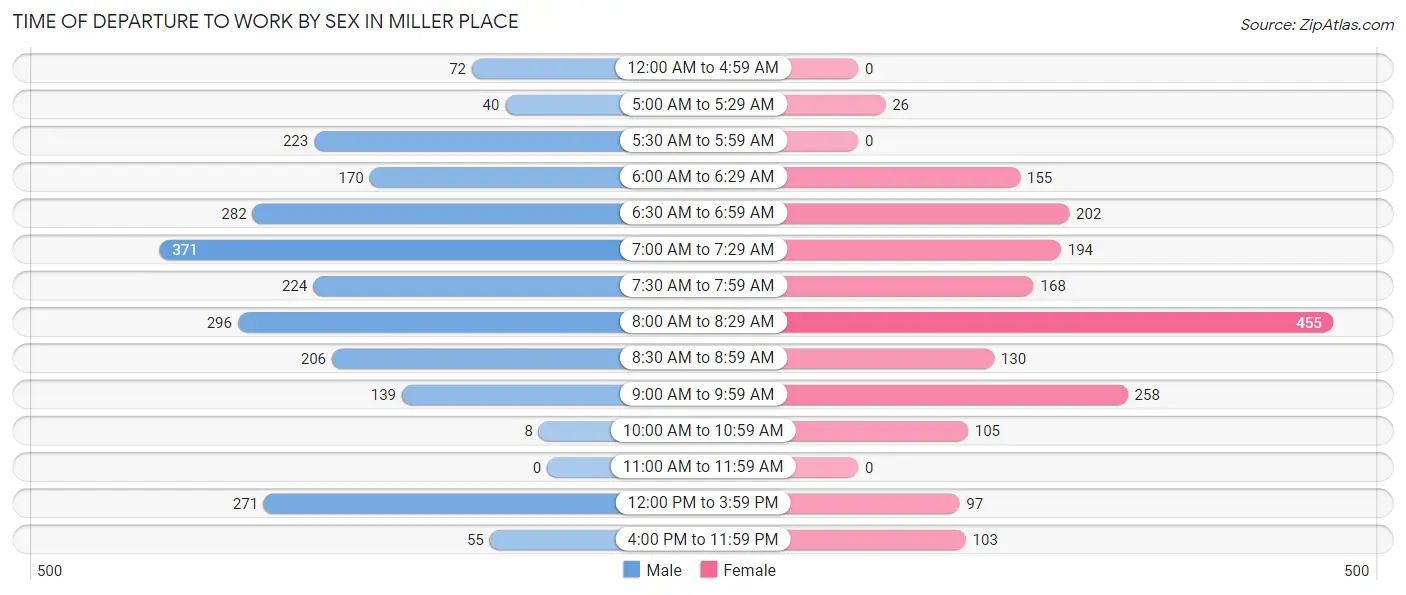
| Time of Departure | Male | Female |
| 12:00 AM to 4:59 AM | 72 (3.0%) | 0 (0.0%) |
| 5:00 AM to 5:29 AM | 40 (1.7%) | 26 (1.4%) |
| 5:30 AM to 5:59 AM | 223 (9.5%) | 0 (0.0%) |
| 6:00 AM to 6:29 AM | 170 (7.2%) | 155 (8.2%) |
| 6:30 AM to 6:59 AM | 282 (12.0%) | 202 (10.7%) |
| 7:00 AM to 7:29 AM | 371 (15.7%) | 194 (10.2%) |
| 7:30 AM to 7:59 AM | 224 (9.5%) | 168 (8.9%) |
| 8:00 AM to 8:29 AM | 296 (12.6%) | 455 (24.0%) |
| 8:30 AM to 8:59 AM | 206 (8.7%) | 130 (6.9%) |
| 9:00 AM to 9:59 AM | 139 (5.9%) | 258 (13.6%) |
| 10:00 AM to 10:59 AM | 8 (0.3%) | 105 (5.6%) |
| 11:00 AM to 11:59 AM | 0 (0.0%) | 0 (0.0%) |
| 12:00 PM to 3:59 PM | 271 (11.5%) | 97 (5.1%) |
| 4:00 PM to 11:59 PM | 55 (2.3%) | 103 (5.4%) |
| Total | 2,357 (100.0%) | 1,893 (100.0%) |
Housing Occupancy in Miller Place
Occupancy by Ownership in Miller Place
Of the total 3,937 dwellings in Miller Place, owner-occupied units account for 3,181 (80.8%), while renter-occupied units make up 756 (19.2%).
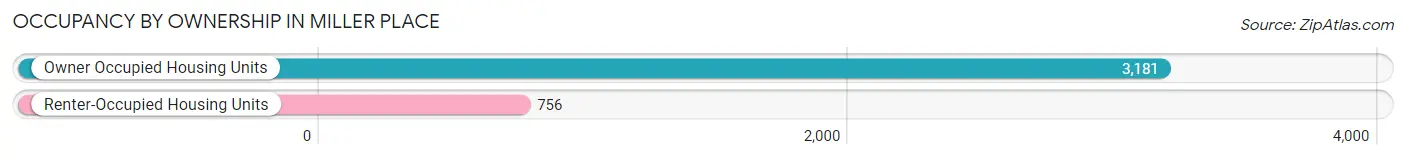
| Occupancy | # Housing Units | % Housing Units |
| Owner Occupied Housing Units | 3,181 | 80.8% |
| Renter-Occupied Housing Units | 756 | 19.2% |
| Total Occupied Housing Units | 3,937 | 100.0% |
Occupancy by Household Size in Miller Place
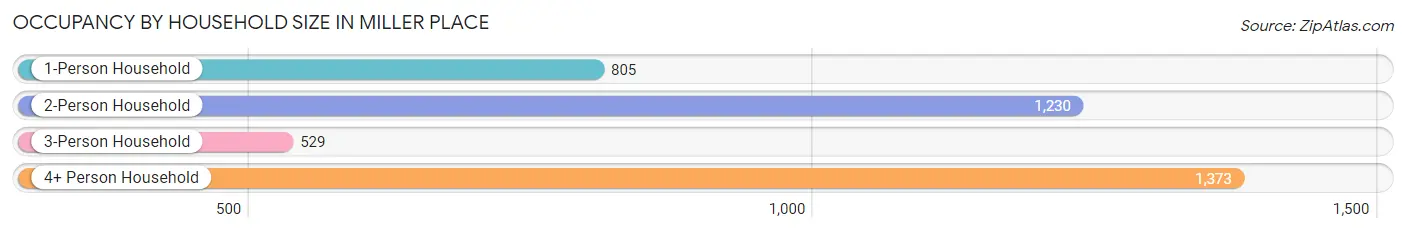
| Household Size | # Housing Units | % Housing Units |
| 1-Person Household | 805 | 20.4% |
| 2-Person Household | 1,230 | 31.2% |
| 3-Person Household | 529 | 13.4% |
| 4+ Person Household | 1,373 | 34.9% |
| Total Housing Units | 3,937 | 100.0% |
Occupancy by Ownership by Household Size in Miller Place
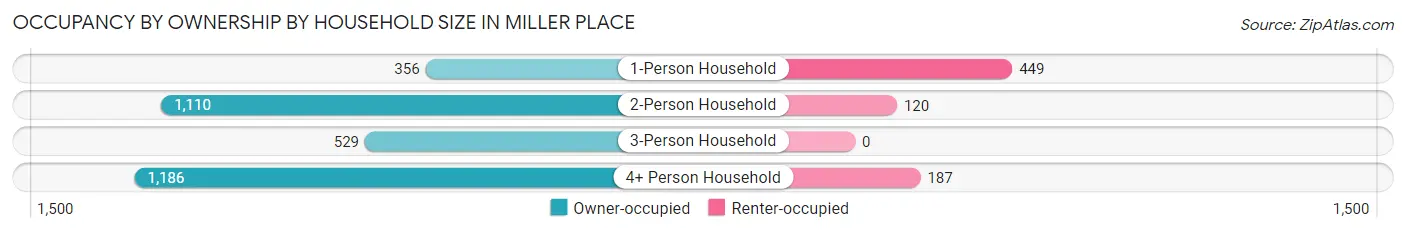
| Household Size | Owner-occupied | Renter-occupied |
| 1-Person Household | 356 (44.2%) | 449 (55.8%) |
| 2-Person Household | 1,110 (90.2%) | 120 (9.8%) |
| 3-Person Household | 529 (100.0%) | 0 (0.0%) |
| 4+ Person Household | 1,186 (86.4%) | 187 (13.6%) |
| Total Housing Units | 3,181 (80.8%) | 756 (19.2%) |
Occupancy by Educational Attainment in Miller Place
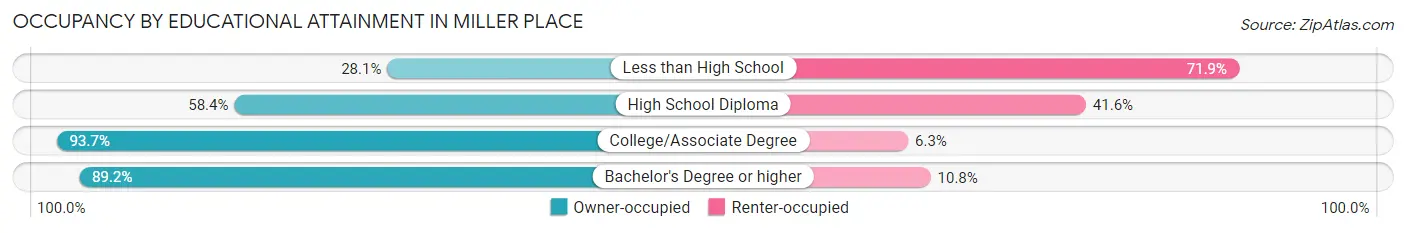
| Household Size | Owner-occupied | Renter-occupied |
| Less than High School | 43 (28.1%) | 110 (71.9%) |
| High School Diploma | 534 (58.4%) | 380 (41.6%) |
| College/Associate Degree | 918 (93.7%) | 62 (6.3%) |
| Bachelor's Degree or higher | 1,686 (89.2%) | 204 (10.8%) |
Occupancy by Age of Householder in Miller Place
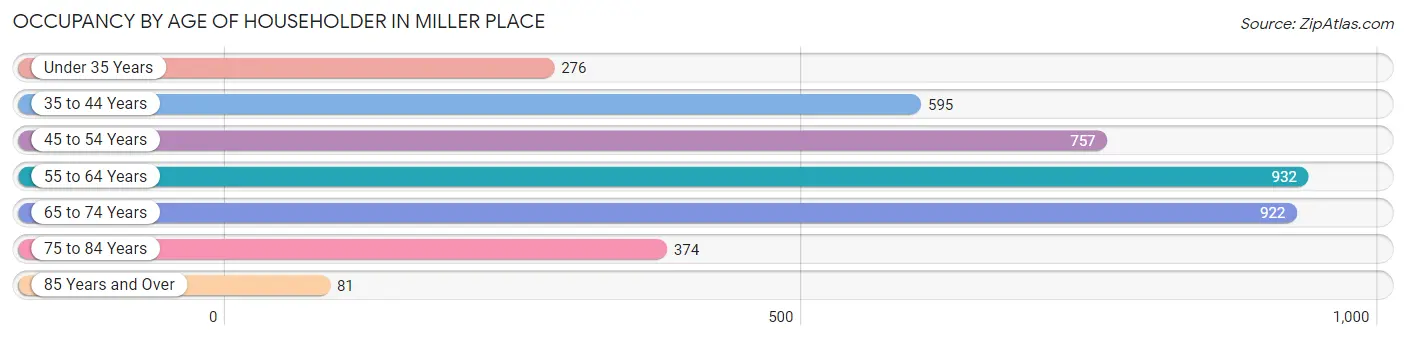
| Age Bracket | # Households | % Households |
| Under 35 Years | 276 | 7.0% |
| 35 to 44 Years | 595 | 15.1% |
| 45 to 54 Years | 757 | 19.2% |
| 55 to 64 Years | 932 | 23.7% |
| 65 to 74 Years | 922 | 23.4% |
| 75 to 84 Years | 374 | 9.5% |
| 85 Years and Over | 81 | 2.1% |
| Total | 3,937 | 100.0% |
Housing Finances in Miller Place
Median Income by Occupancy in Miller Place
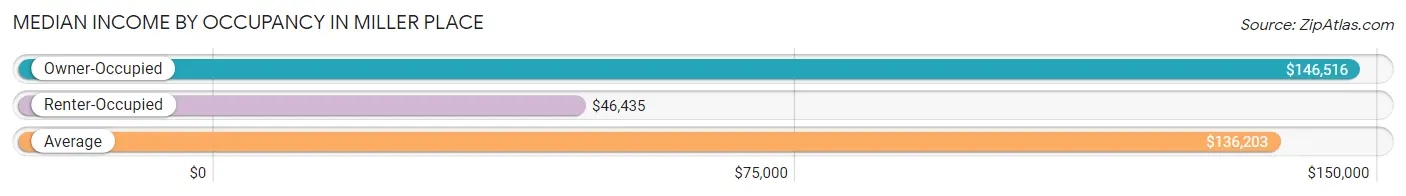
| Occupancy Type | # Households | Median Income |
| Owner-Occupied | 3,181 (80.8%) | $146,516 |
| Renter-Occupied | 756 (19.2%) | $46,435 |
| Average | 3,937 (100.0%) | $136,203 |
Occupancy by Householder Income Bracket in Miller Place
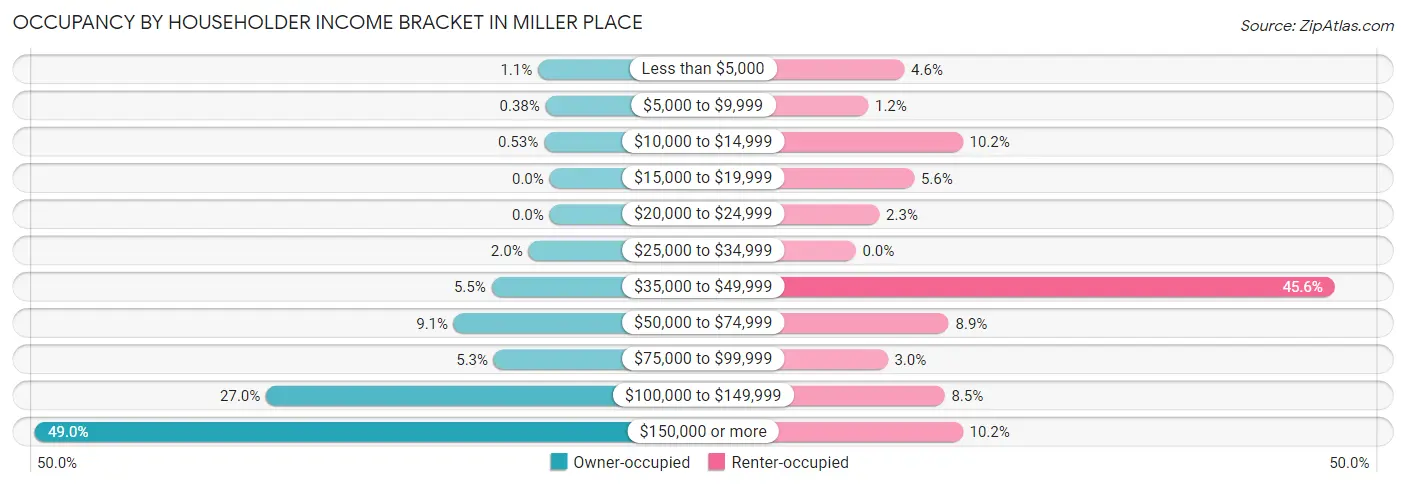
| Income Bracket | Owner-occupied | Renter-occupied |
| Less than $5,000 | 35 (1.1%) | 35 (4.6%) |
| $5,000 to $9,999 | 12 (0.4%) | 9 (1.2%) |
| $10,000 to $14,999 | 17 (0.5%) | 77 (10.2%) |
| $15,000 to $19,999 | 0 (0.0%) | 42 (5.6%) |
| $20,000 to $24,999 | 0 (0.0%) | 17 (2.2%) |
| $25,000 to $34,999 | 64 (2.0%) | 0 (0.0%) |
| $35,000 to $49,999 | 176 (5.5%) | 345 (45.6%) |
| $50,000 to $74,999 | 290 (9.1%) | 67 (8.9%) |
| $75,000 to $99,999 | 169 (5.3%) | 23 (3.0%) |
| $100,000 to $149,999 | 859 (27.0%) | 64 (8.5%) |
| $150,000 or more | 1,559 (49.0%) | 77 (10.2%) |
| Total | 3,181 (100.0%) | 756 (100.0%) |
Monthly Housing Cost Tiers in Miller Place
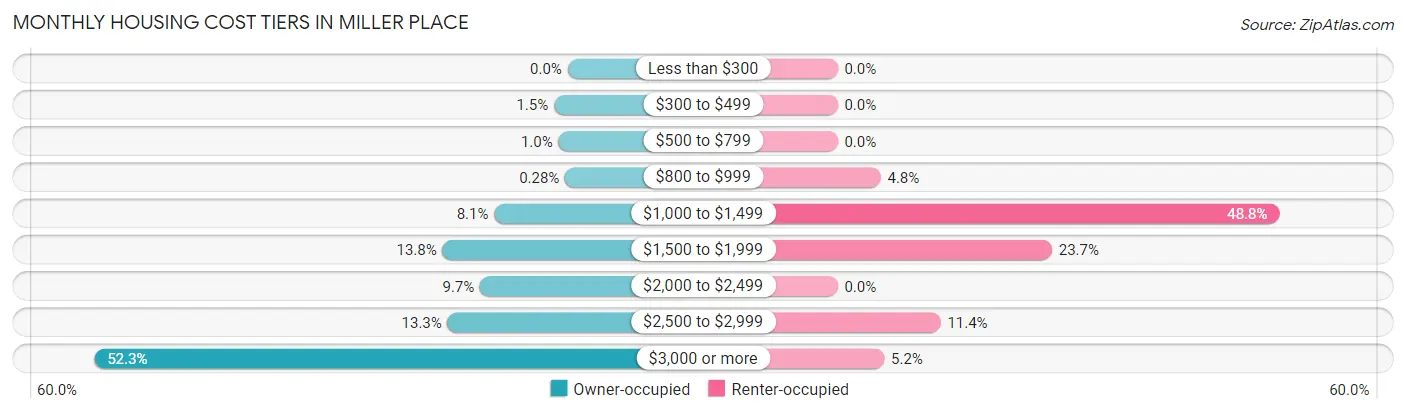
| Monthly Cost | Owner-occupied | Renter-occupied |
| Less than $300 | 0 (0.0%) | 0 (0.0%) |
| $300 to $499 | 48 (1.5%) | 0 (0.0%) |
| $500 to $799 | 32 (1.0%) | 0 (0.0%) |
| $800 to $999 | 9 (0.3%) | 36 (4.8%) |
| $1,000 to $1,499 | 258 (8.1%) | 369 (48.8%) |
| $1,500 to $1,999 | 440 (13.8%) | 179 (23.7%) |
| $2,000 to $2,499 | 308 (9.7%) | 0 (0.0%) |
| $2,500 to $2,999 | 422 (13.3%) | 86 (11.4%) |
| $3,000 or more | 1,664 (52.3%) | 39 (5.2%) |
| Total | 3,181 (100.0%) | 756 (100.0%) |
Physical Housing Characteristics in Miller Place
Housing Structures in Miller Place
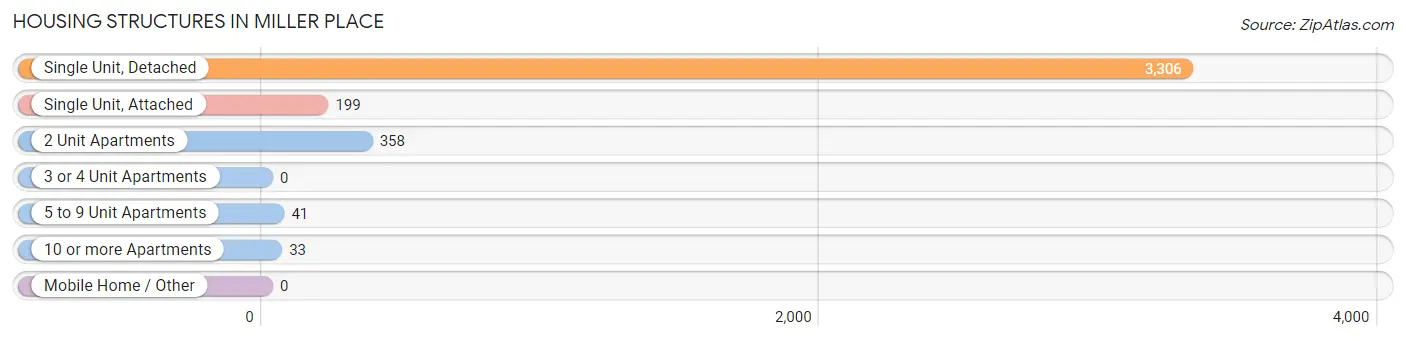
| Structure Type | # Housing Units | % Housing Units |
| Single Unit, Detached | 3,306 | 84.0% |
| Single Unit, Attached | 199 | 5.1% |
| 2 Unit Apartments | 358 | 9.1% |
| 3 or 4 Unit Apartments | 0 | 0.0% |
| 5 to 9 Unit Apartments | 41 | 1.0% |
| 10 or more Apartments | 33 | 0.8% |
| Mobile Home / Other | 0 | 0.0% |
| Total | 3,937 | 100.0% |
Housing Structures by Occupancy in Miller Place
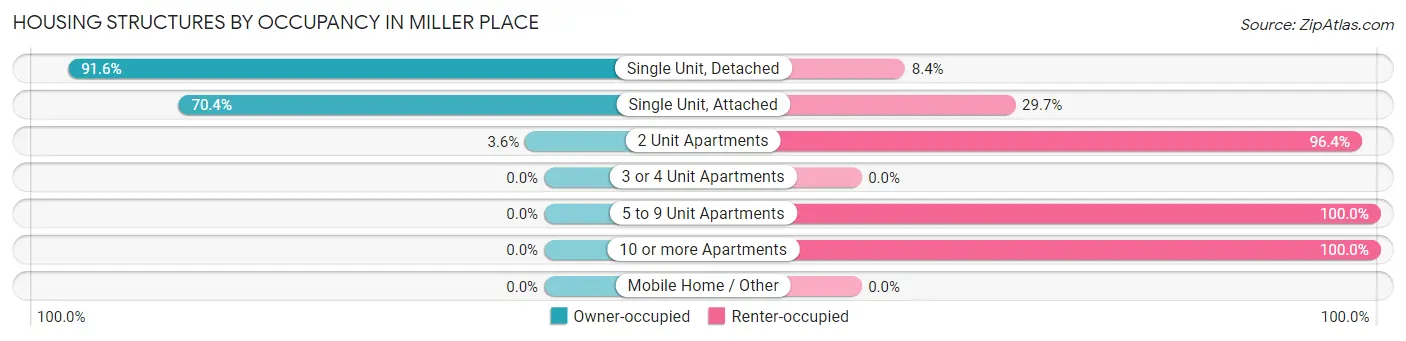
| Structure Type | Owner-occupied | Renter-occupied |
| Single Unit, Detached | 3,028 (91.6%) | 278 (8.4%) |
| Single Unit, Attached | 140 (70.4%) | 59 (29.6%) |
| 2 Unit Apartments | 13 (3.6%) | 345 (96.4%) |
| 3 or 4 Unit Apartments | 0 (0.0%) | 0 (0.0%) |
| 5 to 9 Unit Apartments | 0 (0.0%) | 41 (100.0%) |
| 10 or more Apartments | 0 (0.0%) | 33 (100.0%) |
| Mobile Home / Other | 0 (0.0%) | 0 (0.0%) |
| Total | 3,181 (80.8%) | 756 (19.2%) |
Housing Structures by Number of Rooms in Miller Place
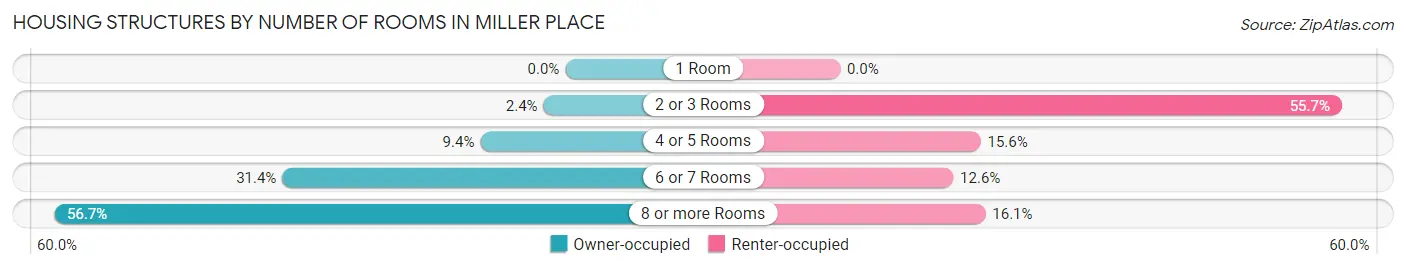
| Number of Rooms | Owner-occupied | Renter-occupied |
| 1 Room | 0 (0.0%) | 0 (0.0%) |
| 2 or 3 Rooms | 77 (2.4%) | 421 (55.7%) |
| 4 or 5 Rooms | 300 (9.4%) | 118 (15.6%) |
| 6 or 7 Rooms | 999 (31.4%) | 95 (12.6%) |
| 8 or more Rooms | 1,805 (56.7%) | 122 (16.1%) |
| Total | 3,181 (100.0%) | 756 (100.0%) |
Housing Structure by Heating Type in Miller Place
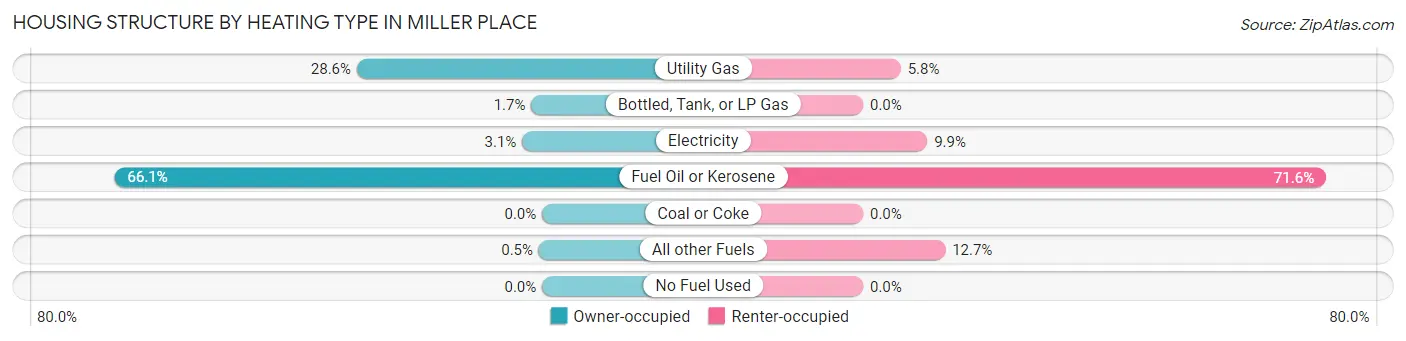
| Heating Type | Owner-occupied | Renter-occupied |
| Utility Gas | 911 (28.6%) | 44 (5.8%) |
| Bottled, Tank, or LP Gas | 53 (1.7%) | 0 (0.0%) |
| Electricity | 98 (3.1%) | 75 (9.9%) |
| Fuel Oil or Kerosene | 2,103 (66.1%) | 541 (71.6%) |
| Coal or Coke | 0 (0.0%) | 0 (0.0%) |
| All other Fuels | 16 (0.5%) | 96 (12.7%) |
| No Fuel Used | 0 (0.0%) | 0 (0.0%) |
| Total | 3,181 (100.0%) | 756 (100.0%) |
Household Vehicle Usage in Miller Place
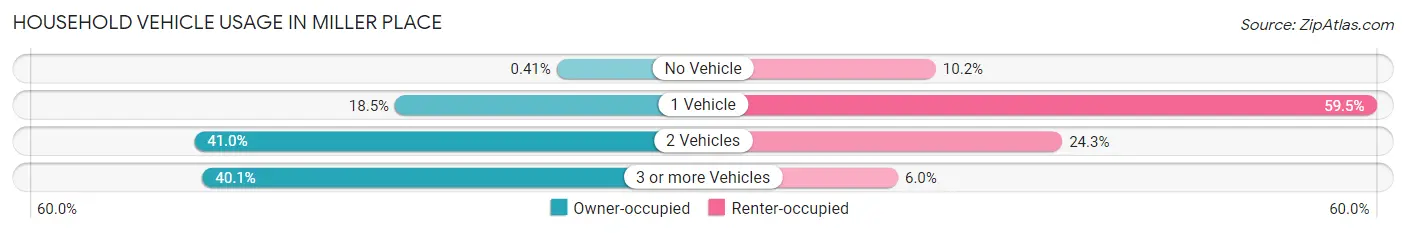
| Vehicles per Household | Owner-occupied | Renter-occupied |
| No Vehicle | 13 (0.4%) | 77 (10.2%) |
| 1 Vehicle | 589 (18.5%) | 450 (59.5%) |
| 2 Vehicles | 1,304 (41.0%) | 184 (24.3%) |
| 3 or more Vehicles | 1,275 (40.1%) | 45 (5.9%) |
| Total | 3,181 (100.0%) | 756 (100.0%) |
Real Estate & Mortgages in Miller Place
Real Estate and Mortgage Overview in Miller Place
| Characteristic | Without Mortgage | With Mortgage |
| Housing Units | 1,056 | 2,125 |
| Median Property Value | $475,400 | $575,600 |
| Median Household Income | $120,179 | $1,166 |
| Monthly Housing Costs | $1,501 | $1,593 |
| Real Estate Taxes | $10,001 | $0 |
Property Value by Mortgage Status in Miller Place
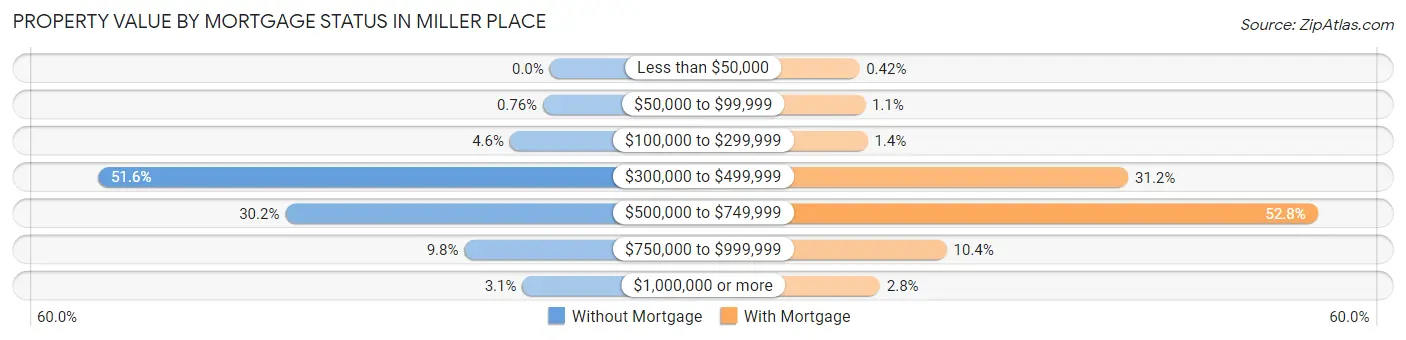
| Property Value | Without Mortgage | With Mortgage |
| Less than $50,000 | 0 (0.0%) | 9 (0.4%) |
| $50,000 to $99,999 | 8 (0.8%) | 23 (1.1%) |
| $100,000 to $299,999 | 48 (4.5%) | 29 (1.4%) |
| $300,000 to $499,999 | 545 (51.6%) | 662 (31.1%) |
| $500,000 to $749,999 | 319 (30.2%) | 1,122 (52.8%) |
| $750,000 to $999,999 | 103 (9.8%) | 221 (10.4%) |
| $1,000,000 or more | 33 (3.1%) | 59 (2.8%) |
| Total | 1,056 (100.0%) | 2,125 (100.0%) |
Household Income by Mortgage Status in Miller Place
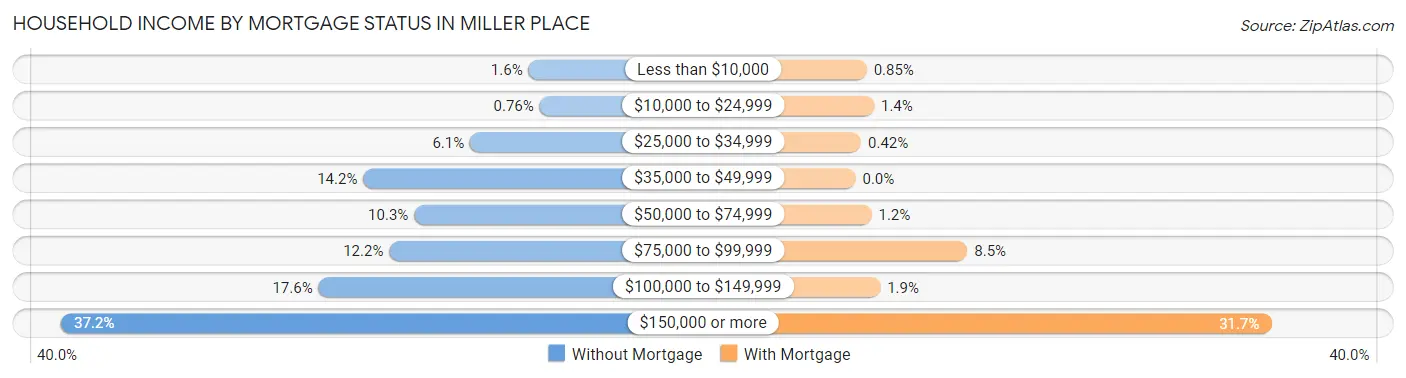
| Household Income | Without Mortgage | With Mortgage |
| Less than $10,000 | 17 (1.6%) | 18 (0.9%) |
| $10,000 to $24,999 | 8 (0.8%) | 30 (1.4%) |
| $25,000 to $34,999 | 64 (6.1%) | 9 (0.4%) |
| $35,000 to $49,999 | 150 (14.2%) | 0 (0.0%) |
| $50,000 to $74,999 | 109 (10.3%) | 26 (1.2%) |
| $75,000 to $99,999 | 129 (12.2%) | 181 (8.5%) |
| $100,000 to $149,999 | 186 (17.6%) | 40 (1.9%) |
| $150,000 or more | 393 (37.2%) | 673 (31.7%) |
| Total | 1,056 (100.0%) | 2,125 (100.0%) |
Property Value to Household Income Ratio in Miller Place
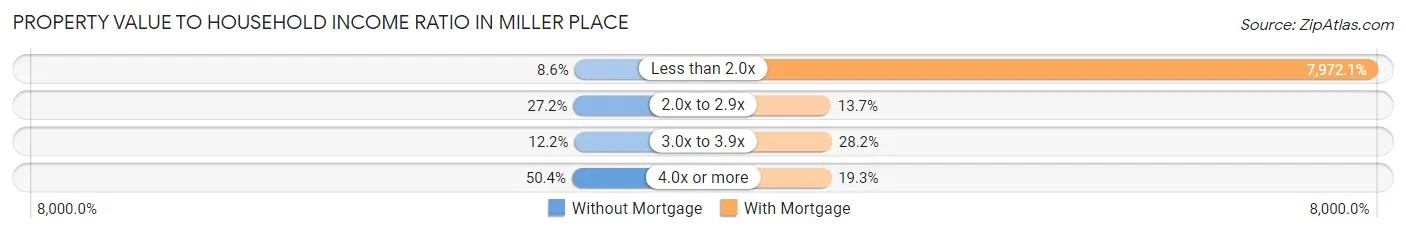
| Value-to-Income Ratio | Without Mortgage | With Mortgage |
| Less than 2.0x | 91 (8.6%) | 169,408 (7,972.1%) |
| 2.0x to 2.9x | 287 (27.2%) | 291 (13.7%) |
| 3.0x to 3.9x | 129 (12.2%) | 600 (28.2%) |
| 4.0x or more | 532 (50.4%) | 410 (19.3%) |
| Total | 1,056 (100.0%) | 2,125 (100.0%) |
Real Estate Taxes by Mortgage Status in Miller Place
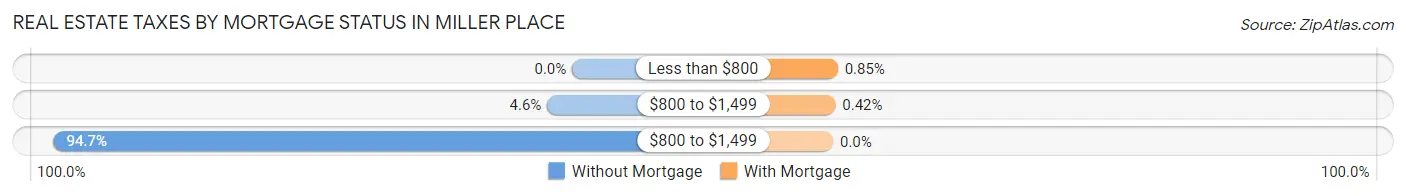
| Property Taxes | Without Mortgage | With Mortgage |
| Less than $800 | 0 (0.0%) | 18 (0.9%) |
| $800 to $1,499 | 48 (4.5%) | 9 (0.4%) |
| $800 to $1,499 | 1,000 (94.7%) | 0 (0.0%) |
| Total | 1,056 (100.0%) | 2,125 (100.0%) |
Health & Disability in Miller Place
Health Insurance Coverage by Age in Miller Place
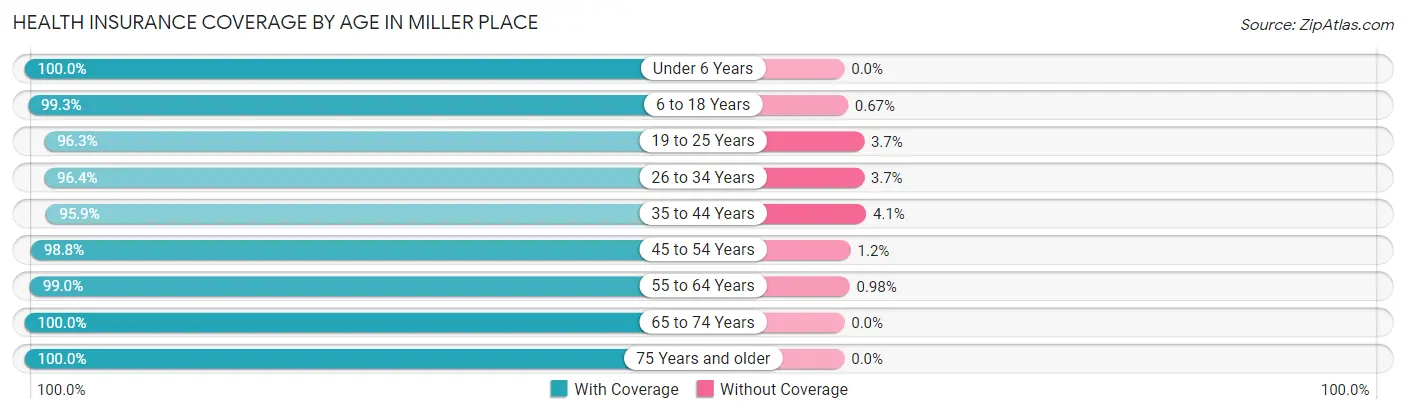
| Age Bracket | With Coverage | Without Coverage |
| Under 6 Years | 429 (100.0%) | 0 (0.0%) |
| 6 to 18 Years | 2,508 (99.3%) | 17 (0.7%) |
| 19 to 25 Years | 1,182 (96.3%) | 45 (3.7%) |
| 26 to 34 Years | 925 (96.4%) | 35 (3.6%) |
| 35 to 44 Years | 1,087 (95.9%) | 46 (4.1%) |
| 45 to 54 Years | 1,595 (98.8%) | 19 (1.2%) |
| 55 to 64 Years | 1,619 (99.0%) | 16 (1.0%) |
| 65 to 74 Years | 1,571 (100.0%) | 0 (0.0%) |
| 75 Years and older | 754 (100.0%) | 0 (0.0%) |
| Total | 11,670 (98.5%) | 178 (1.5%) |
Health Insurance Coverage by Citizenship Status in Miller Place
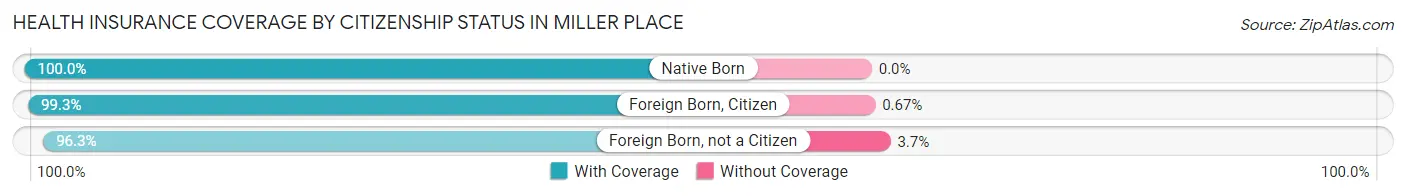
| Citizenship Status | With Coverage | Without Coverage |
| Native Born | 429 (100.0%) | 0 (0.0%) |
| Foreign Born, Citizen | 2,508 (99.3%) | 17 (0.7%) |
| Foreign Born, not a Citizen | 1,182 (96.3%) | 45 (3.7%) |
Health Insurance Coverage by Household Income in Miller Place
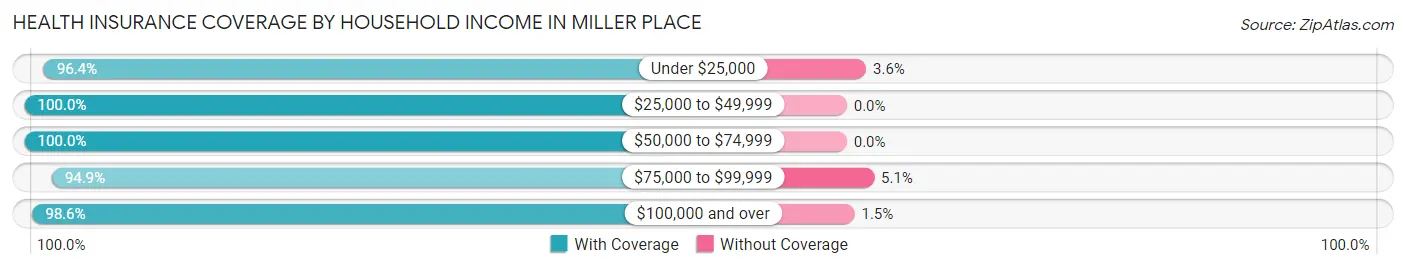
| Household Income | With Coverage | Without Coverage |
| Under $25,000 | 667 (96.4%) | 25 (3.6%) |
| $25,000 to $49,999 | 828 (100.0%) | 0 (0.0%) |
| $50,000 to $74,999 | 827 (100.0%) | 0 (0.0%) |
| $75,000 to $99,999 | 427 (94.9%) | 23 (5.1%) |
| $100,000 and over | 8,850 (98.6%) | 130 (1.5%) |
Public vs Private Health Insurance Coverage by Age in Miller Place
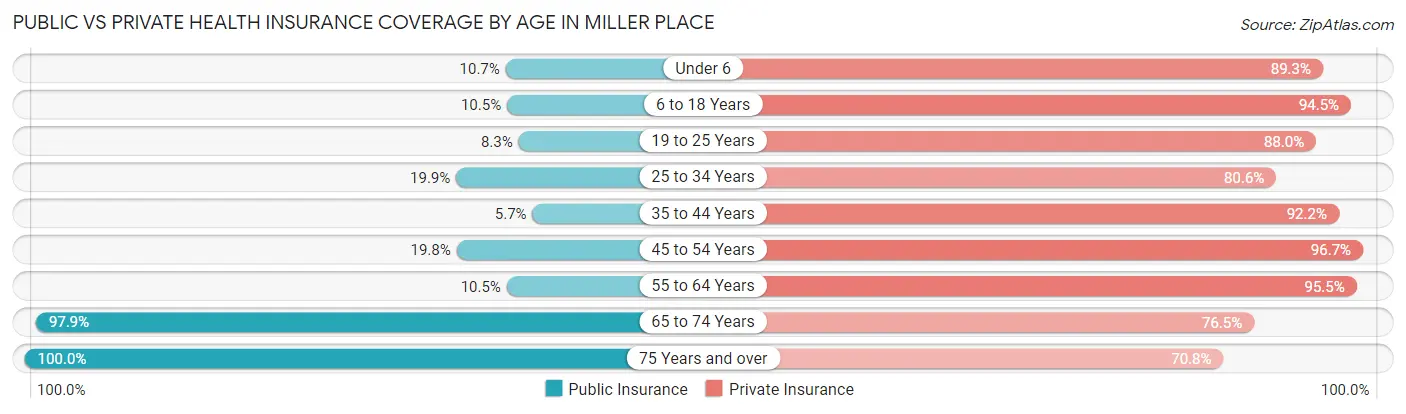
| Age Bracket | Public Insurance | Private Insurance |
| Under 6 | 46 (10.7%) | 383 (89.3%) |
| 6 to 18 Years | 264 (10.5%) | 2,386 (94.5%) |
| 19 to 25 Years | 102 (8.3%) | 1,080 (88.0%) |
| 25 to 34 Years | 191 (19.9%) | 774 (80.6%) |
| 35 to 44 Years | 65 (5.7%) | 1,045 (92.2%) |
| 45 to 54 Years | 320 (19.8%) | 1,561 (96.7%) |
| 55 to 64 Years | 172 (10.5%) | 1,562 (95.5%) |
| 65 to 74 Years | 1,538 (97.9%) | 1,202 (76.5%) |
| 75 Years and over | 754 (100.0%) | 534 (70.8%) |
| Total | 3,452 (29.1%) | 10,527 (88.8%) |
Disability Status by Sex by Age in Miller Place
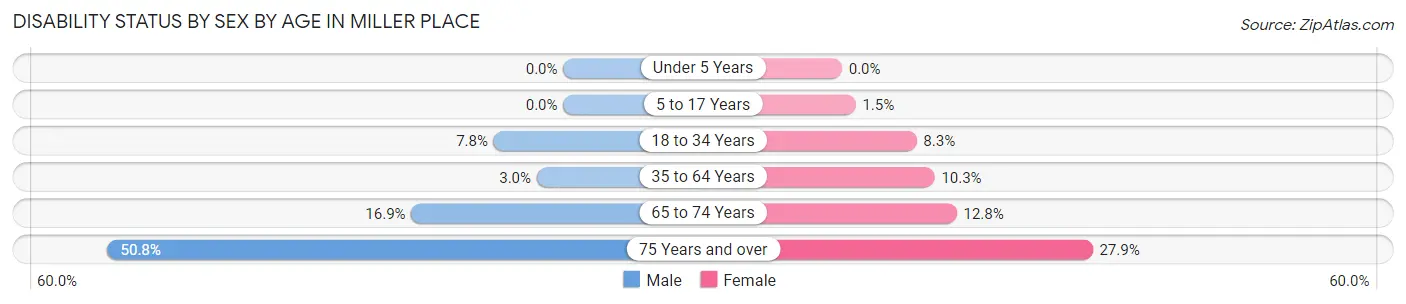
| Age Bracket | Male | Female |
| Under 5 Years | 0 (0.0%) | 0 (0.0%) |
| 5 to 17 Years | 0 (0.0%) | 21 (1.5%) |
| 18 to 34 Years | 97 (7.7%) | 100 (8.3%) |
| 35 to 64 Years | 66 (2.9%) | 221 (10.3%) |
| 65 to 74 Years | 99 (16.9%) | 126 (12.8%) |
| 75 Years and over | 170 (50.7%) | 117 (27.9%) |
Disability Class by Sex by Age in Miller Place
Disability Class: Hearing Difficulty
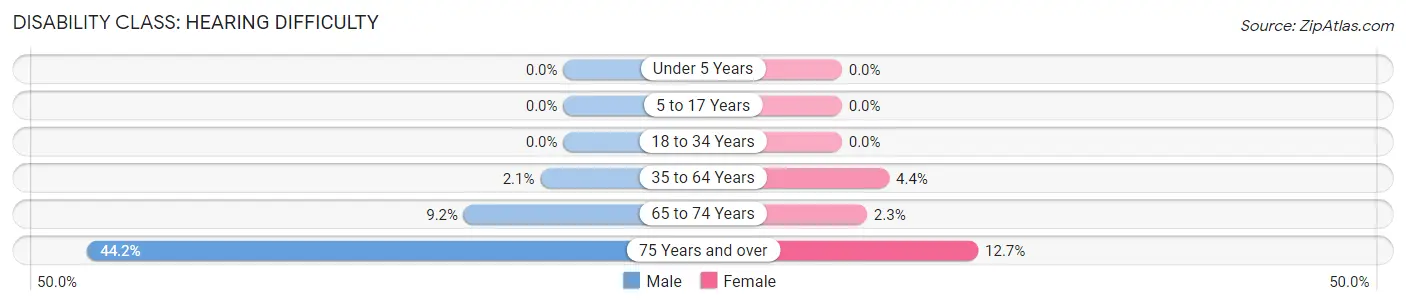
| Age Bracket | Male | Female |
| Under 5 Years | 0 (0.0%) | 0 (0.0%) |
| 5 to 17 Years | 0 (0.0%) | 0 (0.0%) |
| 18 to 34 Years | 0 (0.0%) | 0 (0.0%) |
| 35 to 64 Years | 48 (2.1%) | 94 (4.4%) |
| 65 to 74 Years | 54 (9.2%) | 23 (2.3%) |
| 75 Years and over | 148 (44.2%) | 53 (12.7%) |
Disability Class: Vision Difficulty
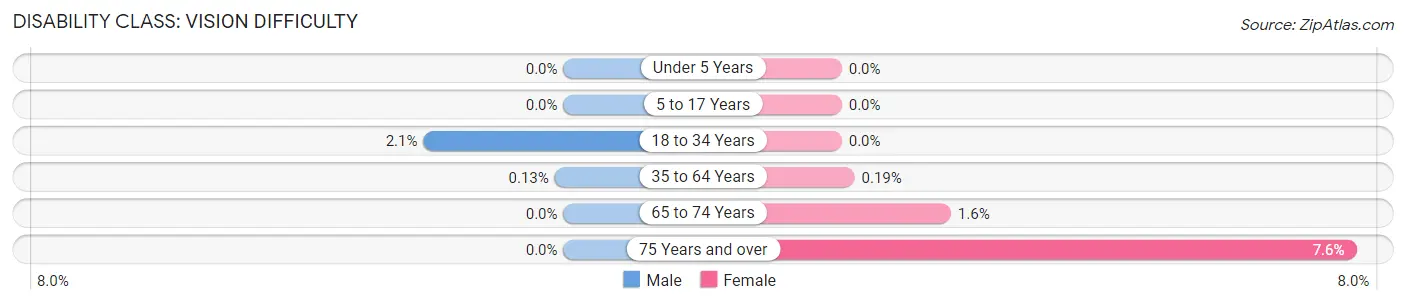
| Age Bracket | Male | Female |
| Under 5 Years | 0 (0.0%) | 0 (0.0%) |
| 5 to 17 Years | 0 (0.0%) | 0 (0.0%) |
| 18 to 34 Years | 26 (2.1%) | 0 (0.0%) |
| 35 to 64 Years | 3 (0.1%) | 4 (0.2%) |
| 65 to 74 Years | 0 (0.0%) | 16 (1.6%) |
| 75 Years and over | 0 (0.0%) | 32 (7.6%) |
Disability Class: Cognitive Difficulty
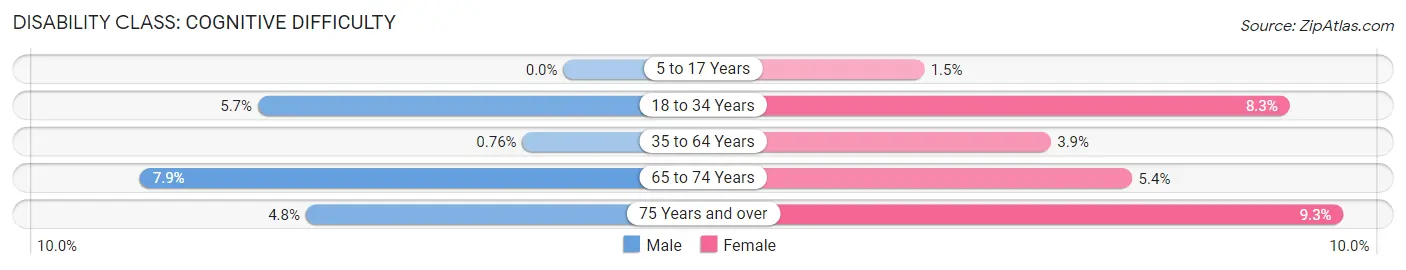
| Age Bracket | Male | Female |
| 5 to 17 Years | 0 (0.0%) | 21 (1.5%) |
| 18 to 34 Years | 71 (5.7%) | 100 (8.3%) |
| 35 to 64 Years | 17 (0.8%) | 83 (3.9%) |
| 65 to 74 Years | 46 (7.9%) | 53 (5.4%) |
| 75 Years and over | 16 (4.8%) | 39 (9.3%) |
Disability Class: Ambulatory Difficulty
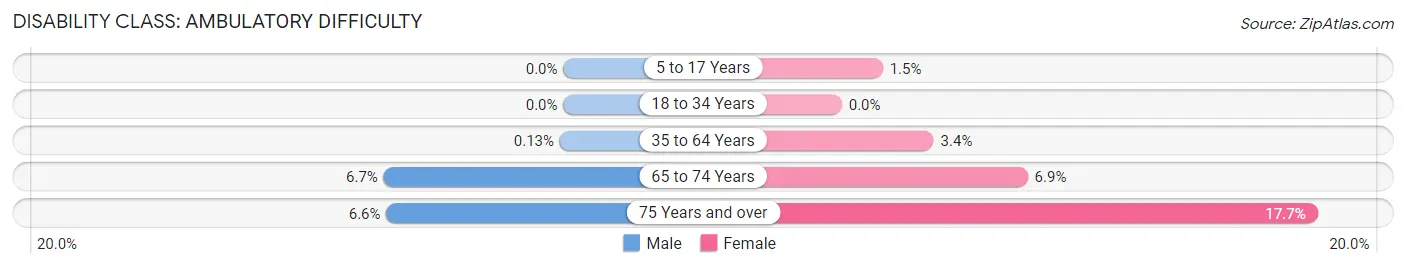
| Age Bracket | Male | Female |
| 5 to 17 Years | 0 (0.0%) | 21 (1.5%) |
| 18 to 34 Years | 0 (0.0%) | 0 (0.0%) |
| 35 to 64 Years | 3 (0.1%) | 73 (3.4%) |
| 65 to 74 Years | 39 (6.7%) | 68 (6.9%) |
| 75 Years and over | 22 (6.6%) | 74 (17.7%) |
Disability Class: Self-Care Difficulty
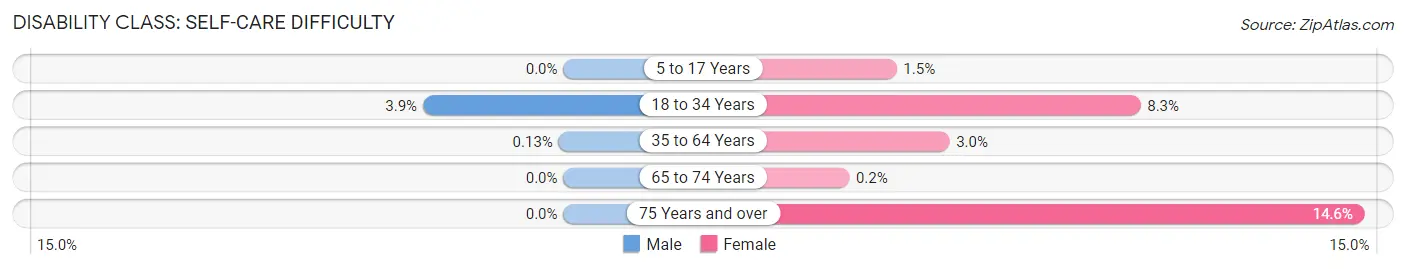
| Age Bracket | Male | Female |
| 5 to 17 Years | 0 (0.0%) | 21 (1.5%) |
| 18 to 34 Years | 49 (3.9%) | 100 (8.3%) |
| 35 to 64 Years | 3 (0.1%) | 64 (3.0%) |
| 65 to 74 Years | 0 (0.0%) | 2 (0.2%) |
| 75 Years and over | 0 (0.0%) | 61 (14.6%) |
Technology Access in Miller Place
Computing Device Access in Miller Place
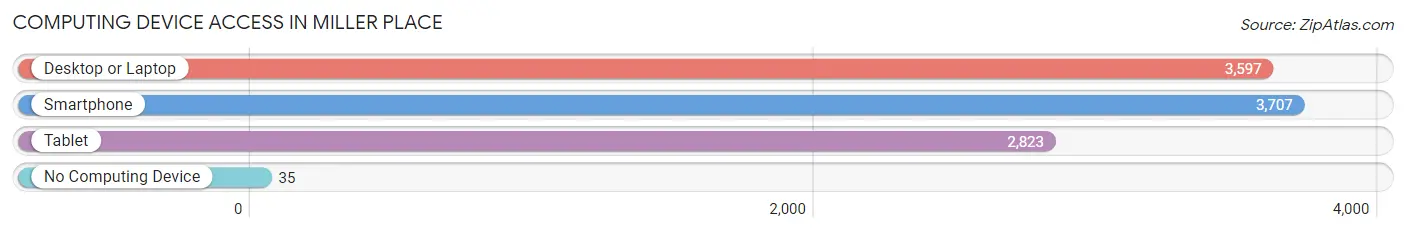
| Device Type | # Households | % Households |
| Desktop or Laptop | 3,597 | 91.4% |
| Smartphone | 3,707 | 94.2% |
| Tablet | 2,823 | 71.7% |
| No Computing Device | 35 | 0.9% |
| Total | 3,937 | 100.0% |
Internet Access in Miller Place
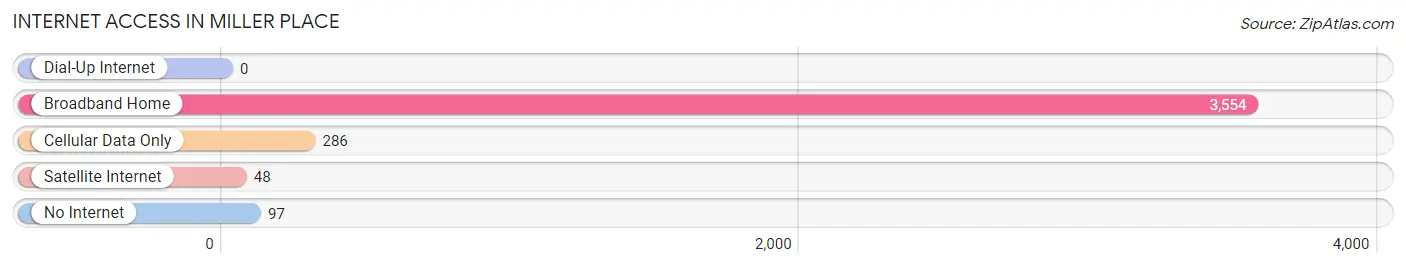
| Internet Type | # Households | % Households |
| Dial-Up Internet | 0 | 0.0% |
| Broadband Home | 3,554 | 90.3% |
| Cellular Data Only | 286 | 7.3% |
| Satellite Internet | 48 | 1.2% |
| No Internet | 97 | 2.5% |
| Total | 3,937 | 100.0% |
Miller Place Summary
History
The hamlet of Miller Place is located in the Town of Brookhaven in Suffolk County, New York. It is situated on the North Shore of Long Island, approximately 60 miles east of New York City. The area was originally inhabited by the Setalcott Indians, a branch of the Algonquin tribe. The first European settlers arrived in the area in the mid-17th century, and the hamlet was officially established in 1795.
The hamlet was named after the Miller family, who were among the first settlers in the area. The Millers were Quakers who had emigrated from England in the 1650s. They established a farm and built a grist mill, which was the first of its kind in the area. The mill was a major source of income for the family, and it gave the hamlet its name.
The hamlet grew slowly over the next century, and by the mid-19th century, it had become a popular summer destination for wealthy New Yorkers. The area was known for its beautiful beaches and scenic views of the Long Island Sound.
In the early 20th century, Miller Place began to experience rapid growth. The hamlet was incorporated in 1921, and by the 1950s, it had become a popular residential community. The population of Miller Place has continued to grow steadily over the past several decades, and it now stands at approximately 8,000 people.
Geography
Miller Place is located on the North Shore of Long Island, approximately 60 miles east of New York City. It is bordered by the hamlets of Mount Sinai to the west, Rocky Point to the north, and Sound Beach to the east. The hamlet is situated on the Long Island Sound, and it is home to several beaches, including Miller Place Beach, Cedar Beach, and Rocky Point Beach.
The hamlet is located in the Town of Brookhaven, which is part of Suffolk County. The town is divided into several hamlets, including Miller Place, Mount Sinai, Rocky Point, Sound Beach, and Port Jefferson. The town is home to several parks, including the Brookhaven Town Beach Park, the Cedar Beach County Park, and the Miller Place-Mount Sinai Historical Park.
Economy
The economy of Miller Place is largely based on tourism and retail. The hamlet is home to several restaurants, bars, and shops, as well as a few small businesses. The hamlet is also home to several marinas, which provide services to boaters and fishermen.
The hamlet is also home to several large employers, including the Miller Place-Mount Sinai School District, the Miller Place Fire Department, and the Miller Place-Mount Sinai Historical Society. The hamlet is also home to several medical facilities, including the Miller Place Medical Center and the Miller Place Surgery Center.
Demographics
As of the 2010 census, the population of Miller Place was 8,037. The population is predominantly white (90.2%), with small percentages of African American (3.2%), Asian (2.7%), and Hispanic (2.3%) residents. The median household income is $103,945, and the median home value is $521,000. The hamlet is home to several schools, including Miller Place High School, Miller Place Middle School, and Miller Place Elementary School.
Common Questions
What is Per Capita Income in Miller Place?
Per Capita income in Miller Place is $53,127.
What is the Median Family Income in Miller Place?
Median Family Income in Miller Place is $153,682.
What is the Median Household income in Miller Place?
Median Household Income in Miller Place is $136,203.
What is Income or Wage Gap in Miller Place?
Income or Wage Gap in Miller Place is 60.3%.
Women in Miller Place earn 39.7 cents for every dollar earned by a man.
What is Family Income Deficit in Miller Place?
Family Income Deficit in Miller Place is $21,398.
Families that are below poverty line in Miller Place earn $21,398 less on average than the poverty threshold level.
What is Inequality or Gini Index in Miller Place?
Inequality or Gini Index in Miller Place is 0.39.
What is the Total Population of Miller Place?
Total Population of Miller Place is 11,848.
What is the Total Male Population of Miller Place?
Total Male Population of Miller Place is 5,547.
What is the Total Female Population of Miller Place?
Total Female Population of Miller Place is 6,301.
What is the Ratio of Males per 100 Females in Miller Place?
There are 88.03 Males per 100 Females in Miller Place.
What is the Ratio of Females per 100 Males in Miller Place?
There are 113.59 Females per 100 Males in Miller Place.
What is the Median Population Age in Miller Place?
Median Population Age in Miller Place is 42.5 Years.
What is the Average Family Size in Miller Place
Average Family Size in Miller Place is 3.5 People.
What is the Average Household Size in Miller Place
Average Household Size in Miller Place is 3.0 People.
How Large is the Labor Force in Miller Place?
There are 5,254 People in the Labor Forcein in Miller Place.
What is the Percentage of People in the Labor Force in Miller Place?
54.5% of People are in the Labor Force in Miller Place.
What is the Unemployment Rate in Miller Place?
Unemployment Rate in Miller Place is 7.6%.