Nesconset, NY Map & Demographics
Nesconset Map
Nesconset Overview
$57,986
PER CAPITA INCOME
$151,884
AVG FAMILY INCOME
$141,754
AVG HOUSEHOLD INCOME
49.6%
WAGE / INCOME GAP [ % ]
50.4¢/ $1
WAGE / INCOME GAP [ $ ]
$12,463
FAMILY INCOME DEFICIT
0.42
INEQUALITY / GINI INDEX
13,549
TOTAL POPULATION
7,200
MALE POPULATION
6,349
FEMALE POPULATION
113.40
MALES / 100 FEMALES
88.18
FEMALES / 100 MALES
42.9
MEDIAN AGE
3.3
AVG FAMILY SIZE
2.9
AVG HOUSEHOLD SIZE
7,189
LABOR FORCE [ PEOPLE ]
64.3%
PERCENT IN LABOR FORCE
1.7%
UNEMPLOYMENT RATE
Nesconset Zip Codes
Nesconset Area Codes
Income in Nesconset
Income Overview in Nesconset
Per Capita Income in Nesconset is $57,986, while median incomes of families and households are $151,884 and $141,754 respectively.
| Characteristic | Number | Measure |
| Per Capita Income | 13,549 | $57,986 |
| Median Family Income | 3,672 | $151,884 |
| Mean Family Income | 3,672 | $191,566 |
| Median Household Income | 4,572 | $141,754 |
| Mean Household Income | 4,572 | $168,284 |
| Income Deficit | 3,672 | $12,463 |
| Wage / Income Gap (%) | 13,549 | 49.64% |
| Wage / Income Gap ($) | 13,549 | 50.36¢ per $1 |
| Gini / Inequality Index | 13,549 | 0.42 |
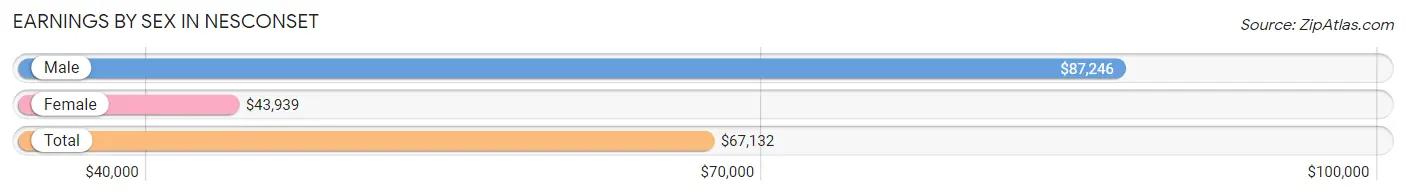
Earnings by Sex in Nesconset
Average Earnings in Nesconset are $67,132, $87,246 for men and $43,939 for women, a difference of 49.6%.
| Sex | Number | Average Earnings |
| Male | 4,423 (58.7%) | $87,246 |
| Female | 3,115 (41.3%) | $43,939 |
| Total | 7,538 (100.0%) | $67,132 |
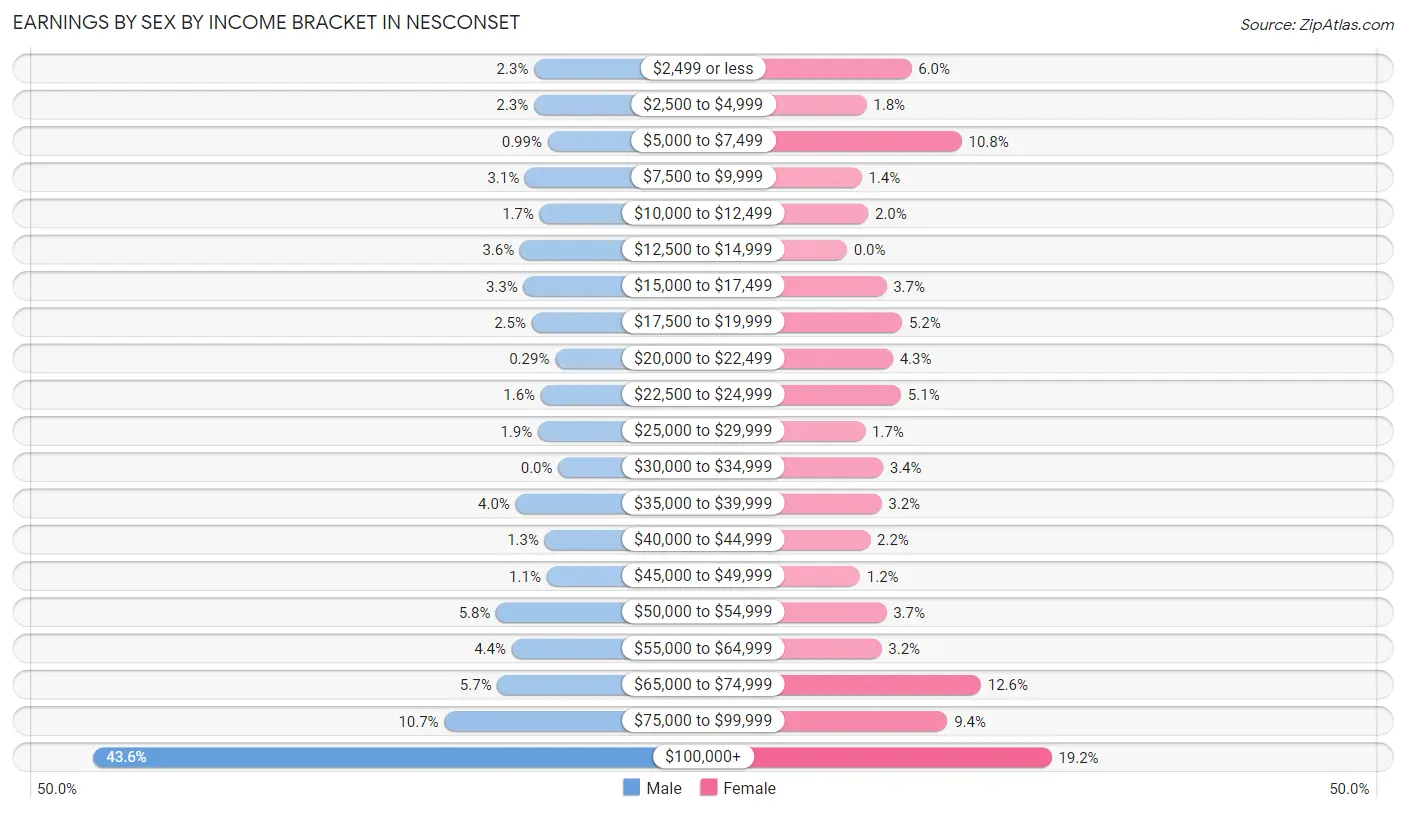
Earnings by Sex by Income Bracket in Nesconset
The most common earnings brackets in Nesconset are $100,000+ for men (1,926 | 43.5%) and $100,000+ for women (597 | 19.2%).
| Income | Male | Female |
| $2,499 or less | 100 (2.3%) | 188 (6.0%) |
| $2,500 to $4,999 | 101 (2.3%) | 57 (1.8%) |
| $5,000 to $7,499 | 44 (1.0%) | 335 (10.7%) |
| $7,500 to $9,999 | 138 (3.1%) | 43 (1.4%) |
| $10,000 to $12,499 | 77 (1.7%) | 62 (2.0%) |
| $12,500 to $14,999 | 159 (3.6%) | 0 (0.0%) |
| $15,000 to $17,499 | 144 (3.3%) | 115 (3.7%) |
| $17,500 to $19,999 | 110 (2.5%) | 161 (5.2%) |
| $20,000 to $22,499 | 13 (0.3%) | 134 (4.3%) |
| $22,500 to $24,999 | 72 (1.6%) | 158 (5.1%) |
| $25,000 to $29,999 | 84 (1.9%) | 53 (1.7%) |
| $30,000 to $34,999 | 0 (0.0%) | 105 (3.4%) |
| $35,000 to $39,999 | 177 (4.0%) | 101 (3.2%) |
| $40,000 to $44,999 | 56 (1.3%) | 68 (2.2%) |
| $45,000 to $49,999 | 48 (1.1%) | 38 (1.2%) |
| $50,000 to $54,999 | 257 (5.8%) | 115 (3.7%) |
| $55,000 to $64,999 | 193 (4.4%) | 101 (3.2%) |
| $65,000 to $74,999 | 252 (5.7%) | 391 (12.6%) |
| $75,000 to $99,999 | 472 (10.7%) | 293 (9.4%) |
| $100,000+ | 1,926 (43.5%) | 597 (19.2%) |
| Total | 4,423 (100.0%) | 3,115 (100.0%) |
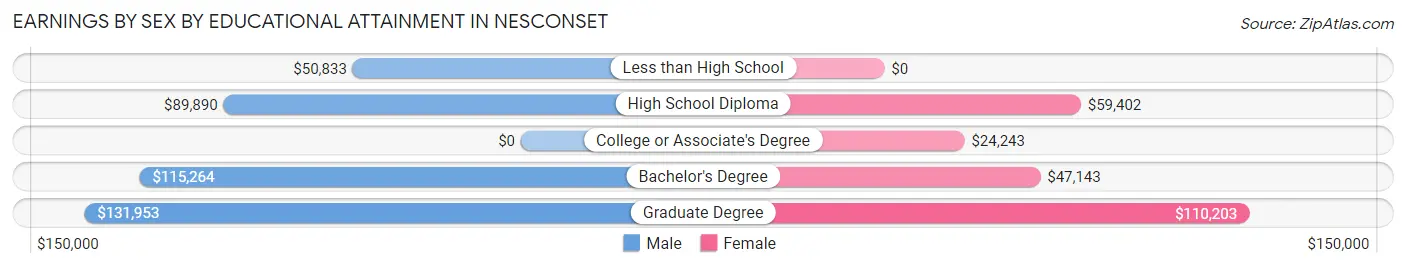
Earnings by Sex by Educational Attainment in Nesconset
Average earnings in Nesconset are $110,842 for men and $52,583 for women, a difference of 52.6%. Men with an educational attainment of graduate degree enjoy the highest average annual earnings of $131,953, while those with less than high school education earn the least with $50,833. Women with an educational attainment of graduate degree earn the most with the average annual earnings of $110,203, while those with college or associate's degree education have the smallest earnings of $24,243.
| Educational Attainment | Male Income | Female Income |
| Less than High School | $50,833 | $0 |
| High School Diploma | $89,890 | $59,402 |
| College or Associate's Degree | - | - |
| Bachelor's Degree | $115,264 | $47,143 |
| Graduate Degree | $131,953 | $110,203 |
| Total | $110,842 | $52,583 |
Family Income in Nesconset
Family Income Brackets in Nesconset
According to the Nesconset family income data, there are 1,267 families falling into the $200,000+ income range, which is the most common income bracket and makes up 34.5% of all families. Conversely, the $10,000 to $14,999 income bracket is the least frequent group with only 15 families (0.4%) belonging to this category.
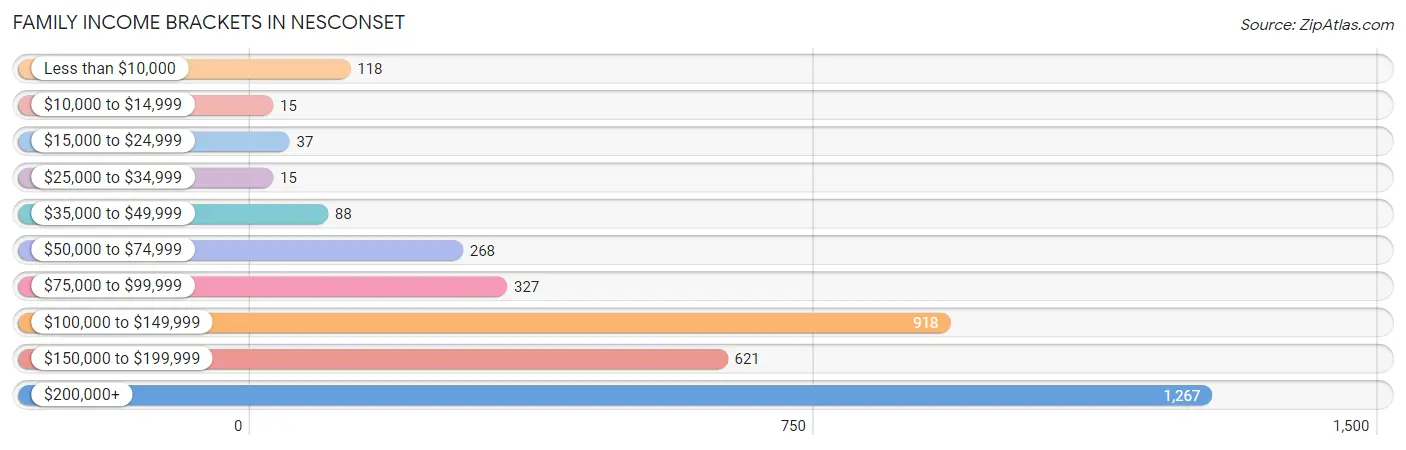
| Income Bracket | # Families | % Families |
| Less than $10,000 | 118 | 3.2% |
| $10,000 to $14,999 | 15 | 0.4% |
| $15,000 to $24,999 | 37 | 1.0% |
| $25,000 to $34,999 | 15 | 0.4% |
| $35,000 to $49,999 | 88 | 2.4% |
| $50,000 to $74,999 | 268 | 7.3% |
| $75,000 to $99,999 | 327 | 8.9% |
| $100,000 to $149,999 | 918 | 25.0% |
| $150,000 to $199,999 | 621 | 16.9% |
| $200,000+ | 1,267 | 34.5% |
Family Income by Famaliy Size in Nesconset
5-person families (276 | 7.5%) account for the highest median family income in Nesconset with $236,333 per family, while 2-person families (1,137 | 31.0%) have the highest median income of $63,676 per family member.
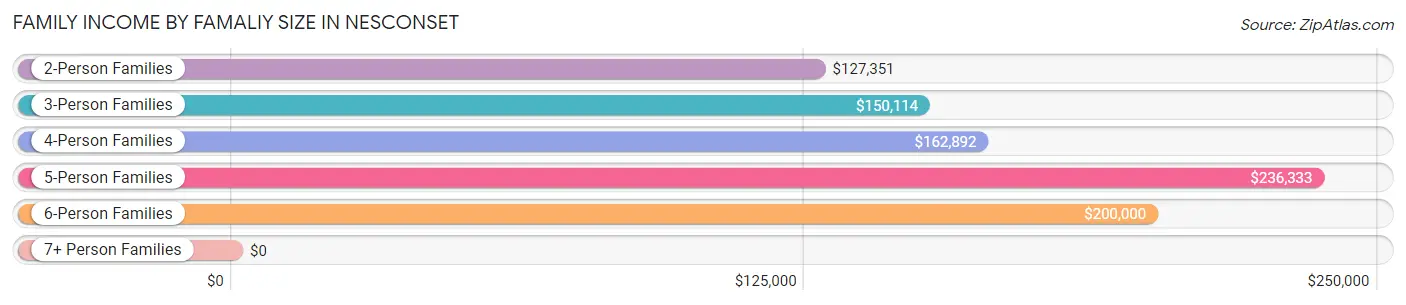
| Income Bracket | # Families | Median Income |
| 2-Person Families | 1,137 (31.0%) | $127,351 |
| 3-Person Families | 981 (26.7%) | $150,114 |
| 4-Person Families | 1,224 (33.3%) | $162,892 |
| 5-Person Families | 276 (7.5%) | $236,333 |
| 6-Person Families | 54 (1.5%) | $200,000 |
| 7+ Person Families | 0 (0.0%) | $0 |
| Total | 3,672 (100.0%) | $151,884 |
Family Income by Number of Earners in Nesconset
The median family income in Nesconset is $151,884, with families comprising 3+ earners (721) having the highest median family income of $229,750, while families with no earners (510) have the lowest median family income of $67,188, accounting for 19.6% and 13.9% of families, respectively.
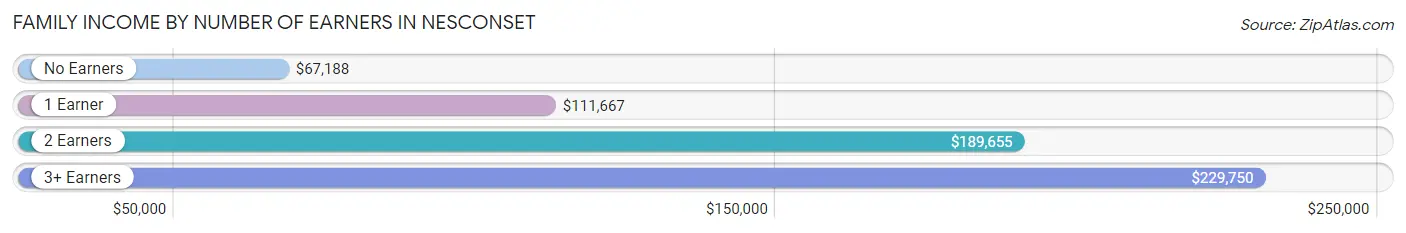
| Number of Earners | # Families | Median Income |
| No Earners | 510 (13.9%) | $67,188 |
| 1 Earner | 854 (23.3%) | $111,667 |
| 2 Earners | 1,587 (43.2%) | $189,655 |
| 3+ Earners | 721 (19.6%) | $229,750 |
| Total | 3,672 (100.0%) | $151,884 |
Household Income in Nesconset
Household Income Brackets in Nesconset
With 1,381 households falling in the category, the $200,000+ income range is the most frequent in Nesconset, accounting for 30.2% of all households. In contrast, only 46 households (1.0%) fall into the $10,000 to $14,999 income bracket, making it the least populous group.
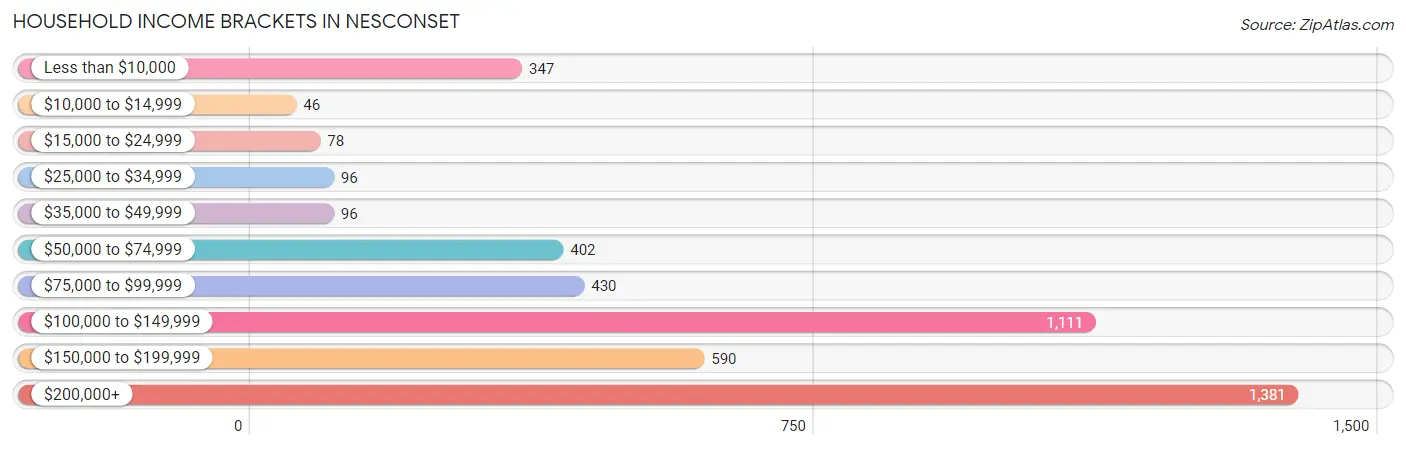
| Income Bracket | # Households | % Households |
| Less than $10,000 | 347 | 7.6% |
| $10,000 to $14,999 | 46 | 1.0% |
| $15,000 to $24,999 | 78 | 1.7% |
| $25,000 to $34,999 | 96 | 2.1% |
| $35,000 to $49,999 | 96 | 2.1% |
| $50,000 to $74,999 | 402 | 8.8% |
| $75,000 to $99,999 | 430 | 9.4% |
| $100,000 to $149,999 | 1,111 | 24.3% |
| $150,000 to $199,999 | 590 | 12.9% |
| $200,000+ | 1,381 | 30.2% |
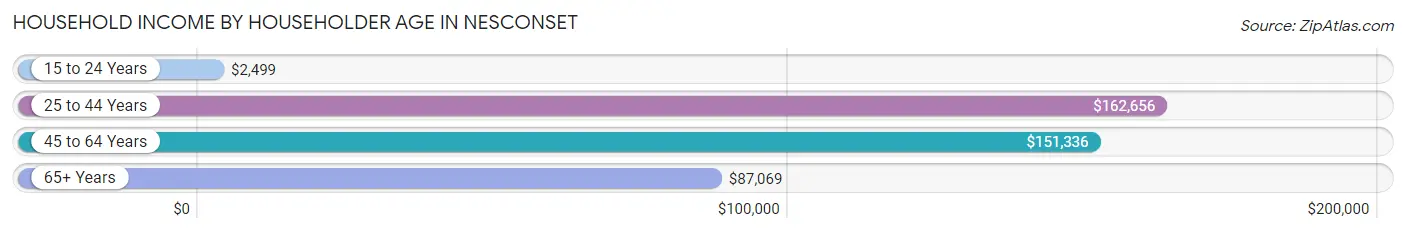
Household Income by Householder Age in Nesconset
The median household income in Nesconset is $141,754, with the highest median household income of $162,656 found in the 25 to 44 years age bracket for the primary householder. A total of 1,026 households (22.4%) fall into this category. Meanwhile, the 15 to 24 years age bracket for the primary householder has the lowest median household income of $2,499, with 130 households (2.8%) in this group.
| Income Bracket | # Households | Median Income |
| 15 to 24 Years | 130 (2.8%) | $2,499 |
| 25 to 44 Years | 1,026 (22.4%) | $162,656 |
| 45 to 64 Years | 2,300 (50.3%) | $151,336 |
| 65+ Years | 1,116 (24.4%) | $87,069 |
| Total | 4,572 (100.0%) | $141,754 |
Poverty in Nesconset
Income Below Poverty by Sex and Age in Nesconset
With 5.7% poverty level for males and 6.4% for females among the residents of Nesconset, 18 to 24 year old males and 16 and 17 year old females are the most vulnerable to poverty, with 192 males (16.4%) and 51 females (18.9%) in their respective age groups living below the poverty level.
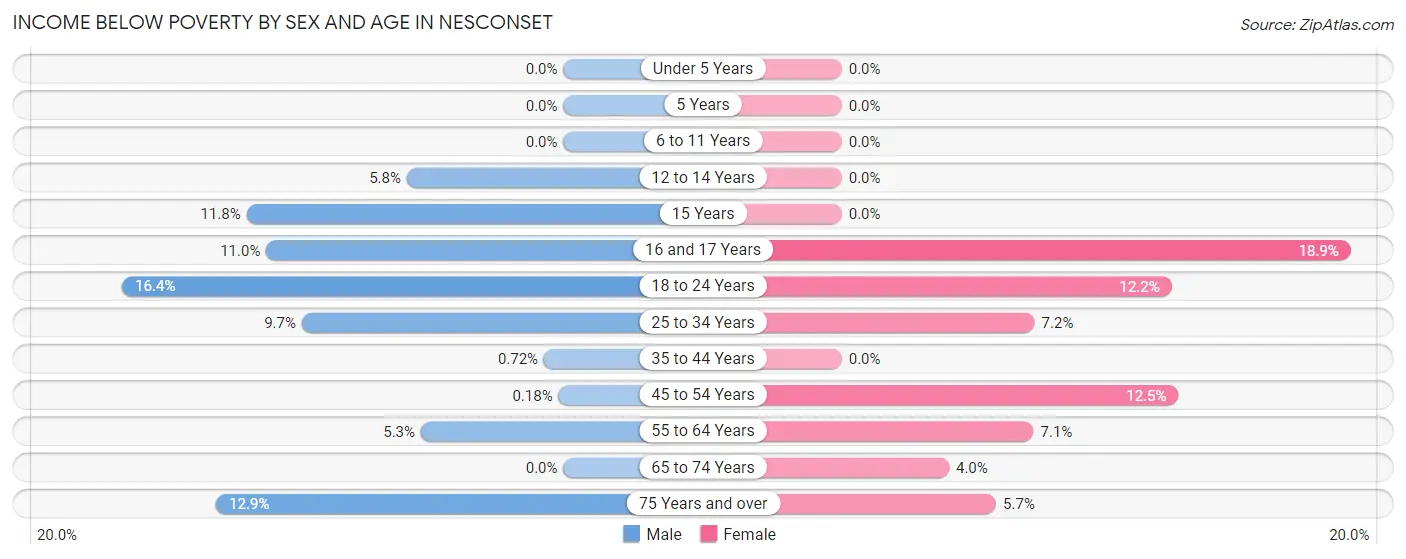
| Age Bracket | Male | Female |
| Under 5 Years | 0 (0.0%) | 0 (0.0%) |
| 5 Years | 0 (0.0%) | 0 (0.0%) |
| 6 to 11 Years | 0 (0.0%) | 0 (0.0%) |
| 12 to 14 Years | 15 (5.8%) | 0 (0.0%) |
| 15 Years | 16 (11.8%) | 0 (0.0%) |
| 16 and 17 Years | 16 (11.0%) | 51 (18.9%) |
| 18 to 24 Years | 192 (16.4%) | 66 (12.2%) |
| 25 to 34 Years | 64 (9.7%) | 31 (7.2%) |
| 35 to 44 Years | 6 (0.7%) | 0 (0.0%) |
| 45 to 54 Years | 2 (0.2%) | 130 (12.5%) |
| 55 to 64 Years | 57 (5.3%) | 65 (7.1%) |
| 65 to 74 Years | 0 (0.0%) | 27 (4.0%) |
| 75 Years and over | 41 (12.9%) | 28 (5.7%) |
| Total | 409 (5.7%) | 398 (6.4%) |
Income Above Poverty by Sex and Age in Nesconset
According to the poverty statistics in Nesconset, males aged under 5 years and females aged under 5 years are the age groups that are most secure financially, with 100.0% of males and 100.0% of females in these age groups living above the poverty line.
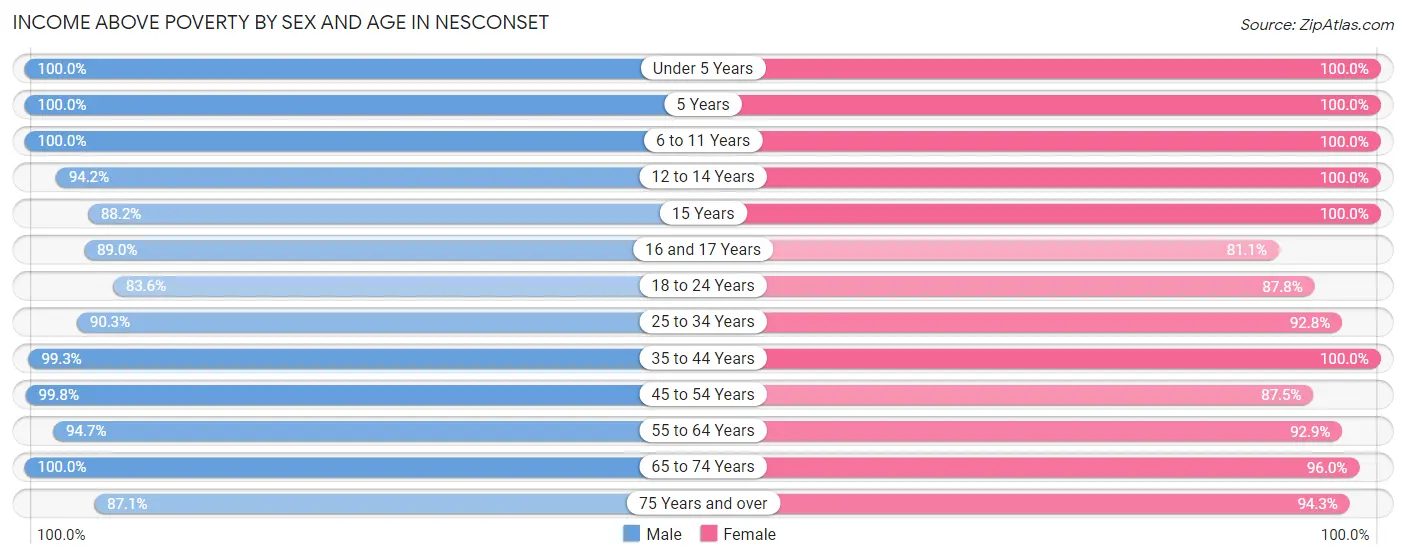
| Age Bracket | Male | Female |
| Under 5 Years | 278 (100.0%) | 197 (100.0%) |
| 5 Years | 42 (100.0%) | 75 (100.0%) |
| 6 to 11 Years | 564 (100.0%) | 391 (100.0%) |
| 12 to 14 Years | 243 (94.2%) | 361 (100.0%) |
| 15 Years | 120 (88.2%) | 64 (100.0%) |
| 16 and 17 Years | 129 (89.0%) | 219 (81.1%) |
| 18 to 24 Years | 980 (83.6%) | 473 (87.8%) |
| 25 to 34 Years | 595 (90.3%) | 402 (92.8%) |
| 35 to 44 Years | 822 (99.3%) | 783 (100.0%) |
| 45 to 54 Years | 1,111 (99.8%) | 911 (87.5%) |
| 55 to 64 Years | 1,020 (94.7%) | 848 (92.9%) |
| 65 to 74 Years | 532 (100.0%) | 651 (96.0%) |
| 75 Years and over | 277 (87.1%) | 461 (94.3%) |
| Total | 6,713 (94.3%) | 5,836 (93.6%) |
Income Below Poverty Among Married-Couple Families in Nesconset
The poverty statistics for married-couple families in Nesconset show that 2.9% or 92 of the total 3,176 families live below the poverty line. Families with no children have the highest poverty rate of 5.1%, comprising of 92 families. On the other hand, families with 1 or 2 children have the lowest poverty rate of 0.0%, which includes 0 families.
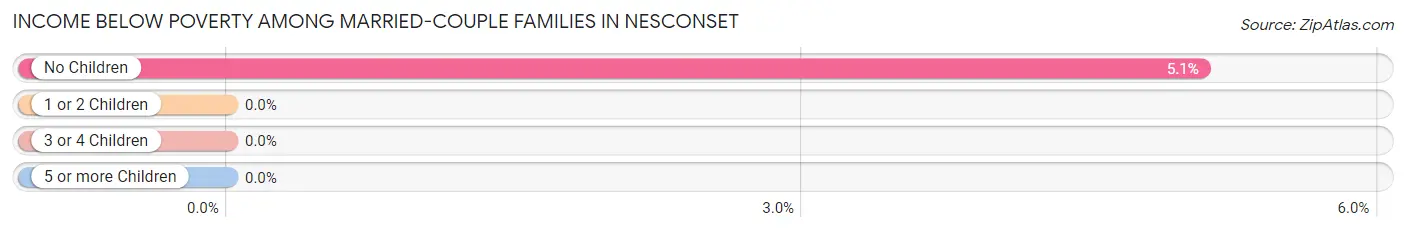
| Children | Above Poverty | Below Poverty |
| No Children | 1,718 (94.9%) | 92 (5.1%) |
| 1 or 2 Children | 1,266 (100.0%) | 0 (0.0%) |
| 3 or 4 Children | 100 (100.0%) | 0 (0.0%) |
| 5 or more Children | 0 (0.0%) | 0 (0.0%) |
| Total | 3,084 (97.1%) | 92 (2.9%) |
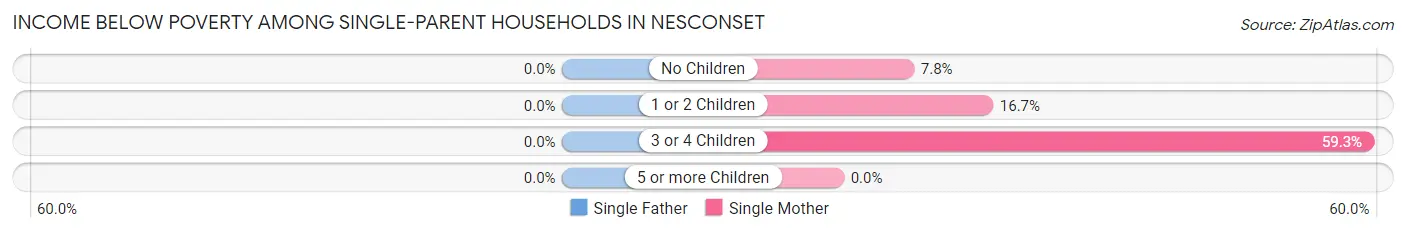
Income Below Poverty Among Single-Parent Households in Nesconset
| Children | Single Father | Single Mother |
| No Children | 0 (0.0%) | 12 (7.8%) |
| 1 or 2 Children | 0 (0.0%) | 27 (16.7%) |
| 3 or 4 Children | 0 (0.0%) | 16 (59.3%) |
| 5 or more Children | 0 (0.0%) | 0 (0.0%) |
| Total | 0 (0.0%) | 55 (16.1%) |
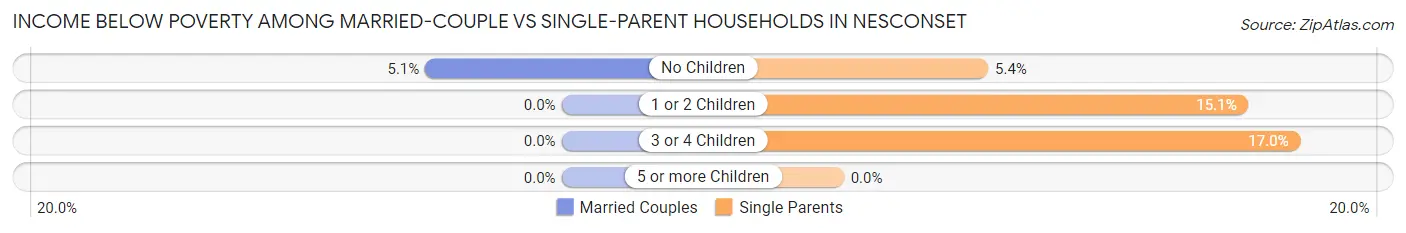
Income Below Poverty Among Married-Couple vs Single-Parent Households in Nesconset
The poverty data for Nesconset shows that 92 of the married-couple family households (2.9%) and 55 of the single-parent households (11.1%) are living below the poverty level. Within the married-couple family households, those with no children have the highest poverty rate, with 92 households (5.1%) falling below the poverty line. Among the single-parent households, those with 3 or 4 children have the highest poverty rate, with 16 household (17.0%) living below poverty.
| Children | Married-Couple Families | Single-Parent Households |
| No Children | 92 (5.1%) | 12 (5.4%) |
| 1 or 2 Children | 0 (0.0%) | 27 (15.1%) |
| 3 or 4 Children | 0 (0.0%) | 16 (17.0%) |
| 5 or more Children | 0 (0.0%) | 0 (0.0%) |
| Total | 92 (2.9%) | 55 (11.1%) |
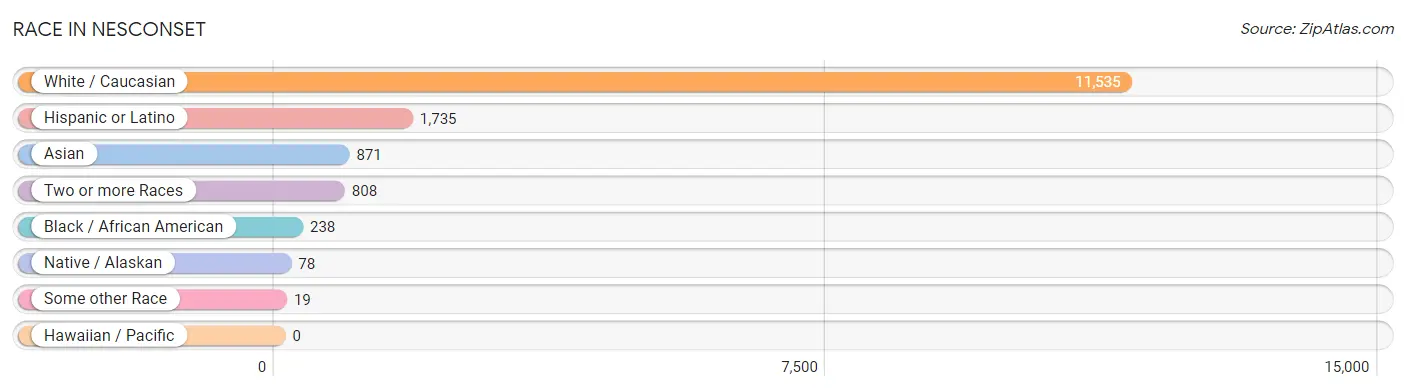
Race in Nesconset
The most populous races in Nesconset are White / Caucasian (11,535 | 85.1%), Hispanic or Latino (1,735 | 12.8%), and Asian (871 | 6.4%).
| Race | # Population | % Population |
| Asian | 871 | 6.4% |
| Black / African American | 238 | 1.8% |
| Hawaiian / Pacific | 0 | 0.0% |
| Hispanic or Latino | 1,735 | 12.8% |
| Native / Alaskan | 78 | 0.6% |
| White / Caucasian | 11,535 | 85.1% |
| Two or more Races | 808 | 6.0% |
| Some other Race | 19 | 0.1% |
| Total | 13,549 | 100.0% |
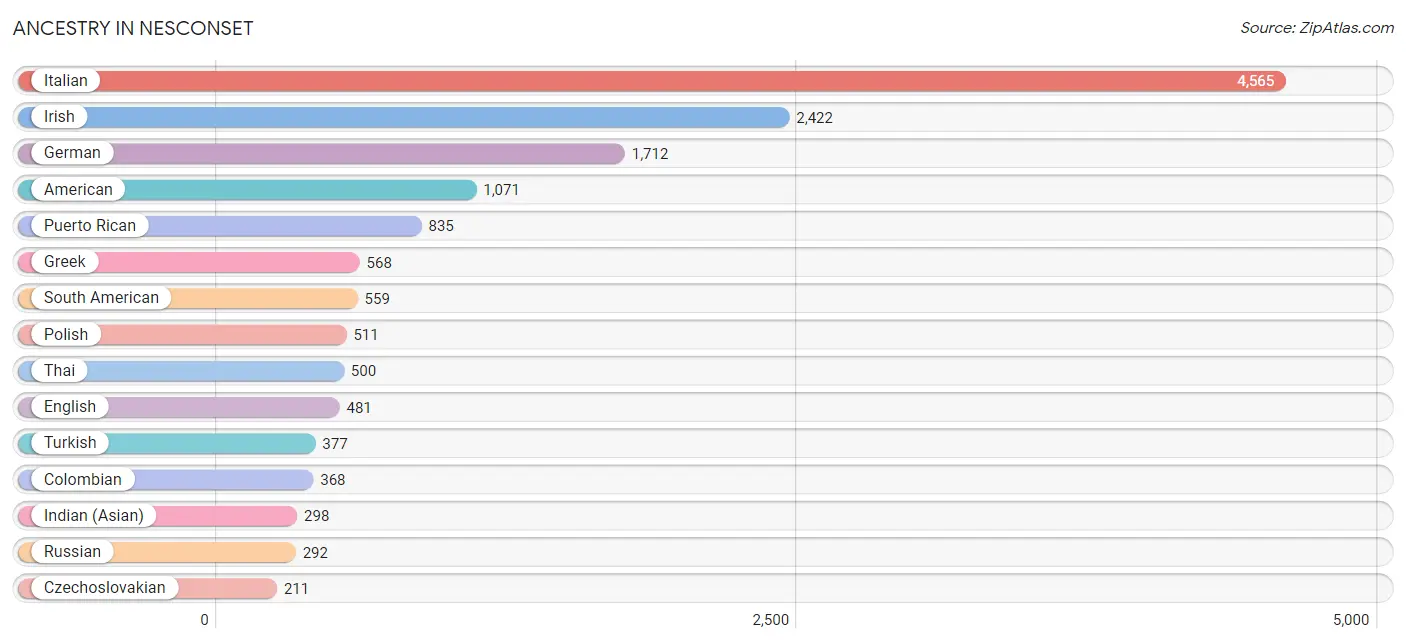
Ancestry in Nesconset
The most populous ancestries reported in Nesconset are Italian (4,565 | 33.7%), Irish (2,422 | 17.9%), German (1,712 | 12.6%), American (1,071 | 7.9%), and Puerto Rican (835 | 6.2%), together accounting for 78.3% of all Nesconset residents.
| Ancestry | # Population | % Population |
| Albanian | 16 | 0.1% |
| American | 1,071 | 7.9% |
| Arab | 104 | 0.8% |
| Armenian | 23 | 0.2% |
| Australian | 21 | 0.2% |
| Austrian | 62 | 0.5% |
| British | 62 | 0.5% |
| British West Indian | 18 | 0.1% |
| Burmese | 44 | 0.3% |
| Central American | 142 | 1.1% |
| Colombian | 368 | 2.7% |
| Croatian | 24 | 0.2% |
| Cuban | 15 | 0.1% |
| Czechoslovakian | 211 | 1.6% |
| Danish | 16 | 0.1% |
| Dominican | 23 | 0.2% |
| Dutch | 43 | 0.3% |
| Eastern European | 42 | 0.3% |
| English | 481 | 3.5% |
| European | 51 | 0.4% |
| French | 186 | 1.4% |
| French Canadian | 27 | 0.2% |
| German | 1,712 | 12.6% |
| Greek | 568 | 4.2% |
| Haitian | 167 | 1.2% |
| Hungarian | 90 | 0.7% |
| Indian (Asian) | 298 | 2.2% |
| Irish | 2,422 | 17.9% |
| Italian | 4,565 | 33.7% |
| Jamaican | 49 | 0.4% |
| Lebanese | 23 | 0.2% |
| Lithuanian | 56 | 0.4% |
| Mexican | 78 | 0.6% |
| Mexican American Indian | 126 | 0.9% |
| Norwegian | 44 | 0.3% |
| Peruvian | 175 | 1.3% |
| Polish | 511 | 3.8% |
| Portuguese | 74 | 0.5% |
| Puerto Rican | 835 | 6.2% |
| Puget Sound Salish | 5 | 0.0% |
| Romanian | 27 | 0.2% |
| Russian | 292 | 2.2% |
| Scotch-Irish | 41 | 0.3% |
| Scottish | 30 | 0.2% |
| Serbian | 72 | 0.5% |
| Sioux | 25 | 0.2% |
| Slavic | 15 | 0.1% |
| South American | 559 | 4.1% |
| Spanish | 15 | 0.1% |
| Swedish | 40 | 0.3% |
| Swiss | 33 | 0.2% |
| Thai | 500 | 3.7% |
| Trinidadian and Tobagonian | 30 | 0.2% |
| Turkish | 377 | 2.8% |
| Ukrainian | 107 | 0.8% |
| Venezuelan | 16 | 0.1% |
| Welsh | 113 | 0.8% |
| West Indian | 61 | 0.4% |
| Yugoslavian | 14 | 0.1% | View All 59 Rows |
Immigrants in Nesconset
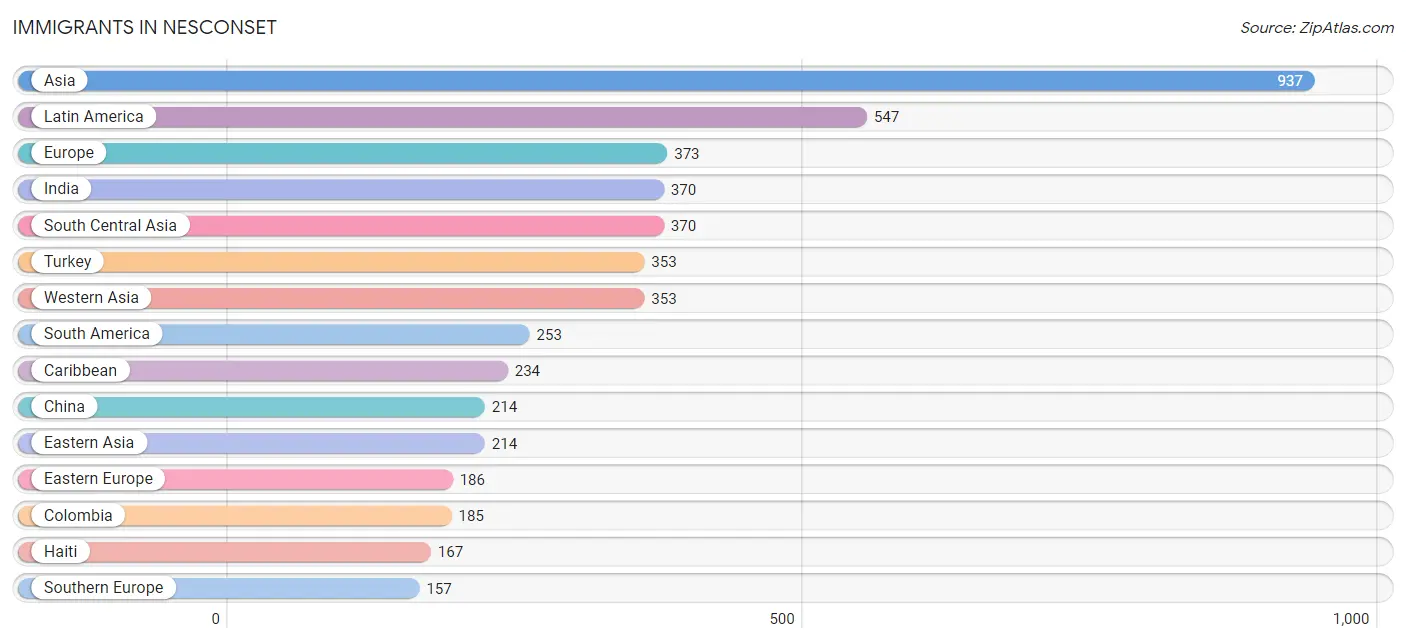
The most numerous immigrant groups reported in Nesconset came from Asia (937 | 6.9%), Latin America (547 | 4.0%), Europe (373 | 2.8%), India (370 | 2.7%), and South Central Asia (370 | 2.7%), together accounting for 19.2% of all Nesconset residents.
| Immigration Origin | # Population | % Population |
| Africa | 43 | 0.3% |
| Asia | 937 | 6.9% |
| Caribbean | 234 | 1.7% |
| Central America | 60 | 0.4% |
| China | 214 | 1.6% |
| Colombia | 185 | 1.4% |
| Dominican Republic | 4 | 0.0% |
| Eastern Asia | 214 | 1.6% |
| Eastern Europe | 186 | 1.4% |
| England | 12 | 0.1% |
| Europe | 373 | 2.8% |
| Haiti | 167 | 1.2% |
| Hungary | 45 | 0.3% |
| India | 370 | 2.7% |
| Italy | 134 | 1.0% |
| Jamaica | 33 | 0.2% |
| Latin America | 547 | 4.0% |
| Mexico | 17 | 0.1% |
| Northern Africa | 23 | 0.2% |
| Northern Europe | 30 | 0.2% |
| Peru | 52 | 0.4% |
| Poland | 46 | 0.3% |
| Portugal | 23 | 0.2% |
| Romania | 18 | 0.1% |
| Serbia | 48 | 0.4% |
| South America | 253 | 1.9% |
| South Central Asia | 370 | 2.7% |
| Southern Europe | 157 | 1.2% |
| Trinidad and Tobago | 30 | 0.2% |
| Turkey | 353 | 2.6% |
| Venezuela | 16 | 0.1% |
| Western Asia | 353 | 2.6% | View All 32 Rows |
Sex and Age in Nesconset
Sex and Age in Nesconset
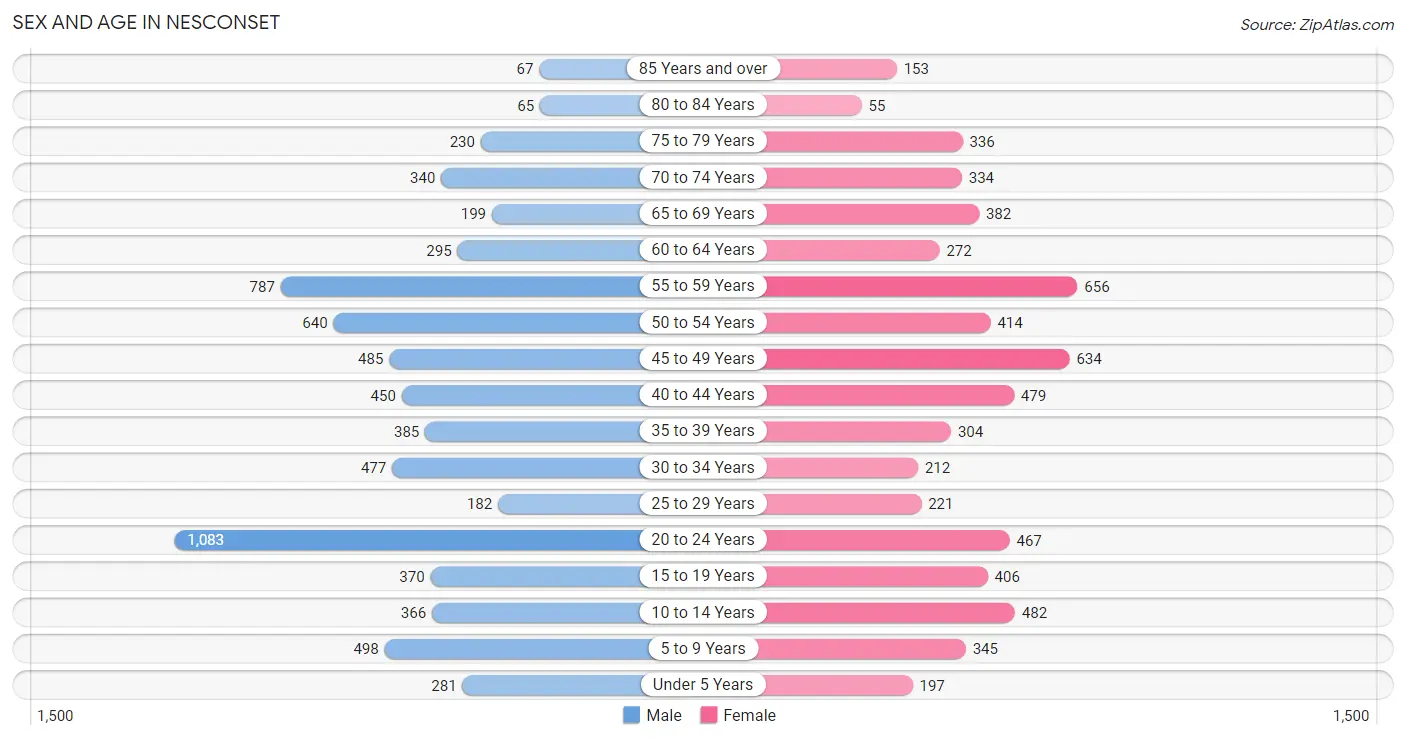
The most populous age groups in Nesconset are 20 to 24 Years (1,083 | 15.0%) for men and 55 to 59 Years (656 | 10.3%) for women.
| Age Bracket | Male | Female |
| Under 5 Years | 281 (3.9%) | 197 (3.1%) |
| 5 to 9 Years | 498 (6.9%) | 345 (5.4%) |
| 10 to 14 Years | 366 (5.1%) | 482 (7.6%) |
| 15 to 19 Years | 370 (5.1%) | 406 (6.4%) |
| 20 to 24 Years | 1,083 (15.0%) | 467 (7.4%) |
| 25 to 29 Years | 182 (2.5%) | 221 (3.5%) |
| 30 to 34 Years | 477 (6.6%) | 212 (3.3%) |
| 35 to 39 Years | 385 (5.3%) | 304 (4.8%) |
| 40 to 44 Years | 450 (6.2%) | 479 (7.5%) |
| 45 to 49 Years | 485 (6.7%) | 634 (10.0%) |
| 50 to 54 Years | 640 (8.9%) | 414 (6.5%) |
| 55 to 59 Years | 787 (10.9%) | 656 (10.3%) |
| 60 to 64 Years | 295 (4.1%) | 272 (4.3%) |
| 65 to 69 Years | 199 (2.8%) | 382 (6.0%) |
| 70 to 74 Years | 340 (4.7%) | 334 (5.3%) |
| 75 to 79 Years | 230 (3.2%) | 336 (5.3%) |
| 80 to 84 Years | 65 (0.9%) | 55 (0.9%) |
| 85 Years and over | 67 (0.9%) | 153 (2.4%) |
| Total | 7,200 (100.0%) | 6,349 (100.0%) |
Families and Households in Nesconset
Median Family Size in Nesconset
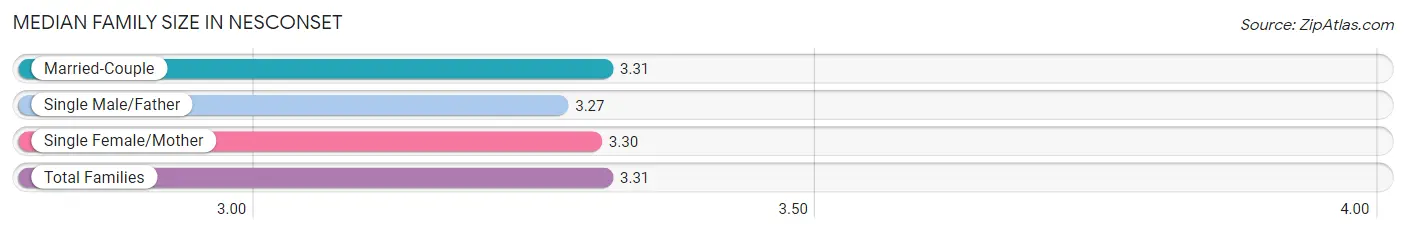
The median family size in Nesconset is 3.31 persons per family, with married-couple families (3,176 | 86.5%) accounting for the largest median family size of 3.31 persons per family. On the other hand, single male/father families (154 | 4.2%) represent the smallest median family size with 3.27 persons per family.
| Family Type | # Families | Family Size |
| Married-Couple | 3,176 (86.5%) | 3.31 |
| Single Male/Father | 154 (4.2%) | 3.27 |
| Single Female/Mother | 342 (9.3%) | 3.30 |
| Total Families | 3,672 (100.0%) | 3.31 |
Median Household Size in Nesconset
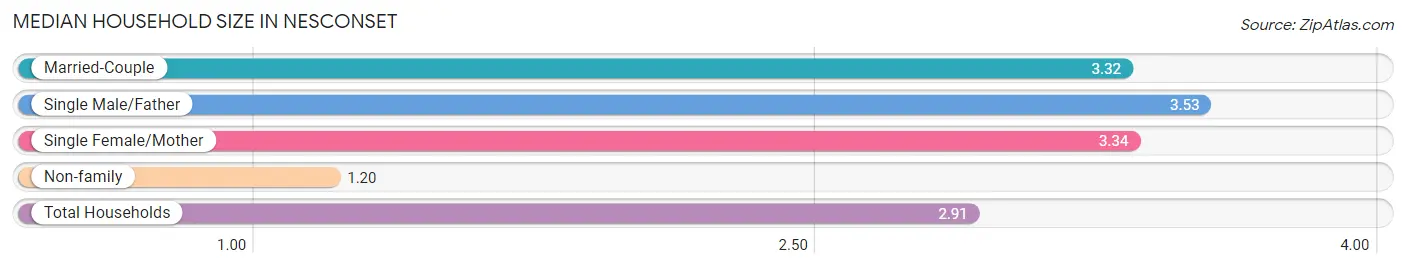
The median household size in Nesconset is 2.91 persons per household, with single male/father households (154 | 3.4%) accounting for the largest median household size of 3.53 persons per household. non-family households (900 | 19.7%) represent the smallest median household size with 1.20 persons per household.
| Household Type | # Households | Household Size |
| Married-Couple | 3,176 (69.5%) | 3.32 |
| Single Male/Father | 154 (3.4%) | 3.53 |
| Single Female/Mother | 342 (7.5%) | 3.34 |
| Non-family | 900 (19.7%) | 1.20 |
| Total Households | 4,572 (100.0%) | 2.91 |
Household Size by Marriage Status in Nesconset
Out of a total of 4,572 households in Nesconset, 3,672 (80.3%) are family households, while 900 (19.7%) are nonfamily households. The most numerous type of family households are 4-person households, comprising 1,220, and the most common type of nonfamily households are 1-person households, comprising 767.
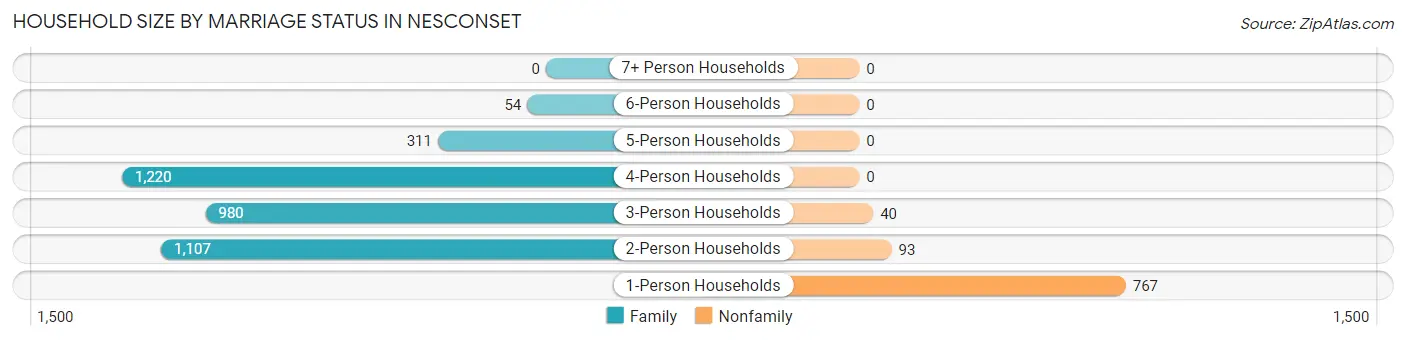
| Household Size | Family Households | Nonfamily Households |
| 1-Person Households | - | 767 (16.8%) |
| 2-Person Households | 1,107 (24.2%) | 93 (2.0%) |
| 3-Person Households | 980 (21.4%) | 40 (0.9%) |
| 4-Person Households | 1,220 (26.7%) | 0 (0.0%) |
| 5-Person Households | 311 (6.8%) | 0 (0.0%) |
| 6-Person Households | 54 (1.2%) | 0 (0.0%) |
| 7+ Person Households | 0 (0.0%) | 0 (0.0%) |
| Total | 3,672 (80.3%) | 900 (19.7%) |
Female Fertility in Nesconset
Fertility by Age in Nesconset
Average fertility rate in Nesconset is 6.0 births per 1,000 women. Women in the age bracket of 20 to 34 years have the highest fertility rate with 18.0 births per 1,000 women. Women in the age bracket of 20 to 34 years acount for 100.0% of all women with births.
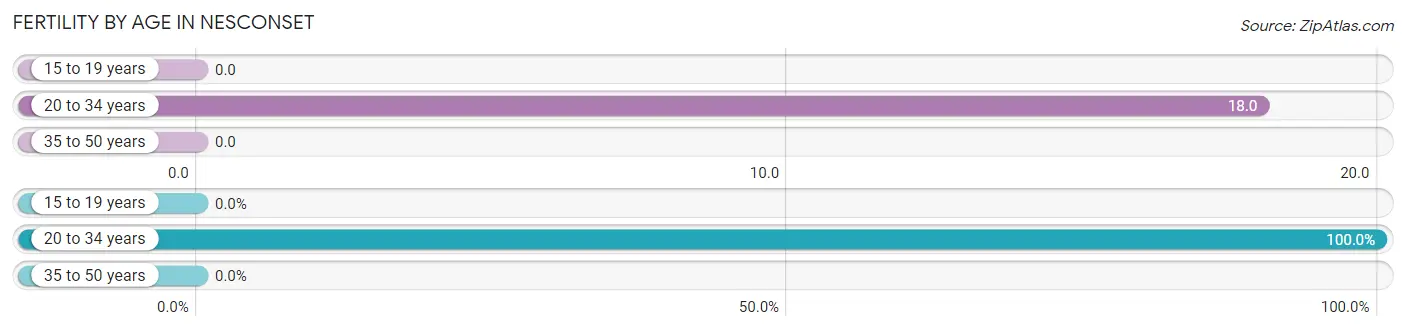
| Age Bracket | Women with Births | Births / 1,000 Women |
| 15 to 19 years | 0 (0.0%) | 0.0 |
| 20 to 34 years | 16 (100.0%) | 18.0 |
| 35 to 50 years | 0 (0.0%) | 0.0 |
| Total | 16 (100.0%) | 6.0 |
Fertility by Age by Marriage Status in Nesconset
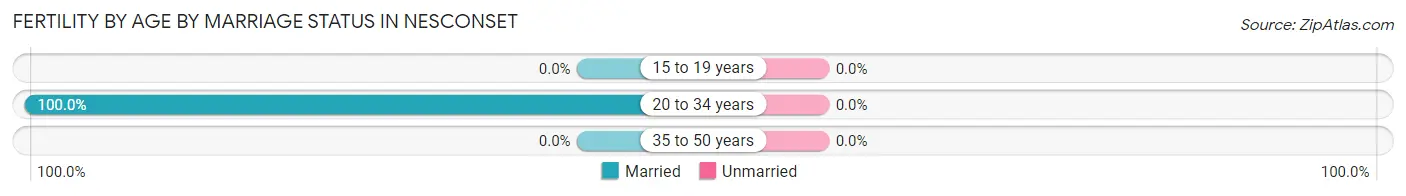
| Age Bracket | Married | Unmarried |
| 15 to 19 years | 0 (0.0%) | 0 (0.0%) |
| 20 to 34 years | 16 (100.0%) | 0 (0.0%) |
| 35 to 50 years | 0 (0.0%) | 0 (0.0%) |
| Total | 16 (100.0%) | 0 (0.0%) |
Fertility by Education in Nesconset
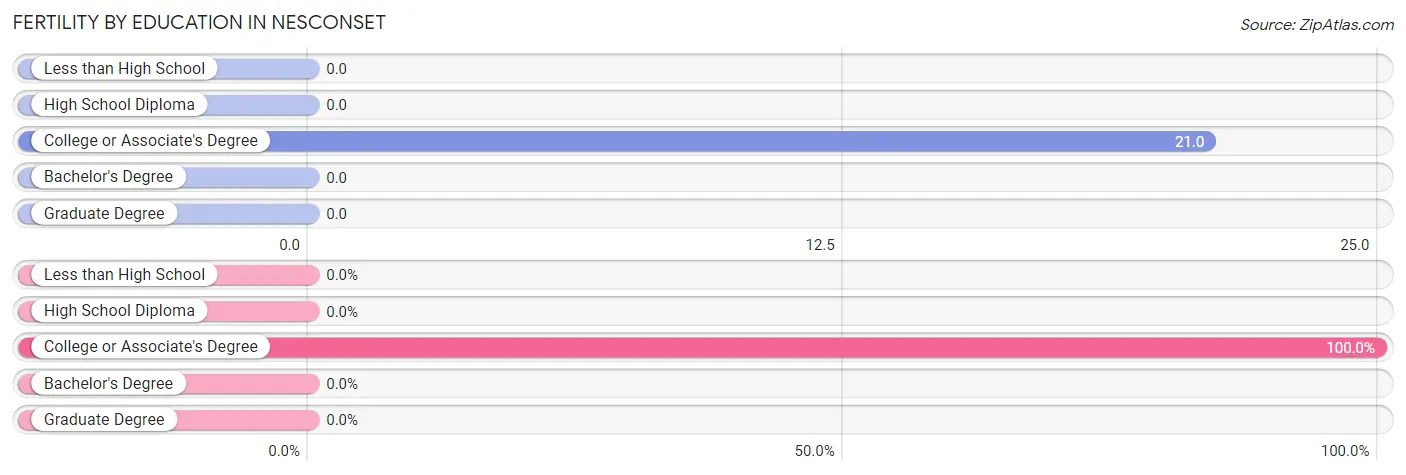
| Educational Attainment | Women with Births | Births / 1,000 Women |
| Less than High School | 0 (0.0%) | 0.0 |
| High School Diploma | 0 (0.0%) | 0.0 |
| College or Associate's Degree | 16 (100.0%) | 21.0 |
| Bachelor's Degree | 0 (0.0%) | 0.0 |
| Graduate Degree | 0 (0.0%) | 0.0 |
| Total | 16 (100.0%) | 6.0 |
Fertility by Education by Marriage Status in Nesconset
| Educational Attainment | Married | Unmarried |
| Less than High School | 0 (0.0%) | 0 (0.0%) |
| High School Diploma | 0 (0.0%) | 0 (0.0%) |
| College or Associate's Degree | 16 (100.0%) | 0 (0.0%) |
| Bachelor's Degree | 0 (0.0%) | 0 (0.0%) |
| Graduate Degree | 0 (0.0%) | 0 (0.0%) |
| Total | 16 (100.0%) | 0 (0.0%) |
Employment Characteristics in Nesconset
Employment by Class of Employer in Nesconset
Among the 7,030 employed individuals in Nesconset, private company employees (4,340 | 61.7%), local government employees (1,100 | 15.7%), and self-employed (incorporated) (507 | 7.2%) make up the most common classes of employment.
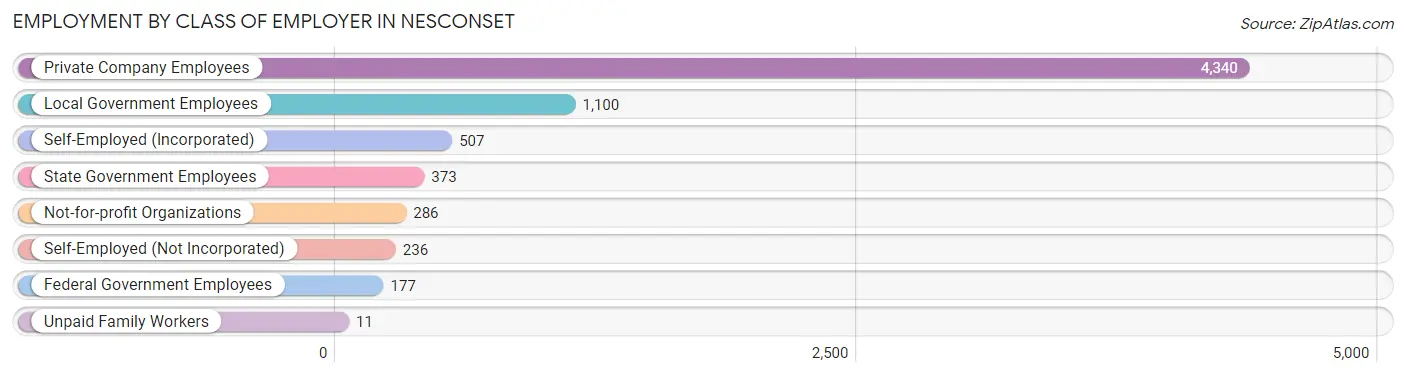
| Employer Class | # Employees | % Employees |
| Private Company Employees | 4,340 | 61.7% |
| Self-Employed (Incorporated) | 507 | 7.2% |
| Self-Employed (Not Incorporated) | 236 | 3.4% |
| Not-for-profit Organizations | 286 | 4.1% |
| Local Government Employees | 1,100 | 15.7% |
| State Government Employees | 373 | 5.3% |
| Federal Government Employees | 177 | 2.5% |
| Unpaid Family Workers | 11 | 0.2% |
| Total | 7,030 | 100.0% |
Employment Status by Age in Nesconset
According to the labor force statistics for Nesconset, out of the total population over 16 years of age (11,180), 64.3% or 7,189 individuals are in the labor force, with 1.7% or 122 of them unemployed. The age group with the highest labor force participation rate is 45 to 54 years, with 95.4% or 2,073 individuals in the labor force. Within the labor force, the 65 to 74 years age range has the highest percentage of unemployed individuals, with 15.5% or 49 of them being unemployed.
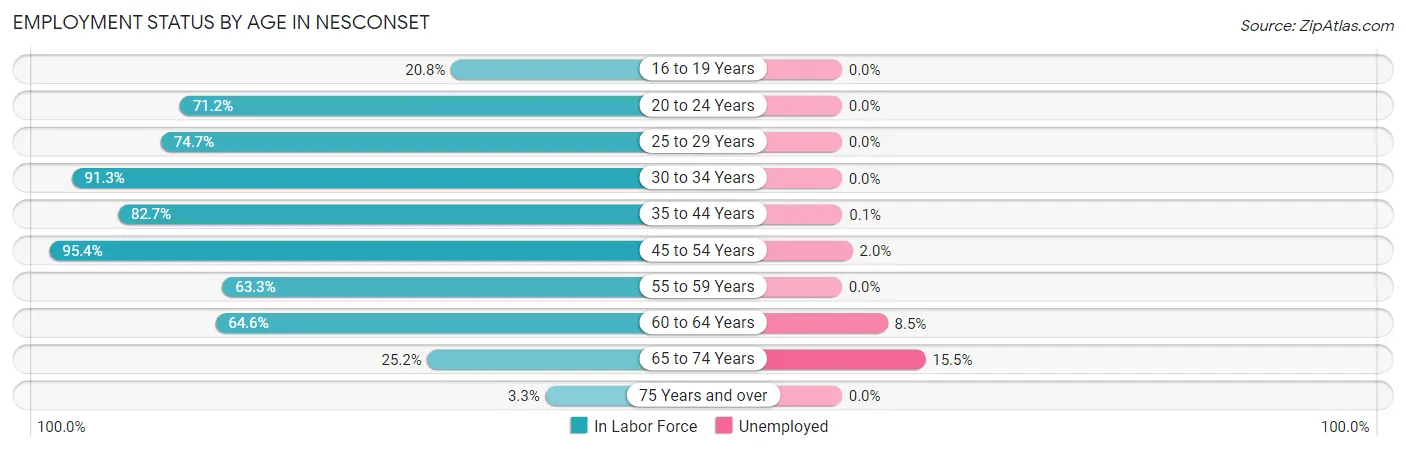
| Age Bracket | In Labor Force | Unemployed |
| 16 to 19 Years | 120 (20.8%) | 0 (0.0%) |
| 20 to 24 Years | 1,104 (71.2%) | 0 (0.0%) |
| 25 to 29 Years | 301 (74.7%) | 0 (0.0%) |
| 30 to 34 Years | 629 (91.3%) | 0 (0.0%) |
| 35 to 44 Years | 1,338 (82.7%) | 1 (0.1%) |
| 45 to 54 Years | 2,073 (95.4%) | 41 (2.0%) |
| 55 to 59 Years | 913 (63.3%) | 0 (0.0%) |
| 60 to 64 Years | 366 (64.6%) | 31 (8.5%) |
| 65 to 74 Years | 316 (25.2%) | 49 (15.5%) |
| 75 Years and over | 30 (3.3%) | 0 (0.0%) |
| Total | 7,189 (64.3%) | 122 (1.7%) |
Employment Status by Educational Attainment in Nesconset
According to labor force statistics for Nesconset, 81.5% of individuals (5,618) out of the total population between 25 and 64 years of age (6,893) are in the labor force, with 1.3% or 73 of them being unemployed. The group with the highest labor force participation rate are those with the educational attainment of bachelor's degree or higher, with 91.4% or 3,432 individuals in the labor force. Within the labor force, individuals with college / associate degree education have the highest percentage of unemployment, with 2.7% or 36 of them being unemployed.
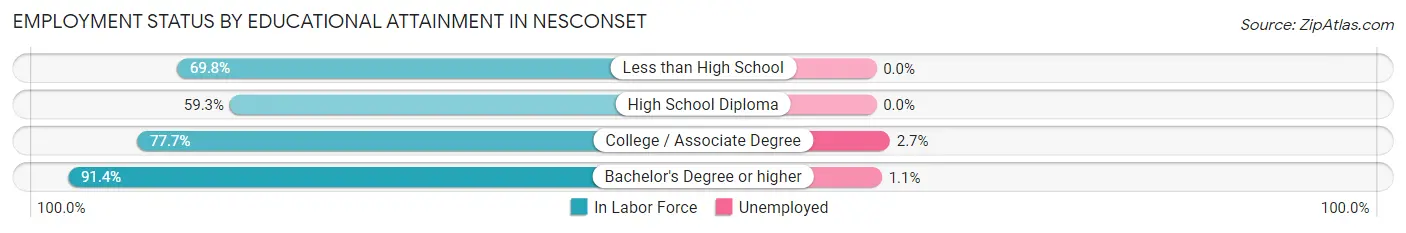
| Educational Attainment | In Labor Force | Unemployed |
| Less than High School | 111 (69.8%) | 0 (0.0%) |
| High School Diploma | 763 (59.3%) | 0 (0.0%) |
| College / Associate Degree | 1,315 (77.7%) | 46 (2.7%) |
| Bachelor's Degree or higher | 3,432 (91.4%) | 41 (1.1%) |
| Total | 5,618 (81.5%) | 90 (1.3%) |
Employment Occupations by Sex in Nesconset
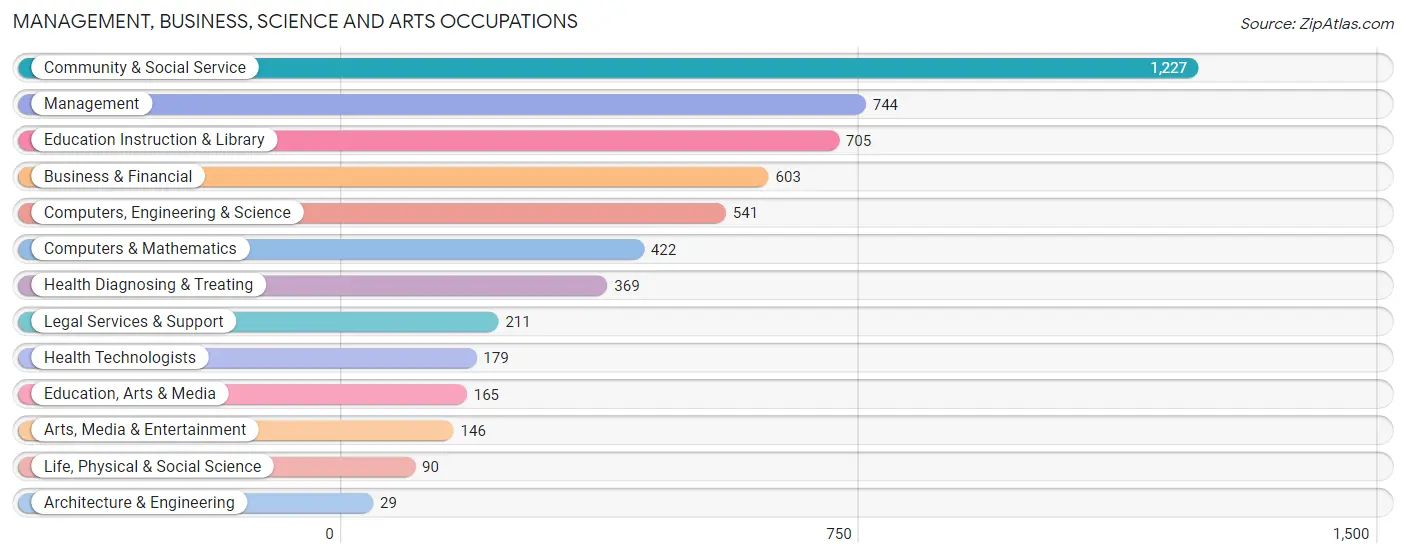
Management, Business, Science and Arts Occupations
The most common Management, Business, Science and Arts occupations in Nesconset are Community & Social Service (1,227 | 17.4%), Management (744 | 10.5%), Education Instruction & Library (705 | 10.0%), Business & Financial (603 | 8.5%), and Computers, Engineering & Science (541 | 7.7%).
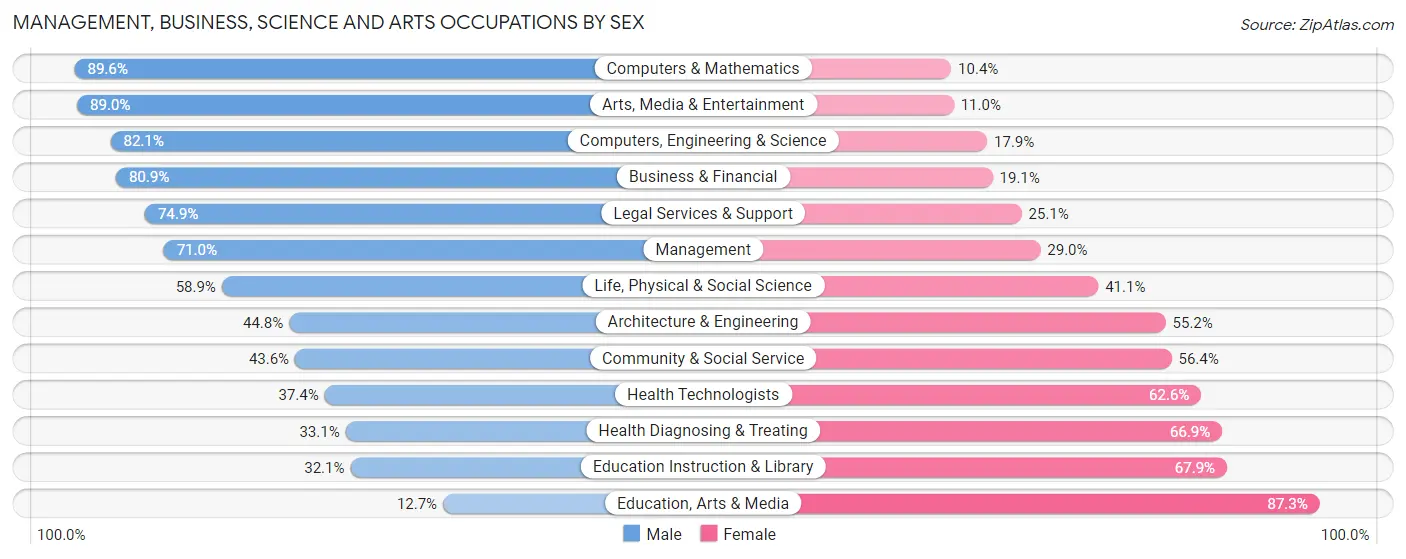
Management, Business, Science and Arts Occupations by Sex
Within the Management, Business, Science and Arts occupations in Nesconset, the most male-oriented occupations are Computers & Mathematics (89.6%), Arts, Media & Entertainment (89.0%), and Computers, Engineering & Science (82.1%), while the most female-oriented occupations are Education, Arts & Media (87.3%), Education Instruction & Library (67.9%), and Health Diagnosing & Treating (66.9%).
| Occupation | Male | Female |
| Management | 528 (71.0%) | 216 (29.0%) |
| Business & Financial | 488 (80.9%) | 115 (19.1%) |
| Computers, Engineering & Science | 444 (82.1%) | 97 (17.9%) |
| Computers & Mathematics | 378 (89.6%) | 44 (10.4%) |
| Architecture & Engineering | 13 (44.8%) | 16 (55.2%) |
| Life, Physical & Social Science | 53 (58.9%) | 37 (41.1%) |
| Community & Social Service | 535 (43.6%) | 692 (56.4%) |
| Education, Arts & Media | 21 (12.7%) | 144 (87.3%) |
| Legal Services & Support | 158 (74.9%) | 53 (25.1%) |
| Education Instruction & Library | 226 (32.1%) | 479 (67.9%) |
| Arts, Media & Entertainment | 130 (89.0%) | 16 (11.0%) |
| Health Diagnosing & Treating | 122 (33.1%) | 247 (66.9%) |
| Health Technologists | 67 (37.4%) | 112 (62.6%) |
| Total (Category) | 2,117 (60.8%) | 1,367 (39.2%) |
| Total (Overall) | 4,256 (60.2%) | 2,810 (39.8%) |
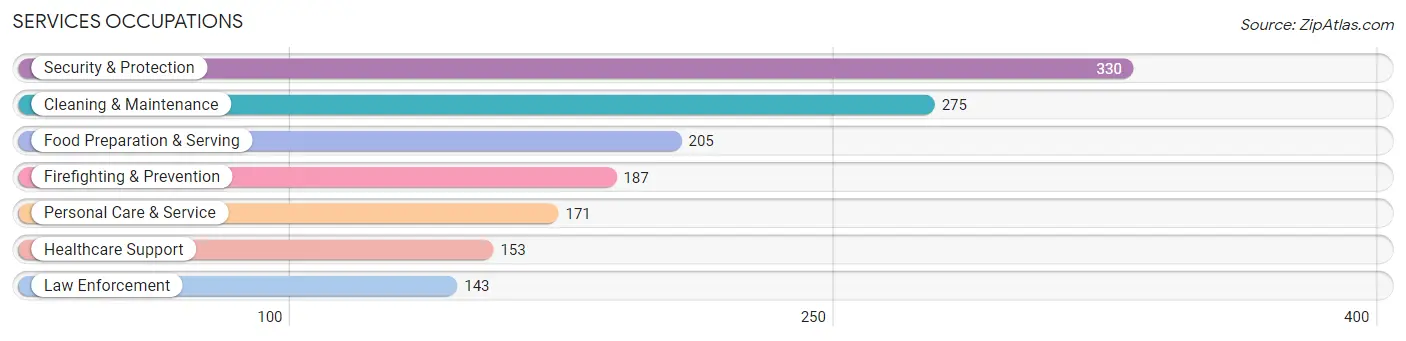
Services Occupations
The most common Services occupations in Nesconset are Security & Protection (330 | 4.7%), Cleaning & Maintenance (275 | 3.9%), Food Preparation & Serving (205 | 2.9%), Firefighting & Prevention (187 | 2.6%), and Personal Care & Service (171 | 2.4%).
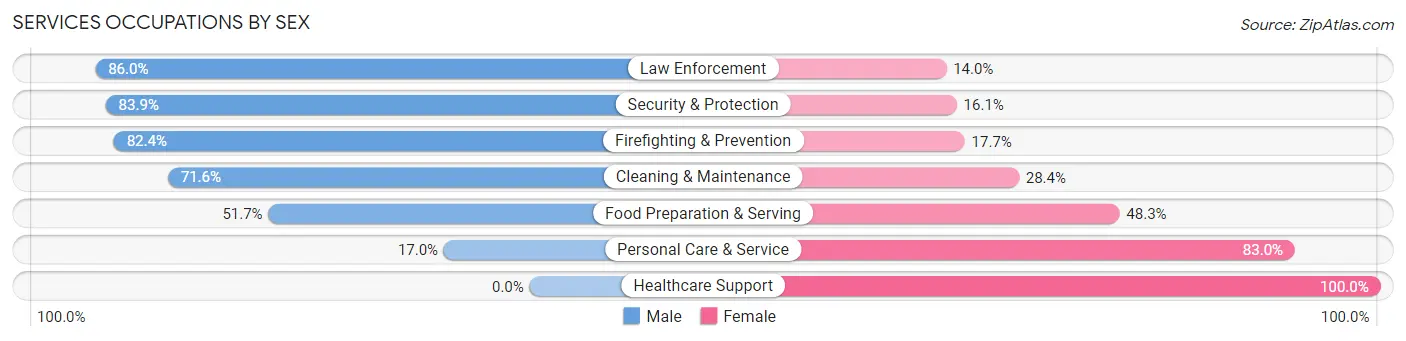
Services Occupations by Sex
Within the Services occupations in Nesconset, the most male-oriented occupations are Law Enforcement (86.0%), Security & Protection (83.9%), and Firefighting & Prevention (82.4%), while the most female-oriented occupations are Healthcare Support (100.0%), Personal Care & Service (83.0%), and Food Preparation & Serving (48.3%).
| Occupation | Male | Female |
| Healthcare Support | 0 (0.0%) | 153 (100.0%) |
| Security & Protection | 277 (83.9%) | 53 (16.1%) |
| Firefighting & Prevention | 154 (82.4%) | 33 (17.6%) |
| Law Enforcement | 123 (86.0%) | 20 (14.0%) |
| Food Preparation & Serving | 106 (51.7%) | 99 (48.3%) |
| Cleaning & Maintenance | 197 (71.6%) | 78 (28.4%) |
| Personal Care & Service | 29 (17.0%) | 142 (83.0%) |
| Total (Category) | 609 (53.7%) | 525 (46.3%) |
| Total (Overall) | 4,256 (60.2%) | 2,810 (39.8%) |
Sales and Office Occupations
The most common Sales and Office occupations in Nesconset are Office & Administration (814 | 11.5%), and Sales & Related (772 | 10.9%).
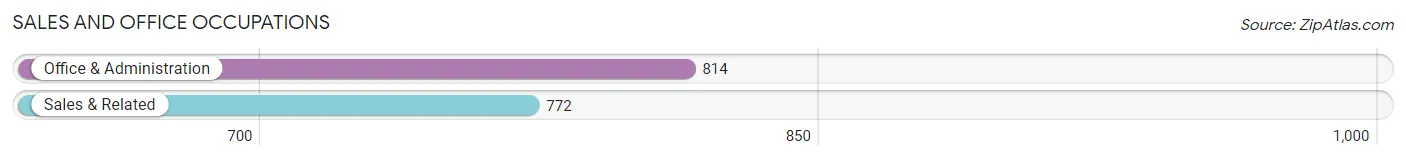
Sales and Office Occupations by Sex
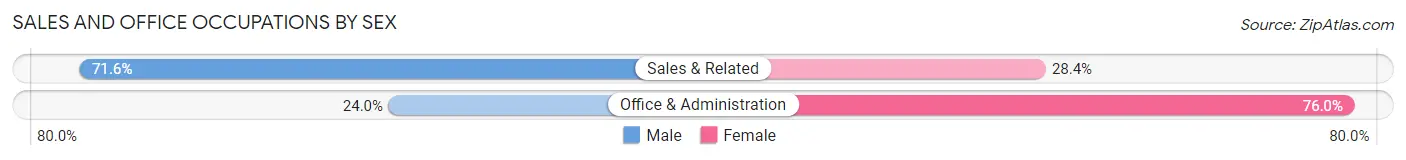
| Occupation | Male | Female |
| Sales & Related | 553 (71.6%) | 219 (28.4%) |
| Office & Administration | 195 (24.0%) | 619 (76.0%) |
| Total (Category) | 748 (47.2%) | 838 (52.8%) |
| Total (Overall) | 4,256 (60.2%) | 2,810 (39.8%) |
Natural Resources, Construction and Maintenance Occupations
The most common Natural Resources, Construction and Maintenance occupations in Nesconset are Construction & Extraction (215 | 3.0%), and Installation, Maintenance & Repair (119 | 1.7%).
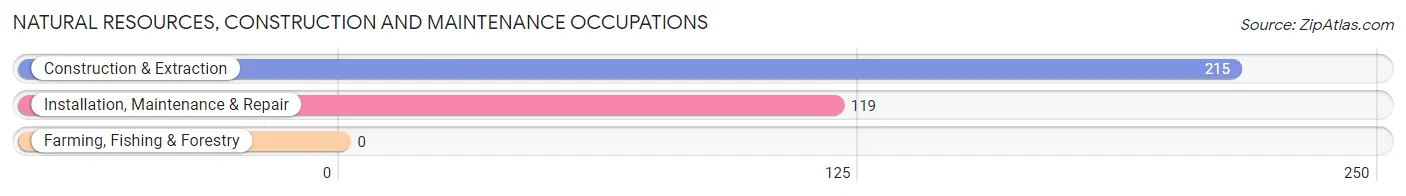
Natural Resources, Construction and Maintenance Occupations by Sex
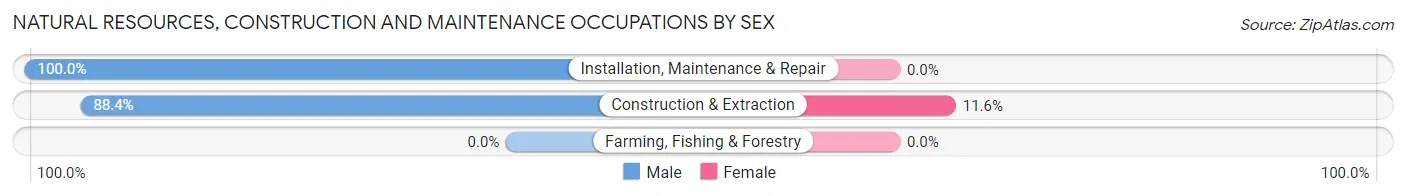
| Occupation | Male | Female |
| Farming, Fishing & Forestry | 0 (0.0%) | 0 (0.0%) |
| Construction & Extraction | 190 (88.4%) | 25 (11.6%) |
| Installation, Maintenance & Repair | 119 (100.0%) | 0 (0.0%) |
| Total (Category) | 309 (92.5%) | 25 (7.5%) |
| Total (Overall) | 4,256 (60.2%) | 2,810 (39.8%) |
Production, Transportation and Moving Occupations
The most common Production, Transportation and Moving occupations in Nesconset are Production (250 | 3.5%), Transportation (195 | 2.8%), and Material Moving (83 | 1.2%).
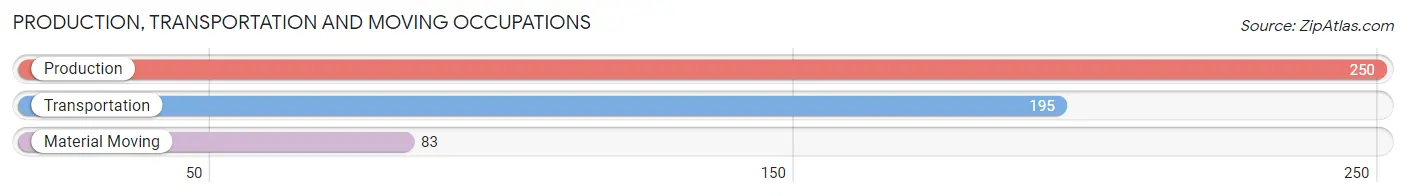
Production, Transportation and Moving Occupations by Sex
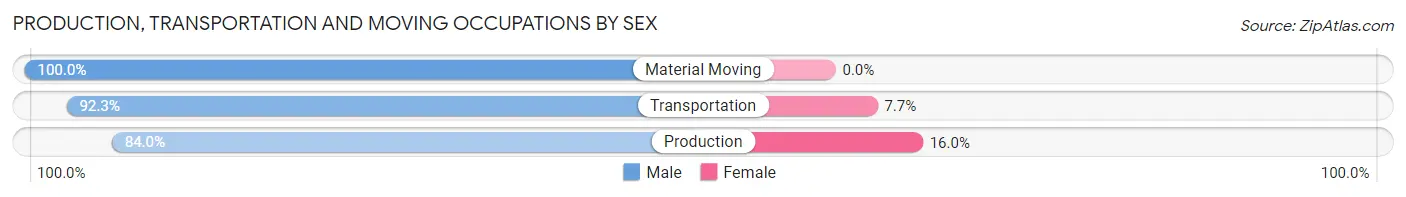
| Occupation | Male | Female |
| Production | 210 (84.0%) | 40 (16.0%) |
| Transportation | 180 (92.3%) | 15 (7.7%) |
| Material Moving | 83 (100.0%) | 0 (0.0%) |
| Total (Category) | 473 (89.6%) | 55 (10.4%) |
| Total (Overall) | 4,256 (60.2%) | 2,810 (39.8%) |
Employment Industries by Sex in Nesconset
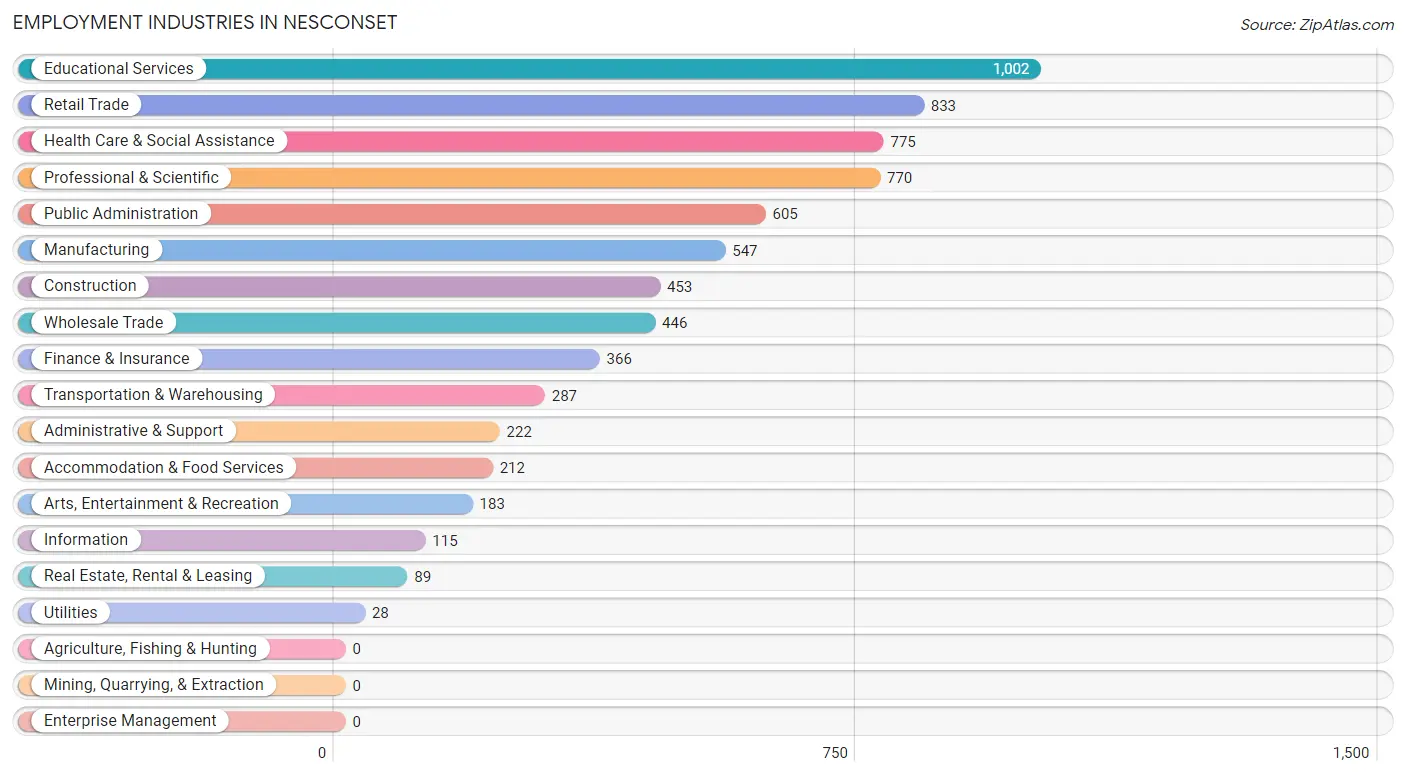
Employment Industries in Nesconset
The major employment industries in Nesconset include Educational Services (1,002 | 14.2%), Retail Trade (833 | 11.8%), Health Care & Social Assistance (775 | 11.0%), Professional & Scientific (770 | 10.9%), and Public Administration (605 | 8.6%).
Employment Industries by Sex in Nesconset
The Nesconset industries that see more men than women are Transportation & Warehousing (100.0%), Manufacturing (82.6%), and Arts, Entertainment & Recreation (82.5%), whereas the industries that tend to have a higher number of women are Educational Services (73.9%), Health Care & Social Assistance (72.7%), and Real Estate, Rental & Leasing (64.0%).
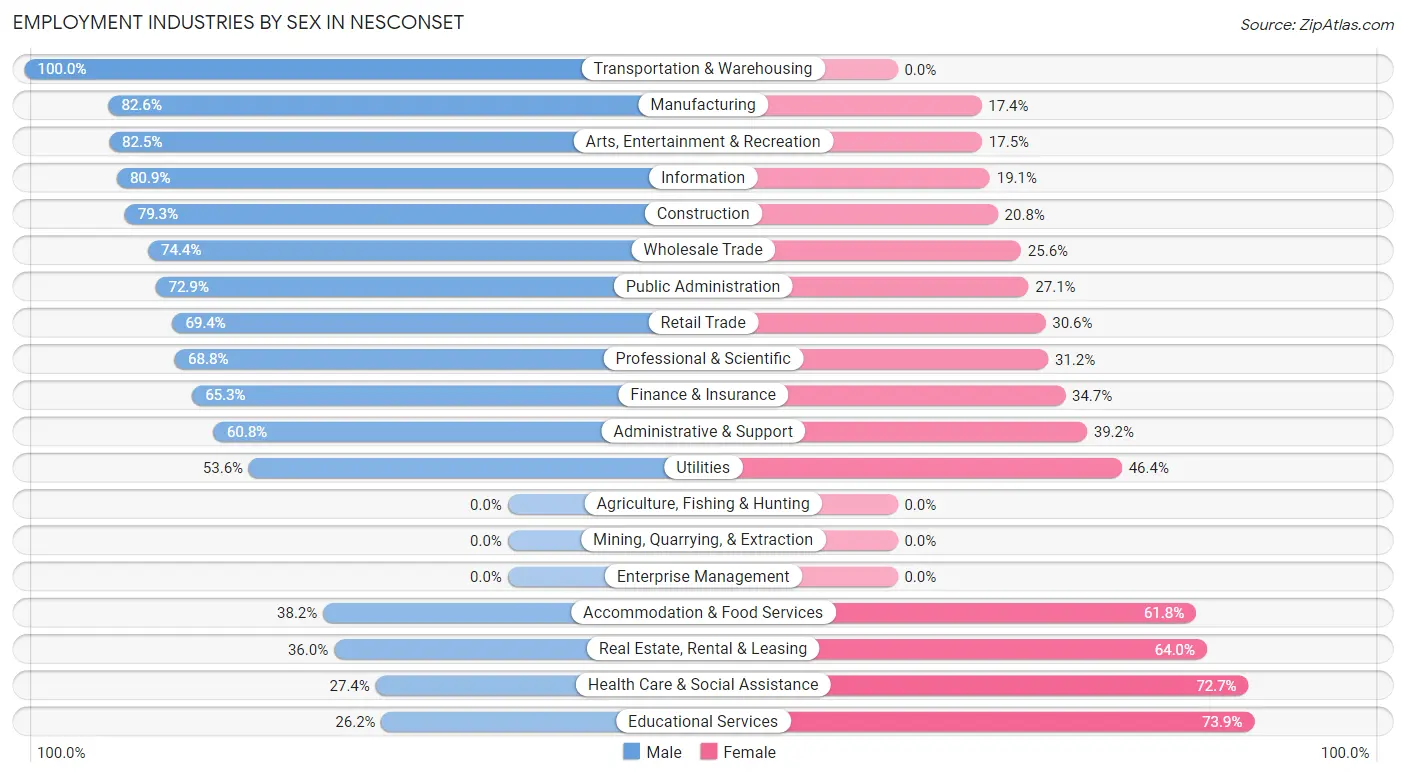
| Industry | Male | Female |
| Agriculture, Fishing & Hunting | 0 (0.0%) | 0 (0.0%) |
| Mining, Quarrying, & Extraction | 0 (0.0%) | 0 (0.0%) |
| Construction | 359 (79.2%) | 94 (20.7%) |
| Manufacturing | 452 (82.6%) | 95 (17.4%) |
| Wholesale Trade | 332 (74.4%) | 114 (25.6%) |
| Retail Trade | 578 (69.4%) | 255 (30.6%) |
| Transportation & Warehousing | 287 (100.0%) | 0 (0.0%) |
| Utilities | 15 (53.6%) | 13 (46.4%) |
| Information | 93 (80.9%) | 22 (19.1%) |
| Finance & Insurance | 239 (65.3%) | 127 (34.7%) |
| Real Estate, Rental & Leasing | 32 (36.0%) | 57 (64.0%) |
| Professional & Scientific | 530 (68.8%) | 240 (31.2%) |
| Enterprise Management | 0 (0.0%) | 0 (0.0%) |
| Administrative & Support | 135 (60.8%) | 87 (39.2%) |
| Educational Services | 262 (26.2%) | 740 (73.9%) |
| Health Care & Social Assistance | 212 (27.4%) | 563 (72.7%) |
| Arts, Entertainment & Recreation | 151 (82.5%) | 32 (17.5%) |
| Accommodation & Food Services | 81 (38.2%) | 131 (61.8%) |
| Public Administration | 441 (72.9%) | 164 (27.1%) |
| Total | 4,256 (60.2%) | 2,810 (39.8%) |
Education in Nesconset
School Enrollment in Nesconset
The most common levels of schooling among the 3,553 students in Nesconset are college / undergraduate (994 | 28.0%), high school (789 | 22.2%), and middle school (707 | 19.9%).
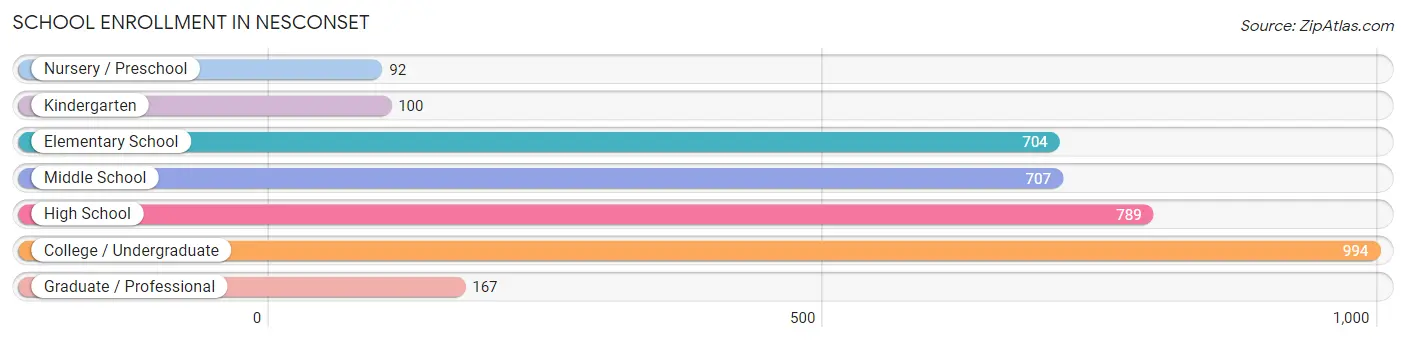
| School Level | # Students | % Students |
| Nursery / Preschool | 92 | 2.6% |
| Kindergarten | 100 | 2.8% |
| Elementary School | 704 | 19.8% |
| Middle School | 707 | 19.9% |
| High School | 789 | 22.2% |
| College / Undergraduate | 994 | 28.0% |
| Graduate / Professional | 167 | 4.7% |
| Total | 3,553 | 100.0% |
School Enrollment by Age by Funding Source in Nesconset
Out of a total of 3,553 students who are enrolled in schools in Nesconset, 412 (11.6%) attend a private institution, while the remaining 3,141 (88.4%) are enrolled in public schools. The age group of 3 to 4 year olds has the highest likelihood of being enrolled in private schools, with 32 (50.0% in the age bracket) enrolled. Conversely, the age group of 25 to 34 year olds has the lowest likelihood of being enrolled in a private school, with 141 (100.0% in the age bracket) attending a public institution.
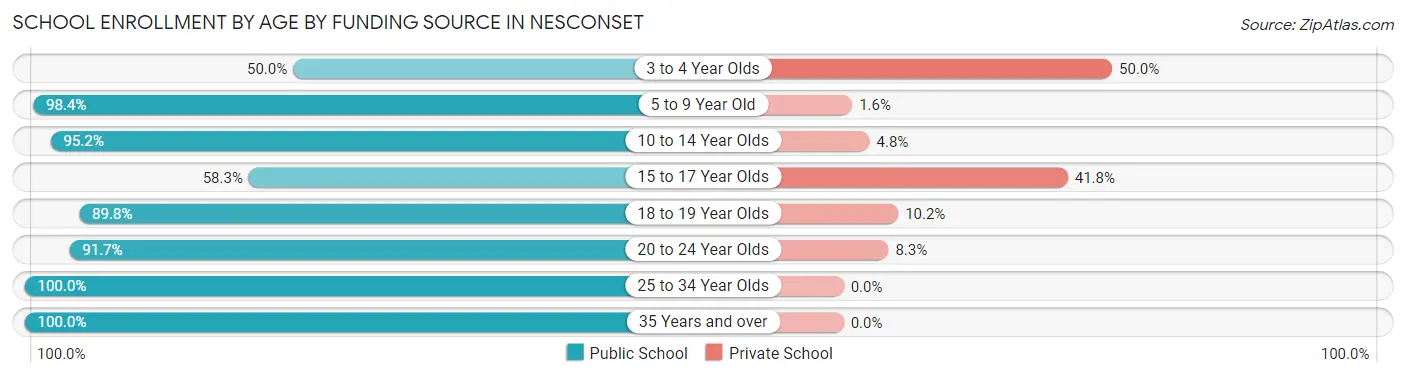
| Age Bracket | Public School | Private School |
| 3 to 4 Year Olds | 32 (50.0%) | 32 (50.0%) |
| 5 to 9 Year Old | 799 (98.4%) | 13 (1.6%) |
| 10 to 14 Year Olds | 807 (95.2%) | 41 (4.8%) |
| 15 to 17 Year Olds | 332 (58.3%) | 238 (41.7%) |
| 18 to 19 Year Olds | 115 (89.8%) | 13 (10.2%) |
| 20 to 24 Year Olds | 824 (91.7%) | 75 (8.3%) |
| 25 to 34 Year Olds | 141 (100.0%) | 0 (0.0%) |
| 35 Years and over | 91 (100.0%) | 0 (0.0%) |
| Total | 3,141 (88.4%) | 412 (11.6%) |
Educational Attainment by Field of Study in Nesconset
Business (966 | 20.0%), education (707 | 14.7%), social sciences (417 | 8.6%), engineering (413 | 8.6%), and psychology (405 | 8.4%) are the most common fields of study among 4,824 individuals in Nesconset who have obtained a bachelor's degree or higher.
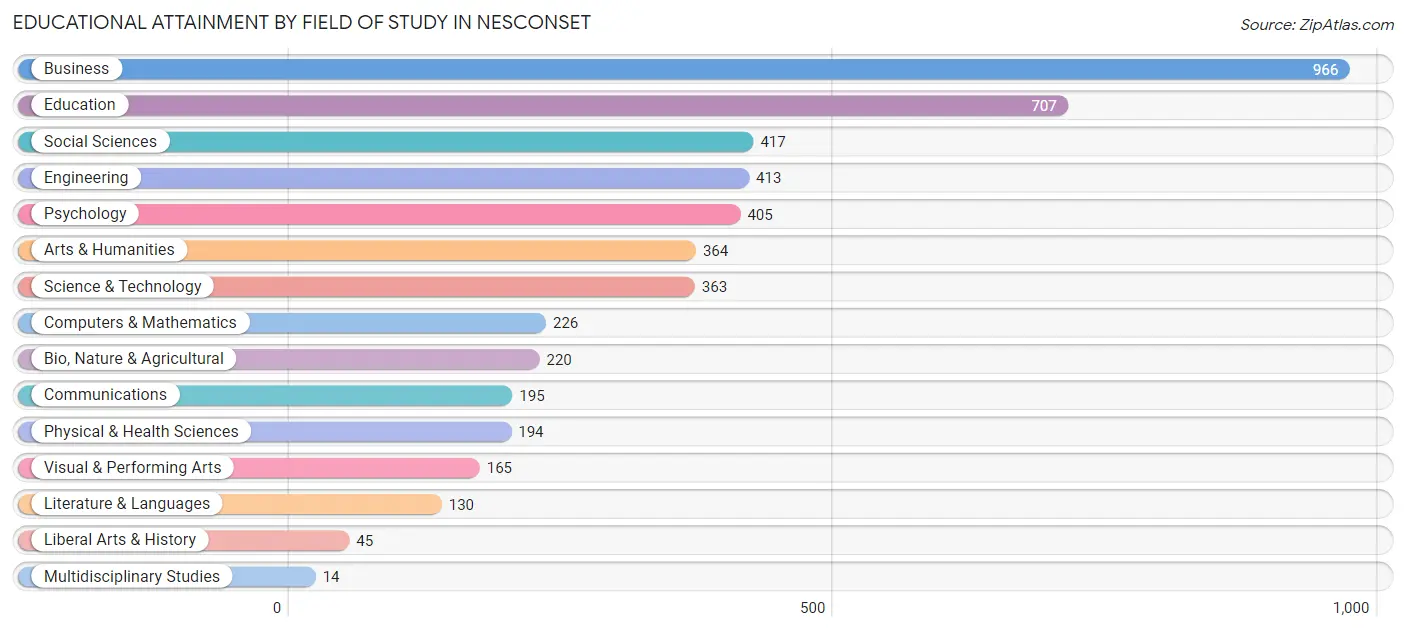
| Field of Study | # Graduates | % Graduates |
| Computers & Mathematics | 226 | 4.7% |
| Bio, Nature & Agricultural | 220 | 4.6% |
| Physical & Health Sciences | 194 | 4.0% |
| Psychology | 405 | 8.4% |
| Social Sciences | 417 | 8.6% |
| Engineering | 413 | 8.6% |
| Multidisciplinary Studies | 14 | 0.3% |
| Science & Technology | 363 | 7.5% |
| Business | 966 | 20.0% |
| Education | 707 | 14.7% |
| Literature & Languages | 130 | 2.7% |
| Liberal Arts & History | 45 | 0.9% |
| Visual & Performing Arts | 165 | 3.4% |
| Communications | 195 | 4.0% |
| Arts & Humanities | 364 | 7.5% |
| Total | 4,824 | 100.0% |
Transportation & Commute in Nesconset
Vehicle Availability by Sex in Nesconset
The most prevalent vehicle ownership categories in Nesconset are males with 2 vehicles (1,505, accounting for 35.4%) and females with 2 vehicles (982, making up 54.2%).
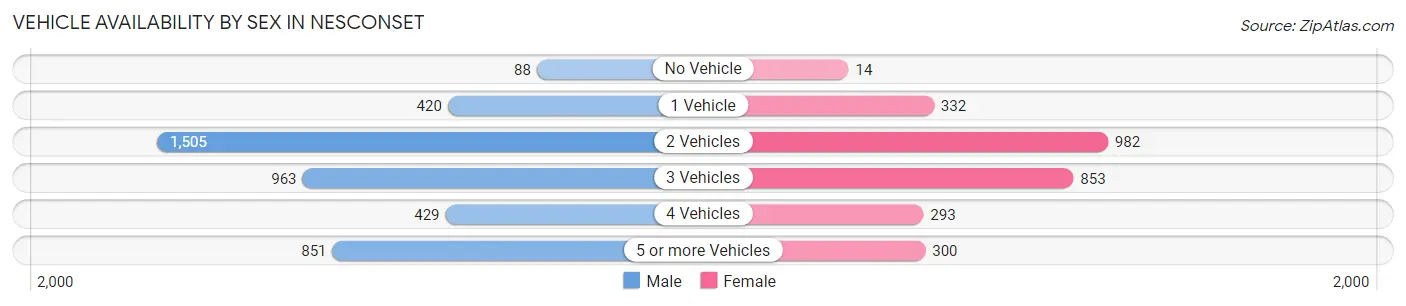
| Vehicles Available | Male | Female |
| No Vehicle | 88 (2.1%) | 14 (0.5%) |
| 1 Vehicle | 420 (9.9%) | 332 (12.0%) |
| 2 Vehicles | 1,505 (35.4%) | 982 (35.4%) |
| 3 Vehicles | 963 (22.6%) | 853 (30.7%) |
| 4 Vehicles | 429 (10.1%) | 293 (10.6%) |
| 5 or more Vehicles | 851 (20.0%) | 300 (10.8%) |
| Total | 4,256 (100.0%) | 2,774 (100.0%) |
Commute Time in Nesconset
The most frequently occuring commute durations in Nesconset are 20 to 24 minutes (1,054 commuters, 17.1%), 15 to 19 minutes (795 commuters, 12.9%), and 90 or more minutes (763 commuters, 12.4%).
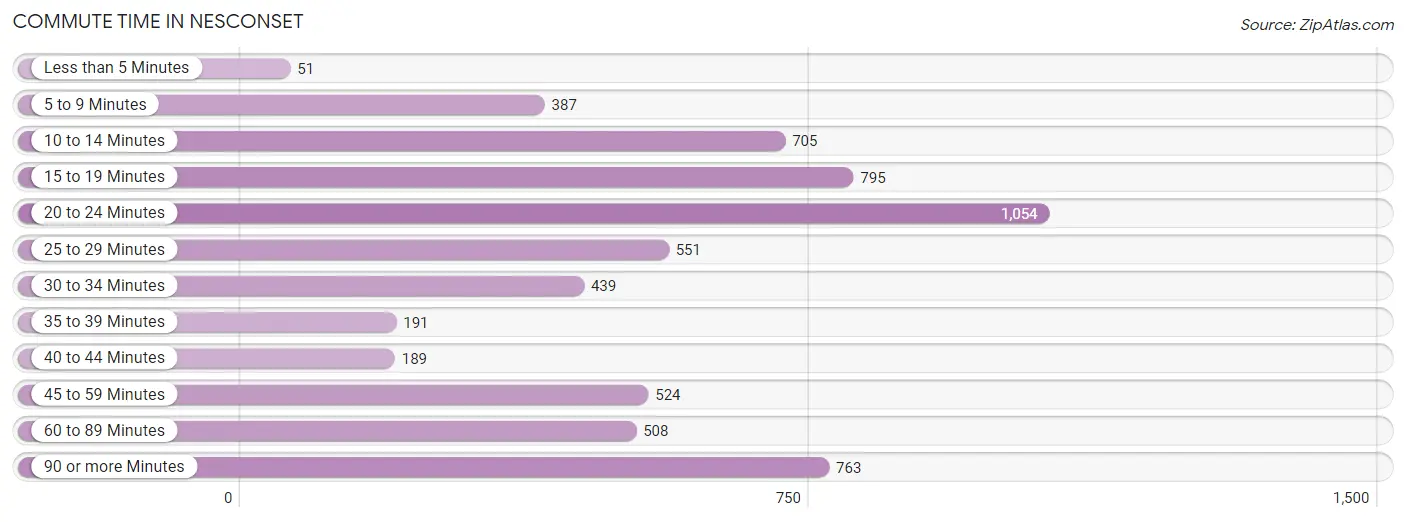
| Commute Time | # Commuters | % Commuters |
| Less than 5 Minutes | 51 | 0.8% |
| 5 to 9 Minutes | 387 | 6.3% |
| 10 to 14 Minutes | 705 | 11.5% |
| 15 to 19 Minutes | 795 | 12.9% |
| 20 to 24 Minutes | 1,054 | 17.1% |
| 25 to 29 Minutes | 551 | 8.9% |
| 30 to 34 Minutes | 439 | 7.1% |
| 35 to 39 Minutes | 191 | 3.1% |
| 40 to 44 Minutes | 189 | 3.1% |
| 45 to 59 Minutes | 524 | 8.5% |
| 60 to 89 Minutes | 508 | 8.3% |
| 90 or more Minutes | 763 | 12.4% |
Commute Time by Sex in Nesconset
The most common commute times in Nesconset are 20 to 24 minutes (655 commuters, 18.2%) for males and 15 to 19 minutes (466 commuters, 18.2%) for females.
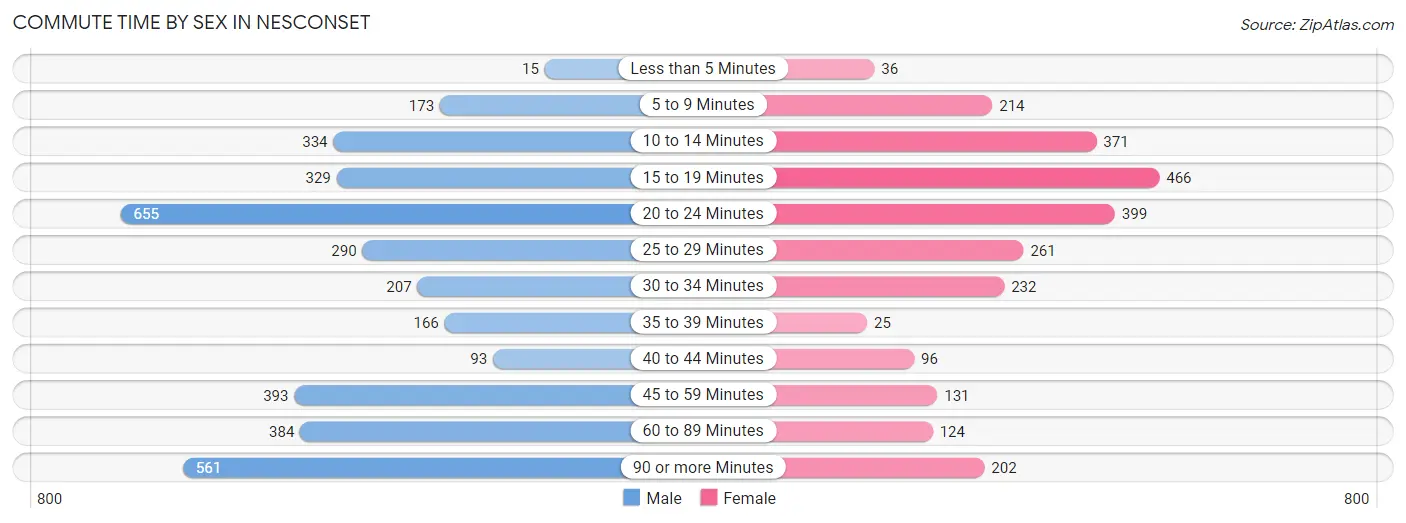
| Commute Time | Male | Female |
| Less than 5 Minutes | 15 (0.4%) | 36 (1.4%) |
| 5 to 9 Minutes | 173 (4.8%) | 214 (8.4%) |
| 10 to 14 Minutes | 334 (9.3%) | 371 (14.5%) |
| 15 to 19 Minutes | 329 (9.1%) | 466 (18.2%) |
| 20 to 24 Minutes | 655 (18.2%) | 399 (15.6%) |
| 25 to 29 Minutes | 290 (8.1%) | 261 (10.2%) |
| 30 to 34 Minutes | 207 (5.8%) | 232 (9.1%) |
| 35 to 39 Minutes | 166 (4.6%) | 25 (1.0%) |
| 40 to 44 Minutes | 93 (2.6%) | 96 (3.7%) |
| 45 to 59 Minutes | 393 (10.9%) | 131 (5.1%) |
| 60 to 89 Minutes | 384 (10.7%) | 124 (4.9%) |
| 90 or more Minutes | 561 (15.6%) | 202 (7.9%) |
Time of Departure to Work by Sex in Nesconset
The most frequent times of departure to work in Nesconset are 7:00 AM to 7:29 AM (560, 15.6%) for males and 7:30 AM to 7:59 AM (376, 14.7%) for females.
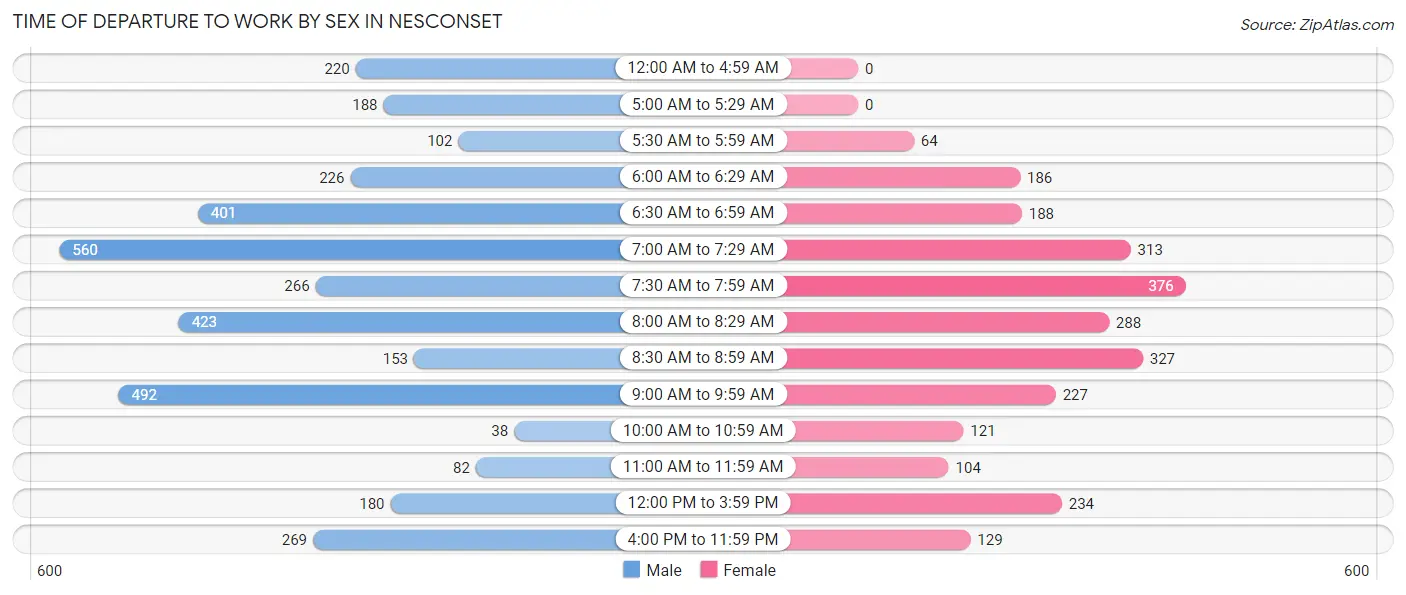
| Time of Departure | Male | Female |
| 12:00 AM to 4:59 AM | 220 (6.1%) | 0 (0.0%) |
| 5:00 AM to 5:29 AM | 188 (5.2%) | 0 (0.0%) |
| 5:30 AM to 5:59 AM | 102 (2.8%) | 64 (2.5%) |
| 6:00 AM to 6:29 AM | 226 (6.3%) | 186 (7.3%) |
| 6:30 AM to 6:59 AM | 401 (11.1%) | 188 (7.3%) |
| 7:00 AM to 7:29 AM | 560 (15.6%) | 313 (12.2%) |
| 7:30 AM to 7:59 AM | 266 (7.4%) | 376 (14.7%) |
| 8:00 AM to 8:29 AM | 423 (11.7%) | 288 (11.3%) |
| 8:30 AM to 8:59 AM | 153 (4.3%) | 327 (12.8%) |
| 9:00 AM to 9:59 AM | 492 (13.7%) | 227 (8.9%) |
| 10:00 AM to 10:59 AM | 38 (1.1%) | 121 (4.7%) |
| 11:00 AM to 11:59 AM | 82 (2.3%) | 104 (4.1%) |
| 12:00 PM to 3:59 PM | 180 (5.0%) | 234 (9.1%) |
| 4:00 PM to 11:59 PM | 269 (7.5%) | 129 (5.0%) |
| Total | 3,600 (100.0%) | 2,557 (100.0%) |
Housing Occupancy in Nesconset
Occupancy by Ownership in Nesconset
Of the total 4,572 dwellings in Nesconset, owner-occupied units account for 3,814 (83.4%), while renter-occupied units make up 758 (16.6%).
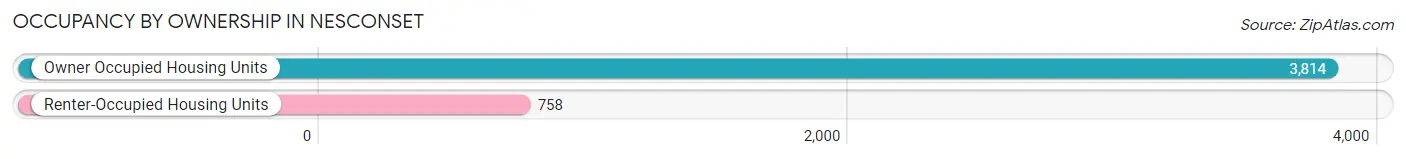
| Occupancy | # Housing Units | % Housing Units |
| Owner Occupied Housing Units | 3,814 | 83.4% |
| Renter-Occupied Housing Units | 758 | 16.6% |
| Total Occupied Housing Units | 4,572 | 100.0% |
Occupancy by Household Size in Nesconset
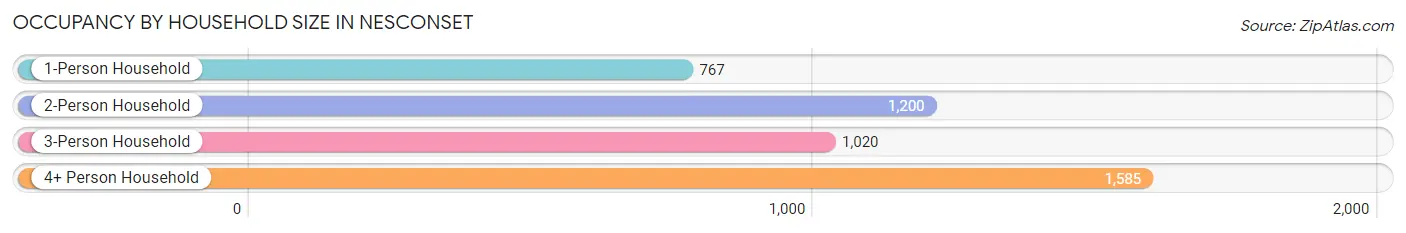
| Household Size | # Housing Units | % Housing Units |
| 1-Person Household | 767 | 16.8% |
| 2-Person Household | 1,200 | 26.3% |
| 3-Person Household | 1,020 | 22.3% |
| 4+ Person Household | 1,585 | 34.7% |
| Total Housing Units | 4,572 | 100.0% |
Occupancy by Ownership by Household Size in Nesconset
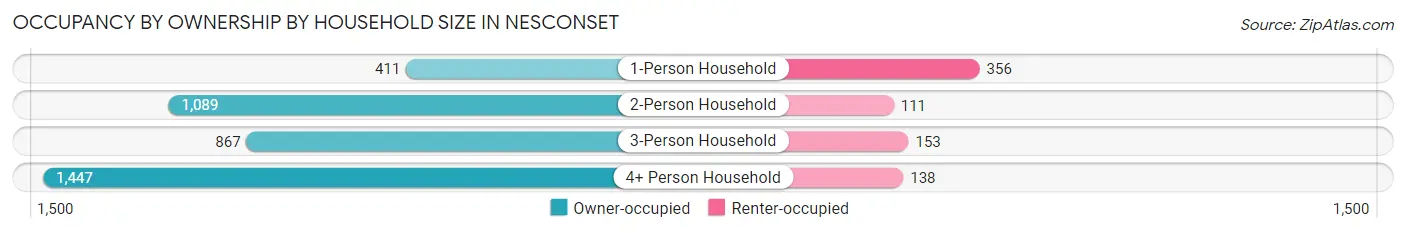
| Household Size | Owner-occupied | Renter-occupied |
| 1-Person Household | 411 (53.6%) | 356 (46.4%) |
| 2-Person Household | 1,089 (90.7%) | 111 (9.2%) |
| 3-Person Household | 867 (85.0%) | 153 (15.0%) |
| 4+ Person Household | 1,447 (91.3%) | 138 (8.7%) |
| Total Housing Units | 3,814 (83.4%) | 758 (16.6%) |
Occupancy by Educational Attainment in Nesconset
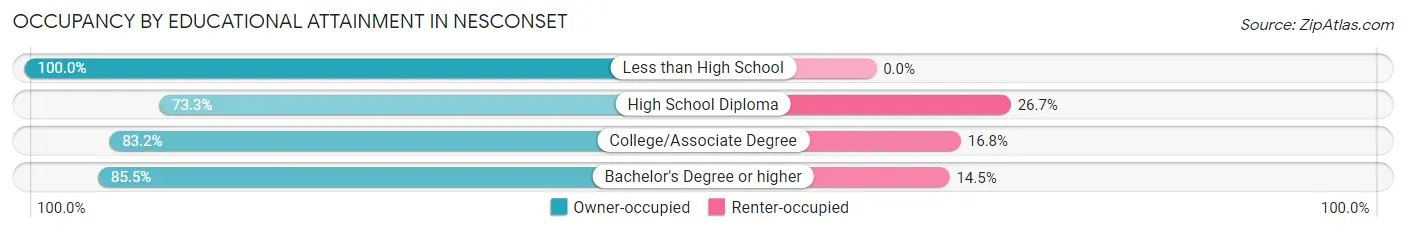
| Household Size | Owner-occupied | Renter-occupied |
| Less than High School | 116 (100.0%) | 0 (0.0%) |
| High School Diploma | 484 (73.3%) | 176 (26.7%) |
| College/Associate Degree | 1,110 (83.2%) | 224 (16.8%) |
| Bachelor's Degree or higher | 2,104 (85.5%) | 358 (14.5%) |
Occupancy by Age of Householder in Nesconset
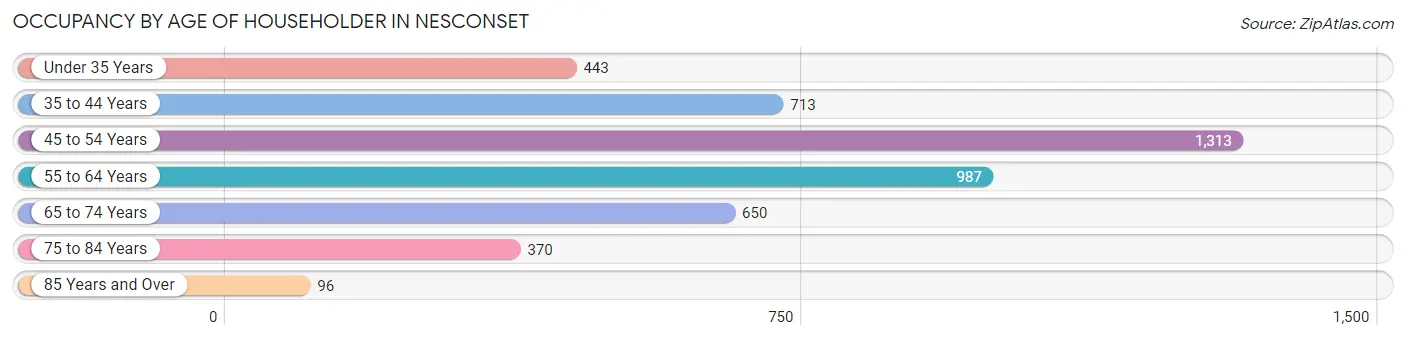
| Age Bracket | # Households | % Households |
| Under 35 Years | 443 | 9.7% |
| 35 to 44 Years | 713 | 15.6% |
| 45 to 54 Years | 1,313 | 28.7% |
| 55 to 64 Years | 987 | 21.6% |
| 65 to 74 Years | 650 | 14.2% |
| 75 to 84 Years | 370 | 8.1% |
| 85 Years and Over | 96 | 2.1% |
| Total | 4,572 | 100.0% |
Housing Finances in Nesconset
Median Income by Occupancy in Nesconset
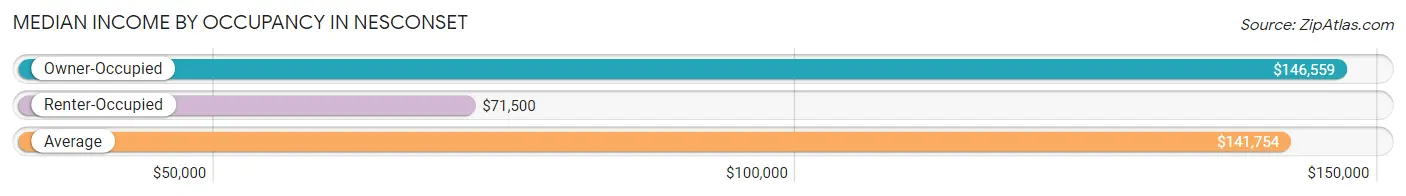
| Occupancy Type | # Households | Median Income |
| Owner-Occupied | 3,814 (83.4%) | $146,559 |
| Renter-Occupied | 758 (16.6%) | $71,500 |
| Average | 4,572 (100.0%) | $141,754 |
Occupancy by Householder Income Bracket in Nesconset
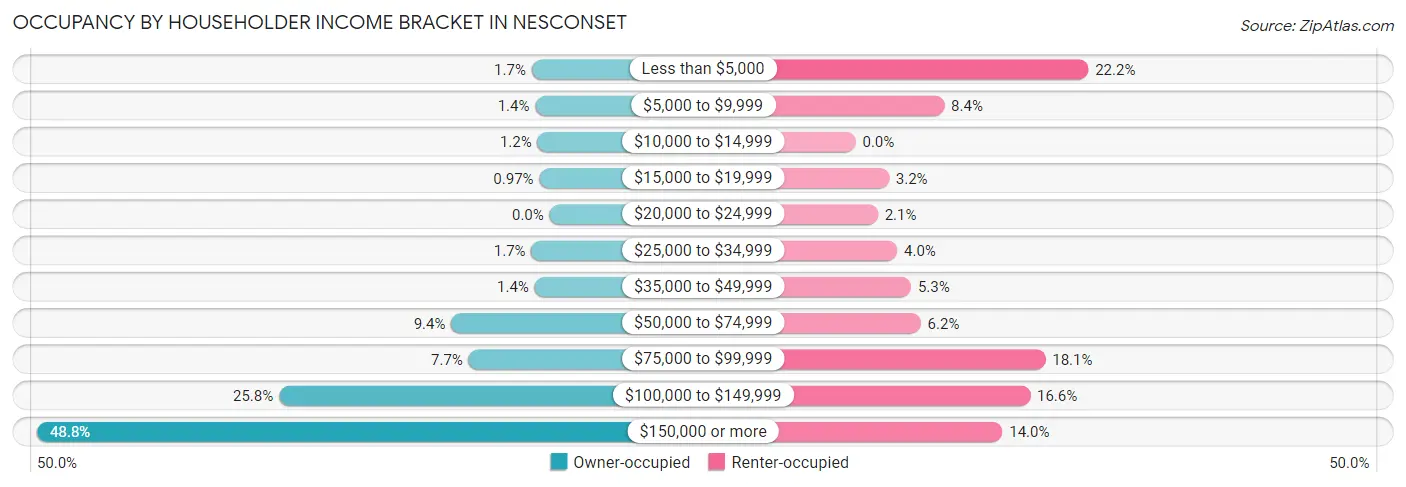
| Income Bracket | Owner-occupied | Renter-occupied |
| Less than $5,000 | 65 (1.7%) | 168 (22.2%) |
| $5,000 to $9,999 | 52 (1.4%) | 64 (8.4%) |
| $10,000 to $14,999 | 44 (1.1%) | 0 (0.0%) |
| $15,000 to $19,999 | 37 (1.0%) | 24 (3.2%) |
| $20,000 to $24,999 | 0 (0.0%) | 16 (2.1%) |
| $25,000 to $34,999 | 66 (1.7%) | 30 (4.0%) |
| $35,000 to $49,999 | 54 (1.4%) | 40 (5.3%) |
| $50,000 to $74,999 | 357 (9.4%) | 47 (6.2%) |
| $75,000 to $99,999 | 294 (7.7%) | 137 (18.1%) |
| $100,000 to $149,999 | 983 (25.8%) | 126 (16.6%) |
| $150,000 or more | 1,862 (48.8%) | 106 (14.0%) |
| Total | 3,814 (100.0%) | 758 (100.0%) |
Monthly Housing Cost Tiers in Nesconset
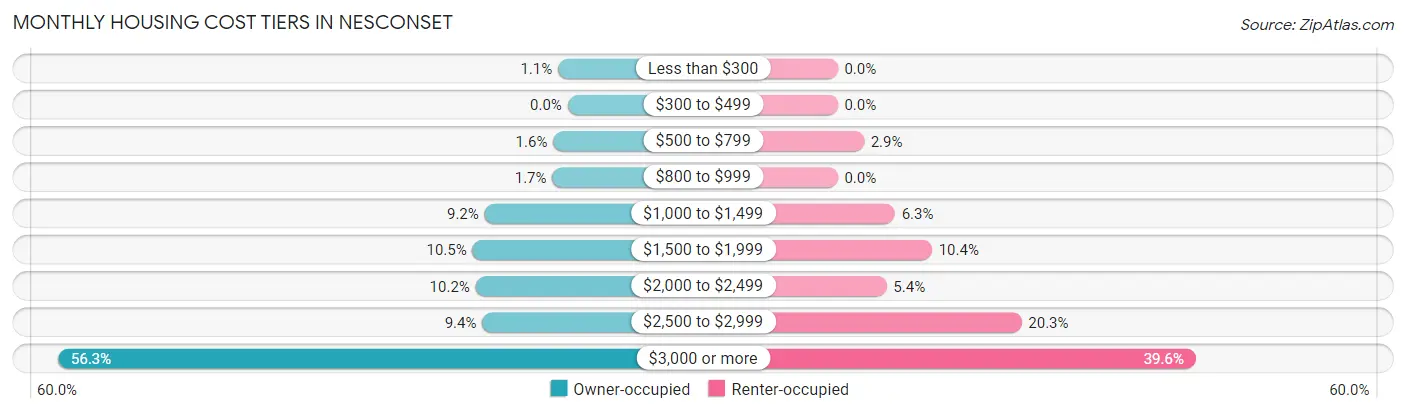
| Monthly Cost | Owner-occupied | Renter-occupied |
| Less than $300 | 41 (1.1%) | 0 (0.0%) |
| $300 to $499 | 0 (0.0%) | 0 (0.0%) |
| $500 to $799 | 61 (1.6%) | 22 (2.9%) |
| $800 to $999 | 65 (1.7%) | 0 (0.0%) |
| $1,000 to $1,499 | 350 (9.2%) | 48 (6.3%) |
| $1,500 to $1,999 | 401 (10.5%) | 79 (10.4%) |
| $2,000 to $2,499 | 388 (10.2%) | 41 (5.4%) |
| $2,500 to $2,999 | 360 (9.4%) | 154 (20.3%) |
| $3,000 or more | 2,148 (56.3%) | 300 (39.6%) |
| Total | 3,814 (100.0%) | 758 (100.0%) |
Physical Housing Characteristics in Nesconset
Housing Structures in Nesconset
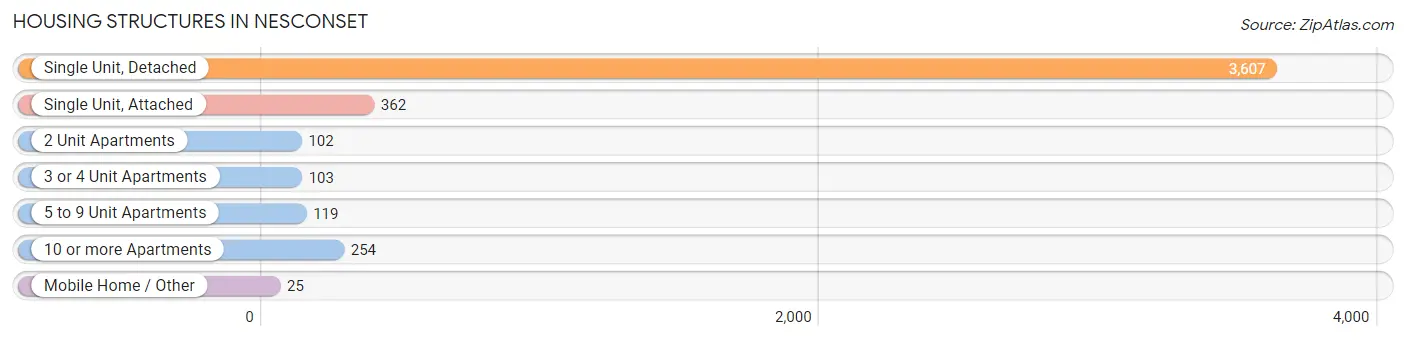
| Structure Type | # Housing Units | % Housing Units |
| Single Unit, Detached | 3,607 | 78.9% |
| Single Unit, Attached | 362 | 7.9% |
| 2 Unit Apartments | 102 | 2.2% |
| 3 or 4 Unit Apartments | 103 | 2.2% |
| 5 to 9 Unit Apartments | 119 | 2.6% |
| 10 or more Apartments | 254 | 5.6% |
| Mobile Home / Other | 25 | 0.5% |
| Total | 4,572 | 100.0% |
Housing Structures by Occupancy in Nesconset
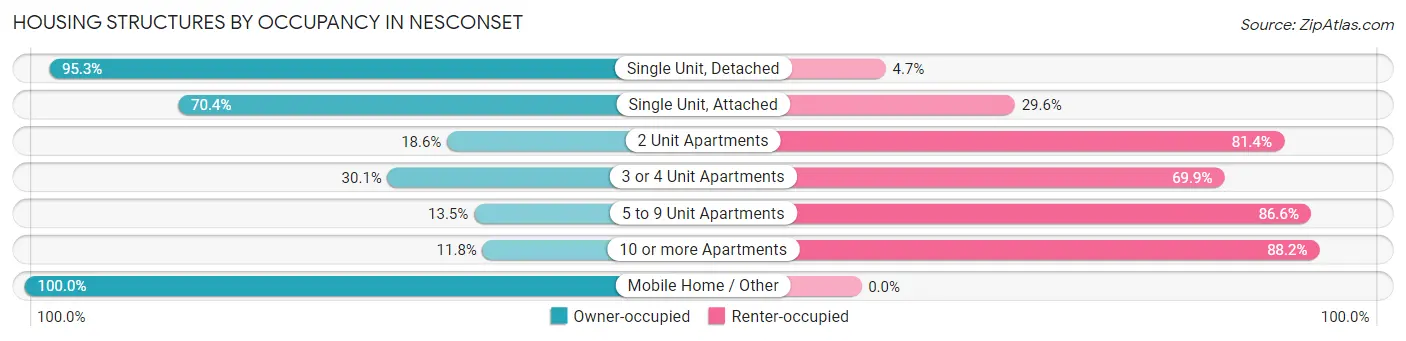
| Structure Type | Owner-occupied | Renter-occupied |
| Single Unit, Detached | 3,438 (95.3%) | 169 (4.7%) |
| Single Unit, Attached | 255 (70.4%) | 107 (29.6%) |
| 2 Unit Apartments | 19 (18.6%) | 83 (81.4%) |
| 3 or 4 Unit Apartments | 31 (30.1%) | 72 (69.9%) |
| 5 to 9 Unit Apartments | 16 (13.5%) | 103 (86.6%) |
| 10 or more Apartments | 30 (11.8%) | 224 (88.2%) |
| Mobile Home / Other | 25 (100.0%) | 0 (0.0%) |
| Total | 3,814 (83.4%) | 758 (16.6%) |
Housing Structures by Number of Rooms in Nesconset
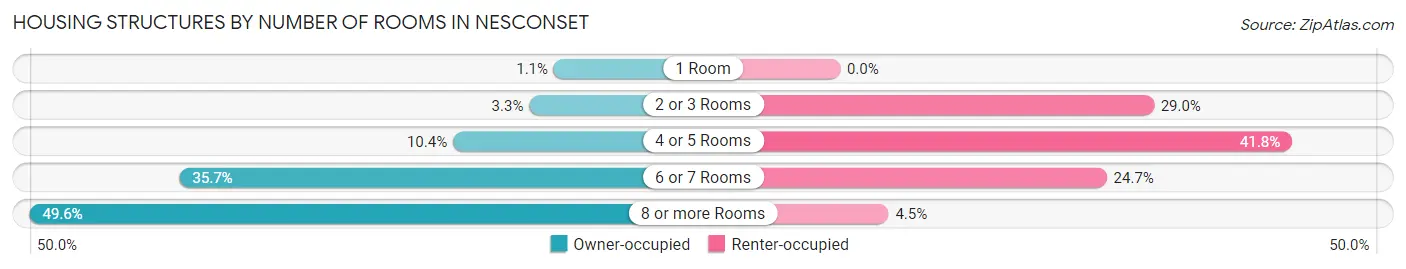
| Number of Rooms | Owner-occupied | Renter-occupied |
| 1 Room | 40 (1.1%) | 0 (0.0%) |
| 2 or 3 Rooms | 127 (3.3%) | 220 (29.0%) |
| 4 or 5 Rooms | 396 (10.4%) | 317 (41.8%) |
| 6 or 7 Rooms | 1,361 (35.7%) | 187 (24.7%) |
| 8 or more Rooms | 1,890 (49.5%) | 34 (4.5%) |
| Total | 3,814 (100.0%) | 758 (100.0%) |
Housing Structure by Heating Type in Nesconset
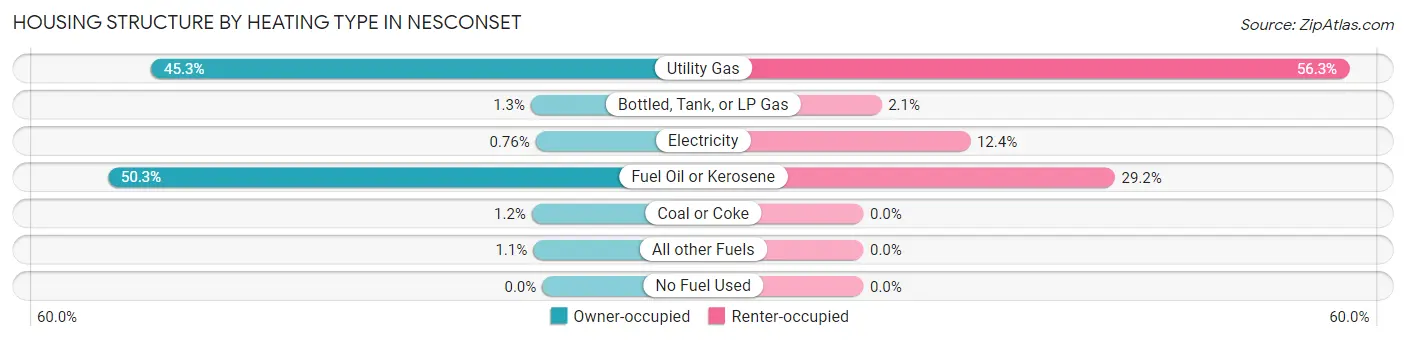
| Heating Type | Owner-occupied | Renter-occupied |
| Utility Gas | 1,729 (45.3%) | 427 (56.3%) |
| Bottled, Tank, or LP Gas | 50 (1.3%) | 16 (2.1%) |
| Electricity | 29 (0.8%) | 94 (12.4%) |
| Fuel Oil or Kerosene | 1,920 (50.3%) | 221 (29.2%) |
| Coal or Coke | 46 (1.2%) | 0 (0.0%) |
| All other Fuels | 40 (1.1%) | 0 (0.0%) |
| No Fuel Used | 0 (0.0%) | 0 (0.0%) |
| Total | 3,814 (100.0%) | 758 (100.0%) |
Household Vehicle Usage in Nesconset
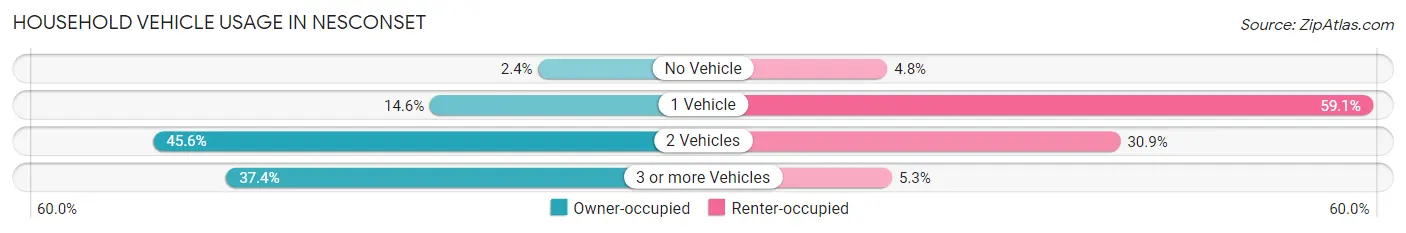
| Vehicles per Household | Owner-occupied | Renter-occupied |
| No Vehicle | 93 (2.4%) | 36 (4.8%) |
| 1 Vehicle | 556 (14.6%) | 448 (59.1%) |
| 2 Vehicles | 1,738 (45.6%) | 234 (30.9%) |
| 3 or more Vehicles | 1,427 (37.4%) | 40 (5.3%) |
| Total | 3,814 (100.0%) | 758 (100.0%) |
Real Estate & Mortgages in Nesconset
Real Estate and Mortgage Overview in Nesconset
| Characteristic | Without Mortgage | With Mortgage |
| Housing Units | 1,135 | 2,679 |
| Median Property Value | $580,500 | $628,600 |
| Median Household Income | $90,181 | $1,641 |
| Monthly Housing Costs | $1,501 | $2,082 |
| Real Estate Taxes | $10,001 | $0 |
Property Value by Mortgage Status in Nesconset
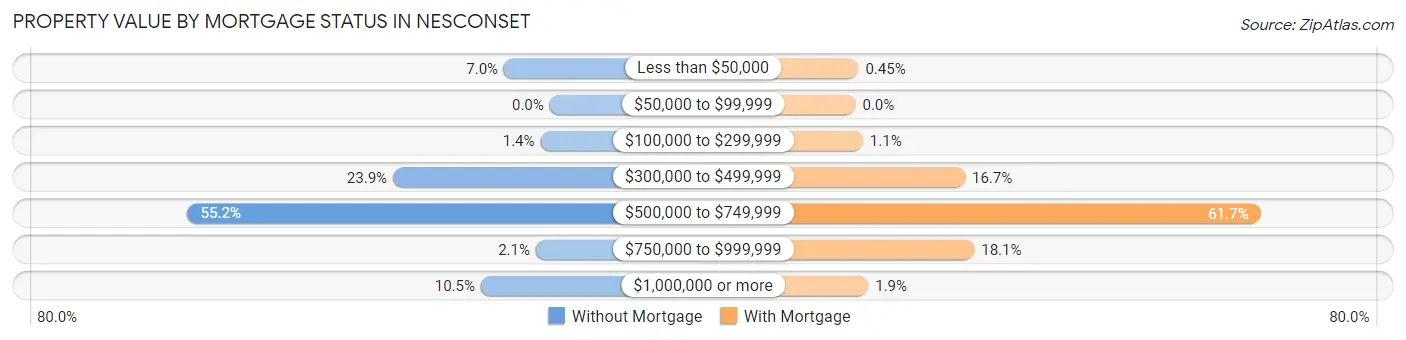
| Property Value | Without Mortgage | With Mortgage |
| Less than $50,000 | 79 (7.0%) | 12 (0.4%) |
| $50,000 to $99,999 | 0 (0.0%) | 0 (0.0%) |
| $100,000 to $299,999 | 16 (1.4%) | 30 (1.1%) |
| $300,000 to $499,999 | 271 (23.9%) | 447 (16.7%) |
| $500,000 to $749,999 | 626 (55.1%) | 1,653 (61.7%) |
| $750,000 to $999,999 | 24 (2.1%) | 485 (18.1%) |
| $1,000,000 or more | 119 (10.5%) | 52 (1.9%) |
| Total | 1,135 (100.0%) | 2,679 (100.0%) |
Household Income by Mortgage Status in Nesconset
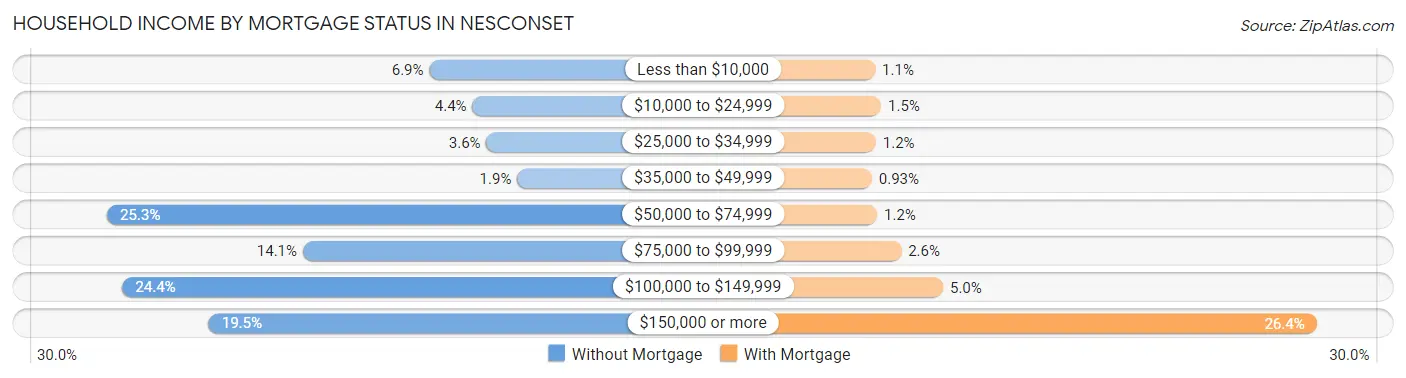
| Household Income | Without Mortgage | With Mortgage |
| Less than $10,000 | 78 (6.9%) | 30 (1.1%) |
| $10,000 to $24,999 | 50 (4.4%) | 39 (1.5%) |
| $25,000 to $34,999 | 41 (3.6%) | 31 (1.2%) |
| $35,000 to $49,999 | 21 (1.8%) | 25 (0.9%) |
| $50,000 to $74,999 | 287 (25.3%) | 33 (1.2%) |
| $75,000 to $99,999 | 160 (14.1%) | 70 (2.6%) |
| $100,000 to $149,999 | 277 (24.4%) | 134 (5.0%) |
| $150,000 or more | 221 (19.5%) | 706 (26.4%) |
| Total | 1,135 (100.0%) | 2,679 (100.0%) |
Property Value to Household Income Ratio in Nesconset
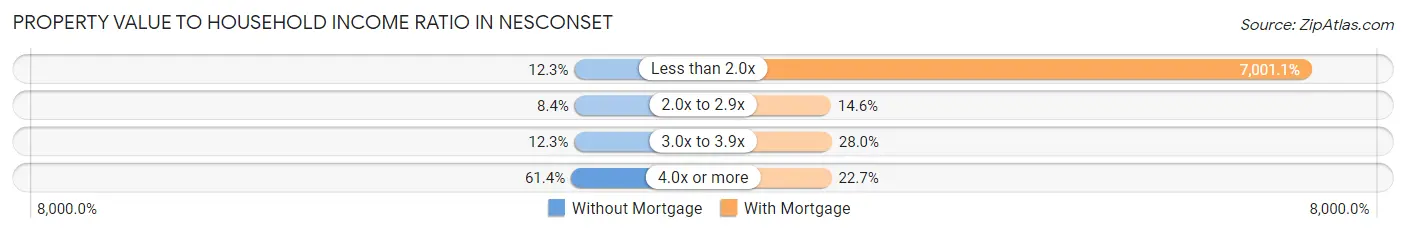
| Value-to-Income Ratio | Without Mortgage | With Mortgage |
| Less than 2.0x | 139 (12.2%) | 187,560 (7,001.1%) |
| 2.0x to 2.9x | 95 (8.4%) | 392 (14.6%) |
| 3.0x to 3.9x | 139 (12.2%) | 750 (28.0%) |
| 4.0x or more | 697 (61.4%) | 608 (22.7%) |
| Total | 1,135 (100.0%) | 2,679 (100.0%) |
Real Estate Taxes by Mortgage Status in Nesconset
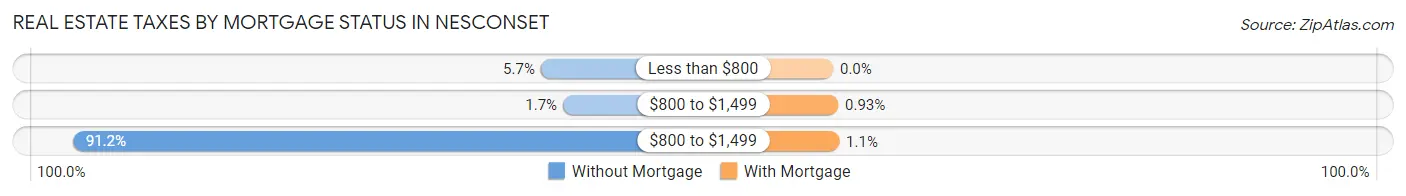
| Property Taxes | Without Mortgage | With Mortgage |
| Less than $800 | 65 (5.7%) | 0 (0.0%) |
| $800 to $1,499 | 19 (1.7%) | 25 (0.9%) |
| $800 to $1,499 | 1,035 (91.2%) | 30 (1.1%) |
| Total | 1,135 (100.0%) | 2,679 (100.0%) |
Health & Disability in Nesconset
Health Insurance Coverage by Age in Nesconset
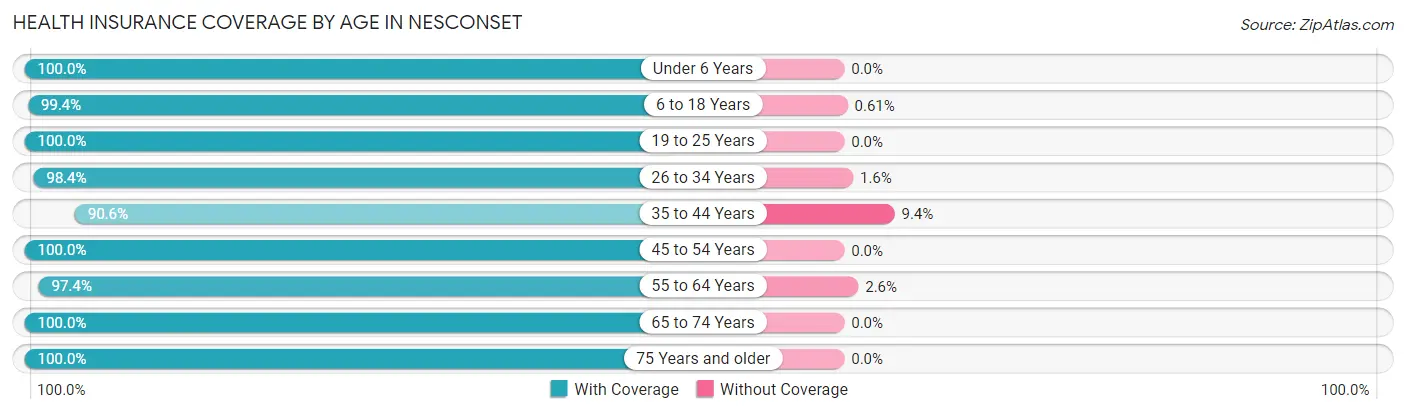
| Age Bracket | With Coverage | Without Coverage |
| Under 6 Years | 595 (100.0%) | 0 (0.0%) |
| 6 to 18 Years | 2,285 (99.4%) | 14 (0.6%) |
| 19 to 25 Years | 1,709 (100.0%) | 0 (0.0%) |
| 26 to 34 Years | 968 (98.4%) | 16 (1.6%) |
| 35 to 44 Years | 1,460 (90.6%) | 151 (9.4%) |
| 45 to 54 Years | 2,154 (100.0%) | 0 (0.0%) |
| 55 to 64 Years | 1,938 (97.4%) | 52 (2.6%) |
| 65 to 74 Years | 1,210 (100.0%) | 0 (0.0%) |
| 75 Years and older | 807 (100.0%) | 0 (0.0%) |
| Total | 13,126 (98.3%) | 233 (1.7%) |
Health Insurance Coverage by Citizenship Status in Nesconset
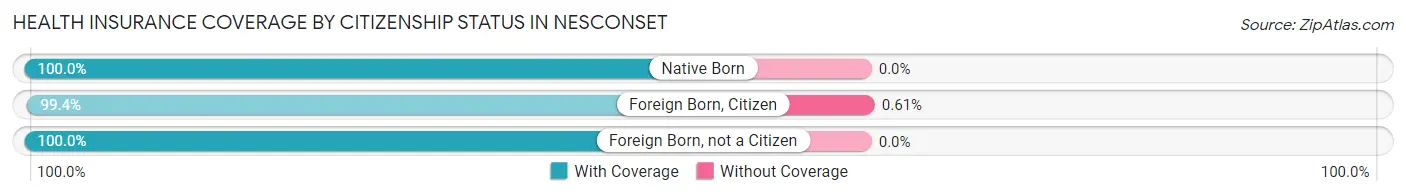
| Citizenship Status | With Coverage | Without Coverage |
| Native Born | 595 (100.0%) | 0 (0.0%) |
| Foreign Born, Citizen | 2,285 (99.4%) | 14 (0.6%) |
| Foreign Born, not a Citizen | 1,709 (100.0%) | 0 (0.0%) |
Health Insurance Coverage by Household Income in Nesconset
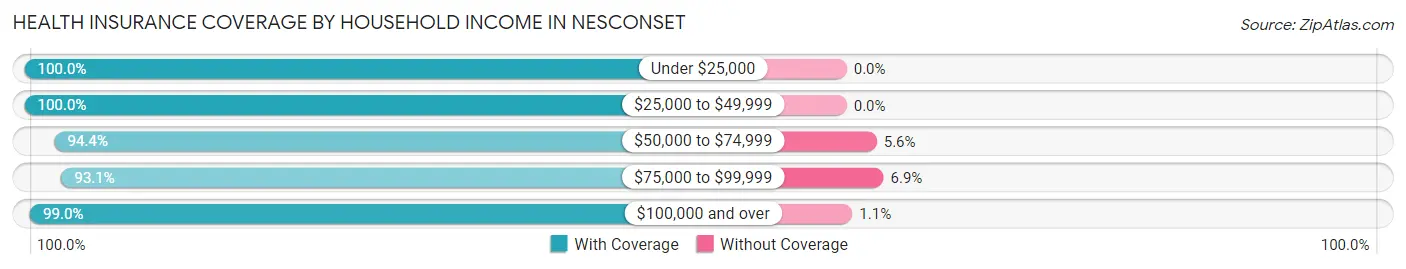
| Household Income | With Coverage | Without Coverage |
| Under $25,000 | 831 (100.0%) | 0 (0.0%) |
| $25,000 to $49,999 | 405 (100.0%) | 0 (0.0%) |
| $50,000 to $74,999 | 823 (94.4%) | 49 (5.6%) |
| $75,000 to $99,999 | 1,053 (93.1%) | 78 (6.9%) |
| $100,000 and over | 9,982 (99.0%) | 106 (1.1%) |
Public vs Private Health Insurance Coverage by Age in Nesconset
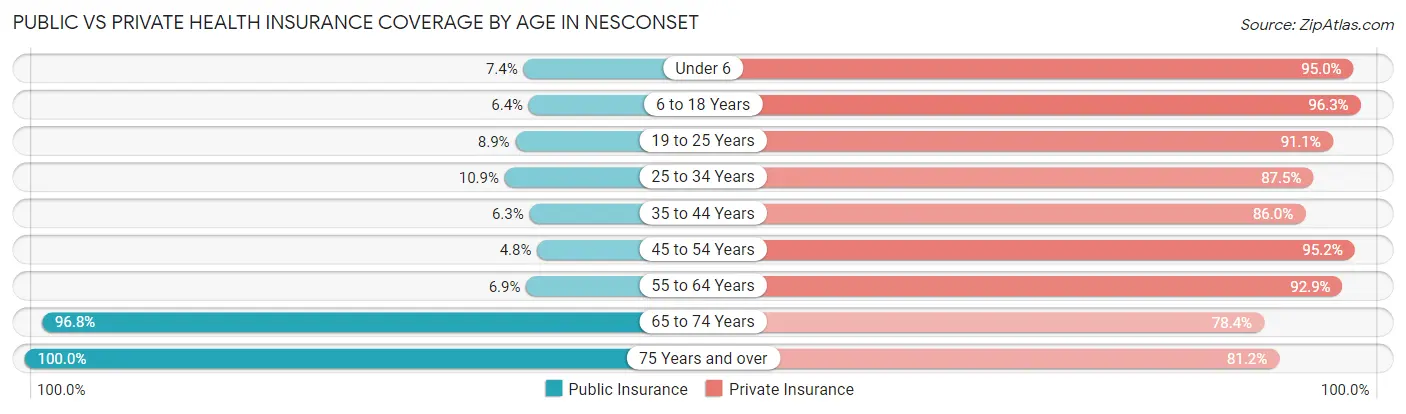
| Age Bracket | Public Insurance | Private Insurance |
| Under 6 | 44 (7.4%) | 565 (95.0%) |
| 6 to 18 Years | 147 (6.4%) | 2,213 (96.3%) |
| 19 to 25 Years | 152 (8.9%) | 1,557 (91.1%) |
| 25 to 34 Years | 107 (10.9%) | 861 (87.5%) |
| 35 to 44 Years | 101 (6.3%) | 1,385 (86.0%) |
| 45 to 54 Years | 104 (4.8%) | 2,050 (95.2%) |
| 55 to 64 Years | 137 (6.9%) | 1,849 (92.9%) |
| 65 to 74 Years | 1,171 (96.8%) | 948 (78.3%) |
| 75 Years and over | 807 (100.0%) | 655 (81.2%) |
| Total | 2,770 (20.7%) | 12,083 (90.4%) |
Disability Status by Sex by Age in Nesconset
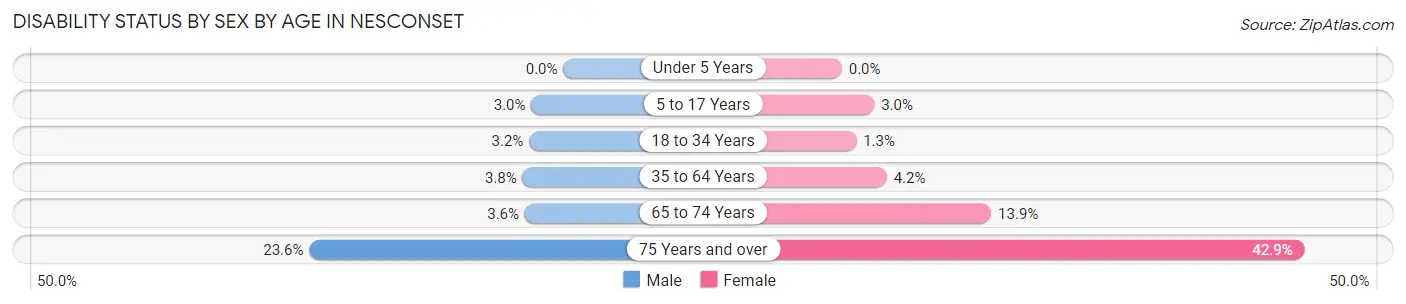
| Age Bracket | Male | Female |
| Under 5 Years | 0 (0.0%) | 0 (0.0%) |
| 5 to 17 Years | 34 (3.0%) | 35 (3.0%) |
| 18 to 34 Years | 58 (3.2%) | 13 (1.3%) |
| 35 to 64 Years | 114 (3.8%) | 114 (4.2%) |
| 65 to 74 Years | 19 (3.6%) | 94 (13.9%) |
| 75 Years and over | 75 (23.6%) | 210 (42.9%) |
Disability Class by Sex by Age in Nesconset
Disability Class: Hearing Difficulty
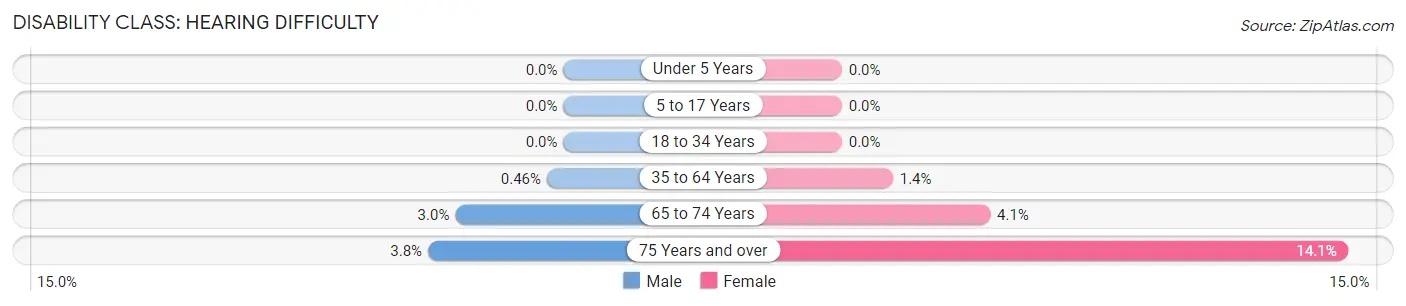
| Age Bracket | Male | Female |
| Under 5 Years | 0 (0.0%) | 0 (0.0%) |
| 5 to 17 Years | 0 (0.0%) | 0 (0.0%) |
| 18 to 34 Years | 0 (0.0%) | 0 (0.0%) |
| 35 to 64 Years | 14 (0.5%) | 39 (1.4%) |
| 65 to 74 Years | 16 (3.0%) | 28 (4.1%) |
| 75 Years and over | 12 (3.8%) | 69 (14.1%) |
Disability Class: Vision Difficulty
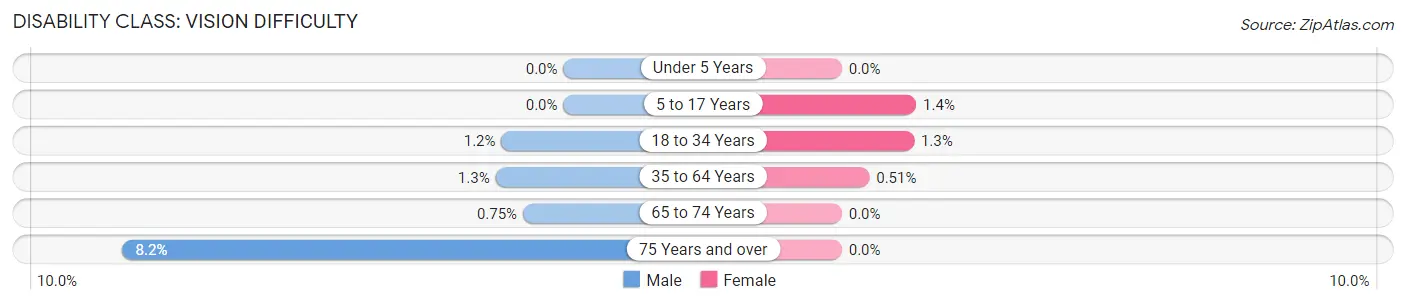
| Age Bracket | Male | Female |
| Under 5 Years | 0 (0.0%) | 0 (0.0%) |
| 5 to 17 Years | 0 (0.0%) | 16 (1.4%) |
| 18 to 34 Years | 21 (1.1%) | 13 (1.3%) |
| 35 to 64 Years | 38 (1.3%) | 14 (0.5%) |
| 65 to 74 Years | 4 (0.7%) | 0 (0.0%) |
| 75 Years and over | 26 (8.2%) | 0 (0.0%) |
Disability Class: Cognitive Difficulty
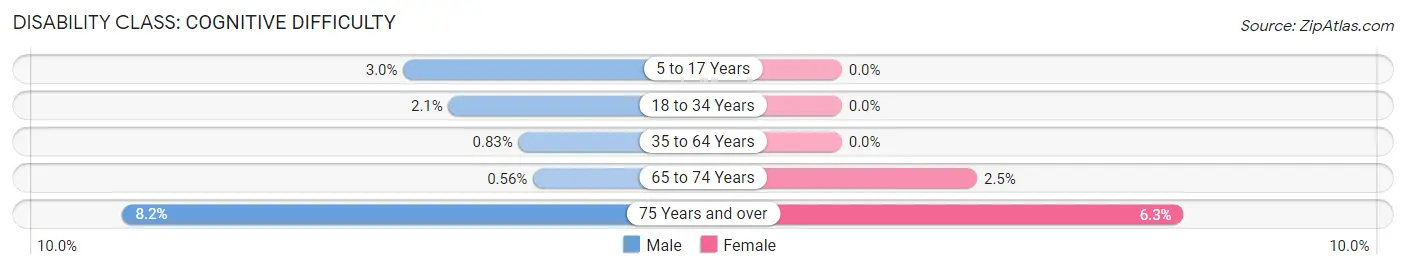
| Age Bracket | Male | Female |
| 5 to 17 Years | 34 (3.0%) | 0 (0.0%) |
| 18 to 34 Years | 39 (2.1%) | 0 (0.0%) |
| 35 to 64 Years | 25 (0.8%) | 0 (0.0%) |
| 65 to 74 Years | 3 (0.6%) | 17 (2.5%) |
| 75 Years and over | 26 (8.2%) | 31 (6.3%) |
Disability Class: Ambulatory Difficulty
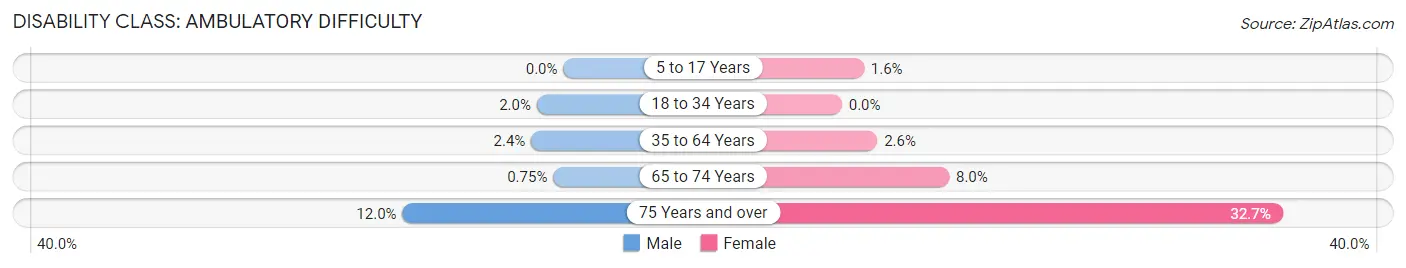
| Age Bracket | Male | Female |
| 5 to 17 Years | 0 (0.0%) | 19 (1.6%) |
| 18 to 34 Years | 36 (2.0%) | 0 (0.0%) |
| 35 to 64 Years | 72 (2.4%) | 72 (2.6%) |
| 65 to 74 Years | 4 (0.7%) | 54 (8.0%) |
| 75 Years and over | 38 (11.9%) | 160 (32.7%) |
Disability Class: Self-Care Difficulty
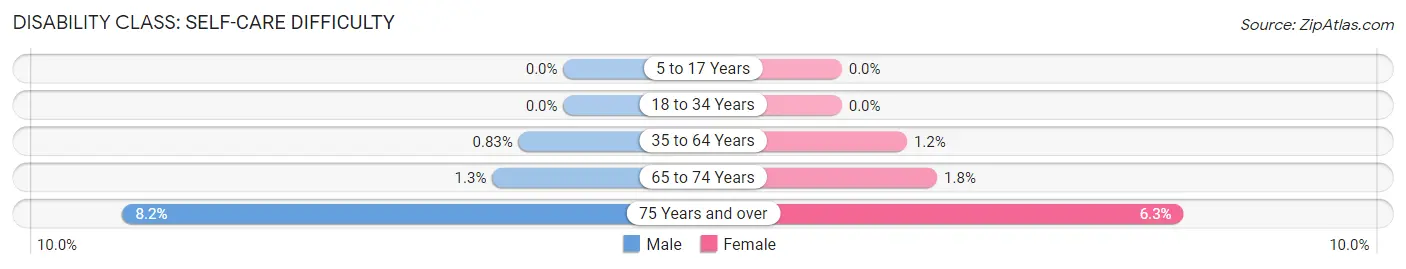
| Age Bracket | Male | Female |
| 5 to 17 Years | 0 (0.0%) | 0 (0.0%) |
| 18 to 34 Years | 0 (0.0%) | 0 (0.0%) |
| 35 to 64 Years | 25 (0.8%) | 33 (1.2%) |
| 65 to 74 Years | 7 (1.3%) | 12 (1.8%) |
| 75 Years and over | 26 (8.2%) | 31 (6.3%) |
Technology Access in Nesconset
Computing Device Access in Nesconset
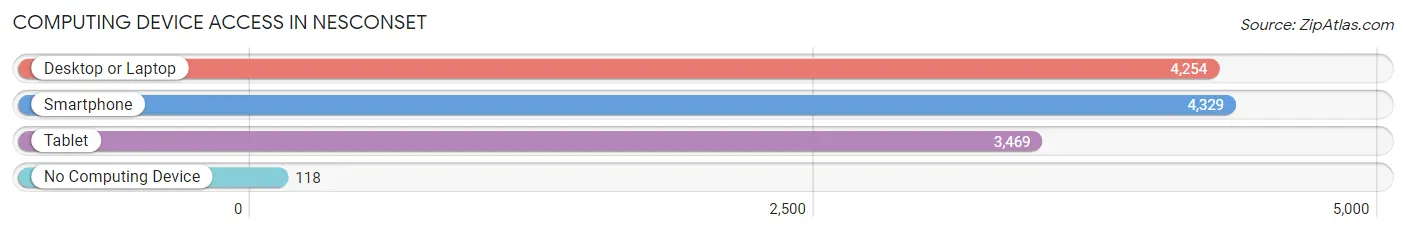
| Device Type | # Households | % Households |
| Desktop or Laptop | 4,254 | 93.0% |
| Smartphone | 4,329 | 94.7% |
| Tablet | 3,469 | 75.9% |
| No Computing Device | 118 | 2.6% |
| Total | 4,572 | 100.0% |
Internet Access in Nesconset
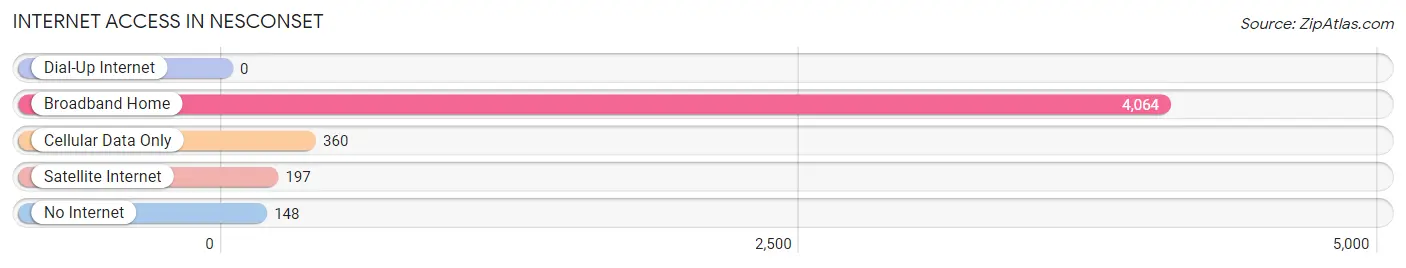
| Internet Type | # Households | % Households |
| Dial-Up Internet | 0 | 0.0% |
| Broadband Home | 4,064 | 88.9% |
| Cellular Data Only | 360 | 7.9% |
| Satellite Internet | 197 | 4.3% |
| No Internet | 148 | 3.2% |
| Total | 4,572 | 100.0% |
Nesconset Summary
Nesconset is a hamlet located in the Town of Smithtown in Suffolk County, New York. It is situated on the north shore of Long Island, approximately 50 miles east of New York City. The hamlet is bordered by the hamlets of Smithtown, Hauppauge, and St. James. Nesconset is home to approximately 17,000 people and is part of the Smithtown Central School District.
History
The area now known as Nesconset was originally inhabited by the Secatogue Indians, a branch of the Algonquin tribe. The Secatogue Indians were a peaceful tribe who lived off the land and were known for their basket weaving and fishing. The Secatogue Indians were eventually displaced by the English settlers in the late 1600s.
The hamlet of Nesconset was first settled in the early 1700s by a group of English settlers led by Captain John Smith. The settlers named the area Nesconset, which is derived from the Native American word for “place of the tall trees.” The settlers built a small village and began farming the land.
In the late 1800s, Nesconset began to grow and develop as a residential community. The hamlet was home to a number of small businesses, including a general store, a blacksmith, and a post office. The hamlet also had a number of churches, including the First Presbyterian Church of Nesconset, which was founded in 1867.
In the early 1900s, Nesconset began to experience a period of rapid growth and development. The hamlet was home to a number of new businesses, including a movie theater, a bowling alley, and a number of restaurants. The hamlet also had a number of new schools, including the Nesconset Elementary School, which opened in 1924.
In the 1950s, Nesconset began to experience a period of suburbanization. The hamlet was home to a number of new housing developments, including the Nesconset Estates, which was built in 1954. The hamlet also had a number of new businesses, including a shopping center, a supermarket, and a number of restaurants.
Geography
Nesconset is located in the Town of Smithtown in Suffolk County, New York. The hamlet is situated on the north shore of Long Island, approximately 50 miles east of New York City. The hamlet is bordered by the hamlets of Smithtown, Hauppauge, and St. James.
Nesconset is located in a hilly area and is home to a number of parks and recreational areas. The hamlet is home to the Nesconset Greenbelt, which is a network of trails and parks that run through the hamlet. The hamlet is also home to the Nesconset Nature Preserve, which is a protected area of land that is home to a variety of wildlife.
Economy
Nesconset is home to a number of businesses and industries. The hamlet is home to a number of retail stores, restaurants, and other businesses. The hamlet is also home to a number of corporate offices, including the headquarters of the Smithtown Central School District.
Nesconset is also home to a number of manufacturing and industrial businesses. The hamlet is home to a number of factories, including the Nesconset Manufacturing Company, which produces a variety of products, including furniture and clothing. The hamlet is also home to a number of warehouses and distribution centers.
Demographics
As of the 2010 census, Nesconset had a population of 17,000 people. The population is predominantly white (90.3%) and the median household income is $90,000. The hamlet is home to a number of ethnic and religious groups, including African Americans (3.2%), Hispanics (2.7%), and Asians (1.7%). The hamlet is also home to a number of religious groups, including Catholics (30.2%), Protestants (25.2%), and Jews (2.2%).
Common Questions
What is Per Capita Income in Nesconset?
Per Capita income in Nesconset is $57,986.
What is the Median Family Income in Nesconset?
Median Family Income in Nesconset is $151,884.
What is the Median Household income in Nesconset?
Median Household Income in Nesconset is $141,754.
What is Income or Wage Gap in Nesconset?
Income or Wage Gap in Nesconset is 49.6%.
Women in Nesconset earn 50.4 cents for every dollar earned by a man.
What is Family Income Deficit in Nesconset?
Family Income Deficit in Nesconset is $12,463.
Families that are below poverty line in Nesconset earn $12,463 less on average than the poverty threshold level.
What is Inequality or Gini Index in Nesconset?
Inequality or Gini Index in Nesconset is 0.42.
What is the Total Population of Nesconset?
Total Population of Nesconset is 13,549.
What is the Total Male Population of Nesconset?
Total Male Population of Nesconset is 7,200.
What is the Total Female Population of Nesconset?
Total Female Population of Nesconset is 6,349.
What is the Ratio of Males per 100 Females in Nesconset?
There are 113.40 Males per 100 Females in Nesconset.
What is the Ratio of Females per 100 Males in Nesconset?
There are 88.18 Females per 100 Males in Nesconset.
What is the Median Population Age in Nesconset?
Median Population Age in Nesconset is 42.9 Years.
What is the Average Family Size in Nesconset
Average Family Size in Nesconset is 3.3 People.
What is the Average Household Size in Nesconset
Average Household Size in Nesconset is 2.9 People.
How Large is the Labor Force in Nesconset?
There are 7,189 People in the Labor Forcein in Nesconset.
What is the Percentage of People in the Labor Force in Nesconset?
64.3% of People are in the Labor Force in Nesconset.
What is the Unemployment Rate in Nesconset?
Unemployment Rate in Nesconset is 1.7%.