Centereach, NY Map & Demographics
Centereach Map
Centereach Overview
$46,051
PER CAPITA INCOME
$137,733
AVG FAMILY INCOME
$122,462
AVG HOUSEHOLD INCOME
30.1%
WAGE / INCOME GAP [ % ]
69.9¢/ $1
WAGE / INCOME GAP [ $ ]
0.37
INEQUALITY / GINI INDEX
31,889
TOTAL POPULATION
15,943
MALE POPULATION
15,946
FEMALE POPULATION
99.98
MALES / 100 FEMALES
100.02
FEMALES / 100 MALES
37.8
MEDIAN AGE
3.6
AVG FAMILY SIZE
3.2
AVG HOUSEHOLD SIZE
16,777
LABOR FORCE [ PEOPLE ]
64.2%
PERCENT IN LABOR FORCE
5.6%
UNEMPLOYMENT RATE
Centereach Zip Codes
Centereach Area Codes
Income in Centereach
Income Overview in Centereach
Per Capita Income in Centereach is $46,051, while median incomes of families and households are $137,733 and $122,462 respectively.
| Characteristic | Number | Measure |
| Per Capita Income | 31,889 | $46,051 |
| Median Family Income | 7,864 | $137,733 |
| Mean Family Income | 7,864 | $157,526 |
| Median Household Income | 9,806 | $122,462 |
| Mean Household Income | 9,806 | $143,751 |
| Income Deficit | 7,864 | $0 |
| Wage / Income Gap (%) | 31,889 | 30.09% |
| Wage / Income Gap ($) | 31,889 | 69.91¢ per $1 |
| Gini / Inequality Index | 31,889 | 0.37 |
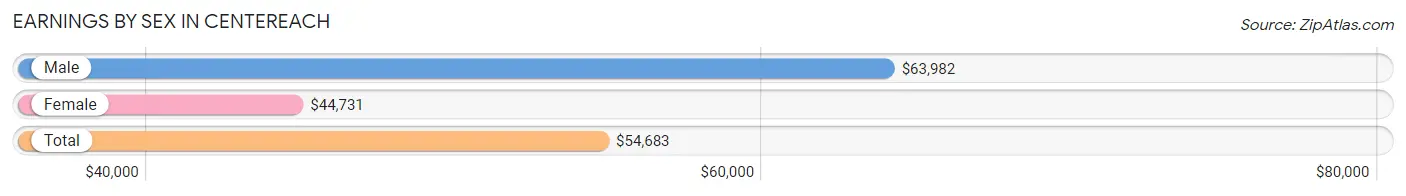
Earnings by Sex in Centereach
Average Earnings in Centereach are $54,683, $63,982 for men and $44,731 for women, a difference of 30.1%.
| Sex | Number | Average Earnings |
| Male | 8,832 (51.2%) | $63,982 |
| Female | 8,425 (48.8%) | $44,731 |
| Total | 17,257 (100.0%) | $54,683 |
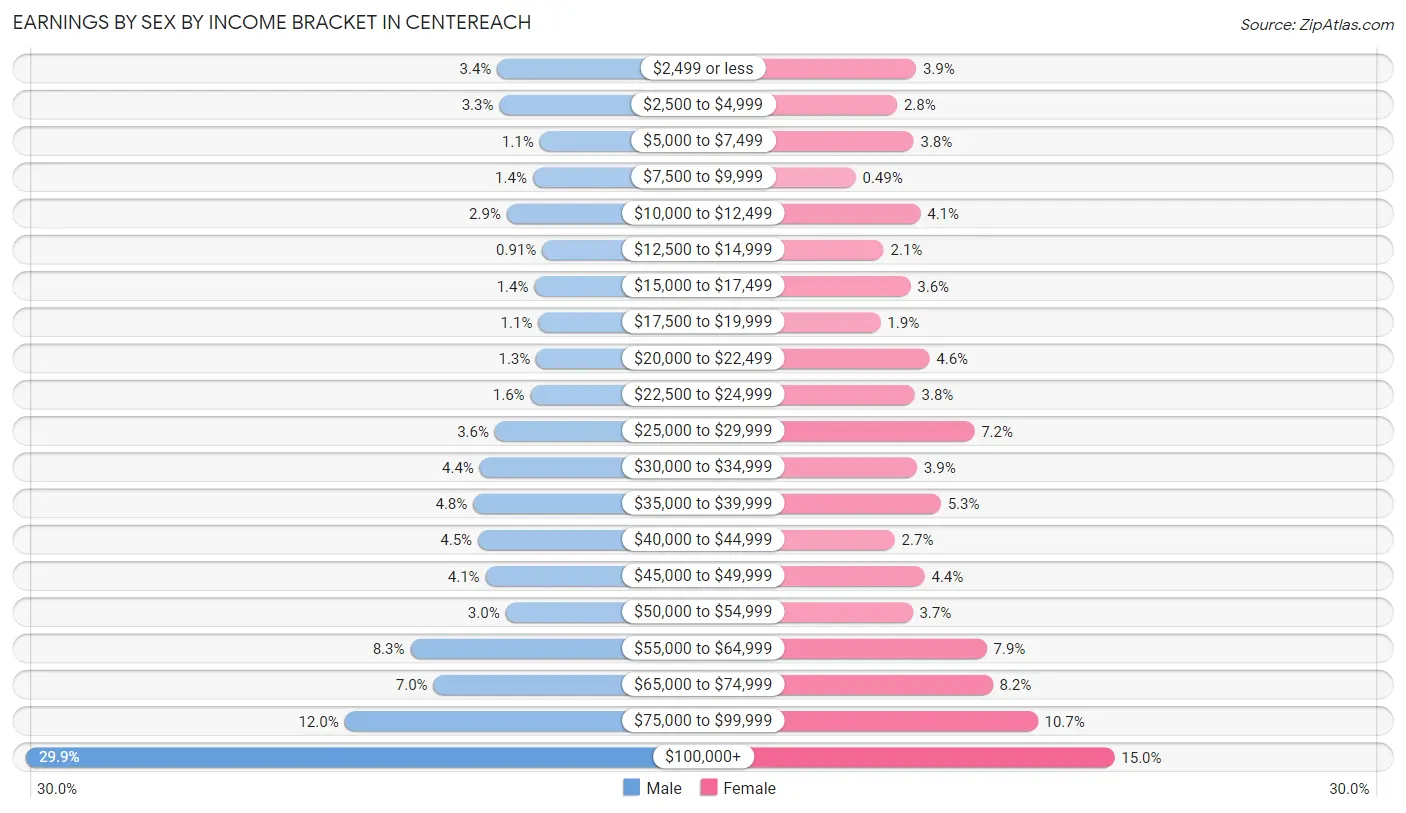
Earnings by Sex by Income Bracket in Centereach
The most common earnings brackets in Centereach are $100,000+ for men (2,642 | 29.9%) and $100,000+ for women (1,267 | 15.0%).
| Income | Male | Female |
| $2,499 or less | 304 (3.4%) | 328 (3.9%) |
| $2,500 to $4,999 | 293 (3.3%) | 238 (2.8%) |
| $5,000 to $7,499 | 94 (1.1%) | 316 (3.7%) |
| $7,500 to $9,999 | 127 (1.4%) | 41 (0.5%) |
| $10,000 to $12,499 | 256 (2.9%) | 348 (4.1%) |
| $12,500 to $14,999 | 80 (0.9%) | 174 (2.1%) |
| $15,000 to $17,499 | 119 (1.3%) | 301 (3.6%) |
| $17,500 to $19,999 | 100 (1.1%) | 159 (1.9%) |
| $20,000 to $22,499 | 110 (1.3%) | 391 (4.6%) |
| $22,500 to $24,999 | 139 (1.6%) | 321 (3.8%) |
| $25,000 to $29,999 | 315 (3.6%) | 603 (7.2%) |
| $30,000 to $34,999 | 390 (4.4%) | 332 (3.9%) |
| $35,000 to $39,999 | 423 (4.8%) | 445 (5.3%) |
| $40,000 to $44,999 | 399 (4.5%) | 227 (2.7%) |
| $45,000 to $49,999 | 362 (4.1%) | 368 (4.4%) |
| $50,000 to $54,999 | 262 (3.0%) | 311 (3.7%) |
| $55,000 to $64,999 | 735 (8.3%) | 662 (7.9%) |
| $65,000 to $74,999 | 620 (7.0%) | 690 (8.2%) |
| $75,000 to $99,999 | 1,062 (12.0%) | 903 (10.7%) |
| $100,000+ | 2,642 (29.9%) | 1,267 (15.0%) |
| Total | 8,832 (100.0%) | 8,425 (100.0%) |
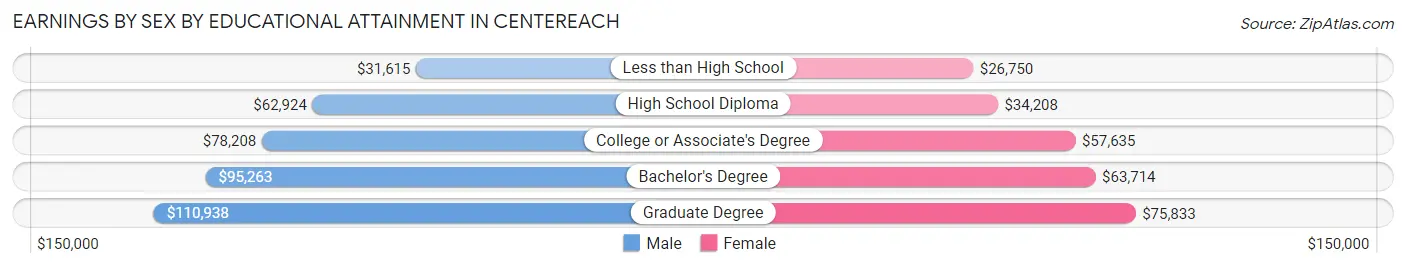
Earnings by Sex by Educational Attainment in Centereach
Average earnings in Centereach are $74,473 for men and $53,134 for women, a difference of 28.6%. Men with an educational attainment of graduate degree enjoy the highest average annual earnings of $110,938, while those with less than high school education earn the least with $31,615. Women with an educational attainment of graduate degree earn the most with the average annual earnings of $75,833, while those with less than high school education have the smallest earnings of $26,750.
| Educational Attainment | Male Income | Female Income |
| Less than High School | $31,615 | $26,750 |
| High School Diploma | $62,924 | $34,208 |
| College or Associate's Degree | $78,208 | $57,635 |
| Bachelor's Degree | $95,263 | $63,714 |
| Graduate Degree | $110,938 | $75,833 |
| Total | $74,473 | $53,134 |
Family Income in Centereach
Family Income Brackets in Centereach
According to the Centereach family income data, there are 2,108 families falling into the $200,000+ income range, which is the most common income bracket and makes up 26.8% of all families. Conversely, the $10,000 to $14,999 income bracket is the least frequent group with only 16 families (0.2%) belonging to this category.
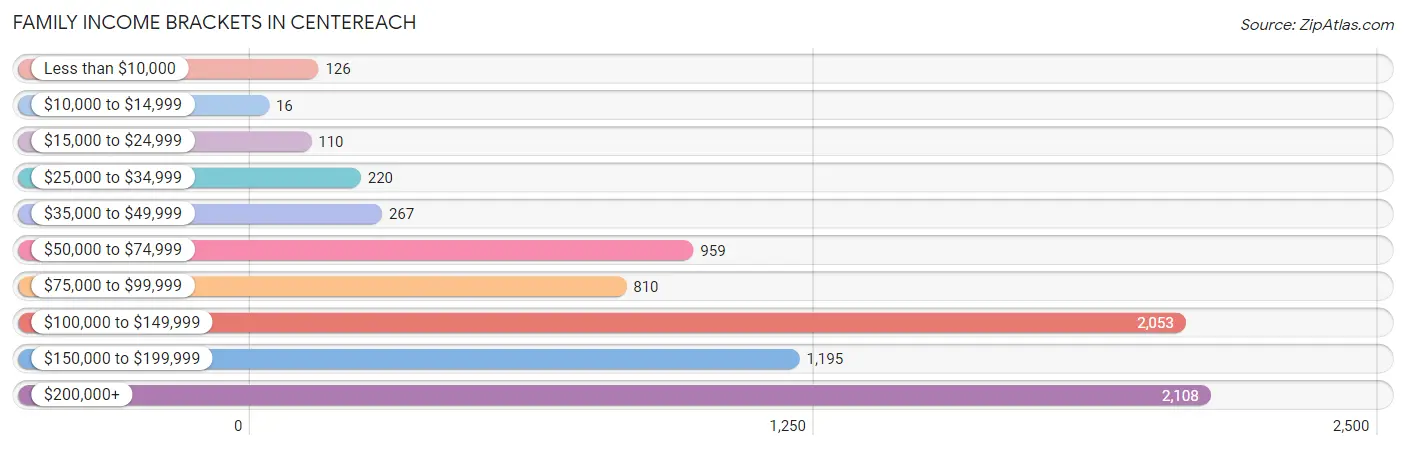
| Income Bracket | # Families | % Families |
| Less than $10,000 | 126 | 1.6% |
| $10,000 to $14,999 | 16 | 0.2% |
| $15,000 to $24,999 | 110 | 1.4% |
| $25,000 to $34,999 | 220 | 2.8% |
| $35,000 to $49,999 | 267 | 3.4% |
| $50,000 to $74,999 | 959 | 12.2% |
| $75,000 to $99,999 | 810 | 10.3% |
| $100,000 to $149,999 | 2,053 | 26.1% |
| $150,000 to $199,999 | 1,195 | 15.2% |
| $200,000+ | 2,108 | 26.8% |
Family Income by Famaliy Size in Centereach
7+ person families (180 | 2.3%) account for the highest median family income in Centereach with $200,577 per family, while 2-person families (2,578 | 32.8%) have the highest median income of $50,246 per family member.
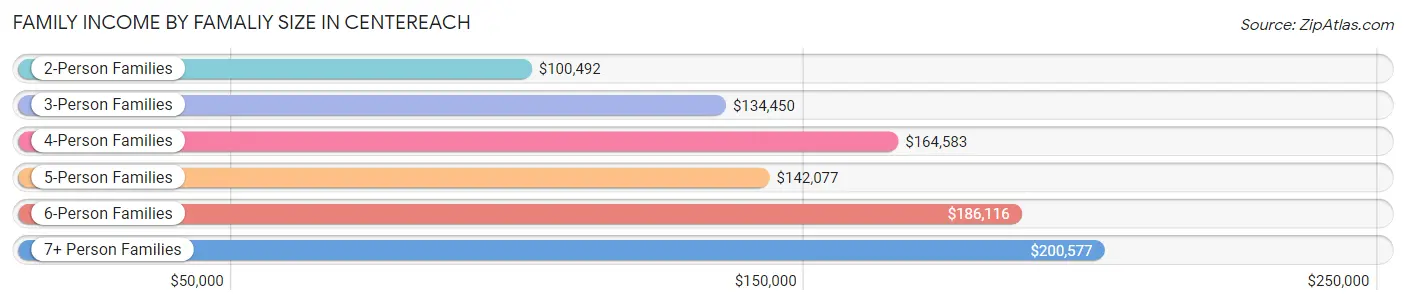
| Income Bracket | # Families | Median Income |
| 2-Person Families | 2,578 (32.8%) | $100,492 |
| 3-Person Families | 2,143 (27.3%) | $134,450 |
| 4-Person Families | 1,772 (22.5%) | $164,583 |
| 5-Person Families | 923 (11.7%) | $142,077 |
| 6-Person Families | 268 (3.4%) | $186,116 |
| 7+ Person Families | 180 (2.3%) | $200,577 |
| Total | 7,864 (100.0%) | $137,733 |
Family Income by Number of Earners in Centereach
The median family income in Centereach is $137,733, with families comprising 3+ earners (1,411) having the highest median family income of $192,773, while families with no earners (767) have the lowest median family income of $63,250, accounting for 17.9% and 9.8% of families, respectively.
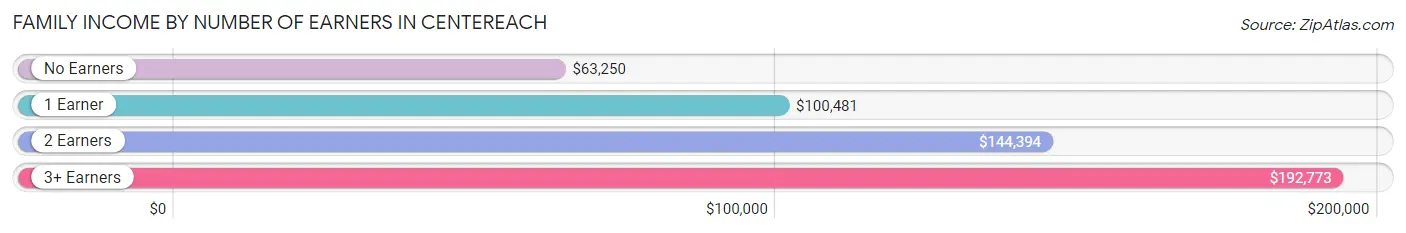
| Number of Earners | # Families | Median Income |
| No Earners | 767 (9.8%) | $63,250 |
| 1 Earner | 2,024 (25.7%) | $100,481 |
| 2 Earners | 3,662 (46.6%) | $144,394 |
| 3+ Earners | 1,411 (17.9%) | $192,773 |
| Total | 7,864 (100.0%) | $137,733 |
Household Income in Centereach
Household Income Brackets in Centereach
With 2,412 households falling in the category, the $100,000 to $149,999 income range is the most frequent in Centereach, accounting for 24.6% of all households. In contrast, only 49 households (0.5%) fall into the $10,000 to $14,999 income bracket, making it the least populous group.
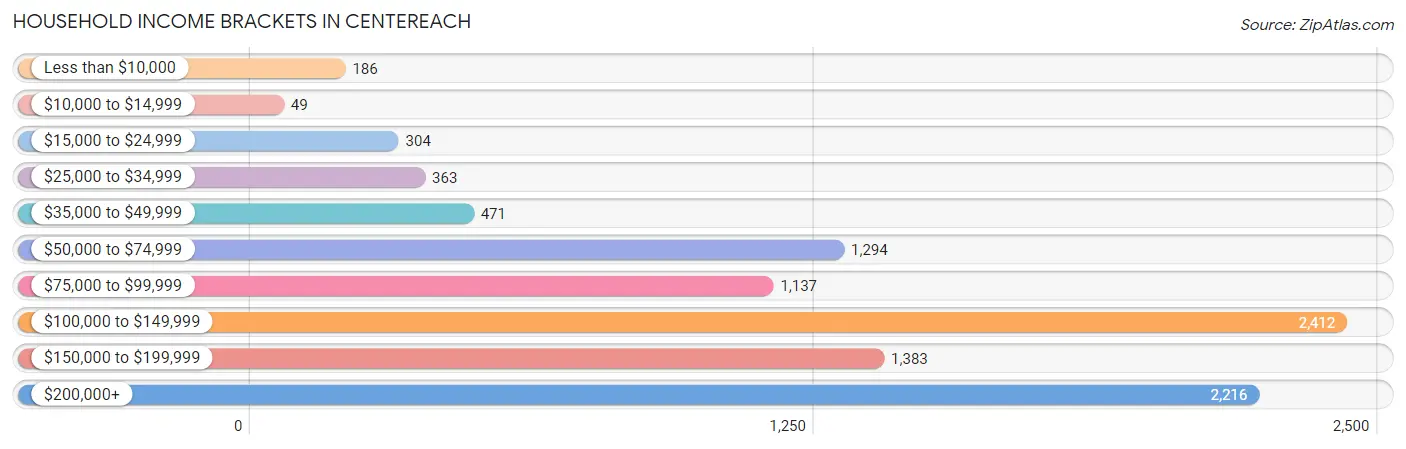
| Income Bracket | # Households | % Households |
| Less than $10,000 | 186 | 1.9% |
| $10,000 to $14,999 | 49 | 0.5% |
| $15,000 to $24,999 | 304 | 3.1% |
| $25,000 to $34,999 | 363 | 3.7% |
| $35,000 to $49,999 | 471 | 4.8% |
| $50,000 to $74,999 | 1,294 | 13.2% |
| $75,000 to $99,999 | 1,137 | 11.6% |
| $100,000 to $149,999 | 2,412 | 24.6% |
| $150,000 to $199,999 | 1,383 | 14.1% |
| $200,000+ | 2,216 | 22.6% |
Household Income by Householder Age in Centereach
The median household income in Centereach is $122,462, with the highest median household income of $141,746 found in the 45 to 64 years age bracket for the primary householder. A total of 4,282 households (43.7%) fall into this category. Meanwhile, the 65+ years age bracket for the primary householder has the lowest median household income of $86,681, with 2,758 households (28.1%) in this group.
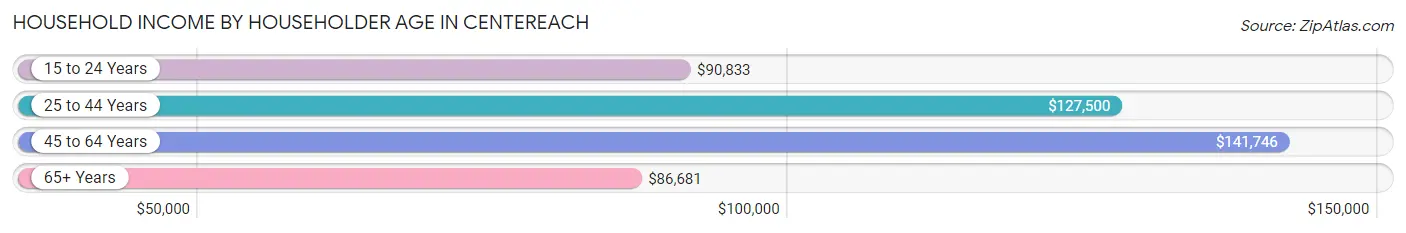
| Income Bracket | # Households | Median Income |
| 15 to 24 Years | 88 (0.9%) | $90,833 |
| 25 to 44 Years | 2,678 (27.3%) | $127,500 |
| 45 to 64 Years | 4,282 (43.7%) | $141,746 |
| 65+ Years | 2,758 (28.1%) | $86,681 |
| Total | 9,806 (100.0%) | $122,462 |
Poverty in Centereach
Income Below Poverty by Sex and Age in Centereach
With 4.7% poverty level for males and 6.7% for females among the residents of Centereach, 15 year old males and 18 to 24 year old females are the most vulnerable to poverty, with 39 males (31.5%) and 281 females (16.5%) in their respective age groups living below the poverty level.
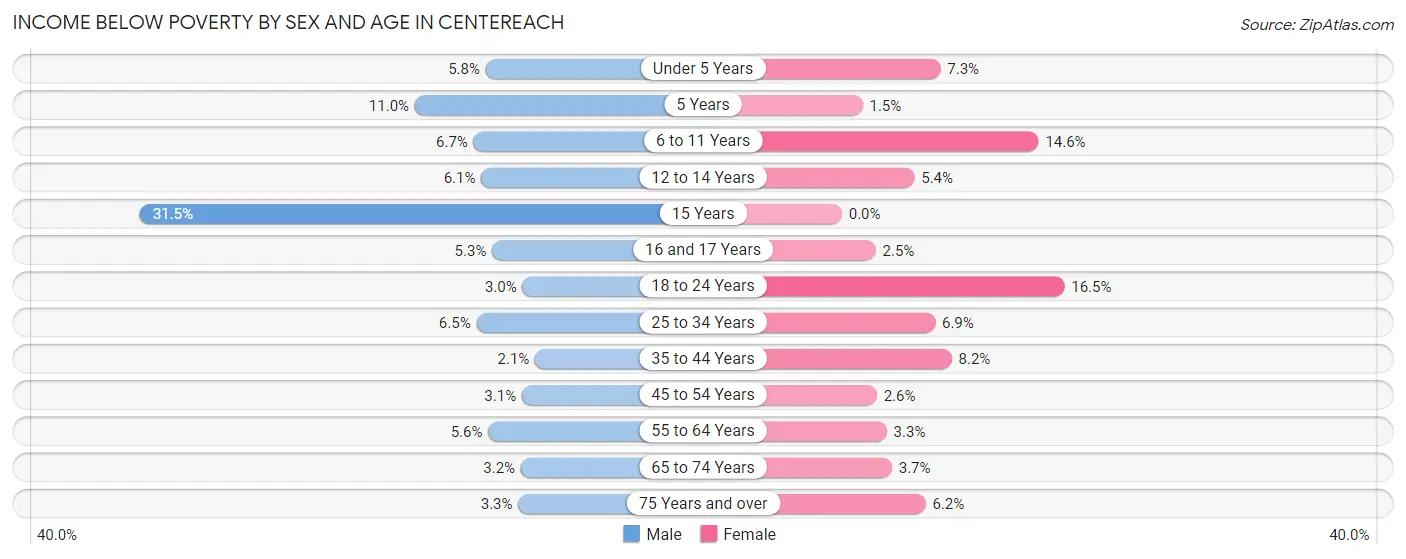
| Age Bracket | Male | Female |
| Under 5 Years | 62 (5.8%) | 52 (7.3%) |
| 5 Years | 13 (11.0%) | 1 (1.5%) |
| 6 to 11 Years | 81 (6.7%) | 107 (14.6%) |
| 12 to 14 Years | 36 (6.1%) | 45 (5.4%) |
| 15 Years | 39 (31.5%) | 0 (0.0%) |
| 16 and 17 Years | 39 (5.3%) | 19 (2.5%) |
| 18 to 24 Years | 48 (3.0%) | 281 (16.5%) |
| 25 to 34 Years | 128 (6.5%) | 139 (6.9%) |
| 35 to 44 Years | 45 (2.1%) | 149 (8.2%) |
| 45 to 54 Years | 66 (3.1%) | 61 (2.6%) |
| 55 to 64 Years | 116 (5.6%) | 68 (3.3%) |
| 65 to 74 Years | 36 (3.2%) | 46 (3.7%) |
| 75 Years and over | 32 (3.3%) | 84 (6.2%) |
| Total | 741 (4.7%) | 1,052 (6.7%) |
Income Above Poverty by Sex and Age in Centereach
According to the poverty statistics in Centereach, males aged 35 to 44 years and females aged 15 years are the age groups that are most secure financially, with 97.9% of males and 100.0% of females in these age groups living above the poverty line.
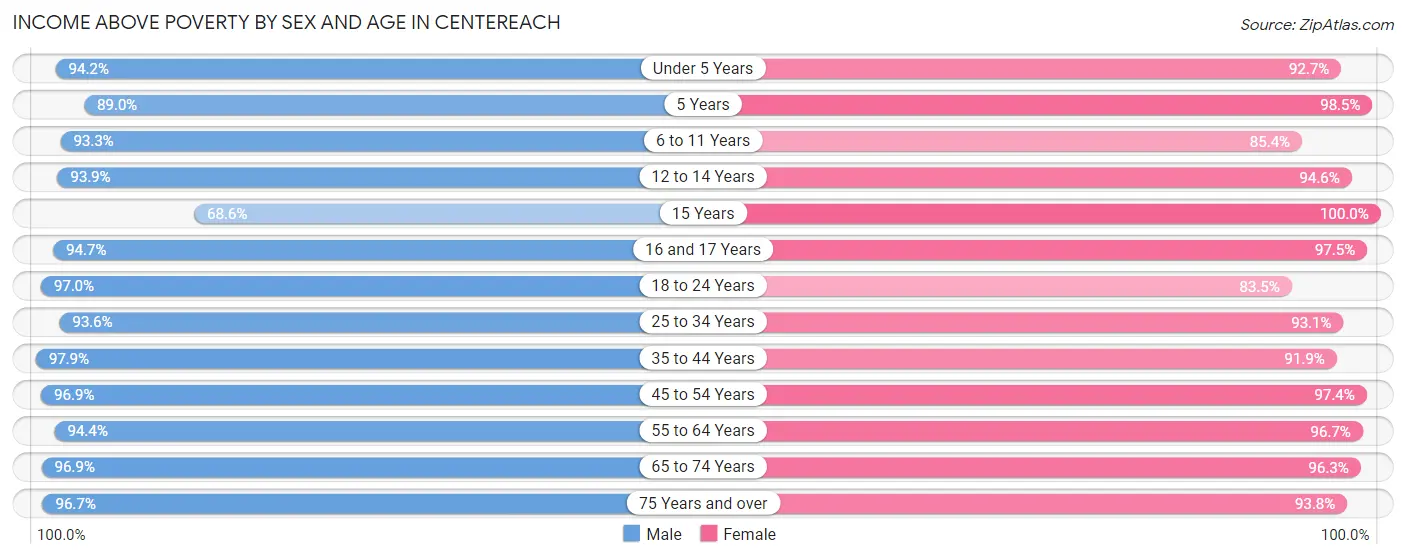
| Age Bracket | Male | Female |
| Under 5 Years | 1,014 (94.2%) | 658 (92.7%) |
| 5 Years | 105 (89.0%) | 64 (98.5%) |
| 6 to 11 Years | 1,136 (93.3%) | 626 (85.4%) |
| 12 to 14 Years | 555 (93.9%) | 791 (94.6%) |
| 15 Years | 85 (68.5%) | 179 (100.0%) |
| 16 and 17 Years | 699 (94.7%) | 738 (97.5%) |
| 18 to 24 Years | 1,535 (97.0%) | 1,420 (83.5%) |
| 25 to 34 Years | 1,858 (93.5%) | 1,871 (93.1%) |
| 35 to 44 Years | 2,106 (97.9%) | 1,680 (91.8%) |
| 45 to 54 Years | 2,084 (96.9%) | 2,297 (97.4%) |
| 55 to 64 Years | 1,965 (94.4%) | 1,973 (96.7%) |
| 65 to 74 Years | 1,108 (96.9%) | 1,194 (96.3%) |
| 75 Years and over | 927 (96.7%) | 1,269 (93.8%) |
| Total | 15,177 (95.3%) | 14,760 (93.3%) |
Income Below Poverty Among Married-Couple Families in Centereach
The poverty statistics for married-couple families in Centereach show that 1.8% or 110 of the total 6,214 families live below the poverty line. Families with 5 or more children have the highest poverty rate of 28.6%, comprising of 18 families. On the other hand, families with 1 or 2 children have the lowest poverty rate of 0.5%, which includes 13 families.
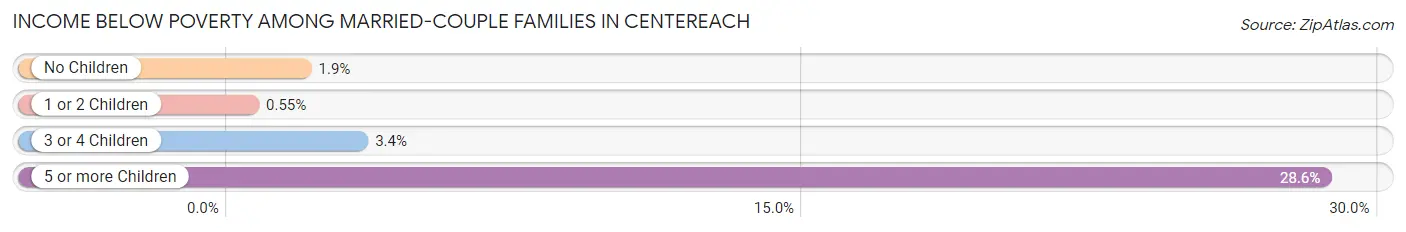
| Children | Above Poverty | Below Poverty |
| No Children | 3,267 (98.1%) | 64 (1.9%) |
| 1 or 2 Children | 2,366 (99.5%) | 13 (0.5%) |
| 3 or 4 Children | 426 (96.6%) | 15 (3.4%) |
| 5 or more Children | 45 (71.4%) | 18 (28.6%) |
| Total | 6,104 (98.2%) | 110 (1.8%) |
Income Below Poverty Among Single-Parent Households in Centereach
According to the poverty data in Centereach, 0.2% or 1 single-father households and 13.6% or 158 single-mother households are living below the poverty line. Among single-father households, those with no children have the highest poverty rate, with 1 households (0.3%) experiencing poverty. Likewise, among single-mother households, those with 5 or more children have the highest poverty rate, with 17 households (100.0%) falling below the poverty line.
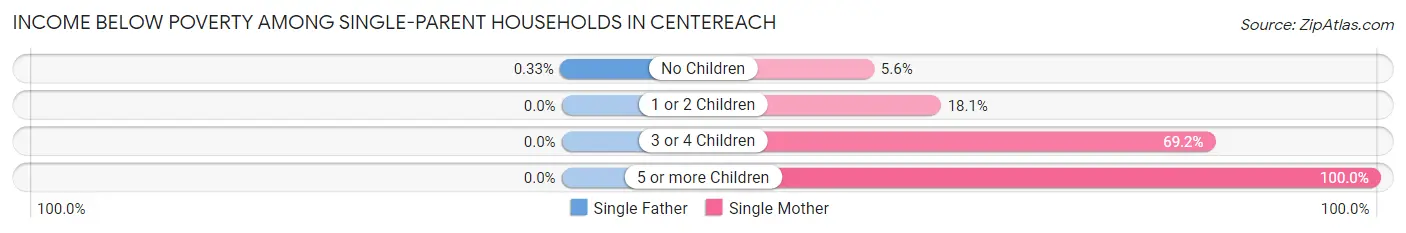
| Children | Single Father | Single Mother |
| No Children | 1 (0.3%) | 33 (5.6%) |
| 1 or 2 Children | 0 (0.0%) | 99 (18.1%) |
| 3 or 4 Children | 0 (0.0%) | 9 (69.2%) |
| 5 or more Children | 0 (0.0%) | 17 (100.0%) |
| Total | 1 (0.2%) | 158 (13.6%) |
Income Below Poverty Among Married-Couple vs Single-Parent Households in Centereach
The poverty data for Centereach shows that 110 of the married-couple family households (1.8%) and 159 of the single-parent households (9.6%) are living below the poverty level. Within the married-couple family households, those with 5 or more children have the highest poverty rate, with 18 households (28.6%) falling below the poverty line. Among the single-parent households, those with 5 or more children have the highest poverty rate, with 17 household (100.0%) living below poverty.
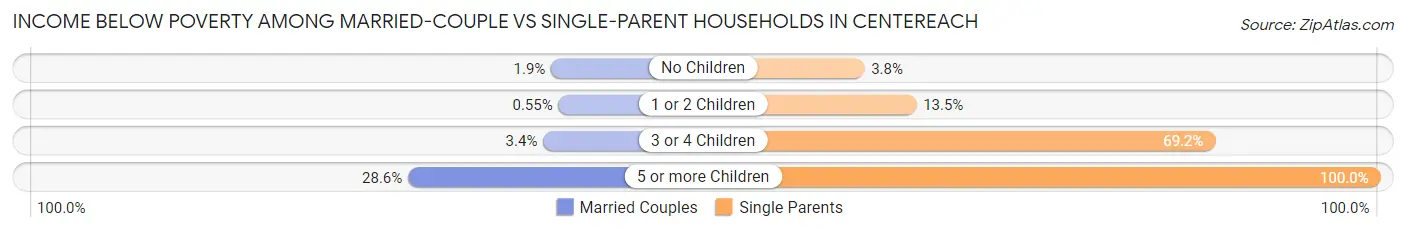
| Children | Married-Couple Families | Single-Parent Households |
| No Children | 64 (1.9%) | 34 (3.8%) |
| 1 or 2 Children | 13 (0.5%) | 99 (13.5%) |
| 3 or 4 Children | 15 (3.4%) | 9 (69.2%) |
| 5 or more Children | 18 (28.6%) | 17 (100.0%) |
| Total | 110 (1.8%) | 159 (9.6%) |
Race in Centereach
The most populous races in Centereach are White / Caucasian (24,312 | 76.2%), Hispanic or Latino (5,288 | 16.6%), and Asian (2,121 | 6.7%).
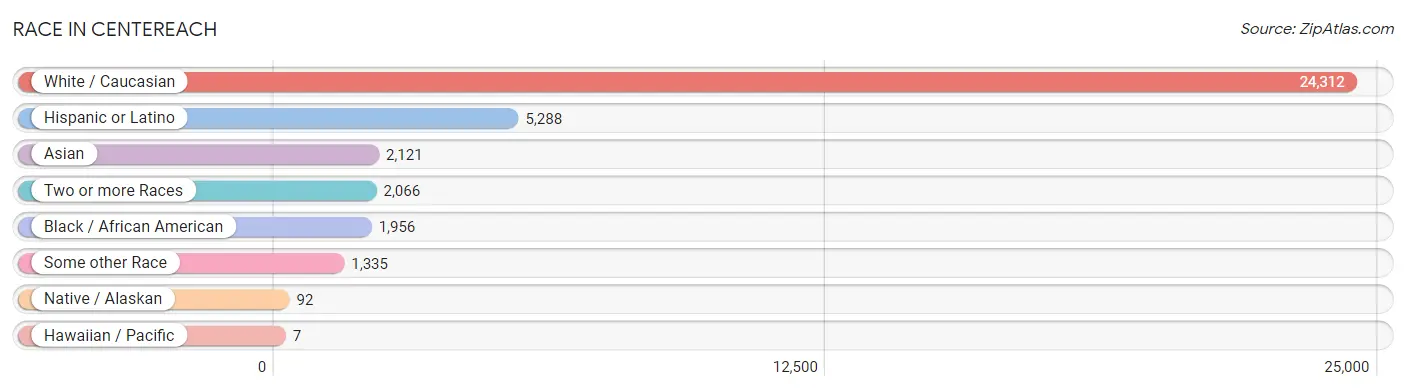
| Race | # Population | % Population |
| Asian | 2,121 | 6.7% |
| Black / African American | 1,956 | 6.1% |
| Hawaiian / Pacific | 7 | 0.0% |
| Hispanic or Latino | 5,288 | 16.6% |
| Native / Alaskan | 92 | 0.3% |
| White / Caucasian | 24,312 | 76.2% |
| Two or more Races | 2,066 | 6.5% |
| Some other Race | 1,335 | 4.2% |
| Total | 31,889 | 100.0% |
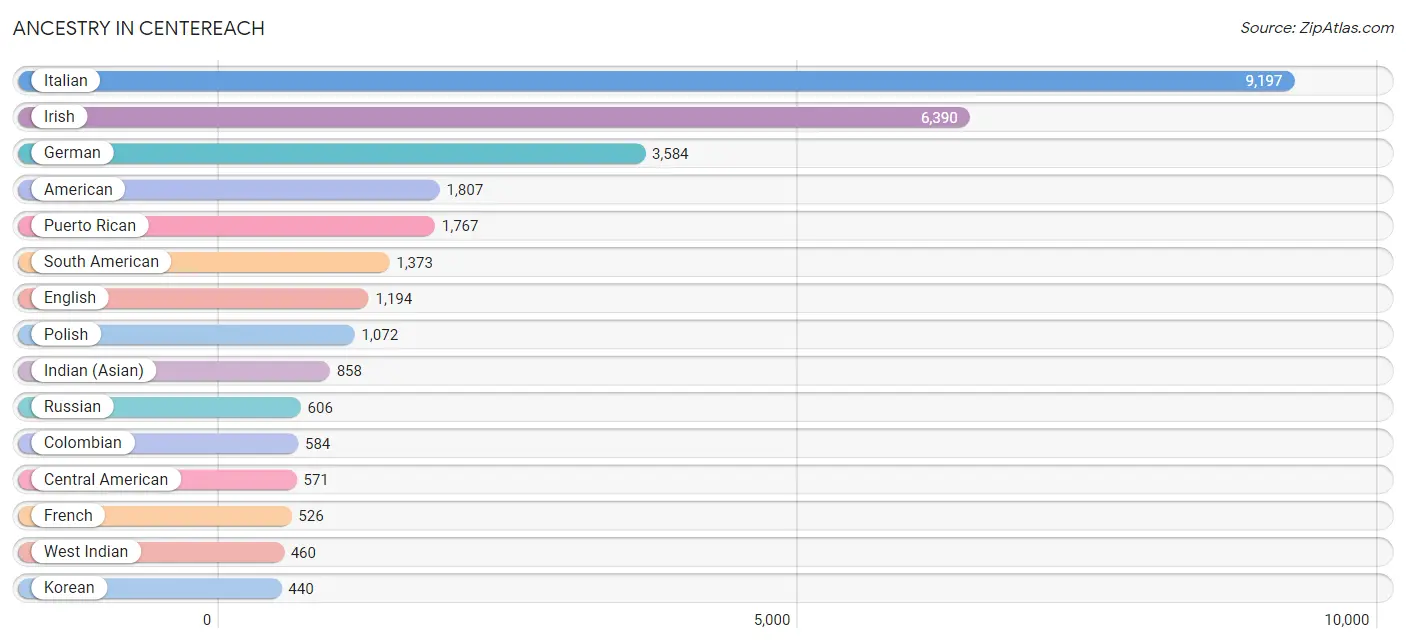
Ancestry in Centereach
The most populous ancestries reported in Centereach are Italian (9,197 | 28.8%), Irish (6,390 | 20.0%), German (3,584 | 11.2%), American (1,807 | 5.7%), and Puerto Rican (1,767 | 5.5%), together accounting for 71.3% of all Centereach residents.
| Ancestry | # Population | % Population |
| African | 11 | 0.0% |
| American | 1,807 | 5.7% |
| Arab | 378 | 1.2% |
| Argentinean | 137 | 0.4% |
| Armenian | 31 | 0.1% |
| Austrian | 138 | 0.4% |
| Barbadian | 35 | 0.1% |
| Belgian | 49 | 0.2% |
| Bhutanese | 32 | 0.1% |
| Brazilian | 11 | 0.0% |
| British | 5 | 0.0% |
| British West Indian | 7 | 0.0% |
| Bulgarian | 30 | 0.1% |
| Burmese | 49 | 0.2% |
| Canadian | 20 | 0.1% |
| Central American | 571 | 1.8% |
| Central American Indian | 428 | 1.3% |
| Chilean | 17 | 0.1% |
| Colombian | 584 | 1.8% |
| Costa Rican | 12 | 0.0% |
| Croatian | 41 | 0.1% |
| Cuban | 209 | 0.7% |
| Czech | 66 | 0.2% |
| Czechoslovakian | 50 | 0.2% |
| Danish | 18 | 0.1% |
| Delaware | 121 | 0.4% |
| Dominican | 385 | 1.2% |
| Dutch | 52 | 0.2% |
| Eastern European | 60 | 0.2% |
| Ecuadorian | 407 | 1.3% |
| Egyptian | 167 | 0.5% |
| English | 1,194 | 3.7% |
| Ethiopian | 62 | 0.2% |
| European | 363 | 1.1% |
| Filipino | 29 | 0.1% |
| Finnish | 60 | 0.2% |
| French | 526 | 1.7% |
| French American Indian | 11 | 0.0% |
| French Canadian | 116 | 0.4% |
| German | 3,584 | 11.2% |
| Ghanaian | 3 | 0.0% |
| Greek | 433 | 1.4% |
| Guamanian / Chamorro | 30 | 0.1% |
| Guatemalan | 141 | 0.4% |
| Guyanese | 3 | 0.0% |
| Haitian | 297 | 0.9% |
| Honduran | 233 | 0.7% |
| Hungarian | 119 | 0.4% |
| Indian (Asian) | 858 | 2.7% |
| Iranian | 8 | 0.0% |
| Iraqi | 35 | 0.1% |
| Irish | 6,390 | 20.0% |
| Iroquois | 1 | 0.0% |
| Israeli | 42 | 0.1% |
| Italian | 9,197 | 28.8% |
| Jamaican | 108 | 0.3% |
| Jordanian | 139 | 0.4% |
| Korean | 440 | 1.4% |
| Lebanese | 23 | 0.1% |
| Lithuanian | 107 | 0.3% |
| Maltese | 3 | 0.0% |
| Mexican | 387 | 1.2% |
| Mexican American Indian | 9 | 0.0% |
| Nicaraguan | 21 | 0.1% |
| Nigerian | 8 | 0.0% |
| Northern European | 13 | 0.0% |
| Norwegian | 263 | 0.8% |
| Okinawan | 22 | 0.1% |
| Pakistani | 22 | 0.1% |
| Panamanian | 15 | 0.1% |
| Peruvian | 208 | 0.6% |
| Polish | 1,072 | 3.4% |
| Portuguese | 160 | 0.5% |
| Puerto Rican | 1,767 | 5.5% |
| Romanian | 35 | 0.1% |
| Russian | 606 | 1.9% |
| Salvadoran | 149 | 0.5% |
| Scotch-Irish | 46 | 0.1% |
| Scottish | 284 | 0.9% |
| Slovak | 30 | 0.1% |
| South American | 1,373 | 4.3% |
| Spaniard | 145 | 0.4% |
| Spanish | 291 | 0.9% |
| Subsaharan African | 100 | 0.3% |
| Swedish | 100 | 0.3% |
| Swiss | 10 | 0.0% |
| Syrian | 5 | 0.0% |
| Thai | 342 | 1.1% |
| Trinidadian and Tobagonian | 343 | 1.1% |
| Turkish | 375 | 1.2% |
| Ukrainian | 175 | 0.5% |
| Uruguayan | 4 | 0.0% |
| Venezuelan | 16 | 0.1% |
| Vietnamese | 45 | 0.1% |
| Welsh | 19 | 0.1% |
| West Indian | 460 | 1.4% | View All 96 Rows |
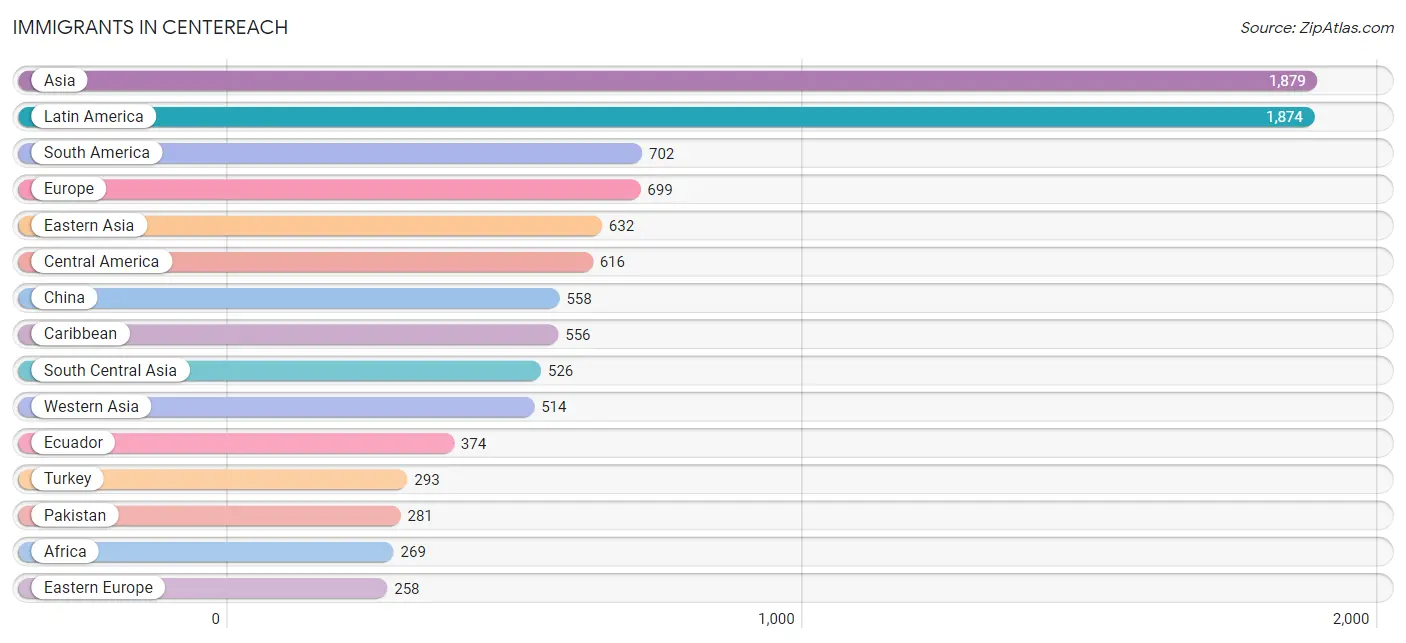
Immigrants in Centereach
The most numerous immigrant groups reported in Centereach came from Asia (1,879 | 5.9%), Latin America (1,874 | 5.9%), South America (702 | 2.2%), Europe (699 | 2.2%), and Eastern Asia (632 | 2.0%), together accounting for 18.1% of all Centereach residents.
| Immigration Origin | # Population | % Population |
| Africa | 269 | 0.8% |
| Argentina | 35 | 0.1% |
| Asia | 1,879 | 5.9% |
| Australia | 21 | 0.1% |
| Bangladesh | 81 | 0.3% |
| Belarus | 7 | 0.0% |
| Brazil | 8 | 0.0% |
| Bulgaria | 16 | 0.1% |
| Canada | 6 | 0.0% |
| Caribbean | 556 | 1.7% |
| Central America | 616 | 1.9% |
| Chile | 11 | 0.0% |
| China | 558 | 1.8% |
| Colombia | 217 | 0.7% |
| Costa Rica | 12 | 0.0% |
| Cuba | 27 | 0.1% |
| Czechoslovakia | 8 | 0.0% |
| Dominican Republic | 81 | 0.3% |
| Eastern Africa | 31 | 0.1% |
| Eastern Asia | 632 | 2.0% |
| Eastern Europe | 258 | 0.8% |
| Ecuador | 374 | 1.2% |
| Egypt | 151 | 0.5% |
| El Salvador | 103 | 0.3% |
| England | 131 | 0.4% |
| Ethiopia | 19 | 0.1% |
| Europe | 699 | 2.2% |
| France | 58 | 0.2% |
| Germany | 93 | 0.3% |
| Ghana | 3 | 0.0% |
| Greece | 49 | 0.2% |
| Guatemala | 146 | 0.5% |
| Guyana | 13 | 0.0% |
| Haiti | 123 | 0.4% |
| Honduras | 127 | 0.4% |
| Hong Kong | 19 | 0.1% |
| India | 147 | 0.5% |
| Iran | 8 | 0.0% |
| Iraq | 14 | 0.0% |
| Ireland | 5 | 0.0% |
| Israel | 42 | 0.1% |
| Italy | 30 | 0.1% |
| Jamaica | 162 | 0.5% |
| Japan | 6 | 0.0% |
| Jordan | 63 | 0.2% |
| Korea | 68 | 0.2% |
| Kuwait | 21 | 0.1% |
| Latin America | 1,874 | 5.9% |
| Lebanon | 5 | 0.0% |
| Mexico | 213 | 0.7% |
| Nepal | 9 | 0.0% |
| Netherlands | 18 | 0.1% |
| Nigeria | 43 | 0.1% |
| Northern Africa | 151 | 0.5% |
| Northern Europe | 162 | 0.5% |
| Norway | 3 | 0.0% |
| Oceania | 21 | 0.1% |
| Pakistan | 281 | 0.9% |
| Panama | 15 | 0.1% |
| Philippines | 196 | 0.6% |
| Poland | 212 | 0.7% |
| Portugal | 27 | 0.1% |
| Romania | 7 | 0.0% |
| Scotland | 23 | 0.1% |
| Singapore | 11 | 0.0% |
| South Africa | 32 | 0.1% |
| South America | 702 | 2.2% |
| South Central Asia | 526 | 1.7% |
| South Eastern Asia | 207 | 0.6% |
| Southern Europe | 106 | 0.3% |
| St. Vincent and the Grenadines | 7 | 0.0% |
| Switzerland | 4 | 0.0% |
| Taiwan | 47 | 0.2% |
| Trinidad and Tobago | 93 | 0.3% |
| Turkey | 293 | 0.9% |
| Uganda | 5 | 0.0% |
| Ukraine | 8 | 0.0% |
| Uruguay | 28 | 0.1% |
| Venezuela | 16 | 0.1% |
| West Indies | 56 | 0.2% |
| Western Africa | 55 | 0.2% |
| Western Asia | 514 | 1.6% |
| Western Europe | 173 | 0.5% | View All 83 Rows |
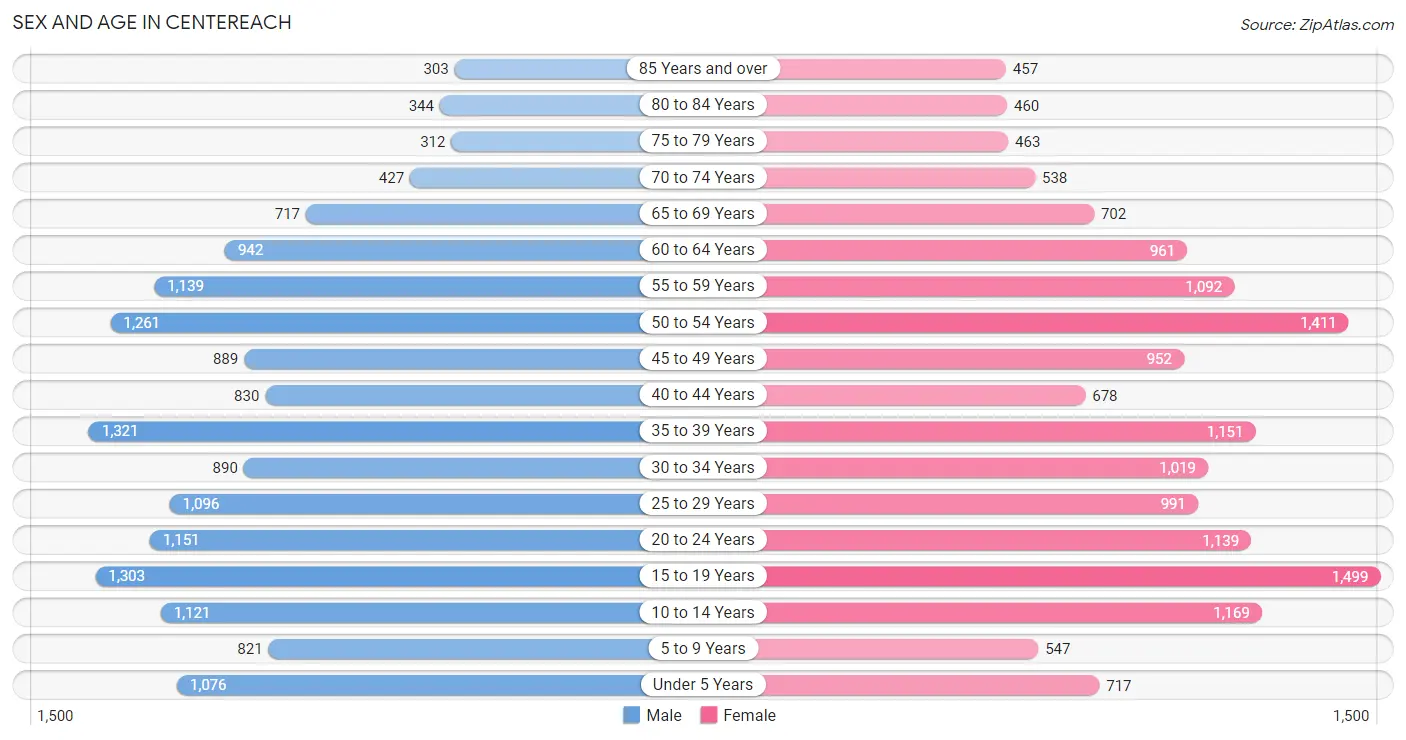
Sex and Age in Centereach
Sex and Age in Centereach
The most populous age groups in Centereach are 35 to 39 Years (1,321 | 8.3%) for men and 15 to 19 Years (1,499 | 9.4%) for women.
| Age Bracket | Male | Female |
| Under 5 Years | 1,076 (6.8%) | 717 (4.5%) |
| 5 to 9 Years | 821 (5.1%) | 547 (3.4%) |
| 10 to 14 Years | 1,121 (7.0%) | 1,169 (7.3%) |
| 15 to 19 Years | 1,303 (8.2%) | 1,499 (9.4%) |
| 20 to 24 Years | 1,151 (7.2%) | 1,139 (7.1%) |
| 25 to 29 Years | 1,096 (6.9%) | 991 (6.2%) |
| 30 to 34 Years | 890 (5.6%) | 1,019 (6.4%) |
| 35 to 39 Years | 1,321 (8.3%) | 1,151 (7.2%) |
| 40 to 44 Years | 830 (5.2%) | 678 (4.3%) |
| 45 to 49 Years | 889 (5.6%) | 952 (6.0%) |
| 50 to 54 Years | 1,261 (7.9%) | 1,411 (8.8%) |
| 55 to 59 Years | 1,139 (7.1%) | 1,092 (6.9%) |
| 60 to 64 Years | 942 (5.9%) | 961 (6.0%) |
| 65 to 69 Years | 717 (4.5%) | 702 (4.4%) |
| 70 to 74 Years | 427 (2.7%) | 538 (3.4%) |
| 75 to 79 Years | 312 (2.0%) | 463 (2.9%) |
| 80 to 84 Years | 344 (2.2%) | 460 (2.9%) |
| 85 Years and over | 303 (1.9%) | 457 (2.9%) |
| Total | 15,943 (100.0%) | 15,946 (100.0%) |
Families and Households in Centereach
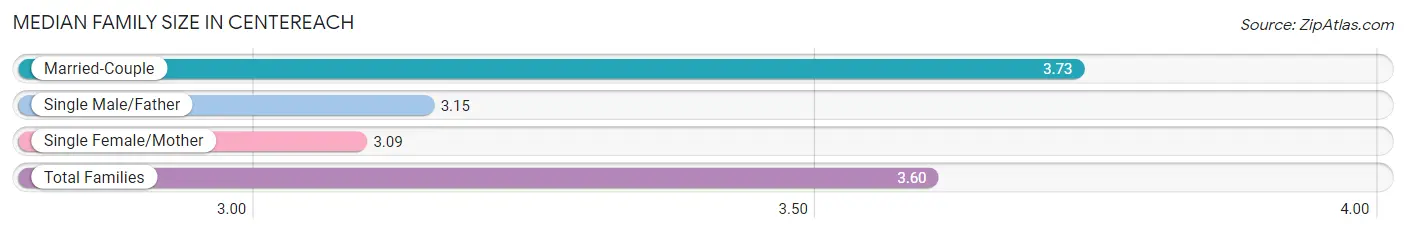
Median Family Size in Centereach
The median family size in Centereach is 3.60 persons per family, with married-couple families (6,214 | 79.0%) accounting for the largest median family size of 3.73 persons per family. On the other hand, single female/mother families (1,164 | 14.8%) represent the smallest median family size with 3.09 persons per family.
| Family Type | # Families | Family Size |
| Married-Couple | 6,214 (79.0%) | 3.73 |
| Single Male/Father | 486 (6.2%) | 3.15 |
| Single Female/Mother | 1,164 (14.8%) | 3.09 |
| Total Families | 7,864 (100.0%) | 3.60 |
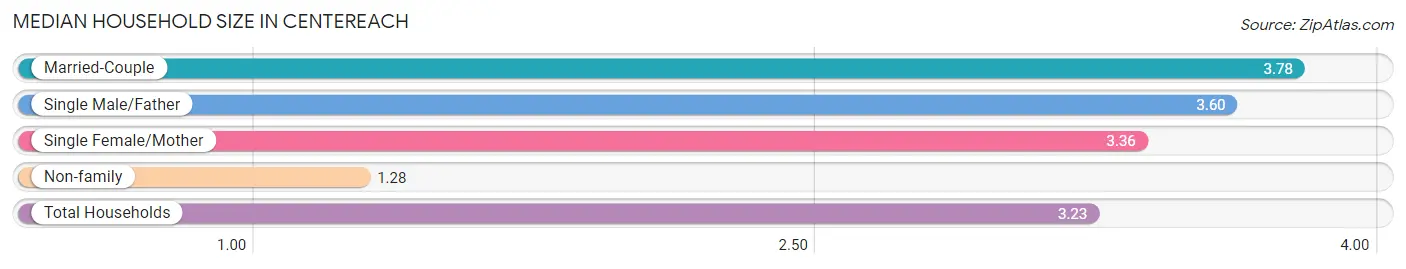
Median Household Size in Centereach
The median household size in Centereach is 3.23 persons per household, with married-couple households (6,214 | 63.4%) accounting for the largest median household size of 3.78 persons per household. non-family households (1,942 | 19.8%) represent the smallest median household size with 1.28 persons per household.
| Household Type | # Households | Household Size |
| Married-Couple | 6,214 (63.4%) | 3.78 |
| Single Male/Father | 486 (5.0%) | 3.60 |
| Single Female/Mother | 1,164 (11.9%) | 3.36 |
| Non-family | 1,942 (19.8%) | 1.28 |
| Total Households | 9,806 (100.0%) | 3.23 |
Household Size by Marriage Status in Centereach
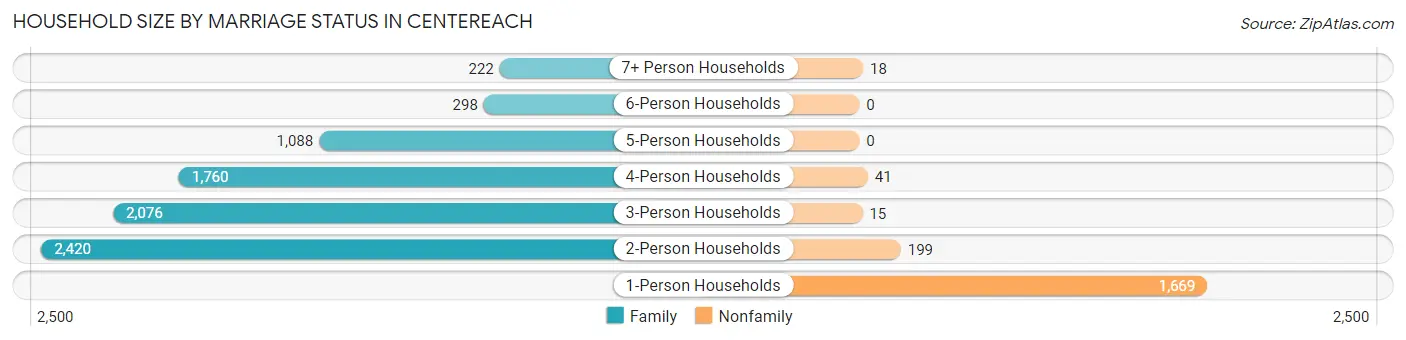
Out of a total of 9,806 households in Centereach, 7,864 (80.2%) are family households, while 1,942 (19.8%) are nonfamily households. The most numerous type of family households are 2-person households, comprising 2,420, and the most common type of nonfamily households are 1-person households, comprising 1,669.
| Household Size | Family Households | Nonfamily Households |
| 1-Person Households | - | 1,669 (17.0%) |
| 2-Person Households | 2,420 (24.7%) | 199 (2.0%) |
| 3-Person Households | 2,076 (21.2%) | 15 (0.2%) |
| 4-Person Households | 1,760 (17.9%) | 41 (0.4%) |
| 5-Person Households | 1,088 (11.1%) | 0 (0.0%) |
| 6-Person Households | 298 (3.0%) | 0 (0.0%) |
| 7+ Person Households | 222 (2.3%) | 18 (0.2%) |
| Total | 7,864 (80.2%) | 1,942 (19.8%) |
Female Fertility in Centereach
Fertility by Age in Centereach
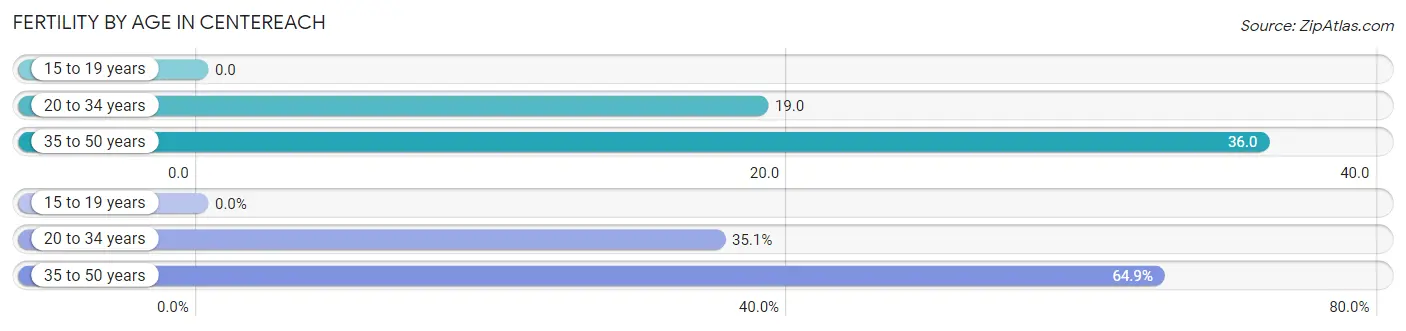
Average fertility rate in Centereach is 22.0 births per 1,000 women. Women in the age bracket of 35 to 50 years have the highest fertility rate with 36.0 births per 1,000 women. Women in the age bracket of 35 to 50 years acount for 64.9% of all women with births.
| Age Bracket | Women with Births | Births / 1,000 Women |
| 15 to 19 years | 0 (0.0%) | 0.0 |
| 20 to 34 years | 60 (35.1%) | 19.0 |
| 35 to 50 years | 111 (64.9%) | 36.0 |
| Total | 171 (100.0%) | 22.0 |
Fertility by Age by Marriage Status in Centereach
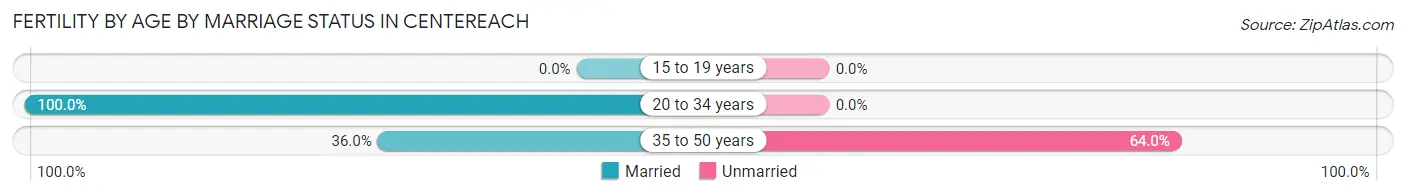
58.5% of women with births (171) in Centereach are married. The highest percentage of unmarried women with births falls into 35 to 50 years age bracket with 64.0% of them unmarried at the time of birth, while the lowest percentage of unmarried women with births belong to 20 to 34 years age bracket with 0.0% of them unmarried.
| Age Bracket | Married | Unmarried |
| 15 to 19 years | 0 (0.0%) | 0 (0.0%) |
| 20 to 34 years | 60 (100.0%) | 0 (0.0%) |
| 35 to 50 years | 40 (36.0%) | 71 (64.0%) |
| Total | 100 (58.5%) | 71 (41.5%) |
Fertility by Education in Centereach
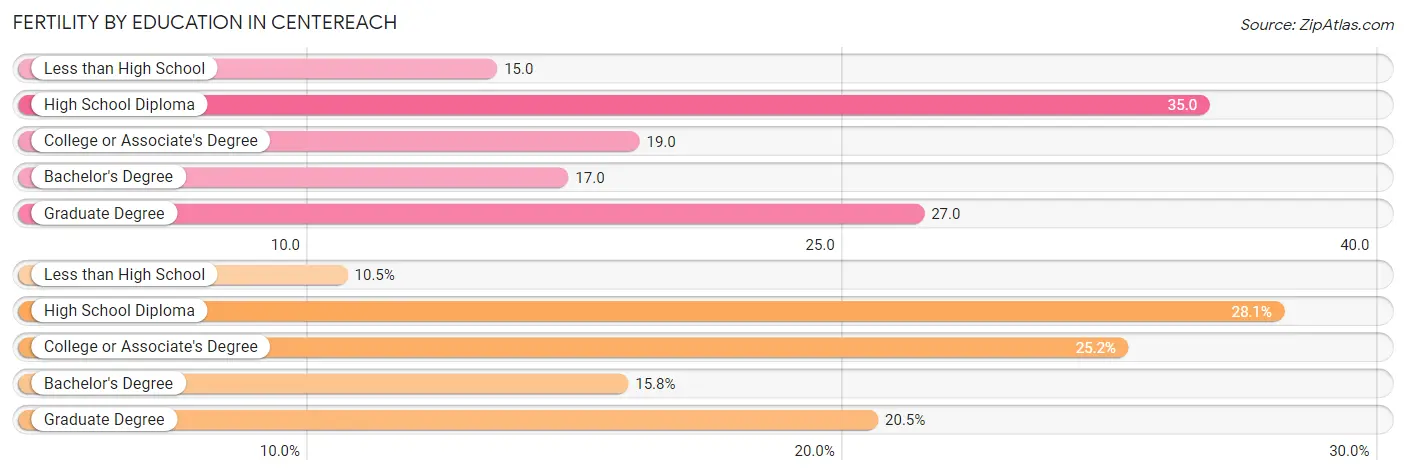
Average fertility rate in Centereach is 22.0 births per 1,000 women. Women with the education attainment of high school diploma have the highest fertility rate of 35.0 births per 1,000 women, while women with the education attainment of less than high school have the lowest fertility at 15.0 births per 1,000 women. Women with the education attainment of high school diploma represent 28.1% of all women with births.
| Educational Attainment | Women with Births | Births / 1,000 Women |
| Less than High School | 18 (10.5%) | 15.0 |
| High School Diploma | 48 (28.1%) | 35.0 |
| College or Associate's Degree | 43 (25.2%) | 19.0 |
| Bachelor's Degree | 27 (15.8%) | 17.0 |
| Graduate Degree | 35 (20.5%) | 27.0 |
| Total | 171 (100.0%) | 22.0 |
Fertility by Education by Marriage Status in Centereach
41.5% of women with births in Centereach are unmarried. Women with the educational attainment of bachelor's degree are most likely to be married with 100.0% of them married at childbirth, while women with the educational attainment of less than high school are least likely to be married with 94.4% of them unmarried at childbirth.
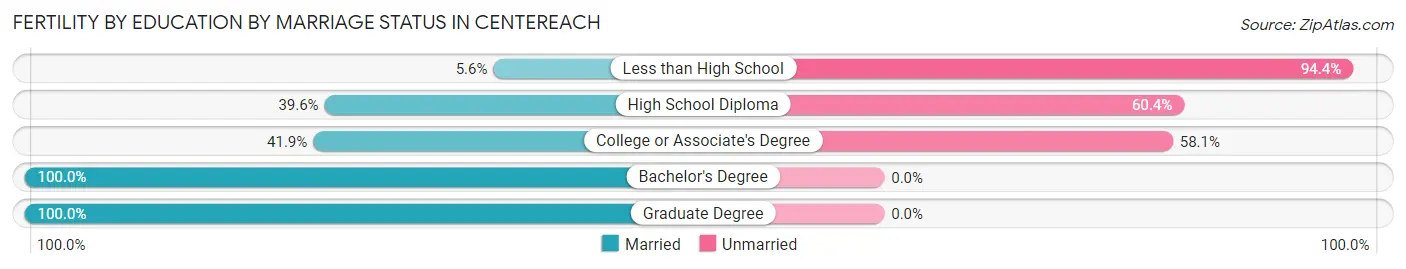
| Educational Attainment | Married | Unmarried |
| Less than High School | 1 (5.6%) | 17 (94.4%) |
| High School Diploma | 19 (39.6%) | 29 (60.4%) |
| College or Associate's Degree | 18 (41.9%) | 25 (58.1%) |
| Bachelor's Degree | 27 (100.0%) | 0 (0.0%) |
| Graduate Degree | 35 (100.0%) | 0 (0.0%) |
| Total | 100 (58.5%) | 71 (41.5%) |
Employment Characteristics in Centereach
Employment by Class of Employer in Centereach
Among the 15,506 employed individuals in Centereach, private company employees (9,292 | 59.9%), local government employees (1,700 | 11.0%), and state government employees (1,676 | 10.8%) make up the most common classes of employment.
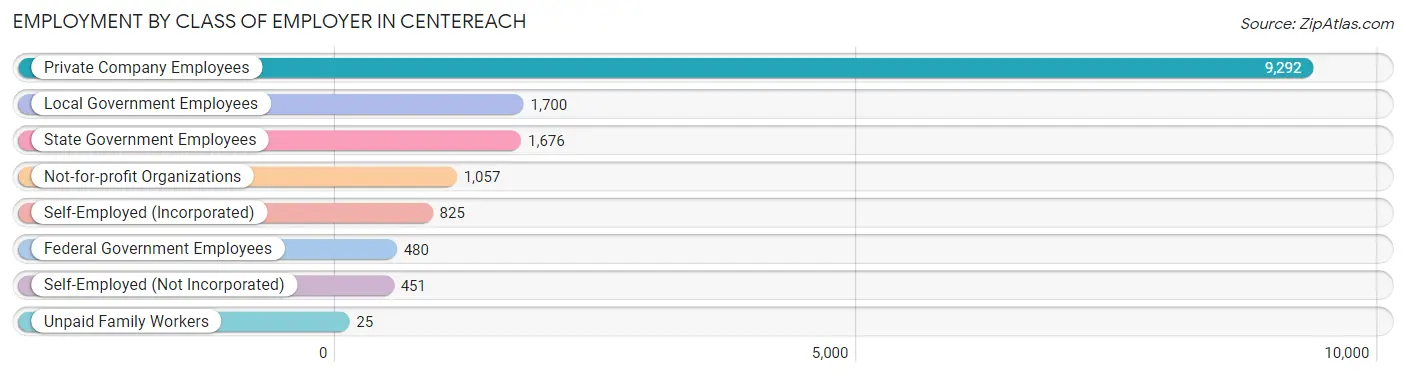
| Employer Class | # Employees | % Employees |
| Private Company Employees | 9,292 | 59.9% |
| Self-Employed (Incorporated) | 825 | 5.3% |
| Self-Employed (Not Incorporated) | 451 | 2.9% |
| Not-for-profit Organizations | 1,057 | 6.8% |
| Local Government Employees | 1,700 | 11.0% |
| State Government Employees | 1,676 | 10.8% |
| Federal Government Employees | 480 | 3.1% |
| Unpaid Family Workers | 25 | 0.2% |
| Total | 15,506 | 100.0% |
Employment Status by Age in Centereach
According to the labor force statistics for Centereach, out of the total population over 16 years of age (26,133), 64.2% or 16,777 individuals are in the labor force, with 5.6% or 940 of them unemployed. The age group with the highest labor force participation rate is 30 to 34 years, with 85.8% or 1,638 individuals in the labor force. Within the labor force, the 16 to 19 years age range has the highest percentage of unemployed individuals, with 29.4% or 266 of them being unemployed.
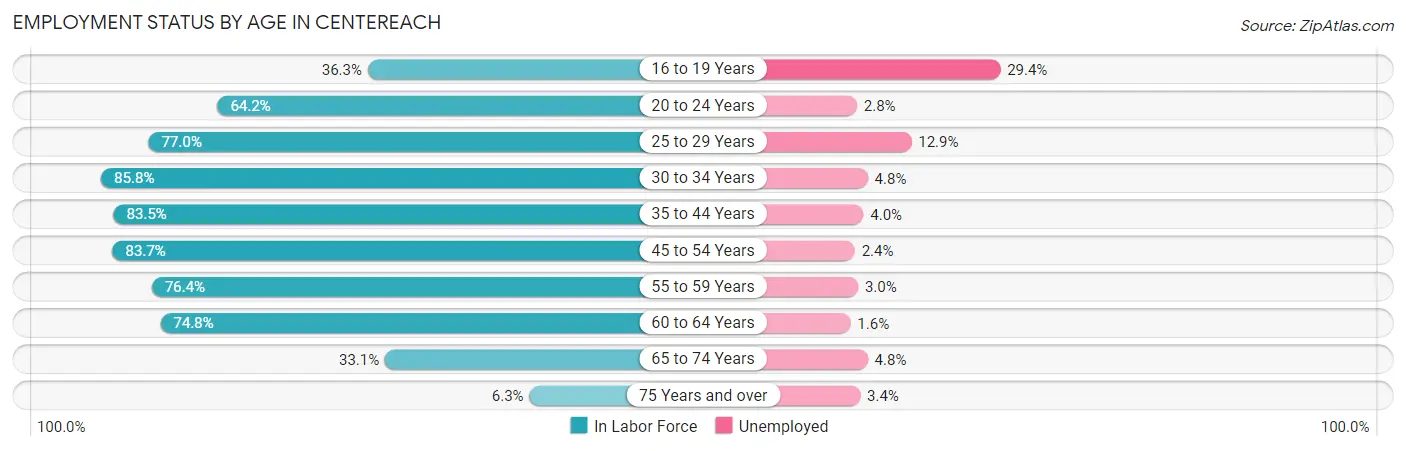
| Age Bracket | In Labor Force | Unemployed |
| 16 to 19 Years | 906 (36.3%) | 266 (29.4%) |
| 20 to 24 Years | 1,470 (64.2%) | 41 (2.8%) |
| 25 to 29 Years | 1,607 (77.0%) | 207 (12.9%) |
| 30 to 34 Years | 1,638 (85.8%) | 79 (4.8%) |
| 35 to 44 Years | 3,323 (83.5%) | 133 (4.0%) |
| 45 to 54 Years | 3,777 (83.7%) | 91 (2.4%) |
| 55 to 59 Years | 1,704 (76.4%) | 51 (3.0%) |
| 60 to 64 Years | 1,423 (74.8%) | 23 (1.6%) |
| 65 to 74 Years | 789 (33.1%) | 38 (4.8%) |
| 75 Years and over | 147 (6.3%) | 5 (3.4%) |
| Total | 16,777 (64.2%) | 940 (5.6%) |
Employment Status by Educational Attainment in Centereach
According to labor force statistics for Centereach, 81.0% of individuals (13,465) out of the total population between 25 and 64 years of age (16,623) are in the labor force, with 4.3% or 579 of them being unemployed. The group with the highest labor force participation rate are those with the educational attainment of bachelor's degree or higher, with 88.5% or 5,408 individuals in the labor force. Within the labor force, individuals with less than high school education have the highest percentage of unemployment, with 8.2% or 58 of them being unemployed.
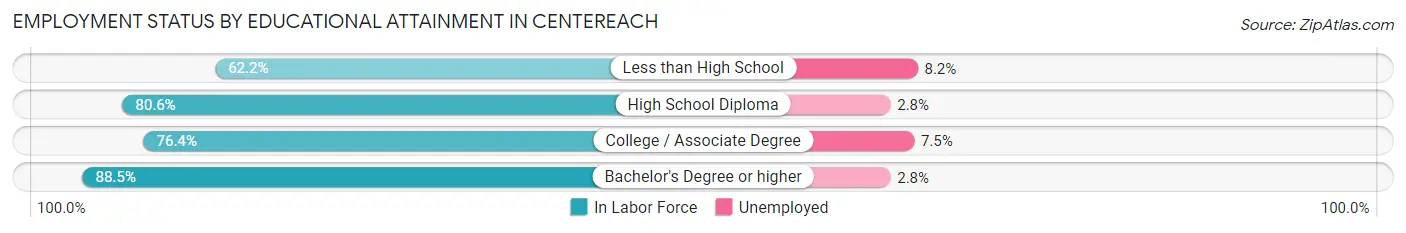
| Educational Attainment | In Labor Force | Unemployed |
| Less than High School | 710 (62.2%) | 94 (8.2%) |
| High School Diploma | 3,759 (80.6%) | 131 (2.8%) |
| College / Associate Degree | 3,595 (76.4%) | 353 (7.5%) |
| Bachelor's Degree or higher | 5,408 (88.5%) | 171 (2.8%) |
| Total | 13,465 (81.0%) | 715 (4.3%) |
Employment Occupations by Sex in Centereach
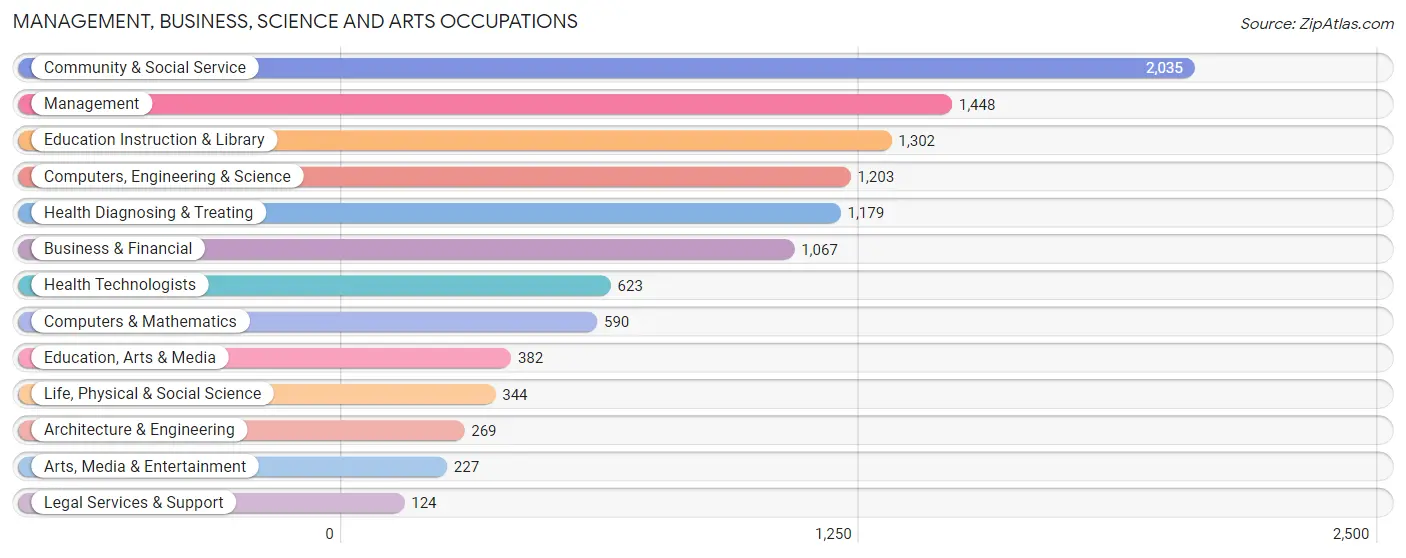
Management, Business, Science and Arts Occupations
The most common Management, Business, Science and Arts occupations in Centereach are Community & Social Service (2,035 | 12.8%), Management (1,448 | 9.1%), Education Instruction & Library (1,302 | 8.2%), Computers, Engineering & Science (1,203 | 7.6%), and Health Diagnosing & Treating (1,179 | 7.4%).
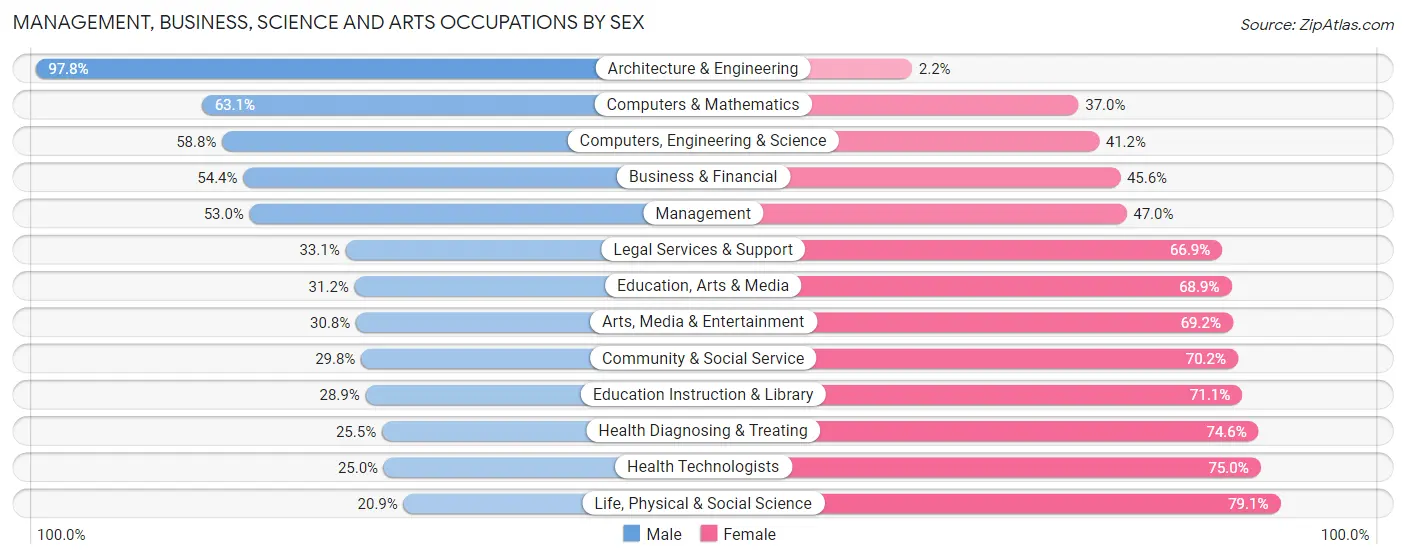
Management, Business, Science and Arts Occupations by Sex
Within the Management, Business, Science and Arts occupations in Centereach, the most male-oriented occupations are Architecture & Engineering (97.8%), Computers & Mathematics (63.0%), and Computers, Engineering & Science (58.8%), while the most female-oriented occupations are Life, Physical & Social Science (79.1%), Health Technologists (75.0%), and Health Diagnosing & Treating (74.6%).
| Occupation | Male | Female |
| Management | 768 (53.0%) | 680 (47.0%) |
| Business & Financial | 580 (54.4%) | 487 (45.6%) |
| Computers, Engineering & Science | 707 (58.8%) | 496 (41.2%) |
| Computers & Mathematics | 372 (63.0%) | 218 (36.9%) |
| Architecture & Engineering | 263 (97.8%) | 6 (2.2%) |
| Life, Physical & Social Science | 72 (20.9%) | 272 (79.1%) |
| Community & Social Service | 606 (29.8%) | 1,429 (70.2%) |
| Education, Arts & Media | 119 (31.1%) | 263 (68.9%) |
| Legal Services & Support | 41 (33.1%) | 83 (66.9%) |
| Education Instruction & Library | 376 (28.9%) | 926 (71.1%) |
| Arts, Media & Entertainment | 70 (30.8%) | 157 (69.2%) |
| Health Diagnosing & Treating | 300 (25.5%) | 879 (74.6%) |
| Health Technologists | 156 (25.0%) | 467 (75.0%) |
| Total (Category) | 2,961 (42.7%) | 3,971 (57.3%) |
| Total (Overall) | 8,135 (51.3%) | 7,717 (48.7%) |
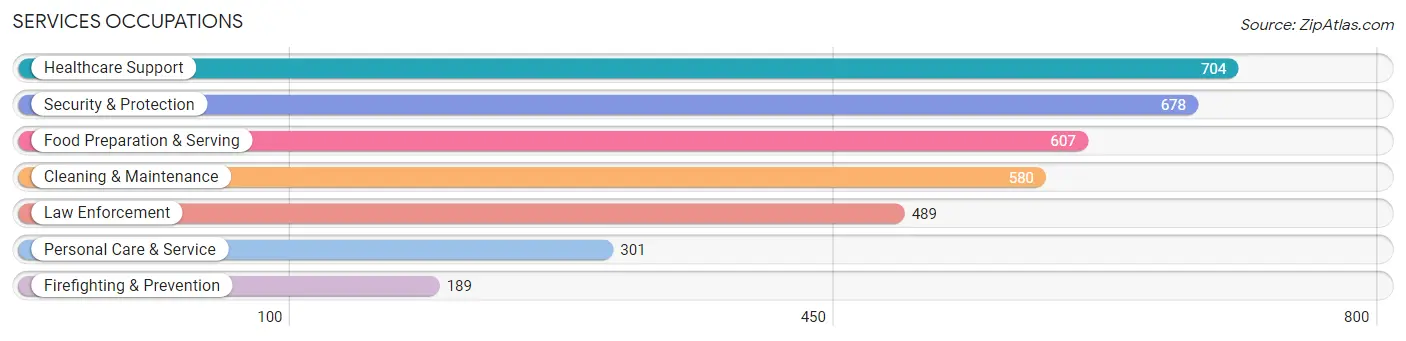
Services Occupations
The most common Services occupations in Centereach are Healthcare Support (704 | 4.4%), Security & Protection (678 | 4.3%), Food Preparation & Serving (607 | 3.8%), Cleaning & Maintenance (580 | 3.7%), and Law Enforcement (489 | 3.1%).
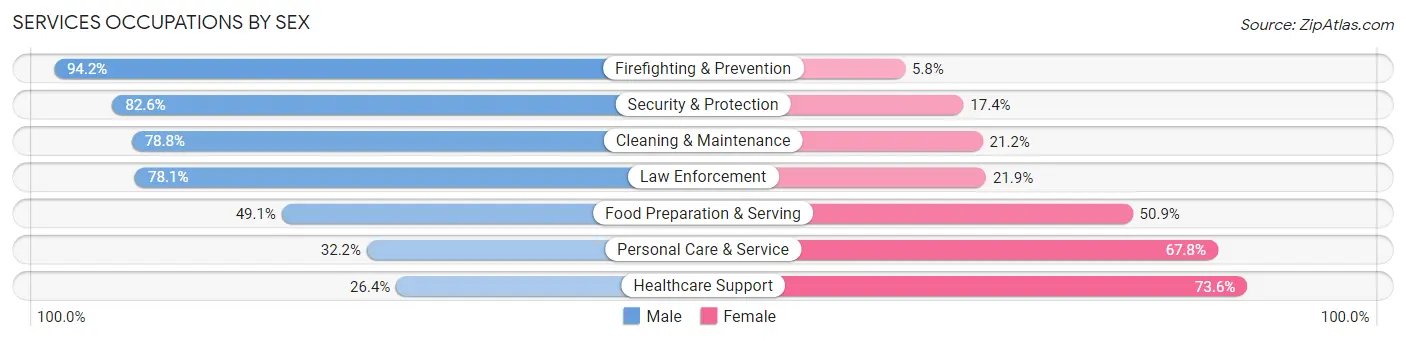
Services Occupations by Sex
Within the Services occupations in Centereach, the most male-oriented occupations are Firefighting & Prevention (94.2%), Security & Protection (82.6%), and Cleaning & Maintenance (78.8%), while the most female-oriented occupations are Healthcare Support (73.6%), Personal Care & Service (67.8%), and Food Preparation & Serving (50.9%).
| Occupation | Male | Female |
| Healthcare Support | 186 (26.4%) | 518 (73.6%) |
| Security & Protection | 560 (82.6%) | 118 (17.4%) |
| Firefighting & Prevention | 178 (94.2%) | 11 (5.8%) |
| Law Enforcement | 382 (78.1%) | 107 (21.9%) |
| Food Preparation & Serving | 298 (49.1%) | 309 (50.9%) |
| Cleaning & Maintenance | 457 (78.8%) | 123 (21.2%) |
| Personal Care & Service | 97 (32.2%) | 204 (67.8%) |
| Total (Category) | 1,598 (55.7%) | 1,272 (44.3%) |
| Total (Overall) | 8,135 (51.3%) | 7,717 (48.7%) |
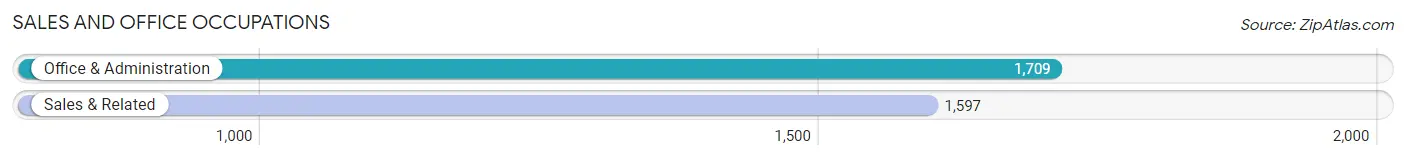
Sales and Office Occupations
The most common Sales and Office occupations in Centereach are Office & Administration (1,709 | 10.8%), and Sales & Related (1,597 | 10.1%).
Sales and Office Occupations by Sex
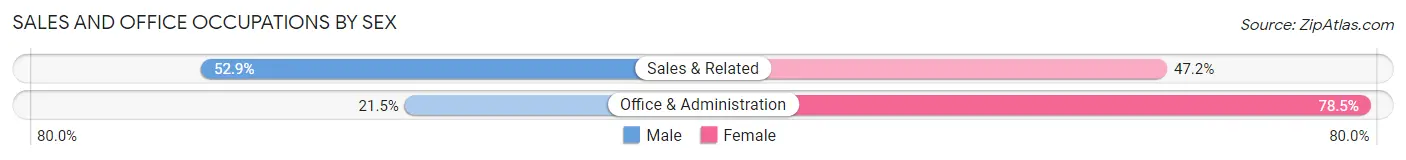
| Occupation | Male | Female |
| Sales & Related | 844 (52.8%) | 753 (47.1%) |
| Office & Administration | 368 (21.5%) | 1,341 (78.5%) |
| Total (Category) | 1,212 (36.7%) | 2,094 (63.3%) |
| Total (Overall) | 8,135 (51.3%) | 7,717 (48.7%) |
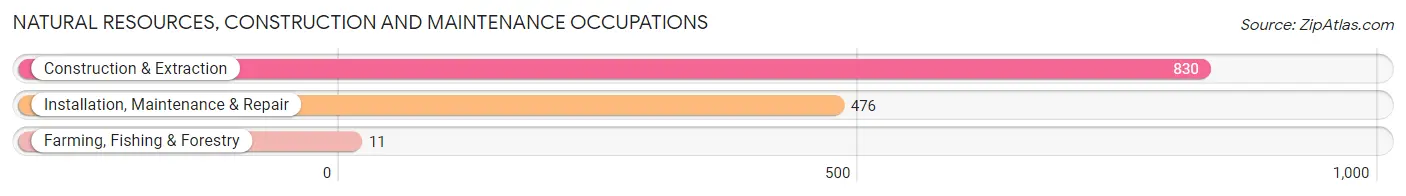
Natural Resources, Construction and Maintenance Occupations
The most common Natural Resources, Construction and Maintenance occupations in Centereach are Construction & Extraction (830 | 5.2%), Installation, Maintenance & Repair (476 | 3.0%), and Farming, Fishing & Forestry (11 | 0.1%).
Natural Resources, Construction and Maintenance Occupations by Sex
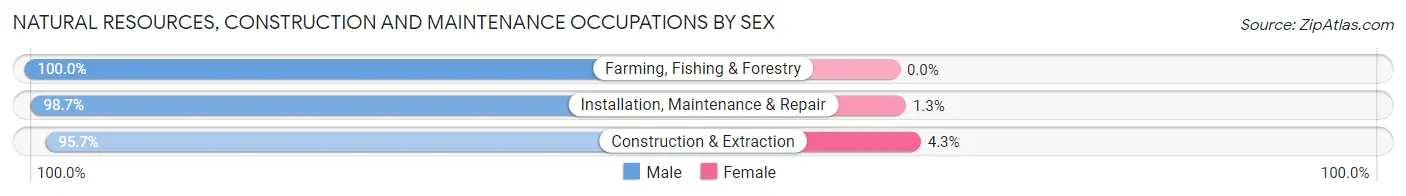
| Occupation | Male | Female |
| Farming, Fishing & Forestry | 11 (100.0%) | 0 (0.0%) |
| Construction & Extraction | 794 (95.7%) | 36 (4.3%) |
| Installation, Maintenance & Repair | 470 (98.7%) | 6 (1.3%) |
| Total (Category) | 1,275 (96.8%) | 42 (3.2%) |
| Total (Overall) | 8,135 (51.3%) | 7,717 (48.7%) |
Production, Transportation and Moving Occupations
The most common Production, Transportation and Moving occupations in Centereach are Production (514 | 3.2%), Transportation (485 | 3.1%), and Material Moving (428 | 2.7%).
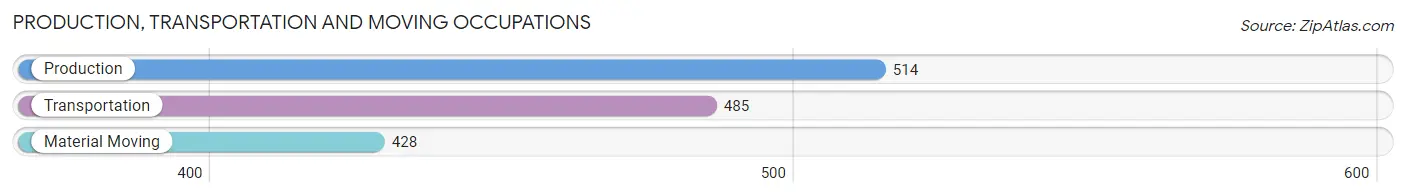
Production, Transportation and Moving Occupations by Sex
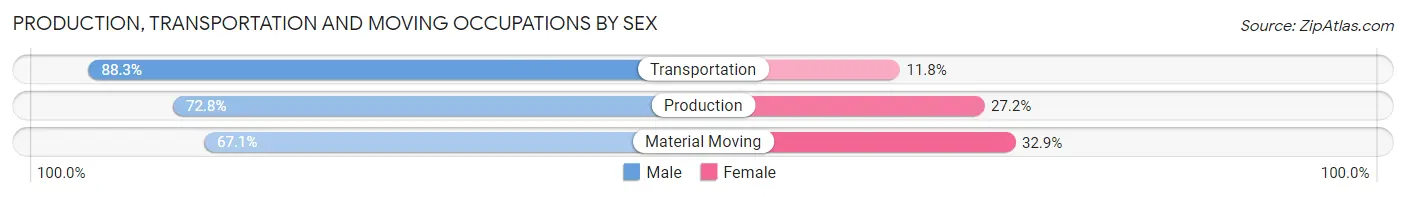
| Occupation | Male | Female |
| Production | 374 (72.8%) | 140 (27.2%) |
| Transportation | 428 (88.2%) | 57 (11.7%) |
| Material Moving | 287 (67.1%) | 141 (32.9%) |
| Total (Category) | 1,089 (76.3%) | 338 (23.7%) |
| Total (Overall) | 8,135 (51.3%) | 7,717 (48.7%) |
Employment Industries by Sex in Centereach
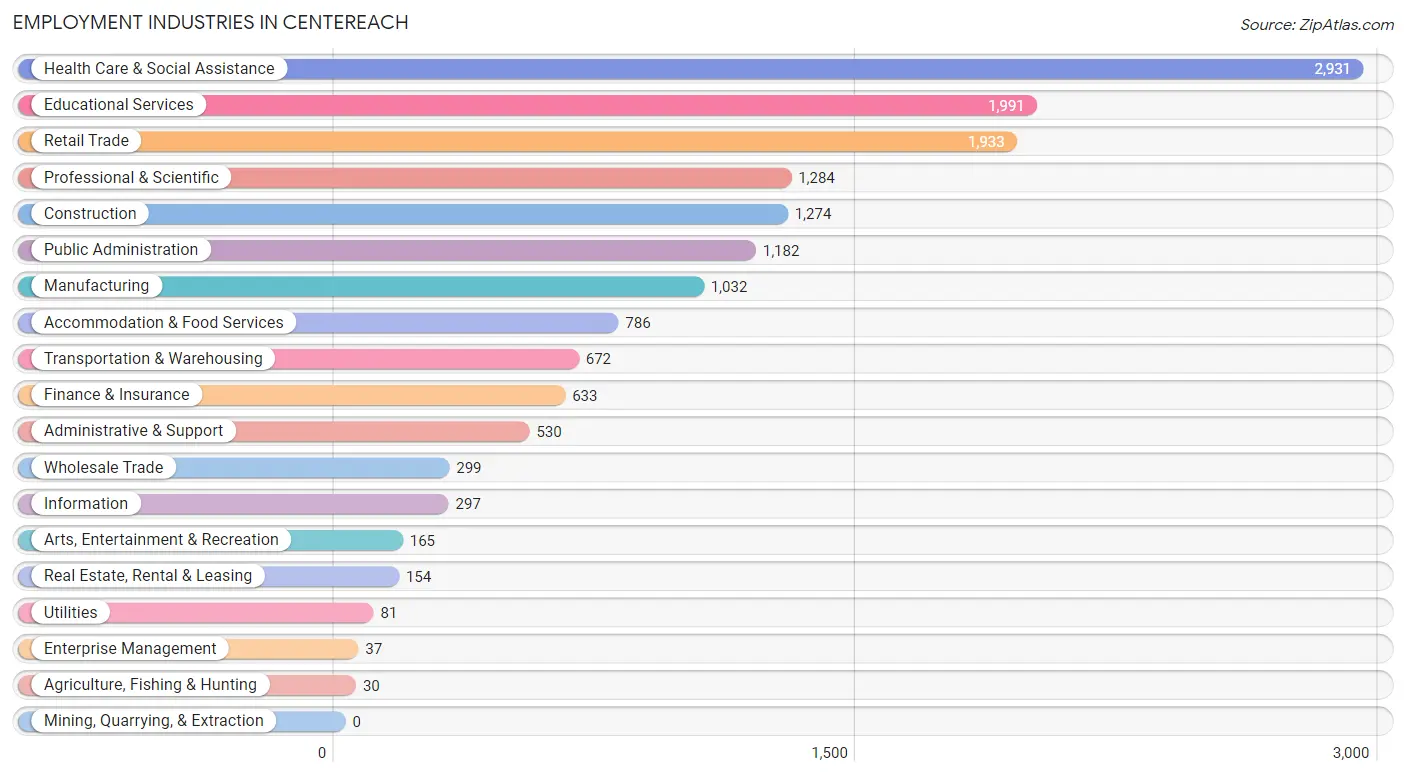
Employment Industries in Centereach
The major employment industries in Centereach include Health Care & Social Assistance (2,931 | 18.5%), Educational Services (1,991 | 12.6%), Retail Trade (1,933 | 12.2%), Professional & Scientific (1,284 | 8.1%), and Construction (1,274 | 8.0%).
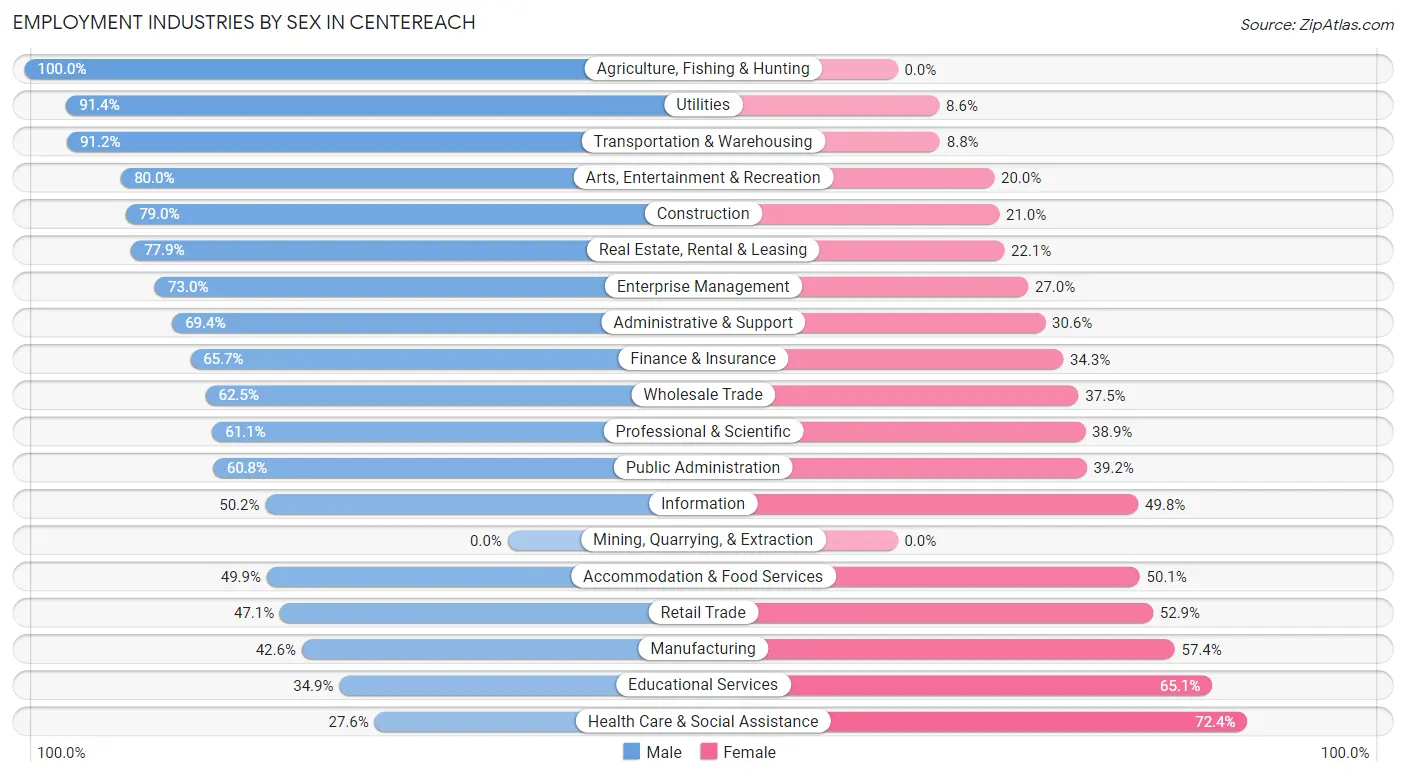
Employment Industries by Sex in Centereach
The Centereach industries that see more men than women are Agriculture, Fishing & Hunting (100.0%), Utilities (91.4%), and Transportation & Warehousing (91.2%), whereas the industries that tend to have a higher number of women are Health Care & Social Assistance (72.4%), Educational Services (65.1%), and Manufacturing (57.4%).
| Industry | Male | Female |
| Agriculture, Fishing & Hunting | 30 (100.0%) | 0 (0.0%) |
| Mining, Quarrying, & Extraction | 0 (0.0%) | 0 (0.0%) |
| Construction | 1,006 (79.0%) | 268 (21.0%) |
| Manufacturing | 440 (42.6%) | 592 (57.4%) |
| Wholesale Trade | 187 (62.5%) | 112 (37.5%) |
| Retail Trade | 911 (47.1%) | 1,022 (52.9%) |
| Transportation & Warehousing | 613 (91.2%) | 59 (8.8%) |
| Utilities | 74 (91.4%) | 7 (8.6%) |
| Information | 149 (50.2%) | 148 (49.8%) |
| Finance & Insurance | 416 (65.7%) | 217 (34.3%) |
| Real Estate, Rental & Leasing | 120 (77.9%) | 34 (22.1%) |
| Professional & Scientific | 785 (61.1%) | 499 (38.9%) |
| Enterprise Management | 27 (73.0%) | 10 (27.0%) |
| Administrative & Support | 368 (69.4%) | 162 (30.6%) |
| Educational Services | 694 (34.9%) | 1,297 (65.1%) |
| Health Care & Social Assistance | 808 (27.6%) | 2,123 (72.4%) |
| Arts, Entertainment & Recreation | 132 (80.0%) | 33 (20.0%) |
| Accommodation & Food Services | 392 (49.9%) | 394 (50.1%) |
| Public Administration | 719 (60.8%) | 463 (39.2%) |
| Total | 8,135 (51.3%) | 7,717 (48.7%) |
Education in Centereach
School Enrollment in Centereach
The most common levels of schooling among the 8,712 students in Centereach are high school (2,183 | 25.1%), middle school (1,893 | 21.7%), and college / undergraduate (1,821 | 20.9%).
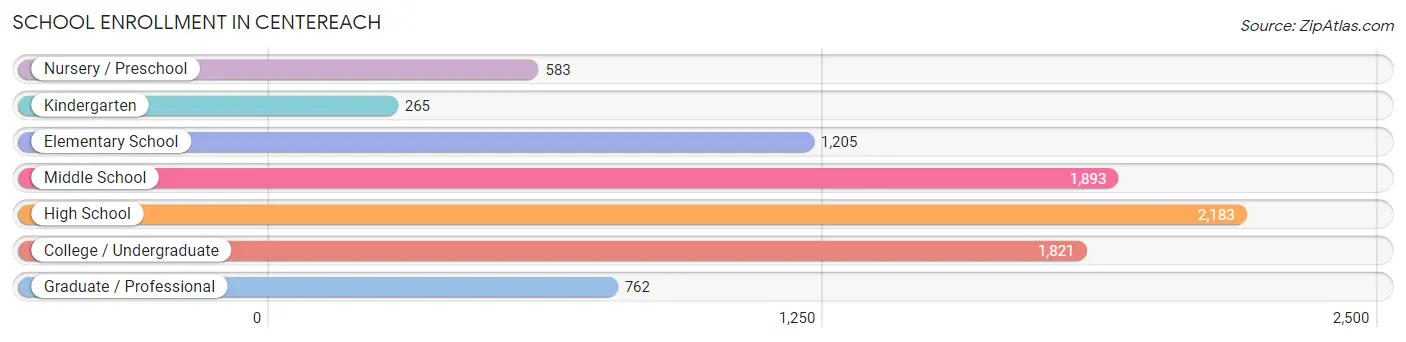
| School Level | # Students | % Students |
| Nursery / Preschool | 583 | 6.7% |
| Kindergarten | 265 | 3.0% |
| Elementary School | 1,205 | 13.8% |
| Middle School | 1,893 | 21.7% |
| High School | 2,183 | 25.1% |
| College / Undergraduate | 1,821 | 20.9% |
| Graduate / Professional | 762 | 8.7% |
| Total | 8,712 | 100.0% |
School Enrollment by Age by Funding Source in Centereach
Out of a total of 8,712 students who are enrolled in schools in Centereach, 784 (9.0%) attend a private institution, while the remaining 7,928 (91.0%) are enrolled in public schools. The age group of 35 years and over has the highest likelihood of being enrolled in private schools, with 113 (35.3% in the age bracket) enrolled. Conversely, the age group of 15 to 17 year olds has the lowest likelihood of being enrolled in a private school, with 1,759 (98.3% in the age bracket) attending a public institution.
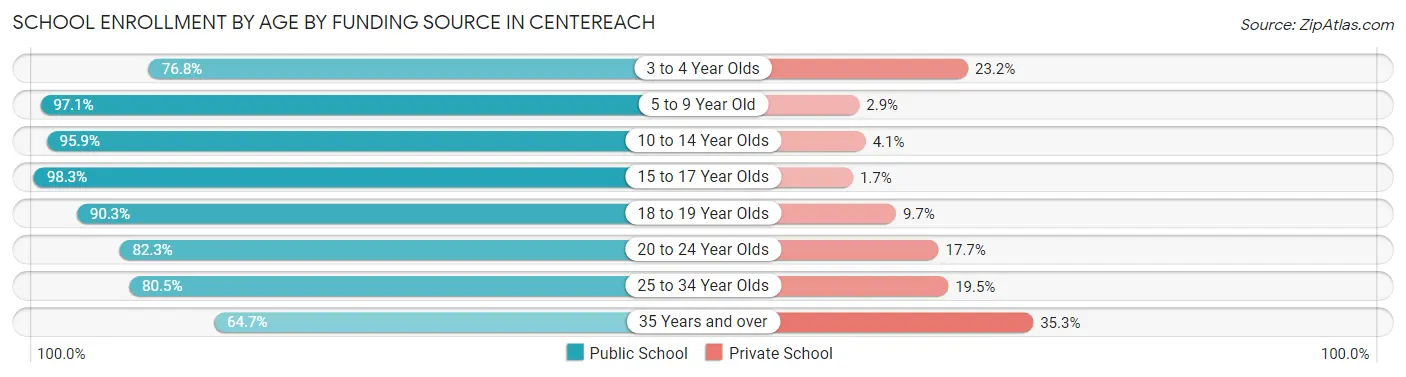
| Age Bracket | Public School | Private School |
| 3 to 4 Year Olds | 438 (76.8%) | 132 (23.2%) |
| 5 to 9 Year Old | 1,328 (97.1%) | 40 (2.9%) |
| 10 to 14 Year Olds | 2,178 (95.9%) | 93 (4.1%) |
| 15 to 17 Year Olds | 1,759 (98.3%) | 31 (1.7%) |
| 18 to 19 Year Olds | 686 (90.3%) | 74 (9.7%) |
| 20 to 24 Year Olds | 727 (82.3%) | 156 (17.7%) |
| 25 to 34 Year Olds | 604 (80.5%) | 146 (19.5%) |
| 35 Years and over | 207 (64.7%) | 113 (35.3%) |
| Total | 7,928 (91.0%) | 784 (9.0%) |
Educational Attainment by Field of Study in Centereach
Business (1,451 | 18.4%), education (1,052 | 13.4%), science & technology (801 | 10.2%), arts & humanities (627 | 8.0%), and bio, nature & agricultural (618 | 7.9%) are the most common fields of study among 7,863 individuals in Centereach who have obtained a bachelor's degree or higher.
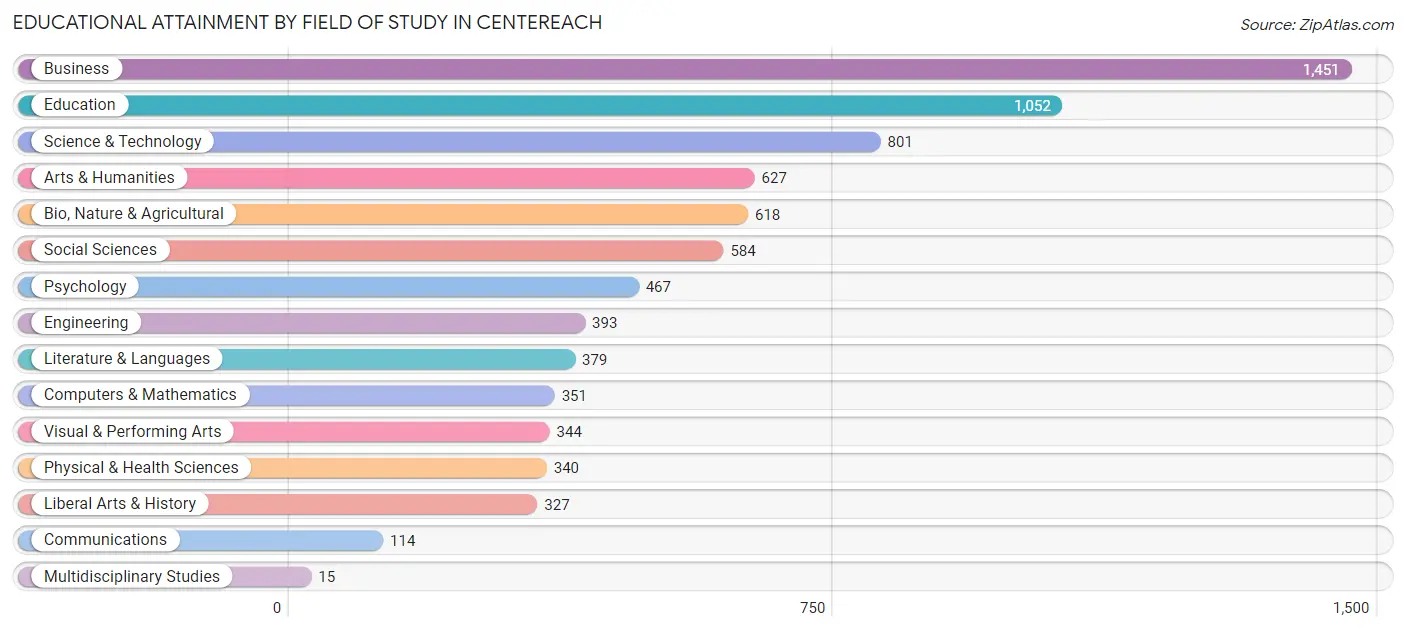
| Field of Study | # Graduates | % Graduates |
| Computers & Mathematics | 351 | 4.5% |
| Bio, Nature & Agricultural | 618 | 7.9% |
| Physical & Health Sciences | 340 | 4.3% |
| Psychology | 467 | 5.9% |
| Social Sciences | 584 | 7.4% |
| Engineering | 393 | 5.0% |
| Multidisciplinary Studies | 15 | 0.2% |
| Science & Technology | 801 | 10.2% |
| Business | 1,451 | 18.4% |
| Education | 1,052 | 13.4% |
| Literature & Languages | 379 | 4.8% |
| Liberal Arts & History | 327 | 4.2% |
| Visual & Performing Arts | 344 | 4.4% |
| Communications | 114 | 1.5% |
| Arts & Humanities | 627 | 8.0% |
| Total | 7,863 | 100.0% |
Transportation & Commute in Centereach
Vehicle Availability by Sex in Centereach
The most prevalent vehicle ownership categories in Centereach are males with 2 vehicles (3,058, accounting for 38.3%) and females with 2 vehicles (2,664, making up 40.7%).
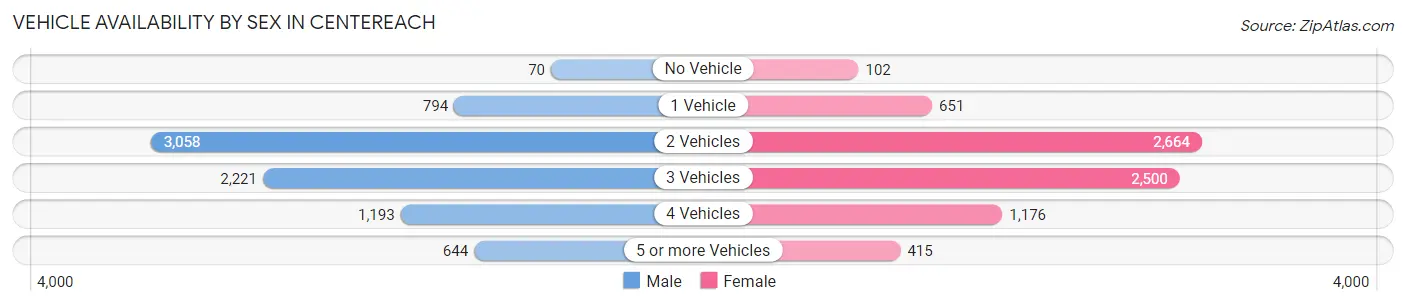
| Vehicles Available | Male | Female |
| No Vehicle | 70 (0.9%) | 102 (1.4%) |
| 1 Vehicle | 794 (10.0%) | 651 (8.7%) |
| 2 Vehicles | 3,058 (38.3%) | 2,664 (35.5%) |
| 3 Vehicles | 2,221 (27.8%) | 2,500 (33.3%) |
| 4 Vehicles | 1,193 (14.9%) | 1,176 (15.7%) |
| 5 or more Vehicles | 644 (8.1%) | 415 (5.5%) |
| Total | 7,980 (100.0%) | 7,508 (100.0%) |
Commute Time in Centereach
The most frequently occuring commute durations in Centereach are 30 to 34 minutes (2,506 commuters, 17.7%), 20 to 24 minutes (2,279 commuters, 16.1%), and 15 to 19 minutes (1,910 commuters, 13.5%).
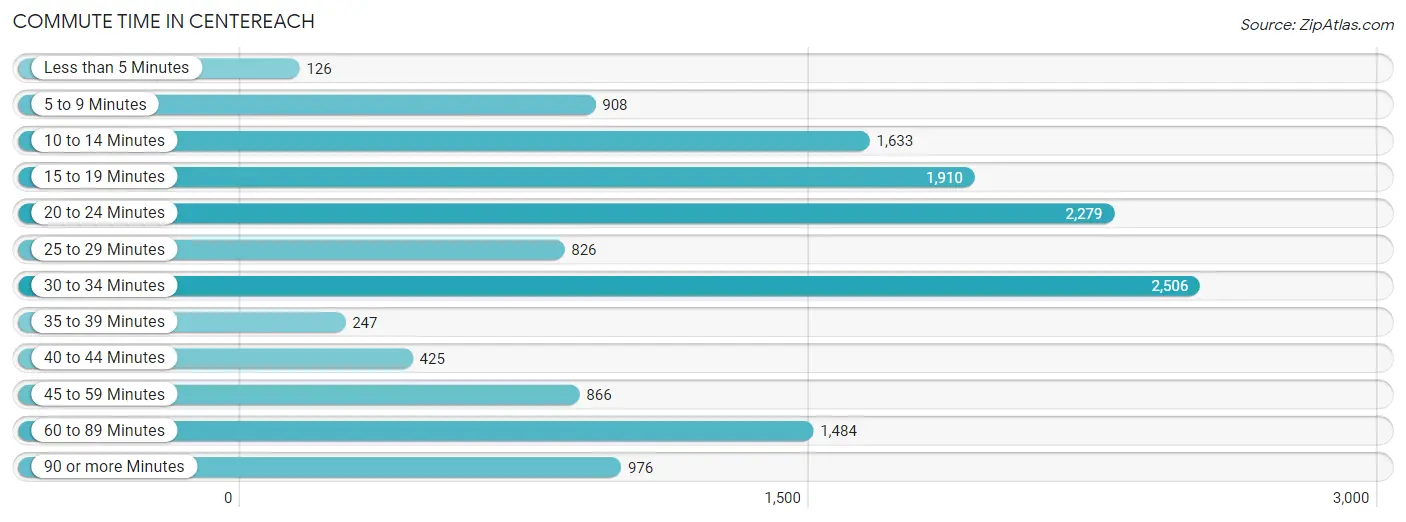
| Commute Time | # Commuters | % Commuters |
| Less than 5 Minutes | 126 | 0.9% |
| 5 to 9 Minutes | 908 | 6.4% |
| 10 to 14 Minutes | 1,633 | 11.5% |
| 15 to 19 Minutes | 1,910 | 13.5% |
| 20 to 24 Minutes | 2,279 | 16.1% |
| 25 to 29 Minutes | 826 | 5.8% |
| 30 to 34 Minutes | 2,506 | 17.7% |
| 35 to 39 Minutes | 247 | 1.7% |
| 40 to 44 Minutes | 425 | 3.0% |
| 45 to 59 Minutes | 866 | 6.1% |
| 60 to 89 Minutes | 1,484 | 10.5% |
| 90 or more Minutes | 976 | 6.9% |
Commute Time by Sex in Centereach
The most common commute times in Centereach are 30 to 34 minutes (1,325 commuters, 17.8%) for males and 20 to 24 minutes (1,244 commuters, 18.5%) for females.
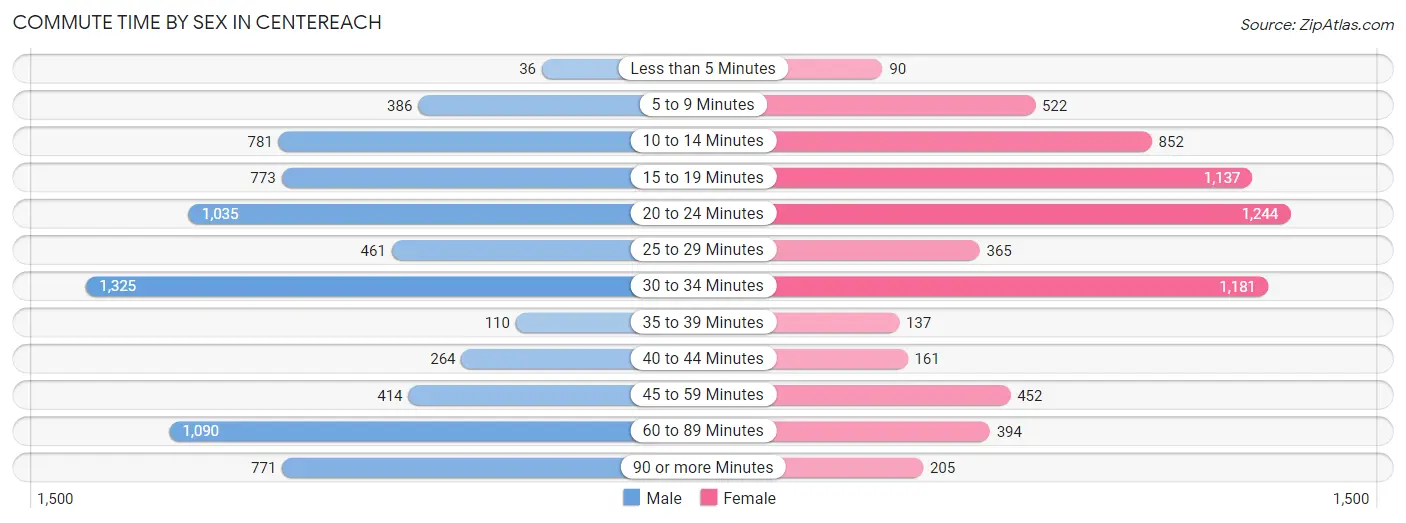
| Commute Time | Male | Female |
| Less than 5 Minutes | 36 (0.5%) | 90 (1.3%) |
| 5 to 9 Minutes | 386 (5.2%) | 522 (7.7%) |
| 10 to 14 Minutes | 781 (10.5%) | 852 (12.6%) |
| 15 to 19 Minutes | 773 (10.4%) | 1,137 (16.9%) |
| 20 to 24 Minutes | 1,035 (13.9%) | 1,244 (18.5%) |
| 25 to 29 Minutes | 461 (6.2%) | 365 (5.4%) |
| 30 to 34 Minutes | 1,325 (17.8%) | 1,181 (17.5%) |
| 35 to 39 Minutes | 110 (1.5%) | 137 (2.0%) |
| 40 to 44 Minutes | 264 (3.5%) | 161 (2.4%) |
| 45 to 59 Minutes | 414 (5.6%) | 452 (6.7%) |
| 60 to 89 Minutes | 1,090 (14.6%) | 394 (5.9%) |
| 90 or more Minutes | 771 (10.3%) | 205 (3.0%) |
Time of Departure to Work by Sex in Centereach
The most frequent times of departure to work in Centereach are 7:00 AM to 7:29 AM (939, 12.6%) for males and 8:00 AM to 8:29 AM (1,223, 18.1%) for females.
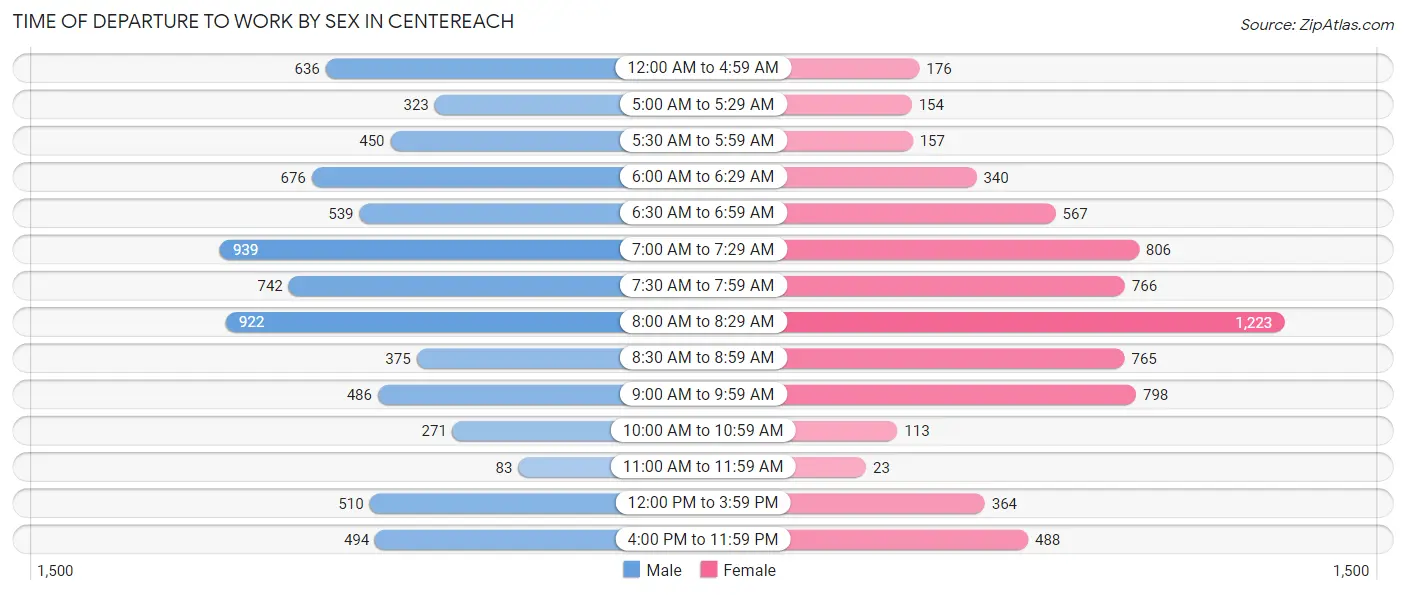
| Time of Departure | Male | Female |
| 12:00 AM to 4:59 AM | 636 (8.5%) | 176 (2.6%) |
| 5:00 AM to 5:29 AM | 323 (4.3%) | 154 (2.3%) |
| 5:30 AM to 5:59 AM | 450 (6.0%) | 157 (2.3%) |
| 6:00 AM to 6:29 AM | 676 (9.1%) | 340 (5.0%) |
| 6:30 AM to 6:59 AM | 539 (7.2%) | 567 (8.4%) |
| 7:00 AM to 7:29 AM | 939 (12.6%) | 806 (12.0%) |
| 7:30 AM to 7:59 AM | 742 (10.0%) | 766 (11.4%) |
| 8:00 AM to 8:29 AM | 922 (12.4%) | 1,223 (18.1%) |
| 8:30 AM to 8:59 AM | 375 (5.0%) | 765 (11.4%) |
| 9:00 AM to 9:59 AM | 486 (6.5%) | 798 (11.8%) |
| 10:00 AM to 10:59 AM | 271 (3.6%) | 113 (1.7%) |
| 11:00 AM to 11:59 AM | 83 (1.1%) | 23 (0.3%) |
| 12:00 PM to 3:59 PM | 510 (6.9%) | 364 (5.4%) |
| 4:00 PM to 11:59 PM | 494 (6.6%) | 488 (7.2%) |
| Total | 7,446 (100.0%) | 6,740 (100.0%) |
Housing Occupancy in Centereach
Occupancy by Ownership in Centereach
Of the total 9,806 dwellings in Centereach, owner-occupied units account for 8,071 (82.3%), while renter-occupied units make up 1,735 (17.7%).
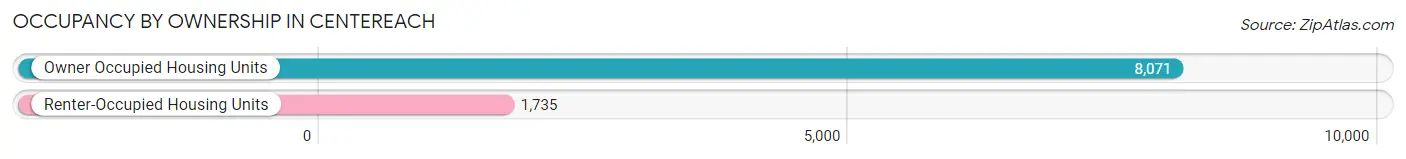
| Occupancy | # Housing Units | % Housing Units |
| Owner Occupied Housing Units | 8,071 | 82.3% |
| Renter-Occupied Housing Units | 1,735 | 17.7% |
| Total Occupied Housing Units | 9,806 | 100.0% |
Occupancy by Household Size in Centereach
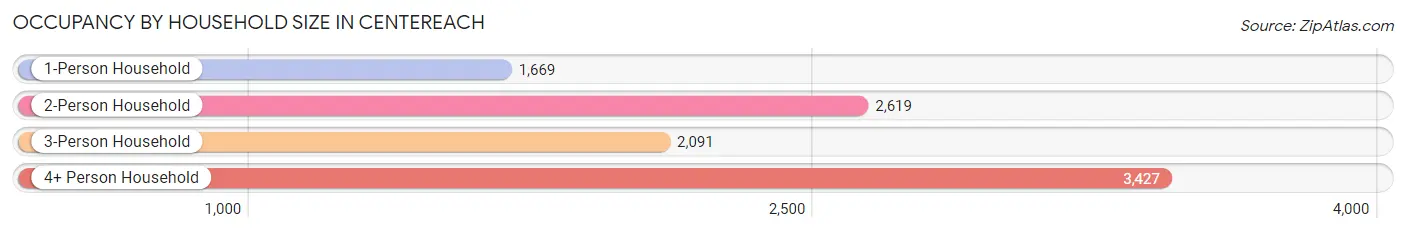
| Household Size | # Housing Units | % Housing Units |
| 1-Person Household | 1,669 | 17.0% |
| 2-Person Household | 2,619 | 26.7% |
| 3-Person Household | 2,091 | 21.3% |
| 4+ Person Household | 3,427 | 34.9% |
| Total Housing Units | 9,806 | 100.0% |
Occupancy by Ownership by Household Size in Centereach
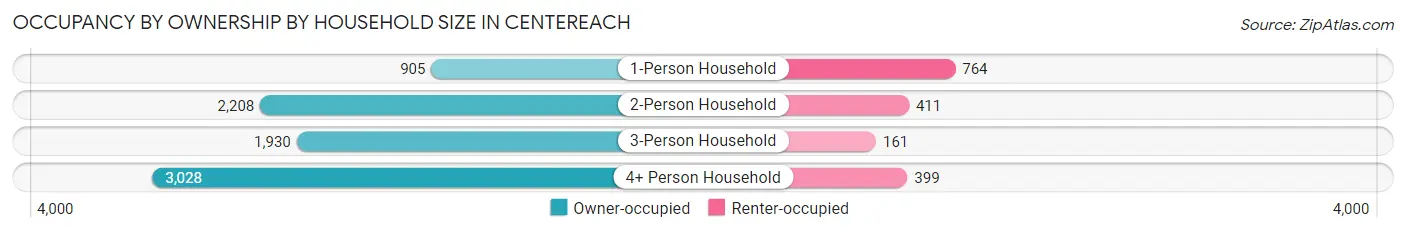
| Household Size | Owner-occupied | Renter-occupied |
| 1-Person Household | 905 (54.2%) | 764 (45.8%) |
| 2-Person Household | 2,208 (84.3%) | 411 (15.7%) |
| 3-Person Household | 1,930 (92.3%) | 161 (7.7%) |
| 4+ Person Household | 3,028 (88.4%) | 399 (11.6%) |
| Total Housing Units | 8,071 (82.3%) | 1,735 (17.7%) |
Occupancy by Educational Attainment in Centereach
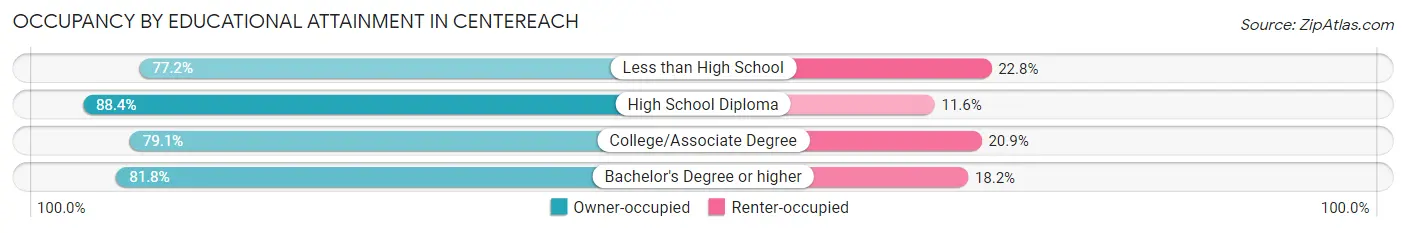
| Household Size | Owner-occupied | Renter-occupied |
| Less than High School | 335 (77.2%) | 99 (22.8%) |
| High School Diploma | 2,031 (88.4%) | 266 (11.6%) |
| College/Associate Degree | 2,441 (79.1%) | 644 (20.9%) |
| Bachelor's Degree or higher | 3,264 (81.8%) | 726 (18.2%) |
Occupancy by Age of Householder in Centereach
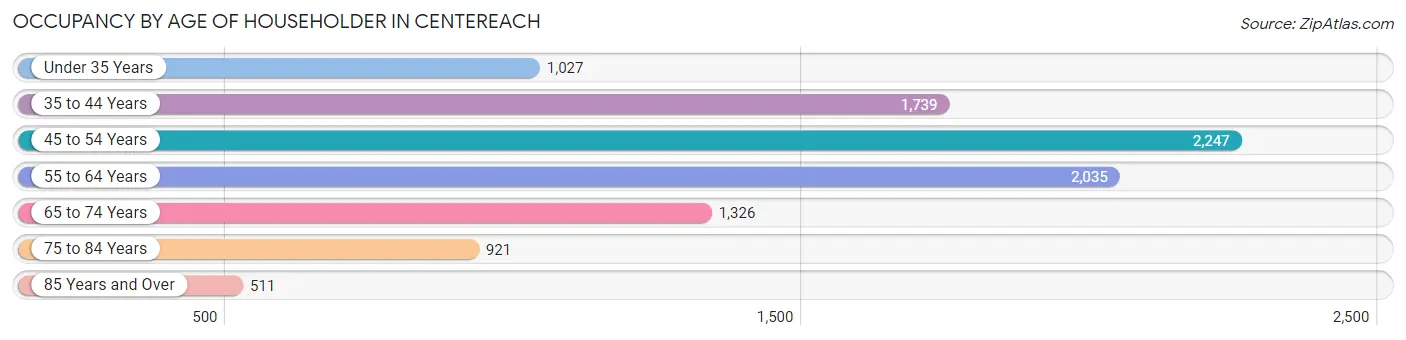
| Age Bracket | # Households | % Households |
| Under 35 Years | 1,027 | 10.5% |
| 35 to 44 Years | 1,739 | 17.7% |
| 45 to 54 Years | 2,247 | 22.9% |
| 55 to 64 Years | 2,035 | 20.7% |
| 65 to 74 Years | 1,326 | 13.5% |
| 75 to 84 Years | 921 | 9.4% |
| 85 Years and Over | 511 | 5.2% |
| Total | 9,806 | 100.0% |
Housing Finances in Centereach
Median Income by Occupancy in Centereach
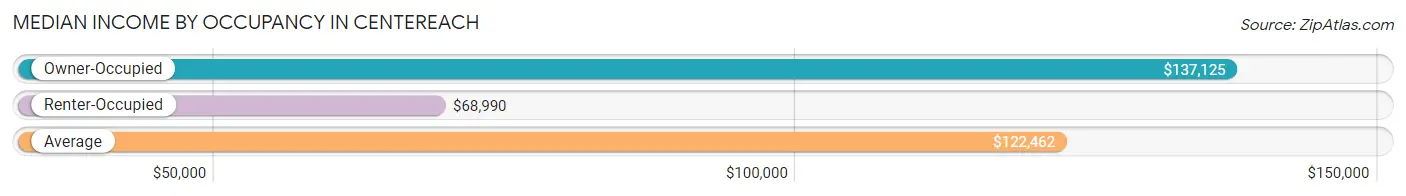
| Occupancy Type | # Households | Median Income |
| Owner-Occupied | 8,071 (82.3%) | $137,125 |
| Renter-Occupied | 1,735 (17.7%) | $68,990 |
| Average | 9,806 (100.0%) | $122,462 |
Occupancy by Householder Income Bracket in Centereach
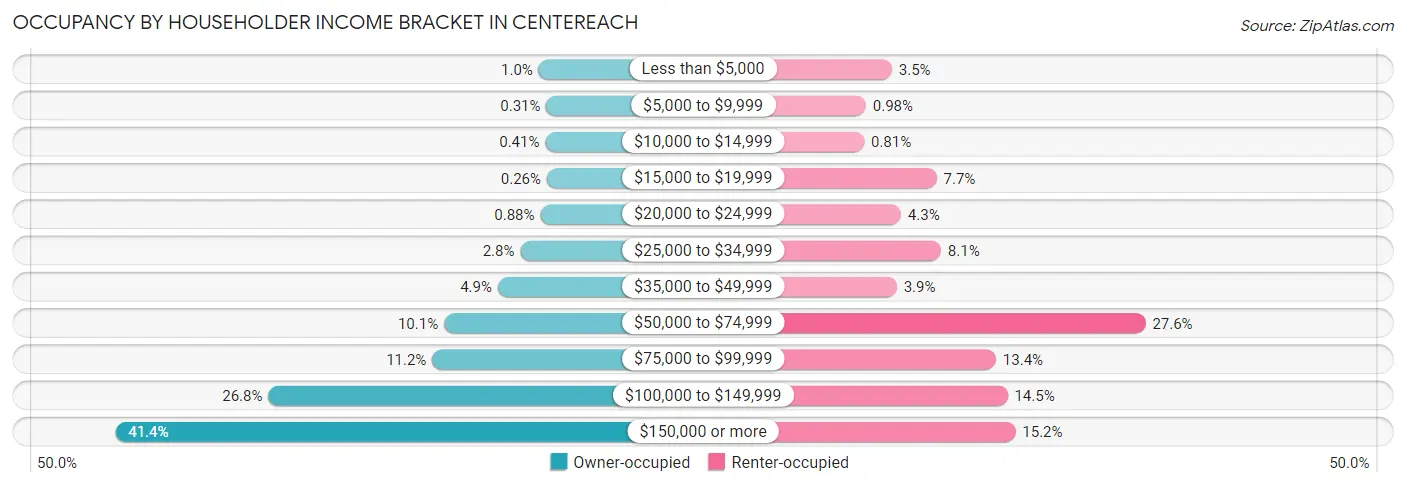
| Income Bracket | Owner-occupied | Renter-occupied |
| Less than $5,000 | 84 (1.0%) | 60 (3.5%) |
| $5,000 to $9,999 | 25 (0.3%) | 17 (1.0%) |
| $10,000 to $14,999 | 33 (0.4%) | 14 (0.8%) |
| $15,000 to $19,999 | 21 (0.3%) | 134 (7.7%) |
| $20,000 to $24,999 | 71 (0.9%) | 75 (4.3%) |
| $25,000 to $34,999 | 225 (2.8%) | 141 (8.1%) |
| $35,000 to $49,999 | 398 (4.9%) | 68 (3.9%) |
| $50,000 to $74,999 | 812 (10.1%) | 479 (27.6%) |
| $75,000 to $99,999 | 902 (11.2%) | 232 (13.4%) |
| $100,000 to $149,999 | 2,162 (26.8%) | 251 (14.5%) |
| $150,000 or more | 3,338 (41.4%) | 264 (15.2%) |
| Total | 8,071 (100.0%) | 1,735 (100.0%) |
Monthly Housing Cost Tiers in Centereach
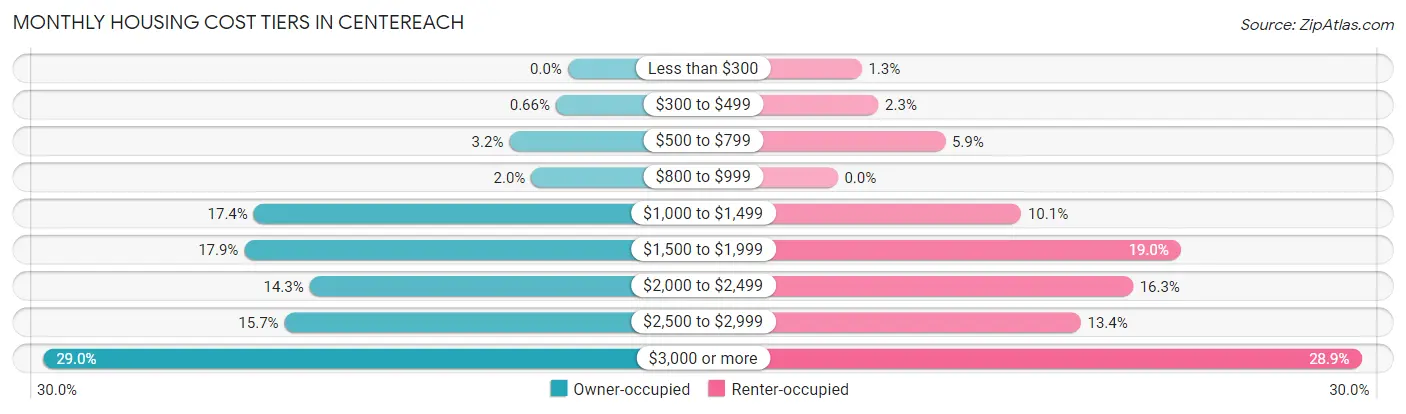
| Monthly Cost | Owner-occupied | Renter-occupied |
| Less than $300 | 0 (0.0%) | 23 (1.3%) |
| $300 to $499 | 53 (0.7%) | 39 (2.2%) |
| $500 to $799 | 261 (3.2%) | 103 (5.9%) |
| $800 to $999 | 163 (2.0%) | 0 (0.0%) |
| $1,000 to $1,499 | 1,400 (17.3%) | 176 (10.1%) |
| $1,500 to $1,999 | 1,442 (17.9%) | 329 (19.0%) |
| $2,000 to $2,499 | 1,151 (14.3%) | 283 (16.3%) |
| $2,500 to $2,999 | 1,263 (15.7%) | 233 (13.4%) |
| $3,000 or more | 2,338 (29.0%) | 502 (28.9%) |
| Total | 8,071 (100.0%) | 1,735 (100.0%) |
Physical Housing Characteristics in Centereach
Housing Structures in Centereach
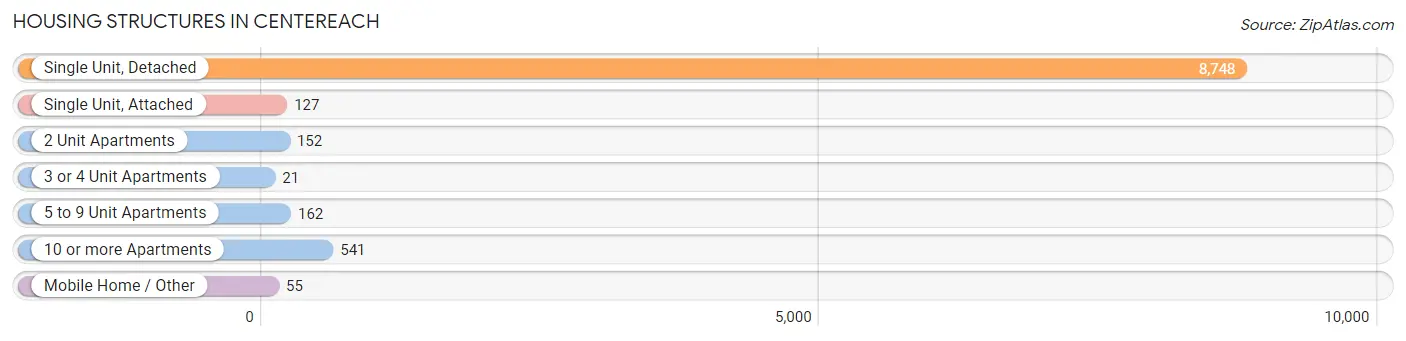
| Structure Type | # Housing Units | % Housing Units |
| Single Unit, Detached | 8,748 | 89.2% |
| Single Unit, Attached | 127 | 1.3% |
| 2 Unit Apartments | 152 | 1.5% |
| 3 or 4 Unit Apartments | 21 | 0.2% |
| 5 to 9 Unit Apartments | 162 | 1.7% |
| 10 or more Apartments | 541 | 5.5% |
| Mobile Home / Other | 55 | 0.6% |
| Total | 9,806 | 100.0% |
Housing Structures by Occupancy in Centereach
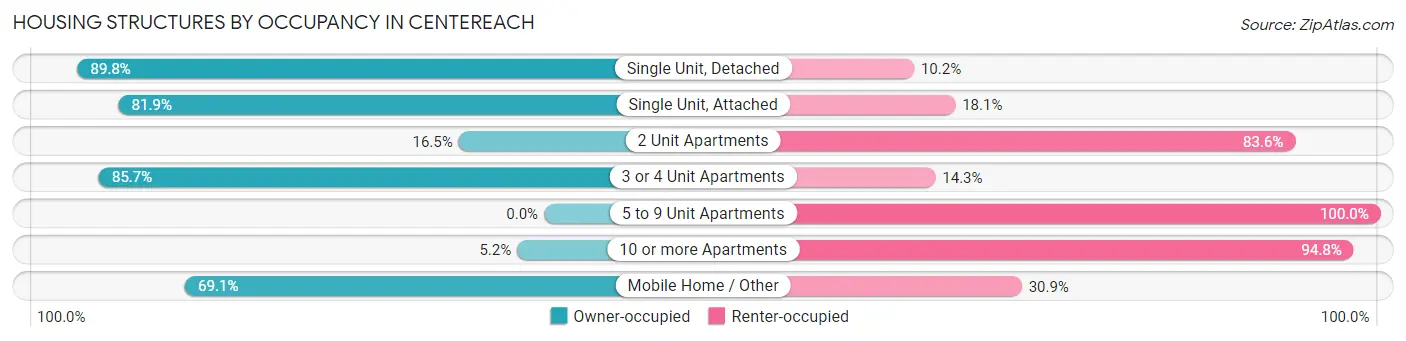
| Structure Type | Owner-occupied | Renter-occupied |
| Single Unit, Detached | 7,858 (89.8%) | 890 (10.2%) |
| Single Unit, Attached | 104 (81.9%) | 23 (18.1%) |
| 2 Unit Apartments | 25 (16.5%) | 127 (83.6%) |
| 3 or 4 Unit Apartments | 18 (85.7%) | 3 (14.3%) |
| 5 to 9 Unit Apartments | 0 (0.0%) | 162 (100.0%) |
| 10 or more Apartments | 28 (5.2%) | 513 (94.8%) |
| Mobile Home / Other | 38 (69.1%) | 17 (30.9%) |
| Total | 8,071 (82.3%) | 1,735 (17.7%) |
Housing Structures by Number of Rooms in Centereach
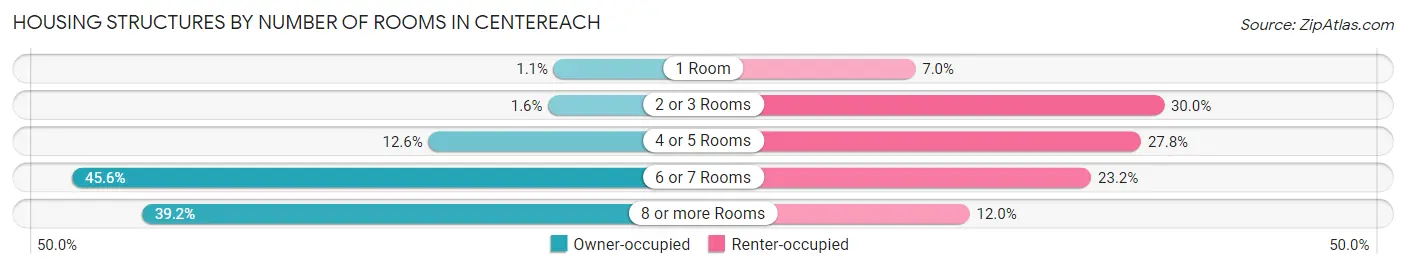
| Number of Rooms | Owner-occupied | Renter-occupied |
| 1 Room | 85 (1.1%) | 121 (7.0%) |
| 2 or 3 Rooms | 126 (1.6%) | 520 (30.0%) |
| 4 or 5 Rooms | 1,020 (12.6%) | 483 (27.8%) |
| 6 or 7 Rooms | 3,680 (45.6%) | 403 (23.2%) |
| 8 or more Rooms | 3,160 (39.2%) | 208 (12.0%) |
| Total | 8,071 (100.0%) | 1,735 (100.0%) |
Housing Structure by Heating Type in Centereach
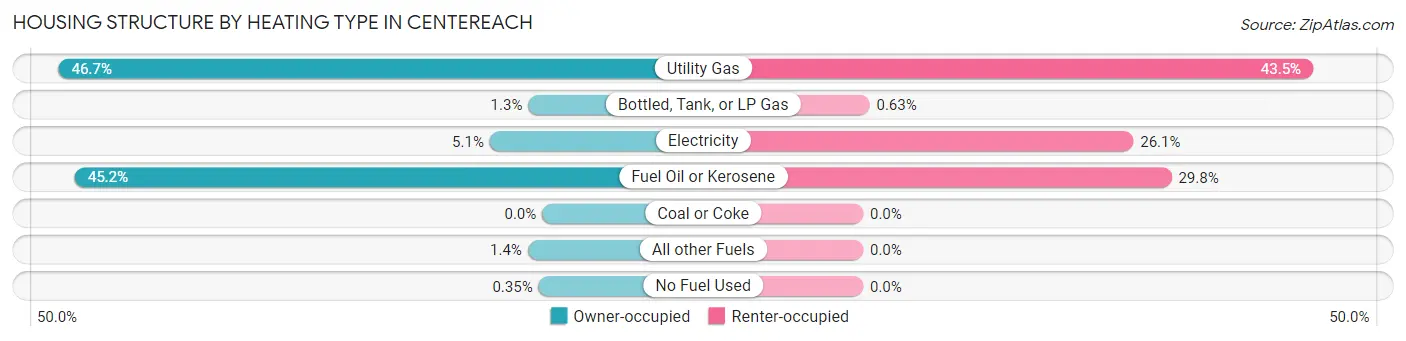
| Heating Type | Owner-occupied | Renter-occupied |
| Utility Gas | 3,771 (46.7%) | 754 (43.5%) |
| Bottled, Tank, or LP Gas | 108 (1.3%) | 11 (0.6%) |
| Electricity | 408 (5.1%) | 453 (26.1%) |
| Fuel Oil or Kerosene | 3,644 (45.2%) | 517 (29.8%) |
| Coal or Coke | 0 (0.0%) | 0 (0.0%) |
| All other Fuels | 112 (1.4%) | 0 (0.0%) |
| No Fuel Used | 28 (0.4%) | 0 (0.0%) |
| Total | 8,071 (100.0%) | 1,735 (100.0%) |
Household Vehicle Usage in Centereach
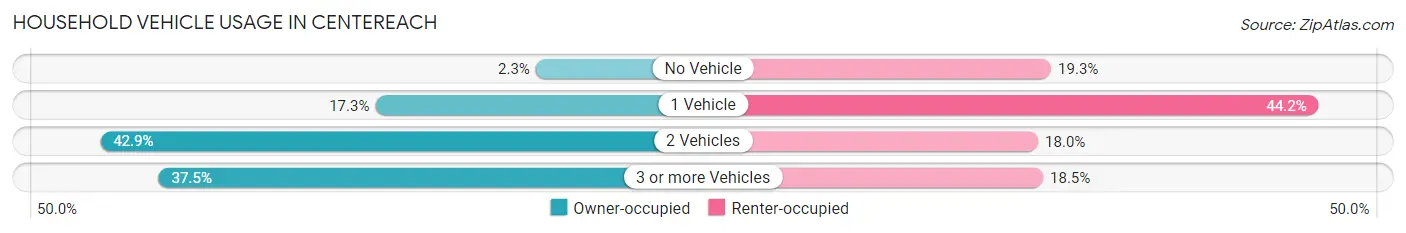
| Vehicles per Household | Owner-occupied | Renter-occupied |
| No Vehicle | 185 (2.3%) | 334 (19.3%) |
| 1 Vehicle | 1,394 (17.3%) | 767 (44.2%) |
| 2 Vehicles | 3,466 (42.9%) | 313 (18.0%) |
| 3 or more Vehicles | 3,026 (37.5%) | 321 (18.5%) |
| Total | 8,071 (100.0%) | 1,735 (100.0%) |
Real Estate & Mortgages in Centereach
Real Estate and Mortgage Overview in Centereach
| Characteristic | Without Mortgage | With Mortgage |
| Housing Units | 2,862 | 5,209 |
| Median Property Value | $444,900 | $436,800 |
| Median Household Income | $121,546 | $2,408 |
| Monthly Housing Costs | $1,396 | $2,332 |
| Real Estate Taxes | $10,001 | $60 |
Property Value by Mortgage Status in Centereach
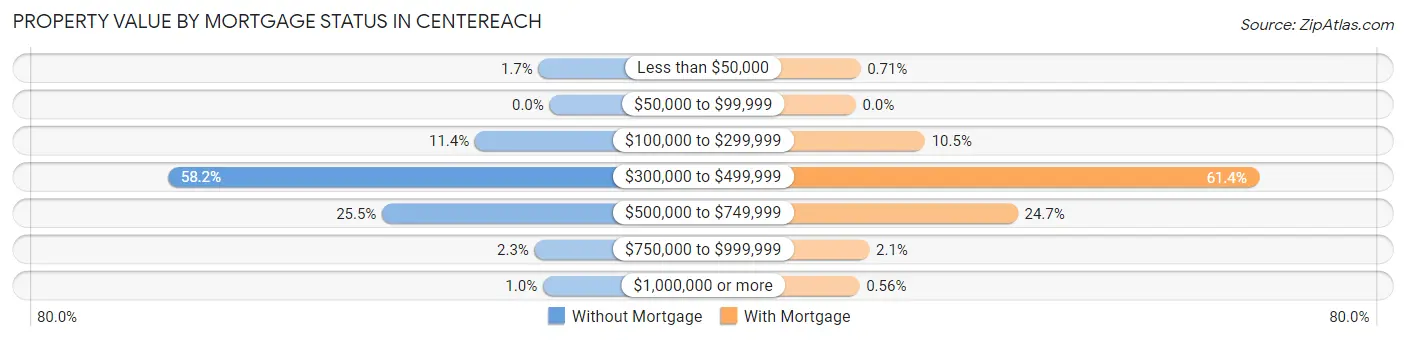
| Property Value | Without Mortgage | With Mortgage |
| Less than $50,000 | 48 (1.7%) | 37 (0.7%) |
| $50,000 to $99,999 | 0 (0.0%) | 0 (0.0%) |
| $100,000 to $299,999 | 325 (11.4%) | 549 (10.5%) |
| $300,000 to $499,999 | 1,665 (58.2%) | 3,200 (61.4%) |
| $500,000 to $749,999 | 730 (25.5%) | 1,286 (24.7%) |
| $750,000 to $999,999 | 65 (2.3%) | 108 (2.1%) |
| $1,000,000 or more | 29 (1.0%) | 29 (0.6%) |
| Total | 2,862 (100.0%) | 5,209 (100.0%) |
Household Income by Mortgage Status in Centereach
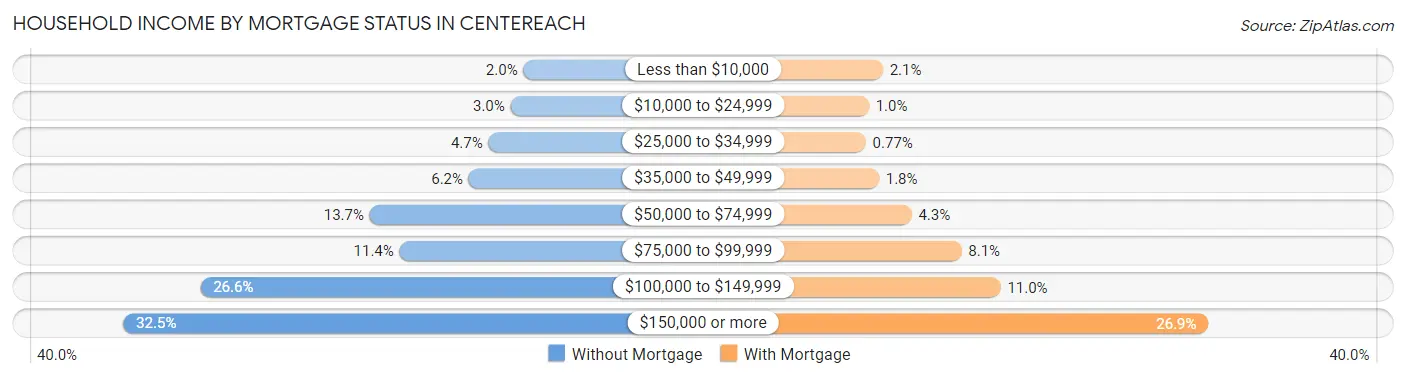
| Household Income | Without Mortgage | With Mortgage |
| Less than $10,000 | 57 (2.0%) | 108 (2.1%) |
| $10,000 to $24,999 | 85 (3.0%) | 52 (1.0%) |
| $25,000 to $34,999 | 133 (4.6%) | 40 (0.8%) |
| $35,000 to $49,999 | 176 (6.1%) | 92 (1.8%) |
| $50,000 to $74,999 | 392 (13.7%) | 222 (4.3%) |
| $75,000 to $99,999 | 327 (11.4%) | 420 (8.1%) |
| $100,000 to $149,999 | 762 (26.6%) | 575 (11.0%) |
| $150,000 or more | 930 (32.5%) | 1,400 (26.9%) |
| Total | 2,862 (100.0%) | 5,209 (100.0%) |
Property Value to Household Income Ratio in Centereach
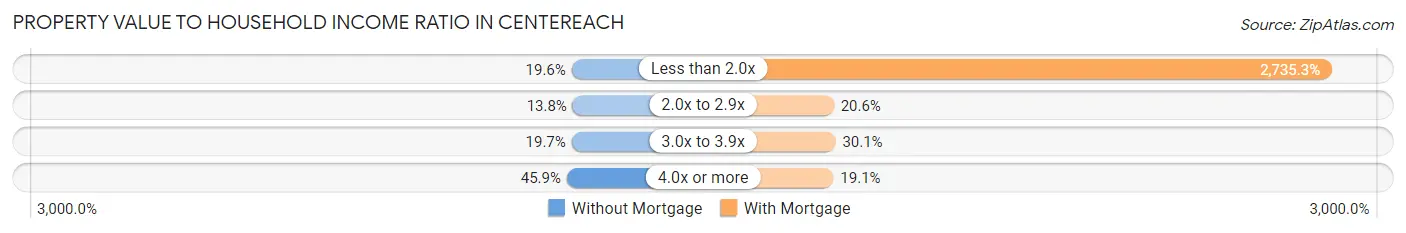
| Value-to-Income Ratio | Without Mortgage | With Mortgage |
| Less than 2.0x | 562 (19.6%) | 142,480 (2,735.3%) |
| 2.0x to 2.9x | 395 (13.8%) | 1,073 (20.6%) |
| 3.0x to 3.9x | 563 (19.7%) | 1,567 (30.1%) |
| 4.0x or more | 1,314 (45.9%) | 996 (19.1%) |
| Total | 2,862 (100.0%) | 5,209 (100.0%) |
Real Estate Taxes by Mortgage Status in Centereach
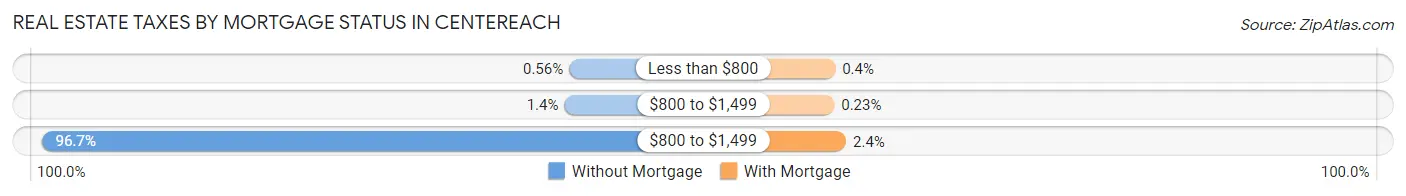
| Property Taxes | Without Mortgage | With Mortgage |
| Less than $800 | 16 (0.6%) | 21 (0.4%) |
| $800 to $1,499 | 41 (1.4%) | 12 (0.2%) |
| $800 to $1,499 | 2,768 (96.7%) | 124 (2.4%) |
| Total | 2,862 (100.0%) | 5,209 (100.0%) |
Health & Disability in Centereach
Health Insurance Coverage by Age in Centereach
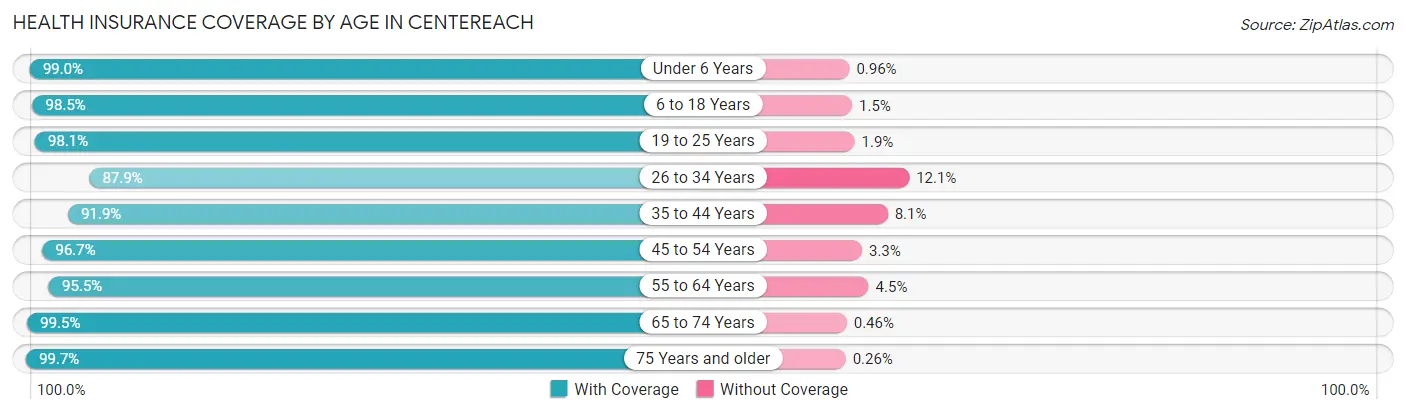
| Age Bracket | With Coverage | Without Coverage |
| Under 6 Years | 1,957 (99.0%) | 19 (1.0%) |
| 6 to 18 Years | 5,588 (98.5%) | 83 (1.5%) |
| 19 to 25 Years | 3,220 (98.1%) | 63 (1.9%) |
| 26 to 34 Years | 3,161 (87.9%) | 435 (12.1%) |
| 35 to 44 Years | 3,658 (91.9%) | 322 (8.1%) |
| 45 to 54 Years | 4,359 (96.7%) | 149 (3.3%) |
| 55 to 64 Years | 3,935 (95.5%) | 187 (4.5%) |
| 65 to 74 Years | 2,373 (99.5%) | 11 (0.5%) |
| 75 Years and older | 2,306 (99.7%) | 6 (0.3%) |
| Total | 30,557 (96.0%) | 1,275 (4.0%) |
Health Insurance Coverage by Citizenship Status in Centereach
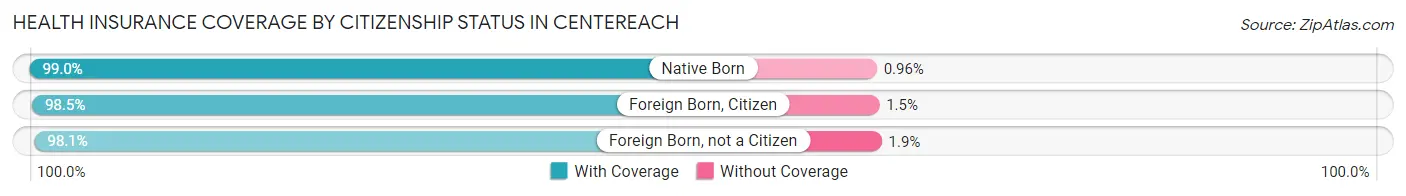
| Citizenship Status | With Coverage | Without Coverage |
| Native Born | 1,957 (99.0%) | 19 (1.0%) |
| Foreign Born, Citizen | 5,588 (98.5%) | 83 (1.5%) |
| Foreign Born, not a Citizen | 3,220 (98.1%) | 63 (1.9%) |
Health Insurance Coverage by Household Income in Centereach
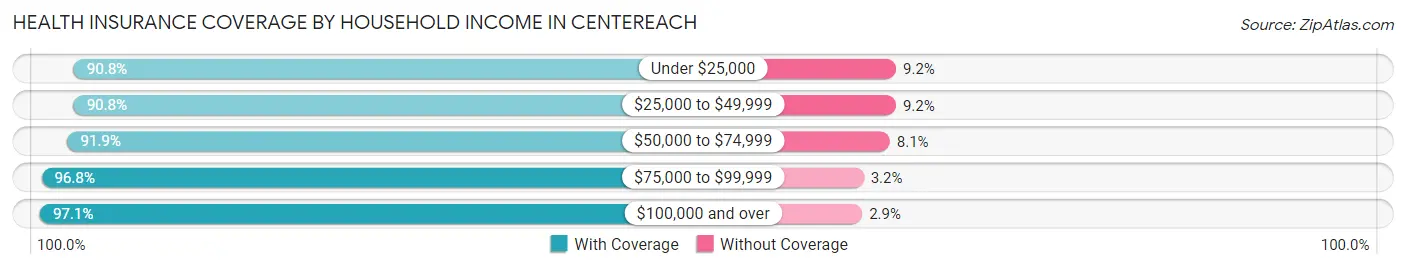
| Household Income | With Coverage | Without Coverage |
| Under $25,000 | 805 (90.8%) | 82 (9.2%) |
| $25,000 to $49,999 | 1,646 (90.8%) | 167 (9.2%) |
| $50,000 to $74,999 | 3,206 (91.9%) | 281 (8.1%) |
| $75,000 to $99,999 | 2,899 (96.8%) | 95 (3.2%) |
| $100,000 and over | 21,840 (97.1%) | 650 (2.9%) |
Public vs Private Health Insurance Coverage by Age in Centereach
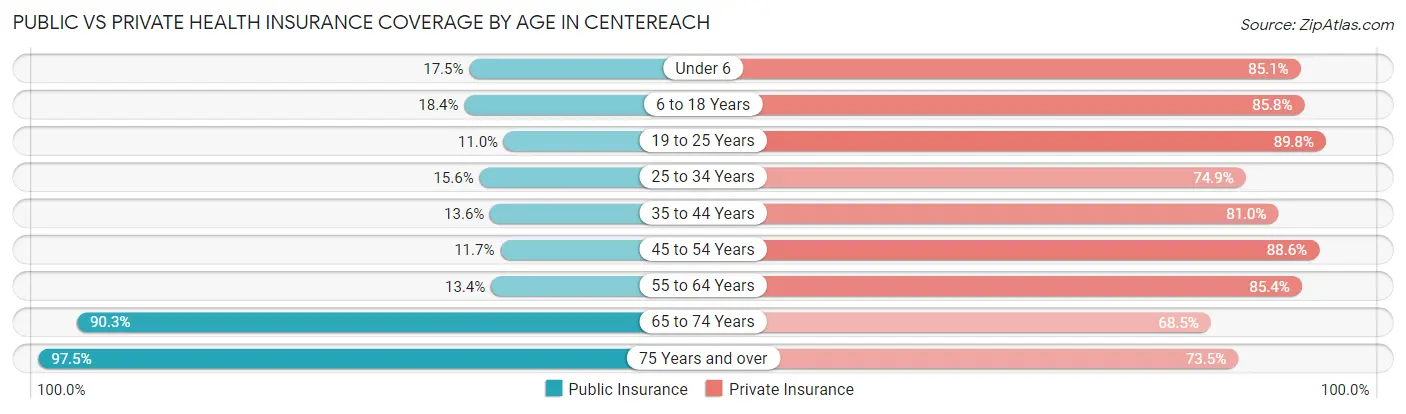
| Age Bracket | Public Insurance | Private Insurance |
| Under 6 | 345 (17.5%) | 1,682 (85.1%) |
| 6 to 18 Years | 1,042 (18.4%) | 4,868 (85.8%) |
| 19 to 25 Years | 362 (11.0%) | 2,949 (89.8%) |
| 25 to 34 Years | 560 (15.6%) | 2,695 (74.9%) |
| 35 to 44 Years | 541 (13.6%) | 3,224 (81.0%) |
| 45 to 54 Years | 528 (11.7%) | 3,992 (88.5%) |
| 55 to 64 Years | 553 (13.4%) | 3,518 (85.4%) |
| 65 to 74 Years | 2,152 (90.3%) | 1,632 (68.5%) |
| 75 Years and over | 2,253 (97.5%) | 1,700 (73.5%) |
| Total | 8,336 (26.2%) | 26,260 (82.5%) |
Disability Status by Sex by Age in Centereach
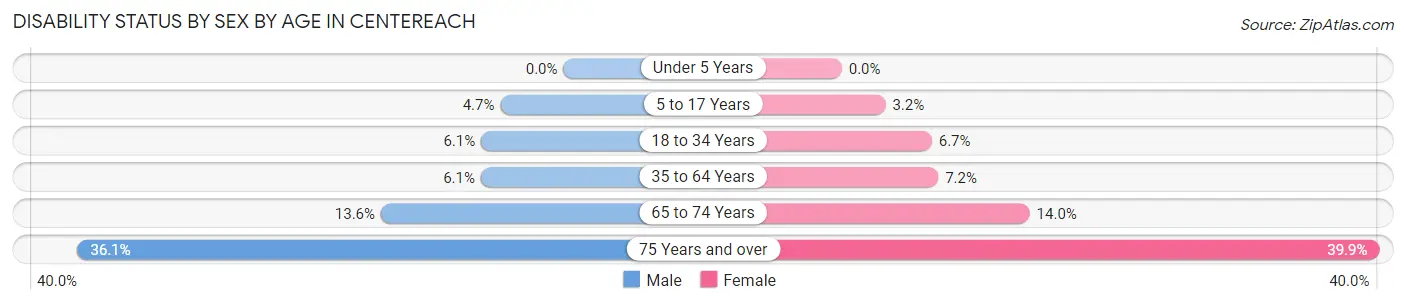
| Age Bracket | Male | Female |
| Under 5 Years | 0 (0.0%) | 0 (0.0%) |
| 5 to 17 Years | 131 (4.7%) | 86 (3.2%) |
| 18 to 34 Years | 218 (6.1%) | 248 (6.7%) |
| 35 to 64 Years | 391 (6.1%) | 446 (7.2%) |
| 65 to 74 Years | 155 (13.6%) | 173 (14.0%) |
| 75 Years and over | 346 (36.1%) | 540 (39.9%) |
Disability Class by Sex by Age in Centereach
Disability Class: Hearing Difficulty
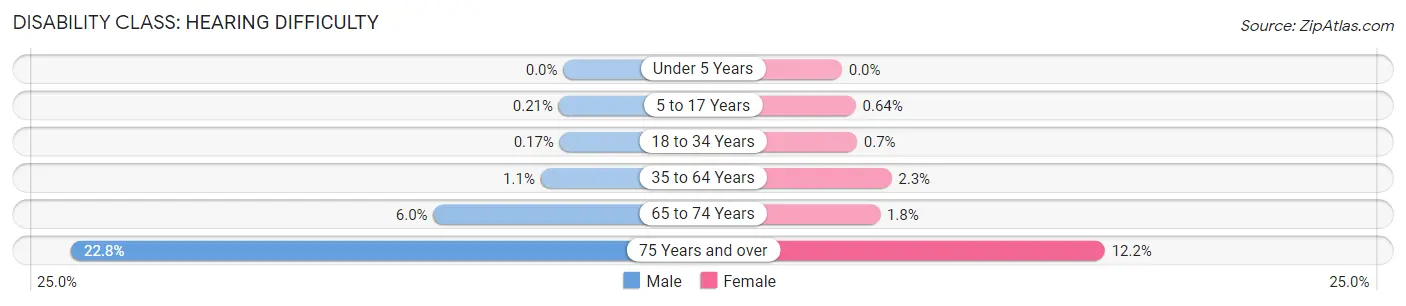
| Age Bracket | Male | Female |
| Under 5 Years | 0 (0.0%) | 0 (0.0%) |
| 5 to 17 Years | 6 (0.2%) | 17 (0.6%) |
| 18 to 34 Years | 6 (0.2%) | 26 (0.7%) |
| 35 to 64 Years | 67 (1.1%) | 143 (2.3%) |
| 65 to 74 Years | 69 (6.0%) | 22 (1.8%) |
| 75 Years and over | 219 (22.8%) | 165 (12.2%) |
Disability Class: Vision Difficulty
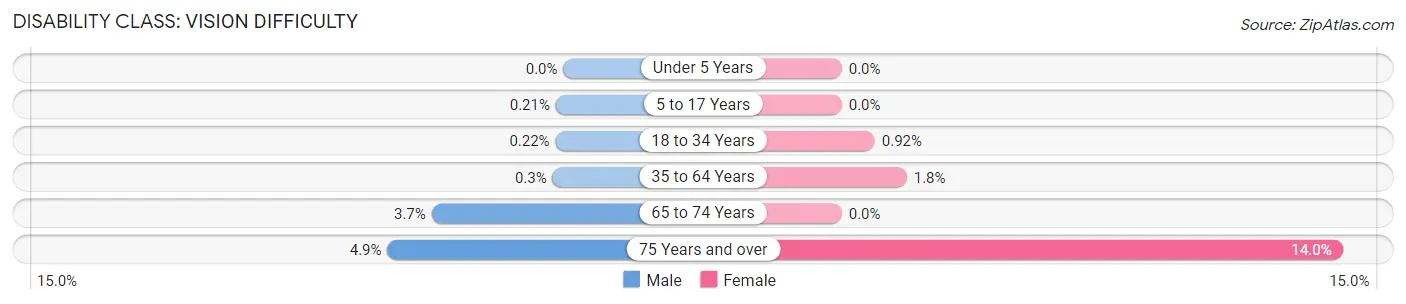
| Age Bracket | Male | Female |
| Under 5 Years | 0 (0.0%) | 0 (0.0%) |
| 5 to 17 Years | 6 (0.2%) | 0 (0.0%) |
| 18 to 34 Years | 8 (0.2%) | 34 (0.9%) |
| 35 to 64 Years | 19 (0.3%) | 113 (1.8%) |
| 65 to 74 Years | 42 (3.7%) | 0 (0.0%) |
| 75 Years and over | 47 (4.9%) | 189 (14.0%) |
Disability Class: Cognitive Difficulty
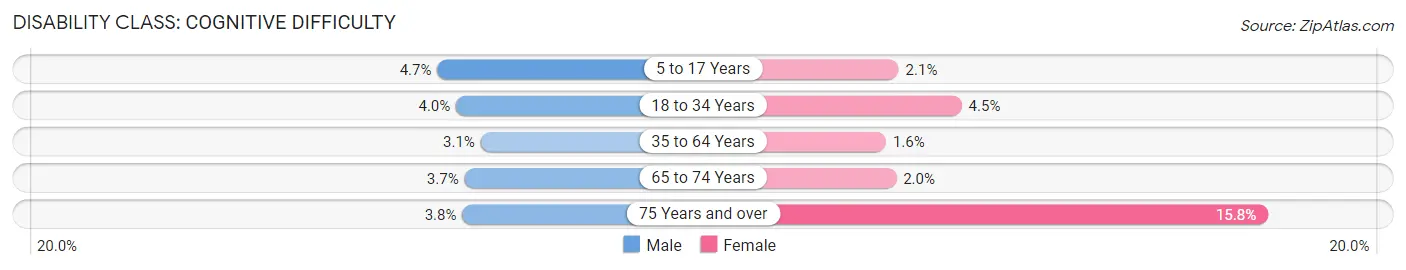
| Age Bracket | Male | Female |
| 5 to 17 Years | 131 (4.7%) | 56 (2.1%) |
| 18 to 34 Years | 142 (4.0%) | 165 (4.4%) |
| 35 to 64 Years | 196 (3.1%) | 102 (1.6%) |
| 65 to 74 Years | 42 (3.7%) | 25 (2.0%) |
| 75 Years and over | 36 (3.7%) | 214 (15.8%) |
Disability Class: Ambulatory Difficulty
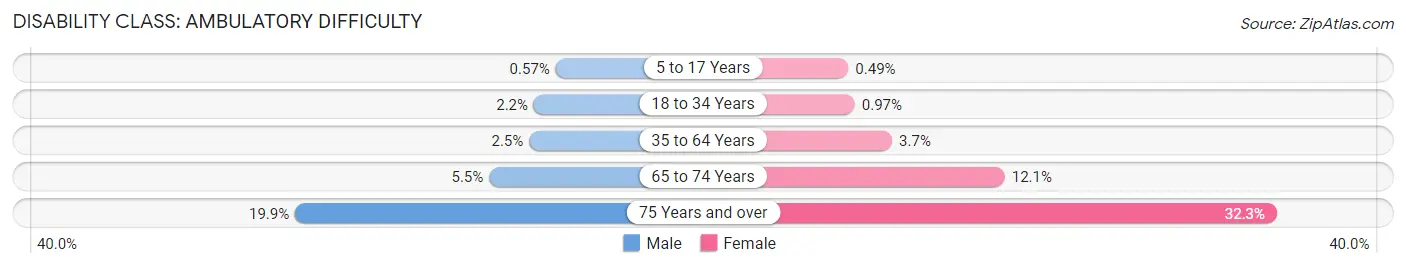
| Age Bracket | Male | Female |
| 5 to 17 Years | 16 (0.6%) | 13 (0.5%) |
| 18 to 34 Years | 78 (2.2%) | 36 (1.0%) |
| 35 to 64 Years | 162 (2.5%) | 233 (3.7%) |
| 65 to 74 Years | 63 (5.5%) | 150 (12.1%) |
| 75 Years and over | 191 (19.9%) | 437 (32.3%) |
Disability Class: Self-Care Difficulty
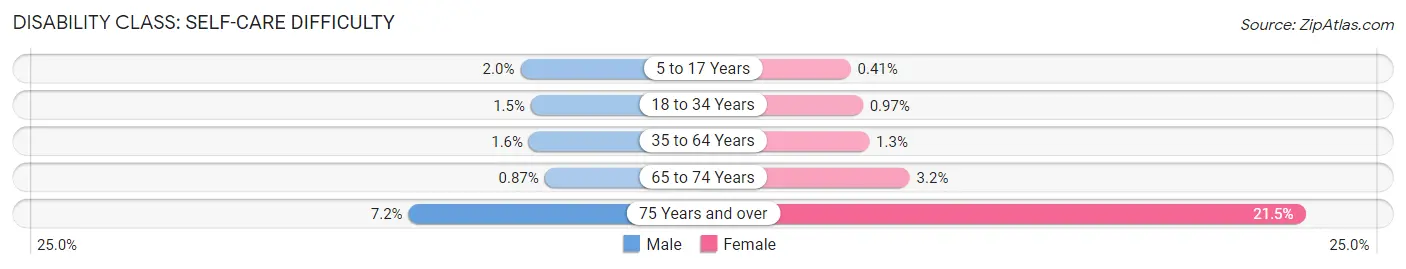
| Age Bracket | Male | Female |
| 5 to 17 Years | 56 (2.0%) | 11 (0.4%) |
| 18 to 34 Years | 54 (1.5%) | 36 (1.0%) |
| 35 to 64 Years | 102 (1.6%) | 79 (1.3%) |
| 65 to 74 Years | 10 (0.9%) | 39 (3.2%) |
| 75 Years and over | 69 (7.2%) | 291 (21.5%) |
Technology Access in Centereach
Computing Device Access in Centereach
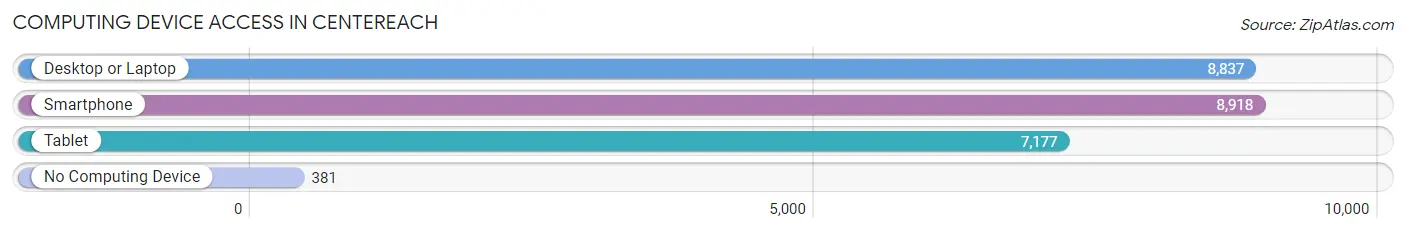
| Device Type | # Households | % Households |
| Desktop or Laptop | 8,837 | 90.1% |
| Smartphone | 8,918 | 90.9% |
| Tablet | 7,177 | 73.2% |
| No Computing Device | 381 | 3.9% |
| Total | 9,806 | 100.0% |
Internet Access in Centereach
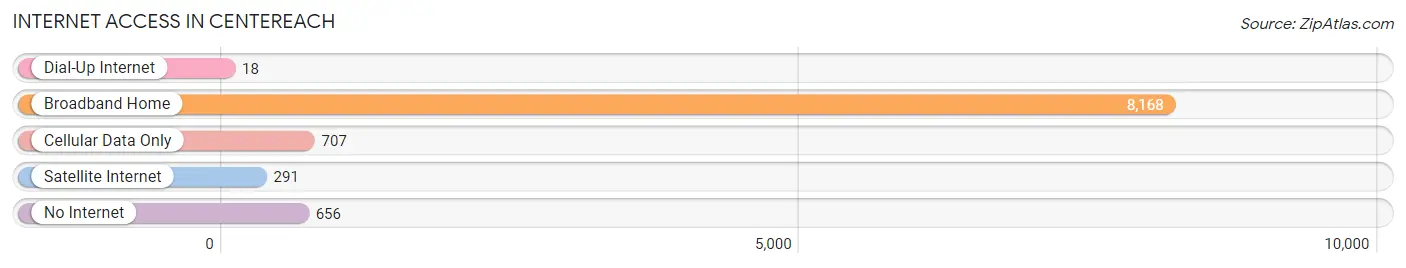
| Internet Type | # Households | % Households |
| Dial-Up Internet | 18 | 0.2% |
| Broadband Home | 8,168 | 83.3% |
| Cellular Data Only | 707 | 7.2% |
| Satellite Internet | 291 | 3.0% |
| No Internet | 656 | 6.7% |
| Total | 9,806 | 100.0% |
Centereach Summary
Centereach is a hamlet located in the Town of Brookhaven in Suffolk County, New York. It is located on the north shore of Long Island, approximately 60 miles east of New York City. The hamlet is bordered by Selden to the west, Lake Grove to the east, and Middle Island to the south. As of the 2010 census, the population of Centereach was 31,575.
History
The area that is now Centereach was originally inhabited by the Setalcott Indians, a sub-tribe of the Algonquin Nation. The first European settlers arrived in the area in the late 1600s, and the hamlet was officially established in 1734. The hamlet was originally known as New Village, but was later renamed Centereach in 1873. The name is derived from the Latin words “centrum” and “reach”, which mean “center” and “reach”, respectively.
Geography
Centereach is located at 40°52'N 73°3'W. It is situated on the north shore of Long Island, approximately 60 miles east of New York City. The hamlet is bordered by Selden to the west, Lake Grove to the east, and Middle Island to the south. The total area of Centereach is 8.3 square miles, of which 8.2 square miles is land and 0.1 square miles is water.
The terrain of Centereach is mostly flat, with some rolling hills in the western part of the hamlet. The highest point in Centereach is located at the intersection of Middle Country Road and Nicolls Road, at an elevation of approximately 200 feet.
Economy
The economy of Centereach is largely based on retail and services. The hamlet is home to several shopping centers, including the Centereach Mall, which is anchored by a Walmart Supercenter. Other major retailers in the area include Target, Best Buy, and Home Depot.
Centereach is also home to several industrial and manufacturing businesses, including the Centereach Industrial Park. The park is home to several companies, including a plastics manufacturer, a printing company, and a food processing plant.
Demographics
As of the 2010 census, the population of Centereach was 31,575. The racial makeup of the hamlet was 79.2% White, 8.3% African American, 0.3% Native American, 5.2% Asian, and 6.9% from other races. Hispanic or Latino of any race were 14.3% of the population.
The median household income in Centereach was $77,845 in 2017. The median home value was $346,400 in 2017. The median age of the population was 40.7 years. The unemployment rate in Centereach was 3.7% in 2017.
Common Questions
What is Per Capita Income in Centereach?
Per Capita income in Centereach is $46,051.
What is the Median Family Income in Centereach?
Median Family Income in Centereach is $137,733.
What is the Median Household income in Centereach?
Median Household Income in Centereach is $122,462.
What is Income or Wage Gap in Centereach?
Income or Wage Gap in Centereach is 30.1%.
Women in Centereach earn 69.9 cents for every dollar earned by a man.
What is Inequality or Gini Index in Centereach?
Inequality or Gini Index in Centereach is 0.37.
What is the Total Population of Centereach?
Total Population of Centereach is 31,889.
What is the Total Male Population of Centereach?
Total Male Population of Centereach is 15,943.
What is the Total Female Population of Centereach?
Total Female Population of Centereach is 15,946.
What is the Ratio of Males per 100 Females in Centereach?
There are 99.98 Males per 100 Females in Centereach.
What is the Ratio of Females per 100 Males in Centereach?
There are 100.02 Females per 100 Males in Centereach.
What is the Median Population Age in Centereach?
Median Population Age in Centereach is 37.8 Years.
What is the Average Family Size in Centereach
Average Family Size in Centereach is 3.6 People.
What is the Average Household Size in Centereach
Average Household Size in Centereach is 3.2 People.
How Large is the Labor Force in Centereach?
There are 16,777 People in the Labor Forcein in Centereach.
What is the Percentage of People in the Labor Force in Centereach?
64.2% of People are in the Labor Force in Centereach.
What is the Unemployment Rate in Centereach?
Unemployment Rate in Centereach is 5.6%.