Tribes Hill, NY Map & Demographics
Tribes Hill Map
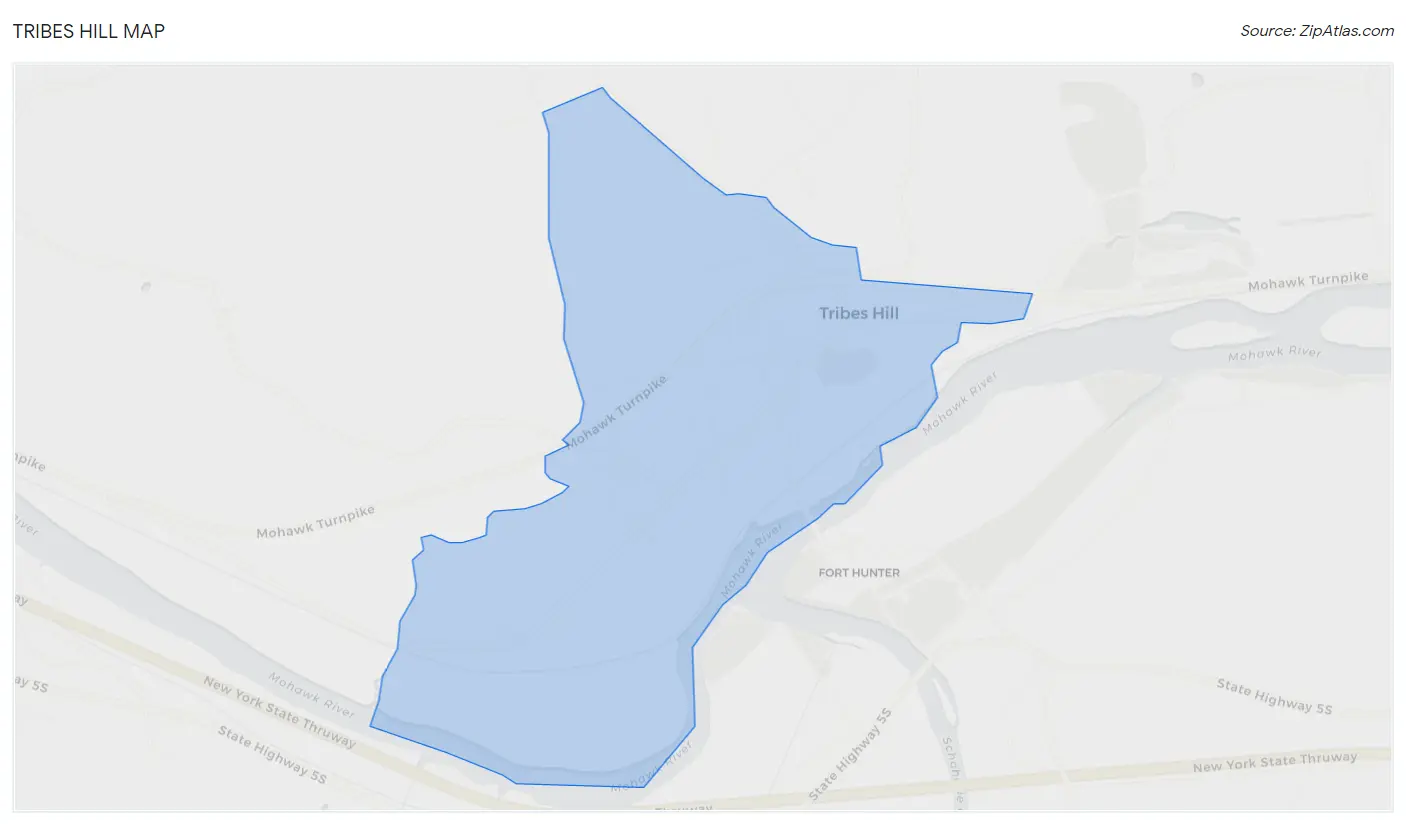
Tribes Hill Overview
$33,939
PER CAPITA INCOME
$131,250
AVG FAMILY INCOME
$92,574
AVG HOUSEHOLD INCOME
40.4%
WAGE / INCOME GAP [ % ]
59.6¢/ $1
WAGE / INCOME GAP [ $ ]
0.32
INEQUALITY / GINI INDEX
838
TOTAL POPULATION
308
MALE POPULATION
530
FEMALE POPULATION
58.11
MALES / 100 FEMALES
172.08
FEMALES / 100 MALES
49.1
MEDIAN AGE
4.6
AVG FAMILY SIZE
3.2
AVG HOUSEHOLD SIZE
358
LABOR FORCE [ PEOPLE ]
55.9%
PERCENT IN LABOR FORCE
Tribes Hill Zip Codes
Tribes Hill Area Codes
Income in Tribes Hill
Income Overview in Tribes Hill
Per Capita Income in Tribes Hill is $33,939, while median incomes of families and households are $131,250 and $92,574 respectively.
| Characteristic | Number | Measure |
| Per Capita Income | 838 | $33,939 |
| Median Family Income | 150 | $131,250 |
| Mean Family Income | 150 | $125,995 |
| Median Household Income | 263 | $92,574 |
| Mean Household Income | 263 | $102,684 |
| Income Deficit | 150 | $0 |
| Wage / Income Gap (%) | 838 | 40.40% |
| Wage / Income Gap ($) | 838 | 59.60¢ per $1 |
| Gini / Inequality Index | 838 | 0.32 |
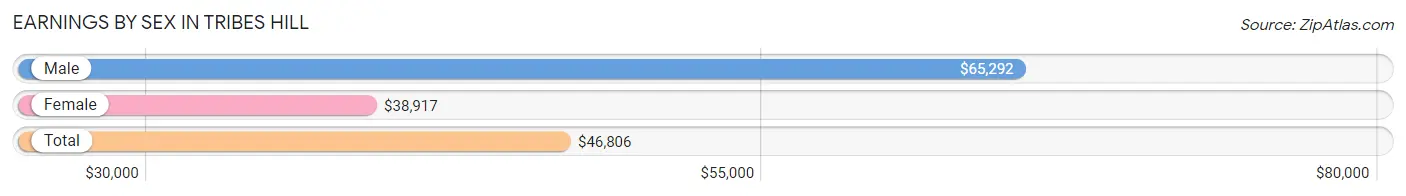
Earnings by Sex in Tribes Hill
Average Earnings in Tribes Hill are $46,806, $65,292 for men and $38,917 for women, a difference of 40.4%.
| Sex | Number | Average Earnings |
| Male | 153 (42.7%) | $65,292 |
| Female | 205 (57.3%) | $38,917 |
| Total | 358 (100.0%) | $46,806 |
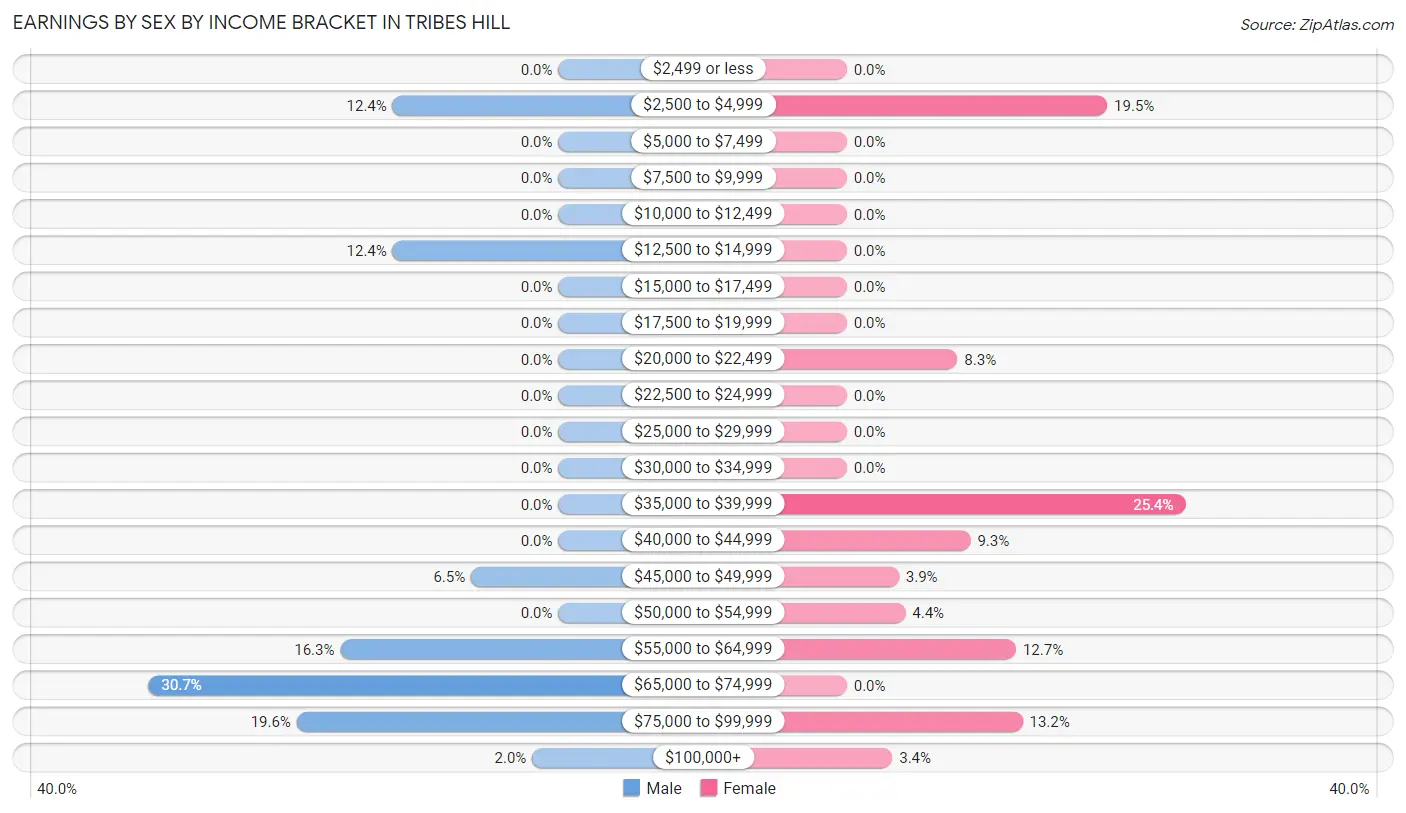
Earnings by Sex by Income Bracket in Tribes Hill
The most common earnings brackets in Tribes Hill are $65,000 to $74,999 for men (47 | 30.7%) and $35,000 to $39,999 for women (52 | 25.4%).
| Income | Male | Female |
| $2,499 or less | 0 (0.0%) | 0 (0.0%) |
| $2,500 to $4,999 | 19 (12.4%) | 40 (19.5%) |
| $5,000 to $7,499 | 0 (0.0%) | 0 (0.0%) |
| $7,500 to $9,999 | 0 (0.0%) | 0 (0.0%) |
| $10,000 to $12,499 | 0 (0.0%) | 0 (0.0%) |
| $12,500 to $14,999 | 19 (12.4%) | 0 (0.0%) |
| $15,000 to $17,499 | 0 (0.0%) | 0 (0.0%) |
| $17,500 to $19,999 | 0 (0.0%) | 0 (0.0%) |
| $20,000 to $22,499 | 0 (0.0%) | 17 (8.3%) |
| $22,500 to $24,999 | 0 (0.0%) | 0 (0.0%) |
| $25,000 to $29,999 | 0 (0.0%) | 0 (0.0%) |
| $30,000 to $34,999 | 0 (0.0%) | 0 (0.0%) |
| $35,000 to $39,999 | 0 (0.0%) | 52 (25.4%) |
| $40,000 to $44,999 | 0 (0.0%) | 19 (9.3%) |
| $45,000 to $49,999 | 10 (6.5%) | 8 (3.9%) |
| $50,000 to $54,999 | 0 (0.0%) | 9 (4.4%) |
| $55,000 to $64,999 | 25 (16.3%) | 26 (12.7%) |
| $65,000 to $74,999 | 47 (30.7%) | 0 (0.0%) |
| $75,000 to $99,999 | 30 (19.6%) | 27 (13.2%) |
| $100,000+ | 3 (2.0%) | 7 (3.4%) |
| Total | 153 (100.0%) | 205 (100.0%) |
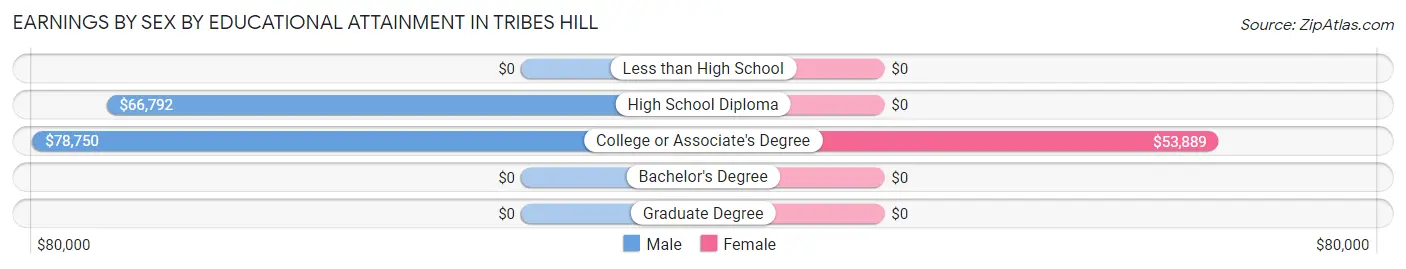
Earnings by Sex by Educational Attainment in Tribes Hill
Average earnings in Tribes Hill are $66,875 for men and $44,276 for women, a difference of 33.8%. Men with an educational attainment of college or associate's degree enjoy the highest average annual earnings of $78,750, while those with high school diploma education earn the least with $66,792. Women with an educational attainment of college or associate's degree earn the most with the average annual earnings of $53,889, while those with college or associate's degree education have the smallest earnings of $53,889.
| Educational Attainment | Male Income | Female Income |
| Less than High School | - | - |
| High School Diploma | $66,792 | $0 |
| College or Associate's Degree | $78,750 | $53,889 |
| Bachelor's Degree | - | - |
| Graduate Degree | - | - |
| Total | $66,875 | $44,276 |
Family Income in Tribes Hill
Family Income Brackets in Tribes Hill
According to the Tribes Hill family income data, there are 38 families falling into the $35,000 to $49,999 income range, which is the most common income bracket and makes up 25.3% of all families.
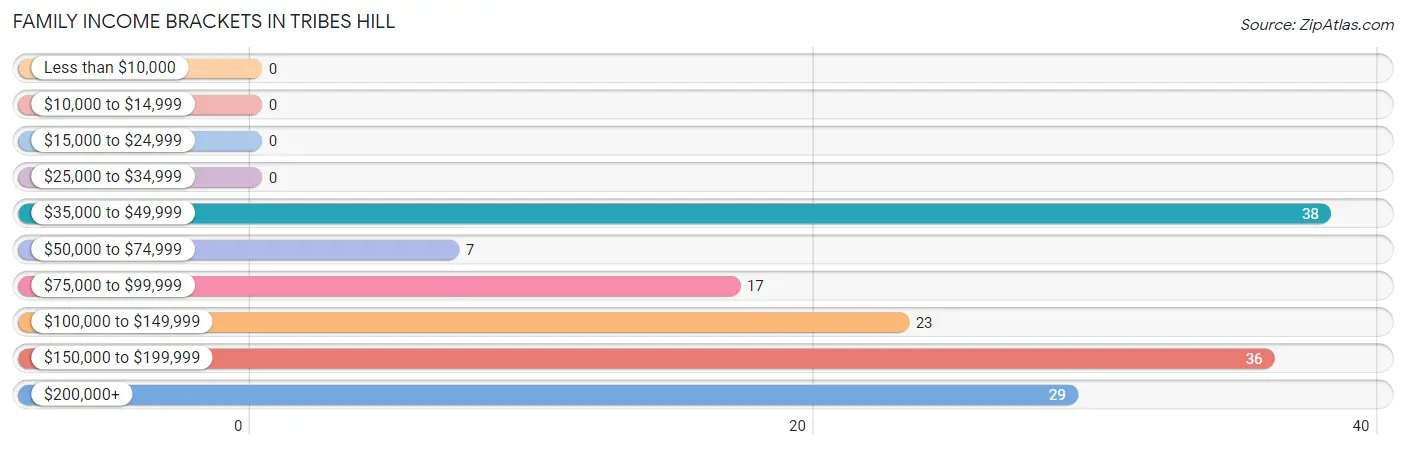
| Income Bracket | # Families | % Families |
| Less than $10,000 | 0 | 0.0% |
| $10,000 to $14,999 | 0 | 0.0% |
| $15,000 to $24,999 | 0 | 0.0% |
| $25,000 to $34,999 | 0 | 0.0% |
| $35,000 to $49,999 | 38 | 25.3% |
| $50,000 to $74,999 | 7 | 4.7% |
| $75,000 to $99,999 | 17 | 11.3% |
| $100,000 to $149,999 | 23 | 15.3% |
| $150,000 to $199,999 | 36 | 24.0% |
| $200,000+ | 29 | 19.3% |
Family Income by Famaliy Size in Tribes Hill
5-person families (70 | 46.7%) account for the highest median family income in Tribes Hill with $156,667 per family, while 5-person families (70 | 46.7%) have the highest median income of $31,333 per family member.
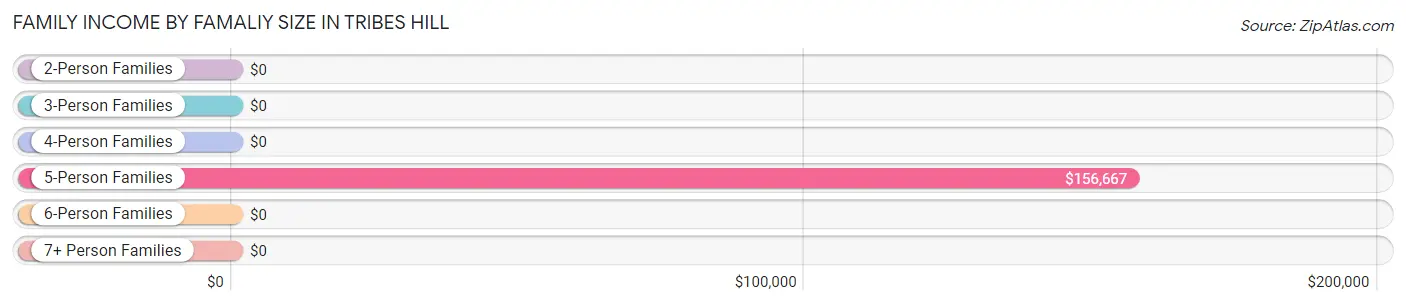
| Income Bracket | # Families | Median Income |
| 2-Person Families | 56 (37.3%) | $0 |
| 3-Person Families | 18 (12.0%) | $0 |
| 4-Person Families | 6 (4.0%) | $0 |
| 5-Person Families | 70 (46.7%) | $156,667 |
| 6-Person Families | 0 (0.0%) | $0 |
| 7+ Person Families | 0 (0.0%) | $0 |
| Total | 150 (100.0%) | $131,250 |
Family Income by Number of Earners in Tribes Hill
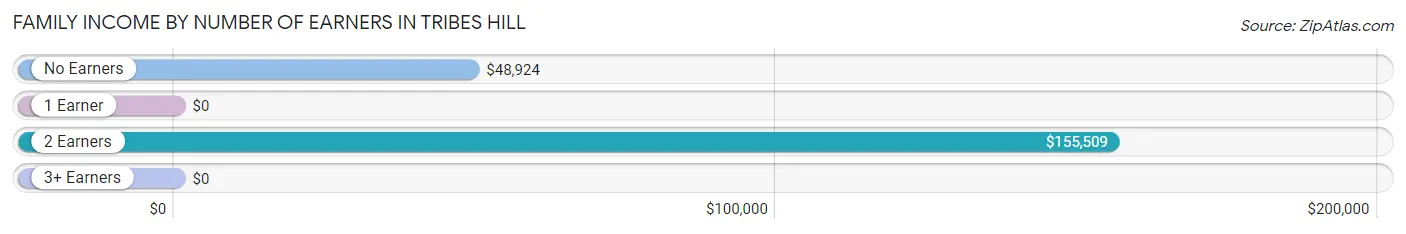
| Number of Earners | # Families | Median Income |
| No Earners | 45 (30.0%) | $48,924 |
| 1 Earner | 12 (8.0%) | $0 |
| 2 Earners | 43 (28.7%) | $155,509 |
| 3+ Earners | 50 (33.3%) | $0 |
| Total | 150 (100.0%) | $131,250 |
Household Income in Tribes Hill
Household Income Brackets in Tribes Hill
With 61 households falling in the category, the $35,000 to $49,999 income range is the most frequent in Tribes Hill, accounting for 23.2% of all households.
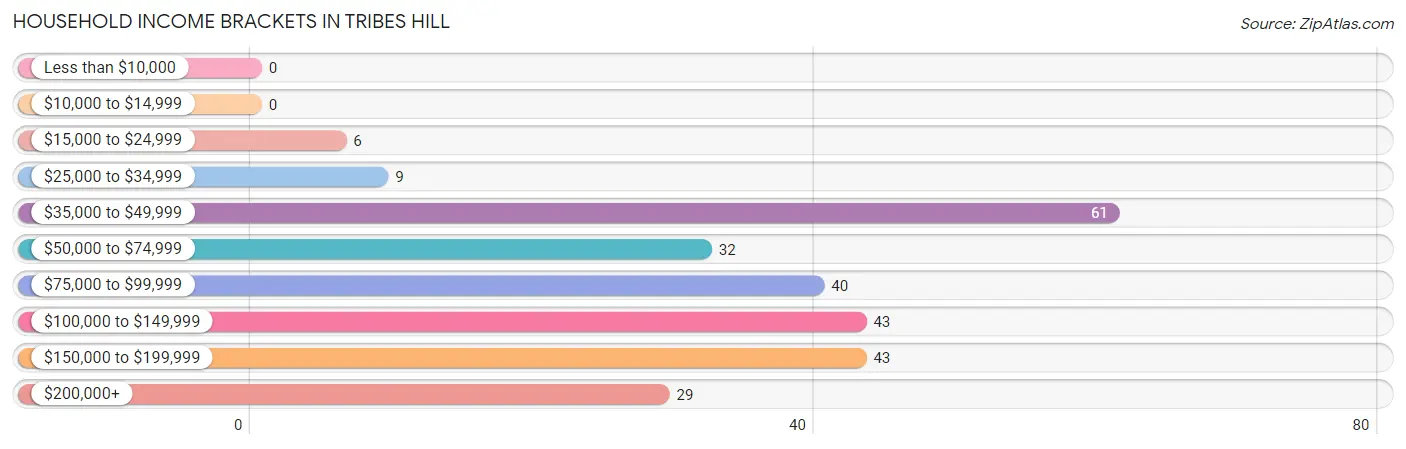
| Income Bracket | # Households | % Households |
| Less than $10,000 | 0 | 0.0% |
| $10,000 to $14,999 | 0 | 0.0% |
| $15,000 to $24,999 | 6 | 2.3% |
| $25,000 to $34,999 | 9 | 3.4% |
| $35,000 to $49,999 | 61 | 23.2% |
| $50,000 to $74,999 | 32 | 12.2% |
| $75,000 to $99,999 | 40 | 15.2% |
| $100,000 to $149,999 | 43 | 16.3% |
| $150,000 to $199,999 | 43 | 16.3% |
| $200,000+ | 29 | 11.0% |
Household Income by Householder Age in Tribes Hill
The median household income in Tribes Hill is $92,574, with the highest median household income of $123,958 found in the 25 to 44 years age bracket for the primary householder. A total of 59 households (22.4%) fall into this category.
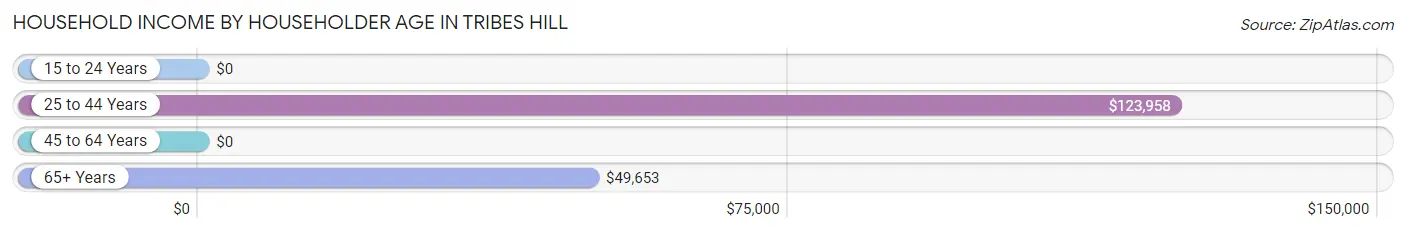
| Income Bracket | # Households | Median Income |
| 15 to 24 Years | 0 (0.0%) | $0 |
| 25 to 44 Years | 59 (22.4%) | $123,958 |
| 45 to 64 Years | 92 (35.0%) | $0 |
| 65+ Years | 112 (42.6%) | $49,653 |
| Total | 263 (100.0%) | $92,574 |
Poverty in Tribes Hill
Income Below Poverty by Sex and Age in Tribes Hill
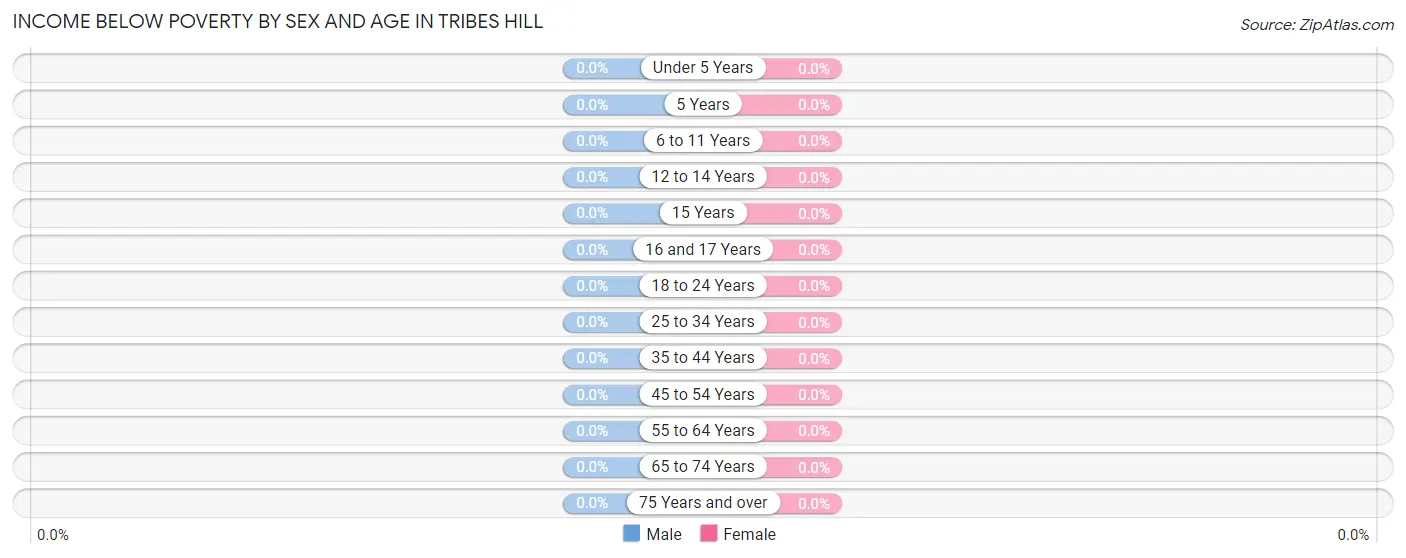
| Age Bracket | Male | Female |
| Under 5 Years | 0 (0.0%) | 0 (0.0%) |
| 5 Years | 0 (0.0%) | 0 (0.0%) |
| 6 to 11 Years | 0 (0.0%) | 0 (0.0%) |
| 12 to 14 Years | 0 (0.0%) | 0 (0.0%) |
| 15 Years | 0 (0.0%) | 0 (0.0%) |
| 16 and 17 Years | 0 (0.0%) | 0 (0.0%) |
| 18 to 24 Years | 0 (0.0%) | 0 (0.0%) |
| 25 to 34 Years | 0 (0.0%) | 0 (0.0%) |
| 35 to 44 Years | 0 (0.0%) | 0 (0.0%) |
| 45 to 54 Years | 0 (0.0%) | 0 (0.0%) |
| 55 to 64 Years | 0 (0.0%) | 0 (0.0%) |
| 65 to 74 Years | 0 (0.0%) | 0 (0.0%) |
| 75 Years and over | 0 (0.0%) | 0 (0.0%) |
| Total | 0 (0.0%) | 0 (0.0%) |
Income Above Poverty by Sex and Age in Tribes Hill
According to the poverty statistics in Tribes Hill, males aged 12 to 14 years and females aged under 5 years are the age groups that are most secure financially, with 100.0% of males and 100.0% of females in these age groups living above the poverty line.
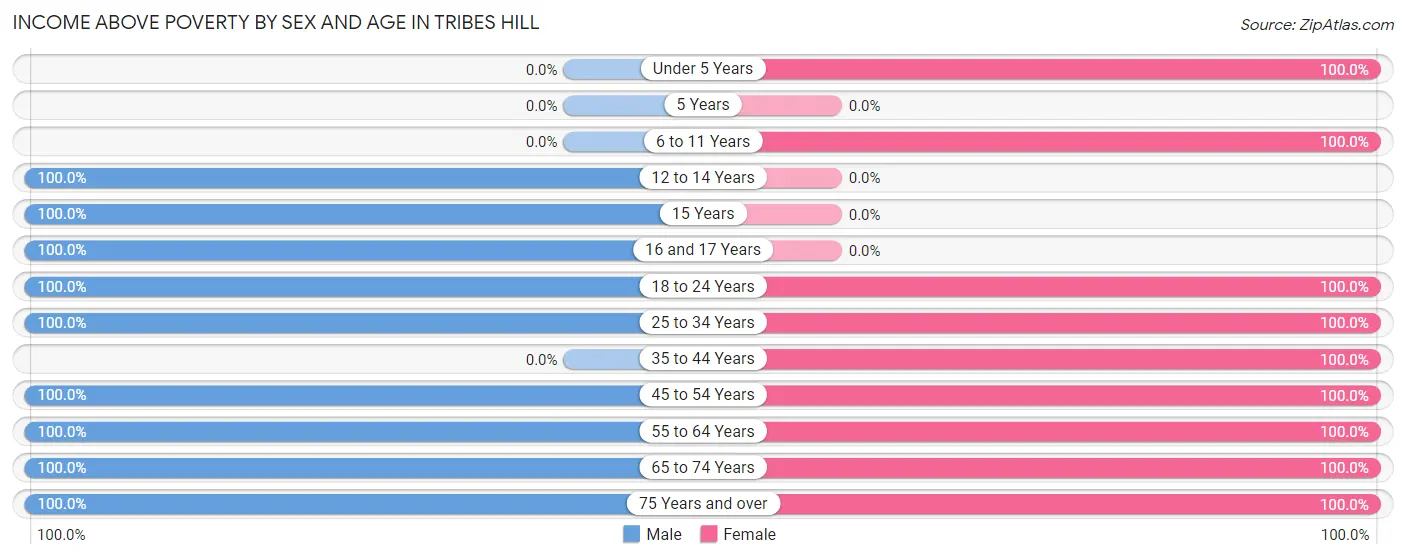
| Age Bracket | Male | Female |
| Under 5 Years | 0 (0.0%) | 43 (100.0%) |
| 5 Years | 0 (0.0%) | 0 (0.0%) |
| 6 to 11 Years | 0 (0.0%) | 120 (100.0%) |
| 12 to 14 Years | 15 (100.0%) | 0 (0.0%) |
| 15 Years | 19 (100.0%) | 0 (0.0%) |
| 16 and 17 Years | 38 (100.0%) | 0 (0.0%) |
| 18 to 24 Years | 9 (100.0%) | 40 (100.0%) |
| 25 to 34 Years | 16 (100.0%) | 56 (100.0%) |
| 35 to 44 Years | 0 (0.0%) | 44 (100.0%) |
| 45 to 54 Years | 65 (100.0%) | 17 (100.0%) |
| 55 to 64 Years | 83 (100.0%) | 41 (100.0%) |
| 65 to 74 Years | 39 (100.0%) | 96 (100.0%) |
| 75 Years and over | 24 (100.0%) | 73 (100.0%) |
| Total | 308 (100.0%) | 530 (100.0%) |
Income Below Poverty Among Married-Couple Families in Tribes Hill
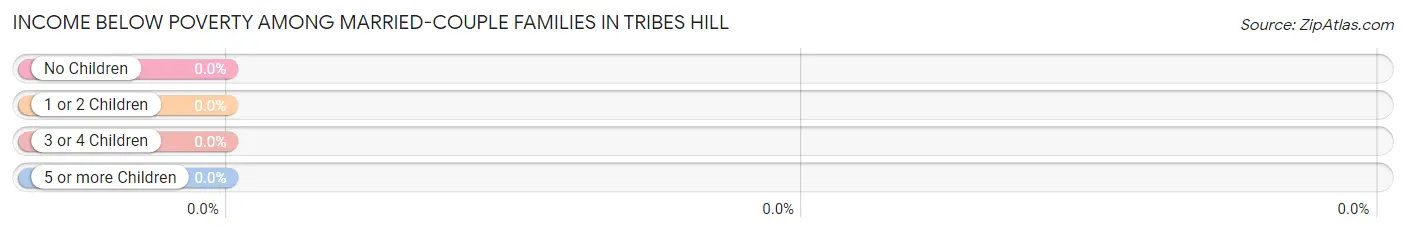
| Children | Above Poverty | Below Poverty |
| No Children | 84 (100.0%) | 0 (0.0%) |
| 1 or 2 Children | 15 (100.0%) | 0 (0.0%) |
| 3 or 4 Children | 44 (100.0%) | 0 (0.0%) |
| 5 or more Children | 0 (0.0%) | 0 (0.0%) |
| Total | 143 (100.0%) | 0 (0.0%) |
Income Below Poverty Among Single-Parent Households in Tribes Hill
| Children | Single Father | Single Mother |
| No Children | 0 (0.0%) | 0 (0.0%) |
| 1 or 2 Children | 0 (0.0%) | 0 (0.0%) |
| 3 or 4 Children | 0 (0.0%) | 0 (0.0%) |
| 5 or more Children | 0 (0.0%) | 0 (0.0%) |
| Total | 0 (0.0%) | 0 (0.0%) |
Income Below Poverty Among Married-Couple vs Single-Parent Households in Tribes Hill
| Children | Married-Couple Families | Single-Parent Households |
| No Children | 0 (0.0%) | 0 (0.0%) |
| 1 or 2 Children | 0 (0.0%) | 0 (0.0%) |
| 3 or 4 Children | 0 (0.0%) | 0 (0.0%) |
| 5 or more Children | 0 (0.0%) | 0 (0.0%) |
| Total | 0 (0.0%) | 0 (0.0%) |
Race in Tribes Hill
The most populous races in Tribes Hill are White / Caucasian (685 | 81.7%), Two or more Races (153 | 18.3%), and Hispanic or Latino (17 | 2.0%).
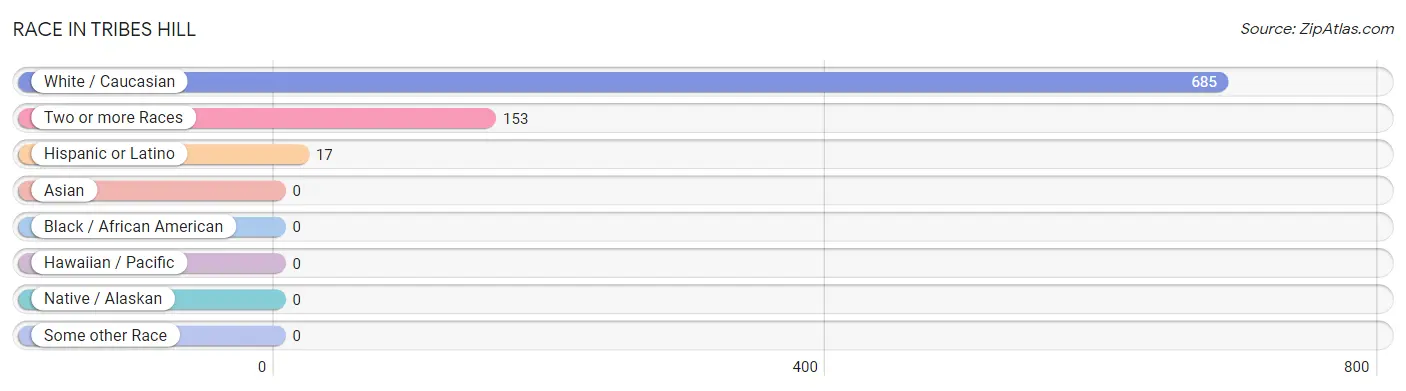
| Race | # Population | % Population |
| Asian | 0 | 0.0% |
| Black / African American | 0 | 0.0% |
| Hawaiian / Pacific | 0 | 0.0% |
| Hispanic or Latino | 17 | 2.0% |
| Native / Alaskan | 0 | 0.0% |
| White / Caucasian | 685 | 81.7% |
| Two or more Races | 153 | 18.3% |
| Some other Race | 0 | 0.0% |
| Total | 838 | 100.0% |
Ancestry in Tribes Hill
The most populous ancestries reported in Tribes Hill are German (213 | 25.4%), Irish (188 | 22.4%), American (139 | 16.6%), English (119 | 14.2%), and Dutch (59 | 7.0%), together accounting for 85.7% of all Tribes Hill residents.
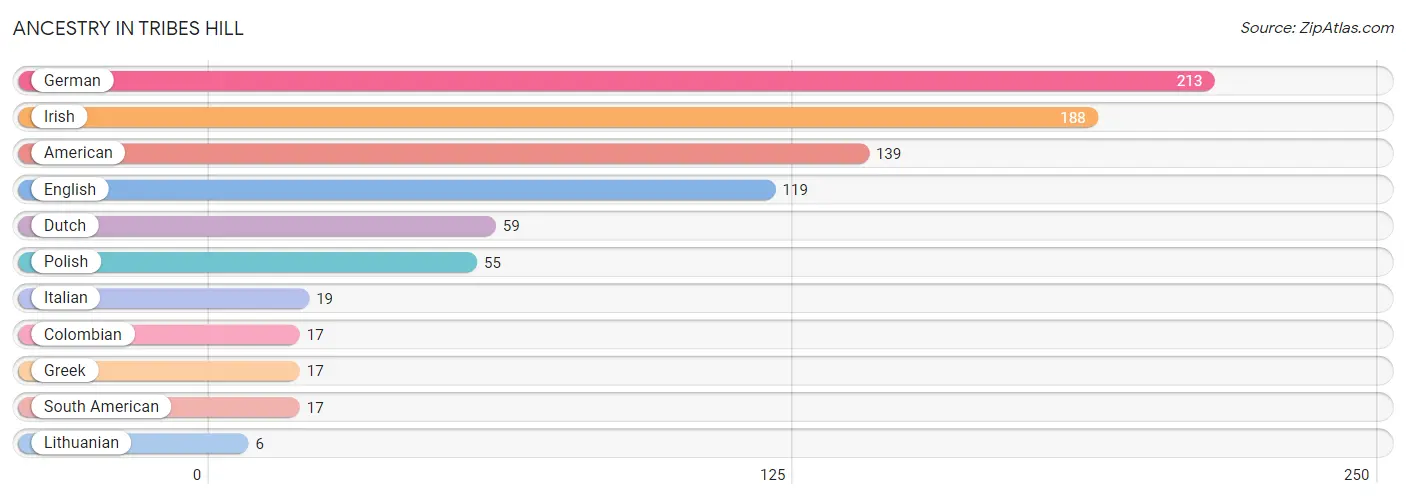
| Ancestry | # Population | % Population |
| American | 139 | 16.6% |
| Colombian | 17 | 2.0% |
| Dutch | 59 | 7.0% |
| English | 119 | 14.2% |
| German | 213 | 25.4% |
| Greek | 17 | 2.0% |
| Irish | 188 | 22.4% |
| Italian | 19 | 2.3% |
| Lithuanian | 6 | 0.7% |
| Polish | 55 | 6.6% |
| South American | 17 | 2.0% | View All 11 Rows |
Immigrants in Tribes Hill

| Immigration Origin | # Population | % Population | View All 0 Rows |
Sex and Age in Tribes Hill
Sex and Age in Tribes Hill
The most populous age groups in Tribes Hill are 15 to 19 Years (66 | 21.4%) for men and 5 to 9 Years (80 | 15.1%) for women.
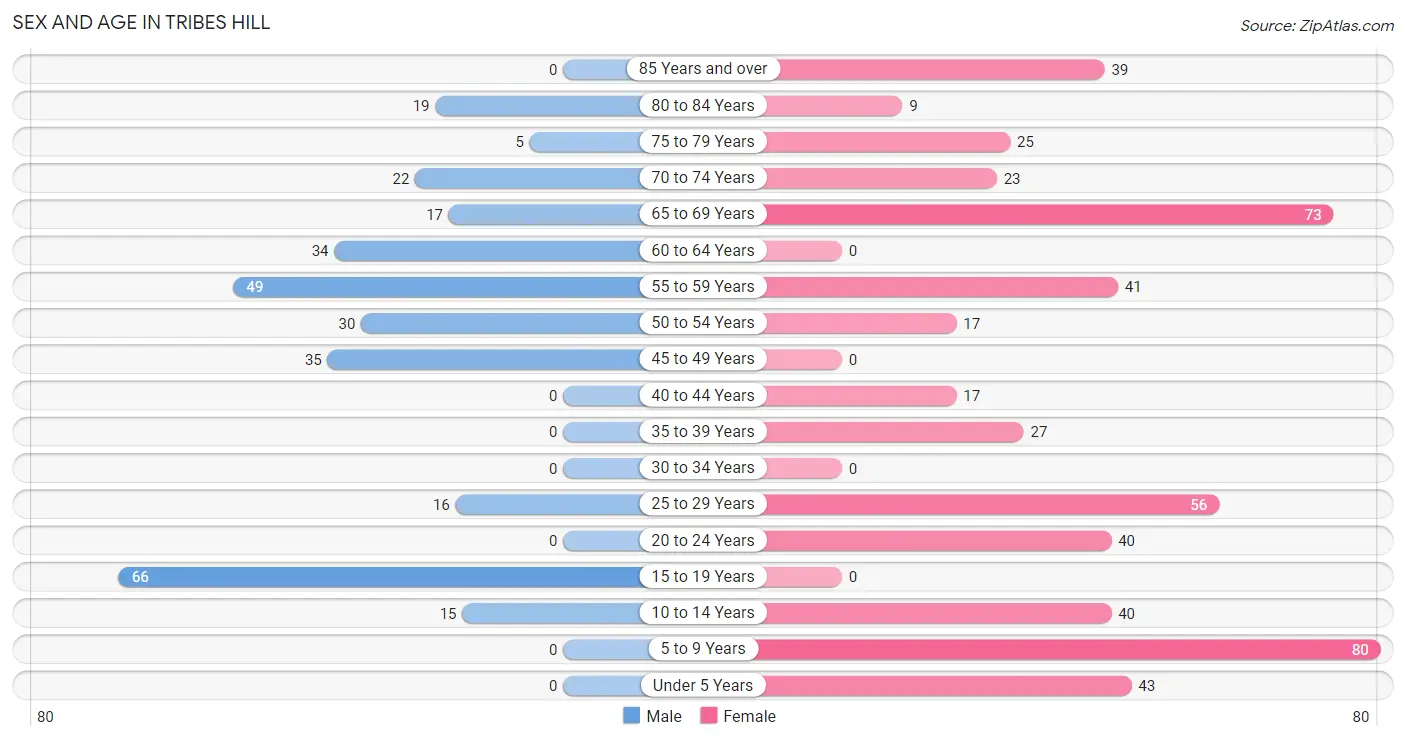
| Age Bracket | Male | Female |
| Under 5 Years | 0 (0.0%) | 43 (8.1%) |
| 5 to 9 Years | 0 (0.0%) | 80 (15.1%) |
| 10 to 14 Years | 15 (4.9%) | 40 (7.5%) |
| 15 to 19 Years | 66 (21.4%) | 0 (0.0%) |
| 20 to 24 Years | 0 (0.0%) | 40 (7.5%) |
| 25 to 29 Years | 16 (5.2%) | 56 (10.6%) |
| 30 to 34 Years | 0 (0.0%) | 0 (0.0%) |
| 35 to 39 Years | 0 (0.0%) | 27 (5.1%) |
| 40 to 44 Years | 0 (0.0%) | 17 (3.2%) |
| 45 to 49 Years | 35 (11.4%) | 0 (0.0%) |
| 50 to 54 Years | 30 (9.7%) | 17 (3.2%) |
| 55 to 59 Years | 49 (15.9%) | 41 (7.7%) |
| 60 to 64 Years | 34 (11.0%) | 0 (0.0%) |
| 65 to 69 Years | 17 (5.5%) | 73 (13.8%) |
| 70 to 74 Years | 22 (7.1%) | 23 (4.3%) |
| 75 to 79 Years | 5 (1.6%) | 25 (4.7%) |
| 80 to 84 Years | 19 (6.2%) | 9 (1.7%) |
| 85 Years and over | 0 (0.0%) | 39 (7.4%) |
| Total | 308 (100.0%) | 530 (100.0%) |
Families and Households in Tribes Hill
Median Family Size in Tribes Hill
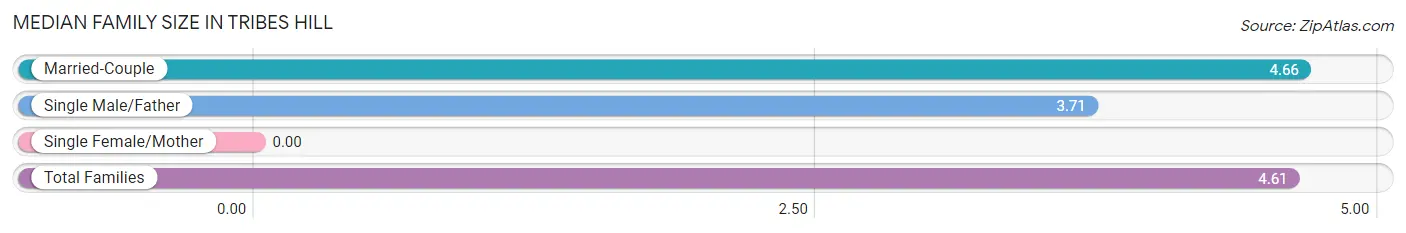
| Family Type | # Families | Family Size |
| Married-Couple | 143 (95.3%) | 4.66 |
| Single Male/Father | 7 (4.7%) | 3.71 |
| Single Female/Mother | 0 (0.0%) | - |
| Total Families | 150 (100.0%) | 4.61 |
Median Household Size in Tribes Hill
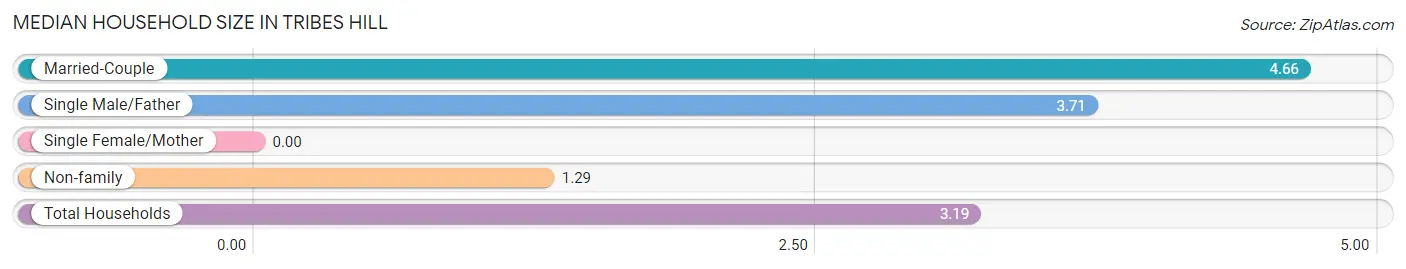
| Household Type | # Households | Household Size |
| Married-Couple | 143 (54.4%) | 4.66 |
| Single Male/Father | 7 (2.7%) | 3.71 |
| Single Female/Mother | 0 (0.0%) | - |
| Non-family | 113 (43.0%) | 1.29 |
| Total Households | 263 (100.0%) | 3.19 |
Household Size by Marriage Status in Tribes Hill
Out of a total of 263 households in Tribes Hill, 150 (57.0%) are family households, while 113 (43.0%) are nonfamily households. The most numerous type of family households are 5-person households, comprising 70, and the most common type of nonfamily households are 1-person households, comprising 84.
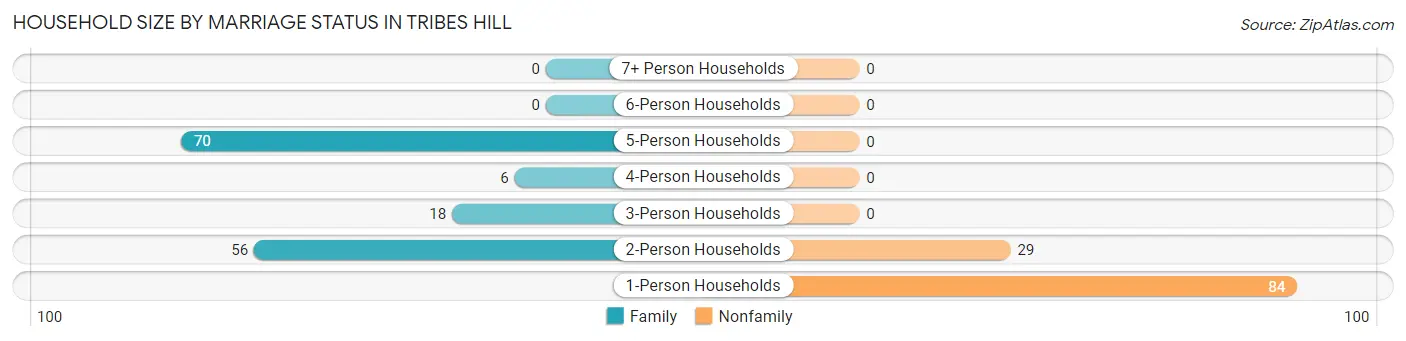
| Household Size | Family Households | Nonfamily Households |
| 1-Person Households | - | 84 (31.9%) |
| 2-Person Households | 56 (21.3%) | 29 (11.0%) |
| 3-Person Households | 18 (6.8%) | 0 (0.0%) |
| 4-Person Households | 6 (2.3%) | 0 (0.0%) |
| 5-Person Households | 70 (26.6%) | 0 (0.0%) |
| 6-Person Households | 0 (0.0%) | 0 (0.0%) |
| 7+ Person Households | 0 (0.0%) | 0 (0.0%) |
| Total | 150 (57.0%) | 113 (43.0%) |
Female Fertility in Tribes Hill
Fertility by Age in Tribes Hill
Average fertility rate in Tribes Hill is 71.0 births per 1,000 women. Women in the age bracket of 20 to 34 years have the highest fertility rate with 104.0 births per 1,000 women. Women in the age bracket of 20 to 34 years acount for 100.0% of all women with births.
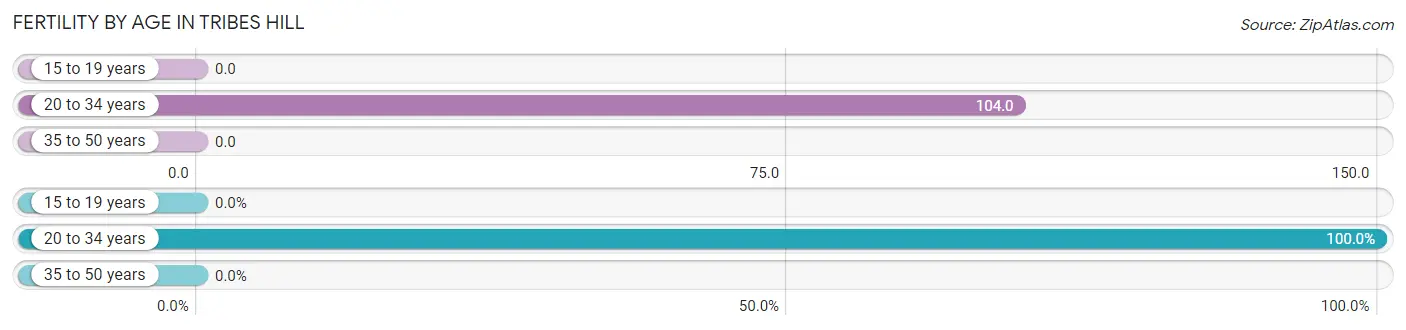
| Age Bracket | Women with Births | Births / 1,000 Women |
| 15 to 19 years | 0 (0.0%) | 0.0 |
| 20 to 34 years | 10 (100.0%) | 104.0 |
| 35 to 50 years | 0 (0.0%) | 0.0 |
| Total | 10 (100.0%) | 71.0 |
Fertility by Age by Marriage Status in Tribes Hill
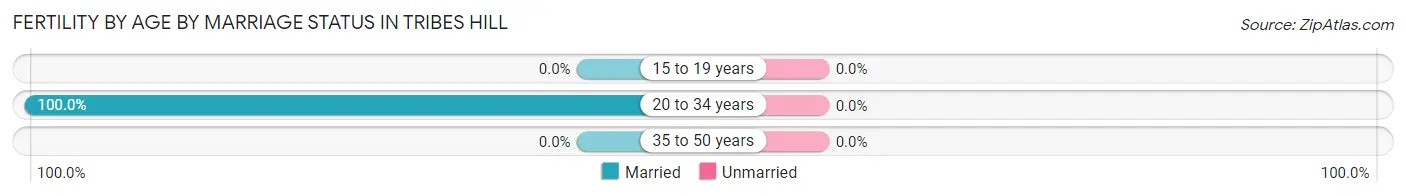
| Age Bracket | Married | Unmarried |
| 15 to 19 years | 0 (0.0%) | 0 (0.0%) |
| 20 to 34 years | 10 (100.0%) | 0 (0.0%) |
| 35 to 50 years | 0 (0.0%) | 0 (0.0%) |
| Total | 10 (100.0%) | 0 (0.0%) |
Fertility by Education in Tribes Hill
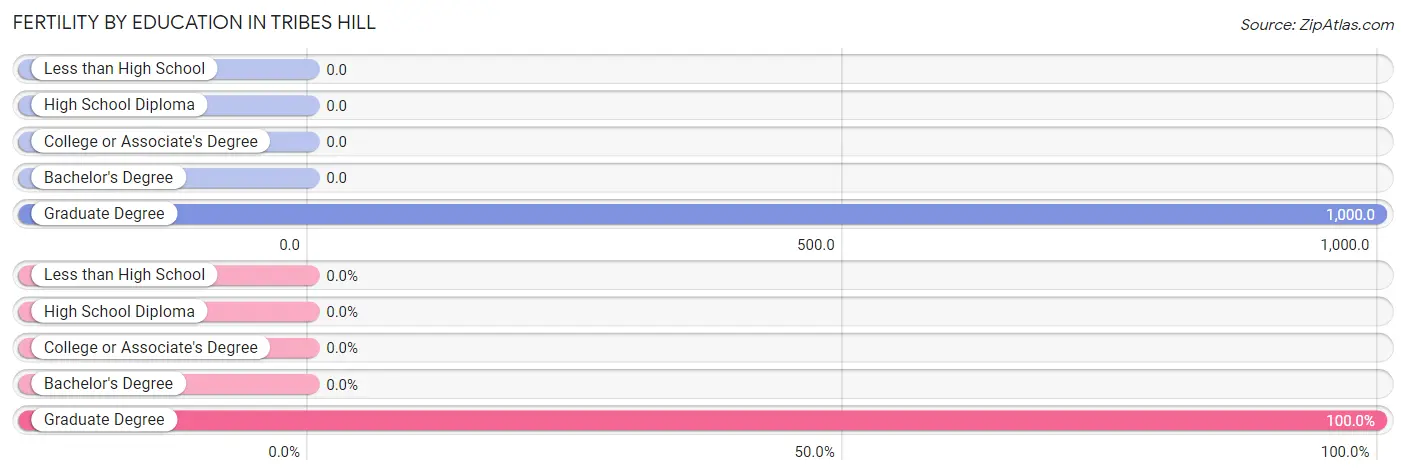
| Educational Attainment | Women with Births | Births / 1,000 Women |
| Less than High School | 0 (0.0%) | 0.0 |
| High School Diploma | 0 (0.0%) | 0.0 |
| College or Associate's Degree | 0 (0.0%) | 0.0 |
| Bachelor's Degree | 0 (0.0%) | 0.0 |
| Graduate Degree | 10 (100.0%) | 1,000.0 |
| Total | 10 (100.0%) | 71.0 |
Fertility by Education by Marriage Status in Tribes Hill
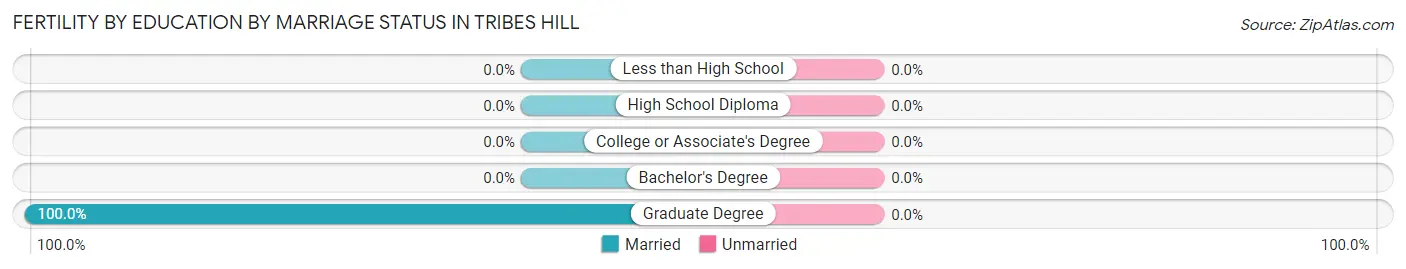
| Educational Attainment | Married | Unmarried |
| Less than High School | 0 (0.0%) | 0 (0.0%) |
| High School Diploma | 0 (0.0%) | 0 (0.0%) |
| College or Associate's Degree | 0 (0.0%) | 0 (0.0%) |
| Bachelor's Degree | 0 (0.0%) | 0 (0.0%) |
| Graduate Degree | 10 (100.0%) | 0 (0.0%) |
| Total | 10 (100.0%) | 0 (0.0%) |
Employment Characteristics in Tribes Hill
Employment by Class of Employer in Tribes Hill
Among the 348 employed individuals in Tribes Hill, private company employees (315 | 90.5%), local government employees (17 | 4.9%), and not-for-profit organizations (10 | 2.9%) make up the most common classes of employment.
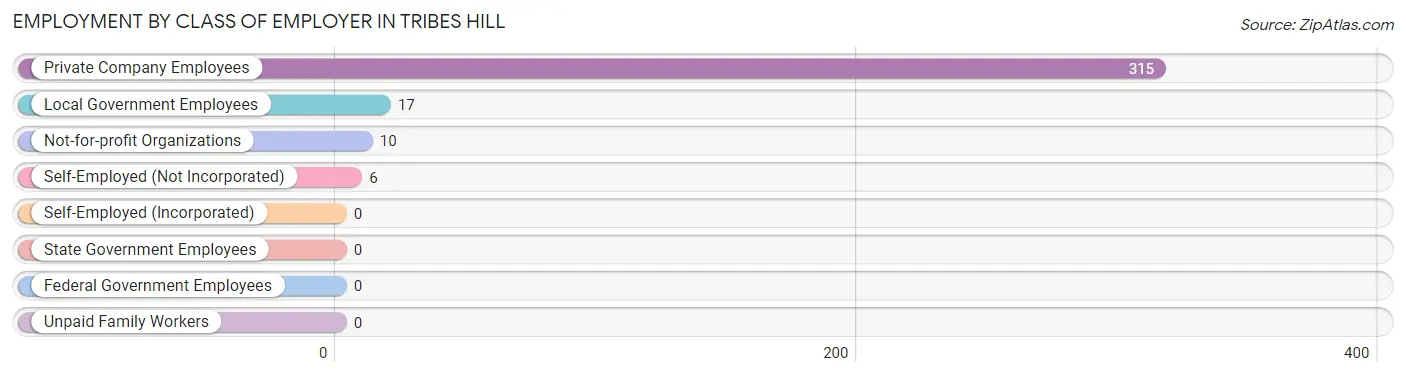
| Employer Class | # Employees | % Employees |
| Private Company Employees | 315 | 90.5% |
| Self-Employed (Incorporated) | 0 | 0.0% |
| Self-Employed (Not Incorporated) | 6 | 1.7% |
| Not-for-profit Organizations | 10 | 2.9% |
| Local Government Employees | 17 | 4.9% |
| State Government Employees | 0 | 0.0% |
| Federal Government Employees | 0 | 0.0% |
| Unpaid Family Workers | 0 | 0.0% |
| Total | 348 | 100.0% |
Employment Status by Age in Tribes Hill
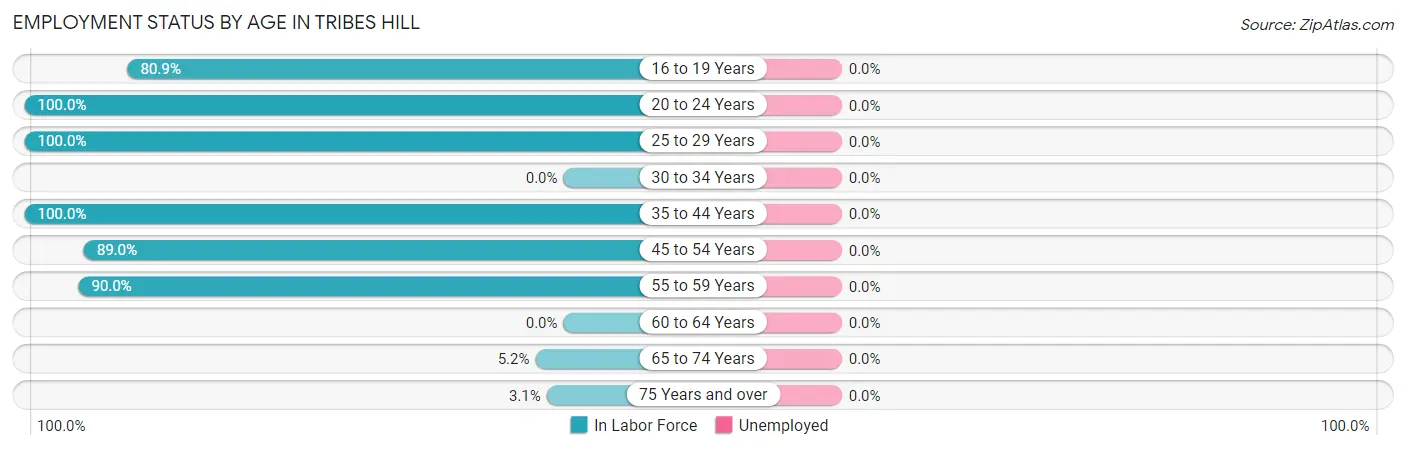
| Age Bracket | In Labor Force | Unemployed |
| 16 to 19 Years | 38 (80.9%) | 0 (0.0%) |
| 20 to 24 Years | 40 (100.0%) | 0 (0.0%) |
| 25 to 29 Years | 72 (100.0%) | 0 (0.0%) |
| 30 to 34 Years | 0 (0.0%) | 0 (0.0%) |
| 35 to 44 Years | 44 (100.0%) | 0 (0.0%) |
| 45 to 54 Years | 73 (89.0%) | 0 (0.0%) |
| 55 to 59 Years | 81 (90.0%) | 0 (0.0%) |
| 60 to 64 Years | 0 (0.0%) | 0 (0.0%) |
| 65 to 74 Years | 7 (5.2%) | 0 (0.0%) |
| 75 Years and over | 3 (3.1%) | 0 (0.0%) |
| Total | 358 (55.9%) | 0 (0.0%) |
Employment Status by Educational Attainment in Tribes Hill
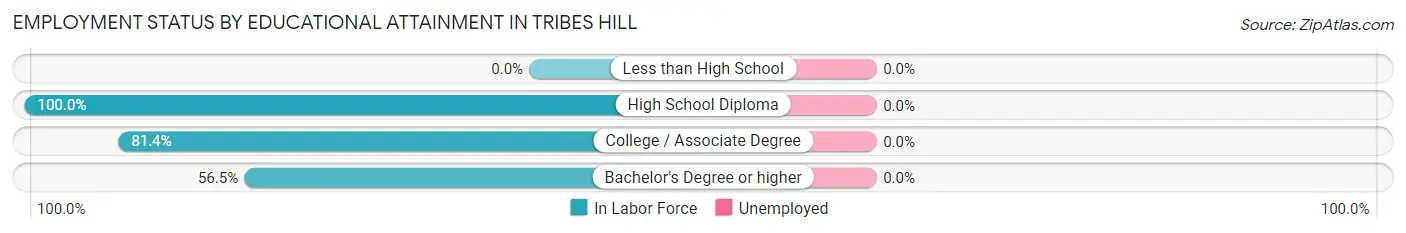
| Educational Attainment | In Labor Force | Unemployed |
| Less than High School | 0 (0.0%) | 0 (0.0%) |
| High School Diploma | 104 (100.0%) | 0 (0.0%) |
| College / Associate Degree | 140 (81.4%) | 0 (0.0%) |
| Bachelor's Degree or higher | 26 (56.5%) | 0 (0.0%) |
| Total | 270 (83.9%) | 0 (0.0%) |
Employment Occupations by Sex in Tribes Hill
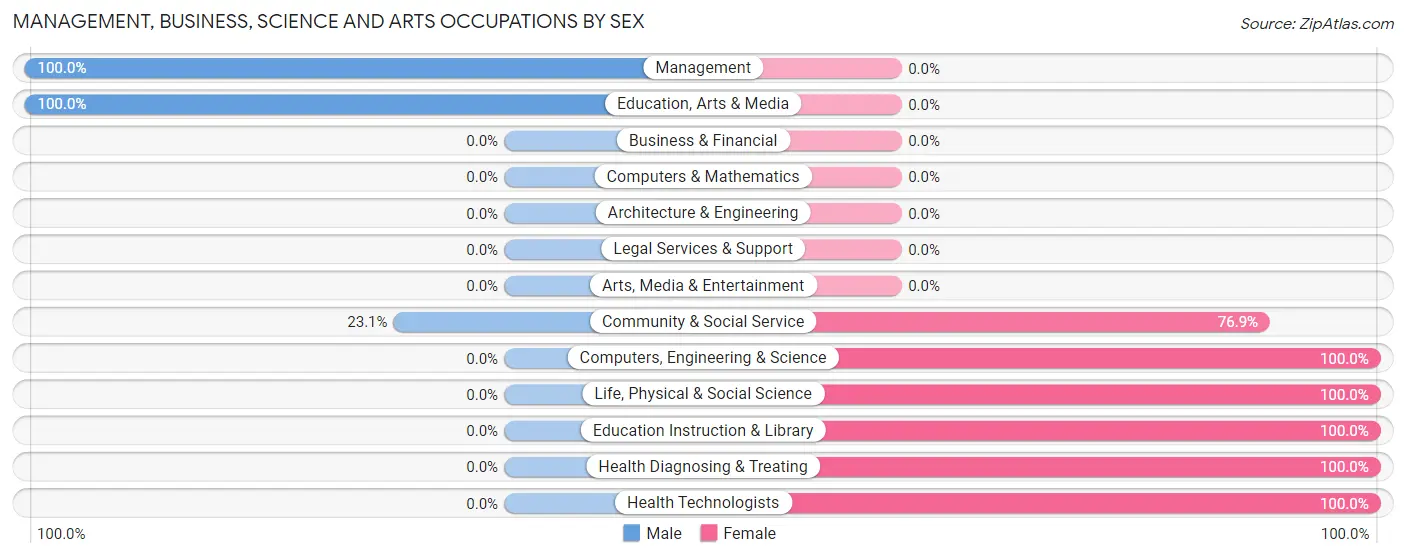
Management, Business, Science and Arts Occupations
The most common Management, Business, Science and Arts occupations in Tribes Hill are Management (37 | 10.3%), Health Diagnosing & Treating (27 | 7.5%), Health Technologists (27 | 7.5%), Community & Social Service (13 | 3.6%), and Education Instruction & Library (10 | 2.8%).
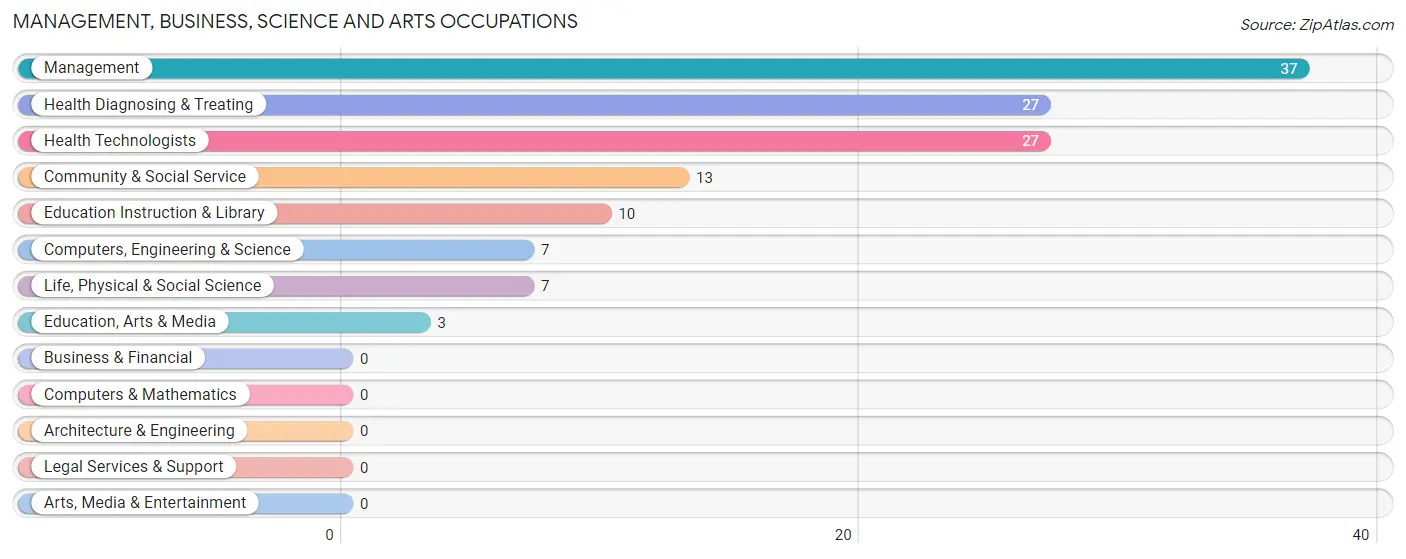
Management, Business, Science and Arts Occupations by Sex
Within the Management, Business, Science and Arts occupations in Tribes Hill, the most male-oriented occupations are Management (100.0%), Education, Arts & Media (100.0%), and Community & Social Service (23.1%), while the most female-oriented occupations are Computers, Engineering & Science (100.0%), Life, Physical & Social Science (100.0%), and Education Instruction & Library (100.0%).
| Occupation | Male | Female |
| Management | 37 (100.0%) | 0 (0.0%) |
| Business & Financial | 0 (0.0%) | 0 (0.0%) |
| Computers, Engineering & Science | 0 (0.0%) | 7 (100.0%) |
| Computers & Mathematics | 0 (0.0%) | 0 (0.0%) |
| Architecture & Engineering | 0 (0.0%) | 0 (0.0%) |
| Life, Physical & Social Science | 0 (0.0%) | 7 (100.0%) |
| Community & Social Service | 3 (23.1%) | 10 (76.9%) |
| Education, Arts & Media | 3 (100.0%) | 0 (0.0%) |
| Legal Services & Support | 0 (0.0%) | 0 (0.0%) |
| Education Instruction & Library | 0 (0.0%) | 10 (100.0%) |
| Arts, Media & Entertainment | 0 (0.0%) | 0 (0.0%) |
| Health Diagnosing & Treating | 0 (0.0%) | 27 (100.0%) |
| Health Technologists | 0 (0.0%) | 27 (100.0%) |
| Total (Category) | 40 (47.6%) | 44 (52.4%) |
| Total (Overall) | 153 (42.7%) | 205 (57.3%) |
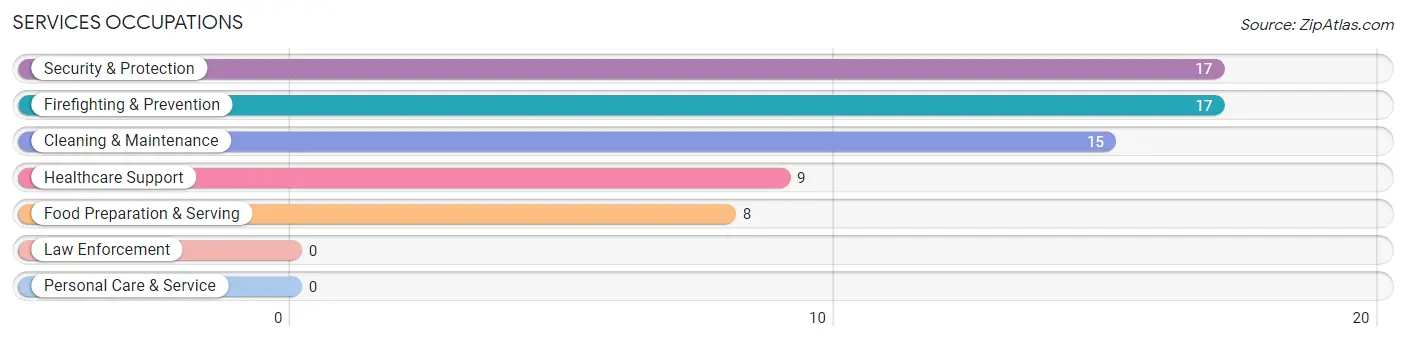
Services Occupations
The most common Services occupations in Tribes Hill are Security & Protection (17 | 4.8%), Firefighting & Prevention (17 | 4.8%), Cleaning & Maintenance (15 | 4.2%), Healthcare Support (9 | 2.5%), and Food Preparation & Serving (8 | 2.2%).
Services Occupations by Sex
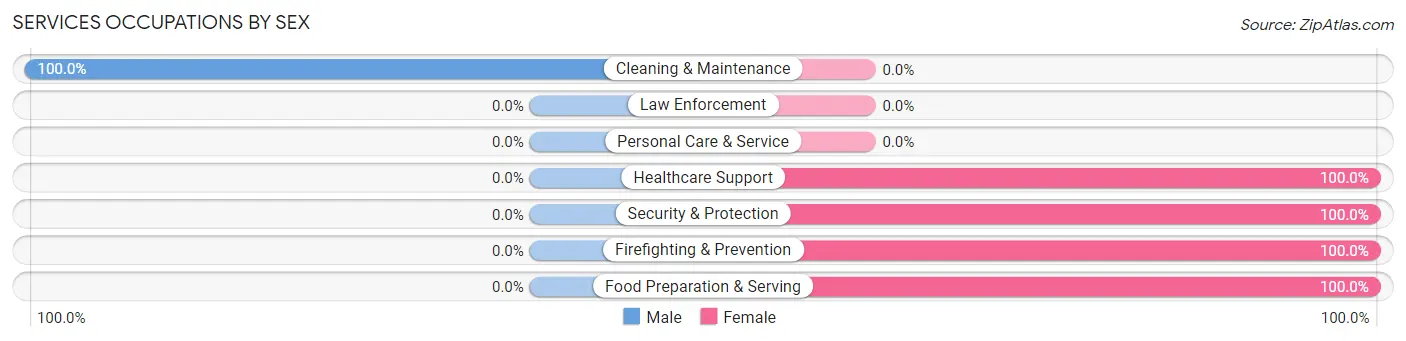
| Occupation | Male | Female |
| Healthcare Support | 0 (0.0%) | 9 (100.0%) |
| Security & Protection | 0 (0.0%) | 17 (100.0%) |
| Firefighting & Prevention | 0 (0.0%) | 17 (100.0%) |
| Law Enforcement | 0 (0.0%) | 0 (0.0%) |
| Food Preparation & Serving | 0 (0.0%) | 8 (100.0%) |
| Cleaning & Maintenance | 15 (100.0%) | 0 (0.0%) |
| Personal Care & Service | 0 (0.0%) | 0 (0.0%) |
| Total (Category) | 15 (30.6%) | 34 (69.4%) |
| Total (Overall) | 153 (42.7%) | 205 (57.3%) |
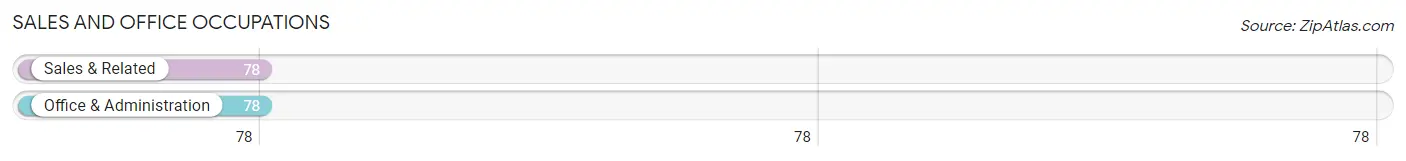
Sales and Office Occupations
The most common Sales and Office occupations in Tribes Hill are Sales & Related (78 | 21.8%), and Office & Administration (78 | 21.8%).
Sales and Office Occupations by Sex
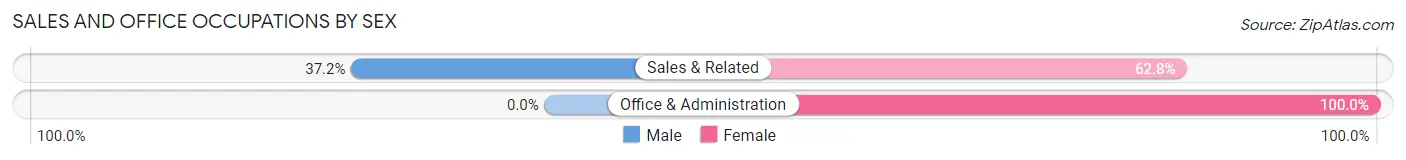
| Occupation | Male | Female |
| Sales & Related | 29 (37.2%) | 49 (62.8%) |
| Office & Administration | 0 (0.0%) | 78 (100.0%) |
| Total (Category) | 29 (18.6%) | 127 (81.4%) |
| Total (Overall) | 153 (42.7%) | 205 (57.3%) |
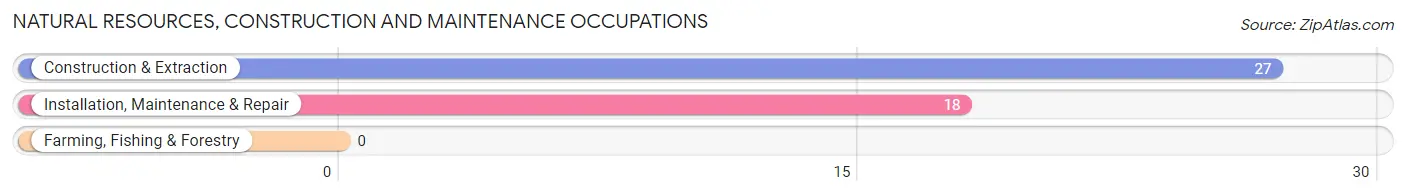
Natural Resources, Construction and Maintenance Occupations
The most common Natural Resources, Construction and Maintenance occupations in Tribes Hill are Construction & Extraction (27 | 7.5%), and Installation, Maintenance & Repair (18 | 5.0%).
Natural Resources, Construction and Maintenance Occupations by Sex
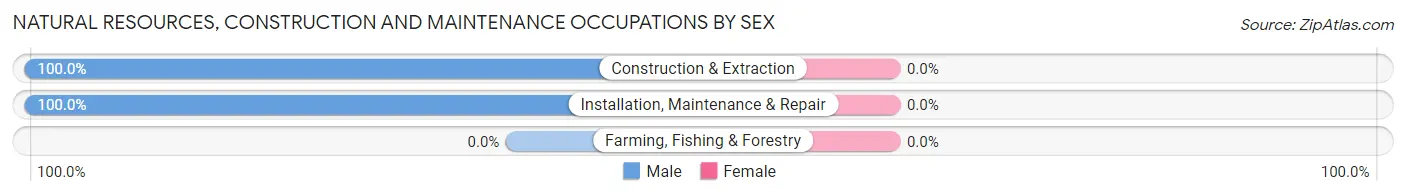
| Occupation | Male | Female |
| Farming, Fishing & Forestry | 0 (0.0%) | 0 (0.0%) |
| Construction & Extraction | 27 (100.0%) | 0 (0.0%) |
| Installation, Maintenance & Repair | 18 (100.0%) | 0 (0.0%) |
| Total (Category) | 45 (100.0%) | 0 (0.0%) |
| Total (Overall) | 153 (42.7%) | 205 (57.3%) |
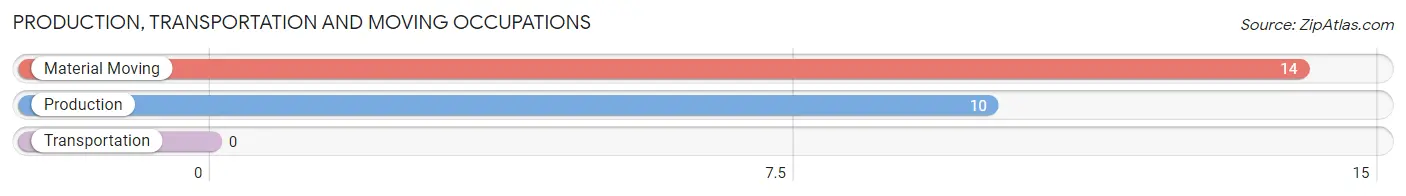
Production, Transportation and Moving Occupations
The most common Production, Transportation and Moving occupations in Tribes Hill are Material Moving (14 | 3.9%), and Production (10 | 2.8%).
Production, Transportation and Moving Occupations by Sex
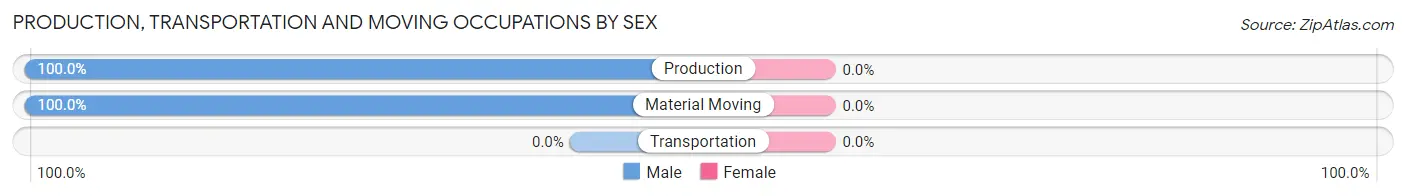
| Occupation | Male | Female |
| Production | 10 (100.0%) | 0 (0.0%) |
| Transportation | 0 (0.0%) | 0 (0.0%) |
| Material Moving | 14 (100.0%) | 0 (0.0%) |
| Total (Category) | 24 (100.0%) | 0 (0.0%) |
| Total (Overall) | 153 (42.7%) | 205 (57.3%) |
Employment Industries by Sex in Tribes Hill
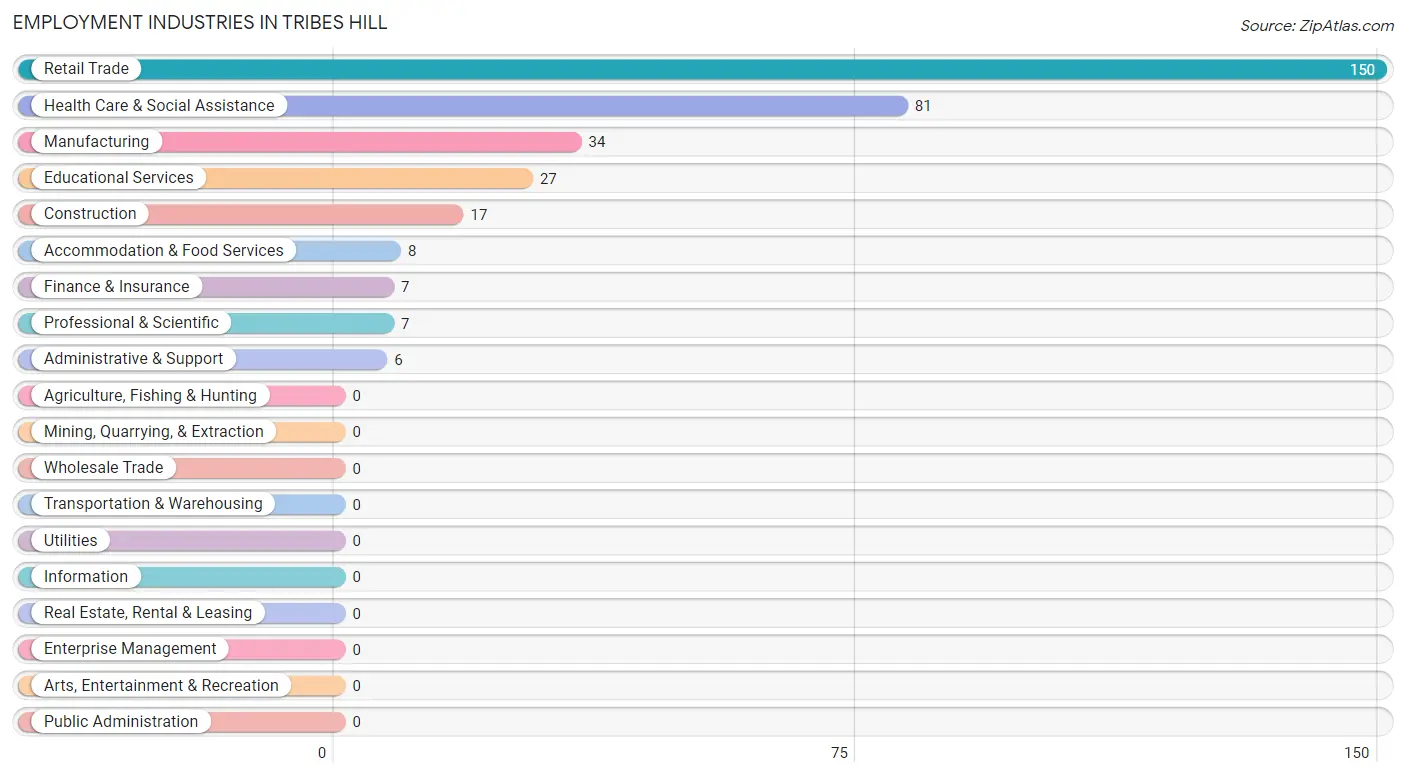
Employment Industries in Tribes Hill
The major employment industries in Tribes Hill include Retail Trade (150 | 41.9%), Health Care & Social Assistance (81 | 22.6%), Manufacturing (34 | 9.5%), Educational Services (27 | 7.5%), and Construction (17 | 4.8%).
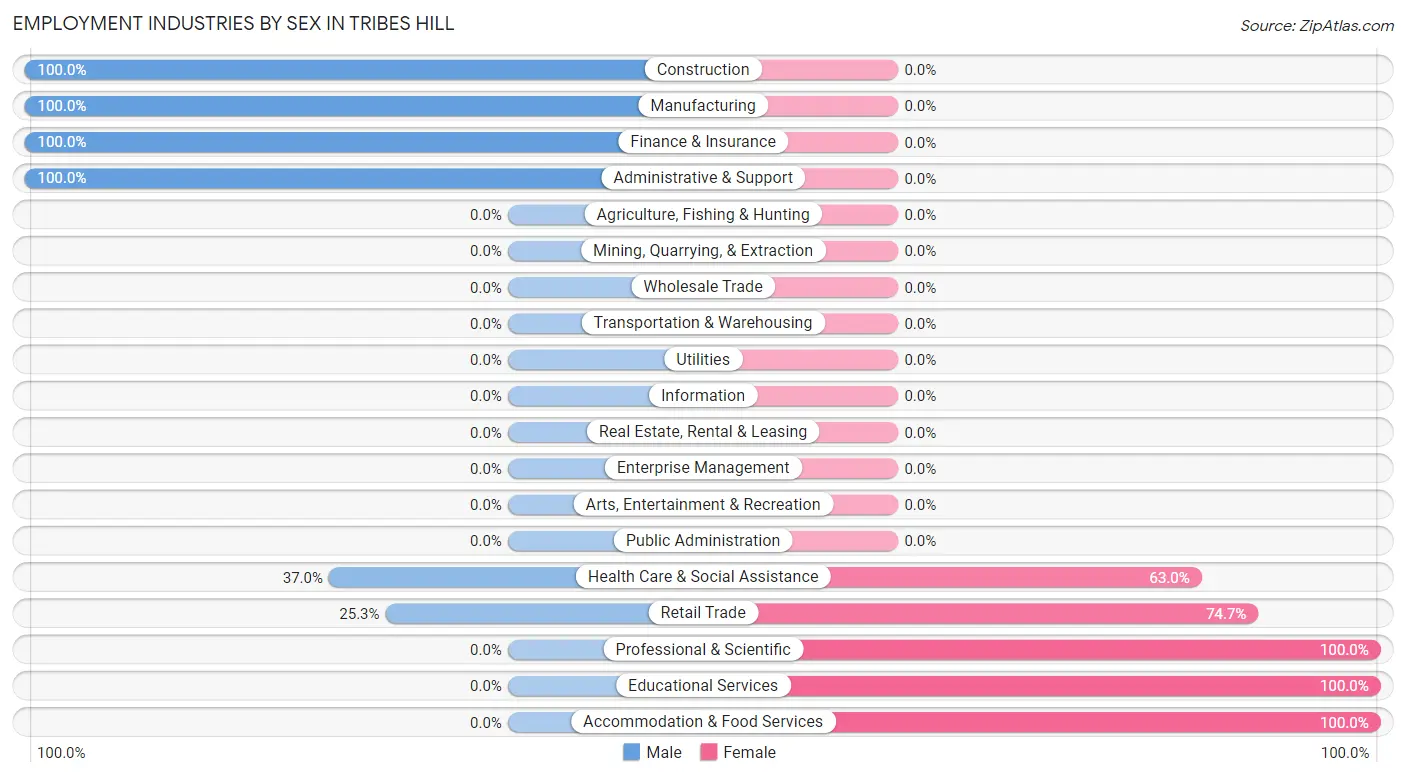
Employment Industries by Sex in Tribes Hill
The Tribes Hill industries that see more men than women are Construction (100.0%), Manufacturing (100.0%), and Finance & Insurance (100.0%), whereas the industries that tend to have a higher number of women are Professional & Scientific (100.0%), Educational Services (100.0%), and Accommodation & Food Services (100.0%).
| Industry | Male | Female |
| Agriculture, Fishing & Hunting | 0 (0.0%) | 0 (0.0%) |
| Mining, Quarrying, & Extraction | 0 (0.0%) | 0 (0.0%) |
| Construction | 17 (100.0%) | 0 (0.0%) |
| Manufacturing | 34 (100.0%) | 0 (0.0%) |
| Wholesale Trade | 0 (0.0%) | 0 (0.0%) |
| Retail Trade | 38 (25.3%) | 112 (74.7%) |
| Transportation & Warehousing | 0 (0.0%) | 0 (0.0%) |
| Utilities | 0 (0.0%) | 0 (0.0%) |
| Information | 0 (0.0%) | 0 (0.0%) |
| Finance & Insurance | 7 (100.0%) | 0 (0.0%) |
| Real Estate, Rental & Leasing | 0 (0.0%) | 0 (0.0%) |
| Professional & Scientific | 0 (0.0%) | 7 (100.0%) |
| Enterprise Management | 0 (0.0%) | 0 (0.0%) |
| Administrative & Support | 6 (100.0%) | 0 (0.0%) |
| Educational Services | 0 (0.0%) | 27 (100.0%) |
| Health Care & Social Assistance | 30 (37.0%) | 51 (63.0%) |
| Arts, Entertainment & Recreation | 0 (0.0%) | 0 (0.0%) |
| Accommodation & Food Services | 0 (0.0%) | 8 (100.0%) |
| Public Administration | 0 (0.0%) | 0 (0.0%) |
| Total | 153 (42.7%) | 205 (57.3%) |
Education in Tribes Hill
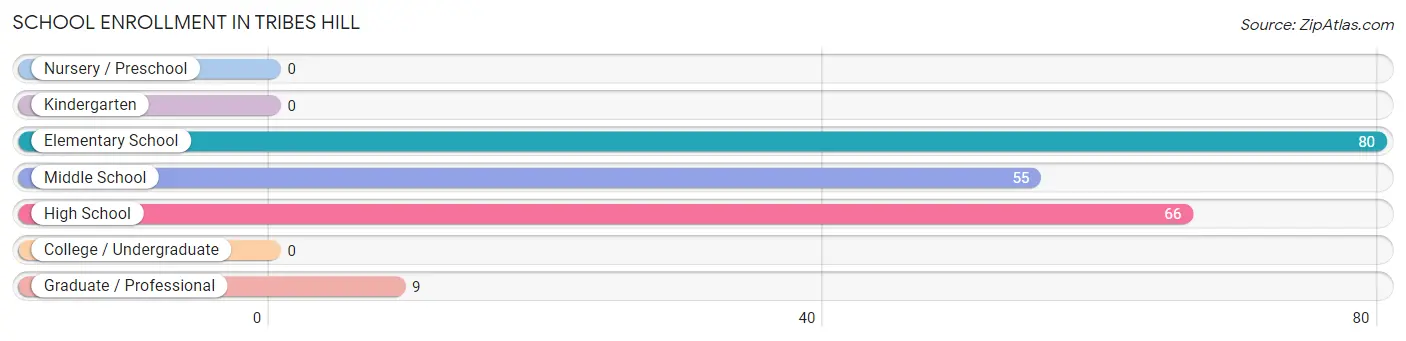
School Enrollment in Tribes Hill
The most common levels of schooling among the 210 students in Tribes Hill are elementary school (80 | 38.1%), high school (66 | 31.4%), and middle school (55 | 26.2%).
| School Level | # Students | % Students |
| Nursery / Preschool | 0 | 0.0% |
| Kindergarten | 0 | 0.0% |
| Elementary School | 80 | 38.1% |
| Middle School | 55 | 26.2% |
| High School | 66 | 31.4% |
| College / Undergraduate | 0 | 0.0% |
| Graduate / Professional | 9 | 4.3% |
| Total | 210 | 100.0% |
School Enrollment by Age by Funding Source in Tribes Hill
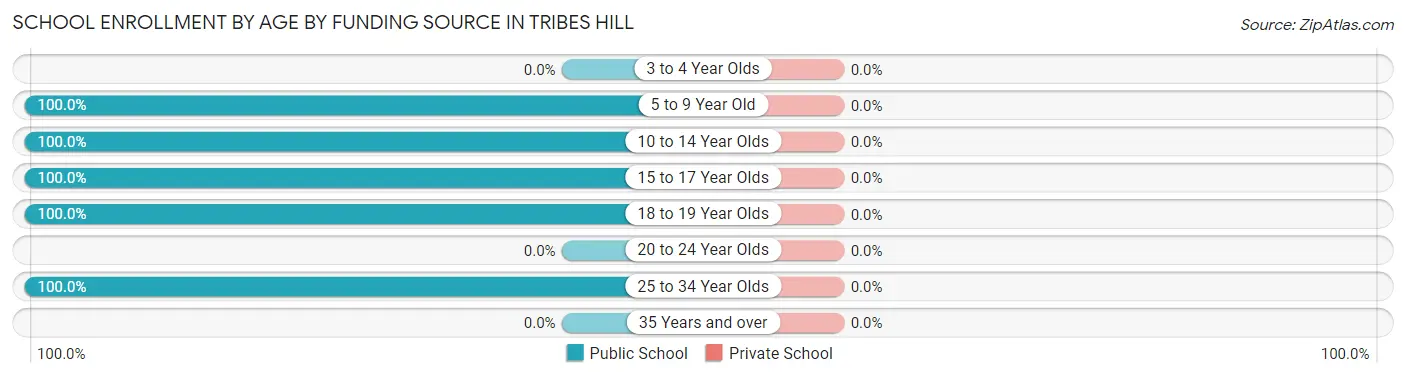
| Age Bracket | Public School | Private School |
| 3 to 4 Year Olds | 0 (0.0%) | 0 (0.0%) |
| 5 to 9 Year Old | 80 (100.0%) | 0 (0.0%) |
| 10 to 14 Year Olds | 55 (100.0%) | 0 (0.0%) |
| 15 to 17 Year Olds | 57 (100.0%) | 0 (0.0%) |
| 18 to 19 Year Olds | 9 (100.0%) | 0 (0.0%) |
| 20 to 24 Year Olds | 0 (0.0%) | 0 (0.0%) |
| 25 to 34 Year Olds | 9 (100.0%) | 0 (0.0%) |
| 35 Years and over | 0 (0.0%) | 0 (0.0%) |
| Total | 210 (100.0%) | 0 (0.0%) |
Educational Attainment by Field of Study in Tribes Hill
Physical & health sciences (20 | 26.7%), social sciences (14 | 18.7%), education (13 | 17.3%), science & technology (11 | 14.7%), and psychology (9 | 12.0%) are the most common fields of study among 75 individuals in Tribes Hill who have obtained a bachelor's degree or higher.
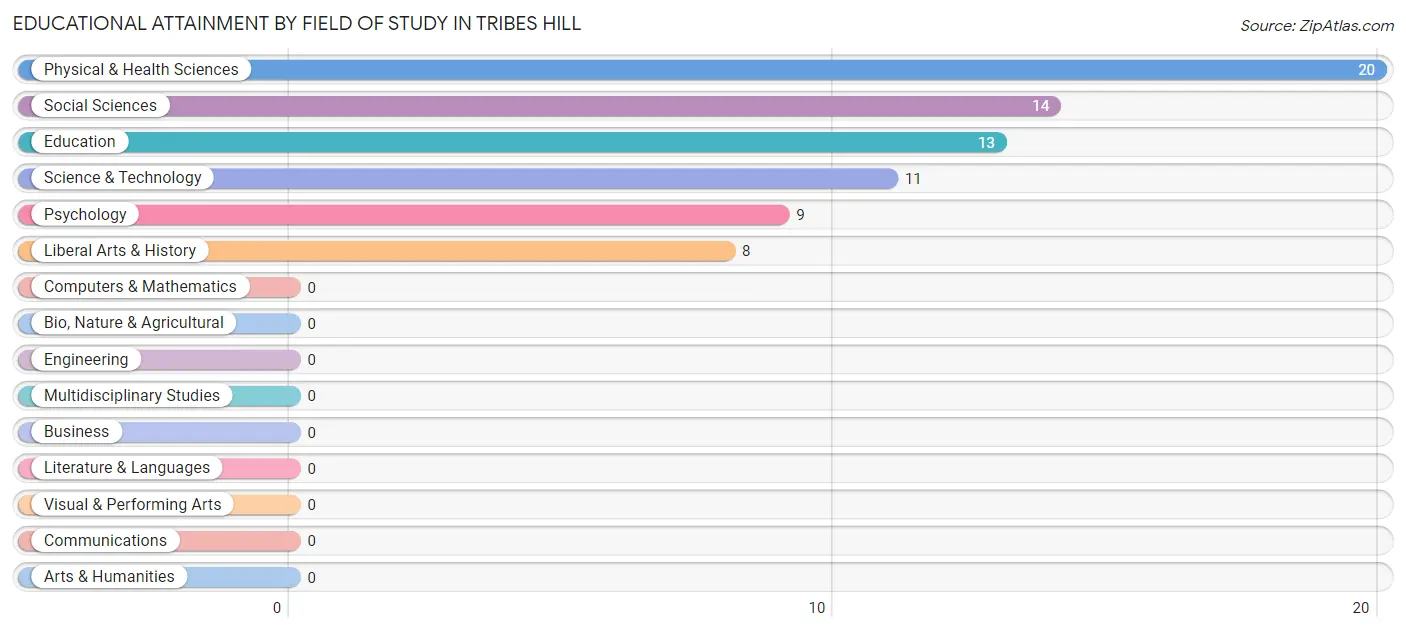
| Field of Study | # Graduates | % Graduates |
| Computers & Mathematics | 0 | 0.0% |
| Bio, Nature & Agricultural | 0 | 0.0% |
| Physical & Health Sciences | 20 | 26.7% |
| Psychology | 9 | 12.0% |
| Social Sciences | 14 | 18.7% |
| Engineering | 0 | 0.0% |
| Multidisciplinary Studies | 0 | 0.0% |
| Science & Technology | 11 | 14.7% |
| Business | 0 | 0.0% |
| Education | 13 | 17.3% |
| Literature & Languages | 0 | 0.0% |
| Liberal Arts & History | 8 | 10.7% |
| Visual & Performing Arts | 0 | 0.0% |
| Communications | 0 | 0.0% |
| Arts & Humanities | 0 | 0.0% |
| Total | 75 | 100.0% |
Transportation & Commute in Tribes Hill
Vehicle Availability by Sex in Tribes Hill
The most prevalent vehicle ownership categories in Tribes Hill are males with 2 vehicles (66, accounting for 43.1%) and females with 2 vehicles (45, making up 33.9%).
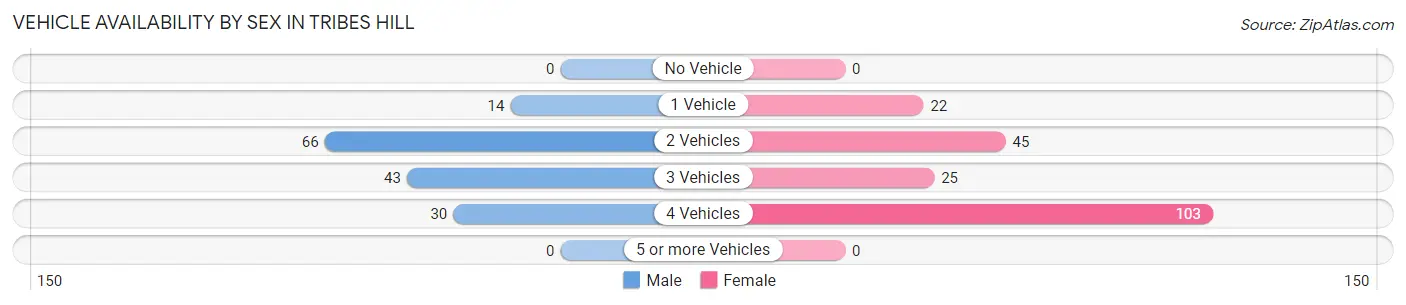
| Vehicles Available | Male | Female |
| No Vehicle | 0 (0.0%) | 0 (0.0%) |
| 1 Vehicle | 14 (9.1%) | 22 (11.3%) |
| 2 Vehicles | 66 (43.1%) | 45 (23.1%) |
| 3 Vehicles | 43 (28.1%) | 25 (12.8%) |
| 4 Vehicles | 30 (19.6%) | 103 (52.8%) |
| 5 or more Vehicles | 0 (0.0%) | 0 (0.0%) |
| Total | 153 (100.0%) | 195 (100.0%) |
Commute Time in Tribes Hill
The most frequently occuring commute durations in Tribes Hill are 10 to 14 minutes (117 commuters, 36.8%), 15 to 19 minutes (110 commuters, 34.6%), and 5 to 9 minutes (40 commuters, 12.6%).
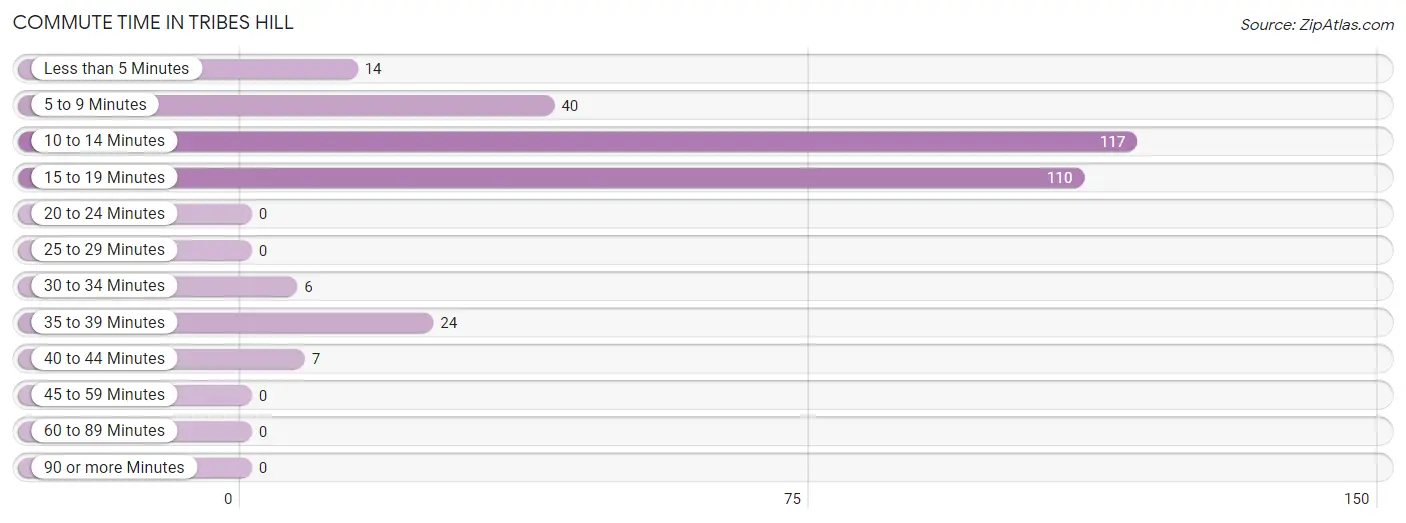
| Commute Time | # Commuters | % Commuters |
| Less than 5 Minutes | 14 | 4.4% |
| 5 to 9 Minutes | 40 | 12.6% |
| 10 to 14 Minutes | 117 | 36.8% |
| 15 to 19 Minutes | 110 | 34.6% |
| 20 to 24 Minutes | 0 | 0.0% |
| 25 to 29 Minutes | 0 | 0.0% |
| 30 to 34 Minutes | 6 | 1.9% |
| 35 to 39 Minutes | 24 | 7.5% |
| 40 to 44 Minutes | 7 | 2.2% |
| 45 to 59 Minutes | 0 | 0.0% |
| 60 to 89 Minutes | 0 | 0.0% |
| 90 or more Minutes | 0 | 0.0% |
Commute Time by Sex in Tribes Hill
The most common commute times in Tribes Hill are 15 to 19 minutes (56 commuters, 45.5%) for males and 10 to 14 minutes (83 commuters, 42.6%) for females.
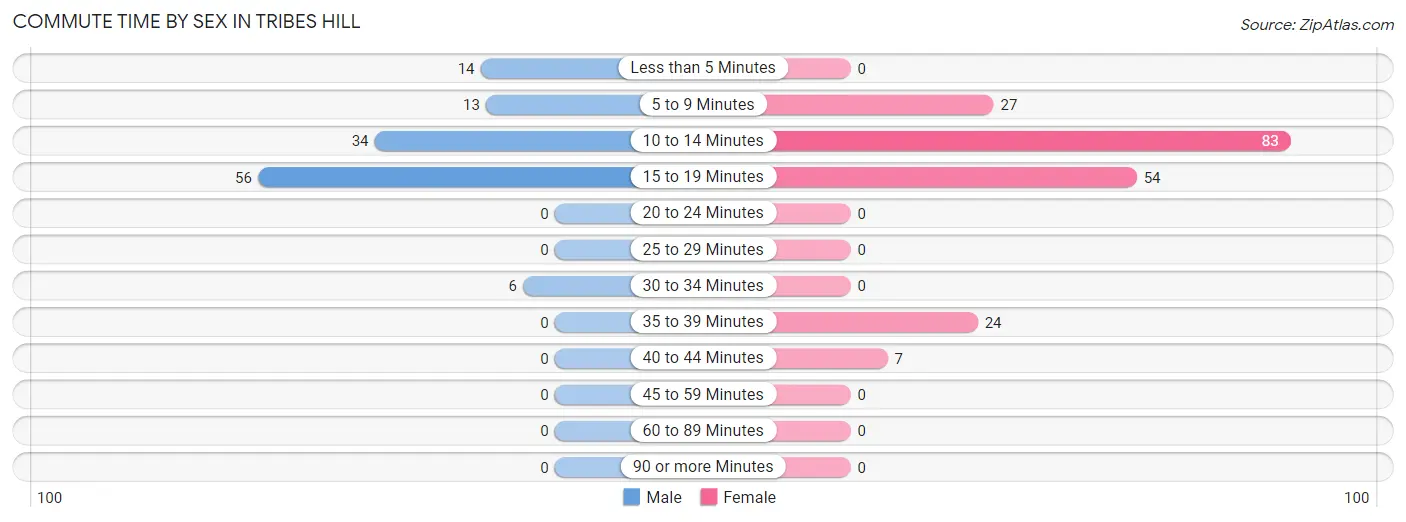
| Commute Time | Male | Female |
| Less than 5 Minutes | 14 (11.4%) | 0 (0.0%) |
| 5 to 9 Minutes | 13 (10.6%) | 27 (13.9%) |
| 10 to 14 Minutes | 34 (27.6%) | 83 (42.6%) |
| 15 to 19 Minutes | 56 (45.5%) | 54 (27.7%) |
| 20 to 24 Minutes | 0 (0.0%) | 0 (0.0%) |
| 25 to 29 Minutes | 0 (0.0%) | 0 (0.0%) |
| 30 to 34 Minutes | 6 (4.9%) | 0 (0.0%) |
| 35 to 39 Minutes | 0 (0.0%) | 24 (12.3%) |
| 40 to 44 Minutes | 0 (0.0%) | 7 (3.6%) |
| 45 to 59 Minutes | 0 (0.0%) | 0 (0.0%) |
| 60 to 89 Minutes | 0 (0.0%) | 0 (0.0%) |
| 90 or more Minutes | 0 (0.0%) | 0 (0.0%) |
Time of Departure to Work by Sex in Tribes Hill
The most frequent times of departure to work in Tribes Hill are 12:00 PM to 3:59 PM (56, 45.5%) for males and 7:30 AM to 7:59 AM (63, 32.3%) for females.
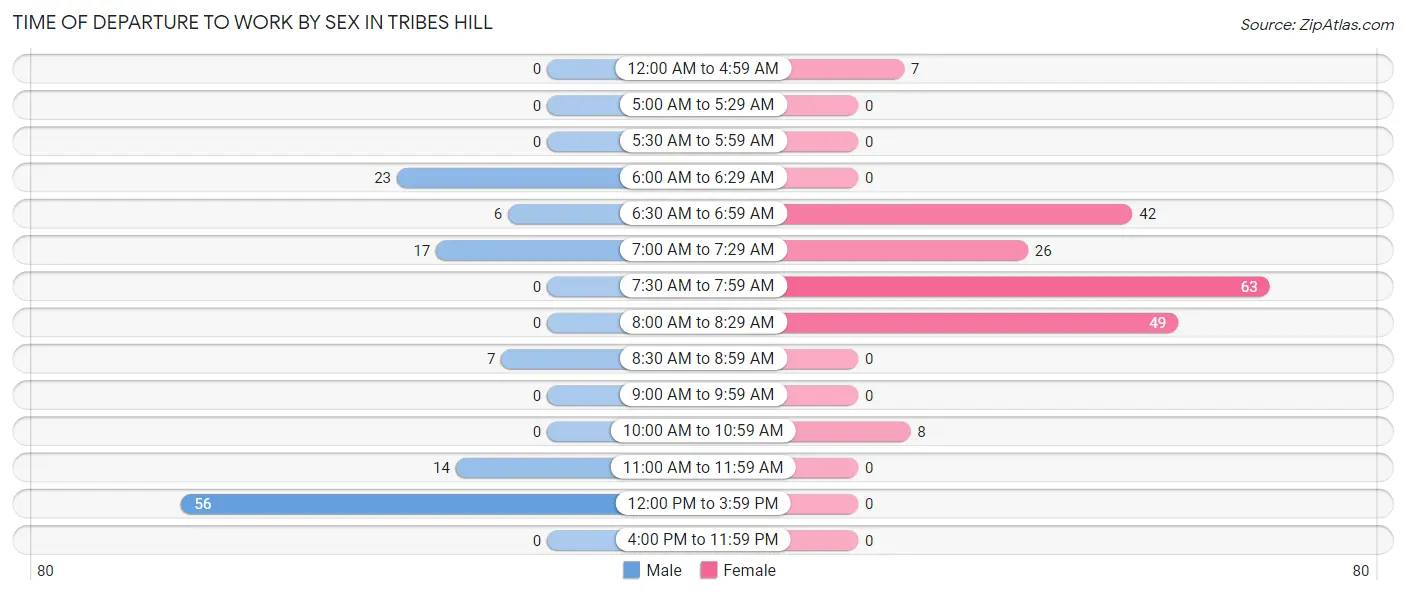
| Time of Departure | Male | Female |
| 12:00 AM to 4:59 AM | 0 (0.0%) | 7 (3.6%) |
| 5:00 AM to 5:29 AM | 0 (0.0%) | 0 (0.0%) |
| 5:30 AM to 5:59 AM | 0 (0.0%) | 0 (0.0%) |
| 6:00 AM to 6:29 AM | 23 (18.7%) | 0 (0.0%) |
| 6:30 AM to 6:59 AM | 6 (4.9%) | 42 (21.5%) |
| 7:00 AM to 7:29 AM | 17 (13.8%) | 26 (13.3%) |
| 7:30 AM to 7:59 AM | 0 (0.0%) | 63 (32.3%) |
| 8:00 AM to 8:29 AM | 0 (0.0%) | 49 (25.1%) |
| 8:30 AM to 8:59 AM | 7 (5.7%) | 0 (0.0%) |
| 9:00 AM to 9:59 AM | 0 (0.0%) | 0 (0.0%) |
| 10:00 AM to 10:59 AM | 0 (0.0%) | 8 (4.1%) |
| 11:00 AM to 11:59 AM | 14 (11.4%) | 0 (0.0%) |
| 12:00 PM to 3:59 PM | 56 (45.5%) | 0 (0.0%) |
| 4:00 PM to 11:59 PM | 0 (0.0%) | 0 (0.0%) |
| Total | 123 (100.0%) | 195 (100.0%) |
Housing Occupancy in Tribes Hill
Occupancy by Ownership in Tribes Hill
Of the total 263 dwellings in Tribes Hill, owner-occupied units account for 204 (77.6%), while renter-occupied units make up 59 (22.4%).
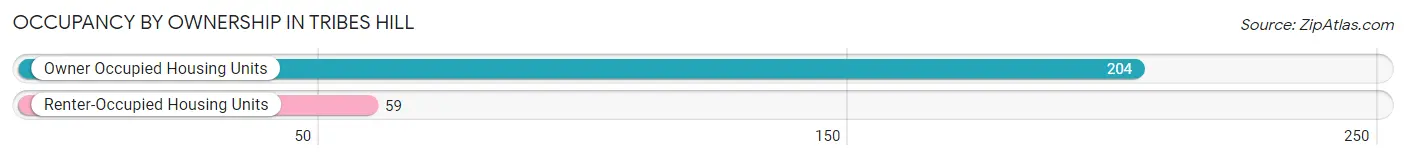
| Occupancy | # Housing Units | % Housing Units |
| Owner Occupied Housing Units | 204 | 77.6% |
| Renter-Occupied Housing Units | 59 | 22.4% |
| Total Occupied Housing Units | 263 | 100.0% |
Occupancy by Household Size in Tribes Hill
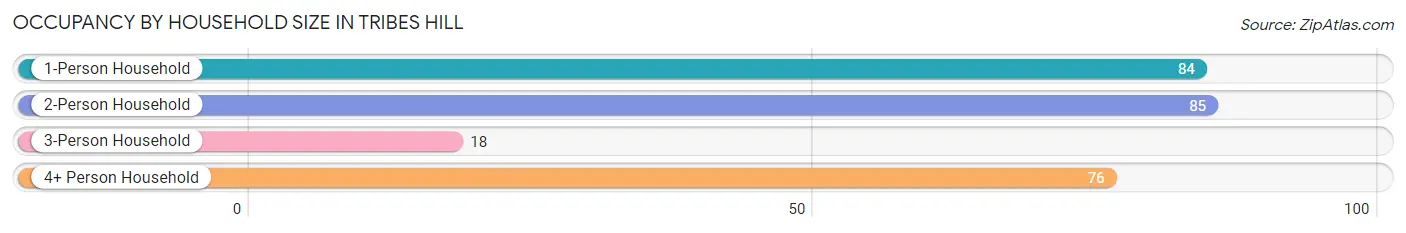
| Household Size | # Housing Units | % Housing Units |
| 1-Person Household | 84 | 31.9% |
| 2-Person Household | 85 | 32.3% |
| 3-Person Household | 18 | 6.8% |
| 4+ Person Household | 76 | 28.9% |
| Total Housing Units | 263 | 100.0% |
Occupancy by Ownership by Household Size in Tribes Hill
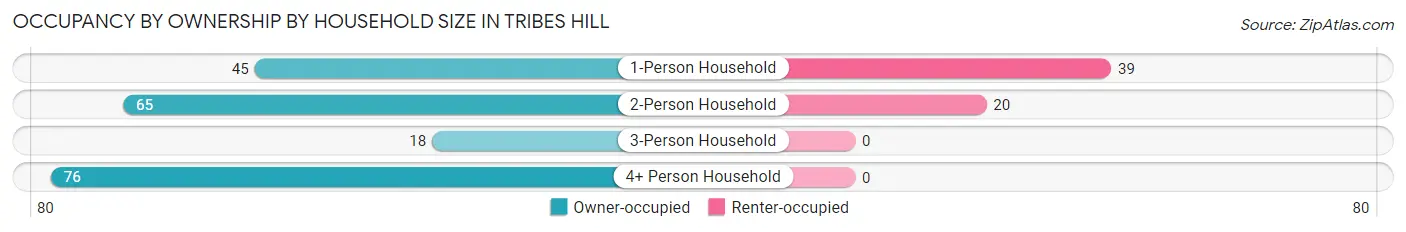
| Household Size | Owner-occupied | Renter-occupied |
| 1-Person Household | 45 (53.6%) | 39 (46.4%) |
| 2-Person Household | 65 (76.5%) | 20 (23.5%) |
| 3-Person Household | 18 (100.0%) | 0 (0.0%) |
| 4+ Person Household | 76 (100.0%) | 0 (0.0%) |
| Total Housing Units | 204 (77.6%) | 59 (22.4%) |
Occupancy by Educational Attainment in Tribes Hill
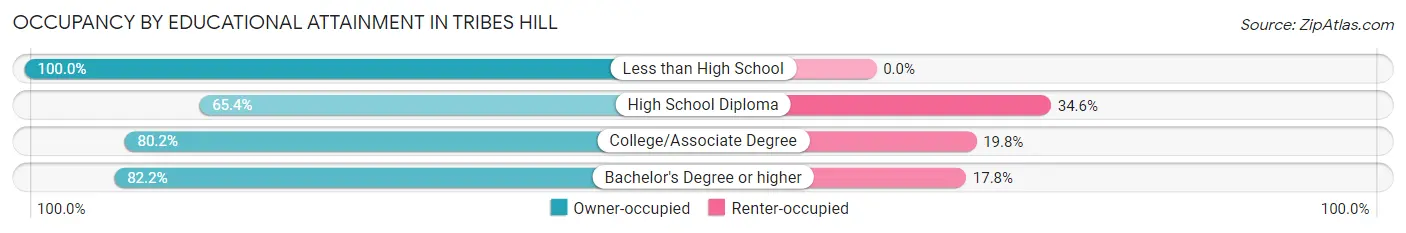
| Household Size | Owner-occupied | Renter-occupied |
| Less than High School | 19 (100.0%) | 0 (0.0%) |
| High School Diploma | 51 (65.4%) | 27 (34.6%) |
| College/Associate Degree | 97 (80.2%) | 24 (19.8%) |
| Bachelor's Degree or higher | 37 (82.2%) | 8 (17.8%) |
Occupancy by Age of Householder in Tribes Hill
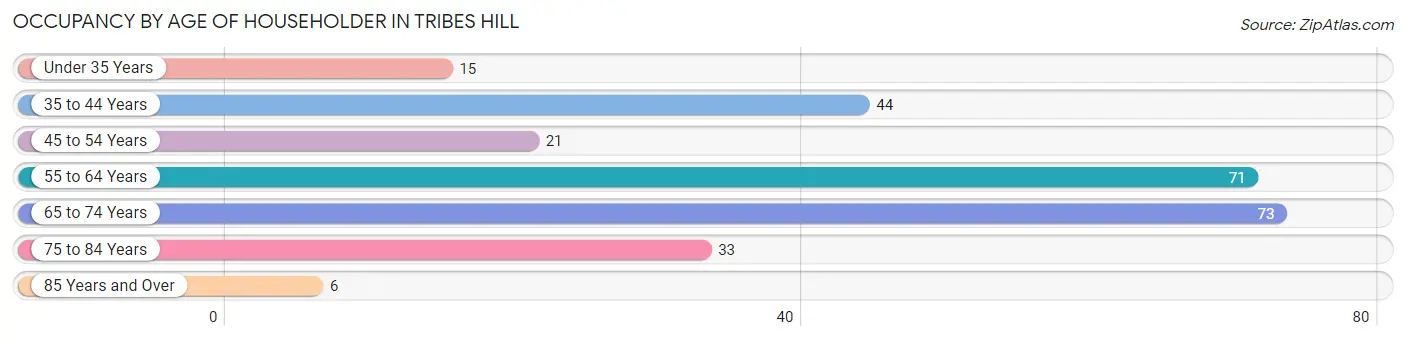
| Age Bracket | # Households | % Households |
| Under 35 Years | 15 | 5.7% |
| 35 to 44 Years | 44 | 16.7% |
| 45 to 54 Years | 21 | 8.0% |
| 55 to 64 Years | 71 | 27.0% |
| 65 to 74 Years | 73 | 27.8% |
| 75 to 84 Years | 33 | 12.6% |
| 85 Years and Over | 6 | 2.3% |
| Total | 263 | 100.0% |
Housing Finances in Tribes Hill
Median Income by Occupancy in Tribes Hill
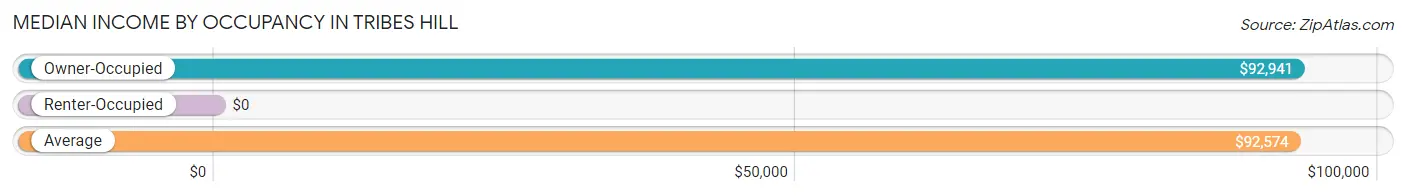
| Occupancy Type | # Households | Median Income |
| Owner-Occupied | 204 (77.6%) | $92,941 |
| Renter-Occupied | 59 (22.4%) | $0 |
| Average | 263 (100.0%) | $92,574 |
Occupancy by Householder Income Bracket in Tribes Hill
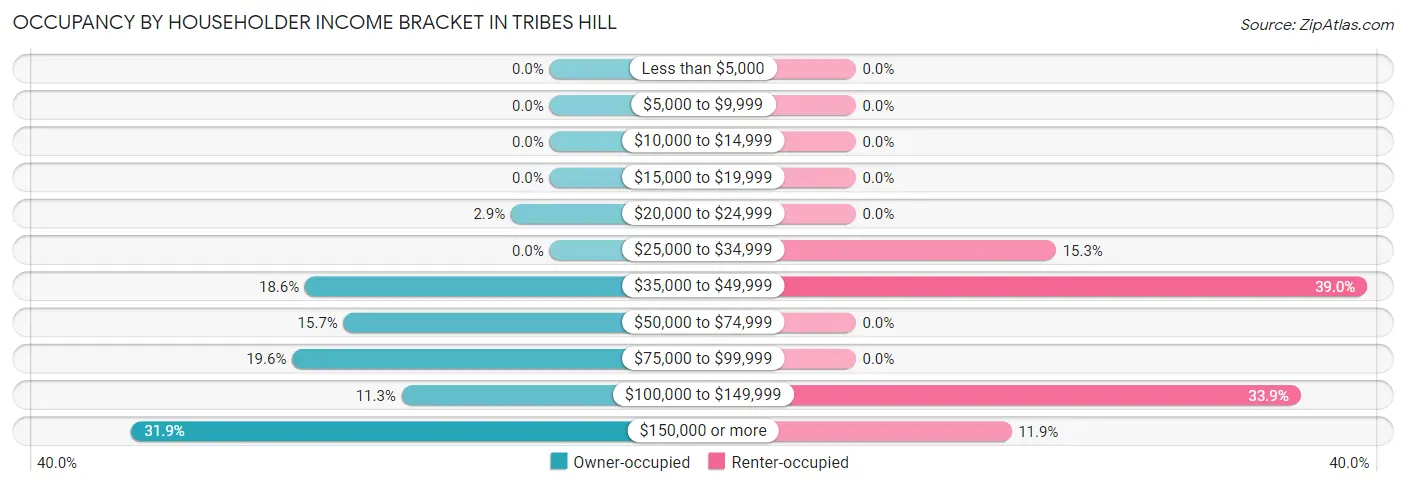
| Income Bracket | Owner-occupied | Renter-occupied |
| Less than $5,000 | 0 (0.0%) | 0 (0.0%) |
| $5,000 to $9,999 | 0 (0.0%) | 0 (0.0%) |
| $10,000 to $14,999 | 0 (0.0%) | 0 (0.0%) |
| $15,000 to $19,999 | 0 (0.0%) | 0 (0.0%) |
| $20,000 to $24,999 | 6 (2.9%) | 0 (0.0%) |
| $25,000 to $34,999 | 0 (0.0%) | 9 (15.2%) |
| $35,000 to $49,999 | 38 (18.6%) | 23 (39.0%) |
| $50,000 to $74,999 | 32 (15.7%) | 0 (0.0%) |
| $75,000 to $99,999 | 40 (19.6%) | 0 (0.0%) |
| $100,000 to $149,999 | 23 (11.3%) | 20 (33.9%) |
| $150,000 or more | 65 (31.9%) | 7 (11.9%) |
| Total | 204 (100.0%) | 59 (100.0%) |
Monthly Housing Cost Tiers in Tribes Hill
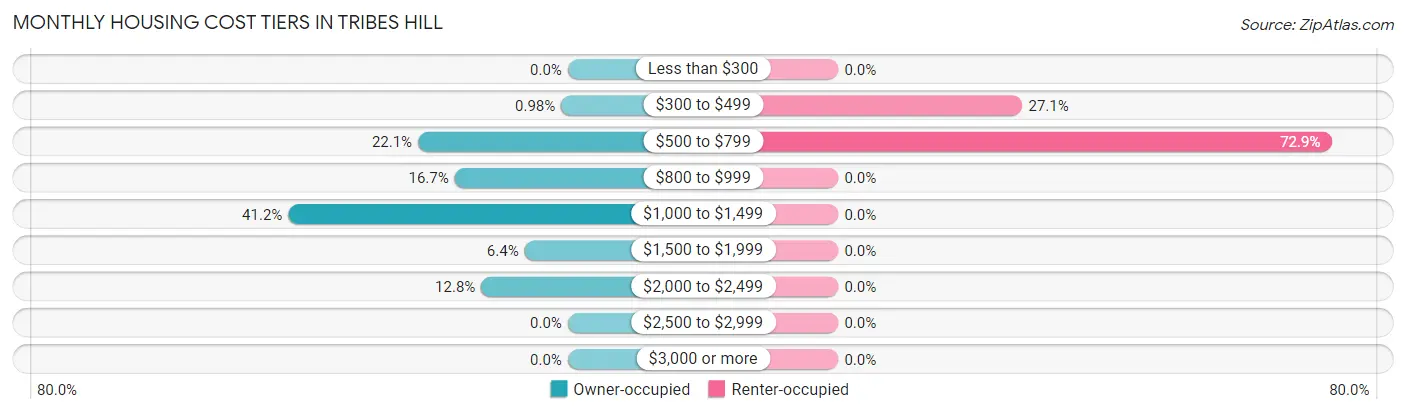
| Monthly Cost | Owner-occupied | Renter-occupied |
| Less than $300 | 0 (0.0%) | 0 (0.0%) |
| $300 to $499 | 2 (1.0%) | 16 (27.1%) |
| $500 to $799 | 45 (22.1%) | 43 (72.9%) |
| $800 to $999 | 34 (16.7%) | 0 (0.0%) |
| $1,000 to $1,499 | 84 (41.2%) | 0 (0.0%) |
| $1,500 to $1,999 | 13 (6.4%) | 0 (0.0%) |
| $2,000 to $2,499 | 26 (12.8%) | 0 (0.0%) |
| $2,500 to $2,999 | 0 (0.0%) | 0 (0.0%) |
| $3,000 or more | 0 (0.0%) | 0 (0.0%) |
| Total | 204 (100.0%) | 59 (100.0%) |
Physical Housing Characteristics in Tribes Hill
Housing Structures in Tribes Hill
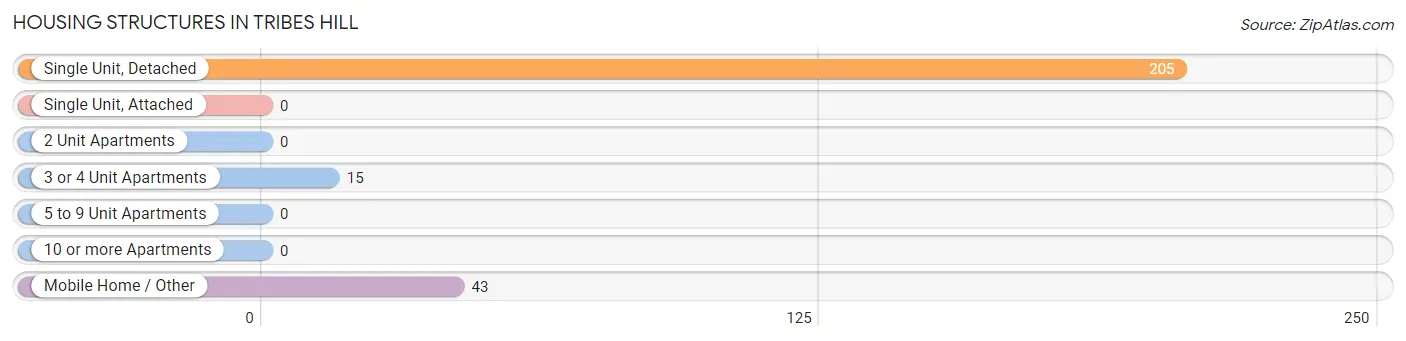
| Structure Type | # Housing Units | % Housing Units |
| Single Unit, Detached | 205 | 77.9% |
| Single Unit, Attached | 0 | 0.0% |
| 2 Unit Apartments | 0 | 0.0% |
| 3 or 4 Unit Apartments | 15 | 5.7% |
| 5 to 9 Unit Apartments | 0 | 0.0% |
| 10 or more Apartments | 0 | 0.0% |
| Mobile Home / Other | 43 | 16.4% |
| Total | 263 | 100.0% |
Housing Structures by Occupancy in Tribes Hill
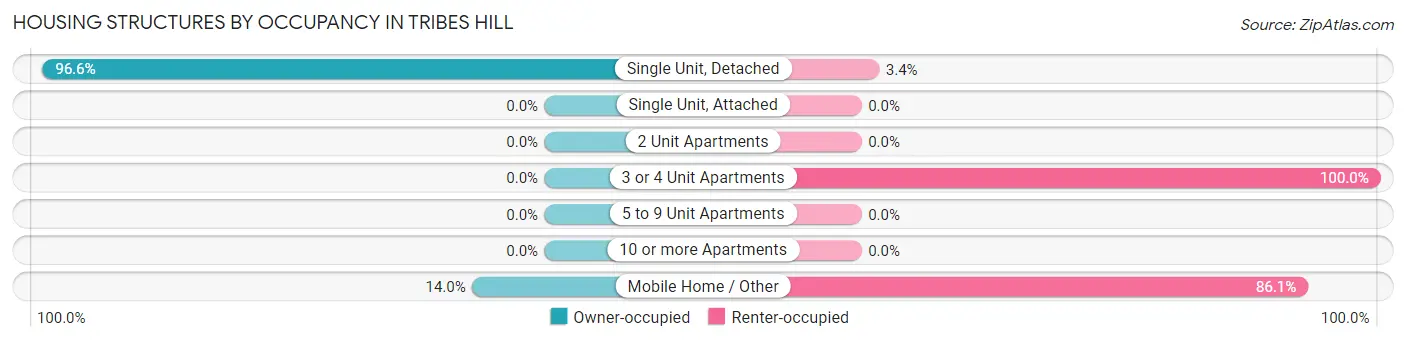
| Structure Type | Owner-occupied | Renter-occupied |
| Single Unit, Detached | 198 (96.6%) | 7 (3.4%) |
| Single Unit, Attached | 0 (0.0%) | 0 (0.0%) |
| 2 Unit Apartments | 0 (0.0%) | 0 (0.0%) |
| 3 or 4 Unit Apartments | 0 (0.0%) | 15 (100.0%) |
| 5 to 9 Unit Apartments | 0 (0.0%) | 0 (0.0%) |
| 10 or more Apartments | 0 (0.0%) | 0 (0.0%) |
| Mobile Home / Other | 6 (14.0%) | 37 (86.1%) |
| Total | 204 (77.6%) | 59 (22.4%) |
Housing Structures by Number of Rooms in Tribes Hill
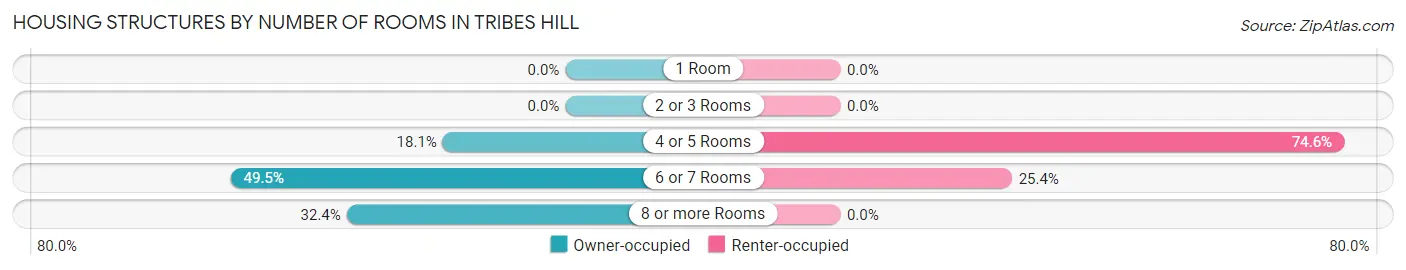
| Number of Rooms | Owner-occupied | Renter-occupied |
| 1 Room | 0 (0.0%) | 0 (0.0%) |
| 2 or 3 Rooms | 0 (0.0%) | 0 (0.0%) |
| 4 or 5 Rooms | 37 (18.1%) | 44 (74.6%) |
| 6 or 7 Rooms | 101 (49.5%) | 15 (25.4%) |
| 8 or more Rooms | 66 (32.4%) | 0 (0.0%) |
| Total | 204 (100.0%) | 59 (100.0%) |
Housing Structure by Heating Type in Tribes Hill
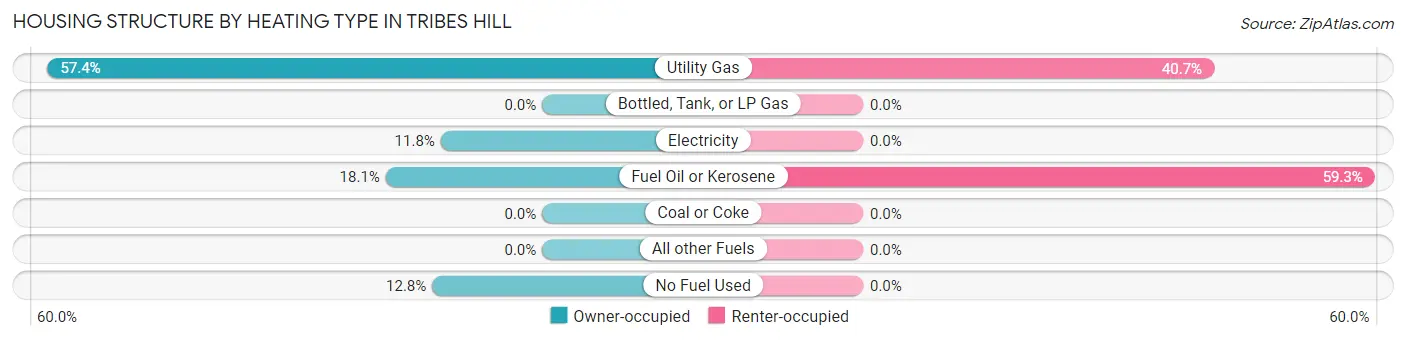
| Heating Type | Owner-occupied | Renter-occupied |
| Utility Gas | 117 (57.4%) | 24 (40.7%) |
| Bottled, Tank, or LP Gas | 0 (0.0%) | 0 (0.0%) |
| Electricity | 24 (11.8%) | 0 (0.0%) |
| Fuel Oil or Kerosene | 37 (18.1%) | 35 (59.3%) |
| Coal or Coke | 0 (0.0%) | 0 (0.0%) |
| All other Fuels | 0 (0.0%) | 0 (0.0%) |
| No Fuel Used | 26 (12.8%) | 0 (0.0%) |
| Total | 204 (100.0%) | 59 (100.0%) |
Household Vehicle Usage in Tribes Hill
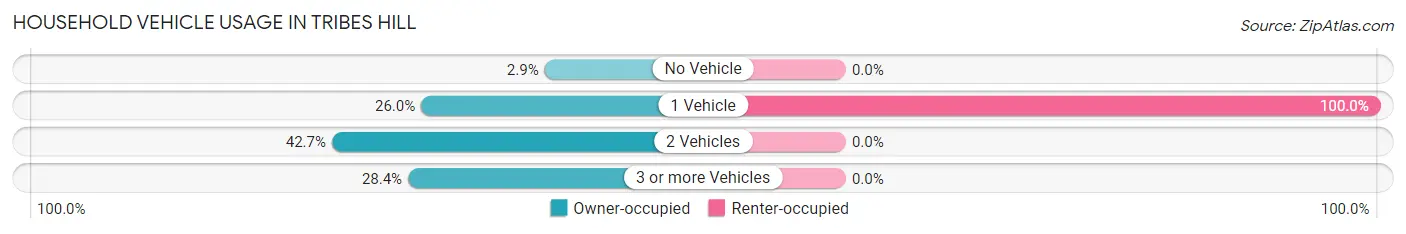
| Vehicles per Household | Owner-occupied | Renter-occupied |
| No Vehicle | 6 (2.9%) | 0 (0.0%) |
| 1 Vehicle | 53 (26.0%) | 59 (100.0%) |
| 2 Vehicles | 87 (42.6%) | 0 (0.0%) |
| 3 or more Vehicles | 58 (28.4%) | 0 (0.0%) |
| Total | 204 (100.0%) | 59 (100.0%) |
Real Estate & Mortgages in Tribes Hill
Real Estate and Mortgage Overview in Tribes Hill
| Characteristic | Without Mortgage | With Mortgage |
| Housing Units | 54 | 150 |
| Median Property Value | $177,600 | $140,900 |
| Median Household Income | $52,500 | $62 |
| Monthly Housing Costs | $596 | $0 |
| Real Estate Taxes | - | - |
Property Value by Mortgage Status in Tribes Hill
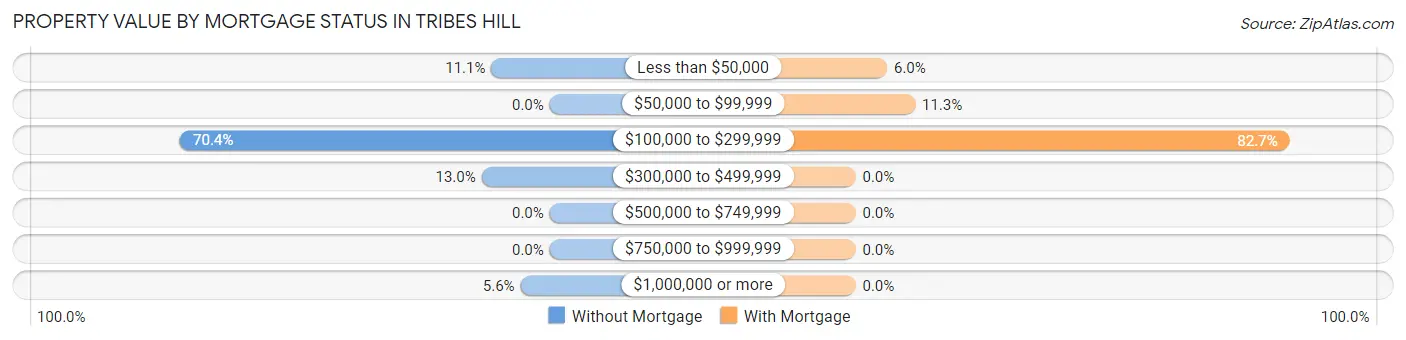
| Property Value | Without Mortgage | With Mortgage |
| Less than $50,000 | 6 (11.1%) | 9 (6.0%) |
| $50,000 to $99,999 | 0 (0.0%) | 17 (11.3%) |
| $100,000 to $299,999 | 38 (70.4%) | 124 (82.7%) |
| $300,000 to $499,999 | 7 (13.0%) | 0 (0.0%) |
| $500,000 to $749,999 | 0 (0.0%) | 0 (0.0%) |
| $750,000 to $999,999 | 0 (0.0%) | 0 (0.0%) |
| $1,000,000 or more | 3 (5.6%) | 0 (0.0%) |
| Total | 54 (100.0%) | 150 (100.0%) |
Household Income by Mortgage Status in Tribes Hill
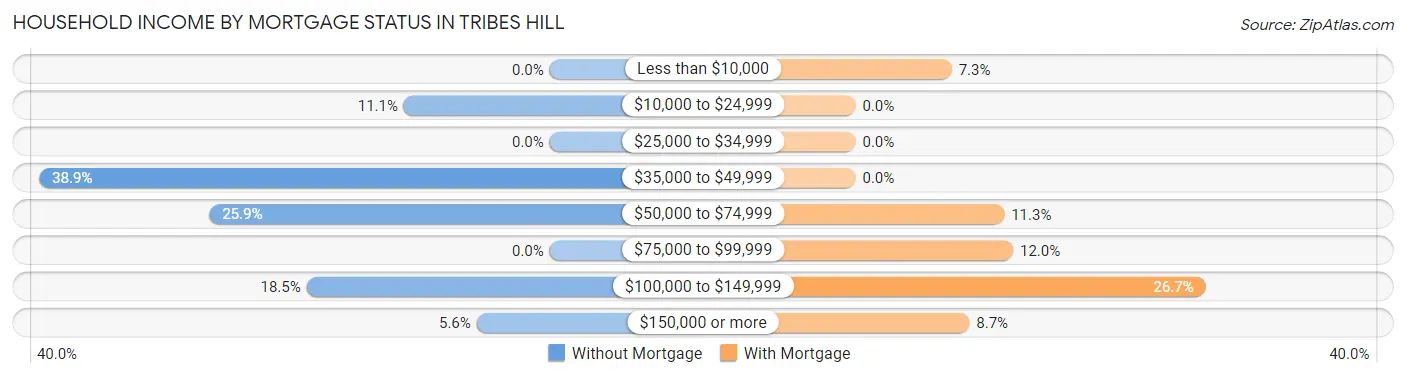
| Household Income | Without Mortgage | With Mortgage |
| Less than $10,000 | 0 (0.0%) | 11 (7.3%) |
| $10,000 to $24,999 | 6 (11.1%) | 0 (0.0%) |
| $25,000 to $34,999 | 0 (0.0%) | 0 (0.0%) |
| $35,000 to $49,999 | 21 (38.9%) | 0 (0.0%) |
| $50,000 to $74,999 | 14 (25.9%) | 17 (11.3%) |
| $75,000 to $99,999 | 0 (0.0%) | 18 (12.0%) |
| $100,000 to $149,999 | 10 (18.5%) | 40 (26.7%) |
| $150,000 or more | 3 (5.6%) | 13 (8.7%) |
| Total | 54 (100.0%) | 150 (100.0%) |
Property Value to Household Income Ratio in Tribes Hill
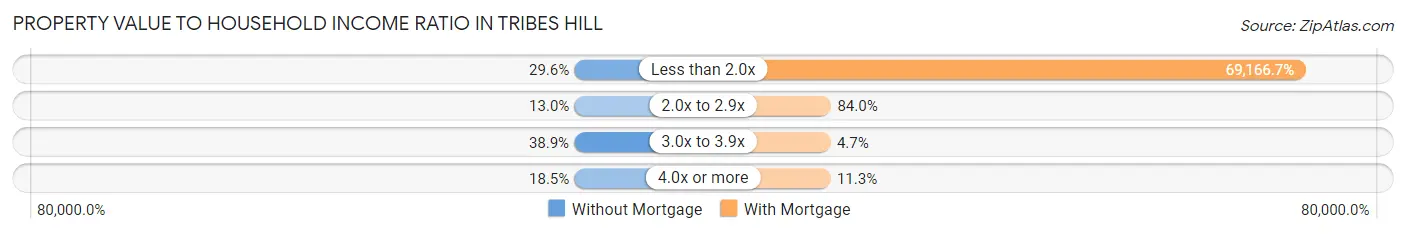
| Value-to-Income Ratio | Without Mortgage | With Mortgage |
| Less than 2.0x | 16 (29.6%) | 103,750 (69,166.7%) |
| 2.0x to 2.9x | 7 (13.0%) | 126 (84.0%) |
| 3.0x to 3.9x | 21 (38.9%) | 7 (4.7%) |
| 4.0x or more | 10 (18.5%) | 17 (11.3%) |
| Total | 54 (100.0%) | 150 (100.0%) |
Real Estate Taxes by Mortgage Status in Tribes Hill
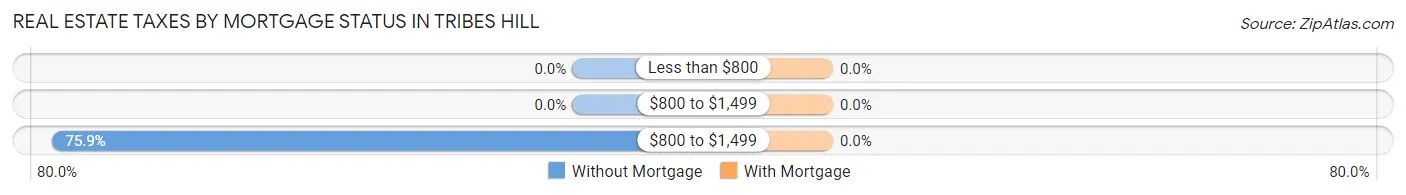
| Property Taxes | Without Mortgage | With Mortgage |
| Less than $800 | 0 (0.0%) | 0 (0.0%) |
| $800 to $1,499 | 0 (0.0%) | 0 (0.0%) |
| $800 to $1,499 | 41 (75.9%) | 0 (0.0%) |
| Total | 54 (100.0%) | 150 (100.0%) |
Health & Disability in Tribes Hill
Health Insurance Coverage by Age in Tribes Hill
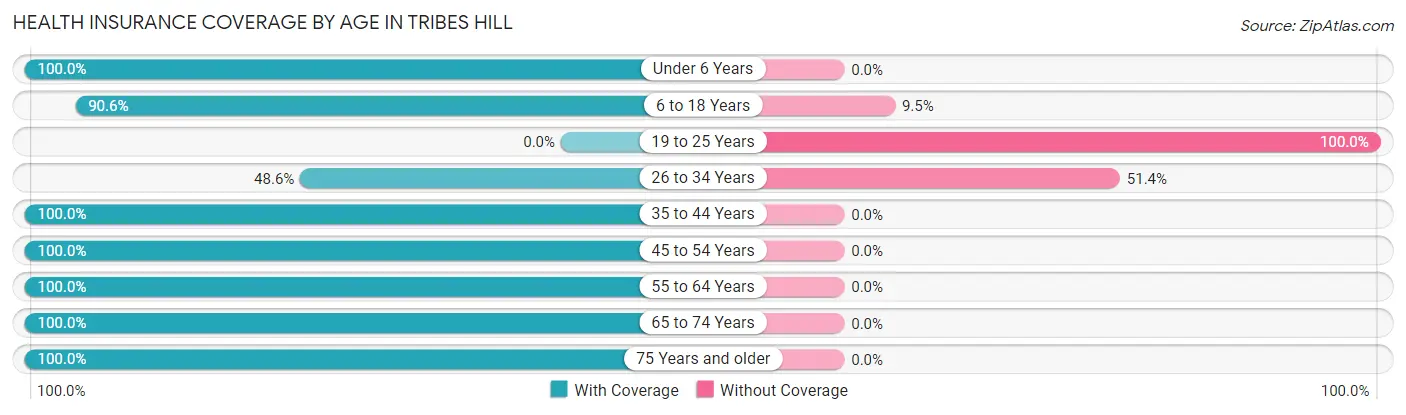
| Age Bracket | With Coverage | Without Coverage |
| Under 6 Years | 43 (100.0%) | 0 (0.0%) |
| 6 to 18 Years | 182 (90.5%) | 19 (9.5%) |
| 19 to 25 Years | 0 (0.0%) | 40 (100.0%) |
| 26 to 34 Years | 35 (48.6%) | 37 (51.4%) |
| 35 to 44 Years | 44 (100.0%) | 0 (0.0%) |
| 45 to 54 Years | 82 (100.0%) | 0 (0.0%) |
| 55 to 64 Years | 124 (100.0%) | 0 (0.0%) |
| 65 to 74 Years | 135 (100.0%) | 0 (0.0%) |
| 75 Years and older | 97 (100.0%) | 0 (0.0%) |
| Total | 742 (88.5%) | 96 (11.5%) |
Health Insurance Coverage by Citizenship Status in Tribes Hill

| Citizenship Status | With Coverage | Without Coverage |
| Native Born | 43 (100.0%) | 0 (0.0%) |
| Foreign Born, Citizen | 182 (90.5%) | 19 (9.5%) |
| Foreign Born, not a Citizen | 0 (0.0%) | 40 (100.0%) |
Health Insurance Coverage by Household Income in Tribes Hill
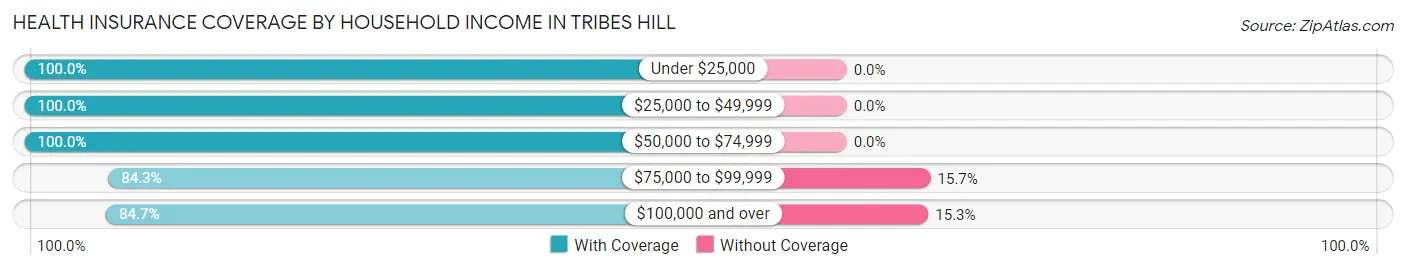
| Household Income | With Coverage | Without Coverage |
| Under $25,000 | 6 (100.0%) | 0 (0.0%) |
| $25,000 to $49,999 | 156 (100.0%) | 0 (0.0%) |
| $50,000 to $74,999 | 51 (100.0%) | 0 (0.0%) |
| $75,000 to $99,999 | 102 (84.3%) | 19 (15.7%) |
| $100,000 and over | 427 (84.7%) | 77 (15.3%) |
Public vs Private Health Insurance Coverage by Age in Tribes Hill
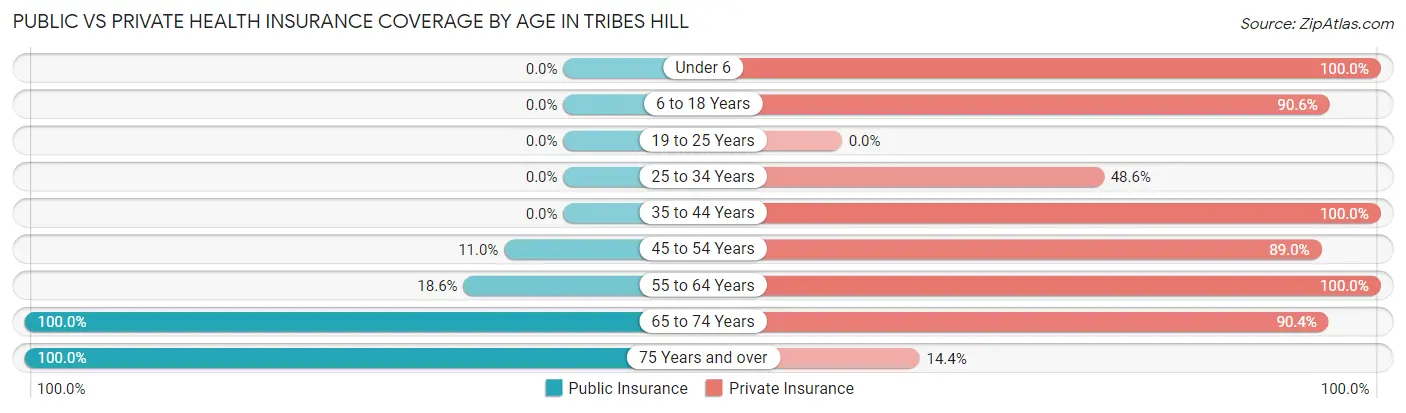
| Age Bracket | Public Insurance | Private Insurance |
| Under 6 | 0 (0.0%) | 43 (100.0%) |
| 6 to 18 Years | 0 (0.0%) | 182 (90.5%) |
| 19 to 25 Years | 0 (0.0%) | 0 (0.0%) |
| 25 to 34 Years | 0 (0.0%) | 35 (48.6%) |
| 35 to 44 Years | 0 (0.0%) | 44 (100.0%) |
| 45 to 54 Years | 9 (11.0%) | 73 (89.0%) |
| 55 to 64 Years | 23 (18.5%) | 124 (100.0%) |
| 65 to 74 Years | 135 (100.0%) | 122 (90.4%) |
| 75 Years and over | 97 (100.0%) | 14 (14.4%) |
| Total | 264 (31.5%) | 637 (76.0%) |
Disability Status by Sex by Age in Tribes Hill
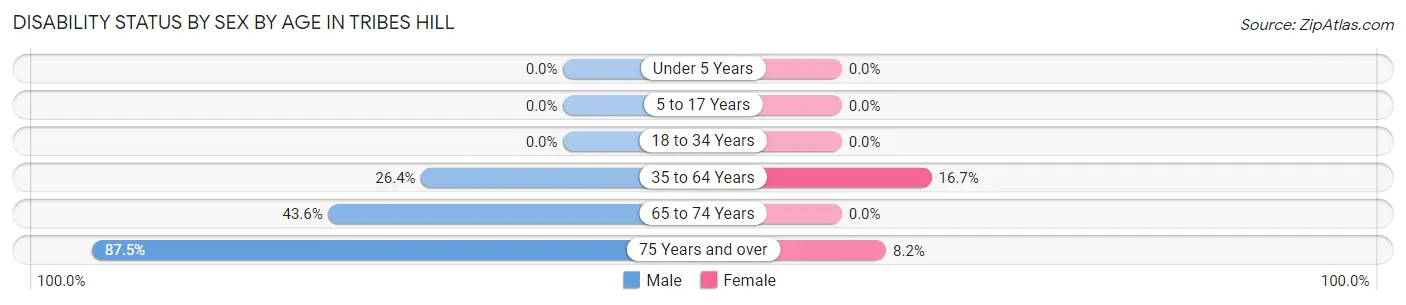
| Age Bracket | Male | Female |
| Under 5 Years | 0 (0.0%) | 0 (0.0%) |
| 5 to 17 Years | 0 (0.0%) | 0 (0.0%) |
| 18 to 34 Years | 0 (0.0%) | 0 (0.0%) |
| 35 to 64 Years | 39 (26.4%) | 17 (16.7%) |
| 65 to 74 Years | 17 (43.6%) | 0 (0.0%) |
| 75 Years and over | 21 (87.5%) | 6 (8.2%) |
Disability Class by Sex by Age in Tribes Hill
Disability Class: Hearing Difficulty
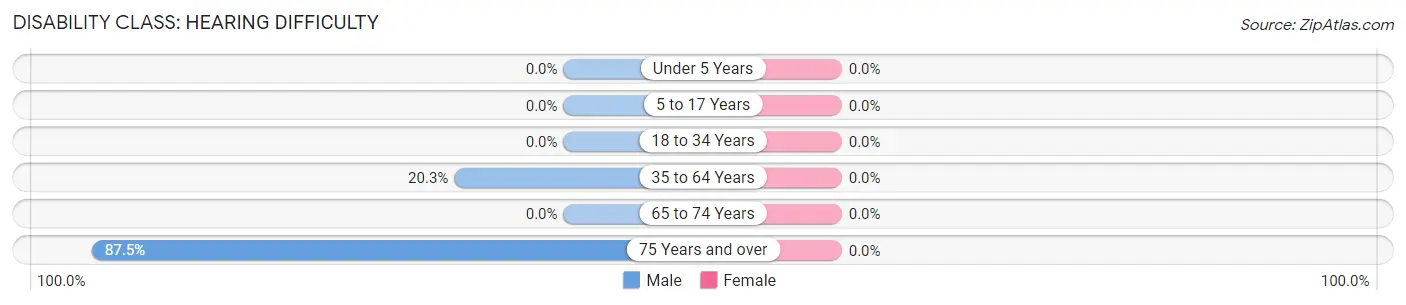
| Age Bracket | Male | Female |
| Under 5 Years | 0 (0.0%) | 0 (0.0%) |
| 5 to 17 Years | 0 (0.0%) | 0 (0.0%) |
| 18 to 34 Years | 0 (0.0%) | 0 (0.0%) |
| 35 to 64 Years | 30 (20.3%) | 0 (0.0%) |
| 65 to 74 Years | 0 (0.0%) | 0 (0.0%) |
| 75 Years and over | 21 (87.5%) | 0 (0.0%) |
Disability Class: Vision Difficulty
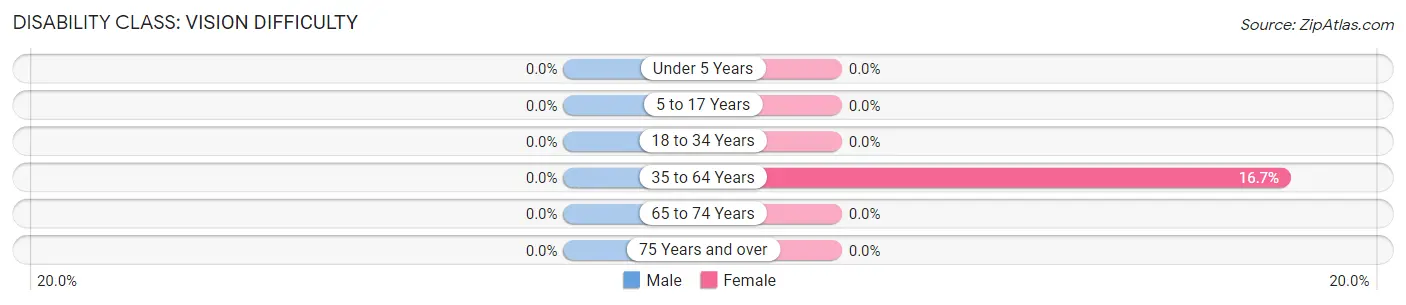
| Age Bracket | Male | Female |
| Under 5 Years | 0 (0.0%) | 0 (0.0%) |
| 5 to 17 Years | 0 (0.0%) | 0 (0.0%) |
| 18 to 34 Years | 0 (0.0%) | 0 (0.0%) |
| 35 to 64 Years | 0 (0.0%) | 17 (16.7%) |
| 65 to 74 Years | 0 (0.0%) | 0 (0.0%) |
| 75 Years and over | 0 (0.0%) | 0 (0.0%) |
Disability Class: Cognitive Difficulty
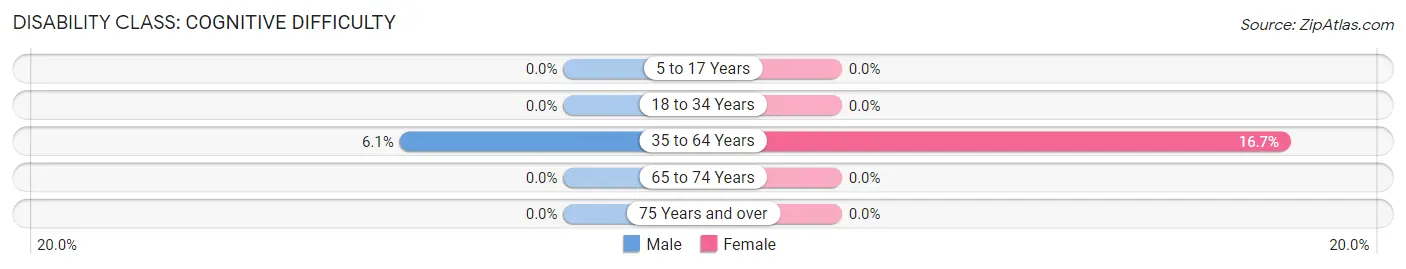
| Age Bracket | Male | Female |
| 5 to 17 Years | 0 (0.0%) | 0 (0.0%) |
| 18 to 34 Years | 0 (0.0%) | 0 (0.0%) |
| 35 to 64 Years | 9 (6.1%) | 17 (16.7%) |
| 65 to 74 Years | 0 (0.0%) | 0 (0.0%) |
| 75 Years and over | 0 (0.0%) | 0 (0.0%) |
Disability Class: Ambulatory Difficulty
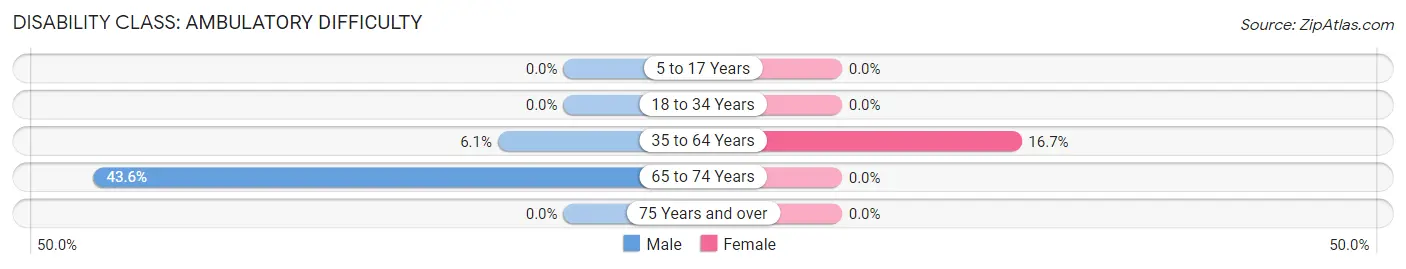
| Age Bracket | Male | Female |
| 5 to 17 Years | 0 (0.0%) | 0 (0.0%) |
| 18 to 34 Years | 0 (0.0%) | 0 (0.0%) |
| 35 to 64 Years | 9 (6.1%) | 17 (16.7%) |
| 65 to 74 Years | 17 (43.6%) | 0 (0.0%) |
| 75 Years and over | 0 (0.0%) | 0 (0.0%) |
Disability Class: Self-Care Difficulty
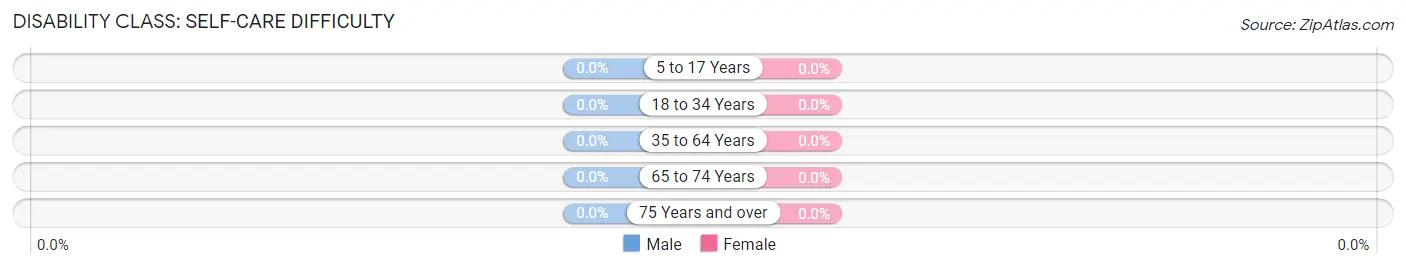
| Age Bracket | Male | Female |
| 5 to 17 Years | 0 (0.0%) | 0 (0.0%) |
| 18 to 34 Years | 0 (0.0%) | 0 (0.0%) |
| 35 to 64 Years | 0 (0.0%) | 0 (0.0%) |
| 65 to 74 Years | 0 (0.0%) | 0 (0.0%) |
| 75 Years and over | 0 (0.0%) | 0 (0.0%) |
Technology Access in Tribes Hill
Computing Device Access in Tribes Hill
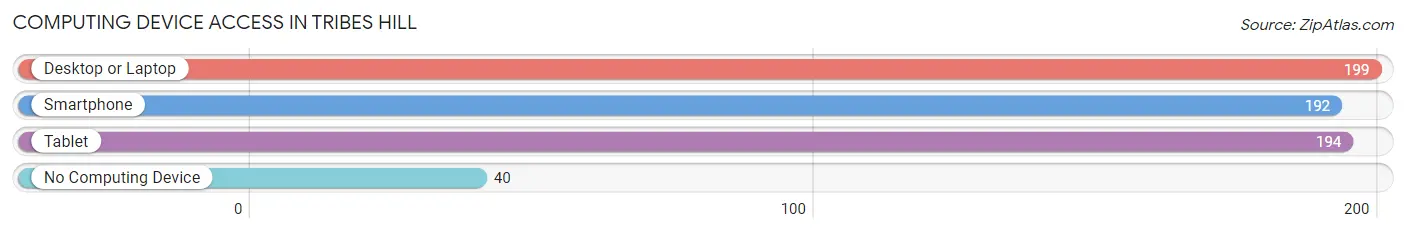
| Device Type | # Households | % Households |
| Desktop or Laptop | 199 | 75.7% |
| Smartphone | 192 | 73.0% |
| Tablet | 194 | 73.8% |
| No Computing Device | 40 | 15.2% |
| Total | 263 | 100.0% |
Internet Access in Tribes Hill
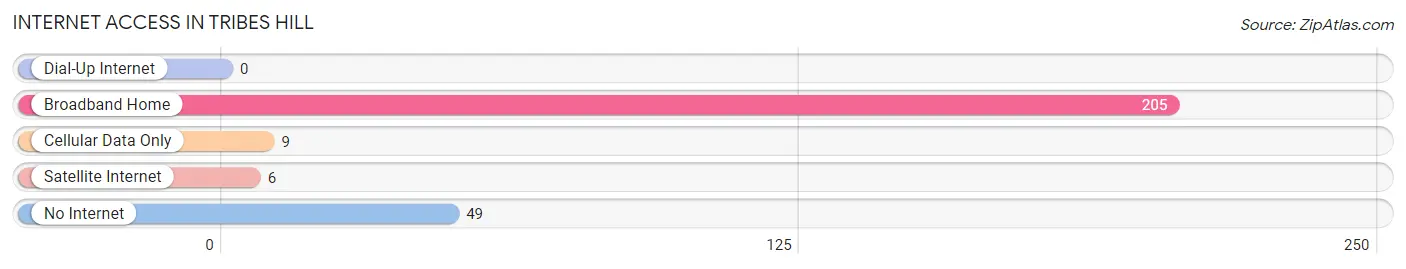
| Internet Type | # Households | % Households |
| Dial-Up Internet | 0 | 0.0% |
| Broadband Home | 205 | 77.9% |
| Cellular Data Only | 9 | 3.4% |
| Satellite Internet | 6 | 2.3% |
| No Internet | 49 | 18.6% |
| Total | 263 | 100.0% |
Tribes Hill Summary
Tribes Hill is a hamlet located in the town of Mohawk in Montgomery County, New York. It is situated on the Mohawk River, just north of the city of Amsterdam. The hamlet is home to a population of approximately 1,000 people and is part of the Amsterdam-Gloversville-Johnstown Metropolitan Statistical Area.
Geography
Tribes Hill is located at 42°59'N, 74°37'W (42.983, -74.617). It is situated on the Mohawk River, just north of the city of Amsterdam. The hamlet is located in the town of Mohawk, which is part of Montgomery County. The terrain of the area is mostly flat, with some rolling hills. The climate is humid continental, with cold winters and hot summers.
History
Tribes Hill was first settled in the late 1700s by Dutch settlers. The hamlet was originally known as "Tribe's Hill" and was named after the local Native American tribe, the Mohawk. The hamlet was incorporated in 1848 and was home to a variety of industries, including a grist mill, a saw mill, a tannery, and a distillery.
In the late 1800s, Tribes Hill was a popular destination for tourists, who came to enjoy the scenery and the nearby Mohawk River. The hamlet was also home to a number of summer resorts, which attracted visitors from all over the country.
In the early 1900s, Tribes Hill experienced a period of decline. The grist mill and saw mill closed, and the tannery and distillery moved away. The hamlet was also affected by the Great Depression, which caused many of the businesses to close.
Economy
Tribes Hill is primarily a residential community, with most of the population employed in the service sector. The hamlet is home to a number of small businesses, including a grocery store, a hardware store, and a few restaurants. The hamlet is also home to a number of small manufacturing companies, which produce a variety of products, including furniture, clothing, and electronics.
Demographics
As of the 2010 census, Tribes Hill had a population of 1,000 people. The racial makeup of the hamlet was 97.2% White, 0.7% African American, 0.3% Native American, 0.3% Asian, and 1.5% from other races. The median household income was $45,000, and the median family income was $50,000.
Conclusion
Tribes Hill is a small hamlet located in the town of Mohawk in Montgomery County, New York. It is situated on the Mohawk River, just north of the city of Amsterdam. The hamlet is home to a population of approximately 1,000 people and is part of the Amsterdam-Gloversville-Johnstown Metropolitan Statistical Area. Tribes Hill is primarily a residential community, with most of the population employed in the service sector. The hamlet is home to a number of small businesses, including a grocery store, a hardware store, and a few restaurants. The hamlet is also home to a number of small manufacturing companies, which produce a variety of products, including furniture, clothing, and electronics.
Common Questions
What is Per Capita Income in Tribes Hill?
Per Capita income in Tribes Hill is $33,939.
What is the Median Family Income in Tribes Hill?
Median Family Income in Tribes Hill is $131,250.
What is the Median Household income in Tribes Hill?
Median Household Income in Tribes Hill is $92,574.
What is Income or Wage Gap in Tribes Hill?
Income or Wage Gap in Tribes Hill is 40.4%.
Women in Tribes Hill earn 59.6 cents for every dollar earned by a man.
What is Inequality or Gini Index in Tribes Hill?
Inequality or Gini Index in Tribes Hill is 0.32.
What is the Total Population of Tribes Hill?
Total Population of Tribes Hill is 838.
What is the Total Male Population of Tribes Hill?
Total Male Population of Tribes Hill is 308.
What is the Total Female Population of Tribes Hill?
Total Female Population of Tribes Hill is 530.
What is the Ratio of Males per 100 Females in Tribes Hill?
There are 58.11 Males per 100 Females in Tribes Hill.
What is the Ratio of Females per 100 Males in Tribes Hill?
There are 172.08 Females per 100 Males in Tribes Hill.
What is the Median Population Age in Tribes Hill?
Median Population Age in Tribes Hill is 49.1 Years.
What is the Average Family Size in Tribes Hill
Average Family Size in Tribes Hill is 4.6 People.
What is the Average Household Size in Tribes Hill
Average Household Size in Tribes Hill is 3.2 People.
How Large is the Labor Force in Tribes Hill?
There are 358 People in the Labor Forcein in Tribes Hill.
What is the Percentage of People in the Labor Force in Tribes Hill?
55.9% of People are in the Labor Force in Tribes Hill.