South Huntington, NY Map & Demographics
South Huntington Map
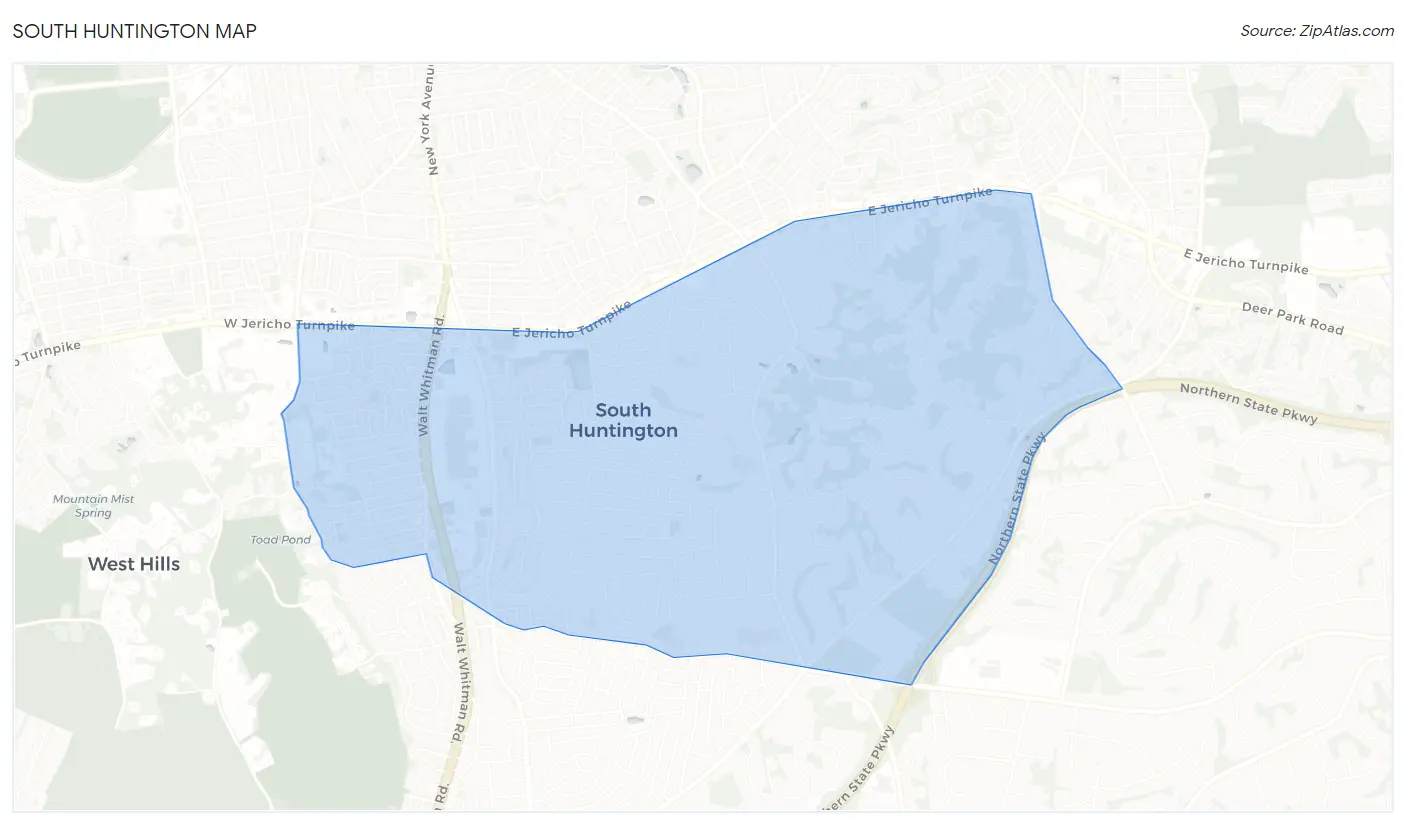
South Huntington Overview
$59,611
PER CAPITA INCOME
$165,588
AVG FAMILY INCOME
$149,615
AVG HOUSEHOLD INCOME
20.7%
WAGE / INCOME GAP [ % ]
79.3¢/ $1
WAGE / INCOME GAP [ $ ]
0.37
INEQUALITY / GINI INDEX
10,307
TOTAL POPULATION
5,162
MALE POPULATION
5,145
FEMALE POPULATION
100.33
MALES / 100 FEMALES
99.67
FEMALES / 100 MALES
42.9
MEDIAN AGE
3.2
AVG FAMILY SIZE
2.9
AVG HOUSEHOLD SIZE
5,984
LABOR FORCE [ PEOPLE ]
71.1%
PERCENT IN LABOR FORCE
7.6%
UNEMPLOYMENT RATE
South Huntington Area Codes
Income in South Huntington
Income Overview in South Huntington
Per Capita Income in South Huntington is $59,611, while median incomes of families and households are $165,588 and $149,615 respectively.
| Characteristic | Number | Measure |
| Per Capita Income | 10,307 | $59,611 |
| Median Family Income | 2,628 | $165,588 |
| Mean Family Income | 2,628 | $183,561 |
| Median Household Income | 3,454 | $149,615 |
| Mean Household Income | 3,454 | $173,487 |
| Income Deficit | 2,628 | $0 |
| Wage / Income Gap (%) | 10,307 | 20.72% |
| Wage / Income Gap ($) | 10,307 | 79.28¢ per $1 |
| Gini / Inequality Index | 10,307 | 0.37 |
Earnings by Sex in South Huntington
Average Earnings in South Huntington are $67,928, $76,985 for men and $61,033 for women, a difference of 20.7%.
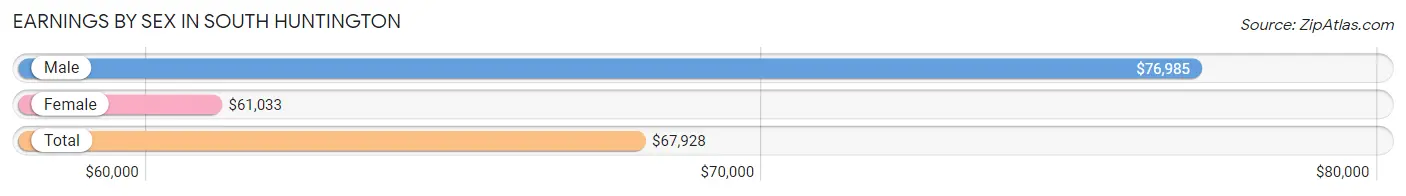
| Sex | Number | Average Earnings |
| Male | 3,346 (54.7%) | $76,985 |
| Female | 2,773 (45.3%) | $61,033 |
| Total | 6,119 (100.0%) | $67,928 |
Earnings by Sex by Income Bracket in South Huntington
The most common earnings brackets in South Huntington are $100,000+ for men (1,234 | 36.9%) and $100,000+ for women (620 | 22.4%).
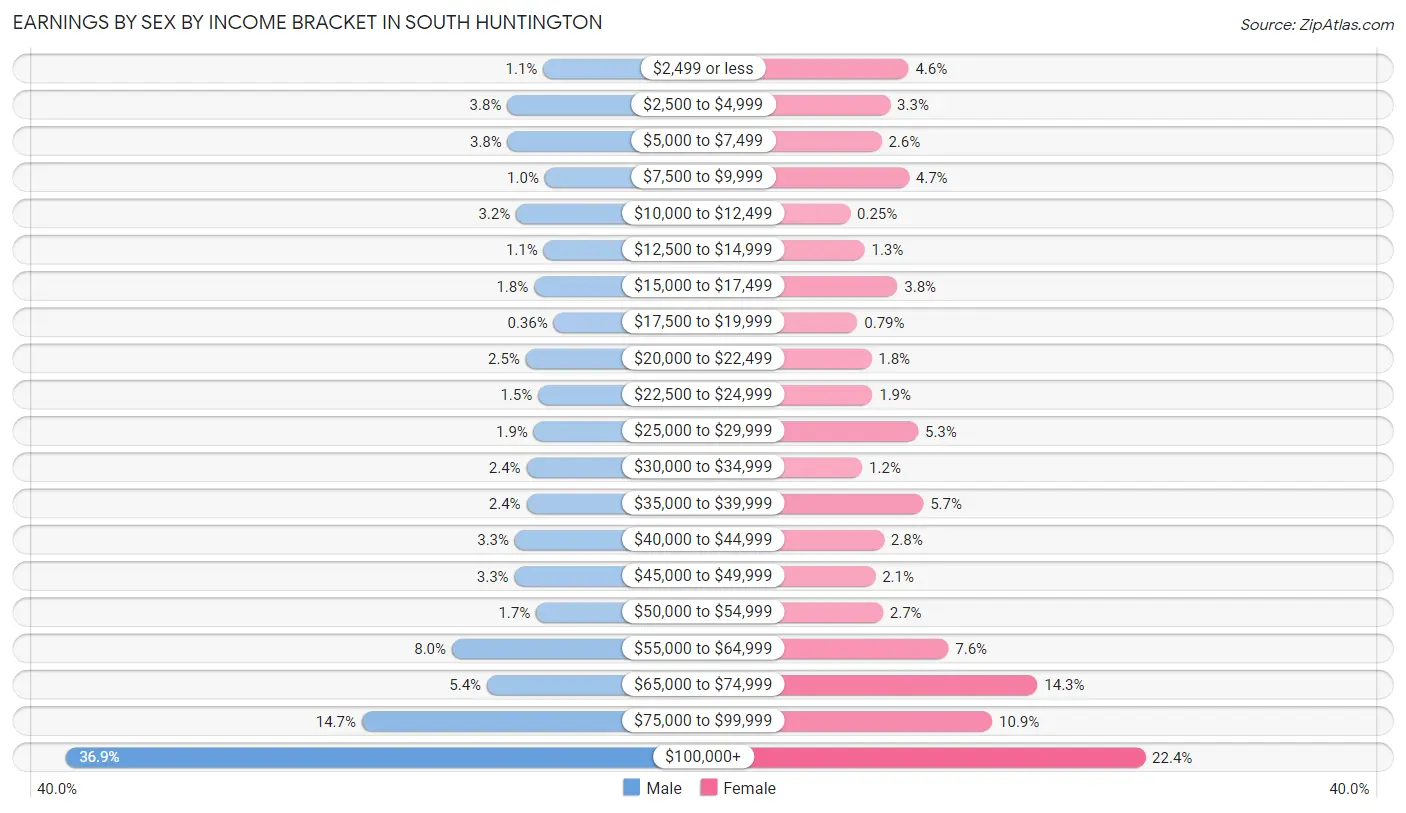
| Income | Male | Female |
| $2,499 or less | 38 (1.1%) | 128 (4.6%) |
| $2,500 to $4,999 | 128 (3.8%) | 90 (3.3%) |
| $5,000 to $7,499 | 127 (3.8%) | 72 (2.6%) |
| $7,500 to $9,999 | 34 (1.0%) | 129 (4.6%) |
| $10,000 to $12,499 | 106 (3.2%) | 7 (0.3%) |
| $12,500 to $14,999 | 37 (1.1%) | 37 (1.3%) |
| $15,000 to $17,499 | 61 (1.8%) | 105 (3.8%) |
| $17,500 to $19,999 | 12 (0.4%) | 22 (0.8%) |
| $20,000 to $22,499 | 82 (2.5%) | 51 (1.8%) |
| $22,500 to $24,999 | 51 (1.5%) | 53 (1.9%) |
| $25,000 to $29,999 | 62 (1.8%) | 148 (5.3%) |
| $30,000 to $34,999 | 80 (2.4%) | 32 (1.1%) |
| $35,000 to $39,999 | 80 (2.4%) | 159 (5.7%) |
| $40,000 to $44,999 | 109 (3.3%) | 77 (2.8%) |
| $45,000 to $49,999 | 110 (3.3%) | 59 (2.1%) |
| $50,000 to $54,999 | 56 (1.7%) | 75 (2.7%) |
| $55,000 to $64,999 | 267 (8.0%) | 211 (7.6%) |
| $65,000 to $74,999 | 179 (5.3%) | 396 (14.3%) |
| $75,000 to $99,999 | 493 (14.7%) | 302 (10.9%) |
| $100,000+ | 1,234 (36.9%) | 620 (22.4%) |
| Total | 3,346 (100.0%) | 2,773 (100.0%) |
Earnings by Sex by Educational Attainment in South Huntington
Average earnings in South Huntington are $91,220 for men and $68,228 for women, a difference of 25.2%. Men with an educational attainment of graduate degree enjoy the highest average annual earnings of $132,300, while those with high school diploma education earn the least with $55,962. Women with an educational attainment of graduate degree earn the most with the average annual earnings of $118,417, while those with high school diploma education have the smallest earnings of $35,469.
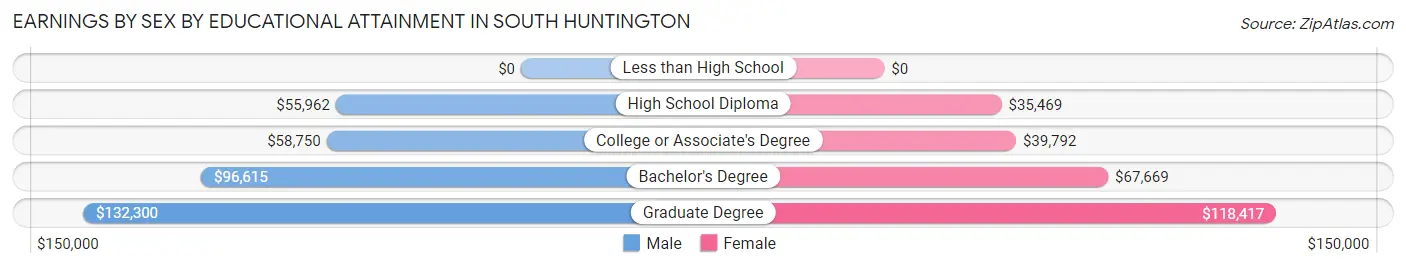
| Educational Attainment | Male Income | Female Income |
| Less than High School | - | - |
| High School Diploma | $55,962 | $35,469 |
| College or Associate's Degree | $58,750 | $39,792 |
| Bachelor's Degree | $96,615 | $67,669 |
| Graduate Degree | $132,300 | $118,417 |
| Total | $91,220 | $68,228 |
Family Income in South Huntington
Family Income Brackets in South Huntington
According to the South Huntington family income data, there are 941 families falling into the $200,000+ income range, which is the most common income bracket and makes up 35.8% of all families.
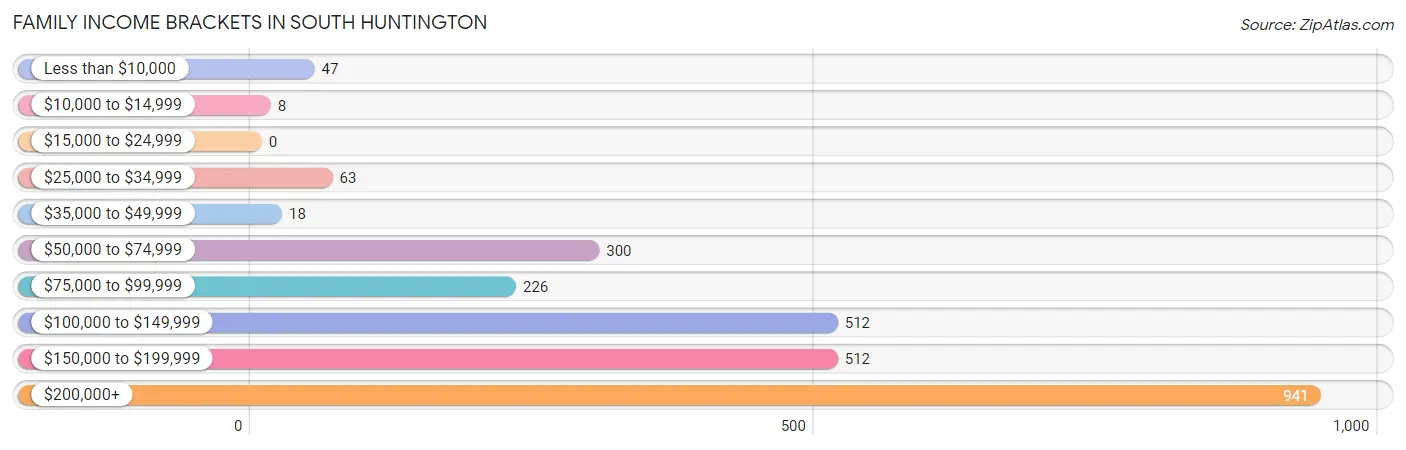
| Income Bracket | # Families | % Families |
| Less than $10,000 | 47 | 1.8% |
| $10,000 to $14,999 | 8 | 0.3% |
| $15,000 to $24,999 | 0 | 0.0% |
| $25,000 to $34,999 | 63 | 2.4% |
| $35,000 to $49,999 | 18 | 0.7% |
| $50,000 to $74,999 | 300 | 11.4% |
| $75,000 to $99,999 | 226 | 8.6% |
| $100,000 to $149,999 | 512 | 19.5% |
| $150,000 to $199,999 | 512 | 19.5% |
| $200,000+ | 941 | 35.8% |
Family Income by Famaliy Size in South Huntington
6-person families (92 | 3.5%) account for the highest median family income in South Huntington with $250,001 per family, while 2-person families (1,045 | 39.8%) have the highest median income of $60,573 per family member.
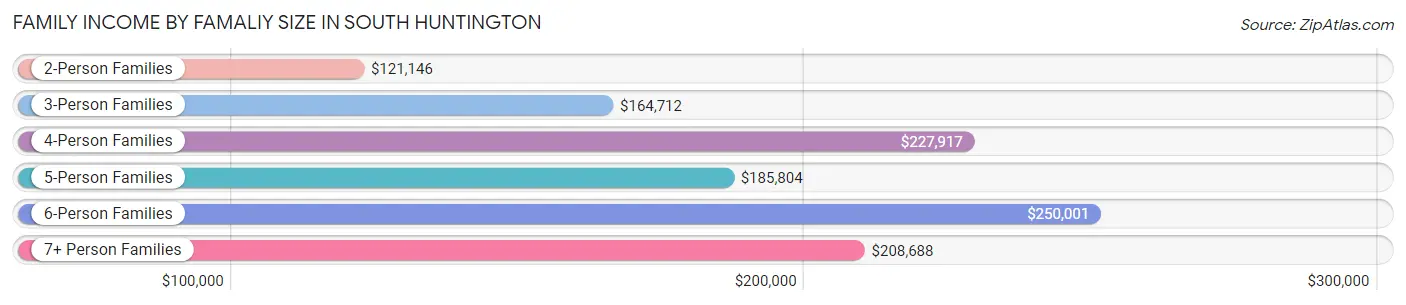
| Income Bracket | # Families | Median Income |
| 2-Person Families | 1,045 (39.8%) | $121,146 |
| 3-Person Families | 701 (26.7%) | $164,712 |
| 4-Person Families | 517 (19.7%) | $227,917 |
| 5-Person Families | 225 (8.6%) | $185,804 |
| 6-Person Families | 92 (3.5%) | $250,001 |
| 7+ Person Families | 48 (1.8%) | $208,688 |
| Total | 2,628 (100.0%) | $165,588 |
Family Income by Number of Earners in South Huntington
The median family income in South Huntington is $165,588, with families comprising 3+ earners (470) having the highest median family income of $207,813, while families with no earners (244) have the lowest median family income of $67,197, accounting for 17.9% and 9.3% of families, respectively.
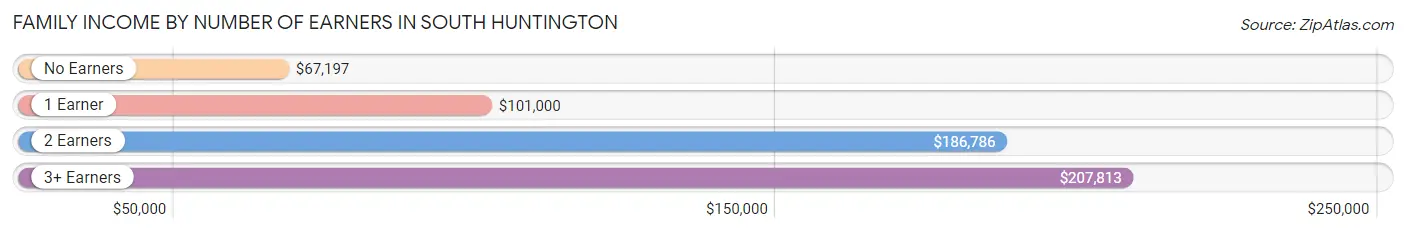
| Number of Earners | # Families | Median Income |
| No Earners | 244 (9.3%) | $67,197 |
| 1 Earner | 576 (21.9%) | $101,000 |
| 2 Earners | 1,338 (50.9%) | $186,786 |
| 3+ Earners | 470 (17.9%) | $207,813 |
| Total | 2,628 (100.0%) | $165,588 |
Household Income in South Huntington
Household Income Brackets in South Huntington
With 1,088 households falling in the category, the $200,000+ income range is the most frequent in South Huntington, accounting for 31.5% of all households. In contrast, only 7 households (0.2%) fall into the $10,000 to $14,999 income bracket, making it the least populous group.
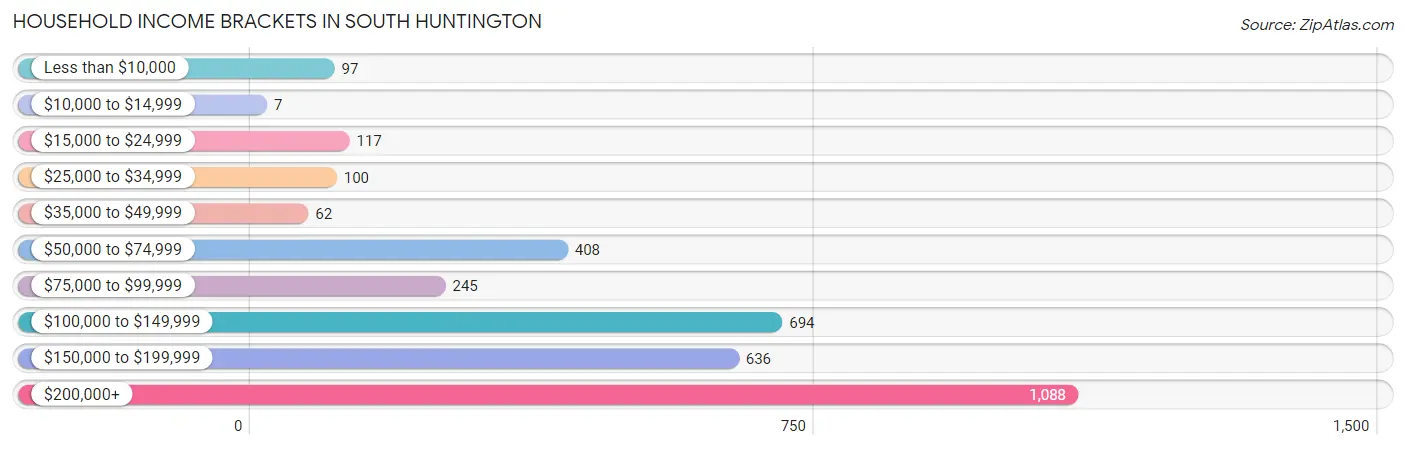
| Income Bracket | # Households | % Households |
| Less than $10,000 | 97 | 2.8% |
| $10,000 to $14,999 | 7 | 0.2% |
| $15,000 to $24,999 | 117 | 3.4% |
| $25,000 to $34,999 | 100 | 2.9% |
| $35,000 to $49,999 | 62 | 1.8% |
| $50,000 to $74,999 | 408 | 11.8% |
| $75,000 to $99,999 | 245 | 7.1% |
| $100,000 to $149,999 | 694 | 20.1% |
| $150,000 to $199,999 | 636 | 18.4% |
| $200,000+ | 1,088 | 31.5% |
Household Income by Householder Age in South Huntington
The median household income in South Huntington is $149,615, with the highest median household income of $174,083 found in the 25 to 44 years age bracket for the primary householder. A total of 952 households (27.6%) fall into this category. Meanwhile, the 65+ years age bracket for the primary householder has the lowest median household income of $79,432, with 845 households (24.5%) in this group.
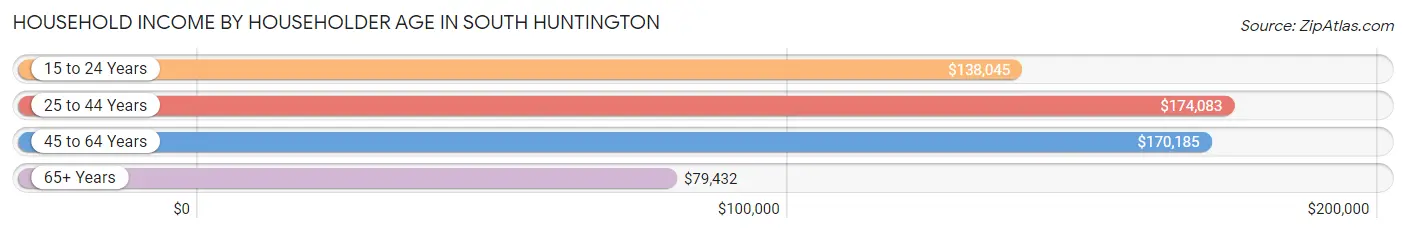
| Income Bracket | # Households | Median Income |
| 15 to 24 Years | 61 (1.8%) | $138,045 |
| 25 to 44 Years | 952 (27.6%) | $174,083 |
| 45 to 64 Years | 1,596 (46.2%) | $170,185 |
| 65+ Years | 845 (24.5%) | $79,432 |
| Total | 3,454 (100.0%) | $149,615 |
Poverty in South Huntington
Income Below Poverty by Sex and Age in South Huntington
With 3.3% poverty level for males and 4.2% for females among the residents of South Huntington, 12 to 14 year old males and 16 and 17 year old females are the most vulnerable to poverty, with 30 males (11.5%) and 22 females (16.7%) in their respective age groups living below the poverty level.
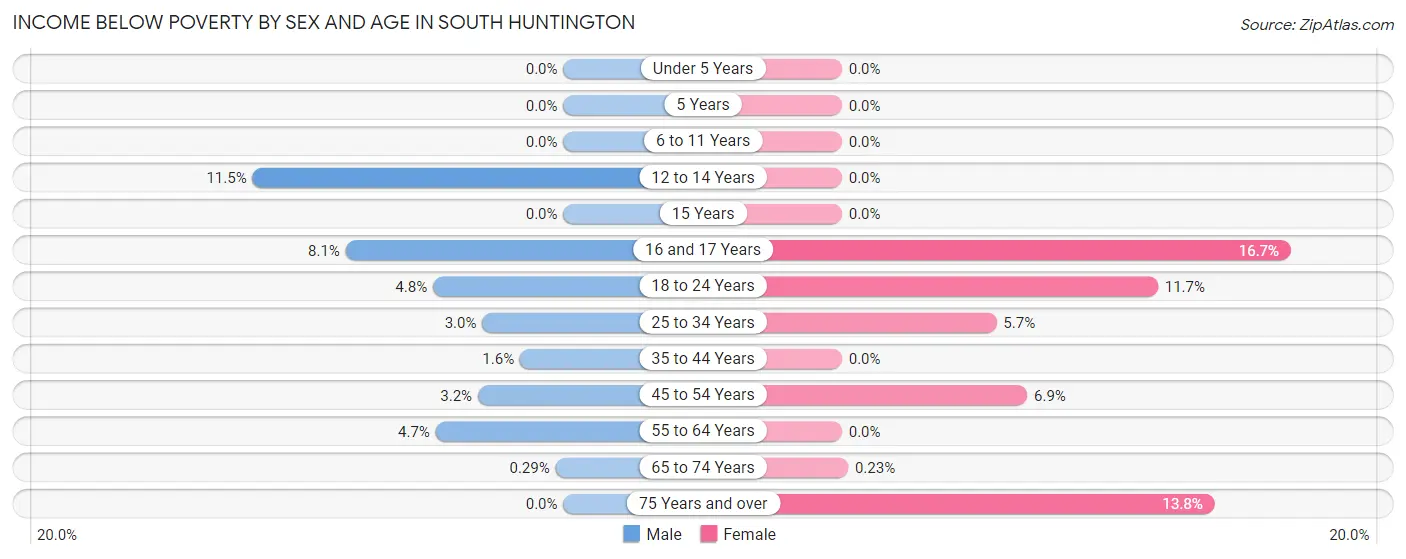
| Age Bracket | Male | Female |
| Under 5 Years | 0 (0.0%) | 0 (0.0%) |
| 5 Years | 0 (0.0%) | 0 (0.0%) |
| 6 to 11 Years | 0 (0.0%) | 0 (0.0%) |
| 12 to 14 Years | 30 (11.5%) | 0 (0.0%) |
| 15 Years | 0 (0.0%) | 0 (0.0%) |
| 16 and 17 Years | 8 (8.1%) | 22 (16.7%) |
| 18 to 24 Years | 31 (4.8%) | 42 (11.7%) |
| 25 to 34 Years | 19 (3.0%) | 37 (5.7%) |
| 35 to 44 Years | 9 (1.6%) | 0 (0.0%) |
| 45 to 54 Years | 19 (3.2%) | 55 (6.9%) |
| 55 to 64 Years | 50 (4.7%) | 0 (0.0%) |
| 65 to 74 Years | 1 (0.3%) | 1 (0.2%) |
| 75 Years and over | 0 (0.0%) | 53 (13.8%) |
| Total | 167 (3.3%) | 210 (4.2%) |
Income Above Poverty by Sex and Age in South Huntington
According to the poverty statistics in South Huntington, males aged under 5 years and females aged under 5 years are the age groups that are most secure financially, with 100.0% of males and 100.0% of females in these age groups living above the poverty line.
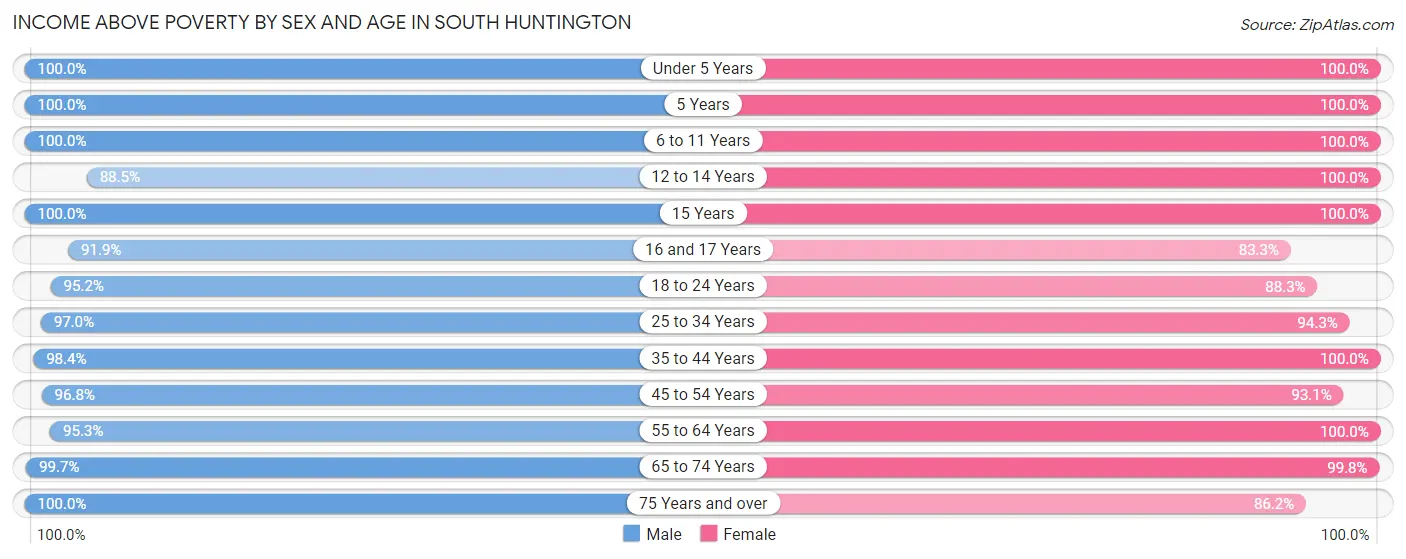
| Age Bracket | Male | Female |
| Under 5 Years | 110 (100.0%) | 432 (100.0%) |
| 5 Years | 20 (100.0%) | 41 (100.0%) |
| 6 to 11 Years | 284 (100.0%) | 326 (100.0%) |
| 12 to 14 Years | 230 (88.5%) | 156 (100.0%) |
| 15 Years | 90 (100.0%) | 76 (100.0%) |
| 16 and 17 Years | 91 (91.9%) | 110 (83.3%) |
| 18 to 24 Years | 609 (95.2%) | 316 (88.3%) |
| 25 to 34 Years | 613 (97.0%) | 608 (94.3%) |
| 35 to 44 Years | 550 (98.4%) | 482 (100.0%) |
| 45 to 54 Years | 580 (96.8%) | 744 (93.1%) |
| 55 to 64 Years | 1,004 (95.3%) | 753 (100.0%) |
| 65 to 74 Years | 345 (99.7%) | 440 (99.8%) |
| 75 Years and over | 365 (100.0%) | 330 (86.2%) |
| Total | 4,891 (96.7%) | 4,814 (95.8%) |
Income Below Poverty Among Married-Couple Families in South Huntington
The poverty statistics for married-couple families in South Huntington show that 0.9% or 19 of the total 2,034 families live below the poverty line. Families with no children have the highest poverty rate of 1.8%, comprising of 19 families. On the other hand, families with 1 or 2 children have the lowest poverty rate of 0.0%, which includes 0 families.
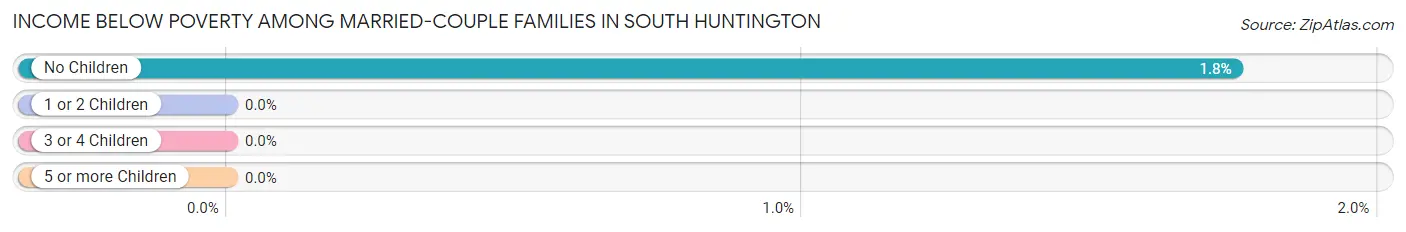
| Children | Above Poverty | Below Poverty |
| No Children | 1,069 (98.3%) | 19 (1.8%) |
| 1 or 2 Children | 825 (100.0%) | 0 (0.0%) |
| 3 or 4 Children | 121 (100.0%) | 0 (0.0%) |
| 5 or more Children | 0 (0.0%) | 0 (0.0%) |
| Total | 2,015 (99.1%) | 19 (0.9%) |
Income Below Poverty Among Single-Parent Households in South Huntington
According to the poverty data in South Huntington, 9.0% or 21 single-father households and 4.4% or 16 single-mother households are living below the poverty line. Among single-father households, those with 1 or 2 children have the highest poverty rate, with 21 households (26.6%) experiencing poverty. Likewise, among single-mother households, those with no children have the highest poverty rate, with 8 households (4.7%) falling below the poverty line.
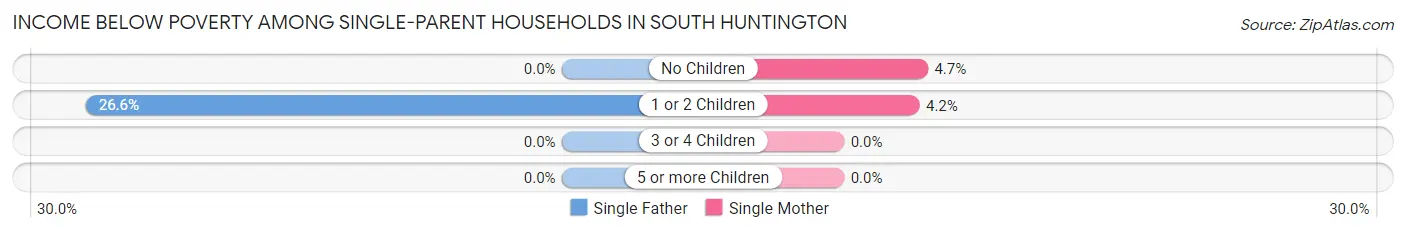
| Children | Single Father | Single Mother |
| No Children | 0 (0.0%) | 8 (4.7%) |
| 1 or 2 Children | 21 (26.6%) | 8 (4.2%) |
| 3 or 4 Children | 0 (0.0%) | 0 (0.0%) |
| 5 or more Children | 0 (0.0%) | 0 (0.0%) |
| Total | 21 (9.0%) | 16 (4.4%) |
Income Below Poverty Among Married-Couple vs Single-Parent Households in South Huntington
The poverty data for South Huntington shows that 19 of the married-couple family households (0.9%) and 37 of the single-parent households (6.2%) are living below the poverty level. Within the married-couple family households, those with no children have the highest poverty rate, with 19 households (1.8%) falling below the poverty line. Among the single-parent households, those with 1 or 2 children have the highest poverty rate, with 29 household (10.8%) living below poverty.
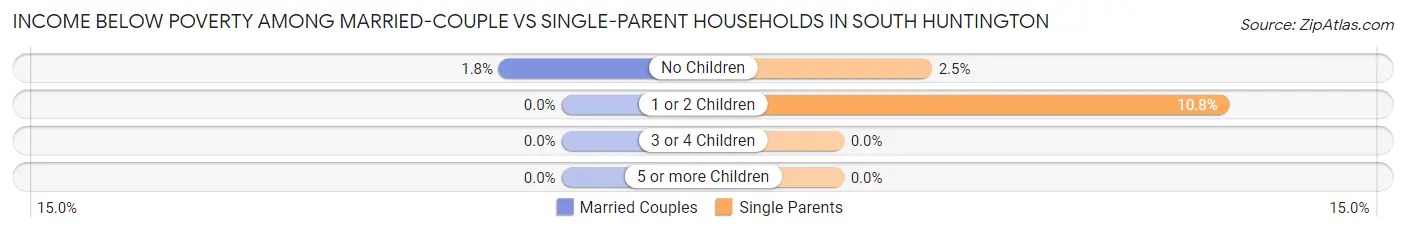
| Children | Married-Couple Families | Single-Parent Households |
| No Children | 19 (1.8%) | 8 (2.5%) |
| 1 or 2 Children | 0 (0.0%) | 29 (10.8%) |
| 3 or 4 Children | 0 (0.0%) | 0 (0.0%) |
| 5 or more Children | 0 (0.0%) | 0 (0.0%) |
| Total | 19 (0.9%) | 37 (6.2%) |
Race in South Huntington
The most populous races in South Huntington are White / Caucasian (8,172 | 79.3%), Hispanic or Latino (1,065 | 10.3%), and Asian (1,010 | 9.8%).
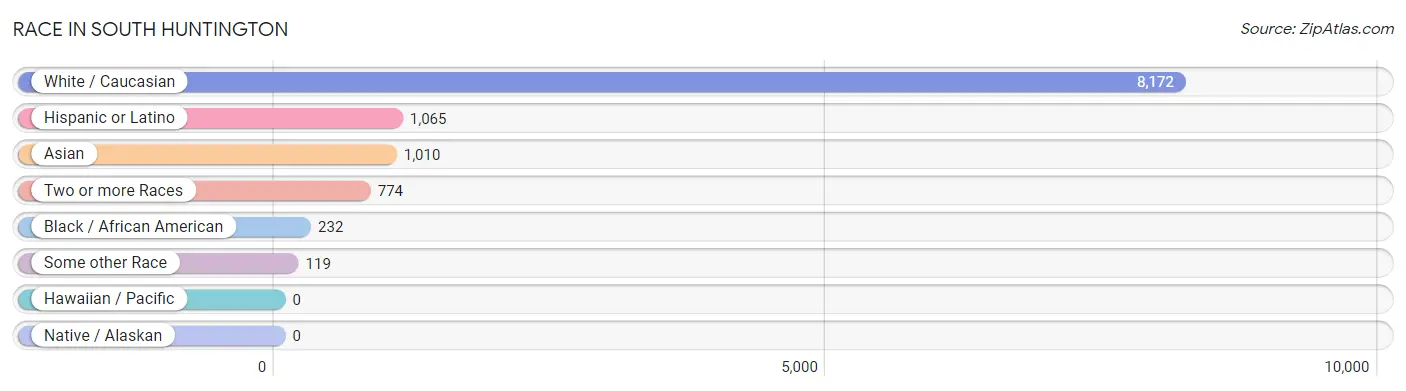
| Race | # Population | % Population |
| Asian | 1,010 | 9.8% |
| Black / African American | 232 | 2.2% |
| Hawaiian / Pacific | 0 | 0.0% |
| Hispanic or Latino | 1,065 | 10.3% |
| Native / Alaskan | 0 | 0.0% |
| White / Caucasian | 8,172 | 79.3% |
| Two or more Races | 774 | 7.5% |
| Some other Race | 119 | 1.1% |
| Total | 10,307 | 100.0% |
Ancestry in South Huntington
The most populous ancestries reported in South Huntington are Italian (2,728 | 26.5%), Irish (1,887 | 18.3%), German (1,769 | 17.2%), American (913 | 8.9%), and South American (461 | 4.5%), together accounting for 75.3% of all South Huntington residents.
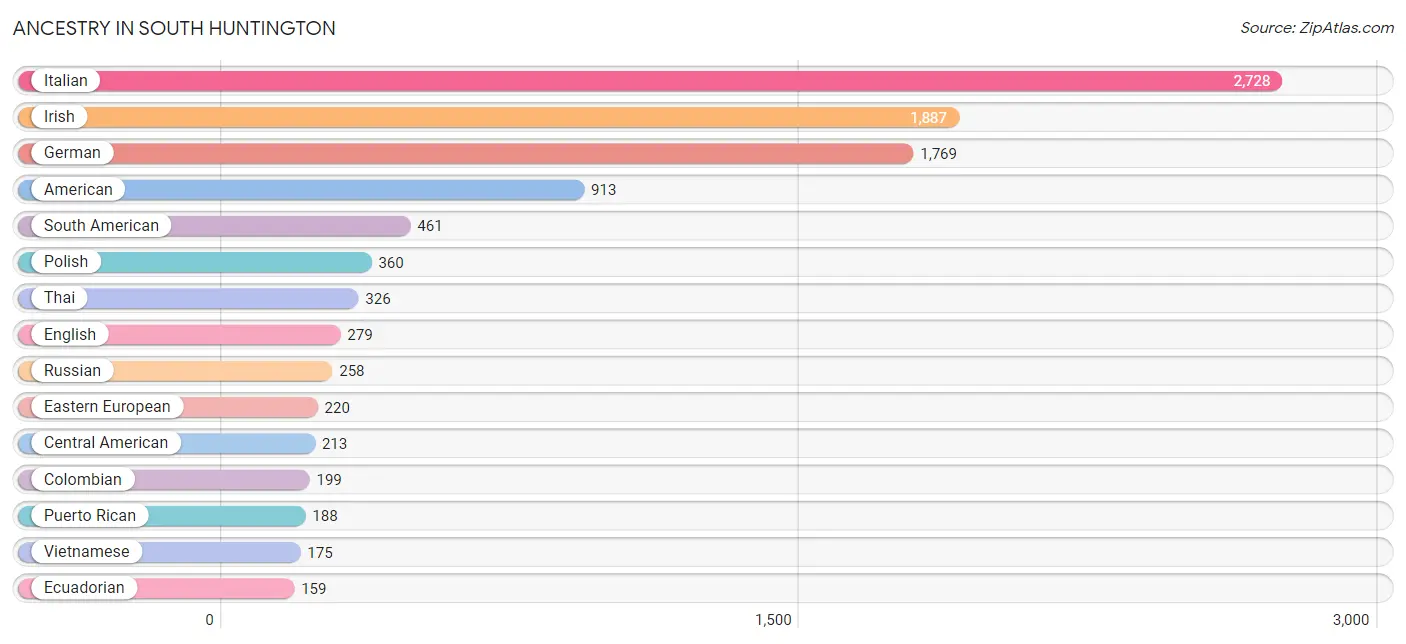
| Ancestry | # Population | % Population |
| African | 30 | 0.3% |
| American | 913 | 8.9% |
| Arab | 110 | 1.1% |
| Argentinean | 47 | 0.5% |
| Australian | 17 | 0.2% |
| Austrian | 32 | 0.3% |
| Basque | 7 | 0.1% |
| Belgian | 8 | 0.1% |
| Bhutanese | 52 | 0.5% |
| Brazilian | 7 | 0.1% |
| British | 8 | 0.1% |
| Burmese | 14 | 0.1% |
| Canadian | 31 | 0.3% |
| Central American | 213 | 2.1% |
| Central American Indian | 16 | 0.2% |
| Chilean | 17 | 0.2% |
| Colombian | 199 | 1.9% |
| Costa Rican | 20 | 0.2% |
| Croatian | 25 | 0.2% |
| Danish | 12 | 0.1% |
| Dominican | 77 | 0.7% |
| Dutch | 60 | 0.6% |
| Eastern European | 220 | 2.1% |
| Ecuadorian | 159 | 1.5% |
| Egyptian | 110 | 1.1% |
| English | 279 | 2.7% |
| Estonian | 5 | 0.1% |
| European | 68 | 0.7% |
| Finnish | 11 | 0.1% |
| French | 155 | 1.5% |
| French Canadian | 8 | 0.1% |
| German | 1,769 | 17.2% |
| Greek | 143 | 1.4% |
| Haitian | 12 | 0.1% |
| Honduran | 105 | 1.0% |
| Hungarian | 99 | 1.0% |
| Indian (Asian) | 131 | 1.3% |
| Irish | 1,887 | 18.3% |
| Italian | 2,728 | 26.5% |
| Jamaican | 12 | 0.1% |
| Korean | 117 | 1.1% |
| Lithuanian | 52 | 0.5% |
| Malaysian | 25 | 0.2% |
| Mexican | 21 | 0.2% |
| Nigerian | 53 | 0.5% |
| Norwegian | 41 | 0.4% |
| Polish | 360 | 3.5% |
| Portuguese | 5 | 0.1% |
| Puerto Rican | 188 | 1.8% |
| Romanian | 18 | 0.2% |
| Russian | 258 | 2.5% |
| Salvadoran | 88 | 0.9% |
| Scandinavian | 28 | 0.3% |
| Scotch-Irish | 45 | 0.4% |
| Scottish | 56 | 0.5% |
| Slovak | 15 | 0.2% |
| Slovene | 11 | 0.1% |
| South African | 6 | 0.1% |
| South American | 461 | 4.5% |
| Spaniard | 74 | 0.7% |
| Spanish | 16 | 0.2% |
| Sri Lankan | 9 | 0.1% |
| Subsaharan African | 89 | 0.9% |
| Swedish | 49 | 0.5% |
| Swiss | 65 | 0.6% |
| Thai | 326 | 3.2% |
| Turkish | 143 | 1.4% |
| Ukrainian | 47 | 0.5% |
| Venezuelan | 39 | 0.4% |
| Vietnamese | 175 | 1.7% |
| Welsh | 9 | 0.1% |
| West Indian | 30 | 0.3% | View All 72 Rows |
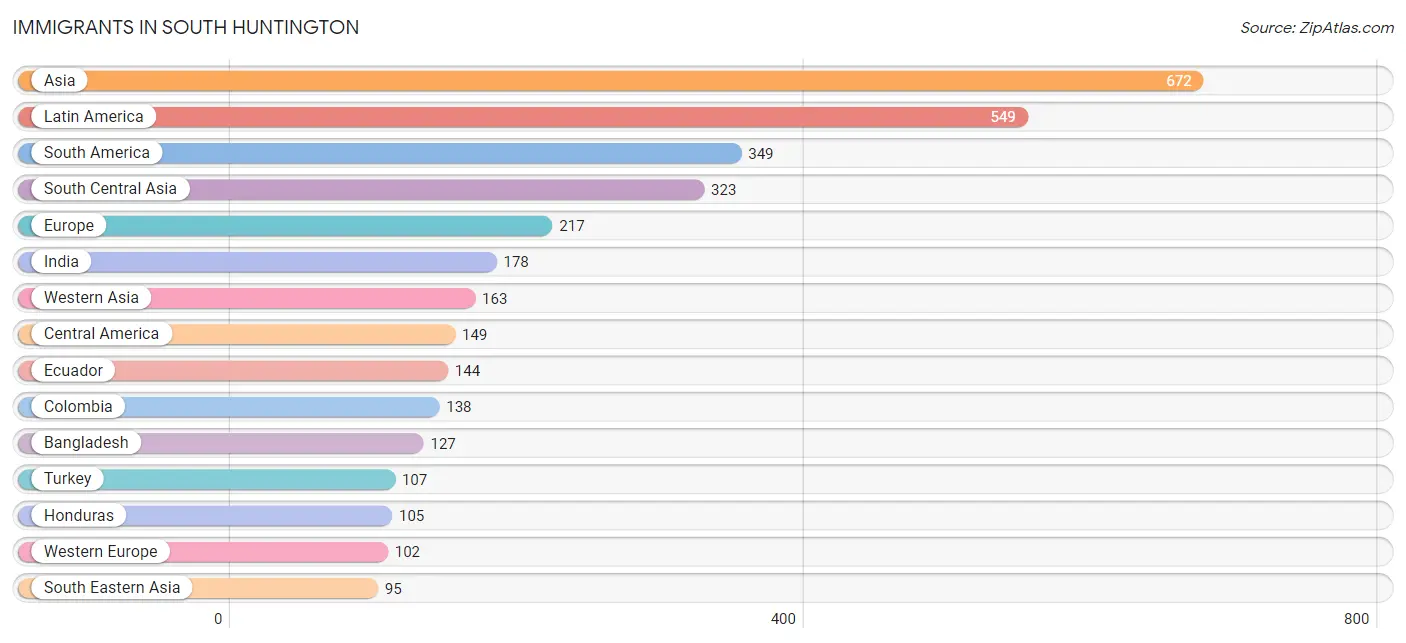
Immigrants in South Huntington
The most numerous immigrant groups reported in South Huntington came from Asia (672 | 6.5%), Latin America (549 | 5.3%), South America (349 | 3.4%), South Central Asia (323 | 3.1%), and Europe (217 | 2.1%), together accounting for 20.5% of all South Huntington residents.
| Immigration Origin | # Population | % Population |
| Africa | 26 | 0.3% |
| Argentina | 25 | 0.2% |
| Asia | 672 | 6.5% |
| Bangladesh | 127 | 1.2% |
| Belgium | 8 | 0.1% |
| Brazil | 7 | 0.1% |
| Canada | 10 | 0.1% |
| Caribbean | 51 | 0.5% |
| Central America | 149 | 1.5% |
| Chile | 17 | 0.2% |
| China | 50 | 0.5% |
| Colombia | 138 | 1.3% |
| Dominica | 14 | 0.1% |
| Dominican Republic | 9 | 0.1% |
| Eastern Asia | 91 | 0.9% |
| Eastern Europe | 71 | 0.7% |
| Ecuador | 144 | 1.4% |
| El Salvador | 23 | 0.2% |
| Europe | 217 | 2.1% |
| France | 19 | 0.2% |
| Germany | 35 | 0.3% |
| Honduras | 105 | 1.0% |
| Hong Kong | 27 | 0.3% |
| India | 178 | 1.7% |
| Ireland | 15 | 0.2% |
| Italy | 24 | 0.2% |
| Jamaica | 28 | 0.3% |
| Japan | 27 | 0.3% |
| Korea | 14 | 0.1% |
| Laos | 25 | 0.2% |
| Latin America | 549 | 5.3% |
| Mexico | 21 | 0.2% |
| Netherlands | 18 | 0.2% |
| Nigeria | 20 | 0.2% |
| Northern Europe | 15 | 0.2% |
| Pakistan | 18 | 0.2% |
| Philippines | 70 | 0.7% |
| Poland | 49 | 0.5% |
| Russia | 22 | 0.2% |
| South Africa | 6 | 0.1% |
| South America | 349 | 3.4% |
| South Central Asia | 323 | 3.1% |
| South Eastern Asia | 95 | 0.9% |
| Southern Europe | 29 | 0.3% |
| Spain | 5 | 0.1% |
| Switzerland | 22 | 0.2% |
| Taiwan | 2 | 0.0% |
| Turkey | 107 | 1.0% |
| Venezuela | 18 | 0.2% |
| Western Africa | 20 | 0.2% |
| Western Asia | 163 | 1.6% |
| Western Europe | 102 | 1.0% | View All 52 Rows |
Sex and Age in South Huntington
Sex and Age in South Huntington
The most populous age groups in South Huntington are 20 to 24 Years (606 | 11.7%) for men and Under 5 Years (441 | 8.6%) for women.
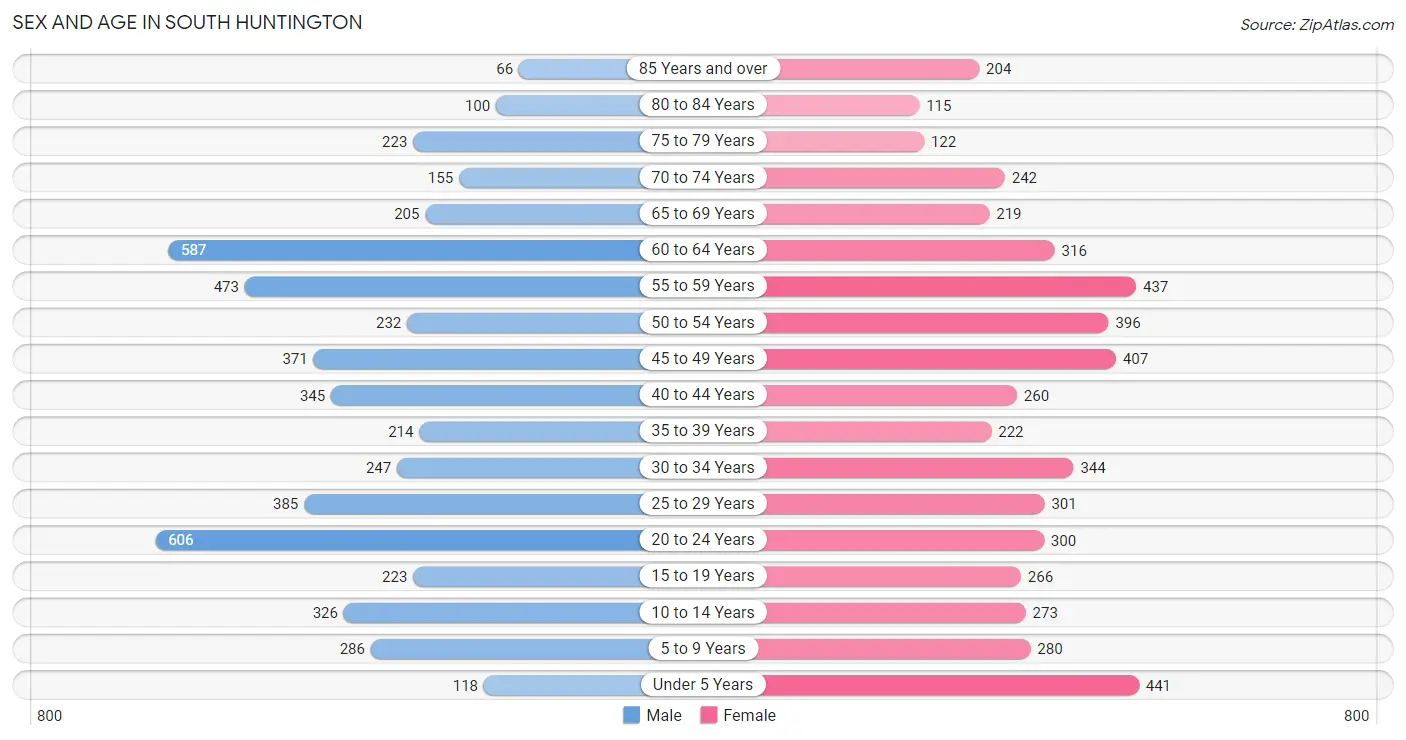
| Age Bracket | Male | Female |
| Under 5 Years | 118 (2.3%) | 441 (8.6%) |
| 5 to 9 Years | 286 (5.5%) | 280 (5.4%) |
| 10 to 14 Years | 326 (6.3%) | 273 (5.3%) |
| 15 to 19 Years | 223 (4.3%) | 266 (5.2%) |
| 20 to 24 Years | 606 (11.7%) | 300 (5.8%) |
| 25 to 29 Years | 385 (7.5%) | 301 (5.9%) |
| 30 to 34 Years | 247 (4.8%) | 344 (6.7%) |
| 35 to 39 Years | 214 (4.2%) | 222 (4.3%) |
| 40 to 44 Years | 345 (6.7%) | 260 (5.1%) |
| 45 to 49 Years | 371 (7.2%) | 407 (7.9%) |
| 50 to 54 Years | 232 (4.5%) | 396 (7.7%) |
| 55 to 59 Years | 473 (9.2%) | 437 (8.5%) |
| 60 to 64 Years | 587 (11.4%) | 316 (6.1%) |
| 65 to 69 Years | 205 (4.0%) | 219 (4.3%) |
| 70 to 74 Years | 155 (3.0%) | 242 (4.7%) |
| 75 to 79 Years | 223 (4.3%) | 122 (2.4%) |
| 80 to 84 Years | 100 (1.9%) | 115 (2.2%) |
| 85 Years and over | 66 (1.3%) | 204 (4.0%) |
| Total | 5,162 (100.0%) | 5,145 (100.0%) |
Families and Households in South Huntington
Median Family Size in South Huntington
The median family size in South Huntington is 3.24 persons per family, with married-couple families (2,034 | 77.4%) accounting for the largest median family size of 3.43 persons per family. On the other hand, single female/mother families (361 | 13.7%) represent the smallest median family size with 2.40 persons per family.
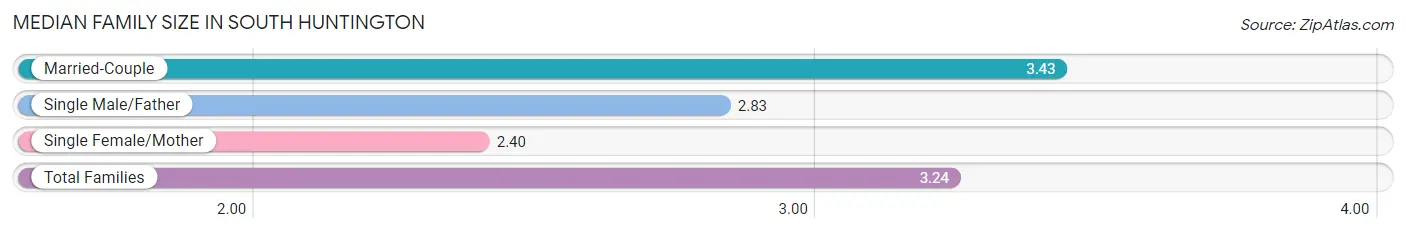
| Family Type | # Families | Family Size |
| Married-Couple | 2,034 (77.4%) | 3.43 |
| Single Male/Father | 233 (8.9%) | 2.83 |
| Single Female/Mother | 361 (13.7%) | 2.40 |
| Total Families | 2,628 (100.0%) | 3.24 |
Median Household Size in South Huntington
The median household size in South Huntington is 2.92 persons per household, with married-couple households (2,034 | 58.9%) accounting for the largest median household size of 3.5 persons per household. non-family households (826 | 23.9%) represent the smallest median household size with 1.49 persons per household.
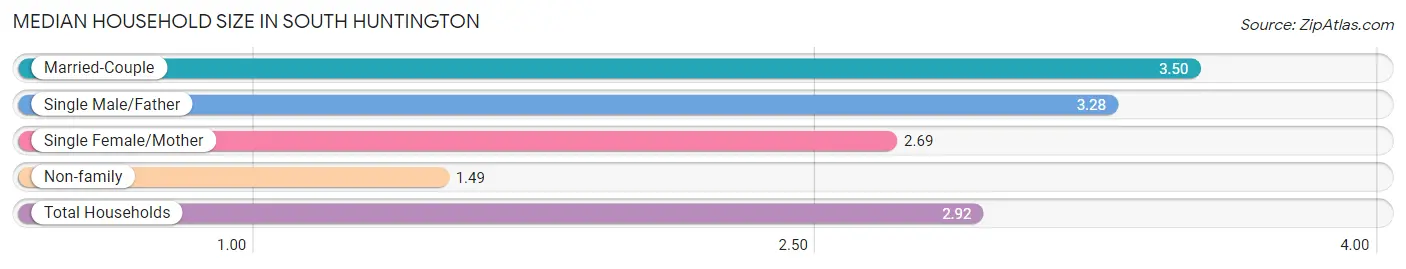
| Household Type | # Households | Household Size |
| Married-Couple | 2,034 (58.9%) | 3.50 |
| Single Male/Father | 233 (6.8%) | 3.28 |
| Single Female/Mother | 361 (10.4%) | 2.69 |
| Non-family | 826 (23.9%) | 1.49 |
| Total Households | 3,454 (100.0%) | 2.92 |
Household Size by Marriage Status in South Huntington
Out of a total of 3,454 households in South Huntington, 2,628 (76.1%) are family households, while 826 (23.9%) are nonfamily households. The most numerous type of family households are 2-person households, comprising 909, and the most common type of nonfamily households are 1-person households, comprising 559.
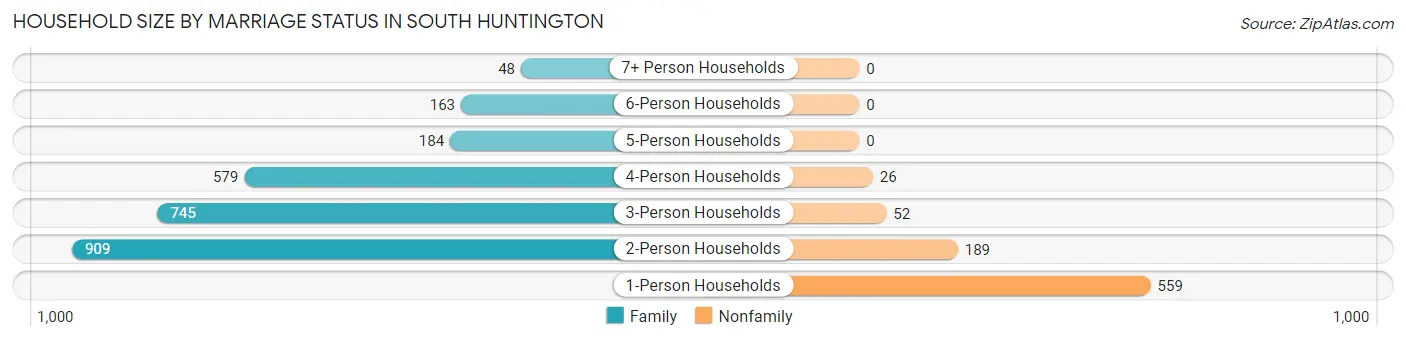
| Household Size | Family Households | Nonfamily Households |
| 1-Person Households | - | 559 (16.2%) |
| 2-Person Households | 909 (26.3%) | 189 (5.5%) |
| 3-Person Households | 745 (21.6%) | 52 (1.5%) |
| 4-Person Households | 579 (16.8%) | 26 (0.7%) |
| 5-Person Households | 184 (5.3%) | 0 (0.0%) |
| 6-Person Households | 163 (4.7%) | 0 (0.0%) |
| 7+ Person Households | 48 (1.4%) | 0 (0.0%) |
| Total | 2,628 (76.1%) | 826 (23.9%) |
Female Fertility in South Huntington
Fertility by Age in South Huntington
Average fertility rate in South Huntington is 66.0 births per 1,000 women. Women in the age bracket of 20 to 34 years have the highest fertility rate with 119.0 births per 1,000 women. Women in the age bracket of 20 to 34 years acount for 77.2% of all women with births.
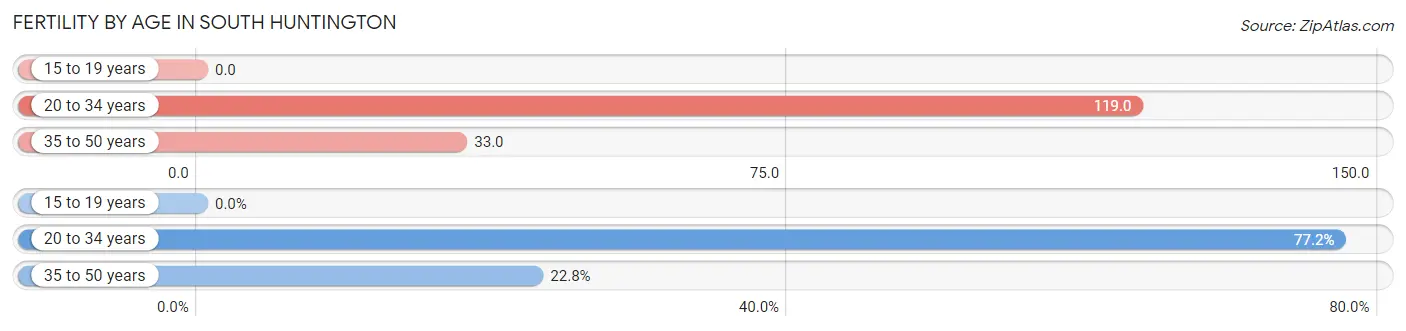
| Age Bracket | Women with Births | Births / 1,000 Women |
| 15 to 19 years | 0 (0.0%) | 0.0 |
| 20 to 34 years | 112 (77.2%) | 119.0 |
| 35 to 50 years | 33 (22.8%) | 33.0 |
| Total | 145 (100.0%) | 66.0 |
Fertility by Age by Marriage Status in South Huntington
63.4% of women with births (145) in South Huntington are married. The highest percentage of unmarried women with births falls into 20 to 34 years age bracket with 47.3% of them unmarried at the time of birth, while the lowest percentage of unmarried women with births belong to 35 to 50 years age bracket with 0.0% of them unmarried.
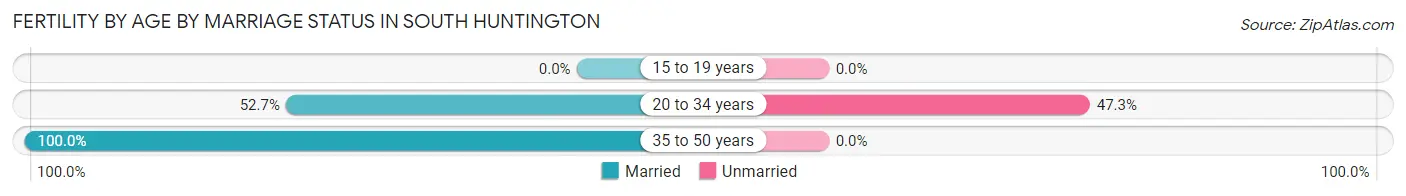
| Age Bracket | Married | Unmarried |
| 15 to 19 years | 0 (0.0%) | 0 (0.0%) |
| 20 to 34 years | 59 (52.7%) | 53 (47.3%) |
| 35 to 50 years | 33 (100.0%) | 0 (0.0%) |
| Total | 92 (63.4%) | 53 (36.5%) |
Fertility by Education in South Huntington
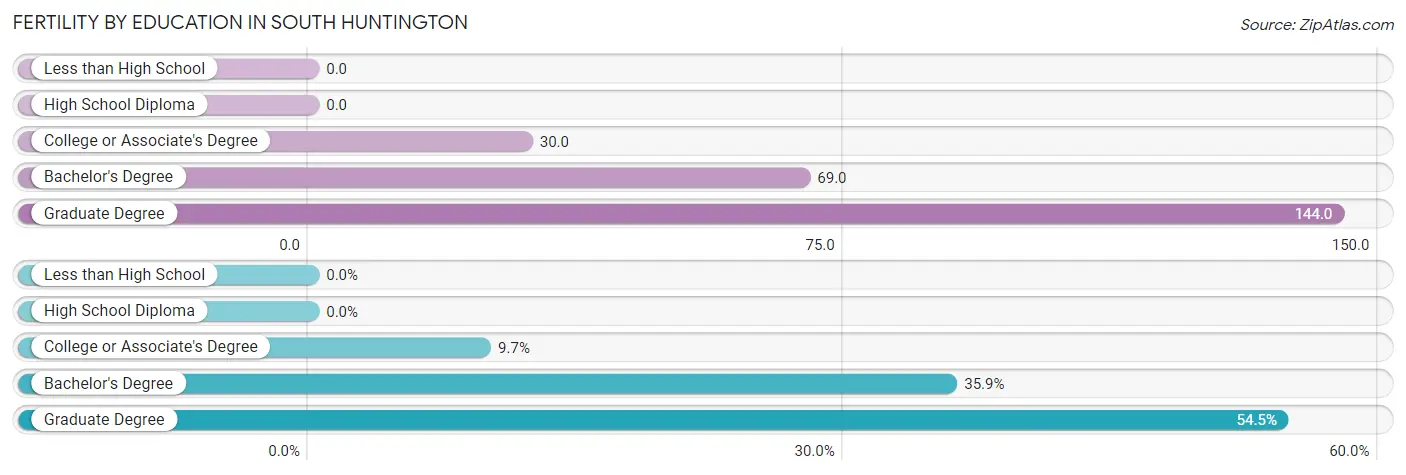
| Educational Attainment | Women with Births | Births / 1,000 Women |
| Less than High School | 0 (0.0%) | 0.0 |
| High School Diploma | 0 (0.0%) | 0.0 |
| College or Associate's Degree | 14 (9.7%) | 30.0 |
| Bachelor's Degree | 52 (35.9%) | 69.0 |
| Graduate Degree | 79 (54.5%) | 144.0 |
| Total | 145 (100.0%) | 66.0 |
Fertility by Education by Marriage Status in South Huntington
36.5% of women with births in South Huntington are unmarried. Women with the educational attainment of college or associate's degree are most likely to be married with 100.0% of them married at childbirth, while women with the educational attainment of graduate degree are least likely to be married with 67.1% of them unmarried at childbirth.
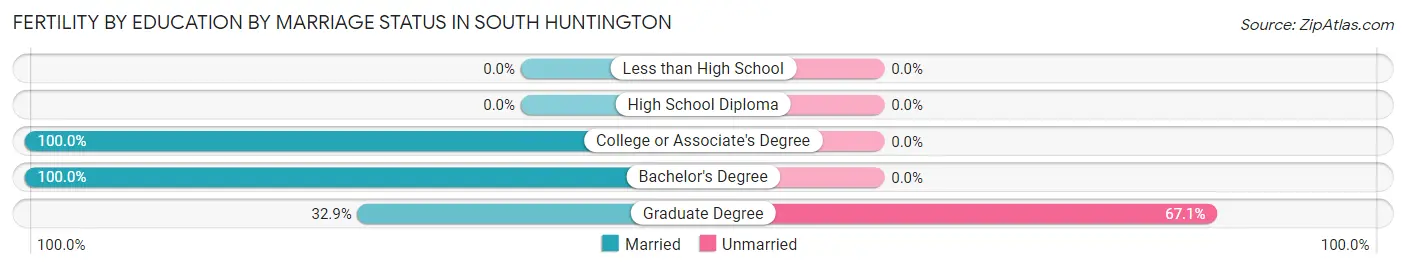
| Educational Attainment | Married | Unmarried |
| Less than High School | 0 (0.0%) | 0 (0.0%) |
| High School Diploma | 0 (0.0%) | 0 (0.0%) |
| College or Associate's Degree | 14 (100.0%) | 0 (0.0%) |
| Bachelor's Degree | 52 (100.0%) | 0 (0.0%) |
| Graduate Degree | 26 (32.9%) | 53 (67.1%) |
| Total | 92 (63.4%) | 53 (36.5%) |
Employment Characteristics in South Huntington
Employment by Class of Employer in South Huntington
Among the 5,466 employed individuals in South Huntington, private company employees (3,266 | 59.8%), local government employees (897 | 16.4%), and not-for-profit organizations (515 | 9.4%) make up the most common classes of employment.
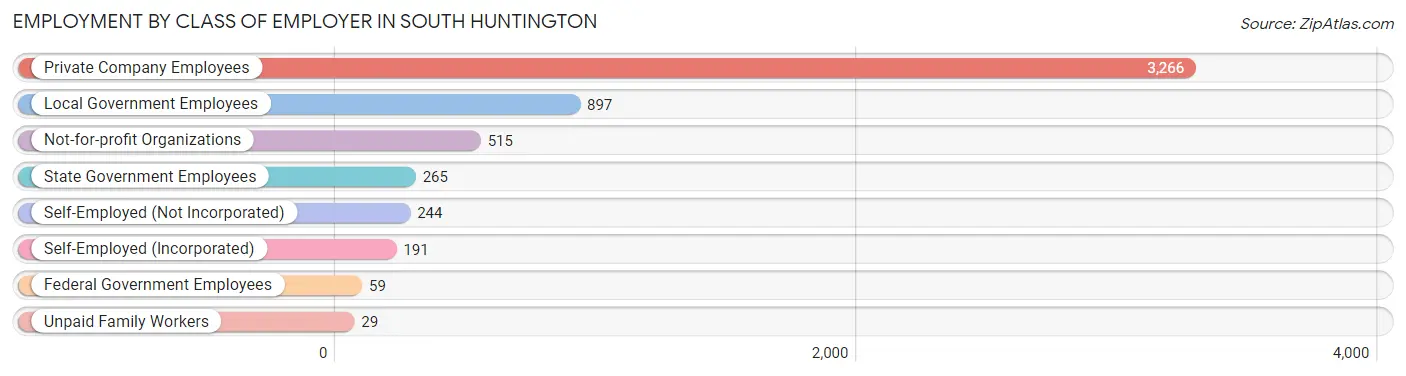
| Employer Class | # Employees | % Employees |
| Private Company Employees | 3,266 | 59.8% |
| Self-Employed (Incorporated) | 191 | 3.5% |
| Self-Employed (Not Incorporated) | 244 | 4.5% |
| Not-for-profit Organizations | 515 | 9.4% |
| Local Government Employees | 897 | 16.4% |
| State Government Employees | 265 | 4.9% |
| Federal Government Employees | 59 | 1.1% |
| Unpaid Family Workers | 29 | 0.5% |
| Total | 5,466 | 100.0% |
Employment Status by Age in South Huntington
According to the labor force statistics for South Huntington, out of the total population over 16 years of age (8,417), 71.1% or 5,984 individuals are in the labor force, with 7.6% or 455 of them unemployed. The age group with the highest labor force participation rate is 30 to 34 years, with 97.0% or 573 individuals in the labor force. Within the labor force, the 16 to 19 years age range has the highest percentage of unemployed individuals, with 22.3% or 23 of them being unemployed.
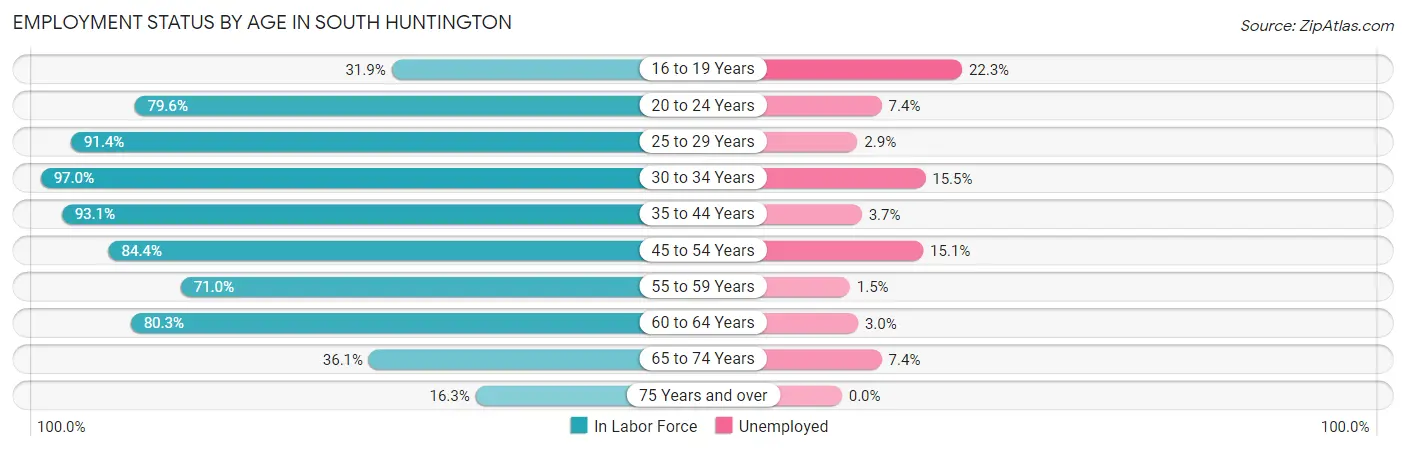
| Age Bracket | In Labor Force | Unemployed |
| 16 to 19 Years | 103 (31.9%) | 23 (22.3%) |
| 20 to 24 Years | 721 (79.6%) | 53 (7.4%) |
| 25 to 29 Years | 627 (91.4%) | 18 (2.9%) |
| 30 to 34 Years | 573 (97.0%) | 89 (15.5%) |
| 35 to 44 Years | 969 (93.1%) | 36 (3.7%) |
| 45 to 54 Years | 1,187 (84.4%) | 179 (15.1%) |
| 55 to 59 Years | 646 (71.0%) | 10 (1.5%) |
| 60 to 64 Years | 725 (80.3%) | 22 (3.0%) |
| 65 to 74 Years | 296 (36.1%) | 22 (7.4%) |
| 75 Years and over | 135 (16.3%) | 0 (0.0%) |
| Total | 5,984 (71.1%) | 455 (7.6%) |
Employment Status by Educational Attainment in South Huntington
According to labor force statistics for South Huntington, 85.4% of individuals (4,729) out of the total population between 25 and 64 years of age (5,537) are in the labor force, with 7.5% or 355 of them being unemployed. The group with the highest labor force participation rate are those with the educational attainment of bachelor's degree or higher, with 89.7% or 2,973 individuals in the labor force. Within the labor force, individuals with college / associate degree education have the highest percentage of unemployment, with 23.9% or 295 of them being unemployed.
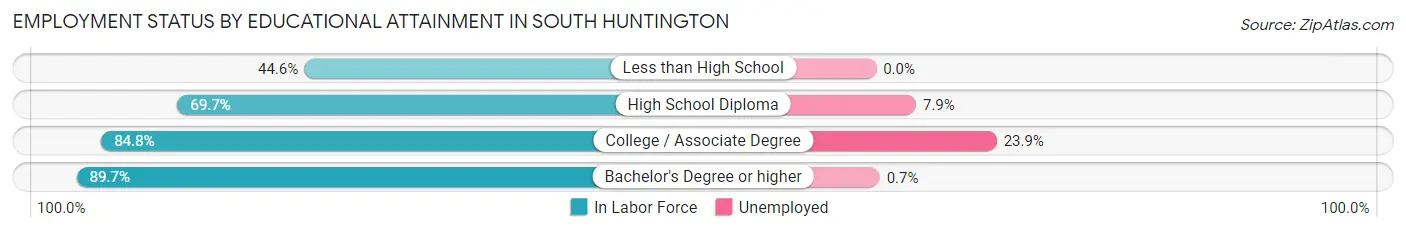
| Educational Attainment | In Labor Force | Unemployed |
| Less than High School | 25 (44.6%) | 0 (0.0%) |
| High School Diploma | 495 (69.7%) | 56 (7.9%) |
| College / Associate Degree | 1,236 (84.8%) | 348 (23.9%) |
| Bachelor's Degree or higher | 2,973 (89.7%) | 23 (0.7%) |
| Total | 4,729 (85.4%) | 415 (7.5%) |
Employment Occupations by Sex in South Huntington
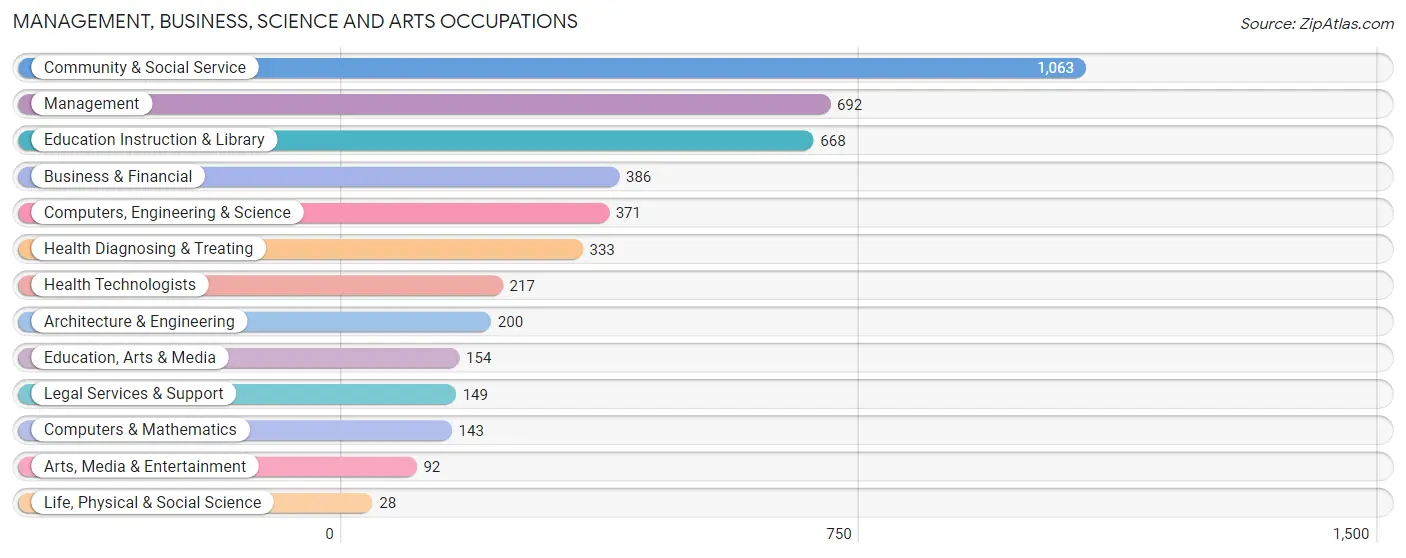
Management, Business, Science and Arts Occupations
The most common Management, Business, Science and Arts occupations in South Huntington are Community & Social Service (1,063 | 19.2%), Management (692 | 12.5%), Education Instruction & Library (668 | 12.1%), Business & Financial (386 | 7.0%), and Computers, Engineering & Science (371 | 6.7%).
Management, Business, Science and Arts Occupations by Sex
Within the Management, Business, Science and Arts occupations in South Huntington, the most male-oriented occupations are Architecture & Engineering (80.5%), Legal Services & Support (75.8%), and Computers, Engineering & Science (67.4%), while the most female-oriented occupations are Health Technologists (82.5%), Education, Arts & Media (82.5%), and Life, Physical & Social Science (71.4%).
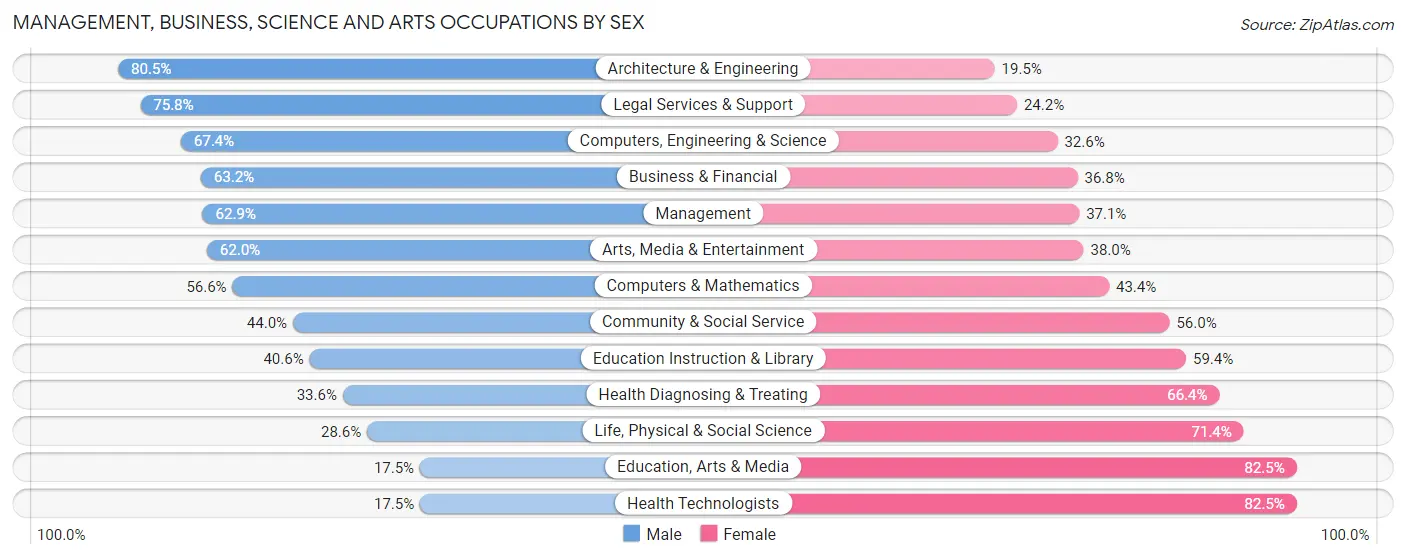
| Occupation | Male | Female |
| Management | 435 (62.9%) | 257 (37.1%) |
| Business & Financial | 244 (63.2%) | 142 (36.8%) |
| Computers, Engineering & Science | 250 (67.4%) | 121 (32.6%) |
| Computers & Mathematics | 81 (56.6%) | 62 (43.4%) |
| Architecture & Engineering | 161 (80.5%) | 39 (19.5%) |
| Life, Physical & Social Science | 8 (28.6%) | 20 (71.4%) |
| Community & Social Service | 468 (44.0%) | 595 (56.0%) |
| Education, Arts & Media | 27 (17.5%) | 127 (82.5%) |
| Legal Services & Support | 113 (75.8%) | 36 (24.2%) |
| Education Instruction & Library | 271 (40.6%) | 397 (59.4%) |
| Arts, Media & Entertainment | 57 (62.0%) | 35 (38.0%) |
| Health Diagnosing & Treating | 112 (33.6%) | 221 (66.4%) |
| Health Technologists | 38 (17.5%) | 179 (82.5%) |
| Total (Category) | 1,509 (53.0%) | 1,336 (47.0%) |
| Total (Overall) | 3,172 (57.4%) | 2,358 (42.6%) |
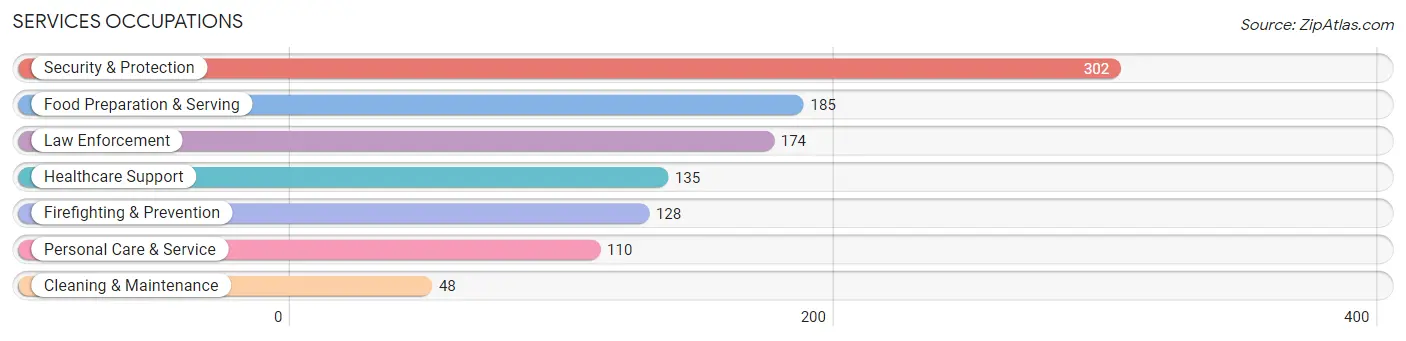
Services Occupations
The most common Services occupations in South Huntington are Security & Protection (302 | 5.5%), Food Preparation & Serving (185 | 3.4%), Law Enforcement (174 | 3.2%), Healthcare Support (135 | 2.4%), and Firefighting & Prevention (128 | 2.3%).
Services Occupations by Sex
Within the Services occupations in South Huntington, the most male-oriented occupations are Law Enforcement (100.0%), Security & Protection (96.0%), and Firefighting & Prevention (90.6%), while the most female-oriented occupations are Food Preparation & Serving (40.5%), Cleaning & Maintenance (14.6%), and Healthcare Support (13.3%).
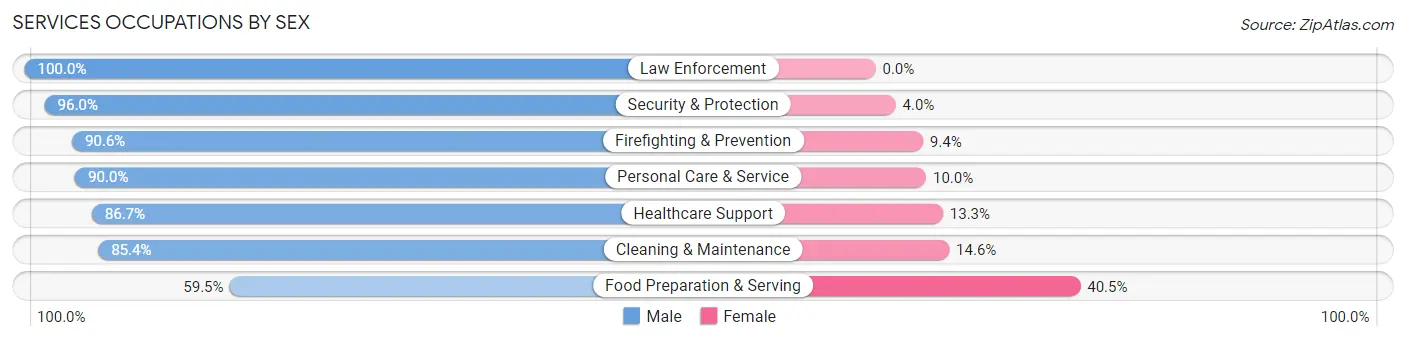
| Occupation | Male | Female |
| Healthcare Support | 117 (86.7%) | 18 (13.3%) |
| Security & Protection | 290 (96.0%) | 12 (4.0%) |
| Firefighting & Prevention | 116 (90.6%) | 12 (9.4%) |
| Law Enforcement | 174 (100.0%) | 0 (0.0%) |
| Food Preparation & Serving | 110 (59.5%) | 75 (40.5%) |
| Cleaning & Maintenance | 41 (85.4%) | 7 (14.6%) |
| Personal Care & Service | 99 (90.0%) | 11 (10.0%) |
| Total (Category) | 657 (84.2%) | 123 (15.8%) |
| Total (Overall) | 3,172 (57.4%) | 2,358 (42.6%) |
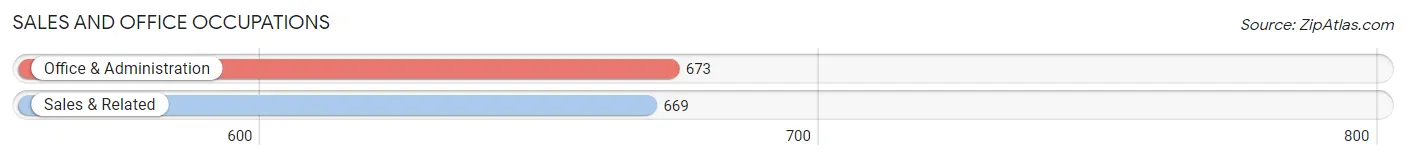
Sales and Office Occupations
The most common Sales and Office occupations in South Huntington are Office & Administration (673 | 12.2%), and Sales & Related (669 | 12.1%).
Sales and Office Occupations by Sex
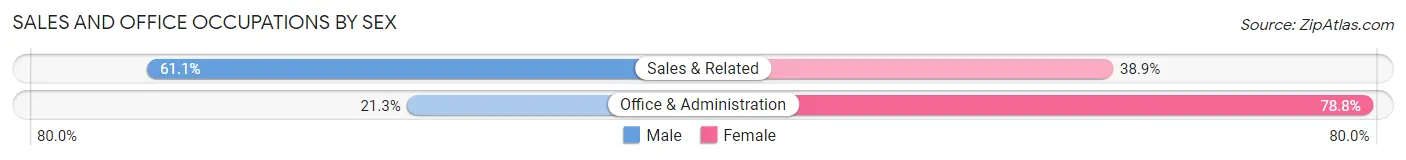
| Occupation | Male | Female |
| Sales & Related | 409 (61.1%) | 260 (38.9%) |
| Office & Administration | 143 (21.2%) | 530 (78.7%) |
| Total (Category) | 552 (41.1%) | 790 (58.9%) |
| Total (Overall) | 3,172 (57.4%) | 2,358 (42.6%) |
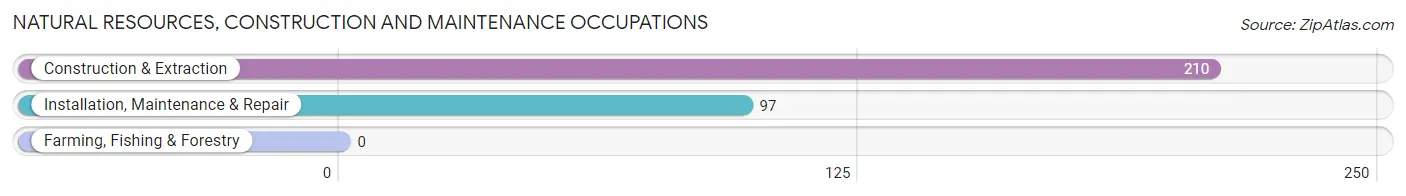
Natural Resources, Construction and Maintenance Occupations
The most common Natural Resources, Construction and Maintenance occupations in South Huntington are Construction & Extraction (210 | 3.8%), and Installation, Maintenance & Repair (97 | 1.8%).
Natural Resources, Construction and Maintenance Occupations by Sex
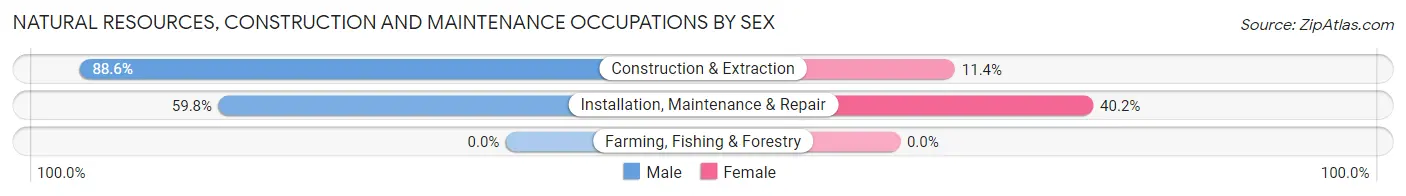
| Occupation | Male | Female |
| Farming, Fishing & Forestry | 0 (0.0%) | 0 (0.0%) |
| Construction & Extraction | 186 (88.6%) | 24 (11.4%) |
| Installation, Maintenance & Repair | 58 (59.8%) | 39 (40.2%) |
| Total (Category) | 244 (79.5%) | 63 (20.5%) |
| Total (Overall) | 3,172 (57.4%) | 2,358 (42.6%) |
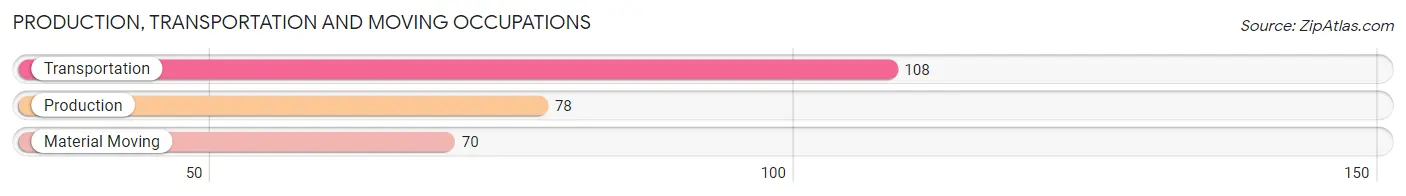
Production, Transportation and Moving Occupations
The most common Production, Transportation and Moving occupations in South Huntington are Transportation (108 | 1.9%), Production (78 | 1.4%), and Material Moving (70 | 1.3%).
Production, Transportation and Moving Occupations by Sex
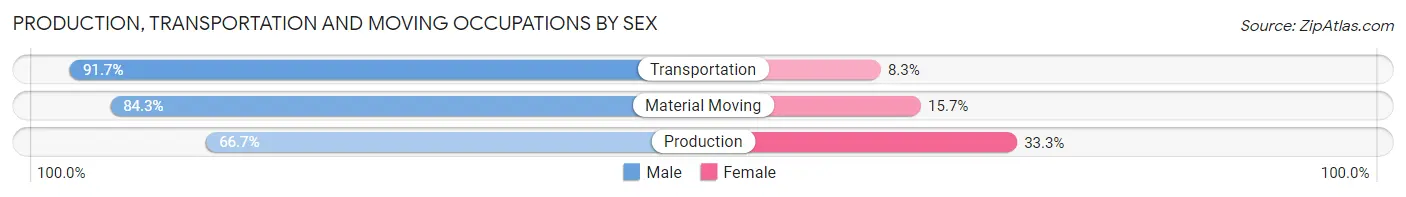
| Occupation | Male | Female |
| Production | 52 (66.7%) | 26 (33.3%) |
| Transportation | 99 (91.7%) | 9 (8.3%) |
| Material Moving | 59 (84.3%) | 11 (15.7%) |
| Total (Category) | 210 (82.0%) | 46 (18.0%) |
| Total (Overall) | 3,172 (57.4%) | 2,358 (42.6%) |
Employment Industries by Sex in South Huntington
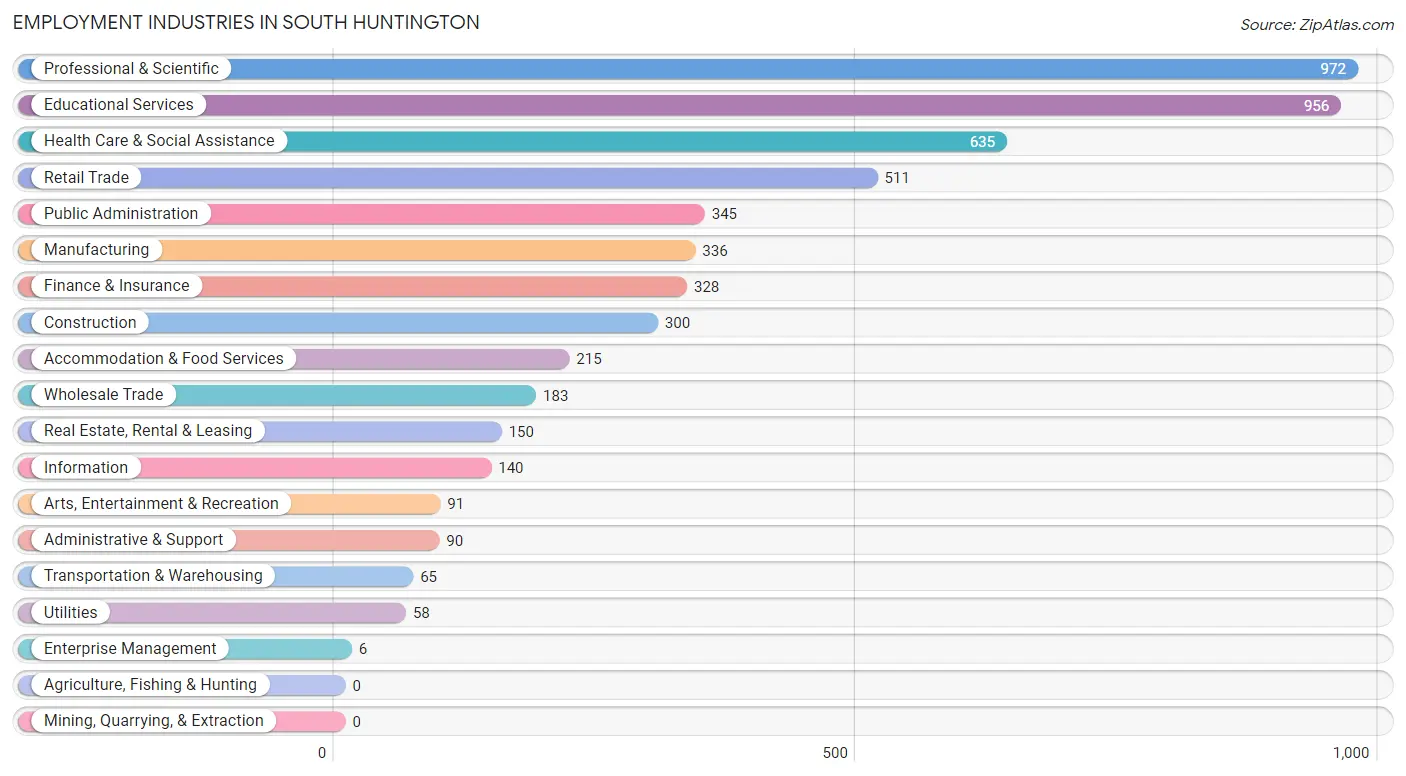
Employment Industries in South Huntington
The major employment industries in South Huntington include Professional & Scientific (972 | 17.6%), Educational Services (956 | 17.3%), Health Care & Social Assistance (635 | 11.5%), Retail Trade (511 | 9.2%), and Public Administration (345 | 6.2%).
Employment Industries by Sex in South Huntington
The South Huntington industries that see more men than women are Transportation & Warehousing (100.0%), Utilities (100.0%), and Enterprise Management (100.0%), whereas the industries that tend to have a higher number of women are Real Estate, Rental & Leasing (80.0%), Educational Services (59.8%), and Accommodation & Food Services (58.6%).
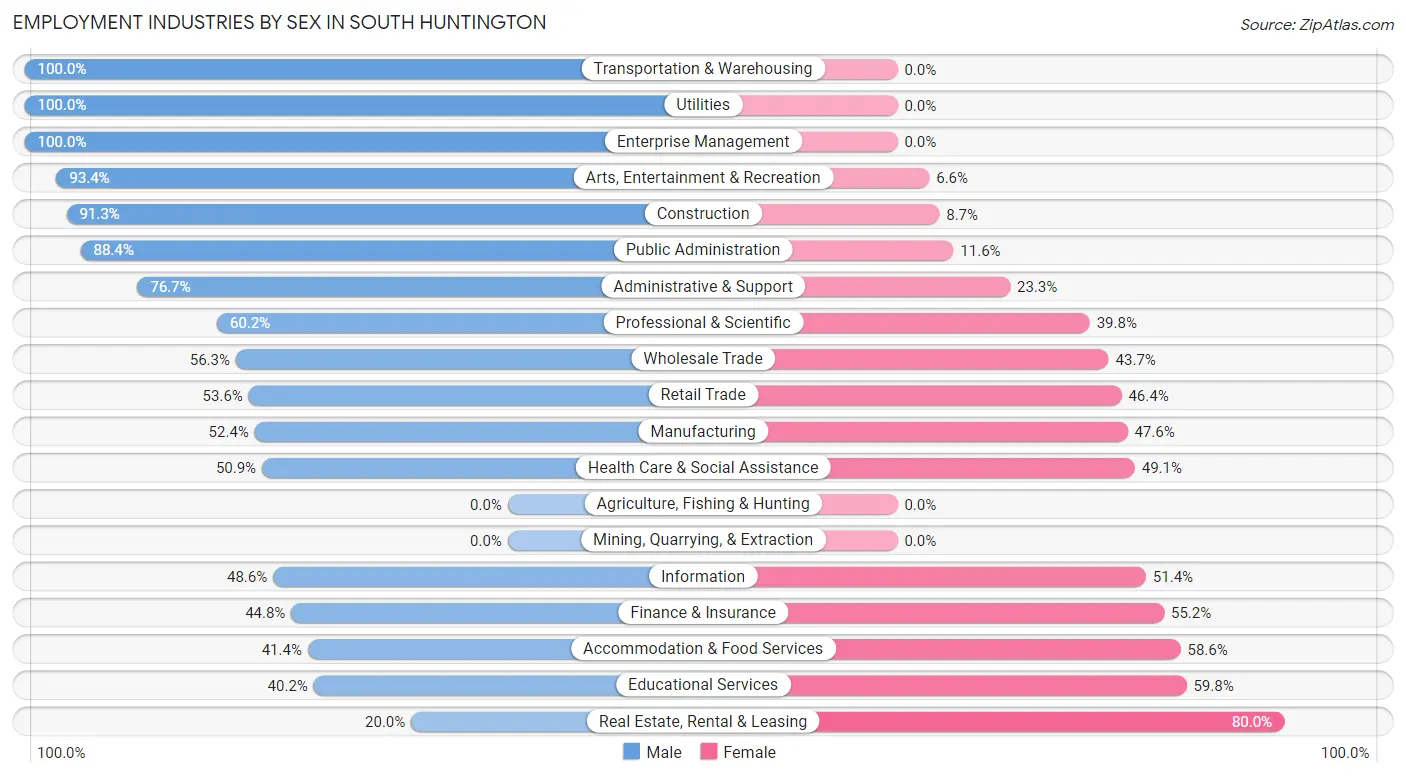
| Industry | Male | Female |
| Agriculture, Fishing & Hunting | 0 (0.0%) | 0 (0.0%) |
| Mining, Quarrying, & Extraction | 0 (0.0%) | 0 (0.0%) |
| Construction | 274 (91.3%) | 26 (8.7%) |
| Manufacturing | 176 (52.4%) | 160 (47.6%) |
| Wholesale Trade | 103 (56.3%) | 80 (43.7%) |
| Retail Trade | 274 (53.6%) | 237 (46.4%) |
| Transportation & Warehousing | 65 (100.0%) | 0 (0.0%) |
| Utilities | 58 (100.0%) | 0 (0.0%) |
| Information | 68 (48.6%) | 72 (51.4%) |
| Finance & Insurance | 147 (44.8%) | 181 (55.2%) |
| Real Estate, Rental & Leasing | 30 (20.0%) | 120 (80.0%) |
| Professional & Scientific | 585 (60.2%) | 387 (39.8%) |
| Enterprise Management | 6 (100.0%) | 0 (0.0%) |
| Administrative & Support | 69 (76.7%) | 21 (23.3%) |
| Educational Services | 384 (40.2%) | 572 (59.8%) |
| Health Care & Social Assistance | 323 (50.9%) | 312 (49.1%) |
| Arts, Entertainment & Recreation | 85 (93.4%) | 6 (6.6%) |
| Accommodation & Food Services | 89 (41.4%) | 126 (58.6%) |
| Public Administration | 305 (88.4%) | 40 (11.6%) |
| Total | 3,172 (57.4%) | 2,358 (42.6%) |
Education in South Huntington
School Enrollment in South Huntington
The most common levels of schooling among the 2,210 students in South Huntington are college / undergraduate (473 | 21.4%), middle school (458 | 20.7%), and high school (453 | 20.5%).
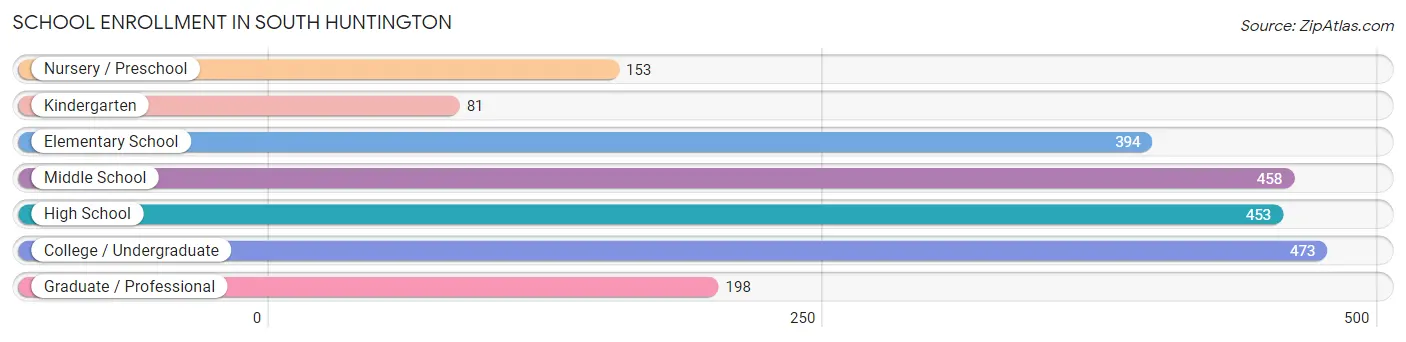
| School Level | # Students | % Students |
| Nursery / Preschool | 153 | 6.9% |
| Kindergarten | 81 | 3.7% |
| Elementary School | 394 | 17.8% |
| Middle School | 458 | 20.7% |
| High School | 453 | 20.5% |
| College / Undergraduate | 473 | 21.4% |
| Graduate / Professional | 198 | 9.0% |
| Total | 2,210 | 100.0% |
School Enrollment by Age by Funding Source in South Huntington
Out of a total of 2,210 students who are enrolled in schools in South Huntington, 572 (25.9%) attend a private institution, while the remaining 1,638 (74.1%) are enrolled in public schools. The age group of 35 years and over has the highest likelihood of being enrolled in private schools, with 80 (54.8% in the age bracket) enrolled. Conversely, the age group of 5 to 9 year old has the lowest likelihood of being enrolled in a private school, with 433 (90.6% in the age bracket) attending a public institution.
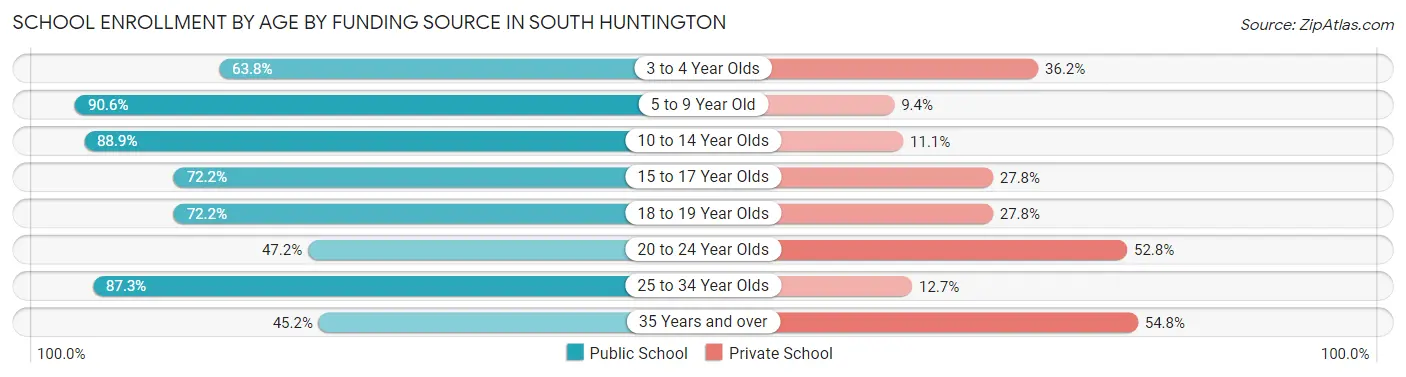
| Age Bracket | Public School | Private School |
| 3 to 4 Year Olds | 81 (63.8%) | 46 (36.2%) |
| 5 to 9 Year Old | 433 (90.6%) | 45 (9.4%) |
| 10 to 14 Year Olds | 506 (88.9%) | 63 (11.1%) |
| 15 to 17 Year Olds | 265 (72.2%) | 102 (27.8%) |
| 18 to 19 Year Olds | 52 (72.2%) | 20 (27.8%) |
| 20 to 24 Year Olds | 187 (47.2%) | 209 (52.8%) |
| 25 to 34 Year Olds | 48 (87.3%) | 7 (12.7%) |
| 35 Years and over | 66 (45.2%) | 80 (54.8%) |
| Total | 1,638 (74.1%) | 572 (25.9%) |
Educational Attainment by Field of Study in South Huntington
Business (1,007 | 22.9%), social sciences (737 | 16.7%), science & technology (573 | 13.0%), education (485 | 11.0%), and engineering (250 | 5.7%) are the most common fields of study among 4,405 individuals in South Huntington who have obtained a bachelor's degree or higher.
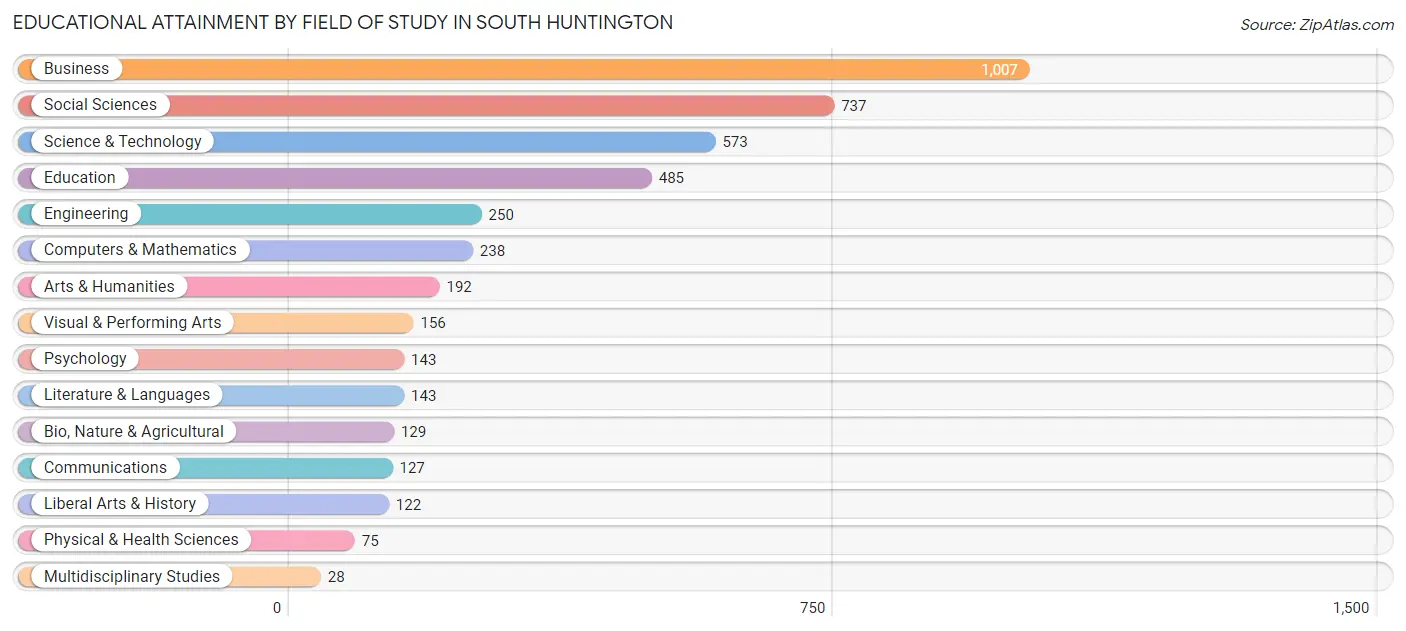
| Field of Study | # Graduates | % Graduates |
| Computers & Mathematics | 238 | 5.4% |
| Bio, Nature & Agricultural | 129 | 2.9% |
| Physical & Health Sciences | 75 | 1.7% |
| Psychology | 143 | 3.3% |
| Social Sciences | 737 | 16.7% |
| Engineering | 250 | 5.7% |
| Multidisciplinary Studies | 28 | 0.6% |
| Science & Technology | 573 | 13.0% |
| Business | 1,007 | 22.9% |
| Education | 485 | 11.0% |
| Literature & Languages | 143 | 3.3% |
| Liberal Arts & History | 122 | 2.8% |
| Visual & Performing Arts | 156 | 3.5% |
| Communications | 127 | 2.9% |
| Arts & Humanities | 192 | 4.4% |
| Total | 4,405 | 100.0% |
Transportation & Commute in South Huntington
Vehicle Availability by Sex in South Huntington
The most prevalent vehicle ownership categories in South Huntington are males with 2 vehicles (1,365, accounting for 43.4%) and females with 2 vehicles (1,115, making up 59.1%).
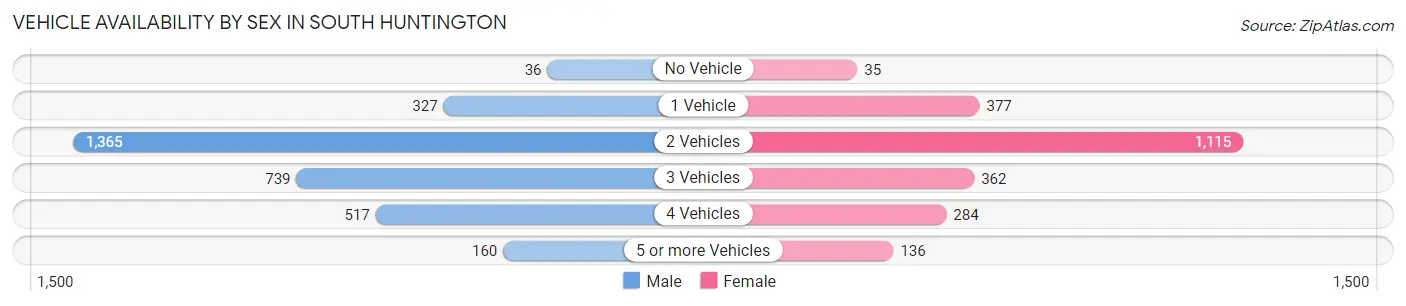
| Vehicles Available | Male | Female |
| No Vehicle | 36 (1.1%) | 35 (1.5%) |
| 1 Vehicle | 327 (10.4%) | 377 (16.3%) |
| 2 Vehicles | 1,365 (43.4%) | 1,115 (48.3%) |
| 3 Vehicles | 739 (23.5%) | 362 (15.7%) |
| 4 Vehicles | 517 (16.4%) | 284 (12.3%) |
| 5 or more Vehicles | 160 (5.1%) | 136 (5.9%) |
| Total | 3,144 (100.0%) | 2,309 (100.0%) |
Commute Time in South Huntington
The most frequently occuring commute durations in South Huntington are 15 to 19 minutes (1,004 commuters, 20.9%), 30 to 34 minutes (606 commuters, 12.7%), and 10 to 14 minutes (459 commuters, 9.6%).
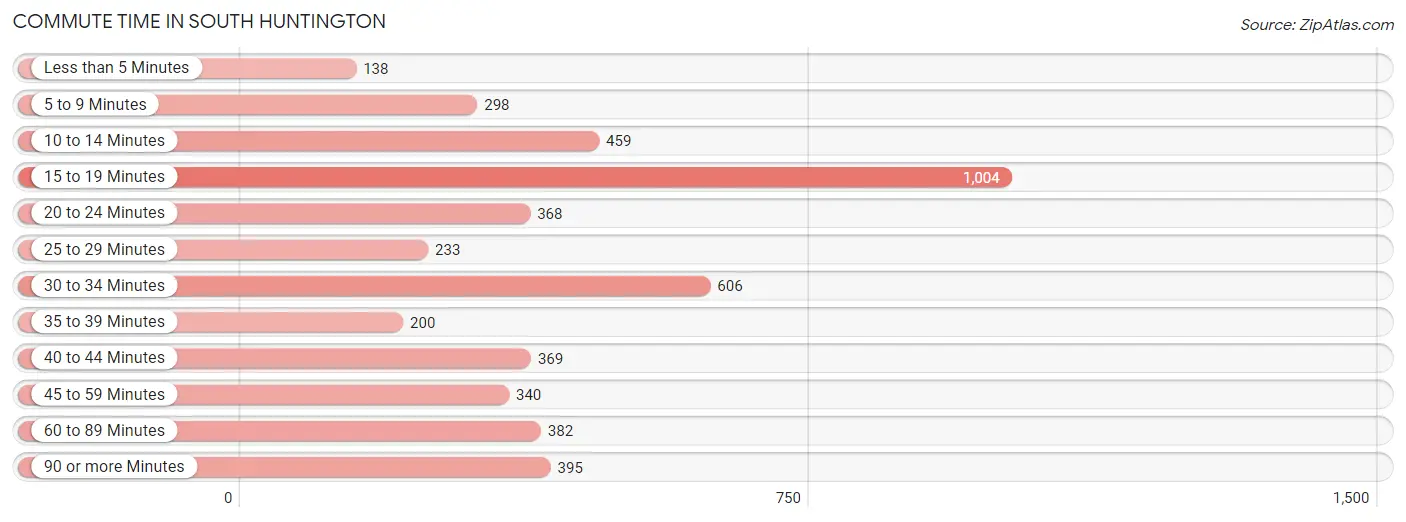
| Commute Time | # Commuters | % Commuters |
| Less than 5 Minutes | 138 | 2.9% |
| 5 to 9 Minutes | 298 | 6.2% |
| 10 to 14 Minutes | 459 | 9.6% |
| 15 to 19 Minutes | 1,004 | 20.9% |
| 20 to 24 Minutes | 368 | 7.7% |
| 25 to 29 Minutes | 233 | 4.9% |
| 30 to 34 Minutes | 606 | 12.7% |
| 35 to 39 Minutes | 200 | 4.2% |
| 40 to 44 Minutes | 369 | 7.7% |
| 45 to 59 Minutes | 340 | 7.1% |
| 60 to 89 Minutes | 382 | 8.0% |
| 90 or more Minutes | 395 | 8.2% |
Commute Time by Sex in South Huntington
The most common commute times in South Huntington are 15 to 19 minutes (558 commuters, 20.6%) for males and 15 to 19 minutes (446 commuters, 21.4%) for females.
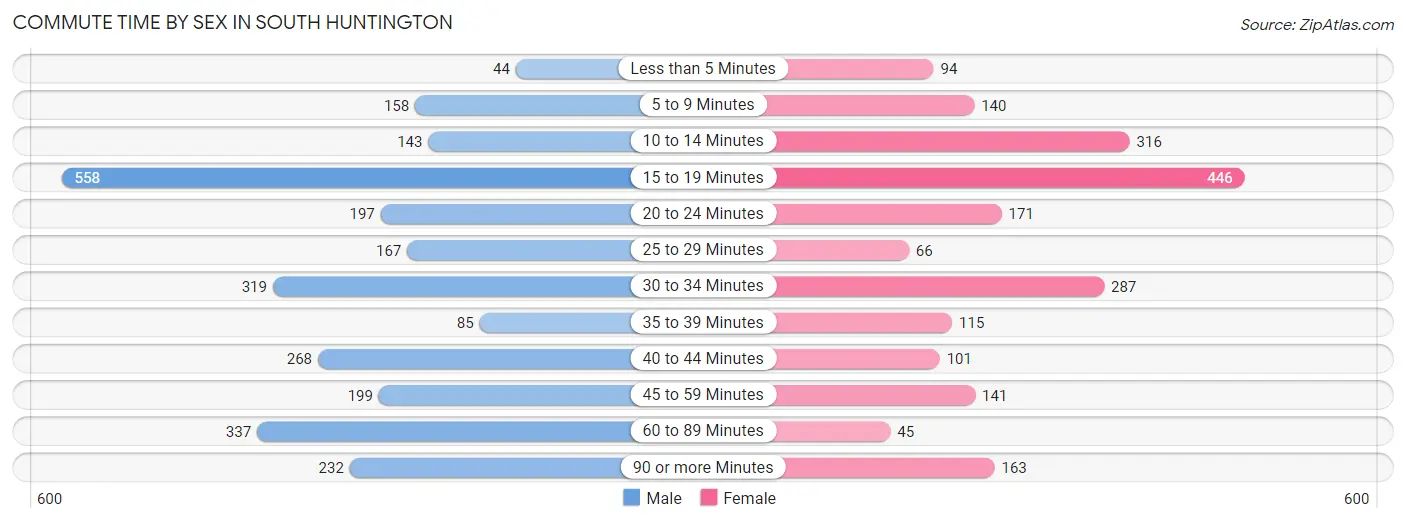
| Commute Time | Male | Female |
| Less than 5 Minutes | 44 (1.6%) | 94 (4.5%) |
| 5 to 9 Minutes | 158 (5.8%) | 140 (6.7%) |
| 10 to 14 Minutes | 143 (5.3%) | 316 (15.2%) |
| 15 to 19 Minutes | 558 (20.6%) | 446 (21.4%) |
| 20 to 24 Minutes | 197 (7.3%) | 171 (8.2%) |
| 25 to 29 Minutes | 167 (6.2%) | 66 (3.2%) |
| 30 to 34 Minutes | 319 (11.8%) | 287 (13.8%) |
| 35 to 39 Minutes | 85 (3.1%) | 115 (5.5%) |
| 40 to 44 Minutes | 268 (9.9%) | 101 (4.8%) |
| 45 to 59 Minutes | 199 (7.3%) | 141 (6.8%) |
| 60 to 89 Minutes | 337 (12.4%) | 45 (2.2%) |
| 90 or more Minutes | 232 (8.6%) | 163 (7.8%) |
Time of Departure to Work by Sex in South Huntington
The most frequent times of departure to work in South Huntington are 7:30 AM to 7:59 AM (341, 12.6%) for males and 8:00 AM to 8:29 AM (489, 23.4%) for females.
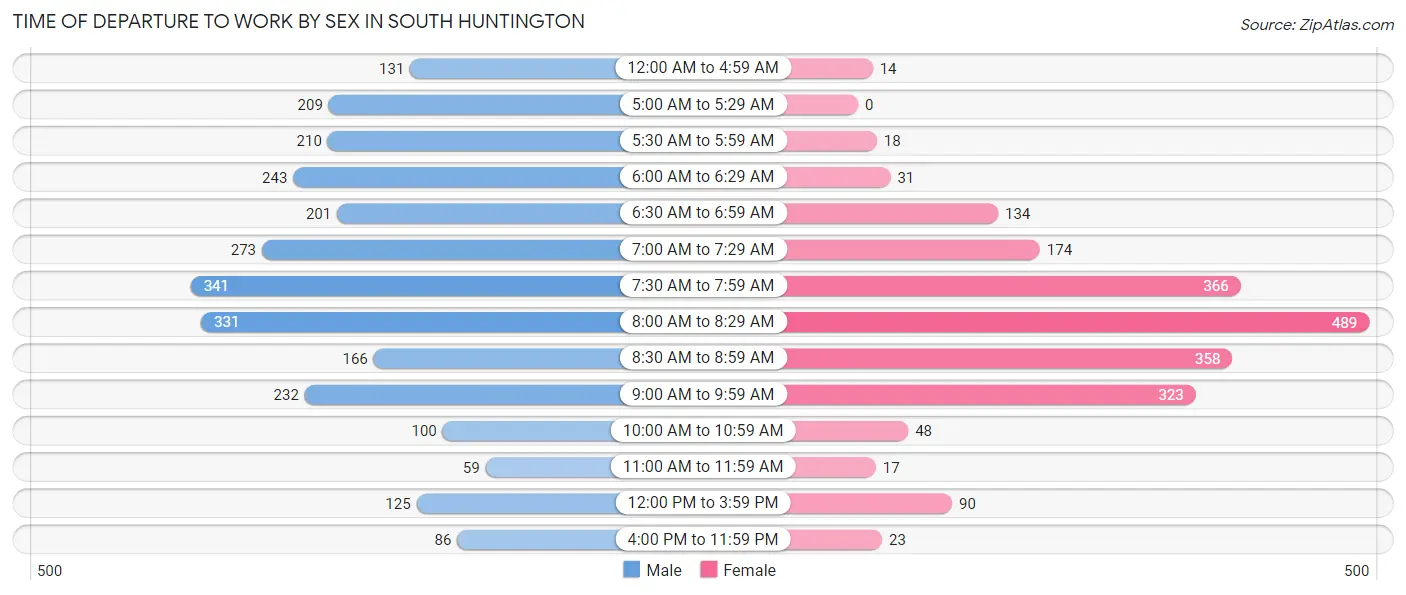
| Time of Departure | Male | Female |
| 12:00 AM to 4:59 AM | 131 (4.8%) | 14 (0.7%) |
| 5:00 AM to 5:29 AM | 209 (7.7%) | 0 (0.0%) |
| 5:30 AM to 5:59 AM | 210 (7.8%) | 18 (0.9%) |
| 6:00 AM to 6:29 AM | 243 (9.0%) | 31 (1.5%) |
| 6:30 AM to 6:59 AM | 201 (7.4%) | 134 (6.4%) |
| 7:00 AM to 7:29 AM | 273 (10.1%) | 174 (8.4%) |
| 7:30 AM to 7:59 AM | 341 (12.6%) | 366 (17.5%) |
| 8:00 AM to 8:29 AM | 331 (12.2%) | 489 (23.4%) |
| 8:30 AM to 8:59 AM | 166 (6.1%) | 358 (17.2%) |
| 9:00 AM to 9:59 AM | 232 (8.6%) | 323 (15.5%) |
| 10:00 AM to 10:59 AM | 100 (3.7%) | 48 (2.3%) |
| 11:00 AM to 11:59 AM | 59 (2.2%) | 17 (0.8%) |
| 12:00 PM to 3:59 PM | 125 (4.6%) | 90 (4.3%) |
| 4:00 PM to 11:59 PM | 86 (3.2%) | 23 (1.1%) |
| Total | 2,707 (100.0%) | 2,085 (100.0%) |
Housing Occupancy in South Huntington
Occupancy by Ownership in South Huntington
Of the total 3,454 dwellings in South Huntington, owner-occupied units account for 3,053 (88.4%), while renter-occupied units make up 401 (11.6%).
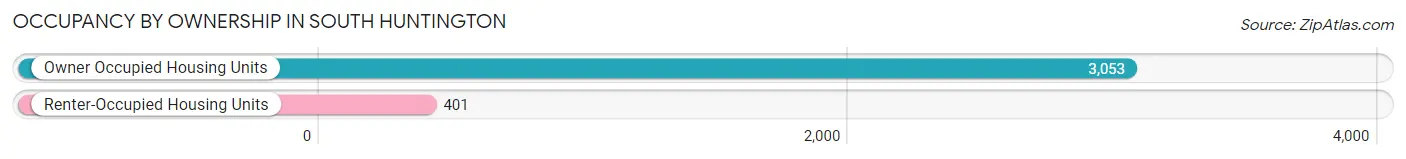
| Occupancy | # Housing Units | % Housing Units |
| Owner Occupied Housing Units | 3,053 | 88.4% |
| Renter-Occupied Housing Units | 401 | 11.6% |
| Total Occupied Housing Units | 3,454 | 100.0% |
Occupancy by Household Size in South Huntington
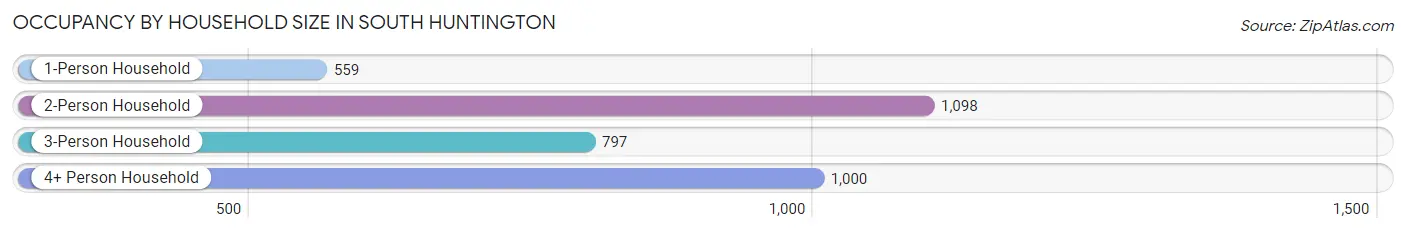
| Household Size | # Housing Units | % Housing Units |
| 1-Person Household | 559 | 16.2% |
| 2-Person Household | 1,098 | 31.8% |
| 3-Person Household | 797 | 23.1% |
| 4+ Person Household | 1,000 | 28.9% |
| Total Housing Units | 3,454 | 100.0% |
Occupancy by Ownership by Household Size in South Huntington
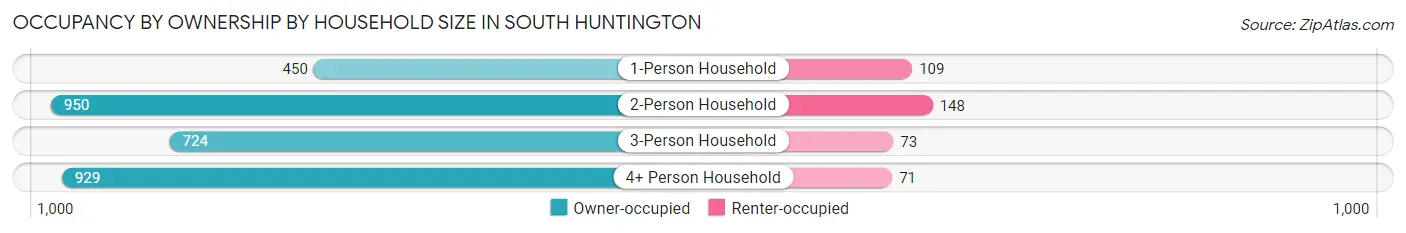
| Household Size | Owner-occupied | Renter-occupied |
| 1-Person Household | 450 (80.5%) | 109 (19.5%) |
| 2-Person Household | 950 (86.5%) | 148 (13.5%) |
| 3-Person Household | 724 (90.8%) | 73 (9.2%) |
| 4+ Person Household | 929 (92.9%) | 71 (7.1%) |
| Total Housing Units | 3,053 (88.4%) | 401 (11.6%) |
Occupancy by Educational Attainment in South Huntington
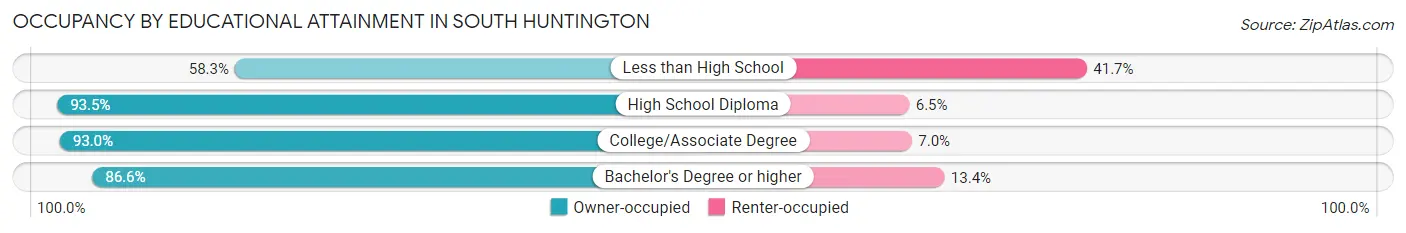
| Household Size | Owner-occupied | Renter-occupied |
| Less than High School | 49 (58.3%) | 35 (41.7%) |
| High School Diploma | 419 (93.5%) | 29 (6.5%) |
| College/Associate Degree | 800 (93.0%) | 60 (7.0%) |
| Bachelor's Degree or higher | 1,785 (86.6%) | 277 (13.4%) |
Occupancy by Age of Householder in South Huntington
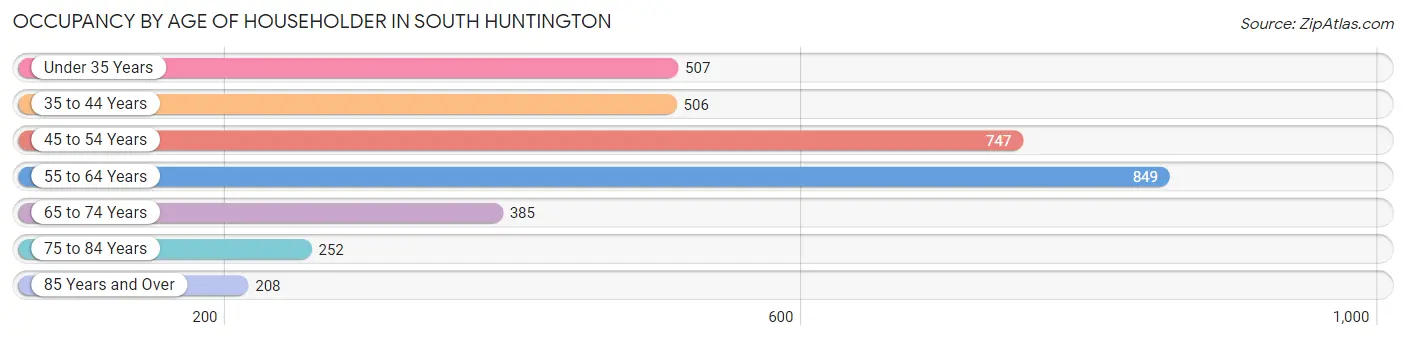
| Age Bracket | # Households | % Households |
| Under 35 Years | 507 | 14.7% |
| 35 to 44 Years | 506 | 14.6% |
| 45 to 54 Years | 747 | 21.6% |
| 55 to 64 Years | 849 | 24.6% |
| 65 to 74 Years | 385 | 11.2% |
| 75 to 84 Years | 252 | 7.3% |
| 85 Years and Over | 208 | 6.0% |
| Total | 3,454 | 100.0% |
Housing Finances in South Huntington
Median Income by Occupancy in South Huntington
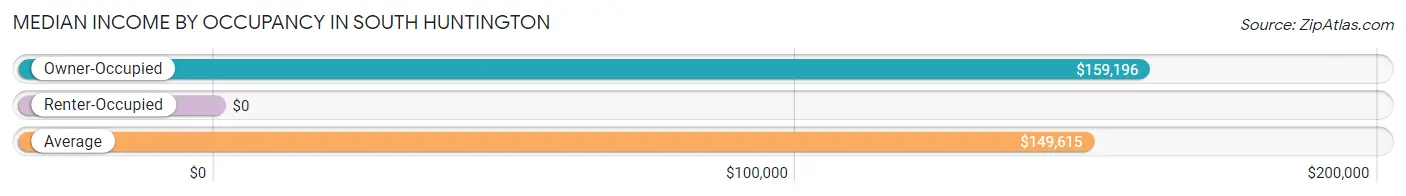
| Occupancy Type | # Households | Median Income |
| Owner-Occupied | 3,053 (88.4%) | $159,196 |
| Renter-Occupied | 401 (11.6%) | $0 |
| Average | 3,454 (100.0%) | $149,615 |
Occupancy by Householder Income Bracket in South Huntington
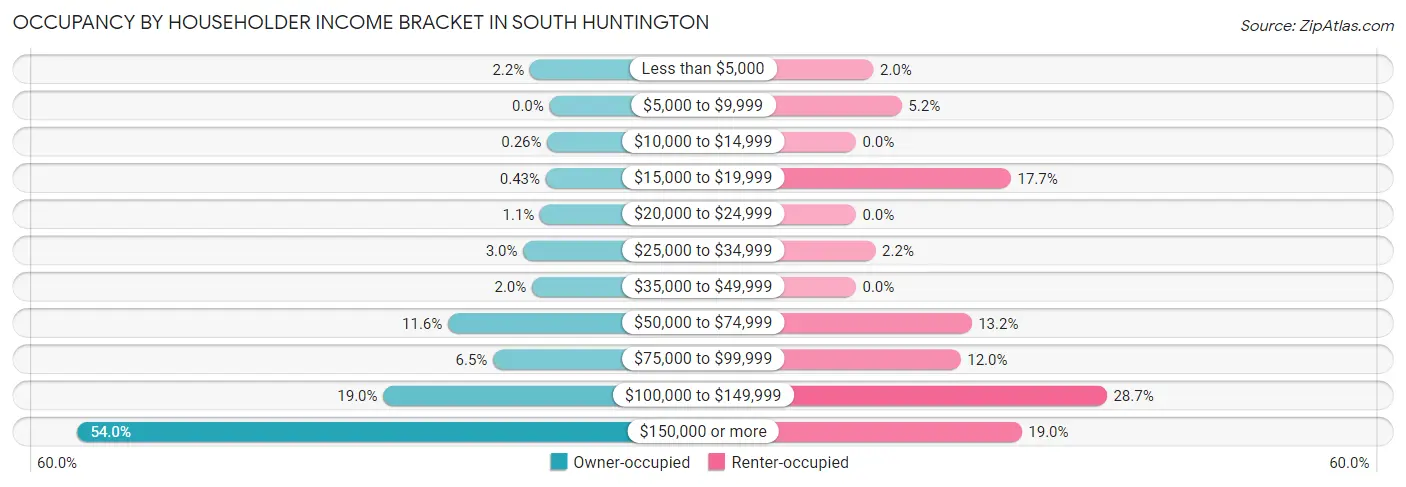
| Income Bracket | Owner-occupied | Renter-occupied |
| Less than $5,000 | 68 (2.2%) | 8 (2.0%) |
| $5,000 to $9,999 | 0 (0.0%) | 21 (5.2%) |
| $10,000 to $14,999 | 8 (0.3%) | 0 (0.0%) |
| $15,000 to $19,999 | 13 (0.4%) | 71 (17.7%) |
| $20,000 to $24,999 | 33 (1.1%) | 0 (0.0%) |
| $25,000 to $34,999 | 92 (3.0%) | 9 (2.2%) |
| $35,000 to $49,999 | 61 (2.0%) | 0 (0.0%) |
| $50,000 to $74,999 | 354 (11.6%) | 53 (13.2%) |
| $75,000 to $99,999 | 197 (6.5%) | 48 (12.0%) |
| $100,000 to $149,999 | 580 (19.0%) | 115 (28.7%) |
| $150,000 or more | 1,647 (53.9%) | 76 (19.0%) |
| Total | 3,053 (100.0%) | 401 (100.0%) |
Monthly Housing Cost Tiers in South Huntington
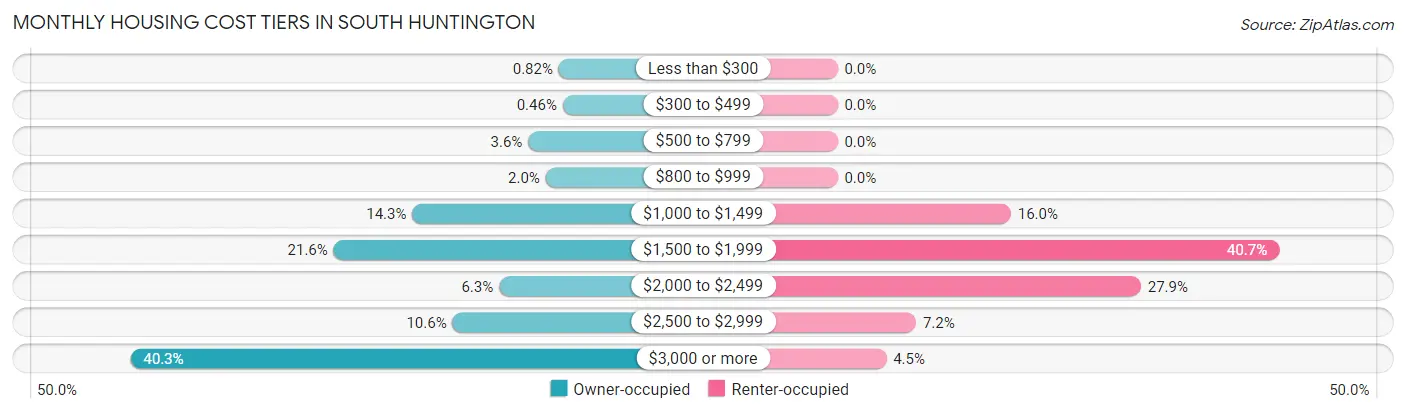
| Monthly Cost | Owner-occupied | Renter-occupied |
| Less than $300 | 25 (0.8%) | 0 (0.0%) |
| $300 to $499 | 14 (0.5%) | 0 (0.0%) |
| $500 to $799 | 111 (3.6%) | 0 (0.0%) |
| $800 to $999 | 62 (2.0%) | 0 (0.0%) |
| $1,000 to $1,499 | 437 (14.3%) | 64 (16.0%) |
| $1,500 to $1,999 | 658 (21.5%) | 163 (40.6%) |
| $2,000 to $2,499 | 193 (6.3%) | 112 (27.9%) |
| $2,500 to $2,999 | 324 (10.6%) | 29 (7.2%) |
| $3,000 or more | 1,229 (40.3%) | 18 (4.5%) |
| Total | 3,053 (100.0%) | 401 (100.0%) |
Physical Housing Characteristics in South Huntington
Housing Structures in South Huntington
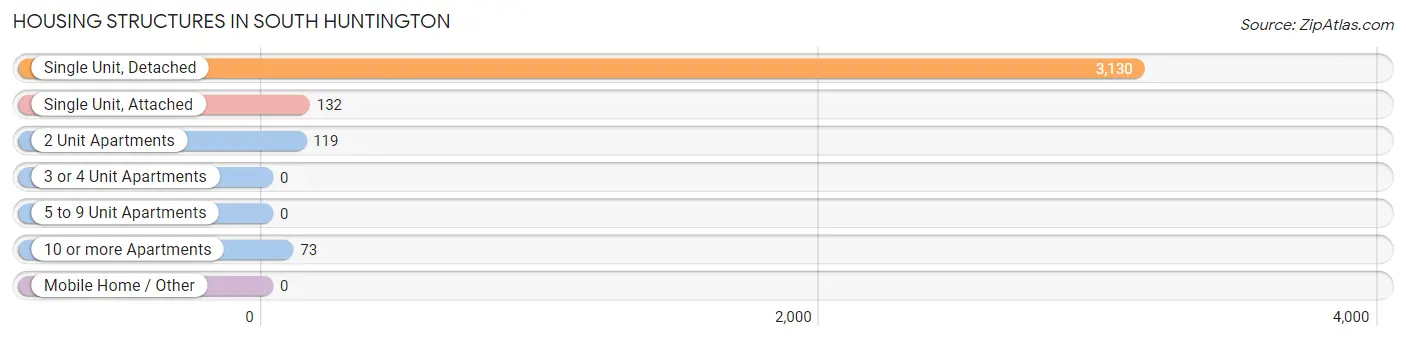
| Structure Type | # Housing Units | % Housing Units |
| Single Unit, Detached | 3,130 | 90.6% |
| Single Unit, Attached | 132 | 3.8% |
| 2 Unit Apartments | 119 | 3.5% |
| 3 or 4 Unit Apartments | 0 | 0.0% |
| 5 to 9 Unit Apartments | 0 | 0.0% |
| 10 or more Apartments | 73 | 2.1% |
| Mobile Home / Other | 0 | 0.0% |
| Total | 3,454 | 100.0% |
Housing Structures by Occupancy in South Huntington
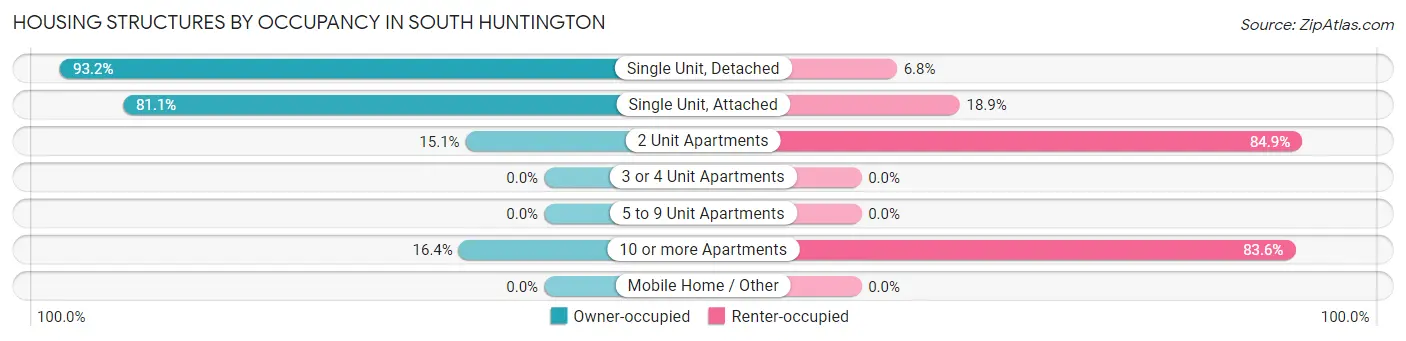
| Structure Type | Owner-occupied | Renter-occupied |
| Single Unit, Detached | 2,916 (93.2%) | 214 (6.8%) |
| Single Unit, Attached | 107 (81.1%) | 25 (18.9%) |
| 2 Unit Apartments | 18 (15.1%) | 101 (84.9%) |
| 3 or 4 Unit Apartments | 0 (0.0%) | 0 (0.0%) |
| 5 to 9 Unit Apartments | 0 (0.0%) | 0 (0.0%) |
| 10 or more Apartments | 12 (16.4%) | 61 (83.6%) |
| Mobile Home / Other | 0 (0.0%) | 0 (0.0%) |
| Total | 3,053 (88.4%) | 401 (11.6%) |
Housing Structures by Number of Rooms in South Huntington
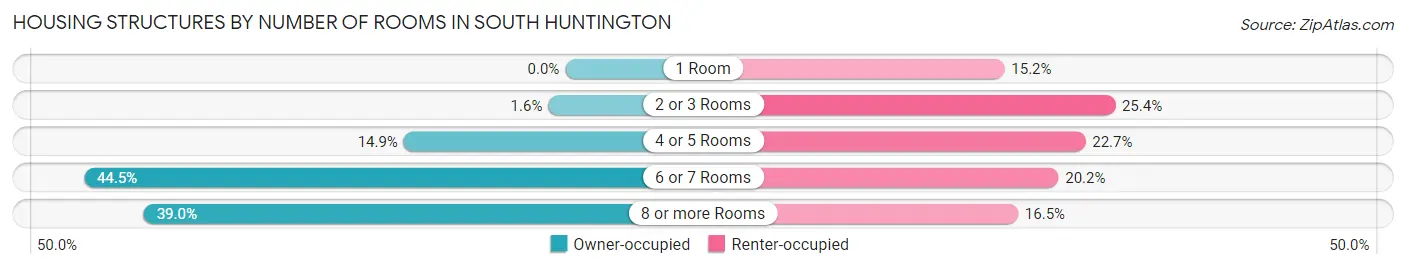
| Number of Rooms | Owner-occupied | Renter-occupied |
| 1 Room | 0 (0.0%) | 61 (15.2%) |
| 2 or 3 Rooms | 48 (1.6%) | 102 (25.4%) |
| 4 or 5 Rooms | 456 (14.9%) | 91 (22.7%) |
| 6 or 7 Rooms | 1,359 (44.5%) | 81 (20.2%) |
| 8 or more Rooms | 1,190 (39.0%) | 66 (16.5%) |
| Total | 3,053 (100.0%) | 401 (100.0%) |
Housing Structure by Heating Type in South Huntington
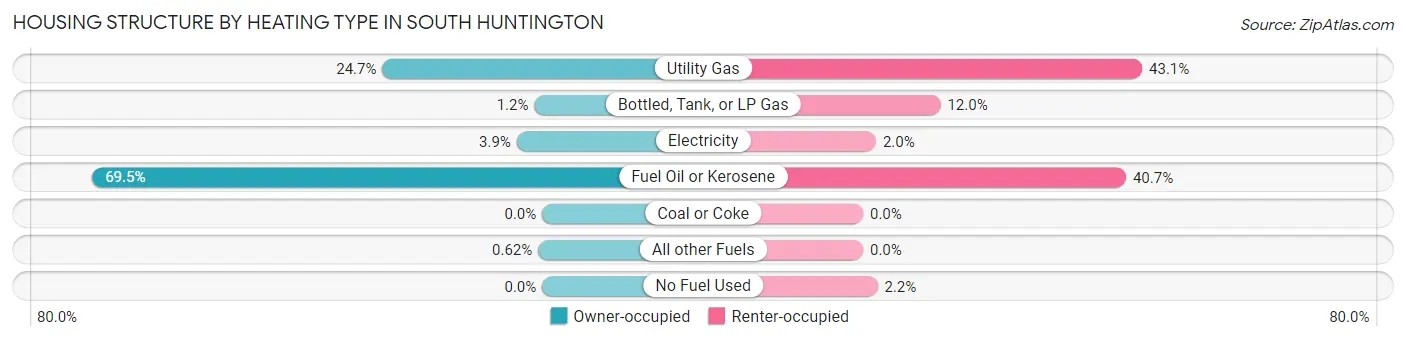
| Heating Type | Owner-occupied | Renter-occupied |
| Utility Gas | 754 (24.7%) | 173 (43.1%) |
| Bottled, Tank, or LP Gas | 37 (1.2%) | 48 (12.0%) |
| Electricity | 120 (3.9%) | 8 (2.0%) |
| Fuel Oil or Kerosene | 2,123 (69.5%) | 163 (40.6%) |
| Coal or Coke | 0 (0.0%) | 0 (0.0%) |
| All other Fuels | 19 (0.6%) | 0 (0.0%) |
| No Fuel Used | 0 (0.0%) | 9 (2.2%) |
| Total | 3,053 (100.0%) | 401 (100.0%) |
Household Vehicle Usage in South Huntington
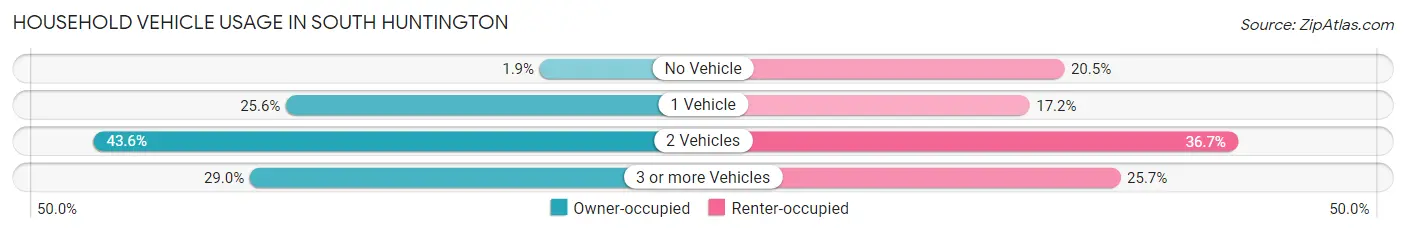
| Vehicles per Household | Owner-occupied | Renter-occupied |
| No Vehicle | 58 (1.9%) | 82 (20.4%) |
| 1 Vehicle | 781 (25.6%) | 69 (17.2%) |
| 2 Vehicles | 1,330 (43.6%) | 147 (36.7%) |
| 3 or more Vehicles | 884 (29.0%) | 103 (25.7%) |
| Total | 3,053 (100.0%) | 401 (100.0%) |
Real Estate & Mortgages in South Huntington
Real Estate and Mortgage Overview in South Huntington
| Characteristic | Without Mortgage | With Mortgage |
| Housing Units | 1,287 | 1,766 |
| Median Property Value | $515,000 | $606,800 |
| Median Household Income | $119,175 | $1,147 |
| Monthly Housing Costs | $1,501 | $1,218 |
| Real Estate Taxes | $10,001 | $26 |
Property Value by Mortgage Status in South Huntington
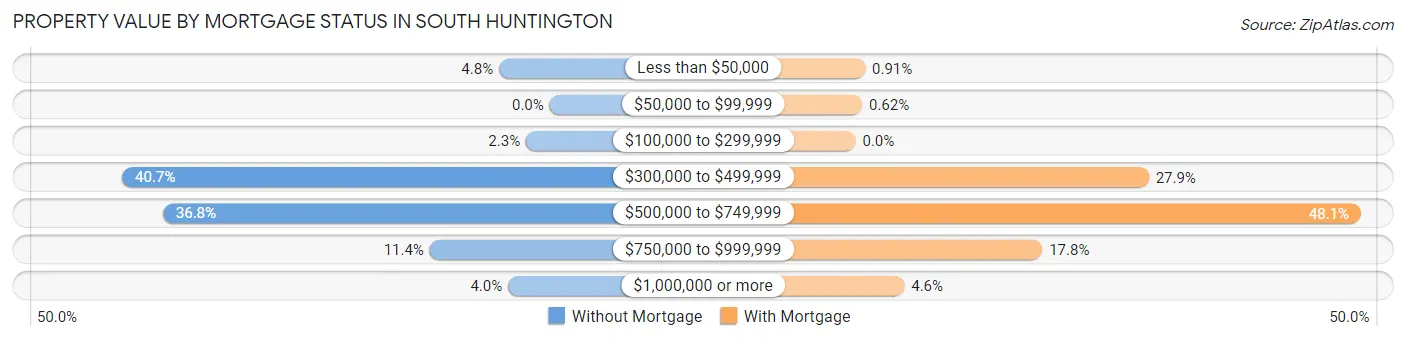
| Property Value | Without Mortgage | With Mortgage |
| Less than $50,000 | 62 (4.8%) | 16 (0.9%) |
| $50,000 to $99,999 | 0 (0.0%) | 11 (0.6%) |
| $100,000 to $299,999 | 29 (2.2%) | 0 (0.0%) |
| $300,000 to $499,999 | 524 (40.7%) | 493 (27.9%) |
| $500,000 to $749,999 | 474 (36.8%) | 850 (48.1%) |
| $750,000 to $999,999 | 147 (11.4%) | 314 (17.8%) |
| $1,000,000 or more | 51 (4.0%) | 82 (4.6%) |
| Total | 1,287 (100.0%) | 1,766 (100.0%) |
Household Income by Mortgage Status in South Huntington
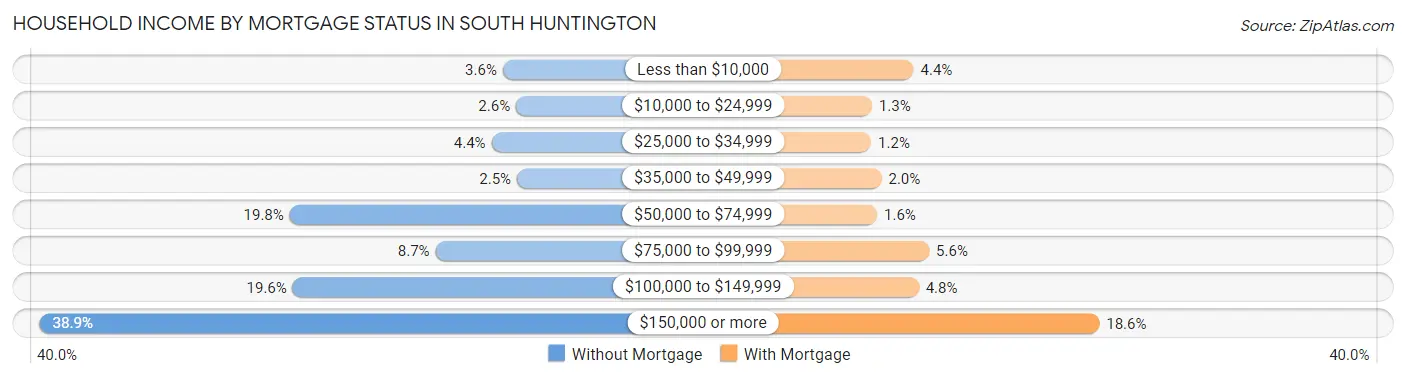
| Household Income | Without Mortgage | With Mortgage |
| Less than $10,000 | 46 (3.6%) | 78 (4.4%) |
| $10,000 to $24,999 | 33 (2.6%) | 22 (1.3%) |
| $25,000 to $34,999 | 57 (4.4%) | 21 (1.2%) |
| $35,000 to $49,999 | 32 (2.5%) | 35 (2.0%) |
| $50,000 to $74,999 | 255 (19.8%) | 29 (1.6%) |
| $75,000 to $99,999 | 112 (8.7%) | 99 (5.6%) |
| $100,000 to $149,999 | 252 (19.6%) | 85 (4.8%) |
| $150,000 or more | 500 (38.9%) | 328 (18.6%) |
| Total | 1,287 (100.0%) | 1,766 (100.0%) |
Property Value to Household Income Ratio in South Huntington
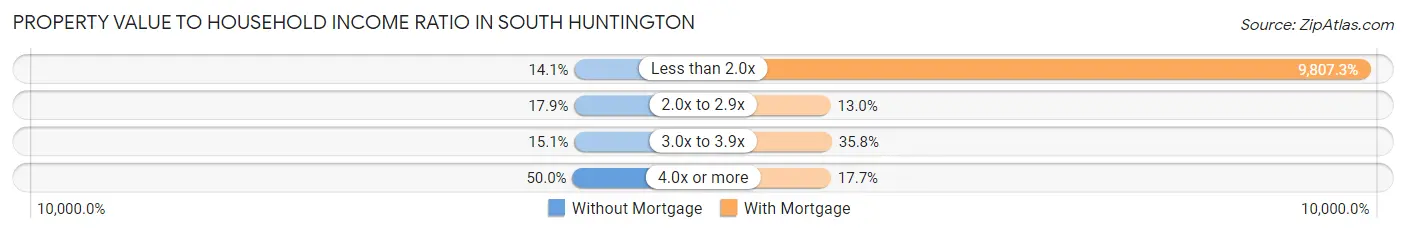
| Value-to-Income Ratio | Without Mortgage | With Mortgage |
| Less than 2.0x | 182 (14.1%) | 173,197 (9,807.3%) |
| 2.0x to 2.9x | 230 (17.9%) | 229 (13.0%) |
| 3.0x to 3.9x | 194 (15.1%) | 632 (35.8%) |
| 4.0x or more | 644 (50.0%) | 312 (17.7%) |
| Total | 1,287 (100.0%) | 1,766 (100.0%) |
Real Estate Taxes by Mortgage Status in South Huntington
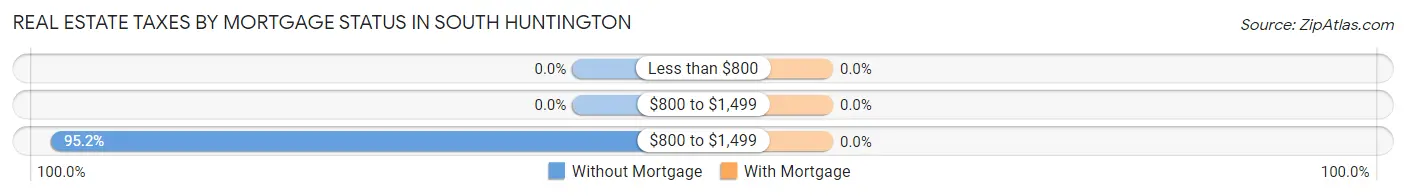
| Property Taxes | Without Mortgage | With Mortgage |
| Less than $800 | 0 (0.0%) | 0 (0.0%) |
| $800 to $1,499 | 0 (0.0%) | 0 (0.0%) |
| $800 to $1,499 | 1,225 (95.2%) | 0 (0.0%) |
| Total | 1,287 (100.0%) | 1,766 (100.0%) |
Health & Disability in South Huntington
Health Insurance Coverage by Age in South Huntington
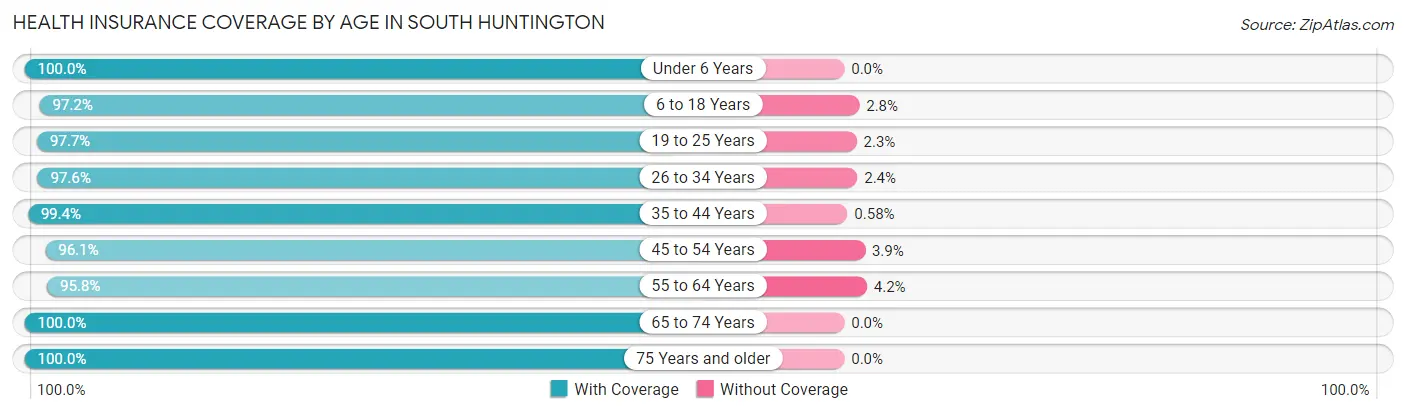
| Age Bracket | With Coverage | Without Coverage |
| Under 6 Years | 620 (100.0%) | 0 (0.0%) |
| 6 to 18 Years | 1,529 (97.2%) | 44 (2.8%) |
| 19 to 25 Years | 1,061 (97.7%) | 25 (2.3%) |
| 26 to 34 Years | 1,090 (97.6%) | 27 (2.4%) |
| 35 to 44 Years | 1,035 (99.4%) | 6 (0.6%) |
| 45 to 54 Years | 1,344 (96.1%) | 54 (3.9%) |
| 55 to 64 Years | 1,731 (95.8%) | 76 (4.2%) |
| 65 to 74 Years | 787 (100.0%) | 0 (0.0%) |
| 75 Years and older | 748 (100.0%) | 0 (0.0%) |
| Total | 9,945 (97.7%) | 232 (2.3%) |
Health Insurance Coverage by Citizenship Status in South Huntington
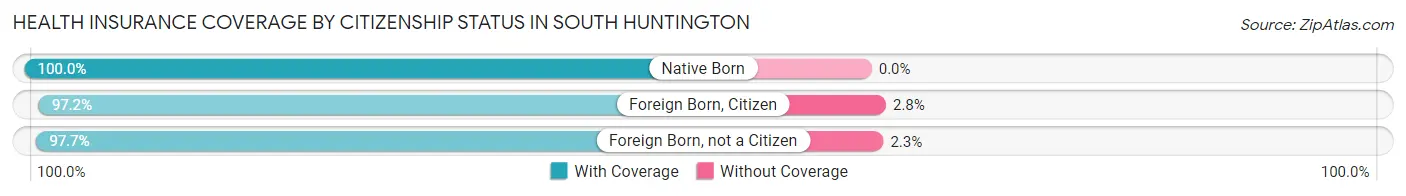
| Citizenship Status | With Coverage | Without Coverage |
| Native Born | 620 (100.0%) | 0 (0.0%) |
| Foreign Born, Citizen | 1,529 (97.2%) | 44 (2.8%) |
| Foreign Born, not a Citizen | 1,061 (97.7%) | 25 (2.3%) |
Health Insurance Coverage by Household Income in South Huntington
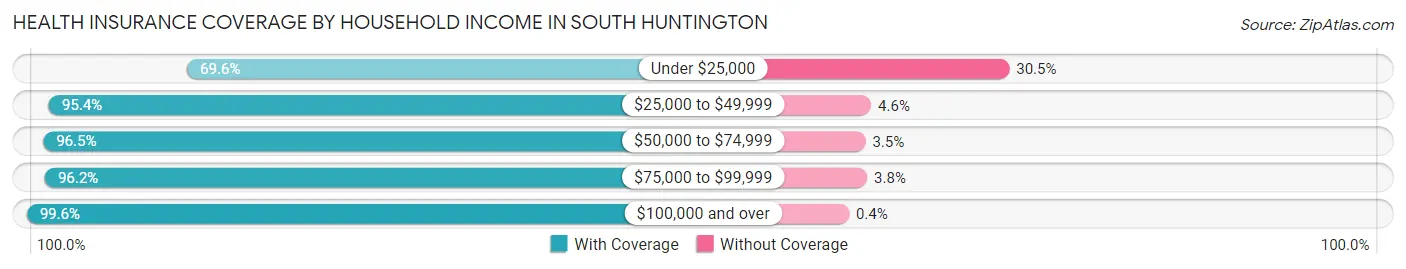
| Household Income | With Coverage | Without Coverage |
| Under $25,000 | 281 (69.6%) | 123 (30.4%) |
| $25,000 to $49,999 | 251 (95.4%) | 12 (4.6%) |
| $50,000 to $74,999 | 800 (96.5%) | 29 (3.5%) |
| $75,000 to $99,999 | 605 (96.2%) | 24 (3.8%) |
| $100,000 and over | 7,931 (99.6%) | 32 (0.4%) |
Public vs Private Health Insurance Coverage by Age in South Huntington
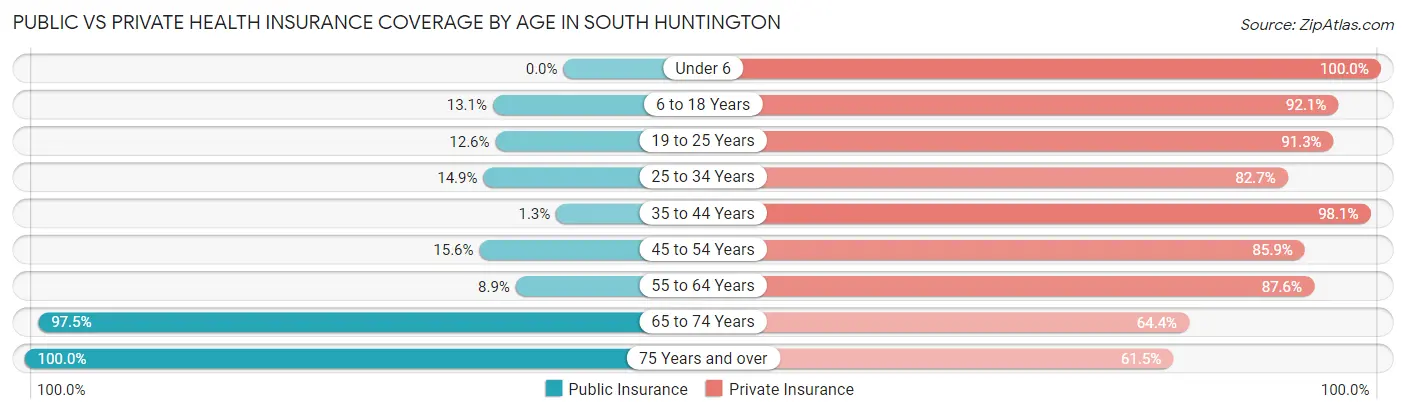
| Age Bracket | Public Insurance | Private Insurance |
| Under 6 | 0 (0.0%) | 620 (100.0%) |
| 6 to 18 Years | 206 (13.1%) | 1,449 (92.1%) |
| 19 to 25 Years | 137 (12.6%) | 991 (91.2%) |
| 25 to 34 Years | 166 (14.9%) | 924 (82.7%) |
| 35 to 44 Years | 14 (1.3%) | 1,021 (98.1%) |
| 45 to 54 Years | 218 (15.6%) | 1,201 (85.9%) |
| 55 to 64 Years | 160 (8.8%) | 1,583 (87.6%) |
| 65 to 74 Years | 767 (97.5%) | 507 (64.4%) |
| 75 Years and over | 748 (100.0%) | 460 (61.5%) |
| Total | 2,416 (23.7%) | 8,756 (86.0%) |
Disability Status by Sex by Age in South Huntington
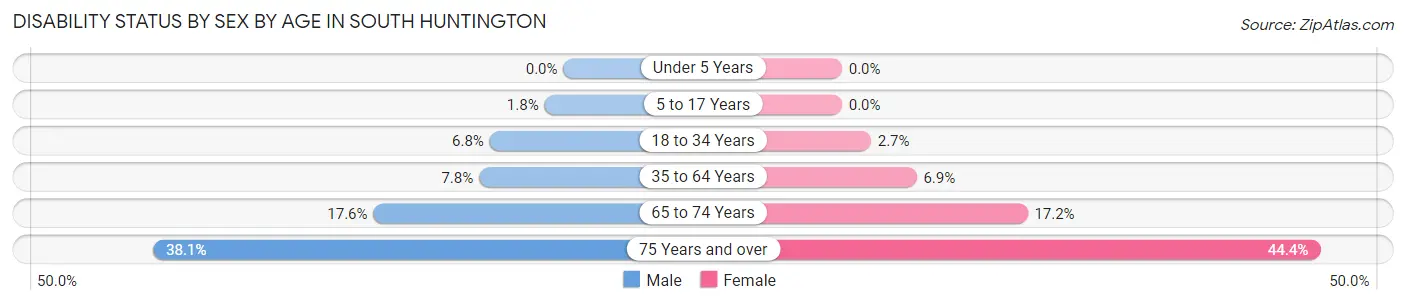
| Age Bracket | Male | Female |
| Under 5 Years | 0 (0.0%) | 0 (0.0%) |
| 5 to 17 Years | 14 (1.8%) | 0 (0.0%) |
| 18 to 34 Years | 87 (6.8%) | 27 (2.7%) |
| 35 to 64 Years | 173 (7.8%) | 141 (6.9%) |
| 65 to 74 Years | 61 (17.6%) | 76 (17.2%) |
| 75 Years and over | 139 (38.1%) | 170 (44.4%) |
Disability Class by Sex by Age in South Huntington
Disability Class: Hearing Difficulty
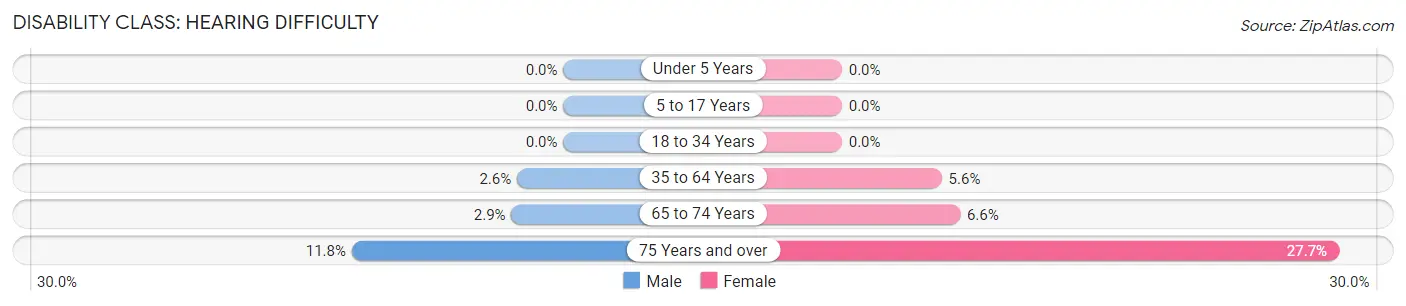
| Age Bracket | Male | Female |
| Under 5 Years | 0 (0.0%) | 0 (0.0%) |
| 5 to 17 Years | 0 (0.0%) | 0 (0.0%) |
| 18 to 34 Years | 0 (0.0%) | 0 (0.0%) |
| 35 to 64 Years | 57 (2.6%) | 113 (5.6%) |
| 65 to 74 Years | 10 (2.9%) | 29 (6.6%) |
| 75 Years and over | 43 (11.8%) | 106 (27.7%) |
Disability Class: Vision Difficulty
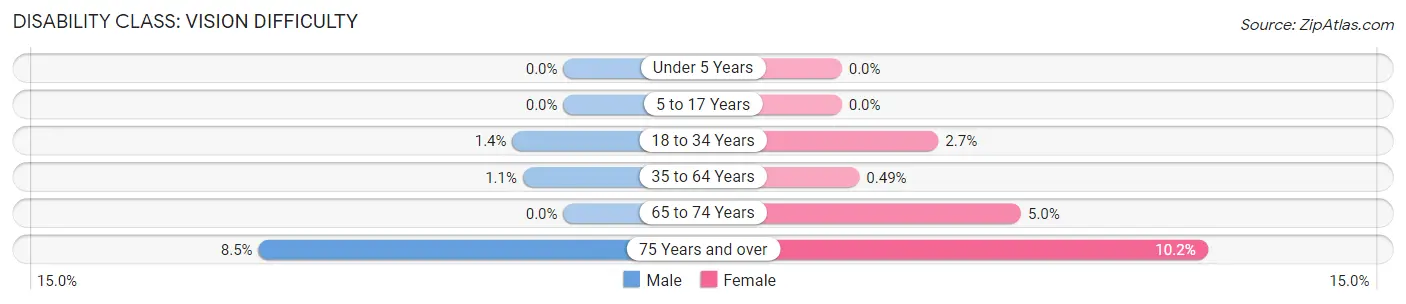
| Age Bracket | Male | Female |
| Under 5 Years | 0 (0.0%) | 0 (0.0%) |
| 5 to 17 Years | 0 (0.0%) | 0 (0.0%) |
| 18 to 34 Years | 18 (1.4%) | 27 (2.7%) |
| 35 to 64 Years | 25 (1.1%) | 10 (0.5%) |
| 65 to 74 Years | 0 (0.0%) | 22 (5.0%) |
| 75 Years and over | 31 (8.5%) | 39 (10.2%) |
Disability Class: Cognitive Difficulty
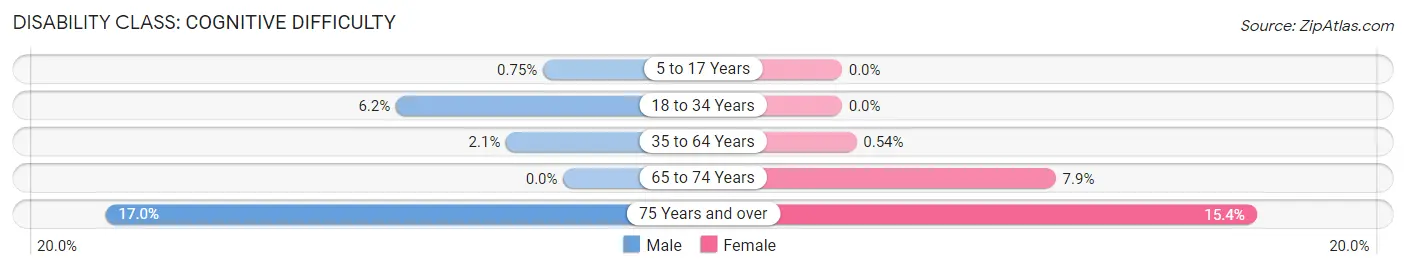
| Age Bracket | Male | Female |
| 5 to 17 Years | 6 (0.7%) | 0 (0.0%) |
| 18 to 34 Years | 79 (6.2%) | 0 (0.0%) |
| 35 to 64 Years | 47 (2.1%) | 11 (0.5%) |
| 65 to 74 Years | 0 (0.0%) | 35 (7.9%) |
| 75 Years and over | 62 (17.0%) | 59 (15.4%) |
Disability Class: Ambulatory Difficulty
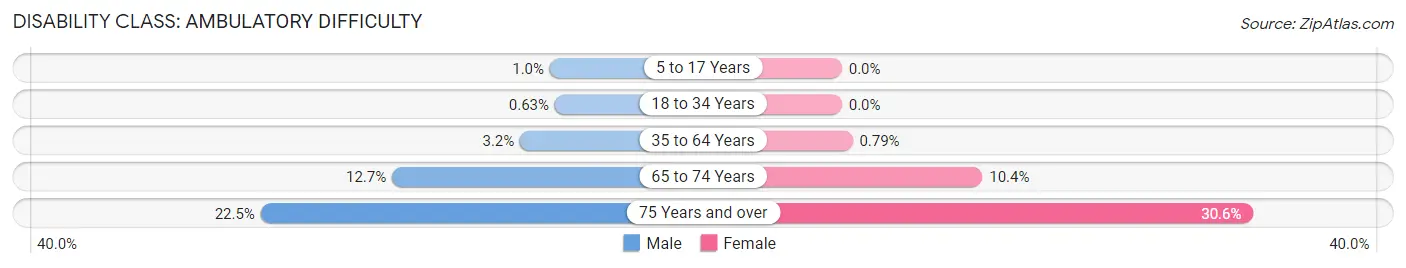
| Age Bracket | Male | Female |
| 5 to 17 Years | 8 (1.0%) | 0 (0.0%) |
| 18 to 34 Years | 8 (0.6%) | 0 (0.0%) |
| 35 to 64 Years | 71 (3.2%) | 16 (0.8%) |
| 65 to 74 Years | 44 (12.7%) | 46 (10.4%) |
| 75 Years and over | 82 (22.5%) | 117 (30.5%) |
Disability Class: Self-Care Difficulty
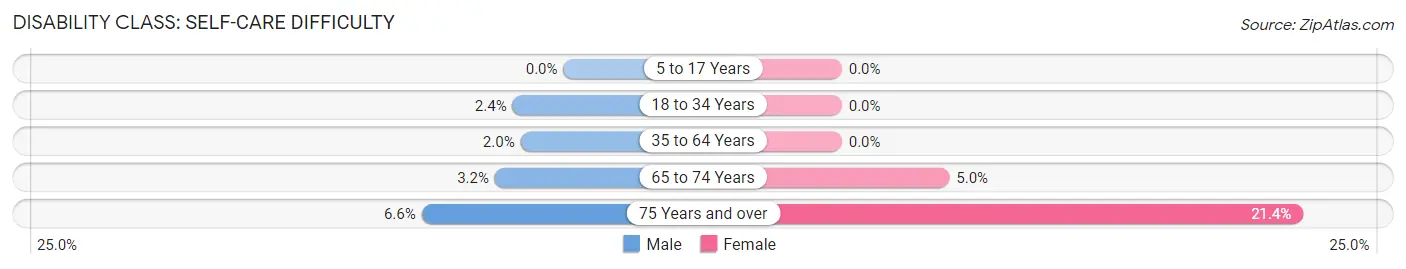
| Age Bracket | Male | Female |
| 5 to 17 Years | 0 (0.0%) | 0 (0.0%) |
| 18 to 34 Years | 30 (2.4%) | 0 (0.0%) |
| 35 to 64 Years | 44 (2.0%) | 0 (0.0%) |
| 65 to 74 Years | 11 (3.2%) | 22 (5.0%) |
| 75 Years and over | 24 (6.6%) | 82 (21.4%) |
Technology Access in South Huntington
Computing Device Access in South Huntington
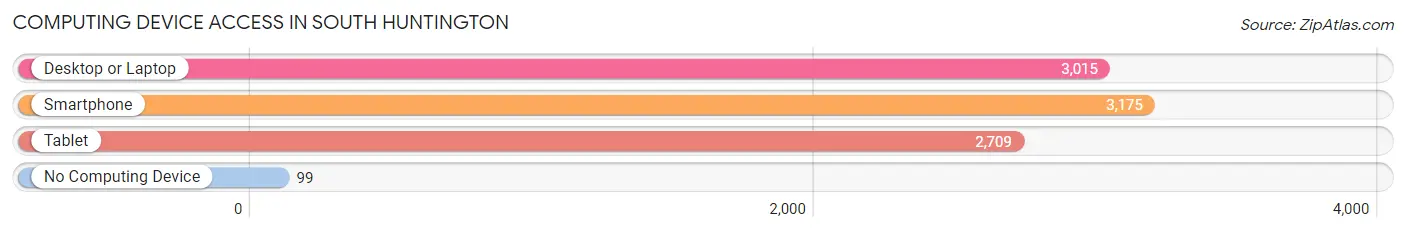
| Device Type | # Households | % Households |
| Desktop or Laptop | 3,015 | 87.3% |
| Smartphone | 3,175 | 91.9% |
| Tablet | 2,709 | 78.4% |
| No Computing Device | 99 | 2.9% |
| Total | 3,454 | 100.0% |
Internet Access in South Huntington
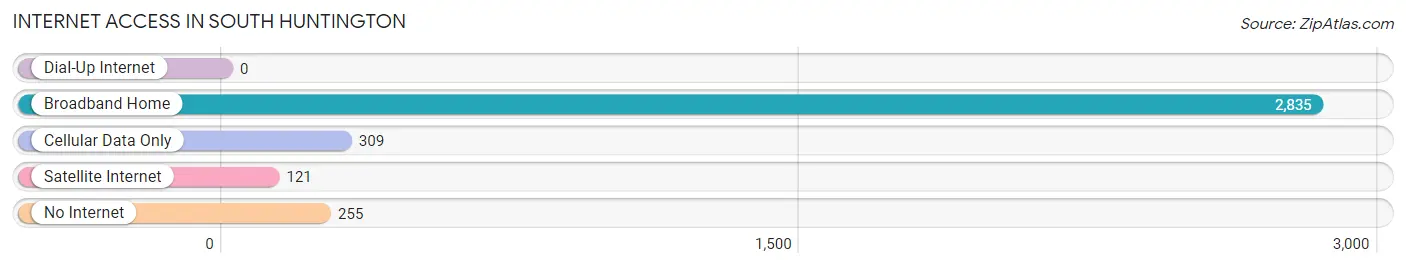
| Internet Type | # Households | % Households |
| Dial-Up Internet | 0 | 0.0% |
| Broadband Home | 2,835 | 82.1% |
| Cellular Data Only | 309 | 8.9% |
| Satellite Internet | 121 | 3.5% |
| No Internet | 255 | 7.4% |
| Total | 3,454 | 100.0% |
South Huntington Summary
History
South Huntington is a hamlet located in the Town of Huntington in Suffolk County, New York. It is located on the south shore of Long Island, approximately 40 miles east of New York City. The hamlet was originally part of the Town of Oyster Bay, which was established in 1653. In 1788, the Town of Huntington was created from parts of Oyster Bay and the Town of Smithtown. South Huntington was originally known as “Little Plains” and was part of the Town of Huntington until 1872, when it was incorporated as a separate village.
The hamlet was originally inhabited by the Matinecock Native American tribe. The first European settlers arrived in the area in the 1650s. The hamlet was primarily an agricultural community until the late 19th century, when it began to develop into a residential community. The hamlet was home to several large estates, including the estate of William K. Vanderbilt, which was located on the north side of Jericho Turnpike.
Geography
South Huntington is located in the Town of Huntington in Suffolk County, New York. It is located on the south shore of Long Island, approximately 40 miles east of New York City. The hamlet is bordered by the hamlets of Huntington Station to the west, Melville to the north, and Dix Hills to the east. The hamlet is located in the Huntington School District.
The hamlet is primarily a residential community, with a few commercial areas. The main commercial area is located along Jericho Turnpike, which runs through the center of the hamlet. The hamlet is also home to several parks, including South Huntington Park, which is located on the north side of Jericho Turnpike.
Economy
South Huntington is primarily a residential community, with a few commercial areas. The main commercial area is located along Jericho Turnpike, which runs through the center of the hamlet. The hamlet is home to several small businesses, including restaurants, retail stores, and professional services. The hamlet is also home to several corporate offices, including the headquarters of the Long Island Power Authority.
The hamlet is served by the Long Island Rail Road, which provides access to New York City and other parts of Long Island. The hamlet is also served by several bus routes, which provide access to other parts of Suffolk County.
Demographics
As of the 2010 census, South Huntington had a population of 17,351. The population was spread out, with 48.3% male and 51.7% female. The median age was 41.7 years. The racial makeup of the hamlet was 79.2% White, 8.2% African American, 0.2% Native American, 6.2% Asian, and 4.2% from other races. The median household income was $107,945.
South Huntington is a diverse community, with a variety of religious and cultural backgrounds. The hamlet is home to several churches, including the South Huntington United Methodist Church, the South Huntington Jewish Center, and the South Huntington Presbyterian Church. The hamlet is also home to several cultural organizations, including the South Huntington Arts Council and the South Huntington Historical Society.
Common Questions
What is Per Capita Income in South Huntington?
Per Capita income in South Huntington is $59,611.
What is the Median Family Income in South Huntington?
Median Family Income in South Huntington is $165,588.
What is the Median Household income in South Huntington?
Median Household Income in South Huntington is $149,615.
What is Income or Wage Gap in South Huntington?
Income or Wage Gap in South Huntington is 20.7%.
Women in South Huntington earn 79.3 cents for every dollar earned by a man.
What is Inequality or Gini Index in South Huntington?
Inequality or Gini Index in South Huntington is 0.37.
What is the Total Population of South Huntington?
Total Population of South Huntington is 10,307.
What is the Total Male Population of South Huntington?
Total Male Population of South Huntington is 5,162.
What is the Total Female Population of South Huntington?
Total Female Population of South Huntington is 5,145.
What is the Ratio of Males per 100 Females in South Huntington?
There are 100.33 Males per 100 Females in South Huntington.
What is the Ratio of Females per 100 Males in South Huntington?
There are 99.67 Females per 100 Males in South Huntington.
What is the Median Population Age in South Huntington?
Median Population Age in South Huntington is 42.9 Years.
What is the Average Family Size in South Huntington
Average Family Size in South Huntington is 3.2 People.
What is the Average Household Size in South Huntington
Average Household Size in South Huntington is 2.9 People.
How Large is the Labor Force in South Huntington?
There are 5,984 People in the Labor Forcein in South Huntington.
What is the Percentage of People in the Labor Force in South Huntington?
71.1% of People are in the Labor Force in South Huntington.
What is the Unemployment Rate in South Huntington?
Unemployment Rate in South Huntington is 7.6%.