East Farmingdale, NY Map & Demographics
East Farmingdale Map
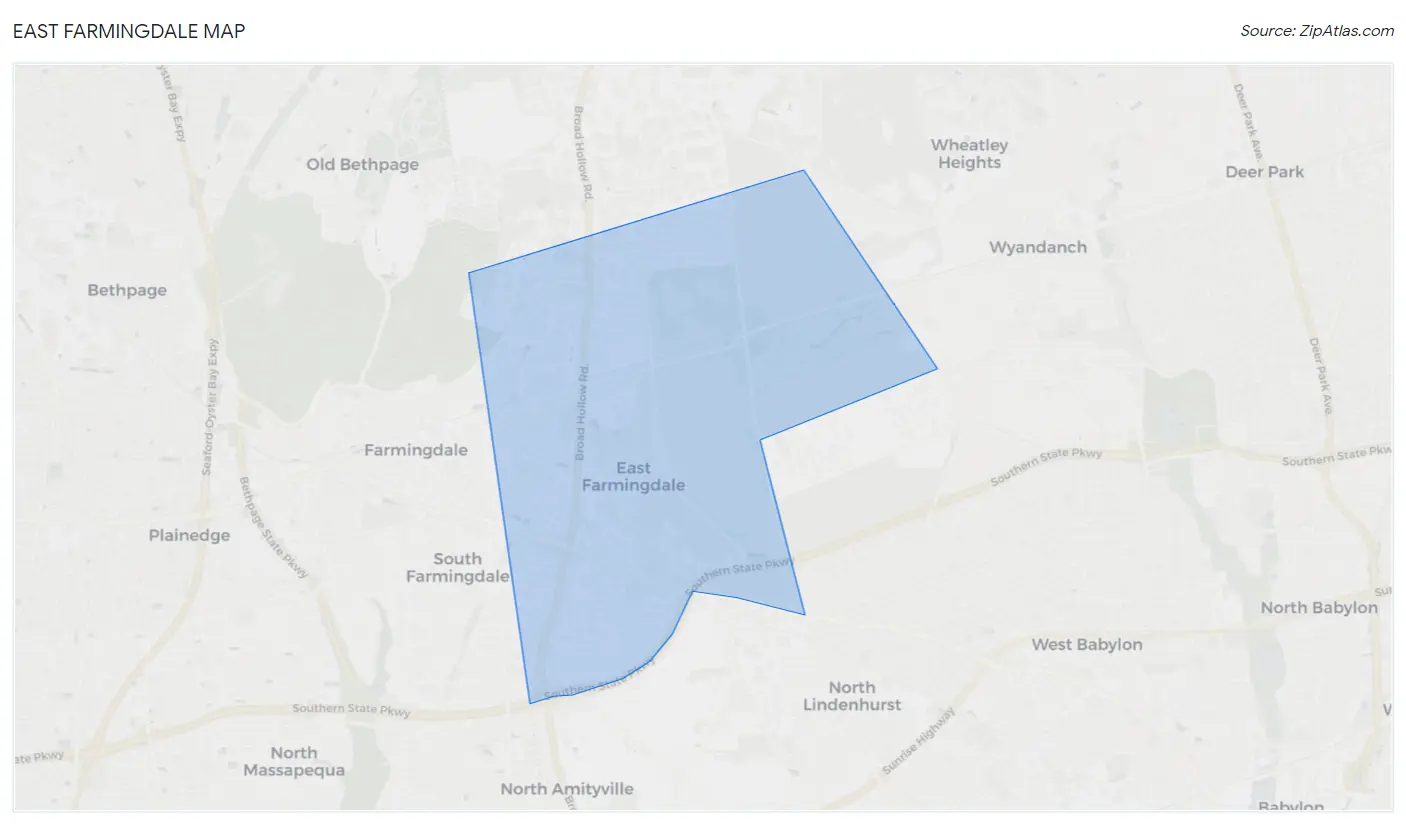
East Farmingdale Overview
$46,247
PER CAPITA INCOME
$122,875
AVG FAMILY INCOME
$102,965
AVG HOUSEHOLD INCOME
25.0%
WAGE / INCOME GAP [ % ]
75.0¢/ $1
WAGE / INCOME GAP [ $ ]
0.42
INEQUALITY / GINI INDEX
6,043
TOTAL POPULATION
3,121
MALE POPULATION
2,922
FEMALE POPULATION
106.81
MALES / 100 FEMALES
93.62
FEMALES / 100 MALES
32.9
MEDIAN AGE
3.5
AVG FAMILY SIZE
2.9
AVG HOUSEHOLD SIZE
3,375
LABOR FORCE [ PEOPLE ]
67.2%
PERCENT IN LABOR FORCE
7.7%
UNEMPLOYMENT RATE
Income in East Farmingdale
Income Overview in East Farmingdale
Per Capita Income in East Farmingdale is $46,247, while median incomes of families and households are $122,875 and $102,965 respectively.
| Characteristic | Number | Measure |
| Per Capita Income | 6,043 | $46,247 |
| Median Family Income | 1,359 | $122,875 |
| Mean Family Income | 1,359 | $159,411 |
| Median Household Income | 1,940 | $102,965 |
| Mean Household Income | 1,940 | $136,520 |
| Income Deficit | 1,359 | $0 |
| Wage / Income Gap (%) | 6,043 | 25.04% |
| Wage / Income Gap ($) | 6,043 | 74.96¢ per $1 |
| Gini / Inequality Index | 6,043 | 0.42 |
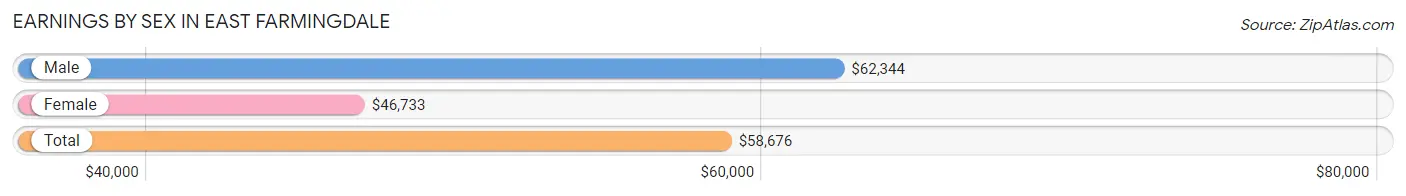
Earnings by Sex in East Farmingdale
Average Earnings in East Farmingdale are $58,676, $62,344 for men and $46,733 for women, a difference of 25.0%.
| Sex | Number | Average Earnings |
| Male | 1,973 (56.0%) | $62,344 |
| Female | 1,547 (44.0%) | $46,733 |
| Total | 3,520 (100.0%) | $58,676 |
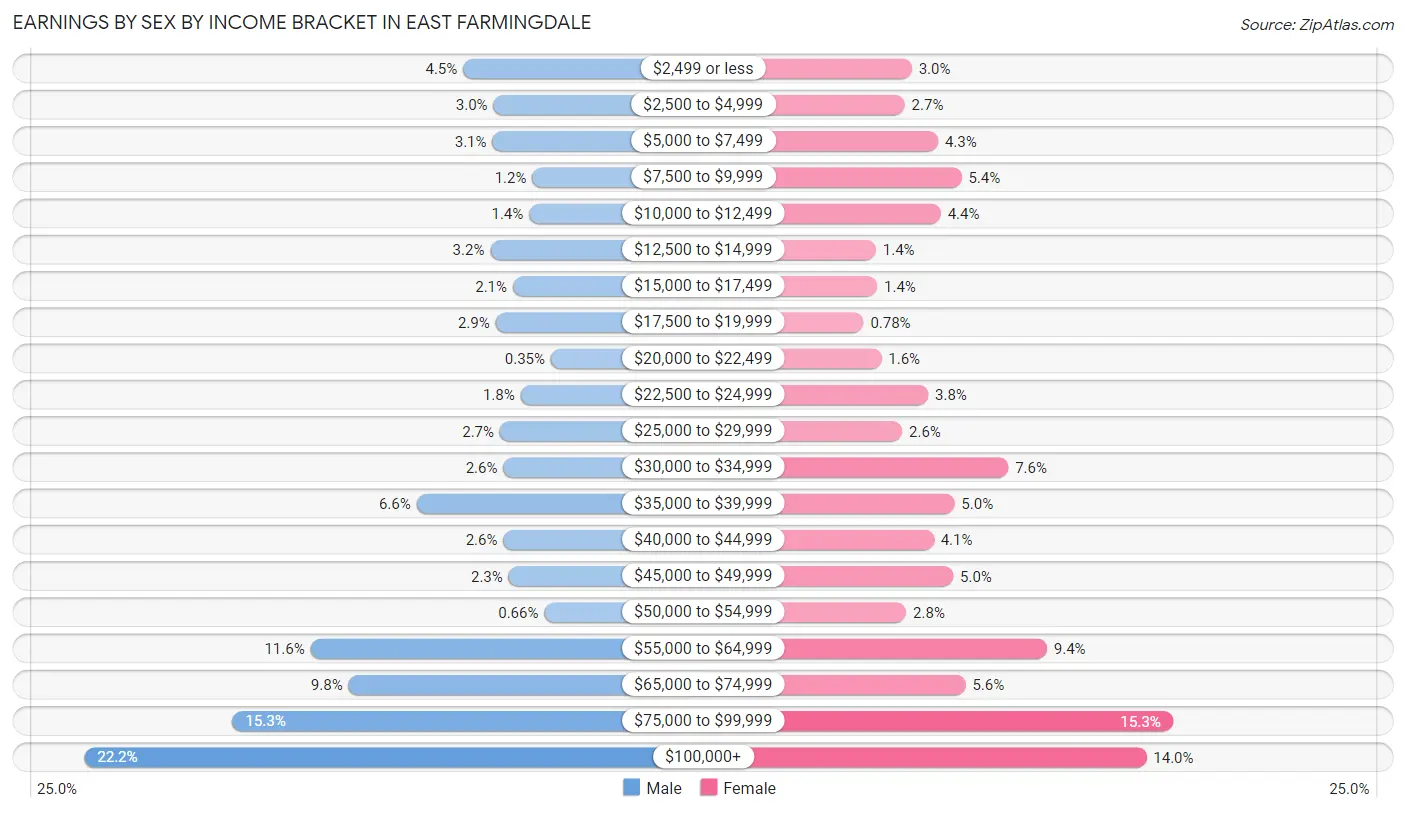
Earnings by Sex by Income Bracket in East Farmingdale
The most common earnings brackets in East Farmingdale are $100,000+ for men (438 | 22.2%) and $75,000 to $99,999 for women (236 | 15.3%).
| Income | Male | Female |
| $2,499 or less | 88 (4.5%) | 47 (3.0%) |
| $2,500 to $4,999 | 60 (3.0%) | 42 (2.7%) |
| $5,000 to $7,499 | 61 (3.1%) | 66 (4.3%) |
| $7,500 to $9,999 | 24 (1.2%) | 83 (5.4%) |
| $10,000 to $12,499 | 27 (1.4%) | 68 (4.4%) |
| $12,500 to $14,999 | 63 (3.2%) | 21 (1.4%) |
| $15,000 to $17,499 | 42 (2.1%) | 22 (1.4%) |
| $17,500 to $19,999 | 58 (2.9%) | 12 (0.8%) |
| $20,000 to $22,499 | 7 (0.4%) | 25 (1.6%) |
| $22,500 to $24,999 | 35 (1.8%) | 59 (3.8%) |
| $25,000 to $29,999 | 54 (2.7%) | 40 (2.6%) |
| $30,000 to $34,999 | 51 (2.6%) | 117 (7.6%) |
| $35,000 to $39,999 | 131 (6.6%) | 78 (5.0%) |
| $40,000 to $44,999 | 51 (2.6%) | 63 (4.1%) |
| $45,000 to $49,999 | 46 (2.3%) | 77 (5.0%) |
| $50,000 to $54,999 | 13 (0.7%) | 43 (2.8%) |
| $55,000 to $64,999 | 229 (11.6%) | 145 (9.4%) |
| $65,000 to $74,999 | 194 (9.8%) | 86 (5.6%) |
| $75,000 to $99,999 | 301 (15.3%) | 236 (15.3%) |
| $100,000+ | 438 (22.2%) | 217 (14.0%) |
| Total | 1,973 (100.0%) | 1,547 (100.0%) |
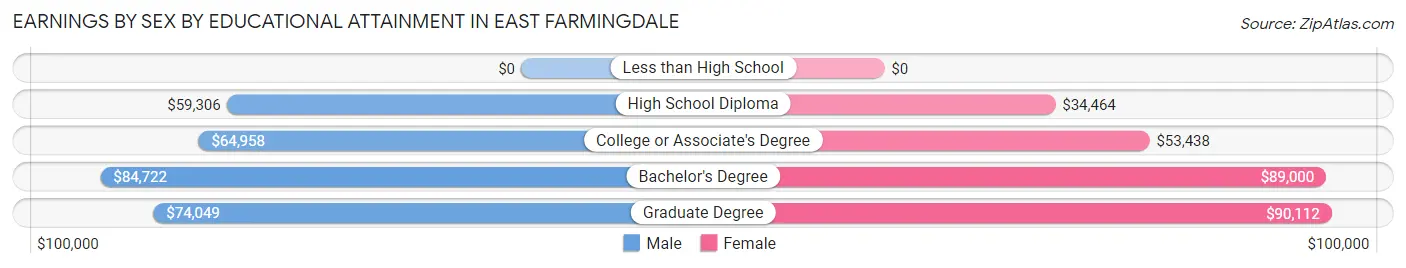
Earnings by Sex by Educational Attainment in East Farmingdale
Average earnings in East Farmingdale are $73,348 for men and $61,378 for women, a difference of 16.3%. Men with an educational attainment of bachelor's degree enjoy the highest average annual earnings of $84,722, while those with high school diploma education earn the least with $59,306. Women with an educational attainment of graduate degree earn the most with the average annual earnings of $90,112, while those with high school diploma education have the smallest earnings of $34,464.
| Educational Attainment | Male Income | Female Income |
| Less than High School | - | - |
| High School Diploma | $59,306 | $34,464 |
| College or Associate's Degree | $64,958 | $53,438 |
| Bachelor's Degree | $84,722 | $89,000 |
| Graduate Degree | $74,049 | $90,112 |
| Total | $73,348 | $61,378 |
Family Income in East Farmingdale
Family Income Brackets in East Farmingdale
According to the East Farmingdale family income data, there are 344 families falling into the $200,000+ income range, which is the most common income bracket and makes up 25.3% of all families. Conversely, the $10,000 to $14,999 income bracket is the least frequent group with only 3 families (0.2%) belonging to this category.
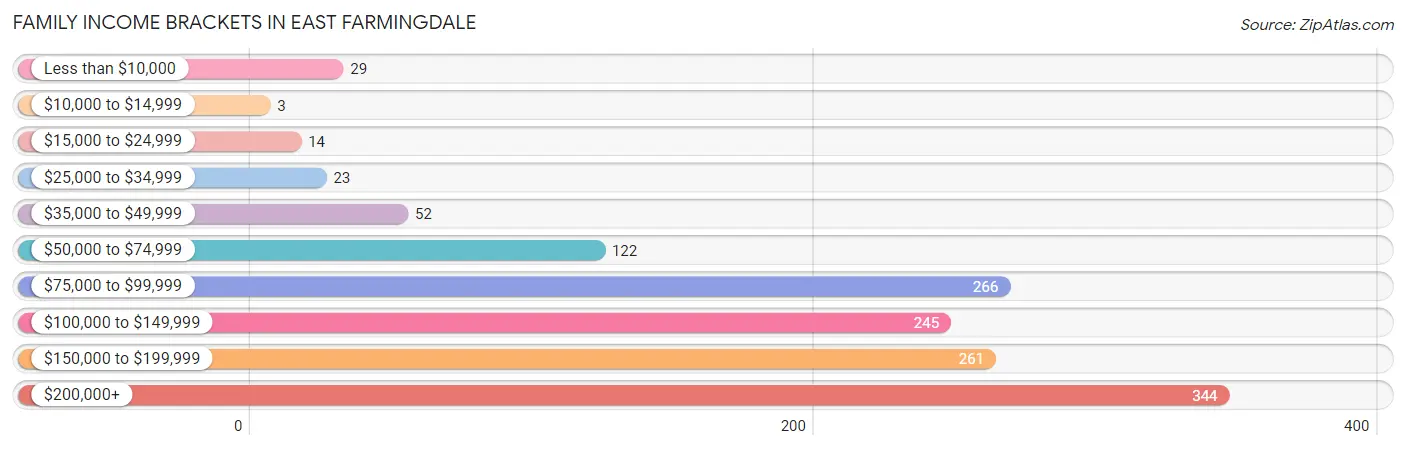
| Income Bracket | # Families | % Families |
| Less than $10,000 | 29 | 2.1% |
| $10,000 to $14,999 | 3 | 0.2% |
| $15,000 to $24,999 | 14 | 1.0% |
| $25,000 to $34,999 | 23 | 1.7% |
| $35,000 to $49,999 | 52 | 3.8% |
| $50,000 to $74,999 | 122 | 9.0% |
| $75,000 to $99,999 | 266 | 19.6% |
| $100,000 to $149,999 | 245 | 18.0% |
| $150,000 to $199,999 | 261 | 19.2% |
| $200,000+ | 344 | 25.3% |
Family Income by Famaliy Size in East Farmingdale
4-person families (280 | 20.6%) account for the highest median family income in East Farmingdale with $147,500 per family, while 2-person families (458 | 33.7%) have the highest median income of $55,764 per family member.
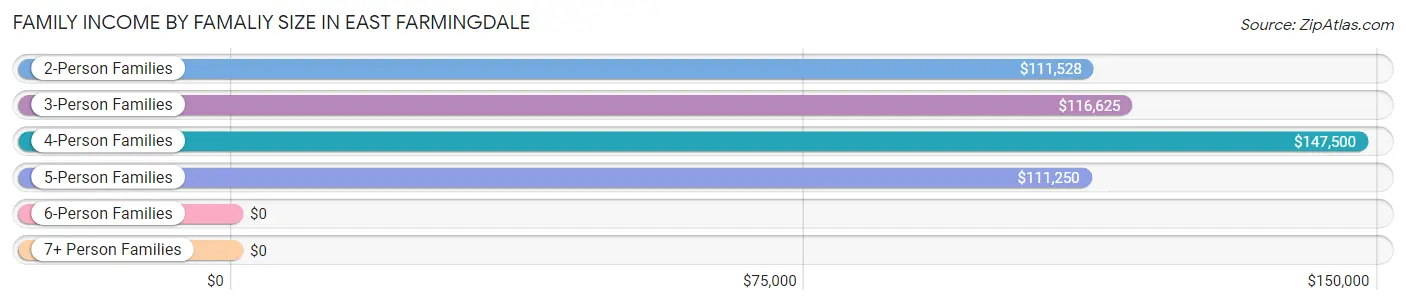
| Income Bracket | # Families | Median Income |
| 2-Person Families | 458 (33.7%) | $111,528 |
| 3-Person Families | 419 (30.8%) | $116,625 |
| 4-Person Families | 280 (20.6%) | $147,500 |
| 5-Person Families | 97 (7.1%) | $111,250 |
| 6-Person Families | 87 (6.4%) | $0 |
| 7+ Person Families | 18 (1.3%) | $0 |
| Total | 1,359 (100.0%) | $122,875 |
Family Income by Number of Earners in East Farmingdale
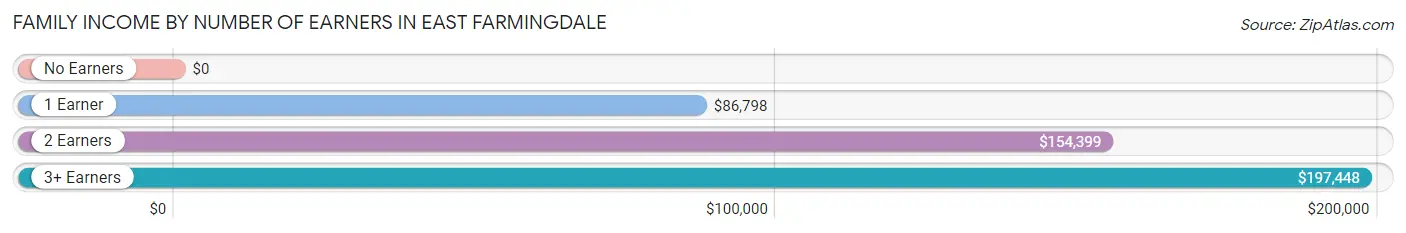
| Number of Earners | # Families | Median Income |
| No Earners | 71 (5.2%) | $0 |
| 1 Earner | 398 (29.3%) | $86,798 |
| 2 Earners | 639 (47.0%) | $154,399 |
| 3+ Earners | 251 (18.5%) | $197,448 |
| Total | 1,359 (100.0%) | $122,875 |
Household Income in East Farmingdale
Household Income Brackets in East Farmingdale
With 382 households falling in the category, the $200,000+ income range is the most frequent in East Farmingdale, accounting for 19.7% of all households. In contrast, only 21 households (1.1%) fall into the $10,000 to $14,999 income bracket, making it the least populous group.
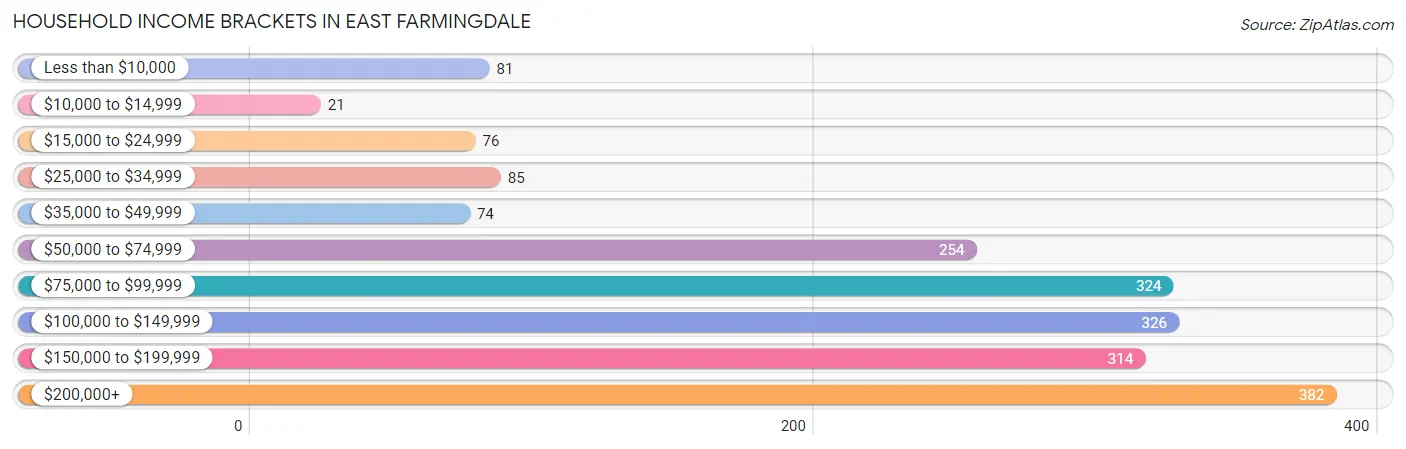
| Income Bracket | # Households | % Households |
| Less than $10,000 | 81 | 4.2% |
| $10,000 to $14,999 | 21 | 1.1% |
| $15,000 to $24,999 | 76 | 3.9% |
| $25,000 to $34,999 | 85 | 4.4% |
| $35,000 to $49,999 | 74 | 3.8% |
| $50,000 to $74,999 | 254 | 13.1% |
| $75,000 to $99,999 | 324 | 16.7% |
| $100,000 to $149,999 | 326 | 16.8% |
| $150,000 to $199,999 | 314 | 16.2% |
| $200,000+ | 382 | 19.7% |
Household Income by Householder Age in East Farmingdale
The median household income in East Farmingdale is $102,965, with the highest median household income of $124,375 found in the 45 to 64 years age bracket for the primary householder. A total of 715 households (36.9%) fall into this category. Meanwhile, the 15 to 24 years age bracket for the primary householder has the lowest median household income of $0, with 13 households (0.7%) in this group.
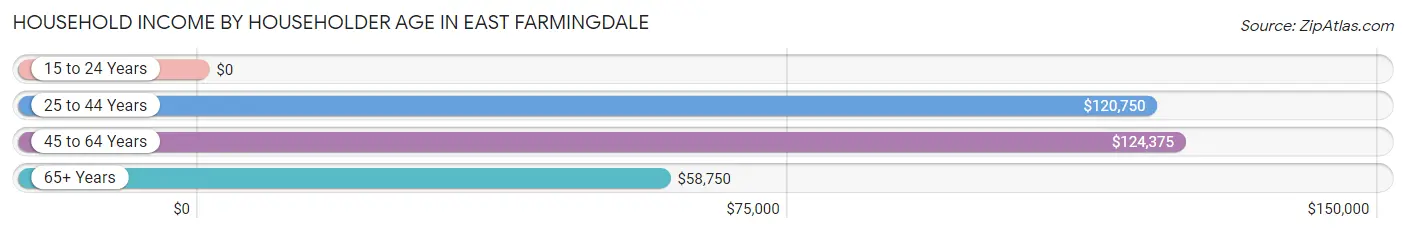
| Income Bracket | # Households | Median Income |
| 15 to 24 Years | 13 (0.7%) | $0 |
| 25 to 44 Years | 680 (35.0%) | $120,750 |
| 45 to 64 Years | 715 (36.9%) | $124,375 |
| 65+ Years | 532 (27.4%) | $58,750 |
| Total | 1,940 (100.0%) | $102,965 |
Poverty in East Farmingdale
Income Below Poverty by Sex and Age in East Farmingdale
With 2.6% poverty level for males and 5.6% for females among the residents of East Farmingdale, 75 year old and over males and 75 year old and over females are the most vulnerable to poverty, with 21 males (15.0%) and 60 females (18.4%) in their respective age groups living below the poverty level.
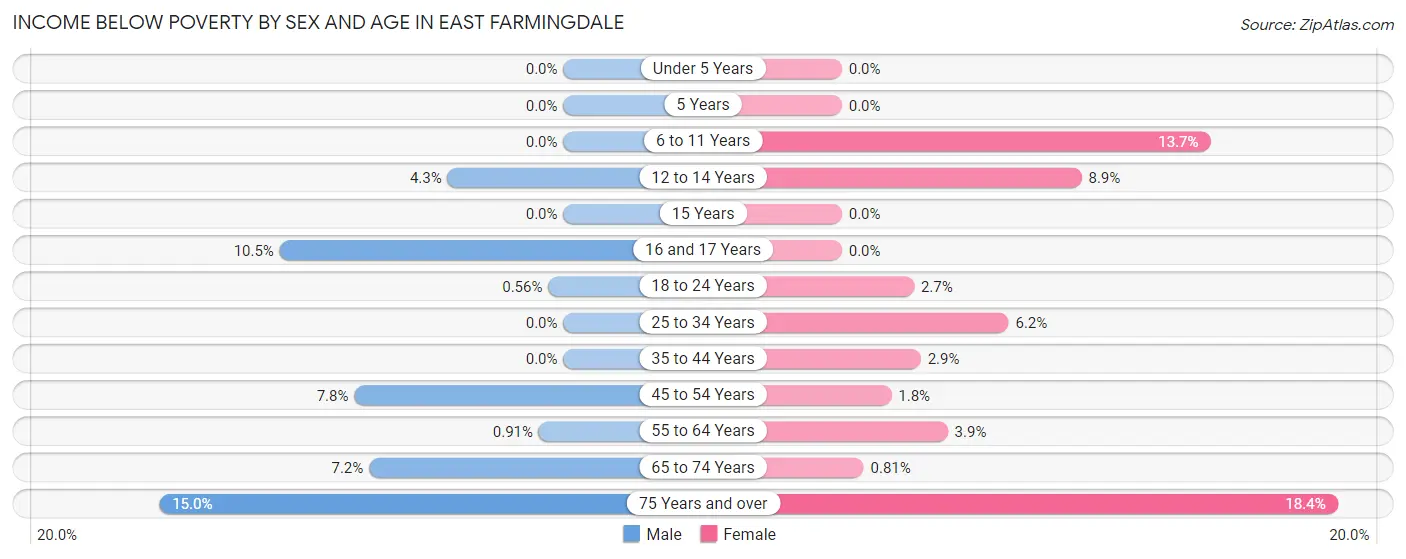
| Age Bracket | Male | Female |
| Under 5 Years | 0 (0.0%) | 0 (0.0%) |
| 5 Years | 0 (0.0%) | 0 (0.0%) |
| 6 to 11 Years | 0 (0.0%) | 13 (13.7%) |
| 12 to 14 Years | 4 (4.3%) | 13 (8.9%) |
| 15 Years | 0 (0.0%) | 0 (0.0%) |
| 16 and 17 Years | 4 (10.5%) | 0 (0.0%) |
| 18 to 24 Years | 2 (0.6%) | 6 (2.7%) |
| 25 to 34 Years | 0 (0.0%) | 25 (6.2%) |
| 35 to 44 Years | 0 (0.0%) | 11 (2.9%) |
| 45 to 54 Years | 28 (7.8%) | 6 (1.8%) |
| 55 to 64 Years | 3 (0.9%) | 16 (3.9%) |
| 65 to 74 Years | 15 (7.2%) | 1 (0.8%) |
| 75 Years and over | 21 (15.0%) | 60 (18.4%) |
| Total | 77 (2.6%) | 151 (5.6%) |
Income Above Poverty by Sex and Age in East Farmingdale
According to the poverty statistics in East Farmingdale, males aged under 5 years and females aged under 5 years are the age groups that are most secure financially, with 100.0% of males and 100.0% of females in these age groups living above the poverty line.
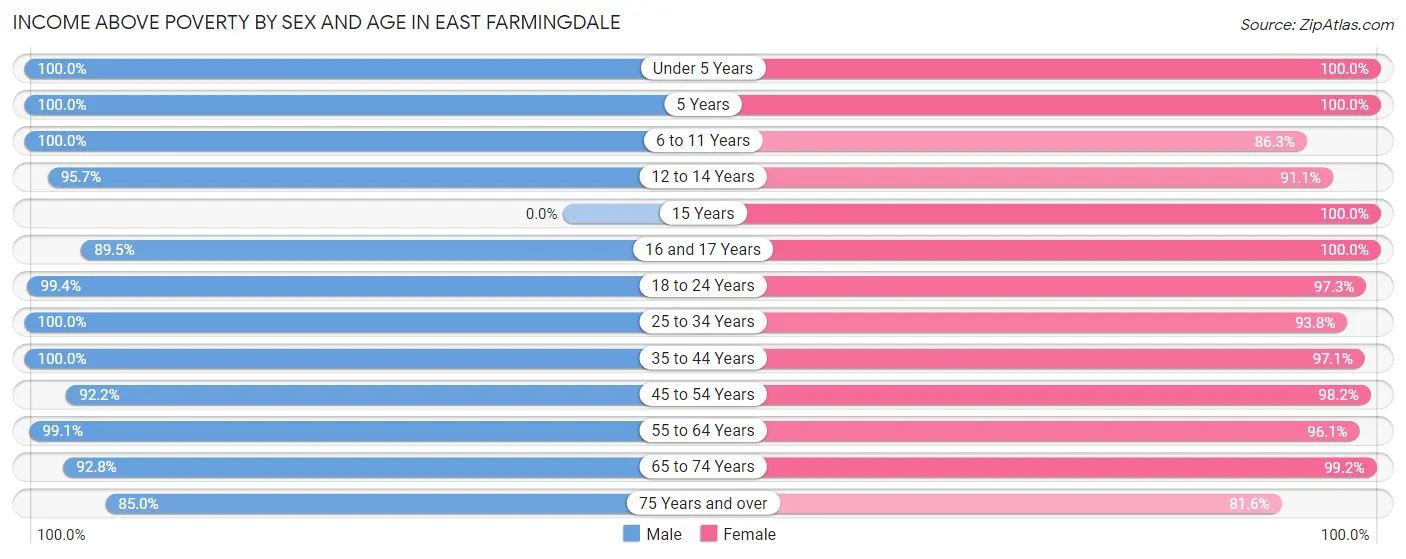
| Age Bracket | Male | Female |
| Under 5 Years | 90 (100.0%) | 170 (100.0%) |
| 5 Years | 47 (100.0%) | 22 (100.0%) |
| 6 to 11 Years | 294 (100.0%) | 82 (86.3%) |
| 12 to 14 Years | 89 (95.7%) | 133 (91.1%) |
| 15 Years | 0 (0.0%) | 21 (100.0%) |
| 16 and 17 Years | 34 (89.5%) | 70 (100.0%) |
| 18 to 24 Years | 357 (99.4%) | 218 (97.3%) |
| 25 to 34 Years | 734 (100.0%) | 379 (93.8%) |
| 35 to 44 Years | 226 (100.0%) | 364 (97.1%) |
| 45 to 54 Years | 333 (92.2%) | 320 (98.2%) |
| 55 to 64 Years | 325 (99.1%) | 391 (96.1%) |
| 65 to 74 Years | 193 (92.8%) | 122 (99.2%) |
| 75 Years and over | 119 (85.0%) | 266 (81.6%) |
| Total | 2,841 (97.4%) | 2,558 (94.4%) |
Income Below Poverty Among Married-Couple Families in East Farmingdale
The poverty statistics for married-couple families in East Farmingdale show that 0.9% or 8 of the total 941 families live below the poverty line. Families with no children have the highest poverty rate of 1.8%, comprising of 8 families. On the other hand, families with 1 or 2 children have the lowest poverty rate of 0.0%, which includes 0 families.
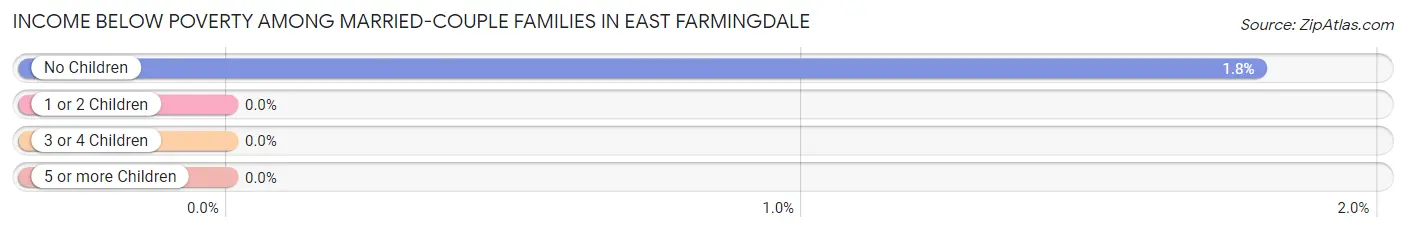
| Children | Above Poverty | Below Poverty |
| No Children | 439 (98.2%) | 8 (1.8%) |
| 1 or 2 Children | 427 (100.0%) | 0 (0.0%) |
| 3 or 4 Children | 67 (100.0%) | 0 (0.0%) |
| 5 or more Children | 0 (0.0%) | 0 (0.0%) |
| Total | 933 (99.2%) | 8 (0.9%) |
Income Below Poverty Among Single-Parent Households in East Farmingdale
According to the poverty data in East Farmingdale, 9.5% or 15 single-father households and 4.6% or 12 single-mother households are living below the poverty line. Among single-father households, those with 1 or 2 children have the highest poverty rate, with 15 households (24.2%) experiencing poverty. Likewise, among single-mother households, those with 1 or 2 children have the highest poverty rate, with 3 households (6.8%) falling below the poverty line.
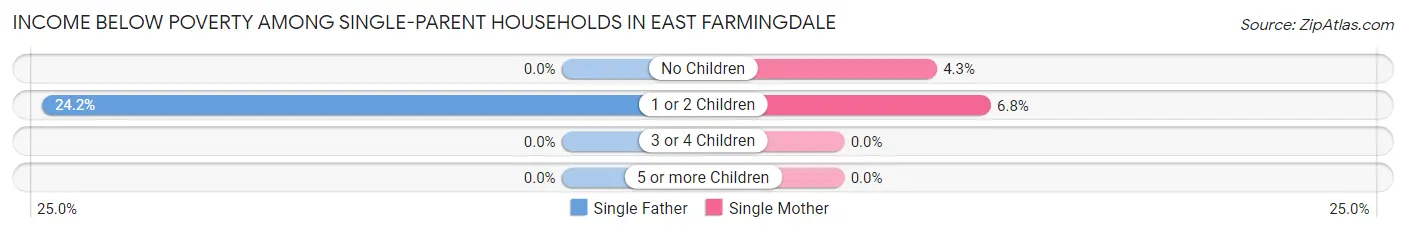
| Children | Single Father | Single Mother |
| No Children | 0 (0.0%) | 9 (4.3%) |
| 1 or 2 Children | 15 (24.2%) | 3 (6.8%) |
| 3 or 4 Children | 0 (0.0%) | 0 (0.0%) |
| 5 or more Children | 0 (0.0%) | 0 (0.0%) |
| Total | 15 (9.5%) | 12 (4.6%) |
Income Below Poverty Among Married-Couple vs Single-Parent Households in East Farmingdale
The poverty data for East Farmingdale shows that 8 of the married-couple family households (0.9%) and 27 of the single-parent households (6.5%) are living below the poverty level. Within the married-couple family households, those with no children have the highest poverty rate, with 8 households (1.8%) falling below the poverty line. Among the single-parent households, those with 1 or 2 children have the highest poverty rate, with 18 household (17.0%) living below poverty.
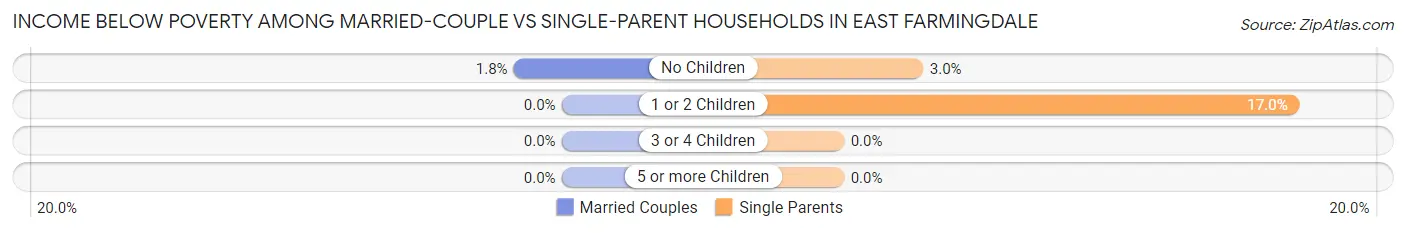
| Children | Married-Couple Families | Single-Parent Households |
| No Children | 8 (1.8%) | 9 (2.9%) |
| 1 or 2 Children | 0 (0.0%) | 18 (17.0%) |
| 3 or 4 Children | 0 (0.0%) | 0 (0.0%) |
| 5 or more Children | 0 (0.0%) | 0 (0.0%) |
| Total | 8 (0.9%) | 27 (6.5%) |
Race in East Farmingdale
The most populous races in East Farmingdale are White / Caucasian (4,188 | 69.3%), Hispanic or Latino (1,152 | 19.1%), and Some other Race (660 | 10.9%).
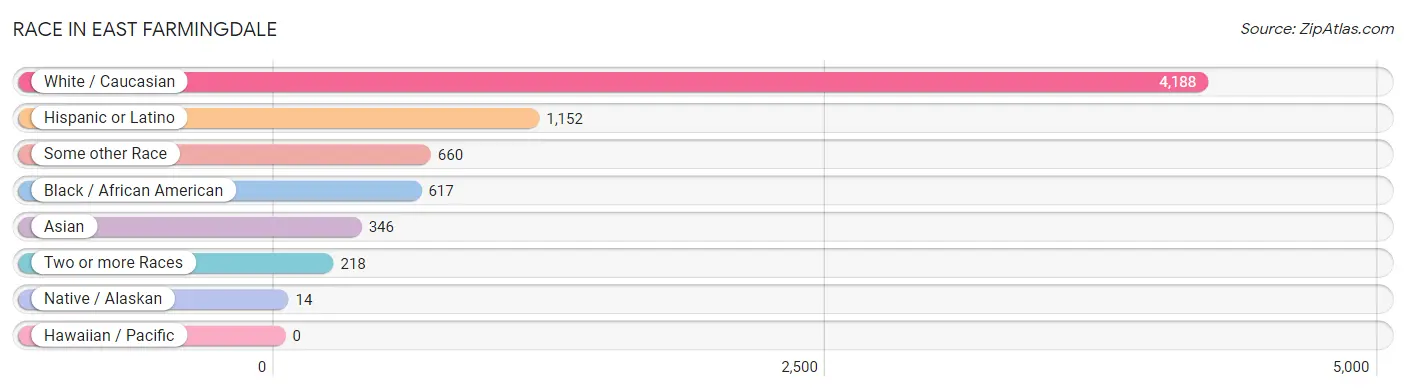
| Race | # Population | % Population |
| Asian | 346 | 5.7% |
| Black / African American | 617 | 10.2% |
| Hawaiian / Pacific | 0 | 0.0% |
| Hispanic or Latino | 1,152 | 19.1% |
| Native / Alaskan | 14 | 0.2% |
| White / Caucasian | 4,188 | 69.3% |
| Two or more Races | 218 | 3.6% |
| Some other Race | 660 | 10.9% |
| Total | 6,043 | 100.0% |
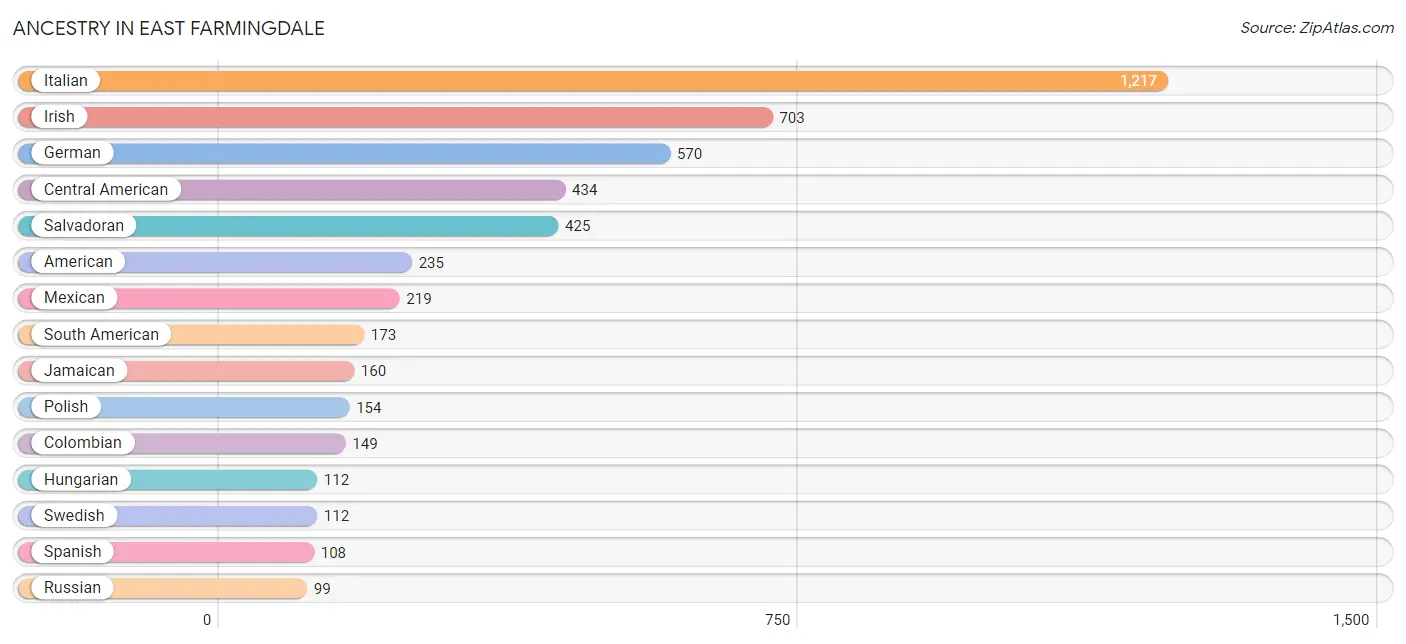
Ancestry in East Farmingdale
The most populous ancestries reported in East Farmingdale are Italian (1,217 | 20.1%), Irish (703 | 11.6%), German (570 | 9.4%), Central American (434 | 7.2%), and Salvadoran (425 | 7.0%), together accounting for 55.4% of all East Farmingdale residents.
| Ancestry | # Population | % Population |
| Afghan | 1 | 0.0% |
| African | 3 | 0.1% |
| Albanian | 11 | 0.2% |
| American | 235 | 3.9% |
| Arab | 26 | 0.4% |
| Belgian | 14 | 0.2% |
| Bhutanese | 29 | 0.5% |
| British | 6 | 0.1% |
| British West Indian | 13 | 0.2% |
| Burmese | 9 | 0.2% |
| Canadian | 5 | 0.1% |
| Central American | 434 | 7.2% |
| Cherokee | 13 | 0.2% |
| Colombian | 149 | 2.5% |
| Czech | 24 | 0.4% |
| Dominican | 51 | 0.8% |
| Dutch | 15 | 0.3% |
| Eastern European | 12 | 0.2% |
| Ecuadorian | 17 | 0.3% |
| English | 63 | 1.0% |
| European | 24 | 0.4% |
| Filipino | 7 | 0.1% |
| French | 16 | 0.3% |
| German | 570 | 9.4% |
| Ghanaian | 3 | 0.1% |
| Greek | 15 | 0.3% |
| Guyanese | 15 | 0.3% |
| Haitian | 29 | 0.5% |
| Hungarian | 112 | 1.8% |
| Indian (Asian) | 62 | 1.0% |
| Iranian | 47 | 0.8% |
| Iraqi | 16 | 0.3% |
| Irish | 703 | 11.6% |
| Iroquois | 5 | 0.1% |
| Israeli | 16 | 0.3% |
| Italian | 1,217 | 20.1% |
| Jamaican | 160 | 2.6% |
| Korean | 63 | 1.0% |
| Lithuanian | 5 | 0.1% |
| Mexican | 219 | 3.6% |
| Moroccan | 10 | 0.2% |
| Nicaraguan | 9 | 0.2% |
| Nigerian | 9 | 0.2% |
| Norwegian | 4 | 0.1% |
| Okinawan | 21 | 0.4% |
| Peruvian | 7 | 0.1% |
| Polish | 154 | 2.5% |
| Portuguese | 15 | 0.3% |
| Puerto Rican | 93 | 1.5% |
| Russian | 99 | 1.6% |
| Salvadoran | 425 | 7.0% |
| Scottish | 48 | 0.8% |
| Slovak | 10 | 0.2% |
| South American | 173 | 2.9% |
| Spaniard | 19 | 0.3% |
| Spanish | 108 | 1.8% |
| Subsaharan African | 12 | 0.2% |
| Swedish | 112 | 1.8% |
| Thai | 99 | 1.6% |
| Trinidadian and Tobagonian | 4 | 0.1% |
| Turkish | 19 | 0.3% |
| Ukrainian | 3 | 0.1% |
| Welsh | 24 | 0.4% |
| West Indian | 31 | 0.5% | View All 64 Rows |
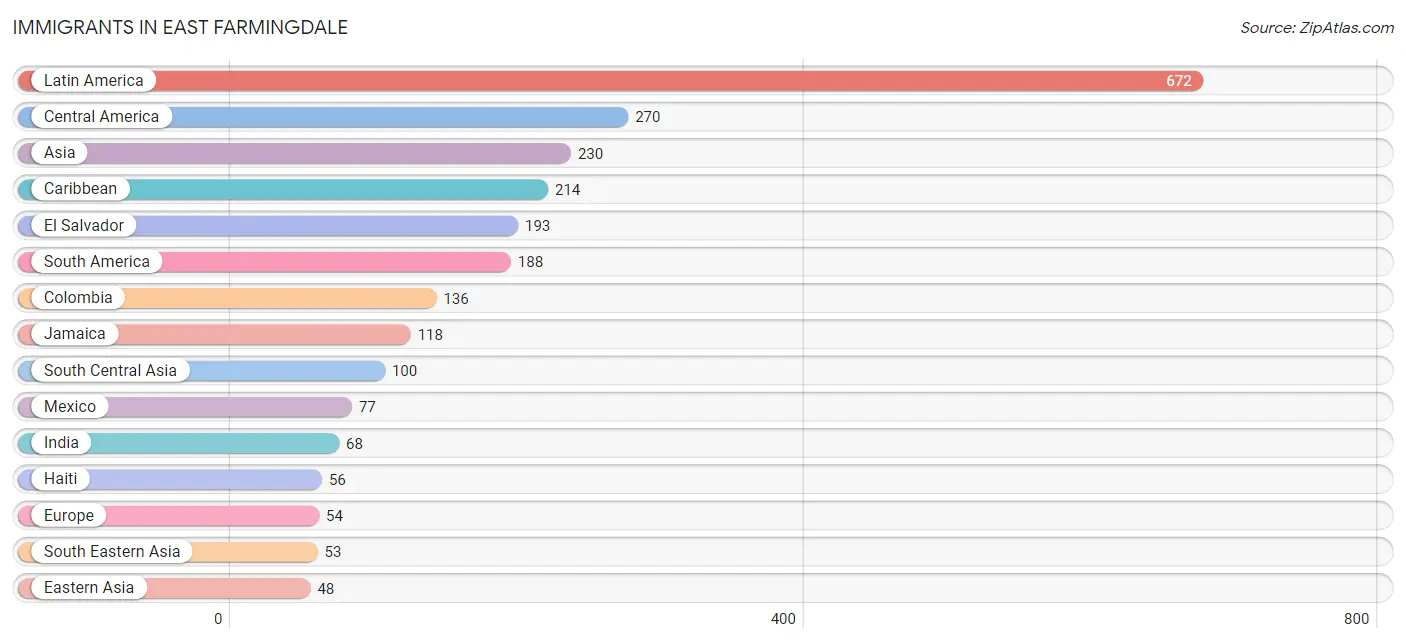
Immigrants in East Farmingdale
The most numerous immigrant groups reported in East Farmingdale came from Latin America (672 | 11.1%), Central America (270 | 4.5%), Asia (230 | 3.8%), Caribbean (214 | 3.5%), and El Salvador (193 | 3.2%), together accounting for 26.1% of all East Farmingdale residents.
| Immigration Origin | # Population | % Population |
| Afghanistan | 17 | 0.3% |
| Albania | 4 | 0.1% |
| Argentina | 4 | 0.1% |
| Asia | 230 | 3.8% |
| Belgium | 14 | 0.2% |
| Canada | 6 | 0.1% |
| Caribbean | 214 | 3.5% |
| Central America | 270 | 4.5% |
| Chile | 11 | 0.2% |
| China | 40 | 0.7% |
| Colombia | 136 | 2.2% |
| Dominican Republic | 23 | 0.4% |
| Eastern Asia | 48 | 0.8% |
| Eastern Europe | 24 | 0.4% |
| Ecuador | 8 | 0.1% |
| El Salvador | 193 | 3.2% |
| Europe | 54 | 0.9% |
| France | 10 | 0.2% |
| Grenada | 7 | 0.1% |
| Guyana | 7 | 0.1% |
| Haiti | 56 | 0.9% |
| Hong Kong | 14 | 0.2% |
| India | 68 | 1.1% |
| Jamaica | 118 | 1.9% |
| Japan | 8 | 0.1% |
| Latin America | 672 | 11.1% |
| Malaysia | 21 | 0.4% |
| Mexico | 77 | 1.3% |
| North Macedonia | 6 | 0.1% |
| Northern Europe | 6 | 0.1% |
| Pakistan | 15 | 0.3% |
| Peru | 7 | 0.1% |
| Philippines | 32 | 0.5% |
| Scotland | 6 | 0.1% |
| South America | 188 | 3.1% |
| South Central Asia | 100 | 1.7% |
| South Eastern Asia | 53 | 0.9% |
| Taiwan | 7 | 0.1% |
| Trinidad and Tobago | 10 | 0.2% |
| Turkey | 29 | 0.5% |
| Ukraine | 14 | 0.2% |
| Venezuela | 15 | 0.3% |
| Western Asia | 29 | 0.5% |
| Western Europe | 24 | 0.4% | View All 44 Rows |
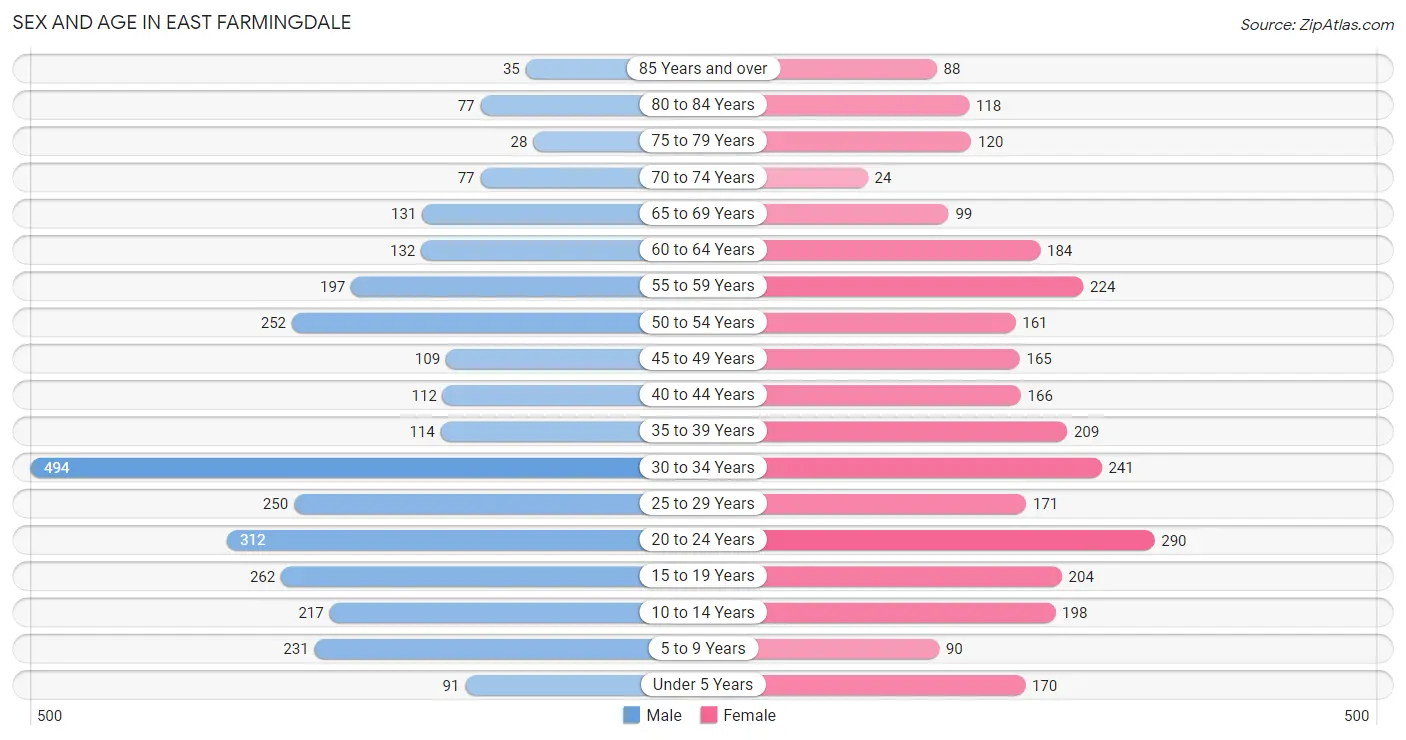
Sex and Age in East Farmingdale
Sex and Age in East Farmingdale
The most populous age groups in East Farmingdale are 30 to 34 Years (494 | 15.8%) for men and 20 to 24 Years (290 | 9.9%) for women.
| Age Bracket | Male | Female |
| Under 5 Years | 91 (2.9%) | 170 (5.8%) |
| 5 to 9 Years | 231 (7.4%) | 90 (3.1%) |
| 10 to 14 Years | 217 (7.0%) | 198 (6.8%) |
| 15 to 19 Years | 262 (8.4%) | 204 (7.0%) |
| 20 to 24 Years | 312 (10.0%) | 290 (9.9%) |
| 25 to 29 Years | 250 (8.0%) | 171 (5.9%) |
| 30 to 34 Years | 494 (15.8%) | 241 (8.3%) |
| 35 to 39 Years | 114 (3.6%) | 209 (7.1%) |
| 40 to 44 Years | 112 (3.6%) | 166 (5.7%) |
| 45 to 49 Years | 109 (3.5%) | 165 (5.7%) |
| 50 to 54 Years | 252 (8.1%) | 161 (5.5%) |
| 55 to 59 Years | 197 (6.3%) | 224 (7.7%) |
| 60 to 64 Years | 132 (4.2%) | 184 (6.3%) |
| 65 to 69 Years | 131 (4.2%) | 99 (3.4%) |
| 70 to 74 Years | 77 (2.5%) | 24 (0.8%) |
| 75 to 79 Years | 28 (0.9%) | 120 (4.1%) |
| 80 to 84 Years | 77 (2.5%) | 118 (4.0%) |
| 85 Years and over | 35 (1.1%) | 88 (3.0%) |
| Total | 3,121 (100.0%) | 2,922 (100.0%) |
Families and Households in East Farmingdale
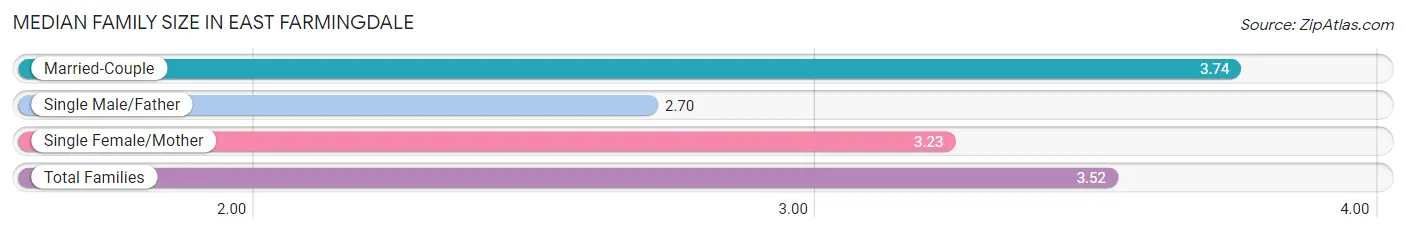
Median Family Size in East Farmingdale
The median family size in East Farmingdale is 3.52 persons per family, with married-couple families (941 | 69.2%) accounting for the largest median family size of 3.74 persons per family. On the other hand, single male/father families (158 | 11.6%) represent the smallest median family size with 2.70 persons per family.
| Family Type | # Families | Family Size |
| Married-Couple | 941 (69.2%) | 3.74 |
| Single Male/Father | 158 (11.6%) | 2.70 |
| Single Female/Mother | 260 (19.1%) | 3.23 |
| Total Families | 1,359 (100.0%) | 3.52 |
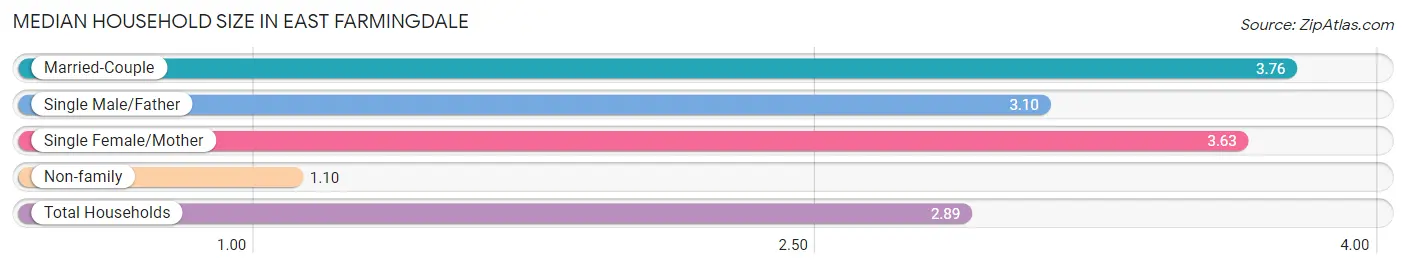
Median Household Size in East Farmingdale
The median household size in East Farmingdale is 2.89 persons per household, with married-couple households (941 | 48.5%) accounting for the largest median household size of 3.76 persons per household. non-family households (581 | 29.9%) represent the smallest median household size with 1.10 persons per household.
| Household Type | # Households | Household Size |
| Married-Couple | 941 (48.5%) | 3.76 |
| Single Male/Father | 158 (8.1%) | 3.10 |
| Single Female/Mother | 260 (13.4%) | 3.63 |
| Non-family | 581 (29.9%) | 1.10 |
| Total Households | 1,940 (100.0%) | 2.89 |
Household Size by Marriage Status in East Farmingdale
Out of a total of 1,940 households in East Farmingdale, 1,359 (70.1%) are family households, while 581 (29.9%) are nonfamily households. The most numerous type of family households are 2-person households, comprising 435, and the most common type of nonfamily households are 1-person households, comprising 522.
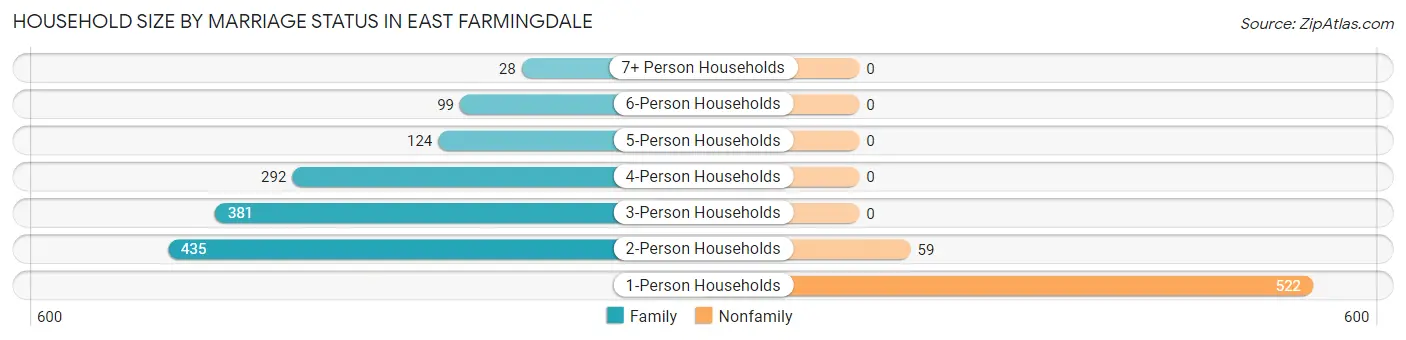
| Household Size | Family Households | Nonfamily Households |
| 1-Person Households | - | 522 (26.9%) |
| 2-Person Households | 435 (22.4%) | 59 (3.0%) |
| 3-Person Households | 381 (19.6%) | 0 (0.0%) |
| 4-Person Households | 292 (15.0%) | 0 (0.0%) |
| 5-Person Households | 124 (6.4%) | 0 (0.0%) |
| 6-Person Households | 99 (5.1%) | 0 (0.0%) |
| 7+ Person Households | 28 (1.4%) | 0 (0.0%) |
| Total | 1,359 (70.1%) | 581 (29.9%) |
Female Fertility in East Farmingdale
Fertility by Age in East Farmingdale
Average fertility rate in East Farmingdale is 91.0 births per 1,000 women. Women in the age bracket of 20 to 34 years have the highest fertility rate with 114.0 births per 1,000 women. Women in the age bracket of 20 to 34 years acount for 58.8% of all women with births.
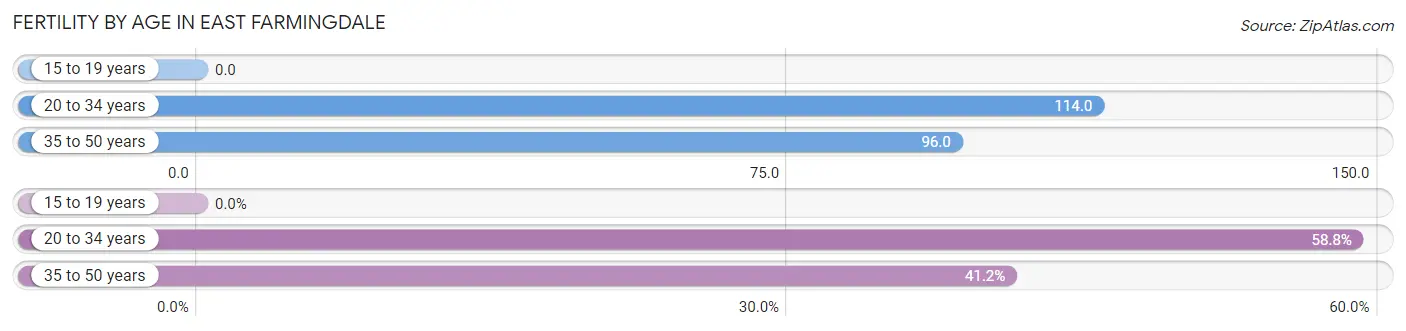
| Age Bracket | Women with Births | Births / 1,000 Women |
| 15 to 19 years | 0 (0.0%) | 0.0 |
| 20 to 34 years | 80 (58.8%) | 114.0 |
| 35 to 50 years | 56 (41.2%) | 96.0 |
| Total | 136 (100.0%) | 91.0 |
Fertility by Age by Marriage Status in East Farmingdale
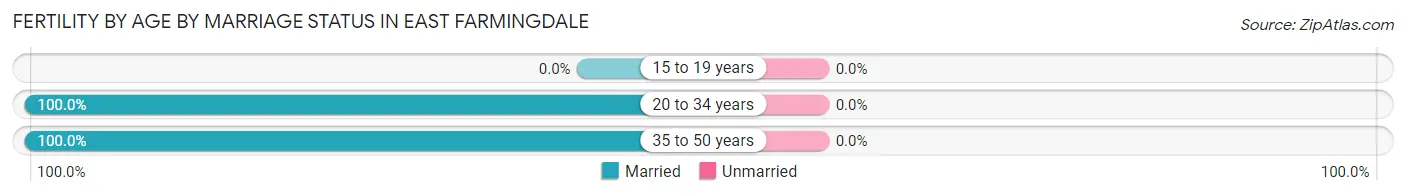
| Age Bracket | Married | Unmarried |
| 15 to 19 years | 0 (0.0%) | 0 (0.0%) |
| 20 to 34 years | 80 (100.0%) | 0 (0.0%) |
| 35 to 50 years | 56 (100.0%) | 0 (0.0%) |
| Total | 136 (100.0%) | 0 (0.0%) |
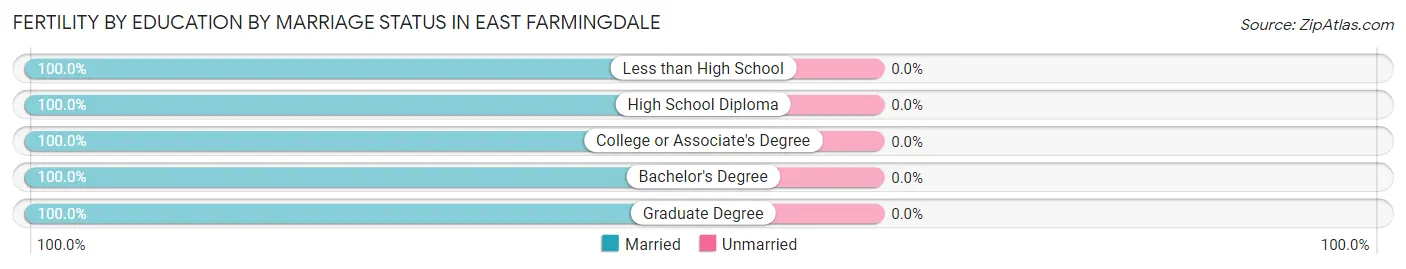
Fertility by Education in East Farmingdale
Average fertility rate in East Farmingdale is 91.0 births per 1,000 women. Women with the education attainment of less than high school have the highest fertility rate of 395.0 births per 1,000 women, while women with the education attainment of bachelor's degree have the lowest fertility at 16.0 births per 1,000 women. Women with the education attainment of less than high school represent 47.1% of all women with births.
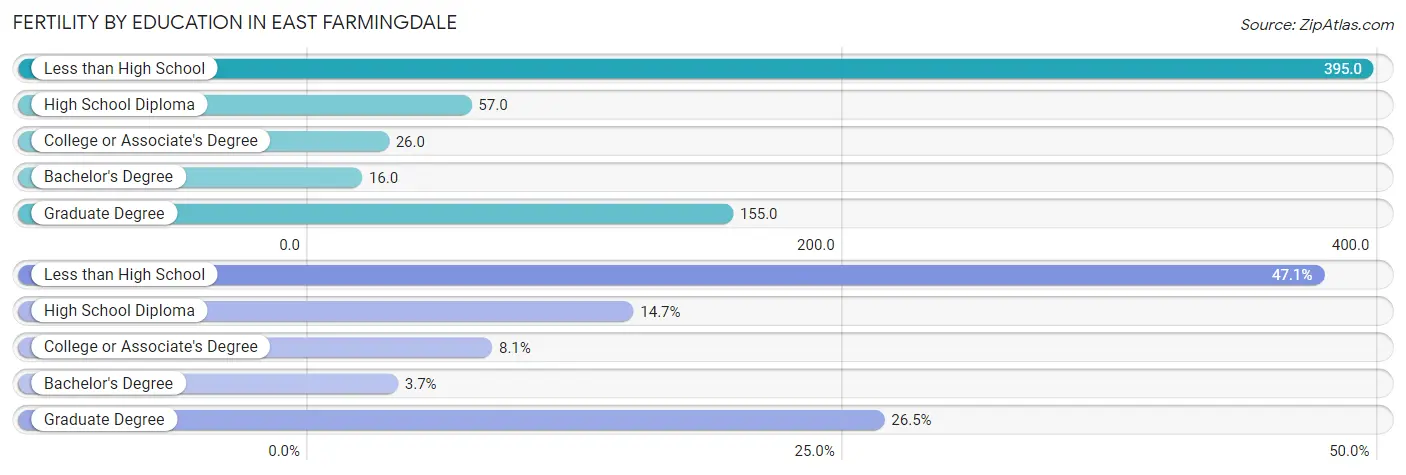
| Educational Attainment | Women with Births | Births / 1,000 Women |
| Less than High School | 64 (47.1%) | 395.0 |
| High School Diploma | 20 (14.7%) | 57.0 |
| College or Associate's Degree | 11 (8.1%) | 26.0 |
| Bachelor's Degree | 5 (3.7%) | 16.0 |
| Graduate Degree | 36 (26.5%) | 155.0 |
| Total | 136 (100.0%) | 91.0 |
Fertility by Education by Marriage Status in East Farmingdale
| Educational Attainment | Married | Unmarried |
| Less than High School | 64 (100.0%) | 0 (0.0%) |
| High School Diploma | 20 (100.0%) | 0 (0.0%) |
| College or Associate's Degree | 11 (100.0%) | 0 (0.0%) |
| Bachelor's Degree | 5 (100.0%) | 0 (0.0%) |
| Graduate Degree | 36 (100.0%) | 0 (0.0%) |
| Total | 136 (100.0%) | 0 (0.0%) |
Employment Characteristics in East Farmingdale
Employment by Class of Employer in East Farmingdale
Among the 3,091 employed individuals in East Farmingdale, private company employees (2,223 | 71.9%), local government employees (271 | 8.8%), and not-for-profit organizations (208 | 6.7%) make up the most common classes of employment.
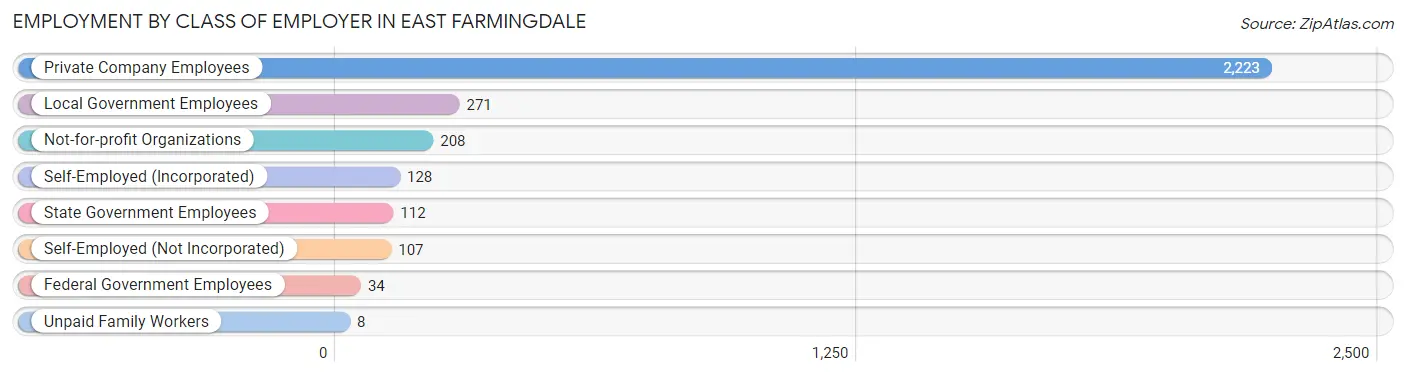
| Employer Class | # Employees | % Employees |
| Private Company Employees | 2,223 | 71.9% |
| Self-Employed (Incorporated) | 128 | 4.1% |
| Self-Employed (Not Incorporated) | 107 | 3.5% |
| Not-for-profit Organizations | 208 | 6.7% |
| Local Government Employees | 271 | 8.8% |
| State Government Employees | 112 | 3.6% |
| Federal Government Employees | 34 | 1.1% |
| Unpaid Family Workers | 8 | 0.3% |
| Total | 3,091 | 100.0% |
Employment Status by Age in East Farmingdale
According to the labor force statistics for East Farmingdale, out of the total population over 16 years of age (5,023), 67.2% or 3,375 individuals are in the labor force, with 7.7% or 260 of them unemployed. The age group with the highest labor force participation rate is 25 to 29 years, with 89.5% or 377 individuals in the labor force. Within the labor force, the 75 years and over age range has the highest percentage of unemployed individuals, with 29.7% or 11 of them being unemployed.
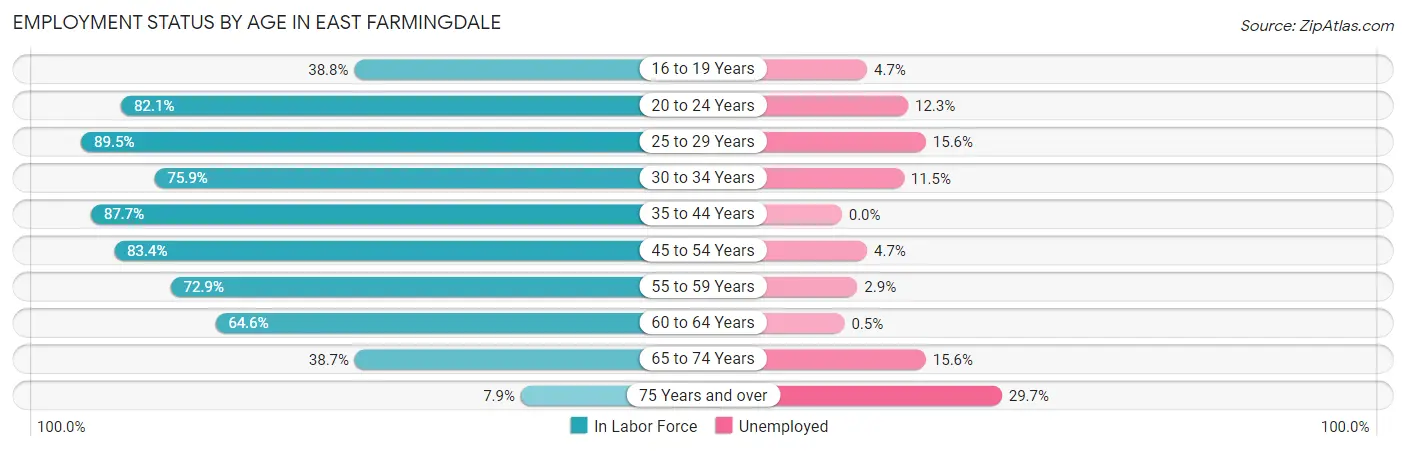
| Age Bracket | In Labor Force | Unemployed |
| 16 to 19 Years | 172 (38.8%) | 8 (4.7%) |
| 20 to 24 Years | 494 (82.1%) | 61 (12.3%) |
| 25 to 29 Years | 377 (89.5%) | 59 (15.6%) |
| 30 to 34 Years | 558 (75.9%) | 64 (11.5%) |
| 35 to 44 Years | 527 (87.7%) | 0 (0.0%) |
| 45 to 54 Years | 573 (83.4%) | 27 (4.7%) |
| 55 to 59 Years | 307 (72.9%) | 9 (2.9%) |
| 60 to 64 Years | 204 (64.6%) | 1 (0.5%) |
| 65 to 74 Years | 128 (38.7%) | 20 (15.6%) |
| 75 Years and over | 37 (7.9%) | 11 (29.7%) |
| Total | 3,375 (67.2%) | 260 (7.7%) |
Employment Status by Educational Attainment in East Farmingdale
According to labor force statistics for East Farmingdale, 80.0% of individuals (2,545) out of the total population between 25 and 64 years of age (3,181) are in the labor force, with 6.3% or 160 of them being unemployed. The group with the highest labor force participation rate are those with the educational attainment of bachelor's degree or higher, with 87.2% or 1,316 individuals in the labor force. Within the labor force, individuals with less than high school education have the highest percentage of unemployment, with 26.1% or 29 of them being unemployed.
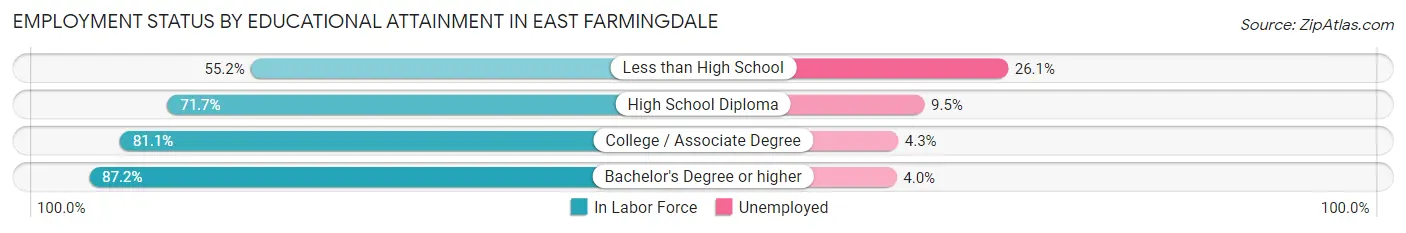
| Educational Attainment | In Labor Force | Unemployed |
| Less than High School | 111 (55.2%) | 52 (26.1%) |
| High School Diploma | 566 (71.7%) | 75 (9.5%) |
| College / Associate Degree | 553 (81.1%) | 29 (4.3%) |
| Bachelor's Degree or higher | 1,316 (87.2%) | 60 (4.0%) |
| Total | 2,545 (80.0%) | 200 (6.3%) |
Employment Occupations by Sex in East Farmingdale
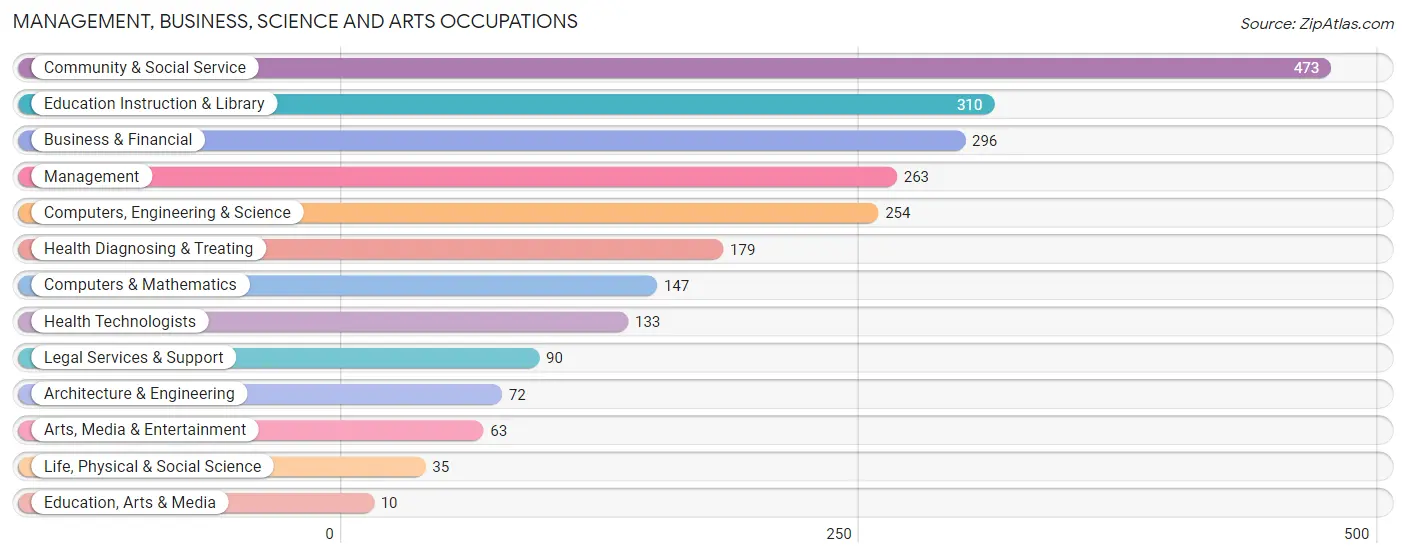
Management, Business, Science and Arts Occupations
The most common Management, Business, Science and Arts occupations in East Farmingdale are Community & Social Service (473 | 15.2%), Education Instruction & Library (310 | 10.0%), Business & Financial (296 | 9.5%), Management (263 | 8.4%), and Computers, Engineering & Science (254 | 8.2%).
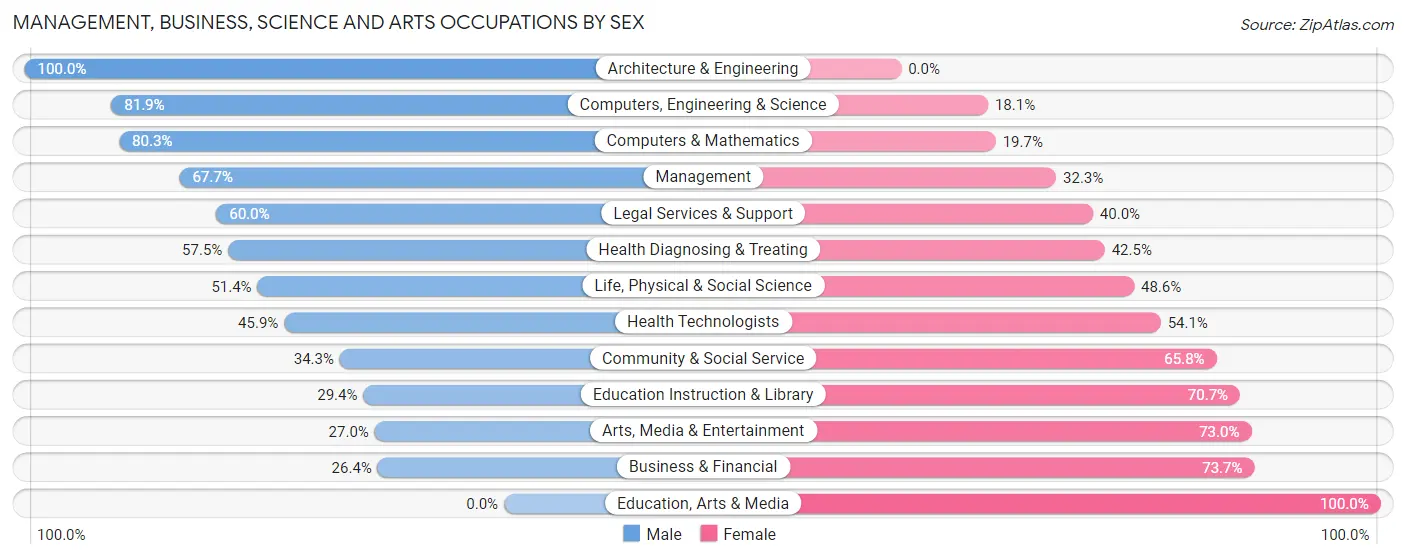
Management, Business, Science and Arts Occupations by Sex
Within the Management, Business, Science and Arts occupations in East Farmingdale, the most male-oriented occupations are Architecture & Engineering (100.0%), Computers, Engineering & Science (81.9%), and Computers & Mathematics (80.3%), while the most female-oriented occupations are Education, Arts & Media (100.0%), Business & Financial (73.7%), and Arts, Media & Entertainment (73.0%).
| Occupation | Male | Female |
| Management | 178 (67.7%) | 85 (32.3%) |
| Business & Financial | 78 (26.4%) | 218 (73.7%) |
| Computers, Engineering & Science | 208 (81.9%) | 46 (18.1%) |
| Computers & Mathematics | 118 (80.3%) | 29 (19.7%) |
| Architecture & Engineering | 72 (100.0%) | 0 (0.0%) |
| Life, Physical & Social Science | 18 (51.4%) | 17 (48.6%) |
| Community & Social Service | 162 (34.3%) | 311 (65.7%) |
| Education, Arts & Media | 0 (0.0%) | 10 (100.0%) |
| Legal Services & Support | 54 (60.0%) | 36 (40.0%) |
| Education Instruction & Library | 91 (29.3%) | 219 (70.7%) |
| Arts, Media & Entertainment | 17 (27.0%) | 46 (73.0%) |
| Health Diagnosing & Treating | 103 (57.5%) | 76 (42.5%) |
| Health Technologists | 61 (45.9%) | 72 (54.1%) |
| Total (Category) | 729 (49.8%) | 736 (50.2%) |
| Total (Overall) | 1,680 (53.9%) | 1,437 (46.1%) |
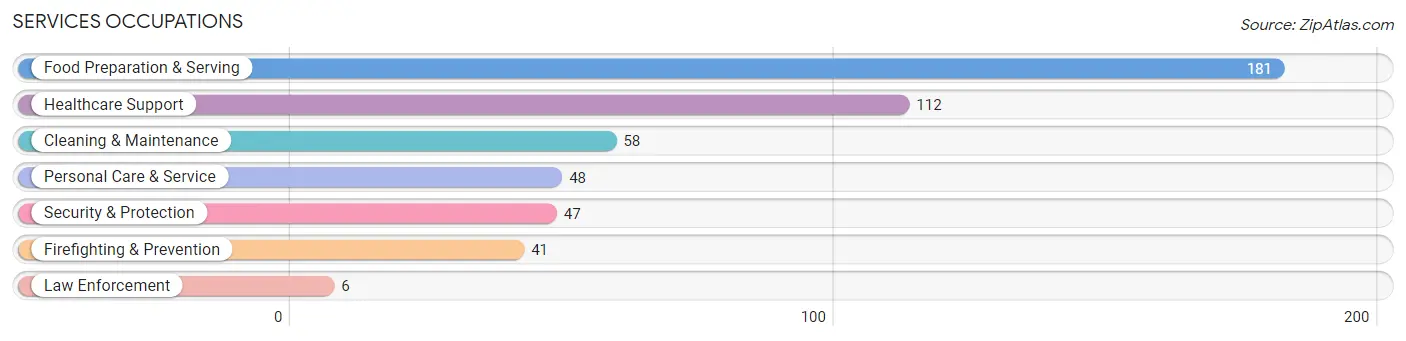
Services Occupations
The most common Services occupations in East Farmingdale are Food Preparation & Serving (181 | 5.8%), Healthcare Support (112 | 3.6%), Cleaning & Maintenance (58 | 1.9%), Personal Care & Service (48 | 1.5%), and Security & Protection (47 | 1.5%).
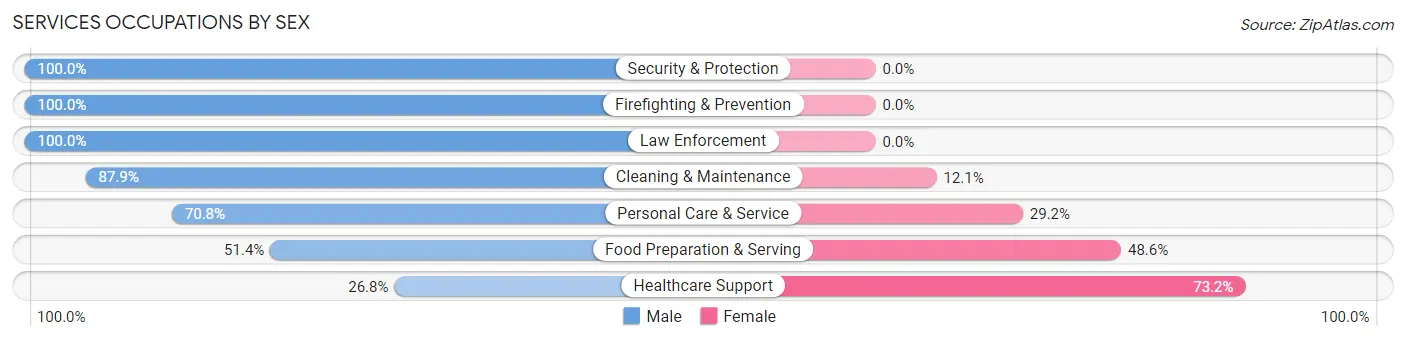
Services Occupations by Sex
Within the Services occupations in East Farmingdale, the most male-oriented occupations are Security & Protection (100.0%), Firefighting & Prevention (100.0%), and Law Enforcement (100.0%), while the most female-oriented occupations are Healthcare Support (73.2%), Food Preparation & Serving (48.6%), and Personal Care & Service (29.2%).
| Occupation | Male | Female |
| Healthcare Support | 30 (26.8%) | 82 (73.2%) |
| Security & Protection | 47 (100.0%) | 0 (0.0%) |
| Firefighting & Prevention | 41 (100.0%) | 0 (0.0%) |
| Law Enforcement | 6 (100.0%) | 0 (0.0%) |
| Food Preparation & Serving | 93 (51.4%) | 88 (48.6%) |
| Cleaning & Maintenance | 51 (87.9%) | 7 (12.1%) |
| Personal Care & Service | 34 (70.8%) | 14 (29.2%) |
| Total (Category) | 255 (57.2%) | 191 (42.8%) |
| Total (Overall) | 1,680 (53.9%) | 1,437 (46.1%) |
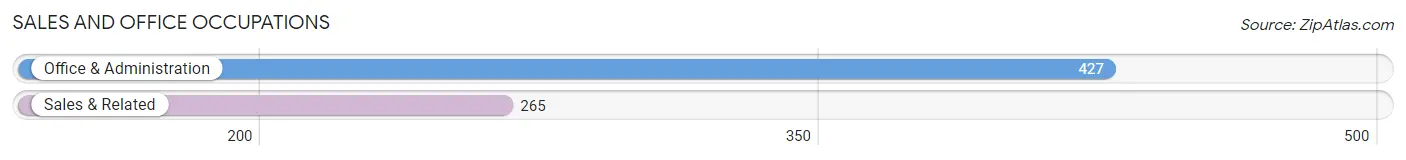
Sales and Office Occupations
The most common Sales and Office occupations in East Farmingdale are Office & Administration (427 | 13.7%), and Sales & Related (265 | 8.5%).
Sales and Office Occupations by Sex
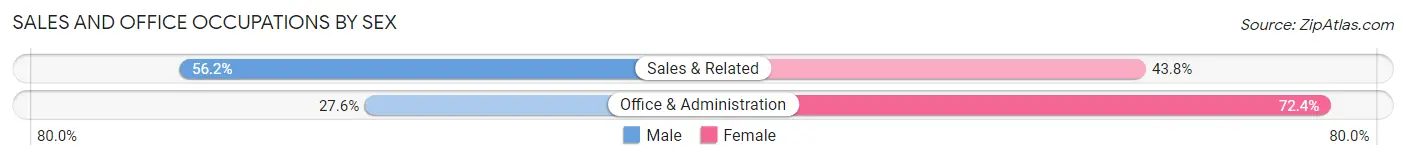
| Occupation | Male | Female |
| Sales & Related | 149 (56.2%) | 116 (43.8%) |
| Office & Administration | 118 (27.6%) | 309 (72.4%) |
| Total (Category) | 267 (38.6%) | 425 (61.4%) |
| Total (Overall) | 1,680 (53.9%) | 1,437 (46.1%) |
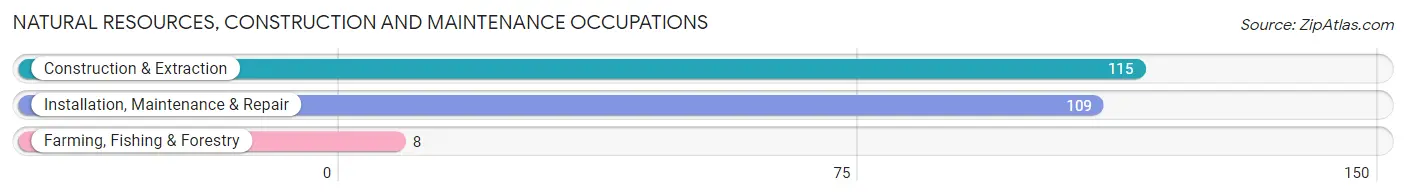
Natural Resources, Construction and Maintenance Occupations
The most common Natural Resources, Construction and Maintenance occupations in East Farmingdale are Construction & Extraction (115 | 3.7%), Installation, Maintenance & Repair (109 | 3.5%), and Farming, Fishing & Forestry (8 | 0.3%).
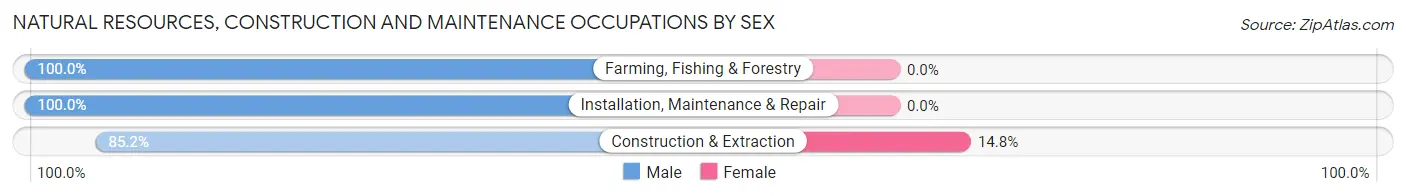
Natural Resources, Construction and Maintenance Occupations by Sex
| Occupation | Male | Female |
| Farming, Fishing & Forestry | 8 (100.0%) | 0 (0.0%) |
| Construction & Extraction | 98 (85.2%) | 17 (14.8%) |
| Installation, Maintenance & Repair | 109 (100.0%) | 0 (0.0%) |
| Total (Category) | 215 (92.7%) | 17 (7.3%) |
| Total (Overall) | 1,680 (53.9%) | 1,437 (46.1%) |
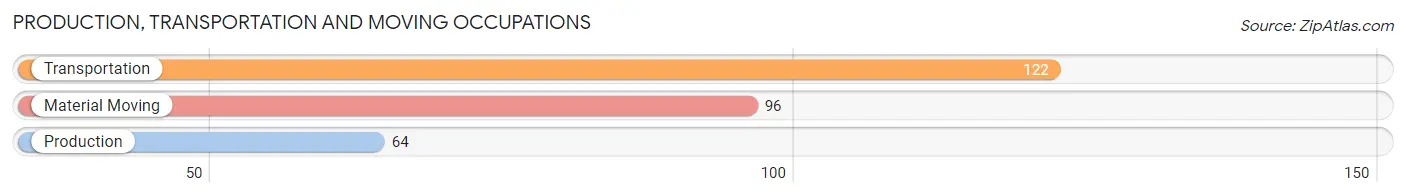
Production, Transportation and Moving Occupations
The most common Production, Transportation and Moving occupations in East Farmingdale are Transportation (122 | 3.9%), Material Moving (96 | 3.1%), and Production (64 | 2.1%).
Production, Transportation and Moving Occupations by Sex
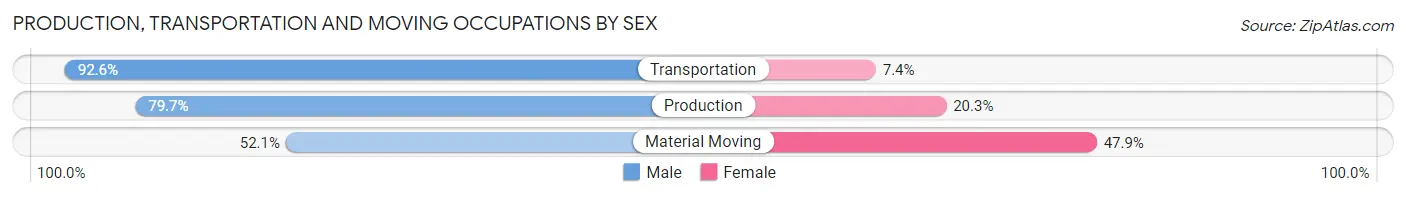
| Occupation | Male | Female |
| Production | 51 (79.7%) | 13 (20.3%) |
| Transportation | 113 (92.6%) | 9 (7.4%) |
| Material Moving | 50 (52.1%) | 46 (47.9%) |
| Total (Category) | 214 (75.9%) | 68 (24.1%) |
| Total (Overall) | 1,680 (53.9%) | 1,437 (46.1%) |
Employment Industries by Sex in East Farmingdale
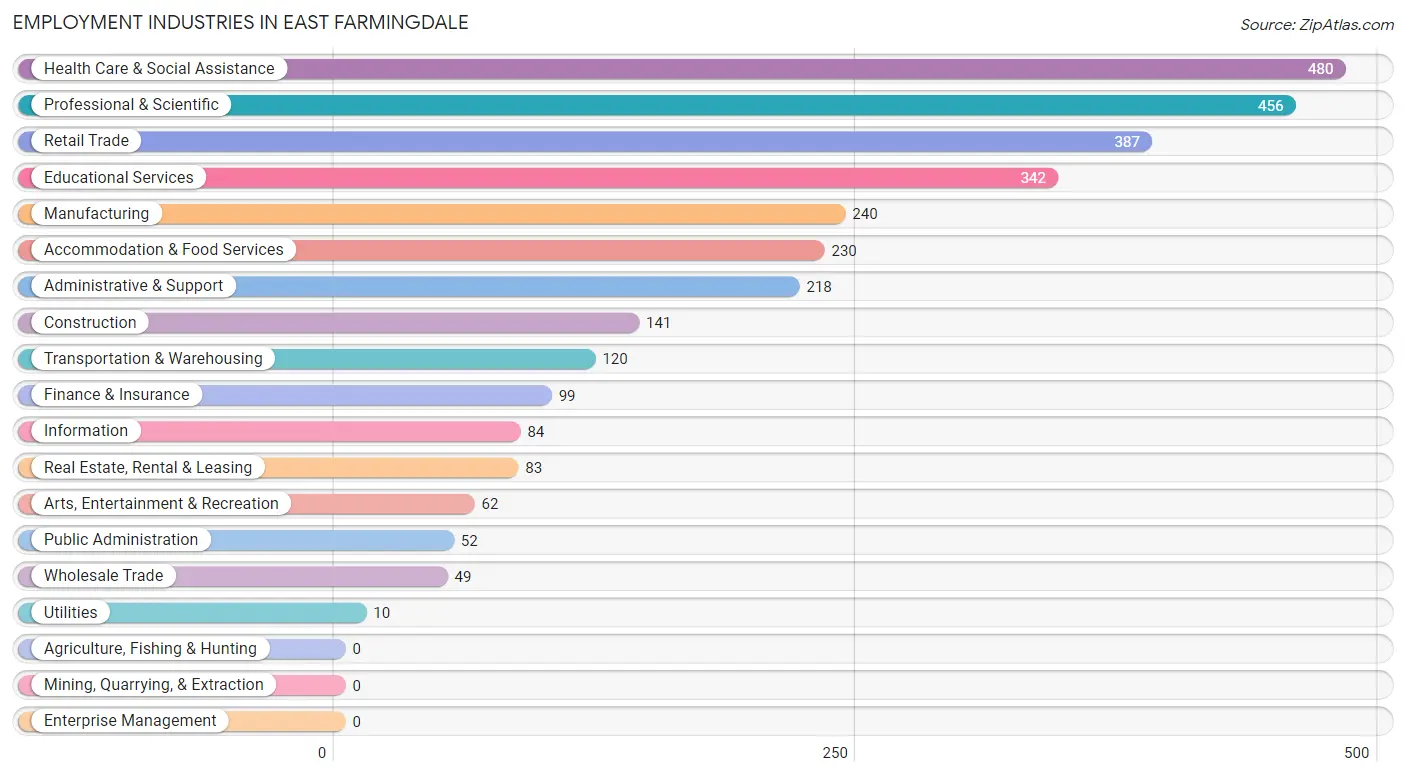
Employment Industries in East Farmingdale
The major employment industries in East Farmingdale include Health Care & Social Assistance (480 | 15.4%), Professional & Scientific (456 | 14.6%), Retail Trade (387 | 12.4%), Educational Services (342 | 11.0%), and Manufacturing (240 | 7.7%).
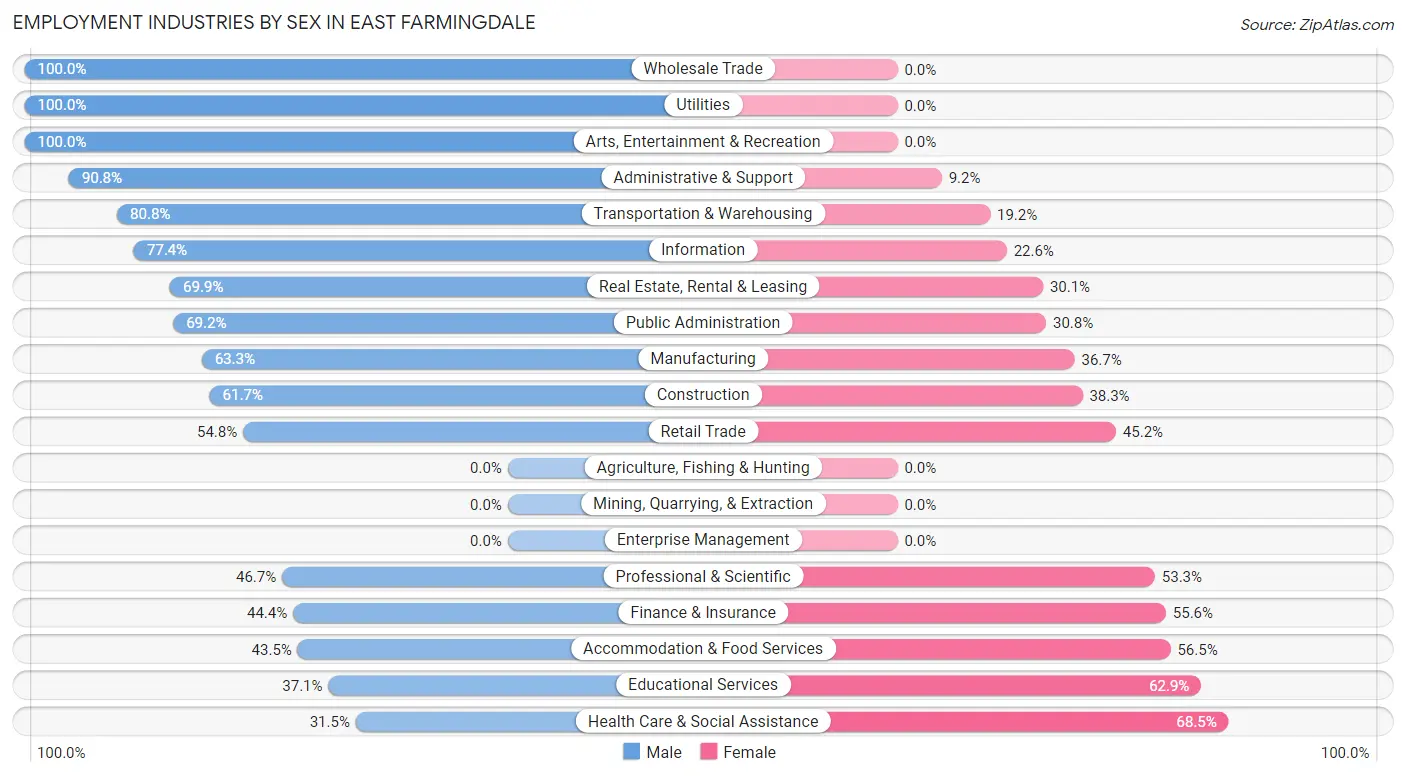
Employment Industries by Sex in East Farmingdale
The East Farmingdale industries that see more men than women are Wholesale Trade (100.0%), Utilities (100.0%), and Arts, Entertainment & Recreation (100.0%), whereas the industries that tend to have a higher number of women are Health Care & Social Assistance (68.5%), Educational Services (62.9%), and Accommodation & Food Services (56.5%).
| Industry | Male | Female |
| Agriculture, Fishing & Hunting | 0 (0.0%) | 0 (0.0%) |
| Mining, Quarrying, & Extraction | 0 (0.0%) | 0 (0.0%) |
| Construction | 87 (61.7%) | 54 (38.3%) |
| Manufacturing | 152 (63.3%) | 88 (36.7%) |
| Wholesale Trade | 49 (100.0%) | 0 (0.0%) |
| Retail Trade | 212 (54.8%) | 175 (45.2%) |
| Transportation & Warehousing | 97 (80.8%) | 23 (19.2%) |
| Utilities | 10 (100.0%) | 0 (0.0%) |
| Information | 65 (77.4%) | 19 (22.6%) |
| Finance & Insurance | 44 (44.4%) | 55 (55.6%) |
| Real Estate, Rental & Leasing | 58 (69.9%) | 25 (30.1%) |
| Professional & Scientific | 213 (46.7%) | 243 (53.3%) |
| Enterprise Management | 0 (0.0%) | 0 (0.0%) |
| Administrative & Support | 198 (90.8%) | 20 (9.2%) |
| Educational Services | 127 (37.1%) | 215 (62.9%) |
| Health Care & Social Assistance | 151 (31.5%) | 329 (68.5%) |
| Arts, Entertainment & Recreation | 62 (100.0%) | 0 (0.0%) |
| Accommodation & Food Services | 100 (43.5%) | 130 (56.5%) |
| Public Administration | 36 (69.2%) | 16 (30.8%) |
| Total | 1,680 (53.9%) | 1,437 (46.1%) |
Education in East Farmingdale
School Enrollment in East Farmingdale
The most common levels of schooling among the 1,661 students in East Farmingdale are college / undergraduate (698 | 42.0%), middle school (352 | 21.2%), and elementary school (217 | 13.1%).
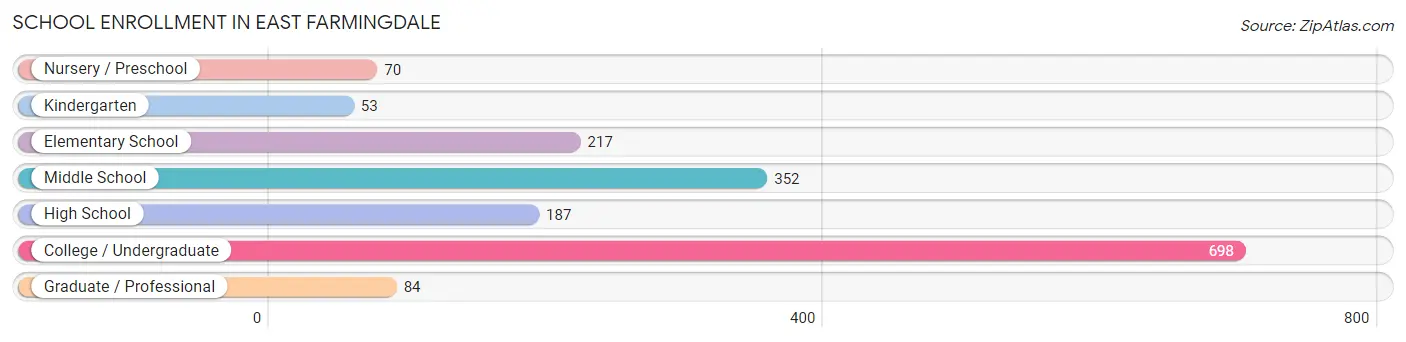
| School Level | # Students | % Students |
| Nursery / Preschool | 70 | 4.2% |
| Kindergarten | 53 | 3.2% |
| Elementary School | 217 | 13.1% |
| Middle School | 352 | 21.2% |
| High School | 187 | 11.3% |
| College / Undergraduate | 698 | 42.0% |
| Graduate / Professional | 84 | 5.1% |
| Total | 1,661 | 100.0% |
School Enrollment by Age by Funding Source in East Farmingdale
Out of a total of 1,661 students who are enrolled in schools in East Farmingdale, 264 (15.9%) attend a private institution, while the remaining 1,397 (84.1%) are enrolled in public schools. The age group of 35 years and over has the highest likelihood of being enrolled in private schools, with 20 (100.0% in the age bracket) enrolled. Conversely, the age group of 5 to 9 year old has the lowest likelihood of being enrolled in a private school, with 278 (100.0% in the age bracket) attending a public institution.
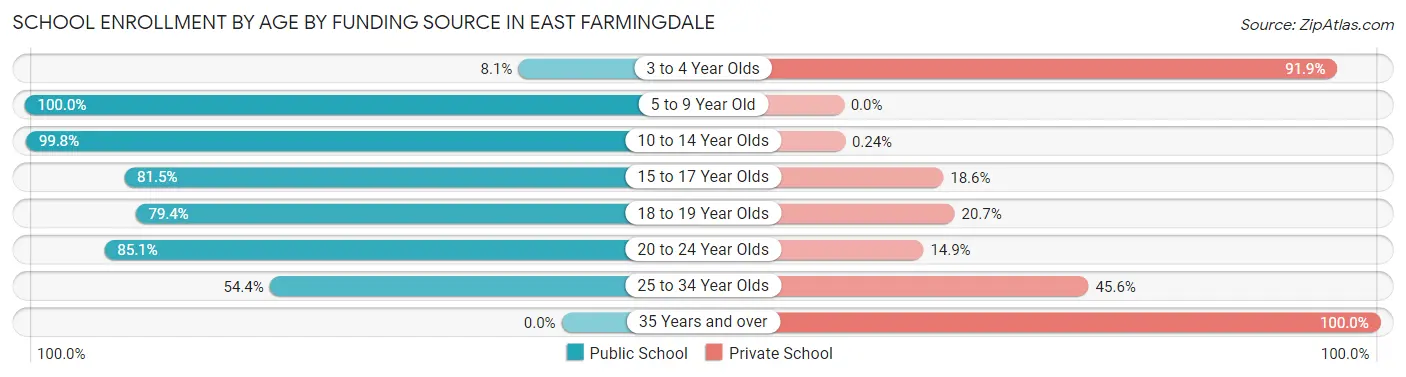
| Age Bracket | Public School | Private School |
| 3 to 4 Year Olds | 5 (8.1%) | 57 (91.9%) |
| 5 to 9 Year Old | 278 (100.0%) | 0 (0.0%) |
| 10 to 14 Year Olds | 413 (99.8%) | 1 (0.2%) |
| 15 to 17 Year Olds | 101 (81.5%) | 23 (18.5%) |
| 18 to 19 Year Olds | 246 (79.3%) | 64 (20.6%) |
| 20 to 24 Year Olds | 298 (85.1%) | 52 (14.9%) |
| 25 to 34 Year Olds | 56 (54.4%) | 47 (45.6%) |
| 35 Years and over | 0 (0.0%) | 20 (100.0%) |
| Total | 1,397 (84.1%) | 264 (15.9%) |
Educational Attainment by Field of Study in East Farmingdale
Business (330 | 17.6%), education (253 | 13.5%), science & technology (242 | 12.9%), social sciences (169 | 9.0%), and literature & languages (157 | 8.4%) are the most common fields of study among 1,879 individuals in East Farmingdale who have obtained a bachelor's degree or higher.
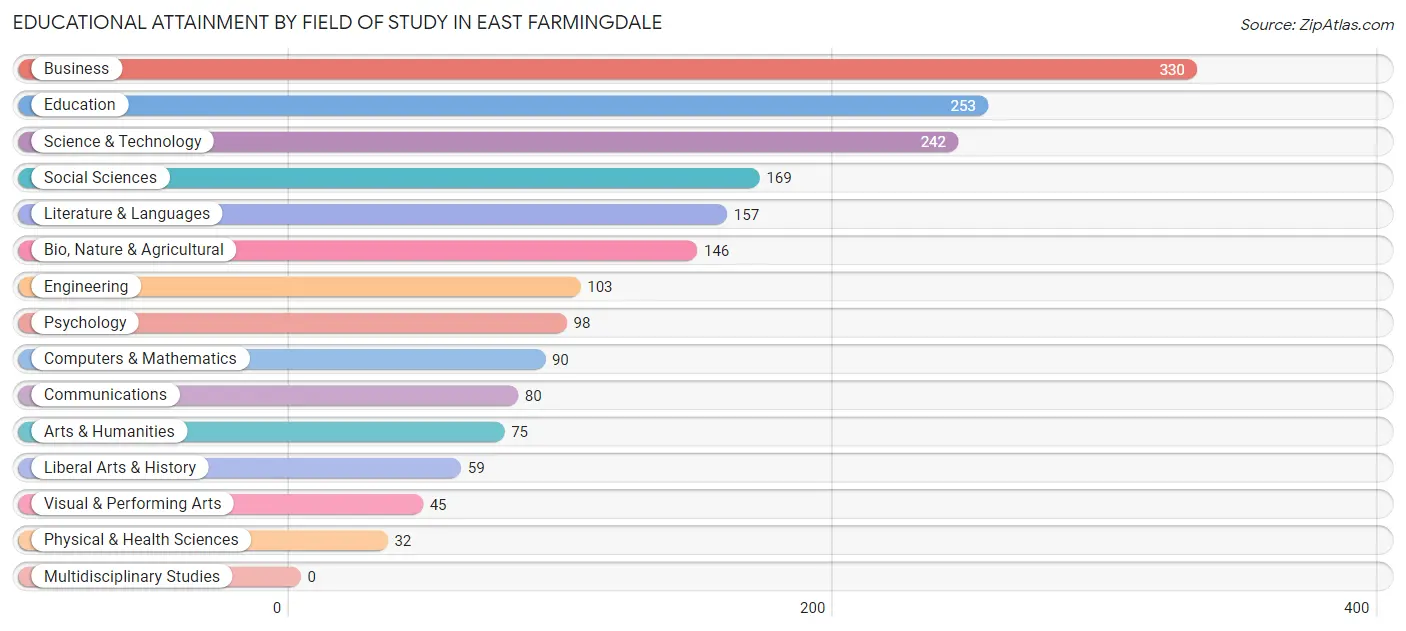
| Field of Study | # Graduates | % Graduates |
| Computers & Mathematics | 90 | 4.8% |
| Bio, Nature & Agricultural | 146 | 7.8% |
| Physical & Health Sciences | 32 | 1.7% |
| Psychology | 98 | 5.2% |
| Social Sciences | 169 | 9.0% |
| Engineering | 103 | 5.5% |
| Multidisciplinary Studies | 0 | 0.0% |
| Science & Technology | 242 | 12.9% |
| Business | 330 | 17.6% |
| Education | 253 | 13.5% |
| Literature & Languages | 157 | 8.4% |
| Liberal Arts & History | 59 | 3.1% |
| Visual & Performing Arts | 45 | 2.4% |
| Communications | 80 | 4.3% |
| Arts & Humanities | 75 | 4.0% |
| Total | 1,879 | 100.0% |
Transportation & Commute in East Farmingdale
Vehicle Availability by Sex in East Farmingdale
The most prevalent vehicle ownership categories in East Farmingdale are males with 2 vehicles (681, accounting for 43.2%) and females with 2 vehicles (550, making up 50.9%).
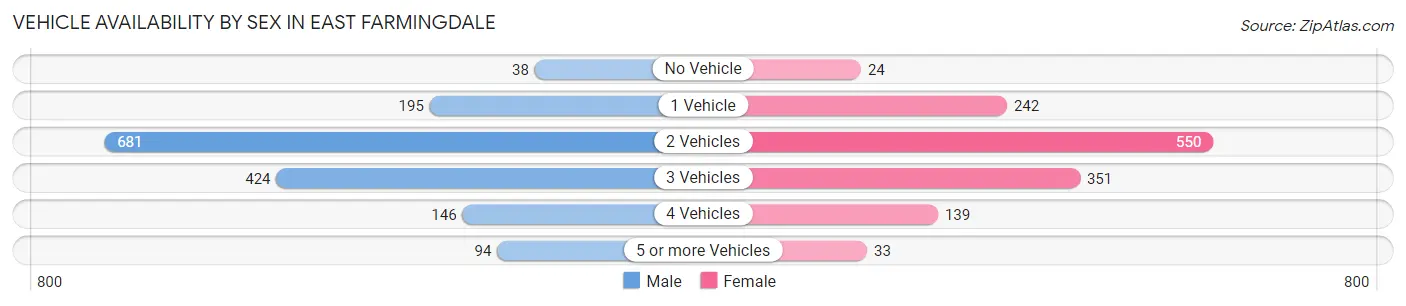
| Vehicles Available | Male | Female |
| No Vehicle | 38 (2.4%) | 24 (1.8%) |
| 1 Vehicle | 195 (12.4%) | 242 (18.1%) |
| 2 Vehicles | 681 (43.2%) | 550 (41.1%) |
| 3 Vehicles | 424 (26.9%) | 351 (26.2%) |
| 4 Vehicles | 146 (9.2%) | 139 (10.4%) |
| 5 or more Vehicles | 94 (6.0%) | 33 (2.5%) |
| Total | 1,578 (100.0%) | 1,339 (100.0%) |
Commute Time in East Farmingdale
The most frequently occuring commute durations in East Farmingdale are 10 to 14 minutes (405 commuters, 14.3%), 15 to 19 minutes (405 commuters, 14.3%), and 20 to 24 minutes (368 commuters, 13.0%).
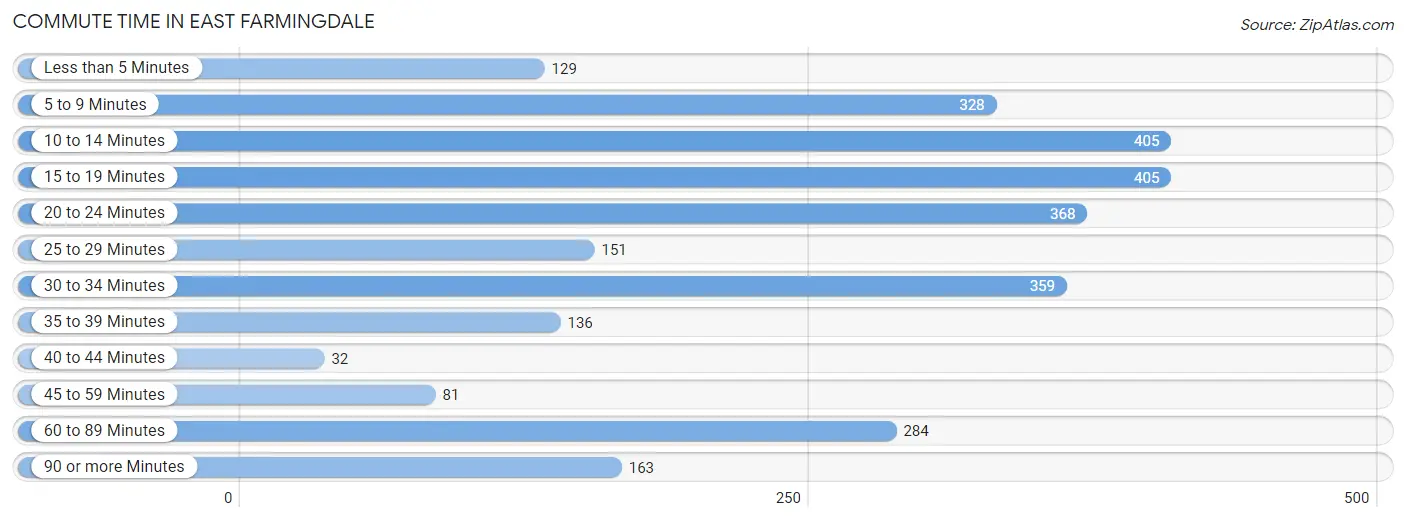
| Commute Time | # Commuters | % Commuters |
| Less than 5 Minutes | 129 | 4.5% |
| 5 to 9 Minutes | 328 | 11.6% |
| 10 to 14 Minutes | 405 | 14.3% |
| 15 to 19 Minutes | 405 | 14.3% |
| 20 to 24 Minutes | 368 | 13.0% |
| 25 to 29 Minutes | 151 | 5.3% |
| 30 to 34 Minutes | 359 | 12.6% |
| 35 to 39 Minutes | 136 | 4.8% |
| 40 to 44 Minutes | 32 | 1.1% |
| 45 to 59 Minutes | 81 | 2.9% |
| 60 to 89 Minutes | 284 | 10.0% |
| 90 or more Minutes | 163 | 5.7% |
Commute Time by Sex in East Farmingdale
The most common commute times in East Farmingdale are 5 to 9 minutes (265 commuters, 17.3%) for males and 10 to 14 minutes (269 commuters, 20.5%) for females.
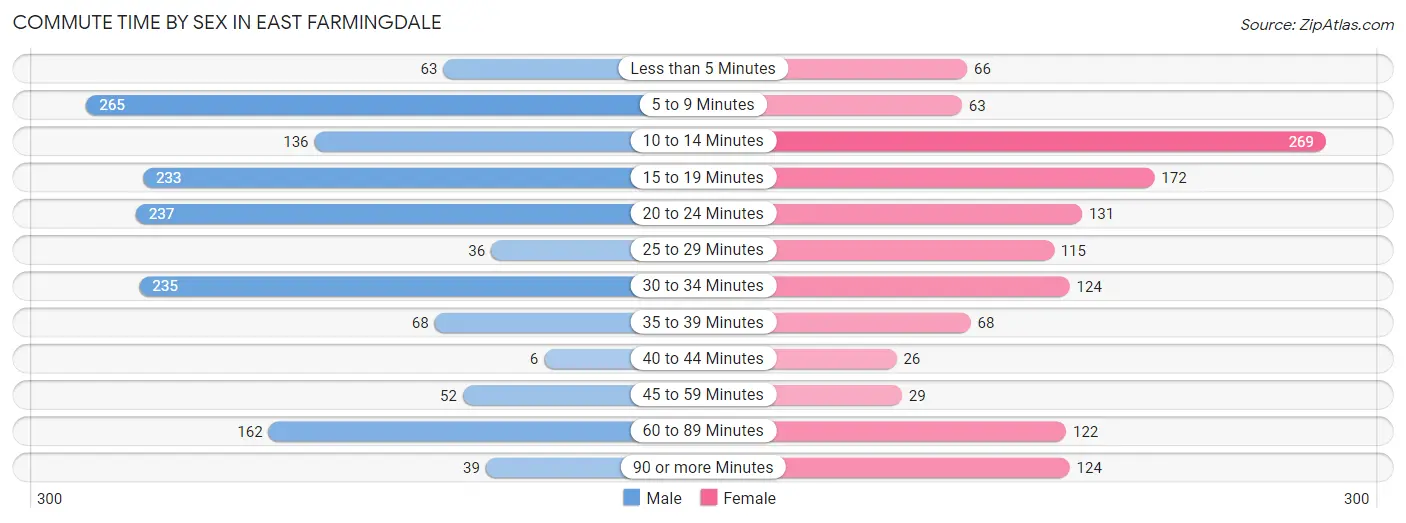
| Commute Time | Male | Female |
| Less than 5 Minutes | 63 (4.1%) | 66 (5.0%) |
| 5 to 9 Minutes | 265 (17.3%) | 63 (4.8%) |
| 10 to 14 Minutes | 136 (8.9%) | 269 (20.5%) |
| 15 to 19 Minutes | 233 (15.2%) | 172 (13.1%) |
| 20 to 24 Minutes | 237 (15.5%) | 131 (10.0%) |
| 25 to 29 Minutes | 36 (2.4%) | 115 (8.8%) |
| 30 to 34 Minutes | 235 (15.3%) | 124 (9.5%) |
| 35 to 39 Minutes | 68 (4.4%) | 68 (5.2%) |
| 40 to 44 Minutes | 6 (0.4%) | 26 (2.0%) |
| 45 to 59 Minutes | 52 (3.4%) | 29 (2.2%) |
| 60 to 89 Minutes | 162 (10.6%) | 122 (9.3%) |
| 90 or more Minutes | 39 (2.5%) | 124 (9.5%) |
Time of Departure to Work by Sex in East Farmingdale
The most frequent times of departure to work in East Farmingdale are 8:30 AM to 8:59 AM (314, 20.5%) for males and 8:00 AM to 8:29 AM (232, 17.7%) for females.
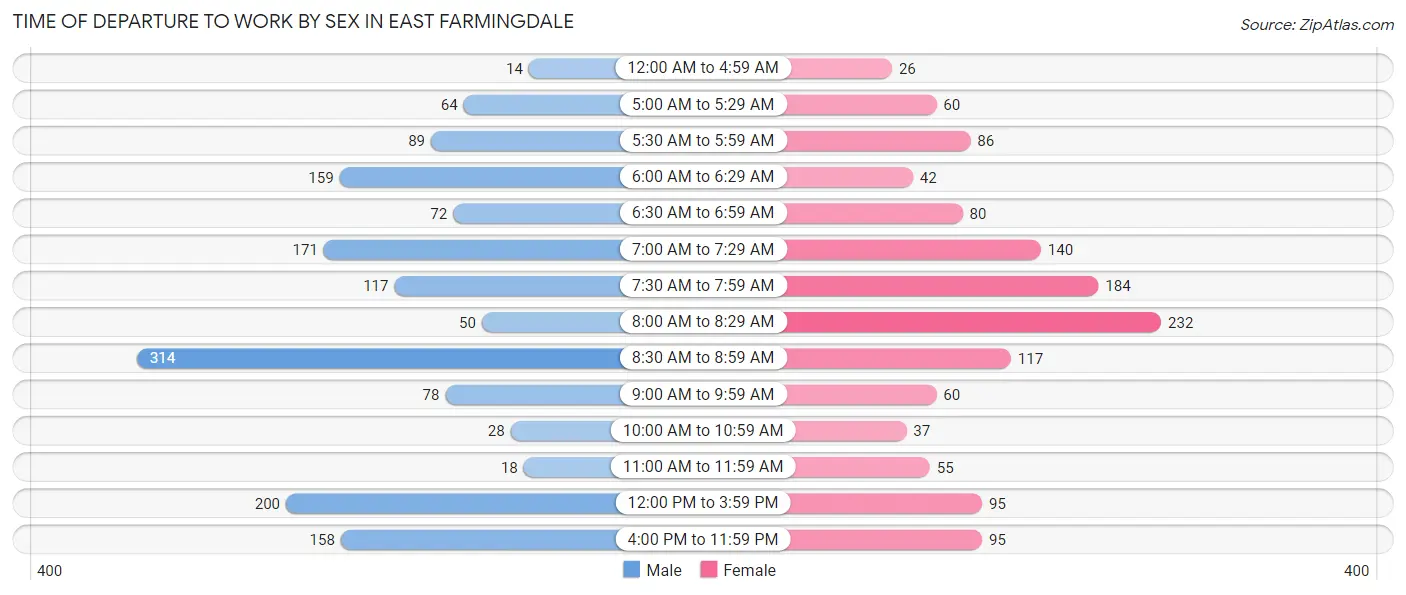
| Time of Departure | Male | Female |
| 12:00 AM to 4:59 AM | 14 (0.9%) | 26 (2.0%) |
| 5:00 AM to 5:29 AM | 64 (4.2%) | 60 (4.6%) |
| 5:30 AM to 5:59 AM | 89 (5.8%) | 86 (6.6%) |
| 6:00 AM to 6:29 AM | 159 (10.4%) | 42 (3.2%) |
| 6:30 AM to 6:59 AM | 72 (4.7%) | 80 (6.1%) |
| 7:00 AM to 7:29 AM | 171 (11.2%) | 140 (10.7%) |
| 7:30 AM to 7:59 AM | 117 (7.6%) | 184 (14.1%) |
| 8:00 AM to 8:29 AM | 50 (3.3%) | 232 (17.7%) |
| 8:30 AM to 8:59 AM | 314 (20.5%) | 117 (8.9%) |
| 9:00 AM to 9:59 AM | 78 (5.1%) | 60 (4.6%) |
| 10:00 AM to 10:59 AM | 28 (1.8%) | 37 (2.8%) |
| 11:00 AM to 11:59 AM | 18 (1.2%) | 55 (4.2%) |
| 12:00 PM to 3:59 PM | 200 (13.1%) | 95 (7.3%) |
| 4:00 PM to 11:59 PM | 158 (10.3%) | 95 (7.3%) |
| Total | 1,532 (100.0%) | 1,309 (100.0%) |
Housing Occupancy in East Farmingdale
Occupancy by Ownership in East Farmingdale
Of the total 1,940 dwellings in East Farmingdale, owner-occupied units account for 1,185 (61.1%), while renter-occupied units make up 755 (38.9%).
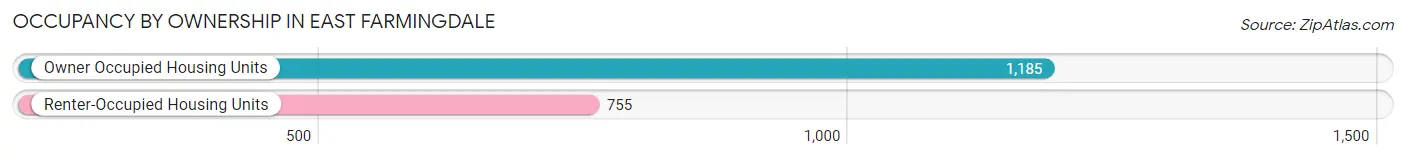
| Occupancy | # Housing Units | % Housing Units |
| Owner Occupied Housing Units | 1,185 | 61.1% |
| Renter-Occupied Housing Units | 755 | 38.9% |
| Total Occupied Housing Units | 1,940 | 100.0% |
Occupancy by Household Size in East Farmingdale
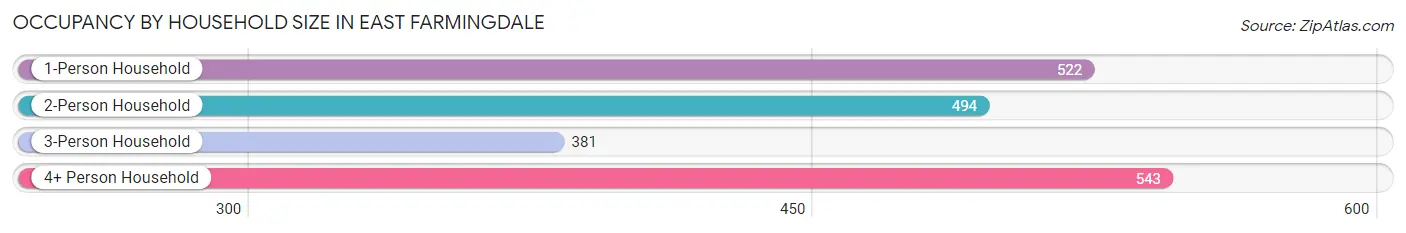
| Household Size | # Housing Units | % Housing Units |
| 1-Person Household | 522 | 26.9% |
| 2-Person Household | 494 | 25.5% |
| 3-Person Household | 381 | 19.6% |
| 4+ Person Household | 543 | 28.0% |
| Total Housing Units | 1,940 | 100.0% |
Occupancy by Ownership by Household Size in East Farmingdale
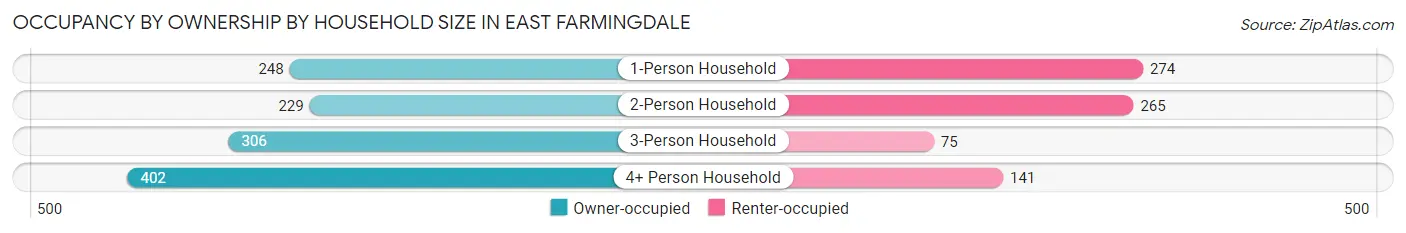
| Household Size | Owner-occupied | Renter-occupied |
| 1-Person Household | 248 (47.5%) | 274 (52.5%) |
| 2-Person Household | 229 (46.4%) | 265 (53.6%) |
| 3-Person Household | 306 (80.3%) | 75 (19.7%) |
| 4+ Person Household | 402 (74.0%) | 141 (26.0%) |
| Total Housing Units | 1,185 (61.1%) | 755 (38.9%) |
Occupancy by Educational Attainment in East Farmingdale
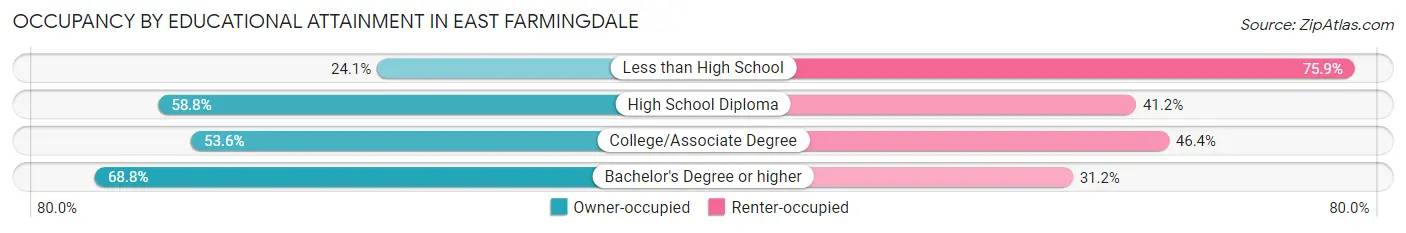
| Household Size | Owner-occupied | Renter-occupied |
| Less than High School | 20 (24.1%) | 63 (75.9%) |
| High School Diploma | 301 (58.8%) | 211 (41.2%) |
| College/Associate Degree | 217 (53.6%) | 188 (46.4%) |
| Bachelor's Degree or higher | 647 (68.8%) | 293 (31.2%) |
Occupancy by Age of Householder in East Farmingdale
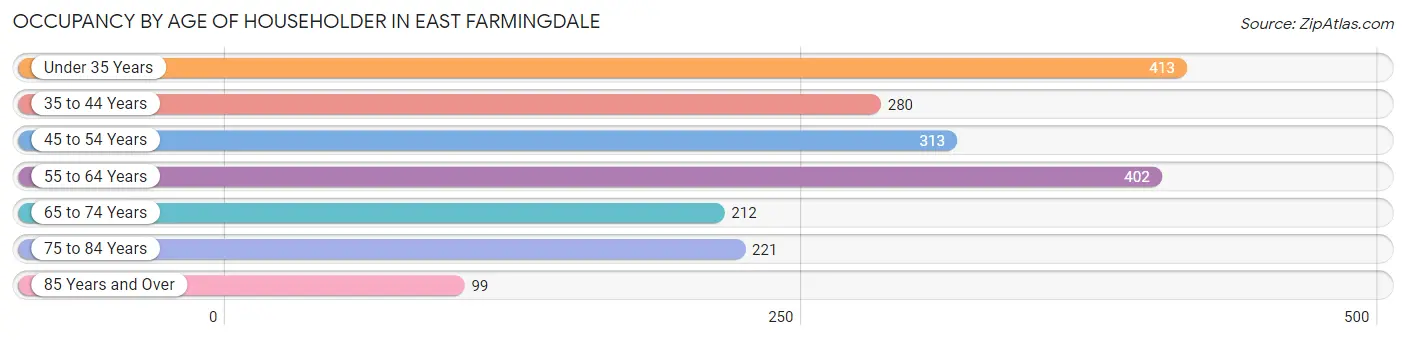
| Age Bracket | # Households | % Households |
| Under 35 Years | 413 | 21.3% |
| 35 to 44 Years | 280 | 14.4% |
| 45 to 54 Years | 313 | 16.1% |
| 55 to 64 Years | 402 | 20.7% |
| 65 to 74 Years | 212 | 10.9% |
| 75 to 84 Years | 221 | 11.4% |
| 85 Years and Over | 99 | 5.1% |
| Total | 1,940 | 100.0% |
Housing Finances in East Farmingdale
Median Income by Occupancy in East Farmingdale
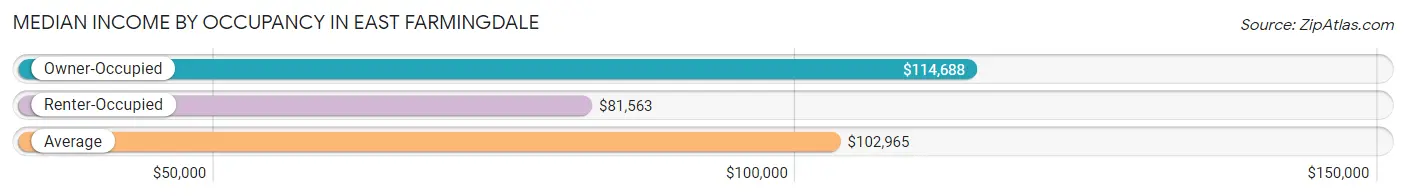
| Occupancy Type | # Households | Median Income |
| Owner-Occupied | 1,185 (61.1%) | $114,688 |
| Renter-Occupied | 755 (38.9%) | $81,563 |
| Average | 1,940 (100.0%) | $102,965 |
Occupancy by Householder Income Bracket in East Farmingdale
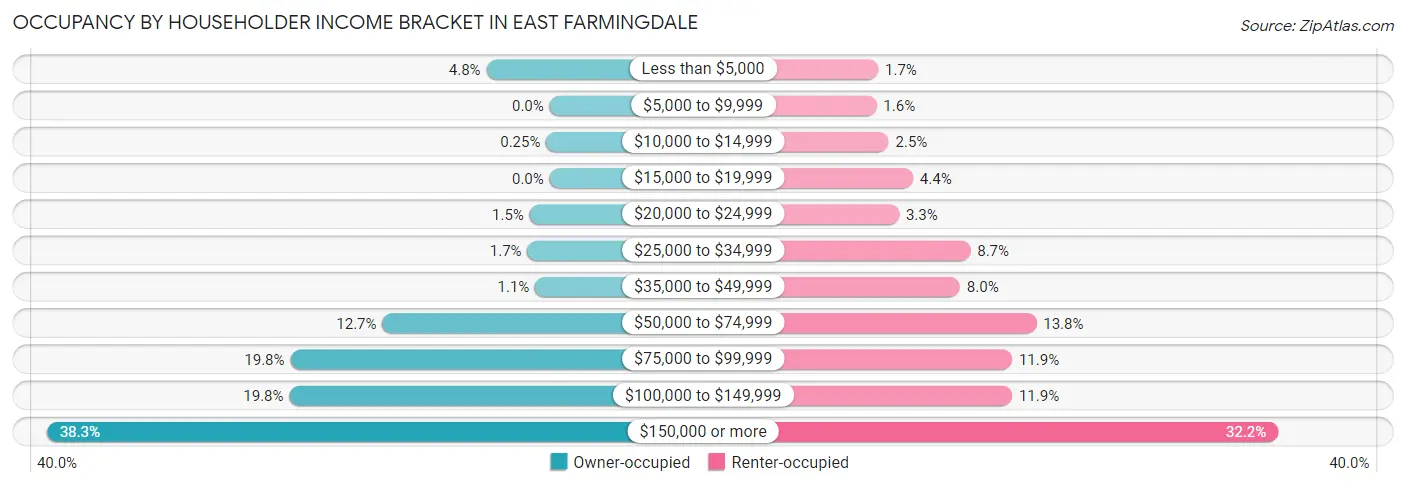
| Income Bracket | Owner-occupied | Renter-occupied |
| Less than $5,000 | 57 (4.8%) | 13 (1.7%) |
| $5,000 to $9,999 | 0 (0.0%) | 12 (1.6%) |
| $10,000 to $14,999 | 3 (0.3%) | 19 (2.5%) |
| $15,000 to $19,999 | 0 (0.0%) | 33 (4.4%) |
| $20,000 to $24,999 | 18 (1.5%) | 25 (3.3%) |
| $25,000 to $34,999 | 20 (1.7%) | 66 (8.7%) |
| $35,000 to $49,999 | 13 (1.1%) | 60 (8.0%) |
| $50,000 to $74,999 | 151 (12.7%) | 104 (13.8%) |
| $75,000 to $99,999 | 234 (19.8%) | 90 (11.9%) |
| $100,000 to $149,999 | 235 (19.8%) | 90 (11.9%) |
| $150,000 or more | 454 (38.3%) | 243 (32.2%) |
| Total | 1,185 (100.0%) | 755 (100.0%) |
Monthly Housing Cost Tiers in East Farmingdale
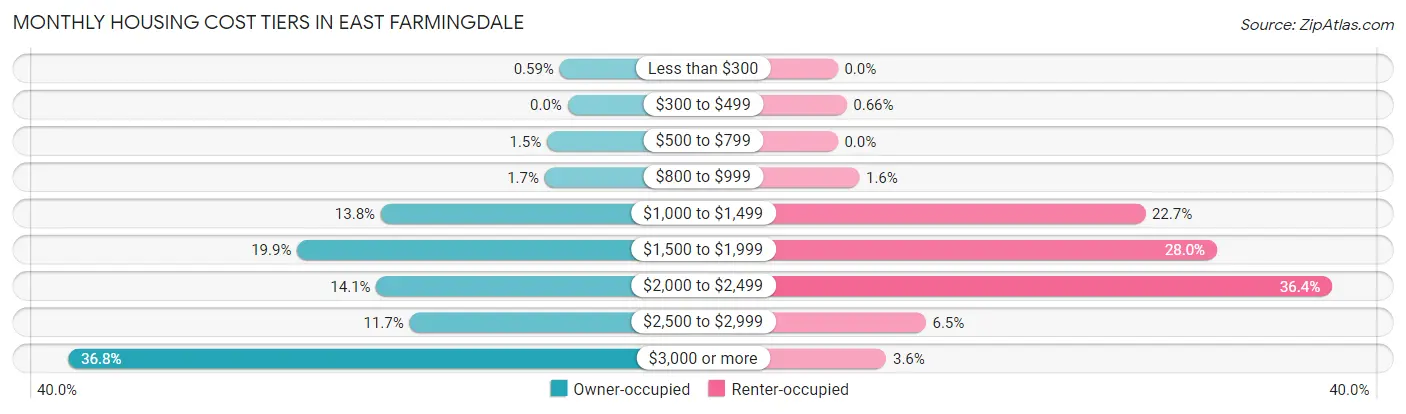
| Monthly Cost | Owner-occupied | Renter-occupied |
| Less than $300 | 7 (0.6%) | 0 (0.0%) |
| $300 to $499 | 0 (0.0%) | 5 (0.7%) |
| $500 to $799 | 18 (1.5%) | 0 (0.0%) |
| $800 to $999 | 20 (1.7%) | 12 (1.6%) |
| $1,000 to $1,499 | 163 (13.8%) | 171 (22.7%) |
| $1,500 to $1,999 | 236 (19.9%) | 211 (28.0%) |
| $2,000 to $2,499 | 167 (14.1%) | 275 (36.4%) |
| $2,500 to $2,999 | 138 (11.7%) | 49 (6.5%) |
| $3,000 or more | 436 (36.8%) | 27 (3.6%) |
| Total | 1,185 (100.0%) | 755 (100.0%) |
Physical Housing Characteristics in East Farmingdale
Housing Structures in East Farmingdale
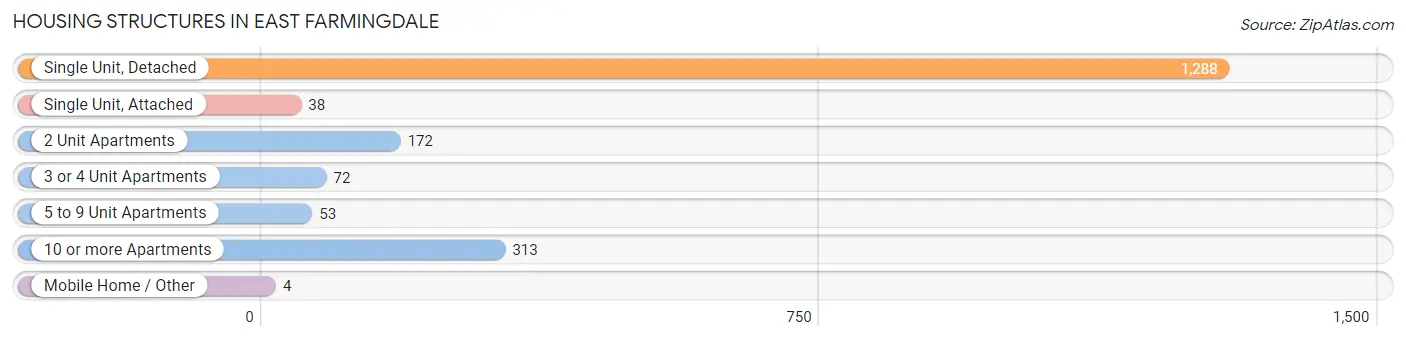
| Structure Type | # Housing Units | % Housing Units |
| Single Unit, Detached | 1,288 | 66.4% |
| Single Unit, Attached | 38 | 2.0% |
| 2 Unit Apartments | 172 | 8.9% |
| 3 or 4 Unit Apartments | 72 | 3.7% |
| 5 to 9 Unit Apartments | 53 | 2.7% |
| 10 or more Apartments | 313 | 16.1% |
| Mobile Home / Other | 4 | 0.2% |
| Total | 1,940 | 100.0% |
Housing Structures by Occupancy in East Farmingdale
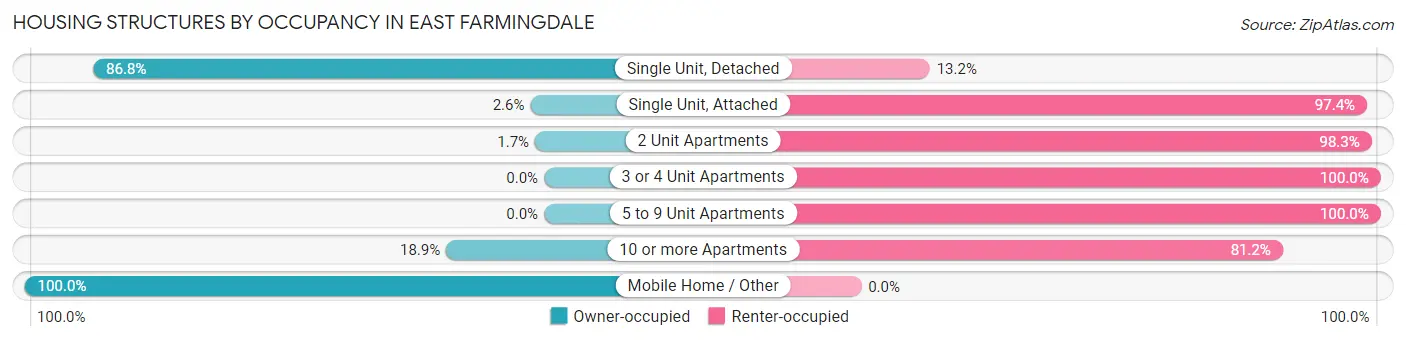
| Structure Type | Owner-occupied | Renter-occupied |
| Single Unit, Detached | 1,118 (86.8%) | 170 (13.2%) |
| Single Unit, Attached | 1 (2.6%) | 37 (97.4%) |
| 2 Unit Apartments | 3 (1.7%) | 169 (98.3%) |
| 3 or 4 Unit Apartments | 0 (0.0%) | 72 (100.0%) |
| 5 to 9 Unit Apartments | 0 (0.0%) | 53 (100.0%) |
| 10 or more Apartments | 59 (18.9%) | 254 (81.1%) |
| Mobile Home / Other | 4 (100.0%) | 0 (0.0%) |
| Total | 1,185 (61.1%) | 755 (38.9%) |
Housing Structures by Number of Rooms in East Farmingdale
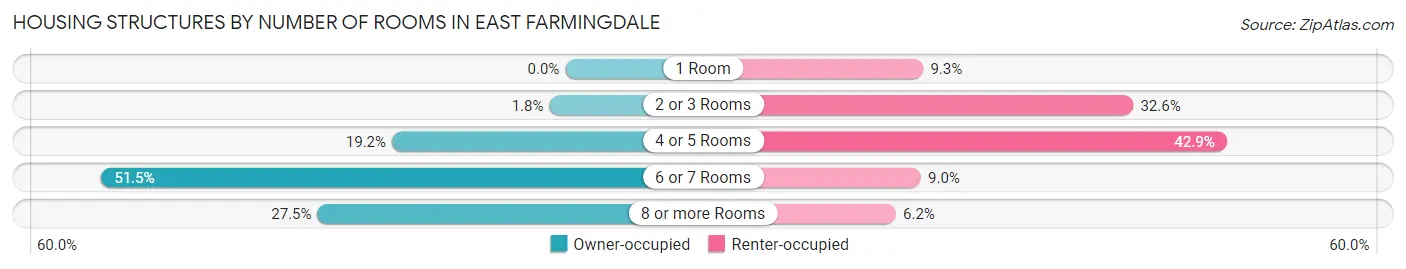
| Number of Rooms | Owner-occupied | Renter-occupied |
| 1 Room | 0 (0.0%) | 70 (9.3%) |
| 2 or 3 Rooms | 21 (1.8%) | 246 (32.6%) |
| 4 or 5 Rooms | 228 (19.2%) | 324 (42.9%) |
| 6 or 7 Rooms | 610 (51.5%) | 68 (9.0%) |
| 8 or more Rooms | 326 (27.5%) | 47 (6.2%) |
| Total | 1,185 (100.0%) | 755 (100.0%) |
Housing Structure by Heating Type in East Farmingdale
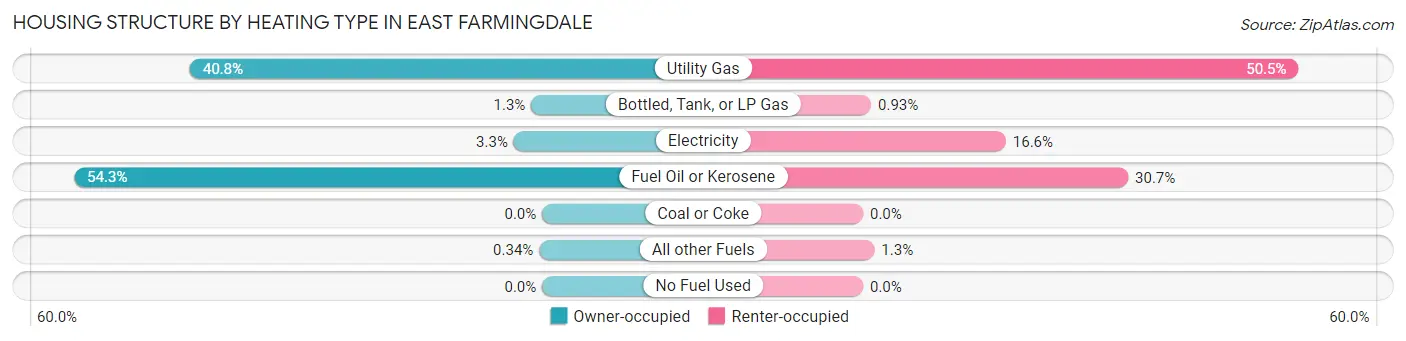
| Heating Type | Owner-occupied | Renter-occupied |
| Utility Gas | 484 (40.8%) | 381 (50.5%) |
| Bottled, Tank, or LP Gas | 15 (1.3%) | 7 (0.9%) |
| Electricity | 39 (3.3%) | 125 (16.6%) |
| Fuel Oil or Kerosene | 643 (54.3%) | 232 (30.7%) |
| Coal or Coke | 0 (0.0%) | 0 (0.0%) |
| All other Fuels | 4 (0.3%) | 10 (1.3%) |
| No Fuel Used | 0 (0.0%) | 0 (0.0%) |
| Total | 1,185 (100.0%) | 755 (100.0%) |
Household Vehicle Usage in East Farmingdale
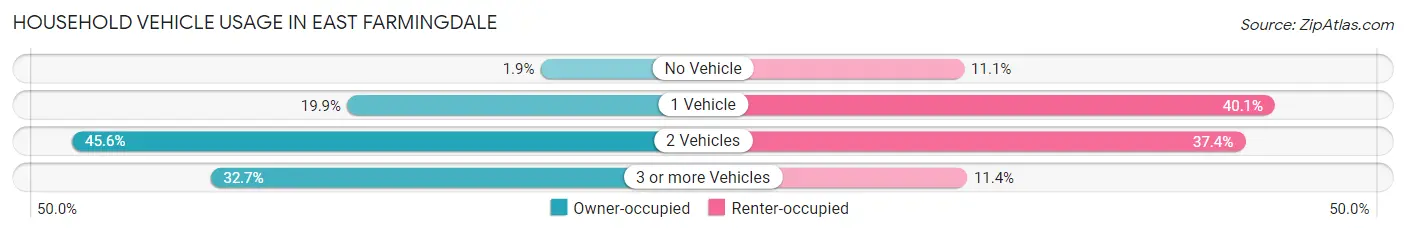
| Vehicles per Household | Owner-occupied | Renter-occupied |
| No Vehicle | 22 (1.9%) | 84 (11.1%) |
| 1 Vehicle | 236 (19.9%) | 303 (40.1%) |
| 2 Vehicles | 540 (45.6%) | 282 (37.3%) |
| 3 or more Vehicles | 387 (32.7%) | 86 (11.4%) |
| Total | 1,185 (100.0%) | 755 (100.0%) |
Real Estate & Mortgages in East Farmingdale
Real Estate and Mortgage Overview in East Farmingdale
| Characteristic | Without Mortgage | With Mortgage |
| Housing Units | 410 | 775 |
| Median Property Value | $491,100 | $549,900 |
| Median Household Income | $98,222 | $336 |
| Monthly Housing Costs | $1,501 | $424 |
| Real Estate Taxes | $10,001 | $14 |
Property Value by Mortgage Status in East Farmingdale
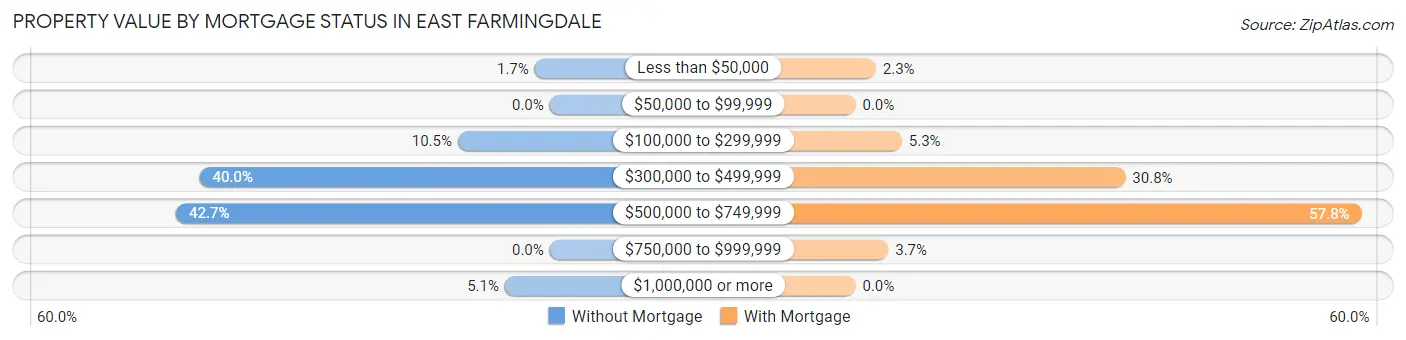
| Property Value | Without Mortgage | With Mortgage |
| Less than $50,000 | 7 (1.7%) | 18 (2.3%) |
| $50,000 to $99,999 | 0 (0.0%) | 0 (0.0%) |
| $100,000 to $299,999 | 43 (10.5%) | 41 (5.3%) |
| $300,000 to $499,999 | 164 (40.0%) | 239 (30.8%) |
| $500,000 to $749,999 | 175 (42.7%) | 448 (57.8%) |
| $750,000 to $999,999 | 0 (0.0%) | 29 (3.7%) |
| $1,000,000 or more | 21 (5.1%) | 0 (0.0%) |
| Total | 410 (100.0%) | 775 (100.0%) |
Household Income by Mortgage Status in East Farmingdale
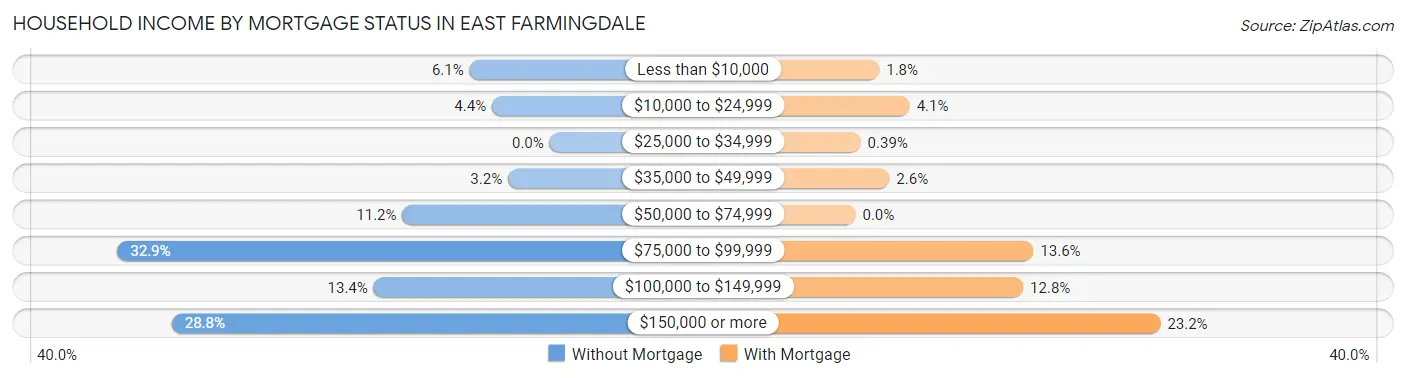
| Household Income | Without Mortgage | With Mortgage |
| Less than $10,000 | 25 (6.1%) | 14 (1.8%) |
| $10,000 to $24,999 | 18 (4.4%) | 32 (4.1%) |
| $25,000 to $34,999 | 0 (0.0%) | 3 (0.4%) |
| $35,000 to $49,999 | 13 (3.2%) | 20 (2.6%) |
| $50,000 to $74,999 | 46 (11.2%) | 0 (0.0%) |
| $75,000 to $99,999 | 135 (32.9%) | 105 (13.6%) |
| $100,000 to $149,999 | 55 (13.4%) | 99 (12.8%) |
| $150,000 or more | 118 (28.8%) | 180 (23.2%) |
| Total | 410 (100.0%) | 775 (100.0%) |
Property Value to Household Income Ratio in East Farmingdale
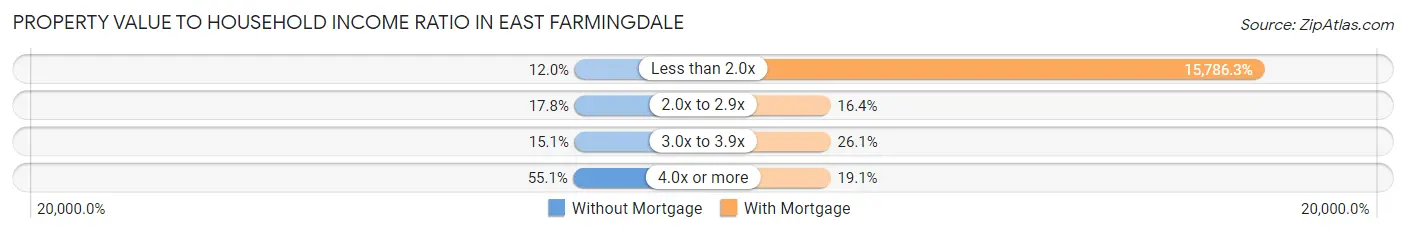
| Value-to-Income Ratio | Without Mortgage | With Mortgage |
| Less than 2.0x | 49 (11.9%) | 122,344 (15,786.3%) |
| 2.0x to 2.9x | 73 (17.8%) | 127 (16.4%) |
| 3.0x to 3.9x | 62 (15.1%) | 202 (26.1%) |
| 4.0x or more | 226 (55.1%) | 148 (19.1%) |
| Total | 410 (100.0%) | 775 (100.0%) |
Real Estate Taxes by Mortgage Status in East Farmingdale
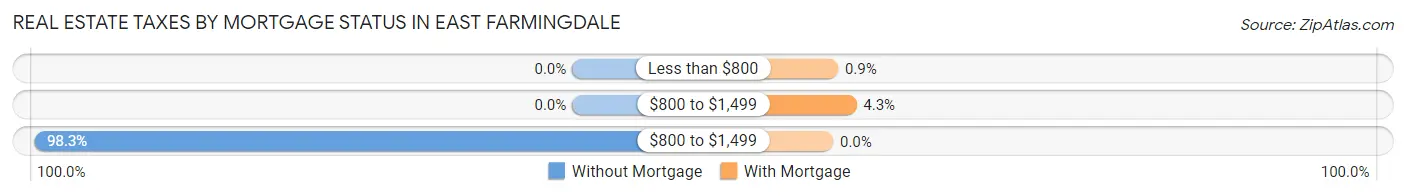
| Property Taxes | Without Mortgage | With Mortgage |
| Less than $800 | 0 (0.0%) | 7 (0.9%) |
| $800 to $1,499 | 0 (0.0%) | 33 (4.3%) |
| $800 to $1,499 | 403 (98.3%) | 0 (0.0%) |
| Total | 410 (100.0%) | 775 (100.0%) |
Health & Disability in East Farmingdale
Health Insurance Coverage by Age in East Farmingdale
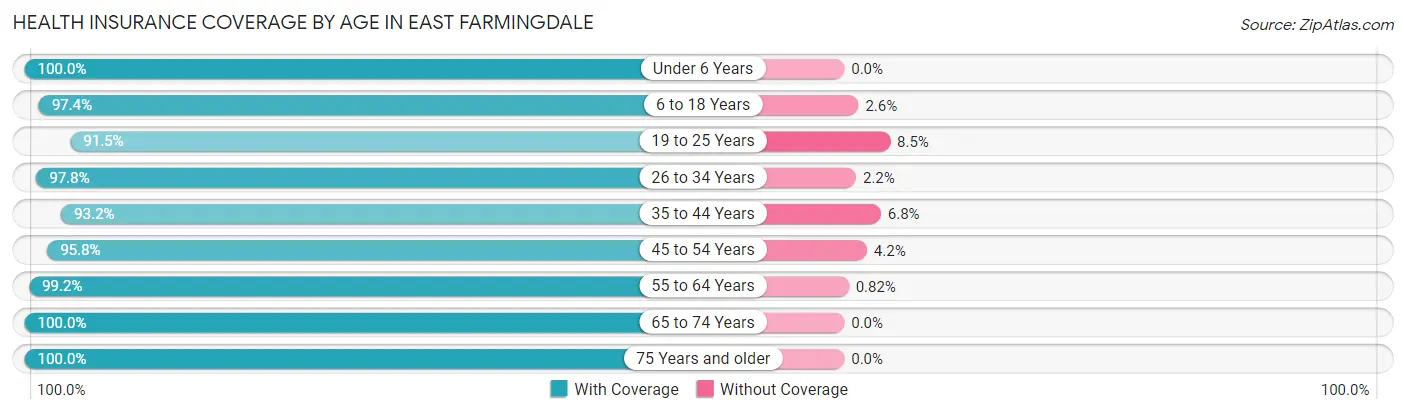
| Age Bracket | With Coverage | Without Coverage |
| Under 6 Years | 329 (100.0%) | 0 (0.0%) |
| 6 to 18 Years | 958 (97.4%) | 26 (2.6%) |
| 19 to 25 Years | 739 (91.5%) | 69 (8.5%) |
| 26 to 34 Years | 1,070 (97.8%) | 24 (2.2%) |
| 35 to 44 Years | 560 (93.2%) | 41 (6.8%) |
| 45 to 54 Years | 658 (95.8%) | 29 (4.2%) |
| 55 to 64 Years | 729 (99.2%) | 6 (0.8%) |
| 65 to 74 Years | 331 (100.0%) | 0 (0.0%) |
| 75 Years and older | 466 (100.0%) | 0 (0.0%) |
| Total | 5,840 (96.8%) | 195 (3.2%) |
Health Insurance Coverage by Citizenship Status in East Farmingdale
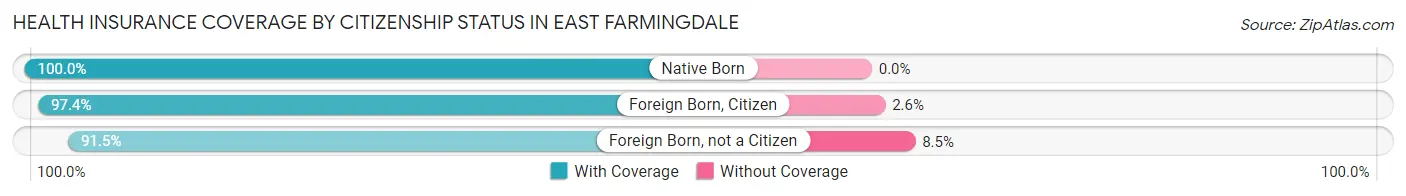
| Citizenship Status | With Coverage | Without Coverage |
| Native Born | 329 (100.0%) | 0 (0.0%) |
| Foreign Born, Citizen | 958 (97.4%) | 26 (2.6%) |
| Foreign Born, not a Citizen | 739 (91.5%) | 69 (8.5%) |
Health Insurance Coverage by Household Income in East Farmingdale
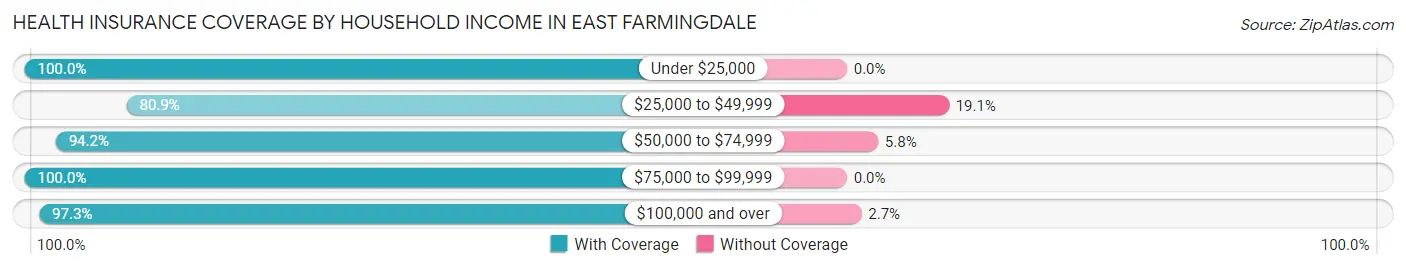
| Household Income | With Coverage | Without Coverage |
| Under $25,000 | 222 (100.0%) | 0 (0.0%) |
| $25,000 to $49,999 | 267 (80.9%) | 63 (19.1%) |
| $50,000 to $74,999 | 614 (94.2%) | 38 (5.8%) |
| $75,000 to $99,999 | 974 (100.0%) | 0 (0.0%) |
| $100,000 and over | 3,343 (97.3%) | 94 (2.7%) |
Public vs Private Health Insurance Coverage by Age in East Farmingdale
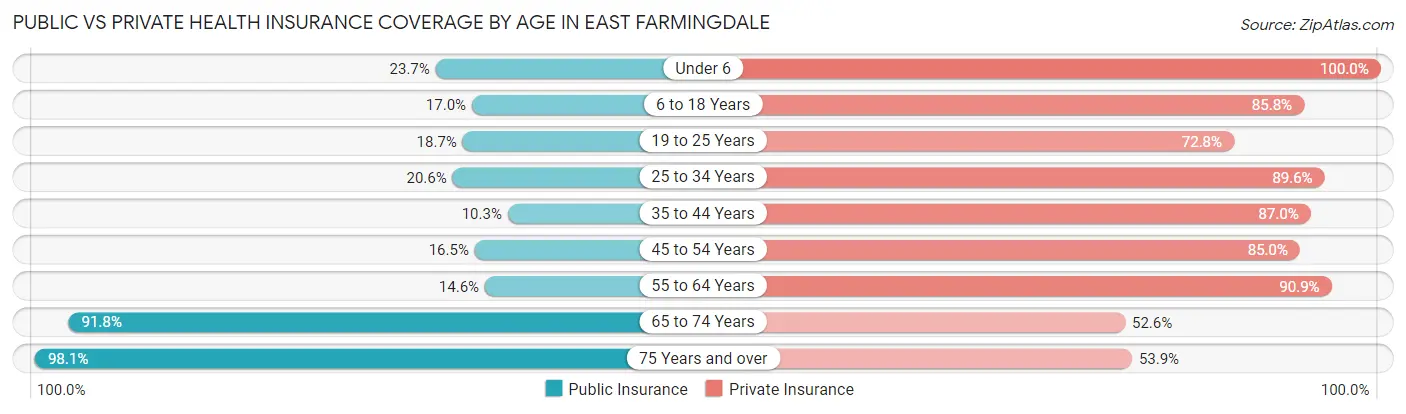
| Age Bracket | Public Insurance | Private Insurance |
| Under 6 | 78 (23.7%) | 329 (100.0%) |
| 6 to 18 Years | 167 (17.0%) | 844 (85.8%) |
| 19 to 25 Years | 151 (18.7%) | 588 (72.8%) |
| 25 to 34 Years | 225 (20.6%) | 980 (89.6%) |
| 35 to 44 Years | 62 (10.3%) | 523 (87.0%) |
| 45 to 54 Years | 113 (16.5%) | 584 (85.0%) |
| 55 to 64 Years | 107 (14.6%) | 668 (90.9%) |
| 65 to 74 Years | 304 (91.8%) | 174 (52.6%) |
| 75 Years and over | 457 (98.1%) | 251 (53.9%) |
| Total | 1,664 (27.6%) | 4,941 (81.9%) |
Disability Status by Sex by Age in East Farmingdale
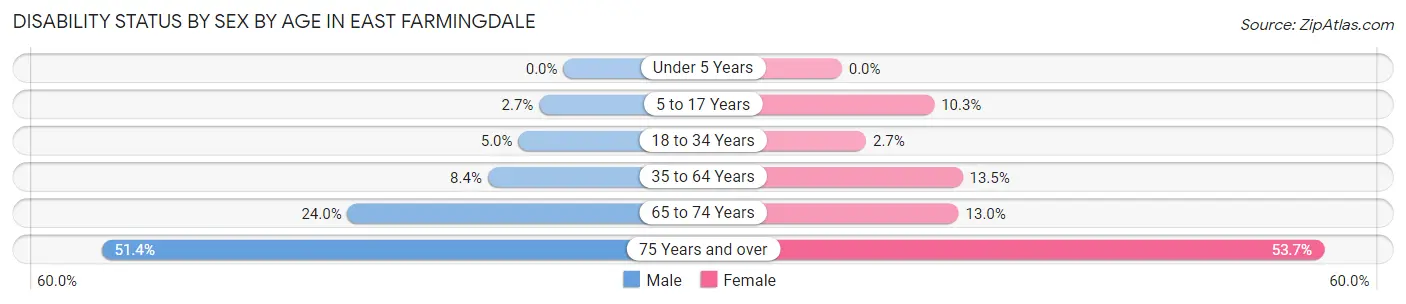
| Age Bracket | Male | Female |
| Under 5 Years | 0 (0.0%) | 0 (0.0%) |
| 5 to 17 Years | 13 (2.7%) | 39 (10.3%) |
| 18 to 34 Years | 64 (5.0%) | 22 (2.7%) |
| 35 to 64 Years | 77 (8.4%) | 149 (13.5%) |
| 65 to 74 Years | 50 (24.0%) | 16 (13.0%) |
| 75 Years and over | 72 (51.4%) | 175 (53.7%) |
Disability Class by Sex by Age in East Farmingdale
Disability Class: Hearing Difficulty
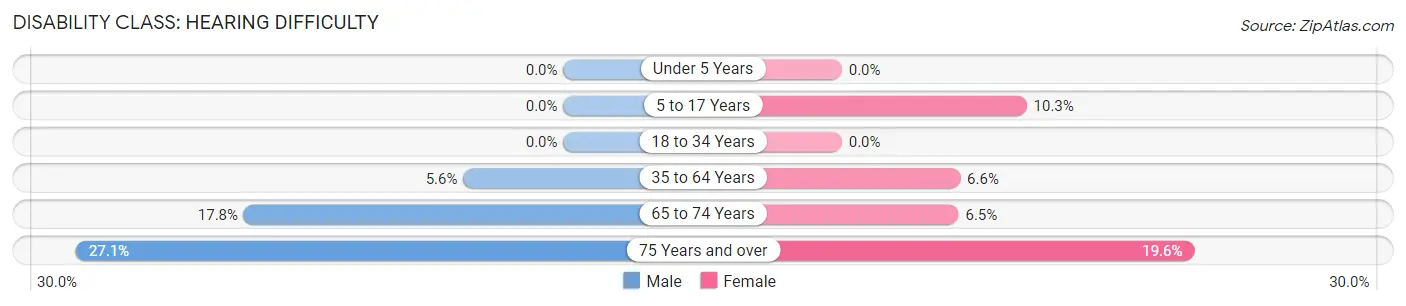
| Age Bracket | Male | Female |
| Under 5 Years | 0 (0.0%) | 0 (0.0%) |
| 5 to 17 Years | 0 (0.0%) | 39 (10.3%) |
| 18 to 34 Years | 0 (0.0%) | 0 (0.0%) |
| 35 to 64 Years | 51 (5.6%) | 73 (6.6%) |
| 65 to 74 Years | 37 (17.8%) | 8 (6.5%) |
| 75 Years and over | 38 (27.1%) | 64 (19.6%) |
Disability Class: Vision Difficulty
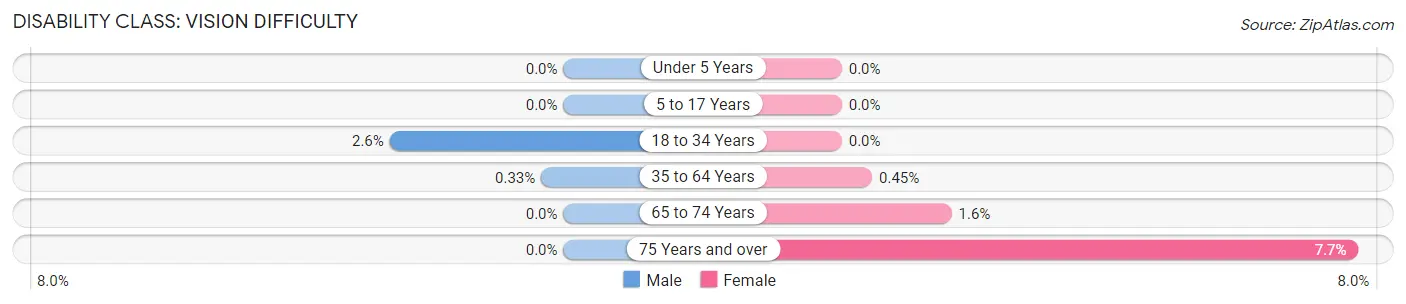
| Age Bracket | Male | Female |
| Under 5 Years | 0 (0.0%) | 0 (0.0%) |
| 5 to 17 Years | 0 (0.0%) | 0 (0.0%) |
| 18 to 34 Years | 33 (2.6%) | 0 (0.0%) |
| 35 to 64 Years | 3 (0.3%) | 5 (0.4%) |
| 65 to 74 Years | 0 (0.0%) | 2 (1.6%) |
| 75 Years and over | 0 (0.0%) | 25 (7.7%) |
Disability Class: Cognitive Difficulty
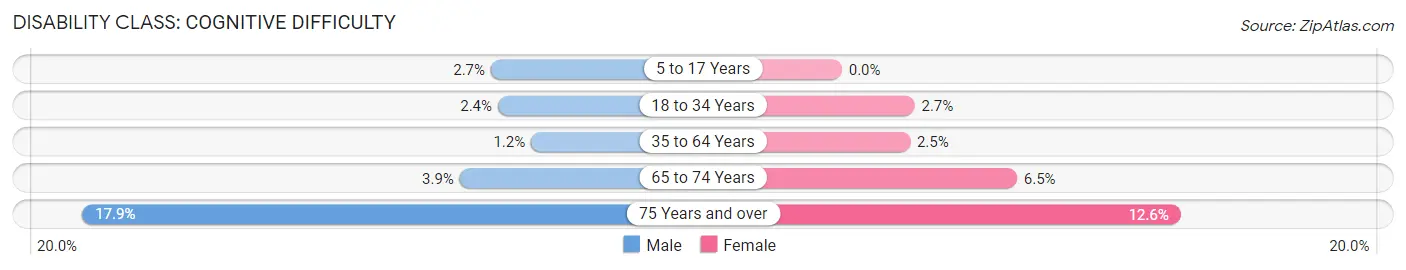
| Age Bracket | Male | Female |
| 5 to 17 Years | 13 (2.7%) | 0 (0.0%) |
| 18 to 34 Years | 31 (2.4%) | 22 (2.7%) |
| 35 to 64 Years | 11 (1.2%) | 28 (2.5%) |
| 65 to 74 Years | 8 (3.8%) | 8 (6.5%) |
| 75 Years and over | 25 (17.9%) | 41 (12.6%) |
Disability Class: Ambulatory Difficulty
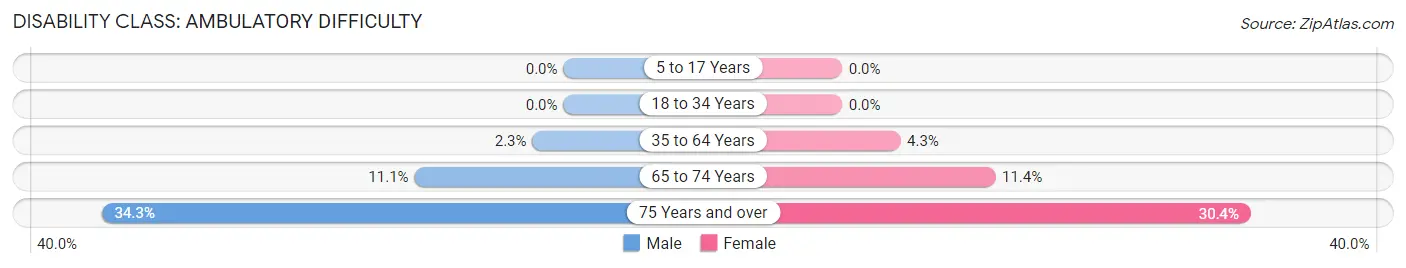
| Age Bracket | Male | Female |
| 5 to 17 Years | 0 (0.0%) | 0 (0.0%) |
| 18 to 34 Years | 0 (0.0%) | 0 (0.0%) |
| 35 to 64 Years | 21 (2.3%) | 48 (4.3%) |
| 65 to 74 Years | 23 (11.1%) | 14 (11.4%) |
| 75 Years and over | 48 (34.3%) | 99 (30.4%) |
Disability Class: Self-Care Difficulty
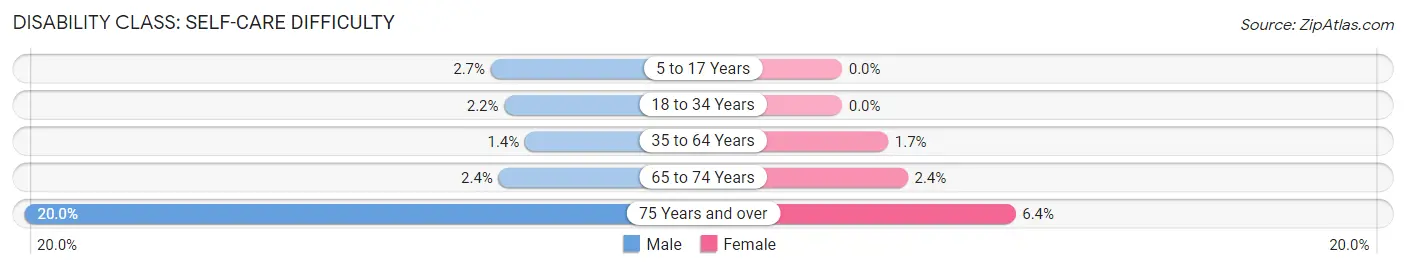
| Age Bracket | Male | Female |
| 5 to 17 Years | 13 (2.7%) | 0 (0.0%) |
| 18 to 34 Years | 28 (2.2%) | 0 (0.0%) |
| 35 to 64 Years | 13 (1.4%) | 19 (1.7%) |
| 65 to 74 Years | 5 (2.4%) | 3 (2.4%) |
| 75 Years and over | 28 (20.0%) | 21 (6.4%) |
Technology Access in East Farmingdale
Computing Device Access in East Farmingdale
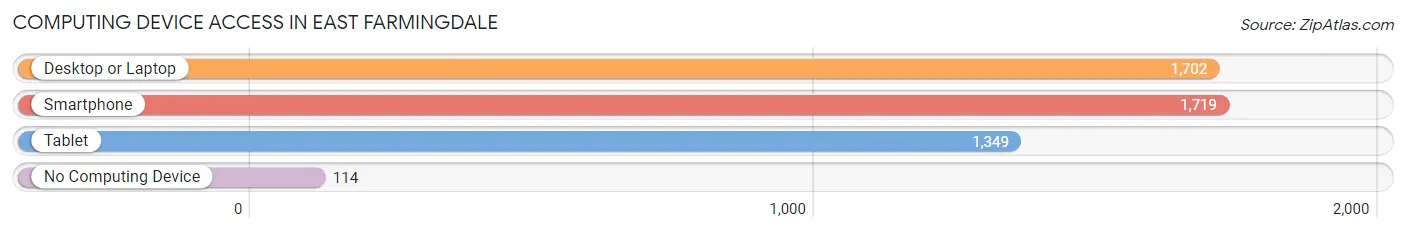
| Device Type | # Households | % Households |
| Desktop or Laptop | 1,702 | 87.7% |
| Smartphone | 1,719 | 88.6% |
| Tablet | 1,349 | 69.5% |
| No Computing Device | 114 | 5.9% |
| Total | 1,940 | 100.0% |
Internet Access in East Farmingdale
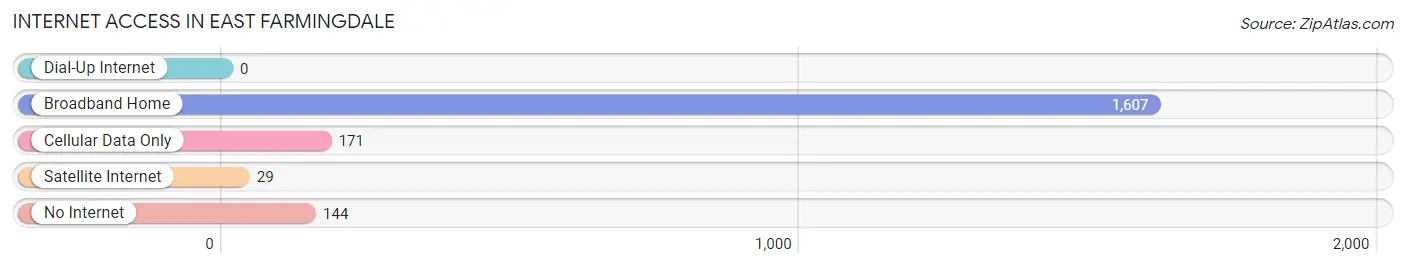
| Internet Type | # Households | % Households |
| Dial-Up Internet | 0 | 0.0% |
| Broadband Home | 1,607 | 82.8% |
| Cellular Data Only | 171 | 8.8% |
| Satellite Internet | 29 | 1.5% |
| No Internet | 144 | 7.4% |
| Total | 1,940 | 100.0% |
East Farmingdale Summary
History
East Farmingdale is a hamlet located in the Town of Babylon in Suffolk County, New York. It is located on the South Shore of Long Island, approximately 40 miles east of New York City. The hamlet was originally part of the Town of Huntington, but was annexed by the Town of Babylon in 1872.
The area was first settled by Europeans in the late 1600s, when English settlers began to move into the area. The hamlet was originally known as “Farmingdale”, and was home to a number of farms and small businesses. In the late 1800s, the hamlet began to grow and develop, and by the early 1900s, it had become a popular summer resort destination.
In the 1920s, the hamlet was renamed “East Farmingdale” to distinguish it from the nearby hamlet of Farmingdale. During this time, the hamlet experienced a period of rapid growth and development, as new businesses and industries moved into the area. The hamlet was home to a number of factories, including the Grumman Aircraft Engineering Corporation, which was founded in 1929.
Geography
East Farmingdale is located in the Town of Babylon in Suffolk County, New York. It is located on the South Shore of Long Island, approximately 40 miles east of New York City. The hamlet is bordered by the hamlets of Farmingdale to the west, Amityville to the north, and Massapequa to the east.
The hamlet is located in a low-lying area, with an elevation of just 25 feet above sea level. The area is mostly flat, with some small hills and valleys. The hamlet is located on the South Shore of Long Island, and is bordered by the Great South Bay to the south.
Economy
East Farmingdale is home to a number of businesses and industries. The hamlet is home to a number of manufacturing and industrial businesses, including the Grumman Aircraft Engineering Corporation, which was founded in 1929. The hamlet is also home to a number of retail businesses, including a number of restaurants, bars, and shops.
The hamlet is also home to a number of corporate offices, including the headquarters of the Grumman Corporation. The hamlet is also home to a number of medical facilities, including Good Samaritan Hospital and Southside Hospital.
Demographics
As of the 2010 census, the population of East Farmingdale was 8,845. The population is predominantly white (83.3%), with a small percentage of African Americans (7.2%), Asians (4.2%), and Hispanics (3.7%). The median household income in the hamlet is $76,945, and the median home value is $420,000. The hamlet has a high rate of homeownership (77.3%), and a low rate of poverty (4.3%).
Common Questions
What is Per Capita Income in East Farmingdale?
Per Capita income in East Farmingdale is $46,247.
What is the Median Family Income in East Farmingdale?
Median Family Income in East Farmingdale is $122,875.
What is the Median Household income in East Farmingdale?
Median Household Income in East Farmingdale is $102,965.
What is Income or Wage Gap in East Farmingdale?
Income or Wage Gap in East Farmingdale is 25.0%.
Women in East Farmingdale earn 75.0 cents for every dollar earned by a man.
What is Inequality or Gini Index in East Farmingdale?
Inequality or Gini Index in East Farmingdale is 0.42.
What is the Total Population of East Farmingdale?
Total Population of East Farmingdale is 6,043.
What is the Total Male Population of East Farmingdale?
Total Male Population of East Farmingdale is 3,121.
What is the Total Female Population of East Farmingdale?
Total Female Population of East Farmingdale is 2,922.
What is the Ratio of Males per 100 Females in East Farmingdale?
There are 106.81 Males per 100 Females in East Farmingdale.
What is the Ratio of Females per 100 Males in East Farmingdale?
There are 93.62 Females per 100 Males in East Farmingdale.
What is the Median Population Age in East Farmingdale?
Median Population Age in East Farmingdale is 32.9 Years.
What is the Average Family Size in East Farmingdale
Average Family Size in East Farmingdale is 3.5 People.
What is the Average Household Size in East Farmingdale
Average Household Size in East Farmingdale is 2.9 People.
How Large is the Labor Force in East Farmingdale?
There are 3,375 People in the Labor Forcein in East Farmingdale.
What is the Percentage of People in the Labor Force in East Farmingdale?
67.2% of People are in the Labor Force in East Farmingdale.
What is the Unemployment Rate in East Farmingdale?
Unemployment Rate in East Farmingdale is 7.7%.