North Valley Stream, NY Map & Demographics
North Valley Stream Map
North Valley Stream Overview
$48,437
PER CAPITA INCOME
$152,724
AVG FAMILY INCOME
$147,569
AVG HOUSEHOLD INCOME
14.0%
WAGE / INCOME GAP [ % ]
86.0¢/ $1
WAGE / INCOME GAP [ $ ]
0.38
INEQUALITY / GINI INDEX
19,016
TOTAL POPULATION
9,353
MALE POPULATION
9,663
FEMALE POPULATION
96.79
MALES / 100 FEMALES
103.31
FEMALES / 100 MALES
42.3
MEDIAN AGE
3.8
AVG FAMILY SIZE
3.4
AVG HOUSEHOLD SIZE
10,562
LABOR FORCE [ PEOPLE ]
65.2%
PERCENT IN LABOR FORCE
5.4%
UNEMPLOYMENT RATE
Income in North Valley Stream
Income Overview in North Valley Stream
Per Capita Income in North Valley Stream is $48,437, while median incomes of families and households are $152,724 and $147,569 respectively.
| Characteristic | Number | Measure |
| Per Capita Income | 19,016 | $48,437 |
| Median Family Income | 4,426 | $152,724 |
| Mean Family Income | 4,426 | $173,182 |
| Median Household Income | 5,588 | $147,569 |
| Mean Household Income | 5,588 | $159,674 |
| Income Deficit | 4,426 | $0 |
| Wage / Income Gap (%) | 19,016 | 14.03% |
| Wage / Income Gap ($) | 19,016 | 85.97¢ per $1 |
| Gini / Inequality Index | 19,016 | 0.38 |
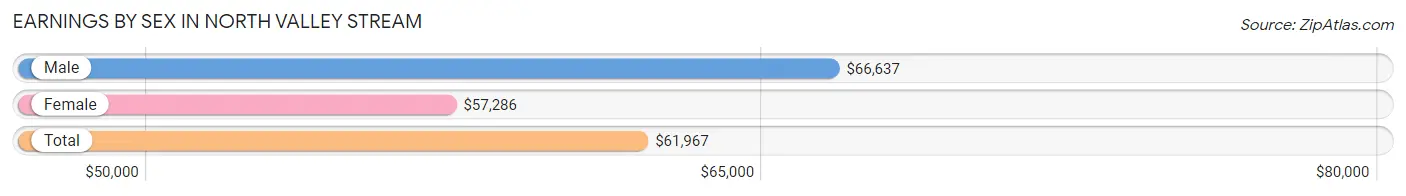
Earnings by Sex in North Valley Stream
Average Earnings in North Valley Stream are $61,967, $66,637 for men and $57,286 for women, a difference of 14.0%.
| Sex | Number | Average Earnings |
| Male | 5,310 (50.7%) | $66,637 |
| Female | 5,162 (49.3%) | $57,286 |
| Total | 10,472 (100.0%) | $61,967 |
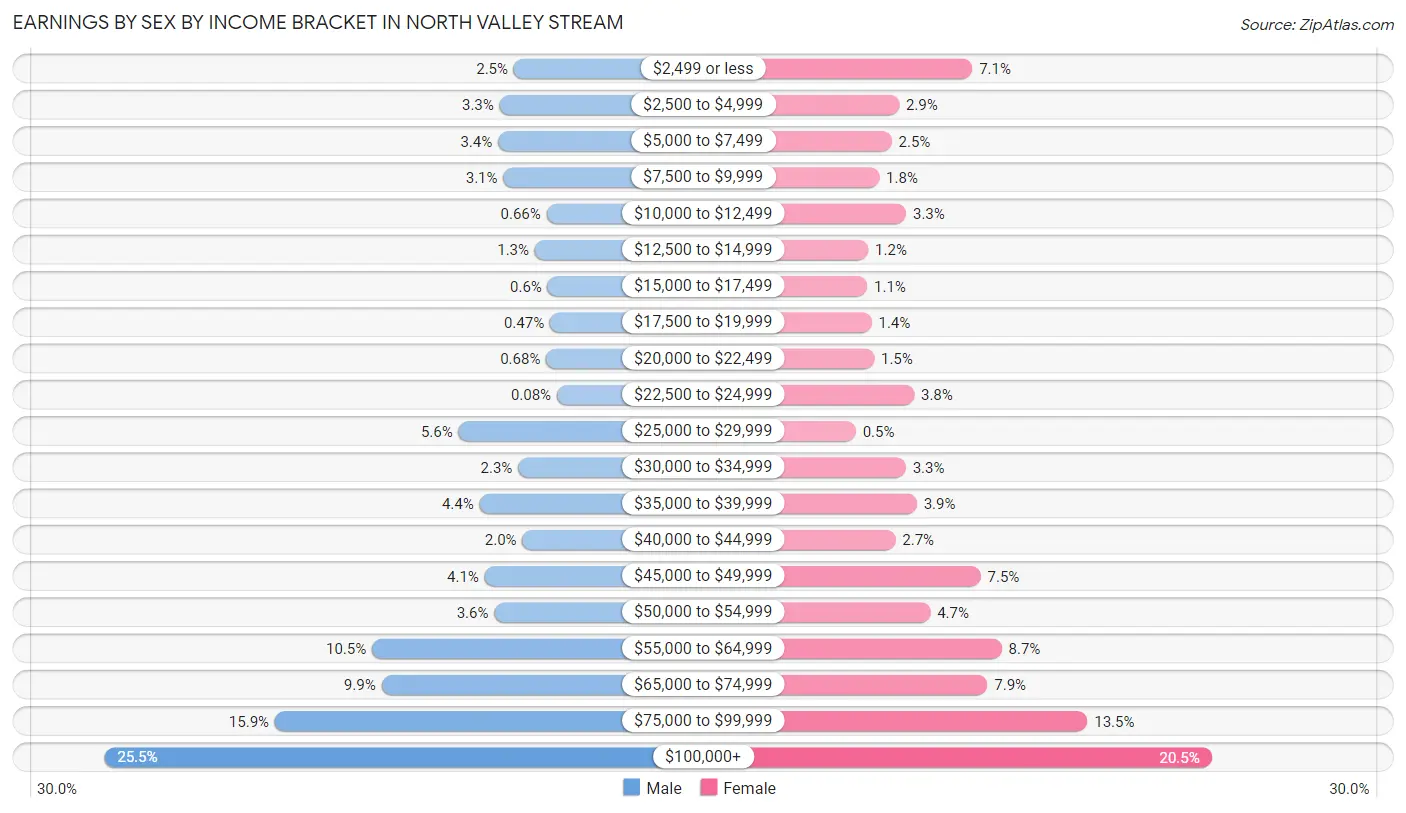
Earnings by Sex by Income Bracket in North Valley Stream
The most common earnings brackets in North Valley Stream are $100,000+ for men (1,355 | 25.5%) and $100,000+ for women (1,058 | 20.5%).
| Income | Male | Female |
| $2,499 or less | 133 (2.5%) | 364 (7.0%) |
| $2,500 to $4,999 | 175 (3.3%) | 151 (2.9%) |
| $5,000 to $7,499 | 180 (3.4%) | 130 (2.5%) |
| $7,500 to $9,999 | 164 (3.1%) | 94 (1.8%) |
| $10,000 to $12,499 | 35 (0.7%) | 172 (3.3%) |
| $12,500 to $14,999 | 70 (1.3%) | 62 (1.2%) |
| $15,000 to $17,499 | 32 (0.6%) | 59 (1.1%) |
| $17,500 to $19,999 | 25 (0.5%) | 72 (1.4%) |
| $20,000 to $22,499 | 36 (0.7%) | 79 (1.5%) |
| $22,500 to $24,999 | 4 (0.1%) | 195 (3.8%) |
| $25,000 to $29,999 | 298 (5.6%) | 26 (0.5%) |
| $30,000 to $34,999 | 120 (2.3%) | 171 (3.3%) |
| $35,000 to $39,999 | 235 (4.4%) | 203 (3.9%) |
| $40,000 to $44,999 | 107 (2.0%) | 141 (2.7%) |
| $45,000 to $49,999 | 220 (4.1%) | 388 (7.5%) |
| $50,000 to $54,999 | 191 (3.6%) | 242 (4.7%) |
| $55,000 to $64,999 | 556 (10.5%) | 449 (8.7%) |
| $65,000 to $74,999 | 528 (9.9%) | 408 (7.9%) |
| $75,000 to $99,999 | 846 (15.9%) | 698 (13.5%) |
| $100,000+ | 1,355 (25.5%) | 1,058 (20.5%) |
| Total | 5,310 (100.0%) | 5,162 (100.0%) |
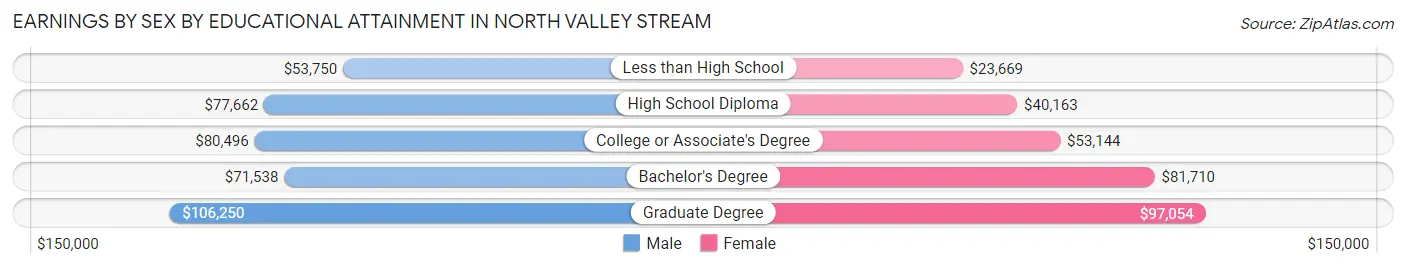
Earnings by Sex by Educational Attainment in North Valley Stream
Average earnings in North Valley Stream are $72,457 for men and $61,477 for women, a difference of 15.1%. Men with an educational attainment of graduate degree enjoy the highest average annual earnings of $106,250, while those with less than high school education earn the least with $53,750. Women with an educational attainment of graduate degree earn the most with the average annual earnings of $97,054, while those with less than high school education have the smallest earnings of $23,669.
| Educational Attainment | Male Income | Female Income |
| Less than High School | $53,750 | $23,669 |
| High School Diploma | $77,662 | $40,163 |
| College or Associate's Degree | $80,496 | $53,144 |
| Bachelor's Degree | $71,538 | $81,710 |
| Graduate Degree | $106,250 | $97,054 |
| Total | $72,457 | $61,477 |
Family Income in North Valley Stream
Family Income Brackets in North Valley Stream
According to the North Valley Stream family income data, there are 1,443 families falling into the $200,000+ income range, which is the most common income bracket and makes up 32.6% of all families.
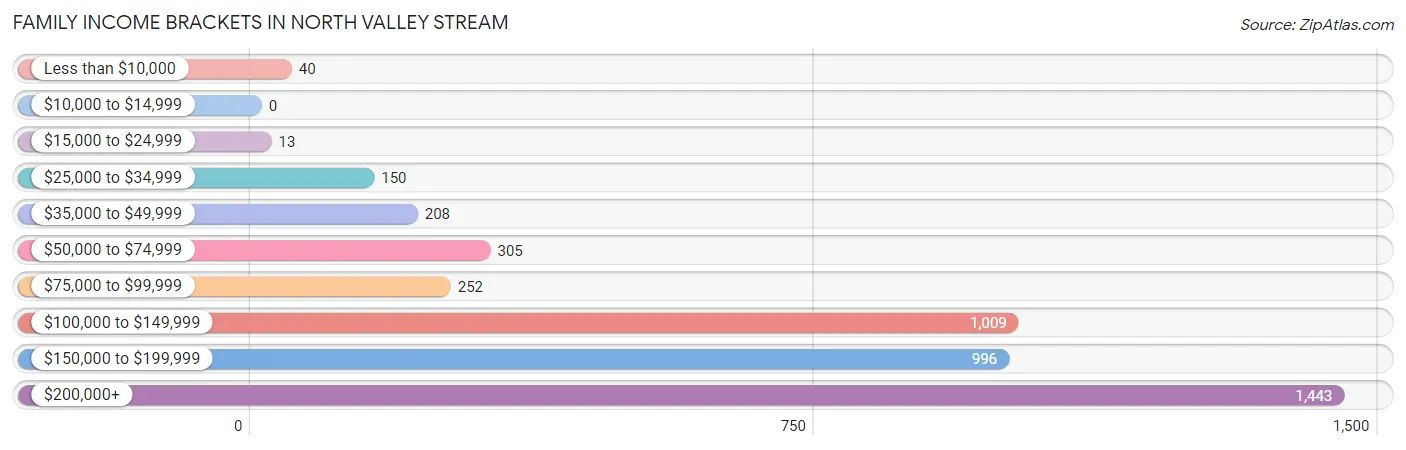
| Income Bracket | # Families | % Families |
| Less than $10,000 | 40 | 0.9% |
| $10,000 to $14,999 | 0 | 0.0% |
| $15,000 to $24,999 | 13 | 0.3% |
| $25,000 to $34,999 | 150 | 3.4% |
| $35,000 to $49,999 | 208 | 4.7% |
| $50,000 to $74,999 | 305 | 6.9% |
| $75,000 to $99,999 | 252 | 5.7% |
| $100,000 to $149,999 | 1,009 | 22.8% |
| $150,000 to $199,999 | 996 | 22.5% |
| $200,000+ | 1,443 | 32.6% |
Family Income by Famaliy Size in North Valley Stream
7+ person families (201 | 4.5%) account for the highest median family income in North Valley Stream with $250,001 per family, while 3-person families (1,143 | 25.8%) have the highest median income of $50,299 per family member.
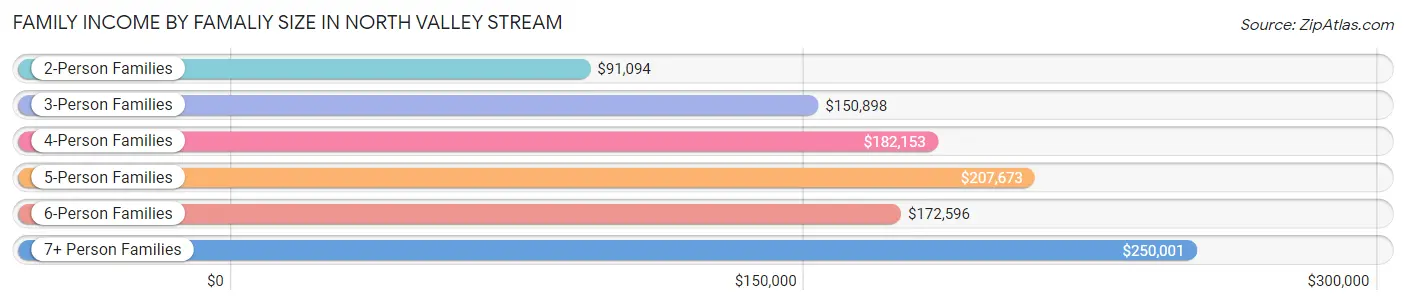
| Income Bracket | # Families | Median Income |
| 2-Person Families | 1,121 (25.3%) | $91,094 |
| 3-Person Families | 1,143 (25.8%) | $150,898 |
| 4-Person Families | 1,169 (26.4%) | $182,153 |
| 5-Person Families | 533 (12.0%) | $207,673 |
| 6-Person Families | 259 (5.9%) | $172,596 |
| 7+ Person Families | 201 (4.5%) | $250,001 |
| Total | 4,426 (100.0%) | $152,724 |
Family Income by Number of Earners in North Valley Stream
The median family income in North Valley Stream is $152,724, with families comprising 3+ earners (1,386) having the highest median family income of $209,521, while families with no earners (390) have the lowest median family income of $45,926, accounting for 31.3% and 8.8% of families, respectively.
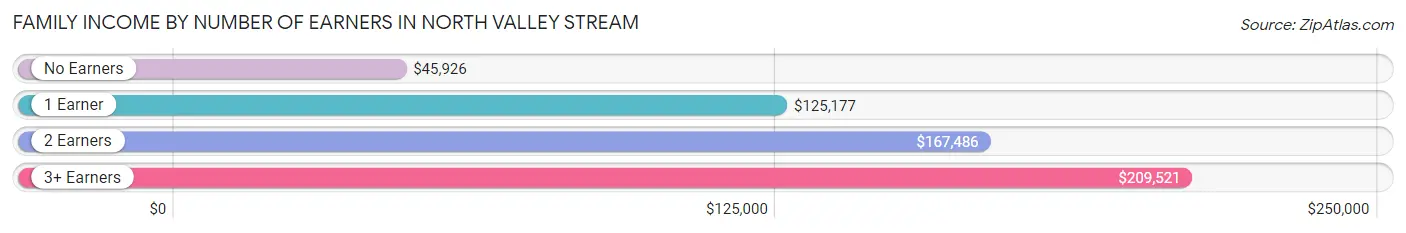
| Number of Earners | # Families | Median Income |
| No Earners | 390 (8.8%) | $45,926 |
| 1 Earner | 1,001 (22.6%) | $125,177 |
| 2 Earners | 1,649 (37.3%) | $167,486 |
| 3+ Earners | 1,386 (31.3%) | $209,521 |
| Total | 4,426 (100.0%) | $152,724 |
Household Income in North Valley Stream
Household Income Brackets in North Valley Stream
With 1,593 households falling in the category, the $200,000+ income range is the most frequent in North Valley Stream, accounting for 28.5% of all households. In contrast, only 6 households (0.1%) fall into the $10,000 to $14,999 income bracket, making it the least populous group.
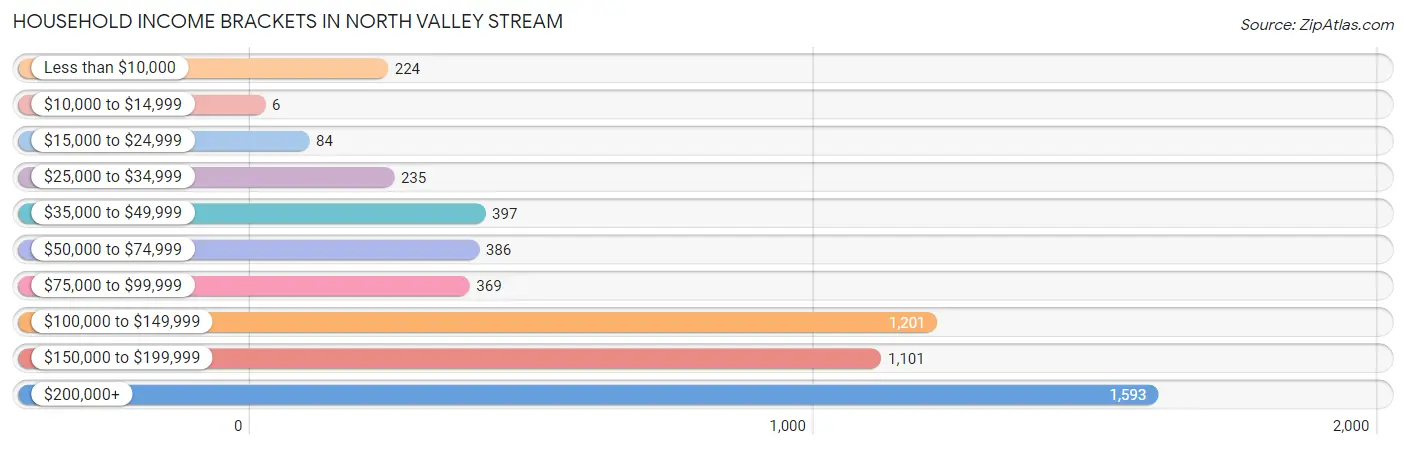
| Income Bracket | # Households | % Households |
| Less than $10,000 | 224 | 4.0% |
| $10,000 to $14,999 | 6 | 0.1% |
| $15,000 to $24,999 | 84 | 1.5% |
| $25,000 to $34,999 | 235 | 4.2% |
| $35,000 to $49,999 | 397 | 7.1% |
| $50,000 to $74,999 | 386 | 6.9% |
| $75,000 to $99,999 | 369 | 6.6% |
| $100,000 to $149,999 | 1,201 | 21.5% |
| $150,000 to $199,999 | 1,101 | 19.7% |
| $200,000+ | 1,593 | 28.5% |
Household Income by Householder Age in North Valley Stream
The median household income in North Valley Stream is $147,569, with the highest median household income of $166,967 found in the 25 to 44 years age bracket for the primary householder. A total of 1,113 households (19.9%) fall into this category.
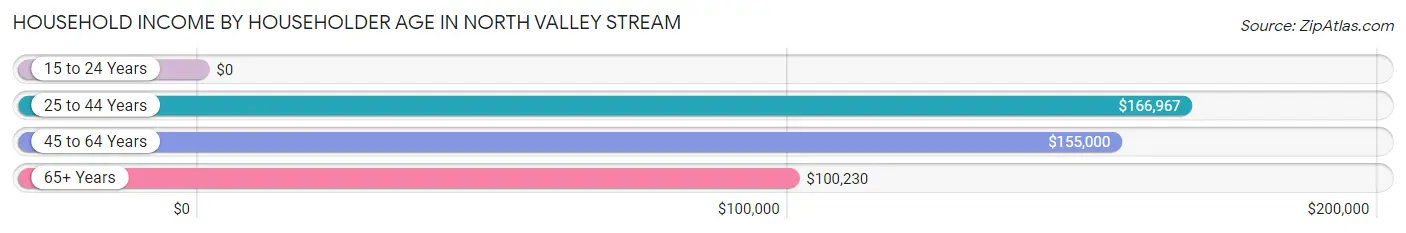
| Income Bracket | # Households | Median Income |
| 15 to 24 Years | 0 (0.0%) | $0 |
| 25 to 44 Years | 1,113 (19.9%) | $166,967 |
| 45 to 64 Years | 2,614 (46.8%) | $155,000 |
| 65+ Years | 1,861 (33.3%) | $100,230 |
| Total | 5,588 (100.0%) | $147,569 |
Poverty in North Valley Stream
Income Below Poverty by Sex and Age in North Valley Stream
With 3.3% poverty level for males and 5.6% for females among the residents of North Valley Stream, 16 and 17 year old males and 25 to 34 year old females are the most vulnerable to poverty, with 62 males (12.1%) and 126 females (10.8%) in their respective age groups living below the poverty level.
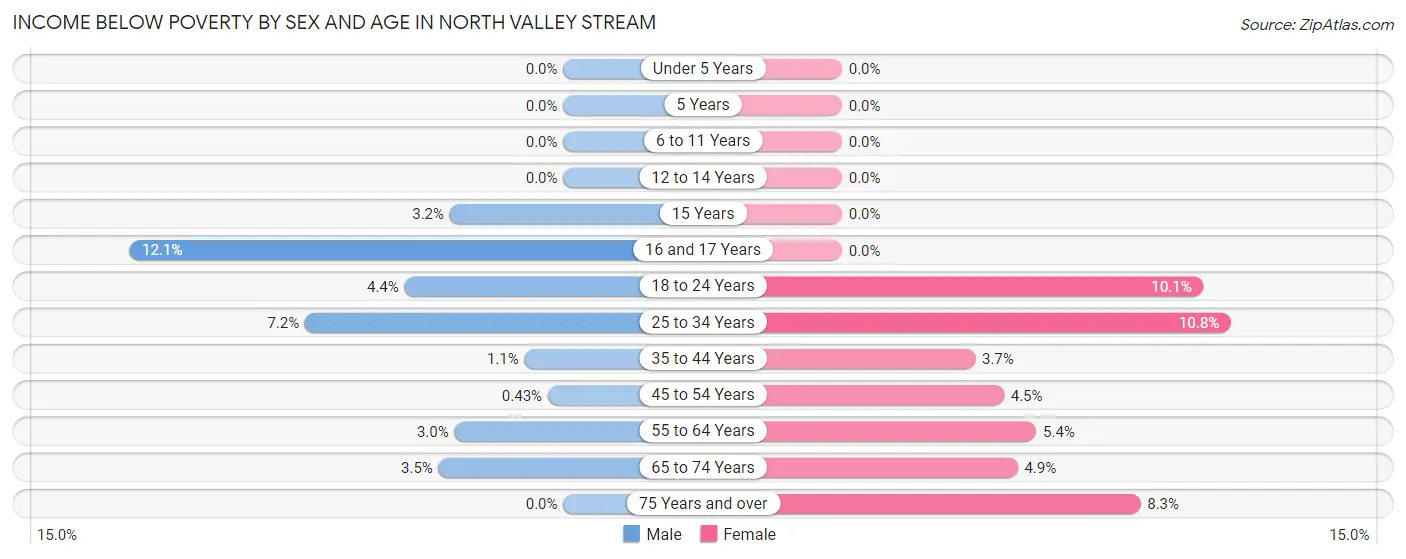
| Age Bracket | Male | Female |
| Under 5 Years | 0 (0.0%) | 0 (0.0%) |
| 5 Years | 0 (0.0%) | 0 (0.0%) |
| 6 to 11 Years | 0 (0.0%) | 0 (0.0%) |
| 12 to 14 Years | 0 (0.0%) | 0 (0.0%) |
| 15 Years | 6 (3.2%) | 0 (0.0%) |
| 16 and 17 Years | 62 (12.1%) | 0 (0.0%) |
| 18 to 24 Years | 45 (4.4%) | 99 (10.1%) |
| 25 to 34 Years | 99 (7.2%) | 126 (10.8%) |
| 35 to 44 Years | 10 (1.1%) | 41 (3.7%) |
| 45 to 54 Years | 5 (0.4%) | 65 (4.5%) |
| 55 to 64 Years | 47 (3.0%) | 73 (5.4%) |
| 65 to 74 Years | 34 (3.5%) | 52 (4.9%) |
| 75 Years and over | 0 (0.0%) | 81 (8.3%) |
| Total | 308 (3.3%) | 537 (5.6%) |
Income Above Poverty by Sex and Age in North Valley Stream
According to the poverty statistics in North Valley Stream, males aged under 5 years and females aged under 5 years are the age groups that are most secure financially, with 100.0% of males and 100.0% of females in these age groups living above the poverty line.
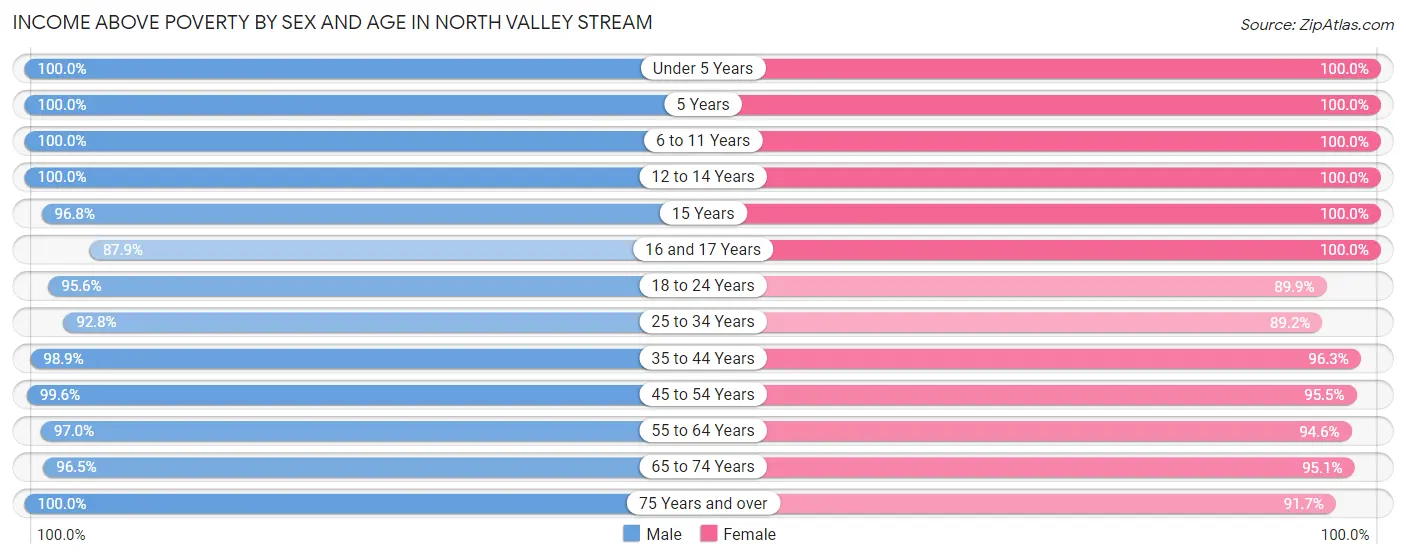
| Age Bracket | Male | Female |
| Under 5 Years | 467 (100.0%) | 350 (100.0%) |
| 5 Years | 19 (100.0%) | 54 (100.0%) |
| 6 to 11 Years | 431 (100.0%) | 344 (100.0%) |
| 12 to 14 Years | 403 (100.0%) | 340 (100.0%) |
| 15 Years | 184 (96.8%) | 190 (100.0%) |
| 16 and 17 Years | 451 (87.9%) | 239 (100.0%) |
| 18 to 24 Years | 974 (95.6%) | 884 (89.9%) |
| 25 to 34 Years | 1,278 (92.8%) | 1,036 (89.2%) |
| 35 to 44 Years | 912 (98.9%) | 1,064 (96.3%) |
| 45 to 54 Years | 1,164 (99.6%) | 1,377 (95.5%) |
| 55 to 64 Years | 1,506 (97.0%) | 1,277 (94.6%) |
| 65 to 74 Years | 945 (96.5%) | 1,011 (95.1%) |
| 75 Years and over | 295 (100.0%) | 894 (91.7%) |
| Total | 9,029 (96.7%) | 9,060 (94.4%) |
Income Below Poverty Among Married-Couple Families in North Valley Stream
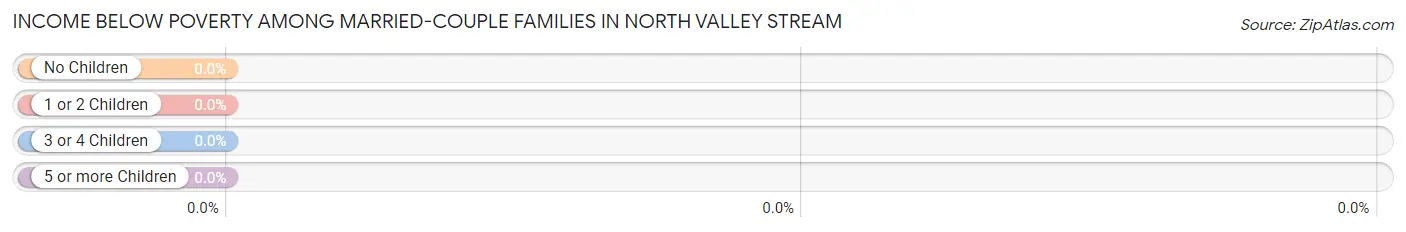
| Children | Above Poverty | Below Poverty |
| No Children | 1,884 (100.0%) | 0 (0.0%) |
| 1 or 2 Children | 1,017 (100.0%) | 0 (0.0%) |
| 3 or 4 Children | 216 (100.0%) | 0 (0.0%) |
| 5 or more Children | 0 (0.0%) | 0 (0.0%) |
| Total | 3,117 (100.0%) | 0 (0.0%) |
Income Below Poverty Among Single-Parent Households in North Valley Stream
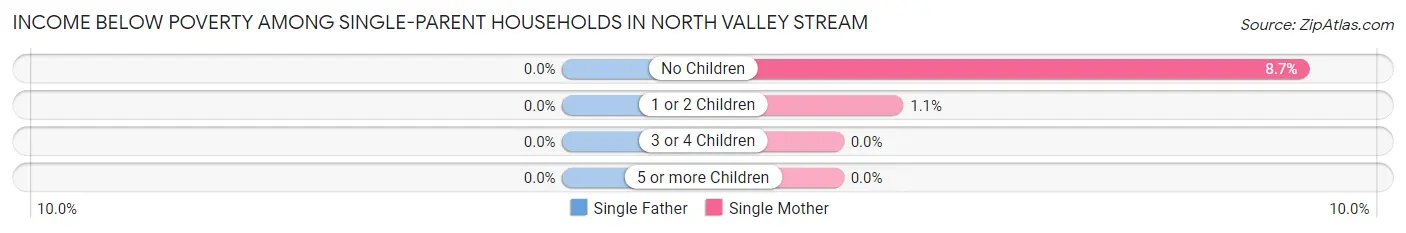
| Children | Single Father | Single Mother |
| No Children | 0 (0.0%) | 41 (8.7%) |
| 1 or 2 Children | 0 (0.0%) | 5 (1.1%) |
| 3 or 4 Children | 0 (0.0%) | 0 (0.0%) |
| 5 or more Children | 0 (0.0%) | 0 (0.0%) |
| Total | 0 (0.0%) | 46 (4.7%) |
Income Below Poverty Among Married-Couple vs Single-Parent Households in North Valley Stream
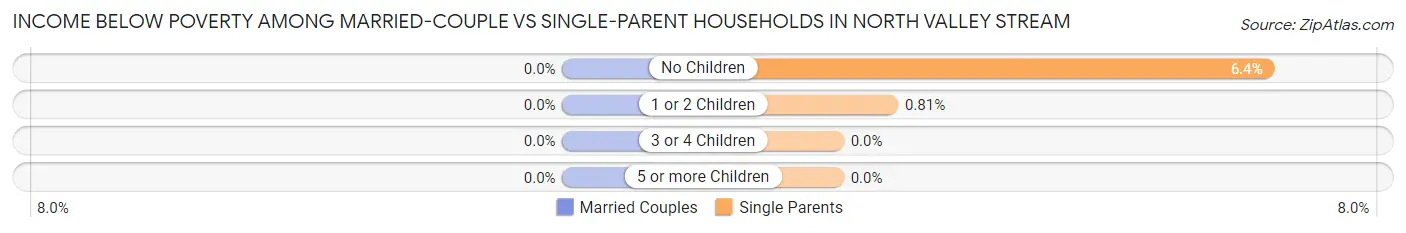
| Children | Married-Couple Families | Single-Parent Households |
| No Children | 0 (0.0%) | 41 (6.4%) |
| 1 or 2 Children | 0 (0.0%) | 5 (0.8%) |
| 3 or 4 Children | 0 (0.0%) | 0 (0.0%) |
| 5 or more Children | 0 (0.0%) | 0 (0.0%) |
| Total | 0 (0.0%) | 46 (3.5%) |
Race in North Valley Stream
The most populous races in North Valley Stream are Black / African American (9,513 | 50.0%), Hispanic or Latino (3,368 | 17.7%), and White / Caucasian (3,076 | 16.2%).
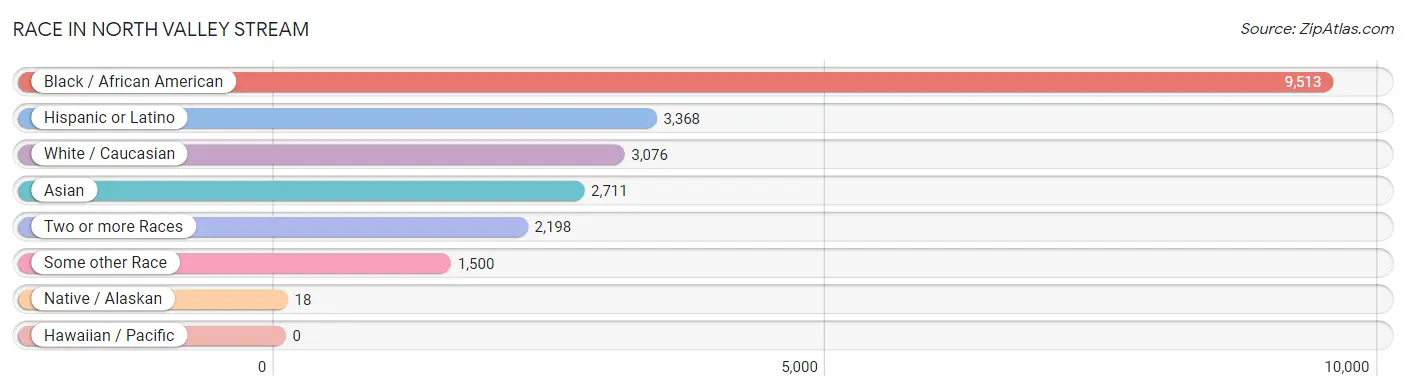
| Race | # Population | % Population |
| Asian | 2,711 | 14.3% |
| Black / African American | 9,513 | 50.0% |
| Hawaiian / Pacific | 0 | 0.0% |
| Hispanic or Latino | 3,368 | 17.7% |
| Native / Alaskan | 18 | 0.1% |
| White / Caucasian | 3,076 | 16.2% |
| Two or more Races | 2,198 | 11.6% |
| Some other Race | 1,500 | 7.9% |
| Total | 19,016 | 100.0% |
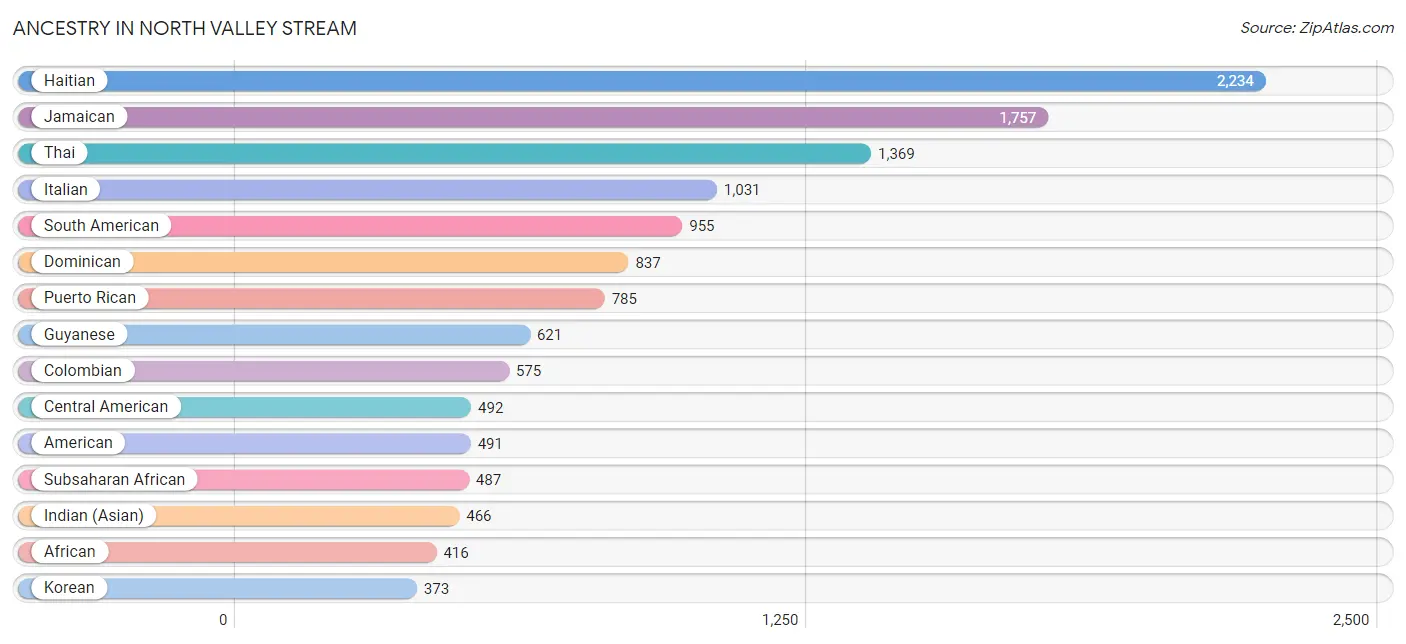
Ancestry in North Valley Stream
The most populous ancestries reported in North Valley Stream are Haitian (2,234 | 11.7%), Jamaican (1,757 | 9.2%), Thai (1,369 | 7.2%), Italian (1,031 | 5.4%), and South American (955 | 5.0%), together accounting for 38.6% of all North Valley Stream residents.
| Ancestry | # Population | % Population |
| Afghan | 6 | 0.0% |
| African | 416 | 2.2% |
| American | 491 | 2.6% |
| Argentinean | 33 | 0.2% |
| Barbadian | 66 | 0.4% |
| Belizean | 9 | 0.1% |
| Bhutanese | 34 | 0.2% |
| British | 15 | 0.1% |
| British West Indian | 163 | 0.9% |
| Burmese | 42 | 0.2% |
| Central American | 492 | 2.6% |
| Cherokee | 58 | 0.3% |
| Choctaw | 57 | 0.3% |
| Colombian | 575 | 3.0% |
| Cuban | 56 | 0.3% |
| Czech | 8 | 0.0% |
| Dominican | 837 | 4.4% |
| Dutch | 38 | 0.2% |
| Eastern European | 8 | 0.0% |
| Ecuadorian | 129 | 0.7% |
| English | 138 | 0.7% |
| European | 9 | 0.1% |
| Filipino | 87 | 0.5% |
| German | 226 | 1.2% |
| Greek | 8 | 0.0% |
| Guatemalan | 82 | 0.4% |
| Guyanese | 621 | 3.3% |
| Haitian | 2,234 | 11.7% |
| Honduran | 13 | 0.1% |
| Hungarian | 10 | 0.1% |
| Indian (Asian) | 466 | 2.5% |
| Irish | 366 | 1.9% |
| Israeli | 7 | 0.0% |
| Italian | 1,031 | 5.4% |
| Jamaican | 1,757 | 9.2% |
| Korean | 373 | 2.0% |
| Lithuanian | 20 | 0.1% |
| Macedonian | 19 | 0.1% |
| Maltese | 9 | 0.1% |
| Mongolian | 55 | 0.3% |
| Nicaraguan | 131 | 0.7% |
| Nigerian | 78 | 0.4% |
| Norwegian | 25 | 0.1% |
| Panamanian | 23 | 0.1% |
| Peruvian | 93 | 0.5% |
| Polish | 189 | 1.0% |
| Portuguese | 13 | 0.1% |
| Puerto Rican | 785 | 4.1% |
| Romanian | 19 | 0.1% |
| Russian | 130 | 0.7% |
| Salvadoran | 243 | 1.3% |
| Scandinavian | 8 | 0.0% |
| Scotch-Irish | 21 | 0.1% |
| Scottish | 128 | 0.7% |
| Slavic | 18 | 0.1% |
| South American | 955 | 5.0% |
| Subsaharan African | 487 | 2.6% |
| Swedish | 61 | 0.3% |
| Thai | 1,369 | 7.2% |
| Trinidadian and Tobagonian | 367 | 1.9% |
| Ukrainian | 51 | 0.3% |
| Uruguayan | 125 | 0.7% |
| Vietnamese | 5 | 0.0% |
| West Indian | 293 | 1.5% | View All 64 Rows |
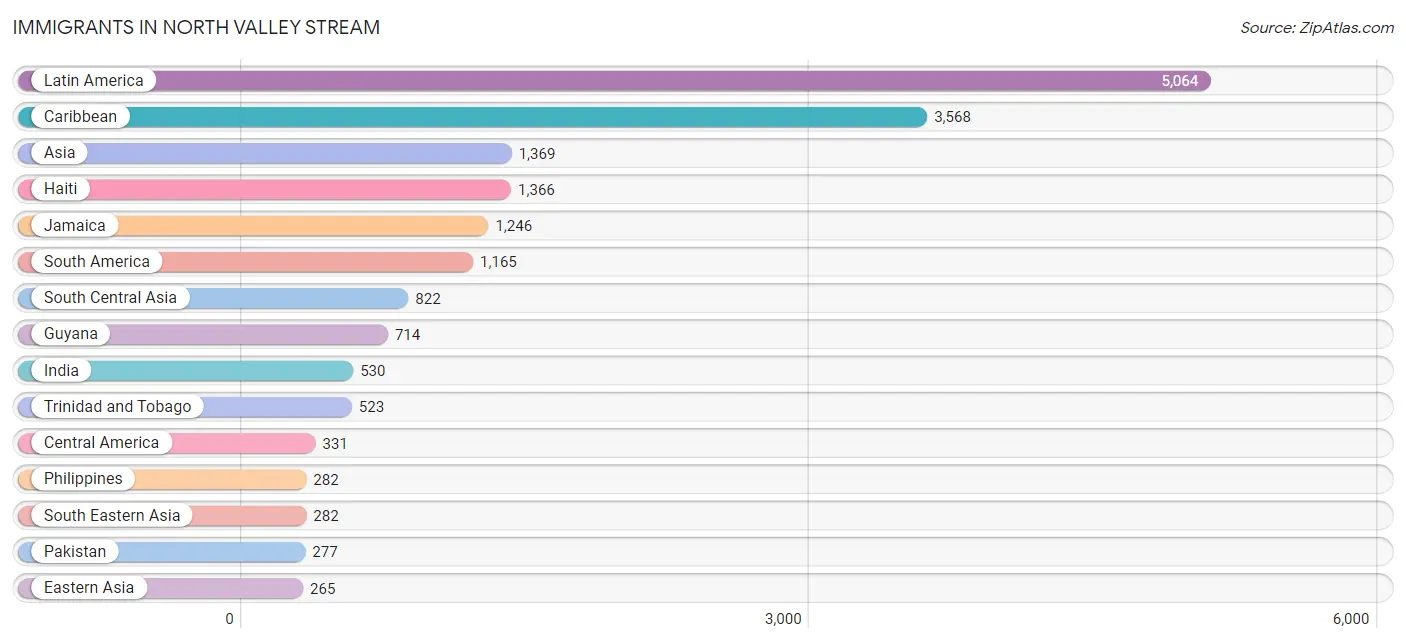
Immigrants in North Valley Stream
The most numerous immigrant groups reported in North Valley Stream came from Latin America (5,064 | 26.6%), Caribbean (3,568 | 18.8%), Asia (1,369 | 7.2%), Haiti (1,366 | 7.2%), and Jamaica (1,246 | 6.6%), together accounting for 66.3% of all North Valley Stream residents.
| Immigration Origin | # Population | % Population |
| Afghanistan | 6 | 0.0% |
| Africa | 104 | 0.5% |
| Argentina | 43 | 0.2% |
| Asia | 1,369 | 7.2% |
| Bangladesh | 9 | 0.1% |
| Barbados | 44 | 0.2% |
| Belize | 9 | 0.1% |
| Canada | 8 | 0.0% |
| Caribbean | 3,568 | 18.8% |
| Central America | 331 | 1.7% |
| China | 206 | 1.1% |
| Colombia | 259 | 1.4% |
| Dominica | 58 | 0.3% |
| Dominican Republic | 222 | 1.2% |
| Eastern Asia | 265 | 1.4% |
| Eastern Europe | 46 | 0.2% |
| Ecuador | 82 | 0.4% |
| El Salvador | 188 | 1.0% |
| England | 49 | 0.3% |
| Europe | 204 | 1.1% |
| Grenada | 50 | 0.3% |
| Guatemala | 60 | 0.3% |
| Guyana | 714 | 3.7% |
| Haiti | 1,366 | 7.2% |
| Hong Kong | 7 | 0.0% |
| Hungary | 11 | 0.1% |
| India | 530 | 2.8% |
| Italy | 65 | 0.3% |
| Jamaica | 1,246 | 6.6% |
| Japan | 17 | 0.1% |
| Korea | 42 | 0.2% |
| Latin America | 5,064 | 26.6% |
| Nicaragua | 62 | 0.3% |
| Nigeria | 49 | 0.3% |
| Northern Europe | 93 | 0.5% |
| Pakistan | 277 | 1.5% |
| Panama | 12 | 0.1% |
| Peru | 44 | 0.2% |
| Philippines | 282 | 1.5% |
| Russia | 24 | 0.1% |
| Senegal | 55 | 0.3% |
| South America | 1,165 | 6.1% |
| South Central Asia | 822 | 4.3% |
| South Eastern Asia | 282 | 1.5% |
| Southern Europe | 65 | 0.3% |
| St. Vincent and the Grenadines | 27 | 0.1% |
| Taiwan | 134 | 0.7% |
| Trinidad and Tobago | 523 | 2.8% |
| Western Africa | 104 | 0.5% | View All 49 Rows |
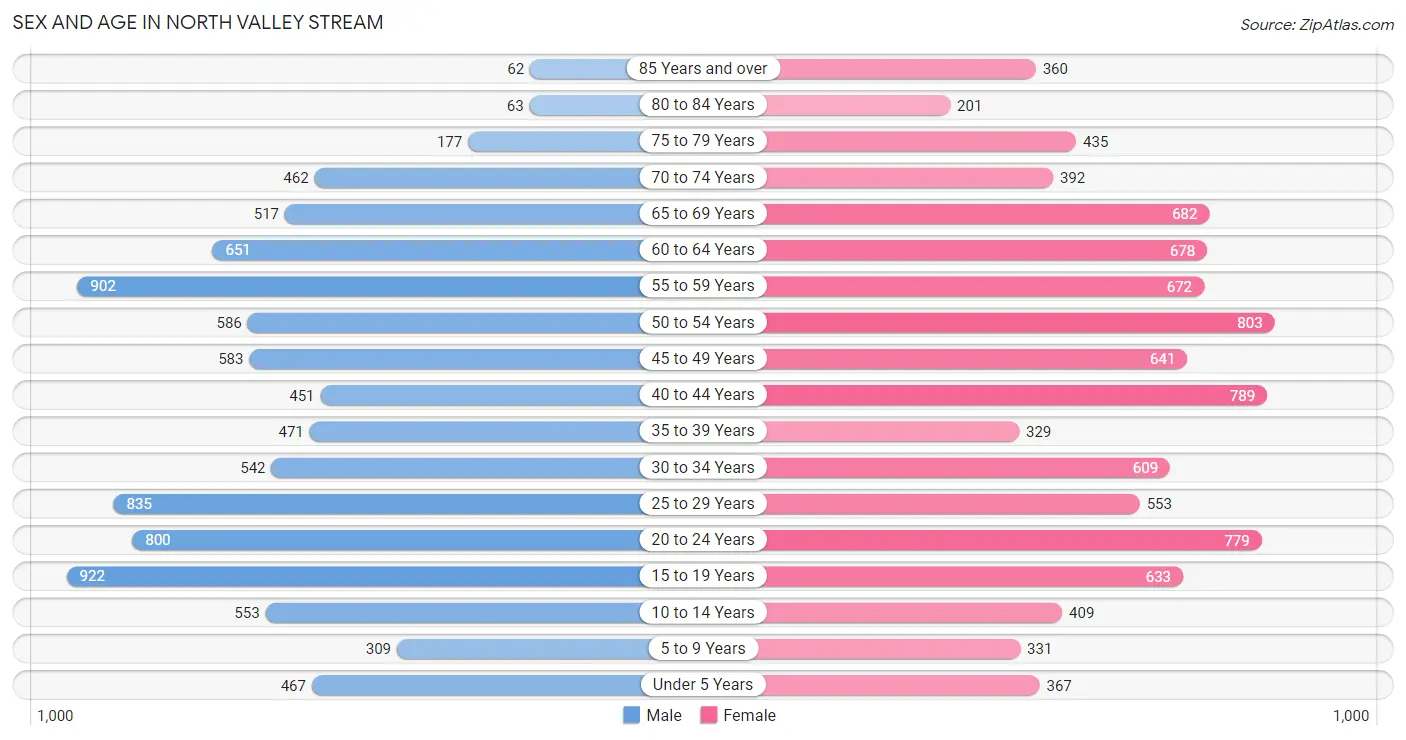
Sex and Age in North Valley Stream
Sex and Age in North Valley Stream
The most populous age groups in North Valley Stream are 15 to 19 Years (922 | 9.9%) for men and 50 to 54 Years (803 | 8.3%) for women.
| Age Bracket | Male | Female |
| Under 5 Years | 467 (5.0%) | 367 (3.8%) |
| 5 to 9 Years | 309 (3.3%) | 331 (3.4%) |
| 10 to 14 Years | 553 (5.9%) | 409 (4.2%) |
| 15 to 19 Years | 922 (9.9%) | 633 (6.6%) |
| 20 to 24 Years | 800 (8.6%) | 779 (8.1%) |
| 25 to 29 Years | 835 (8.9%) | 553 (5.7%) |
| 30 to 34 Years | 542 (5.8%) | 609 (6.3%) |
| 35 to 39 Years | 471 (5.0%) | 329 (3.4%) |
| 40 to 44 Years | 451 (4.8%) | 789 (8.2%) |
| 45 to 49 Years | 583 (6.2%) | 641 (6.6%) |
| 50 to 54 Years | 586 (6.3%) | 803 (8.3%) |
| 55 to 59 Years | 902 (9.6%) | 672 (7.0%) |
| 60 to 64 Years | 651 (7.0%) | 678 (7.0%) |
| 65 to 69 Years | 517 (5.5%) | 682 (7.1%) |
| 70 to 74 Years | 462 (4.9%) | 392 (4.1%) |
| 75 to 79 Years | 177 (1.9%) | 435 (4.5%) |
| 80 to 84 Years | 63 (0.7%) | 201 (2.1%) |
| 85 Years and over | 62 (0.7%) | 360 (3.7%) |
| Total | 9,353 (100.0%) | 9,663 (100.0%) |
Families and Households in North Valley Stream
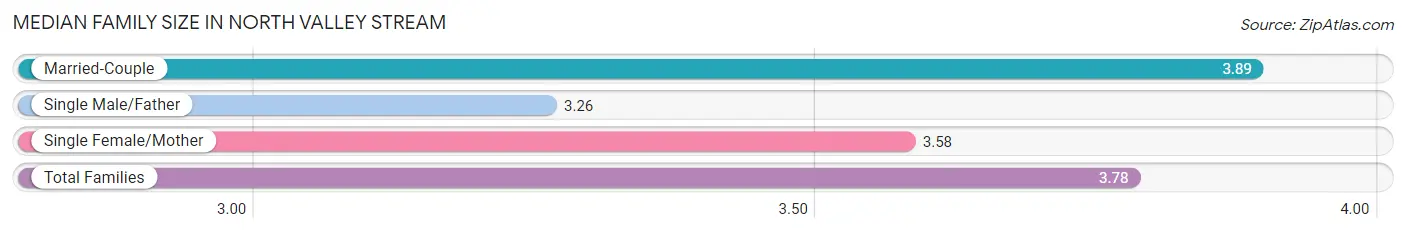
Median Family Size in North Valley Stream
The median family size in North Valley Stream is 3.78 persons per family, with married-couple families (3,117 | 70.4%) accounting for the largest median family size of 3.89 persons per family. On the other hand, single male/father families (337 | 7.6%) represent the smallest median family size with 3.26 persons per family.
| Family Type | # Families | Family Size |
| Married-Couple | 3,117 (70.4%) | 3.89 |
| Single Male/Father | 337 (7.6%) | 3.26 |
| Single Female/Mother | 972 (22.0%) | 3.58 |
| Total Families | 4,426 (100.0%) | 3.78 |
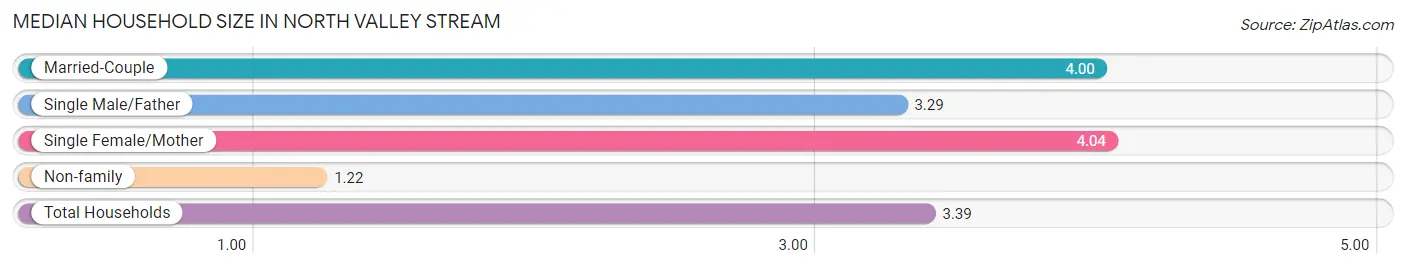
Median Household Size in North Valley Stream
The median household size in North Valley Stream is 3.39 persons per household, with single female/mother households (972 | 17.4%) accounting for the largest median household size of 4.04 persons per household. non-family households (1,162 | 20.8%) represent the smallest median household size with 1.22 persons per household.
| Household Type | # Households | Household Size |
| Married-Couple | 3,117 (55.8%) | 4.00 |
| Single Male/Father | 337 (6.0%) | 3.29 |
| Single Female/Mother | 972 (17.4%) | 4.04 |
| Non-family | 1,162 (20.8%) | 1.22 |
| Total Households | 5,588 (100.0%) | 3.39 |
Household Size by Marriage Status in North Valley Stream
Out of a total of 5,588 households in North Valley Stream, 4,426 (79.2%) are family households, while 1,162 (20.8%) are nonfamily households. The most numerous type of family households are 3-person households, comprising 1,120, and the most common type of nonfamily households are 1-person households, comprising 1,057.
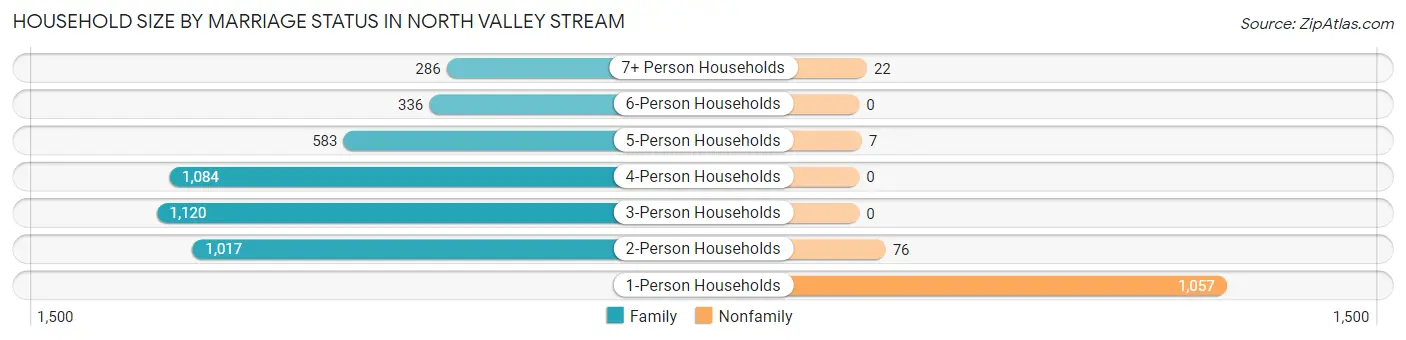
| Household Size | Family Households | Nonfamily Households |
| 1-Person Households | - | 1,057 (18.9%) |
| 2-Person Households | 1,017 (18.2%) | 76 (1.4%) |
| 3-Person Households | 1,120 (20.0%) | 0 (0.0%) |
| 4-Person Households | 1,084 (19.4%) | 0 (0.0%) |
| 5-Person Households | 583 (10.4%) | 7 (0.1%) |
| 6-Person Households | 336 (6.0%) | 0 (0.0%) |
| 7+ Person Households | 286 (5.1%) | 22 (0.4%) |
| Total | 4,426 (79.2%) | 1,162 (20.8%) |
Female Fertility in North Valley Stream
Fertility by Age in North Valley Stream
Average fertility rate in North Valley Stream is 65.0 births per 1,000 women. Women in the age bracket of 20 to 34 years have the highest fertility rate with 104.0 births per 1,000 women. Women in the age bracket of 20 to 34 years acount for 69.2% of all women with births.
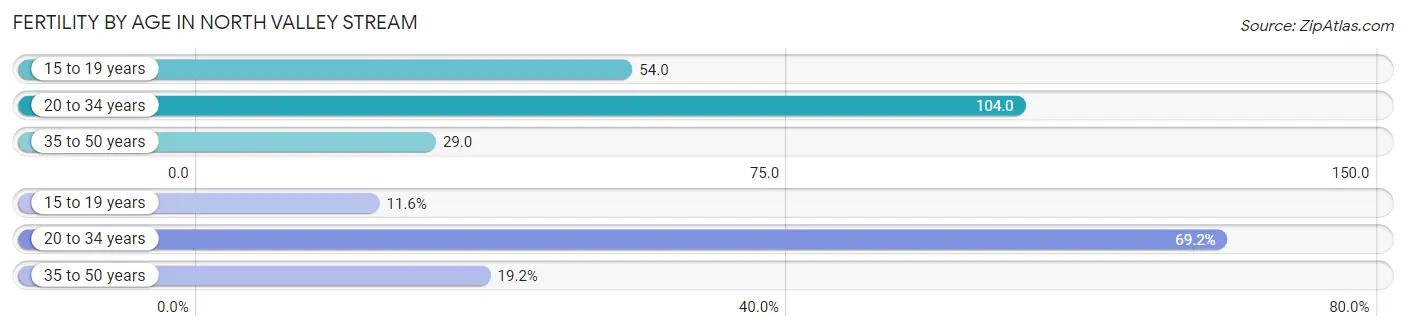
| Age Bracket | Women with Births | Births / 1,000 Women |
| 15 to 19 years | 34 (11.6%) | 54.0 |
| 20 to 34 years | 202 (69.2%) | 104.0 |
| 35 to 50 years | 56 (19.2%) | 29.0 |
| Total | 292 (100.0%) | 65.0 |
Fertility by Age by Marriage Status in North Valley Stream
54.5% of women with births (292) in North Valley Stream are married. The highest percentage of unmarried women with births falls into 15 to 19 years age bracket with 100.0% of them unmarried at the time of birth, while the lowest percentage of unmarried women with births belong to 35 to 50 years age bracket with 0.0% of them unmarried.
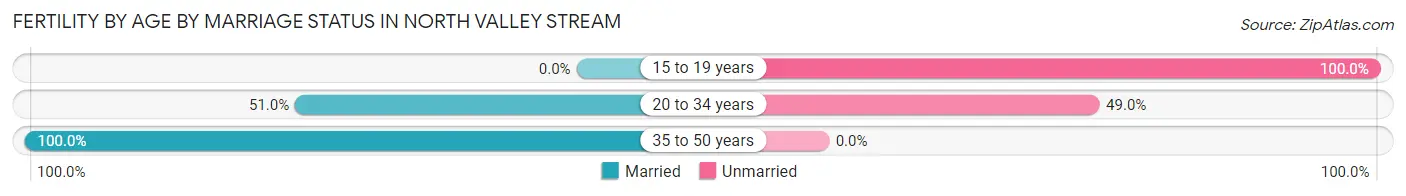
| Age Bracket | Married | Unmarried |
| 15 to 19 years | 0 (0.0%) | 34 (100.0%) |
| 20 to 34 years | 103 (51.0%) | 99 (49.0%) |
| 35 to 50 years | 56 (100.0%) | 0 (0.0%) |
| Total | 159 (54.4%) | 133 (45.6%) |
Fertility by Education in North Valley Stream
Average fertility rate in North Valley Stream is 65.0 births per 1,000 women. Women with the education attainment of college or associate's degree have the highest fertility rate of 105.0 births per 1,000 women, while women with the education attainment of bachelor's degree have the lowest fertility at 21.0 births per 1,000 women. Women with the education attainment of college or associate's degree represent 41.1% of all women with births.
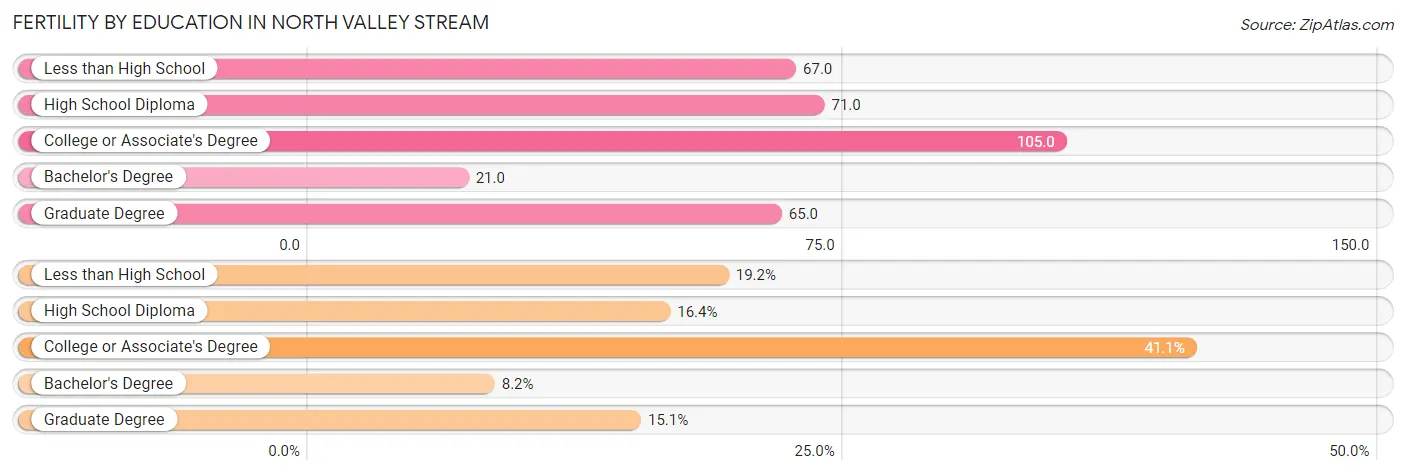
| Educational Attainment | Women with Births | Births / 1,000 Women |
| Less than High School | 56 (19.2%) | 67.0 |
| High School Diploma | 48 (16.4%) | 71.0 |
| College or Associate's Degree | 120 (41.1%) | 105.0 |
| Bachelor's Degree | 24 (8.2%) | 21.0 |
| Graduate Degree | 44 (15.1%) | 65.0 |
| Total | 292 (100.0%) | 65.0 |
Fertility by Education by Marriage Status in North Valley Stream
45.6% of women with births in North Valley Stream are unmarried. Women with the educational attainment of graduate degree are most likely to be married with 100.0% of them married at childbirth, while women with the educational attainment of high school diploma are least likely to be married with 100.0% of them unmarried at childbirth.
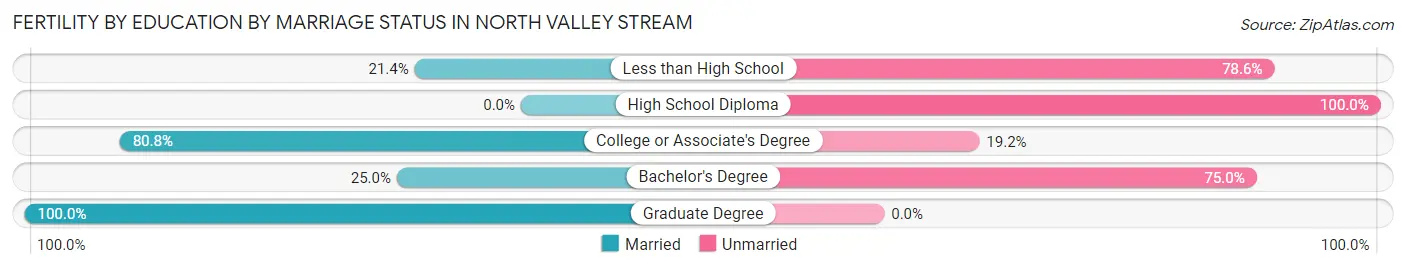
| Educational Attainment | Married | Unmarried |
| Less than High School | 12 (21.4%) | 44 (78.6%) |
| High School Diploma | 0 (0.0%) | 48 (100.0%) |
| College or Associate's Degree | 97 (80.8%) | 23 (19.2%) |
| Bachelor's Degree | 6 (25.0%) | 18 (75.0%) |
| Graduate Degree | 44 (100.0%) | 0 (0.0%) |
| Total | 159 (54.4%) | 133 (45.6%) |
Employment Characteristics in North Valley Stream
Employment by Class of Employer in North Valley Stream
Among the 9,671 employed individuals in North Valley Stream, private company employees (6,249 | 64.6%), local government employees (1,108 | 11.5%), and not-for-profit organizations (854 | 8.8%) make up the most common classes of employment.
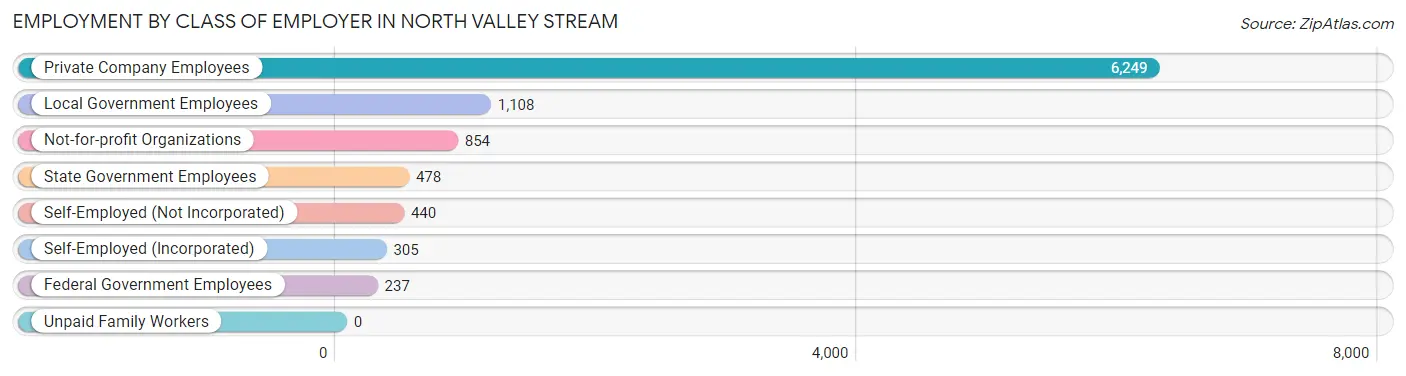
| Employer Class | # Employees | % Employees |
| Private Company Employees | 6,249 | 64.6% |
| Self-Employed (Incorporated) | 305 | 3.2% |
| Self-Employed (Not Incorporated) | 440 | 4.5% |
| Not-for-profit Organizations | 854 | 8.8% |
| Local Government Employees | 1,108 | 11.5% |
| State Government Employees | 478 | 4.9% |
| Federal Government Employees | 237 | 2.5% |
| Unpaid Family Workers | 0 | 0.0% |
| Total | 9,671 | 100.0% |
Employment Status by Age in North Valley Stream
According to the labor force statistics for North Valley Stream, out of the total population over 16 years of age (16,200), 65.2% or 10,562 individuals are in the labor force, with 5.4% or 570 of them unemployed. The age group with the highest labor force participation rate is 30 to 34 years, with 92.4% or 1,064 individuals in the labor force. Within the labor force, the 75 years and over age range has the highest percentage of unemployed individuals, with 88.9% or 16 of them being unemployed.
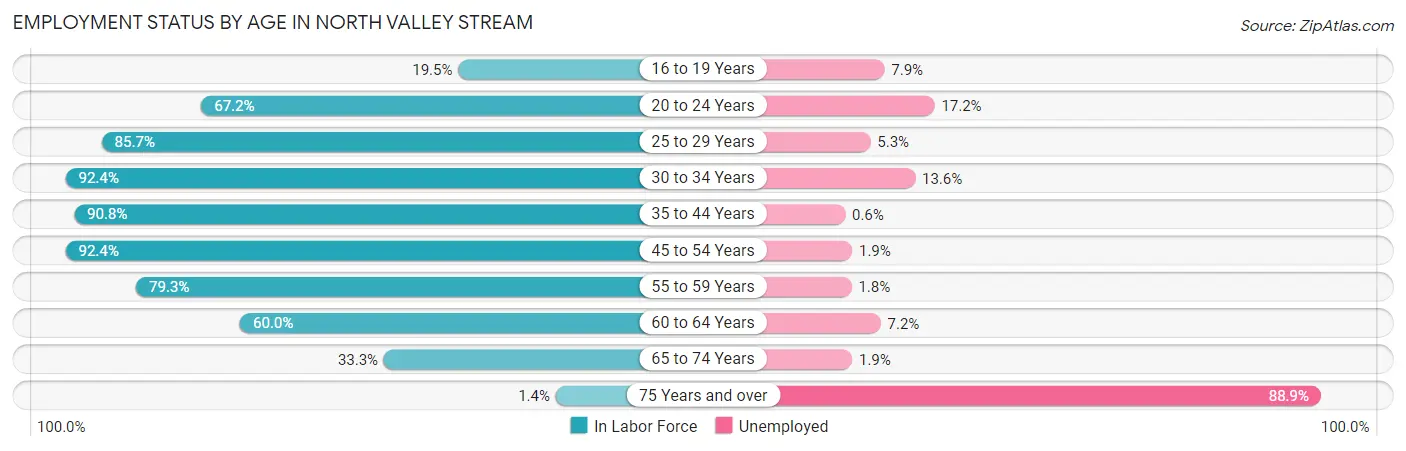
| Age Bracket | In Labor Force | Unemployed |
| 16 to 19 Years | 229 (19.5%) | 18 (7.9%) |
| 20 to 24 Years | 1,061 (67.2%) | 182 (17.2%) |
| 25 to 29 Years | 1,190 (85.7%) | 63 (5.3%) |
| 30 to 34 Years | 1,064 (92.4%) | 145 (13.6%) |
| 35 to 44 Years | 1,852 (90.8%) | 11 (0.6%) |
| 45 to 54 Years | 2,414 (92.4%) | 46 (1.9%) |
| 55 to 59 Years | 1,248 (79.3%) | 22 (1.8%) |
| 60 to 64 Years | 797 (60.0%) | 57 (7.2%) |
| 65 to 74 Years | 684 (33.3%) | 13 (1.9%) |
| 75 Years and over | 18 (1.4%) | 16 (88.9%) |
| Total | 10,562 (65.2%) | 570 (5.4%) |
Employment Status by Educational Attainment in North Valley Stream
According to labor force statistics for North Valley Stream, 84.8% of individuals (8,561) out of the total population between 25 and 64 years of age (10,095) are in the labor force, with 4.0% or 342 of them being unemployed. The group with the highest labor force participation rate are those with the educational attainment of bachelor's degree or higher, with 85.8% or 3,856 individuals in the labor force. Within the labor force, individuals with less than high school education have the highest percentage of unemployment, with 12.3% or 72 of them being unemployed.
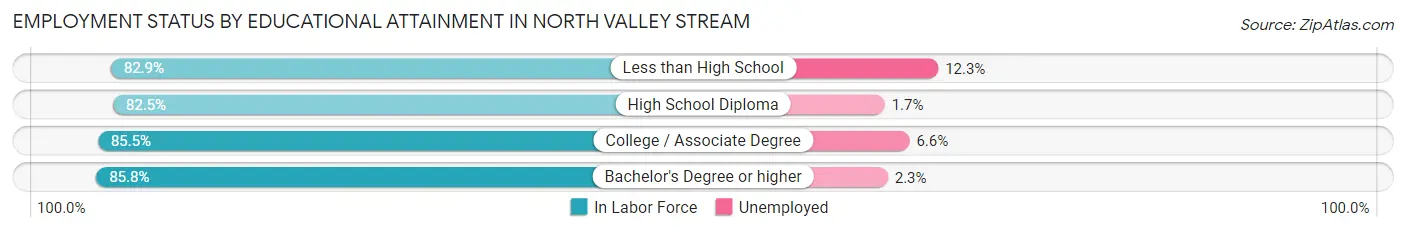
| Educational Attainment | In Labor Force | Unemployed |
| Less than High School | 585 (82.9%) | 87 (12.3%) |
| High School Diploma | 1,738 (82.5%) | 36 (1.7%) |
| College / Associate Degree | 2,384 (85.5%) | 184 (6.6%) |
| Bachelor's Degree or higher | 3,856 (85.8%) | 103 (2.3%) |
| Total | 8,561 (84.8%) | 404 (4.0%) |
Employment Occupations by Sex in North Valley Stream
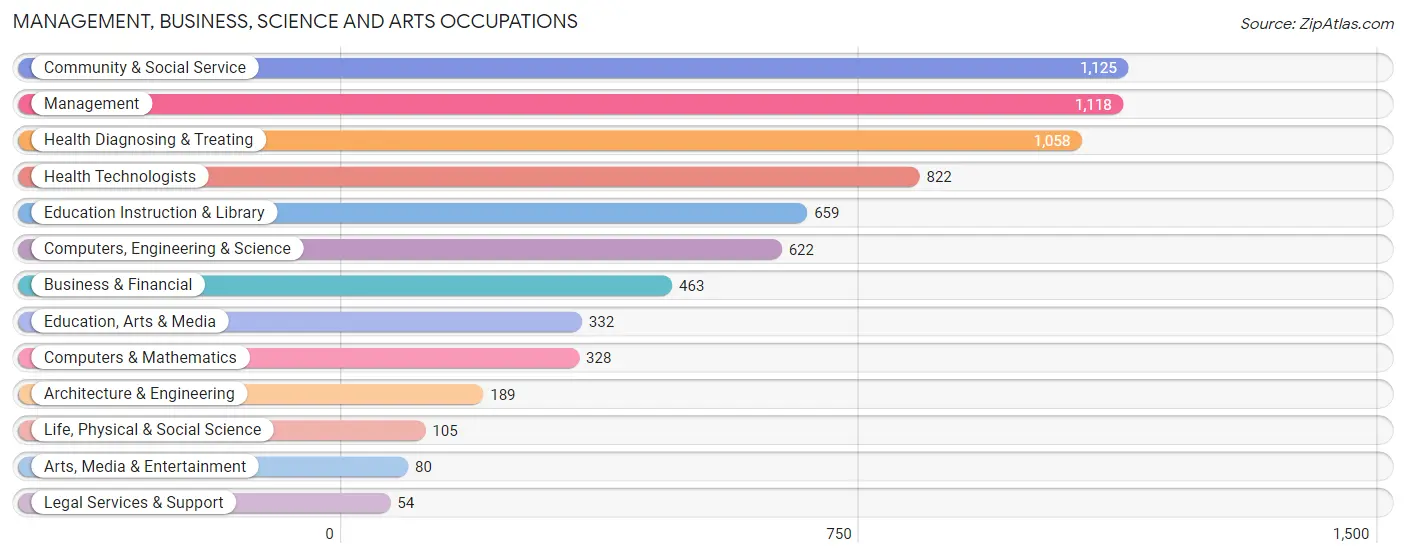
Management, Business, Science and Arts Occupations
The most common Management, Business, Science and Arts occupations in North Valley Stream are Community & Social Service (1,125 | 11.3%), Management (1,118 | 11.2%), Health Diagnosing & Treating (1,058 | 10.6%), Health Technologists (822 | 8.2%), and Education Instruction & Library (659 | 6.6%).
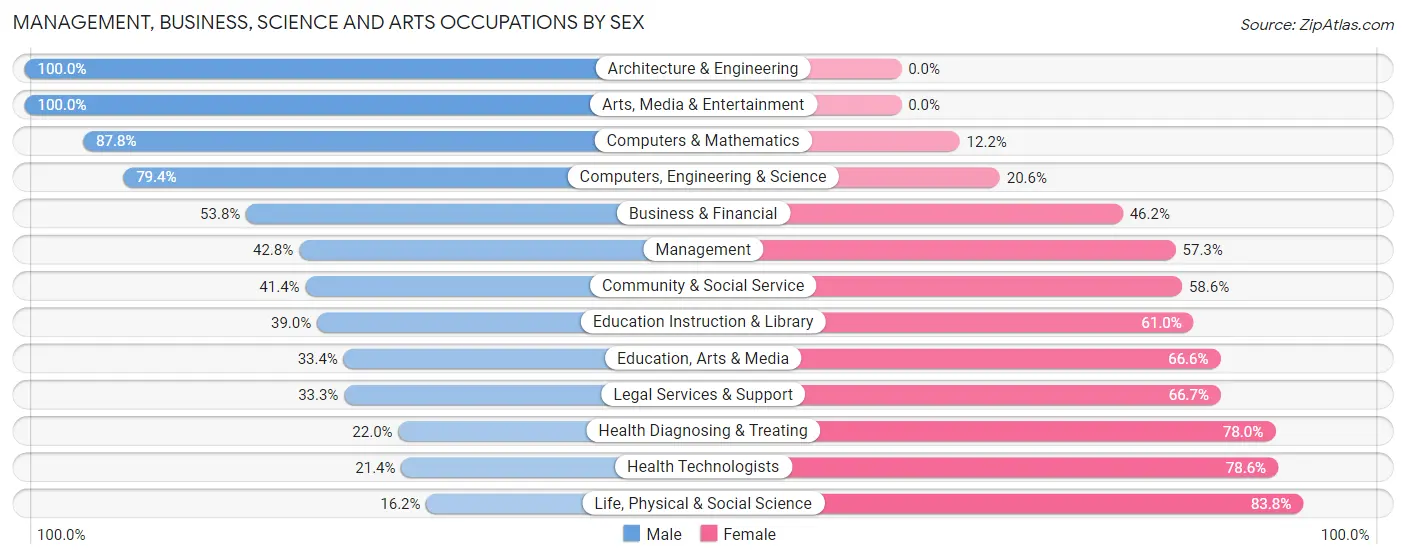
Management, Business, Science and Arts Occupations by Sex
Within the Management, Business, Science and Arts occupations in North Valley Stream, the most male-oriented occupations are Architecture & Engineering (100.0%), Arts, Media & Entertainment (100.0%), and Computers & Mathematics (87.8%), while the most female-oriented occupations are Life, Physical & Social Science (83.8%), Health Technologists (78.6%), and Health Diagnosing & Treating (78.0%).
| Occupation | Male | Female |
| Management | 478 (42.7%) | 640 (57.3%) |
| Business & Financial | 249 (53.8%) | 214 (46.2%) |
| Computers, Engineering & Science | 494 (79.4%) | 128 (20.6%) |
| Computers & Mathematics | 288 (87.8%) | 40 (12.2%) |
| Architecture & Engineering | 189 (100.0%) | 0 (0.0%) |
| Life, Physical & Social Science | 17 (16.2%) | 88 (83.8%) |
| Community & Social Service | 466 (41.4%) | 659 (58.6%) |
| Education, Arts & Media | 111 (33.4%) | 221 (66.6%) |
| Legal Services & Support | 18 (33.3%) | 36 (66.7%) |
| Education Instruction & Library | 257 (39.0%) | 402 (61.0%) |
| Arts, Media & Entertainment | 80 (100.0%) | 0 (0.0%) |
| Health Diagnosing & Treating | 233 (22.0%) | 825 (78.0%) |
| Health Technologists | 176 (21.4%) | 646 (78.6%) |
| Total (Category) | 1,920 (43.8%) | 2,466 (56.2%) |
| Total (Overall) | 5,068 (50.8%) | 4,913 (49.2%) |
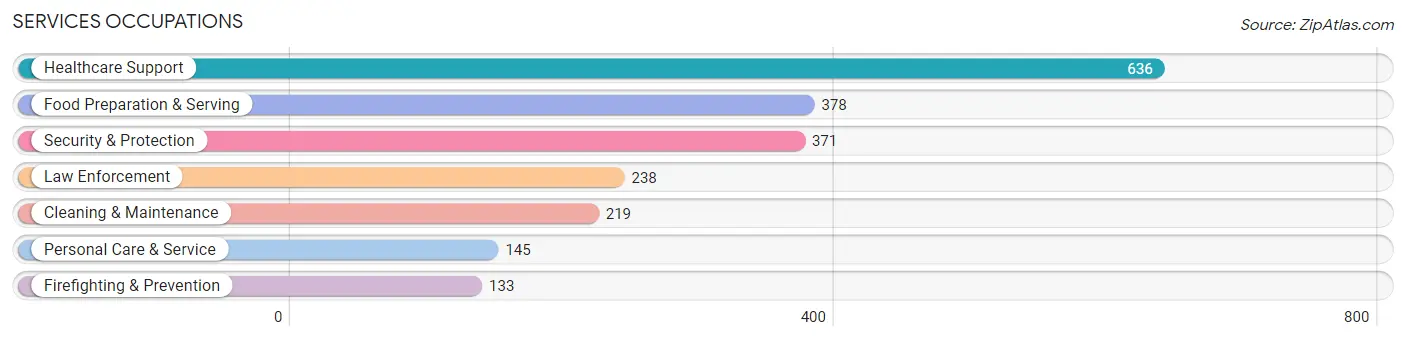
Services Occupations
The most common Services occupations in North Valley Stream are Healthcare Support (636 | 6.4%), Food Preparation & Serving (378 | 3.8%), Security & Protection (371 | 3.7%), Law Enforcement (238 | 2.4%), and Cleaning & Maintenance (219 | 2.2%).
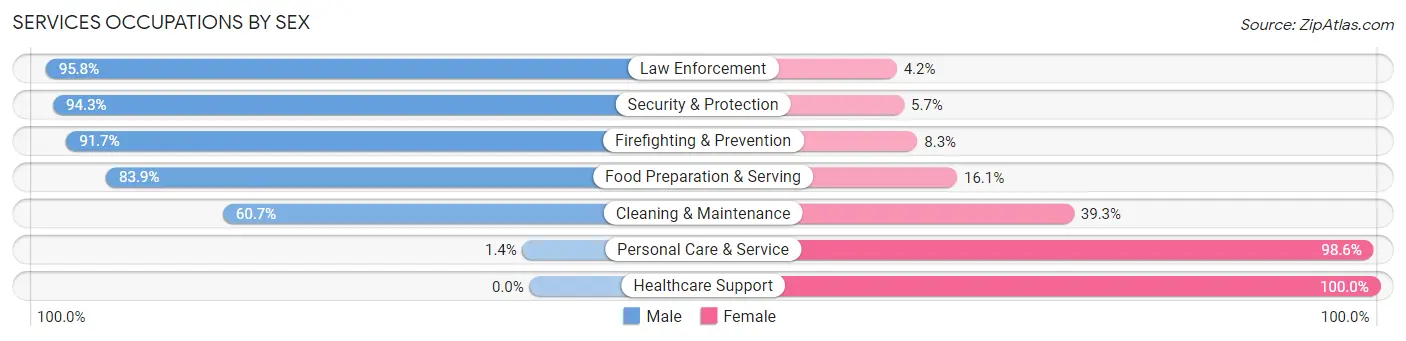
Services Occupations by Sex
Within the Services occupations in North Valley Stream, the most male-oriented occupations are Law Enforcement (95.8%), Security & Protection (94.3%), and Firefighting & Prevention (91.7%), while the most female-oriented occupations are Healthcare Support (100.0%), Personal Care & Service (98.6%), and Cleaning & Maintenance (39.3%).
| Occupation | Male | Female |
| Healthcare Support | 0 (0.0%) | 636 (100.0%) |
| Security & Protection | 350 (94.3%) | 21 (5.7%) |
| Firefighting & Prevention | 122 (91.7%) | 11 (8.3%) |
| Law Enforcement | 228 (95.8%) | 10 (4.2%) |
| Food Preparation & Serving | 317 (83.9%) | 61 (16.1%) |
| Cleaning & Maintenance | 133 (60.7%) | 86 (39.3%) |
| Personal Care & Service | 2 (1.4%) | 143 (98.6%) |
| Total (Category) | 802 (45.9%) | 947 (54.1%) |
| Total (Overall) | 5,068 (50.8%) | 4,913 (49.2%) |
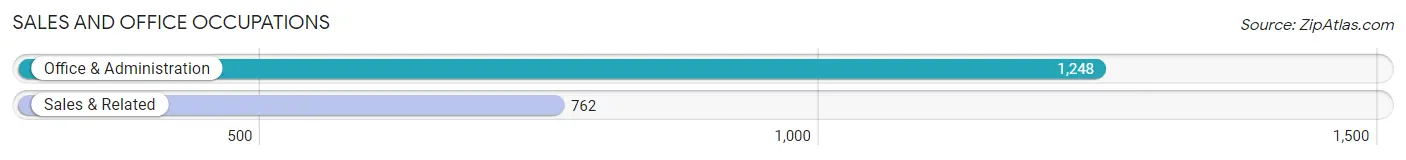
Sales and Office Occupations
The most common Sales and Office occupations in North Valley Stream are Office & Administration (1,248 | 12.5%), and Sales & Related (762 | 7.6%).
Sales and Office Occupations by Sex
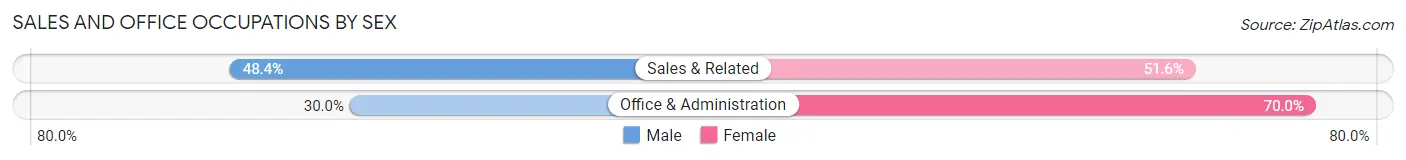
| Occupation | Male | Female |
| Sales & Related | 369 (48.4%) | 393 (51.6%) |
| Office & Administration | 374 (30.0%) | 874 (70.0%) |
| Total (Category) | 743 (37.0%) | 1,267 (63.0%) |
| Total (Overall) | 5,068 (50.8%) | 4,913 (49.2%) |
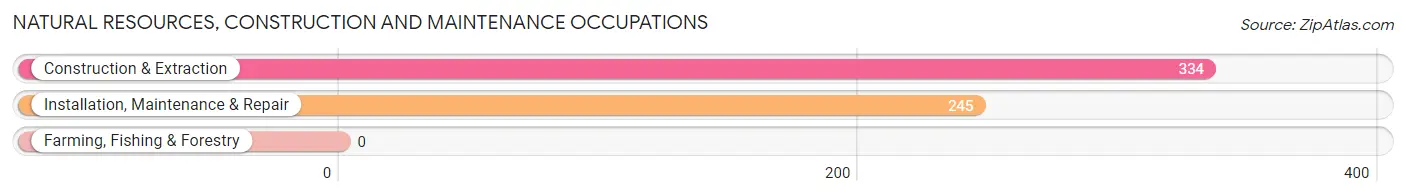
Natural Resources, Construction and Maintenance Occupations
The most common Natural Resources, Construction and Maintenance occupations in North Valley Stream are Construction & Extraction (334 | 3.4%), and Installation, Maintenance & Repair (245 | 2.5%).
Natural Resources, Construction and Maintenance Occupations by Sex
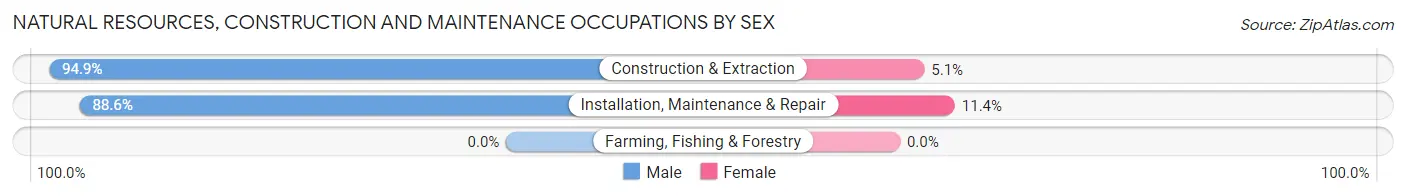
| Occupation | Male | Female |
| Farming, Fishing & Forestry | 0 (0.0%) | 0 (0.0%) |
| Construction & Extraction | 317 (94.9%) | 17 (5.1%) |
| Installation, Maintenance & Repair | 217 (88.6%) | 28 (11.4%) |
| Total (Category) | 534 (92.2%) | 45 (7.8%) |
| Total (Overall) | 5,068 (50.8%) | 4,913 (49.2%) |
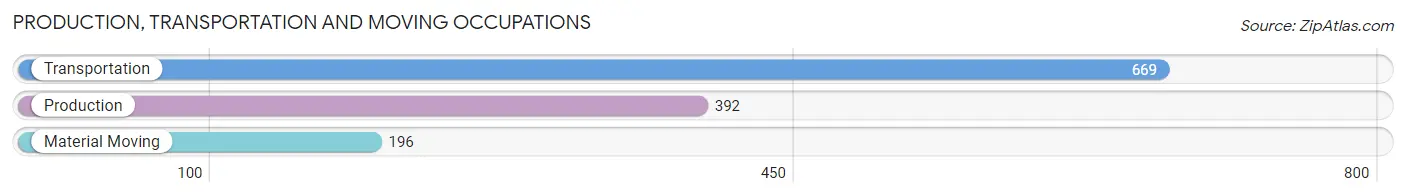
Production, Transportation and Moving Occupations
The most common Production, Transportation and Moving occupations in North Valley Stream are Transportation (669 | 6.7%), Production (392 | 3.9%), and Material Moving (196 | 2.0%).
Production, Transportation and Moving Occupations by Sex
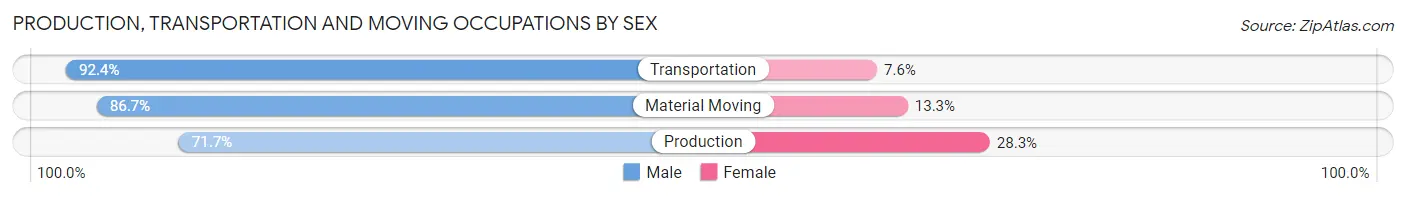
| Occupation | Male | Female |
| Production | 281 (71.7%) | 111 (28.3%) |
| Transportation | 618 (92.4%) | 51 (7.6%) |
| Material Moving | 170 (86.7%) | 26 (13.3%) |
| Total (Category) | 1,069 (85.0%) | 188 (15.0%) |
| Total (Overall) | 5,068 (50.8%) | 4,913 (49.2%) |
Employment Industries by Sex in North Valley Stream
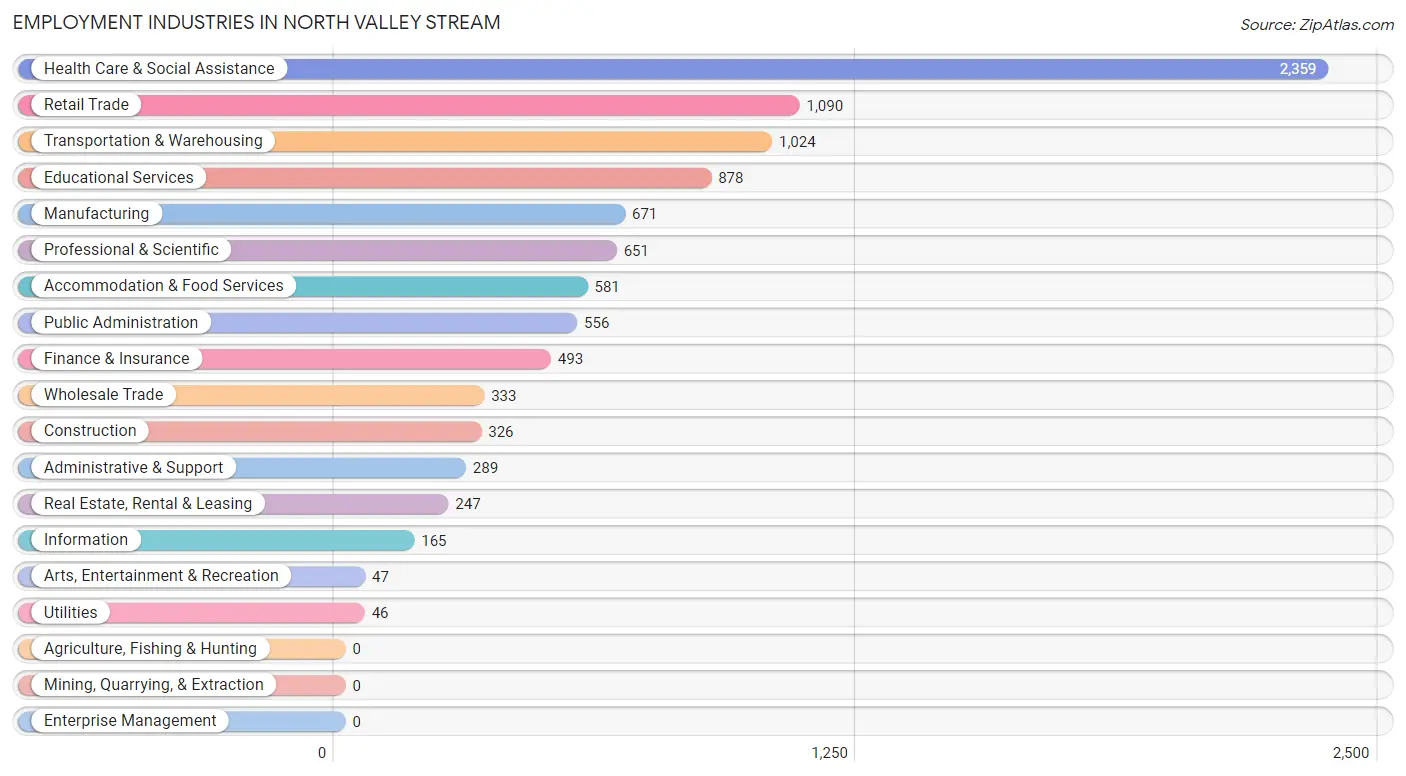
Employment Industries in North Valley Stream
The major employment industries in North Valley Stream include Health Care & Social Assistance (2,359 | 23.6%), Retail Trade (1,090 | 10.9%), Transportation & Warehousing (1,024 | 10.3%), Educational Services (878 | 8.8%), and Manufacturing (671 | 6.7%).
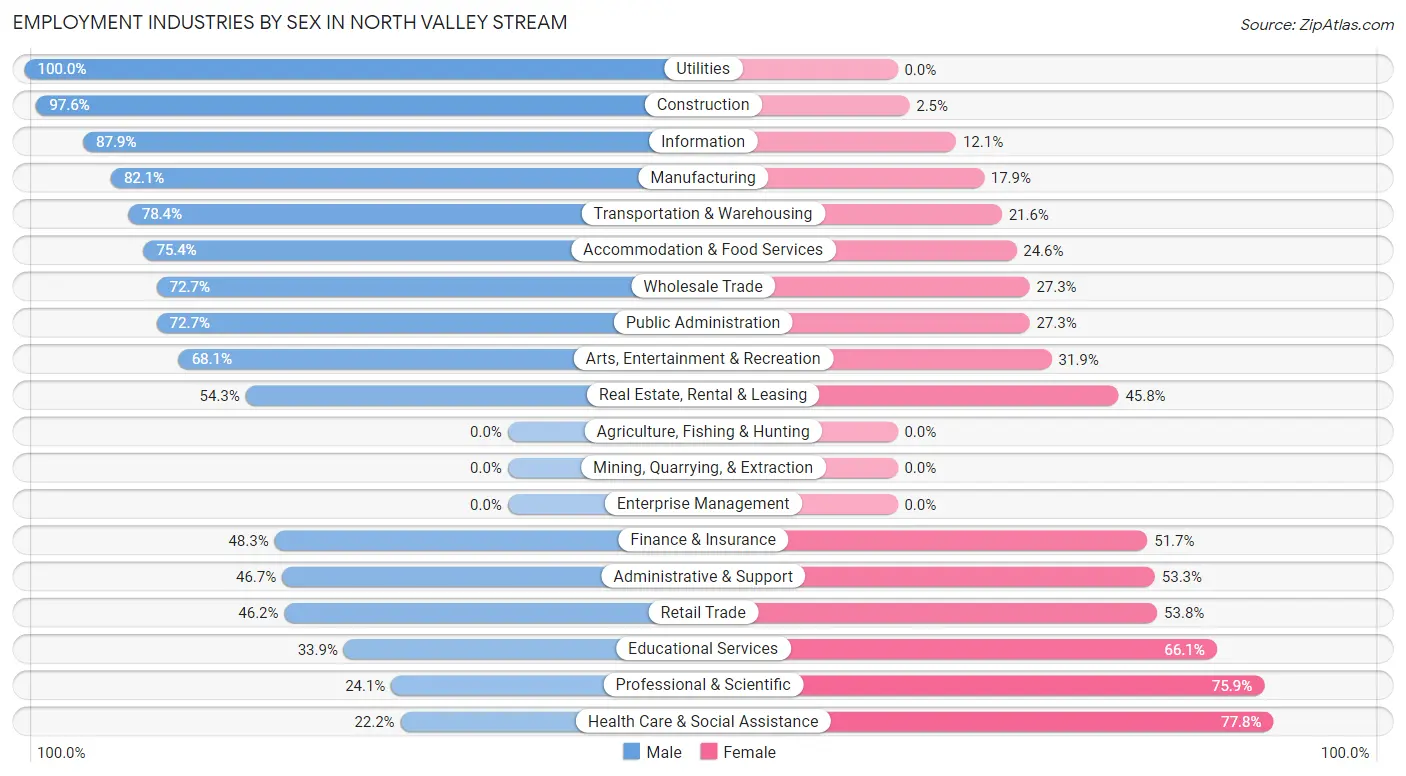
Employment Industries by Sex in North Valley Stream
The North Valley Stream industries that see more men than women are Utilities (100.0%), Construction (97.6%), and Information (87.9%), whereas the industries that tend to have a higher number of women are Health Care & Social Assistance (77.8%), Professional & Scientific (75.9%), and Educational Services (66.1%).
| Industry | Male | Female |
| Agriculture, Fishing & Hunting | 0 (0.0%) | 0 (0.0%) |
| Mining, Quarrying, & Extraction | 0 (0.0%) | 0 (0.0%) |
| Construction | 318 (97.6%) | 8 (2.5%) |
| Manufacturing | 551 (82.1%) | 120 (17.9%) |
| Wholesale Trade | 242 (72.7%) | 91 (27.3%) |
| Retail Trade | 504 (46.2%) | 586 (53.8%) |
| Transportation & Warehousing | 803 (78.4%) | 221 (21.6%) |
| Utilities | 46 (100.0%) | 0 (0.0%) |
| Information | 145 (87.9%) | 20 (12.1%) |
| Finance & Insurance | 238 (48.3%) | 255 (51.7%) |
| Real Estate, Rental & Leasing | 134 (54.2%) | 113 (45.8%) |
| Professional & Scientific | 157 (24.1%) | 494 (75.9%) |
| Enterprise Management | 0 (0.0%) | 0 (0.0%) |
| Administrative & Support | 135 (46.7%) | 154 (53.3%) |
| Educational Services | 298 (33.9%) | 580 (66.1%) |
| Health Care & Social Assistance | 524 (22.2%) | 1,835 (77.8%) |
| Arts, Entertainment & Recreation | 32 (68.1%) | 15 (31.9%) |
| Accommodation & Food Services | 438 (75.4%) | 143 (24.6%) |
| Public Administration | 404 (72.7%) | 152 (27.3%) |
| Total | 5,068 (50.8%) | 4,913 (49.2%) |
Education in North Valley Stream
School Enrollment in North Valley Stream
The most common levels of schooling among the 4,940 students in North Valley Stream are college / undergraduate (1,418 | 28.7%), high school (1,396 | 28.3%), and middle school (741 | 15.0%).
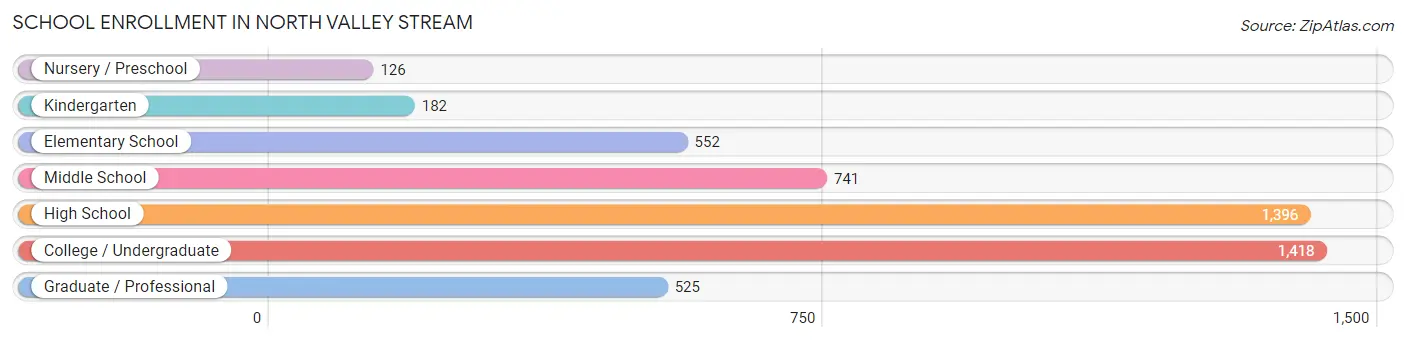
| School Level | # Students | % Students |
| Nursery / Preschool | 126 | 2.5% |
| Kindergarten | 182 | 3.7% |
| Elementary School | 552 | 11.2% |
| Middle School | 741 | 15.0% |
| High School | 1,396 | 28.3% |
| College / Undergraduate | 1,418 | 28.7% |
| Graduate / Professional | 525 | 10.6% |
| Total | 4,940 | 100.0% |
School Enrollment by Age by Funding Source in North Valley Stream
Out of a total of 4,940 students who are enrolled in schools in North Valley Stream, 1,240 (25.1%) attend a private institution, while the remaining 3,700 (74.9%) are enrolled in public schools. The age group of 25 to 34 year olds has the highest likelihood of being enrolled in private schools, with 221 (54.3% in the age bracket) enrolled. Conversely, the age group of 3 to 4 year olds has the lowest likelihood of being enrolled in a private school, with 241 (100.0% in the age bracket) attending a public institution.
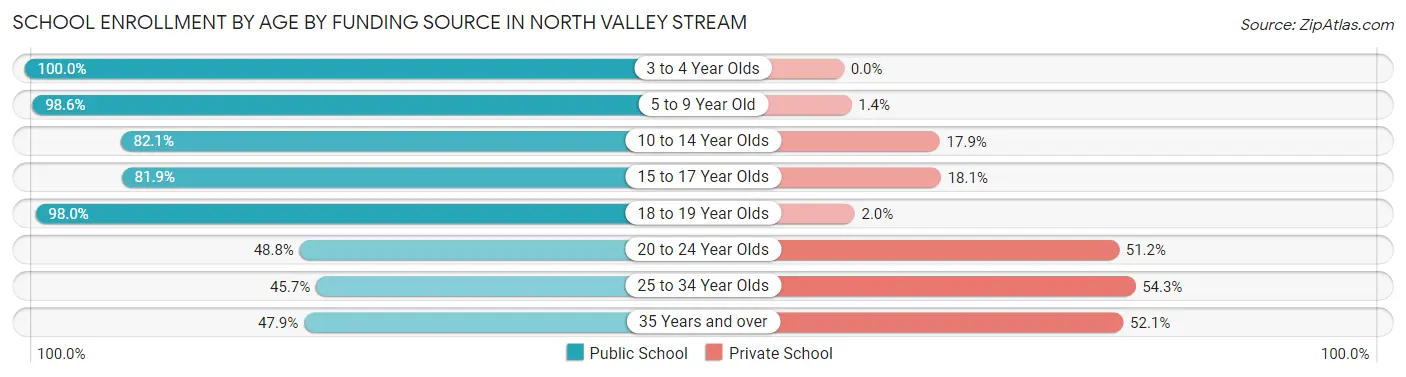
| Age Bracket | Public School | Private School |
| 3 to 4 Year Olds | 241 (100.0%) | 0 (0.0%) |
| 5 to 9 Year Old | 625 (98.6%) | 9 (1.4%) |
| 10 to 14 Year Olds | 790 (82.1%) | 172 (17.9%) |
| 15 to 17 Year Olds | 870 (81.9%) | 192 (18.1%) |
| 18 to 19 Year Olds | 389 (98.0%) | 8 (2.0%) |
| 20 to 24 Year Olds | 414 (48.8%) | 435 (51.2%) |
| 25 to 34 Year Olds | 186 (45.7%) | 221 (54.3%) |
| 35 Years and over | 186 (47.9%) | 202 (52.1%) |
| Total | 3,700 (74.9%) | 1,240 (25.1%) |
Educational Attainment by Field of Study in North Valley Stream
Business (1,322 | 22.7%), science & technology (1,025 | 17.6%), education (626 | 10.7%), social sciences (521 | 8.9%), and arts & humanities (405 | 7.0%) are the most common fields of study among 5,826 individuals in North Valley Stream who have obtained a bachelor's degree or higher.
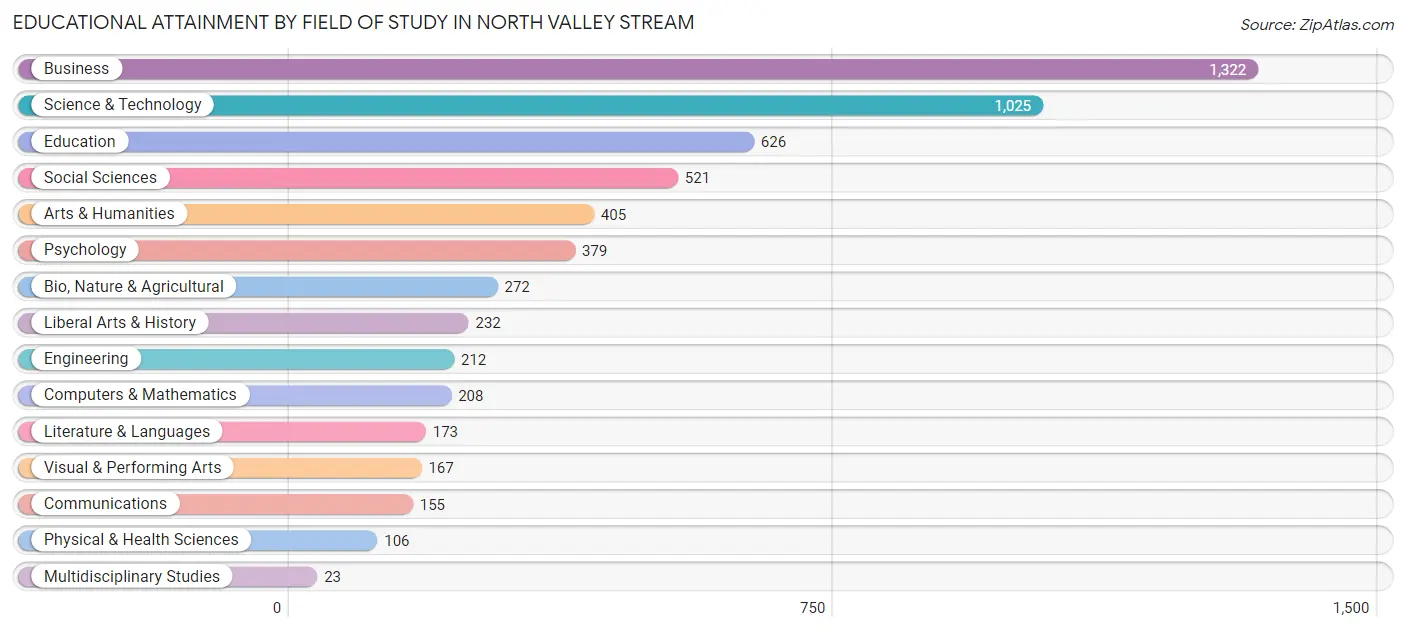
| Field of Study | # Graduates | % Graduates |
| Computers & Mathematics | 208 | 3.6% |
| Bio, Nature & Agricultural | 272 | 4.7% |
| Physical & Health Sciences | 106 | 1.8% |
| Psychology | 379 | 6.5% |
| Social Sciences | 521 | 8.9% |
| Engineering | 212 | 3.6% |
| Multidisciplinary Studies | 23 | 0.4% |
| Science & Technology | 1,025 | 17.6% |
| Business | 1,322 | 22.7% |
| Education | 626 | 10.7% |
| Literature & Languages | 173 | 3.0% |
| Liberal Arts & History | 232 | 4.0% |
| Visual & Performing Arts | 167 | 2.9% |
| Communications | 155 | 2.7% |
| Arts & Humanities | 405 | 7.0% |
| Total | 5,826 | 100.0% |
Transportation & Commute in North Valley Stream
Vehicle Availability by Sex in North Valley Stream
The most prevalent vehicle ownership categories in North Valley Stream are males with 2 vehicles (1,874, accounting for 38.5%) and females with 2 vehicles (1,725, making up 39.0%).
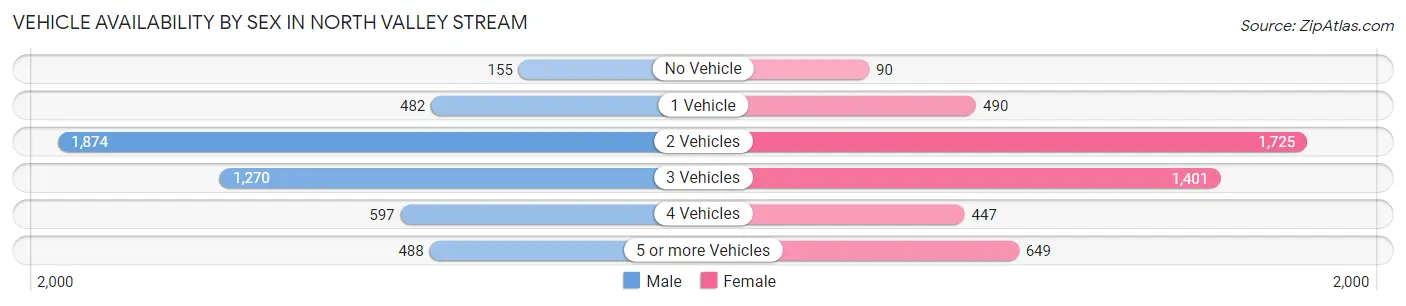
| Vehicles Available | Male | Female |
| No Vehicle | 155 (3.2%) | 90 (1.9%) |
| 1 Vehicle | 482 (9.9%) | 490 (10.2%) |
| 2 Vehicles | 1,874 (38.5%) | 1,725 (35.9%) |
| 3 Vehicles | 1,270 (26.1%) | 1,401 (29.2%) |
| 4 Vehicles | 597 (12.3%) | 447 (9.3%) |
| 5 or more Vehicles | 488 (10.0%) | 649 (13.5%) |
| Total | 4,866 (100.0%) | 4,802 (100.0%) |
Commute Time in North Valley Stream
The most frequently occuring commute durations in North Valley Stream are 30 to 34 minutes (1,593 commuters, 18.7%), 20 to 24 minutes (1,334 commuters, 15.7%), and 60 to 89 minutes (1,137 commuters, 13.4%).
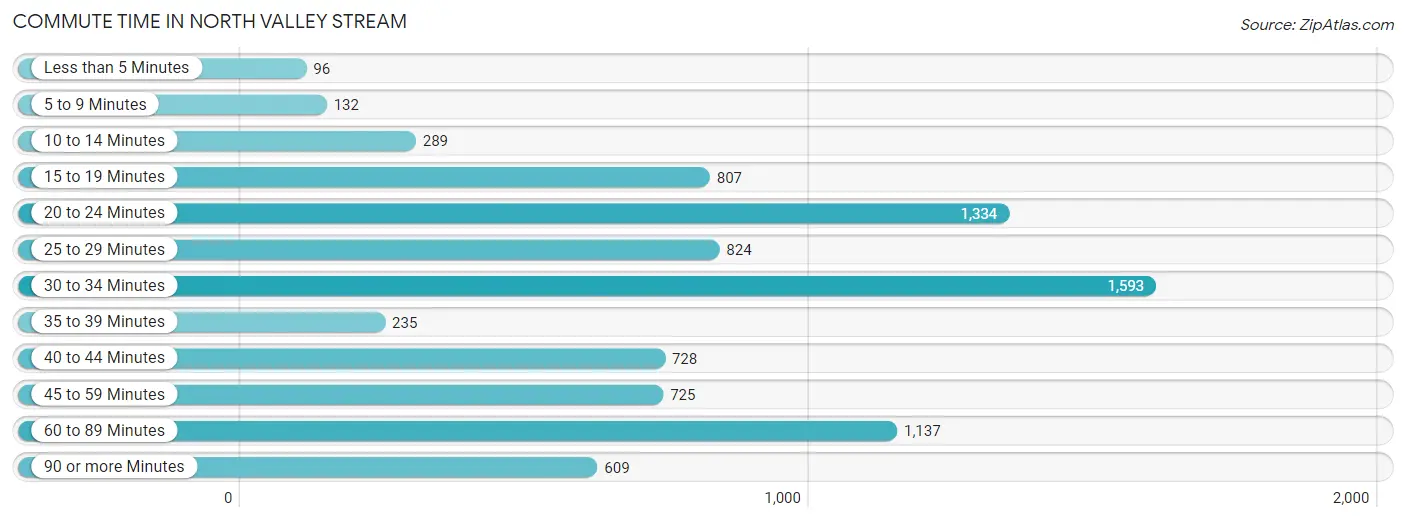
| Commute Time | # Commuters | % Commuters |
| Less than 5 Minutes | 96 | 1.1% |
| 5 to 9 Minutes | 132 | 1.5% |
| 10 to 14 Minutes | 289 | 3.4% |
| 15 to 19 Minutes | 807 | 9.5% |
| 20 to 24 Minutes | 1,334 | 15.7% |
| 25 to 29 Minutes | 824 | 9.7% |
| 30 to 34 Minutes | 1,593 | 18.7% |
| 35 to 39 Minutes | 235 | 2.8% |
| 40 to 44 Minutes | 728 | 8.6% |
| 45 to 59 Minutes | 725 | 8.5% |
| 60 to 89 Minutes | 1,137 | 13.4% |
| 90 or more Minutes | 609 | 7.2% |
Commute Time by Sex in North Valley Stream
The most common commute times in North Valley Stream are 30 to 34 minutes (865 commuters, 19.9%) for males and 60 to 89 minutes (764 commuters, 18.4%) for females.
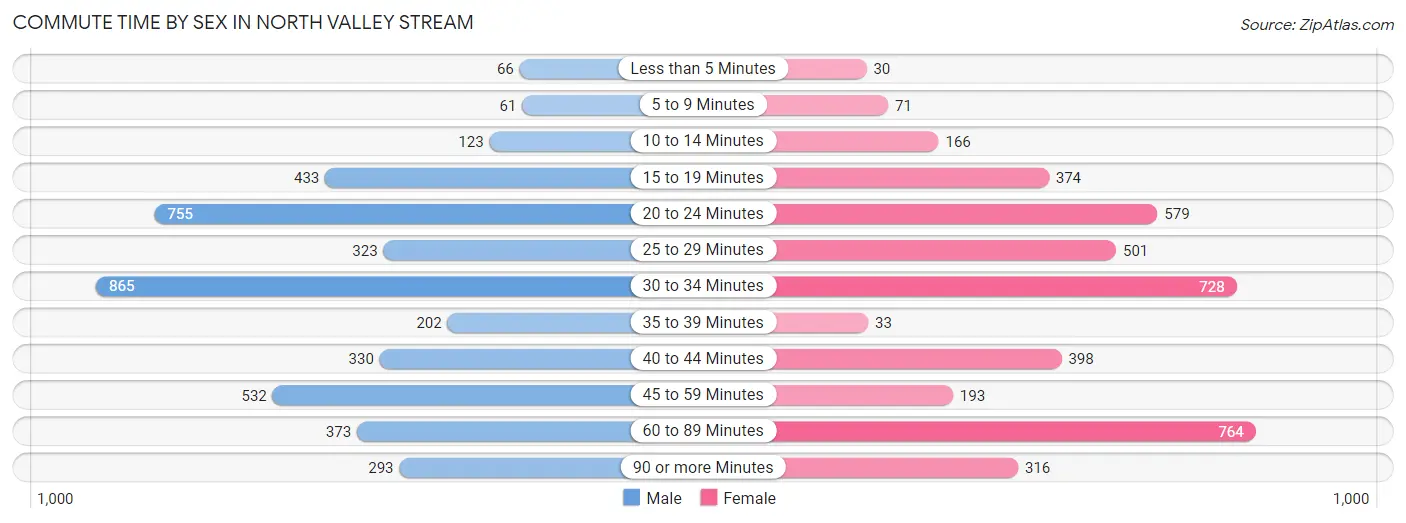
| Commute Time | Male | Female |
| Less than 5 Minutes | 66 (1.5%) | 30 (0.7%) |
| 5 to 9 Minutes | 61 (1.4%) | 71 (1.7%) |
| 10 to 14 Minutes | 123 (2.8%) | 166 (4.0%) |
| 15 to 19 Minutes | 433 (9.9%) | 374 (9.0%) |
| 20 to 24 Minutes | 755 (17.3%) | 579 (13.9%) |
| 25 to 29 Minutes | 323 (7.4%) | 501 (12.1%) |
| 30 to 34 Minutes | 865 (19.9%) | 728 (17.5%) |
| 35 to 39 Minutes | 202 (4.6%) | 33 (0.8%) |
| 40 to 44 Minutes | 330 (7.6%) | 398 (9.6%) |
| 45 to 59 Minutes | 532 (12.2%) | 193 (4.6%) |
| 60 to 89 Minutes | 373 (8.6%) | 764 (18.4%) |
| 90 or more Minutes | 293 (6.7%) | 316 (7.6%) |
Time of Departure to Work by Sex in North Valley Stream
The most frequent times of departure to work in North Valley Stream are 8:00 AM to 8:29 AM (698, 16.0%) for males and 8:00 AM to 8:29 AM (1,178, 28.4%) for females.
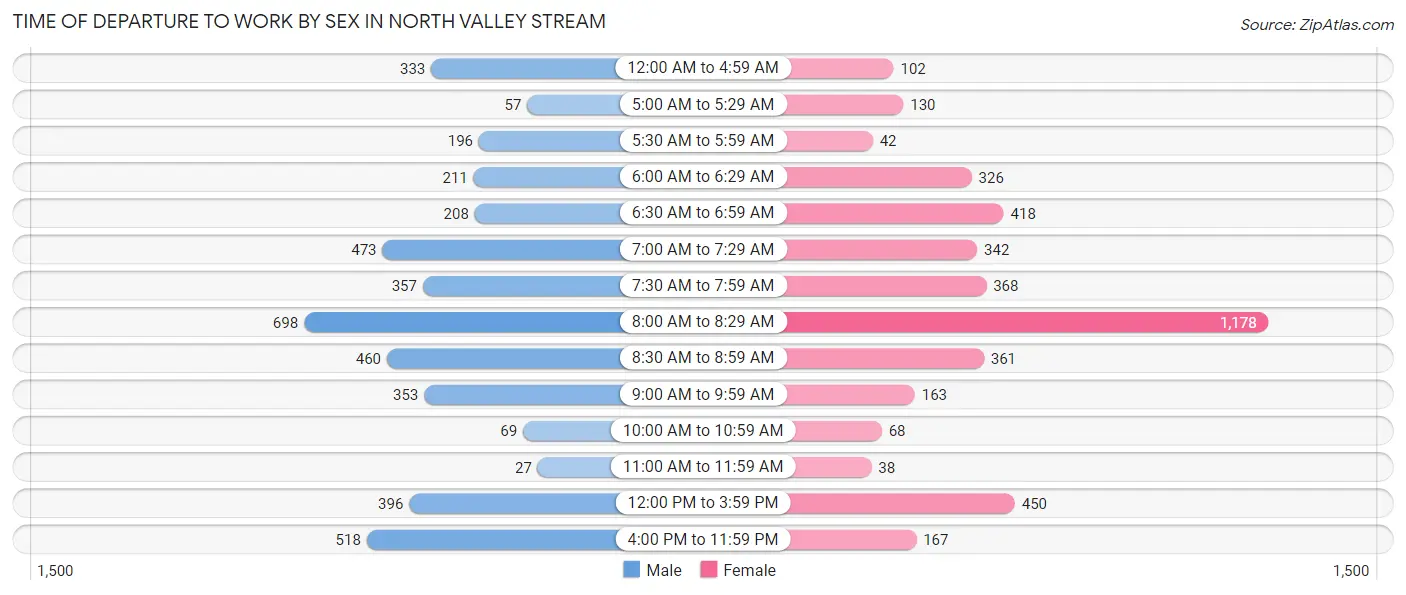
| Time of Departure | Male | Female |
| 12:00 AM to 4:59 AM | 333 (7.6%) | 102 (2.5%) |
| 5:00 AM to 5:29 AM | 57 (1.3%) | 130 (3.1%) |
| 5:30 AM to 5:59 AM | 196 (4.5%) | 42 (1.0%) |
| 6:00 AM to 6:29 AM | 211 (4.8%) | 326 (7.9%) |
| 6:30 AM to 6:59 AM | 208 (4.8%) | 418 (10.1%) |
| 7:00 AM to 7:29 AM | 473 (10.9%) | 342 (8.2%) |
| 7:30 AM to 7:59 AM | 357 (8.2%) | 368 (8.9%) |
| 8:00 AM to 8:29 AM | 698 (16.0%) | 1,178 (28.4%) |
| 8:30 AM to 8:59 AM | 460 (10.6%) | 361 (8.7%) |
| 9:00 AM to 9:59 AM | 353 (8.1%) | 163 (3.9%) |
| 10:00 AM to 10:59 AM | 69 (1.6%) | 68 (1.6%) |
| 11:00 AM to 11:59 AM | 27 (0.6%) | 38 (0.9%) |
| 12:00 PM to 3:59 PM | 396 (9.1%) | 450 (10.8%) |
| 4:00 PM to 11:59 PM | 518 (11.9%) | 167 (4.0%) |
| Total | 4,356 (100.0%) | 4,153 (100.0%) |
Housing Occupancy in North Valley Stream
Occupancy by Ownership in North Valley Stream
Of the total 5,588 dwellings in North Valley Stream, owner-occupied units account for 5,254 (94.0%), while renter-occupied units make up 334 (6.0%).
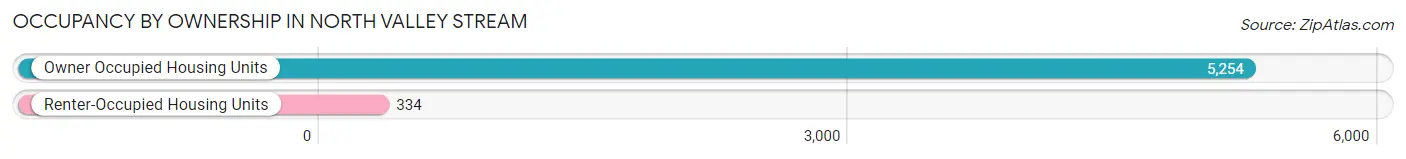
| Occupancy | # Housing Units | % Housing Units |
| Owner Occupied Housing Units | 5,254 | 94.0% |
| Renter-Occupied Housing Units | 334 | 6.0% |
| Total Occupied Housing Units | 5,588 | 100.0% |
Occupancy by Household Size in North Valley Stream
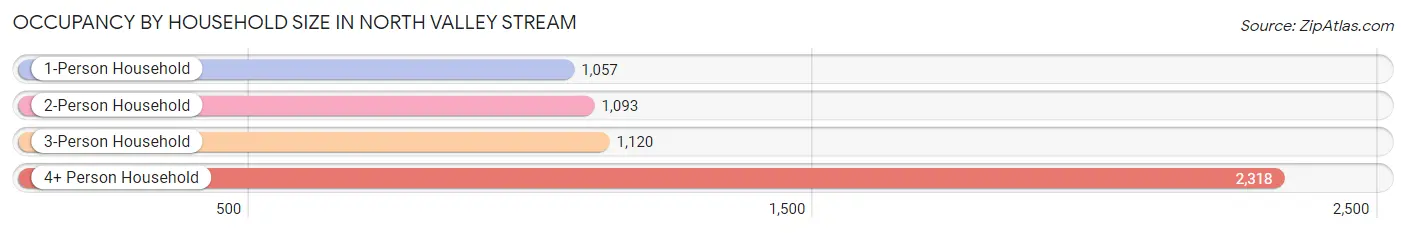
| Household Size | # Housing Units | % Housing Units |
| 1-Person Household | 1,057 | 18.9% |
| 2-Person Household | 1,093 | 19.6% |
| 3-Person Household | 1,120 | 20.0% |
| 4+ Person Household | 2,318 | 41.5% |
| Total Housing Units | 5,588 | 100.0% |
Occupancy by Ownership by Household Size in North Valley Stream
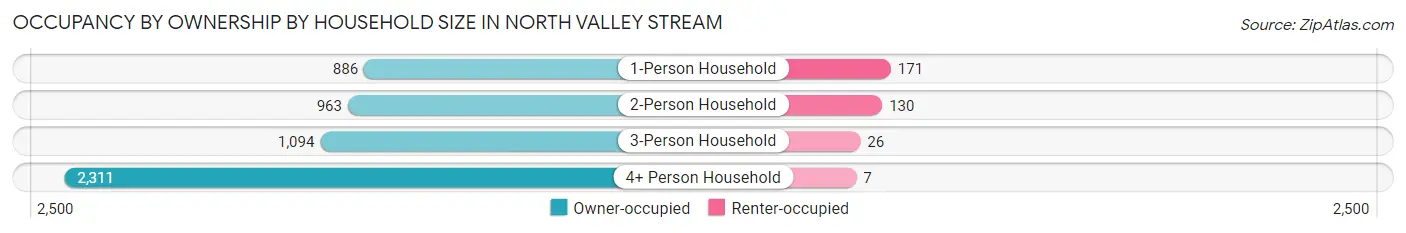
| Household Size | Owner-occupied | Renter-occupied |
| 1-Person Household | 886 (83.8%) | 171 (16.2%) |
| 2-Person Household | 963 (88.1%) | 130 (11.9%) |
| 3-Person Household | 1,094 (97.7%) | 26 (2.3%) |
| 4+ Person Household | 2,311 (99.7%) | 7 (0.3%) |
| Total Housing Units | 5,254 (94.0%) | 334 (6.0%) |
Occupancy by Educational Attainment in North Valley Stream
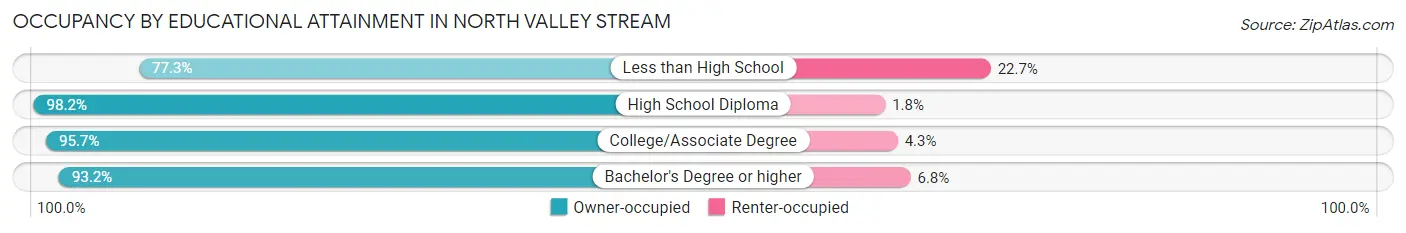
| Household Size | Owner-occupied | Renter-occupied |
| Less than High School | 245 (77.3%) | 72 (22.7%) |
| High School Diploma | 1,089 (98.2%) | 20 (1.8%) |
| College/Associate Degree | 1,568 (95.7%) | 70 (4.3%) |
| Bachelor's Degree or higher | 2,352 (93.2%) | 172 (6.8%) |
Occupancy by Age of Householder in North Valley Stream
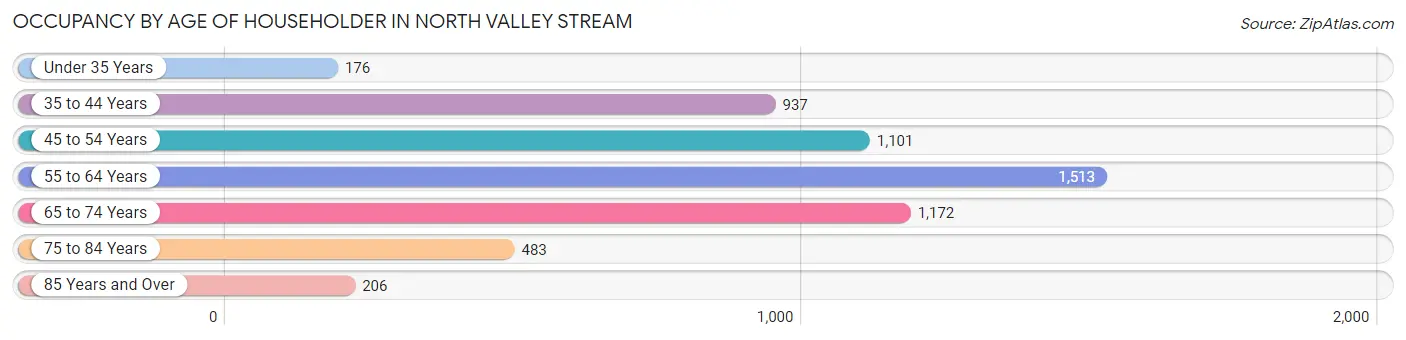
| Age Bracket | # Households | % Households |
| Under 35 Years | 176 | 3.2% |
| 35 to 44 Years | 937 | 16.8% |
| 45 to 54 Years | 1,101 | 19.7% |
| 55 to 64 Years | 1,513 | 27.1% |
| 65 to 74 Years | 1,172 | 21.0% |
| 75 to 84 Years | 483 | 8.6% |
| 85 Years and Over | 206 | 3.7% |
| Total | 5,588 | 100.0% |
Housing Finances in North Valley Stream
Median Income by Occupancy in North Valley Stream
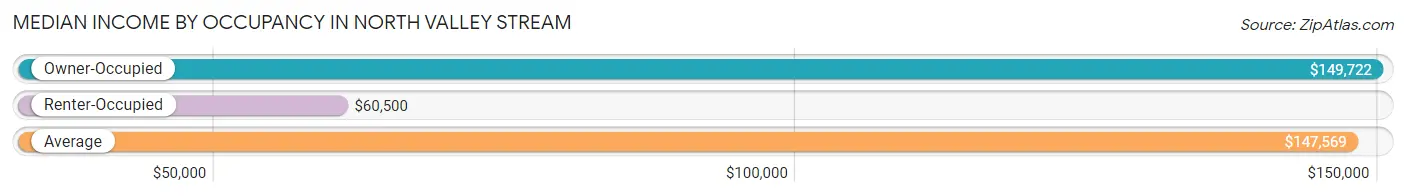
| Occupancy Type | # Households | Median Income |
| Owner-Occupied | 5,254 (94.0%) | $149,722 |
| Renter-Occupied | 334 (6.0%) | $60,500 |
| Average | 5,588 (100.0%) | $147,569 |
Occupancy by Householder Income Bracket in North Valley Stream
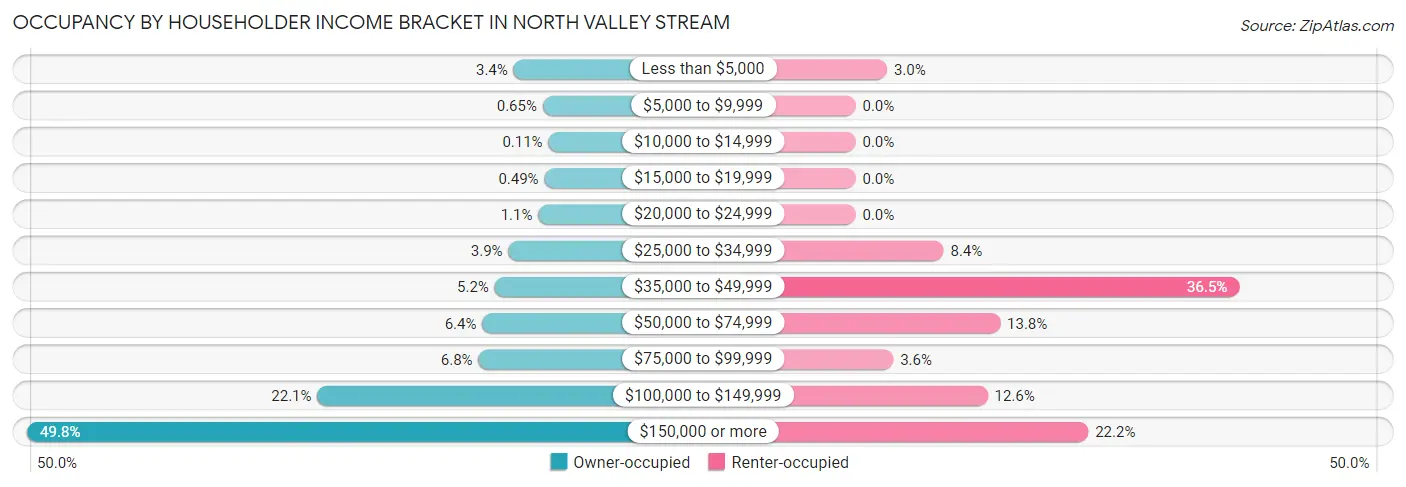
| Income Bracket | Owner-occupied | Renter-occupied |
| Less than $5,000 | 180 (3.4%) | 10 (3.0%) |
| $5,000 to $9,999 | 34 (0.6%) | 0 (0.0%) |
| $10,000 to $14,999 | 6 (0.1%) | 0 (0.0%) |
| $15,000 to $19,999 | 26 (0.5%) | 0 (0.0%) |
| $20,000 to $24,999 | 57 (1.1%) | 0 (0.0%) |
| $25,000 to $34,999 | 206 (3.9%) | 28 (8.4%) |
| $35,000 to $49,999 | 275 (5.2%) | 122 (36.5%) |
| $50,000 to $74,999 | 337 (6.4%) | 46 (13.8%) |
| $75,000 to $99,999 | 356 (6.8%) | 12 (3.6%) |
| $100,000 to $149,999 | 1,162 (22.1%) | 42 (12.6%) |
| $150,000 or more | 2,615 (49.8%) | 74 (22.2%) |
| Total | 5,254 (100.0%) | 334 (100.0%) |
Monthly Housing Cost Tiers in North Valley Stream
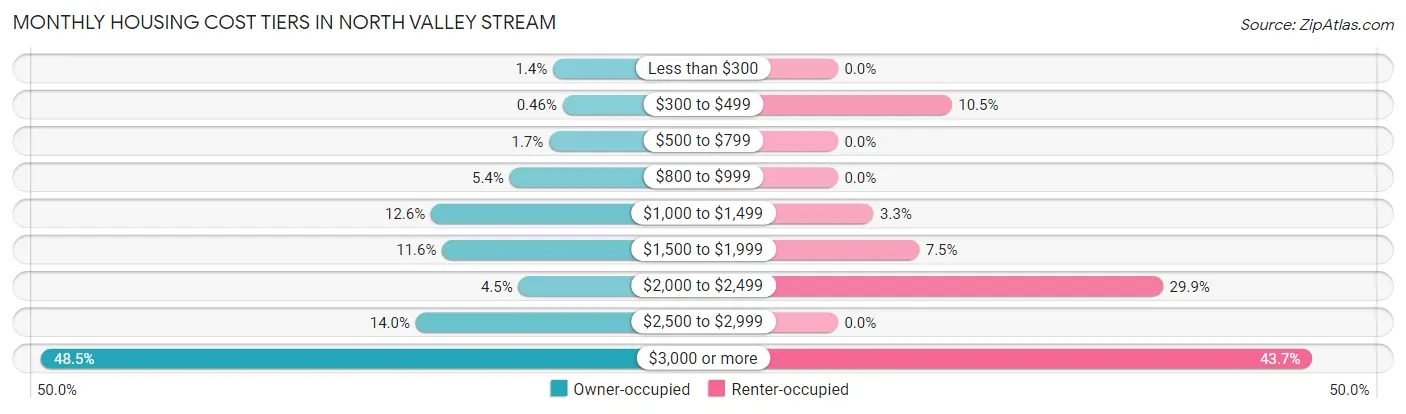
| Monthly Cost | Owner-occupied | Renter-occupied |
| Less than $300 | 71 (1.3%) | 0 (0.0%) |
| $300 to $499 | 24 (0.5%) | 35 (10.5%) |
| $500 to $799 | 90 (1.7%) | 0 (0.0%) |
| $800 to $999 | 281 (5.3%) | 0 (0.0%) |
| $1,000 to $1,499 | 661 (12.6%) | 11 (3.3%) |
| $1,500 to $1,999 | 607 (11.6%) | 25 (7.5%) |
| $2,000 to $2,499 | 238 (4.5%) | 100 (29.9%) |
| $2,500 to $2,999 | 735 (14.0%) | 0 (0.0%) |
| $3,000 or more | 2,547 (48.5%) | 146 (43.7%) |
| Total | 5,254 (100.0%) | 334 (100.0%) |
Physical Housing Characteristics in North Valley Stream
Housing Structures in North Valley Stream
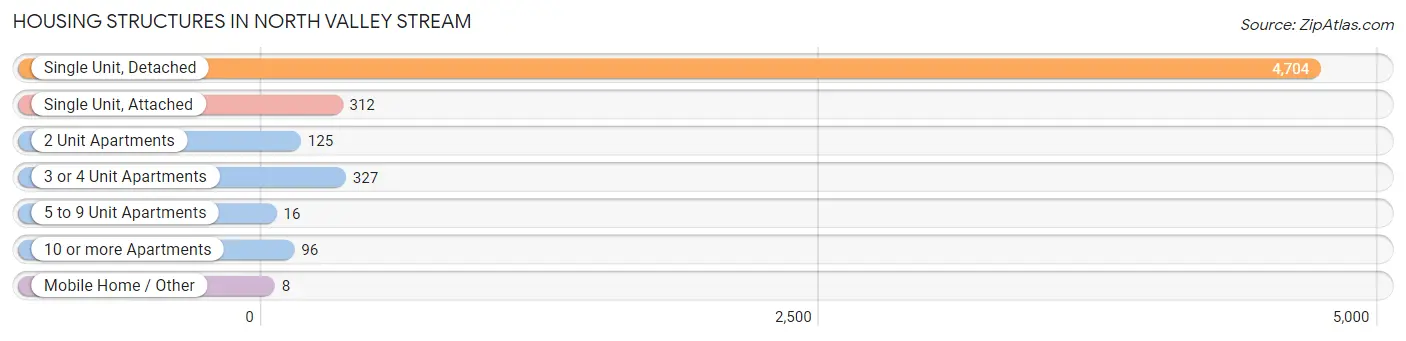
| Structure Type | # Housing Units | % Housing Units |
| Single Unit, Detached | 4,704 | 84.2% |
| Single Unit, Attached | 312 | 5.6% |
| 2 Unit Apartments | 125 | 2.2% |
| 3 or 4 Unit Apartments | 327 | 5.9% |
| 5 to 9 Unit Apartments | 16 | 0.3% |
| 10 or more Apartments | 96 | 1.7% |
| Mobile Home / Other | 8 | 0.1% |
| Total | 5,588 | 100.0% |
Housing Structures by Occupancy in North Valley Stream
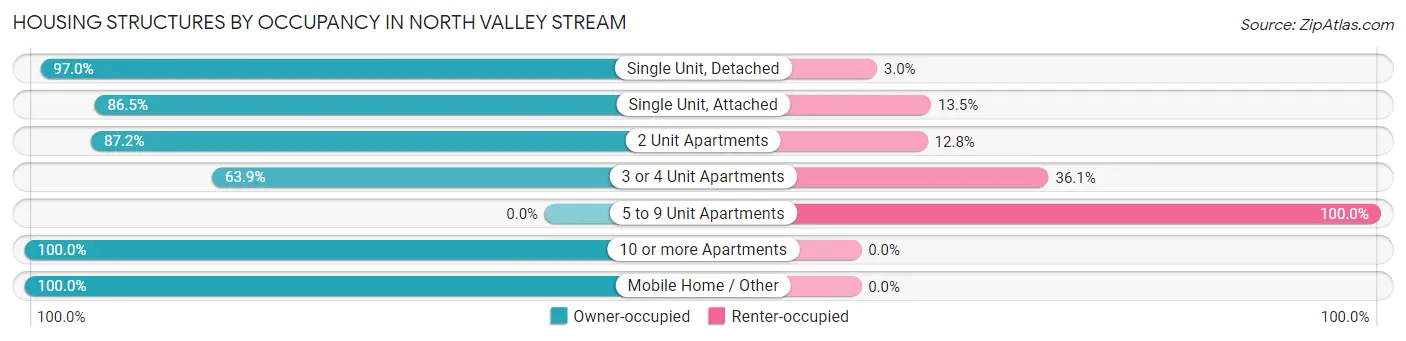
| Structure Type | Owner-occupied | Renter-occupied |
| Single Unit, Detached | 4,562 (97.0%) | 142 (3.0%) |
| Single Unit, Attached | 270 (86.5%) | 42 (13.5%) |
| 2 Unit Apartments | 109 (87.2%) | 16 (12.8%) |
| 3 or 4 Unit Apartments | 209 (63.9%) | 118 (36.1%) |
| 5 to 9 Unit Apartments | 0 (0.0%) | 16 (100.0%) |
| 10 or more Apartments | 96 (100.0%) | 0 (0.0%) |
| Mobile Home / Other | 8 (100.0%) | 0 (0.0%) |
| Total | 5,254 (94.0%) | 334 (6.0%) |
Housing Structures by Number of Rooms in North Valley Stream
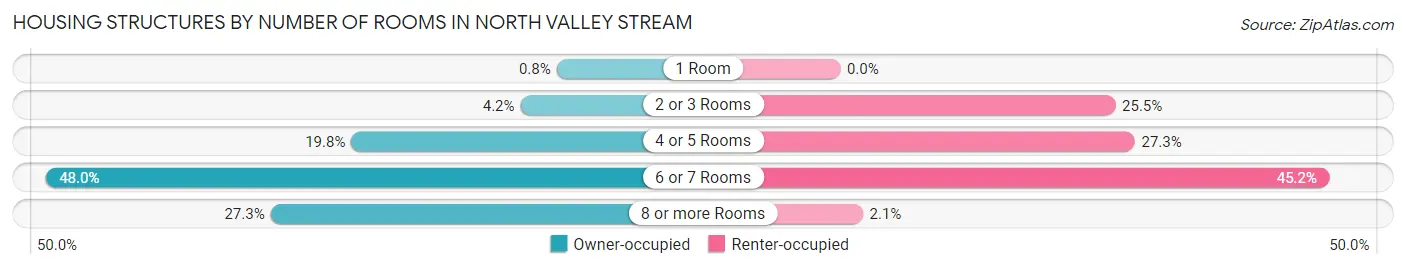
| Number of Rooms | Owner-occupied | Renter-occupied |
| 1 Room | 42 (0.8%) | 0 (0.0%) |
| 2 or 3 Rooms | 218 (4.2%) | 85 (25.5%) |
| 4 or 5 Rooms | 1,040 (19.8%) | 91 (27.3%) |
| 6 or 7 Rooms | 2,522 (48.0%) | 151 (45.2%) |
| 8 or more Rooms | 1,432 (27.3%) | 7 (2.1%) |
| Total | 5,254 (100.0%) | 334 (100.0%) |
Housing Structure by Heating Type in North Valley Stream
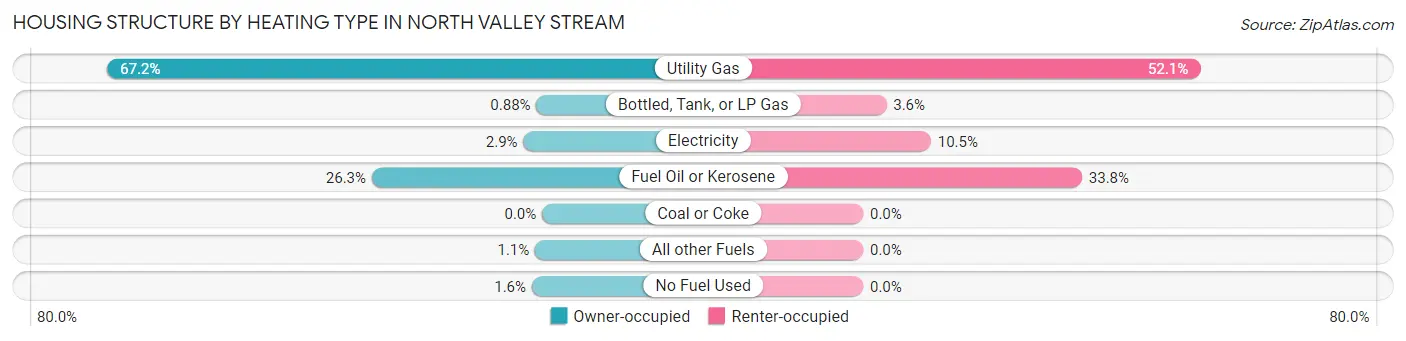
| Heating Type | Owner-occupied | Renter-occupied |
| Utility Gas | 3,533 (67.2%) | 174 (52.1%) |
| Bottled, Tank, or LP Gas | 46 (0.9%) | 12 (3.6%) |
| Electricity | 152 (2.9%) | 35 (10.5%) |
| Fuel Oil or Kerosene | 1,383 (26.3%) | 113 (33.8%) |
| Coal or Coke | 0 (0.0%) | 0 (0.0%) |
| All other Fuels | 57 (1.1%) | 0 (0.0%) |
| No Fuel Used | 83 (1.6%) | 0 (0.0%) |
| Total | 5,254 (100.0%) | 334 (100.0%) |
Household Vehicle Usage in North Valley Stream
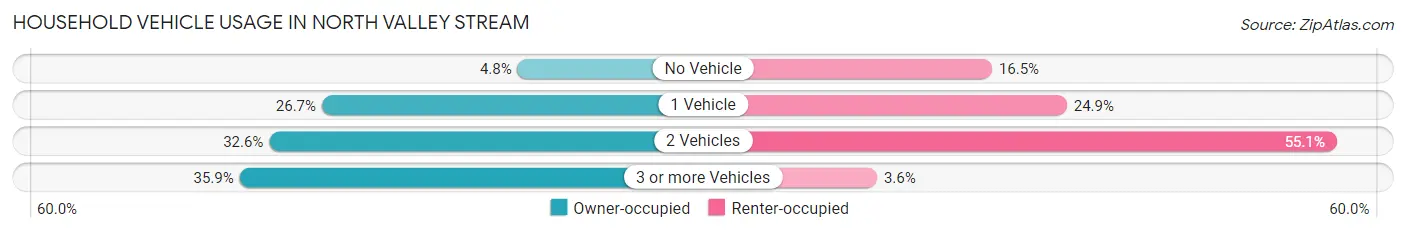
| Vehicles per Household | Owner-occupied | Renter-occupied |
| No Vehicle | 251 (4.8%) | 55 (16.5%) |
| 1 Vehicle | 1,403 (26.7%) | 83 (24.8%) |
| 2 Vehicles | 1,713 (32.6%) | 184 (55.1%) |
| 3 or more Vehicles | 1,887 (35.9%) | 12 (3.6%) |
| Total | 5,254 (100.0%) | 334 (100.0%) |
Real Estate & Mortgages in North Valley Stream
Real Estate and Mortgage Overview in North Valley Stream
| Characteristic | Without Mortgage | With Mortgage |
| Housing Units | 1,446 | 3,808 |
| Median Property Value | $544,100 | $577,000 |
| Median Household Income | $114,038 | $2,209 |
| Monthly Housing Costs | $1,335 | $2,547 |
| Real Estate Taxes | $10,001 | $58 |
Property Value by Mortgage Status in North Valley Stream
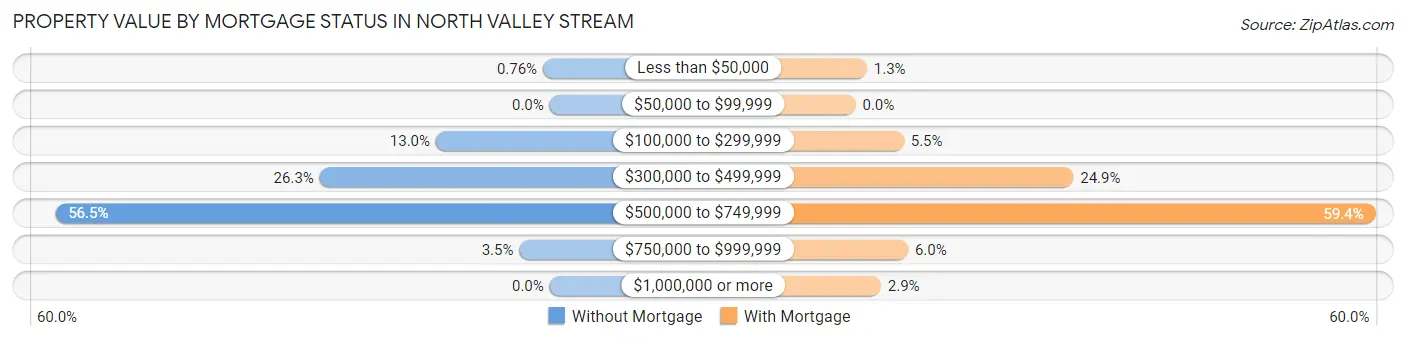
| Property Value | Without Mortgage | With Mortgage |
| Less than $50,000 | 11 (0.8%) | 49 (1.3%) |
| $50,000 to $99,999 | 0 (0.0%) | 0 (0.0%) |
| $100,000 to $299,999 | 188 (13.0%) | 210 (5.5%) |
| $300,000 to $499,999 | 380 (26.3%) | 948 (24.9%) |
| $500,000 to $749,999 | 817 (56.5%) | 2,263 (59.4%) |
| $750,000 to $999,999 | 50 (3.5%) | 228 (6.0%) |
| $1,000,000 or more | 0 (0.0%) | 110 (2.9%) |
| Total | 1,446 (100.0%) | 3,808 (100.0%) |
Household Income by Mortgage Status in North Valley Stream
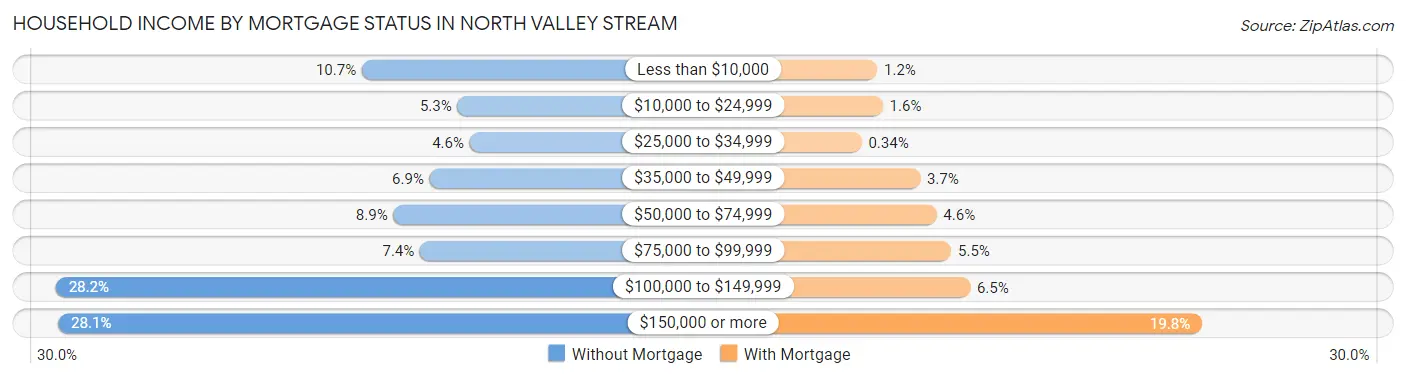
| Household Income | Without Mortgage | With Mortgage |
| Less than $10,000 | 155 (10.7%) | 47 (1.2%) |
| $10,000 to $24,999 | 76 (5.3%) | 59 (1.5%) |
| $25,000 to $34,999 | 66 (4.6%) | 13 (0.3%) |
| $35,000 to $49,999 | 99 (6.9%) | 140 (3.7%) |
| $50,000 to $74,999 | 129 (8.9%) | 176 (4.6%) |
| $75,000 to $99,999 | 107 (7.4%) | 208 (5.5%) |
| $100,000 to $149,999 | 408 (28.2%) | 249 (6.5%) |
| $150,000 or more | 406 (28.1%) | 754 (19.8%) |
| Total | 1,446 (100.0%) | 3,808 (100.0%) |
Property Value to Household Income Ratio in North Valley Stream
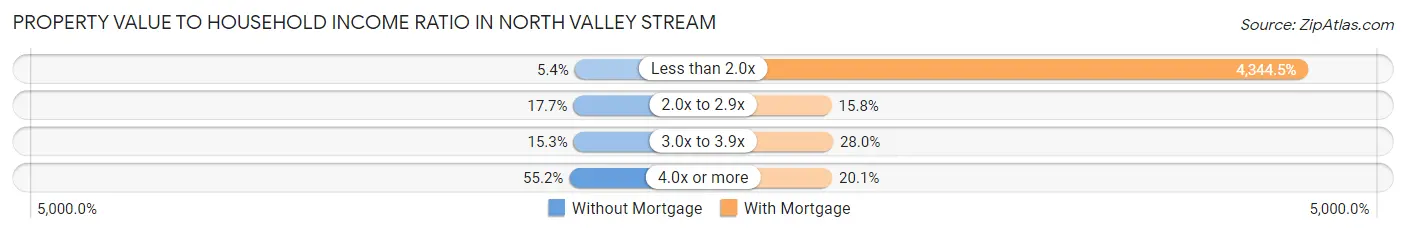
| Value-to-Income Ratio | Without Mortgage | With Mortgage |
| Less than 2.0x | 78 (5.4%) | 165,440 (4,344.5%) |
| 2.0x to 2.9x | 256 (17.7%) | 600 (15.8%) |
| 3.0x to 3.9x | 221 (15.3%) | 1,065 (28.0%) |
| 4.0x or more | 798 (55.2%) | 765 (20.1%) |
| Total | 1,446 (100.0%) | 3,808 (100.0%) |
Real Estate Taxes by Mortgage Status in North Valley Stream
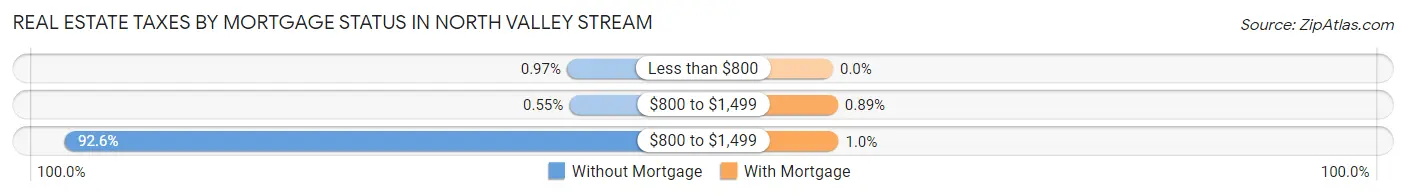
| Property Taxes | Without Mortgage | With Mortgage |
| Less than $800 | 14 (1.0%) | 0 (0.0%) |
| $800 to $1,499 | 8 (0.5%) | 34 (0.9%) |
| $800 to $1,499 | 1,339 (92.6%) | 38 (1.0%) |
| Total | 1,446 (100.0%) | 3,808 (100.0%) |
Health & Disability in North Valley Stream
Health Insurance Coverage by Age in North Valley Stream
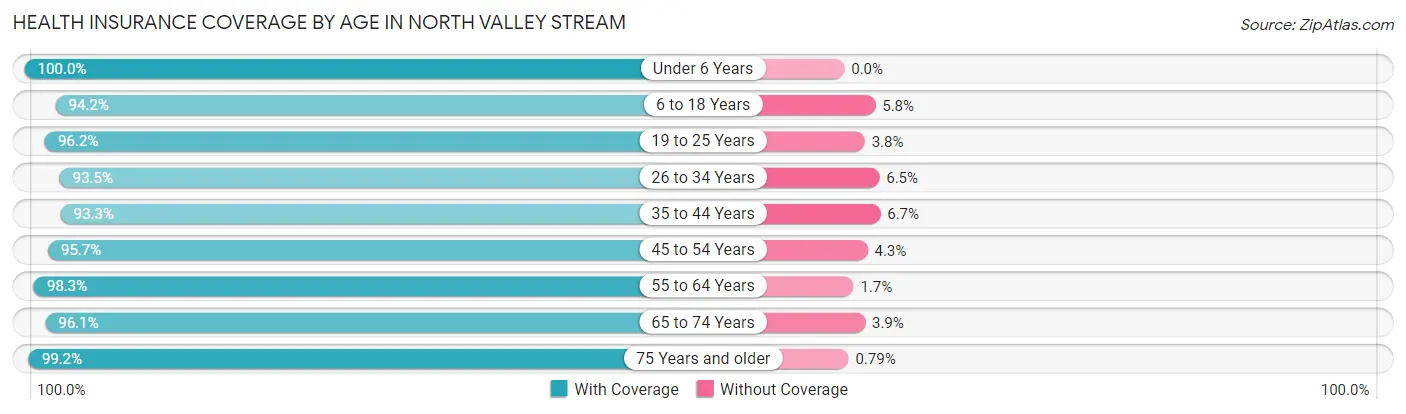
| Age Bracket | With Coverage | Without Coverage |
| Under 6 Years | 907 (100.0%) | 0 (0.0%) |
| 6 to 18 Years | 2,720 (94.2%) | 167 (5.8%) |
| 19 to 25 Years | 2,072 (96.2%) | 82 (3.8%) |
| 26 to 34 Years | 2,020 (93.5%) | 141 (6.5%) |
| 35 to 44 Years | 1,891 (93.3%) | 136 (6.7%) |
| 45 to 54 Years | 2,498 (95.7%) | 113 (4.3%) |
| 55 to 64 Years | 2,853 (98.3%) | 50 (1.7%) |
| 65 to 74 Years | 1,963 (96.1%) | 79 (3.9%) |
| 75 Years and older | 1,260 (99.2%) | 10 (0.8%) |
| Total | 18,184 (95.9%) | 778 (4.1%) |
Health Insurance Coverage by Citizenship Status in North Valley Stream
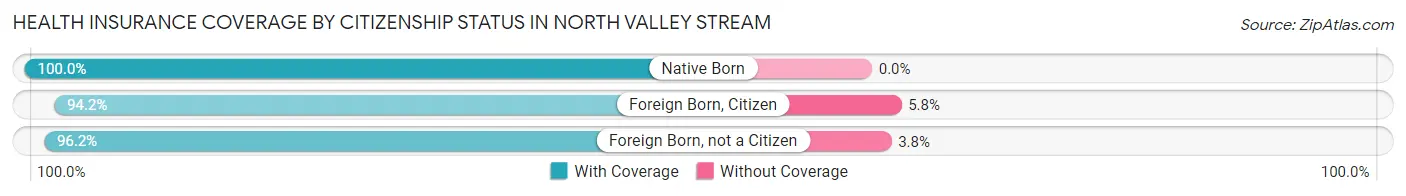
| Citizenship Status | With Coverage | Without Coverage |
| Native Born | 907 (100.0%) | 0 (0.0%) |
| Foreign Born, Citizen | 2,720 (94.2%) | 167 (5.8%) |
| Foreign Born, not a Citizen | 2,072 (96.2%) | 82 (3.8%) |
Health Insurance Coverage by Household Income in North Valley Stream
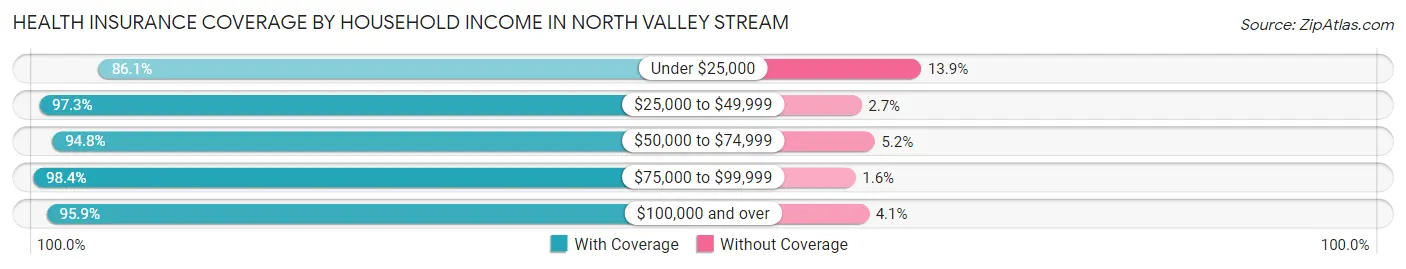
| Household Income | With Coverage | Without Coverage |
| Under $25,000 | 322 (86.1%) | 52 (13.9%) |
| $25,000 to $49,999 | 1,393 (97.3%) | 39 (2.7%) |
| $50,000 to $74,999 | 714 (94.8%) | 39 (5.2%) |
| $75,000 to $99,999 | 987 (98.4%) | 16 (1.6%) |
| $100,000 and over | 14,733 (95.9%) | 632 (4.1%) |
Public vs Private Health Insurance Coverage by Age in North Valley Stream
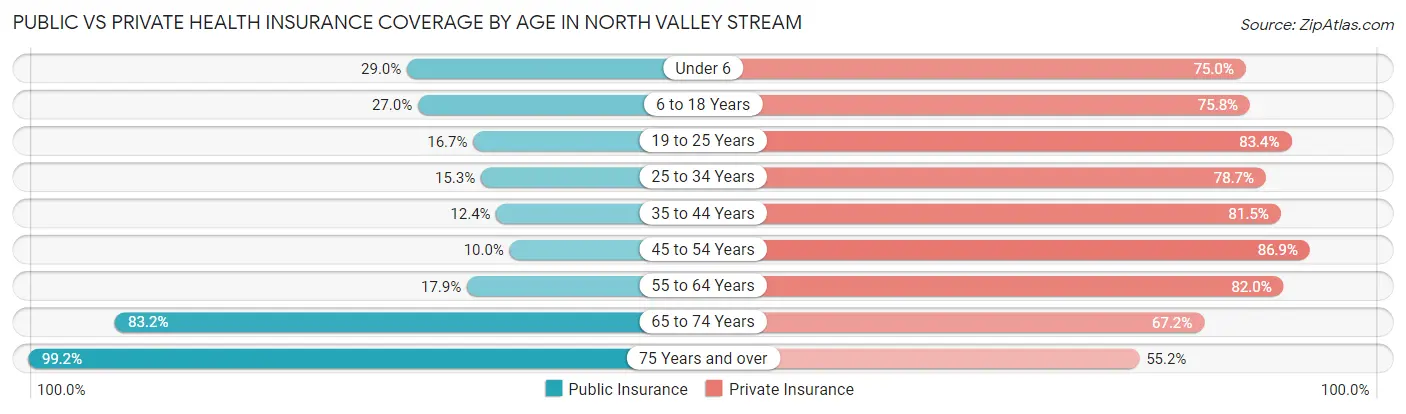
| Age Bracket | Public Insurance | Private Insurance |
| Under 6 | 263 (29.0%) | 680 (75.0%) |
| 6 to 18 Years | 779 (27.0%) | 2,187 (75.7%) |
| 19 to 25 Years | 360 (16.7%) | 1,797 (83.4%) |
| 25 to 34 Years | 330 (15.3%) | 1,701 (78.7%) |
| 35 to 44 Years | 252 (12.4%) | 1,651 (81.5%) |
| 45 to 54 Years | 260 (10.0%) | 2,268 (86.9%) |
| 55 to 64 Years | 519 (17.9%) | 2,380 (82.0%) |
| 65 to 74 Years | 1,699 (83.2%) | 1,373 (67.2%) |
| 75 Years and over | 1,260 (99.2%) | 701 (55.2%) |
| Total | 5,722 (30.2%) | 14,738 (77.7%) |
Disability Status by Sex by Age in North Valley Stream
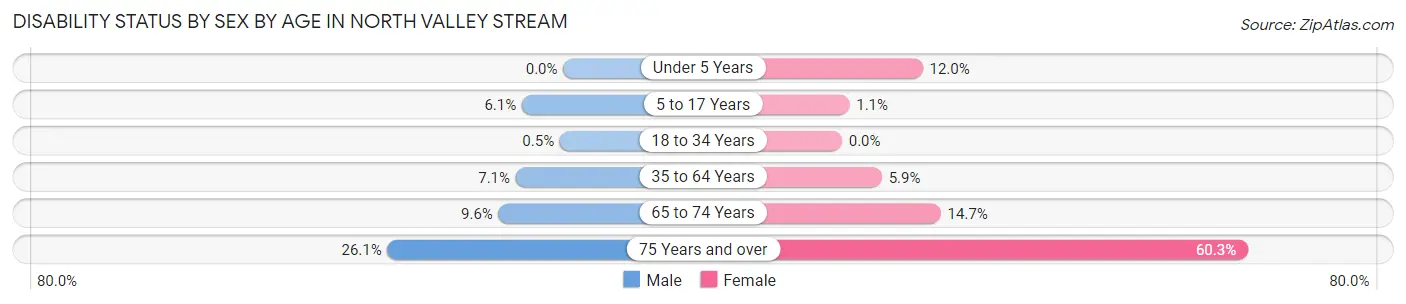
| Age Bracket | Male | Female |
| Under 5 Years | 0 (0.0%) | 44 (12.0%) |
| 5 to 17 Years | 96 (6.1%) | 13 (1.1%) |
| 18 to 34 Years | 12 (0.5%) | 0 (0.0%) |
| 35 to 64 Years | 257 (7.0%) | 231 (5.9%) |
| 65 to 74 Years | 94 (9.6%) | 156 (14.7%) |
| 75 Years and over | 77 (26.1%) | 588 (60.3%) |
Disability Class by Sex by Age in North Valley Stream
Disability Class: Hearing Difficulty
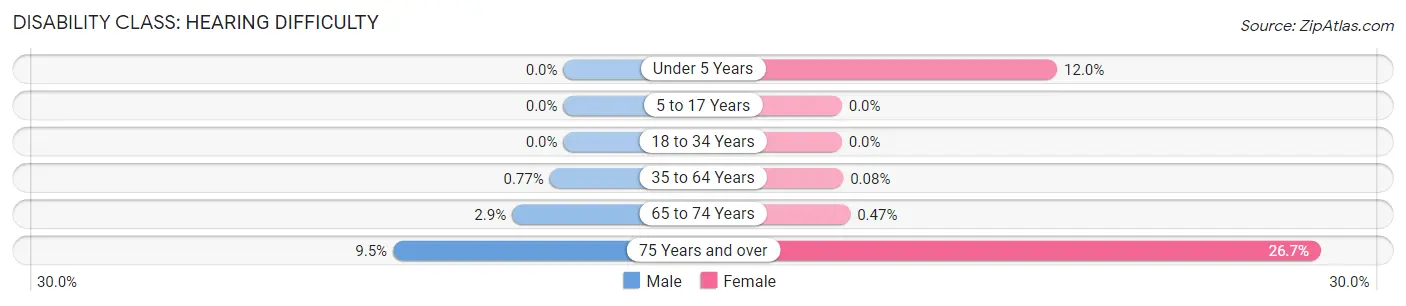
| Age Bracket | Male | Female |
| Under 5 Years | 0 (0.0%) | 44 (12.0%) |
| 5 to 17 Years | 0 (0.0%) | 0 (0.0%) |
| 18 to 34 Years | 0 (0.0%) | 0 (0.0%) |
| 35 to 64 Years | 28 (0.8%) | 3 (0.1%) |
| 65 to 74 Years | 28 (2.9%) | 5 (0.5%) |
| 75 Years and over | 28 (9.5%) | 260 (26.7%) |
Disability Class: Vision Difficulty
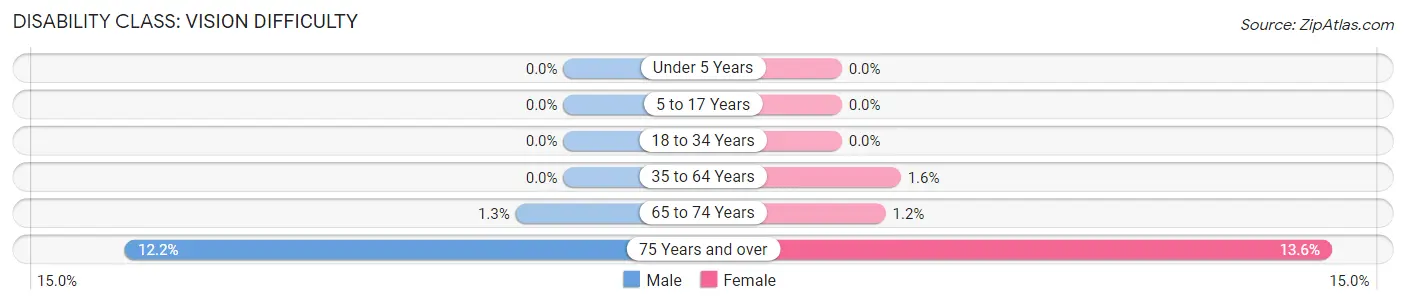
| Age Bracket | Male | Female |
| Under 5 Years | 0 (0.0%) | 0 (0.0%) |
| 5 to 17 Years | 0 (0.0%) | 0 (0.0%) |
| 18 to 34 Years | 0 (0.0%) | 0 (0.0%) |
| 35 to 64 Years | 0 (0.0%) | 64 (1.6%) |
| 65 to 74 Years | 13 (1.3%) | 13 (1.2%) |
| 75 Years and over | 36 (12.2%) | 133 (13.6%) |
Disability Class: Cognitive Difficulty
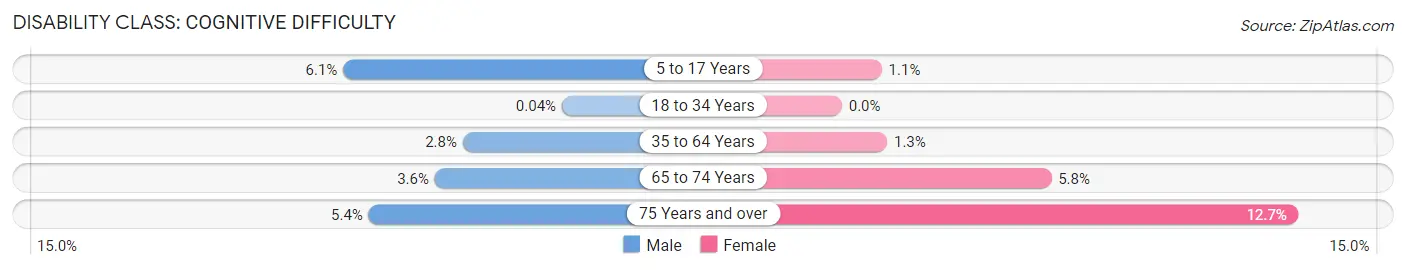
| Age Bracket | Male | Female |
| 5 to 17 Years | 96 (6.1%) | 13 (1.1%) |
| 18 to 34 Years | 1 (0.0%) | 0 (0.0%) |
| 35 to 64 Years | 102 (2.8%) | 49 (1.3%) |
| 65 to 74 Years | 35 (3.6%) | 62 (5.8%) |
| 75 Years and over | 16 (5.4%) | 124 (12.7%) |
Disability Class: Ambulatory Difficulty
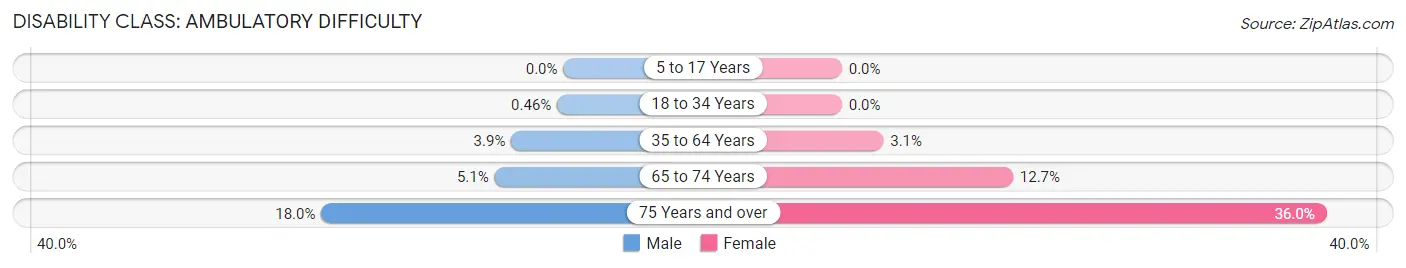
| Age Bracket | Male | Female |
| 5 to 17 Years | 0 (0.0%) | 0 (0.0%) |
| 18 to 34 Years | 11 (0.5%) | 0 (0.0%) |
| 35 to 64 Years | 141 (3.9%) | 120 (3.1%) |
| 65 to 74 Years | 50 (5.1%) | 135 (12.7%) |
| 75 Years and over | 53 (18.0%) | 351 (36.0%) |
Disability Class: Self-Care Difficulty
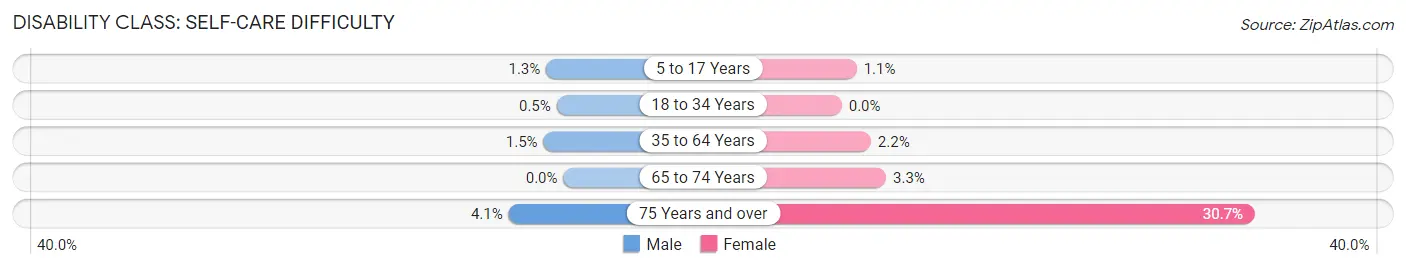
| Age Bracket | Male | Female |
| 5 to 17 Years | 20 (1.3%) | 13 (1.1%) |
| 18 to 34 Years | 12 (0.5%) | 0 (0.0%) |
| 35 to 64 Years | 54 (1.5%) | 84 (2.2%) |
| 65 to 74 Years | 0 (0.0%) | 35 (3.3%) |
| 75 Years and over | 12 (4.1%) | 299 (30.7%) |
Technology Access in North Valley Stream
Computing Device Access in North Valley Stream
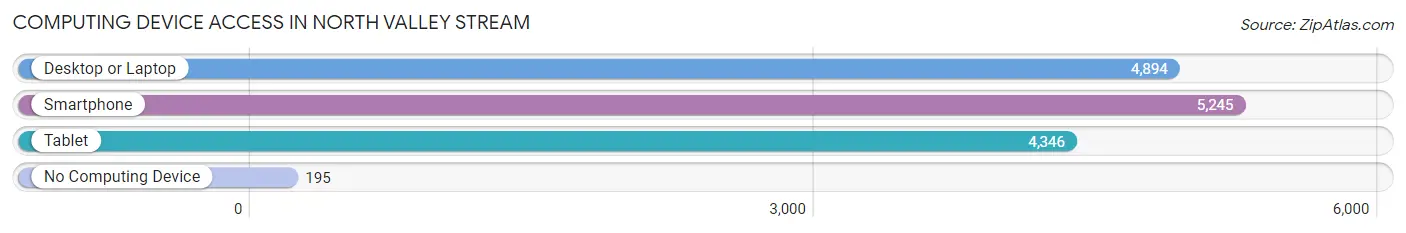
| Device Type | # Households | % Households |
| Desktop or Laptop | 4,894 | 87.6% |
| Smartphone | 5,245 | 93.9% |
| Tablet | 4,346 | 77.8% |
| No Computing Device | 195 | 3.5% |
| Total | 5,588 | 100.0% |
Internet Access in North Valley Stream
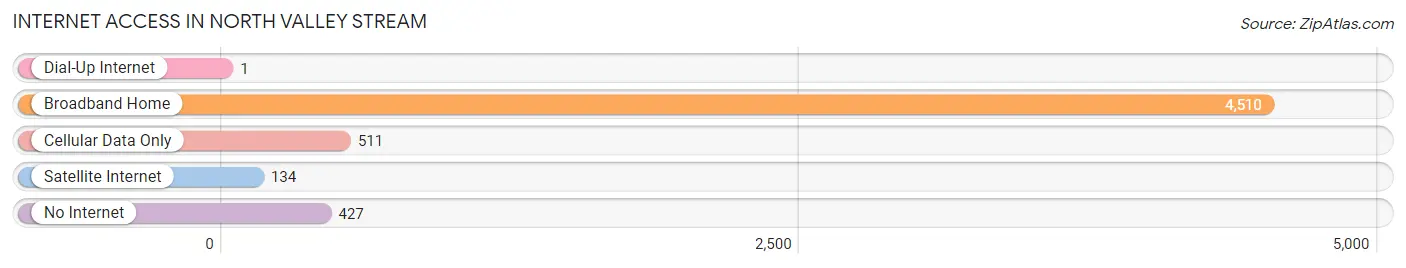
| Internet Type | # Households | % Households |
| Dial-Up Internet | 1 | 0.0% |
| Broadband Home | 4,510 | 80.7% |
| Cellular Data Only | 511 | 9.1% |
| Satellite Internet | 134 | 2.4% |
| No Internet | 427 | 7.6% |
| Total | 5,588 | 100.0% |
North Valley Stream Summary
Valley Stream is a village located in Nassau County, New York, United States. It is situated in the southwestern part of the county, within the Town of Hempstead. The population was 37,511 at the 2010 census.
History
Valley Stream was originally inhabited by the Rockaway Indians, a branch of the Lenape tribe. The first European settlers arrived in the area in 1640, and the area was known as “Fosters Meadow”. The area was renamed “Valley Stream” in 1837, after the stream that runs through the village.
The village was incorporated in 1925, and the first mayor was elected in 1926. The village has grown significantly since then, and is now home to a diverse population.
Geography
Valley Stream is located at 40°40'25" North, 73°41'17" West (40.673611, -73.688056). It is situated in the southwestern part of Nassau County, within the Town of Hempstead. The village is bordered by Elmont to the north, Franklin Square to the east, Lynbrook to the south, and Malverne to the west.
Valley Stream is located on the South Shore of Long Island, and is approximately 20 miles east of Manhattan. The village is served by the Long Island Rail Road, and is accessible via the Far Rockaway Branch.
Economy
Valley Stream is home to a variety of businesses, including retail stores, restaurants, and professional services. The village is also home to a number of corporate headquarters, including the headquarters of the National Hockey League.
The village is also home to a number of industrial parks, which provide employment opportunities for local residents. The largest of these is the Valley Stream Industrial Park, which is home to a variety of businesses, including manufacturing, warehousing, and distribution.
Demographics
As of the 2010 census, there were 37,511 people, 12,845 households, and 9,717 families residing in the village. The population density was 8,945.3 people per square mile (3,459.2/km2). There were 13,541 housing units at an average density of 3,213.3 per square mile (1,238.2/km2).
The racial makeup of the village was 57.2% White, 16.3% African American, 0.3% Native American, 8.2% Asian, 0.1% Pacific Islander, 14.2% from other races, and 3.9% from two or more races. Hispanic or Latino of any race were 28.2% of the population.
The median income for a household in the village was $68,945, and the median income for a family was $77,945. Males had a median income of $50,945 versus $41,945 for females. The per capita income for the village was $27,945. About 4.2% of families and 6.2% of the population were below the poverty line, including 8.2% of those under age 18 and 5.2% of those age 65 or over.
Valley Stream is a diverse community, with a variety of cultures and backgrounds represented. The village is home to a large number of immigrants, including those from the Caribbean, Latin America, and Asia.
Common Questions
What is Per Capita Income in North Valley Stream?
Per Capita income in North Valley Stream is $48,437.
What is the Median Family Income in North Valley Stream?
Median Family Income in North Valley Stream is $152,724.
What is the Median Household income in North Valley Stream?
Median Household Income in North Valley Stream is $147,569.
What is Income or Wage Gap in North Valley Stream?
Income or Wage Gap in North Valley Stream is 14.0%.
Women in North Valley Stream earn 86.0 cents for every dollar earned by a man.
What is Inequality or Gini Index in North Valley Stream?
Inequality or Gini Index in North Valley Stream is 0.38.
What is the Total Population of North Valley Stream?
Total Population of North Valley Stream is 19,016.
What is the Total Male Population of North Valley Stream?
Total Male Population of North Valley Stream is 9,353.
What is the Total Female Population of North Valley Stream?
Total Female Population of North Valley Stream is 9,663.
What is the Ratio of Males per 100 Females in North Valley Stream?
There are 96.79 Males per 100 Females in North Valley Stream.
What is the Ratio of Females per 100 Males in North Valley Stream?
There are 103.31 Females per 100 Males in North Valley Stream.
What is the Median Population Age in North Valley Stream?
Median Population Age in North Valley Stream is 42.3 Years.
What is the Average Family Size in North Valley Stream
Average Family Size in North Valley Stream is 3.8 People.
What is the Average Household Size in North Valley Stream
Average Household Size in North Valley Stream is 3.4 People.
How Large is the Labor Force in North Valley Stream?
There are 10,562 People in the Labor Forcein in North Valley Stream.
What is the Percentage of People in the Labor Force in North Valley Stream?
65.2% of People are in the Labor Force in North Valley Stream.
What is the Unemployment Rate in North Valley Stream?
Unemployment Rate in North Valley Stream is 5.4%.