Blasdell, NY Map & Demographics
Blasdell Map
Blasdell Overview
$33,062
PER CAPITA INCOME
$76,382
AVG FAMILY INCOME
$58,611
AVG HOUSEHOLD INCOME
17.1%
WAGE / INCOME GAP [ % ]
82.9¢/ $1
WAGE / INCOME GAP [ $ ]
0.40
INEQUALITY / GINI INDEX
2,551
TOTAL POPULATION
1,263
MALE POPULATION
1,288
FEMALE POPULATION
98.06
MALES / 100 FEMALES
101.98
FEMALES / 100 MALES
44.2
MEDIAN AGE
2.9
AVG FAMILY SIZE
2.1
AVG HOUSEHOLD SIZE
1,492
LABOR FORCE [ PEOPLE ]
70.5%
PERCENT IN LABOR FORCE
11.9%
UNEMPLOYMENT RATE
Blasdell Area Codes
Income in Blasdell
Income Overview in Blasdell
Per Capita Income in Blasdell is $33,062, while median incomes of families and households are $76,382 and $58,611 respectively.
| Characteristic | Number | Measure |
| Per Capita Income | 2,551 | $33,062 |
| Median Family Income | 619 | $76,382 |
| Mean Family Income | 619 | $80,046 |
| Median Household Income | 1,230 | $58,611 |
| Mean Household Income | 1,230 | $68,999 |
| Income Deficit | 619 | $0 |
| Wage / Income Gap (%) | 2,551 | 17.13% |
| Wage / Income Gap ($) | 2,551 | 82.87¢ per $1 |
| Gini / Inequality Index | 2,551 | 0.40 |
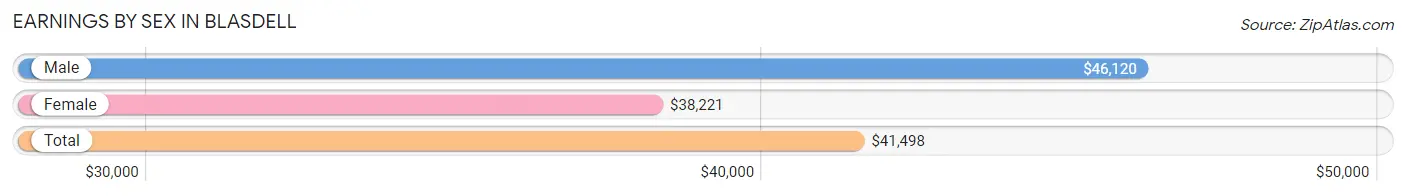
Earnings by Sex in Blasdell
Average Earnings in Blasdell are $41,498, $46,120 for men and $38,221 for women, a difference of 17.1%.
| Sex | Number | Average Earnings |
| Male | 779 (51.6%) | $46,120 |
| Female | 732 (48.4%) | $38,221 |
| Total | 1,511 (100.0%) | $41,498 |
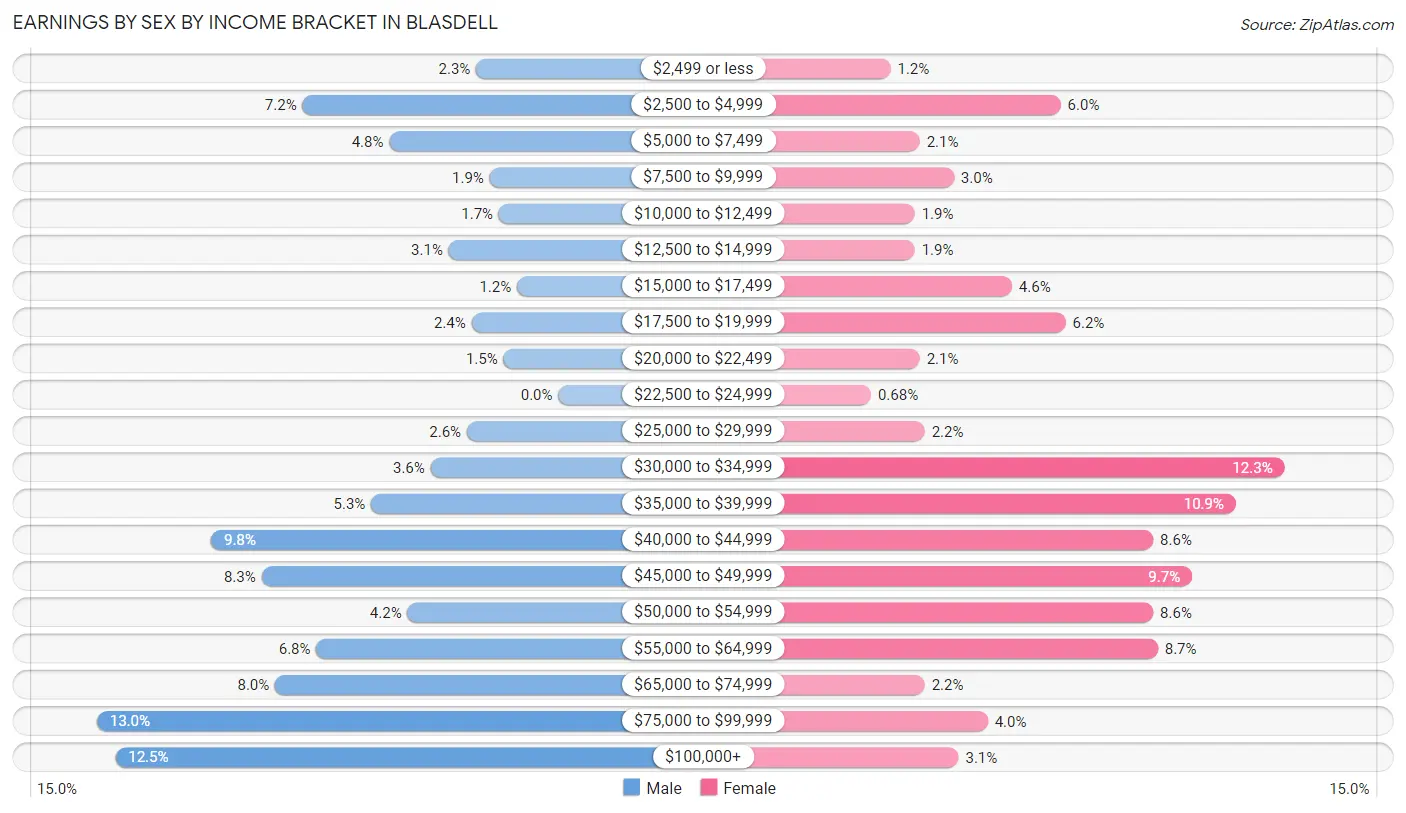
Earnings by Sex by Income Bracket in Blasdell
The most common earnings brackets in Blasdell are $75,000 to $99,999 for men (101 | 13.0%) and $30,000 to $34,999 for women (90 | 12.3%).
| Income | Male | Female |
| $2,499 or less | 18 (2.3%) | 9 (1.2%) |
| $2,500 to $4,999 | 56 (7.2%) | 44 (6.0%) |
| $5,000 to $7,499 | 37 (4.8%) | 15 (2.1%) |
| $7,500 to $9,999 | 15 (1.9%) | 22 (3.0%) |
| $10,000 to $12,499 | 13 (1.7%) | 14 (1.9%) |
| $12,500 to $14,999 | 24 (3.1%) | 14 (1.9%) |
| $15,000 to $17,499 | 9 (1.2%) | 34 (4.6%) |
| $17,500 to $19,999 | 19 (2.4%) | 45 (6.1%) |
| $20,000 to $22,499 | 12 (1.5%) | 15 (2.1%) |
| $22,500 to $24,999 | 0 (0.0%) | 5 (0.7%) |
| $25,000 to $29,999 | 20 (2.6%) | 16 (2.2%) |
| $30,000 to $34,999 | 28 (3.6%) | 90 (12.3%) |
| $35,000 to $39,999 | 41 (5.3%) | 80 (10.9%) |
| $40,000 to $44,999 | 76 (9.8%) | 63 (8.6%) |
| $45,000 to $49,999 | 65 (8.3%) | 71 (9.7%) |
| $50,000 to $54,999 | 33 (4.2%) | 63 (8.6%) |
| $55,000 to $64,999 | 53 (6.8%) | 64 (8.7%) |
| $65,000 to $74,999 | 62 (8.0%) | 16 (2.2%) |
| $75,000 to $99,999 | 101 (13.0%) | 29 (4.0%) |
| $100,000+ | 97 (12.4%) | 23 (3.1%) |
| Total | 779 (100.0%) | 732 (100.0%) |
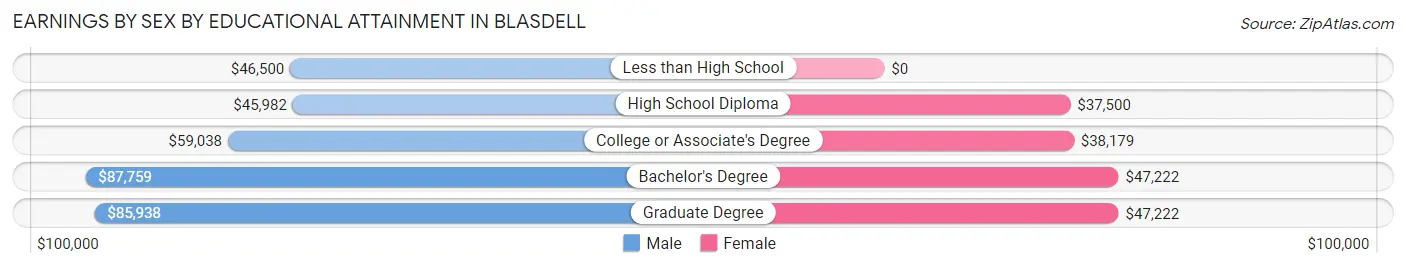
Earnings by Sex by Educational Attainment in Blasdell
Average earnings in Blasdell are $50,341 for men and $40,065 for women, a difference of 20.4%. Men with an educational attainment of bachelor's degree enjoy the highest average annual earnings of $87,759, while those with high school diploma education earn the least with $45,982. Women with an educational attainment of bachelor's degree earn the most with the average annual earnings of $47,222, while those with high school diploma education have the smallest earnings of $37,500.
| Educational Attainment | Male Income | Female Income |
| Less than High School | $46,500 | $0 |
| High School Diploma | $45,982 | $37,500 |
| College or Associate's Degree | $59,038 | $38,179 |
| Bachelor's Degree | $87,759 | $47,222 |
| Graduate Degree | $85,938 | $47,222 |
| Total | $50,341 | $40,065 |
Family Income in Blasdell
Family Income Brackets in Blasdell
According to the Blasdell family income data, there are 124 families falling into the $100,000 to $149,999 income range, which is the most common income bracket and makes up 20.0% of all families. Conversely, the $200,000+ income bracket is the least frequent group with only 5 families (0.8%) belonging to this category.
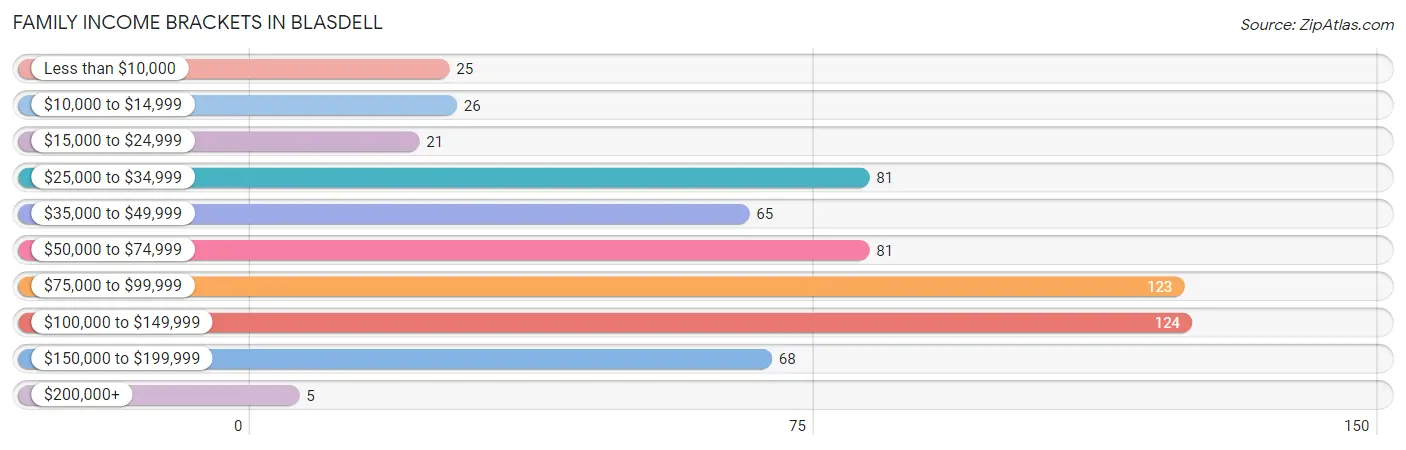
| Income Bracket | # Families | % Families |
| Less than $10,000 | 25 | 4.0% |
| $10,000 to $14,999 | 26 | 4.2% |
| $15,000 to $24,999 | 21 | 3.4% |
| $25,000 to $34,999 | 81 | 13.1% |
| $35,000 to $49,999 | 65 | 10.5% |
| $50,000 to $74,999 | 81 | 13.1% |
| $75,000 to $99,999 | 123 | 19.9% |
| $100,000 to $149,999 | 124 | 20.0% |
| $150,000 to $199,999 | 68 | 11.0% |
| $200,000+ | 5 | 0.8% |
Family Income by Famaliy Size in Blasdell
4-person families (99 | 16.0%) account for the highest median family income in Blasdell with $131,563 per family, while 4-person families (99 | 16.0%) have the highest median income of $32,891 per family member.
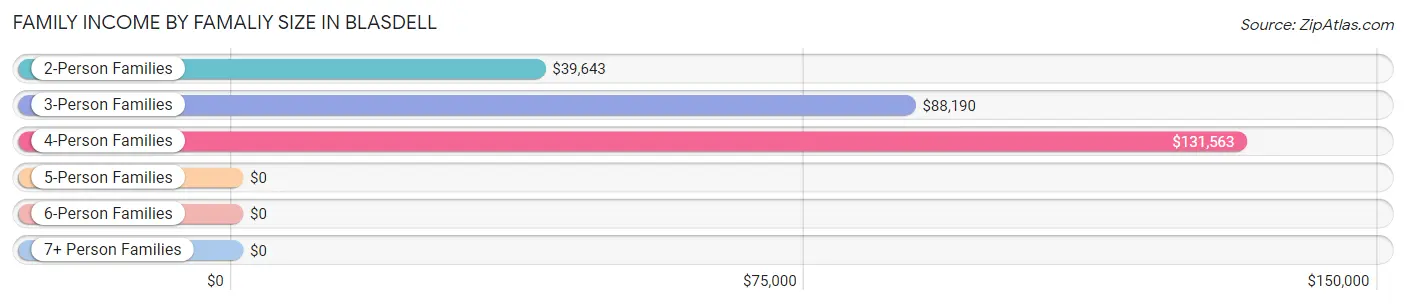
| Income Bracket | # Families | Median Income |
| 2-Person Families | 322 (52.0%) | $39,643 |
| 3-Person Families | 122 (19.7%) | $88,190 |
| 4-Person Families | 99 (16.0%) | $131,563 |
| 5-Person Families | 45 (7.3%) | $0 |
| 6-Person Families | 12 (1.9%) | $0 |
| 7+ Person Families | 19 (3.1%) | $0 |
| Total | 619 (100.0%) | $76,382 |
Family Income by Number of Earners in Blasdell
The median family income in Blasdell is $76,382, with families comprising 3+ earners (136) having the highest median family income of $136,250, while families with no earners (100) have the lowest median family income of $32,955, accounting for 22.0% and 16.2% of families, respectively.
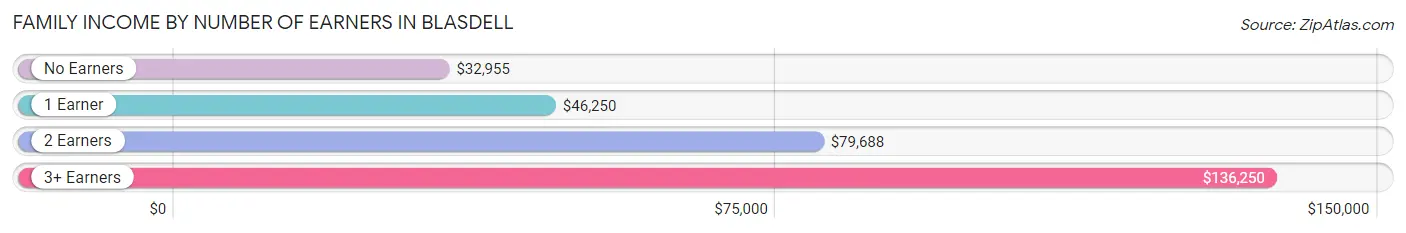
| Number of Earners | # Families | Median Income |
| No Earners | 100 (16.2%) | $32,955 |
| 1 Earner | 188 (30.4%) | $46,250 |
| 2 Earners | 195 (31.5%) | $79,688 |
| 3+ Earners | 136 (22.0%) | $136,250 |
| Total | 619 (100.0%) | $76,382 |
Household Income in Blasdell
Household Income Brackets in Blasdell
With 255 households falling in the category, the $100,000 to $149,999 income range is the most frequent in Blasdell, accounting for 20.7% of all households. In contrast, only 12 households (1.0%) fall into the $200,000+ income bracket, making it the least populous group.
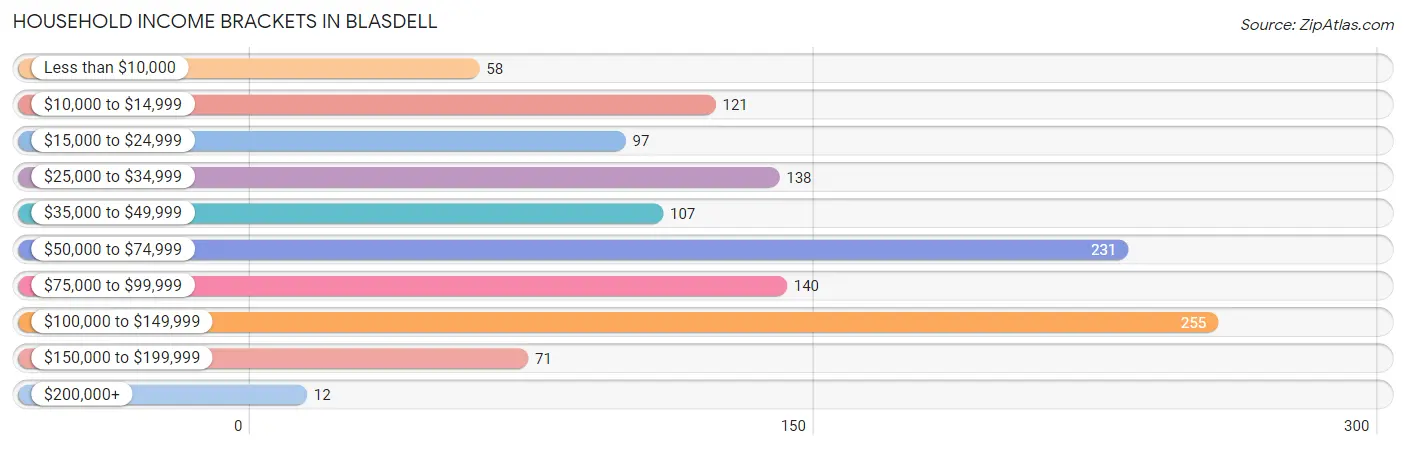
| Income Bracket | # Households | % Households |
| Less than $10,000 | 58 | 4.7% |
| $10,000 to $14,999 | 121 | 9.8% |
| $15,000 to $24,999 | 97 | 7.9% |
| $25,000 to $34,999 | 138 | 11.2% |
| $35,000 to $49,999 | 107 | 8.7% |
| $50,000 to $74,999 | 231 | 18.8% |
| $75,000 to $99,999 | 140 | 11.4% |
| $100,000 to $149,999 | 255 | 20.7% |
| $150,000 to $199,999 | 71 | 5.8% |
| $200,000+ | 12 | 1.0% |
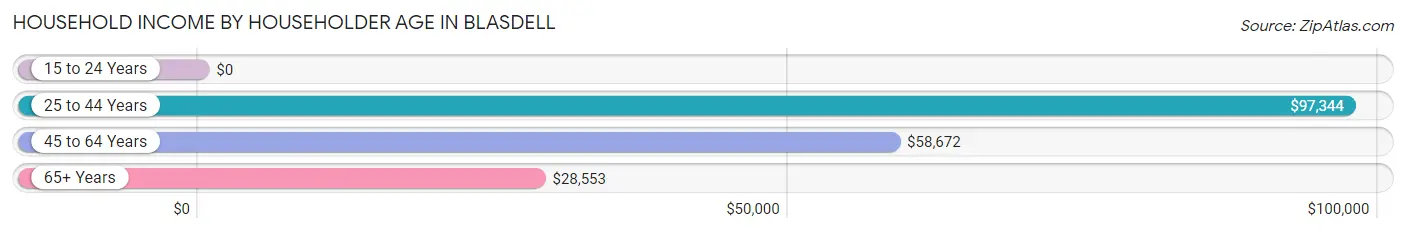
Household Income by Householder Age in Blasdell
The median household income in Blasdell is $58,611, with the highest median household income of $97,344 found in the 25 to 44 years age bracket for the primary householder. A total of 387 households (31.5%) fall into this category. Meanwhile, the 15 to 24 years age bracket for the primary householder has the lowest median household income of $0, with 10 households (0.8%) in this group.
| Income Bracket | # Households | Median Income |
| 15 to 24 Years | 10 (0.8%) | $0 |
| 25 to 44 Years | 387 (31.5%) | $97,344 |
| 45 to 64 Years | 483 (39.3%) | $58,672 |
| 65+ Years | 350 (28.5%) | $28,553 |
| Total | 1,230 (100.0%) | $58,611 |
Poverty in Blasdell
Income Below Poverty by Sex and Age in Blasdell
With 14.7% poverty level for males and 15.4% for females among the residents of Blasdell, 15 year old males and 65 to 74 year old females are the most vulnerable to poverty, with 23 males (79.3%) and 47 females (29.7%) in their respective age groups living below the poverty level.
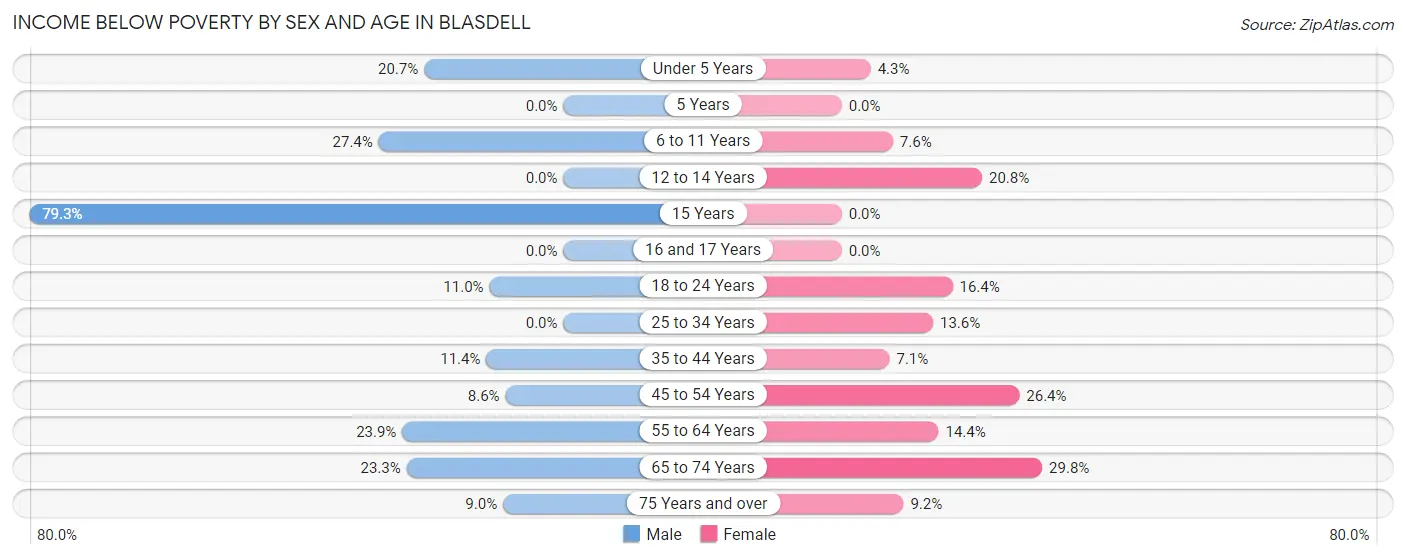
| Age Bracket | Male | Female |
| Under 5 Years | 12 (20.7%) | 4 (4.3%) |
| 5 Years | 0 (0.0%) | 0 (0.0%) |
| 6 to 11 Years | 31 (27.4%) | 6 (7.6%) |
| 12 to 14 Years | 0 (0.0%) | 10 (20.8%) |
| 15 Years | 23 (79.3%) | 0 (0.0%) |
| 16 and 17 Years | 0 (0.0%) | 0 (0.0%) |
| 18 to 24 Years | 9 (11.0%) | 12 (16.4%) |
| 25 to 34 Years | 0 (0.0%) | 21 (13.6%) |
| 35 to 44 Years | 23 (11.4%) | 9 (7.1%) |
| 45 to 54 Years | 16 (8.6%) | 53 (26.4%) |
| 55 to 64 Years | 39 (23.9%) | 25 (14.4%) |
| 65 to 74 Years | 27 (23.3%) | 47 (29.7%) |
| 75 Years and over | 6 (9.0%) | 12 (9.2%) |
| Total | 186 (14.7%) | 199 (15.4%) |
Income Above Poverty by Sex and Age in Blasdell
According to the poverty statistics in Blasdell, males aged 12 to 14 years and females aged 16 and 17 years are the age groups that are most secure financially, with 100.0% of males and 100.0% of females in these age groups living above the poverty line.
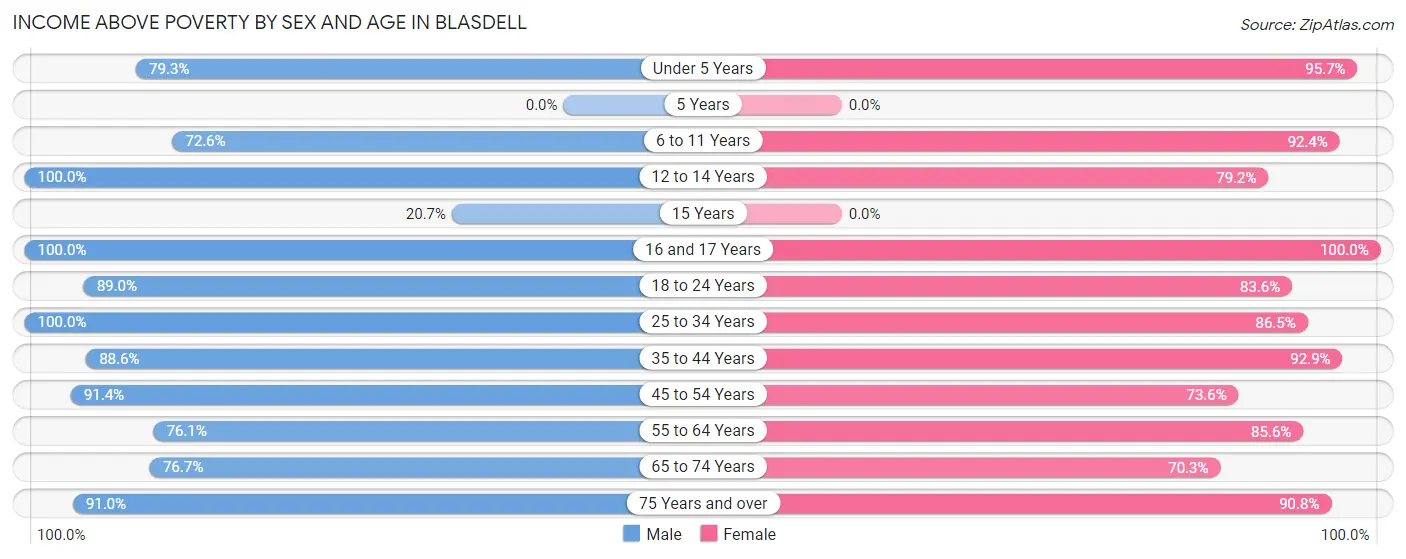
| Age Bracket | Male | Female |
| Under 5 Years | 46 (79.3%) | 89 (95.7%) |
| 5 Years | 0 (0.0%) | 0 (0.0%) |
| 6 to 11 Years | 82 (72.6%) | 73 (92.4%) |
| 12 to 14 Years | 15 (100.0%) | 38 (79.2%) |
| 15 Years | 6 (20.7%) | 0 (0.0%) |
| 16 and 17 Years | 18 (100.0%) | 49 (100.0%) |
| 18 to 24 Years | 73 (89.0%) | 61 (83.6%) |
| 25 to 34 Years | 215 (100.0%) | 134 (86.5%) |
| 35 to 44 Years | 178 (88.6%) | 118 (92.9%) |
| 45 to 54 Years | 170 (91.4%) | 148 (73.6%) |
| 55 to 64 Years | 124 (76.1%) | 149 (85.6%) |
| 65 to 74 Years | 89 (76.7%) | 111 (70.3%) |
| 75 Years and over | 61 (91.0%) | 119 (90.8%) |
| Total | 1,077 (85.3%) | 1,089 (84.6%) |
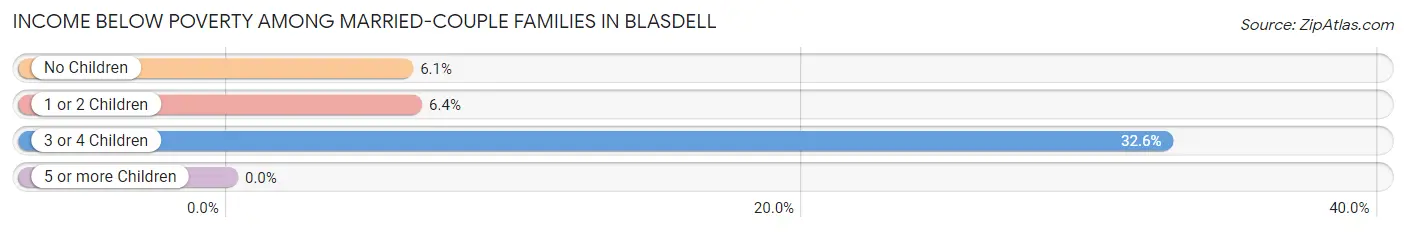
Income Below Poverty Among Married-Couple Families in Blasdell
The poverty statistics for married-couple families in Blasdell show that 8.5% or 37 of the total 435 families live below the poverty line. Families with 3 or 4 children have the highest poverty rate of 32.6%, comprising of 14 families. On the other hand, families with 5 or more children have the lowest poverty rate of 0.0%, which includes 0 families.
| Children | Above Poverty | Below Poverty |
| No Children | 277 (93.9%) | 18 (6.1%) |
| 1 or 2 Children | 73 (93.6%) | 5 (6.4%) |
| 3 or 4 Children | 29 (67.4%) | 14 (32.6%) |
| 5 or more Children | 19 (100.0%) | 0 (0.0%) |
| Total | 398 (91.5%) | 37 (8.5%) |
Income Below Poverty Among Single-Parent Households in Blasdell
According to the poverty data in Blasdell, 2.1% or 2 single-father households and 35.2% or 32 single-mother households are living below the poverty line. Among single-father households, those with 1 or 2 children have the highest poverty rate, with 2 households (2.9%) experiencing poverty. Likewise, among single-mother households, those with 1 or 2 children have the highest poverty rate, with 26 households (42.6%) falling below the poverty line.
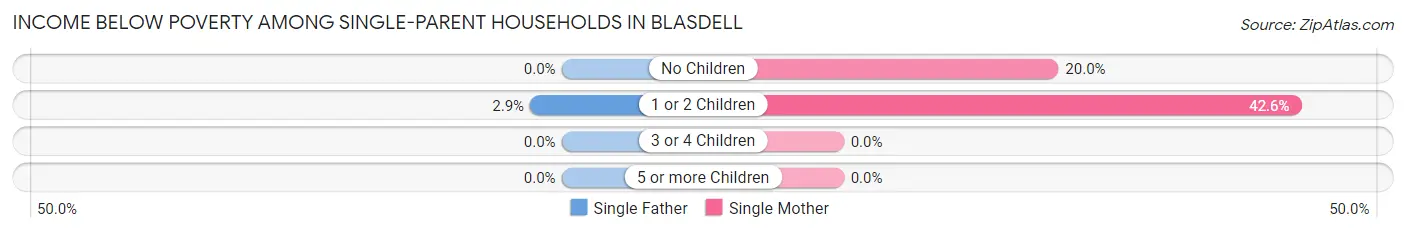
| Children | Single Father | Single Mother |
| No Children | 0 (0.0%) | 6 (20.0%) |
| 1 or 2 Children | 2 (2.9%) | 26 (42.6%) |
| 3 or 4 Children | 0 (0.0%) | 0 (0.0%) |
| 5 or more Children | 0 (0.0%) | 0 (0.0%) |
| Total | 2 (2.1%) | 32 (35.2%) |
Income Below Poverty Among Married-Couple vs Single-Parent Households in Blasdell
The poverty data for Blasdell shows that 37 of the married-couple family households (8.5%) and 34 of the single-parent households (18.5%) are living below the poverty level. Within the married-couple family households, those with 3 or 4 children have the highest poverty rate, with 14 households (32.6%) falling below the poverty line. Among the single-parent households, those with 1 or 2 children have the highest poverty rate, with 28 household (21.7%) living below poverty.
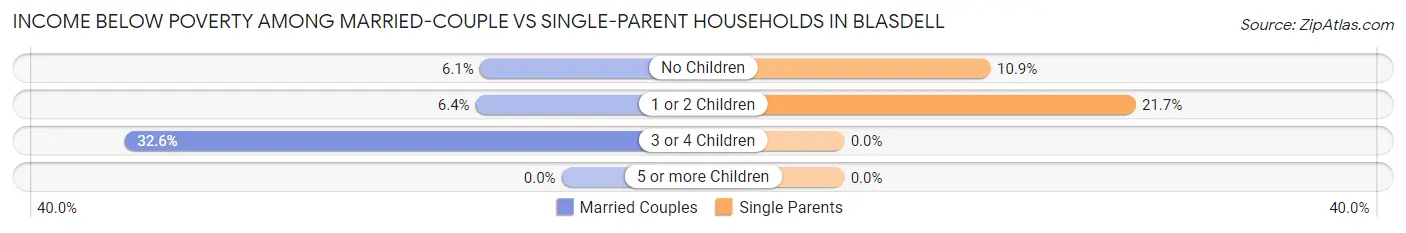
| Children | Married-Couple Families | Single-Parent Households |
| No Children | 18 (6.1%) | 6 (10.9%) |
| 1 or 2 Children | 5 (6.4%) | 28 (21.7%) |
| 3 or 4 Children | 14 (32.6%) | 0 (0.0%) |
| 5 or more Children | 0 (0.0%) | 0 (0.0%) |
| Total | 37 (8.5%) | 34 (18.5%) |
Race in Blasdell
The most populous races in Blasdell are White / Caucasian (2,410 | 94.5%), Hispanic or Latino (85 | 3.3%), and Two or more Races (57 | 2.2%).
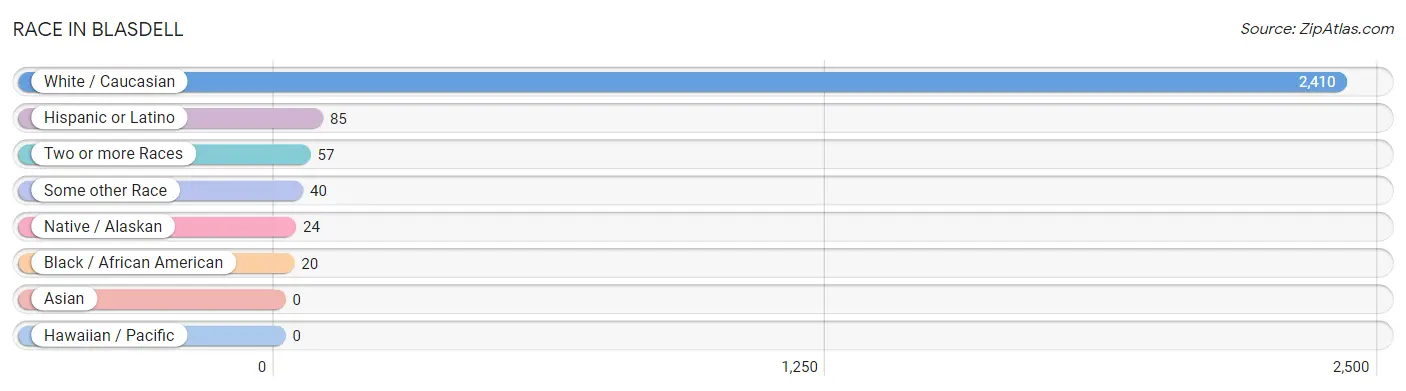
| Race | # Population | % Population |
| Asian | 0 | 0.0% |
| Black / African American | 20 | 0.8% |
| Hawaiian / Pacific | 0 | 0.0% |
| Hispanic or Latino | 85 | 3.3% |
| Native / Alaskan | 24 | 0.9% |
| White / Caucasian | 2,410 | 94.5% |
| Two or more Races | 57 | 2.2% |
| Some other Race | 40 | 1.6% |
| Total | 2,551 | 100.0% |
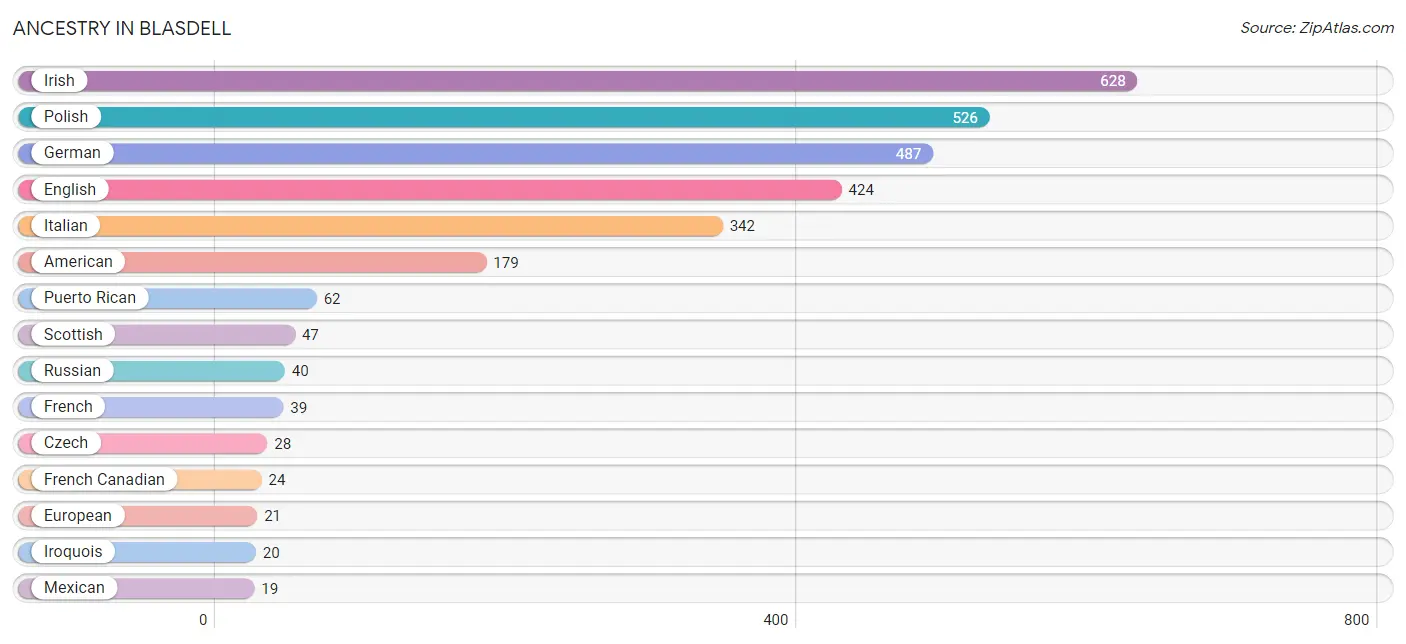
Ancestry in Blasdell
The most populous ancestries reported in Blasdell are Irish (628 | 24.6%), Polish (526 | 20.6%), German (487 | 19.1%), English (424 | 16.6%), and Italian (342 | 13.4%), together accounting for 94.4% of all Blasdell residents.
| Ancestry | # Population | % Population |
| African | 7 | 0.3% |
| American | 179 | 7.0% |
| Arab | 15 | 0.6% |
| Czech | 28 | 1.1% |
| Dutch | 4 | 0.2% |
| English | 424 | 16.6% |
| European | 21 | 0.8% |
| French | 39 | 1.5% |
| French Canadian | 24 | 0.9% |
| German | 487 | 19.1% |
| Greek | 4 | 0.2% |
| Hungarian | 14 | 0.5% |
| Irish | 628 | 24.6% |
| Iroquois | 20 | 0.8% |
| Italian | 342 | 13.4% |
| Lebanese | 15 | 0.6% |
| Mexican | 19 | 0.7% |
| Norwegian | 9 | 0.4% |
| Polish | 526 | 20.6% |
| Puerto Rican | 62 | 2.4% |
| Russian | 40 | 1.6% |
| Scotch-Irish | 16 | 0.6% |
| Scottish | 47 | 1.8% |
| Subsaharan African | 7 | 0.3% |
| Swedish | 5 | 0.2% |
| Ukrainian | 4 | 0.2% |
| West Indian | 7 | 0.3% | View All 27 Rows |
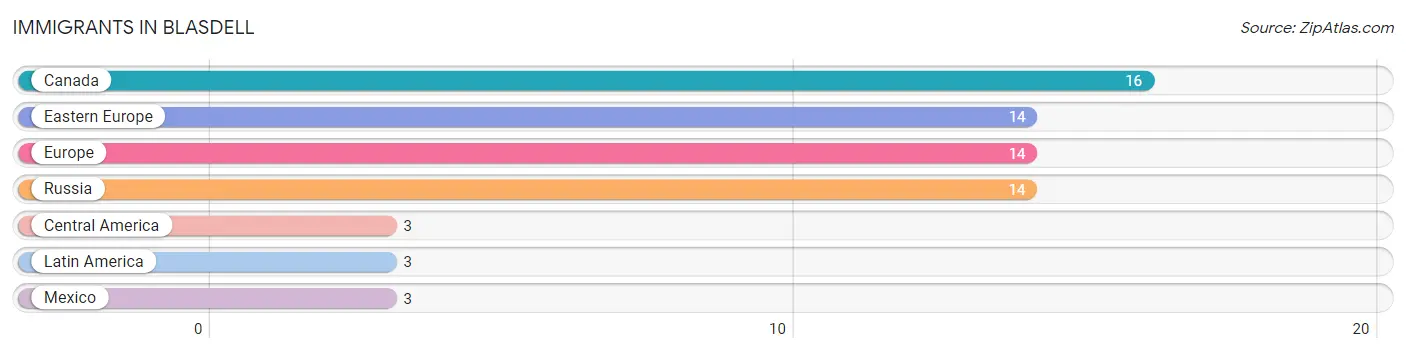
Immigrants in Blasdell
The most numerous immigrant groups reported in Blasdell came from Canada (16 | 0.6%), Eastern Europe (14 | 0.5%), Europe (14 | 0.5%), Russia (14 | 0.5%), and Central America (3 | 0.1%), together accounting for 2.4% of all Blasdell residents.
| Immigration Origin | # Population | % Population |
| Canada | 16 | 0.6% |
| Central America | 3 | 0.1% |
| Eastern Europe | 14 | 0.5% |
| Europe | 14 | 0.5% |
| Latin America | 3 | 0.1% |
| Mexico | 3 | 0.1% |
| Russia | 14 | 0.5% | View All 7 Rows |
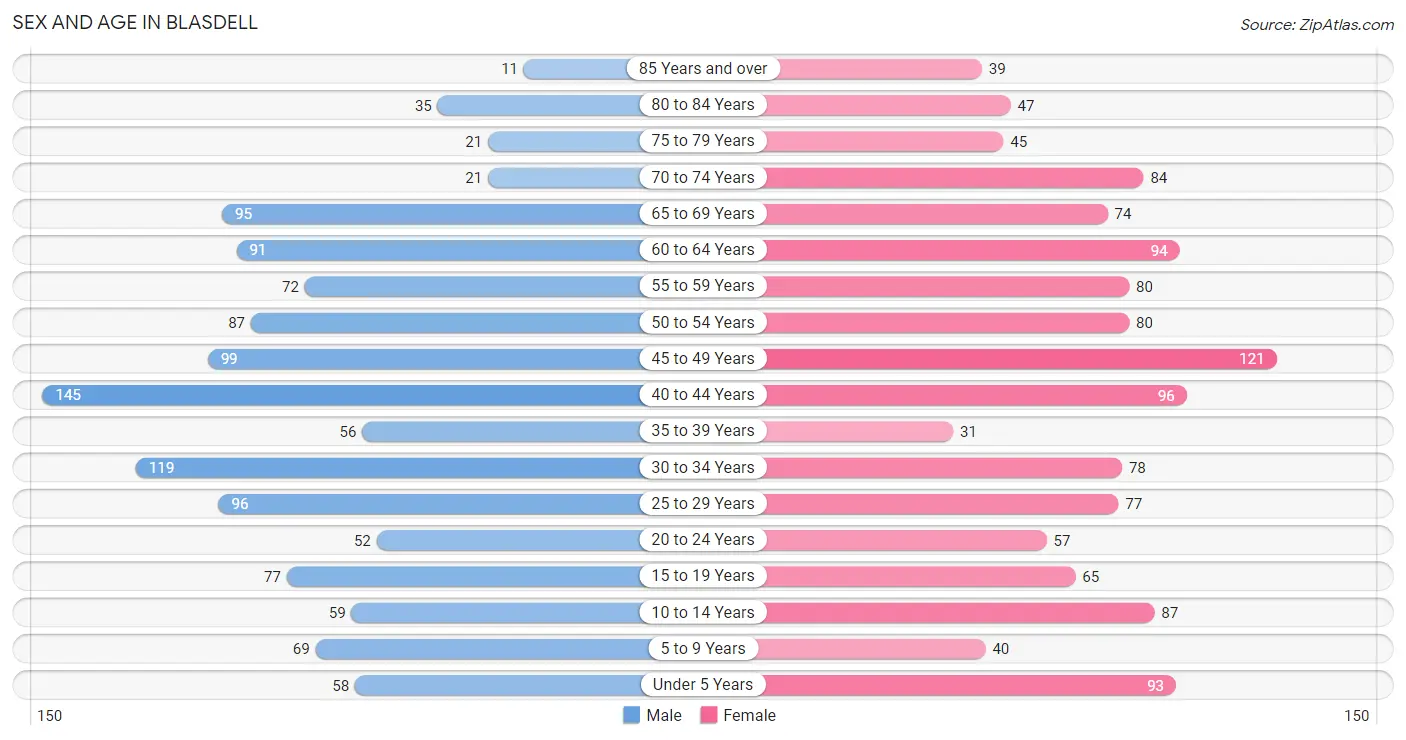
Sex and Age in Blasdell
Sex and Age in Blasdell
The most populous age groups in Blasdell are 40 to 44 Years (145 | 11.5%) for men and 45 to 49 Years (121 | 9.4%) for women.
| Age Bracket | Male | Female |
| Under 5 Years | 58 (4.6%) | 93 (7.2%) |
| 5 to 9 Years | 69 (5.5%) | 40 (3.1%) |
| 10 to 14 Years | 59 (4.7%) | 87 (6.8%) |
| 15 to 19 Years | 77 (6.1%) | 65 (5.1%) |
| 20 to 24 Years | 52 (4.1%) | 57 (4.4%) |
| 25 to 29 Years | 96 (7.6%) | 77 (6.0%) |
| 30 to 34 Years | 119 (9.4%) | 78 (6.1%) |
| 35 to 39 Years | 56 (4.4%) | 31 (2.4%) |
| 40 to 44 Years | 145 (11.5%) | 96 (7.4%) |
| 45 to 49 Years | 99 (7.8%) | 121 (9.4%) |
| 50 to 54 Years | 87 (6.9%) | 80 (6.2%) |
| 55 to 59 Years | 72 (5.7%) | 80 (6.2%) |
| 60 to 64 Years | 91 (7.2%) | 94 (7.3%) |
| 65 to 69 Years | 95 (7.5%) | 74 (5.8%) |
| 70 to 74 Years | 21 (1.7%) | 84 (6.5%) |
| 75 to 79 Years | 21 (1.7%) | 45 (3.5%) |
| 80 to 84 Years | 35 (2.8%) | 47 (3.6%) |
| 85 Years and over | 11 (0.9%) | 39 (3.0%) |
| Total | 1,263 (100.0%) | 1,288 (100.0%) |
Families and Households in Blasdell
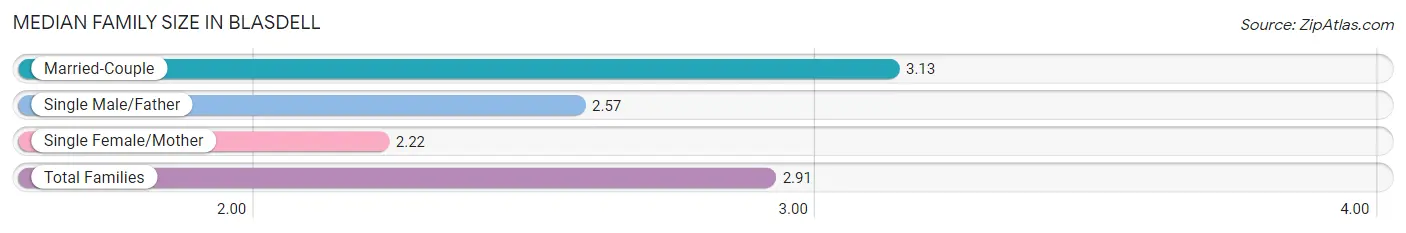
Median Family Size in Blasdell
The median family size in Blasdell is 2.91 persons per family, with married-couple families (435 | 70.3%) accounting for the largest median family size of 3.13 persons per family. On the other hand, single female/mother families (91 | 14.7%) represent the smallest median family size with 2.22 persons per family.
| Family Type | # Families | Family Size |
| Married-Couple | 435 (70.3%) | 3.13 |
| Single Male/Father | 93 (15.0%) | 2.57 |
| Single Female/Mother | 91 (14.7%) | 2.22 |
| Total Families | 619 (100.0%) | 2.91 |
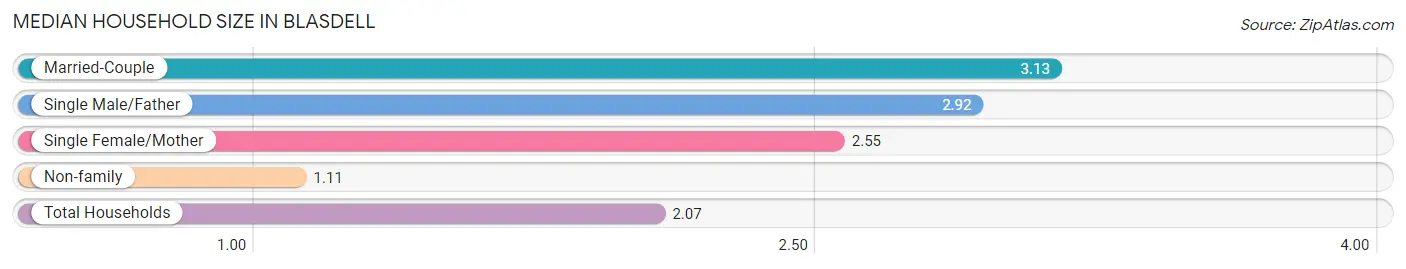
Median Household Size in Blasdell
The median household size in Blasdell is 2.07 persons per household, with married-couple households (435 | 35.4%) accounting for the largest median household size of 3.13 persons per household. non-family households (611 | 49.7%) represent the smallest median household size with 1.11 persons per household.
| Household Type | # Households | Household Size |
| Married-Couple | 435 (35.4%) | 3.13 |
| Single Male/Father | 93 (7.6%) | 2.92 |
| Single Female/Mother | 91 (7.4%) | 2.55 |
| Non-family | 611 (49.7%) | 1.11 |
| Total Households | 1,230 (100.0%) | 2.07 |
Household Size by Marriage Status in Blasdell
Out of a total of 1,230 households in Blasdell, 619 (50.3%) are family households, while 611 (49.7%) are nonfamily households. The most numerous type of family households are 2-person households, comprising 295, and the most common type of nonfamily households are 1-person households, comprising 562.
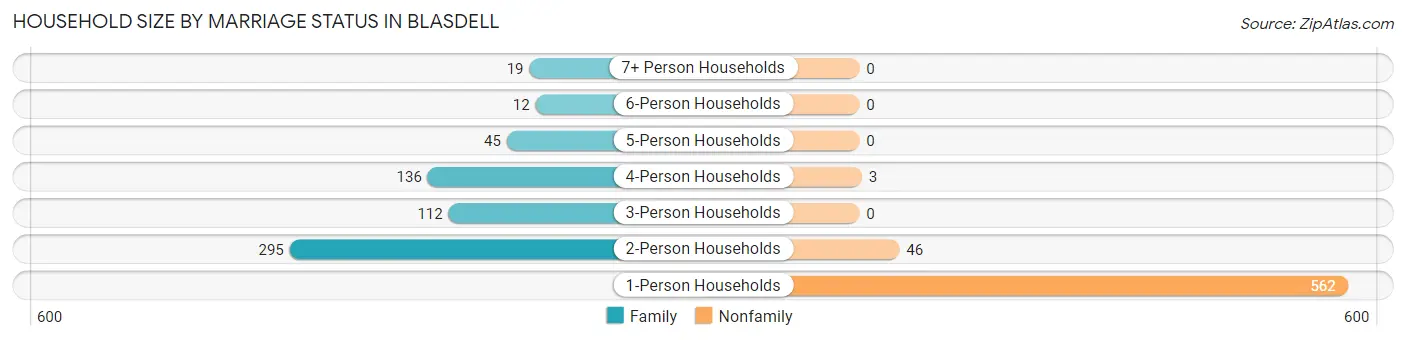
| Household Size | Family Households | Nonfamily Households |
| 1-Person Households | - | 562 (45.7%) |
| 2-Person Households | 295 (24.0%) | 46 (3.7%) |
| 3-Person Households | 112 (9.1%) | 0 (0.0%) |
| 4-Person Households | 136 (11.1%) | 3 (0.2%) |
| 5-Person Households | 45 (3.7%) | 0 (0.0%) |
| 6-Person Households | 12 (1.0%) | 0 (0.0%) |
| 7+ Person Households | 19 (1.5%) | 0 (0.0%) |
| Total | 619 (50.3%) | 611 (49.7%) |
Female Fertility in Blasdell
Fertility by Age in Blasdell
Average fertility rate in Blasdell is 8.0 births per 1,000 women. Women in the age bracket of 20 to 34 years have the highest fertility rate with 19.0 births per 1,000 women. Women in the age bracket of 20 to 34 years acount for 100.0% of all women with births.
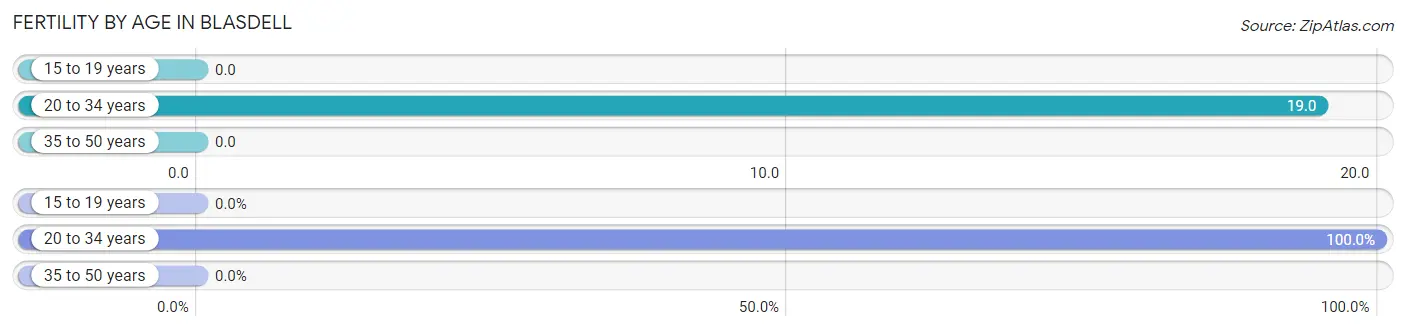
| Age Bracket | Women with Births | Births / 1,000 Women |
| 15 to 19 years | 0 (0.0%) | 0.0 |
| 20 to 34 years | 4 (100.0%) | 19.0 |
| 35 to 50 years | 0 (0.0%) | 0.0 |
| Total | 4 (100.0%) | 8.0 |
Fertility by Age by Marriage Status in Blasdell
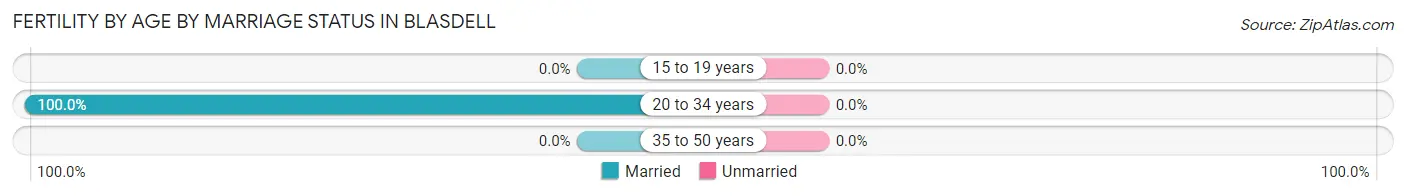
| Age Bracket | Married | Unmarried |
| 15 to 19 years | 0 (0.0%) | 0 (0.0%) |
| 20 to 34 years | 4 (100.0%) | 0 (0.0%) |
| 35 to 50 years | 0 (0.0%) | 0 (0.0%) |
| Total | 4 (100.0%) | 0 (0.0%) |
Fertility by Education in Blasdell
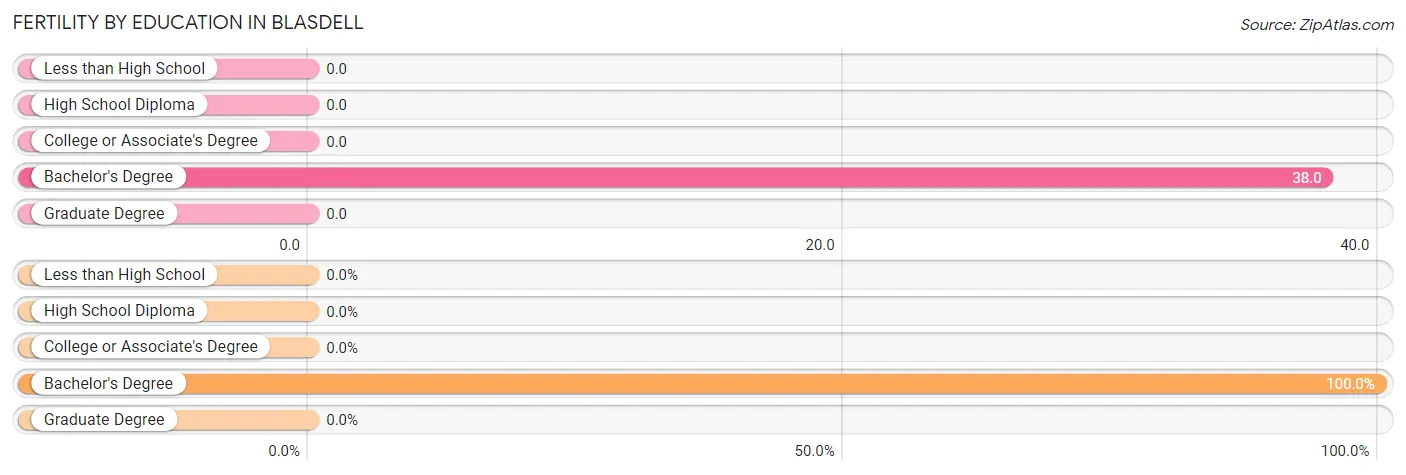
| Educational Attainment | Women with Births | Births / 1,000 Women |
| Less than High School | 0 (0.0%) | 0.0 |
| High School Diploma | 0 (0.0%) | 0.0 |
| College or Associate's Degree | 0 (0.0%) | 0.0 |
| Bachelor's Degree | 4 (100.0%) | 38.0 |
| Graduate Degree | 0 (0.0%) | 0.0 |
| Total | 4 (100.0%) | 8.0 |
Fertility by Education by Marriage Status in Blasdell
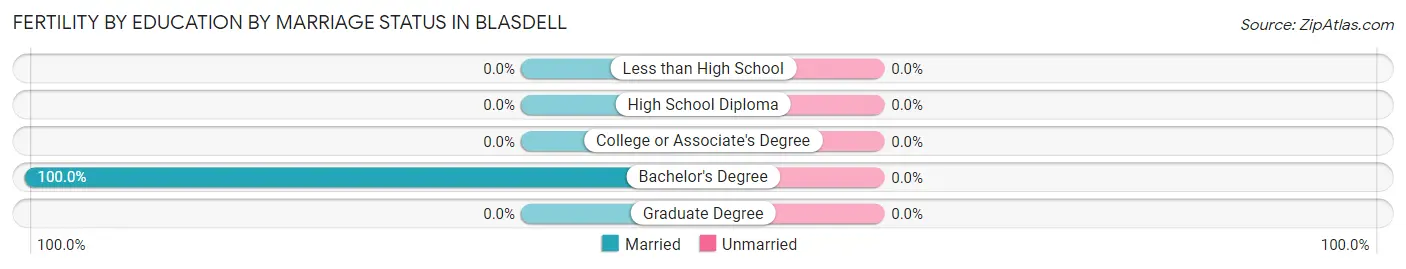
| Educational Attainment | Married | Unmarried |
| Less than High School | 0 (0.0%) | 0 (0.0%) |
| High School Diploma | 0 (0.0%) | 0 (0.0%) |
| College or Associate's Degree | 0 (0.0%) | 0 (0.0%) |
| Bachelor's Degree | 4 (100.0%) | 0 (0.0%) |
| Graduate Degree | 0 (0.0%) | 0 (0.0%) |
| Total | 4 (100.0%) | 0 (0.0%) |
Employment Characteristics in Blasdell
Employment by Class of Employer in Blasdell
Among the 1,283 employed individuals in Blasdell, private company employees (933 | 72.7%), not-for-profit organizations (131 | 10.2%), and local government employees (104 | 8.1%) make up the most common classes of employment.
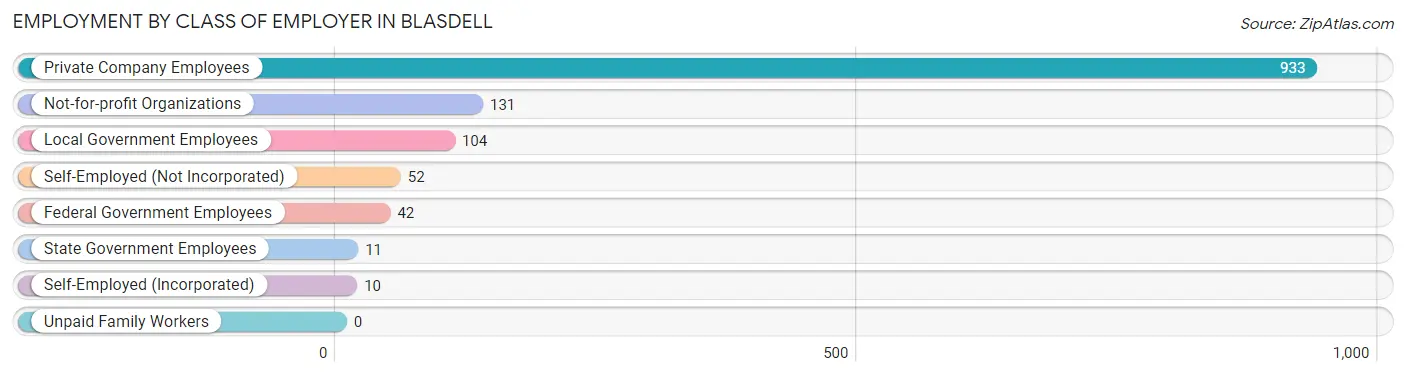
| Employer Class | # Employees | % Employees |
| Private Company Employees | 933 | 72.7% |
| Self-Employed (Incorporated) | 10 | 0.8% |
| Self-Employed (Not Incorporated) | 52 | 4.1% |
| Not-for-profit Organizations | 131 | 10.2% |
| Local Government Employees | 104 | 8.1% |
| State Government Employees | 11 | 0.9% |
| Federal Government Employees | 42 | 3.3% |
| Unpaid Family Workers | 0 | 0.0% |
| Total | 1,283 | 100.0% |
Employment Status by Age in Blasdell
According to the labor force statistics for Blasdell, out of the total population over 16 years of age (2,116), 70.5% or 1,492 individuals are in the labor force, with 11.9% or 178 of them unemployed. The age group with the highest labor force participation rate is 30 to 34 years, with 100.0% or 197 individuals in the labor force. Within the labor force, the 20 to 24 years age range has the highest percentage of unemployed individuals, with 30.6% or 30 of them being unemployed.
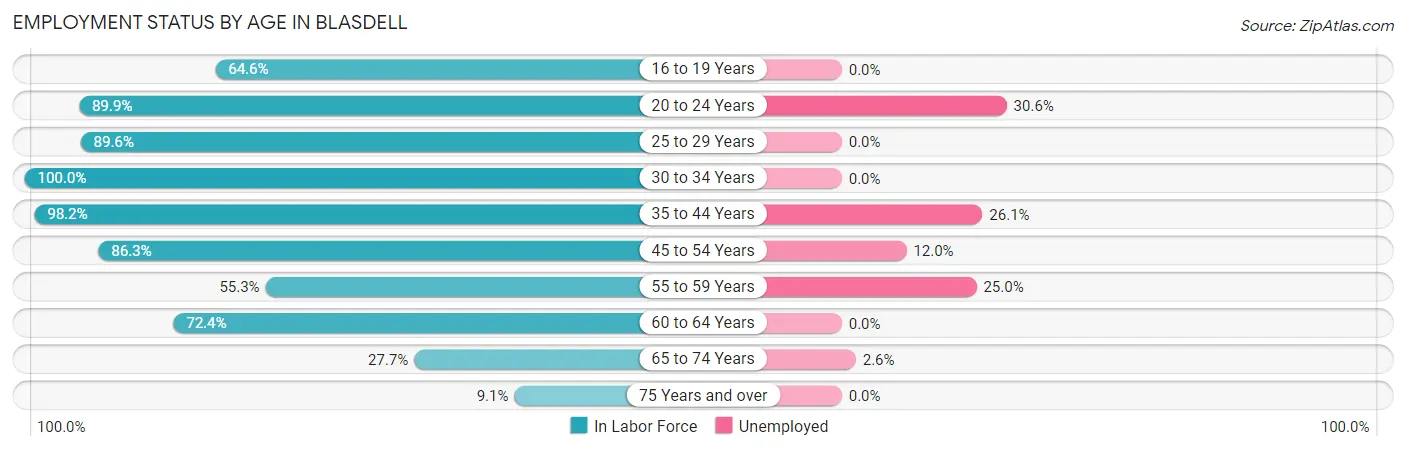
| Age Bracket | In Labor Force | Unemployed |
| 16 to 19 Years | 73 (64.6%) | 0 (0.0%) |
| 20 to 24 Years | 98 (89.9%) | 30 (30.6%) |
| 25 to 29 Years | 155 (89.6%) | 0 (0.0%) |
| 30 to 34 Years | 197 (100.0%) | 0 (0.0%) |
| 35 to 44 Years | 322 (98.2%) | 84 (26.1%) |
| 45 to 54 Years | 334 (86.3%) | 40 (12.0%) |
| 55 to 59 Years | 84 (55.3%) | 21 (25.0%) |
| 60 to 64 Years | 134 (72.4%) | 0 (0.0%) |
| 65 to 74 Years | 76 (27.7%) | 2 (2.6%) |
| 75 Years and over | 18 (9.1%) | 0 (0.0%) |
| Total | 1,492 (70.5%) | 178 (11.9%) |
Employment Status by Educational Attainment in Blasdell
According to labor force statistics for Blasdell, 86.2% of individuals (1,226) out of the total population between 25 and 64 years of age (1,422) are in the labor force, with 11.8% or 145 of them being unemployed. The group with the highest labor force participation rate are those with the educational attainment of bachelor's degree or higher, with 98.3% or 283 individuals in the labor force. Within the labor force, individuals with college / associate degree education have the highest percentage of unemployment, with 25.1% or 124 of them being unemployed.
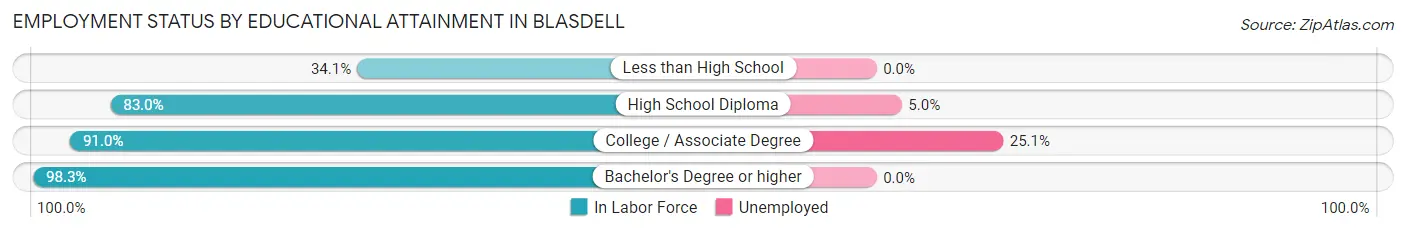
| Educational Attainment | In Labor Force | Unemployed |
| Less than High School | 29 (34.1%) | 0 (0.0%) |
| High School Diploma | 420 (83.0%) | 25 (5.0%) |
| College / Associate Degree | 494 (91.0%) | 136 (25.1%) |
| Bachelor's Degree or higher | 283 (98.3%) | 0 (0.0%) |
| Total | 1,226 (86.2%) | 168 (11.8%) |
Employment Occupations by Sex in Blasdell
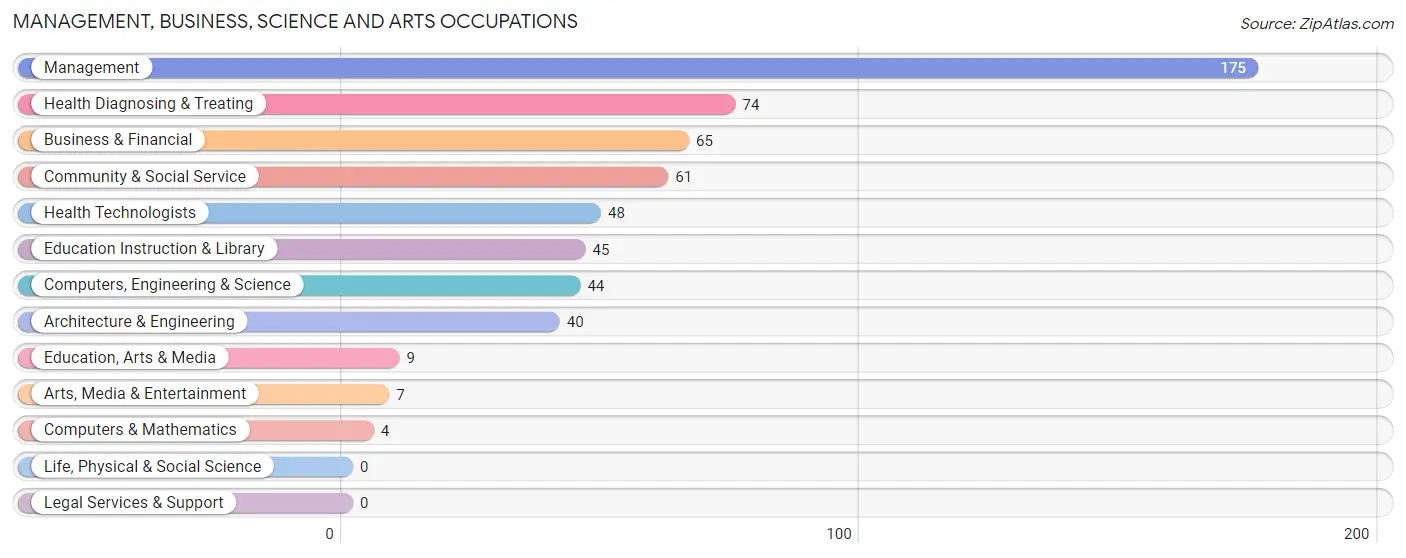
Management, Business, Science and Arts Occupations
The most common Management, Business, Science and Arts occupations in Blasdell are Management (175 | 13.3%), Health Diagnosing & Treating (74 | 5.6%), Business & Financial (65 | 5.0%), Community & Social Service (61 | 4.6%), and Health Technologists (48 | 3.6%).
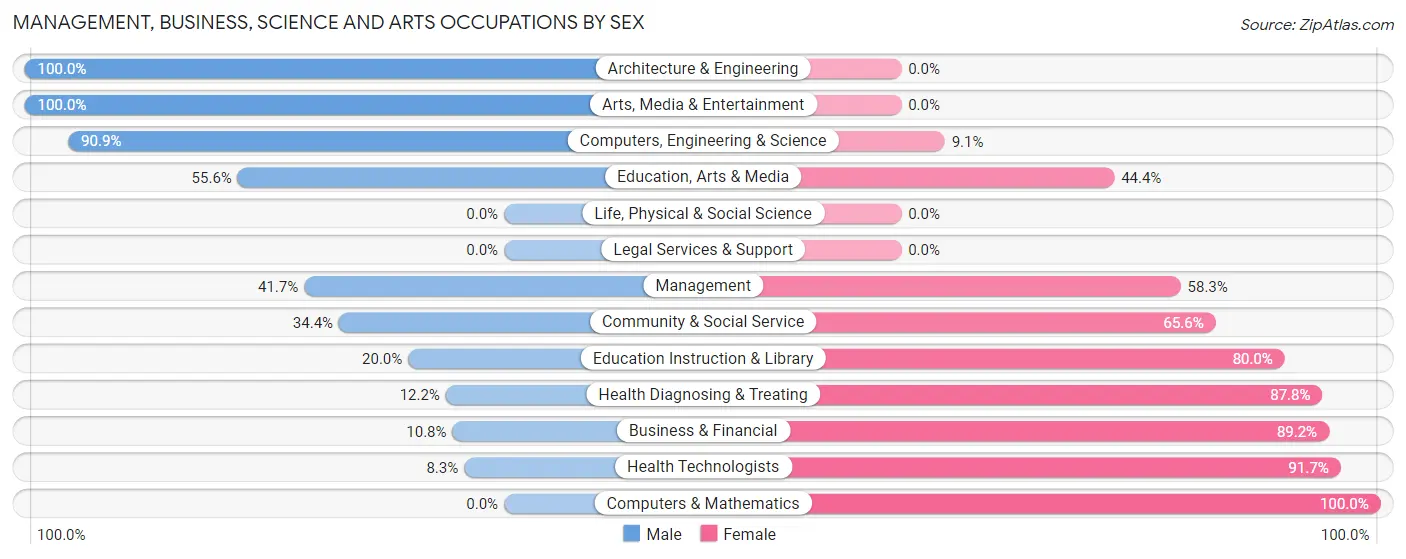
Management, Business, Science and Arts Occupations by Sex
Within the Management, Business, Science and Arts occupations in Blasdell, the most male-oriented occupations are Architecture & Engineering (100.0%), Arts, Media & Entertainment (100.0%), and Computers, Engineering & Science (90.9%), while the most female-oriented occupations are Computers & Mathematics (100.0%), Health Technologists (91.7%), and Business & Financial (89.2%).
| Occupation | Male | Female |
| Management | 73 (41.7%) | 102 (58.3%) |
| Business & Financial | 7 (10.8%) | 58 (89.2%) |
| Computers, Engineering & Science | 40 (90.9%) | 4 (9.1%) |
| Computers & Mathematics | 0 (0.0%) | 4 (100.0%) |
| Architecture & Engineering | 40 (100.0%) | 0 (0.0%) |
| Life, Physical & Social Science | 0 (0.0%) | 0 (0.0%) |
| Community & Social Service | 21 (34.4%) | 40 (65.6%) |
| Education, Arts & Media | 5 (55.6%) | 4 (44.4%) |
| Legal Services & Support | 0 (0.0%) | 0 (0.0%) |
| Education Instruction & Library | 9 (20.0%) | 36 (80.0%) |
| Arts, Media & Entertainment | 7 (100.0%) | 0 (0.0%) |
| Health Diagnosing & Treating | 9 (12.2%) | 65 (87.8%) |
| Health Technologists | 4 (8.3%) | 44 (91.7%) |
| Total (Category) | 150 (35.8%) | 269 (64.2%) |
| Total (Overall) | 626 (47.6%) | 688 (52.4%) |
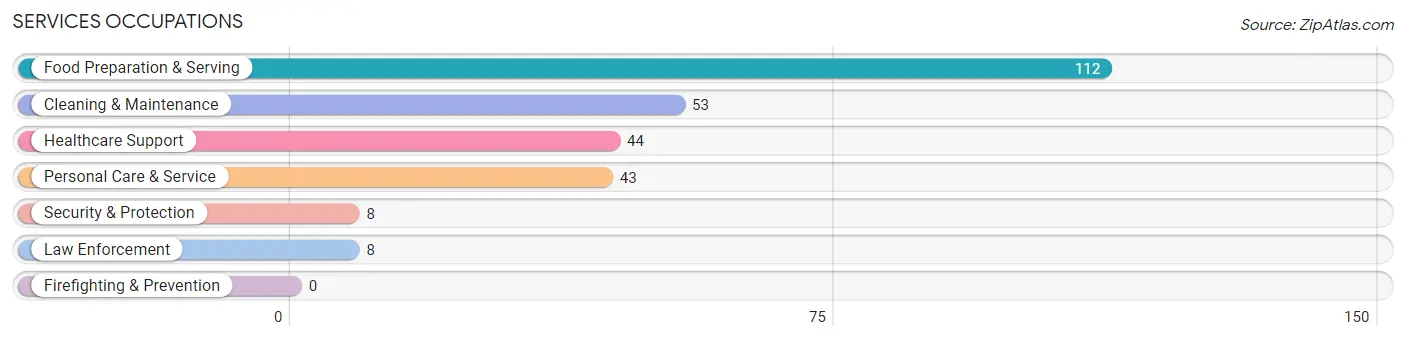
Services Occupations
The most common Services occupations in Blasdell are Food Preparation & Serving (112 | 8.5%), Cleaning & Maintenance (53 | 4.0%), Healthcare Support (44 | 3.4%), Personal Care & Service (43 | 3.3%), and Security & Protection (8 | 0.6%).
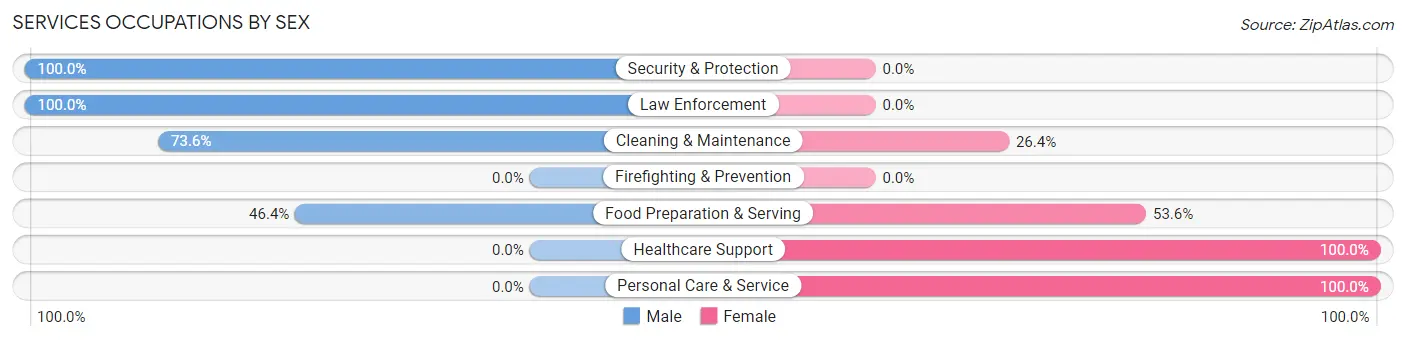
Services Occupations by Sex
Within the Services occupations in Blasdell, the most male-oriented occupations are Security & Protection (100.0%), Law Enforcement (100.0%), and Cleaning & Maintenance (73.6%), while the most female-oriented occupations are Healthcare Support (100.0%), Personal Care & Service (100.0%), and Food Preparation & Serving (53.6%).
| Occupation | Male | Female |
| Healthcare Support | 0 (0.0%) | 44 (100.0%) |
| Security & Protection | 8 (100.0%) | 0 (0.0%) |
| Firefighting & Prevention | 0 (0.0%) | 0 (0.0%) |
| Law Enforcement | 8 (100.0%) | 0 (0.0%) |
| Food Preparation & Serving | 52 (46.4%) | 60 (53.6%) |
| Cleaning & Maintenance | 39 (73.6%) | 14 (26.4%) |
| Personal Care & Service | 0 (0.0%) | 43 (100.0%) |
| Total (Category) | 99 (38.1%) | 161 (61.9%) |
| Total (Overall) | 626 (47.6%) | 688 (52.4%) |
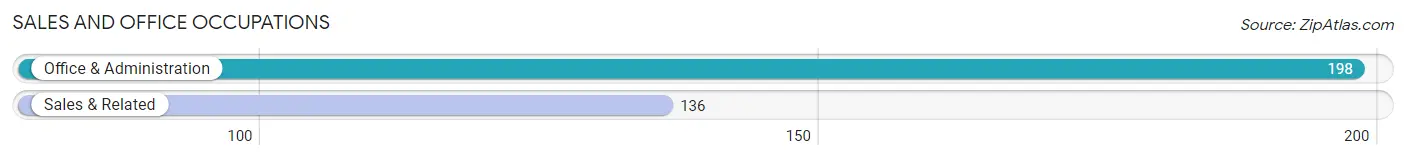
Sales and Office Occupations
The most common Sales and Office occupations in Blasdell are Office & Administration (198 | 15.1%), and Sales & Related (136 | 10.3%).
Sales and Office Occupations by Sex
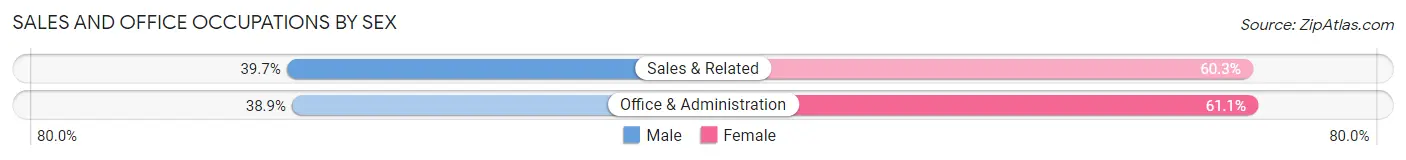
| Occupation | Male | Female |
| Sales & Related | 54 (39.7%) | 82 (60.3%) |
| Office & Administration | 77 (38.9%) | 121 (61.1%) |
| Total (Category) | 131 (39.2%) | 203 (60.8%) |
| Total (Overall) | 626 (47.6%) | 688 (52.4%) |
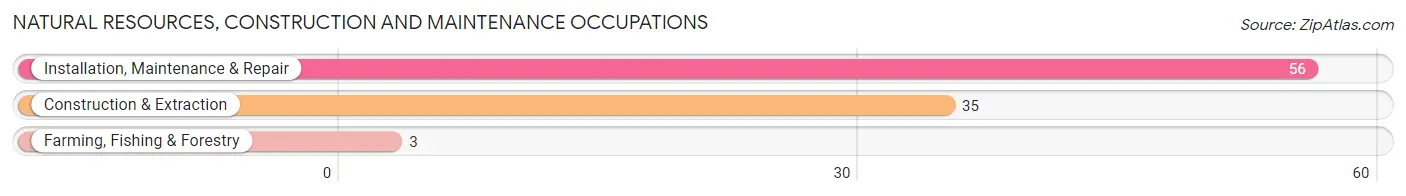
Natural Resources, Construction and Maintenance Occupations
The most common Natural Resources, Construction and Maintenance occupations in Blasdell are Installation, Maintenance & Repair (56 | 4.3%), Construction & Extraction (35 | 2.7%), and Farming, Fishing & Forestry (3 | 0.2%).
Natural Resources, Construction and Maintenance Occupations by Sex
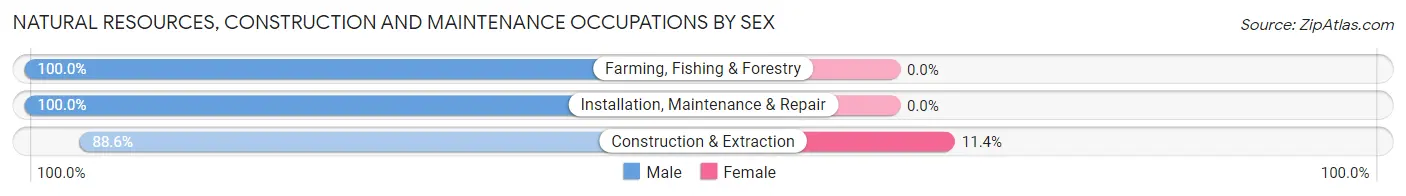
| Occupation | Male | Female |
| Farming, Fishing & Forestry | 3 (100.0%) | 0 (0.0%) |
| Construction & Extraction | 31 (88.6%) | 4 (11.4%) |
| Installation, Maintenance & Repair | 56 (100.0%) | 0 (0.0%) |
| Total (Category) | 90 (95.7%) | 4 (4.3%) |
| Total (Overall) | 626 (47.6%) | 688 (52.4%) |
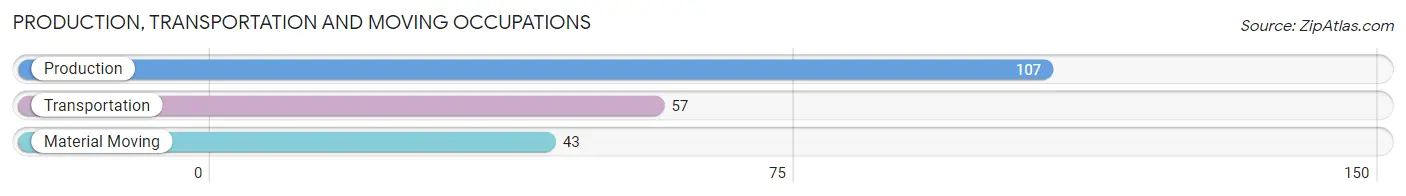
Production, Transportation and Moving Occupations
The most common Production, Transportation and Moving occupations in Blasdell are Production (107 | 8.1%), Transportation (57 | 4.3%), and Material Moving (43 | 3.3%).
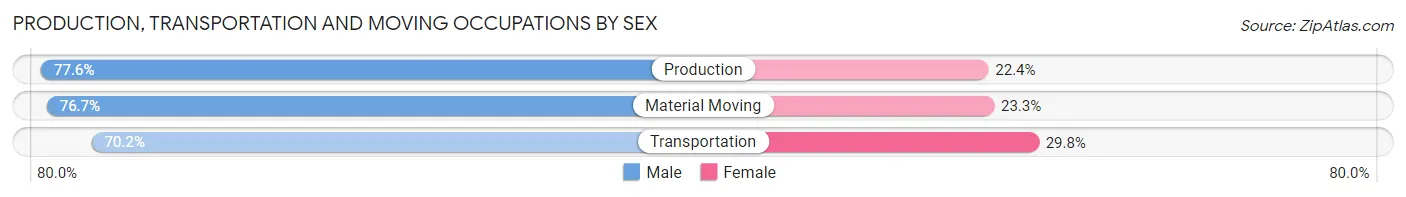
Production, Transportation and Moving Occupations by Sex
| Occupation | Male | Female |
| Production | 83 (77.6%) | 24 (22.4%) |
| Transportation | 40 (70.2%) | 17 (29.8%) |
| Material Moving | 33 (76.7%) | 10 (23.3%) |
| Total (Category) | 156 (75.4%) | 51 (24.6%) |
| Total (Overall) | 626 (47.6%) | 688 (52.4%) |
Employment Industries by Sex in Blasdell
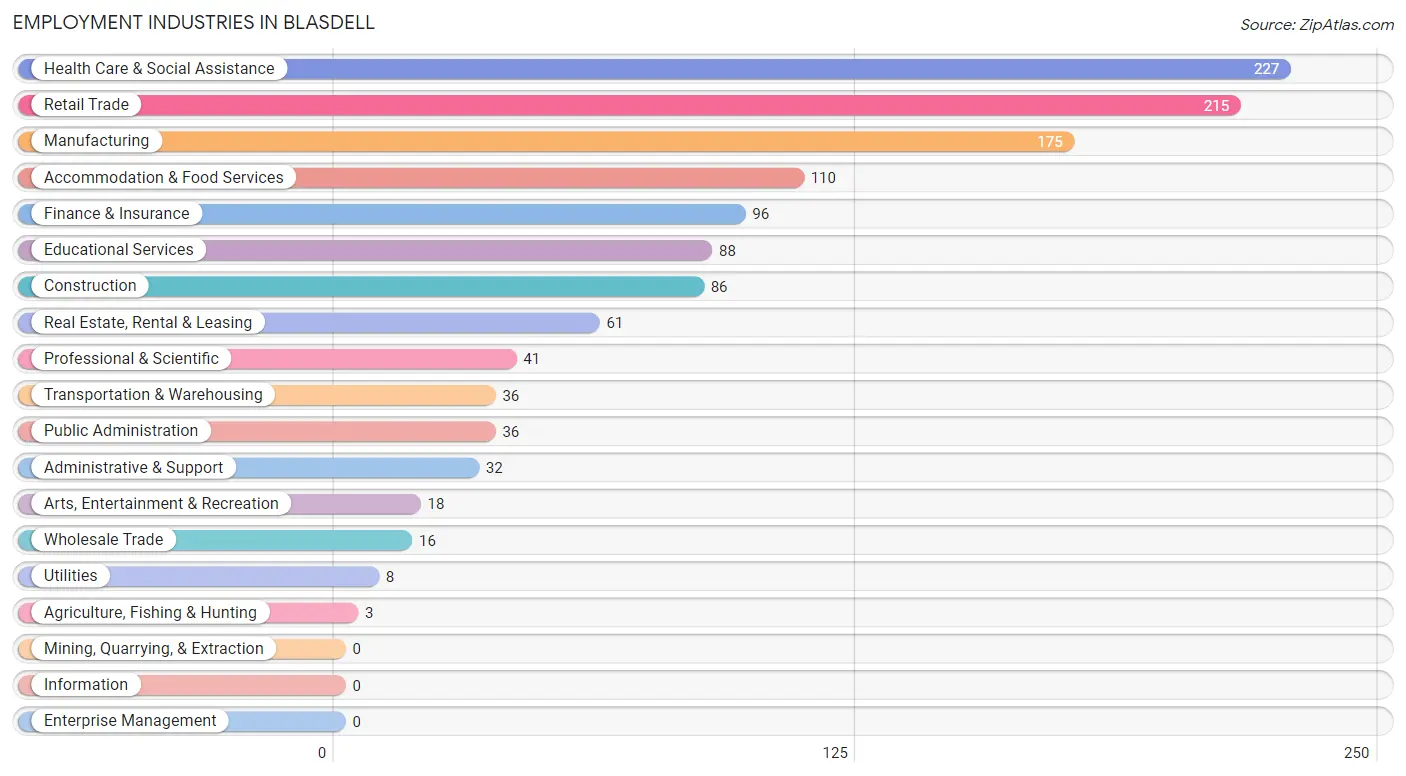
Employment Industries in Blasdell
The major employment industries in Blasdell include Health Care & Social Assistance (227 | 17.3%), Retail Trade (215 | 16.4%), Manufacturing (175 | 13.3%), Accommodation & Food Services (110 | 8.4%), and Finance & Insurance (96 | 7.3%).
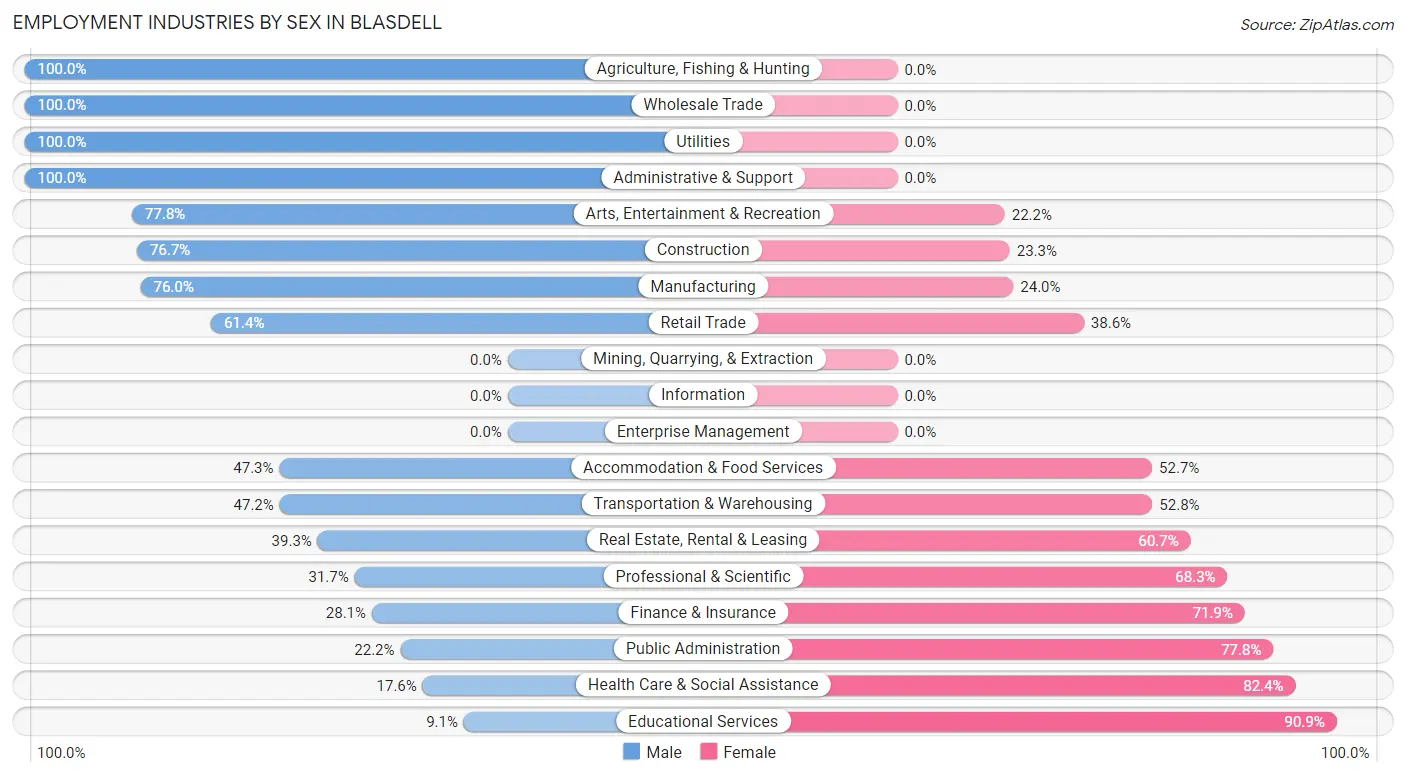
Employment Industries by Sex in Blasdell
The Blasdell industries that see more men than women are Agriculture, Fishing & Hunting (100.0%), Wholesale Trade (100.0%), and Utilities (100.0%), whereas the industries that tend to have a higher number of women are Educational Services (90.9%), Health Care & Social Assistance (82.4%), and Public Administration (77.8%).
| Industry | Male | Female |
| Agriculture, Fishing & Hunting | 3 (100.0%) | 0 (0.0%) |
| Mining, Quarrying, & Extraction | 0 (0.0%) | 0 (0.0%) |
| Construction | 66 (76.7%) | 20 (23.3%) |
| Manufacturing | 133 (76.0%) | 42 (24.0%) |
| Wholesale Trade | 16 (100.0%) | 0 (0.0%) |
| Retail Trade | 132 (61.4%) | 83 (38.6%) |
| Transportation & Warehousing | 17 (47.2%) | 19 (52.8%) |
| Utilities | 8 (100.0%) | 0 (0.0%) |
| Information | 0 (0.0%) | 0 (0.0%) |
| Finance & Insurance | 27 (28.1%) | 69 (71.9%) |
| Real Estate, Rental & Leasing | 24 (39.3%) | 37 (60.7%) |
| Professional & Scientific | 13 (31.7%) | 28 (68.3%) |
| Enterprise Management | 0 (0.0%) | 0 (0.0%) |
| Administrative & Support | 32 (100.0%) | 0 (0.0%) |
| Educational Services | 8 (9.1%) | 80 (90.9%) |
| Health Care & Social Assistance | 40 (17.6%) | 187 (82.4%) |
| Arts, Entertainment & Recreation | 14 (77.8%) | 4 (22.2%) |
| Accommodation & Food Services | 52 (47.3%) | 58 (52.7%) |
| Public Administration | 8 (22.2%) | 28 (77.8%) |
| Total | 626 (47.6%) | 688 (52.4%) |
Education in Blasdell
School Enrollment in Blasdell
The most common levels of schooling among the 545 students in Blasdell are middle school (147 | 27.0%), high school (117 | 21.5%), and elementary school (80 | 14.7%).
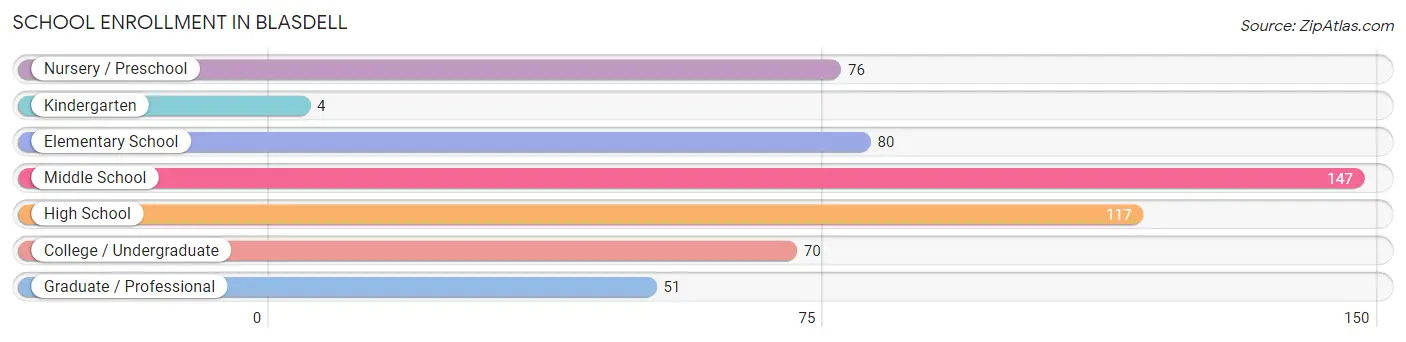
| School Level | # Students | % Students |
| Nursery / Preschool | 76 | 13.9% |
| Kindergarten | 4 | 0.7% |
| Elementary School | 80 | 14.7% |
| Middle School | 147 | 27.0% |
| High School | 117 | 21.5% |
| College / Undergraduate | 70 | 12.8% |
| Graduate / Professional | 51 | 9.4% |
| Total | 545 | 100.0% |
School Enrollment by Age by Funding Source in Blasdell
Out of a total of 545 students who are enrolled in schools in Blasdell, 115 (21.1%) attend a private institution, while the remaining 430 (78.9%) are enrolled in public schools. The age group of 18 to 19 year olds has the highest likelihood of being enrolled in private schools, with 23 (100.0% in the age bracket) enrolled. Conversely, the age group of 5 to 9 year old has the lowest likelihood of being enrolled in a private school, with 96 (94.1% in the age bracket) attending a public institution.
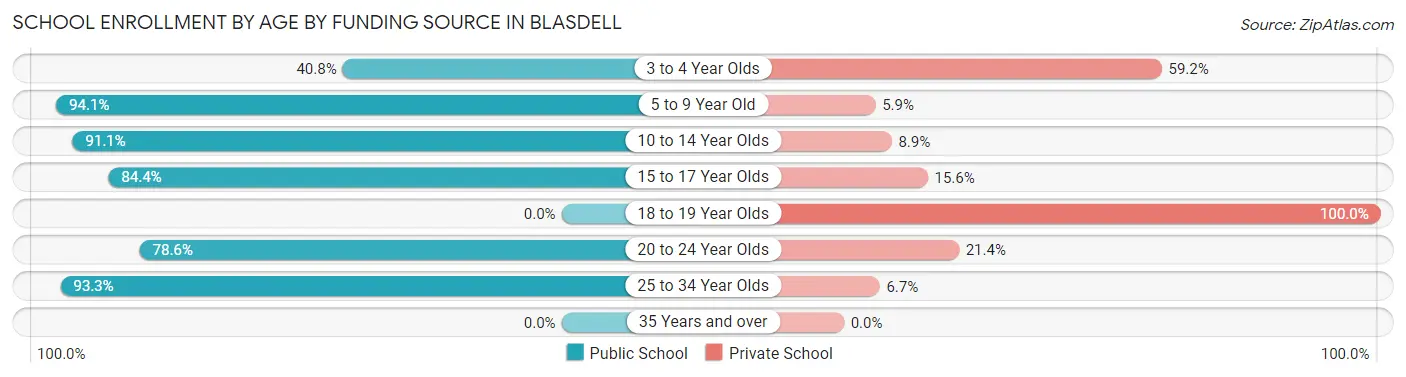
| Age Bracket | Public School | Private School |
| 3 to 4 Year Olds | 31 (40.8%) | 45 (59.2%) |
| 5 to 9 Year Old | 96 (94.1%) | 6 (5.9%) |
| 10 to 14 Year Olds | 133 (91.1%) | 13 (8.9%) |
| 15 to 17 Year Olds | 81 (84.4%) | 15 (15.6%) |
| 18 to 19 Year Olds | 0 (0.0%) | 23 (100.0%) |
| 20 to 24 Year Olds | 33 (78.6%) | 9 (21.4%) |
| 25 to 34 Year Olds | 56 (93.3%) | 4 (6.7%) |
| 35 Years and over | 0 (0.0%) | 0 (0.0%) |
| Total | 430 (78.9%) | 115 (21.1%) |
Educational Attainment by Field of Study in Blasdell
Business (75 | 22.5%), education (67 | 20.1%), social sciences (41 | 12.3%), engineering (41 | 12.3%), and science & technology (34 | 10.2%) are the most common fields of study among 333 individuals in Blasdell who have obtained a bachelor's degree or higher.
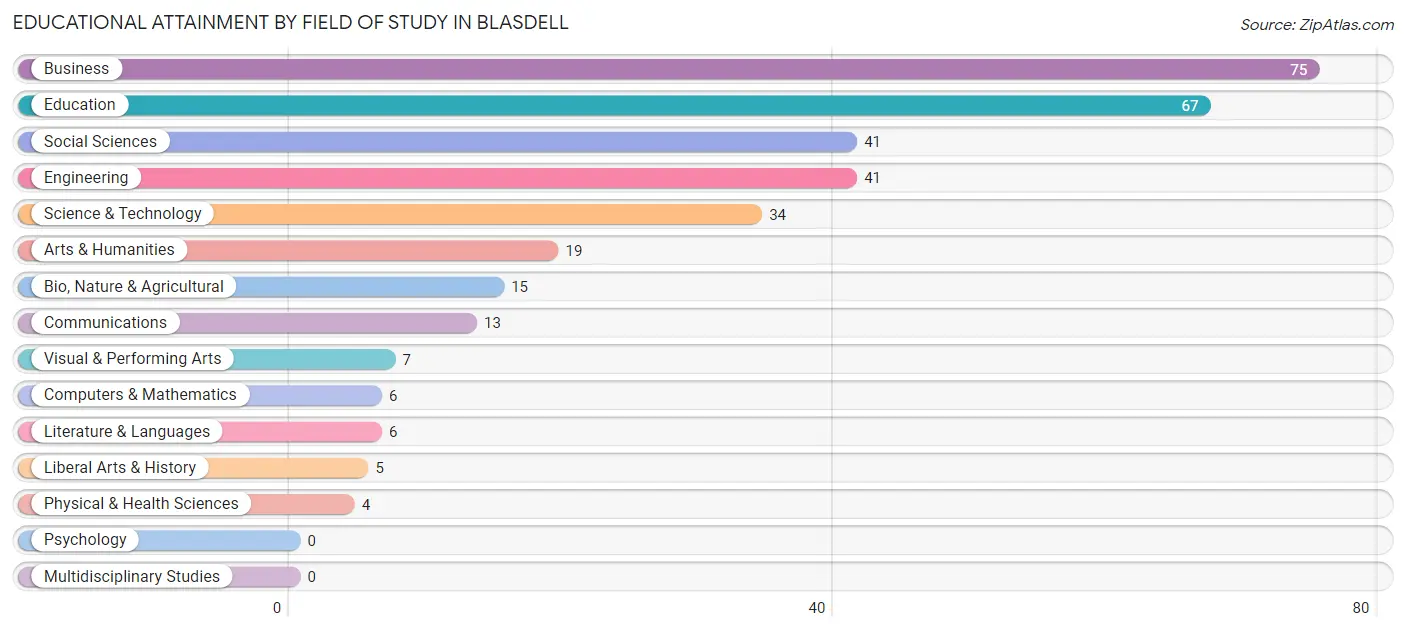
| Field of Study | # Graduates | % Graduates |
| Computers & Mathematics | 6 | 1.8% |
| Bio, Nature & Agricultural | 15 | 4.5% |
| Physical & Health Sciences | 4 | 1.2% |
| Psychology | 0 | 0.0% |
| Social Sciences | 41 | 12.3% |
| Engineering | 41 | 12.3% |
| Multidisciplinary Studies | 0 | 0.0% |
| Science & Technology | 34 | 10.2% |
| Business | 75 | 22.5% |
| Education | 67 | 20.1% |
| Literature & Languages | 6 | 1.8% |
| Liberal Arts & History | 5 | 1.5% |
| Visual & Performing Arts | 7 | 2.1% |
| Communications | 13 | 3.9% |
| Arts & Humanities | 19 | 5.7% |
| Total | 333 | 100.0% |
Transportation & Commute in Blasdell
Vehicle Availability by Sex in Blasdell
The most prevalent vehicle ownership categories in Blasdell are males with 2 vehicles (316, accounting for 50.7%) and females with 2 vehicles (283, making up 48.1%).
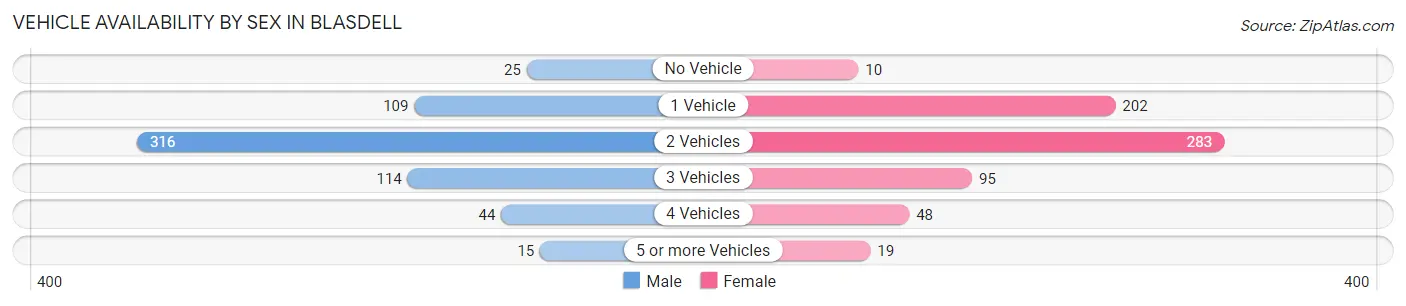
| Vehicles Available | Male | Female |
| No Vehicle | 25 (4.0%) | 10 (1.5%) |
| 1 Vehicle | 109 (17.5%) | 202 (30.7%) |
| 2 Vehicles | 316 (50.7%) | 283 (43.1%) |
| 3 Vehicles | 114 (18.3%) | 95 (14.5%) |
| 4 Vehicles | 44 (7.1%) | 48 (7.3%) |
| 5 or more Vehicles | 15 (2.4%) | 19 (2.9%) |
| Total | 623 (100.0%) | 657 (100.0%) |
Commute Time in Blasdell
The most frequently occuring commute durations in Blasdell are 15 to 19 minutes (209 commuters, 18.4%), 30 to 34 minutes (194 commuters, 17.1%), and 20 to 24 minutes (175 commuters, 15.4%).
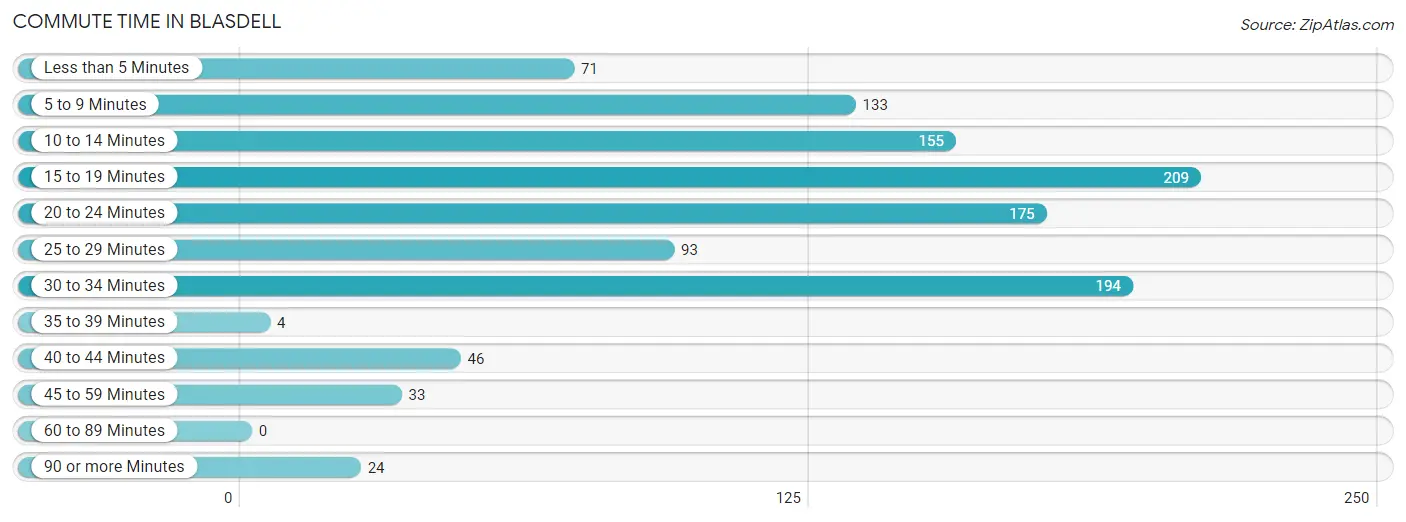
| Commute Time | # Commuters | % Commuters |
| Less than 5 Minutes | 71 | 6.2% |
| 5 to 9 Minutes | 133 | 11.7% |
| 10 to 14 Minutes | 155 | 13.6% |
| 15 to 19 Minutes | 209 | 18.4% |
| 20 to 24 Minutes | 175 | 15.4% |
| 25 to 29 Minutes | 93 | 8.2% |
| 30 to 34 Minutes | 194 | 17.1% |
| 35 to 39 Minutes | 4 | 0.4% |
| 40 to 44 Minutes | 46 | 4.1% |
| 45 to 59 Minutes | 33 | 2.9% |
| 60 to 89 Minutes | 0 | 0.0% |
| 90 or more Minutes | 24 | 2.1% |
Commute Time by Sex in Blasdell
The most common commute times in Blasdell are 30 to 34 minutes (127 commuters, 23.1%) for males and 15 to 19 minutes (124 commuters, 21.2%) for females.
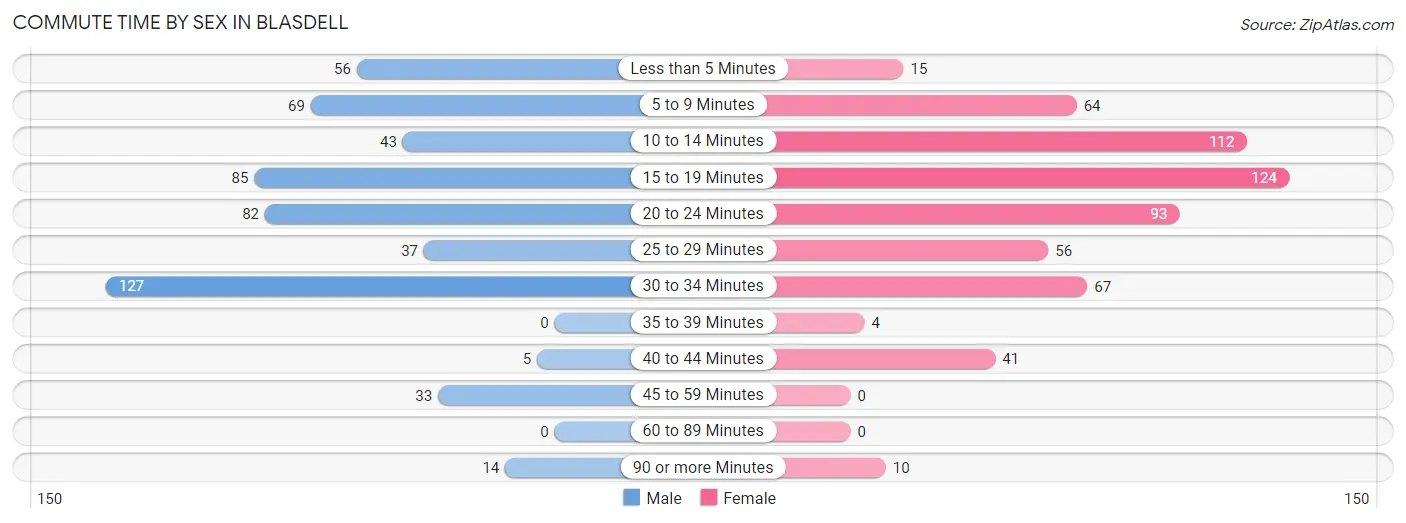
| Commute Time | Male | Female |
| Less than 5 Minutes | 56 (10.2%) | 15 (2.6%) |
| 5 to 9 Minutes | 69 (12.5%) | 64 (10.9%) |
| 10 to 14 Minutes | 43 (7.8%) | 112 (19.1%) |
| 15 to 19 Minutes | 85 (15.4%) | 124 (21.2%) |
| 20 to 24 Minutes | 82 (14.9%) | 93 (15.9%) |
| 25 to 29 Minutes | 37 (6.7%) | 56 (9.6%) |
| 30 to 34 Minutes | 127 (23.1%) | 67 (11.4%) |
| 35 to 39 Minutes | 0 (0.0%) | 4 (0.7%) |
| 40 to 44 Minutes | 5 (0.9%) | 41 (7.0%) |
| 45 to 59 Minutes | 33 (6.0%) | 0 (0.0%) |
| 60 to 89 Minutes | 0 (0.0%) | 0 (0.0%) |
| 90 or more Minutes | 14 (2.5%) | 10 (1.7%) |
Time of Departure to Work by Sex in Blasdell
The most frequent times of departure to work in Blasdell are 7:30 AM to 7:59 AM (100, 18.1%) for males and 8:00 AM to 8:29 AM (140, 23.9%) for females.
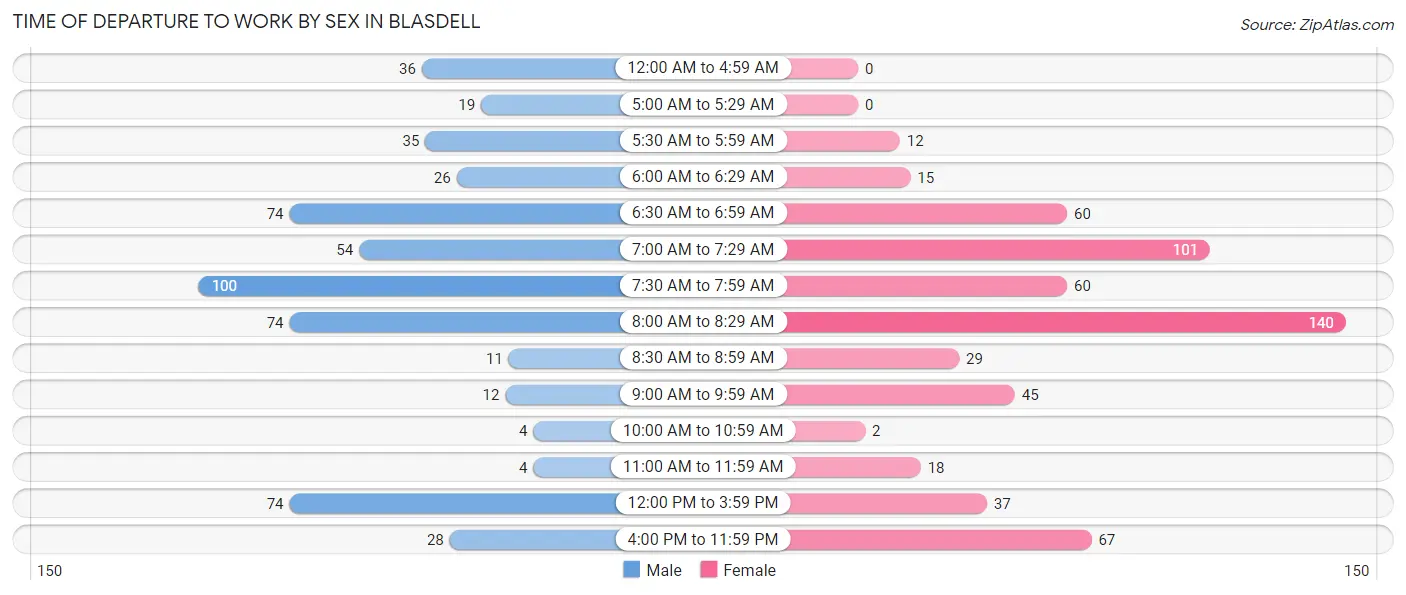
| Time of Departure | Male | Female |
| 12:00 AM to 4:59 AM | 36 (6.5%) | 0 (0.0%) |
| 5:00 AM to 5:29 AM | 19 (3.5%) | 0 (0.0%) |
| 5:30 AM to 5:59 AM | 35 (6.4%) | 12 (2.1%) |
| 6:00 AM to 6:29 AM | 26 (4.7%) | 15 (2.6%) |
| 6:30 AM to 6:59 AM | 74 (13.4%) | 60 (10.2%) |
| 7:00 AM to 7:29 AM | 54 (9.8%) | 101 (17.2%) |
| 7:30 AM to 7:59 AM | 100 (18.1%) | 60 (10.2%) |
| 8:00 AM to 8:29 AM | 74 (13.4%) | 140 (23.9%) |
| 8:30 AM to 8:59 AM | 11 (2.0%) | 29 (5.0%) |
| 9:00 AM to 9:59 AM | 12 (2.2%) | 45 (7.7%) |
| 10:00 AM to 10:59 AM | 4 (0.7%) | 2 (0.3%) |
| 11:00 AM to 11:59 AM | 4 (0.7%) | 18 (3.1%) |
| 12:00 PM to 3:59 PM | 74 (13.4%) | 37 (6.3%) |
| 4:00 PM to 11:59 PM | 28 (5.1%) | 67 (11.4%) |
| Total | 551 (100.0%) | 586 (100.0%) |
Housing Occupancy in Blasdell
Occupancy by Ownership in Blasdell
Of the total 1,230 dwellings in Blasdell, owner-occupied units account for 689 (56.0%), while renter-occupied units make up 541 (44.0%).
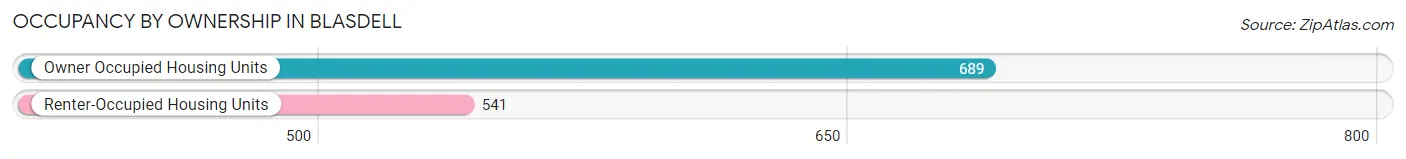
| Occupancy | # Housing Units | % Housing Units |
| Owner Occupied Housing Units | 689 | 56.0% |
| Renter-Occupied Housing Units | 541 | 44.0% |
| Total Occupied Housing Units | 1,230 | 100.0% |
Occupancy by Household Size in Blasdell
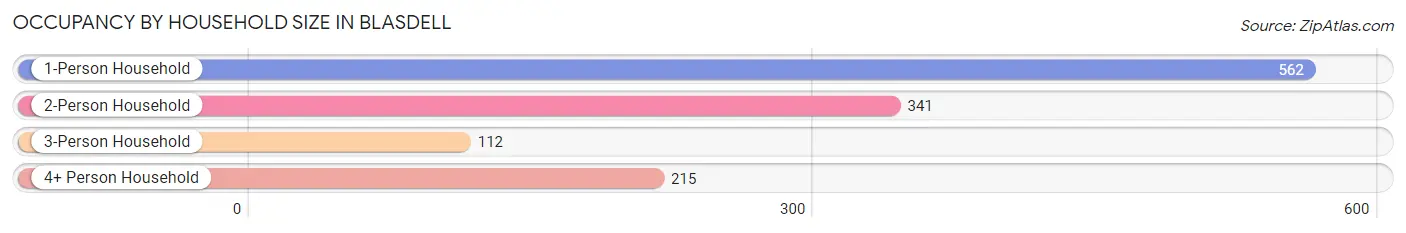
| Household Size | # Housing Units | % Housing Units |
| 1-Person Household | 562 | 45.7% |
| 2-Person Household | 341 | 27.7% |
| 3-Person Household | 112 | 9.1% |
| 4+ Person Household | 215 | 17.5% |
| Total Housing Units | 1,230 | 100.0% |
Occupancy by Ownership by Household Size in Blasdell
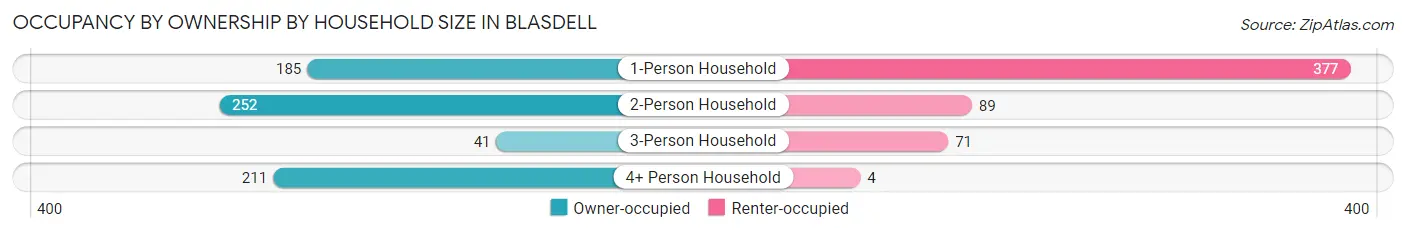
| Household Size | Owner-occupied | Renter-occupied |
| 1-Person Household | 185 (32.9%) | 377 (67.1%) |
| 2-Person Household | 252 (73.9%) | 89 (26.1%) |
| 3-Person Household | 41 (36.6%) | 71 (63.4%) |
| 4+ Person Household | 211 (98.1%) | 4 (1.9%) |
| Total Housing Units | 689 (56.0%) | 541 (44.0%) |
Occupancy by Educational Attainment in Blasdell
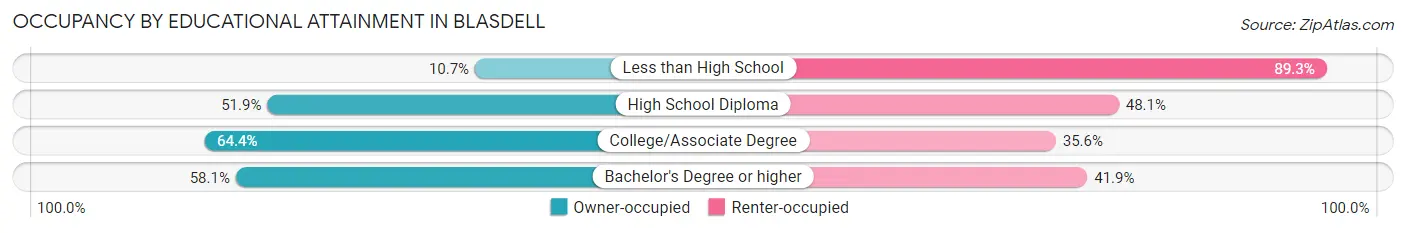
| Household Size | Owner-occupied | Renter-occupied |
| Less than High School | 6 (10.7%) | 50 (89.3%) |
| High School Diploma | 247 (51.9%) | 229 (48.1%) |
| College/Associate Degree | 311 (64.4%) | 172 (35.6%) |
| Bachelor's Degree or higher | 125 (58.1%) | 90 (41.9%) |
Occupancy by Age of Householder in Blasdell
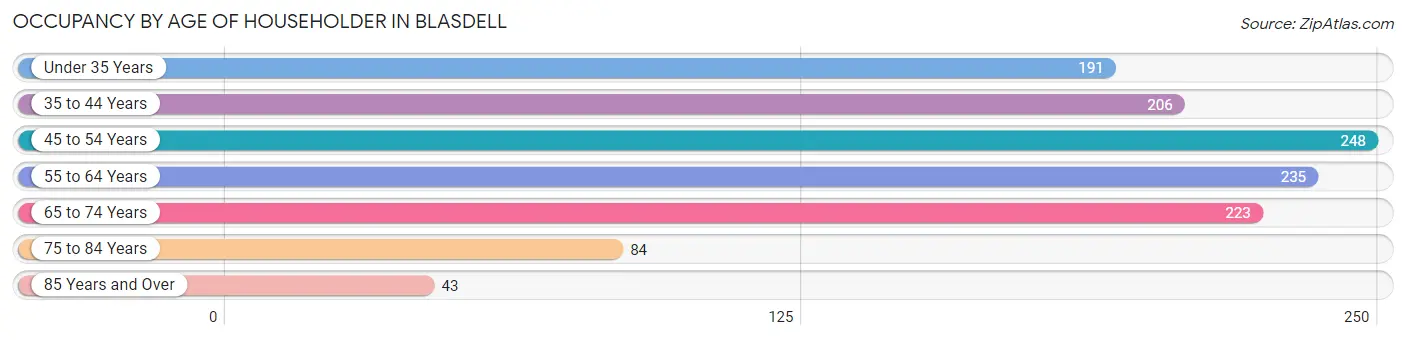
| Age Bracket | # Households | % Households |
| Under 35 Years | 191 | 15.5% |
| 35 to 44 Years | 206 | 16.8% |
| 45 to 54 Years | 248 | 20.2% |
| 55 to 64 Years | 235 | 19.1% |
| 65 to 74 Years | 223 | 18.1% |
| 75 to 84 Years | 84 | 6.8% |
| 85 Years and Over | 43 | 3.5% |
| Total | 1,230 | 100.0% |
Housing Finances in Blasdell
Median Income by Occupancy in Blasdell
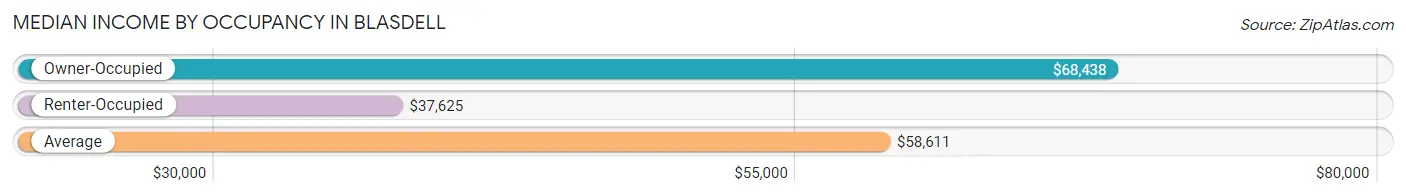
| Occupancy Type | # Households | Median Income |
| Owner-Occupied | 689 (56.0%) | $68,438 |
| Renter-Occupied | 541 (44.0%) | $37,625 |
| Average | 1,230 (100.0%) | $58,611 |
Occupancy by Householder Income Bracket in Blasdell
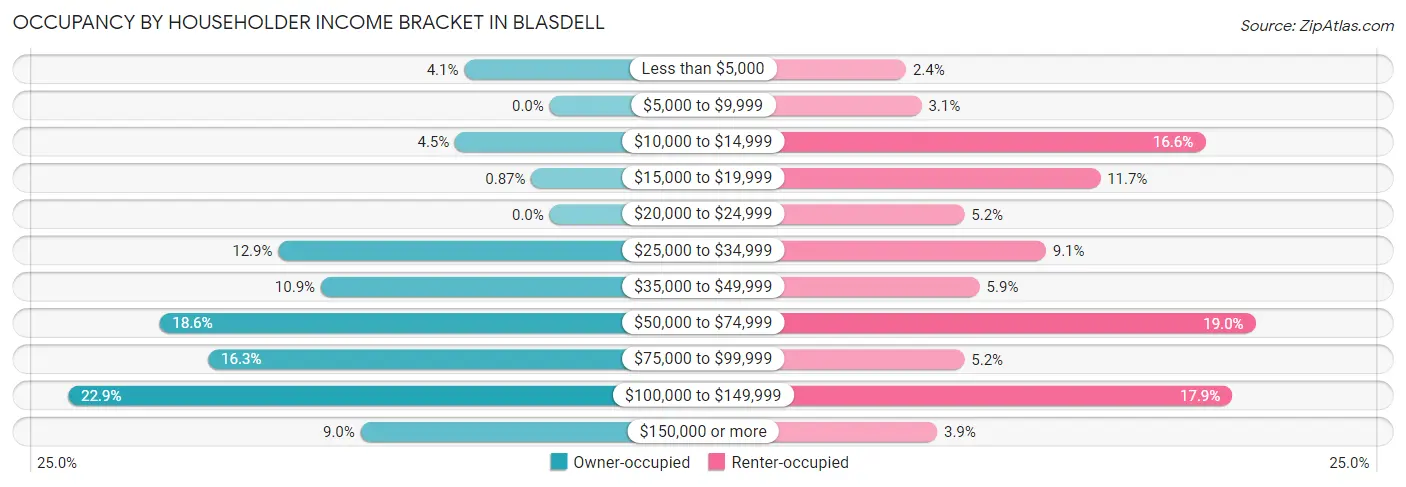
| Income Bracket | Owner-occupied | Renter-occupied |
| Less than $5,000 | 28 (4.1%) | 13 (2.4%) |
| $5,000 to $9,999 | 0 (0.0%) | 17 (3.1%) |
| $10,000 to $14,999 | 31 (4.5%) | 90 (16.6%) |
| $15,000 to $19,999 | 6 (0.9%) | 63 (11.7%) |
| $20,000 to $24,999 | 0 (0.0%) | 28 (5.2%) |
| $25,000 to $34,999 | 89 (12.9%) | 49 (9.1%) |
| $35,000 to $49,999 | 75 (10.9%) | 32 (5.9%) |
| $50,000 to $74,999 | 128 (18.6%) | 103 (19.0%) |
| $75,000 to $99,999 | 112 (16.3%) | 28 (5.2%) |
| $100,000 to $149,999 | 158 (22.9%) | 97 (17.9%) |
| $150,000 or more | 62 (9.0%) | 21 (3.9%) |
| Total | 689 (100.0%) | 541 (100.0%) |
Monthly Housing Cost Tiers in Blasdell
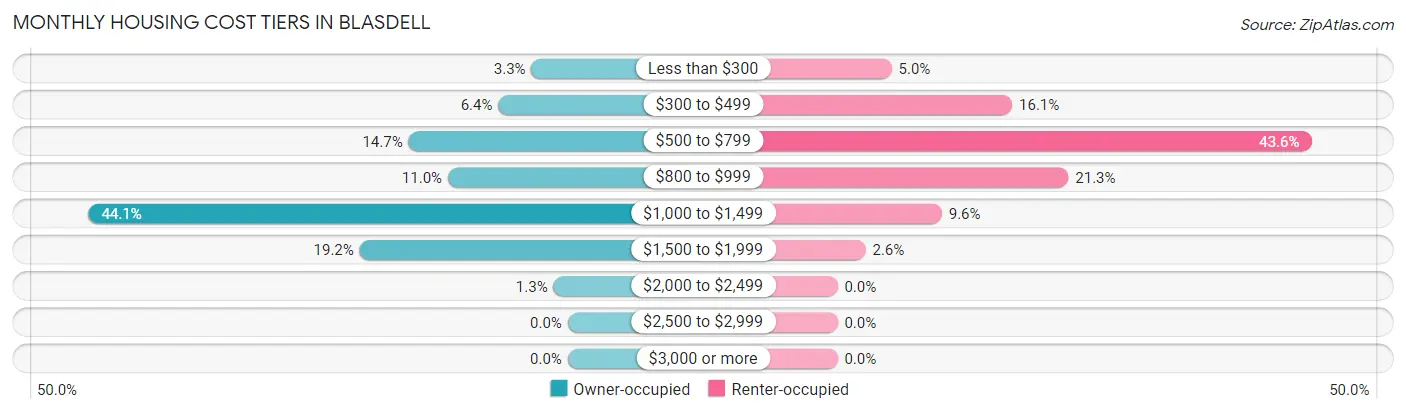
| Monthly Cost | Owner-occupied | Renter-occupied |
| Less than $300 | 23 (3.3%) | 27 (5.0%) |
| $300 to $499 | 44 (6.4%) | 87 (16.1%) |
| $500 to $799 | 101 (14.7%) | 236 (43.6%) |
| $800 to $999 | 76 (11.0%) | 115 (21.3%) |
| $1,000 to $1,499 | 304 (44.1%) | 52 (9.6%) |
| $1,500 to $1,999 | 132 (19.2%) | 14 (2.6%) |
| $2,000 to $2,499 | 9 (1.3%) | 0 (0.0%) |
| $2,500 to $2,999 | 0 (0.0%) | 0 (0.0%) |
| $3,000 or more | 0 (0.0%) | 0 (0.0%) |
| Total | 689 (100.0%) | 541 (100.0%) |
Physical Housing Characteristics in Blasdell
Housing Structures in Blasdell
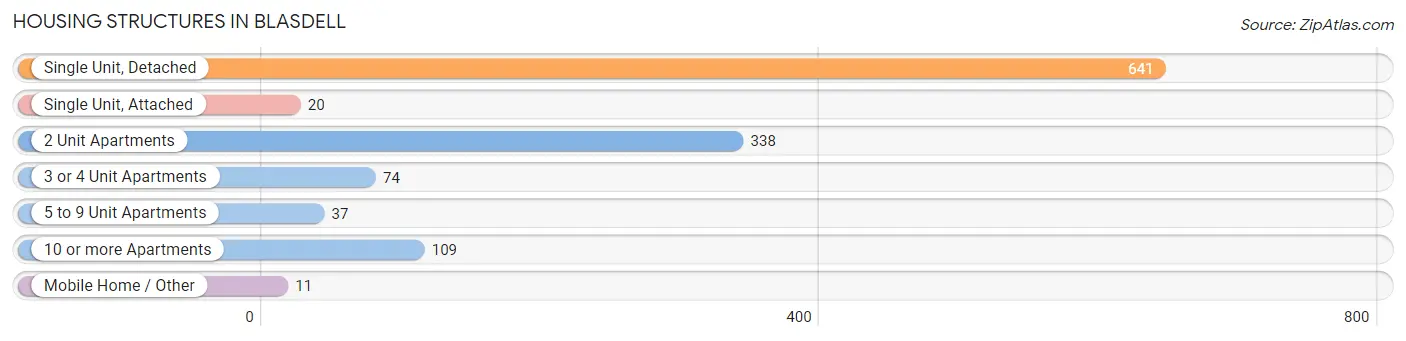
| Structure Type | # Housing Units | % Housing Units |
| Single Unit, Detached | 641 | 52.1% |
| Single Unit, Attached | 20 | 1.6% |
| 2 Unit Apartments | 338 | 27.5% |
| 3 or 4 Unit Apartments | 74 | 6.0% |
| 5 to 9 Unit Apartments | 37 | 3.0% |
| 10 or more Apartments | 109 | 8.9% |
| Mobile Home / Other | 11 | 0.9% |
| Total | 1,230 | 100.0% |
Housing Structures by Occupancy in Blasdell
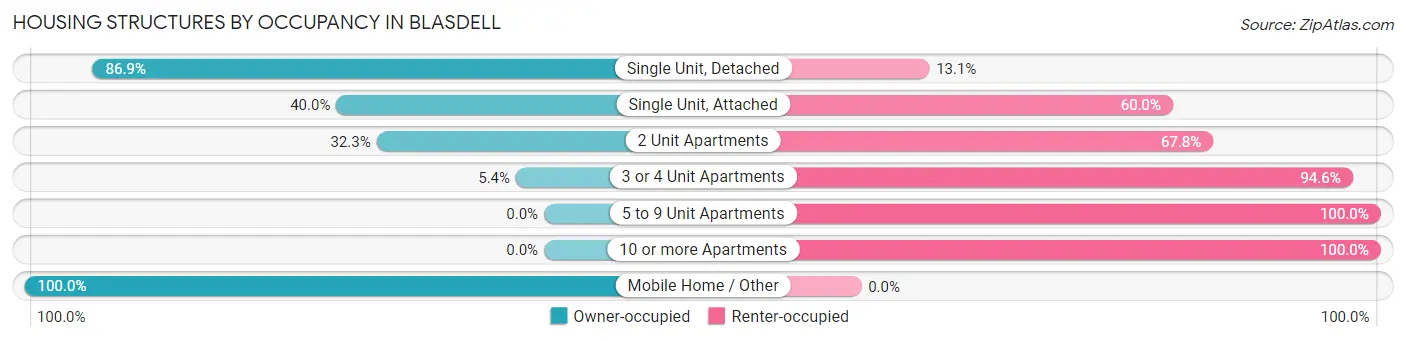
| Structure Type | Owner-occupied | Renter-occupied |
| Single Unit, Detached | 557 (86.9%) | 84 (13.1%) |
| Single Unit, Attached | 8 (40.0%) | 12 (60.0%) |
| 2 Unit Apartments | 109 (32.3%) | 229 (67.7%) |
| 3 or 4 Unit Apartments | 4 (5.4%) | 70 (94.6%) |
| 5 to 9 Unit Apartments | 0 (0.0%) | 37 (100.0%) |
| 10 or more Apartments | 0 (0.0%) | 109 (100.0%) |
| Mobile Home / Other | 11 (100.0%) | 0 (0.0%) |
| Total | 689 (56.0%) | 541 (44.0%) |
Housing Structures by Number of Rooms in Blasdell
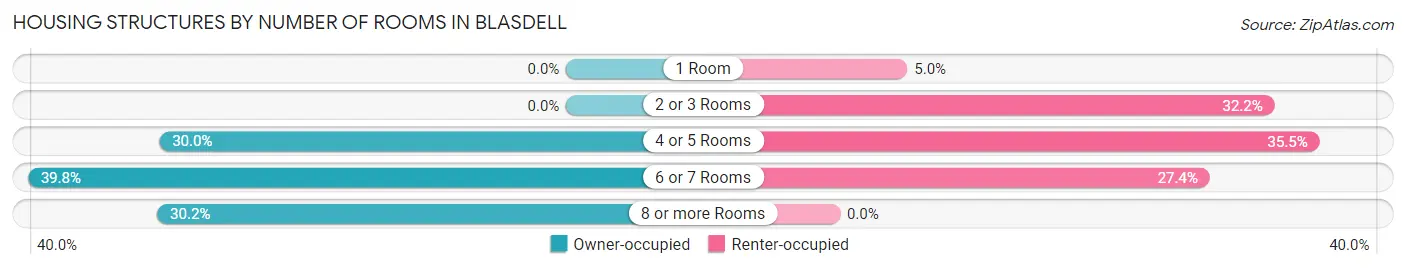
| Number of Rooms | Owner-occupied | Renter-occupied |
| 1 Room | 0 (0.0%) | 27 (5.0%) |
| 2 or 3 Rooms | 0 (0.0%) | 174 (32.2%) |
| 4 or 5 Rooms | 207 (30.0%) | 192 (35.5%) |
| 6 or 7 Rooms | 274 (39.8%) | 148 (27.4%) |
| 8 or more Rooms | 208 (30.2%) | 0 (0.0%) |
| Total | 689 (100.0%) | 541 (100.0%) |
Housing Structure by Heating Type in Blasdell
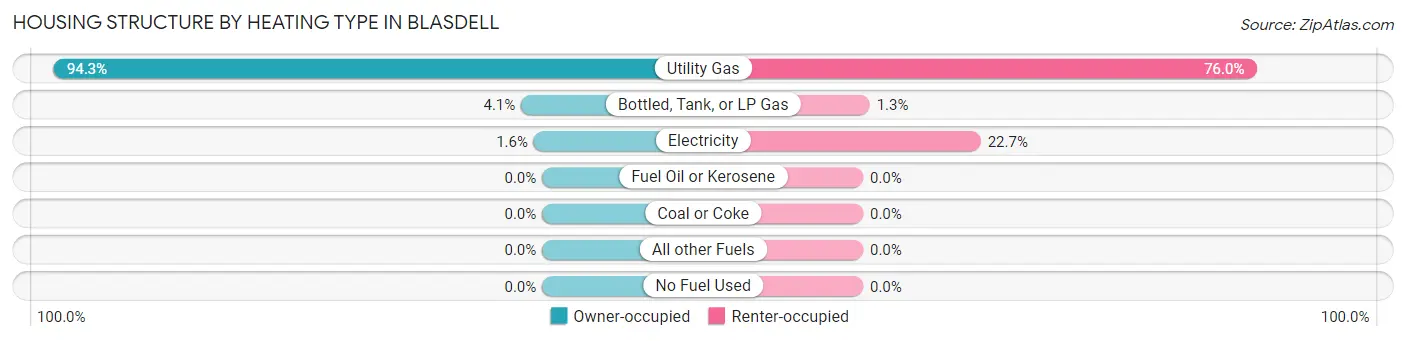
| Heating Type | Owner-occupied | Renter-occupied |
| Utility Gas | 650 (94.3%) | 411 (76.0%) |
| Bottled, Tank, or LP Gas | 28 (4.1%) | 7 (1.3%) |
| Electricity | 11 (1.6%) | 123 (22.7%) |
| Fuel Oil or Kerosene | 0 (0.0%) | 0 (0.0%) |
| Coal or Coke | 0 (0.0%) | 0 (0.0%) |
| All other Fuels | 0 (0.0%) | 0 (0.0%) |
| No Fuel Used | 0 (0.0%) | 0 (0.0%) |
| Total | 689 (100.0%) | 541 (100.0%) |
Household Vehicle Usage in Blasdell
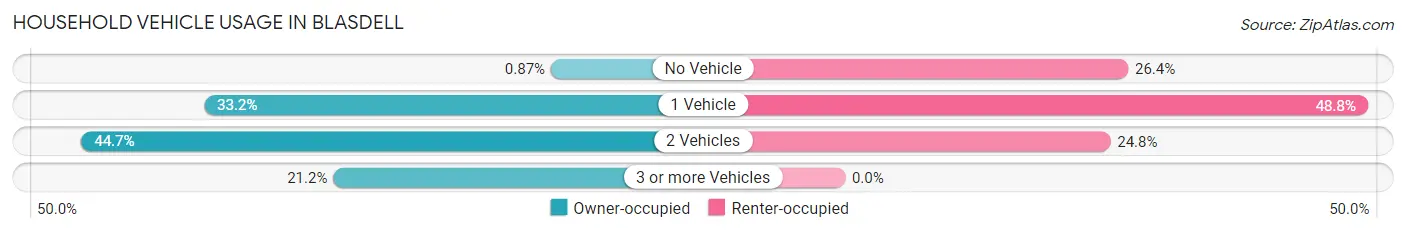
| Vehicles per Household | Owner-occupied | Renter-occupied |
| No Vehicle | 6 (0.9%) | 143 (26.4%) |
| 1 Vehicle | 229 (33.2%) | 264 (48.8%) |
| 2 Vehicles | 308 (44.7%) | 134 (24.8%) |
| 3 or more Vehicles | 146 (21.2%) | 0 (0.0%) |
| Total | 689 (100.0%) | 541 (100.0%) |
Real Estate & Mortgages in Blasdell
Real Estate and Mortgage Overview in Blasdell
| Characteristic | Without Mortgage | With Mortgage |
| Housing Units | 179 | 510 |
| Median Property Value | $135,900 | $152,400 |
| Median Household Income | $47,250 | $48 |
| Monthly Housing Costs | $559 | $0 |
| Real Estate Taxes | $3,825 | $11 |
Property Value by Mortgage Status in Blasdell
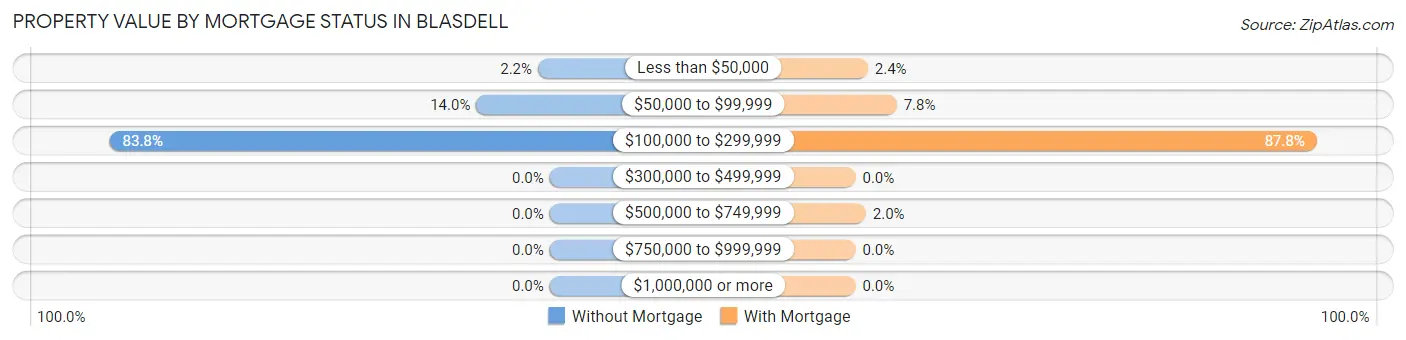
| Property Value | Without Mortgage | With Mortgage |
| Less than $50,000 | 4 (2.2%) | 12 (2.4%) |
| $50,000 to $99,999 | 25 (14.0%) | 40 (7.8%) |
| $100,000 to $299,999 | 150 (83.8%) | 448 (87.8%) |
| $300,000 to $499,999 | 0 (0.0%) | 0 (0.0%) |
| $500,000 to $749,999 | 0 (0.0%) | 10 (2.0%) |
| $750,000 to $999,999 | 0 (0.0%) | 0 (0.0%) |
| $1,000,000 or more | 0 (0.0%) | 0 (0.0%) |
| Total | 179 (100.0%) | 510 (100.0%) |
Household Income by Mortgage Status in Blasdell
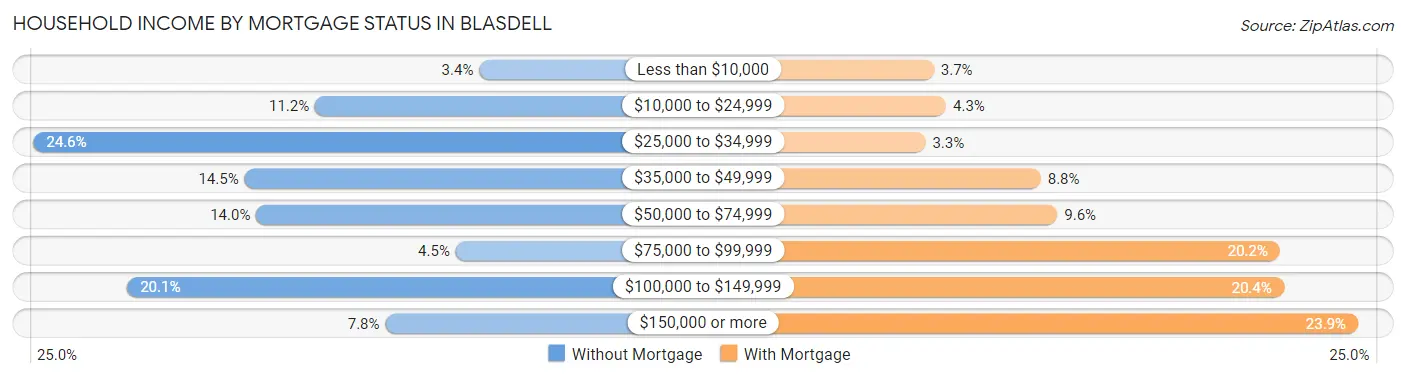
| Household Income | Without Mortgage | With Mortgage |
| Less than $10,000 | 6 (3.4%) | 19 (3.7%) |
| $10,000 to $24,999 | 20 (11.2%) | 22 (4.3%) |
| $25,000 to $34,999 | 44 (24.6%) | 17 (3.3%) |
| $35,000 to $49,999 | 26 (14.5%) | 45 (8.8%) |
| $50,000 to $74,999 | 25 (14.0%) | 49 (9.6%) |
| $75,000 to $99,999 | 8 (4.5%) | 103 (20.2%) |
| $100,000 to $149,999 | 36 (20.1%) | 104 (20.4%) |
| $150,000 or more | 14 (7.8%) | 122 (23.9%) |
| Total | 179 (100.0%) | 510 (100.0%) |
Property Value to Household Income Ratio in Blasdell
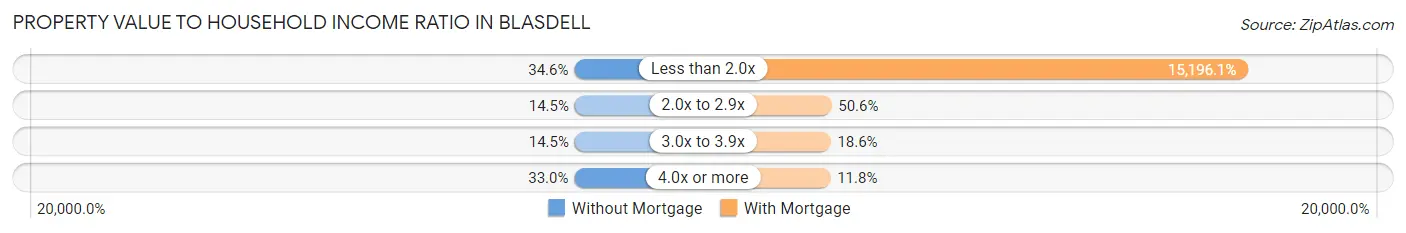
| Value-to-Income Ratio | Without Mortgage | With Mortgage |
| Less than 2.0x | 62 (34.6%) | 77,500 (15,196.1%) |
| 2.0x to 2.9x | 26 (14.5%) | 258 (50.6%) |
| 3.0x to 3.9x | 26 (14.5%) | 95 (18.6%) |
| 4.0x or more | 59 (33.0%) | 60 (11.8%) |
| Total | 179 (100.0%) | 510 (100.0%) |
Real Estate Taxes by Mortgage Status in Blasdell
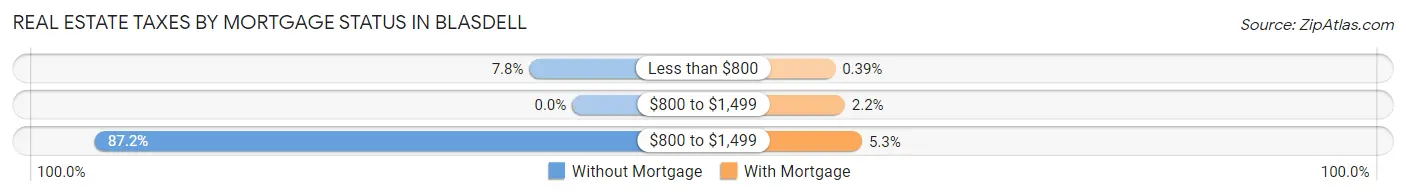
| Property Taxes | Without Mortgage | With Mortgage |
| Less than $800 | 14 (7.8%) | 2 (0.4%) |
| $800 to $1,499 | 0 (0.0%) | 11 (2.2%) |
| $800 to $1,499 | 156 (87.2%) | 27 (5.3%) |
| Total | 179 (100.0%) | 510 (100.0%) |
Health & Disability in Blasdell
Health Insurance Coverage by Age in Blasdell
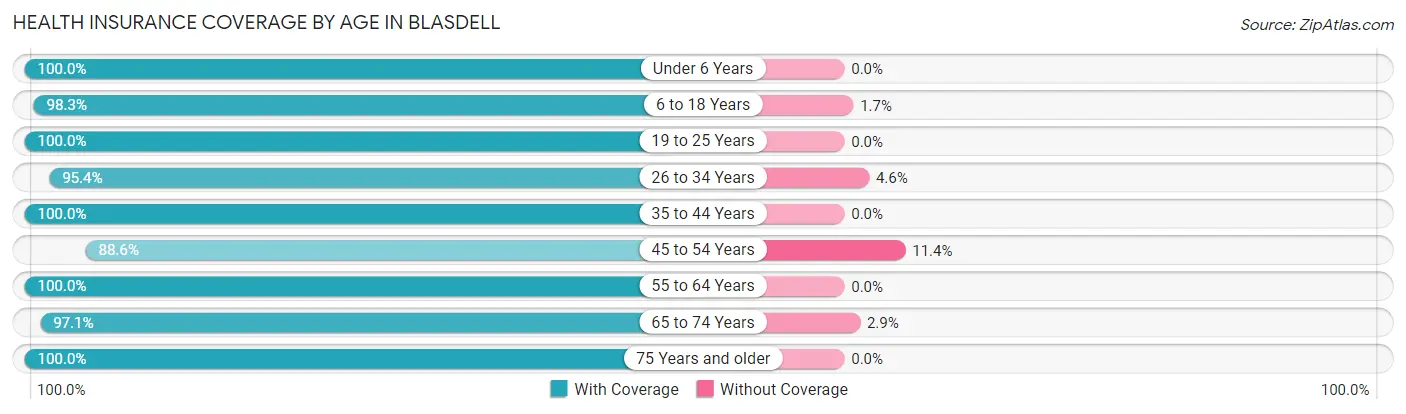
| Age Bracket | With Coverage | Without Coverage |
| Under 6 Years | 151 (100.0%) | 0 (0.0%) |
| 6 to 18 Years | 353 (98.3%) | 6 (1.7%) |
| 19 to 25 Years | 169 (100.0%) | 0 (0.0%) |
| 26 to 34 Years | 332 (95.4%) | 16 (4.6%) |
| 35 to 44 Years | 328 (100.0%) | 0 (0.0%) |
| 45 to 54 Years | 343 (88.6%) | 44 (11.4%) |
| 55 to 64 Years | 337 (100.0%) | 0 (0.0%) |
| 65 to 74 Years | 266 (97.1%) | 8 (2.9%) |
| 75 Years and older | 198 (100.0%) | 0 (0.0%) |
| Total | 2,477 (97.1%) | 74 (2.9%) |
Health Insurance Coverage by Citizenship Status in Blasdell
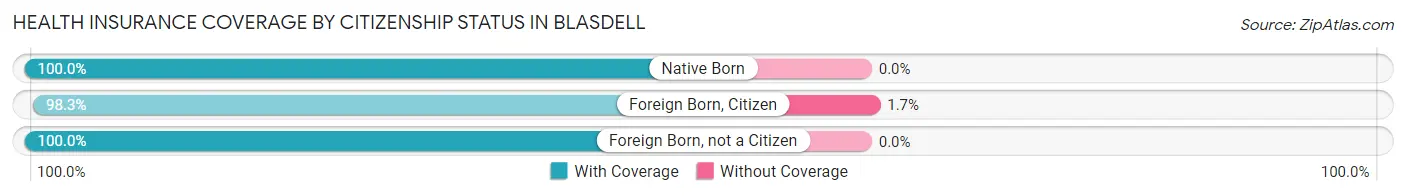
| Citizenship Status | With Coverage | Without Coverage |
| Native Born | 151 (100.0%) | 0 (0.0%) |
| Foreign Born, Citizen | 353 (98.3%) | 6 (1.7%) |
| Foreign Born, not a Citizen | 169 (100.0%) | 0 (0.0%) |
Health Insurance Coverage by Household Income in Blasdell
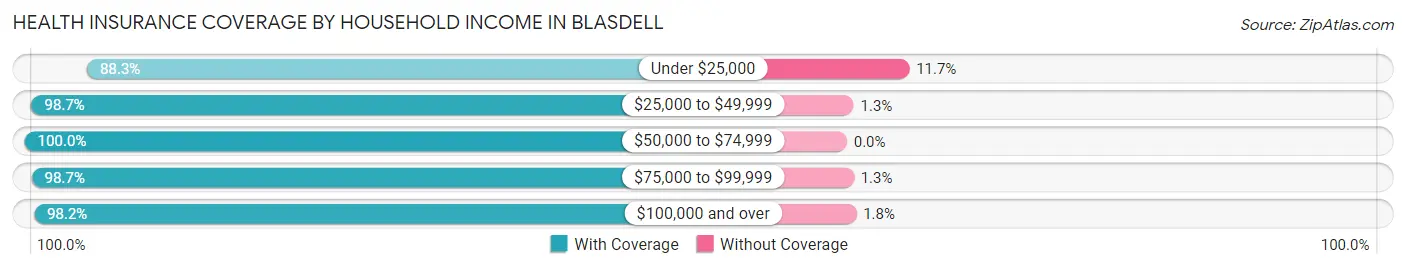
| Household Income | With Coverage | Without Coverage |
| Under $25,000 | 355 (88.3%) | 47 (11.7%) |
| $25,000 to $49,999 | 386 (98.7%) | 5 (1.3%) |
| $50,000 to $74,999 | 398 (100.0%) | 0 (0.0%) |
| $75,000 to $99,999 | 380 (98.7%) | 5 (1.3%) |
| $100,000 and over | 949 (98.2%) | 17 (1.8%) |
Public vs Private Health Insurance Coverage by Age in Blasdell
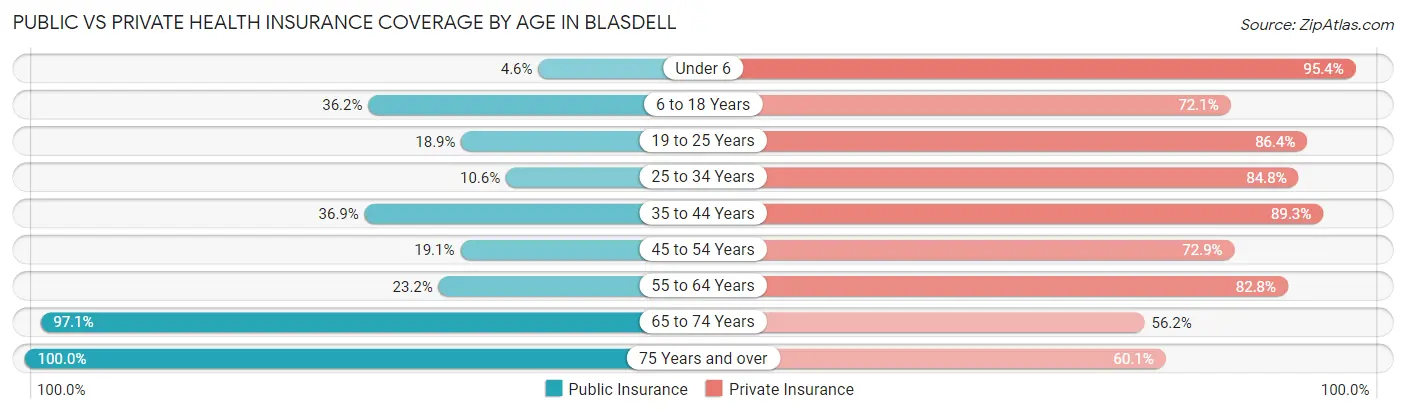
| Age Bracket | Public Insurance | Private Insurance |
| Under 6 | 7 (4.6%) | 144 (95.4%) |
| 6 to 18 Years | 130 (36.2%) | 259 (72.1%) |
| 19 to 25 Years | 32 (18.9%) | 146 (86.4%) |
| 25 to 34 Years | 37 (10.6%) | 295 (84.8%) |
| 35 to 44 Years | 121 (36.9%) | 293 (89.3%) |
| 45 to 54 Years | 74 (19.1%) | 282 (72.9%) |
| 55 to 64 Years | 78 (23.2%) | 279 (82.8%) |
| 65 to 74 Years | 266 (97.1%) | 154 (56.2%) |
| 75 Years and over | 198 (100.0%) | 119 (60.1%) |
| Total | 943 (37.0%) | 1,971 (77.3%) |
Disability Status by Sex by Age in Blasdell
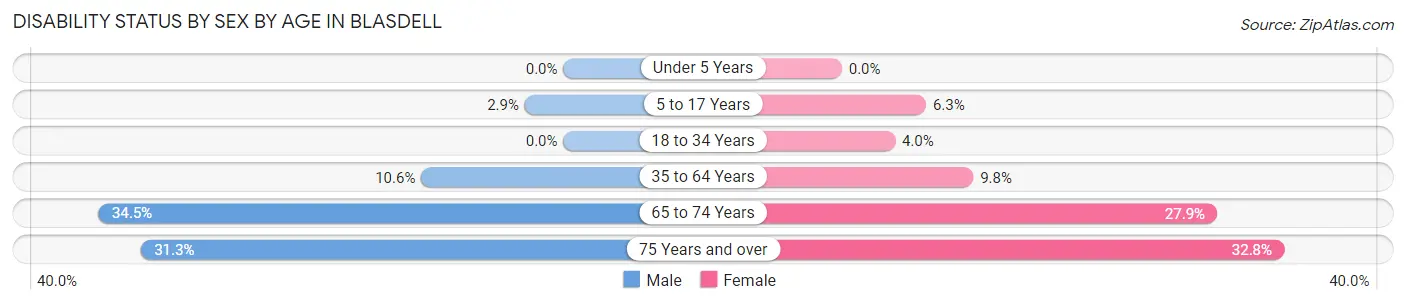
| Age Bracket | Male | Female |
| Under 5 Years | 0 (0.0%) | 0 (0.0%) |
| 5 to 17 Years | 5 (2.9%) | 11 (6.2%) |
| 18 to 34 Years | 0 (0.0%) | 9 (4.0%) |
| 35 to 64 Years | 58 (10.5%) | 49 (9.8%) |
| 65 to 74 Years | 40 (34.5%) | 44 (27.9%) |
| 75 Years and over | 21 (31.3%) | 43 (32.8%) |
Disability Class by Sex by Age in Blasdell
Disability Class: Hearing Difficulty
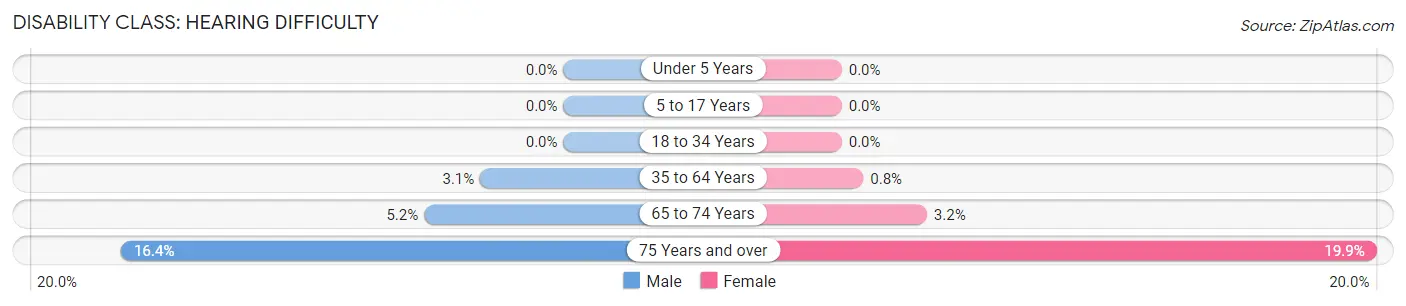
| Age Bracket | Male | Female |
| Under 5 Years | 0 (0.0%) | 0 (0.0%) |
| 5 to 17 Years | 0 (0.0%) | 0 (0.0%) |
| 18 to 34 Years | 0 (0.0%) | 0 (0.0%) |
| 35 to 64 Years | 17 (3.1%) | 4 (0.8%) |
| 65 to 74 Years | 6 (5.2%) | 5 (3.2%) |
| 75 Years and over | 11 (16.4%) | 26 (19.9%) |
Disability Class: Vision Difficulty
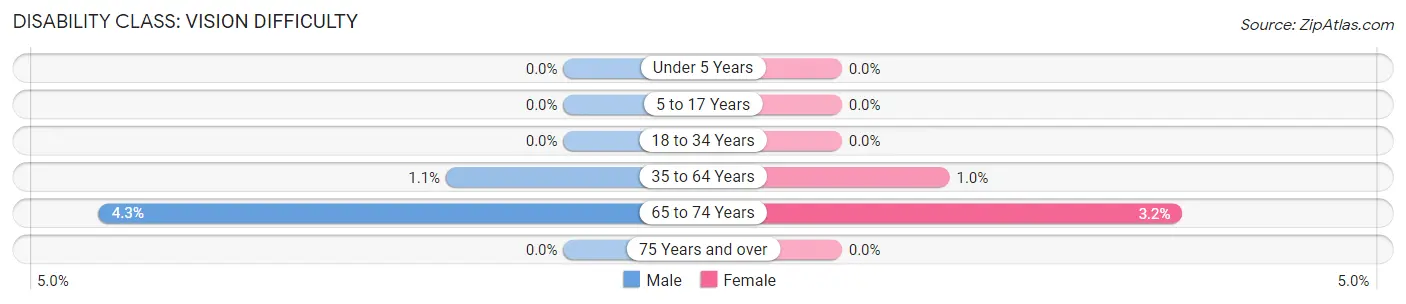
| Age Bracket | Male | Female |
| Under 5 Years | 0 (0.0%) | 0 (0.0%) |
| 5 to 17 Years | 0 (0.0%) | 0 (0.0%) |
| 18 to 34 Years | 0 (0.0%) | 0 (0.0%) |
| 35 to 64 Years | 6 (1.1%) | 5 (1.0%) |
| 65 to 74 Years | 5 (4.3%) | 5 (3.2%) |
| 75 Years and over | 0 (0.0%) | 0 (0.0%) |
Disability Class: Cognitive Difficulty
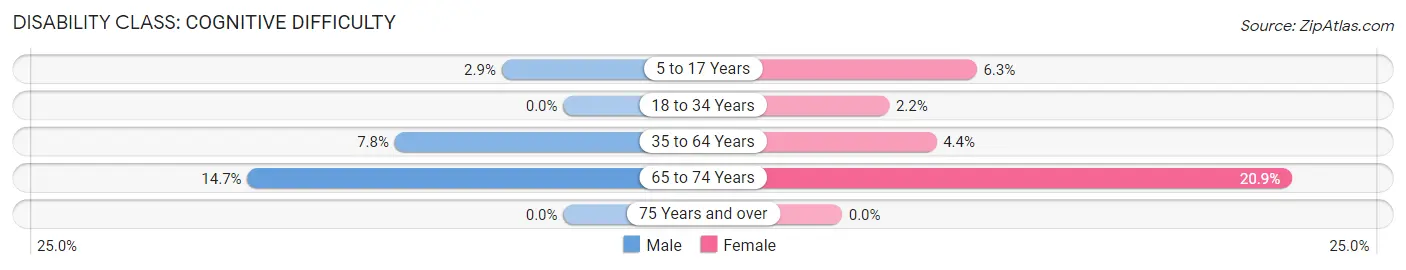
| Age Bracket | Male | Female |
| 5 to 17 Years | 5 (2.9%) | 11 (6.2%) |
| 18 to 34 Years | 0 (0.0%) | 5 (2.2%) |
| 35 to 64 Years | 43 (7.8%) | 22 (4.4%) |
| 65 to 74 Years | 17 (14.7%) | 33 (20.9%) |
| 75 Years and over | 0 (0.0%) | 0 (0.0%) |
Disability Class: Ambulatory Difficulty
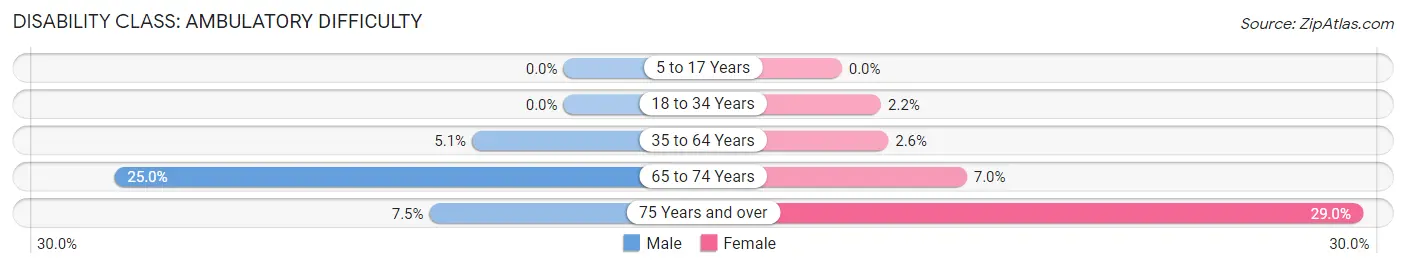
| Age Bracket | Male | Female |
| 5 to 17 Years | 0 (0.0%) | 0 (0.0%) |
| 18 to 34 Years | 0 (0.0%) | 5 (2.2%) |
| 35 to 64 Years | 28 (5.1%) | 13 (2.6%) |
| 65 to 74 Years | 29 (25.0%) | 11 (7.0%) |
| 75 Years and over | 5 (7.5%) | 38 (29.0%) |
Disability Class: Self-Care Difficulty
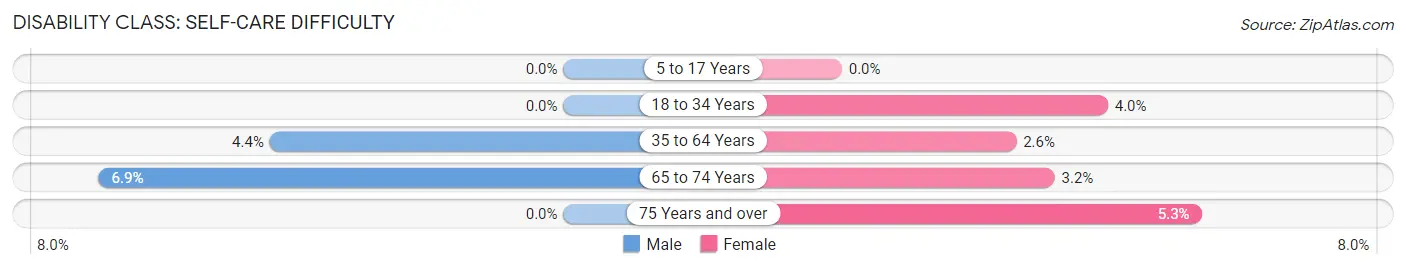
| Age Bracket | Male | Female |
| 5 to 17 Years | 0 (0.0%) | 0 (0.0%) |
| 18 to 34 Years | 0 (0.0%) | 9 (4.0%) |
| 35 to 64 Years | 24 (4.4%) | 13 (2.6%) |
| 65 to 74 Years | 8 (6.9%) | 5 (3.2%) |
| 75 Years and over | 0 (0.0%) | 7 (5.3%) |
Technology Access in Blasdell
Computing Device Access in Blasdell
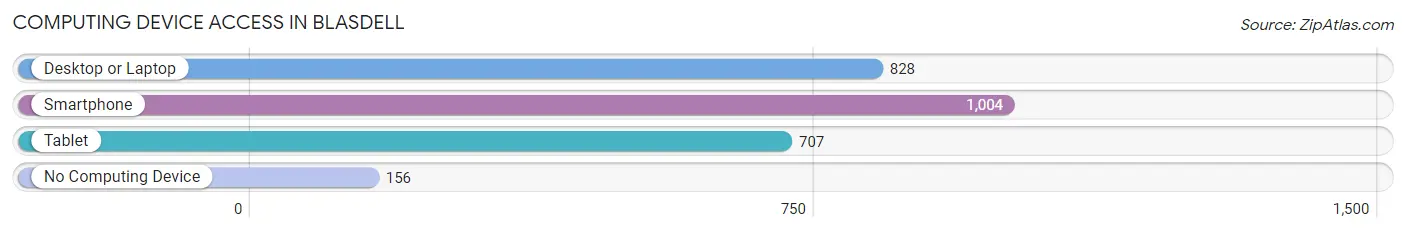
| Device Type | # Households | % Households |
| Desktop or Laptop | 828 | 67.3% |
| Smartphone | 1,004 | 81.6% |
| Tablet | 707 | 57.5% |
| No Computing Device | 156 | 12.7% |
| Total | 1,230 | 100.0% |
Internet Access in Blasdell
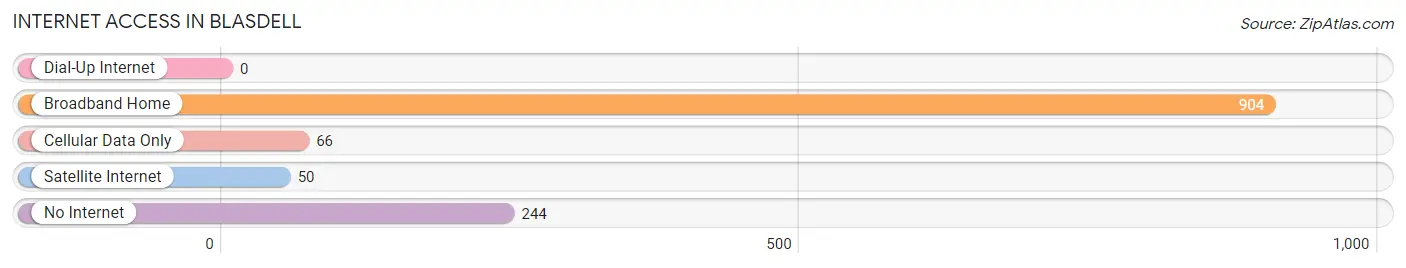
| Internet Type | # Households | % Households |
| Dial-Up Internet | 0 | 0.0% |
| Broadband Home | 904 | 73.5% |
| Cellular Data Only | 66 | 5.4% |
| Satellite Internet | 50 | 4.1% |
| No Internet | 244 | 19.8% |
| Total | 1,230 | 100.0% |
Blasdell Summary
Blasdell is a village located in the town of Hamburg in Erie County, New York, United States. The population was 2,959 at the 2010 census. It is part of the Buffalo–Niagara Falls Metropolitan Statistical Area.
History
The area that is now Blasdell was first settled in 1804 by a man named John Blasdell. He was a veteran of the Revolutionary War and was granted a land patent from the Holland Land Company. He built a log cabin and cleared the land for farming. The area was known as Blasdell’s Corners until 1851 when it was officially incorporated as the village of Blasdell.
The village grew slowly but steadily over the next few decades. In 1876, the first post office was established and the first school was built in 1878. The village was connected to the outside world by the Buffalo and Lake Erie Railroad in 1881.
In the early 20th century, Blasdell began to experience rapid growth. The village was annexed by the town of Hamburg in 1921 and the population had grown to 1,000 by 1930. The village continued to grow throughout the mid-20th century and by the 1970s, the population had reached 4,000.
Geography
Blasdell is located at 42°46′N 78°48′W (42.76, -78.80). According to the United States Census Bureau, the village has a total area of 1.2 square miles (3.1 km2), all of it land.
The village is located on the south shore of Lake Erie, just east of the city of Buffalo. It is bordered to the north by the town of Hamburg and to the south by the village of Lackawanna.
Economy
The economy of Blasdell is largely based on retail and services. The village is home to several small businesses, including restaurants, convenience stores, and auto repair shops. The village also has a small industrial park, which is home to several manufacturing companies.
The village is also home to a large shopping center, the Southtowns Plaza, which is anchored by a Walmart Supercenter. The plaza also includes several other stores and restaurants.
Demographics
As of the census of 2010, there were 2,959 people, 1,220 households, and 790 families residing in the village. The population density was 2,457.5 people per square mile (948.2/km2). There were 1,320 housing units at an average density of 1,093.3 per square mile (422.3/km2). The racial makeup of the village was 97.2% White, 0.7% African American, 0.2% Native American, 0.7% Asian, 0.1% Pacific Islander, 0.3% from other races, and 0.9% from two or more races. Hispanic or Latino of any race were 1.7% of the population.
There were 1,220 households, out of which 28.2% had children under the age of 18 living with them, 46.2% were married couples living together, 12.3% had a female householder with no husband present, and 36.2% were non-families. 30.2% of all households were made up of individuals, and 11.2% had someone living alone who was 65 years of age or older. The average household size was 2.43 and the average family size was 3.03.
In the village, the population was spread out, with 23.2% under the age of 18, 7.2% from 18 to 24, 28.7% from 25 to 44, 25.2% from 45 to 64, and 15.7% who were 65 years of age or older. The median age was 39 years. For every 100 females, there were 92.2 males. For every 100 females age 18 and over, there were 88.7 males.
The median income for a household in the village was $41,964, and the median income for a family was $50,938. Males had a median income of $37,917 versus $27,917 for females. The per capita income for the village was $20,945. About 5.2% of families and 7.2% of the population were below the poverty line, including 8.3% of those under age 18 and 6.2% of those age 65 or over.
Common Questions
What is Per Capita Income in Blasdell?
Per Capita income in Blasdell is $33,062.
What is the Median Family Income in Blasdell?
Median Family Income in Blasdell is $76,382.
What is the Median Household income in Blasdell?
Median Household Income in Blasdell is $58,611.
What is Income or Wage Gap in Blasdell?
Income or Wage Gap in Blasdell is 17.1%.
Women in Blasdell earn 82.9 cents for every dollar earned by a man.
What is Inequality or Gini Index in Blasdell?
Inequality or Gini Index in Blasdell is 0.40.
What is the Total Population of Blasdell?
Total Population of Blasdell is 2,551.
What is the Total Male Population of Blasdell?
Total Male Population of Blasdell is 1,263.
What is the Total Female Population of Blasdell?
Total Female Population of Blasdell is 1,288.
What is the Ratio of Males per 100 Females in Blasdell?
There are 98.06 Males per 100 Females in Blasdell.
What is the Ratio of Females per 100 Males in Blasdell?
There are 101.98 Females per 100 Males in Blasdell.
What is the Median Population Age in Blasdell?
Median Population Age in Blasdell is 44.2 Years.
What is the Average Family Size in Blasdell
Average Family Size in Blasdell is 2.9 People.
What is the Average Household Size in Blasdell
Average Household Size in Blasdell is 2.1 People.
How Large is the Labor Force in Blasdell?
There are 1,492 People in the Labor Forcein in Blasdell.
What is the Percentage of People in the Labor Force in Blasdell?
70.5% of People are in the Labor Force in Blasdell.
What is the Unemployment Rate in Blasdell?
Unemployment Rate in Blasdell is 11.9%.