East Patchogue, NY Map & Demographics
East Patchogue Map
East Patchogue Overview
$46,241
PER CAPITA INCOME
$127,054
AVG FAMILY INCOME
$105,208
AVG HOUSEHOLD INCOME
37.9%
WAGE / INCOME GAP [ % ]
62.1¢/ $1
WAGE / INCOME GAP [ $ ]
0.41
INEQUALITY / GINI INDEX
21,449
TOTAL POPULATION
9,960
MALE POPULATION
11,489
FEMALE POPULATION
86.69
MALES / 100 FEMALES
115.35
FEMALES / 100 MALES
42.2
MEDIAN AGE
3.4
AVG FAMILY SIZE
2.6
AVG HOUSEHOLD SIZE
12,195
LABOR FORCE [ PEOPLE ]
67.9%
PERCENT IN LABOR FORCE
4.7%
UNEMPLOYMENT RATE
East Patchogue Area Codes
Income in East Patchogue
Income Overview in East Patchogue
Per Capita Income in East Patchogue is $46,241, while median incomes of families and households are $127,054 and $105,208 respectively.
| Characteristic | Number | Measure |
| Per Capita Income | 21,449 | $46,241 |
| Median Family Income | 4,998 | $127,054 |
| Mean Family Income | 4,998 | $145,221 |
| Median Household Income | 8,011 | $105,208 |
| Mean Household Income | 8,011 | $119,354 |
| Income Deficit | 4,998 | $0 |
| Wage / Income Gap (%) | 21,449 | 37.91% |
| Wage / Income Gap ($) | 21,449 | 62.09¢ per $1 |
| Gini / Inequality Index | 21,449 | 0.41 |
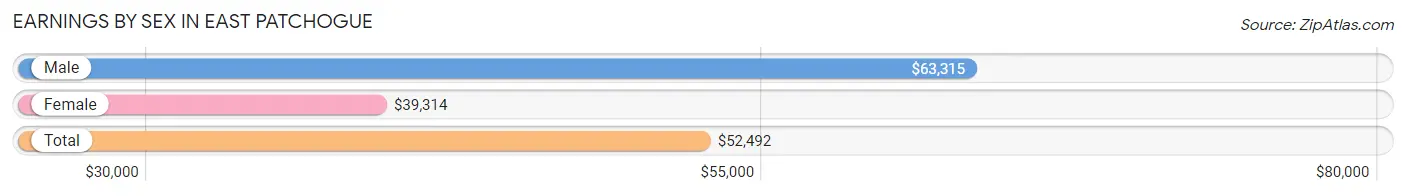
Earnings by Sex in East Patchogue
Average Earnings in East Patchogue are $52,492, $63,315 for men and $39,314 for women, a difference of 37.9%.
| Sex | Number | Average Earnings |
| Male | 6,377 (51.6%) | $63,315 |
| Female | 5,990 (48.4%) | $39,314 |
| Total | 12,367 (100.0%) | $52,492 |
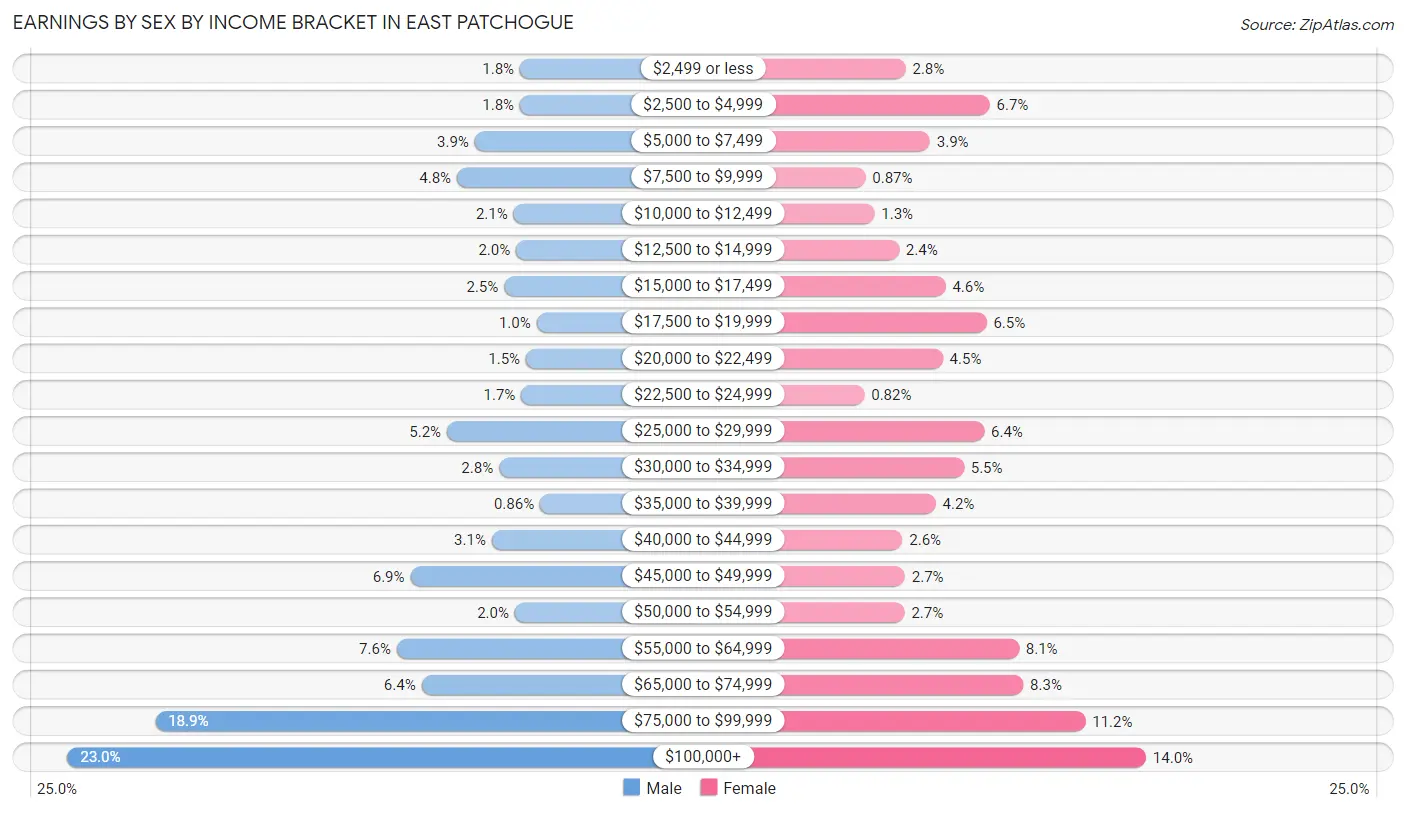
Earnings by Sex by Income Bracket in East Patchogue
The most common earnings brackets in East Patchogue are $100,000+ for men (1,467 | 23.0%) and $100,000+ for women (839 | 14.0%).
| Income | Male | Female |
| $2,499 or less | 115 (1.8%) | 165 (2.8%) |
| $2,500 to $4,999 | 115 (1.8%) | 401 (6.7%) |
| $5,000 to $7,499 | 250 (3.9%) | 233 (3.9%) |
| $7,500 to $9,999 | 303 (4.8%) | 52 (0.9%) |
| $10,000 to $12,499 | 134 (2.1%) | 77 (1.3%) |
| $12,500 to $14,999 | 126 (2.0%) | 146 (2.4%) |
| $15,000 to $17,499 | 162 (2.5%) | 277 (4.6%) |
| $17,500 to $19,999 | 65 (1.0%) | 392 (6.5%) |
| $20,000 to $22,499 | 97 (1.5%) | 269 (4.5%) |
| $22,500 to $24,999 | 111 (1.7%) | 49 (0.8%) |
| $25,000 to $29,999 | 333 (5.2%) | 385 (6.4%) |
| $30,000 to $34,999 | 177 (2.8%) | 328 (5.5%) |
| $35,000 to $39,999 | 55 (0.9%) | 249 (4.2%) |
| $40,000 to $44,999 | 199 (3.1%) | 156 (2.6%) |
| $45,000 to $49,999 | 442 (6.9%) | 163 (2.7%) |
| $50,000 to $54,999 | 130 (2.0%) | 162 (2.7%) |
| $55,000 to $64,999 | 483 (7.6%) | 483 (8.1%) |
| $65,000 to $74,999 | 409 (6.4%) | 495 (8.3%) |
| $75,000 to $99,999 | 1,204 (18.9%) | 669 (11.2%) |
| $100,000+ | 1,467 (23.0%) | 839 (14.0%) |
| Total | 6,377 (100.0%) | 5,990 (100.0%) |
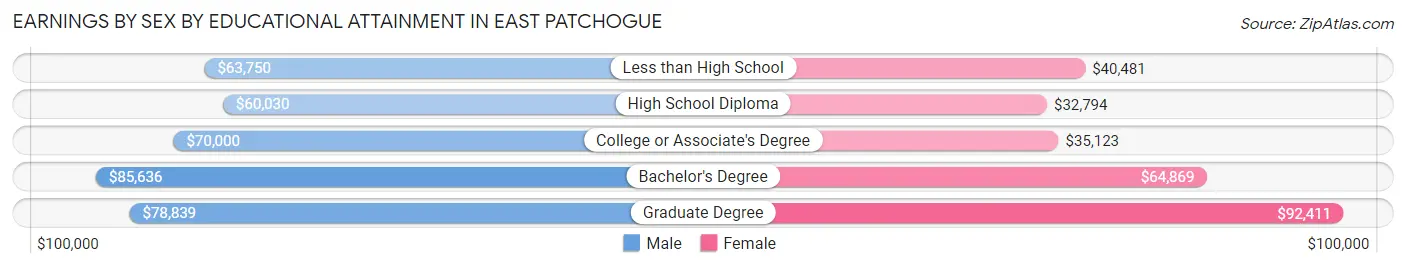
Earnings by Sex by Educational Attainment in East Patchogue
Average earnings in East Patchogue are $69,071 for men and $52,243 for women, a difference of 24.4%. Men with an educational attainment of bachelor's degree enjoy the highest average annual earnings of $85,636, while those with high school diploma education earn the least with $60,030. Women with an educational attainment of graduate degree earn the most with the average annual earnings of $92,411, while those with high school diploma education have the smallest earnings of $32,794.
| Educational Attainment | Male Income | Female Income |
| Less than High School | $63,750 | $40,481 |
| High School Diploma | $60,030 | $32,794 |
| College or Associate's Degree | $70,000 | $35,123 |
| Bachelor's Degree | $85,636 | $64,869 |
| Graduate Degree | $78,839 | $92,411 |
| Total | $69,071 | $52,243 |
Family Income in East Patchogue
Family Income Brackets in East Patchogue
According to the East Patchogue family income data, there are 1,624 families falling into the $100,000 to $149,999 income range, which is the most common income bracket and makes up 32.5% of all families.
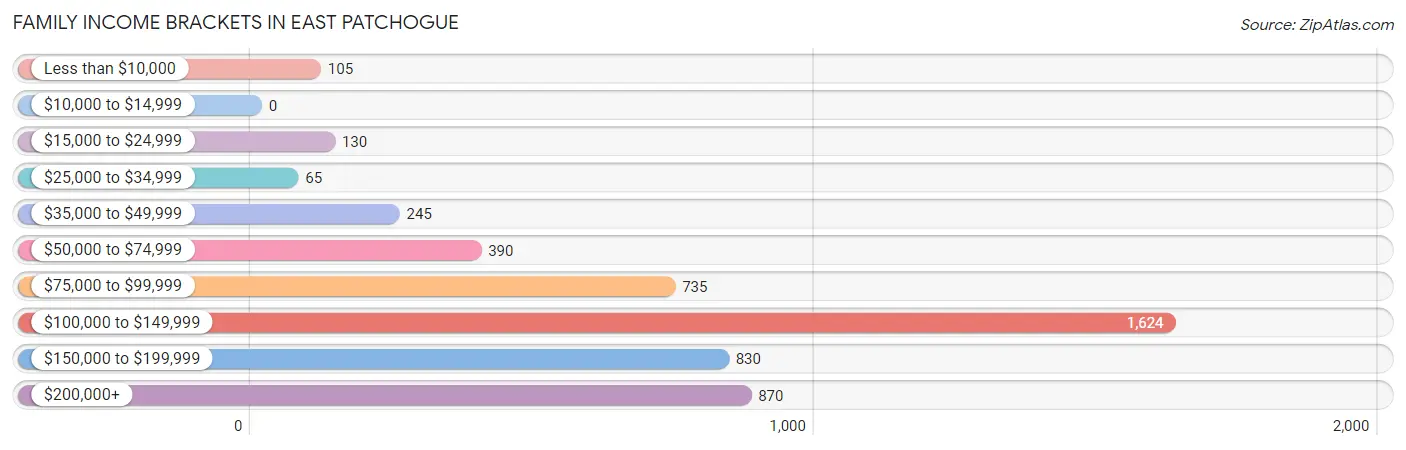
| Income Bracket | # Families | % Families |
| Less than $10,000 | 105 | 2.1% |
| $10,000 to $14,999 | 0 | 0.0% |
| $15,000 to $24,999 | 130 | 2.6% |
| $25,000 to $34,999 | 65 | 1.3% |
| $35,000 to $49,999 | 245 | 4.9% |
| $50,000 to $74,999 | 390 | 7.8% |
| $75,000 to $99,999 | 735 | 14.7% |
| $100,000 to $149,999 | 1,624 | 32.5% |
| $150,000 to $199,999 | 830 | 16.6% |
| $200,000+ | 870 | 17.4% |
Family Income by Famaliy Size in East Patchogue
7+ person families (63 | 1.3%) account for the highest median family income in East Patchogue with $250,001 per family, while 2-person families (1,950 | 39.0%) have the highest median income of $53,949 per family member.
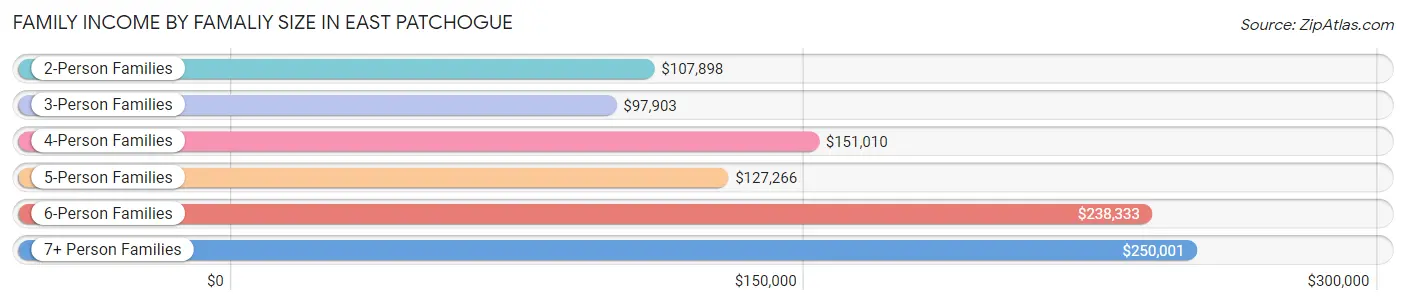
| Income Bracket | # Families | Median Income |
| 2-Person Families | 1,950 (39.0%) | $107,898 |
| 3-Person Families | 998 (20.0%) | $97,903 |
| 4-Person Families | 1,350 (27.0%) | $151,010 |
| 5-Person Families | 549 (11.0%) | $127,266 |
| 6-Person Families | 88 (1.8%) | $238,333 |
| 7+ Person Families | 63 (1.3%) | $250,001 |
| Total | 4,998 (100.0%) | $127,054 |
Family Income by Number of Earners in East Patchogue
The median family income in East Patchogue is $127,054, with families comprising 3+ earners (1,042) having the highest median family income of $178,167, while families with 1 earner (1,306) have the lowest median family income of $92,869, accounting for 20.8% and 26.1% of families, respectively.
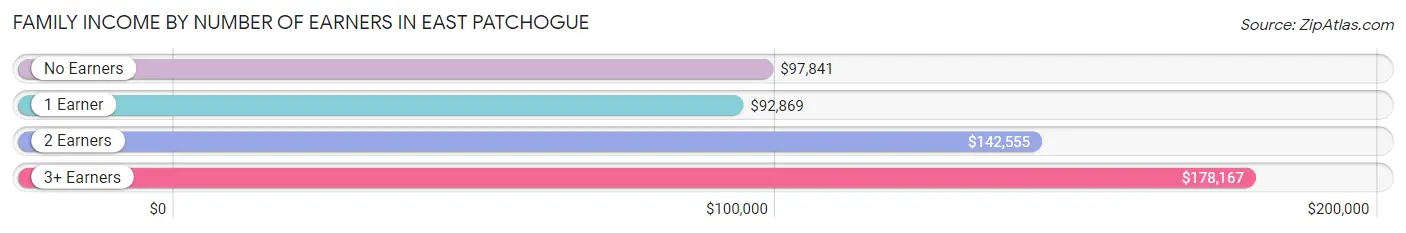
| Number of Earners | # Families | Median Income |
| No Earners | 493 (9.9%) | $97,841 |
| 1 Earner | 1,306 (26.1%) | $92,869 |
| 2 Earners | 2,157 (43.2%) | $142,555 |
| 3+ Earners | 1,042 (20.8%) | $178,167 |
| Total | 4,998 (100.0%) | $127,054 |
Household Income in East Patchogue
Household Income Brackets in East Patchogue
With 2,123 households falling in the category, the $100,000 to $149,999 income range is the most frequent in East Patchogue, accounting for 26.5% of all households. In contrast, only 160 households (2.0%) fall into the $10,000 to $14,999 income bracket, making it the least populous group.
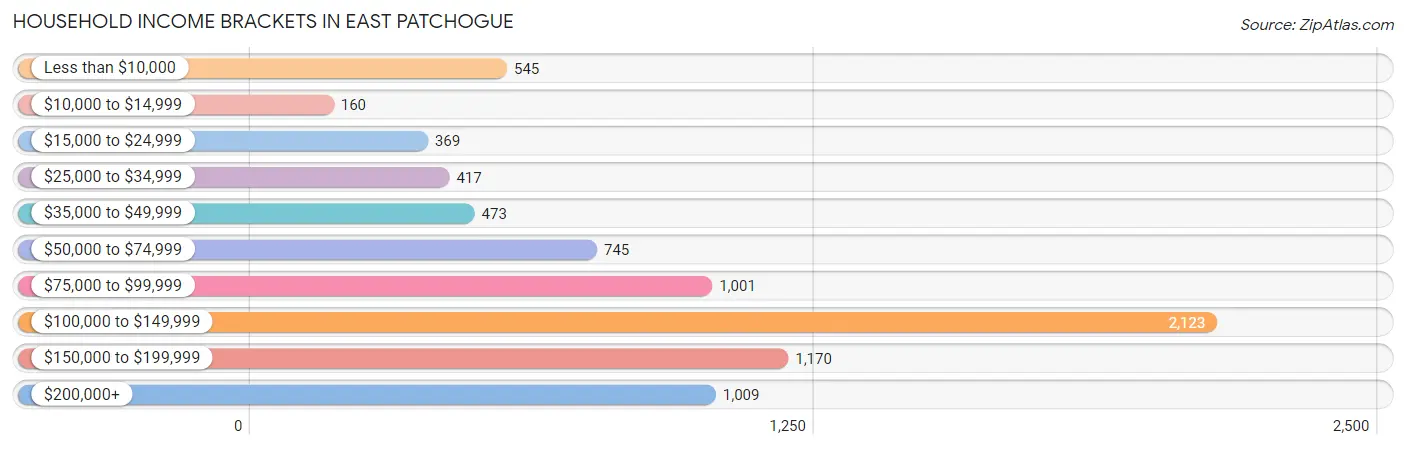
| Income Bracket | # Households | % Households |
| Less than $10,000 | 545 | 6.8% |
| $10,000 to $14,999 | 160 | 2.0% |
| $15,000 to $24,999 | 369 | 4.6% |
| $25,000 to $34,999 | 417 | 5.2% |
| $35,000 to $49,999 | 473 | 5.9% |
| $50,000 to $74,999 | 745 | 9.3% |
| $75,000 to $99,999 | 1,001 | 12.5% |
| $100,000 to $149,999 | 2,123 | 26.5% |
| $150,000 to $199,999 | 1,170 | 14.6% |
| $200,000+ | 1,009 | 12.6% |
Household Income by Householder Age in East Patchogue
The median household income in East Patchogue is $105,208, with the highest median household income of $127,487 found in the 25 to 44 years age bracket for the primary householder. A total of 1,969 households (24.6%) fall into this category.
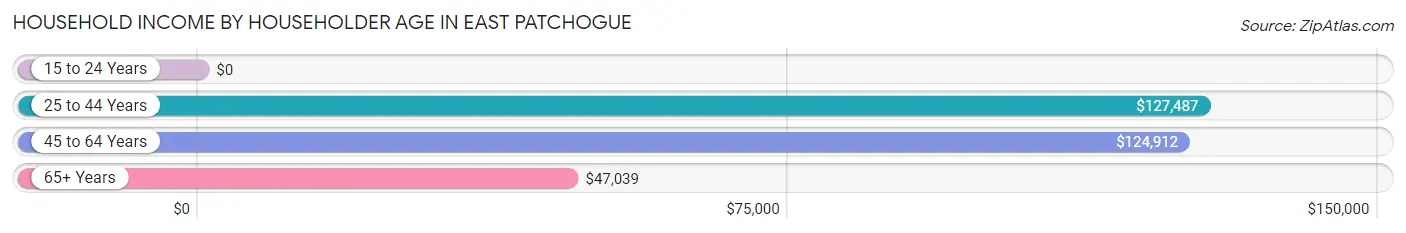
| Income Bracket | # Households | Median Income |
| 15 to 24 Years | 0 (0.0%) | $0 |
| 25 to 44 Years | 1,969 (24.6%) | $127,487 |
| 45 to 64 Years | 3,279 (40.9%) | $124,912 |
| 65+ Years | 2,763 (34.5%) | $47,039 |
| Total | 8,011 (100.0%) | $105,208 |
Poverty in East Patchogue
Income Below Poverty by Sex and Age in East Patchogue
With 3.4% poverty level for males and 9.6% for females among the residents of East Patchogue, under 5 year old males and 75 year old and over females are the most vulnerable to poverty, with 63 males (16.3%) and 355 females (32.8%) in their respective age groups living below the poverty level.
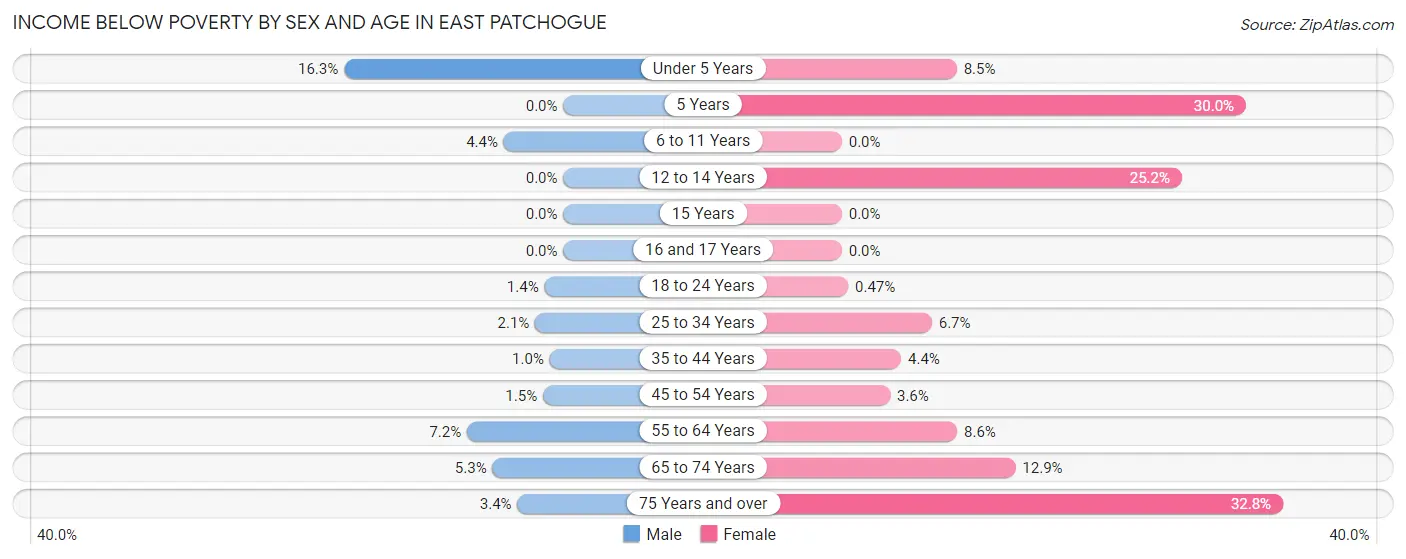
| Age Bracket | Male | Female |
| Under 5 Years | 63 (16.3%) | 54 (8.5%) |
| 5 Years | 0 (0.0%) | 60 (30.0%) |
| 6 to 11 Years | 21 (4.4%) | 0 (0.0%) |
| 12 to 14 Years | 0 (0.0%) | 105 (25.2%) |
| 15 Years | 0 (0.0%) | 0 (0.0%) |
| 16 and 17 Years | 0 (0.0%) | 0 (0.0%) |
| 18 to 24 Years | 13 (1.4%) | 4 (0.5%) |
| 25 to 34 Years | 29 (2.1%) | 93 (6.7%) |
| 35 to 44 Years | 13 (1.0%) | 67 (4.4%) |
| 45 to 54 Years | 26 (1.5%) | 52 (3.6%) |
| 55 to 64 Years | 105 (7.1%) | 118 (8.6%) |
| 65 to 74 Years | 44 (5.3%) | 176 (12.9%) |
| 75 Years and over | 20 (3.4%) | 355 (32.8%) |
| Total | 334 (3.4%) | 1,084 (9.6%) |
Income Above Poverty by Sex and Age in East Patchogue
According to the poverty statistics in East Patchogue, males aged 5 years and females aged 6 to 11 years are the age groups that are most secure financially, with 100.0% of males and 100.0% of females in these age groups living above the poverty line.
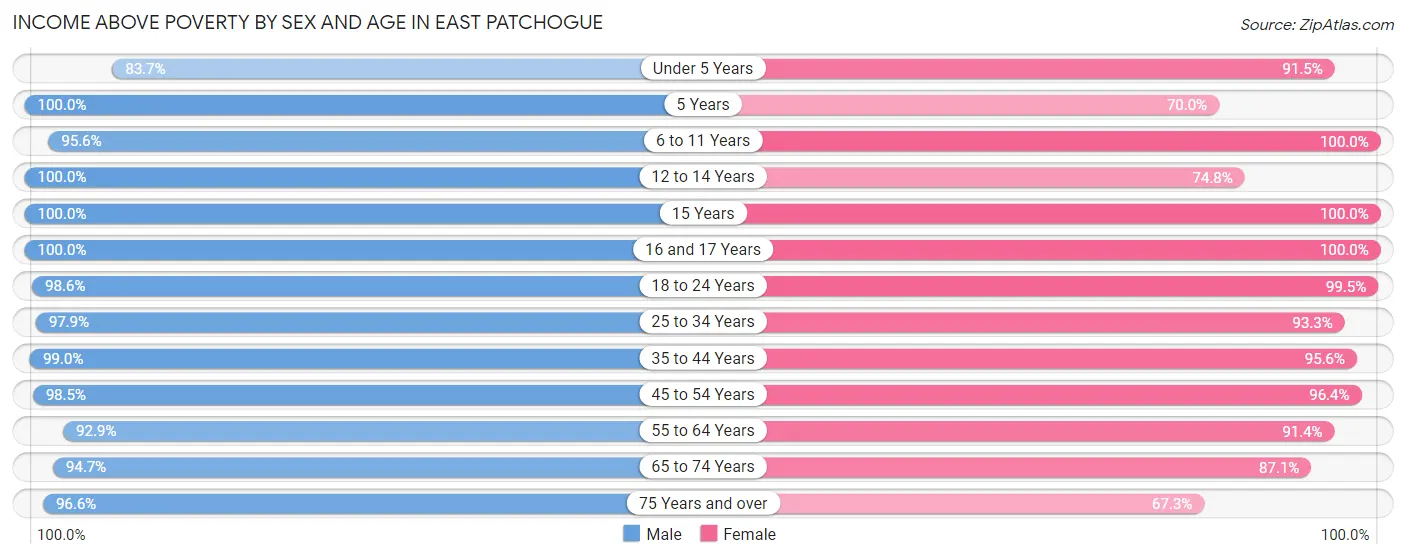
| Age Bracket | Male | Female |
| Under 5 Years | 324 (83.7%) | 579 (91.5%) |
| 5 Years | 107 (100.0%) | 140 (70.0%) |
| 6 to 11 Years | 454 (95.6%) | 412 (100.0%) |
| 12 to 14 Years | 410 (100.0%) | 311 (74.8%) |
| 15 Years | 81 (100.0%) | 341 (100.0%) |
| 16 and 17 Years | 227 (100.0%) | 275 (100.0%) |
| 18 to 24 Years | 914 (98.6%) | 849 (99.5%) |
| 25 to 34 Years | 1,358 (97.9%) | 1,300 (93.3%) |
| 35 to 44 Years | 1,274 (99.0%) | 1,457 (95.6%) |
| 45 to 54 Years | 1,693 (98.5%) | 1,400 (96.4%) |
| 55 to 64 Years | 1,363 (92.8%) | 1,261 (91.4%) |
| 65 to 74 Years | 792 (94.7%) | 1,189 (87.1%) |
| 75 Years and over | 567 (96.6%) | 729 (67.2%) |
| Total | 9,564 (96.6%) | 10,243 (90.4%) |
Income Below Poverty Among Married-Couple Families in East Patchogue
The poverty statistics for married-couple families in East Patchogue show that 1.8% or 68 of the total 3,724 families live below the poverty line. Families with 1 or 2 children have the highest poverty rate of 3.3%, comprising of 50 families. On the other hand, families with 3 or 4 children have the lowest poverty rate of 0.0%, which includes 0 families.
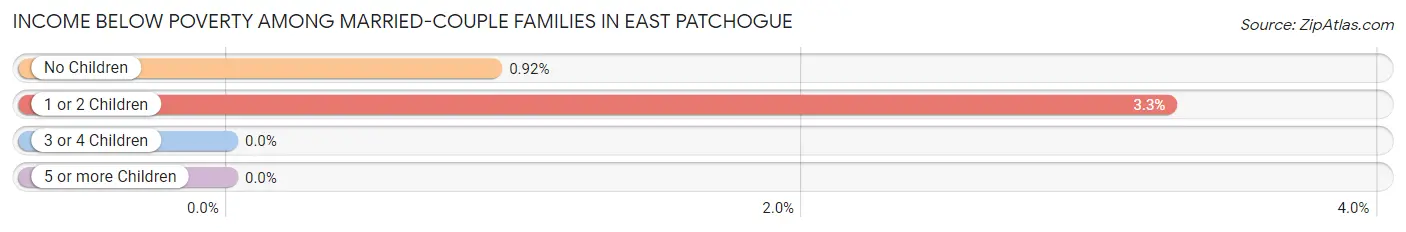
| Children | Above Poverty | Below Poverty |
| No Children | 1,945 (99.1%) | 18 (0.9%) |
| 1 or 2 Children | 1,481 (96.7%) | 50 (3.3%) |
| 3 or 4 Children | 230 (100.0%) | 0 (0.0%) |
| 5 or more Children | 0 (0.0%) | 0 (0.0%) |
| Total | 3,656 (98.2%) | 68 (1.8%) |
Income Below Poverty Among Single-Parent Households in East Patchogue
According to the poverty data in East Patchogue, 1.9% or 5 single-father households and 13.8% or 140 single-mother households are living below the poverty line. Among single-father households, those with 1 or 2 children have the highest poverty rate, with 5 households (11.4%) experiencing poverty. Likewise, among single-mother households, those with 1 or 2 children have the highest poverty rate, with 70 households (18.6%) falling below the poverty line.
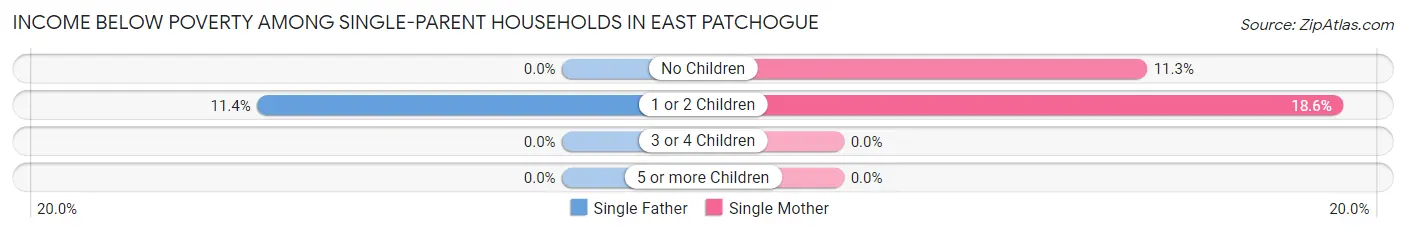
| Children | Single Father | Single Mother |
| No Children | 0 (0.0%) | 70 (11.3%) |
| 1 or 2 Children | 5 (11.4%) | 70 (18.6%) |
| 3 or 4 Children | 0 (0.0%) | 0 (0.0%) |
| 5 or more Children | 0 (0.0%) | 0 (0.0%) |
| Total | 5 (1.9%) | 140 (13.8%) |
Income Below Poverty Among Married-Couple vs Single-Parent Households in East Patchogue
The poverty data for East Patchogue shows that 68 of the married-couple family households (1.8%) and 145 of the single-parent households (11.4%) are living below the poverty level. Within the married-couple family households, those with 1 or 2 children have the highest poverty rate, with 50 households (3.3%) falling below the poverty line. Among the single-parent households, those with 1 or 2 children have the highest poverty rate, with 75 household (17.9%) living below poverty.
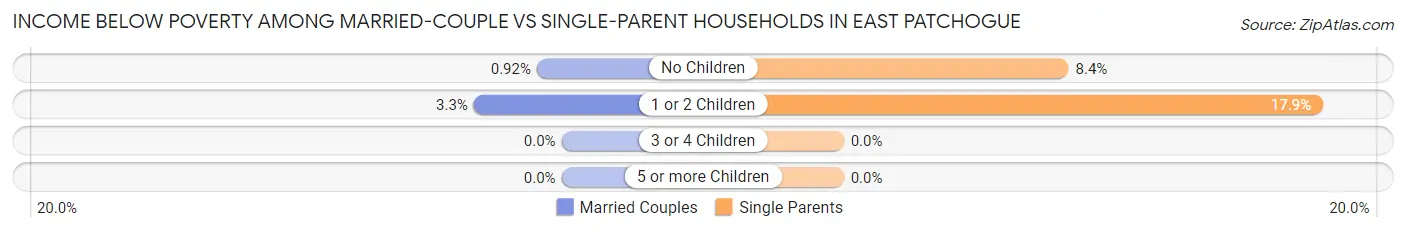
| Children | Married-Couple Families | Single-Parent Households |
| No Children | 18 (0.9%) | 70 (8.4%) |
| 1 or 2 Children | 50 (3.3%) | 75 (17.9%) |
| 3 or 4 Children | 0 (0.0%) | 0 (0.0%) |
| 5 or more Children | 0 (0.0%) | 0 (0.0%) |
| Total | 68 (1.8%) | 145 (11.4%) |
Race in East Patchogue
The most populous races in East Patchogue are White / Caucasian (17,892 | 83.4%), Hispanic or Latino (3,065 | 14.3%), and Two or more Races (1,118 | 5.2%).
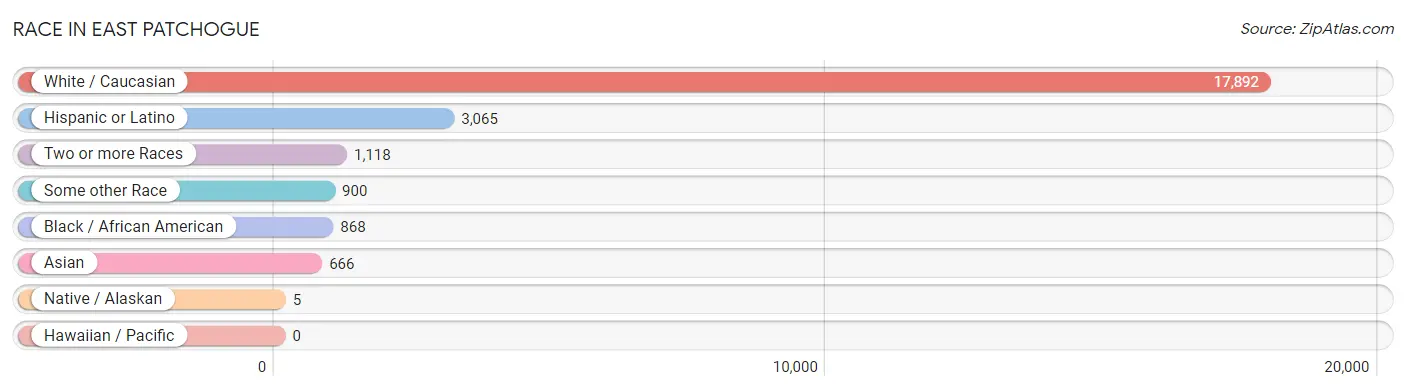
| Race | # Population | % Population |
| Asian | 666 | 3.1% |
| Black / African American | 868 | 4.1% |
| Hawaiian / Pacific | 0 | 0.0% |
| Hispanic or Latino | 3,065 | 14.3% |
| Native / Alaskan | 5 | 0.0% |
| White / Caucasian | 17,892 | 83.4% |
| Two or more Races | 1,118 | 5.2% |
| Some other Race | 900 | 4.2% |
| Total | 21,449 | 100.0% |
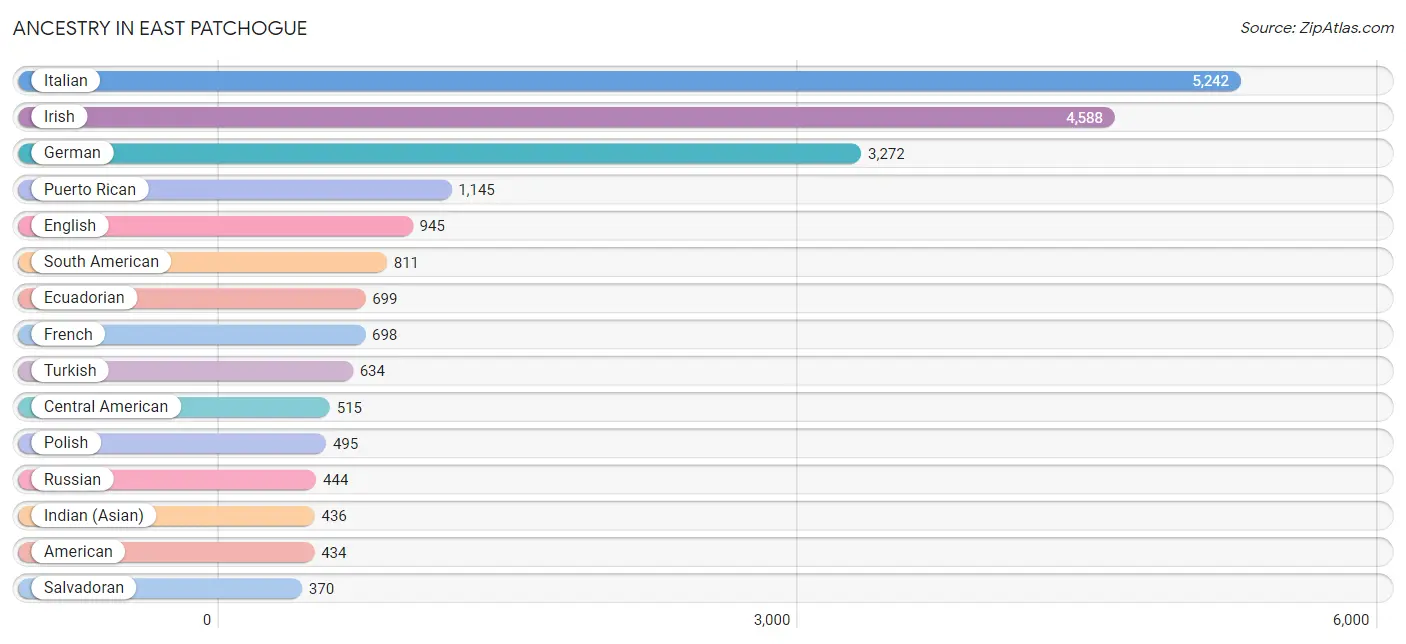
Ancestry in East Patchogue
The most populous ancestries reported in East Patchogue are Italian (5,242 | 24.4%), Irish (4,588 | 21.4%), German (3,272 | 15.2%), Puerto Rican (1,145 | 5.3%), and English (945 | 4.4%), together accounting for 70.8% of all East Patchogue residents.
| Ancestry | # Population | % Population |
| African | 50 | 0.2% |
| American | 434 | 2.0% |
| Arab | 310 | 1.5% |
| Austrian | 32 | 0.2% |
| Barbadian | 19 | 0.1% |
| Bhutanese | 32 | 0.2% |
| Brazilian | 19 | 0.1% |
| British | 10 | 0.1% |
| Burmese | 73 | 0.3% |
| Canadian | 22 | 0.1% |
| Central American | 515 | 2.4% |
| Cherokee | 17 | 0.1% |
| Chilean | 104 | 0.5% |
| Choctaw | 17 | 0.1% |
| Colombian | 8 | 0.0% |
| Cuban | 32 | 0.2% |
| Cypriot | 9 | 0.0% |
| Czech | 121 | 0.6% |
| Czechoslovakian | 95 | 0.4% |
| Dominican | 47 | 0.2% |
| Dutch | 271 | 1.3% |
| Eastern European | 8 | 0.0% |
| Ecuadorian | 699 | 3.3% |
| Egyptian | 22 | 0.1% |
| English | 945 | 4.4% |
| European | 326 | 1.5% |
| Finnish | 26 | 0.1% |
| French | 698 | 3.3% |
| French Canadian | 156 | 0.7% |
| German | 3,272 | 15.2% |
| German Russian | 20 | 0.1% |
| Greek | 154 | 0.7% |
| Guatemalan | 109 | 0.5% |
| Haitian | 62 | 0.3% |
| Hungarian | 53 | 0.3% |
| Icelander | 8 | 0.0% |
| Indian (Asian) | 436 | 2.0% |
| Irish | 4,588 | 21.4% |
| Italian | 5,242 | 24.4% |
| Jamaican | 12 | 0.1% |
| Korean | 91 | 0.4% |
| Lebanese | 15 | 0.1% |
| Lithuanian | 73 | 0.3% |
| Maltese | 30 | 0.1% |
| Mexican | 293 | 1.4% |
| Norwegian | 91 | 0.4% |
| Panamanian | 36 | 0.2% |
| Polish | 495 | 2.3% |
| Portuguese | 17 | 0.1% |
| Puerto Rican | 1,145 | 5.3% |
| Romanian | 34 | 0.2% |
| Russian | 444 | 2.1% |
| Salvadoran | 370 | 1.7% |
| Scotch-Irish | 39 | 0.2% |
| Scottish | 59 | 0.3% |
| Sioux | 17 | 0.1% |
| Slavic | 15 | 0.1% |
| South American | 811 | 3.8% |
| Spaniard | 25 | 0.1% |
| Spanish | 15 | 0.1% |
| Subsaharan African | 102 | 0.5% |
| Swedish | 57 | 0.3% |
| Syrian | 15 | 0.1% |
| Thai | 211 | 1.0% |
| Trinidadian and Tobagonian | 63 | 0.3% |
| Turkish | 634 | 3.0% |
| Ugandan | 52 | 0.2% |
| Ukrainian | 53 | 0.3% |
| Welsh | 56 | 0.3% |
| West Indian | 10 | 0.1% |
| Yugoslavian | 22 | 0.1% | View All 71 Rows |
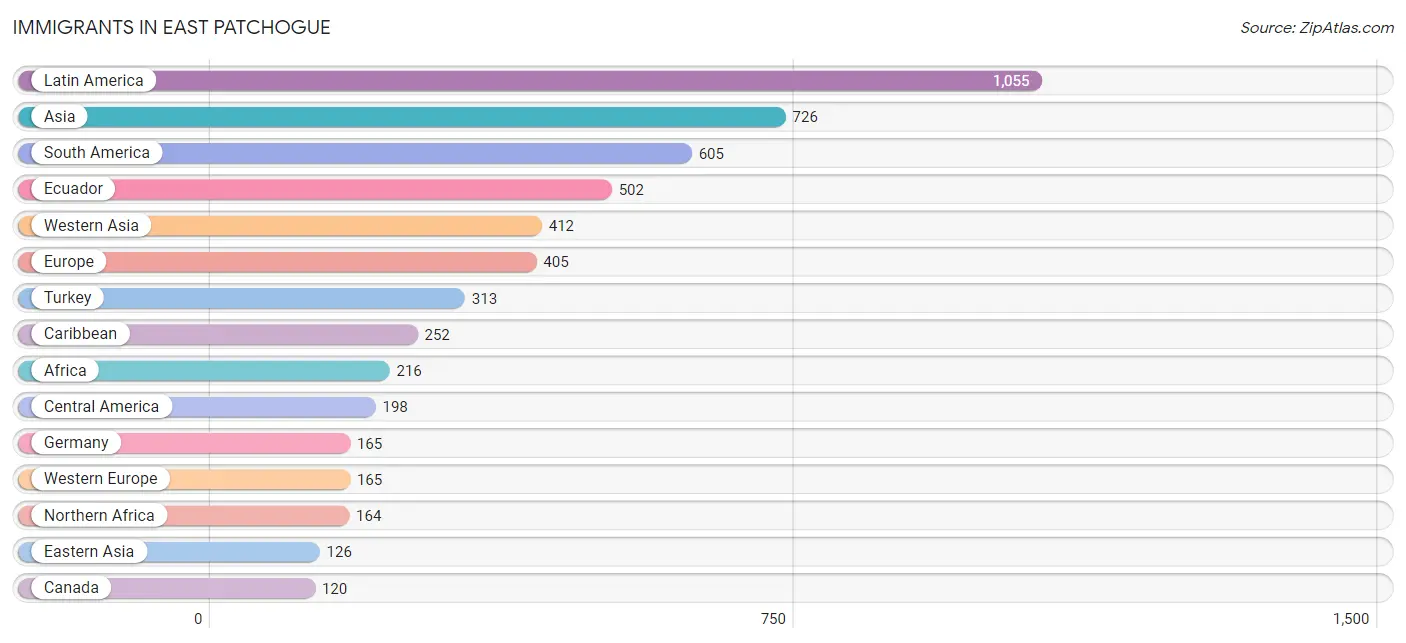
Immigrants in East Patchogue
The most numerous immigrant groups reported in East Patchogue came from Latin America (1,055 | 4.9%), Asia (726 | 3.4%), South America (605 | 2.8%), Ecuador (502 | 2.3%), and Western Asia (412 | 1.9%), together accounting for 15.4% of all East Patchogue residents.
| Immigration Origin | # Population | % Population |
| Africa | 216 | 1.0% |
| Asia | 726 | 3.4% |
| Barbados | 19 | 0.1% |
| Belarus | 23 | 0.1% |
| Canada | 120 | 0.6% |
| Caribbean | 252 | 1.2% |
| Central America | 198 | 0.9% |
| Chile | 26 | 0.1% |
| China | 96 | 0.4% |
| Colombia | 77 | 0.4% |
| Cuba | 35 | 0.2% |
| Czechoslovakia | 12 | 0.1% |
| Dominican Republic | 9 | 0.0% |
| Eastern Africa | 52 | 0.2% |
| Eastern Asia | 126 | 0.6% |
| Eastern Europe | 72 | 0.3% |
| Ecuador | 502 | 2.3% |
| Egypt | 17 | 0.1% |
| El Salvador | 70 | 0.3% |
| England | 53 | 0.3% |
| Europe | 405 | 1.9% |
| Germany | 165 | 0.8% |
| Greece | 11 | 0.1% |
| Guatemala | 79 | 0.4% |
| Haiti | 116 | 0.5% |
| Honduras | 13 | 0.1% |
| Ireland | 2 | 0.0% |
| Israel | 54 | 0.3% |
| Italy | 68 | 0.3% |
| Jamaica | 12 | 0.1% |
| Korea | 30 | 0.1% |
| Latin America | 1,055 | 4.9% |
| Lebanon | 30 | 0.1% |
| Northern Africa | 164 | 0.8% |
| Northern Europe | 78 | 0.4% |
| Pakistan | 84 | 0.4% |
| Panama | 36 | 0.2% |
| Philippines | 83 | 0.4% |
| Poland | 21 | 0.1% |
| Russia | 6 | 0.0% |
| Serbia | 10 | 0.1% |
| South America | 605 | 2.8% |
| South Central Asia | 84 | 0.4% |
| South Eastern Asia | 83 | 0.4% |
| Southern Europe | 82 | 0.4% |
| Spain | 3 | 0.0% |
| Syria | 15 | 0.1% |
| Trinidad and Tobago | 61 | 0.3% |
| Turkey | 313 | 1.5% |
| Uganda | 52 | 0.2% |
| Western Asia | 412 | 1.9% |
| Western Europe | 165 | 0.8% | View All 52 Rows |
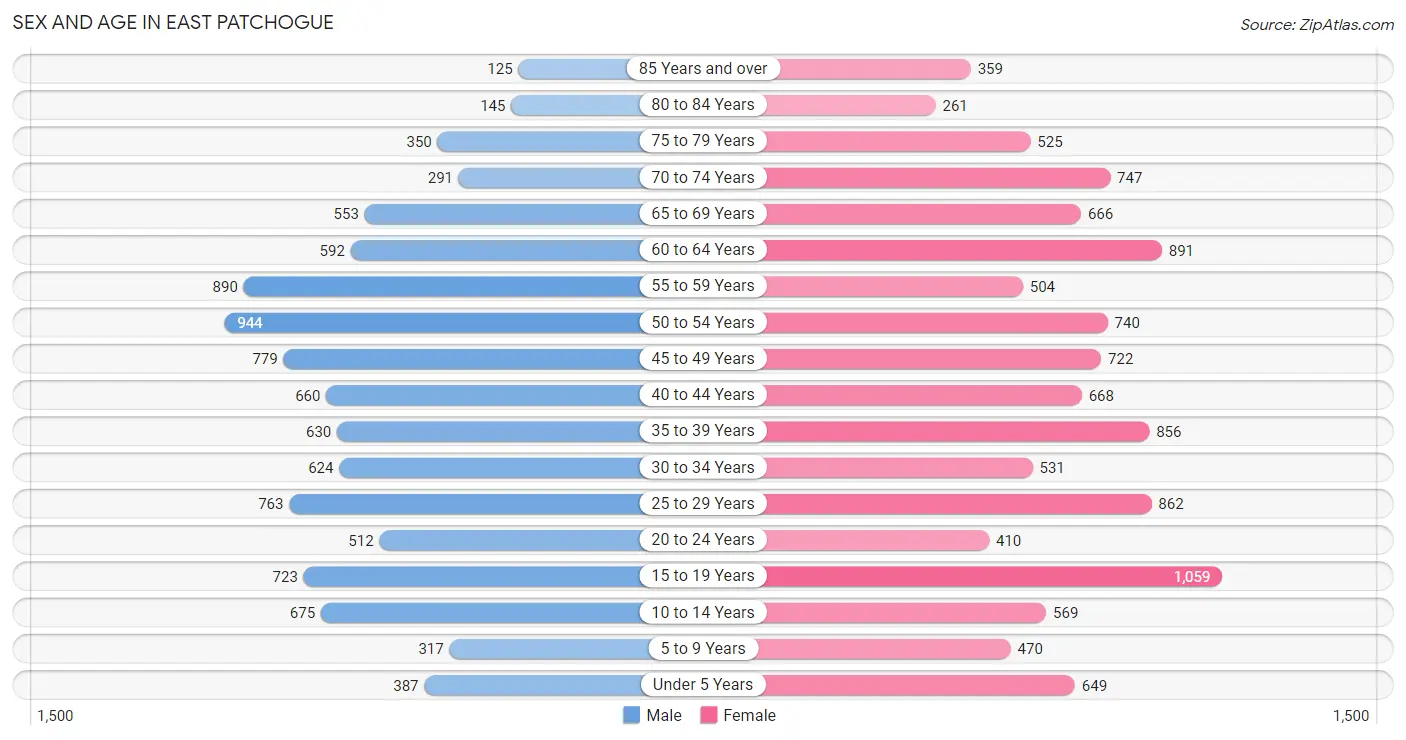
Sex and Age in East Patchogue
Sex and Age in East Patchogue
The most populous age groups in East Patchogue are 50 to 54 Years (944 | 9.5%) for men and 15 to 19 Years (1,059 | 9.2%) for women.
| Age Bracket | Male | Female |
| Under 5 Years | 387 (3.9%) | 649 (5.7%) |
| 5 to 9 Years | 317 (3.2%) | 470 (4.1%) |
| 10 to 14 Years | 675 (6.8%) | 569 (5.0%) |
| 15 to 19 Years | 723 (7.3%) | 1,059 (9.2%) |
| 20 to 24 Years | 512 (5.1%) | 410 (3.6%) |
| 25 to 29 Years | 763 (7.7%) | 862 (7.5%) |
| 30 to 34 Years | 624 (6.3%) | 531 (4.6%) |
| 35 to 39 Years | 630 (6.3%) | 856 (7.4%) |
| 40 to 44 Years | 660 (6.6%) | 668 (5.8%) |
| 45 to 49 Years | 779 (7.8%) | 722 (6.3%) |
| 50 to 54 Years | 944 (9.5%) | 740 (6.4%) |
| 55 to 59 Years | 890 (8.9%) | 504 (4.4%) |
| 60 to 64 Years | 592 (5.9%) | 891 (7.8%) |
| 65 to 69 Years | 553 (5.6%) | 666 (5.8%) |
| 70 to 74 Years | 291 (2.9%) | 747 (6.5%) |
| 75 to 79 Years | 350 (3.5%) | 525 (4.6%) |
| 80 to 84 Years | 145 (1.5%) | 261 (2.3%) |
| 85 Years and over | 125 (1.3%) | 359 (3.1%) |
| Total | 9,960 (100.0%) | 11,489 (100.0%) |
Families and Households in East Patchogue
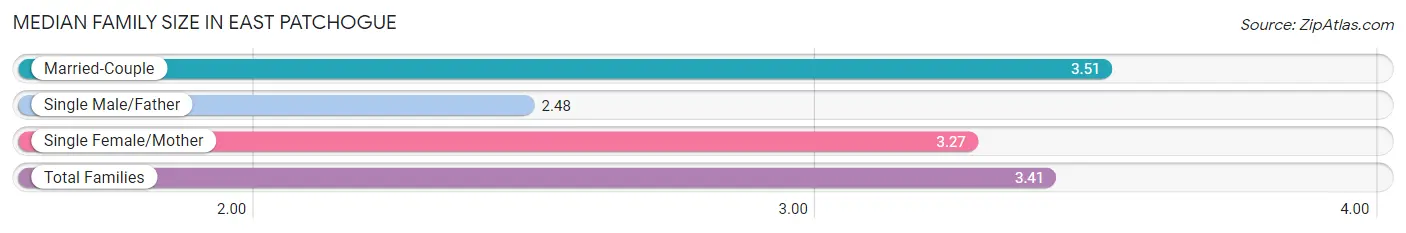
Median Family Size in East Patchogue
The median family size in East Patchogue is 3.41 persons per family, with married-couple families (3,724 | 74.5%) accounting for the largest median family size of 3.51 persons per family. On the other hand, single male/father families (259 | 5.2%) represent the smallest median family size with 2.48 persons per family.
| Family Type | # Families | Family Size |
| Married-Couple | 3,724 (74.5%) | 3.51 |
| Single Male/Father | 259 (5.2%) | 2.48 |
| Single Female/Mother | 1,015 (20.3%) | 3.27 |
| Total Families | 4,998 (100.0%) | 3.41 |
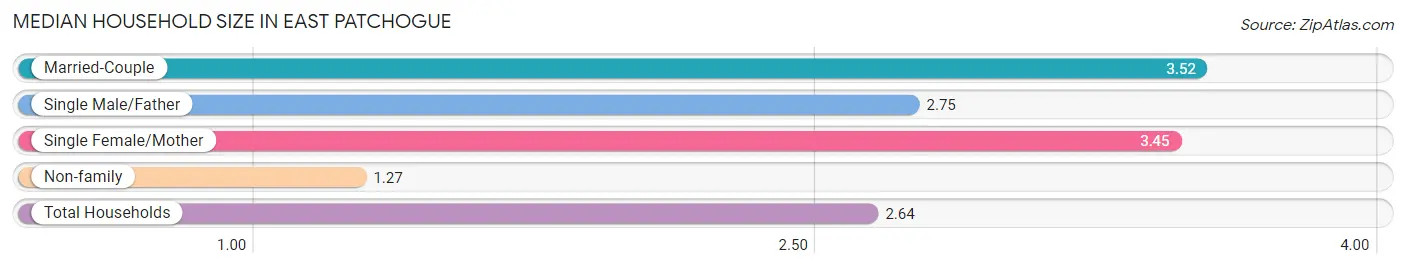
Median Household Size in East Patchogue
The median household size in East Patchogue is 2.64 persons per household, with married-couple households (3,724 | 46.5%) accounting for the largest median household size of 3.52 persons per household. non-family households (3,013 | 37.6%) represent the smallest median household size with 1.27 persons per household.
| Household Type | # Households | Household Size |
| Married-Couple | 3,724 (46.5%) | 3.52 |
| Single Male/Father | 259 (3.2%) | 2.75 |
| Single Female/Mother | 1,015 (12.7%) | 3.45 |
| Non-family | 3,013 (37.6%) | 1.27 |
| Total Households | 8,011 (100.0%) | 2.64 |
Household Size by Marriage Status in East Patchogue
Out of a total of 8,011 households in East Patchogue, 4,998 (62.4%) are family households, while 3,013 (37.6%) are nonfamily households. The most numerous type of family households are 2-person households, comprising 1,854, and the most common type of nonfamily households are 1-person households, comprising 2,275.
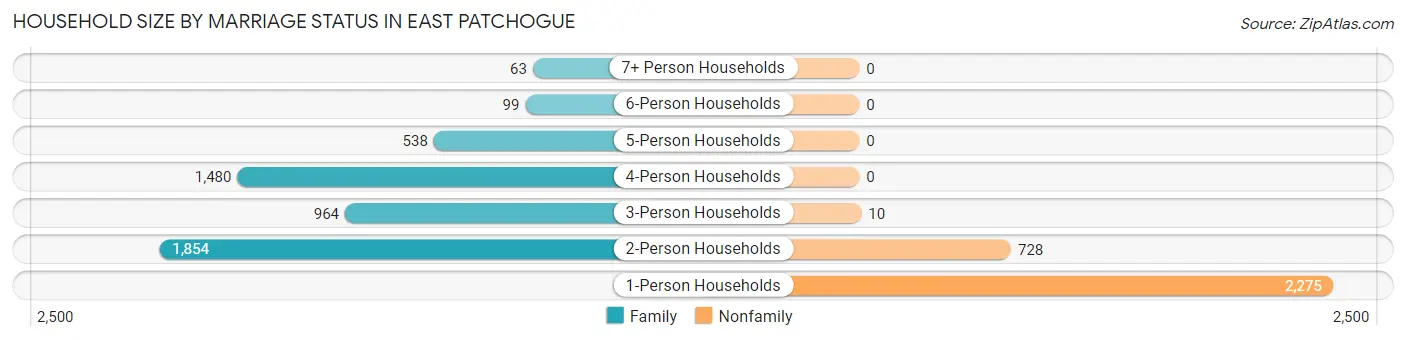
| Household Size | Family Households | Nonfamily Households |
| 1-Person Households | - | 2,275 (28.4%) |
| 2-Person Households | 1,854 (23.1%) | 728 (9.1%) |
| 3-Person Households | 964 (12.0%) | 10 (0.1%) |
| 4-Person Households | 1,480 (18.5%) | 0 (0.0%) |
| 5-Person Households | 538 (6.7%) | 0 (0.0%) |
| 6-Person Households | 99 (1.2%) | 0 (0.0%) |
| 7+ Person Households | 63 (0.8%) | 0 (0.0%) |
| Total | 4,998 (62.4%) | 3,013 (37.6%) |
Female Fertility in East Patchogue
Fertility by Age in East Patchogue
Average fertility rate in East Patchogue is 32.0 births per 1,000 women. Women in the age bracket of 20 to 34 years have the highest fertility rate with 41.0 births per 1,000 women. Women in the age bracket of 35 to 50 years acount for 55.7% of all women with births.
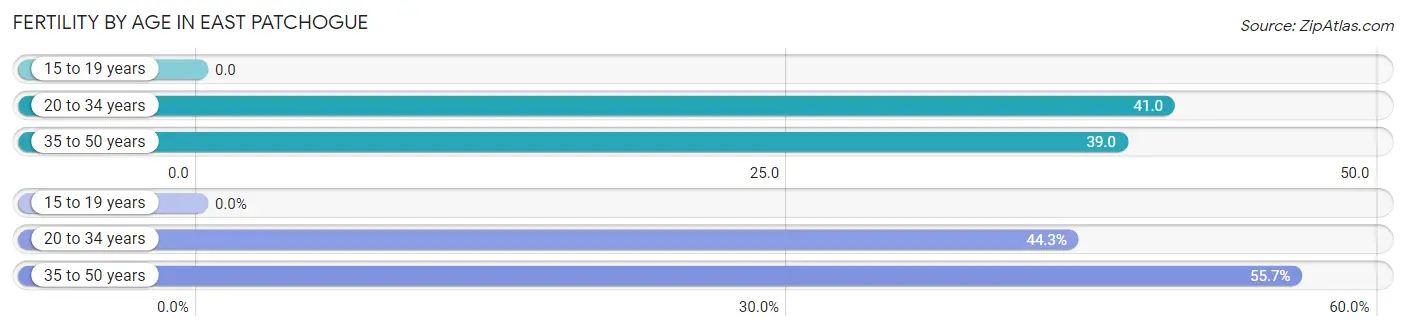
| Age Bracket | Women with Births | Births / 1,000 Women |
| 15 to 19 years | 0 (0.0%) | 0.0 |
| 20 to 34 years | 74 (44.3%) | 41.0 |
| 35 to 50 years | 93 (55.7%) | 39.0 |
| Total | 167 (100.0%) | 32.0 |
Fertility by Age by Marriage Status in East Patchogue
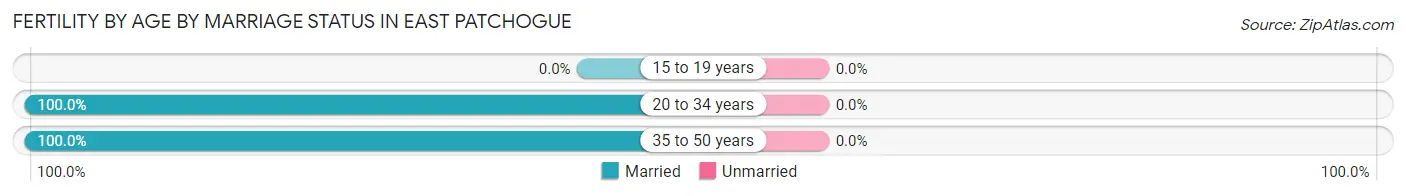
| Age Bracket | Married | Unmarried |
| 15 to 19 years | 0 (0.0%) | 0 (0.0%) |
| 20 to 34 years | 74 (100.0%) | 0 (0.0%) |
| 35 to 50 years | 93 (100.0%) | 0 (0.0%) |
| Total | 167 (100.0%) | 0 (0.0%) |
Fertility by Education in East Patchogue
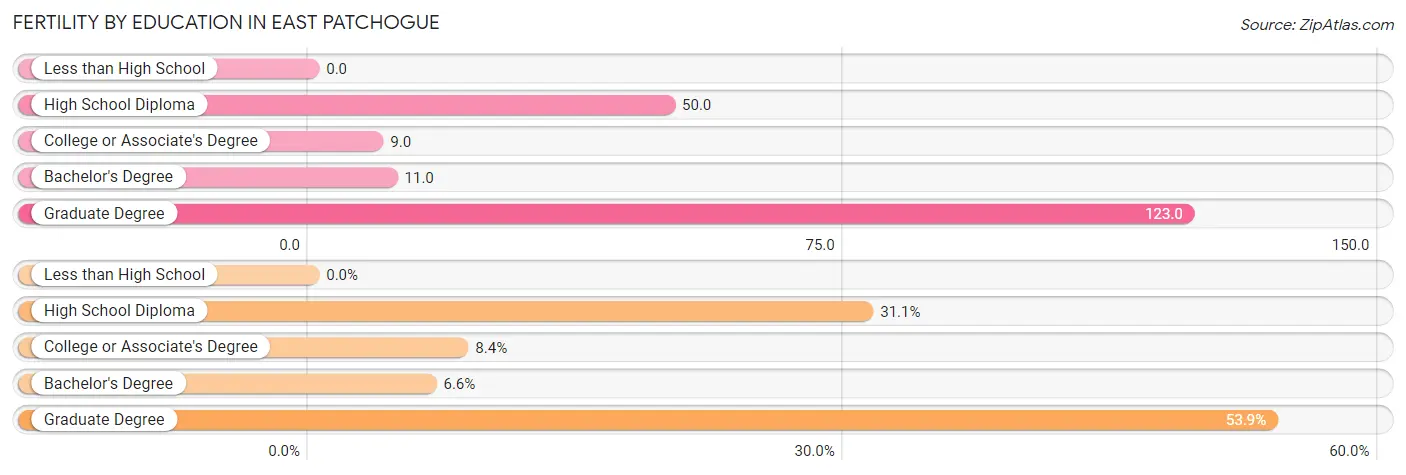
| Educational Attainment | Women with Births | Births / 1,000 Women |
| Less than High School | 0 (0.0%) | 0.0 |
| High School Diploma | 52 (31.1%) | 50.0 |
| College or Associate's Degree | 14 (8.4%) | 9.0 |
| Bachelor's Degree | 11 (6.6%) | 11.0 |
| Graduate Degree | 90 (53.9%) | 123.0 |
| Total | 167 (100.0%) | 32.0 |
Fertility by Education by Marriage Status in East Patchogue
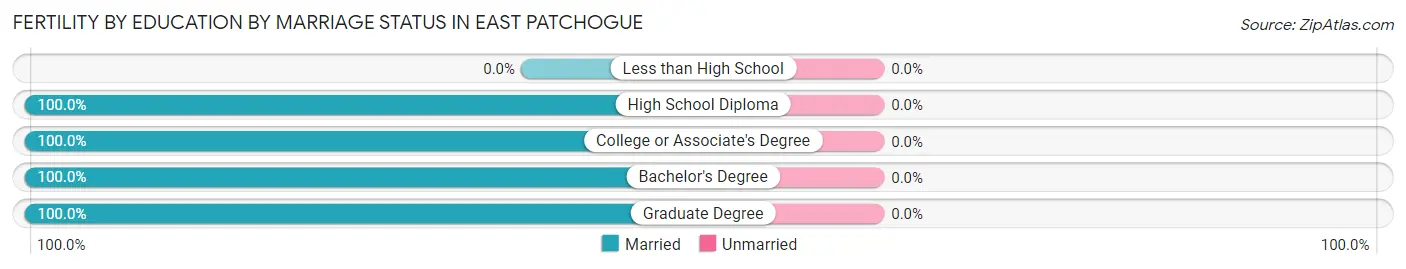
| Educational Attainment | Married | Unmarried |
| Less than High School | 0 (0.0%) | 0 (0.0%) |
| High School Diploma | 52 (100.0%) | 0 (0.0%) |
| College or Associate's Degree | 14 (100.0%) | 0 (0.0%) |
| Bachelor's Degree | 11 (100.0%) | 0 (0.0%) |
| Graduate Degree | 90 (100.0%) | 0 (0.0%) |
| Total | 167 (100.0%) | 0 (0.0%) |
Employment Characteristics in East Patchogue
Employment by Class of Employer in East Patchogue
Among the 11,430 employed individuals in East Patchogue, private company employees (7,170 | 62.7%), local government employees (1,420 | 12.4%), and not-for-profit organizations (861 | 7.5%) make up the most common classes of employment.
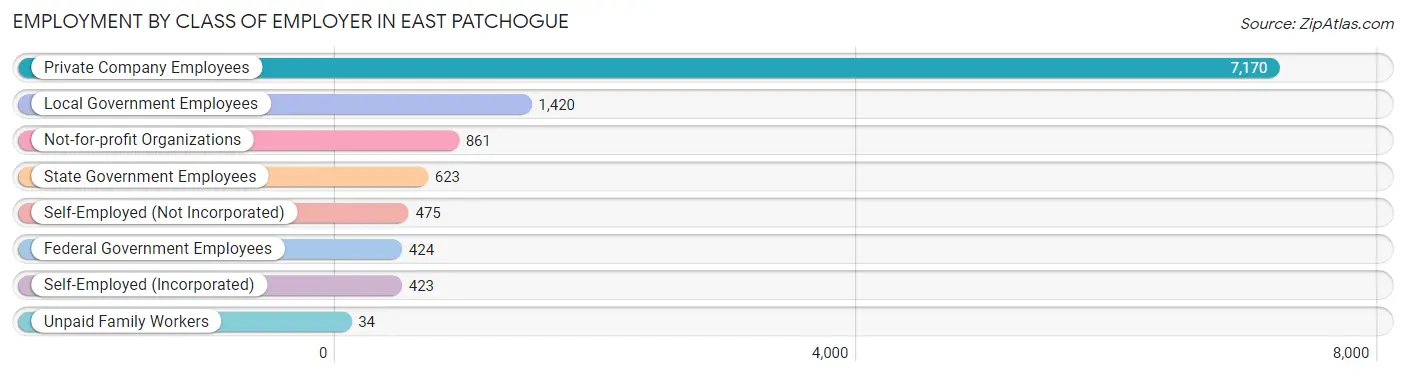
| Employer Class | # Employees | % Employees |
| Private Company Employees | 7,170 | 62.7% |
| Self-Employed (Incorporated) | 423 | 3.7% |
| Self-Employed (Not Incorporated) | 475 | 4.2% |
| Not-for-profit Organizations | 861 | 7.5% |
| Local Government Employees | 1,420 | 12.4% |
| State Government Employees | 623 | 5.4% |
| Federal Government Employees | 424 | 3.7% |
| Unpaid Family Workers | 34 | 0.3% |
| Total | 11,430 | 100.0% |
Employment Status by Age in East Patchogue
According to the labor force statistics for East Patchogue, out of the total population over 16 years of age (17,960), 67.9% or 12,195 individuals are in the labor force, with 4.7% or 573 of them unemployed. The age group with the highest labor force participation rate is 25 to 29 years, with 98.0% or 1,592 individuals in the labor force. Within the labor force, the 20 to 24 years age range has the highest percentage of unemployed individuals, with 21.5% or 127 of them being unemployed.
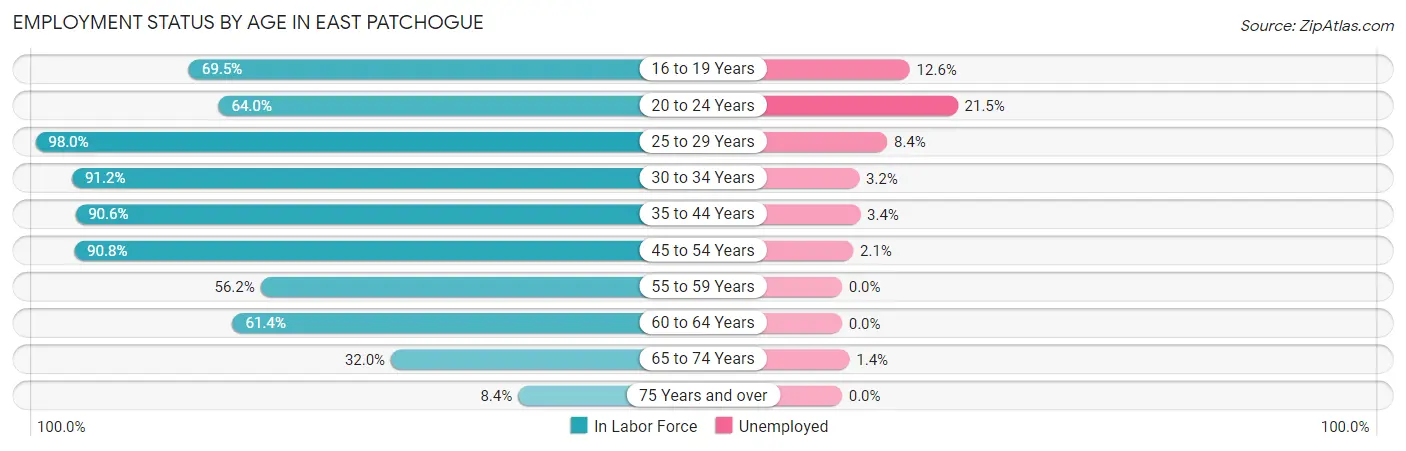
| Age Bracket | In Labor Force | Unemployed |
| 16 to 19 Years | 945 (69.5%) | 119 (12.6%) |
| 20 to 24 Years | 590 (64.0%) | 127 (21.5%) |
| 25 to 29 Years | 1,592 (98.0%) | 134 (8.4%) |
| 30 to 34 Years | 1,053 (91.2%) | 34 (3.2%) |
| 35 to 44 Years | 2,549 (90.6%) | 87 (3.4%) |
| 45 to 54 Years | 2,892 (90.8%) | 61 (2.1%) |
| 55 to 59 Years | 783 (56.2%) | 0 (0.0%) |
| 60 to 64 Years | 911 (61.4%) | 0 (0.0%) |
| 65 to 74 Years | 722 (32.0%) | 10 (1.4%) |
| 75 Years and over | 148 (8.4%) | 0 (0.0%) |
| Total | 12,195 (67.9%) | 573 (4.7%) |
Employment Status by Educational Attainment in East Patchogue
According to labor force statistics for East Patchogue, 83.9% of individuals (9,779) out of the total population between 25 and 64 years of age (11,656) are in the labor force, with 3.2% or 313 of them being unemployed. The group with the highest labor force participation rate are those with the educational attainment of bachelor's degree or higher, with 89.2% or 3,577 individuals in the labor force. Within the labor force, individuals with bachelor's degree or higher education have the highest percentage of unemployment, with 4.8% or 172 of them being unemployed.
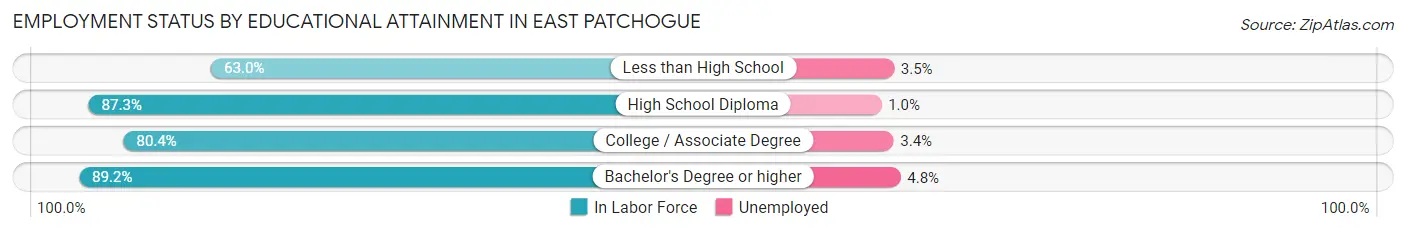
| Educational Attainment | In Labor Force | Unemployed |
| Less than High School | 625 (63.0%) | 35 (3.5%) |
| High School Diploma | 2,889 (87.3%) | 33 (1.0%) |
| College / Associate Degree | 2,689 (80.4%) | 114 (3.4%) |
| Bachelor's Degree or higher | 3,577 (89.2%) | 192 (4.8%) |
| Total | 9,779 (83.9%) | 373 (3.2%) |
Employment Occupations by Sex in East Patchogue
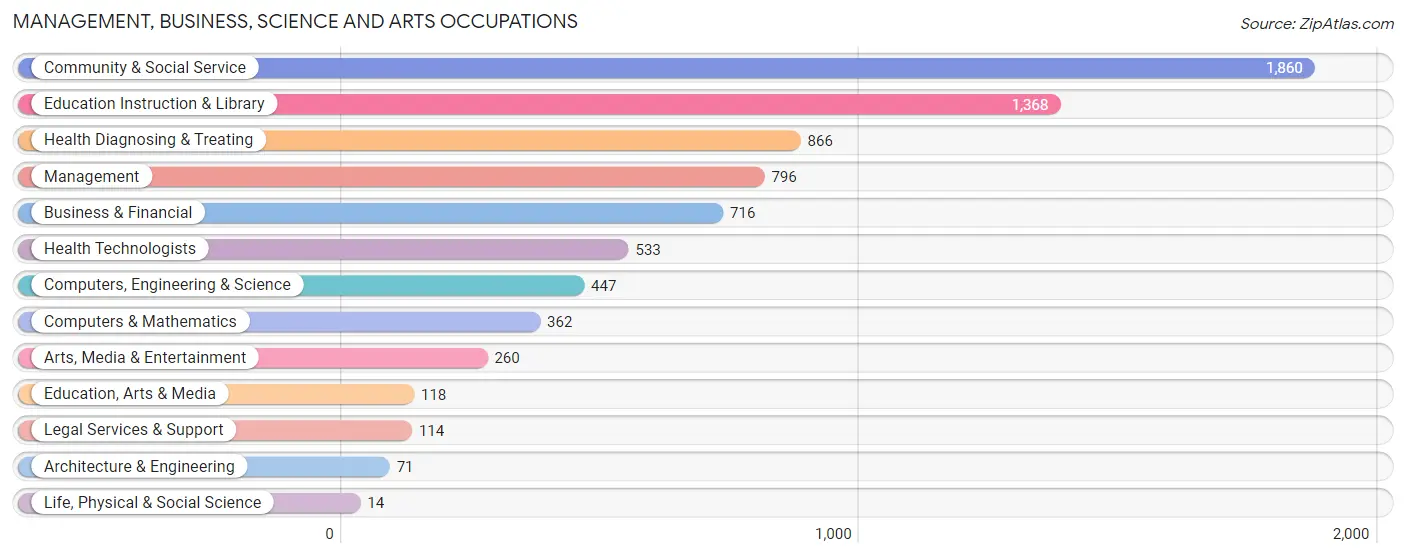
Management, Business, Science and Arts Occupations
The most common Management, Business, Science and Arts occupations in East Patchogue are Community & Social Service (1,860 | 16.0%), Education Instruction & Library (1,368 | 11.8%), Health Diagnosing & Treating (866 | 7.5%), Management (796 | 6.9%), and Business & Financial (716 | 6.2%).
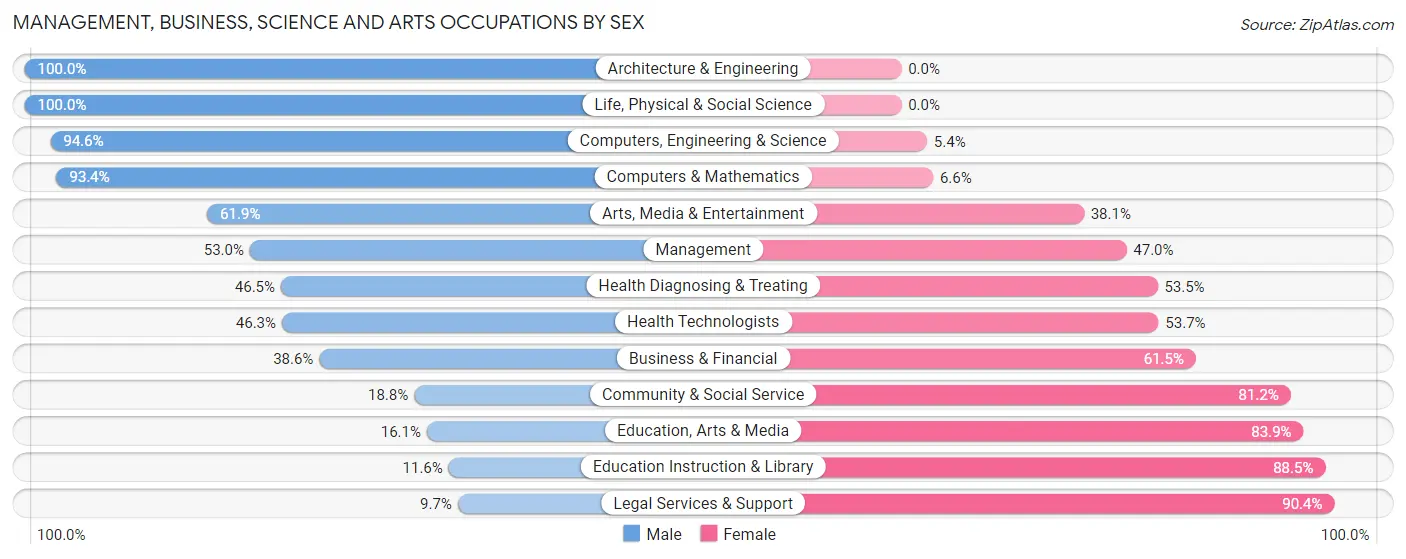
Management, Business, Science and Arts Occupations by Sex
Within the Management, Business, Science and Arts occupations in East Patchogue, the most male-oriented occupations are Architecture & Engineering (100.0%), Life, Physical & Social Science (100.0%), and Computers, Engineering & Science (94.6%), while the most female-oriented occupations are Legal Services & Support (90.3%), Education Instruction & Library (88.4%), and Education, Arts & Media (83.9%).
| Occupation | Male | Female |
| Management | 422 (53.0%) | 374 (47.0%) |
| Business & Financial | 276 (38.6%) | 440 (61.5%) |
| Computers, Engineering & Science | 423 (94.6%) | 24 (5.4%) |
| Computers & Mathematics | 338 (93.4%) | 24 (6.6%) |
| Architecture & Engineering | 71 (100.0%) | 0 (0.0%) |
| Life, Physical & Social Science | 14 (100.0%) | 0 (0.0%) |
| Community & Social Service | 349 (18.8%) | 1,511 (81.2%) |
| Education, Arts & Media | 19 (16.1%) | 99 (83.9%) |
| Legal Services & Support | 11 (9.7%) | 103 (90.3%) |
| Education Instruction & Library | 158 (11.6%) | 1,210 (88.4%) |
| Arts, Media & Entertainment | 161 (61.9%) | 99 (38.1%) |
| Health Diagnosing & Treating | 403 (46.5%) | 463 (53.5%) |
| Health Technologists | 247 (46.3%) | 286 (53.7%) |
| Total (Category) | 1,873 (40.0%) | 2,812 (60.0%) |
| Total (Overall) | 5,891 (50.7%) | 5,724 (49.3%) |
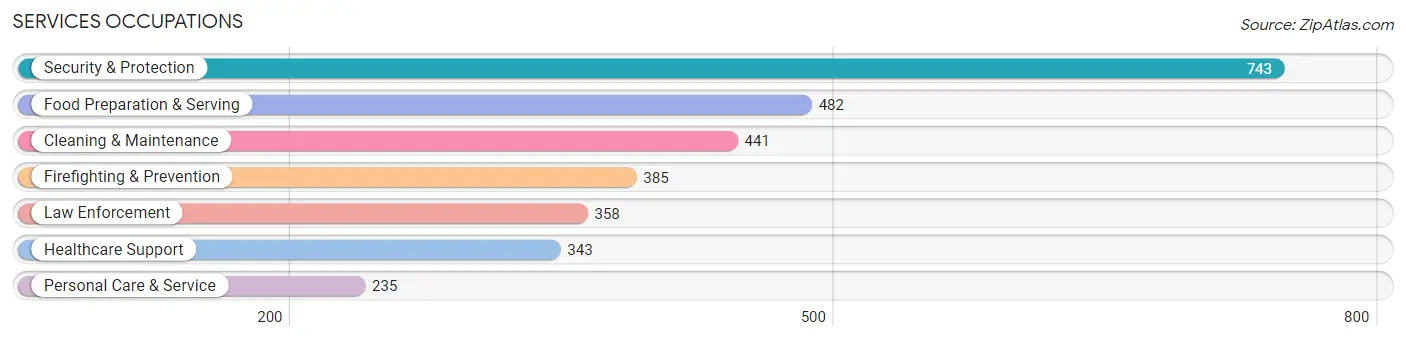
Services Occupations
The most common Services occupations in East Patchogue are Security & Protection (743 | 6.4%), Food Preparation & Serving (482 | 4.2%), Cleaning & Maintenance (441 | 3.8%), Firefighting & Prevention (385 | 3.3%), and Law Enforcement (358 | 3.1%).
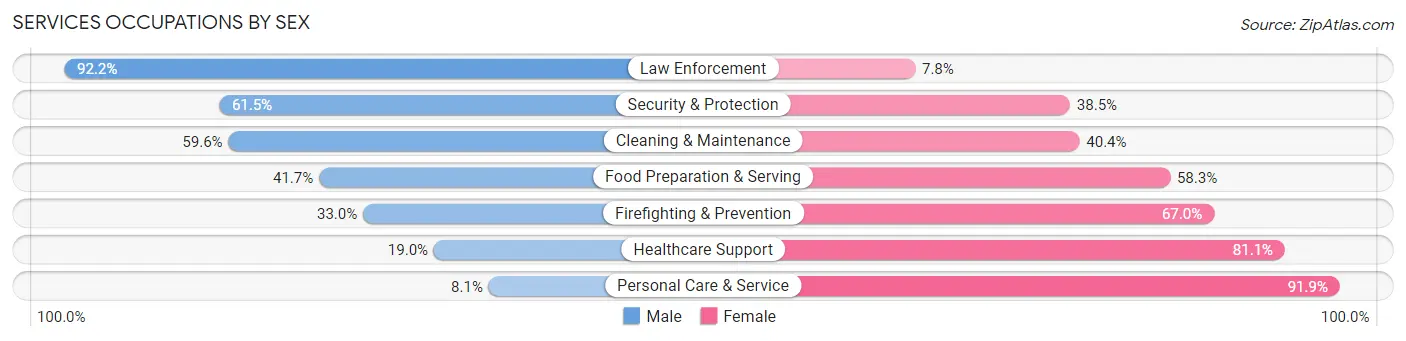
Services Occupations by Sex
Within the Services occupations in East Patchogue, the most male-oriented occupations are Law Enforcement (92.2%), Security & Protection (61.5%), and Cleaning & Maintenance (59.6%), while the most female-oriented occupations are Personal Care & Service (91.9%), Healthcare Support (81.0%), and Firefighting & Prevention (67.0%).
| Occupation | Male | Female |
| Healthcare Support | 65 (19.0%) | 278 (81.0%) |
| Security & Protection | 457 (61.5%) | 286 (38.5%) |
| Firefighting & Prevention | 127 (33.0%) | 258 (67.0%) |
| Law Enforcement | 330 (92.2%) | 28 (7.8%) |
| Food Preparation & Serving | 201 (41.7%) | 281 (58.3%) |
| Cleaning & Maintenance | 263 (59.6%) | 178 (40.4%) |
| Personal Care & Service | 19 (8.1%) | 216 (91.9%) |
| Total (Category) | 1,005 (44.8%) | 1,239 (55.2%) |
| Total (Overall) | 5,891 (50.7%) | 5,724 (49.3%) |
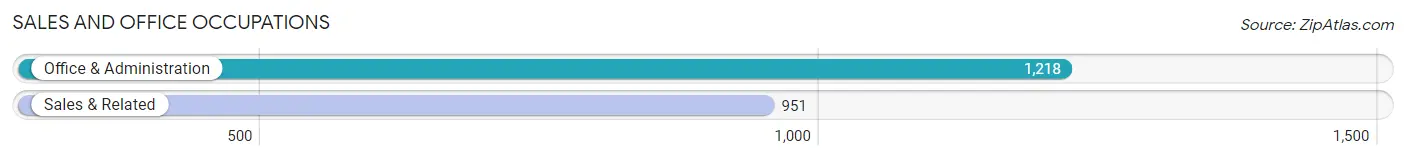
Sales and Office Occupations
The most common Sales and Office occupations in East Patchogue are Office & Administration (1,218 | 10.5%), and Sales & Related (951 | 8.2%).
Sales and Office Occupations by Sex
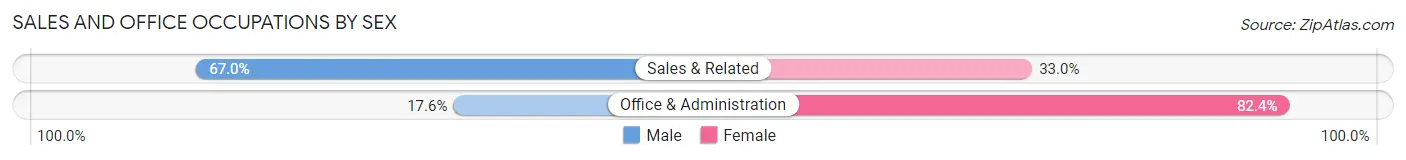
| Occupation | Male | Female |
| Sales & Related | 637 (67.0%) | 314 (33.0%) |
| Office & Administration | 214 (17.6%) | 1,004 (82.4%) |
| Total (Category) | 851 (39.2%) | 1,318 (60.8%) |
| Total (Overall) | 5,891 (50.7%) | 5,724 (49.3%) |
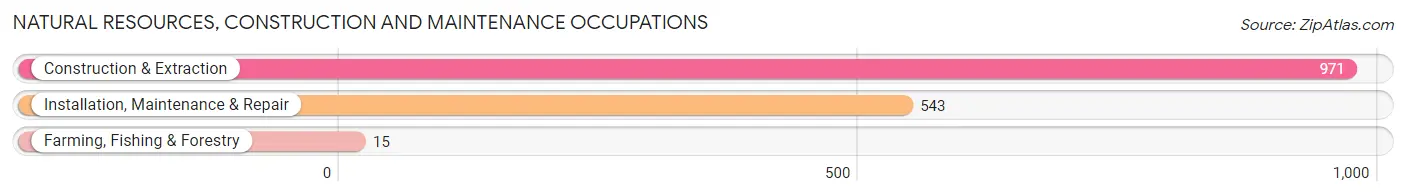
Natural Resources, Construction and Maintenance Occupations
The most common Natural Resources, Construction and Maintenance occupations in East Patchogue are Construction & Extraction (971 | 8.4%), Installation, Maintenance & Repair (543 | 4.7%), and Farming, Fishing & Forestry (15 | 0.1%).
Natural Resources, Construction and Maintenance Occupations by Sex
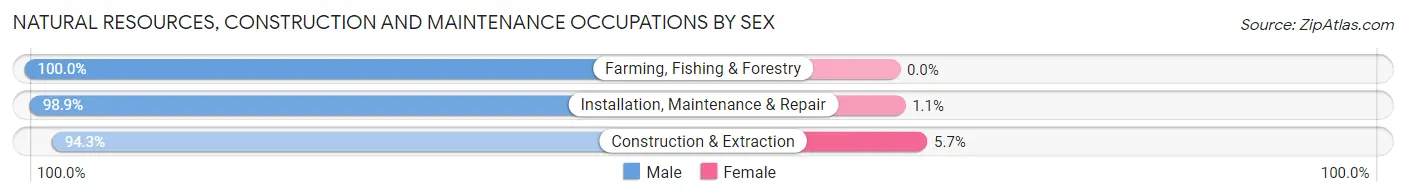
| Occupation | Male | Female |
| Farming, Fishing & Forestry | 15 (100.0%) | 0 (0.0%) |
| Construction & Extraction | 916 (94.3%) | 55 (5.7%) |
| Installation, Maintenance & Repair | 537 (98.9%) | 6 (1.1%) |
| Total (Category) | 1,468 (96.0%) | 61 (4.0%) |
| Total (Overall) | 5,891 (50.7%) | 5,724 (49.3%) |
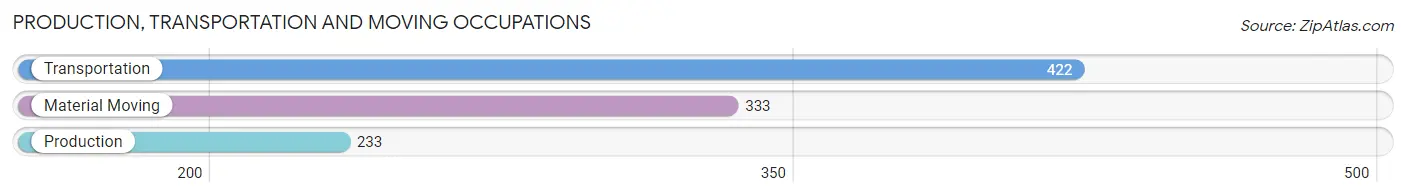
Production, Transportation and Moving Occupations
The most common Production, Transportation and Moving occupations in East Patchogue are Transportation (422 | 3.6%), Material Moving (333 | 2.9%), and Production (233 | 2.0%).
Production, Transportation and Moving Occupations by Sex
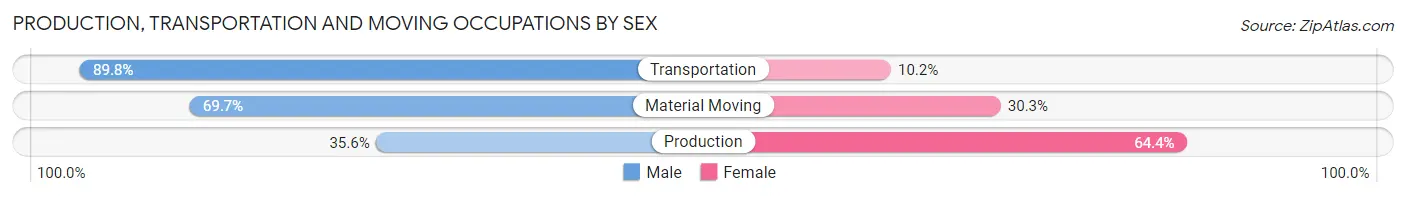
| Occupation | Male | Female |
| Production | 83 (35.6%) | 150 (64.4%) |
| Transportation | 379 (89.8%) | 43 (10.2%) |
| Material Moving | 232 (69.7%) | 101 (30.3%) |
| Total (Category) | 694 (70.2%) | 294 (29.8%) |
| Total (Overall) | 5,891 (50.7%) | 5,724 (49.3%) |
Employment Industries by Sex in East Patchogue
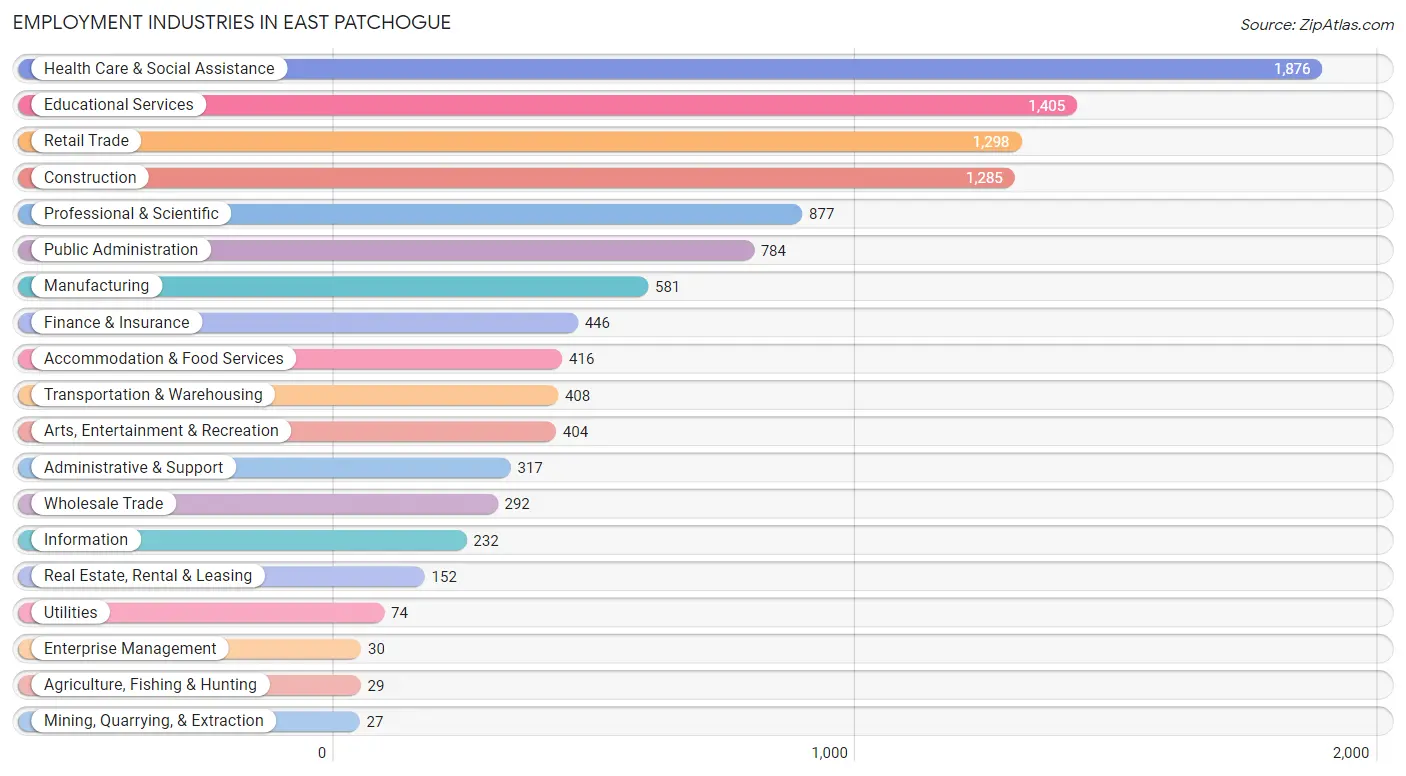
Employment Industries in East Patchogue
The major employment industries in East Patchogue include Health Care & Social Assistance (1,876 | 16.2%), Educational Services (1,405 | 12.1%), Retail Trade (1,298 | 11.2%), Construction (1,285 | 11.1%), and Professional & Scientific (877 | 7.5%).
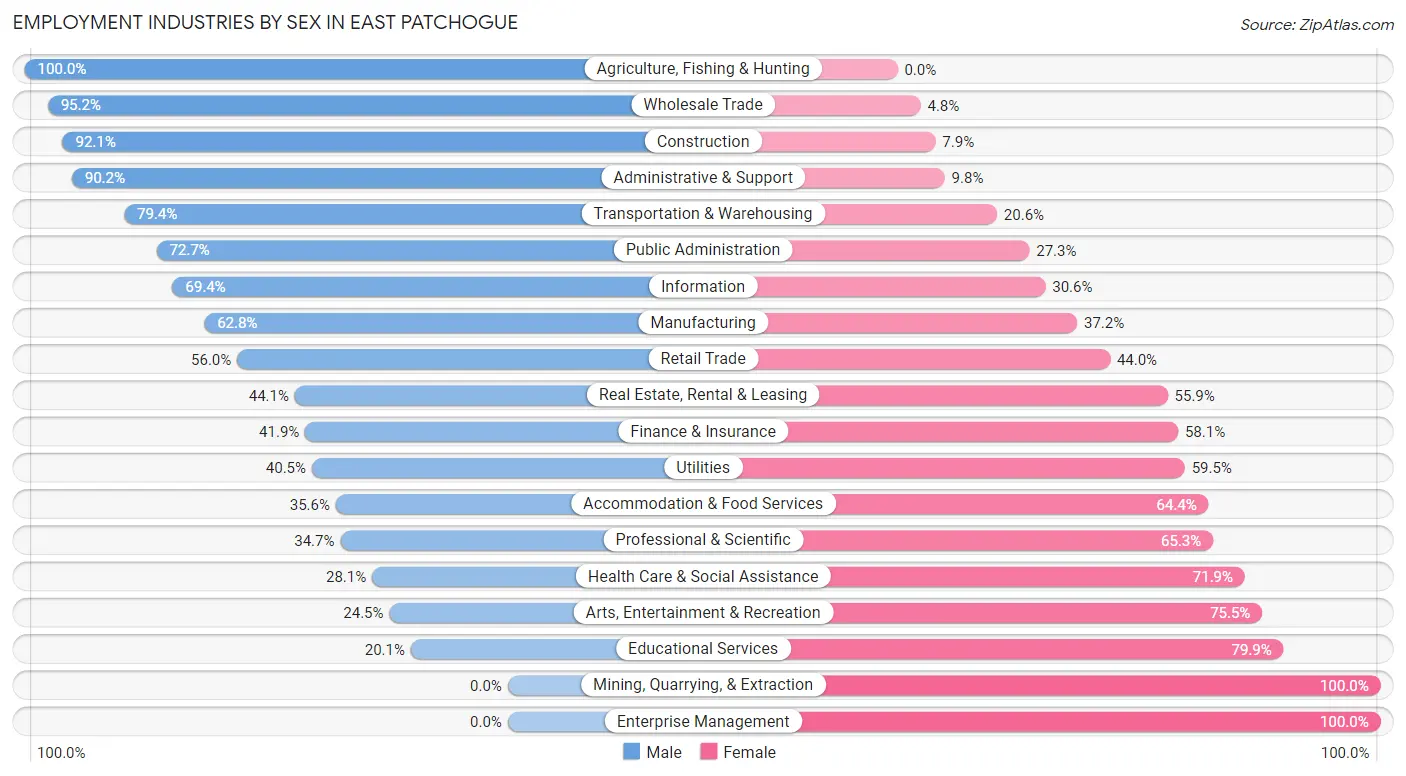
Employment Industries by Sex in East Patchogue
The East Patchogue industries that see more men than women are Agriculture, Fishing & Hunting (100.0%), Wholesale Trade (95.2%), and Construction (92.1%), whereas the industries that tend to have a higher number of women are Mining, Quarrying, & Extraction (100.0%), Enterprise Management (100.0%), and Educational Services (79.9%).
| Industry | Male | Female |
| Agriculture, Fishing & Hunting | 29 (100.0%) | 0 (0.0%) |
| Mining, Quarrying, & Extraction | 0 (0.0%) | 27 (100.0%) |
| Construction | 1,184 (92.1%) | 101 (7.9%) |
| Manufacturing | 365 (62.8%) | 216 (37.2%) |
| Wholesale Trade | 278 (95.2%) | 14 (4.8%) |
| Retail Trade | 727 (56.0%) | 571 (44.0%) |
| Transportation & Warehousing | 324 (79.4%) | 84 (20.6%) |
| Utilities | 30 (40.5%) | 44 (59.5%) |
| Information | 161 (69.4%) | 71 (30.6%) |
| Finance & Insurance | 187 (41.9%) | 259 (58.1%) |
| Real Estate, Rental & Leasing | 67 (44.1%) | 85 (55.9%) |
| Professional & Scientific | 304 (34.7%) | 573 (65.3%) |
| Enterprise Management | 0 (0.0%) | 30 (100.0%) |
| Administrative & Support | 286 (90.2%) | 31 (9.8%) |
| Educational Services | 282 (20.1%) | 1,123 (79.9%) |
| Health Care & Social Assistance | 527 (28.1%) | 1,349 (71.9%) |
| Arts, Entertainment & Recreation | 99 (24.5%) | 305 (75.5%) |
| Accommodation & Food Services | 148 (35.6%) | 268 (64.4%) |
| Public Administration | 570 (72.7%) | 214 (27.3%) |
| Total | 5,891 (50.7%) | 5,724 (49.3%) |
Education in East Patchogue
School Enrollment in East Patchogue
The most common levels of schooling among the 5,594 students in East Patchogue are college / undergraduate (1,506 | 26.9%), high school (1,350 | 24.1%), and middle school (949 | 17.0%).
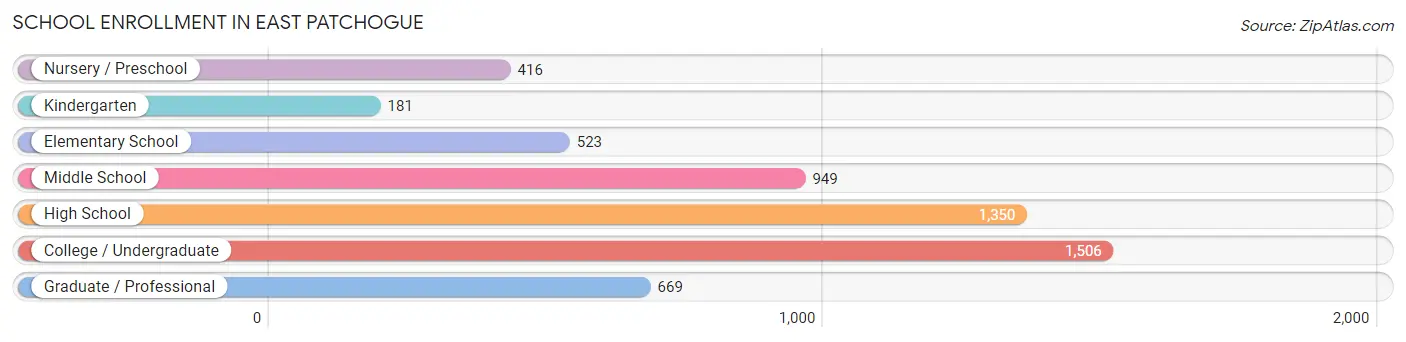
| School Level | # Students | % Students |
| Nursery / Preschool | 416 | 7.4% |
| Kindergarten | 181 | 3.2% |
| Elementary School | 523 | 9.3% |
| Middle School | 949 | 17.0% |
| High School | 1,350 | 24.1% |
| College / Undergraduate | 1,506 | 26.9% |
| Graduate / Professional | 669 | 12.0% |
| Total | 5,594 | 100.0% |
School Enrollment by Age by Funding Source in East Patchogue
Out of a total of 5,594 students who are enrolled in schools in East Patchogue, 1,242 (22.2%) attend a private institution, while the remaining 4,352 (77.8%) are enrolled in public schools. The age group of 20 to 24 year olds has the highest likelihood of being enrolled in private schools, with 325 (57.2% in the age bracket) enrolled. Conversely, the age group of 10 to 14 year olds has the lowest likelihood of being enrolled in a private school, with 1,192 (95.8% in the age bracket) attending a public institution.
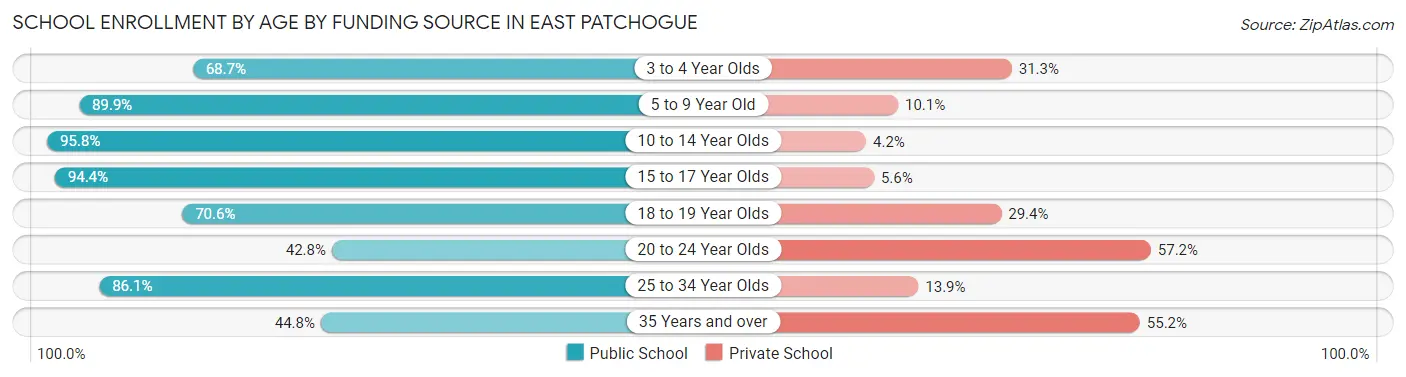
| Age Bracket | Public School | Private School |
| 3 to 4 Year Olds | 318 (68.7%) | 145 (31.3%) |
| 5 to 9 Year Old | 541 (89.9%) | 61 (10.1%) |
| 10 to 14 Year Olds | 1,192 (95.8%) | 52 (4.2%) |
| 15 to 17 Year Olds | 837 (94.4%) | 50 (5.6%) |
| 18 to 19 Year Olds | 539 (70.6%) | 224 (29.4%) |
| 20 to 24 Year Olds | 243 (42.8%) | 325 (57.2%) |
| 25 to 34 Year Olds | 427 (86.1%) | 69 (13.9%) |
| 35 Years and over | 256 (44.8%) | 315 (55.2%) |
| Total | 4,352 (77.8%) | 1,242 (22.2%) |
Educational Attainment by Field of Study in East Patchogue
Business (1,003 | 19.5%), education (976 | 19.0%), computers & mathematics (456 | 8.9%), bio, nature & agricultural (436 | 8.5%), and science & technology (398 | 7.7%) are the most common fields of study among 5,149 individuals in East Patchogue who have obtained a bachelor's degree or higher.
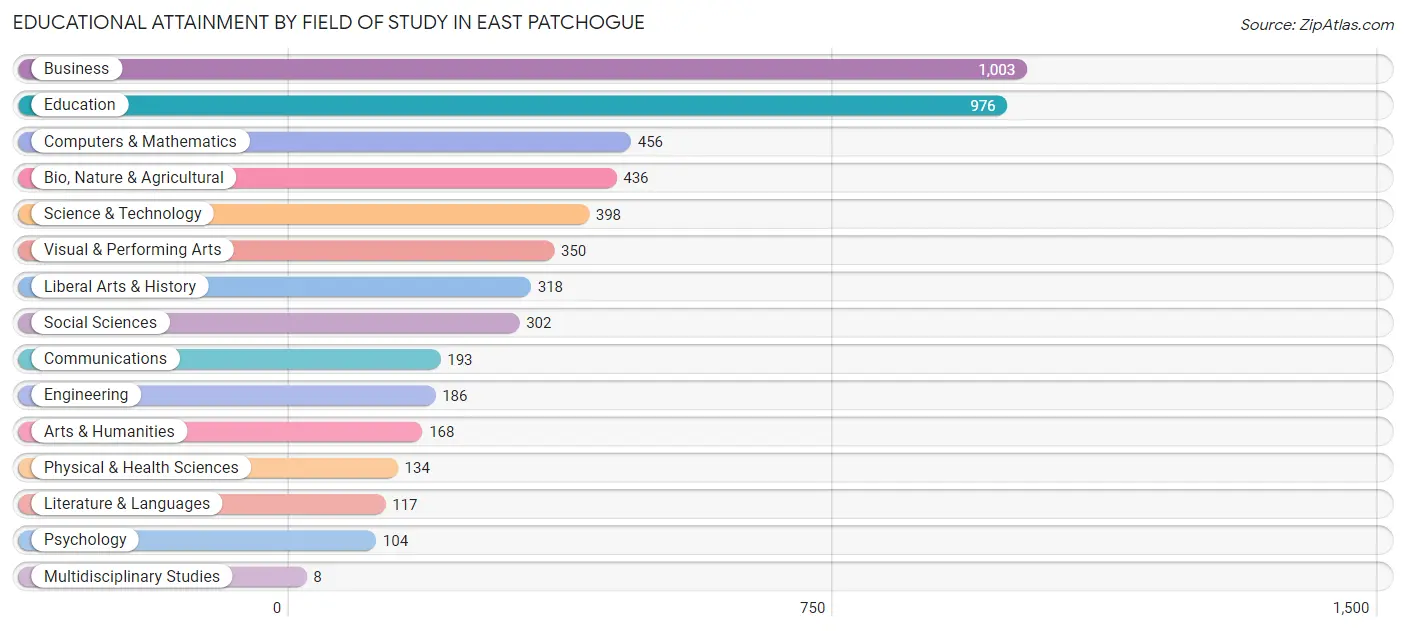
| Field of Study | # Graduates | % Graduates |
| Computers & Mathematics | 456 | 8.9% |
| Bio, Nature & Agricultural | 436 | 8.5% |
| Physical & Health Sciences | 134 | 2.6% |
| Psychology | 104 | 2.0% |
| Social Sciences | 302 | 5.9% |
| Engineering | 186 | 3.6% |
| Multidisciplinary Studies | 8 | 0.2% |
| Science & Technology | 398 | 7.7% |
| Business | 1,003 | 19.5% |
| Education | 976 | 19.0% |
| Literature & Languages | 117 | 2.3% |
| Liberal Arts & History | 318 | 6.2% |
| Visual & Performing Arts | 350 | 6.8% |
| Communications | 193 | 3.7% |
| Arts & Humanities | 168 | 3.3% |
| Total | 5,149 | 100.0% |
Transportation & Commute in East Patchogue
Vehicle Availability by Sex in East Patchogue
The most prevalent vehicle ownership categories in East Patchogue are males with 2 vehicles (2,228, accounting for 38.7%) and females with 2 vehicles (1,971, making up 39.5%).
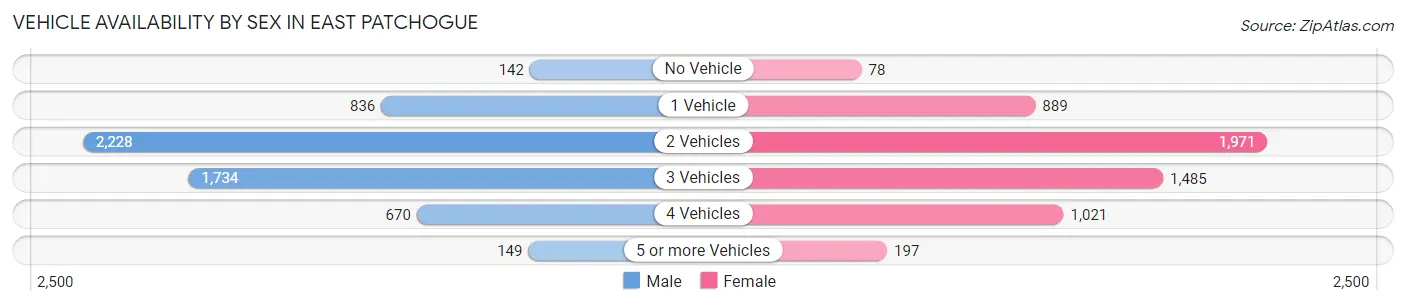
| Vehicles Available | Male | Female |
| No Vehicle | 142 (2.5%) | 78 (1.4%) |
| 1 Vehicle | 836 (14.5%) | 889 (15.8%) |
| 2 Vehicles | 2,228 (38.7%) | 1,971 (34.9%) |
| 3 Vehicles | 1,734 (30.1%) | 1,485 (26.3%) |
| 4 Vehicles | 670 (11.6%) | 1,021 (18.1%) |
| 5 or more Vehicles | 149 (2.6%) | 197 (3.5%) |
| Total | 5,759 (100.0%) | 5,641 (100.0%) |
Commute Time in East Patchogue
The most frequently occuring commute durations in East Patchogue are 30 to 34 minutes (1,906 commuters, 18.2%), 15 to 19 minutes (1,339 commuters, 12.8%), and 20 to 24 minutes (1,261 commuters, 12.0%).
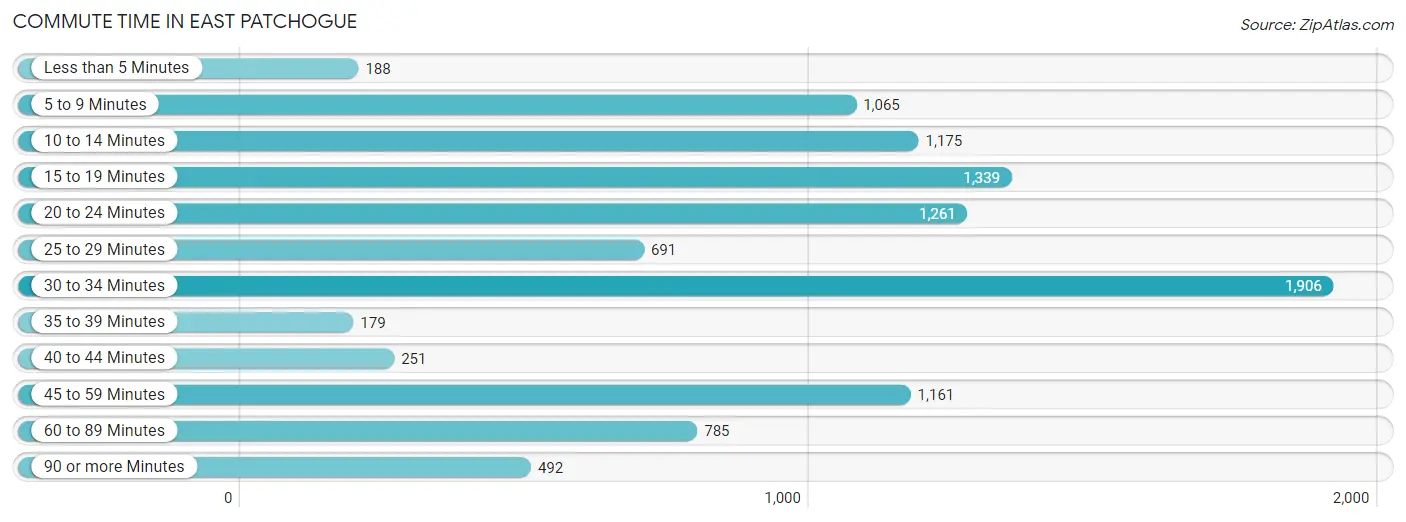
| Commute Time | # Commuters | % Commuters |
| Less than 5 Minutes | 188 | 1.8% |
| 5 to 9 Minutes | 1,065 | 10.2% |
| 10 to 14 Minutes | 1,175 | 11.2% |
| 15 to 19 Minutes | 1,339 | 12.8% |
| 20 to 24 Minutes | 1,261 | 12.0% |
| 25 to 29 Minutes | 691 | 6.6% |
| 30 to 34 Minutes | 1,906 | 18.2% |
| 35 to 39 Minutes | 179 | 1.7% |
| 40 to 44 Minutes | 251 | 2.4% |
| 45 to 59 Minutes | 1,161 | 11.1% |
| 60 to 89 Minutes | 785 | 7.5% |
| 90 or more Minutes | 492 | 4.7% |
Commute Time by Sex in East Patchogue
The most common commute times in East Patchogue are 45 to 59 minutes (883 commuters, 16.0%) for males and 30 to 34 minutes (1,076 commuters, 21.6%) for females.
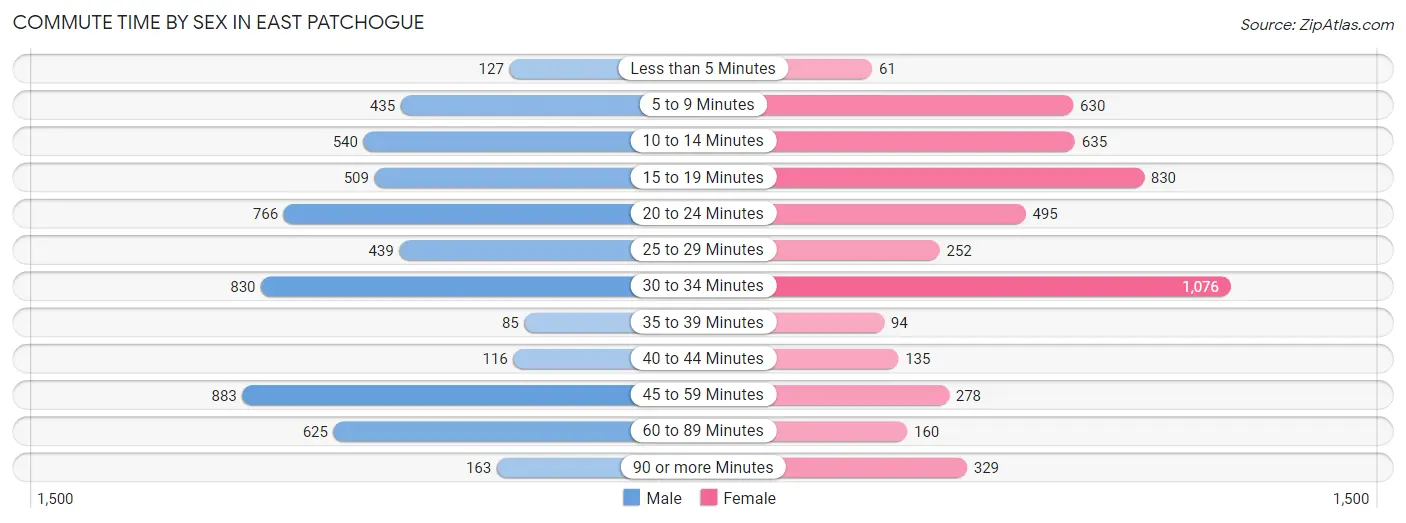
| Commute Time | Male | Female |
| Less than 5 Minutes | 127 (2.3%) | 61 (1.2%) |
| 5 to 9 Minutes | 435 (7.9%) | 630 (12.7%) |
| 10 to 14 Minutes | 540 (9.8%) | 635 (12.8%) |
| 15 to 19 Minutes | 509 (9.2%) | 830 (16.7%) |
| 20 to 24 Minutes | 766 (13.9%) | 495 (10.0%) |
| 25 to 29 Minutes | 439 (8.0%) | 252 (5.1%) |
| 30 to 34 Minutes | 830 (15.0%) | 1,076 (21.6%) |
| 35 to 39 Minutes | 85 (1.5%) | 94 (1.9%) |
| 40 to 44 Minutes | 116 (2.1%) | 135 (2.7%) |
| 45 to 59 Minutes | 883 (16.0%) | 278 (5.6%) |
| 60 to 89 Minutes | 625 (11.3%) | 160 (3.2%) |
| 90 or more Minutes | 163 (2.9%) | 329 (6.6%) |
Time of Departure to Work by Sex in East Patchogue
The most frequent times of departure to work in East Patchogue are 7:00 AM to 7:29 AM (1,253, 22.7%) for males and 8:00 AM to 8:29 AM (882, 17.7%) for females.
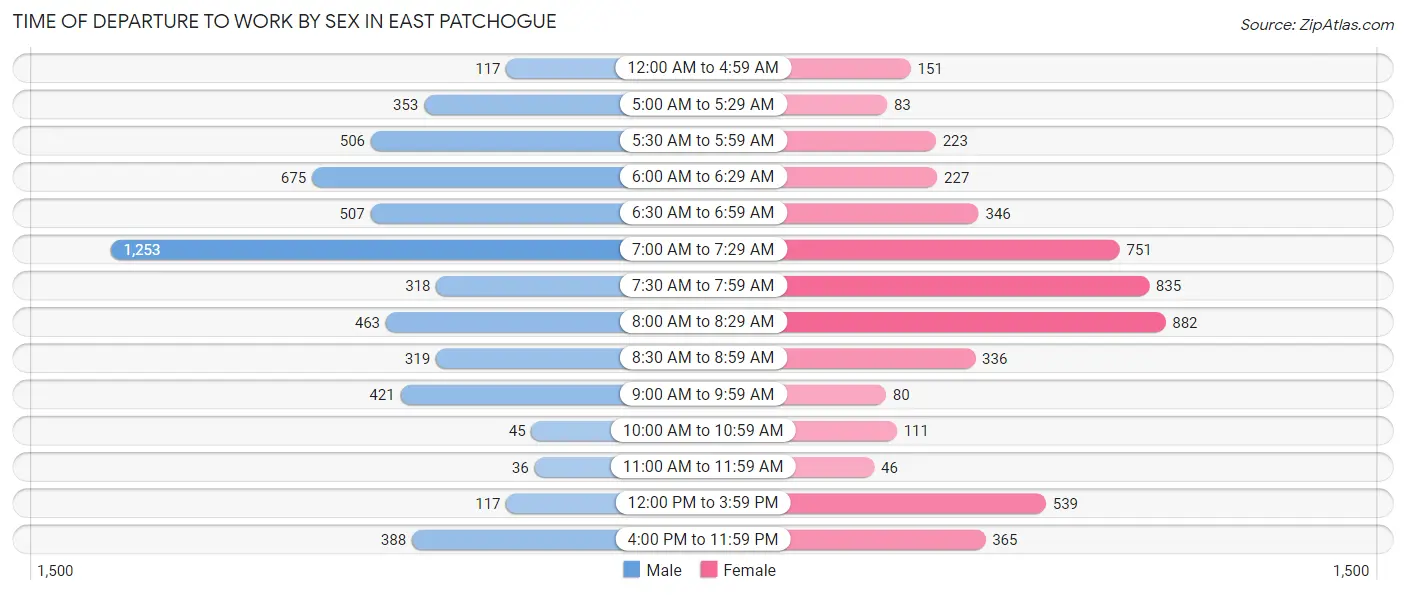
| Time of Departure | Male | Female |
| 12:00 AM to 4:59 AM | 117 (2.1%) | 151 (3.0%) |
| 5:00 AM to 5:29 AM | 353 (6.4%) | 83 (1.7%) |
| 5:30 AM to 5:59 AM | 506 (9.2%) | 223 (4.5%) |
| 6:00 AM to 6:29 AM | 675 (12.2%) | 227 (4.6%) |
| 6:30 AM to 6:59 AM | 507 (9.2%) | 346 (7.0%) |
| 7:00 AM to 7:29 AM | 1,253 (22.7%) | 751 (15.1%) |
| 7:30 AM to 7:59 AM | 318 (5.8%) | 835 (16.8%) |
| 8:00 AM to 8:29 AM | 463 (8.4%) | 882 (17.7%) |
| 8:30 AM to 8:59 AM | 319 (5.8%) | 336 (6.8%) |
| 9:00 AM to 9:59 AM | 421 (7.6%) | 80 (1.6%) |
| 10:00 AM to 10:59 AM | 45 (0.8%) | 111 (2.2%) |
| 11:00 AM to 11:59 AM | 36 (0.6%) | 46 (0.9%) |
| 12:00 PM to 3:59 PM | 117 (2.1%) | 539 (10.8%) |
| 4:00 PM to 11:59 PM | 388 (7.0%) | 365 (7.3%) |
| Total | 5,518 (100.0%) | 4,975 (100.0%) |
Housing Occupancy in East Patchogue
Occupancy by Ownership in East Patchogue
Of the total 8,011 dwellings in East Patchogue, owner-occupied units account for 5,903 (73.7%), while renter-occupied units make up 2,108 (26.3%).
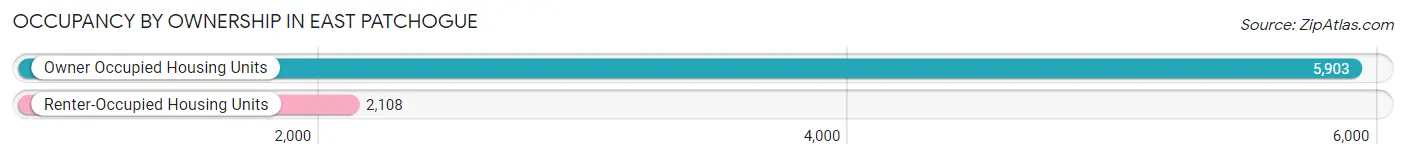
| Occupancy | # Housing Units | % Housing Units |
| Owner Occupied Housing Units | 5,903 | 73.7% |
| Renter-Occupied Housing Units | 2,108 | 26.3% |
| Total Occupied Housing Units | 8,011 | 100.0% |
Occupancy by Household Size in East Patchogue
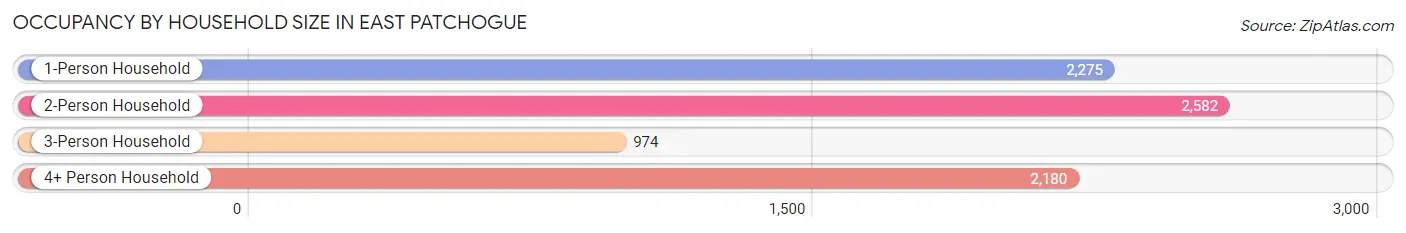
| Household Size | # Housing Units | % Housing Units |
| 1-Person Household | 2,275 | 28.4% |
| 2-Person Household | 2,582 | 32.2% |
| 3-Person Household | 974 | 12.2% |
| 4+ Person Household | 2,180 | 27.2% |
| Total Housing Units | 8,011 | 100.0% |
Occupancy by Ownership by Household Size in East Patchogue
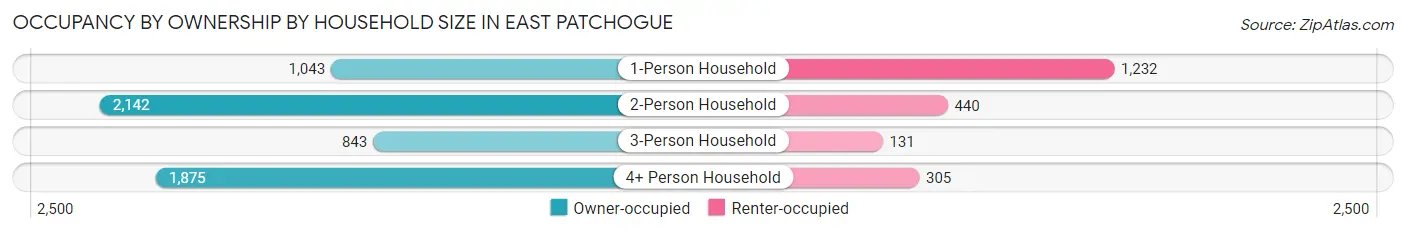
| Household Size | Owner-occupied | Renter-occupied |
| 1-Person Household | 1,043 (45.9%) | 1,232 (54.1%) |
| 2-Person Household | 2,142 (83.0%) | 440 (17.0%) |
| 3-Person Household | 843 (86.6%) | 131 (13.5%) |
| 4+ Person Household | 1,875 (86.0%) | 305 (14.0%) |
| Total Housing Units | 5,903 (73.7%) | 2,108 (26.3%) |
Occupancy by Educational Attainment in East Patchogue
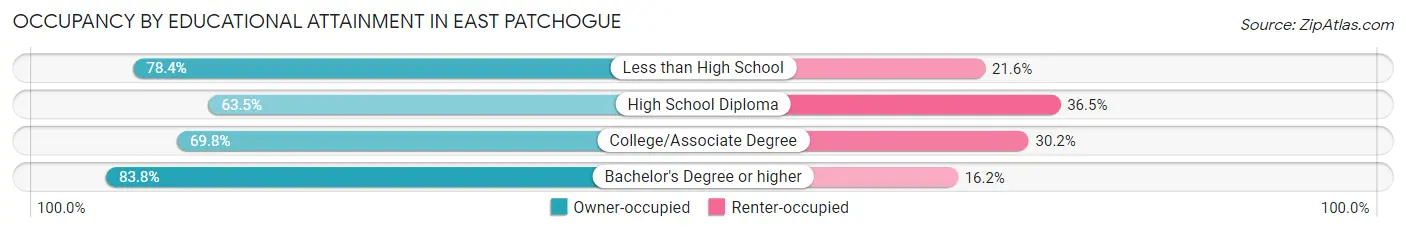
| Household Size | Owner-occupied | Renter-occupied |
| Less than High School | 665 (78.4%) | 183 (21.6%) |
| High School Diploma | 1,361 (63.5%) | 782 (36.5%) |
| College/Associate Degree | 1,646 (69.8%) | 713 (30.2%) |
| Bachelor's Degree or higher | 2,231 (83.8%) | 430 (16.2%) |
Occupancy by Age of Householder in East Patchogue
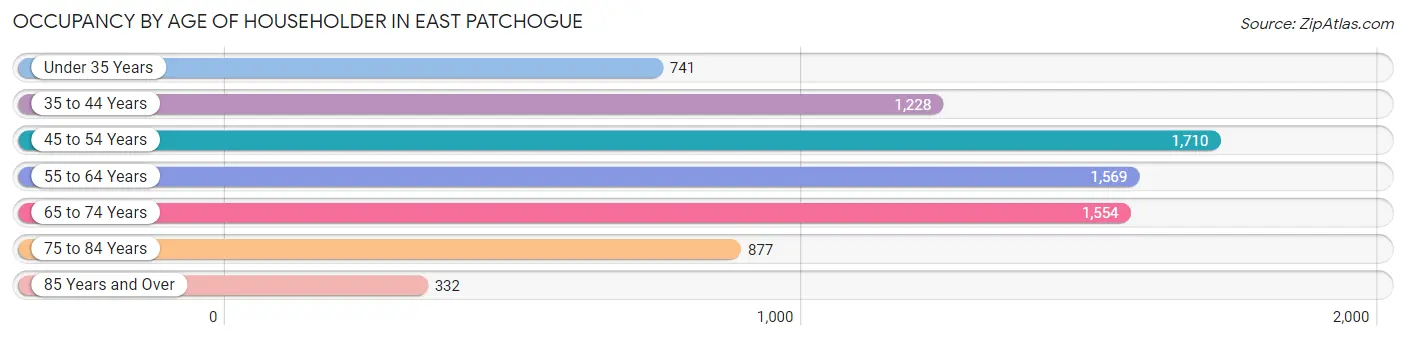
| Age Bracket | # Households | % Households |
| Under 35 Years | 741 | 9.2% |
| 35 to 44 Years | 1,228 | 15.3% |
| 45 to 54 Years | 1,710 | 21.3% |
| 55 to 64 Years | 1,569 | 19.6% |
| 65 to 74 Years | 1,554 | 19.4% |
| 75 to 84 Years | 877 | 11.0% |
| 85 Years and Over | 332 | 4.1% |
| Total | 8,011 | 100.0% |
Housing Finances in East Patchogue
Median Income by Occupancy in East Patchogue
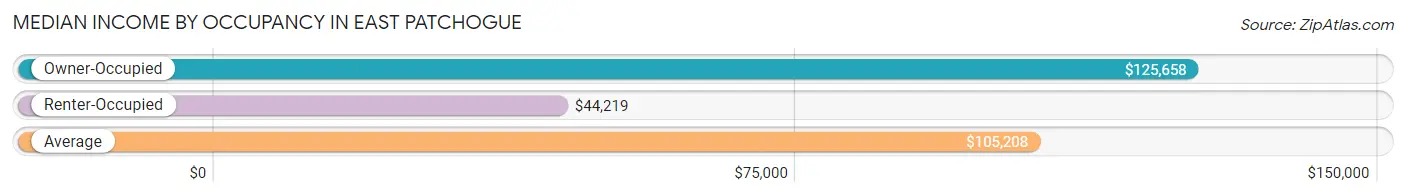
| Occupancy Type | # Households | Median Income |
| Owner-Occupied | 5,903 (73.7%) | $125,658 |
| Renter-Occupied | 2,108 (26.3%) | $44,219 |
| Average | 8,011 (100.0%) | $105,208 |
Occupancy by Householder Income Bracket in East Patchogue
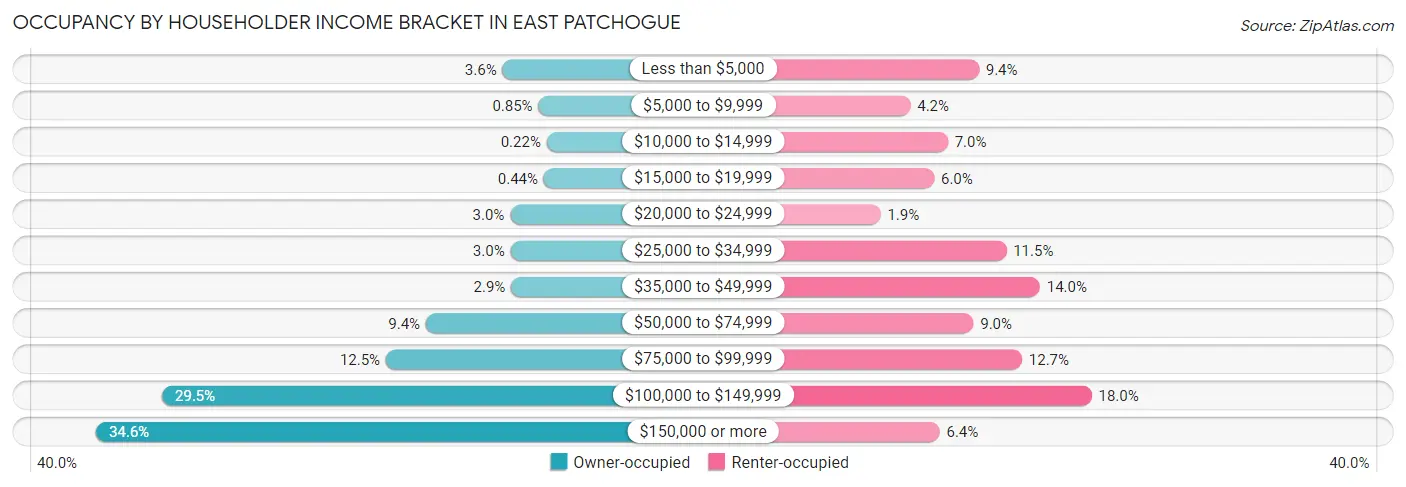
| Income Bracket | Owner-occupied | Renter-occupied |
| Less than $5,000 | 212 (3.6%) | 198 (9.4%) |
| $5,000 to $9,999 | 50 (0.9%) | 88 (4.2%) |
| $10,000 to $14,999 | 13 (0.2%) | 148 (7.0%) |
| $15,000 to $19,999 | 26 (0.4%) | 126 (6.0%) |
| $20,000 to $24,999 | 177 (3.0%) | 40 (1.9%) |
| $25,000 to $34,999 | 176 (3.0%) | 242 (11.5%) |
| $35,000 to $49,999 | 173 (2.9%) | 296 (14.0%) |
| $50,000 to $74,999 | 556 (9.4%) | 189 (9.0%) |
| $75,000 to $99,999 | 736 (12.5%) | 267 (12.7%) |
| $100,000 to $149,999 | 1,744 (29.5%) | 379 (18.0%) |
| $150,000 or more | 2,040 (34.6%) | 135 (6.4%) |
| Total | 5,903 (100.0%) | 2,108 (100.0%) |
Monthly Housing Cost Tiers in East Patchogue
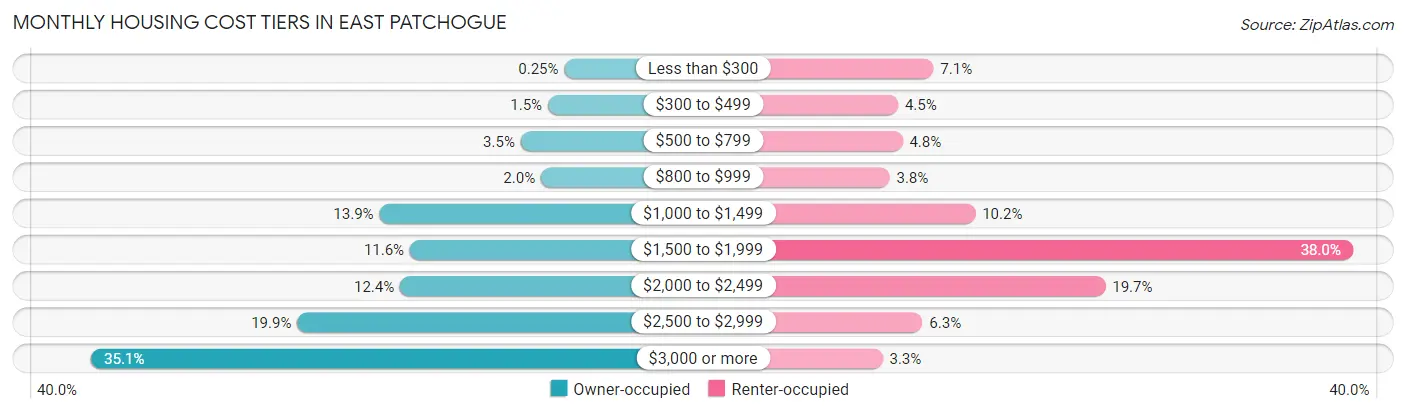
| Monthly Cost | Owner-occupied | Renter-occupied |
| Less than $300 | 15 (0.3%) | 149 (7.1%) |
| $300 to $499 | 86 (1.5%) | 94 (4.5%) |
| $500 to $799 | 204 (3.5%) | 101 (4.8%) |
| $800 to $999 | 116 (2.0%) | 81 (3.8%) |
| $1,000 to $1,499 | 819 (13.9%) | 214 (10.2%) |
| $1,500 to $1,999 | 686 (11.6%) | 800 (38.0%) |
| $2,000 to $2,499 | 729 (12.3%) | 416 (19.7%) |
| $2,500 to $2,999 | 1,176 (19.9%) | 132 (6.3%) |
| $3,000 or more | 2,072 (35.1%) | 70 (3.3%) |
| Total | 5,903 (100.0%) | 2,108 (100.0%) |
Physical Housing Characteristics in East Patchogue
Housing Structures in East Patchogue
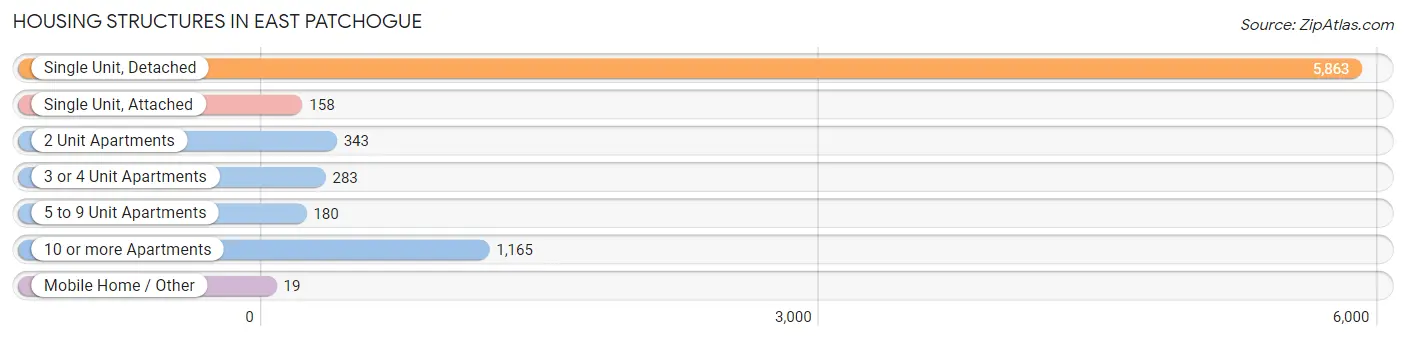
| Structure Type | # Housing Units | % Housing Units |
| Single Unit, Detached | 5,863 | 73.2% |
| Single Unit, Attached | 158 | 2.0% |
| 2 Unit Apartments | 343 | 4.3% |
| 3 or 4 Unit Apartments | 283 | 3.5% |
| 5 to 9 Unit Apartments | 180 | 2.2% |
| 10 or more Apartments | 1,165 | 14.5% |
| Mobile Home / Other | 19 | 0.2% |
| Total | 8,011 | 100.0% |
Housing Structures by Occupancy in East Patchogue
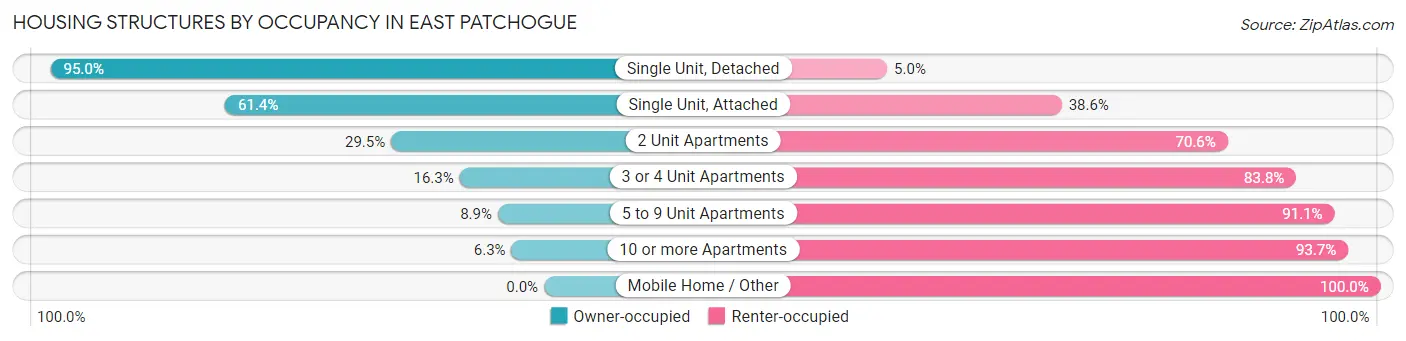
| Structure Type | Owner-occupied | Renter-occupied |
| Single Unit, Detached | 5,570 (95.0%) | 293 (5.0%) |
| Single Unit, Attached | 97 (61.4%) | 61 (38.6%) |
| 2 Unit Apartments | 101 (29.4%) | 242 (70.6%) |
| 3 or 4 Unit Apartments | 46 (16.3%) | 237 (83.8%) |
| 5 to 9 Unit Apartments | 16 (8.9%) | 164 (91.1%) |
| 10 or more Apartments | 73 (6.3%) | 1,092 (93.7%) |
| Mobile Home / Other | 0 (0.0%) | 19 (100.0%) |
| Total | 5,903 (73.7%) | 2,108 (26.3%) |
Housing Structures by Number of Rooms in East Patchogue
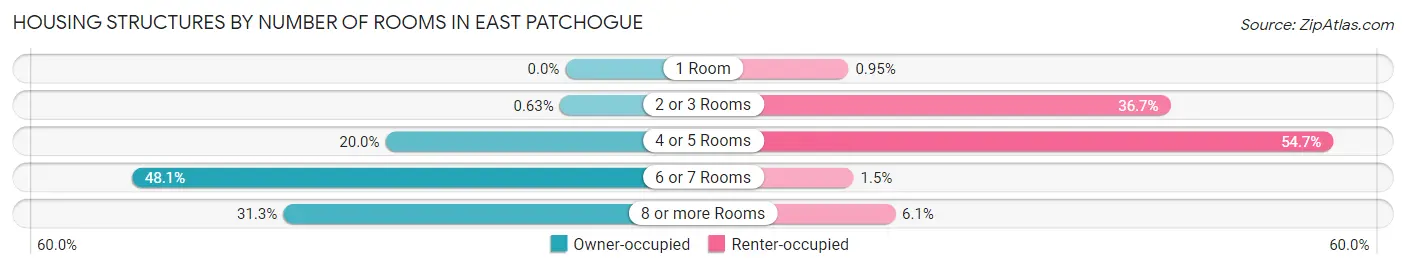
| Number of Rooms | Owner-occupied | Renter-occupied |
| 1 Room | 0 (0.0%) | 20 (0.9%) |
| 2 or 3 Rooms | 37 (0.6%) | 773 (36.7%) |
| 4 or 5 Rooms | 1,178 (20.0%) | 1,154 (54.7%) |
| 6 or 7 Rooms | 2,839 (48.1%) | 32 (1.5%) |
| 8 or more Rooms | 1,849 (31.3%) | 129 (6.1%) |
| Total | 5,903 (100.0%) | 2,108 (100.0%) |
Housing Structure by Heating Type in East Patchogue
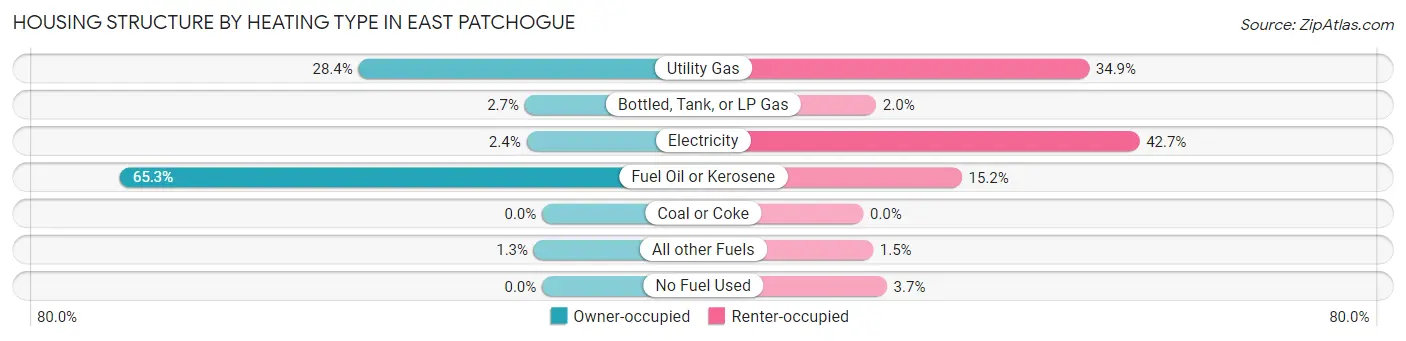
| Heating Type | Owner-occupied | Renter-occupied |
| Utility Gas | 1,675 (28.4%) | 736 (34.9%) |
| Bottled, Tank, or LP Gas | 158 (2.7%) | 42 (2.0%) |
| Electricity | 142 (2.4%) | 900 (42.7%) |
| Fuel Oil or Kerosene | 3,853 (65.3%) | 321 (15.2%) |
| Coal or Coke | 0 (0.0%) | 0 (0.0%) |
| All other Fuels | 75 (1.3%) | 32 (1.5%) |
| No Fuel Used | 0 (0.0%) | 77 (3.6%) |
| Total | 5,903 (100.0%) | 2,108 (100.0%) |
Household Vehicle Usage in East Patchogue
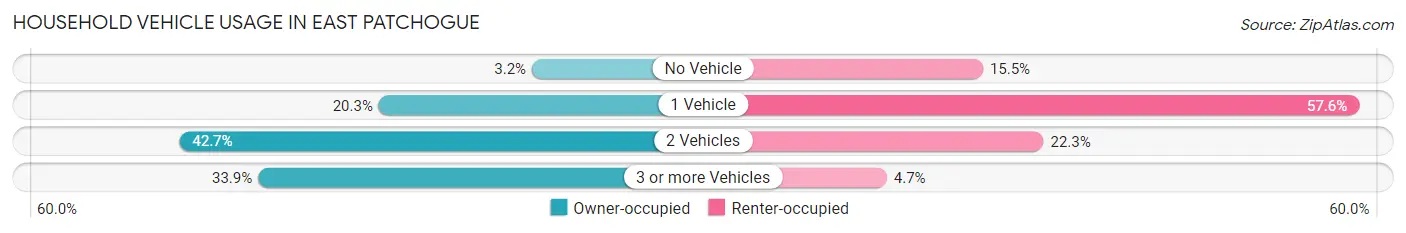
| Vehicles per Household | Owner-occupied | Renter-occupied |
| No Vehicle | 187 (3.2%) | 326 (15.5%) |
| 1 Vehicle | 1,200 (20.3%) | 1,214 (57.6%) |
| 2 Vehicles | 2,518 (42.7%) | 469 (22.3%) |
| 3 or more Vehicles | 1,998 (33.9%) | 99 (4.7%) |
| Total | 5,903 (100.0%) | 2,108 (100.0%) |
Real Estate & Mortgages in East Patchogue
Real Estate and Mortgage Overview in East Patchogue
| Characteristic | Without Mortgage | With Mortgage |
| Housing Units | 1,558 | 4,345 |
| Median Property Value | $426,100 | $434,800 |
| Median Household Income | $76,563 | $1,636 |
| Monthly Housing Costs | $1,248 | $2,072 |
| Real Estate Taxes | $9,065 | $45 |
Property Value by Mortgage Status in East Patchogue
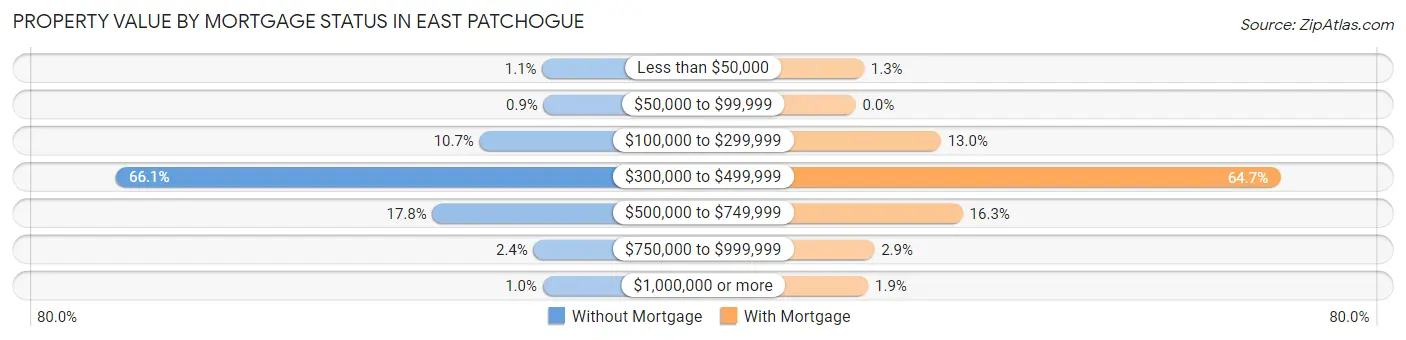
| Property Value | Without Mortgage | With Mortgage |
| Less than $50,000 | 17 (1.1%) | 55 (1.3%) |
| $50,000 to $99,999 | 14 (0.9%) | 0 (0.0%) |
| $100,000 to $299,999 | 166 (10.6%) | 564 (13.0%) |
| $300,000 to $499,999 | 1,029 (66.0%) | 2,810 (64.7%) |
| $500,000 to $749,999 | 278 (17.8%) | 709 (16.3%) |
| $750,000 to $999,999 | 38 (2.4%) | 124 (2.9%) |
| $1,000,000 or more | 16 (1.0%) | 83 (1.9%) |
| Total | 1,558 (100.0%) | 4,345 (100.0%) |
Household Income by Mortgage Status in East Patchogue
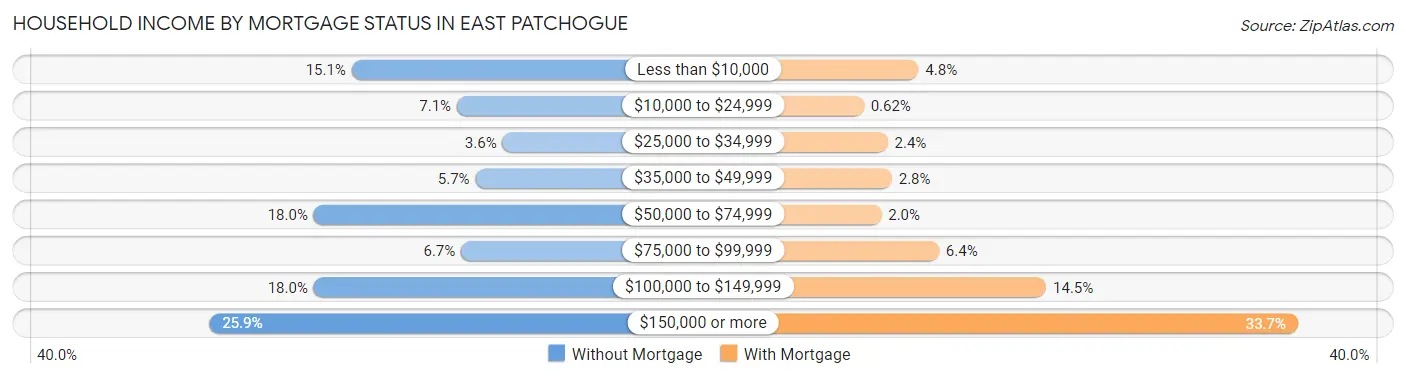
| Household Income | Without Mortgage | With Mortgage |
| Less than $10,000 | 235 (15.1%) | 208 (4.8%) |
| $10,000 to $24,999 | 110 (7.1%) | 27 (0.6%) |
| $25,000 to $34,999 | 56 (3.6%) | 106 (2.4%) |
| $35,000 to $49,999 | 88 (5.7%) | 120 (2.8%) |
| $50,000 to $74,999 | 280 (18.0%) | 85 (2.0%) |
| $75,000 to $99,999 | 105 (6.7%) | 276 (6.4%) |
| $100,000 to $149,999 | 280 (18.0%) | 631 (14.5%) |
| $150,000 or more | 404 (25.9%) | 1,464 (33.7%) |
| Total | 1,558 (100.0%) | 4,345 (100.0%) |
Property Value to Household Income Ratio in East Patchogue
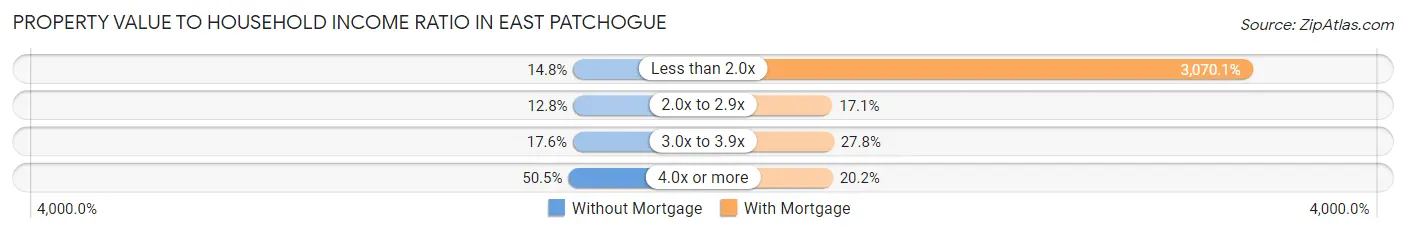
| Value-to-Income Ratio | Without Mortgage | With Mortgage |
| Less than 2.0x | 230 (14.8%) | 133,396 (3,070.1%) |
| 2.0x to 2.9x | 200 (12.8%) | 741 (17.1%) |
| 3.0x to 3.9x | 274 (17.6%) | 1,208 (27.8%) |
| 4.0x or more | 787 (50.5%) | 879 (20.2%) |
| Total | 1,558 (100.0%) | 4,345 (100.0%) |
Real Estate Taxes by Mortgage Status in East Patchogue
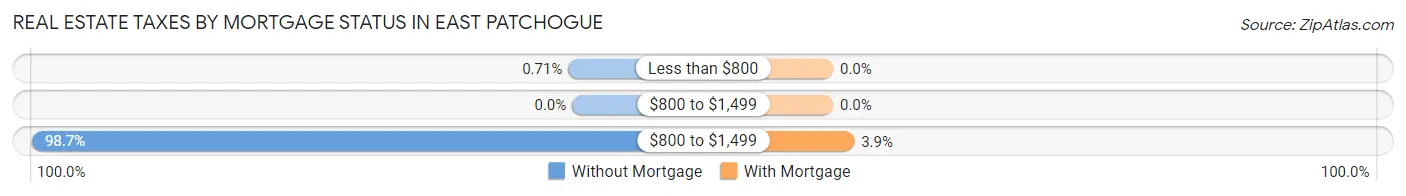
| Property Taxes | Without Mortgage | With Mortgage |
| Less than $800 | 11 (0.7%) | 0 (0.0%) |
| $800 to $1,499 | 0 (0.0%) | 0 (0.0%) |
| $800 to $1,499 | 1,537 (98.7%) | 168 (3.9%) |
| Total | 1,558 (100.0%) | 4,345 (100.0%) |
Health & Disability in East Patchogue
Health Insurance Coverage by Age in East Patchogue
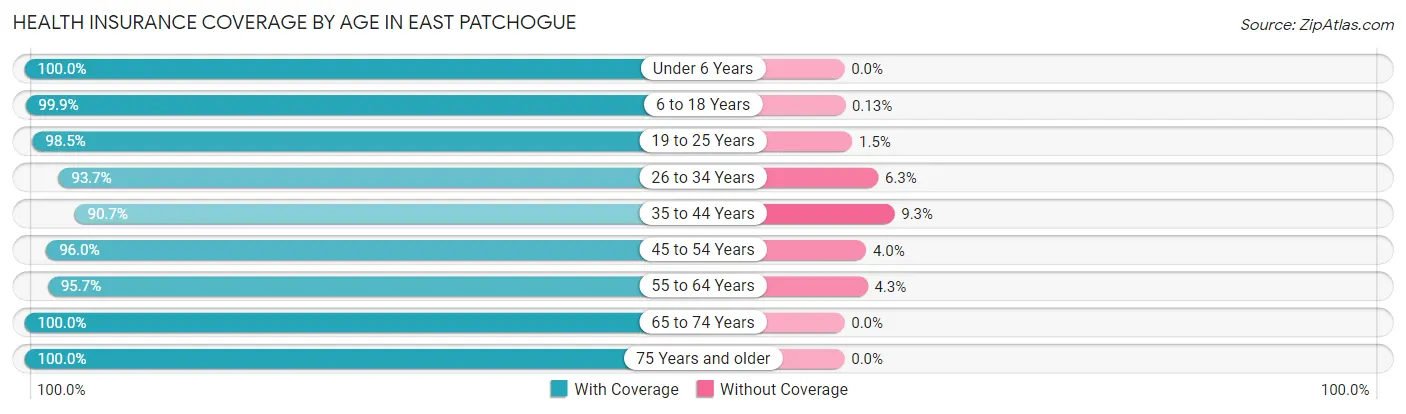
| Age Bracket | With Coverage | Without Coverage |
| Under 6 Years | 1,343 (100.0%) | 0 (0.0%) |
| 6 to 18 Years | 3,011 (99.9%) | 4 (0.1%) |
| 19 to 25 Years | 1,689 (98.5%) | 25 (1.5%) |
| 26 to 34 Years | 2,323 (93.7%) | 156 (6.3%) |
| 35 to 44 Years | 2,549 (90.7%) | 262 (9.3%) |
| 45 to 54 Years | 3,043 (96.0%) | 128 (4.0%) |
| 55 to 64 Years | 2,724 (95.7%) | 123 (4.3%) |
| 65 to 74 Years | 2,201 (100.0%) | 0 (0.0%) |
| 75 Years and older | 1,671 (100.0%) | 0 (0.0%) |
| Total | 20,554 (96.7%) | 698 (3.3%) |
Health Insurance Coverage by Citizenship Status in East Patchogue
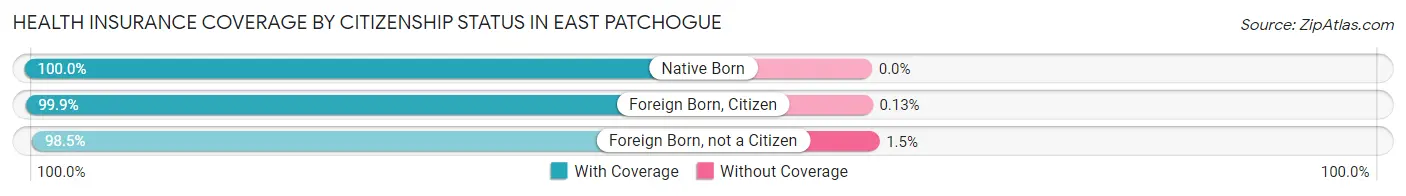
| Citizenship Status | With Coverage | Without Coverage |
| Native Born | 1,343 (100.0%) | 0 (0.0%) |
| Foreign Born, Citizen | 3,011 (99.9%) | 4 (0.1%) |
| Foreign Born, not a Citizen | 1,689 (98.5%) | 25 (1.5%) |
Health Insurance Coverage by Household Income in East Patchogue
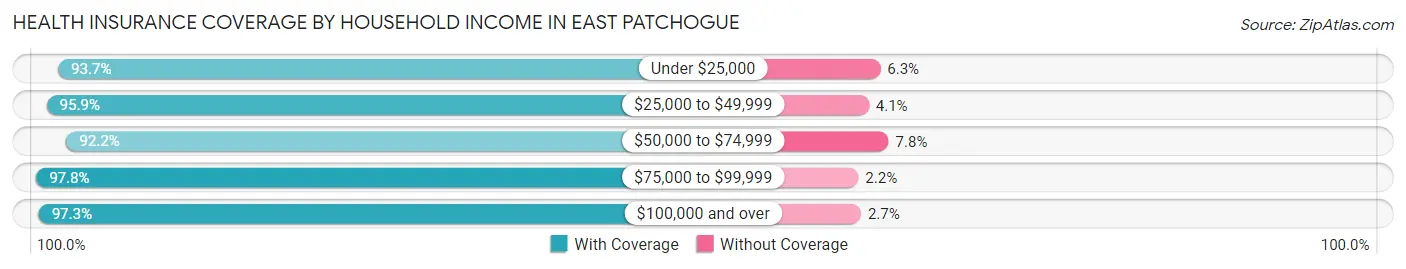
| Household Income | With Coverage | Without Coverage |
| Under $25,000 | 1,400 (93.7%) | 94 (6.3%) |
| $25,000 to $49,999 | 1,392 (95.9%) | 60 (4.1%) |
| $50,000 to $74,999 | 1,281 (92.2%) | 109 (7.8%) |
| $75,000 to $99,999 | 2,332 (97.8%) | 52 (2.2%) |
| $100,000 and over | 14,036 (97.3%) | 383 (2.7%) |
Public vs Private Health Insurance Coverage by Age in East Patchogue
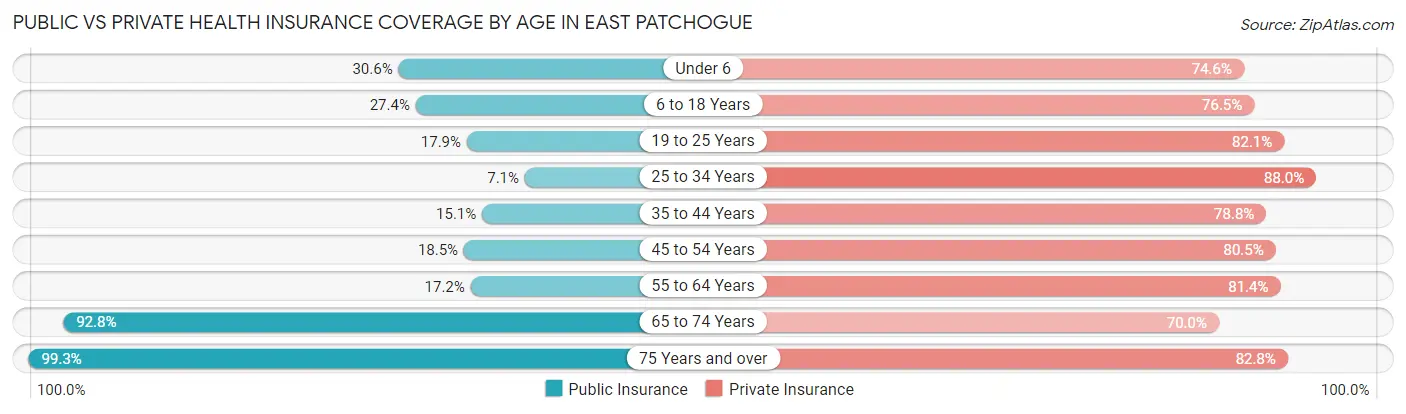
| Age Bracket | Public Insurance | Private Insurance |
| Under 6 | 411 (30.6%) | 1,002 (74.6%) |
| 6 to 18 Years | 826 (27.4%) | 2,307 (76.5%) |
| 19 to 25 Years | 307 (17.9%) | 1,407 (82.1%) |
| 25 to 34 Years | 177 (7.1%) | 2,182 (88.0%) |
| 35 to 44 Years | 424 (15.1%) | 2,214 (78.8%) |
| 45 to 54 Years | 585 (18.4%) | 2,553 (80.5%) |
| 55 to 64 Years | 490 (17.2%) | 2,317 (81.4%) |
| 65 to 74 Years | 2,043 (92.8%) | 1,540 (70.0%) |
| 75 Years and over | 1,659 (99.3%) | 1,383 (82.8%) |
| Total | 6,922 (32.6%) | 16,905 (79.5%) |
Disability Status by Sex by Age in East Patchogue
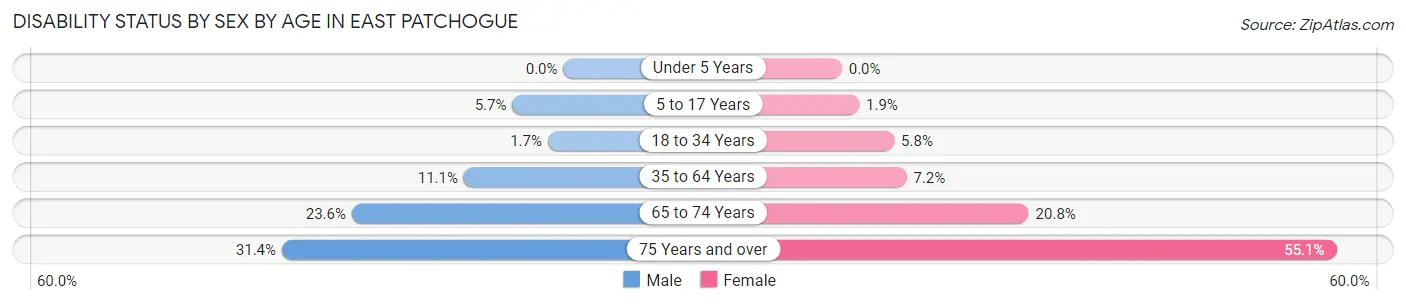
| Age Bracket | Male | Female |
| Under 5 Years | 0 (0.0%) | 0 (0.0%) |
| 5 to 17 Years | 74 (5.7%) | 32 (1.9%) |
| 18 to 34 Years | 40 (1.7%) | 131 (5.8%) |
| 35 to 64 Years | 496 (11.1%) | 314 (7.2%) |
| 65 to 74 Years | 197 (23.6%) | 284 (20.8%) |
| 75 Years and over | 184 (31.4%) | 597 (55.1%) |
Disability Class by Sex by Age in East Patchogue
Disability Class: Hearing Difficulty
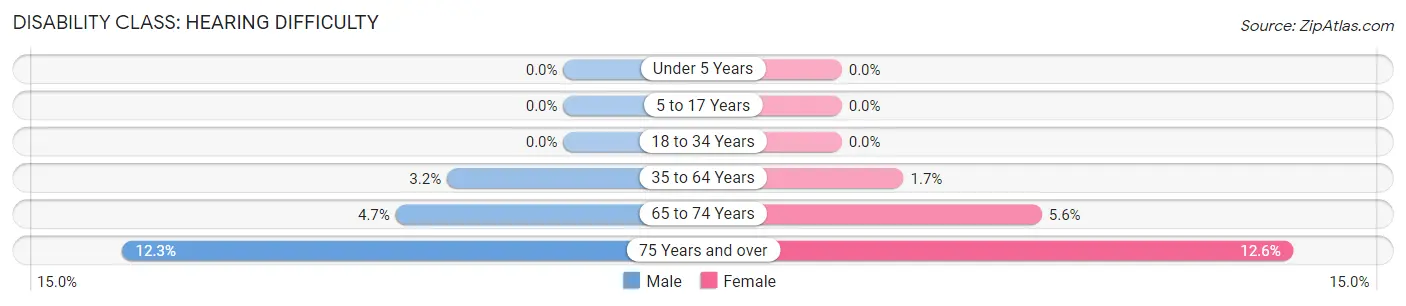
| Age Bracket | Male | Female |
| Under 5 Years | 0 (0.0%) | 0 (0.0%) |
| 5 to 17 Years | 0 (0.0%) | 0 (0.0%) |
| 18 to 34 Years | 0 (0.0%) | 0 (0.0%) |
| 35 to 64 Years | 145 (3.2%) | 75 (1.7%) |
| 65 to 74 Years | 39 (4.7%) | 76 (5.6%) |
| 75 Years and over | 72 (12.3%) | 136 (12.6%) |
Disability Class: Vision Difficulty
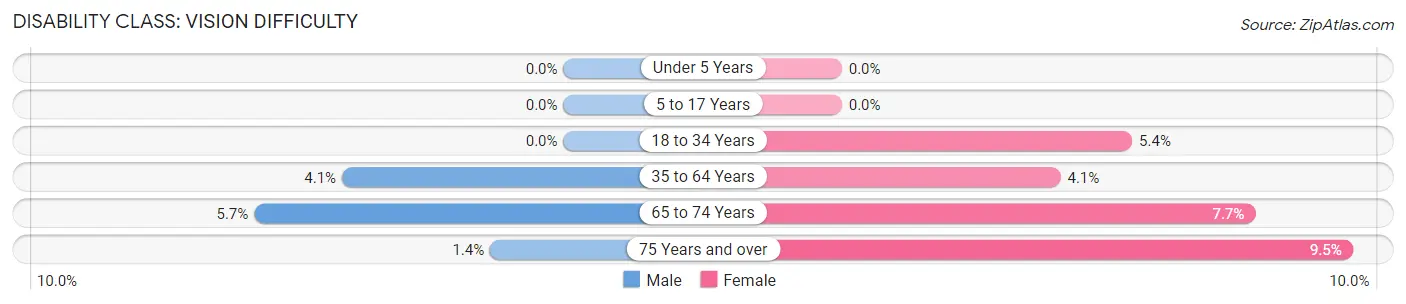
| Age Bracket | Male | Female |
| Under 5 Years | 0 (0.0%) | 0 (0.0%) |
| 5 to 17 Years | 0 (0.0%) | 0 (0.0%) |
| 18 to 34 Years | 0 (0.0%) | 121 (5.4%) |
| 35 to 64 Years | 184 (4.1%) | 177 (4.1%) |
| 65 to 74 Years | 48 (5.7%) | 105 (7.7%) |
| 75 Years and over | 8 (1.4%) | 103 (9.5%) |
Disability Class: Cognitive Difficulty
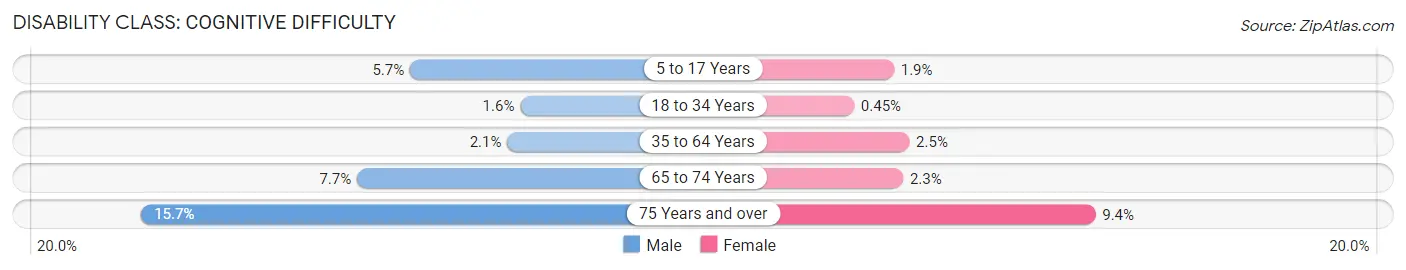
| Age Bracket | Male | Female |
| 5 to 17 Years | 74 (5.7%) | 32 (1.9%) |
| 18 to 34 Years | 37 (1.6%) | 10 (0.4%) |
| 35 to 64 Years | 93 (2.1%) | 109 (2.5%) |
| 65 to 74 Years | 64 (7.7%) | 31 (2.3%) |
| 75 Years and over | 92 (15.7%) | 102 (9.4%) |
Disability Class: Ambulatory Difficulty
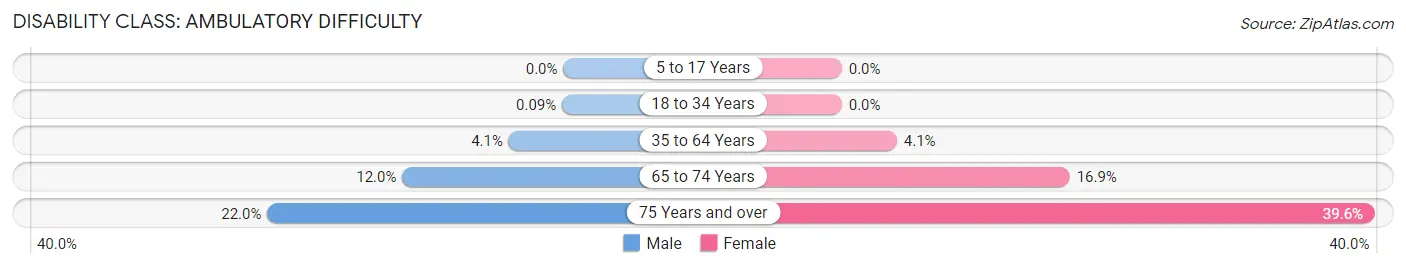
| Age Bracket | Male | Female |
| 5 to 17 Years | 0 (0.0%) | 0 (0.0%) |
| 18 to 34 Years | 2 (0.1%) | 0 (0.0%) |
| 35 to 64 Years | 181 (4.1%) | 178 (4.1%) |
| 65 to 74 Years | 100 (12.0%) | 231 (16.9%) |
| 75 Years and over | 129 (22.0%) | 429 (39.6%) |
Disability Class: Self-Care Difficulty
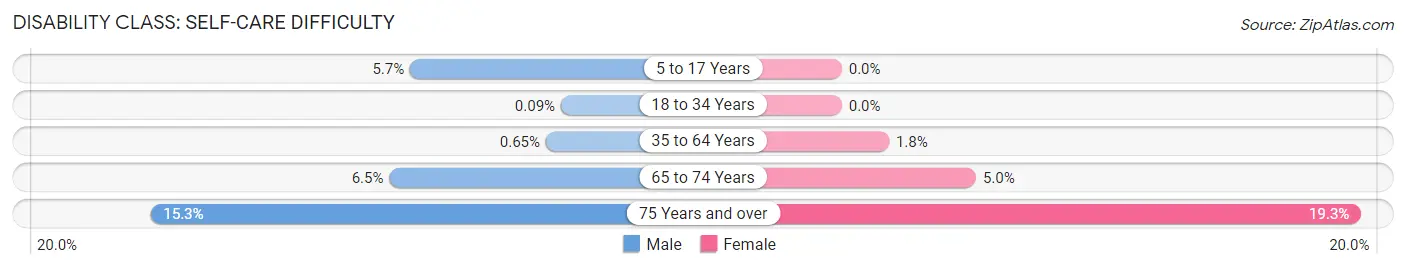
| Age Bracket | Male | Female |
| 5 to 17 Years | 74 (5.7%) | 0 (0.0%) |
| 18 to 34 Years | 2 (0.1%) | 0 (0.0%) |
| 35 to 64 Years | 29 (0.6%) | 76 (1.8%) |
| 65 to 74 Years | 54 (6.5%) | 68 (5.0%) |
| 75 Years and over | 90 (15.3%) | 209 (19.3%) |
Technology Access in East Patchogue
Computing Device Access in East Patchogue
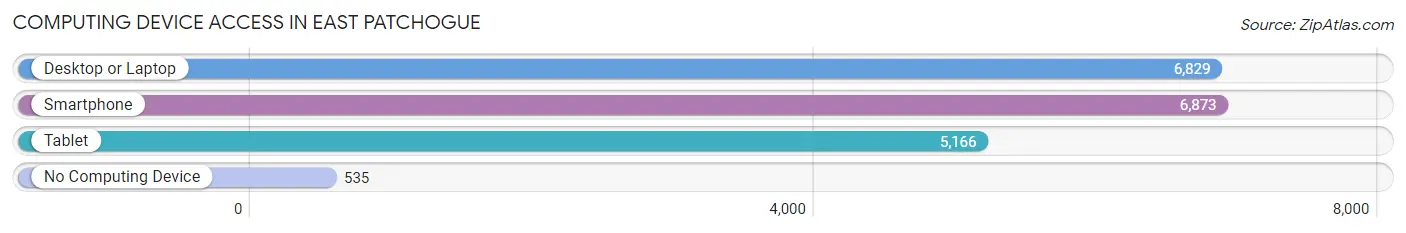
| Device Type | # Households | % Households |
| Desktop or Laptop | 6,829 | 85.3% |
| Smartphone | 6,873 | 85.8% |
| Tablet | 5,166 | 64.5% |
| No Computing Device | 535 | 6.7% |
| Total | 8,011 | 100.0% |
Internet Access in East Patchogue
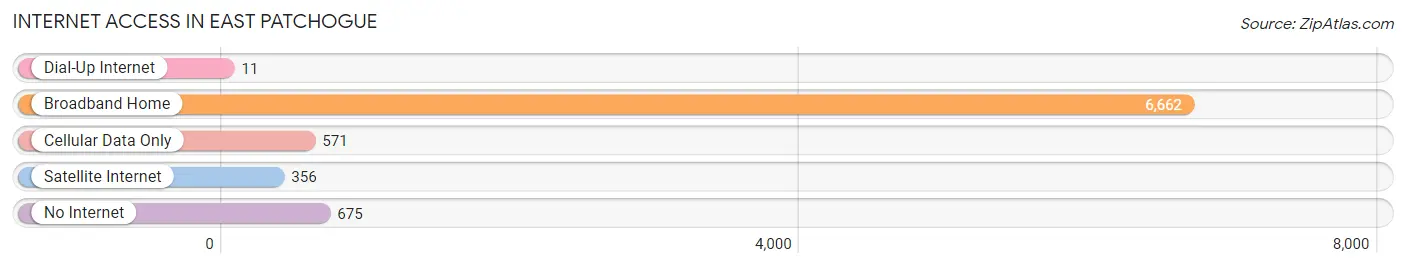
| Internet Type | # Households | % Households |
| Dial-Up Internet | 11 | 0.1% |
| Broadband Home | 6,662 | 83.2% |
| Cellular Data Only | 571 | 7.1% |
| Satellite Internet | 356 | 4.4% |
| No Internet | 675 | 8.4% |
| Total | 8,011 | 100.0% |
East Patchogue Summary
Patchogue is a hamlet located in the Town of Brookhaven in Suffolk County, New York. It is situated on the south shore of Long Island, approximately 60 miles east of New York City. The hamlet is bordered by the Great South Bay to the north, Bellport to the east, and Medford to the west. The population of Patchogue was 11,798 as of the 2010 census.
History
The area now known as Patchogue was originally inhabited by the Secatogue Native American tribe. The first European settlers arrived in the area in the 1650s, and the hamlet was officially founded in 1790. The name Patchogue is derived from the Algonquin word “patchogues,” which means “where the river meets the bay.”
In the late 19th century, Patchogue became a popular summer resort destination for wealthy New Yorkers. The hamlet was home to several large hotels, including the Patchogue Hotel, which was built in 1872 and was the largest hotel on Long Island at the time.
In the early 20th century, Patchogue experienced a period of rapid growth and development. The Patchogue Theatre was built in 1923, and the Patchogue-Medford Library was established in 1924. The Patchogue-Medford School District was formed in 1930, and the Patchogue-Medford High School was built in 1932.
Geography
Patchogue is located on the south shore of Long Island, approximately 60 miles east of New York City. The hamlet is bordered by the Great South Bay to the north, Bellport to the east, and Medford to the west. The Patchogue River runs through the center of the hamlet.
The terrain of Patchogue is mostly flat, with some rolling hills in the western part of the hamlet. The climate is humid subtropical, with hot, humid summers and mild winters.
Economy
The economy of Patchogue is largely based on tourism and retail. The hamlet is home to several popular restaurants, bars, and shops, as well as a number of hotels and motels. The Patchogue Theatre is a popular venue for concerts and other events.
The Patchogue-Medford School District is the largest employer in the hamlet, followed by Brookhaven Memorial Hospital Medical Center and the Patchogue-Medford Library.
Demographics
As of the 2010 census, the population of Patchogue was 11,798. The racial makeup of the hamlet was 79.3% White, 8.2% African American, 0.3% Native American, 4.2% Asian, and 6.7% Hispanic or Latino.
The median household income in Patchogue was $63,945, and the median family income was $76,945. The per capita income was $30,945. The unemployment rate was 4.2%.
Common Questions
What is Per Capita Income in East Patchogue?
Per Capita income in East Patchogue is $46,241.
What is the Median Family Income in East Patchogue?
Median Family Income in East Patchogue is $127,054.
What is the Median Household income in East Patchogue?
Median Household Income in East Patchogue is $105,208.
What is Income or Wage Gap in East Patchogue?
Income or Wage Gap in East Patchogue is 37.9%.
Women in East Patchogue earn 62.1 cents for every dollar earned by a man.
What is Inequality or Gini Index in East Patchogue?
Inequality or Gini Index in East Patchogue is 0.41.
What is the Total Population of East Patchogue?
Total Population of East Patchogue is 21,449.
What is the Total Male Population of East Patchogue?
Total Male Population of East Patchogue is 9,960.
What is the Total Female Population of East Patchogue?
Total Female Population of East Patchogue is 11,489.
What is the Ratio of Males per 100 Females in East Patchogue?
There are 86.69 Males per 100 Females in East Patchogue.
What is the Ratio of Females per 100 Males in East Patchogue?
There are 115.35 Females per 100 Males in East Patchogue.
What is the Median Population Age in East Patchogue?
Median Population Age in East Patchogue is 42.2 Years.
What is the Average Family Size in East Patchogue
Average Family Size in East Patchogue is 3.4 People.
What is the Average Household Size in East Patchogue
Average Household Size in East Patchogue is 2.6 People.
How Large is the Labor Force in East Patchogue?
There are 12,195 People in the Labor Forcein in East Patchogue.
What is the Percentage of People in the Labor Force in East Patchogue?
67.9% of People are in the Labor Force in East Patchogue.
What is the Unemployment Rate in East Patchogue?
Unemployment Rate in East Patchogue is 4.7%.