Norwich, NY Map & Demographics
Norwich Map
Norwich Overview
$32,626
PER CAPITA INCOME
$71,659
AVG FAMILY INCOME
$50,579
AVG HOUSEHOLD INCOME
39.4%
WAGE / INCOME GAP [ % ]
60.6¢/ $1
WAGE / INCOME GAP [ $ ]
0.49
INEQUALITY / GINI INDEX
6,950
TOTAL POPULATION
3,222
MALE POPULATION
3,728
FEMALE POPULATION
86.43
MALES / 100 FEMALES
115.70
FEMALES / 100 MALES
40.5
MEDIAN AGE
2.8
AVG FAMILY SIZE
2.2
AVG HOUSEHOLD SIZE
3,441
LABOR FORCE [ PEOPLE ]
59.3%
PERCENT IN LABOR FORCE
11.7%
UNEMPLOYMENT RATE
Norwich Zip Codes
Norwich Area Codes
Income in Norwich
Income Overview in Norwich
Per Capita Income in Norwich is $32,626, while median incomes of families and households are $71,659 and $50,579 respectively.
| Characteristic | Number | Measure |
| Per Capita Income | 6,950 | $32,626 |
| Median Family Income | 1,687 | $71,659 |
| Mean Family Income | 1,687 | $92,095 |
| Median Household Income | 3,087 | $50,579 |
| Mean Household Income | 3,087 | $75,206 |
| Income Deficit | 1,687 | $0 |
| Wage / Income Gap (%) | 6,950 | 39.35% |
| Wage / Income Gap ($) | 6,950 | 60.65¢ per $1 |
| Gini / Inequality Index | 6,950 | 0.49 |
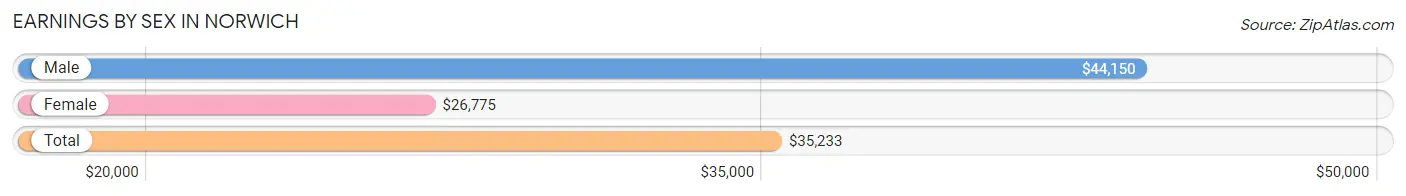
Earnings by Sex in Norwich
Average Earnings in Norwich are $35,233, $44,150 for men and $26,775 for women, a difference of 39.4%.
| Sex | Number | Average Earnings |
| Male | 1,734 (48.9%) | $44,150 |
| Female | 1,811 (51.1%) | $26,775 |
| Total | 3,545 (100.0%) | $35,233 |
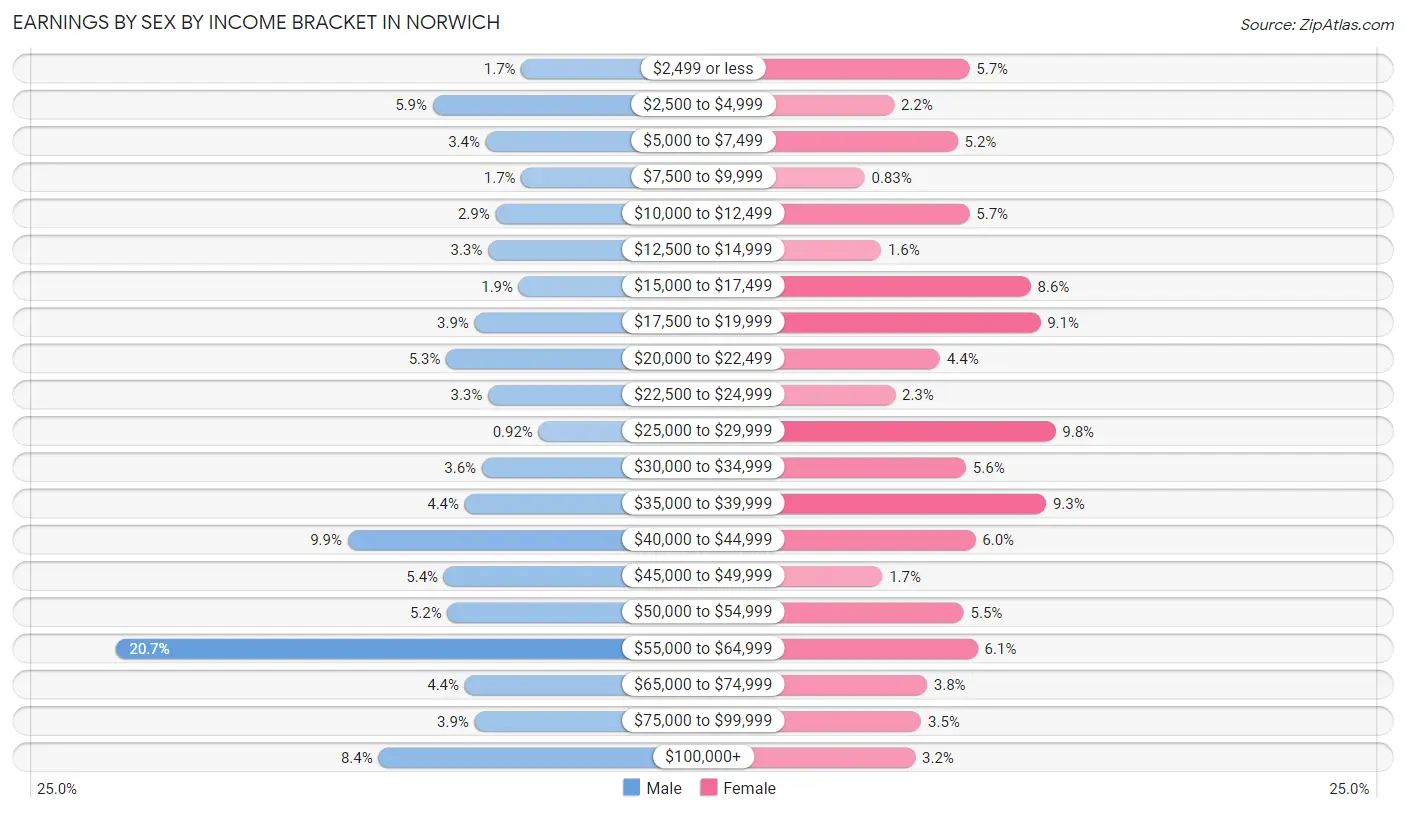
Earnings by Sex by Income Bracket in Norwich
The most common earnings brackets in Norwich are $55,000 to $64,999 for men (359 | 20.7%) and $25,000 to $29,999 for women (177 | 9.8%).
| Income | Male | Female |
| $2,499 or less | 30 (1.7%) | 104 (5.7%) |
| $2,500 to $4,999 | 102 (5.9%) | 40 (2.2%) |
| $5,000 to $7,499 | 59 (3.4%) | 94 (5.2%) |
| $7,500 to $9,999 | 30 (1.7%) | 15 (0.8%) |
| $10,000 to $12,499 | 51 (2.9%) | 104 (5.7%) |
| $12,500 to $14,999 | 57 (3.3%) | 29 (1.6%) |
| $15,000 to $17,499 | 32 (1.8%) | 156 (8.6%) |
| $17,500 to $19,999 | 68 (3.9%) | 164 (9.1%) |
| $20,000 to $22,499 | 91 (5.2%) | 79 (4.4%) |
| $22,500 to $24,999 | 57 (3.3%) | 41 (2.3%) |
| $25,000 to $29,999 | 16 (0.9%) | 177 (9.8%) |
| $30,000 to $34,999 | 62 (3.6%) | 101 (5.6%) |
| $35,000 to $39,999 | 76 (4.4%) | 169 (9.3%) |
| $40,000 to $44,999 | 171 (9.9%) | 109 (6.0%) |
| $45,000 to $49,999 | 93 (5.4%) | 30 (1.7%) |
| $50,000 to $54,999 | 90 (5.2%) | 99 (5.5%) |
| $55,000 to $64,999 | 359 (20.7%) | 111 (6.1%) |
| $65,000 to $74,999 | 76 (4.4%) | 68 (3.7%) |
| $75,000 to $99,999 | 68 (3.9%) | 63 (3.5%) |
| $100,000+ | 146 (8.4%) | 58 (3.2%) |
| Total | 1,734 (100.0%) | 1,811 (100.0%) |
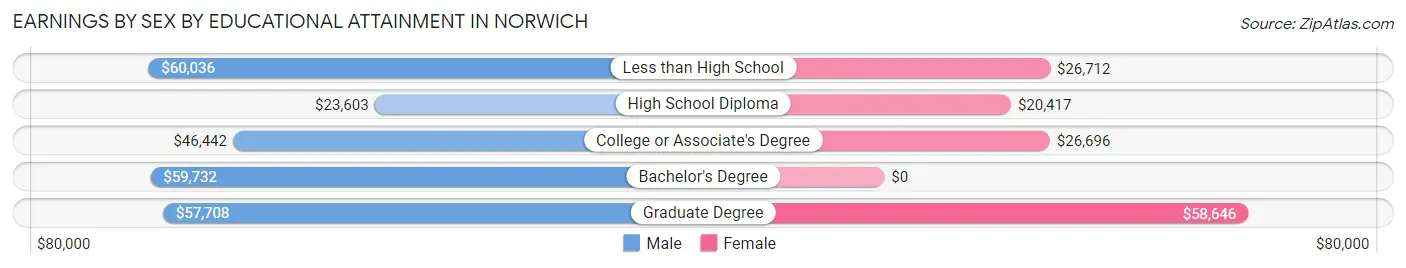
Earnings by Sex by Educational Attainment in Norwich
Average earnings in Norwich are $44,951 for men and $27,422 for women, a difference of 39.0%. Men with an educational attainment of less than high school enjoy the highest average annual earnings of $60,036, while those with high school diploma education earn the least with $23,603. Women with an educational attainment of graduate degree earn the most with the average annual earnings of $58,646, while those with high school diploma education have the smallest earnings of $20,417.
| Educational Attainment | Male Income | Female Income |
| Less than High School | $60,036 | $26,712 |
| High School Diploma | $23,603 | $20,417 |
| College or Associate's Degree | $46,442 | $26,696 |
| Bachelor's Degree | $59,732 | $0 |
| Graduate Degree | $57,708 | $58,646 |
| Total | $44,951 | $27,422 |
Family Income in Norwich
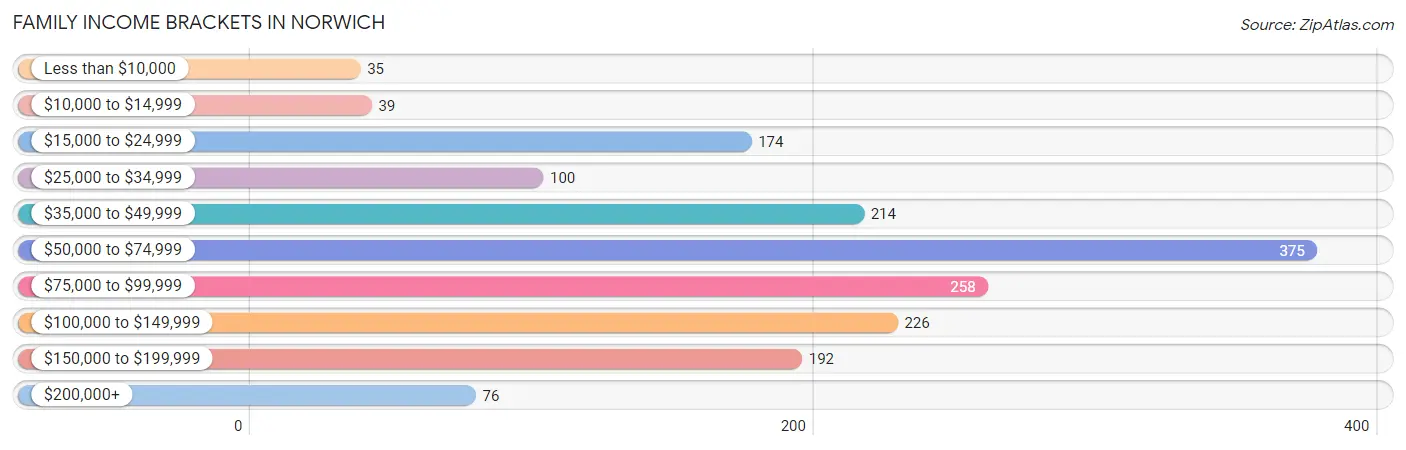
Family Income Brackets in Norwich
According to the Norwich family income data, there are 375 families falling into the $50,000 to $74,999 income range, which is the most common income bracket and makes up 22.2% of all families. Conversely, the less than $10,000 income bracket is the least frequent group with only 35 families (2.1%) belonging to this category.
| Income Bracket | # Families | % Families |
| Less than $10,000 | 35 | 2.1% |
| $10,000 to $14,999 | 39 | 2.3% |
| $15,000 to $24,999 | 174 | 10.3% |
| $25,000 to $34,999 | 100 | 5.9% |
| $35,000 to $49,999 | 214 | 12.7% |
| $50,000 to $74,999 | 375 | 22.2% |
| $75,000 to $99,999 | 258 | 15.3% |
| $100,000 to $149,999 | 226 | 13.4% |
| $150,000 to $199,999 | 192 | 11.4% |
| $200,000+ | 76 | 4.5% |
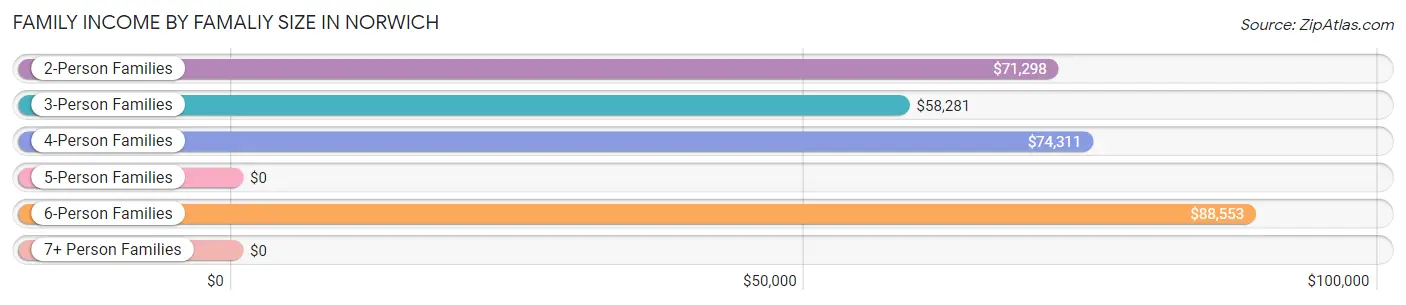
Family Income by Famaliy Size in Norwich
6-person families (72 | 4.3%) account for the highest median family income in Norwich with $88,553 per family, while 2-person families (888 | 52.6%) have the highest median income of $35,649 per family member.
| Income Bracket | # Families | Median Income |
| 2-Person Families | 888 (52.6%) | $71,298 |
| 3-Person Families | 393 (23.3%) | $58,281 |
| 4-Person Families | 223 (13.2%) | $74,311 |
| 5-Person Families | 100 (5.9%) | $0 |
| 6-Person Families | 72 (4.3%) | $88,553 |
| 7+ Person Families | 11 (0.6%) | $0 |
| Total | 1,687 (100.0%) | $71,659 |
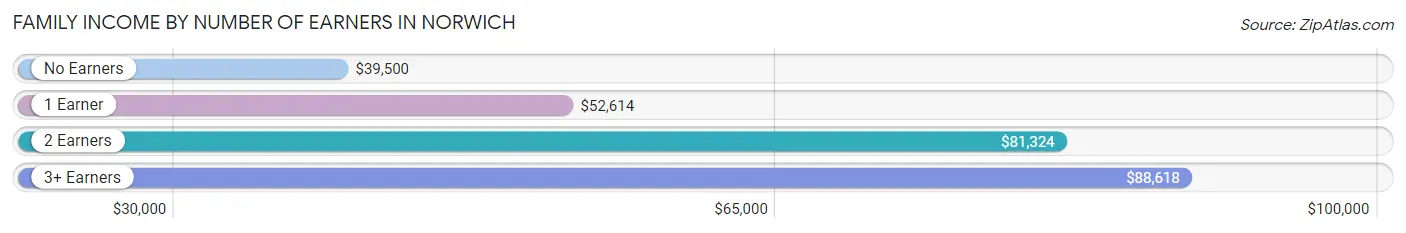
Family Income by Number of Earners in Norwich
The median family income in Norwich is $71,659, with families comprising 3+ earners (134) having the highest median family income of $88,618, while families with no earners (352) have the lowest median family income of $39,500, accounting for 7.9% and 20.9% of families, respectively.
| Number of Earners | # Families | Median Income |
| No Earners | 352 (20.9%) | $39,500 |
| 1 Earner | 459 (27.2%) | $52,614 |
| 2 Earners | 742 (44.0%) | $81,324 |
| 3+ Earners | 134 (7.9%) | $88,618 |
| Total | 1,687 (100.0%) | $71,659 |
Household Income in Norwich
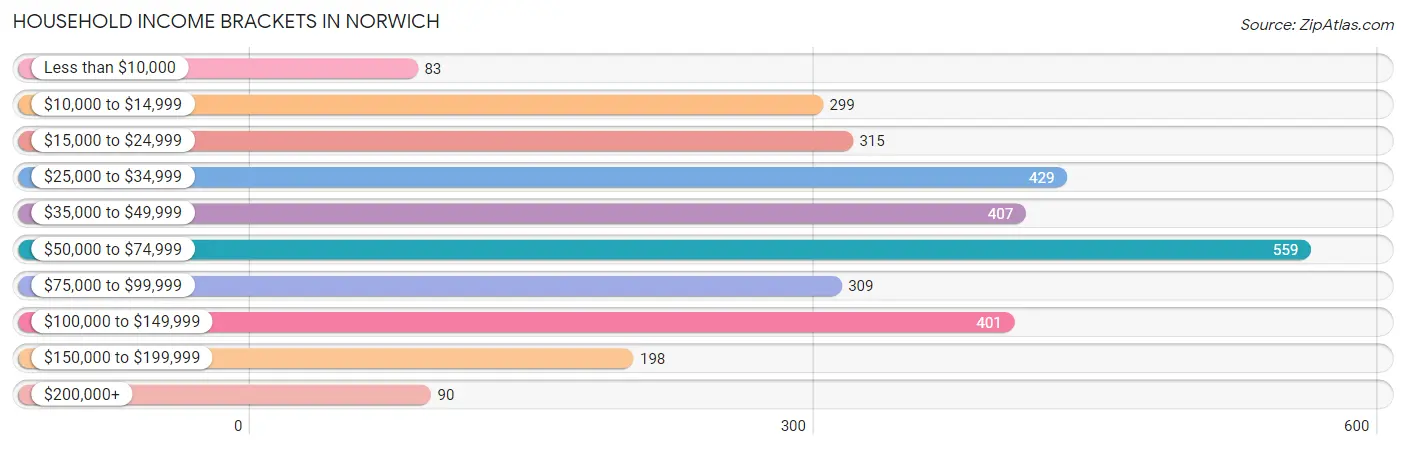
Household Income Brackets in Norwich
With 559 households falling in the category, the $50,000 to $74,999 income range is the most frequent in Norwich, accounting for 18.1% of all households. In contrast, only 83 households (2.7%) fall into the less than $10,000 income bracket, making it the least populous group.
| Income Bracket | # Households | % Households |
| Less than $10,000 | 83 | 2.7% |
| $10,000 to $14,999 | 299 | 9.7% |
| $15,000 to $24,999 | 315 | 10.2% |
| $25,000 to $34,999 | 429 | 13.9% |
| $35,000 to $49,999 | 407 | 13.2% |
| $50,000 to $74,999 | 559 | 18.1% |
| $75,000 to $99,999 | 309 | 10.0% |
| $100,000 to $149,999 | 401 | 13.0% |
| $150,000 to $199,999 | 198 | 6.4% |
| $200,000+ | 90 | 2.9% |
Household Income by Householder Age in Norwich
The median household income in Norwich is $50,579, with the highest median household income of $61,908 found in the 25 to 44 years age bracket for the primary householder. A total of 875 households (28.3%) fall into this category. Meanwhile, the 15 to 24 years age bracket for the primary householder has the lowest median household income of $0, with 278 households (9.0%) in this group.
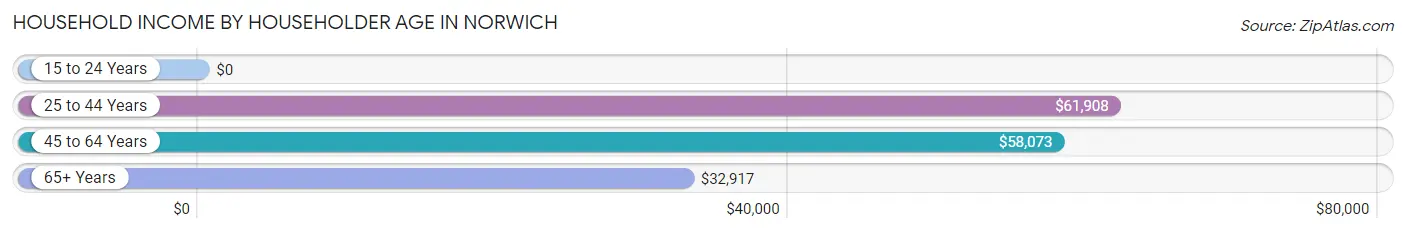
| Income Bracket | # Households | Median Income |
| 15 to 24 Years | 278 (9.0%) | $0 |
| 25 to 44 Years | 875 (28.3%) | $61,908 |
| 45 to 64 Years | 965 (31.3%) | $58,073 |
| 65+ Years | 969 (31.4%) | $32,917 |
| Total | 3,087 (100.0%) | $50,579 |
Poverty in Norwich
Income Below Poverty by Sex and Age in Norwich
With 17.4% poverty level for males and 18.9% for females among the residents of Norwich, 16 and 17 year old males and 15 year old females are the most vulnerable to poverty, with 38 males (44.2%) and 41 females (55.4%) in their respective age groups living below the poverty level.
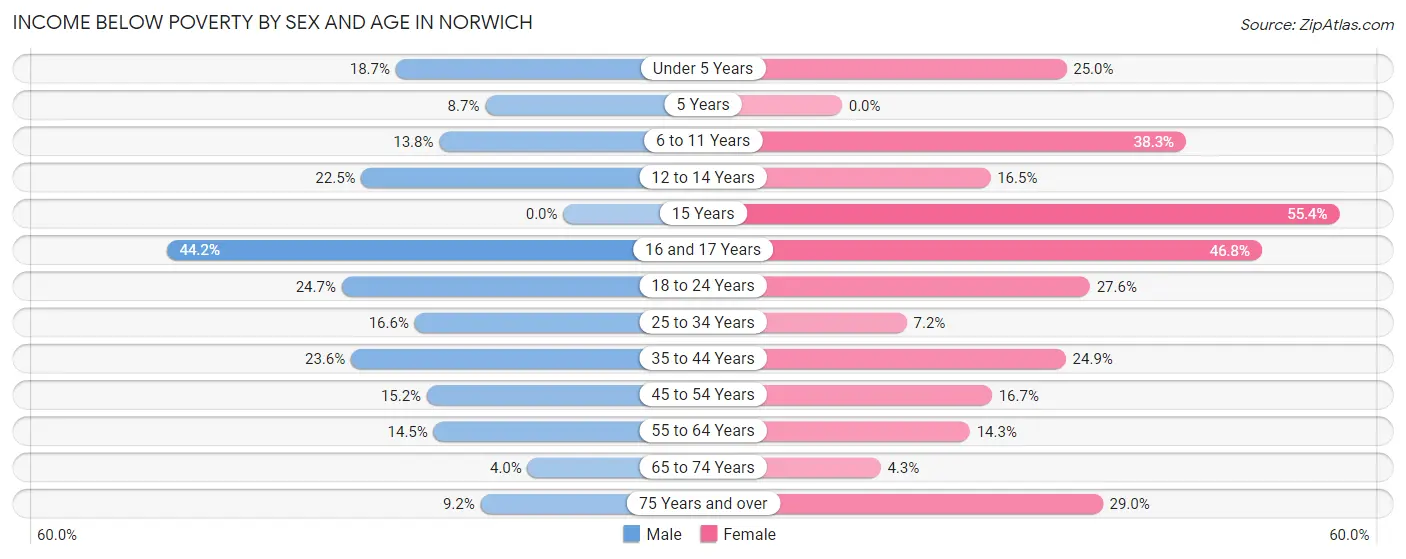
| Age Bracket | Male | Female |
| Under 5 Years | 39 (18.7%) | 45 (25.0%) |
| 5 Years | 2 (8.7%) | 0 (0.0%) |
| 6 to 11 Years | 21 (13.8%) | 41 (38.3%) |
| 12 to 14 Years | 47 (22.5%) | 20 (16.5%) |
| 15 Years | 0 (0.0%) | 41 (55.4%) |
| 16 and 17 Years | 38 (44.2%) | 29 (46.8%) |
| 18 to 24 Years | 57 (24.7%) | 103 (27.6%) |
| 25 to 34 Years | 95 (16.6%) | 38 (7.2%) |
| 35 to 44 Years | 104 (23.6%) | 93 (24.9%) |
| 45 to 54 Years | 65 (15.2%) | 78 (16.7%) |
| 55 to 64 Years | 49 (14.4%) | 54 (14.2%) |
| 65 to 74 Years | 9 (4.0%) | 21 (4.3%) |
| 75 Years and over | 19 (9.2%) | 106 (29.0%) |
| Total | 545 (17.4%) | 669 (18.9%) |
Income Above Poverty by Sex and Age in Norwich
According to the poverty statistics in Norwich, males aged 15 years and females aged 5 years are the age groups that are most secure financially, with 100.0% of males and 100.0% of females in these age groups living above the poverty line.
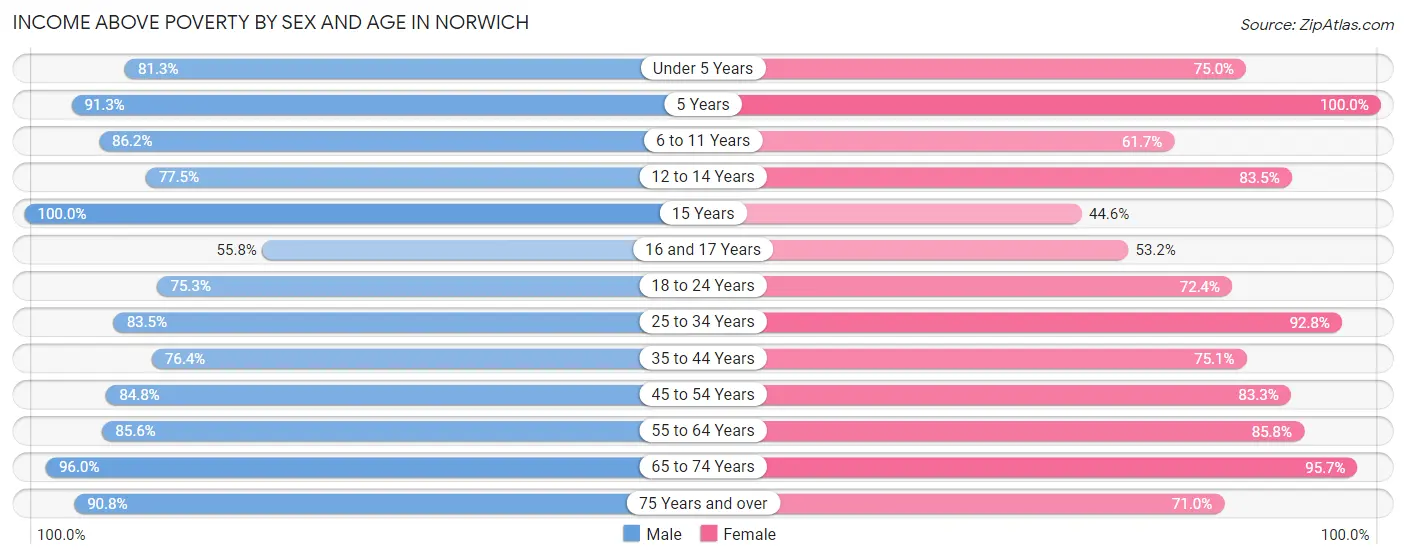
| Age Bracket | Male | Female |
| Under 5 Years | 170 (81.3%) | 135 (75.0%) |
| 5 Years | 21 (91.3%) | 35 (100.0%) |
| 6 to 11 Years | 131 (86.2%) | 66 (61.7%) |
| 12 to 14 Years | 162 (77.5%) | 101 (83.5%) |
| 15 Years | 15 (100.0%) | 33 (44.6%) |
| 16 and 17 Years | 48 (55.8%) | 33 (53.2%) |
| 18 to 24 Years | 174 (75.3%) | 270 (72.4%) |
| 25 to 34 Years | 479 (83.5%) | 488 (92.8%) |
| 35 to 44 Years | 336 (76.4%) | 280 (75.1%) |
| 45 to 54 Years | 363 (84.8%) | 389 (83.3%) |
| 55 to 64 Years | 290 (85.6%) | 325 (85.8%) |
| 65 to 74 Years | 217 (96.0%) | 466 (95.7%) |
| 75 Years and over | 187 (90.8%) | 259 (71.0%) |
| Total | 2,593 (82.6%) | 2,880 (81.1%) |
Income Below Poverty Among Married-Couple Families in Norwich
The poverty statistics for married-couple families in Norwich show that 7.4% or 86 of the total 1,160 families live below the poverty line. Families with 1 or 2 children have the highest poverty rate of 18.1%, comprising of 73 families. On the other hand, families with 3 or 4 children have the lowest poverty rate of 0.0%, which includes 0 families.
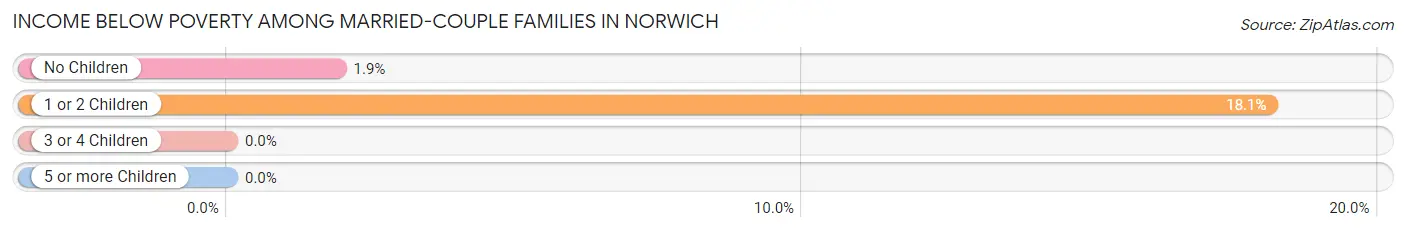
| Children | Above Poverty | Below Poverty |
| No Children | 676 (98.1%) | 13 (1.9%) |
| 1 or 2 Children | 330 (81.9%) | 73 (18.1%) |
| 3 or 4 Children | 68 (100.0%) | 0 (0.0%) |
| 5 or more Children | 0 (0.0%) | 0 (0.0%) |
| Total | 1,074 (92.6%) | 86 (7.4%) |
Income Below Poverty Among Single-Parent Households in Norwich
According to the poverty data in Norwich, 13.3% or 19 single-father households and 28.9% or 111 single-mother households are living below the poverty line. Among single-father households, those with 1 or 2 children have the highest poverty rate, with 19 households (29.7%) experiencing poverty. Likewise, among single-mother households, those with 3 or 4 children have the highest poverty rate, with 19 households (100.0%) falling below the poverty line.
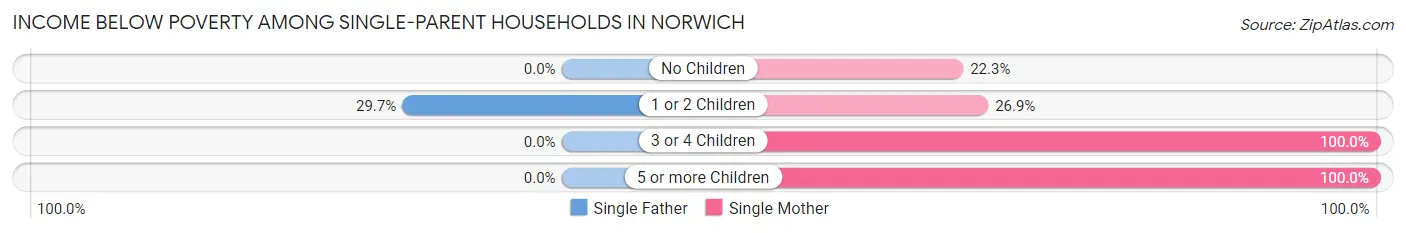
| Children | Single Father | Single Mother |
| No Children | 0 (0.0%) | 51 (22.3%) |
| 1 or 2 Children | 19 (29.7%) | 35 (26.9%) |
| 3 or 4 Children | 0 (0.0%) | 19 (100.0%) |
| 5 or more Children | 0 (0.0%) | 6 (100.0%) |
| Total | 19 (13.3%) | 111 (28.9%) |
Income Below Poverty Among Married-Couple vs Single-Parent Households in Norwich
The poverty data for Norwich shows that 86 of the married-couple family households (7.4%) and 130 of the single-parent households (24.7%) are living below the poverty level. Within the married-couple family households, those with 1 or 2 children have the highest poverty rate, with 73 households (18.1%) falling below the poverty line. Among the single-parent households, those with 5 or more children have the highest poverty rate, with 6 household (100.0%) living below poverty.
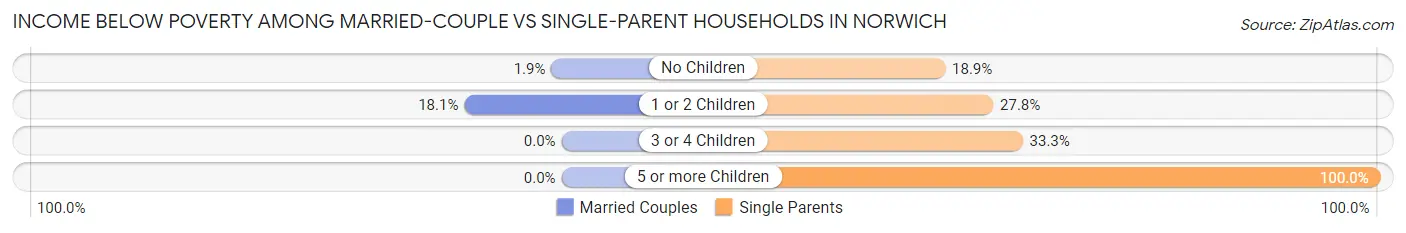
| Children | Married-Couple Families | Single-Parent Households |
| No Children | 13 (1.9%) | 51 (18.9%) |
| 1 or 2 Children | 73 (18.1%) | 54 (27.8%) |
| 3 or 4 Children | 0 (0.0%) | 19 (33.3%) |
| 5 or more Children | 0 (0.0%) | 6 (100.0%) |
| Total | 86 (7.4%) | 130 (24.7%) |
Race in Norwich
The most populous races in Norwich are White / Caucasian (6,134 | 88.3%), Hispanic or Latino (483 | 7.0%), and Some other Race (390 | 5.6%).
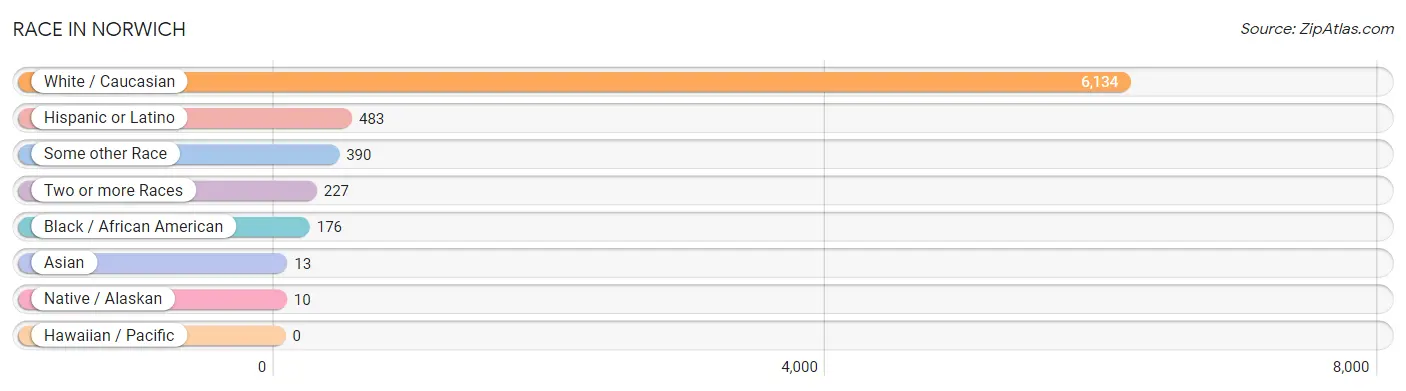
| Race | # Population | % Population |
| Asian | 13 | 0.2% |
| Black / African American | 176 | 2.5% |
| Hawaiian / Pacific | 0 | 0.0% |
| Hispanic or Latino | 483 | 7.0% |
| Native / Alaskan | 10 | 0.1% |
| White / Caucasian | 6,134 | 88.3% |
| Two or more Races | 227 | 3.3% |
| Some other Race | 390 | 5.6% |
| Total | 6,950 | 100.0% |
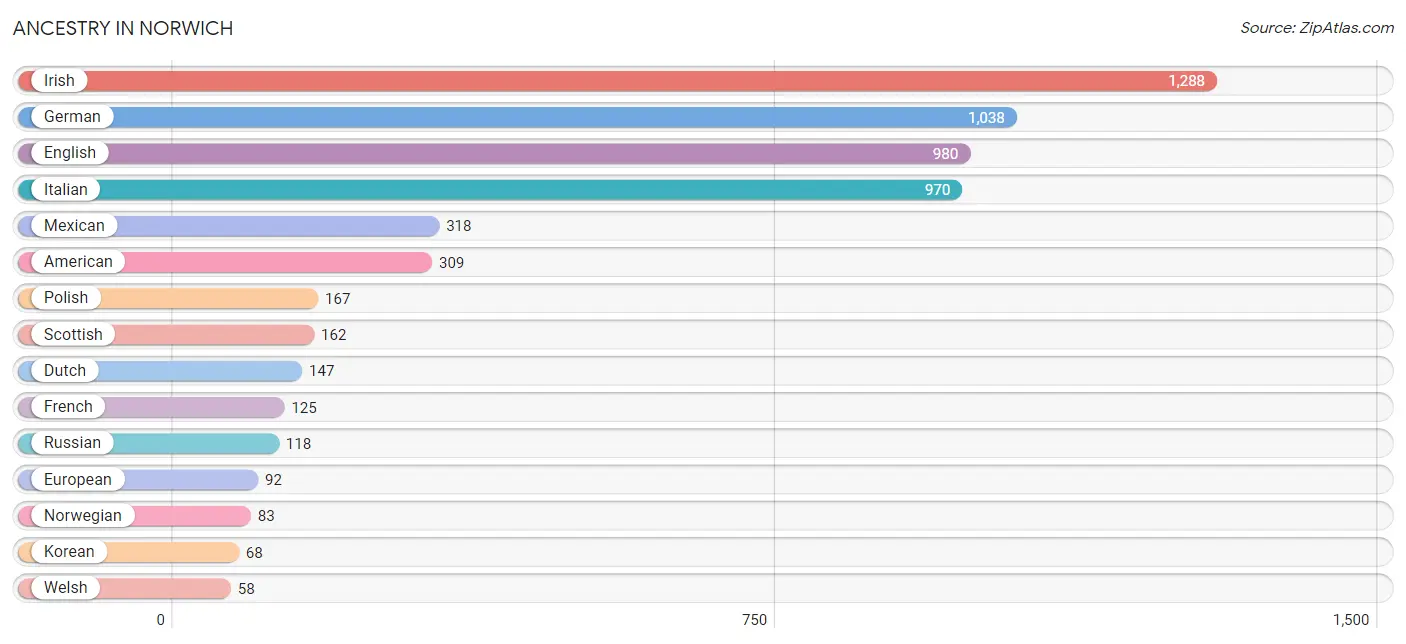
Ancestry in Norwich
The most populous ancestries reported in Norwich are Irish (1,288 | 18.5%), German (1,038 | 14.9%), English (980 | 14.1%), Italian (970 | 14.0%), and Mexican (318 | 4.6%), together accounting for 66.1% of all Norwich residents.
| Ancestry | # Population | % Population |
| American | 309 | 4.4% |
| Arab | 42 | 0.6% |
| British | 23 | 0.3% |
| Central American | 29 | 0.4% |
| Cherokee | 10 | 0.1% |
| Colombian | 4 | 0.1% |
| Costa Rican | 29 | 0.4% |
| Croatian | 21 | 0.3% |
| Czechoslovakian | 23 | 0.3% |
| Danish | 24 | 0.4% |
| Dominican | 38 | 0.5% |
| Dutch | 147 | 2.1% |
| Eastern European | 22 | 0.3% |
| Ecuadorian | 30 | 0.4% |
| English | 980 | 14.1% |
| European | 92 | 1.3% |
| Finnish | 6 | 0.1% |
| French | 125 | 1.8% |
| French Canadian | 48 | 0.7% |
| German | 1,038 | 14.9% |
| Greek | 9 | 0.1% |
| Guyanese | 6 | 0.1% |
| Haitian | 9 | 0.1% |
| Hungarian | 12 | 0.2% |
| Irish | 1,288 | 18.5% |
| Iroquois | 9 | 0.1% |
| Italian | 970 | 14.0% |
| Korean | 68 | 1.0% |
| Lebanese | 23 | 0.3% |
| Lithuanian | 20 | 0.3% |
| Mexican | 318 | 4.6% |
| Northern European | 7 | 0.1% |
| Norwegian | 83 | 1.2% |
| Peruvian | 11 | 0.2% |
| Polish | 167 | 2.4% |
| Puerto Rican | 53 | 0.8% |
| Russian | 118 | 1.7% |
| Scandinavian | 23 | 0.3% |
| Scotch-Irish | 19 | 0.3% |
| Scottish | 162 | 2.3% |
| Slovak | 10 | 0.1% |
| South American | 45 | 0.6% |
| Swedish | 44 | 0.6% |
| Swiss | 18 | 0.3% |
| Syrian | 19 | 0.3% |
| Turkish | 10 | 0.1% |
| Welsh | 58 | 0.8% |
| West Indian | 2 | 0.0% | View All 48 Rows |
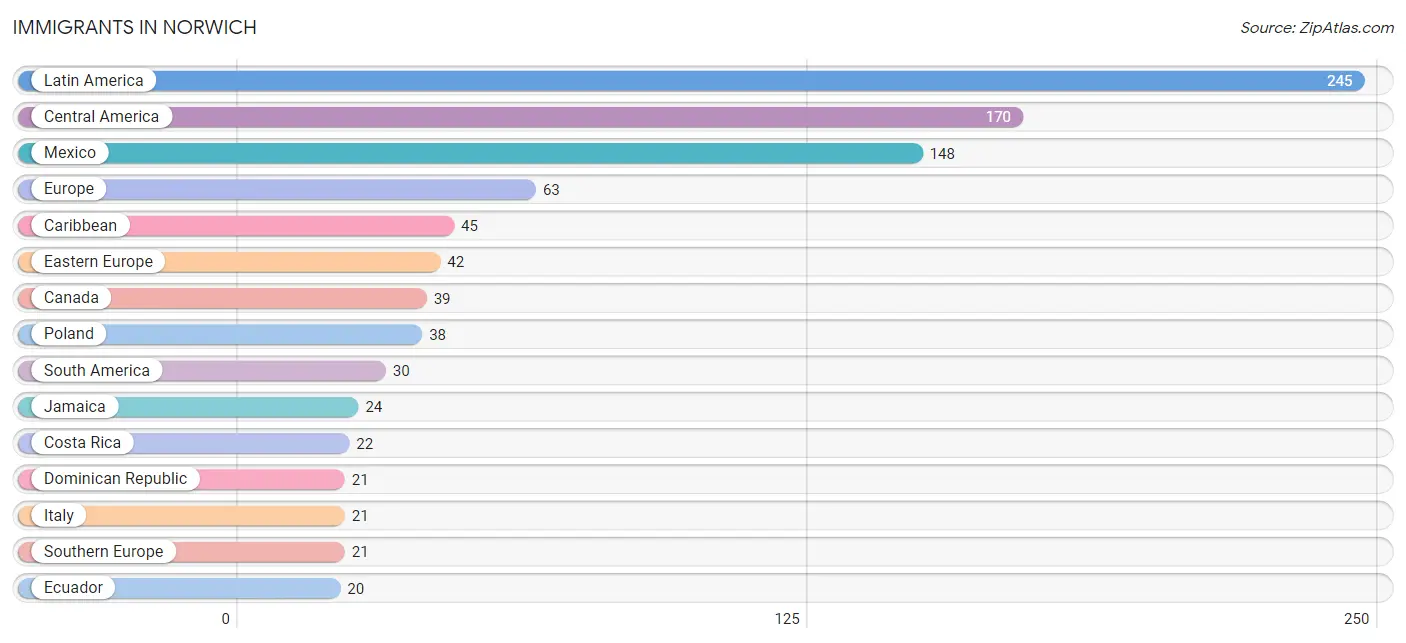
Immigrants in Norwich
The most numerous immigrant groups reported in Norwich came from Latin America (245 | 3.5%), Central America (170 | 2.5%), Mexico (148 | 2.1%), Europe (63 | 0.9%), and Caribbean (45 | 0.6%), together accounting for 9.7% of all Norwich residents.
| Immigration Origin | # Population | % Population |
| Asia | 13 | 0.2% |
| Canada | 39 | 0.6% |
| Caribbean | 45 | 0.6% |
| Central America | 170 | 2.5% |
| Colombia | 4 | 0.1% |
| Costa Rica | 22 | 0.3% |
| Dominican Republic | 21 | 0.3% |
| Eastern Europe | 42 | 0.6% |
| Ecuador | 20 | 0.3% |
| Europe | 63 | 0.9% |
| Guyana | 6 | 0.1% |
| Hungary | 4 | 0.1% |
| Italy | 21 | 0.3% |
| Jamaica | 24 | 0.4% |
| Latin America | 245 | 3.5% |
| Mexico | 148 | 2.1% |
| Philippines | 13 | 0.2% |
| Poland | 38 | 0.5% |
| South America | 30 | 0.4% |
| South Eastern Asia | 13 | 0.2% |
| Southern Europe | 21 | 0.3% | View All 21 Rows |
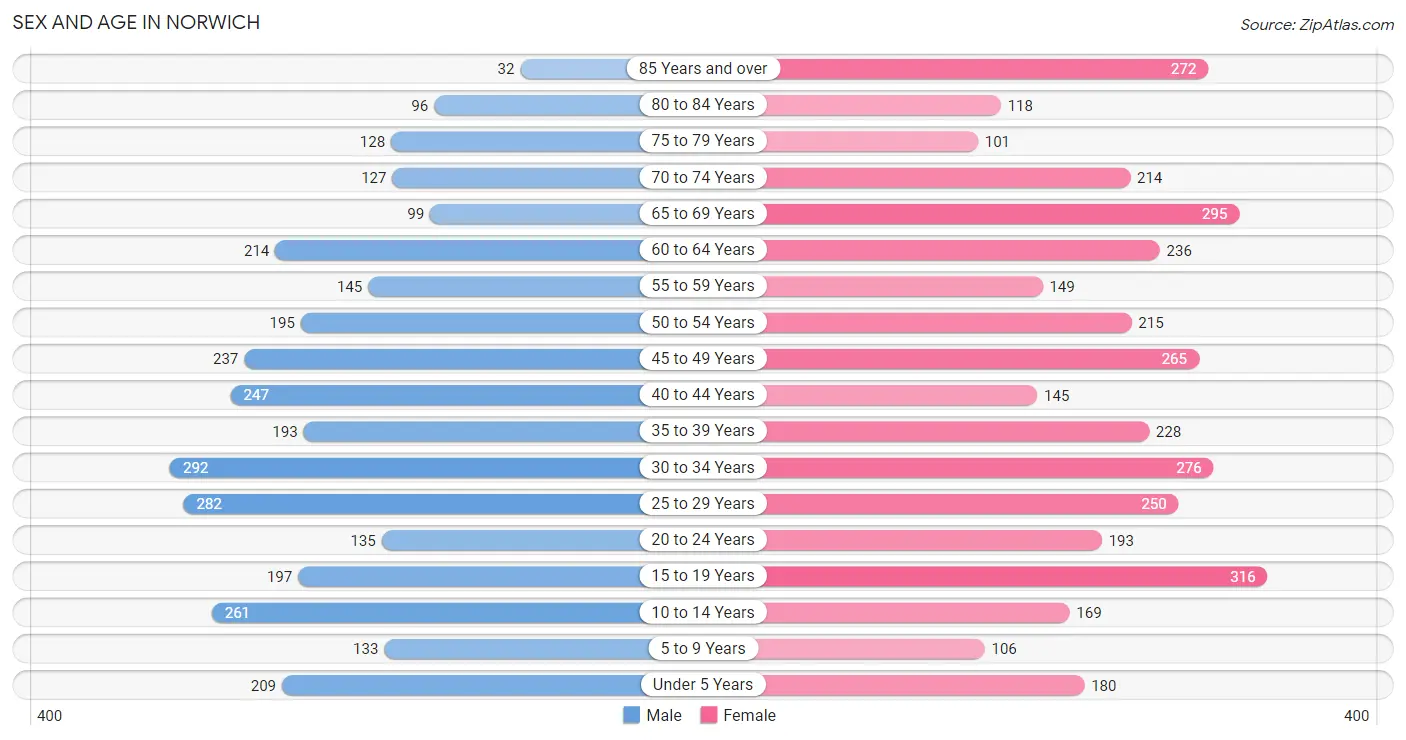
Sex and Age in Norwich
Sex and Age in Norwich
The most populous age groups in Norwich are 30 to 34 Years (292 | 9.1%) for men and 15 to 19 Years (316 | 8.5%) for women.
| Age Bracket | Male | Female |
| Under 5 Years | 209 (6.5%) | 180 (4.8%) |
| 5 to 9 Years | 133 (4.1%) | 106 (2.8%) |
| 10 to 14 Years | 261 (8.1%) | 169 (4.5%) |
| 15 to 19 Years | 197 (6.1%) | 316 (8.5%) |
| 20 to 24 Years | 135 (4.2%) | 193 (5.2%) |
| 25 to 29 Years | 282 (8.7%) | 250 (6.7%) |
| 30 to 34 Years | 292 (9.1%) | 276 (7.4%) |
| 35 to 39 Years | 193 (6.0%) | 228 (6.1%) |
| 40 to 44 Years | 247 (7.7%) | 145 (3.9%) |
| 45 to 49 Years | 237 (7.4%) | 265 (7.1%) |
| 50 to 54 Years | 195 (6.0%) | 215 (5.8%) |
| 55 to 59 Years | 145 (4.5%) | 149 (4.0%) |
| 60 to 64 Years | 214 (6.6%) | 236 (6.3%) |
| 65 to 69 Years | 99 (3.1%) | 295 (7.9%) |
| 70 to 74 Years | 127 (3.9%) | 214 (5.7%) |
| 75 to 79 Years | 128 (4.0%) | 101 (2.7%) |
| 80 to 84 Years | 96 (3.0%) | 118 (3.2%) |
| 85 Years and over | 32 (1.0%) | 272 (7.3%) |
| Total | 3,222 (100.0%) | 3,728 (100.0%) |
Families and Households in Norwich
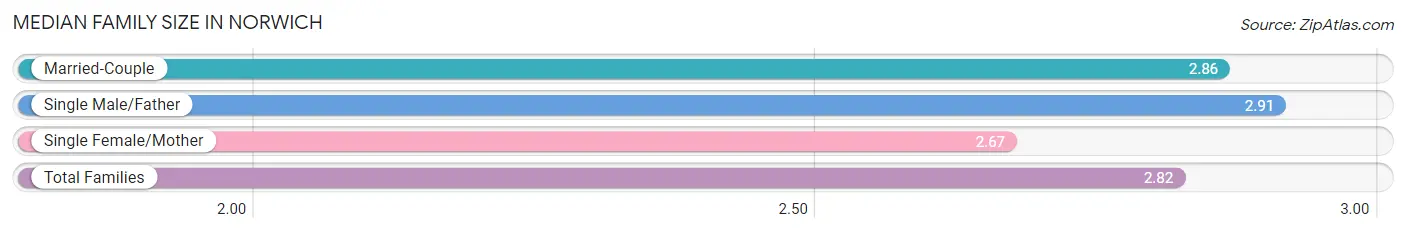
Median Family Size in Norwich
The median family size in Norwich is 2.82 persons per family, with single male/father families (143 | 8.5%) accounting for the largest median family size of 2.91 persons per family. On the other hand, single female/mother families (384 | 22.8%) represent the smallest median family size with 2.67 persons per family.
| Family Type | # Families | Family Size |
| Married-Couple | 1,160 (68.8%) | 2.86 |
| Single Male/Father | 143 (8.5%) | 2.91 |
| Single Female/Mother | 384 (22.8%) | 2.67 |
| Total Families | 1,687 (100.0%) | 2.82 |
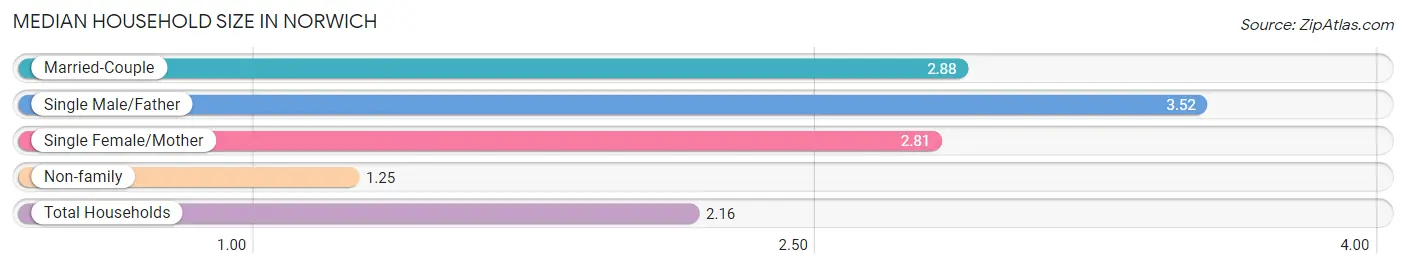
Median Household Size in Norwich
The median household size in Norwich is 2.16 persons per household, with single male/father households (143 | 4.6%) accounting for the largest median household size of 3.52 persons per household. non-family households (1,400 | 45.4%) represent the smallest median household size with 1.25 persons per household.
| Household Type | # Households | Household Size |
| Married-Couple | 1,160 (37.6%) | 2.88 |
| Single Male/Father | 143 (4.6%) | 3.52 |
| Single Female/Mother | 384 (12.4%) | 2.81 |
| Non-family | 1,400 (45.4%) | 1.25 |
| Total Households | 3,087 (100.0%) | 2.16 |
Household Size by Marriage Status in Norwich
Out of a total of 3,087 households in Norwich, 1,687 (54.6%) are family households, while 1,400 (45.4%) are nonfamily households. The most numerous type of family households are 2-person households, comprising 840, and the most common type of nonfamily households are 1-person households, comprising 1,130.
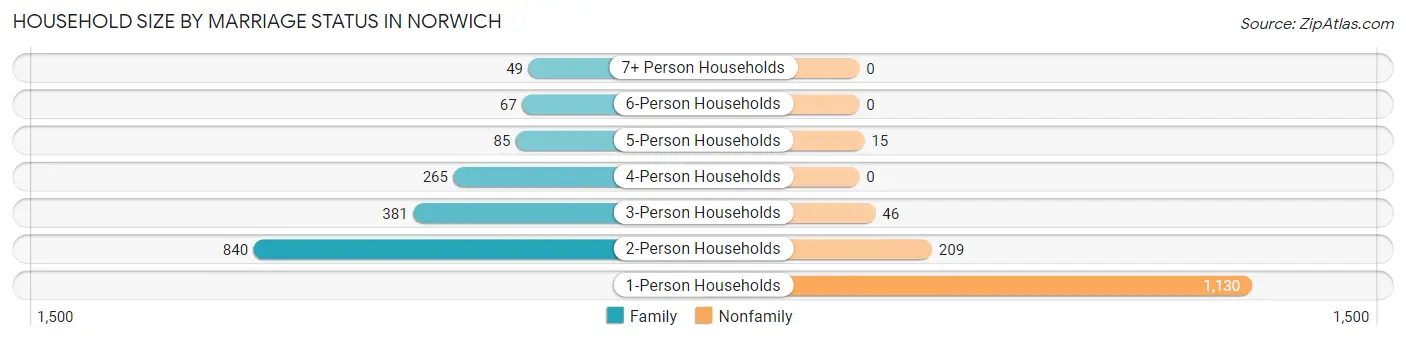
| Household Size | Family Households | Nonfamily Households |
| 1-Person Households | - | 1,130 (36.6%) |
| 2-Person Households | 840 (27.2%) | 209 (6.8%) |
| 3-Person Households | 381 (12.3%) | 46 (1.5%) |
| 4-Person Households | 265 (8.6%) | 0 (0.0%) |
| 5-Person Households | 85 (2.8%) | 15 (0.5%) |
| 6-Person Households | 67 (2.2%) | 0 (0.0%) |
| 7+ Person Households | 49 (1.6%) | 0 (0.0%) |
| Total | 1,687 (54.6%) | 1,400 (45.4%) |
Female Fertility in Norwich
Fertility by Age in Norwich
Average fertility rate in Norwich is 54.0 births per 1,000 women. Women in the age bracket of 20 to 34 years have the highest fertility rate with 108.0 births per 1,000 women. Women in the age bracket of 20 to 34 years acount for 84.8% of all women with births.
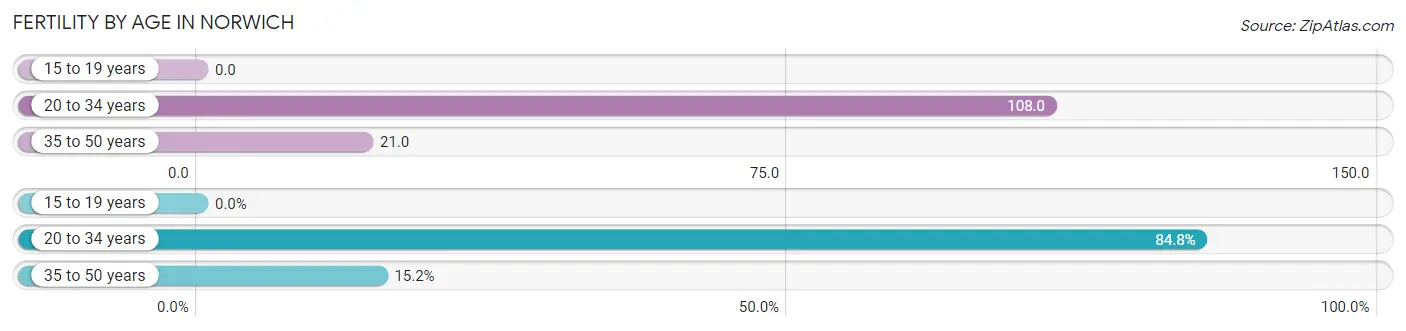
| Age Bracket | Women with Births | Births / 1,000 Women |
| 15 to 19 years | 0 (0.0%) | 0.0 |
| 20 to 34 years | 78 (84.8%) | 108.0 |
| 35 to 50 years | 14 (15.2%) | 21.0 |
| Total | 92 (100.0%) | 54.0 |
Fertility by Age by Marriage Status in Norwich
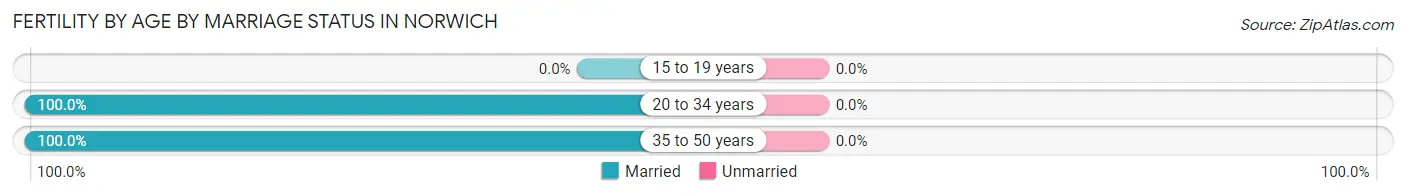
| Age Bracket | Married | Unmarried |
| 15 to 19 years | 0 (0.0%) | 0 (0.0%) |
| 20 to 34 years | 78 (100.0%) | 0 (0.0%) |
| 35 to 50 years | 14 (100.0%) | 0 (0.0%) |
| Total | 92 (100.0%) | 0 (0.0%) |
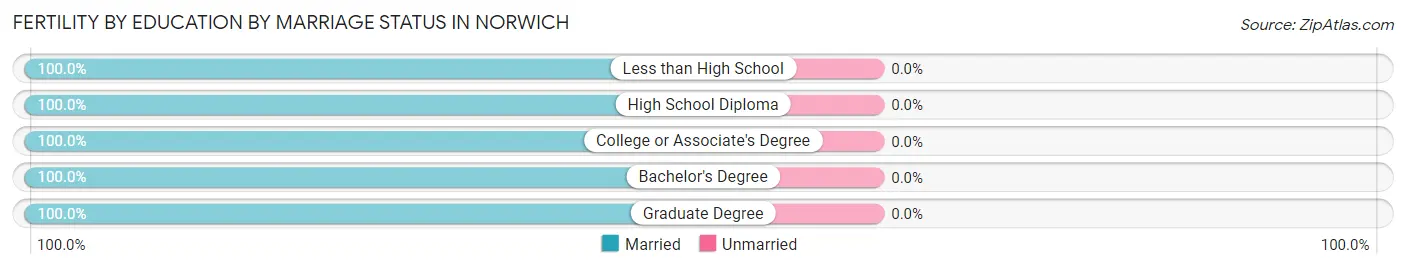
Fertility by Education in Norwich
Average fertility rate in Norwich is 54.0 births per 1,000 women. Women with the education attainment of bachelor's degree have the highest fertility rate of 121.0 births per 1,000 women, while women with the education attainment of less than high school have the lowest fertility at 18.0 births per 1,000 women. Women with the education attainment of high school diploma represent 42.4% of all women with births.
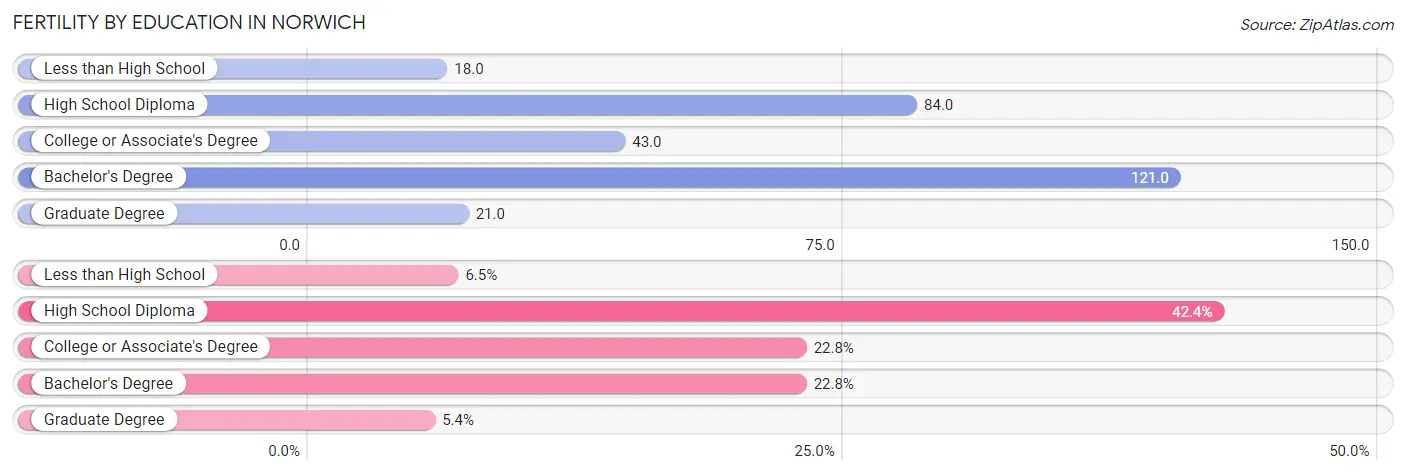
| Educational Attainment | Women with Births | Births / 1,000 Women |
| Less than High School | 6 (6.5%) | 18.0 |
| High School Diploma | 39 (42.4%) | 84.0 |
| College or Associate's Degree | 21 (22.8%) | 43.0 |
| Bachelor's Degree | 21 (22.8%) | 121.0 |
| Graduate Degree | 5 (5.4%) | 21.0 |
| Total | 92 (100.0%) | 54.0 |
Fertility by Education by Marriage Status in Norwich
| Educational Attainment | Married | Unmarried |
| Less than High School | 6 (100.0%) | 0 (0.0%) |
| High School Diploma | 39 (100.0%) | 0 (0.0%) |
| College or Associate's Degree | 21 (100.0%) | 0 (0.0%) |
| Bachelor's Degree | 21 (100.0%) | 0 (0.0%) |
| Graduate Degree | 5 (100.0%) | 0 (0.0%) |
| Total | 92 (100.0%) | 0 (0.0%) |
Employment Characteristics in Norwich
Employment by Class of Employer in Norwich
Among the 2,928 employed individuals in Norwich, private company employees (1,812 | 61.9%), not-for-profit organizations (469 | 16.0%), and local government employees (313 | 10.7%) make up the most common classes of employment.
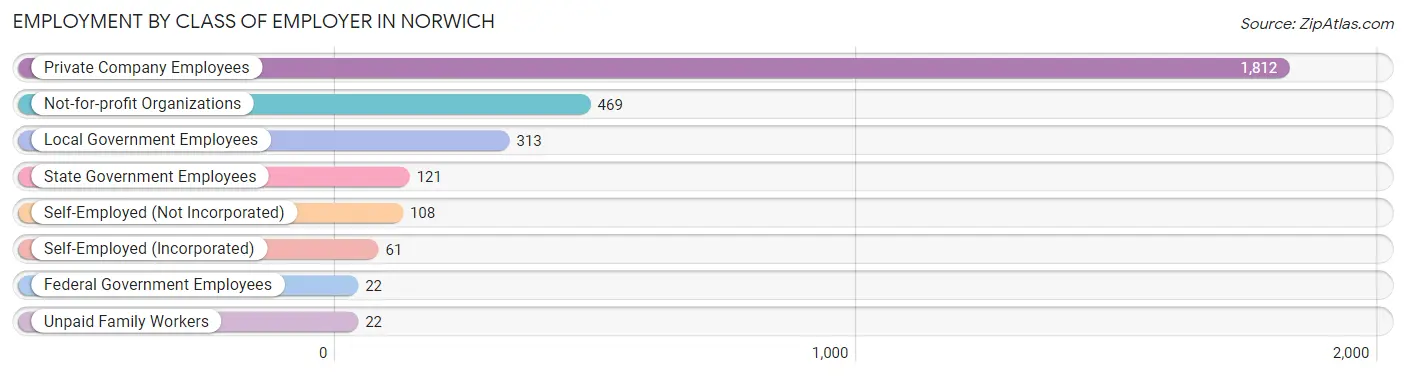
| Employer Class | # Employees | % Employees |
| Private Company Employees | 1,812 | 61.9% |
| Self-Employed (Incorporated) | 61 | 2.1% |
| Self-Employed (Not Incorporated) | 108 | 3.7% |
| Not-for-profit Organizations | 469 | 16.0% |
| Local Government Employees | 313 | 10.7% |
| State Government Employees | 121 | 4.1% |
| Federal Government Employees | 22 | 0.7% |
| Unpaid Family Workers | 22 | 0.7% |
| Total | 2,928 | 100.0% |
Employment Status by Age in Norwich
According to the labor force statistics for Norwich, out of the total population over 16 years of age (5,803), 59.3% or 3,441 individuals are in the labor force, with 11.7% or 403 of them unemployed. The age group with the highest labor force participation rate is 35 to 44 years, with 89.4% or 727 individuals in the labor force. Within the labor force, the 16 to 19 years age range has the highest percentage of unemployed individuals, with 21.7% or 54 of them being unemployed.
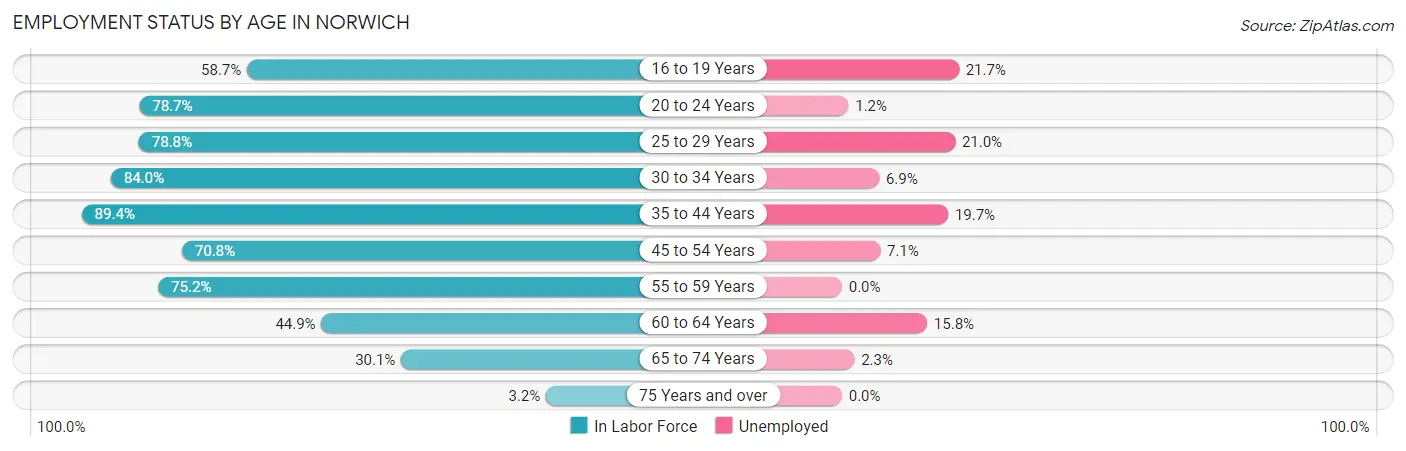
| Age Bracket | In Labor Force | Unemployed |
| 16 to 19 Years | 249 (58.7%) | 54 (21.7%) |
| 20 to 24 Years | 258 (78.7%) | 3 (1.2%) |
| 25 to 29 Years | 419 (78.8%) | 88 (21.0%) |
| 30 to 34 Years | 477 (84.0%) | 33 (6.9%) |
| 35 to 44 Years | 727 (89.4%) | 143 (19.7%) |
| 45 to 54 Years | 646 (70.8%) | 46 (7.1%) |
| 55 to 59 Years | 221 (75.2%) | 0 (0.0%) |
| 60 to 64 Years | 202 (44.9%) | 32 (15.8%) |
| 65 to 74 Years | 221 (30.1%) | 5 (2.3%) |
| 75 Years and over | 24 (3.2%) | 0 (0.0%) |
| Total | 3,441 (59.3%) | 403 (11.7%) |
Employment Status by Educational Attainment in Norwich
According to labor force statistics for Norwich, 75.4% of individuals (2,691) out of the total population between 25 and 64 years of age (3,569) are in the labor force, with 12.7% or 342 of them being unemployed. The group with the highest labor force participation rate are those with the educational attainment of bachelor's degree or higher, with 82.0% or 763 individuals in the labor force. Within the labor force, individuals with high school diploma education have the highest percentage of unemployment, with 19.9% or 190 of them being unemployed.
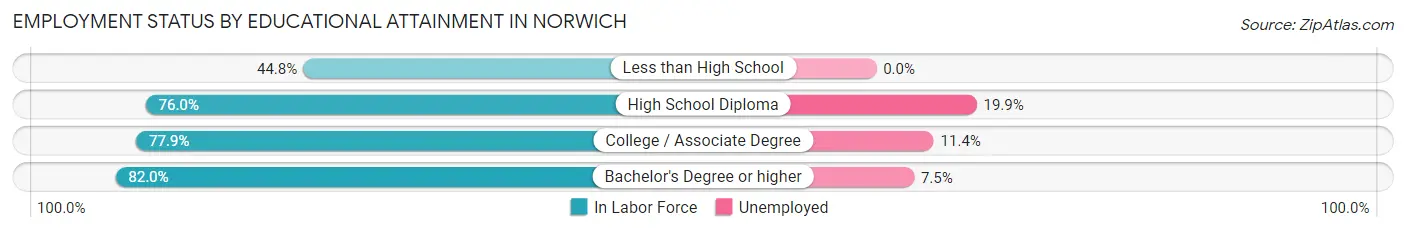
| Educational Attainment | In Labor Force | Unemployed |
| Less than High School | 139 (44.8%) | 0 (0.0%) |
| High School Diploma | 955 (76.0%) | 250 (19.9%) |
| College / Associate Degree | 836 (77.9%) | 122 (11.4%) |
| Bachelor's Degree or higher | 763 (82.0%) | 70 (7.5%) |
| Total | 2,691 (75.4%) | 453 (12.7%) |
Employment Occupations by Sex in Norwich
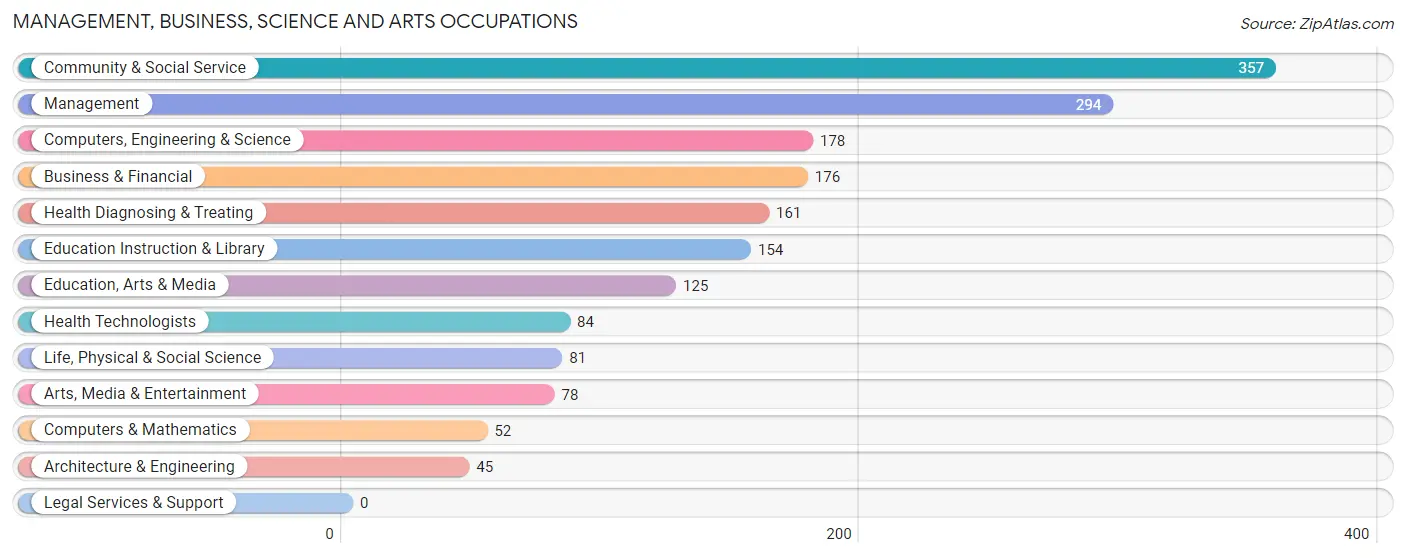
Management, Business, Science and Arts Occupations
The most common Management, Business, Science and Arts occupations in Norwich are Community & Social Service (357 | 11.7%), Management (294 | 9.7%), Computers, Engineering & Science (178 | 5.9%), Business & Financial (176 | 5.8%), and Health Diagnosing & Treating (161 | 5.3%).
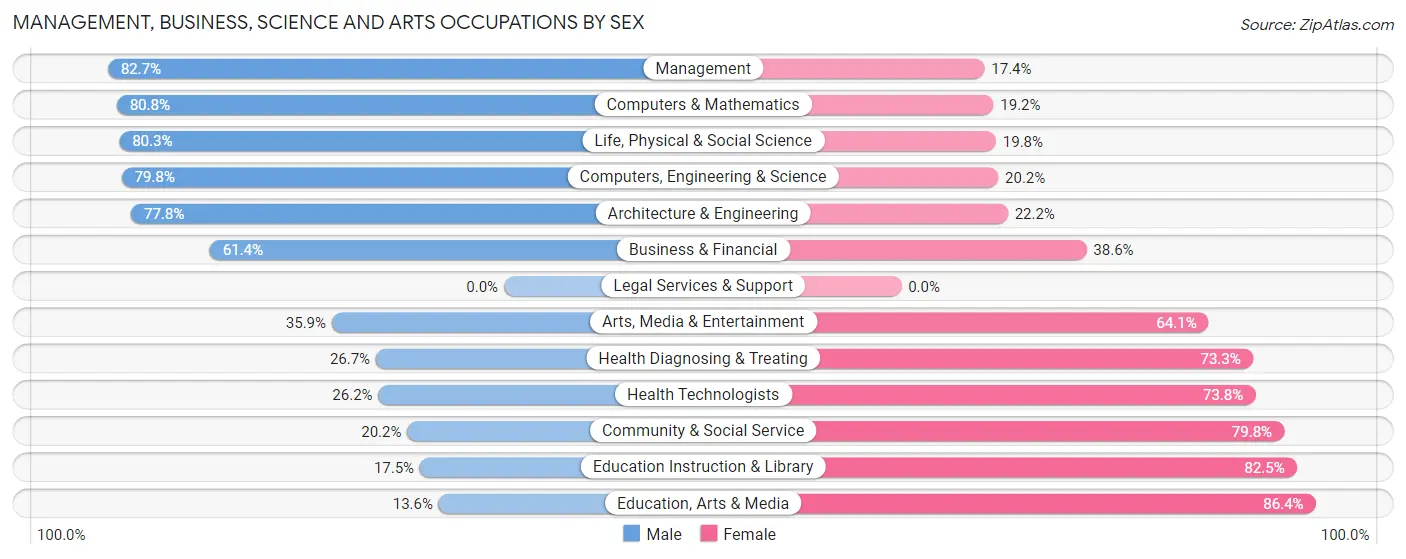
Management, Business, Science and Arts Occupations by Sex
Within the Management, Business, Science and Arts occupations in Norwich, the most male-oriented occupations are Management (82.7%), Computers & Mathematics (80.8%), and Life, Physical & Social Science (80.2%), while the most female-oriented occupations are Education, Arts & Media (86.4%), Education Instruction & Library (82.5%), and Community & Social Service (79.8%).
| Occupation | Male | Female |
| Management | 243 (82.7%) | 51 (17.3%) |
| Business & Financial | 108 (61.4%) | 68 (38.6%) |
| Computers, Engineering & Science | 142 (79.8%) | 36 (20.2%) |
| Computers & Mathematics | 42 (80.8%) | 10 (19.2%) |
| Architecture & Engineering | 35 (77.8%) | 10 (22.2%) |
| Life, Physical & Social Science | 65 (80.2%) | 16 (19.8%) |
| Community & Social Service | 72 (20.2%) | 285 (79.8%) |
| Education, Arts & Media | 17 (13.6%) | 108 (86.4%) |
| Legal Services & Support | 0 (0.0%) | 0 (0.0%) |
| Education Instruction & Library | 27 (17.5%) | 127 (82.5%) |
| Arts, Media & Entertainment | 28 (35.9%) | 50 (64.1%) |
| Health Diagnosing & Treating | 43 (26.7%) | 118 (73.3%) |
| Health Technologists | 22 (26.2%) | 62 (73.8%) |
| Total (Category) | 608 (52.1%) | 558 (47.9%) |
| Total (Overall) | 1,522 (50.1%) | 1,518 (49.9%) |
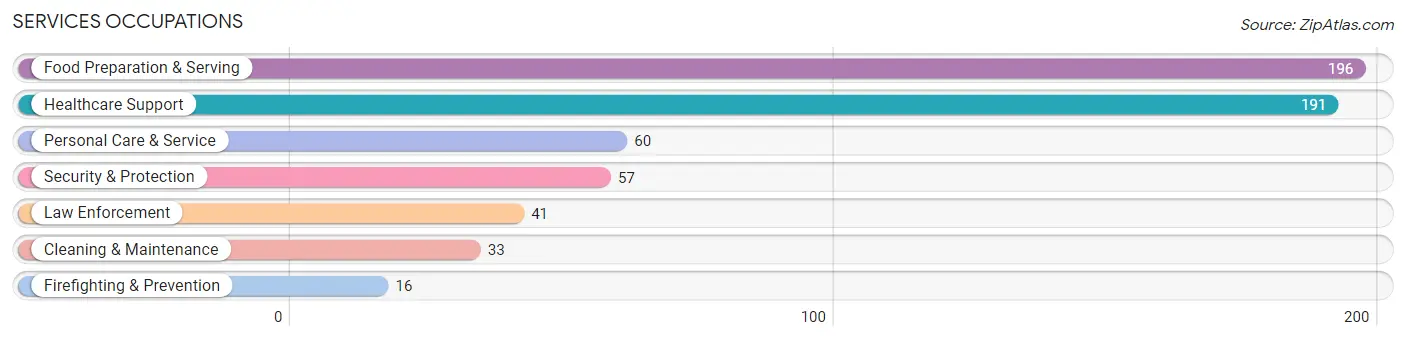
Services Occupations
The most common Services occupations in Norwich are Food Preparation & Serving (196 | 6.5%), Healthcare Support (191 | 6.3%), Personal Care & Service (60 | 2.0%), Security & Protection (57 | 1.9%), and Law Enforcement (41 | 1.3%).
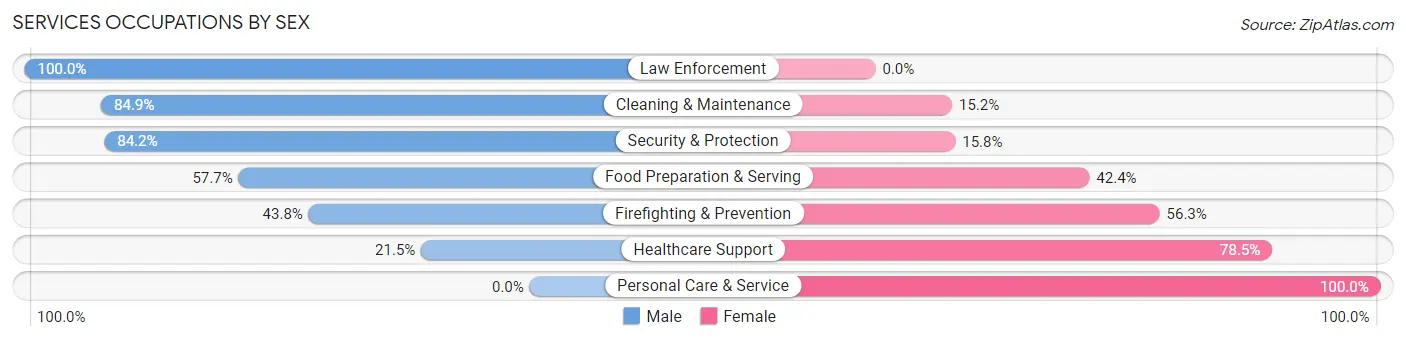
Services Occupations by Sex
Within the Services occupations in Norwich, the most male-oriented occupations are Law Enforcement (100.0%), Cleaning & Maintenance (84.9%), and Security & Protection (84.2%), while the most female-oriented occupations are Personal Care & Service (100.0%), Healthcare Support (78.5%), and Firefighting & Prevention (56.2%).
| Occupation | Male | Female |
| Healthcare Support | 41 (21.5%) | 150 (78.5%) |
| Security & Protection | 48 (84.2%) | 9 (15.8%) |
| Firefighting & Prevention | 7 (43.8%) | 9 (56.2%) |
| Law Enforcement | 41 (100.0%) | 0 (0.0%) |
| Food Preparation & Serving | 113 (57.7%) | 83 (42.3%) |
| Cleaning & Maintenance | 28 (84.9%) | 5 (15.1%) |
| Personal Care & Service | 0 (0.0%) | 60 (100.0%) |
| Total (Category) | 230 (42.8%) | 307 (57.2%) |
| Total (Overall) | 1,522 (50.1%) | 1,518 (49.9%) |
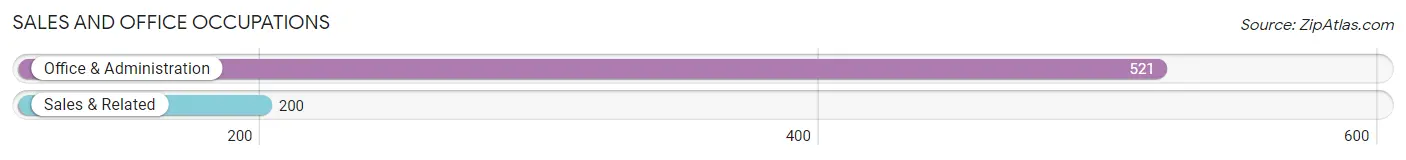
Sales and Office Occupations
The most common Sales and Office occupations in Norwich are Office & Administration (521 | 17.1%), and Sales & Related (200 | 6.6%).
Sales and Office Occupations by Sex
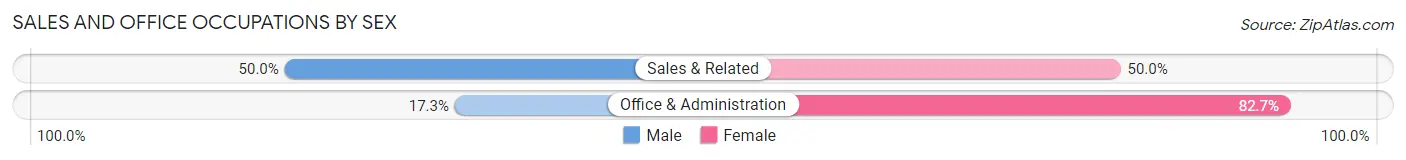
| Occupation | Male | Female |
| Sales & Related | 100 (50.0%) | 100 (50.0%) |
| Office & Administration | 90 (17.3%) | 431 (82.7%) |
| Total (Category) | 190 (26.4%) | 531 (73.7%) |
| Total (Overall) | 1,522 (50.1%) | 1,518 (49.9%) |
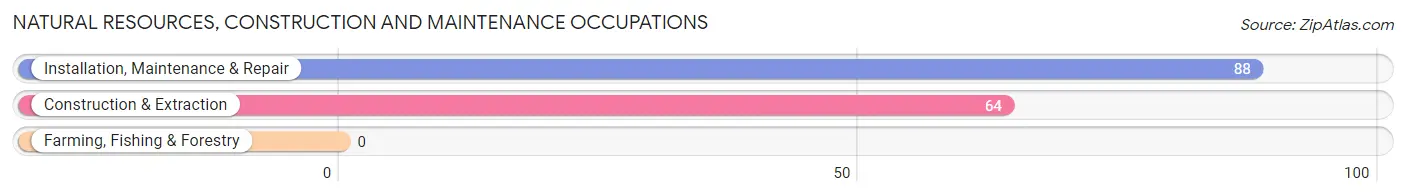
Natural Resources, Construction and Maintenance Occupations
The most common Natural Resources, Construction and Maintenance occupations in Norwich are Installation, Maintenance & Repair (88 | 2.9%), and Construction & Extraction (64 | 2.1%).
Natural Resources, Construction and Maintenance Occupations by Sex
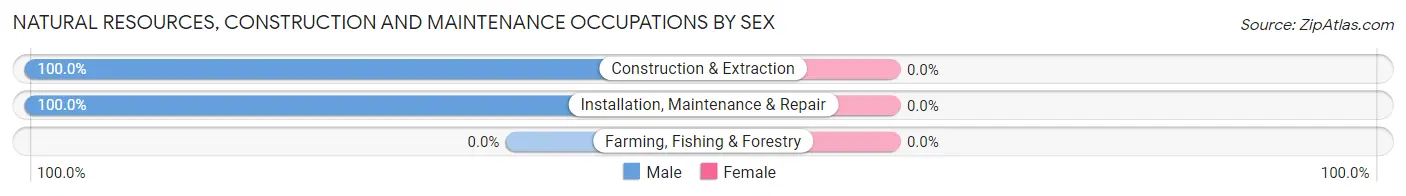
| Occupation | Male | Female |
| Farming, Fishing & Forestry | 0 (0.0%) | 0 (0.0%) |
| Construction & Extraction | 64 (100.0%) | 0 (0.0%) |
| Installation, Maintenance & Repair | 88 (100.0%) | 0 (0.0%) |
| Total (Category) | 152 (100.0%) | 0 (0.0%) |
| Total (Overall) | 1,522 (50.1%) | 1,518 (49.9%) |
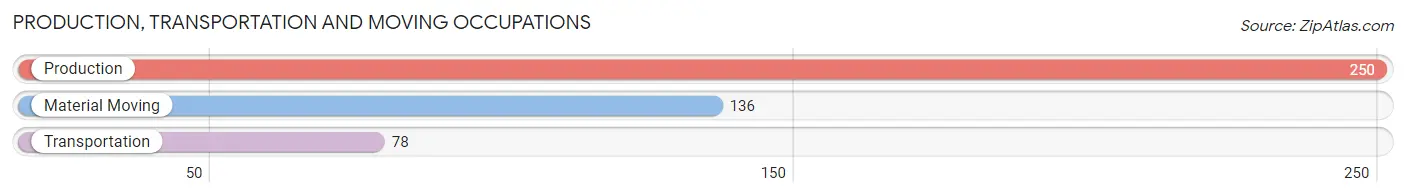
Production, Transportation and Moving Occupations
The most common Production, Transportation and Moving occupations in Norwich are Production (250 | 8.2%), Material Moving (136 | 4.5%), and Transportation (78 | 2.6%).
Production, Transportation and Moving Occupations by Sex
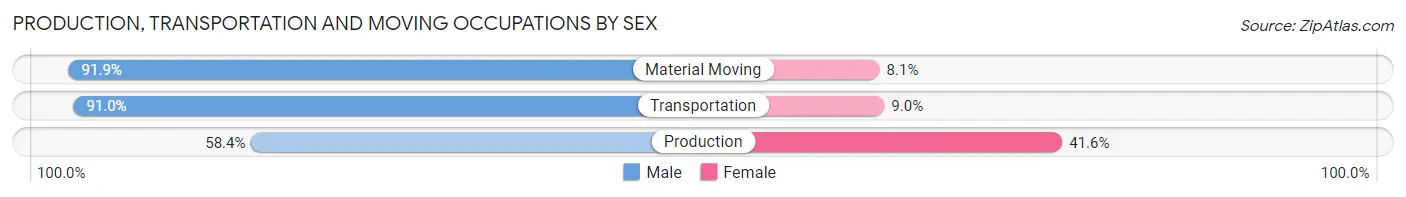
| Occupation | Male | Female |
| Production | 146 (58.4%) | 104 (41.6%) |
| Transportation | 71 (91.0%) | 7 (9.0%) |
| Material Moving | 125 (91.9%) | 11 (8.1%) |
| Total (Category) | 342 (73.7%) | 122 (26.3%) |
| Total (Overall) | 1,522 (50.1%) | 1,518 (49.9%) |
Employment Industries by Sex in Norwich
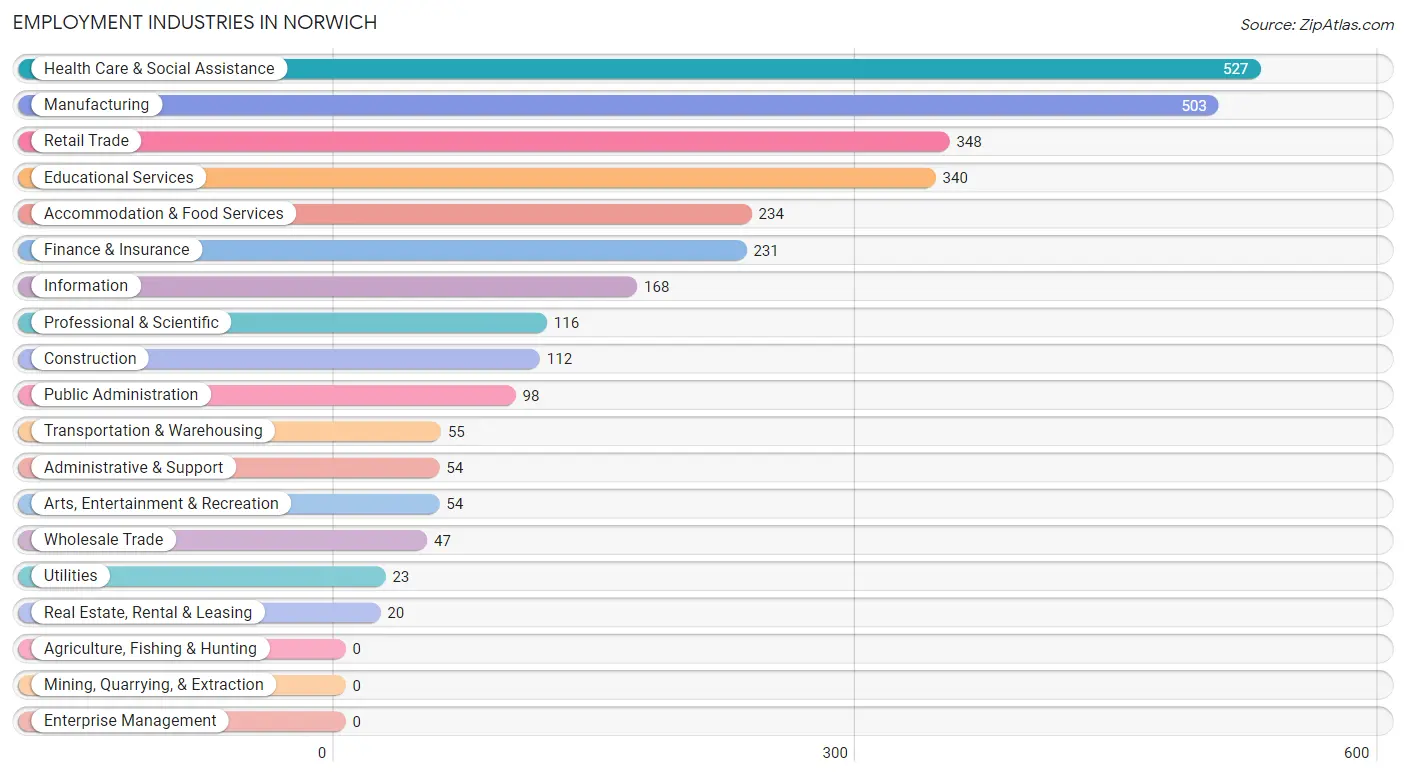
Employment Industries in Norwich
The major employment industries in Norwich include Health Care & Social Assistance (527 | 17.3%), Manufacturing (503 | 16.6%), Retail Trade (348 | 11.5%), Educational Services (340 | 11.2%), and Accommodation & Food Services (234 | 7.7%).
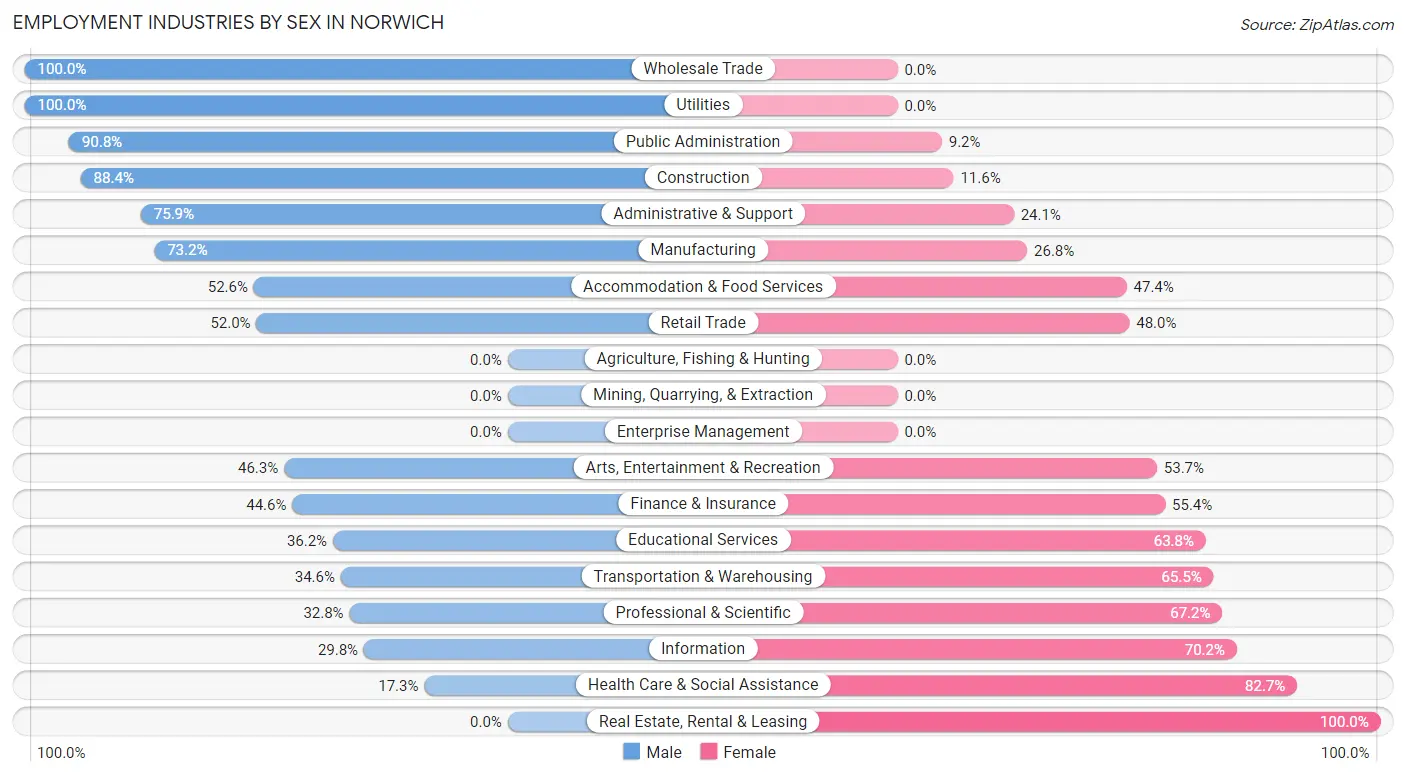
Employment Industries by Sex in Norwich
The Norwich industries that see more men than women are Wholesale Trade (100.0%), Utilities (100.0%), and Public Administration (90.8%), whereas the industries that tend to have a higher number of women are Real Estate, Rental & Leasing (100.0%), Health Care & Social Assistance (82.7%), and Information (70.2%).
| Industry | Male | Female |
| Agriculture, Fishing & Hunting | 0 (0.0%) | 0 (0.0%) |
| Mining, Quarrying, & Extraction | 0 (0.0%) | 0 (0.0%) |
| Construction | 99 (88.4%) | 13 (11.6%) |
| Manufacturing | 368 (73.2%) | 135 (26.8%) |
| Wholesale Trade | 47 (100.0%) | 0 (0.0%) |
| Retail Trade | 181 (52.0%) | 167 (48.0%) |
| Transportation & Warehousing | 19 (34.5%) | 36 (65.4%) |
| Utilities | 23 (100.0%) | 0 (0.0%) |
| Information | 50 (29.8%) | 118 (70.2%) |
| Finance & Insurance | 103 (44.6%) | 128 (55.4%) |
| Real Estate, Rental & Leasing | 0 (0.0%) | 20 (100.0%) |
| Professional & Scientific | 38 (32.8%) | 78 (67.2%) |
| Enterprise Management | 0 (0.0%) | 0 (0.0%) |
| Administrative & Support | 41 (75.9%) | 13 (24.1%) |
| Educational Services | 123 (36.2%) | 217 (63.8%) |
| Health Care & Social Assistance | 91 (17.3%) | 436 (82.7%) |
| Arts, Entertainment & Recreation | 25 (46.3%) | 29 (53.7%) |
| Accommodation & Food Services | 123 (52.6%) | 111 (47.4%) |
| Public Administration | 89 (90.8%) | 9 (9.2%) |
| Total | 1,522 (50.1%) | 1,518 (49.9%) |
Education in Norwich
School Enrollment in Norwich
The most common levels of schooling among the 1,496 students in Norwich are college / undergraduate (340 | 22.7%), high school (327 | 21.9%), and middle school (307 | 20.5%).
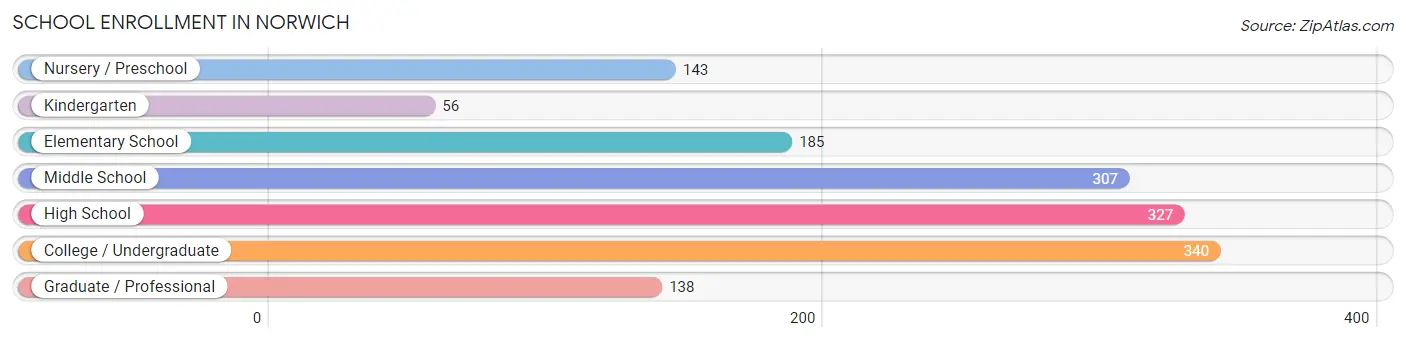
| School Level | # Students | % Students |
| Nursery / Preschool | 143 | 9.6% |
| Kindergarten | 56 | 3.7% |
| Elementary School | 185 | 12.4% |
| Middle School | 307 | 20.5% |
| High School | 327 | 21.9% |
| College / Undergraduate | 340 | 22.7% |
| Graduate / Professional | 138 | 9.2% |
| Total | 1,496 | 100.0% |
School Enrollment by Age by Funding Source in Norwich
Out of a total of 1,496 students who are enrolled in schools in Norwich, 188 (12.6%) attend a private institution, while the remaining 1,308 (87.4%) are enrolled in public schools. The age group of 35 years and over has the highest likelihood of being enrolled in private schools, with 57 (31.3% in the age bracket) enrolled. Conversely, the age group of 18 to 19 year olds has the lowest likelihood of being enrolled in a private school, with 78 (100.0% in the age bracket) attending a public institution.
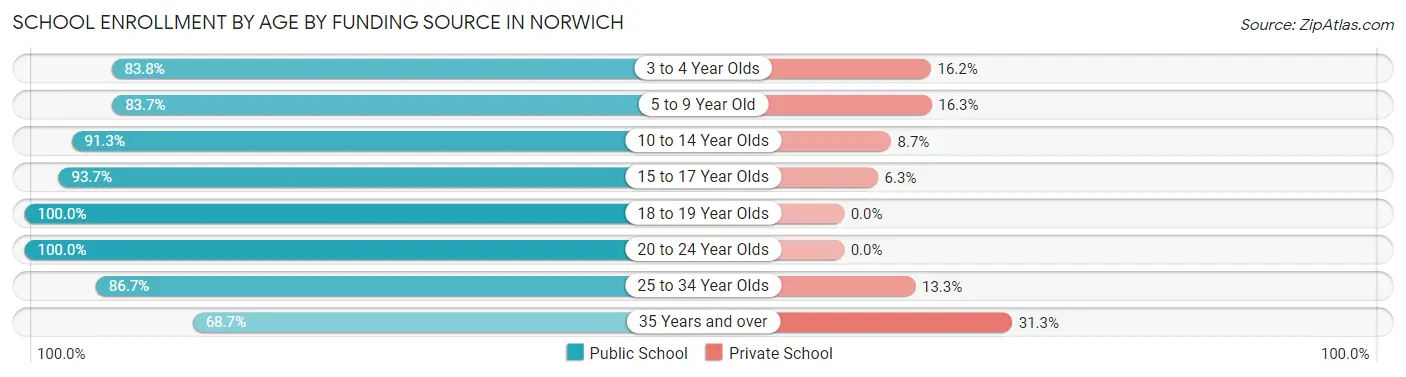
| Age Bracket | Public School | Private School |
| 3 to 4 Year Olds | 114 (83.8%) | 22 (16.2%) |
| 5 to 9 Year Old | 200 (83.7%) | 39 (16.3%) |
| 10 to 14 Year Olds | 355 (91.3%) | 34 (8.7%) |
| 15 to 17 Year Olds | 222 (93.7%) | 15 (6.3%) |
| 18 to 19 Year Olds | 78 (100.0%) | 0 (0.0%) |
| 20 to 24 Year Olds | 77 (100.0%) | 0 (0.0%) |
| 25 to 34 Year Olds | 137 (86.7%) | 21 (13.3%) |
| 35 Years and over | 125 (68.7%) | 57 (31.3%) |
| Total | 1,308 (87.4%) | 188 (12.6%) |
Educational Attainment by Field of Study in Norwich
Education (290 | 21.7%), business (177 | 13.3%), physical & health sciences (135 | 10.1%), liberal arts & history (118 | 8.8%), and psychology (117 | 8.8%) are the most common fields of study among 1,334 individuals in Norwich who have obtained a bachelor's degree or higher.
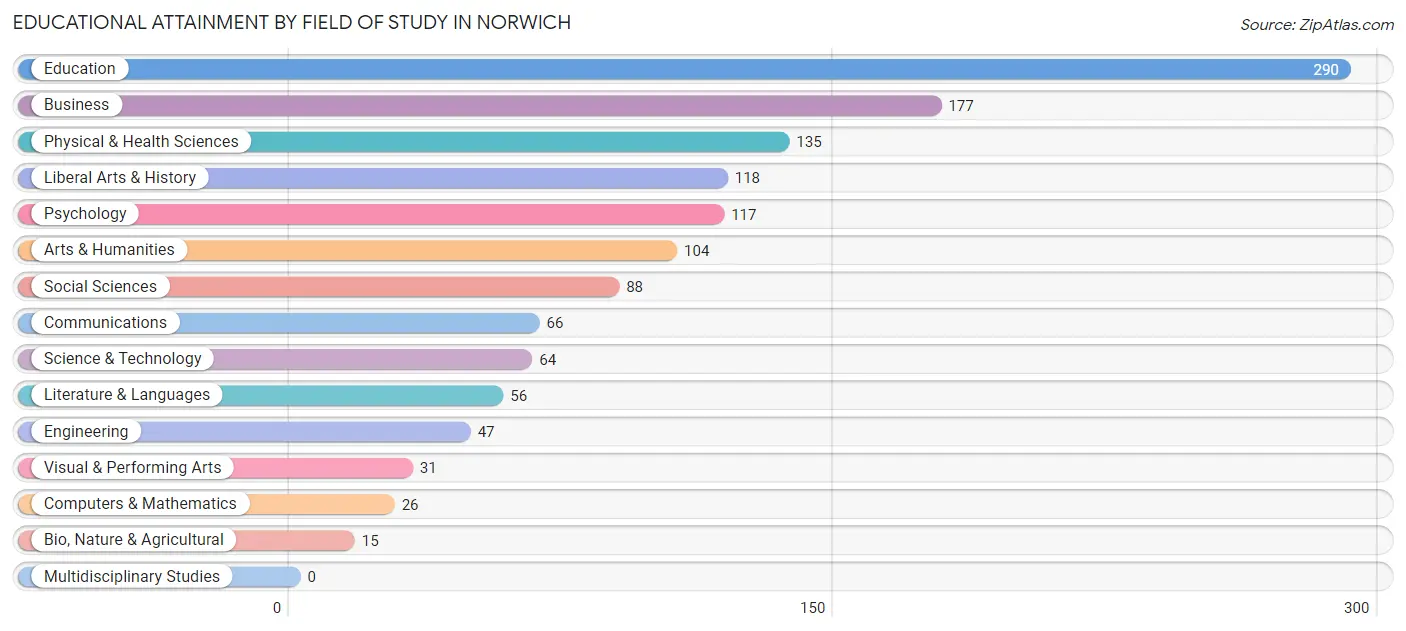
| Field of Study | # Graduates | % Graduates |
| Computers & Mathematics | 26 | 1.9% |
| Bio, Nature & Agricultural | 15 | 1.1% |
| Physical & Health Sciences | 135 | 10.1% |
| Psychology | 117 | 8.8% |
| Social Sciences | 88 | 6.6% |
| Engineering | 47 | 3.5% |
| Multidisciplinary Studies | 0 | 0.0% |
| Science & Technology | 64 | 4.8% |
| Business | 177 | 13.3% |
| Education | 290 | 21.7% |
| Literature & Languages | 56 | 4.2% |
| Liberal Arts & History | 118 | 8.8% |
| Visual & Performing Arts | 31 | 2.3% |
| Communications | 66 | 5.0% |
| Arts & Humanities | 104 | 7.8% |
| Total | 1,334 | 100.0% |
Transportation & Commute in Norwich
Vehicle Availability by Sex in Norwich
The most prevalent vehicle ownership categories in Norwich are males with 2 vehicles (712, accounting for 48.6%) and females with 2 vehicles (588, making up 49.7%).
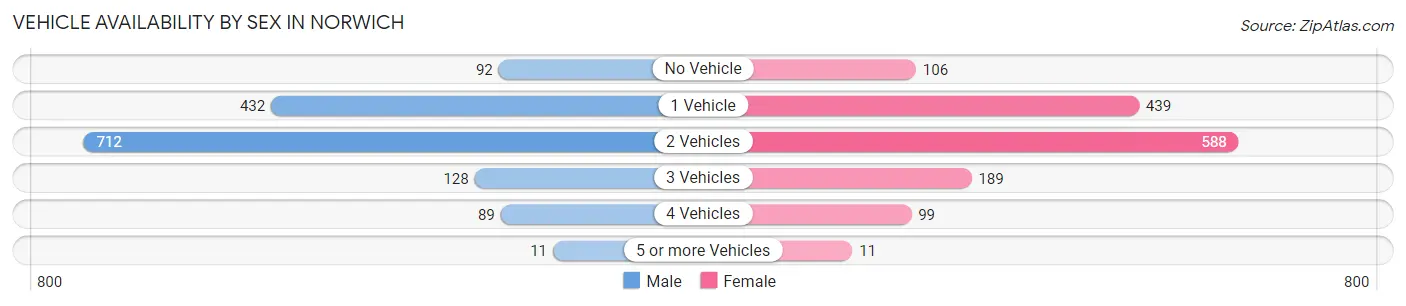
| Vehicles Available | Male | Female |
| No Vehicle | 92 (6.3%) | 106 (7.4%) |
| 1 Vehicle | 432 (29.5%) | 439 (30.7%) |
| 2 Vehicles | 712 (48.6%) | 588 (41.1%) |
| 3 Vehicles | 128 (8.7%) | 189 (13.2%) |
| 4 Vehicles | 89 (6.1%) | 99 (6.9%) |
| 5 or more Vehicles | 11 (0.7%) | 11 (0.8%) |
| Total | 1,464 (100.0%) | 1,432 (100.0%) |
Commute Time in Norwich
The most frequently occuring commute durations in Norwich are 5 to 9 minutes (884 commuters, 32.3%), 10 to 14 minutes (476 commuters, 17.4%), and less than 5 minutes (440 commuters, 16.1%).
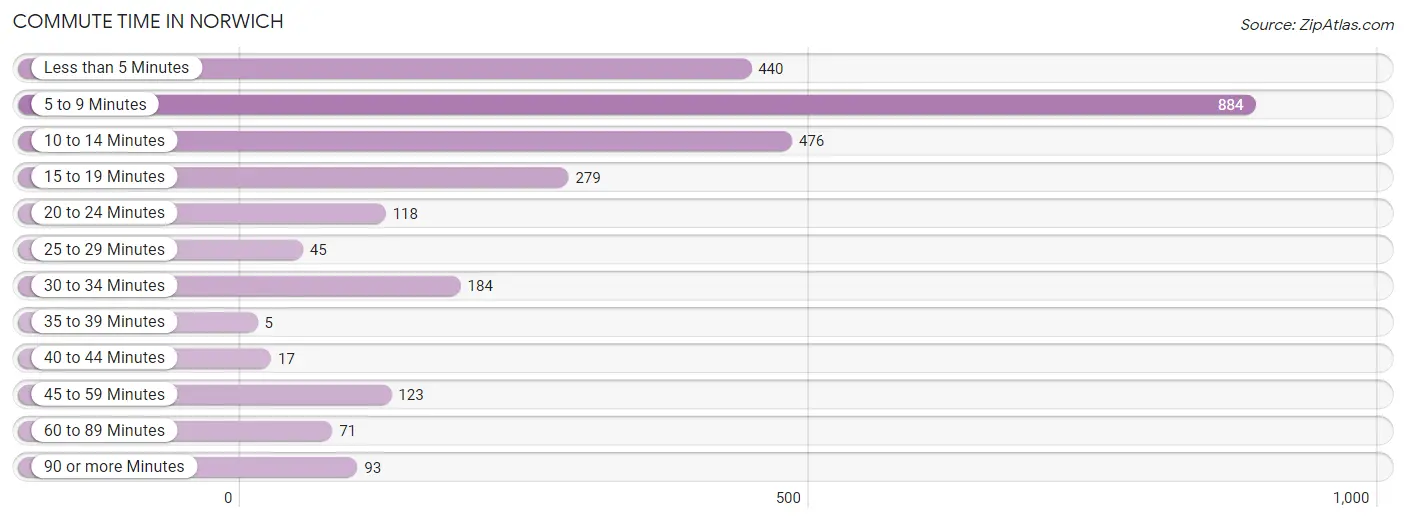
| Commute Time | # Commuters | % Commuters |
| Less than 5 Minutes | 440 | 16.1% |
| 5 to 9 Minutes | 884 | 32.3% |
| 10 to 14 Minutes | 476 | 17.4% |
| 15 to 19 Minutes | 279 | 10.2% |
| 20 to 24 Minutes | 118 | 4.3% |
| 25 to 29 Minutes | 45 | 1.7% |
| 30 to 34 Minutes | 184 | 6.7% |
| 35 to 39 Minutes | 5 | 0.2% |
| 40 to 44 Minutes | 17 | 0.6% |
| 45 to 59 Minutes | 123 | 4.5% |
| 60 to 89 Minutes | 71 | 2.6% |
| 90 or more Minutes | 93 | 3.4% |
Commute Time by Sex in Norwich
The most common commute times in Norwich are 5 to 9 minutes (398 commuters, 28.2%) for males and 5 to 9 minutes (486 commuters, 36.6%) for females.
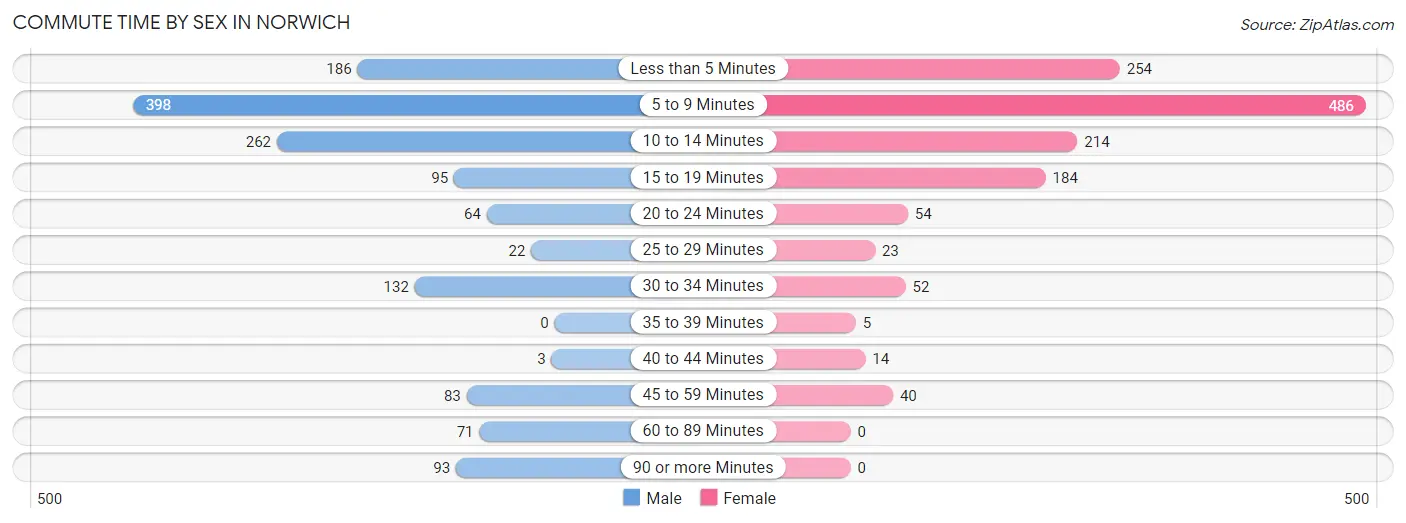
| Commute Time | Male | Female |
| Less than 5 Minutes | 186 (13.2%) | 254 (19.2%) |
| 5 to 9 Minutes | 398 (28.2%) | 486 (36.6%) |
| 10 to 14 Minutes | 262 (18.6%) | 214 (16.1%) |
| 15 to 19 Minutes | 95 (6.7%) | 184 (13.9%) |
| 20 to 24 Minutes | 64 (4.5%) | 54 (4.1%) |
| 25 to 29 Minutes | 22 (1.6%) | 23 (1.7%) |
| 30 to 34 Minutes | 132 (9.4%) | 52 (3.9%) |
| 35 to 39 Minutes | 0 (0.0%) | 5 (0.4%) |
| 40 to 44 Minutes | 3 (0.2%) | 14 (1.1%) |
| 45 to 59 Minutes | 83 (5.9%) | 40 (3.0%) |
| 60 to 89 Minutes | 71 (5.0%) | 0 (0.0%) |
| 90 or more Minutes | 93 (6.6%) | 0 (0.0%) |
Time of Departure to Work by Sex in Norwich
The most frequent times of departure to work in Norwich are 7:00 AM to 7:29 AM (241, 17.1%) for males and 7:00 AM to 7:29 AM (322, 24.3%) for females.
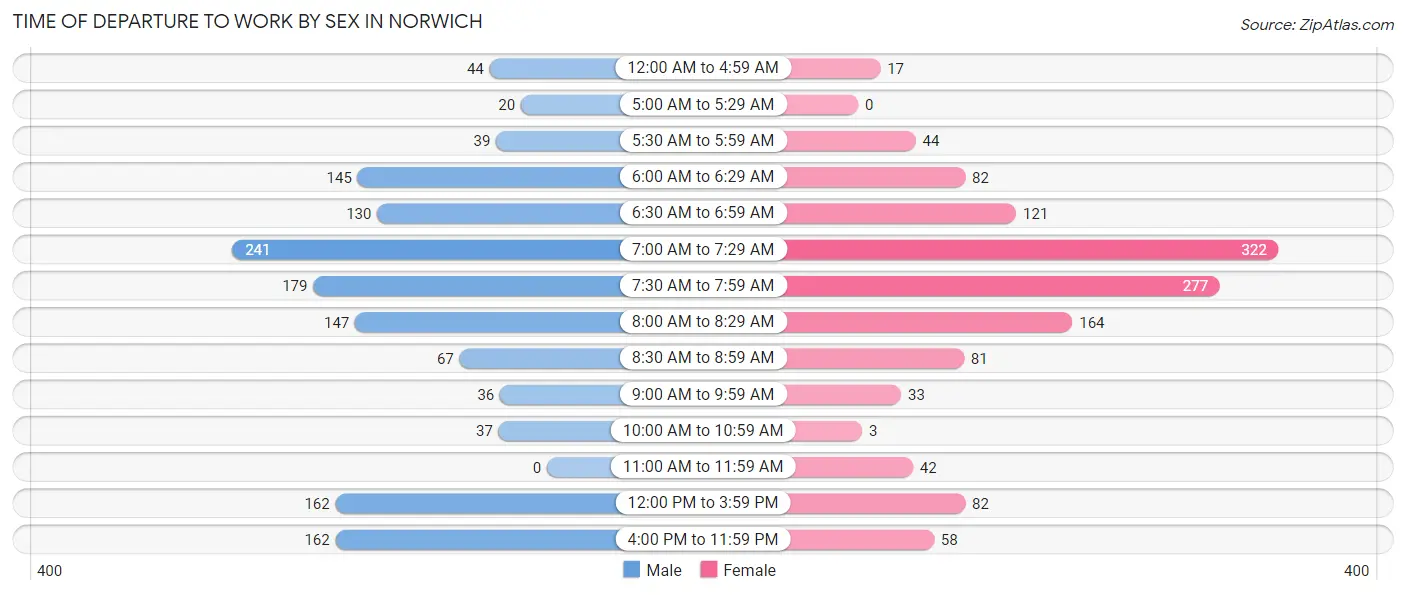
| Time of Departure | Male | Female |
| 12:00 AM to 4:59 AM | 44 (3.1%) | 17 (1.3%) |
| 5:00 AM to 5:29 AM | 20 (1.4%) | 0 (0.0%) |
| 5:30 AM to 5:59 AM | 39 (2.8%) | 44 (3.3%) |
| 6:00 AM to 6:29 AM | 145 (10.3%) | 82 (6.2%) |
| 6:30 AM to 6:59 AM | 130 (9.2%) | 121 (9.1%) |
| 7:00 AM to 7:29 AM | 241 (17.1%) | 322 (24.3%) |
| 7:30 AM to 7:59 AM | 179 (12.7%) | 277 (20.9%) |
| 8:00 AM to 8:29 AM | 147 (10.4%) | 164 (12.4%) |
| 8:30 AM to 8:59 AM | 67 (4.8%) | 81 (6.1%) |
| 9:00 AM to 9:59 AM | 36 (2.6%) | 33 (2.5%) |
| 10:00 AM to 10:59 AM | 37 (2.6%) | 3 (0.2%) |
| 11:00 AM to 11:59 AM | 0 (0.0%) | 42 (3.2%) |
| 12:00 PM to 3:59 PM | 162 (11.5%) | 82 (6.2%) |
| 4:00 PM to 11:59 PM | 162 (11.5%) | 58 (4.4%) |
| Total | 1,409 (100.0%) | 1,326 (100.0%) |
Housing Occupancy in Norwich
Occupancy by Ownership in Norwich
Of the total 3,087 dwellings in Norwich, owner-occupied units account for 1,276 (41.3%), while renter-occupied units make up 1,811 (58.7%).
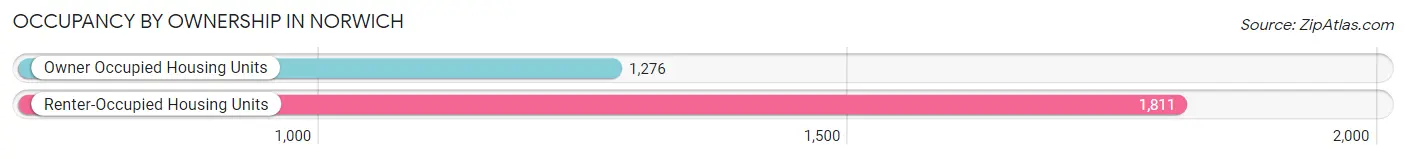
| Occupancy | # Housing Units | % Housing Units |
| Owner Occupied Housing Units | 1,276 | 41.3% |
| Renter-Occupied Housing Units | 1,811 | 58.7% |
| Total Occupied Housing Units | 3,087 | 100.0% |
Occupancy by Household Size in Norwich
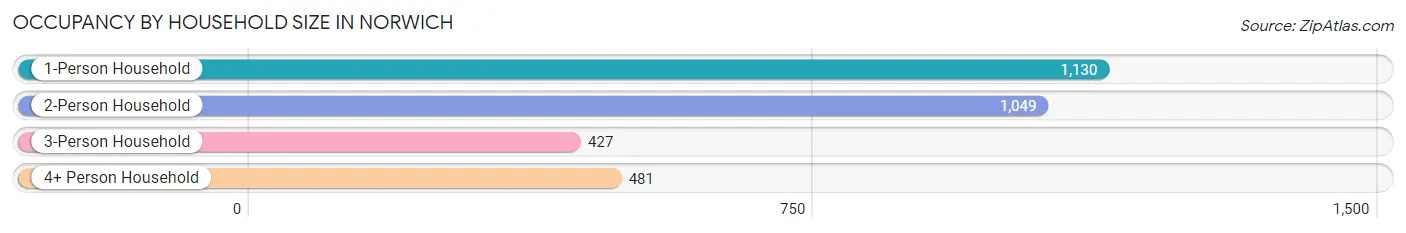
| Household Size | # Housing Units | % Housing Units |
| 1-Person Household | 1,130 | 36.6% |
| 2-Person Household | 1,049 | 34.0% |
| 3-Person Household | 427 | 13.8% |
| 4+ Person Household | 481 | 15.6% |
| Total Housing Units | 3,087 | 100.0% |
Occupancy by Ownership by Household Size in Norwich
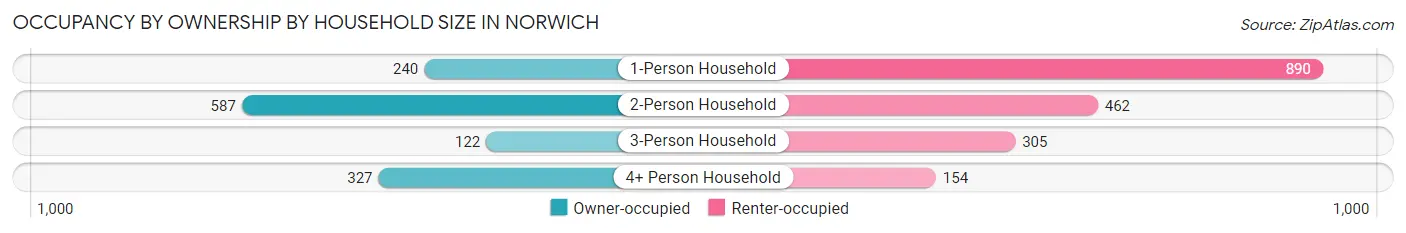
| Household Size | Owner-occupied | Renter-occupied |
| 1-Person Household | 240 (21.2%) | 890 (78.8%) |
| 2-Person Household | 587 (56.0%) | 462 (44.0%) |
| 3-Person Household | 122 (28.6%) | 305 (71.4%) |
| 4+ Person Household | 327 (68.0%) | 154 (32.0%) |
| Total Housing Units | 1,276 (41.3%) | 1,811 (58.7%) |
Occupancy by Educational Attainment in Norwich
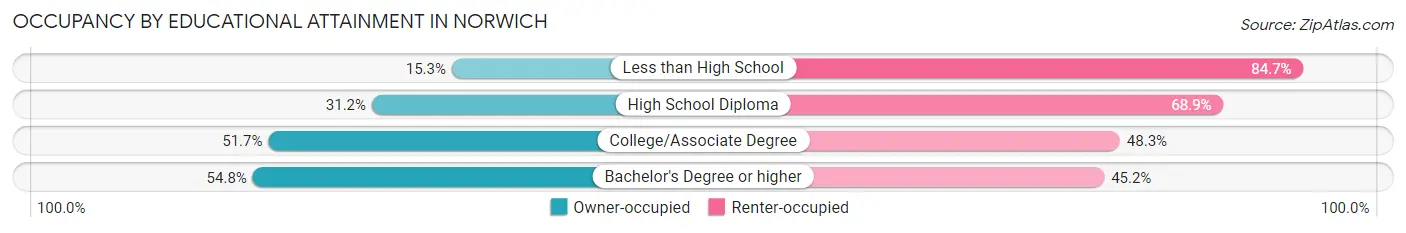
| Household Size | Owner-occupied | Renter-occupied |
| Less than High School | 43 (15.3%) | 238 (84.7%) |
| High School Diploma | 367 (31.1%) | 811 (68.9%) |
| College/Associate Degree | 431 (51.7%) | 403 (48.3%) |
| Bachelor's Degree or higher | 435 (54.8%) | 359 (45.2%) |
Occupancy by Age of Householder in Norwich
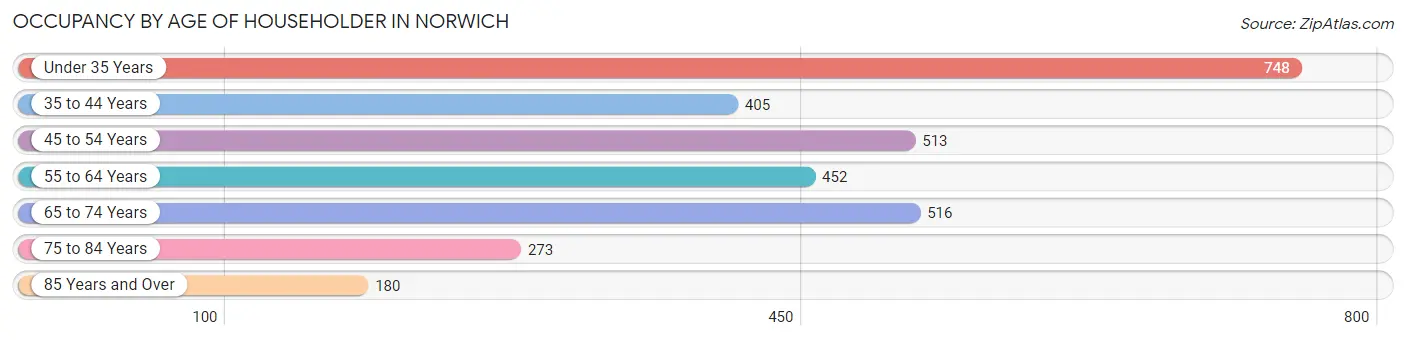
| Age Bracket | # Households | % Households |
| Under 35 Years | 748 | 24.2% |
| 35 to 44 Years | 405 | 13.1% |
| 45 to 54 Years | 513 | 16.6% |
| 55 to 64 Years | 452 | 14.6% |
| 65 to 74 Years | 516 | 16.7% |
| 75 to 84 Years | 273 | 8.8% |
| 85 Years and Over | 180 | 5.8% |
| Total | 3,087 | 100.0% |
Housing Finances in Norwich
Median Income by Occupancy in Norwich
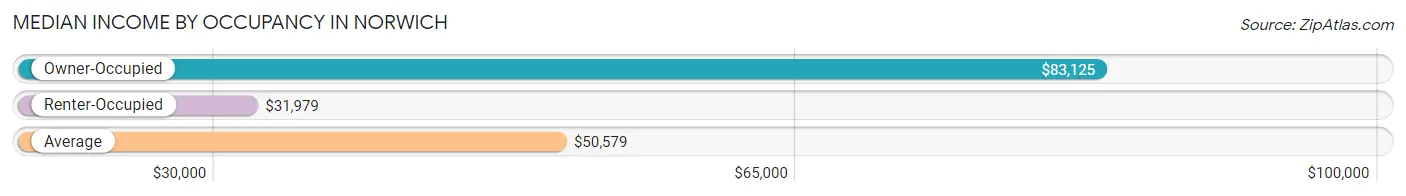
| Occupancy Type | # Households | Median Income |
| Owner-Occupied | 1,276 (41.3%) | $83,125 |
| Renter-Occupied | 1,811 (58.7%) | $31,979 |
| Average | 3,087 (100.0%) | $50,579 |
Occupancy by Householder Income Bracket in Norwich
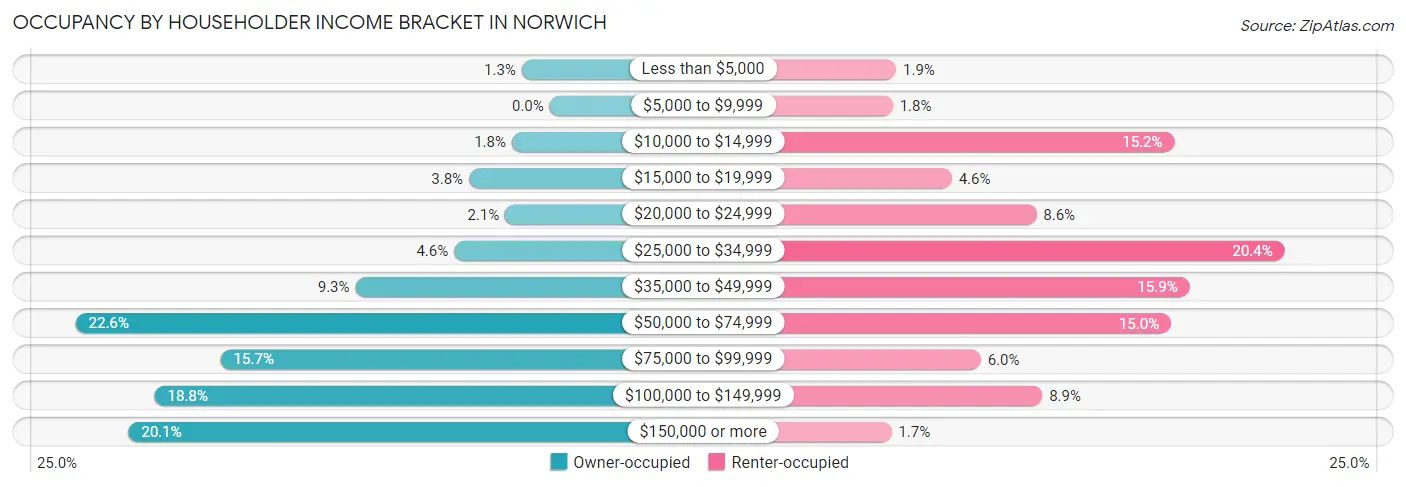
| Income Bracket | Owner-occupied | Renter-occupied |
| Less than $5,000 | 17 (1.3%) | 35 (1.9%) |
| $5,000 to $9,999 | 0 (0.0%) | 32 (1.8%) |
| $10,000 to $14,999 | 23 (1.8%) | 275 (15.2%) |
| $15,000 to $19,999 | 49 (3.8%) | 83 (4.6%) |
| $20,000 to $24,999 | 27 (2.1%) | 156 (8.6%) |
| $25,000 to $34,999 | 58 (4.5%) | 370 (20.4%) |
| $35,000 to $49,999 | 118 (9.2%) | 288 (15.9%) |
| $50,000 to $74,999 | 288 (22.6%) | 272 (15.0%) |
| $75,000 to $99,999 | 200 (15.7%) | 108 (6.0%) |
| $100,000 to $149,999 | 240 (18.8%) | 161 (8.9%) |
| $150,000 or more | 256 (20.1%) | 31 (1.7%) |
| Total | 1,276 (100.0%) | 1,811 (100.0%) |
Monthly Housing Cost Tiers in Norwich
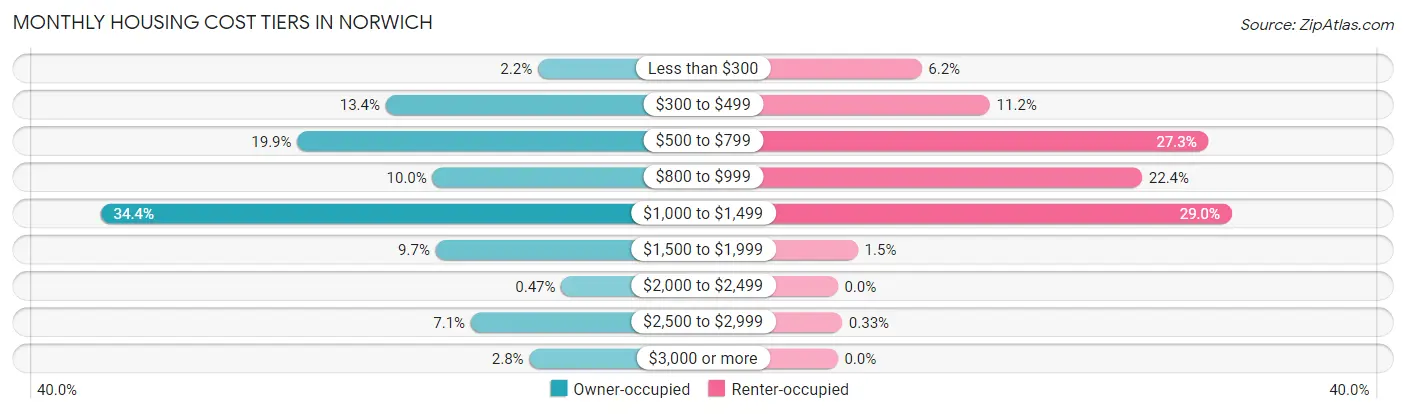
| Monthly Cost | Owner-occupied | Renter-occupied |
| Less than $300 | 28 (2.2%) | 112 (6.2%) |
| $300 to $499 | 171 (13.4%) | 203 (11.2%) |
| $500 to $799 | 254 (19.9%) | 495 (27.3%) |
| $800 to $999 | 127 (10.0%) | 406 (22.4%) |
| $1,000 to $1,499 | 439 (34.4%) | 526 (29.0%) |
| $1,500 to $1,999 | 124 (9.7%) | 27 (1.5%) |
| $2,000 to $2,499 | 6 (0.5%) | 0 (0.0%) |
| $2,500 to $2,999 | 91 (7.1%) | 6 (0.3%) |
| $3,000 or more | 36 (2.8%) | 0 (0.0%) |
| Total | 1,276 (100.0%) | 1,811 (100.0%) |
Physical Housing Characteristics in Norwich
Housing Structures in Norwich
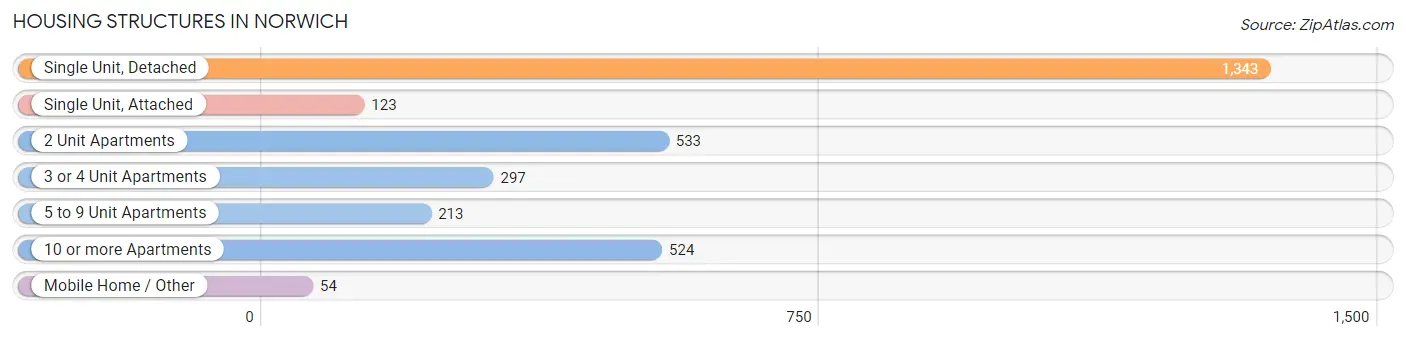
| Structure Type | # Housing Units | % Housing Units |
| Single Unit, Detached | 1,343 | 43.5% |
| Single Unit, Attached | 123 | 4.0% |
| 2 Unit Apartments | 533 | 17.3% |
| 3 or 4 Unit Apartments | 297 | 9.6% |
| 5 to 9 Unit Apartments | 213 | 6.9% |
| 10 or more Apartments | 524 | 17.0% |
| Mobile Home / Other | 54 | 1.8% |
| Total | 3,087 | 100.0% |
Housing Structures by Occupancy in Norwich
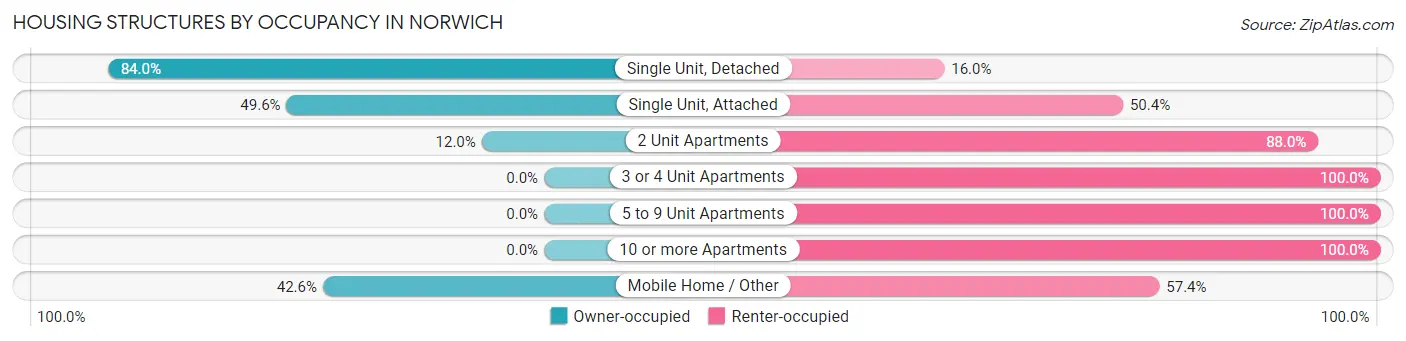
| Structure Type | Owner-occupied | Renter-occupied |
| Single Unit, Detached | 1,128 (84.0%) | 215 (16.0%) |
| Single Unit, Attached | 61 (49.6%) | 62 (50.4%) |
| 2 Unit Apartments | 64 (12.0%) | 469 (88.0%) |
| 3 or 4 Unit Apartments | 0 (0.0%) | 297 (100.0%) |
| 5 to 9 Unit Apartments | 0 (0.0%) | 213 (100.0%) |
| 10 or more Apartments | 0 (0.0%) | 524 (100.0%) |
| Mobile Home / Other | 23 (42.6%) | 31 (57.4%) |
| Total | 1,276 (41.3%) | 1,811 (58.7%) |
Housing Structures by Number of Rooms in Norwich
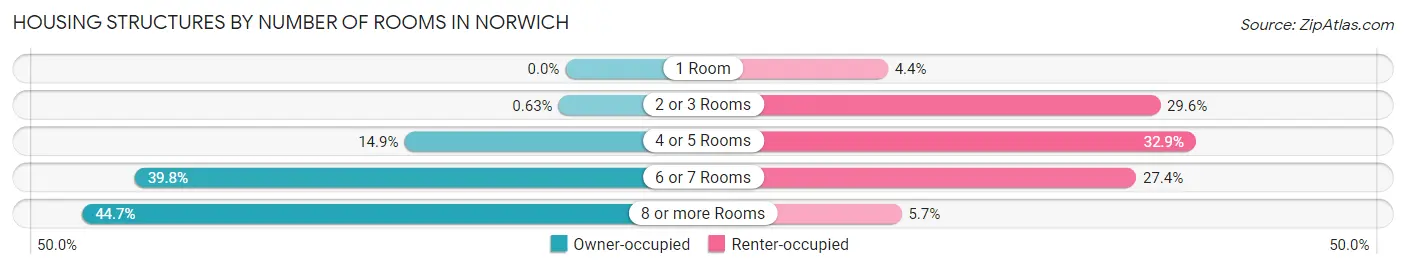
| Number of Rooms | Owner-occupied | Renter-occupied |
| 1 Room | 0 (0.0%) | 80 (4.4%) |
| 2 or 3 Rooms | 8 (0.6%) | 536 (29.6%) |
| 4 or 5 Rooms | 190 (14.9%) | 596 (32.9%) |
| 6 or 7 Rooms | 508 (39.8%) | 496 (27.4%) |
| 8 or more Rooms | 570 (44.7%) | 103 (5.7%) |
| Total | 1,276 (100.0%) | 1,811 (100.0%) |
Housing Structure by Heating Type in Norwich
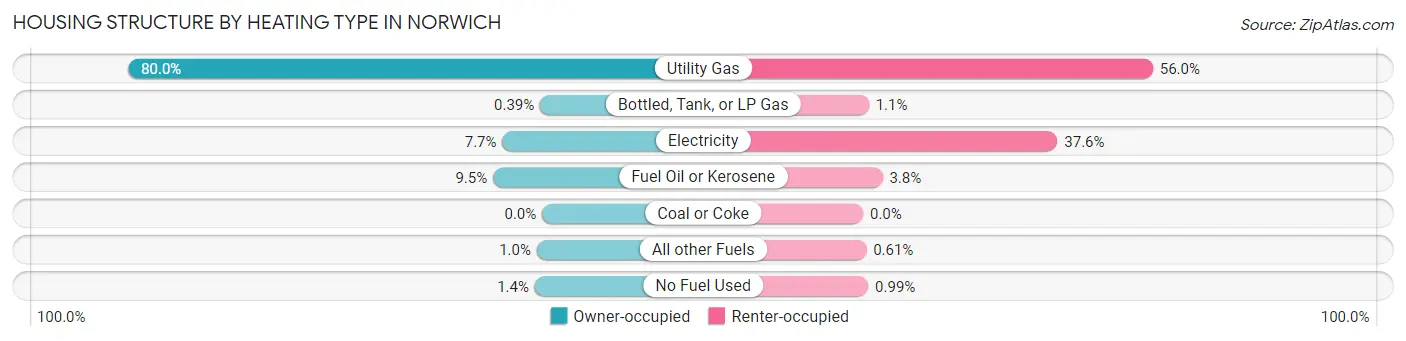
| Heating Type | Owner-occupied | Renter-occupied |
| Utility Gas | 1,021 (80.0%) | 1,014 (56.0%) |
| Bottled, Tank, or LP Gas | 5 (0.4%) | 20 (1.1%) |
| Electricity | 98 (7.7%) | 680 (37.6%) |
| Fuel Oil or Kerosene | 121 (9.5%) | 68 (3.7%) |
| Coal or Coke | 0 (0.0%) | 0 (0.0%) |
| All other Fuels | 13 (1.0%) | 11 (0.6%) |
| No Fuel Used | 18 (1.4%) | 18 (1.0%) |
| Total | 1,276 (100.0%) | 1,811 (100.0%) |
Household Vehicle Usage in Norwich
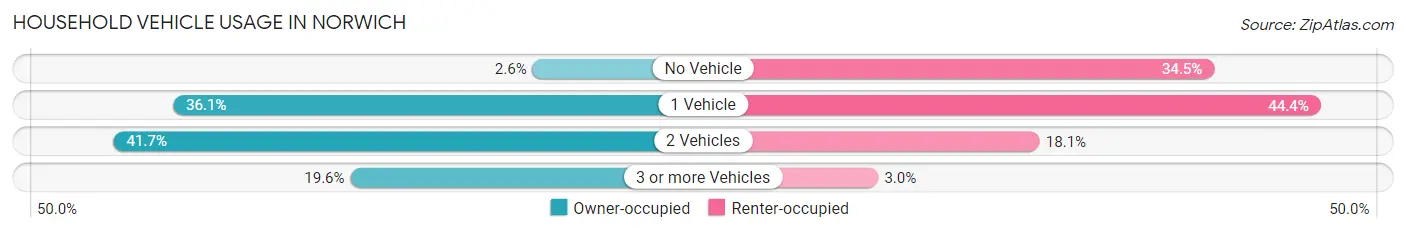
| Vehicles per Household | Owner-occupied | Renter-occupied |
| No Vehicle | 33 (2.6%) | 624 (34.5%) |
| 1 Vehicle | 461 (36.1%) | 804 (44.4%) |
| 2 Vehicles | 532 (41.7%) | 328 (18.1%) |
| 3 or more Vehicles | 250 (19.6%) | 55 (3.0%) |
| Total | 1,276 (100.0%) | 1,811 (100.0%) |
Real Estate & Mortgages in Norwich
Real Estate and Mortgage Overview in Norwich
| Characteristic | Without Mortgage | With Mortgage |
| Housing Units | 545 | 731 |
| Median Property Value | $102,900 | $121,900 |
| Median Household Income | $72,159 | $136 |
| Monthly Housing Costs | $569 | $36 |
| Real Estate Taxes | $2,667 | $29 |
Property Value by Mortgage Status in Norwich
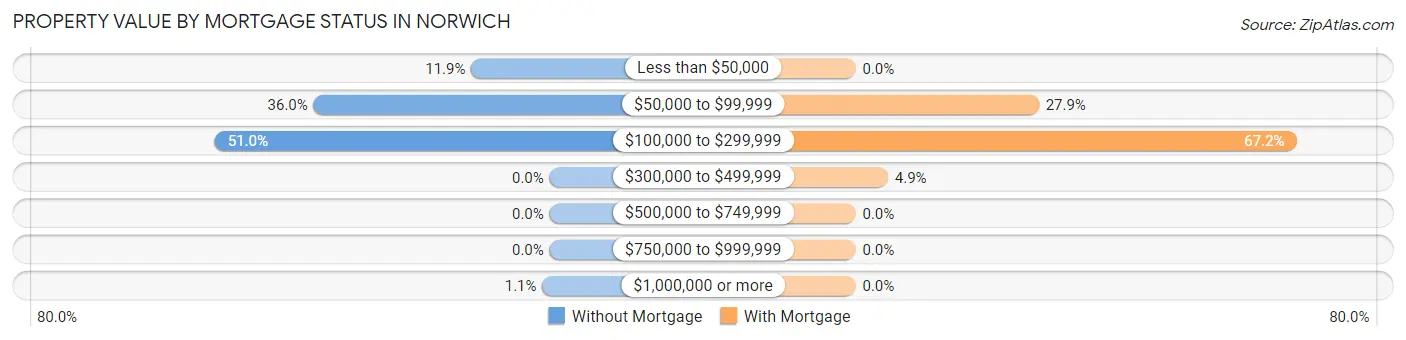
| Property Value | Without Mortgage | With Mortgage |
| Less than $50,000 | 65 (11.9%) | 0 (0.0%) |
| $50,000 to $99,999 | 196 (36.0%) | 204 (27.9%) |
| $100,000 to $299,999 | 278 (51.0%) | 491 (67.2%) |
| $300,000 to $499,999 | 0 (0.0%) | 36 (4.9%) |
| $500,000 to $749,999 | 0 (0.0%) | 0 (0.0%) |
| $750,000 to $999,999 | 0 (0.0%) | 0 (0.0%) |
| $1,000,000 or more | 6 (1.1%) | 0 (0.0%) |
| Total | 545 (100.0%) | 731 (100.0%) |
Household Income by Mortgage Status in Norwich
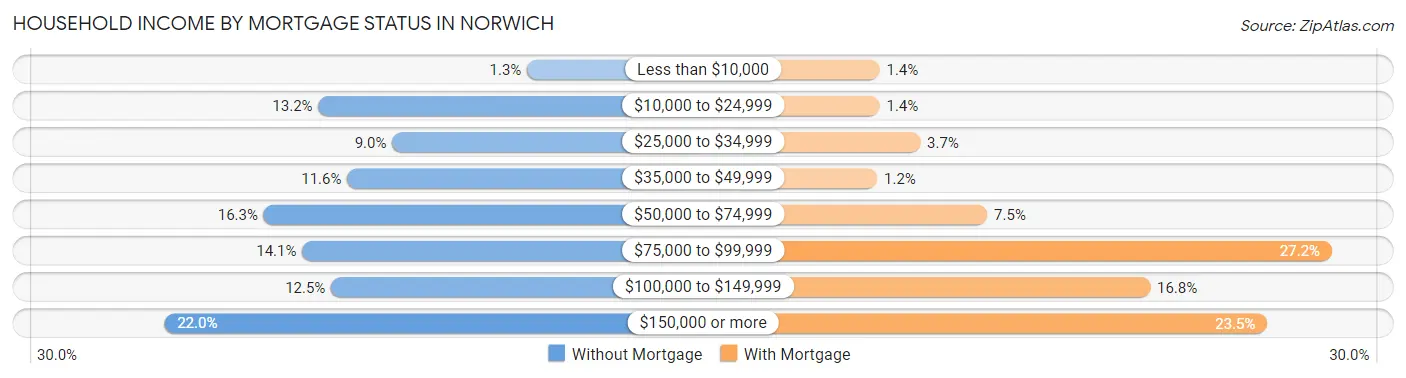
| Household Income | Without Mortgage | With Mortgage |
| Less than $10,000 | 7 (1.3%) | 10 (1.4%) |
| $10,000 to $24,999 | 72 (13.2%) | 10 (1.4%) |
| $25,000 to $34,999 | 49 (9.0%) | 27 (3.7%) |
| $35,000 to $49,999 | 63 (11.6%) | 9 (1.2%) |
| $50,000 to $74,999 | 89 (16.3%) | 55 (7.5%) |
| $75,000 to $99,999 | 77 (14.1%) | 199 (27.2%) |
| $100,000 to $149,999 | 68 (12.5%) | 123 (16.8%) |
| $150,000 or more | 120 (22.0%) | 172 (23.5%) |
| Total | 545 (100.0%) | 731 (100.0%) |
Property Value to Household Income Ratio in Norwich
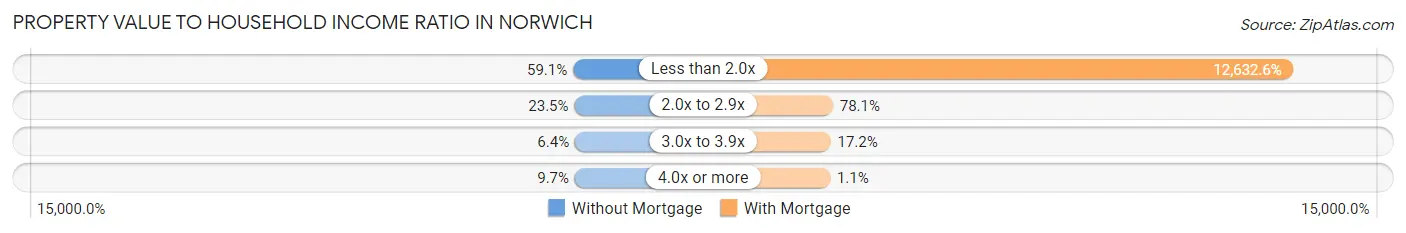
| Value-to-Income Ratio | Without Mortgage | With Mortgage |
| Less than 2.0x | 322 (59.1%) | 92,344 (12,632.6%) |
| 2.0x to 2.9x | 128 (23.5%) | 571 (78.1%) |
| 3.0x to 3.9x | 35 (6.4%) | 126 (17.2%) |
| 4.0x or more | 53 (9.7%) | 8 (1.1%) |
| Total | 545 (100.0%) | 731 (100.0%) |
Real Estate Taxes by Mortgage Status in Norwich
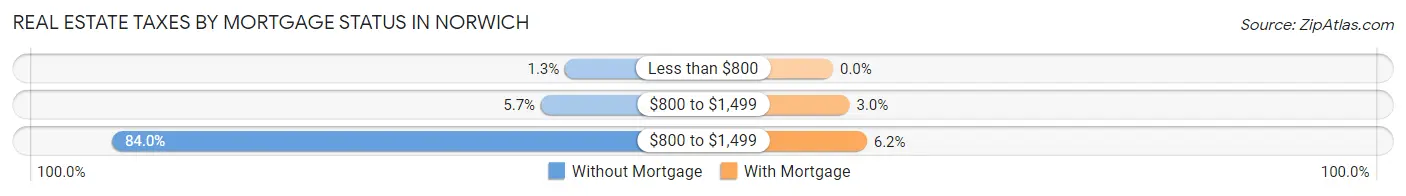
| Property Taxes | Without Mortgage | With Mortgage |
| Less than $800 | 7 (1.3%) | 0 (0.0%) |
| $800 to $1,499 | 31 (5.7%) | 22 (3.0%) |
| $800 to $1,499 | 458 (84.0%) | 45 (6.2%) |
| Total | 545 (100.0%) | 731 (100.0%) |
Health & Disability in Norwich
Health Insurance Coverage by Age in Norwich
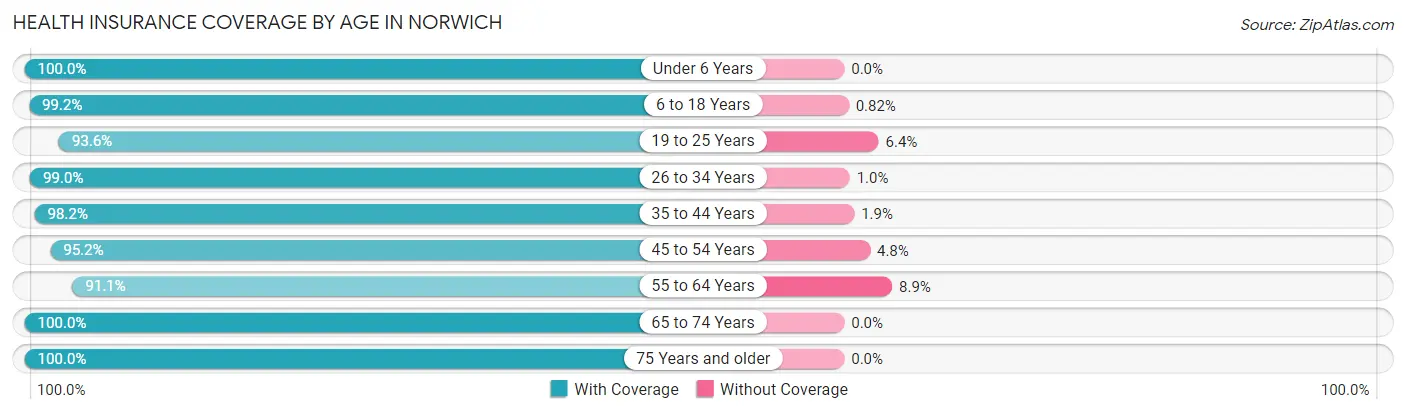
| Age Bracket | With Coverage | Without Coverage |
| Under 6 Years | 447 (100.0%) | 0 (0.0%) |
| 6 to 18 Years | 962 (99.2%) | 8 (0.8%) |
| 19 to 25 Years | 556 (93.6%) | 38 (6.4%) |
| 26 to 34 Years | 978 (99.0%) | 10 (1.0%) |
| 35 to 44 Years | 798 (98.2%) | 15 (1.8%) |
| 45 to 54 Years | 852 (95.2%) | 43 (4.8%) |
| 55 to 64 Years | 654 (91.1%) | 64 (8.9%) |
| 65 to 74 Years | 713 (100.0%) | 0 (0.0%) |
| 75 Years and older | 571 (100.0%) | 0 (0.0%) |
| Total | 6,531 (97.4%) | 178 (2.6%) |
Health Insurance Coverage by Citizenship Status in Norwich
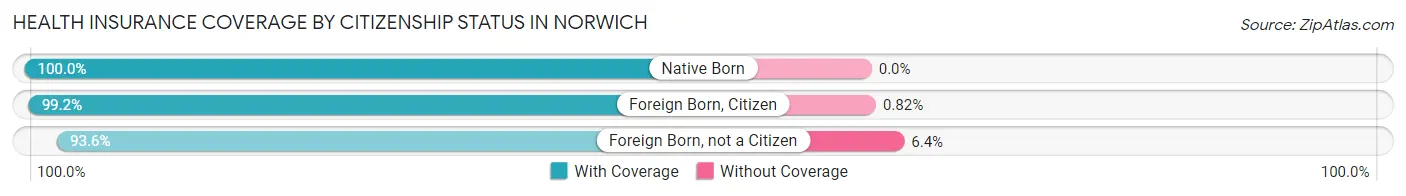
| Citizenship Status | With Coverage | Without Coverage |
| Native Born | 447 (100.0%) | 0 (0.0%) |
| Foreign Born, Citizen | 962 (99.2%) | 8 (0.8%) |
| Foreign Born, not a Citizen | 556 (93.6%) | 38 (6.4%) |
Health Insurance Coverage by Household Income in Norwich
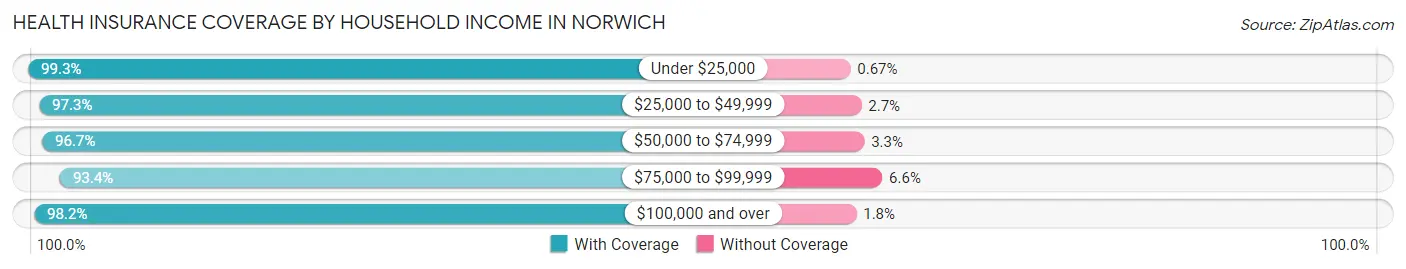
| Household Income | With Coverage | Without Coverage |
| Under $25,000 | 1,193 (99.3%) | 8 (0.7%) |
| $25,000 to $49,999 | 1,253 (97.3%) | 35 (2.7%) |
| $50,000 to $74,999 | 1,362 (96.7%) | 46 (3.3%) |
| $75,000 to $99,999 | 760 (93.4%) | 54 (6.6%) |
| $100,000 and over | 1,928 (98.2%) | 35 (1.8%) |
Public vs Private Health Insurance Coverage by Age in Norwich
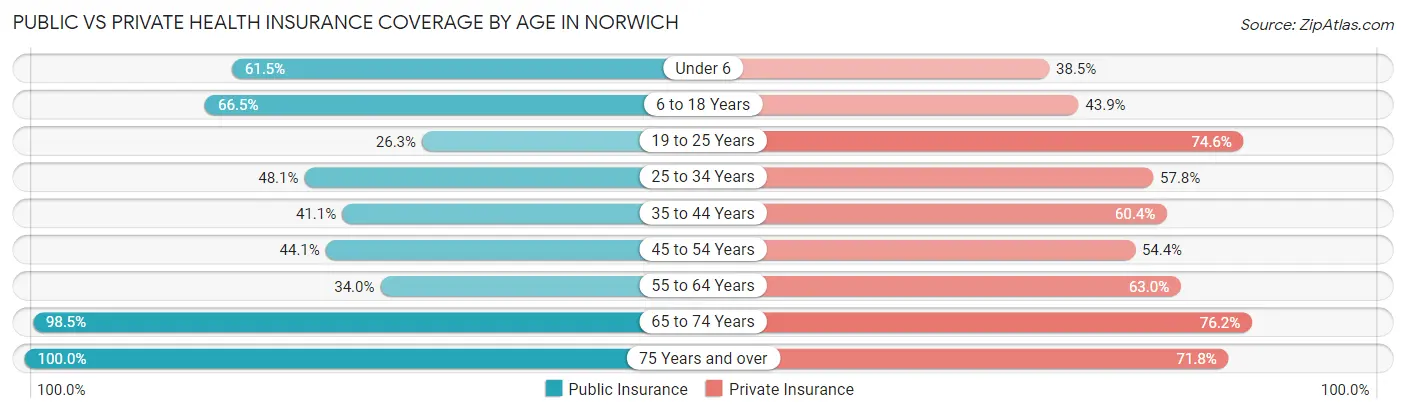
| Age Bracket | Public Insurance | Private Insurance |
| Under 6 | 275 (61.5%) | 172 (38.5%) |
| 6 to 18 Years | 645 (66.5%) | 426 (43.9%) |
| 19 to 25 Years | 156 (26.3%) | 443 (74.6%) |
| 25 to 34 Years | 475 (48.1%) | 571 (57.8%) |
| 35 to 44 Years | 334 (41.1%) | 491 (60.4%) |
| 45 to 54 Years | 395 (44.1%) | 487 (54.4%) |
| 55 to 64 Years | 244 (34.0%) | 452 (62.9%) |
| 65 to 74 Years | 702 (98.5%) | 543 (76.2%) |
| 75 Years and over | 571 (100.0%) | 410 (71.8%) |
| Total | 3,797 (56.6%) | 3,995 (59.6%) |
Disability Status by Sex by Age in Norwich
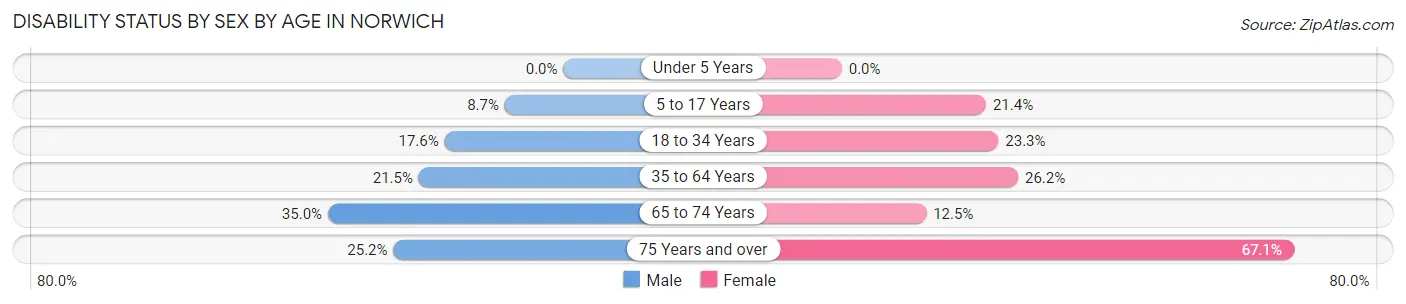
| Age Bracket | Male | Female |
| Under 5 Years | 0 (0.0%) | 0 (0.0%) |
| 5 to 17 Years | 43 (8.7%) | 88 (21.4%) |
| 18 to 34 Years | 142 (17.6%) | 209 (23.3%) |
| 35 to 64 Years | 259 (21.5%) | 319 (26.2%) |
| 65 to 74 Years | 79 (35.0%) | 61 (12.5%) |
| 75 Years and over | 52 (25.2%) | 245 (67.1%) |
Disability Class by Sex by Age in Norwich
Disability Class: Hearing Difficulty
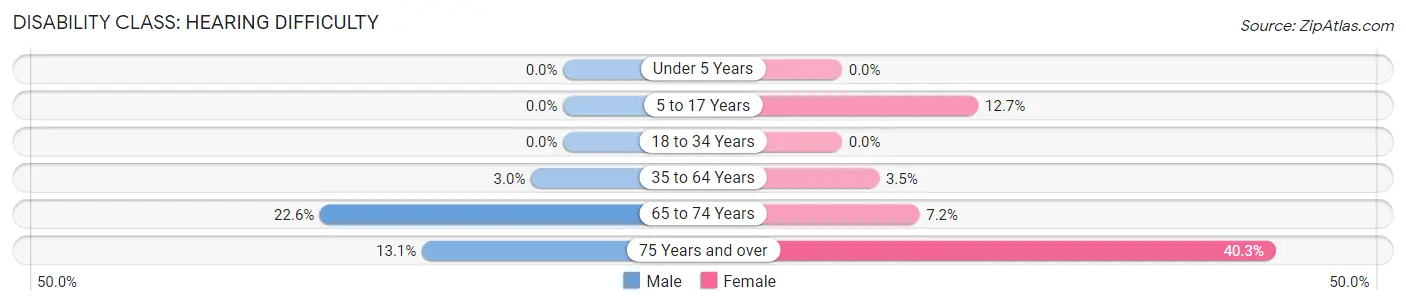
| Age Bracket | Male | Female |
| Under 5 Years | 0 (0.0%) | 0 (0.0%) |
| 5 to 17 Years | 0 (0.0%) | 52 (12.7%) |
| 18 to 34 Years | 0 (0.0%) | 0 (0.0%) |
| 35 to 64 Years | 36 (3.0%) | 42 (3.5%) |
| 65 to 74 Years | 51 (22.6%) | 35 (7.2%) |
| 75 Years and over | 27 (13.1%) | 147 (40.3%) |
Disability Class: Vision Difficulty
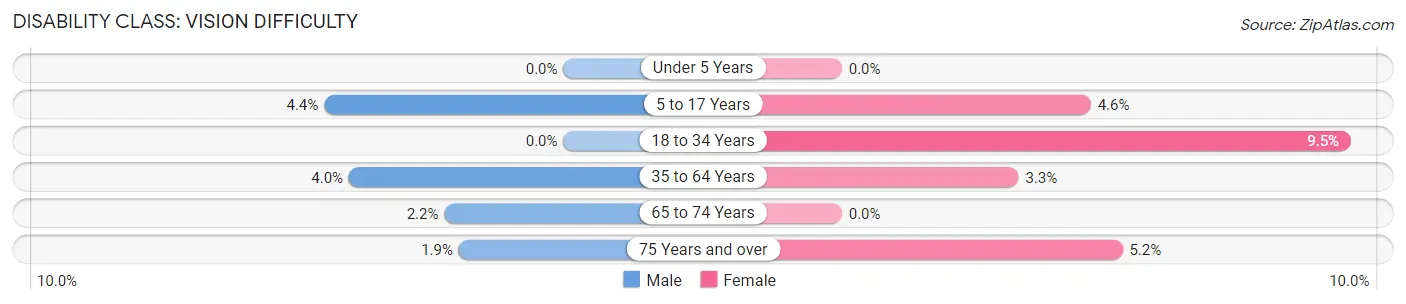
| Age Bracket | Male | Female |
| Under 5 Years | 0 (0.0%) | 0 (0.0%) |
| 5 to 17 Years | 22 (4.4%) | 19 (4.6%) |
| 18 to 34 Years | 0 (0.0%) | 85 (9.5%) |
| 35 to 64 Years | 48 (4.0%) | 40 (3.3%) |
| 65 to 74 Years | 5 (2.2%) | 0 (0.0%) |
| 75 Years and over | 4 (1.9%) | 19 (5.2%) |
Disability Class: Cognitive Difficulty
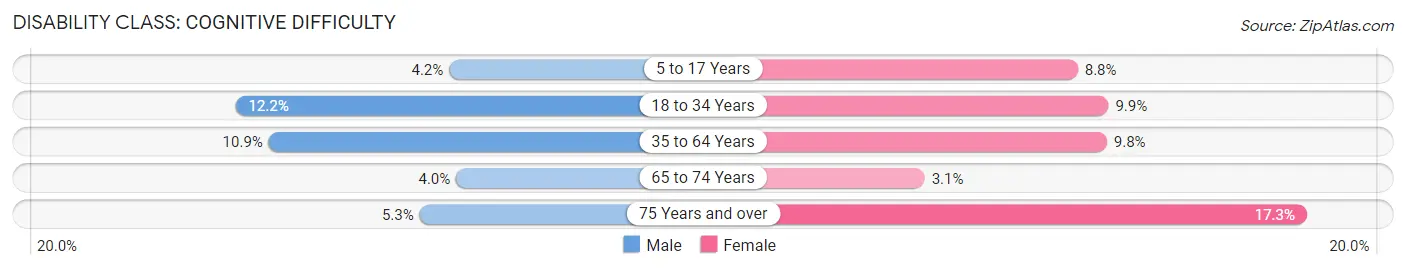
| Age Bracket | Male | Female |
| 5 to 17 Years | 21 (4.2%) | 36 (8.8%) |
| 18 to 34 Years | 98 (12.2%) | 89 (9.9%) |
| 35 to 64 Years | 132 (10.9%) | 120 (9.8%) |
| 65 to 74 Years | 9 (4.0%) | 15 (3.1%) |
| 75 Years and over | 11 (5.3%) | 63 (17.3%) |
Disability Class: Ambulatory Difficulty
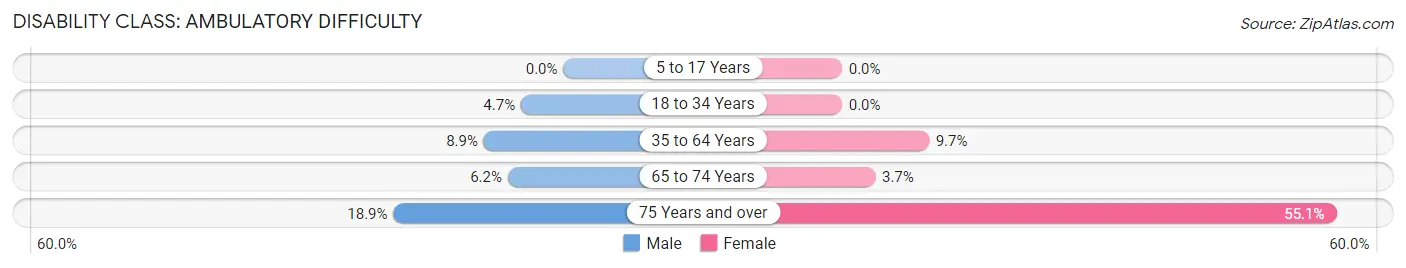
| Age Bracket | Male | Female |
| 5 to 17 Years | 0 (0.0%) | 0 (0.0%) |
| 18 to 34 Years | 38 (4.7%) | 0 (0.0%) |
| 35 to 64 Years | 107 (8.9%) | 118 (9.7%) |
| 65 to 74 Years | 14 (6.2%) | 18 (3.7%) |
| 75 Years and over | 39 (18.9%) | 201 (55.1%) |
Disability Class: Self-Care Difficulty
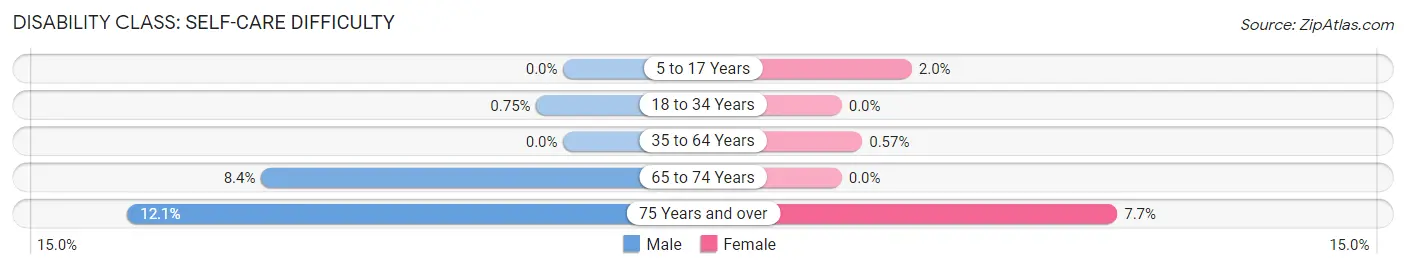
| Age Bracket | Male | Female |
| 5 to 17 Years | 0 (0.0%) | 8 (1.9%) |
| 18 to 34 Years | 6 (0.7%) | 0 (0.0%) |
| 35 to 64 Years | 0 (0.0%) | 7 (0.6%) |
| 65 to 74 Years | 19 (8.4%) | 0 (0.0%) |
| 75 Years and over | 25 (12.1%) | 28 (7.7%) |
Technology Access in Norwich
Computing Device Access in Norwich
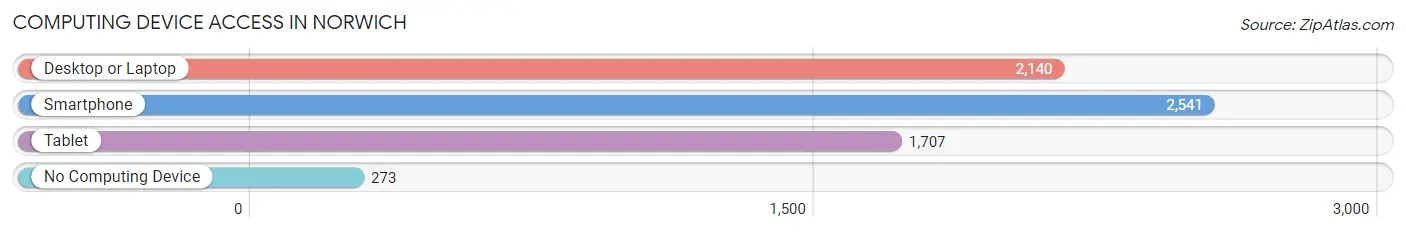
| Device Type | # Households | % Households |
| Desktop or Laptop | 2,140 | 69.3% |
| Smartphone | 2,541 | 82.3% |
| Tablet | 1,707 | 55.3% |
| No Computing Device | 273 | 8.8% |
| Total | 3,087 | 100.0% |
Internet Access in Norwich
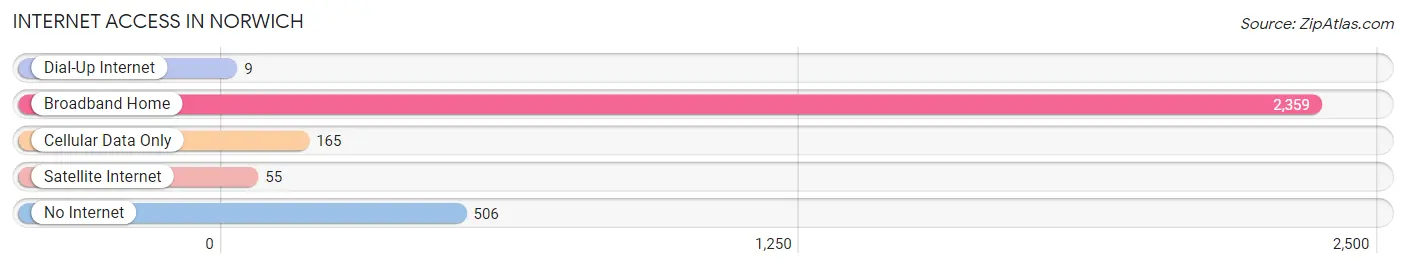
| Internet Type | # Households | % Households |
| Dial-Up Internet | 9 | 0.3% |
| Broadband Home | 2,359 | 76.4% |
| Cellular Data Only | 165 | 5.3% |
| Satellite Internet | 55 | 1.8% |
| No Internet | 506 | 16.4% |
| Total | 3,087 | 100.0% |
Norwich Summary
Norwich is a city located in Chenango County, New York, United States. The population was 7,355 at the 2010 census. It is the county seat of Chenango County. The city is surrounded by the town of Norwich and is located in the center of the county.
History
The area that is now Norwich was first settled in 1788 by settlers from New England. The first settler was William Williams, who built a log cabin near the present-day intersection of North Broad Street and East Main Street. The settlement was originally known as "Newtown", but was later changed to "Norwich" after the city of Norwich, Connecticut.
The city was incorporated in 1816 and was named the county seat of Chenango County in 1819. The Chenango Canal, which connected the Chenango and Susquehanna Rivers, was completed in 1837 and helped to spur the growth of the city. The canal was used to transport goods and passengers between Binghamton and Utica.
The city was a major center of the abolitionist movement in the mid-19th century. The Norwich Anti-Slavery Society was founded in 1835 and held regular meetings in the city. The city was also home to the first African-American newspaper in the state, The Norwich Courier, which was published from 1845 to 1848.
Geography
Norwich is located at 42°25′N 75°31′W (42.4133, -75.5179). According to the United States Census Bureau, the city has a total area of 4.2 square miles (10.8 km2), all of it land.
The city is located in the Chenango Valley, which is part of the Appalachian Plateau. The valley is surrounded by hills and mountains, including the Unadilla Mountains to the west and the Catskill Mountains to the east. The city is located at the confluence of the Chenango and Susquehanna Rivers.
Economy
Norwich is the county seat of Chenango County and is the economic and cultural center of the region. The city is home to a variety of businesses, including manufacturing, retail, and service industries.
The largest employer in the city is the Norwich City School District, which employs over 1,000 people. Other major employers include the Norwich Public Library, Chenango Memorial Hospital, and the Chenango County Courthouse.
The city is also home to a variety of small businesses, including restaurants, shops, and professional services. The city is also home to a number of small manufacturing companies, including Norwich Pharmaceuticals, which produces generic drugs.
Demographics
As of the 2010 census, there were 7,355 people, 2,945 households, and 1,845 families residing in the city. The population density was 1,743.3 people per square mile (673.2/km2). There were 3,093 housing units at an average density of 735.2 per square mile (284.2/km2). The racial makeup of the city was 94.2% White, 1.7% African American, 0.3% Native American, 0.7% Asian, 0.1% Pacific Islander, 1.3% from other races, and 1.9% from two or more races. Hispanic or Latino of any race were 3.7% of the population.
There were 2,945 households, out of which 30.2% had children under the age of 18 living with them, 44.2% were married couples living together, 14.2% had a female householder with no husband present, and 36.2% were non-families. 30.7% of all households were made up of individuals, and 13.2% had someone living alone who was 65 years of age or older. The average household size was 2.41 and the average family size was 2.98.
In the city, the population was spread out, with 24.7% under the age of 18, 8.2% from 18 to 24, 27.2% from 25 to 44, 22.7% from 45 to 64, and 17.2% who were 65 years of age or older. The median age was 38 years. For every 100 females, there were 91.2 males. For every 100 females age 18 and over, there were 87.2 males.
The median income for a household in the city was $35,938, and the median income for a family was $45,938. Males had a median income of $31,938 versus $25,938 for females. The per capita income for the city was $18,938. About 8.2% of families and 11.2% of the population were below the poverty line, including 15.2% of those under age 18 and 8.2% of those age 65 or over.
Common Questions
What is Per Capita Income in Norwich?
Per Capita income in Norwich is $32,626.
What is the Median Family Income in Norwich?
Median Family Income in Norwich is $71,659.
What is the Median Household income in Norwich?
Median Household Income in Norwich is $50,579.
What is Income or Wage Gap in Norwich?
Income or Wage Gap in Norwich is 39.4%.
Women in Norwich earn 60.6 cents for every dollar earned by a man.
What is Inequality or Gini Index in Norwich?
Inequality or Gini Index in Norwich is 0.49.
What is the Total Population of Norwich?
Total Population of Norwich is 6,950.
What is the Total Male Population of Norwich?
Total Male Population of Norwich is 3,222.
What is the Total Female Population of Norwich?
Total Female Population of Norwich is 3,728.
What is the Ratio of Males per 100 Females in Norwich?
There are 86.43 Males per 100 Females in Norwich.
What is the Ratio of Females per 100 Males in Norwich?
There are 115.70 Females per 100 Males in Norwich.
What is the Median Population Age in Norwich?
Median Population Age in Norwich is 40.5 Years.
What is the Average Family Size in Norwich
Average Family Size in Norwich is 2.8 People.
What is the Average Household Size in Norwich
Average Household Size in Norwich is 2.2 People.
How Large is the Labor Force in Norwich?
There are 3,441 People in the Labor Forcein in Norwich.
What is the Percentage of People in the Labor Force in Norwich?
59.3% of People are in the Labor Force in Norwich.
What is the Unemployment Rate in Norwich?
Unemployment Rate in Norwich is 11.7%.