Rome, NY Map & Demographics
Rome Map
Rome Overview
$31,008
PER CAPITA INCOME
$74,084
AVG FAMILY INCOME
$56,901
AVG HOUSEHOLD INCOME
19.8%
WAGE / INCOME GAP [ % ]
80.2¢/ $1
WAGE / INCOME GAP [ $ ]
$13,981
FAMILY INCOME DEFICIT
0.44
INEQUALITY / GINI INDEX
32,031
TOTAL POPULATION
16,147
MALE POPULATION
15,884
FEMALE POPULATION
101.66
MALES / 100 FEMALES
98.37
FEMALES / 100 MALES
40.7
MEDIAN AGE
2.9
AVG FAMILY SIZE
2.2
AVG HOUSEHOLD SIZE
13,847
LABOR FORCE [ PEOPLE ]
53.1%
PERCENT IN LABOR FORCE
5.0%
UNEMPLOYMENT RATE
Rome Area Codes
Income in Rome
Income Overview in Rome
Per Capita Income in Rome is $31,008, while median incomes of families and households are $74,084 and $56,901 respectively.
| Characteristic | Number | Measure |
| Per Capita Income | 32,031 | $31,008 |
| Median Family Income | 7,761 | $74,084 |
| Mean Family Income | 7,761 | $87,022 |
| Median Household Income | 13,726 | $56,901 |
| Mean Household Income | 13,726 | $70,407 |
| Income Deficit | 7,761 | $13,981 |
| Wage / Income Gap (%) | 32,031 | 19.79% |
| Wage / Income Gap ($) | 32,031 | 80.21¢ per $1 |
| Gini / Inequality Index | 32,031 | 0.44 |
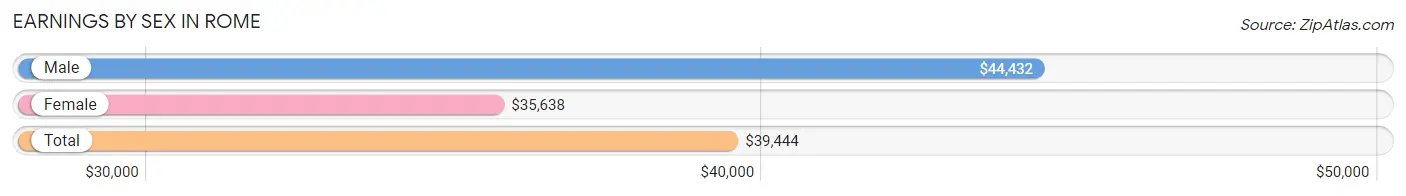
Earnings by Sex in Rome
Average Earnings in Rome are $39,444, $44,432 for men and $35,638 for women, a difference of 19.8%.
| Sex | Number | Average Earnings |
| Male | 8,043 (53.7%) | $44,432 |
| Female | 6,925 (46.3%) | $35,638 |
| Total | 14,968 (100.0%) | $39,444 |
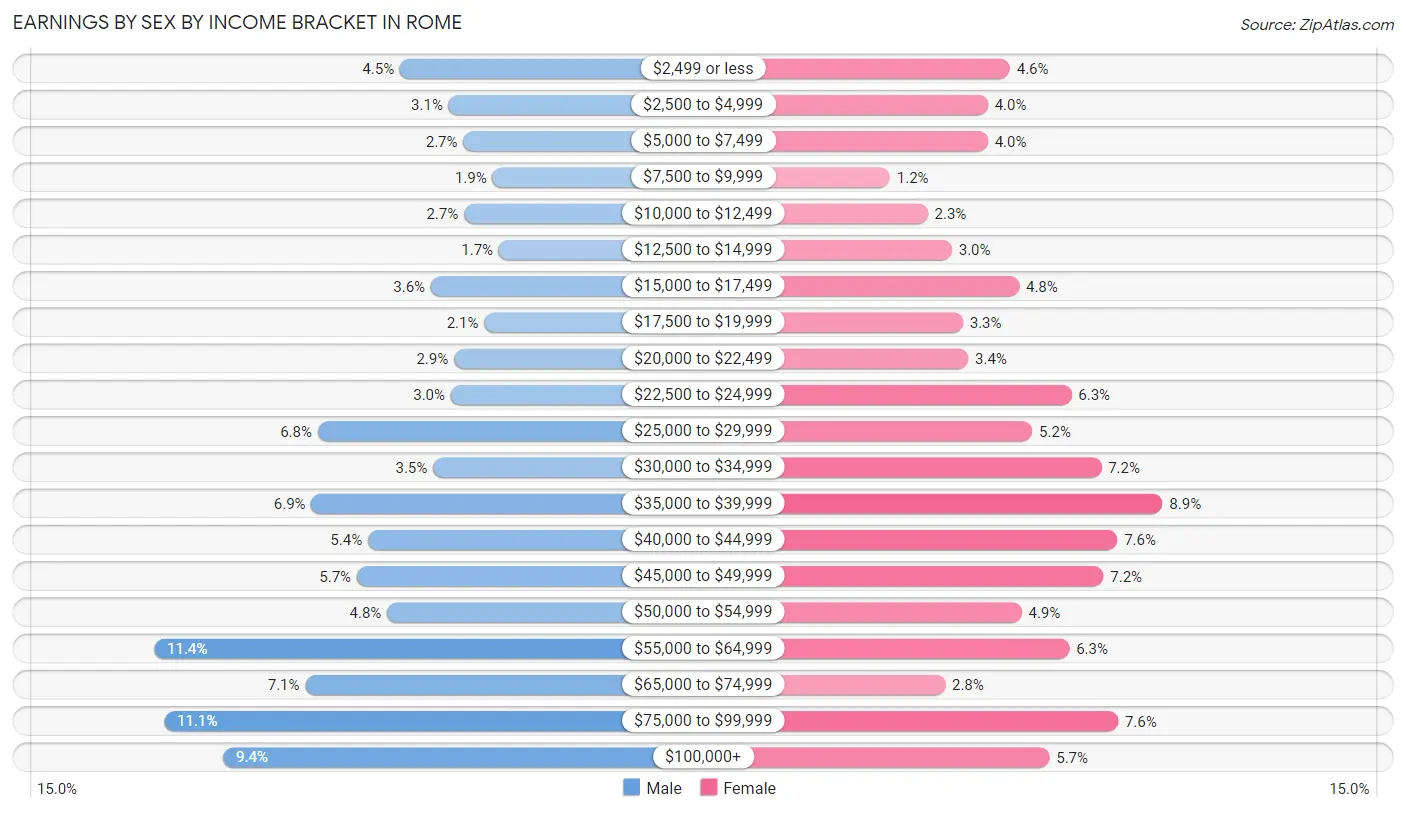
Earnings by Sex by Income Bracket in Rome
The most common earnings brackets in Rome are $55,000 to $64,999 for men (914 | 11.4%) and $35,000 to $39,999 for women (614 | 8.9%).
| Income | Male | Female |
| $2,499 or less | 358 (4.4%) | 317 (4.6%) |
| $2,500 to $4,999 | 248 (3.1%) | 274 (4.0%) |
| $5,000 to $7,499 | 215 (2.7%) | 274 (4.0%) |
| $7,500 to $9,999 | 149 (1.8%) | 84 (1.2%) |
| $10,000 to $12,499 | 213 (2.6%) | 157 (2.3%) |
| $12,500 to $14,999 | 134 (1.7%) | 204 (2.9%) |
| $15,000 to $17,499 | 288 (3.6%) | 335 (4.8%) |
| $17,500 to $19,999 | 167 (2.1%) | 226 (3.3%) |
| $20,000 to $22,499 | 236 (2.9%) | 236 (3.4%) |
| $22,500 to $24,999 | 243 (3.0%) | 437 (6.3%) |
| $25,000 to $29,999 | 544 (6.8%) | 361 (5.2%) |
| $30,000 to $34,999 | 283 (3.5%) | 495 (7.1%) |
| $35,000 to $39,999 | 558 (6.9%) | 614 (8.9%) |
| $40,000 to $44,999 | 430 (5.3%) | 526 (7.6%) |
| $45,000 to $49,999 | 455 (5.7%) | 499 (7.2%) |
| $50,000 to $54,999 | 387 (4.8%) | 340 (4.9%) |
| $55,000 to $64,999 | 914 (11.4%) | 433 (6.2%) |
| $65,000 to $74,999 | 572 (7.1%) | 191 (2.8%) |
| $75,000 to $99,999 | 891 (11.1%) | 528 (7.6%) |
| $100,000+ | 758 (9.4%) | 394 (5.7%) |
| Total | 8,043 (100.0%) | 6,925 (100.0%) |
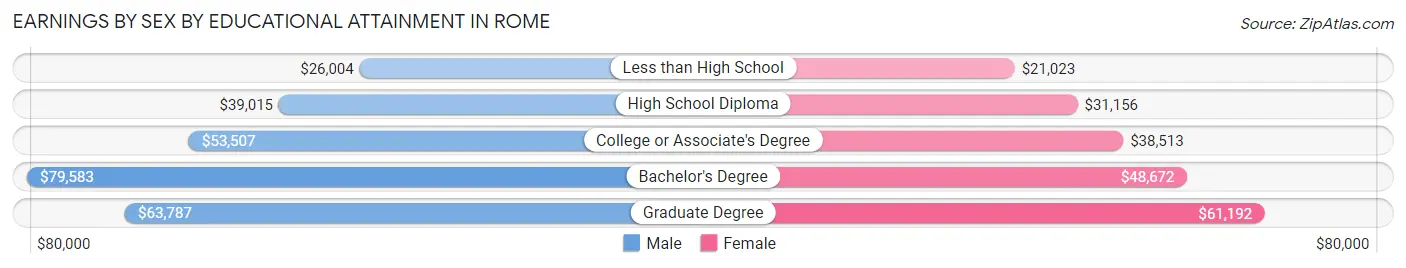
Earnings by Sex by Educational Attainment in Rome
Average earnings in Rome are $49,266 for men and $38,968 for women, a difference of 20.9%. Men with an educational attainment of bachelor's degree enjoy the highest average annual earnings of $79,583, while those with less than high school education earn the least with $26,004. Women with an educational attainment of graduate degree earn the most with the average annual earnings of $61,192, while those with less than high school education have the smallest earnings of $21,023.
| Educational Attainment | Male Income | Female Income |
| Less than High School | $26,004 | $21,023 |
| High School Diploma | $39,015 | $31,156 |
| College or Associate's Degree | $53,507 | $38,513 |
| Bachelor's Degree | $79,583 | $48,672 |
| Graduate Degree | $63,787 | $61,192 |
| Total | $49,266 | $38,968 |
Family Income in Rome
Family Income Brackets in Rome
According to the Rome family income data, there are 1,506 families falling into the $50,000 to $74,999 income range, which is the most common income bracket and makes up 19.4% of all families. Conversely, the $10,000 to $14,999 income bracket is the least frequent group with only 155 families (2.0%) belonging to this category.
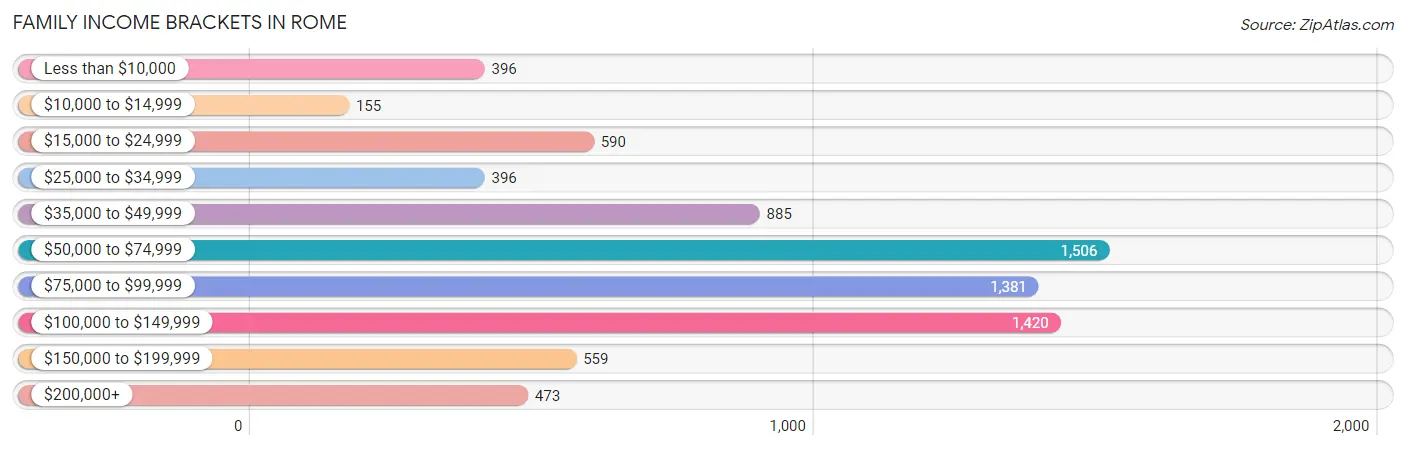
| Income Bracket | # Families | % Families |
| Less than $10,000 | 396 | 5.1% |
| $10,000 to $14,999 | 155 | 2.0% |
| $15,000 to $24,999 | 590 | 7.6% |
| $25,000 to $34,999 | 396 | 5.1% |
| $35,000 to $49,999 | 885 | 11.4% |
| $50,000 to $74,999 | 1,506 | 19.4% |
| $75,000 to $99,999 | 1,381 | 17.8% |
| $100,000 to $149,999 | 1,420 | 18.3% |
| $150,000 to $199,999 | 559 | 7.2% |
| $200,000+ | 473 | 6.1% |
Family Income by Famaliy Size in Rome
4-person families (1,341 | 17.3%) account for the highest median family income in Rome with $103,542 per family, while 2-person families (4,053 | 52.2%) have the highest median income of $32,147 per family member.
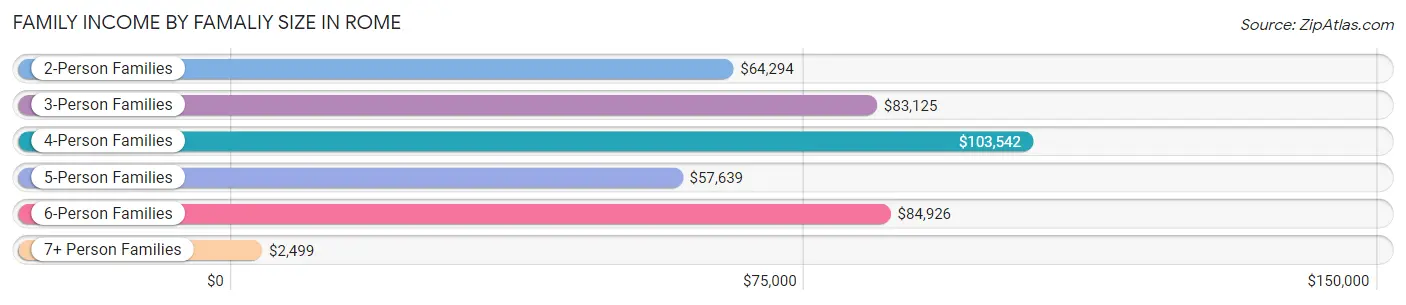
| Income Bracket | # Families | Median Income |
| 2-Person Families | 4,053 (52.2%) | $64,294 |
| 3-Person Families | 1,662 (21.4%) | $83,125 |
| 4-Person Families | 1,341 (17.3%) | $103,542 |
| 5-Person Families | 427 (5.5%) | $57,639 |
| 6-Person Families | 147 (1.9%) | $84,926 |
| 7+ Person Families | 131 (1.7%) | $2,499 |
| Total | 7,761 (100.0%) | $74,084 |
Family Income by Number of Earners in Rome
The median family income in Rome is $74,084, with families comprising 3+ earners (581) having the highest median family income of $115,914, while families with no earners (1,462) have the lowest median family income of $38,529, accounting for 7.5% and 18.8% of families, respectively.
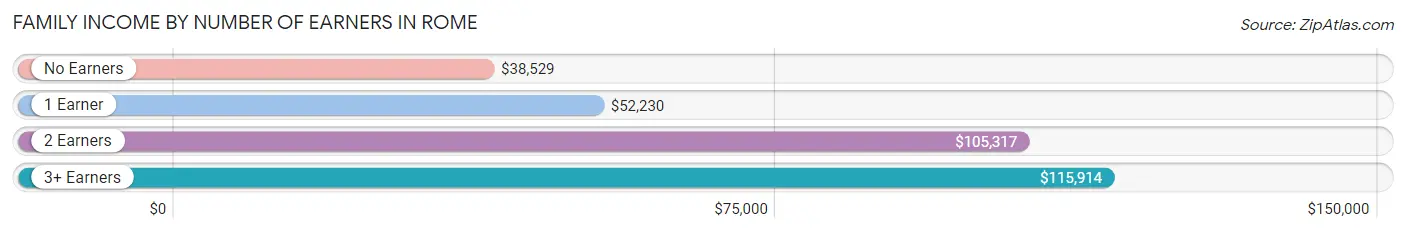
| Number of Earners | # Families | Median Income |
| No Earners | 1,462 (18.8%) | $38,529 |
| 1 Earner | 2,941 (37.9%) | $52,230 |
| 2 Earners | 2,777 (35.8%) | $105,317 |
| 3+ Earners | 581 (7.5%) | $115,914 |
| Total | 7,761 (100.0%) | $74,084 |
Household Income in Rome
Household Income Brackets in Rome
With 2,498 households falling in the category, the $50,000 to $74,999 income range is the most frequent in Rome, accounting for 18.2% of all households. In contrast, only 522 households (3.8%) fall into the $200,000+ income bracket, making it the least populous group.
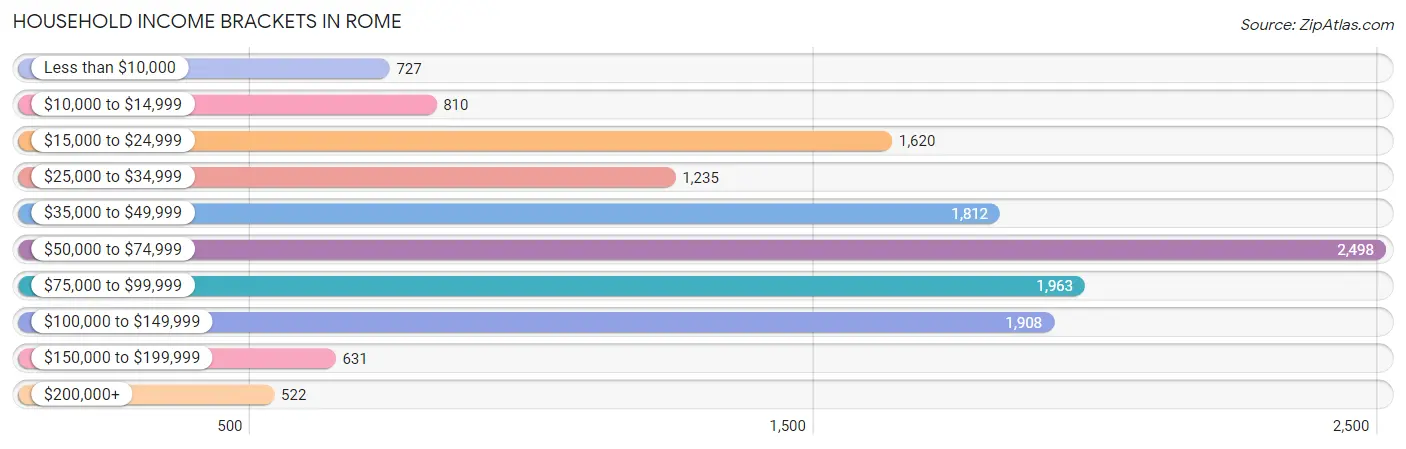
| Income Bracket | # Households | % Households |
| Less than $10,000 | 727 | 5.3% |
| $10,000 to $14,999 | 810 | 5.9% |
| $15,000 to $24,999 | 1,620 | 11.8% |
| $25,000 to $34,999 | 1,235 | 9.0% |
| $35,000 to $49,999 | 1,812 | 13.2% |
| $50,000 to $74,999 | 2,498 | 18.2% |
| $75,000 to $99,999 | 1,963 | 14.3% |
| $100,000 to $149,999 | 1,908 | 13.9% |
| $150,000 to $199,999 | 631 | 4.6% |
| $200,000+ | 522 | 3.8% |
Household Income by Householder Age in Rome
The median household income in Rome is $56,901, with the highest median household income of $68,859 found in the 45 to 64 years age bracket for the primary householder. A total of 4,995 households (36.4%) fall into this category. Meanwhile, the 15 to 24 years age bracket for the primary householder has the lowest median household income of $39,674, with 558 households (4.1%) in this group.
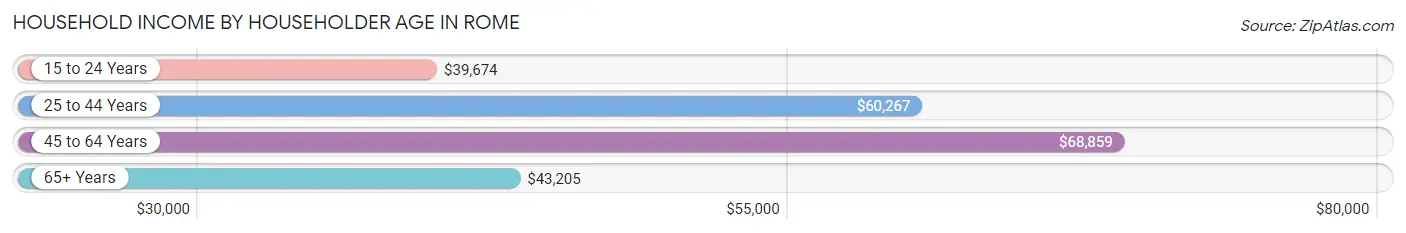
| Income Bracket | # Households | Median Income |
| 15 to 24 Years | 558 (4.1%) | $39,674 |
| 25 to 44 Years | 4,190 (30.5%) | $60,267 |
| 45 to 64 Years | 4,995 (36.4%) | $68,859 |
| 65+ Years | 3,983 (29.0%) | $43,205 |
| Total | 13,726 (100.0%) | $56,901 |
Poverty in Rome
Income Below Poverty by Sex and Age in Rome
With 17.9% poverty level for males and 16.2% for females among the residents of Rome, 15 year old males and 35 to 44 year old females are the most vulnerable to poverty, with 75 males (36.9%) and 657 females (36.2%) in their respective age groups living below the poverty level.
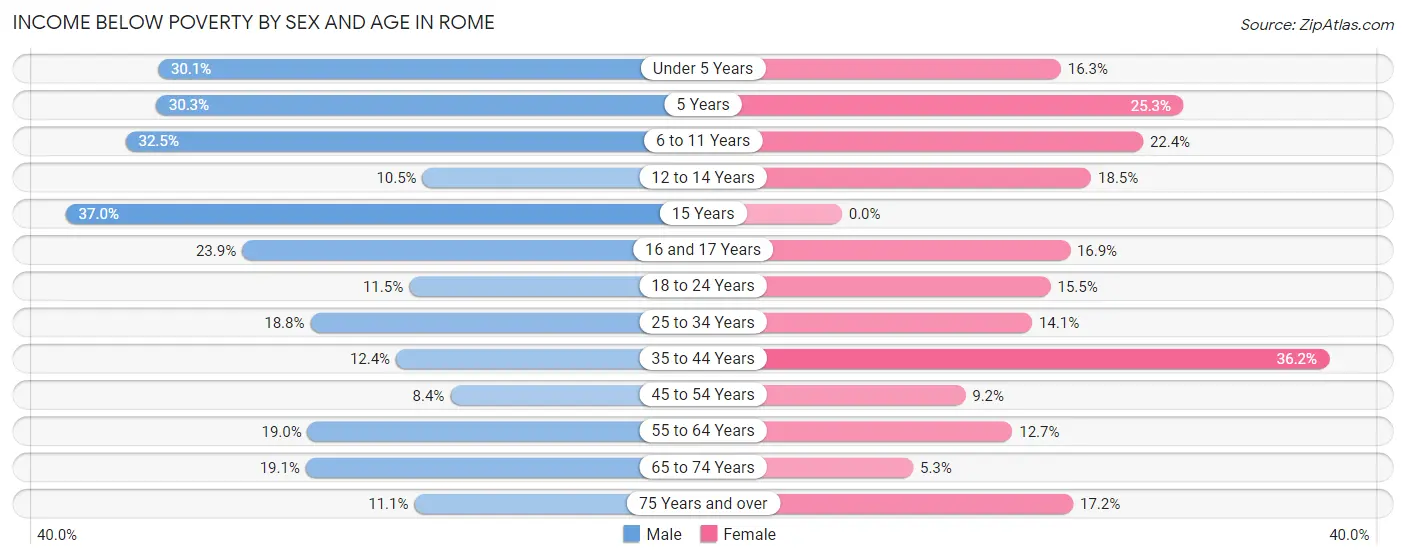
| Age Bracket | Male | Female |
| Under 5 Years | 285 (30.1%) | 147 (16.3%) |
| 5 Years | 85 (30.2%) | 59 (25.3%) |
| 6 to 11 Years | 339 (32.5%) | 229 (22.4%) |
| 12 to 14 Years | 55 (10.5%) | 104 (18.5%) |
| 15 Years | 75 (36.9%) | 0 (0.0%) |
| 16 and 17 Years | 84 (23.9%) | 61 (16.9%) |
| 18 to 24 Years | 141 (11.5%) | 173 (15.5%) |
| 25 to 34 Years | 388 (18.8%) | 312 (14.1%) |
| 35 to 44 Years | 198 (12.4%) | 657 (36.2%) |
| 45 to 54 Years | 128 (8.4%) | 183 (9.2%) |
| 55 to 64 Years | 457 (19.0%) | 259 (12.7%) |
| 65 to 74 Years | 274 (19.1%) | 87 (5.3%) |
| 75 Years and over | 127 (11.1%) | 257 (17.2%) |
| Total | 2,636 (17.9%) | 2,528 (16.2%) |
Income Above Poverty by Sex and Age in Rome
According to the poverty statistics in Rome, males aged 45 to 54 years and females aged 15 years are the age groups that are most secure financially, with 91.6% of males and 100.0% of females in these age groups living above the poverty line.
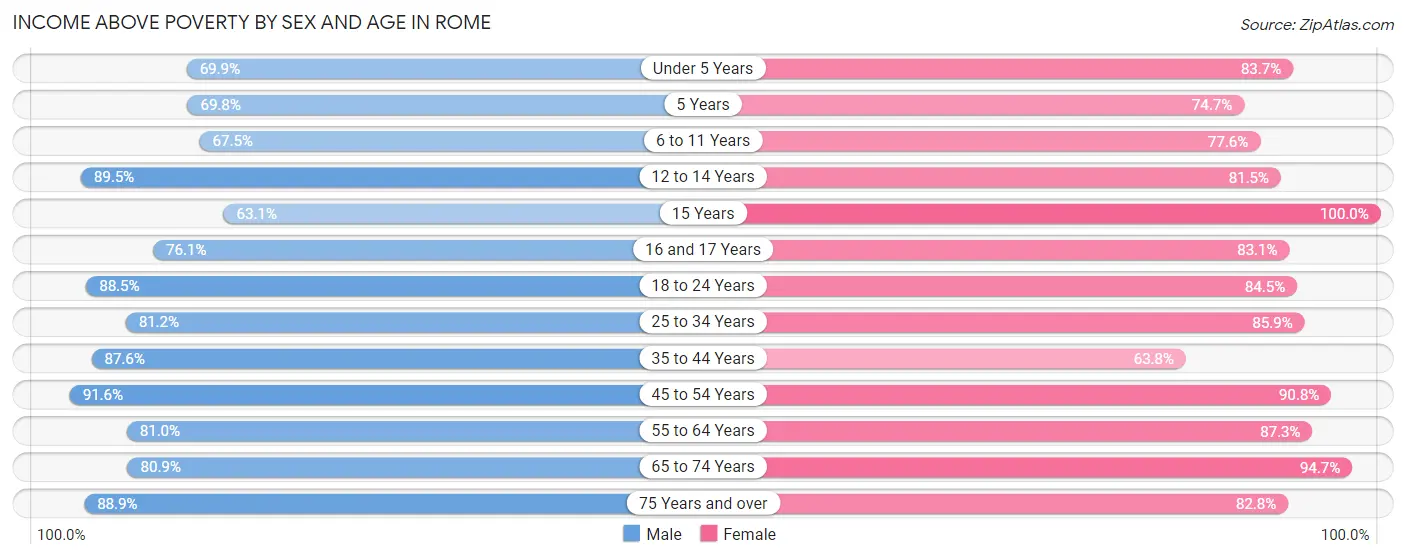
| Age Bracket | Male | Female |
| Under 5 Years | 662 (69.9%) | 757 (83.7%) |
| 5 Years | 196 (69.8%) | 174 (74.7%) |
| 6 to 11 Years | 704 (67.5%) | 795 (77.6%) |
| 12 to 14 Years | 471 (89.5%) | 458 (81.5%) |
| 15 Years | 128 (63.0%) | 199 (100.0%) |
| 16 and 17 Years | 268 (76.1%) | 299 (83.1%) |
| 18 to 24 Years | 1,089 (88.5%) | 943 (84.5%) |
| 25 to 34 Years | 1,677 (81.2%) | 1,897 (85.9%) |
| 35 to 44 Years | 1,395 (87.6%) | 1,160 (63.8%) |
| 45 to 54 Years | 1,395 (91.6%) | 1,813 (90.8%) |
| 55 to 64 Years | 1,949 (81.0%) | 1,787 (87.3%) |
| 65 to 74 Years | 1,158 (80.9%) | 1,558 (94.7%) |
| 75 Years and over | 1,020 (88.9%) | 1,240 (82.8%) |
| Total | 12,112 (82.1%) | 13,080 (83.8%) |
Income Below Poverty Among Married-Couple Families in Rome
The poverty statistics for married-couple families in Rome show that 4.1% or 202 of the total 4,880 families live below the poverty line. Families with 3 or 4 children have the highest poverty rate of 27.3%, comprising of 75 families. On the other hand, families with 5 or more children have the lowest poverty rate of 0.0%, which includes 0 families.
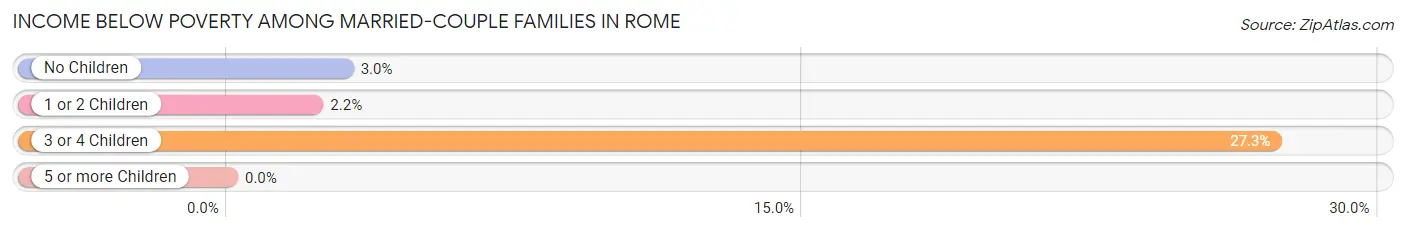
| Children | Above Poverty | Below Poverty |
| No Children | 3,050 (97.0%) | 95 (3.0%) |
| 1 or 2 Children | 1,402 (97.8%) | 32 (2.2%) |
| 3 or 4 Children | 200 (72.7%) | 75 (27.3%) |
| 5 or more Children | 26 (100.0%) | 0 (0.0%) |
| Total | 4,678 (95.9%) | 202 (4.1%) |
Income Below Poverty Among Single-Parent Households in Rome
According to the poverty data in Rome, 28.1% or 260 single-father households and 21.5% or 421 single-mother households are living below the poverty line. Among single-father households, those with 3 or 4 children have the highest poverty rate, with 14 households (66.7%) experiencing poverty. Likewise, among single-mother households, those with 5 or more children have the highest poverty rate, with 90 households (100.0%) falling below the poverty line.
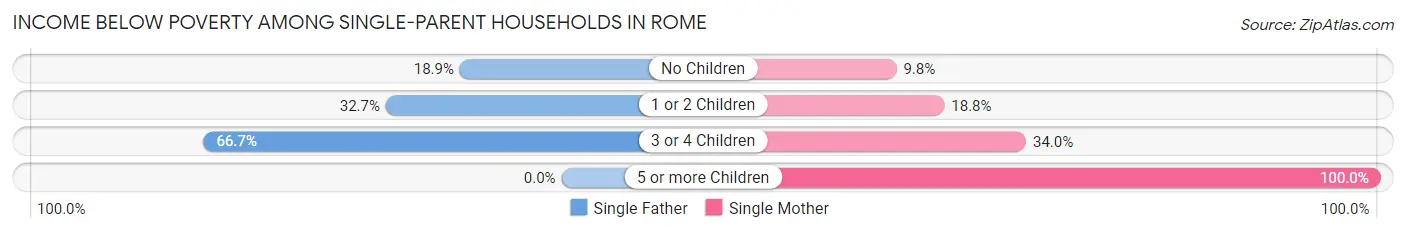
| Children | Single Father | Single Mother |
| No Children | 68 (18.9%) | 65 (9.8%) |
| 1 or 2 Children | 178 (32.7%) | 177 (18.8%) |
| 3 or 4 Children | 14 (66.7%) | 89 (34.0%) |
| 5 or more Children | 0 (0.0%) | 90 (100.0%) |
| Total | 260 (28.1%) | 421 (21.5%) |
Income Below Poverty Among Married-Couple vs Single-Parent Households in Rome
The poverty data for Rome shows that 202 of the married-couple family households (4.1%) and 681 of the single-parent households (23.6%) are living below the poverty level. Within the married-couple family households, those with 3 or 4 children have the highest poverty rate, with 75 households (27.3%) falling below the poverty line. Among the single-parent households, those with 5 or more children have the highest poverty rate, with 90 household (100.0%) living below poverty.
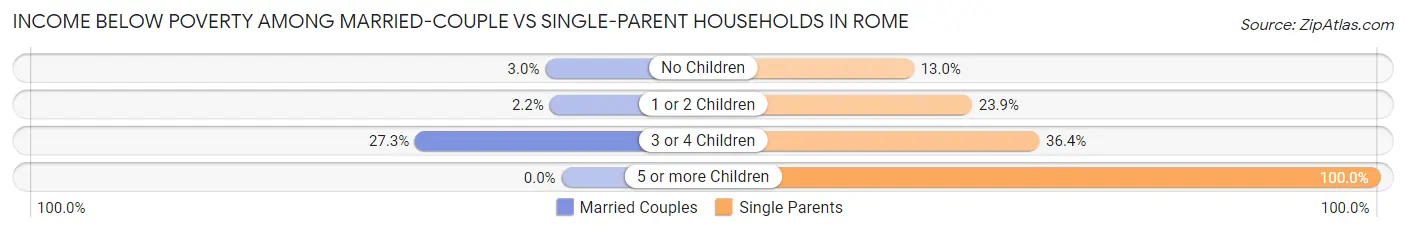
| Children | Married-Couple Families | Single-Parent Households |
| No Children | 95 (3.0%) | 133 (13.0%) |
| 1 or 2 Children | 32 (2.2%) | 355 (23.9%) |
| 3 or 4 Children | 75 (27.3%) | 103 (36.4%) |
| 5 or more Children | 0 (0.0%) | 90 (100.0%) |
| Total | 202 (4.1%) | 681 (23.6%) |
Race in Rome
The most populous races in Rome are White / Caucasian (27,593 | 86.1%), Hispanic or Latino (1,952 | 6.1%), and Two or more Races (1,817 | 5.7%).
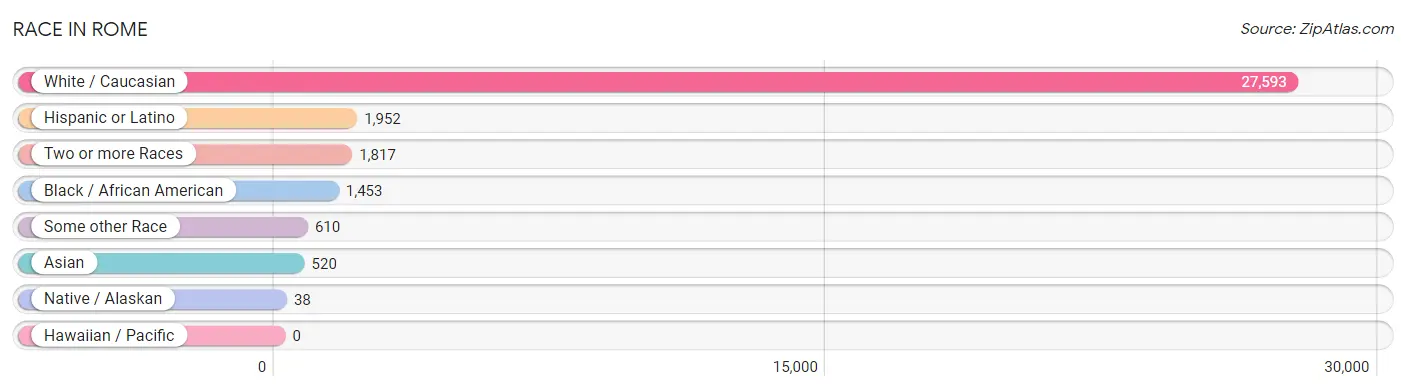
| Race | # Population | % Population |
| Asian | 520 | 1.6% |
| Black / African American | 1,453 | 4.5% |
| Hawaiian / Pacific | 0 | 0.0% |
| Hispanic or Latino | 1,952 | 6.1% |
| Native / Alaskan | 38 | 0.1% |
| White / Caucasian | 27,593 | 86.1% |
| Two or more Races | 1,817 | 5.7% |
| Some other Race | 610 | 1.9% |
| Total | 32,031 | 100.0% |
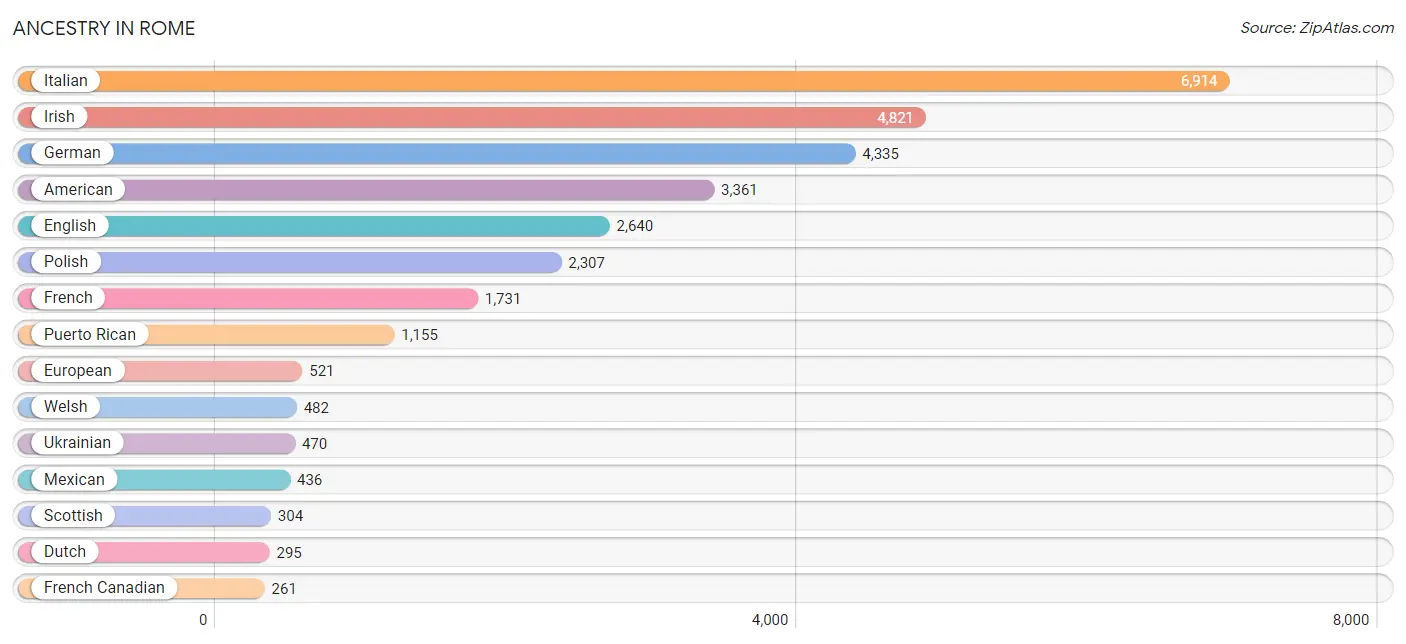
Ancestry in Rome
The most populous ancestries reported in Rome are Italian (6,914 | 21.6%), Irish (4,821 | 15.0%), German (4,335 | 13.5%), American (3,361 | 10.5%), and English (2,640 | 8.2%), together accounting for 68.9% of all Rome residents.
| Ancestry | # Population | % Population |
| African | 89 | 0.3% |
| Alsatian | 5 | 0.0% |
| American | 3,361 | 10.5% |
| Arab | 180 | 0.6% |
| Argentinean | 24 | 0.1% |
| Austrian | 44 | 0.1% |
| Bhutanese | 67 | 0.2% |
| British | 29 | 0.1% |
| Burmese | 66 | 0.2% |
| Canadian | 131 | 0.4% |
| Celtic | 62 | 0.2% |
| Central American | 53 | 0.2% |
| Central American Indian | 14 | 0.0% |
| Cherokee | 90 | 0.3% |
| Costa Rican | 9 | 0.0% |
| Cuban | 9 | 0.0% |
| Czech | 42 | 0.1% |
| Danish | 57 | 0.2% |
| Dominican | 59 | 0.2% |
| Dutch | 295 | 0.9% |
| Eastern European | 7 | 0.0% |
| English | 2,640 | 8.2% |
| European | 521 | 1.6% |
| Finnish | 17 | 0.1% |
| French | 1,731 | 5.4% |
| French Canadian | 261 | 0.8% |
| German | 4,335 | 13.5% |
| Ghanaian | 4 | 0.0% |
| Greek | 63 | 0.2% |
| Guamanian / Chamorro | 50 | 0.2% |
| Guatemalan | 29 | 0.1% |
| Honduran | 15 | 0.1% |
| Hungarian | 24 | 0.1% |
| Indian (Asian) | 257 | 0.8% |
| Irish | 4,821 | 15.0% |
| Iroquois | 13 | 0.0% |
| Italian | 6,914 | 21.6% |
| Jamaican | 41 | 0.1% |
| Jordanian | 6 | 0.0% |
| Korean | 202 | 0.6% |
| Laotian | 7 | 0.0% |
| Latvian | 3 | 0.0% |
| Lebanese | 136 | 0.4% |
| Lithuanian | 9 | 0.0% |
| Luxembourger | 10 | 0.0% |
| Mexican | 436 | 1.4% |
| Moroccan | 28 | 0.1% |
| Native Hawaiian | 34 | 0.1% |
| Nigerian | 11 | 0.0% |
| Northern European | 36 | 0.1% |
| Norwegian | 6 | 0.0% |
| Okinawan | 25 | 0.1% |
| Pakistani | 12 | 0.0% |
| Polish | 2,307 | 7.2% |
| Portuguese | 5 | 0.0% |
| Puerto Rican | 1,155 | 3.6% |
| Romanian | 10 | 0.0% |
| Russian | 88 | 0.3% |
| Scandinavian | 32 | 0.1% |
| Scotch-Irish | 78 | 0.2% |
| Scottish | 304 | 0.9% |
| Serbian | 3 | 0.0% |
| Sioux | 9 | 0.0% |
| Slavic | 22 | 0.1% |
| Slovak | 70 | 0.2% |
| Slovene | 20 | 0.1% |
| Somali | 6 | 0.0% |
| South American | 24 | 0.1% |
| Spaniard | 25 | 0.1% |
| Spanish | 89 | 0.3% |
| Subsaharan African | 110 | 0.3% |
| Swedish | 131 | 0.4% |
| Swiss | 140 | 0.4% |
| Syrian | 6 | 0.0% |
| Thai | 53 | 0.2% |
| Trinidadian and Tobagonian | 12 | 0.0% |
| Turkish | 6 | 0.0% |
| Ukrainian | 470 | 1.5% |
| Vietnamese | 6 | 0.0% |
| Welsh | 482 | 1.5% | View All 80 Rows |
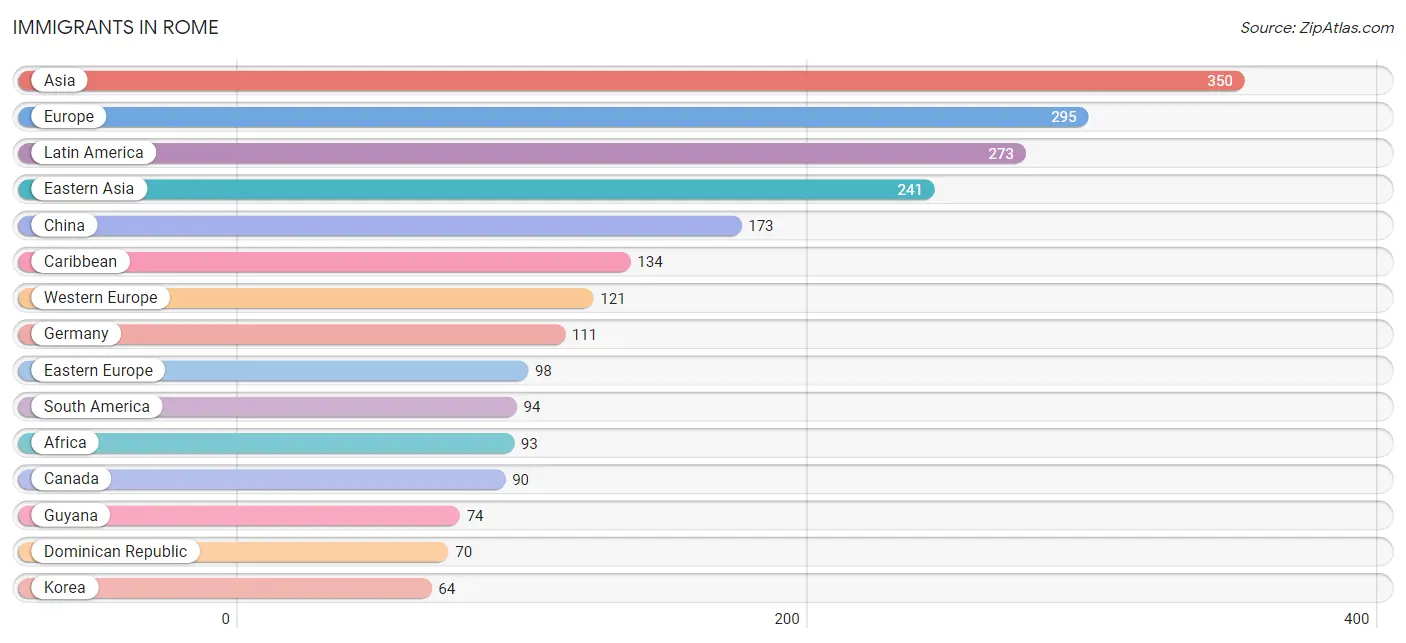
Immigrants in Rome
The most numerous immigrant groups reported in Rome came from Asia (350 | 1.1%), Europe (295 | 0.9%), Latin America (273 | 0.9%), Eastern Asia (241 | 0.7%), and China (173 | 0.5%), together accounting for 4.2% of all Rome residents.
| Immigration Origin | # Population | % Population |
| Africa | 93 | 0.3% |
| Argentina | 10 | 0.0% |
| Asia | 350 | 1.1% |
| Bangladesh | 6 | 0.0% |
| Canada | 90 | 0.3% |
| Caribbean | 134 | 0.4% |
| Central America | 45 | 0.1% |
| China | 173 | 0.5% |
| Costa Rica | 9 | 0.0% |
| Cuba | 17 | 0.1% |
| Dominican Republic | 70 | 0.2% |
| Eastern Africa | 11 | 0.0% |
| Eastern Asia | 241 | 0.7% |
| Eastern Europe | 98 | 0.3% |
| Ecuador | 10 | 0.0% |
| England | 17 | 0.1% |
| Europe | 295 | 0.9% |
| Germany | 111 | 0.4% |
| Ghana | 43 | 0.1% |
| Guatemala | 29 | 0.1% |
| Guyana | 74 | 0.2% |
| Hong Kong | 58 | 0.2% |
| India | 17 | 0.1% |
| Indonesia | 1 | 0.0% |
| Ireland | 29 | 0.1% |
| Italy | 12 | 0.0% |
| Jamaica | 35 | 0.1% |
| Japan | 4 | 0.0% |
| Jordan | 17 | 0.1% |
| Kenya | 5 | 0.0% |
| Korea | 64 | 0.2% |
| Latin America | 273 | 0.9% |
| Lebanon | 13 | 0.0% |
| Mexico | 7 | 0.0% |
| Morocco | 28 | 0.1% |
| Nigeria | 11 | 0.0% |
| Northern Africa | 28 | 0.1% |
| Northern Europe | 53 | 0.2% |
| Philippines | 32 | 0.1% |
| Poland | 43 | 0.1% |
| Romania | 9 | 0.0% |
| Russia | 36 | 0.1% |
| Singapore | 5 | 0.0% |
| Somalia | 6 | 0.0% |
| South America | 94 | 0.3% |
| South Central Asia | 23 | 0.1% |
| South Eastern Asia | 50 | 0.2% |
| Southern Europe | 23 | 0.1% |
| Spain | 11 | 0.0% |
| Thailand | 12 | 0.0% |
| Trinidad and Tobago | 12 | 0.0% |
| Turkey | 6 | 0.0% |
| Ukraine | 10 | 0.0% |
| Western Africa | 54 | 0.2% |
| Western Asia | 36 | 0.1% |
| Western Europe | 121 | 0.4% | View All 56 Rows |
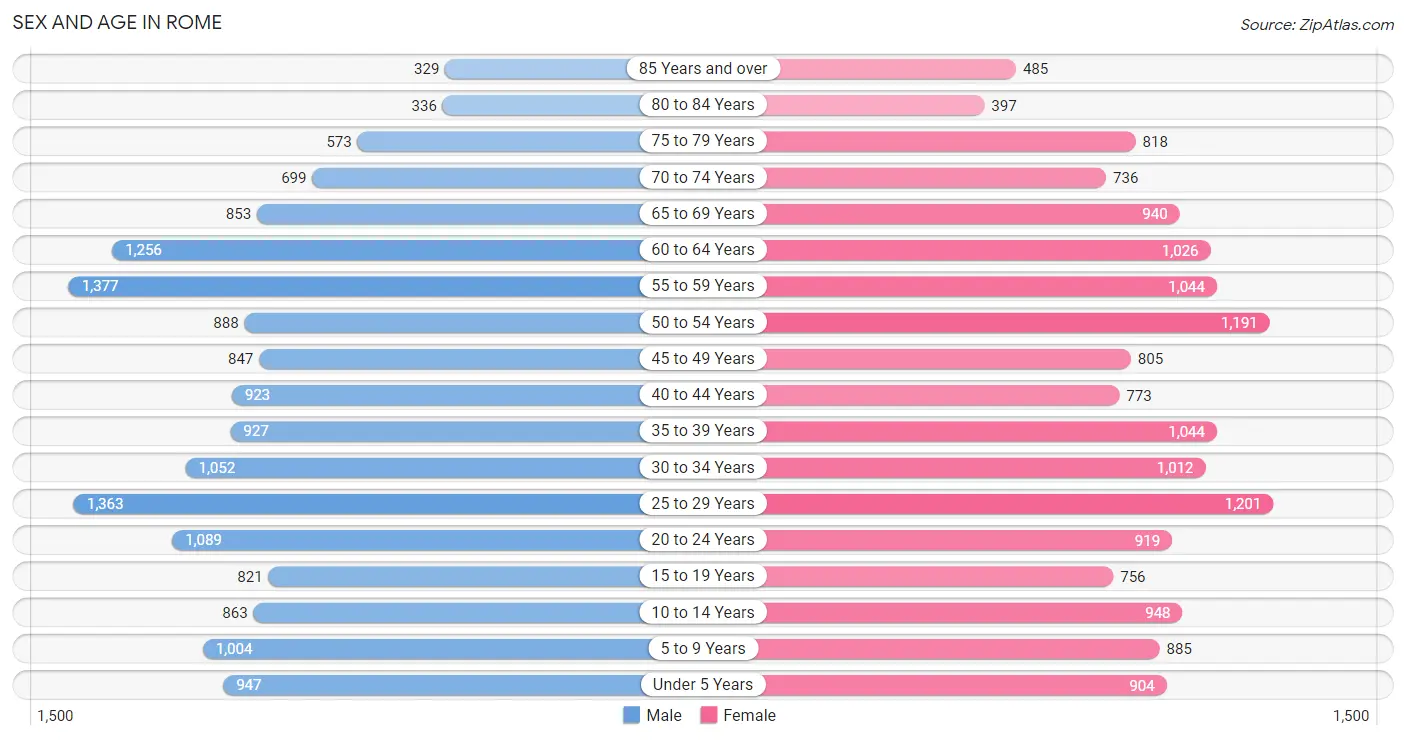
Sex and Age in Rome
Sex and Age in Rome
The most populous age groups in Rome are 55 to 59 Years (1,377 | 8.5%) for men and 25 to 29 Years (1,201 | 7.6%) for women.
| Age Bracket | Male | Female |
| Under 5 Years | 947 (5.9%) | 904 (5.7%) |
| 5 to 9 Years | 1,004 (6.2%) | 885 (5.6%) |
| 10 to 14 Years | 863 (5.3%) | 948 (6.0%) |
| 15 to 19 Years | 821 (5.1%) | 756 (4.8%) |
| 20 to 24 Years | 1,089 (6.7%) | 919 (5.8%) |
| 25 to 29 Years | 1,363 (8.4%) | 1,201 (7.6%) |
| 30 to 34 Years | 1,052 (6.5%) | 1,012 (6.4%) |
| 35 to 39 Years | 927 (5.7%) | 1,044 (6.6%) |
| 40 to 44 Years | 923 (5.7%) | 773 (4.9%) |
| 45 to 49 Years | 847 (5.2%) | 805 (5.1%) |
| 50 to 54 Years | 888 (5.5%) | 1,191 (7.5%) |
| 55 to 59 Years | 1,377 (8.5%) | 1,044 (6.6%) |
| 60 to 64 Years | 1,256 (7.8%) | 1,026 (6.5%) |
| 65 to 69 Years | 853 (5.3%) | 940 (5.9%) |
| 70 to 74 Years | 699 (4.3%) | 736 (4.6%) |
| 75 to 79 Years | 573 (3.5%) | 818 (5.1%) |
| 80 to 84 Years | 336 (2.1%) | 397 (2.5%) |
| 85 Years and over | 329 (2.0%) | 485 (3.0%) |
| Total | 16,147 (100.0%) | 15,884 (100.0%) |
Families and Households in Rome
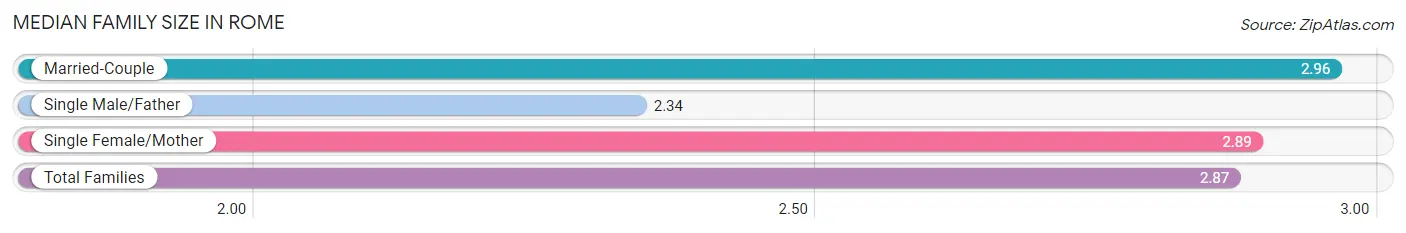
Median Family Size in Rome
The median family size in Rome is 2.87 persons per family, with married-couple families (4,880 | 62.9%) accounting for the largest median family size of 2.96 persons per family. On the other hand, single male/father families (924 | 11.9%) represent the smallest median family size with 2.34 persons per family.
| Family Type | # Families | Family Size |
| Married-Couple | 4,880 (62.9%) | 2.96 |
| Single Male/Father | 924 (11.9%) | 2.34 |
| Single Female/Mother | 1,957 (25.2%) | 2.89 |
| Total Families | 7,761 (100.0%) | 2.87 |
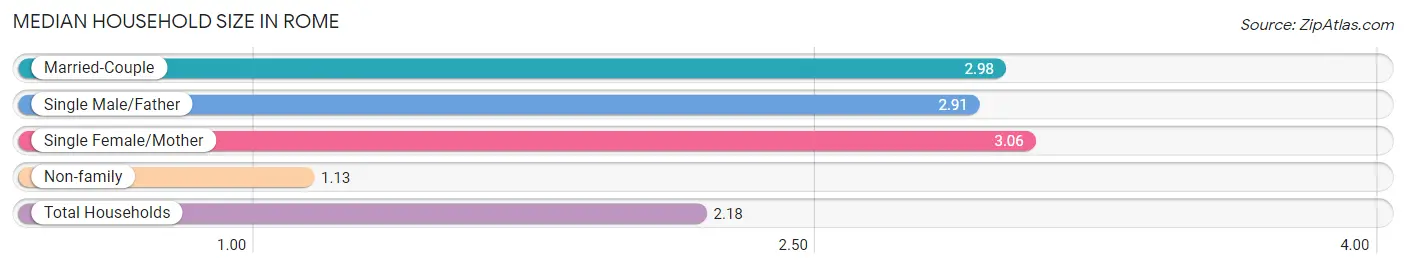
Median Household Size in Rome
The median household size in Rome is 2.18 persons per household, with single female/mother households (1,957 | 14.3%) accounting for the largest median household size of 3.06 persons per household. non-family households (5,965 | 43.5%) represent the smallest median household size with 1.13 persons per household.
| Household Type | # Households | Household Size |
| Married-Couple | 4,880 (35.5%) | 2.98 |
| Single Male/Father | 924 (6.7%) | 2.91 |
| Single Female/Mother | 1,957 (14.3%) | 3.06 |
| Non-family | 5,965 (43.5%) | 1.13 |
| Total Households | 13,726 (100.0%) | 2.18 |
Household Size by Marriage Status in Rome
Out of a total of 13,726 households in Rome, 7,761 (56.5%) are family households, while 5,965 (43.5%) are nonfamily households. The most numerous type of family households are 2-person households, comprising 3,748, and the most common type of nonfamily households are 1-person households, comprising 5,288.
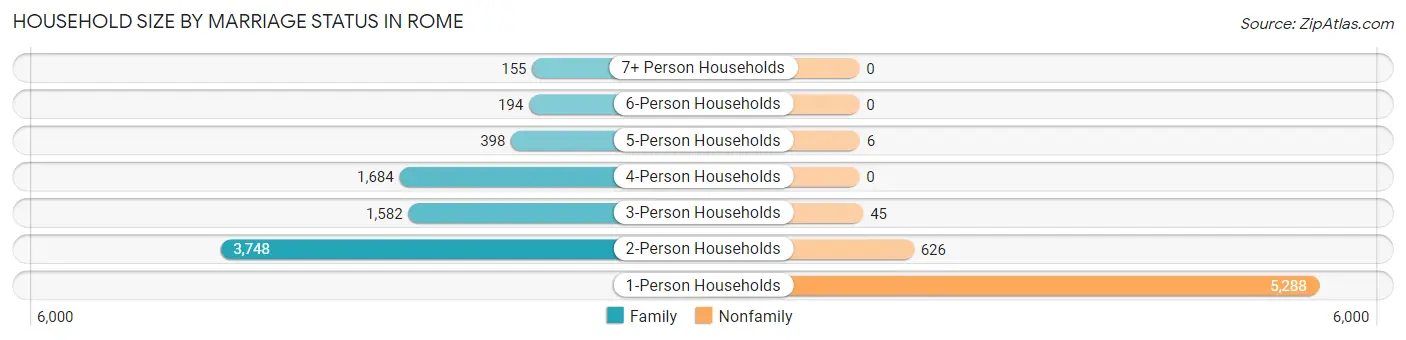
| Household Size | Family Households | Nonfamily Households |
| 1-Person Households | - | 5,288 (38.5%) |
| 2-Person Households | 3,748 (27.3%) | 626 (4.6%) |
| 3-Person Households | 1,582 (11.5%) | 45 (0.3%) |
| 4-Person Households | 1,684 (12.3%) | 0 (0.0%) |
| 5-Person Households | 398 (2.9%) | 6 (0.0%) |
| 6-Person Households | 194 (1.4%) | 0 (0.0%) |
| 7+ Person Households | 155 (1.1%) | 0 (0.0%) |
| Total | 7,761 (56.5%) | 5,965 (43.5%) |
Female Fertility in Rome
Fertility by Age in Rome
Average fertility rate in Rome is 100.0 births per 1,000 women. Women in the age bracket of 20 to 34 years have the highest fertility rate with 179.0 births per 1,000 women. Women in the age bracket of 20 to 34 years acount for 81.8% of all women with births.
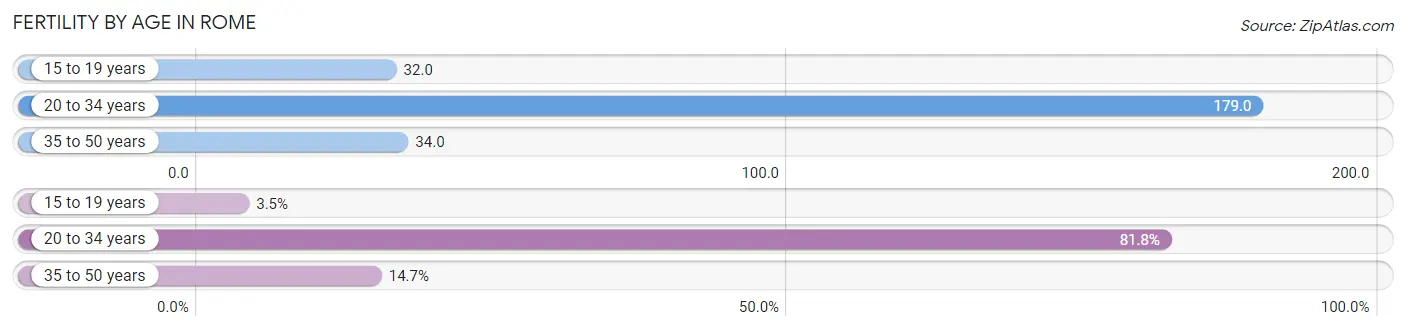
| Age Bracket | Women with Births | Births / 1,000 Women |
| 15 to 19 years | 24 (3.5%) | 32.0 |
| 20 to 34 years | 560 (81.8%) | 179.0 |
| 35 to 50 years | 101 (14.7%) | 34.0 |
| Total | 685 (100.0%) | 100.0 |
Fertility by Age by Marriage Status in Rome
72.3% of women with births (685) in Rome are married. The highest percentage of unmarried women with births falls into 15 to 19 years age bracket with 100.0% of them unmarried at the time of birth, while the lowest percentage of unmarried women with births belong to 35 to 50 years age bracket with 0.0% of them unmarried.
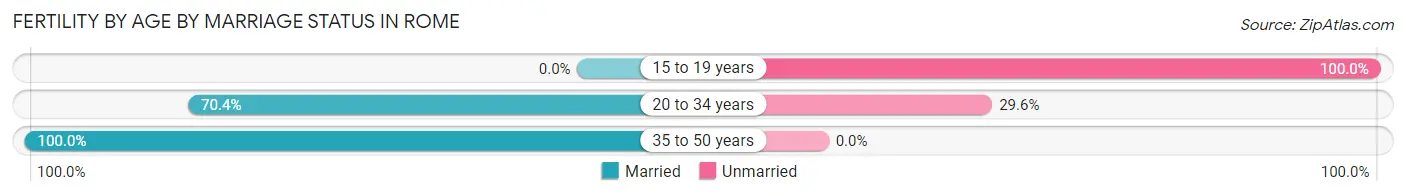
| Age Bracket | Married | Unmarried |
| 15 to 19 years | 0 (0.0%) | 24 (100.0%) |
| 20 to 34 years | 394 (70.4%) | 166 (29.6%) |
| 35 to 50 years | 101 (100.0%) | 0 (0.0%) |
| Total | 495 (72.3%) | 190 (27.7%) |
Fertility by Education in Rome
Average fertility rate in Rome is 100.0 births per 1,000 women. Women with the education attainment of college or associate's degree have the highest fertility rate of 126.0 births per 1,000 women, while women with the education attainment of bachelor's degree have the lowest fertility at 64.0 births per 1,000 women. Women with the education attainment of college or associate's degree represent 46.0% of all women with births.
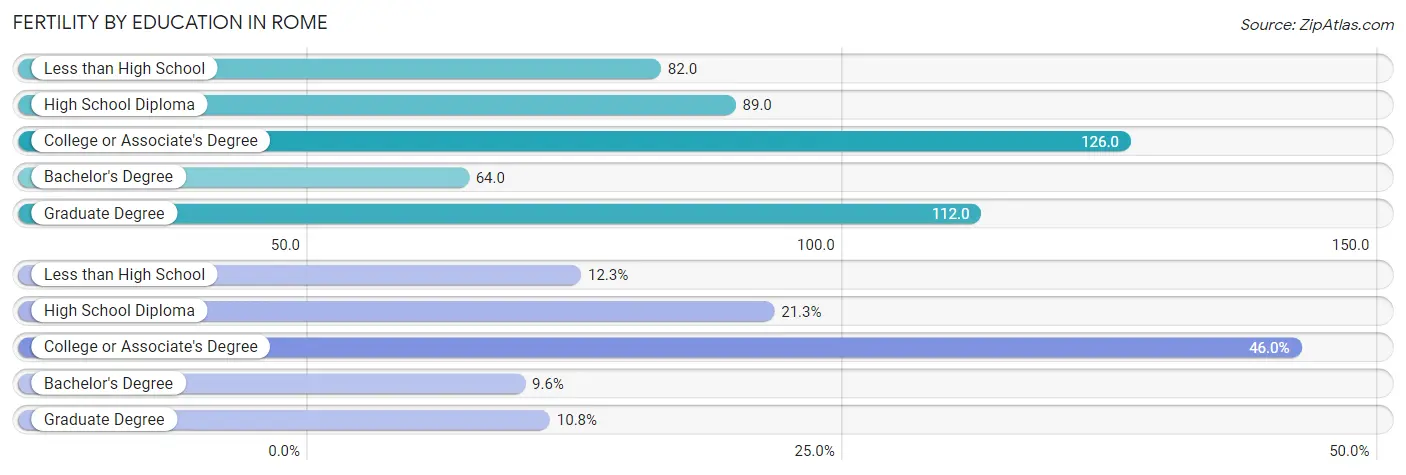
| Educational Attainment | Women with Births | Births / 1,000 Women |
| Less than High School | 84 (12.3%) | 82.0 |
| High School Diploma | 146 (21.3%) | 89.0 |
| College or Associate's Degree | 315 (46.0%) | 126.0 |
| Bachelor's Degree | 66 (9.6%) | 64.0 |
| Graduate Degree | 74 (10.8%) | 112.0 |
| Total | 685 (100.0%) | 100.0 |
Fertility by Education by Marriage Status in Rome
27.7% of women with births in Rome are unmarried. Women with the educational attainment of bachelor's degree are most likely to be married with 100.0% of them married at childbirth, while women with the educational attainment of high school diploma are least likely to be married with 70.6% of them unmarried at childbirth.
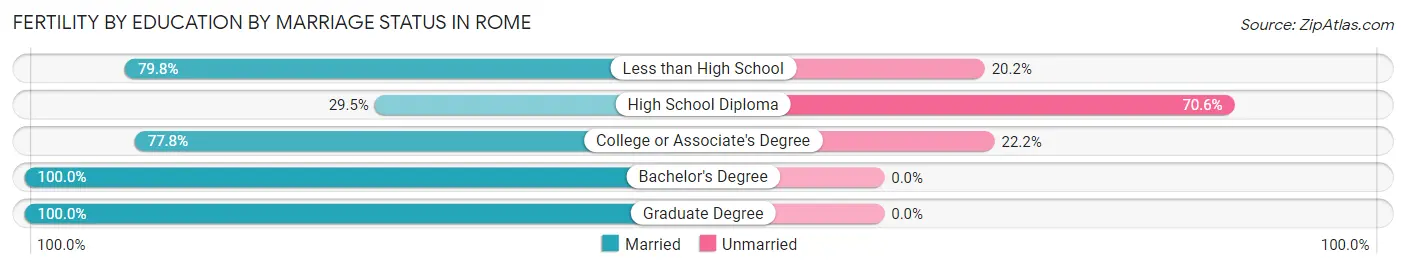
| Educational Attainment | Married | Unmarried |
| Less than High School | 67 (79.8%) | 17 (20.2%) |
| High School Diploma | 43 (29.4%) | 103 (70.6%) |
| College or Associate's Degree | 245 (77.8%) | 70 (22.2%) |
| Bachelor's Degree | 66 (100.0%) | 0 (0.0%) |
| Graduate Degree | 74 (100.0%) | 0 (0.0%) |
| Total | 495 (72.3%) | 190 (27.7%) |
Employment Characteristics in Rome
Employment by Class of Employer in Rome
Among the 12,697 employed individuals in Rome, private company employees (7,262 | 57.2%), local government employees (1,366 | 10.8%), and not-for-profit organizations (1,311 | 10.3%) make up the most common classes of employment.
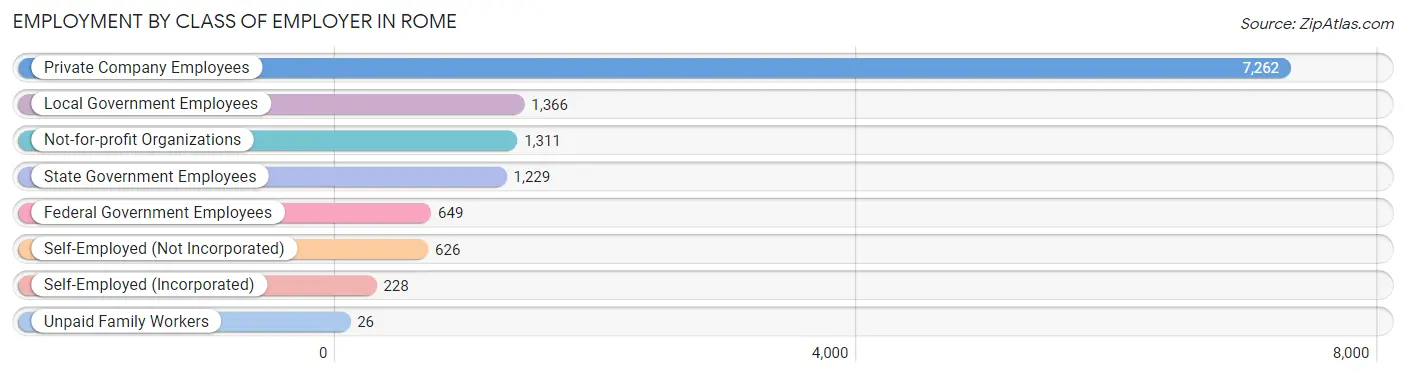
| Employer Class | # Employees | % Employees |
| Private Company Employees | 7,262 | 57.2% |
| Self-Employed (Incorporated) | 228 | 1.8% |
| Self-Employed (Not Incorporated) | 626 | 4.9% |
| Not-for-profit Organizations | 1,311 | 10.3% |
| Local Government Employees | 1,366 | 10.8% |
| State Government Employees | 1,229 | 9.7% |
| Federal Government Employees | 649 | 5.1% |
| Unpaid Family Workers | 26 | 0.2% |
| Total | 12,697 | 100.0% |
Employment Status by Age in Rome
According to the labor force statistics for Rome, out of the total population over 16 years of age (26,078), 53.1% or 13,847 individuals are in the labor force, with 5.0% or 692 of them unemployed. The age group with the highest labor force participation rate is 30 to 34 years, with 80.3% or 1,657 individuals in the labor force. Within the labor force, the 16 to 19 years age range has the highest percentage of unemployed individuals, with 35.8% or 124 of them being unemployed.
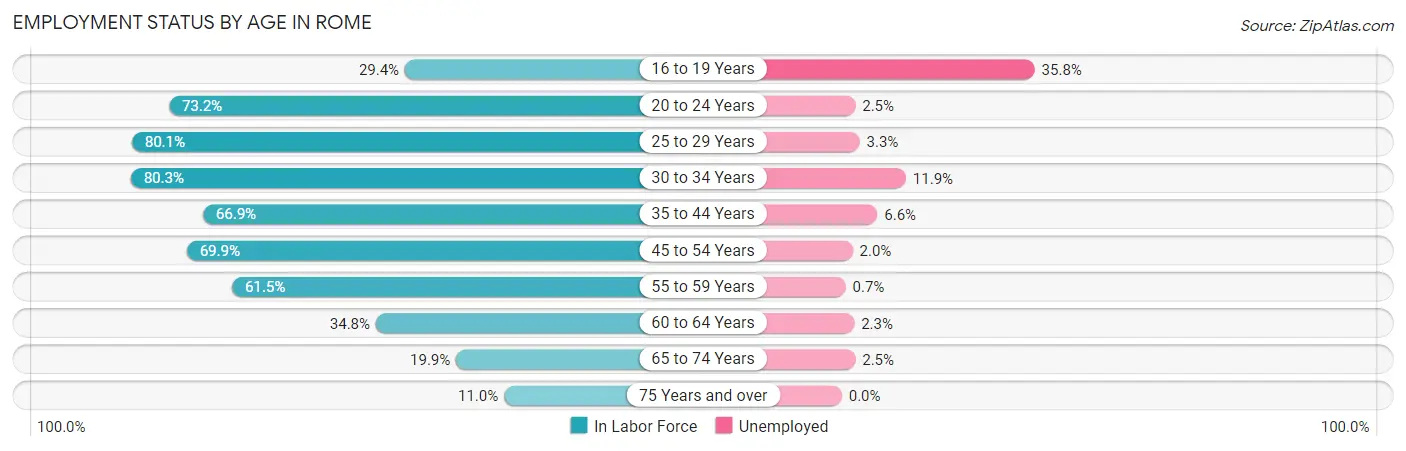
| Age Bracket | In Labor Force | Unemployed |
| 16 to 19 Years | 345 (29.4%) | 124 (35.8%) |
| 20 to 24 Years | 1,470 (73.2%) | 37 (2.5%) |
| 25 to 29 Years | 2,054 (80.1%) | 68 (3.3%) |
| 30 to 34 Years | 1,657 (80.3%) | 197 (11.9%) |
| 35 to 44 Years | 2,453 (66.9%) | 162 (6.6%) |
| 45 to 54 Years | 2,608 (69.9%) | 52 (2.0%) |
| 55 to 59 Years | 1,489 (61.5%) | 10 (0.7%) |
| 60 to 64 Years | 794 (34.8%) | 18 (2.3%) |
| 65 to 74 Years | 642 (19.9%) | 16 (2.5%) |
| 75 Years and over | 323 (11.0%) | 0 (0.0%) |
| Total | 13,847 (53.1%) | 692 (5.0%) |
Employment Status by Educational Attainment in Rome
According to labor force statistics for Rome, 66.1% of individuals (11,058) out of the total population between 25 and 64 years of age (16,729) are in the labor force, with 4.6% or 509 of them being unemployed. The group with the highest labor force participation rate are those with the educational attainment of bachelor's degree or higher, with 88.1% or 3,246 individuals in the labor force. Within the labor force, individuals with high school diploma education have the highest percentage of unemployment, with 7.4% or 205 of them being unemployed.
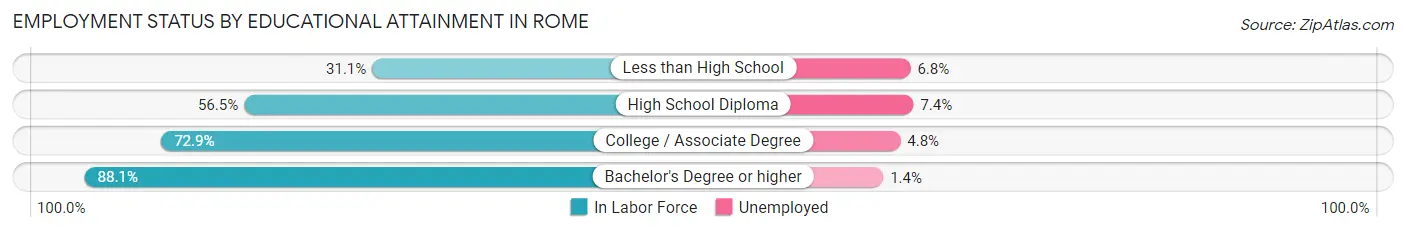
| Educational Attainment | In Labor Force | Unemployed |
| Less than High School | 664 (31.1%) | 145 (6.8%) |
| High School Diploma | 2,772 (56.5%) | 363 (7.4%) |
| College / Associate Degree | 4,375 (72.9%) | 288 (4.8%) |
| Bachelor's Degree or higher | 3,246 (88.1%) | 52 (1.4%) |
| Total | 11,058 (66.1%) | 770 (4.6%) |
Employment Occupations by Sex in Rome
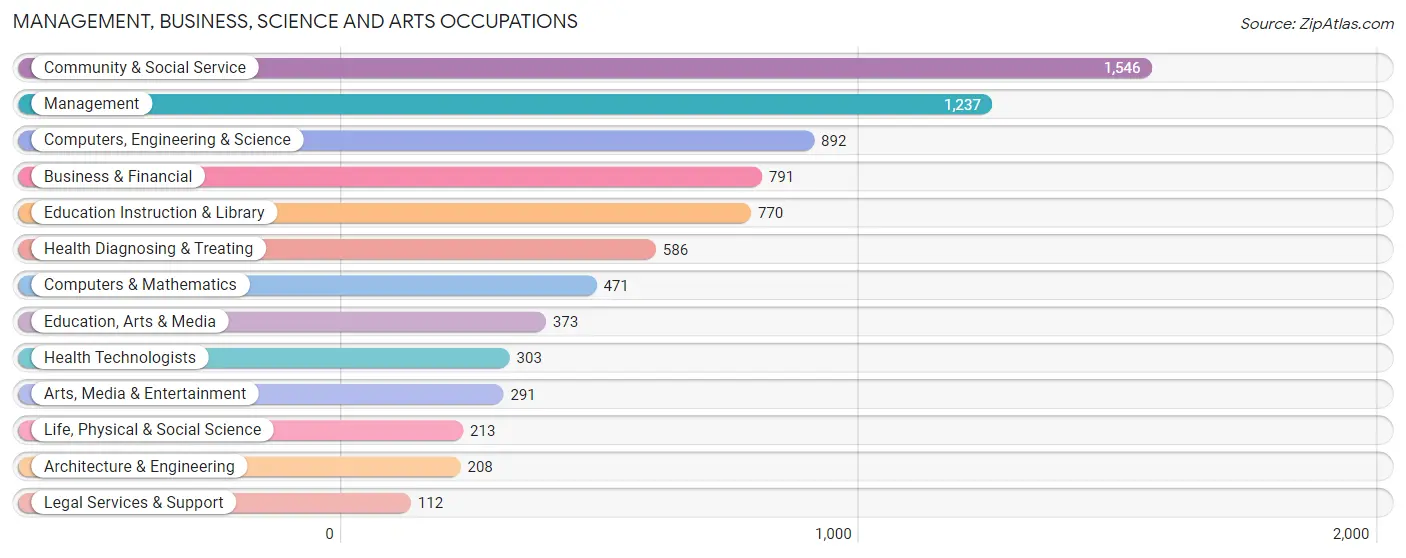
Management, Business, Science and Arts Occupations
The most common Management, Business, Science and Arts occupations in Rome are Community & Social Service (1,546 | 11.8%), Management (1,237 | 9.5%), Computers, Engineering & Science (892 | 6.8%), Business & Financial (791 | 6.0%), and Education Instruction & Library (770 | 5.9%).
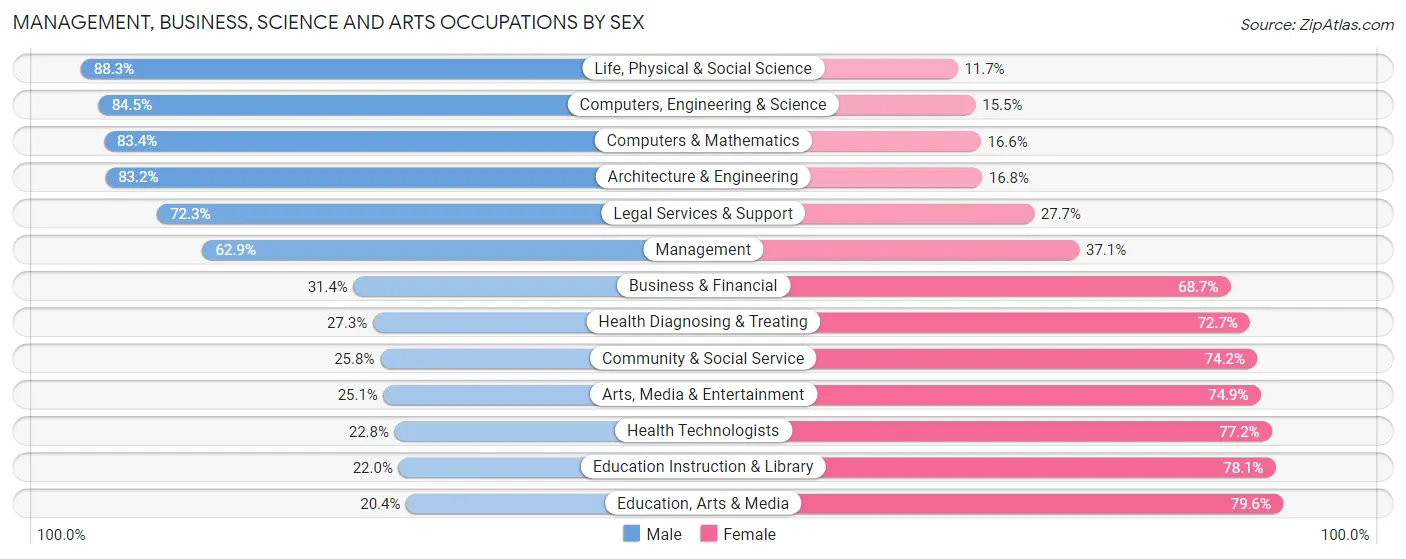
Management, Business, Science and Arts Occupations by Sex
Within the Management, Business, Science and Arts occupations in Rome, the most male-oriented occupations are Life, Physical & Social Science (88.3%), Computers, Engineering & Science (84.5%), and Computers & Mathematics (83.4%), while the most female-oriented occupations are Education, Arts & Media (79.6%), Education Instruction & Library (78.0%), and Health Technologists (77.2%).
| Occupation | Male | Female |
| Management | 778 (62.9%) | 459 (37.1%) |
| Business & Financial | 248 (31.4%) | 543 (68.6%) |
| Computers, Engineering & Science | 754 (84.5%) | 138 (15.5%) |
| Computers & Mathematics | 393 (83.4%) | 78 (16.6%) |
| Architecture & Engineering | 173 (83.2%) | 35 (16.8%) |
| Life, Physical & Social Science | 188 (88.3%) | 25 (11.7%) |
| Community & Social Service | 399 (25.8%) | 1,147 (74.2%) |
| Education, Arts & Media | 76 (20.4%) | 297 (79.6%) |
| Legal Services & Support | 81 (72.3%) | 31 (27.7%) |
| Education Instruction & Library | 169 (22.0%) | 601 (78.0%) |
| Arts, Media & Entertainment | 73 (25.1%) | 218 (74.9%) |
| Health Diagnosing & Treating | 160 (27.3%) | 426 (72.7%) |
| Health Technologists | 69 (22.8%) | 234 (77.2%) |
| Total (Category) | 2,339 (46.3%) | 2,713 (53.7%) |
| Total (Overall) | 6,638 (50.7%) | 6,447 (49.3%) |
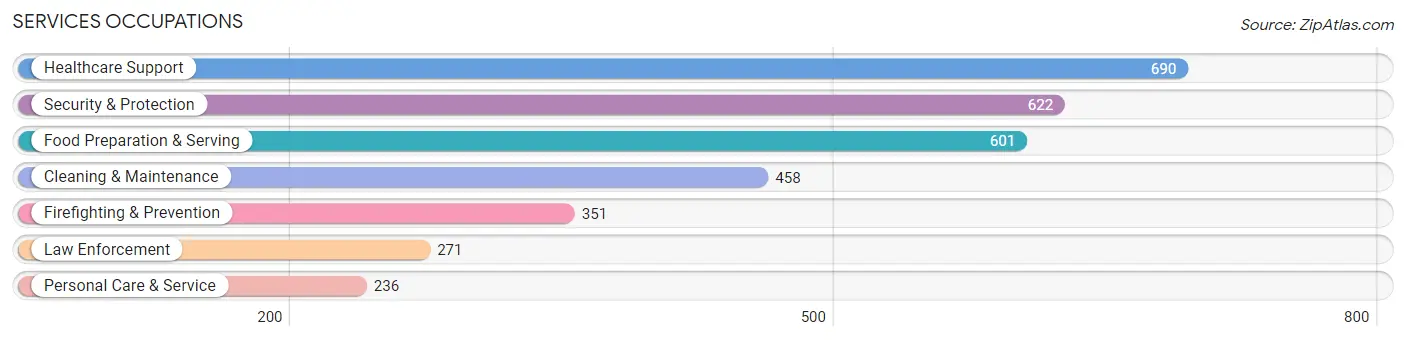
Services Occupations
The most common Services occupations in Rome are Healthcare Support (690 | 5.3%), Security & Protection (622 | 4.8%), Food Preparation & Serving (601 | 4.6%), Cleaning & Maintenance (458 | 3.5%), and Firefighting & Prevention (351 | 2.7%).
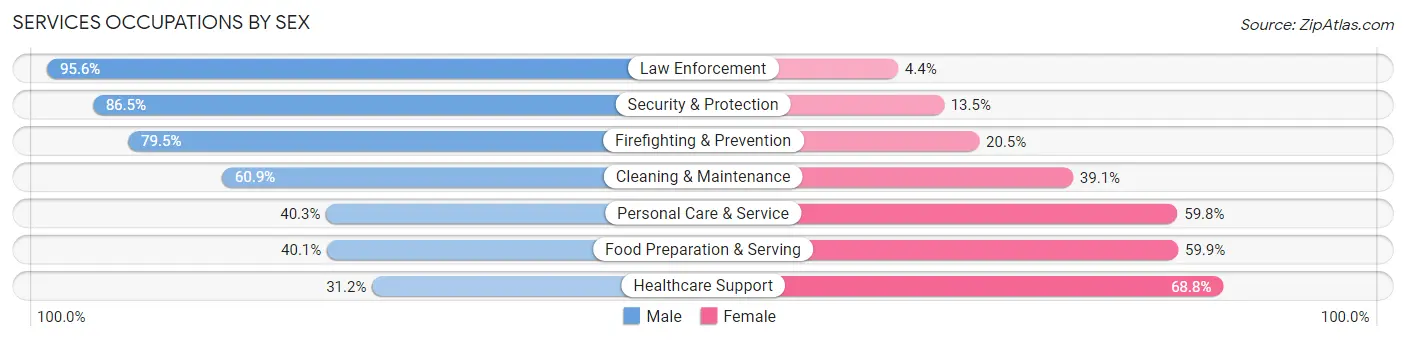
Services Occupations by Sex
Within the Services occupations in Rome, the most male-oriented occupations are Law Enforcement (95.6%), Security & Protection (86.5%), and Firefighting & Prevention (79.5%), while the most female-oriented occupations are Healthcare Support (68.8%), Food Preparation & Serving (59.9%), and Personal Care & Service (59.8%).
| Occupation | Male | Female |
| Healthcare Support | 215 (31.2%) | 475 (68.8%) |
| Security & Protection | 538 (86.5%) | 84 (13.5%) |
| Firefighting & Prevention | 279 (79.5%) | 72 (20.5%) |
| Law Enforcement | 259 (95.6%) | 12 (4.4%) |
| Food Preparation & Serving | 241 (40.1%) | 360 (59.9%) |
| Cleaning & Maintenance | 279 (60.9%) | 179 (39.1%) |
| Personal Care & Service | 95 (40.3%) | 141 (59.8%) |
| Total (Category) | 1,368 (52.5%) | 1,239 (47.5%) |
| Total (Overall) | 6,638 (50.7%) | 6,447 (49.3%) |
Sales and Office Occupations
The most common Sales and Office occupations in Rome are Office & Administration (2,018 | 15.4%), and Sales & Related (1,027 | 7.9%).
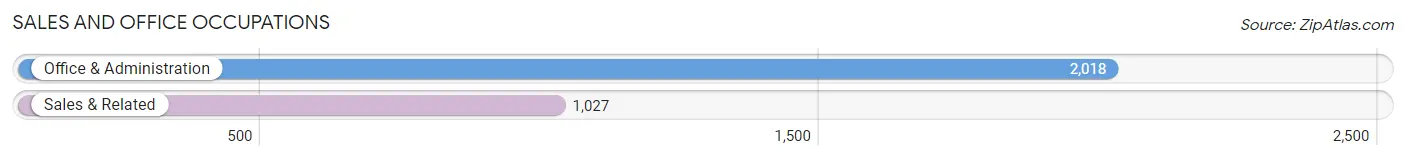
Sales and Office Occupations by Sex

| Occupation | Male | Female |
| Sales & Related | 410 (39.9%) | 617 (60.1%) |
| Office & Administration | 393 (19.5%) | 1,625 (80.5%) |
| Total (Category) | 803 (26.4%) | 2,242 (73.6%) |
| Total (Overall) | 6,638 (50.7%) | 6,447 (49.3%) |
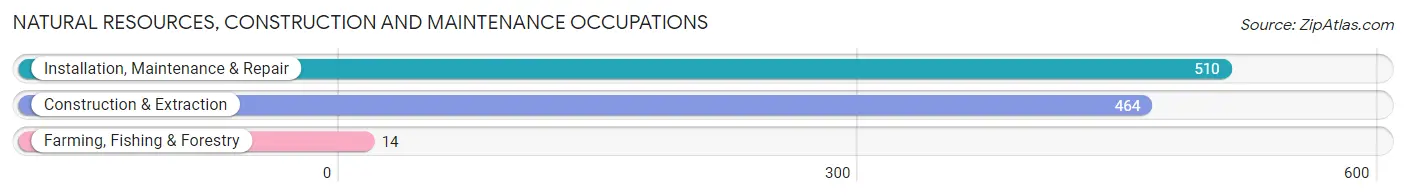
Natural Resources, Construction and Maintenance Occupations
The most common Natural Resources, Construction and Maintenance occupations in Rome are Installation, Maintenance & Repair (510 | 3.9%), Construction & Extraction (464 | 3.5%), and Farming, Fishing & Forestry (14 | 0.1%).
Natural Resources, Construction and Maintenance Occupations by Sex
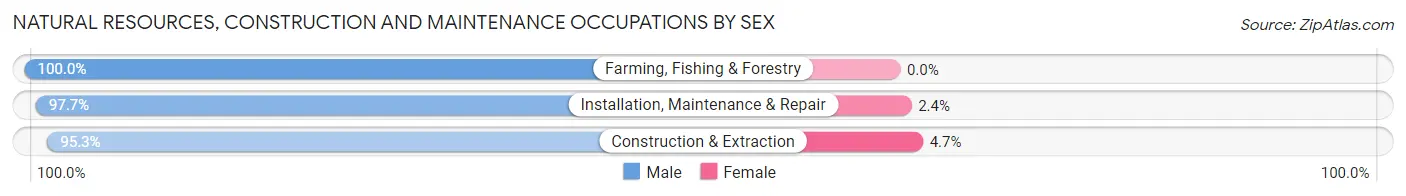
| Occupation | Male | Female |
| Farming, Fishing & Forestry | 14 (100.0%) | 0 (0.0%) |
| Construction & Extraction | 442 (95.3%) | 22 (4.7%) |
| Installation, Maintenance & Repair | 498 (97.7%) | 12 (2.4%) |
| Total (Category) | 954 (96.6%) | 34 (3.4%) |
| Total (Overall) | 6,638 (50.7%) | 6,447 (49.3%) |
Production, Transportation and Moving Occupations
The most common Production, Transportation and Moving occupations in Rome are Production (532 | 4.1%), Transportation (531 | 4.1%), and Material Moving (330 | 2.5%).
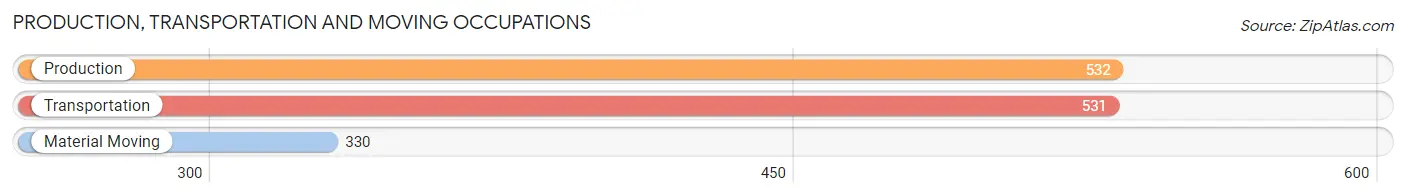
Production, Transportation and Moving Occupations by Sex
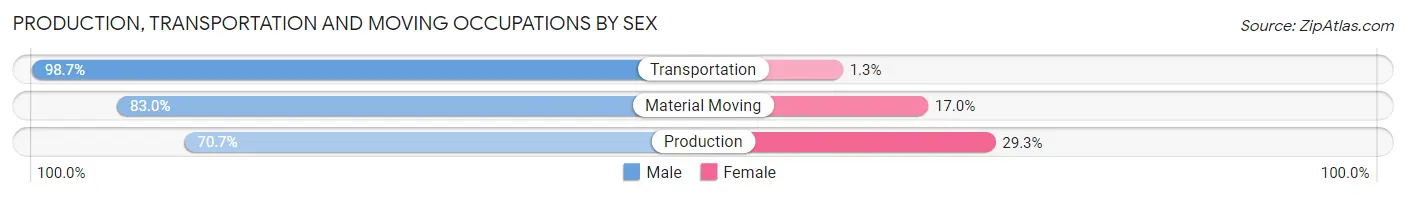
| Occupation | Male | Female |
| Production | 376 (70.7%) | 156 (29.3%) |
| Transportation | 524 (98.7%) | 7 (1.3%) |
| Material Moving | 274 (83.0%) | 56 (17.0%) |
| Total (Category) | 1,174 (84.3%) | 219 (15.7%) |
| Total (Overall) | 6,638 (50.7%) | 6,447 (49.3%) |
Employment Industries by Sex in Rome
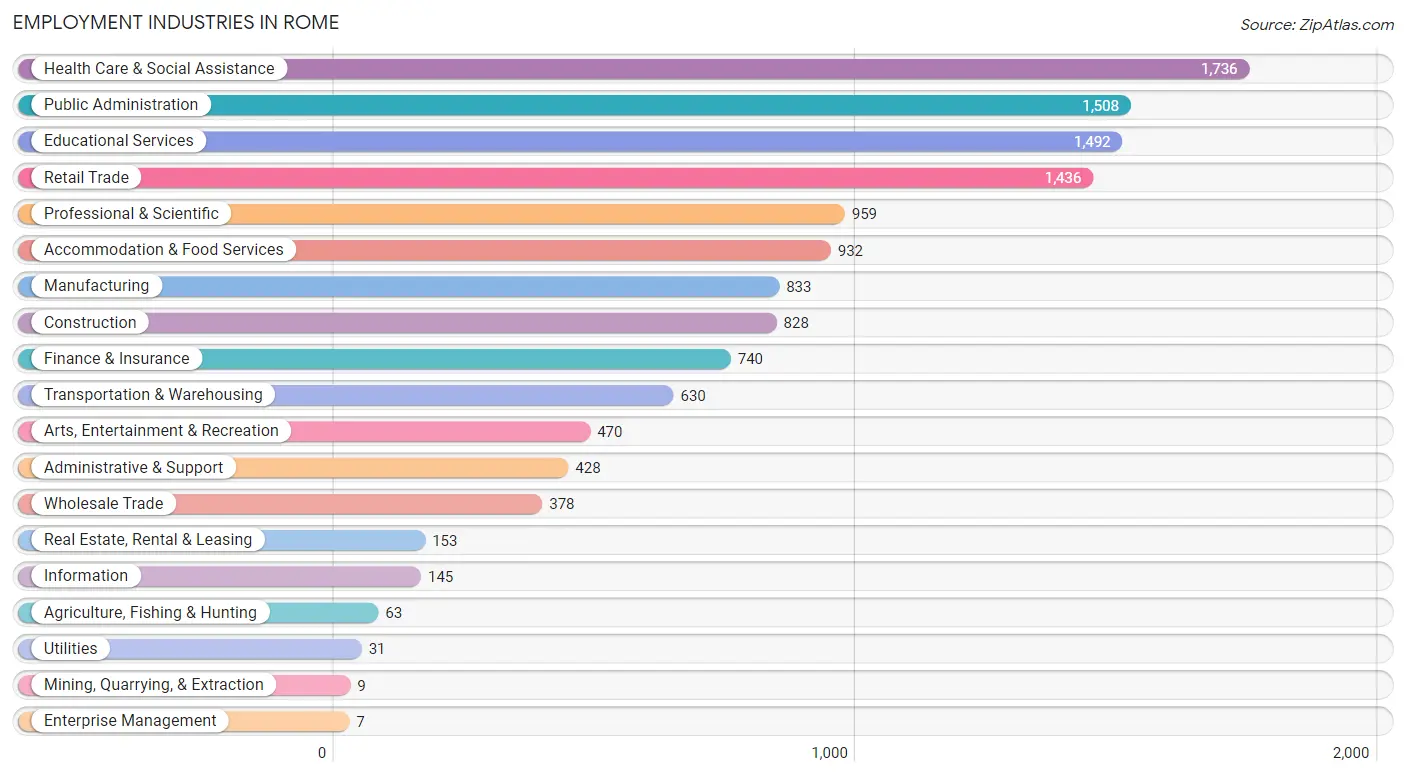
Employment Industries in Rome
The major employment industries in Rome include Health Care & Social Assistance (1,736 | 13.3%), Public Administration (1,508 | 11.5%), Educational Services (1,492 | 11.4%), Retail Trade (1,436 | 11.0%), and Professional & Scientific (959 | 7.3%).
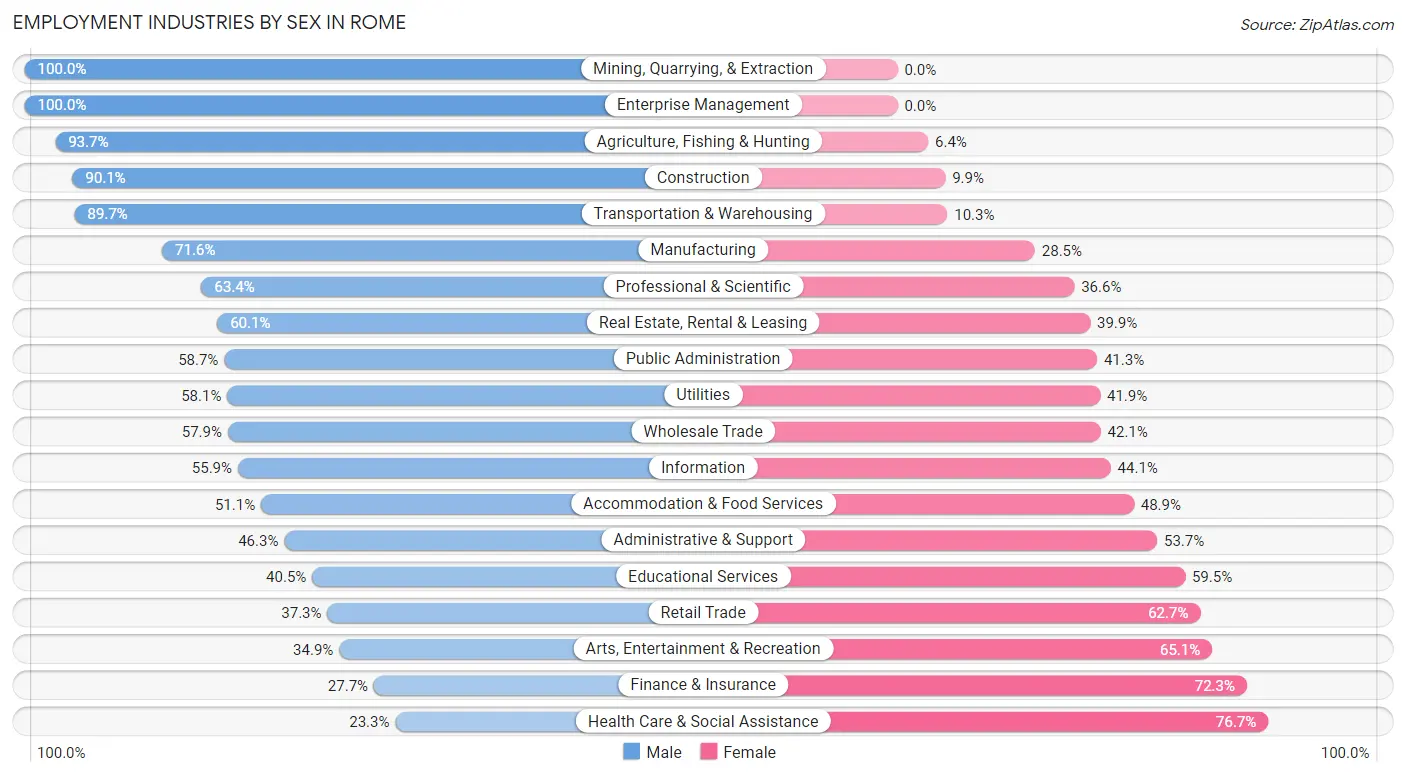
Employment Industries by Sex in Rome
The Rome industries that see more men than women are Mining, Quarrying, & Extraction (100.0%), Enterprise Management (100.0%), and Agriculture, Fishing & Hunting (93.6%), whereas the industries that tend to have a higher number of women are Health Care & Social Assistance (76.7%), Finance & Insurance (72.3%), and Arts, Entertainment & Recreation (65.1%).
| Industry | Male | Female |
| Agriculture, Fishing & Hunting | 59 (93.6%) | 4 (6.4%) |
| Mining, Quarrying, & Extraction | 9 (100.0%) | 0 (0.0%) |
| Construction | 746 (90.1%) | 82 (9.9%) |
| Manufacturing | 596 (71.6%) | 237 (28.4%) |
| Wholesale Trade | 219 (57.9%) | 159 (42.1%) |
| Retail Trade | 536 (37.3%) | 900 (62.7%) |
| Transportation & Warehousing | 565 (89.7%) | 65 (10.3%) |
| Utilities | 18 (58.1%) | 13 (41.9%) |
| Information | 81 (55.9%) | 64 (44.1%) |
| Finance & Insurance | 205 (27.7%) | 535 (72.3%) |
| Real Estate, Rental & Leasing | 92 (60.1%) | 61 (39.9%) |
| Professional & Scientific | 608 (63.4%) | 351 (36.6%) |
| Enterprise Management | 7 (100.0%) | 0 (0.0%) |
| Administrative & Support | 198 (46.3%) | 230 (53.7%) |
| Educational Services | 604 (40.5%) | 888 (59.5%) |
| Health Care & Social Assistance | 404 (23.3%) | 1,332 (76.7%) |
| Arts, Entertainment & Recreation | 164 (34.9%) | 306 (65.1%) |
| Accommodation & Food Services | 476 (51.1%) | 456 (48.9%) |
| Public Administration | 885 (58.7%) | 623 (41.3%) |
| Total | 6,638 (50.7%) | 6,447 (49.3%) |
Education in Rome
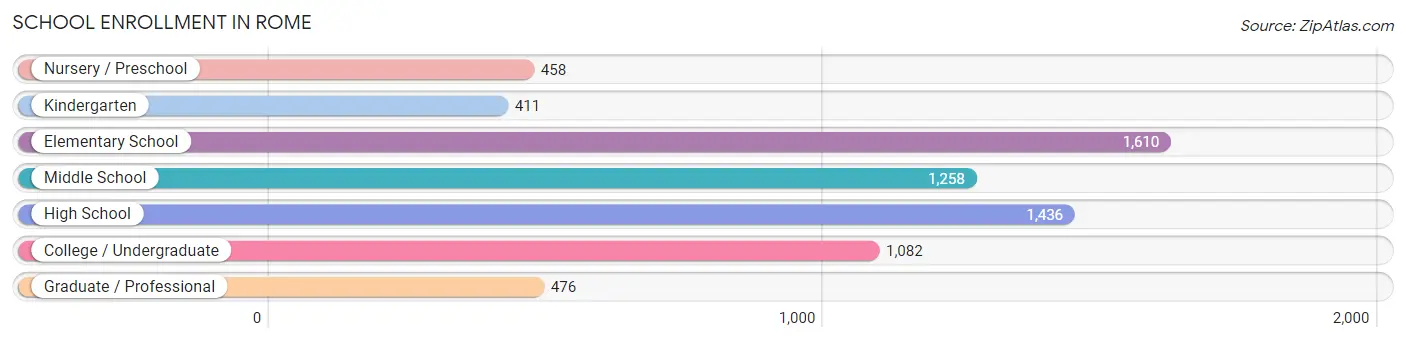
School Enrollment in Rome
The most common levels of schooling among the 6,731 students in Rome are elementary school (1,610 | 23.9%), high school (1,436 | 21.3%), and middle school (1,258 | 18.7%).
| School Level | # Students | % Students |
| Nursery / Preschool | 458 | 6.8% |
| Kindergarten | 411 | 6.1% |
| Elementary School | 1,610 | 23.9% |
| Middle School | 1,258 | 18.7% |
| High School | 1,436 | 21.3% |
| College / Undergraduate | 1,082 | 16.1% |
| Graduate / Professional | 476 | 7.1% |
| Total | 6,731 | 100.0% |
School Enrollment by Age by Funding Source in Rome
Out of a total of 6,731 students who are enrolled in schools in Rome, 902 (13.4%) attend a private institution, while the remaining 5,829 (86.6%) are enrolled in public schools. The age group of 35 years and over has the highest likelihood of being enrolled in private schools, with 157 (42.5% in the age bracket) enrolled. Conversely, the age group of 5 to 9 year old has the lowest likelihood of being enrolled in a private school, with 1,703 (97.6% in the age bracket) attending a public institution.
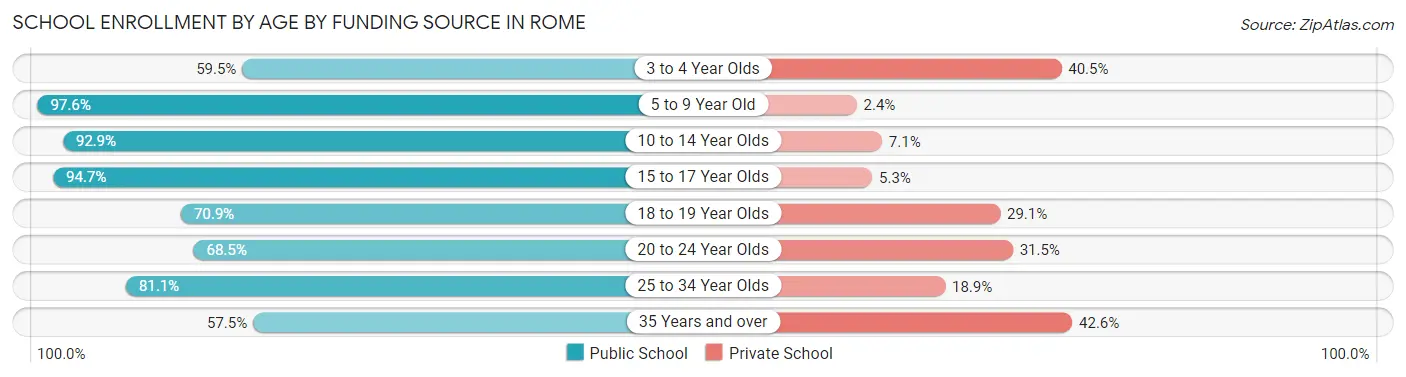
| Age Bracket | Public School | Private School |
| 3 to 4 Year Olds | 223 (59.5%) | 152 (40.5%) |
| 5 to 9 Year Old | 1,703 (97.6%) | 42 (2.4%) |
| 10 to 14 Year Olds | 1,670 (92.9%) | 128 (7.1%) |
| 15 to 17 Year Olds | 1,037 (94.7%) | 58 (5.3%) |
| 18 to 19 Year Olds | 219 (70.9%) | 90 (29.1%) |
| 20 to 24 Year Olds | 444 (68.5%) | 204 (31.5%) |
| 25 to 34 Year Olds | 318 (81.1%) | 74 (18.9%) |
| 35 Years and over | 212 (57.5%) | 157 (42.5%) |
| Total | 5,829 (86.6%) | 902 (13.4%) |
Educational Attainment by Field of Study in Rome
Business (968 | 17.9%), education (767 | 14.2%), psychology (541 | 10.0%), science & technology (524 | 9.7%), and arts & humanities (428 | 7.9%) are the most common fields of study among 5,418 individuals in Rome who have obtained a bachelor's degree or higher.
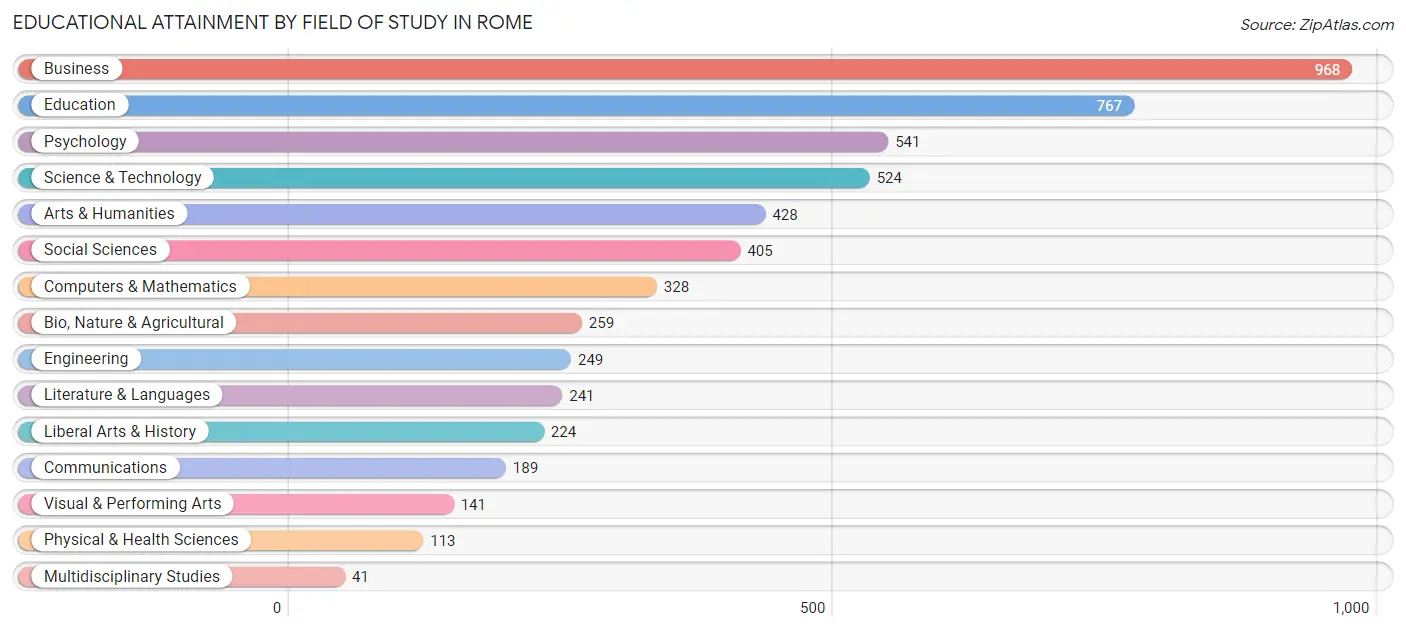
| Field of Study | # Graduates | % Graduates |
| Computers & Mathematics | 328 | 6.0% |
| Bio, Nature & Agricultural | 259 | 4.8% |
| Physical & Health Sciences | 113 | 2.1% |
| Psychology | 541 | 10.0% |
| Social Sciences | 405 | 7.5% |
| Engineering | 249 | 4.6% |
| Multidisciplinary Studies | 41 | 0.8% |
| Science & Technology | 524 | 9.7% |
| Business | 968 | 17.9% |
| Education | 767 | 14.2% |
| Literature & Languages | 241 | 4.4% |
| Liberal Arts & History | 224 | 4.1% |
| Visual & Performing Arts | 141 | 2.6% |
| Communications | 189 | 3.5% |
| Arts & Humanities | 428 | 7.9% |
| Total | 5,418 | 100.0% |
Transportation & Commute in Rome
Vehicle Availability by Sex in Rome
The most prevalent vehicle ownership categories in Rome are males with 2 vehicles (2,779, accounting for 42.4%) and females with 2 vehicles (2,513, making up 45.3%).
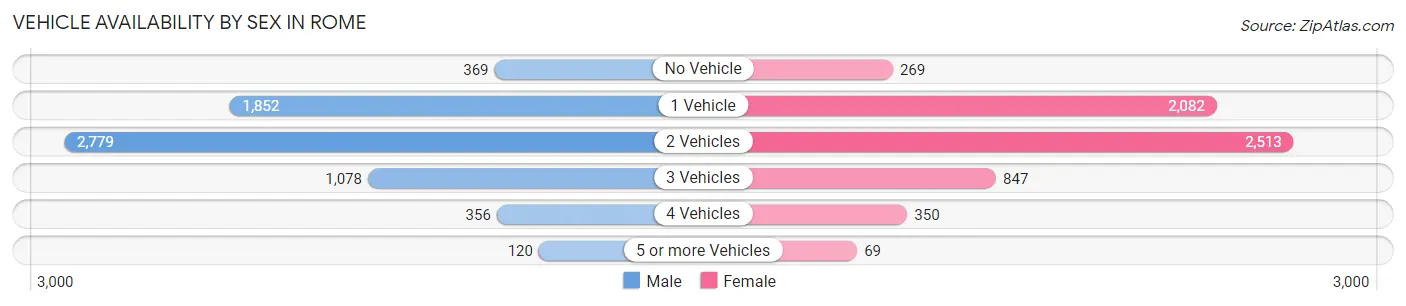
| Vehicles Available | Male | Female |
| No Vehicle | 369 (5.6%) | 269 (4.4%) |
| 1 Vehicle | 1,852 (28.3%) | 2,082 (34.0%) |
| 2 Vehicles | 2,779 (42.4%) | 2,513 (41.0%) |
| 3 Vehicles | 1,078 (16.5%) | 847 (13.8%) |
| 4 Vehicles | 356 (5.4%) | 350 (5.7%) |
| 5 or more Vehicles | 120 (1.8%) | 69 (1.1%) |
| Total | 6,554 (100.0%) | 6,130 (100.0%) |
Commute Time in Rome
The most frequently occuring commute durations in Rome are 10 to 14 minutes (2,167 commuters, 19.2%), 5 to 9 minutes (2,097 commuters, 18.6%), and 15 to 19 minutes (1,822 commuters, 16.1%).
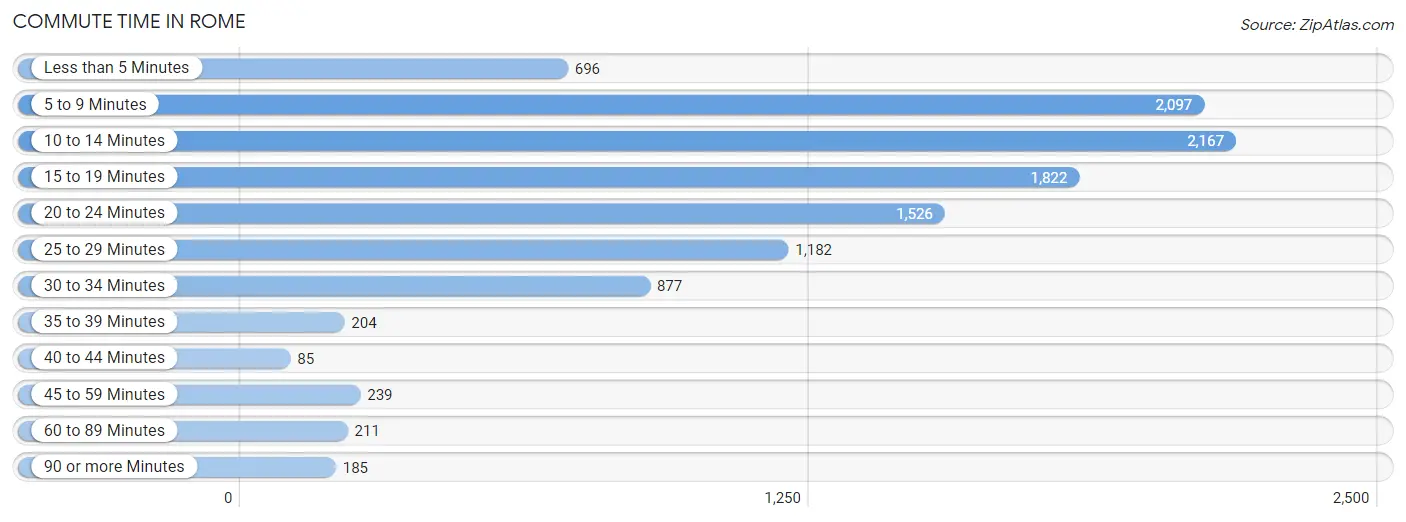
| Commute Time | # Commuters | % Commuters |
| Less than 5 Minutes | 696 | 6.2% |
| 5 to 9 Minutes | 2,097 | 18.6% |
| 10 to 14 Minutes | 2,167 | 19.2% |
| 15 to 19 Minutes | 1,822 | 16.1% |
| 20 to 24 Minutes | 1,526 | 13.5% |
| 25 to 29 Minutes | 1,182 | 10.5% |
| 30 to 34 Minutes | 877 | 7.8% |
| 35 to 39 Minutes | 204 | 1.8% |
| 40 to 44 Minutes | 85 | 0.7% |
| 45 to 59 Minutes | 239 | 2.1% |
| 60 to 89 Minutes | 211 | 1.9% |
| 90 or more Minutes | 185 | 1.6% |
Commute Time by Sex in Rome
The most common commute times in Rome are 10 to 14 minutes (1,314 commuters, 21.6%) for males and 5 to 9 minutes (940 commuters, 18.0%) for females.
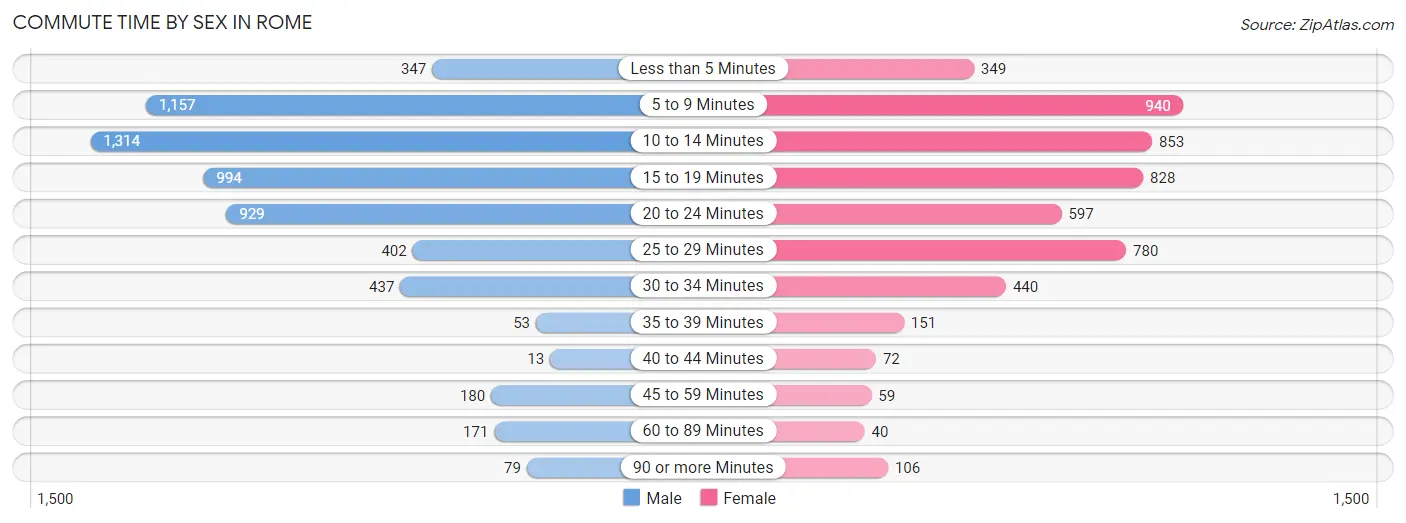
| Commute Time | Male | Female |
| Less than 5 Minutes | 347 (5.7%) | 349 (6.7%) |
| 5 to 9 Minutes | 1,157 (19.0%) | 940 (18.0%) |
| 10 to 14 Minutes | 1,314 (21.6%) | 853 (16.4%) |
| 15 to 19 Minutes | 994 (16.4%) | 828 (15.9%) |
| 20 to 24 Minutes | 929 (15.3%) | 597 (11.5%) |
| 25 to 29 Minutes | 402 (6.6%) | 780 (15.0%) |
| 30 to 34 Minutes | 437 (7.2%) | 440 (8.4%) |
| 35 to 39 Minutes | 53 (0.9%) | 151 (2.9%) |
| 40 to 44 Minutes | 13 (0.2%) | 72 (1.4%) |
| 45 to 59 Minutes | 180 (3.0%) | 59 (1.1%) |
| 60 to 89 Minutes | 171 (2.8%) | 40 (0.8%) |
| 90 or more Minutes | 79 (1.3%) | 106 (2.0%) |
Time of Departure to Work by Sex in Rome
The most frequent times of departure to work in Rome are 7:00 AM to 7:29 AM (970, 16.0%) for males and 7:00 AM to 7:29 AM (1,103, 21.1%) for females.
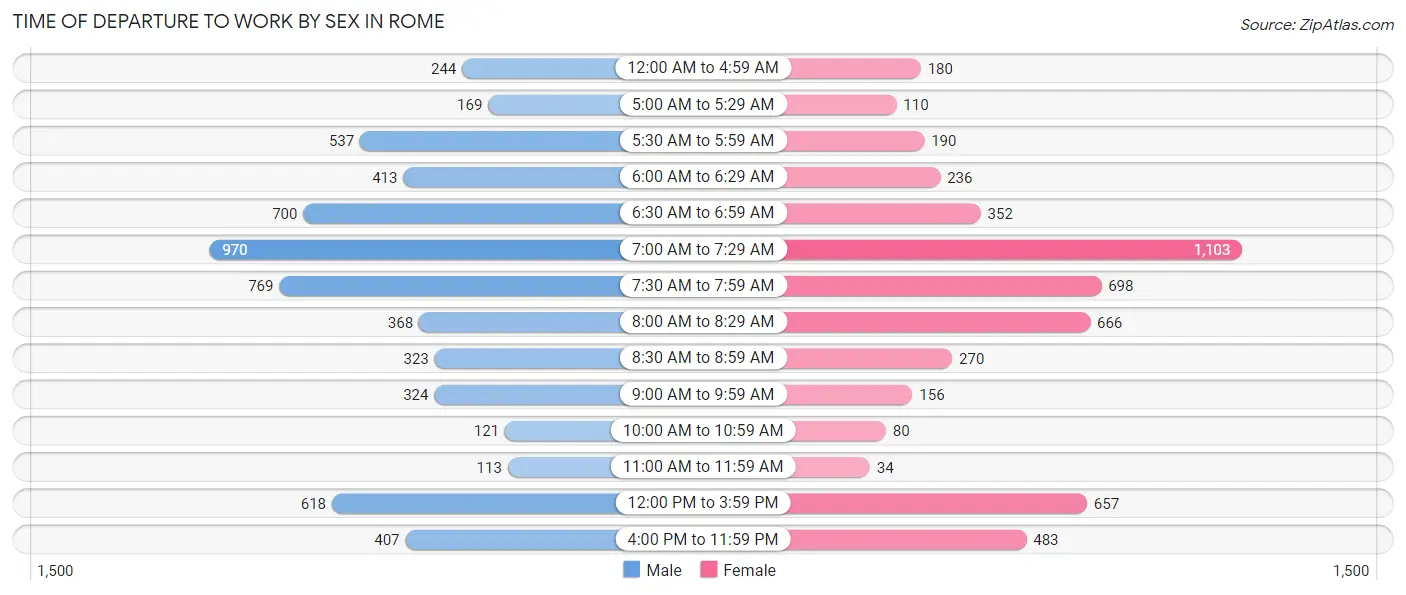
| Time of Departure | Male | Female |
| 12:00 AM to 4:59 AM | 244 (4.0%) | 180 (3.5%) |
| 5:00 AM to 5:29 AM | 169 (2.8%) | 110 (2.1%) |
| 5:30 AM to 5:59 AM | 537 (8.8%) | 190 (3.6%) |
| 6:00 AM to 6:29 AM | 413 (6.8%) | 236 (4.5%) |
| 6:30 AM to 6:59 AM | 700 (11.5%) | 352 (6.8%) |
| 7:00 AM to 7:29 AM | 970 (16.0%) | 1,103 (21.1%) |
| 7:30 AM to 7:59 AM | 769 (12.7%) | 698 (13.4%) |
| 8:00 AM to 8:29 AM | 368 (6.1%) | 666 (12.8%) |
| 8:30 AM to 8:59 AM | 323 (5.3%) | 270 (5.2%) |
| 9:00 AM to 9:59 AM | 324 (5.3%) | 156 (3.0%) |
| 10:00 AM to 10:59 AM | 121 (2.0%) | 80 (1.5%) |
| 11:00 AM to 11:59 AM | 113 (1.9%) | 34 (0.6%) |
| 12:00 PM to 3:59 PM | 618 (10.2%) | 657 (12.6%) |
| 4:00 PM to 11:59 PM | 407 (6.7%) | 483 (9.3%) |
| Total | 6,076 (100.0%) | 5,215 (100.0%) |
Housing Occupancy in Rome
Occupancy by Ownership in Rome
Of the total 13,726 dwellings in Rome, owner-occupied units account for 7,768 (56.6%), while renter-occupied units make up 5,958 (43.4%).
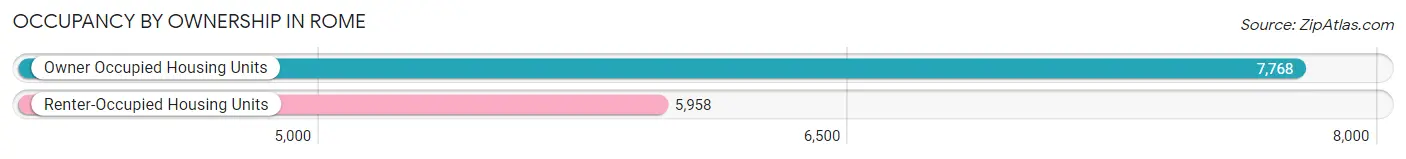
| Occupancy | # Housing Units | % Housing Units |
| Owner Occupied Housing Units | 7,768 | 56.6% |
| Renter-Occupied Housing Units | 5,958 | 43.4% |
| Total Occupied Housing Units | 13,726 | 100.0% |
Occupancy by Household Size in Rome
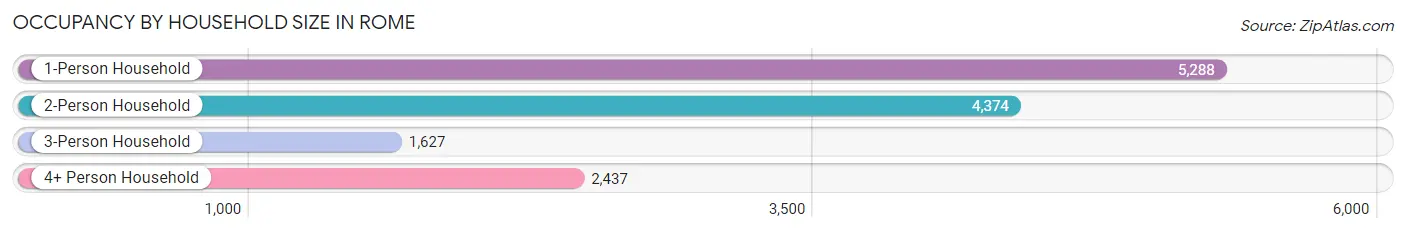
| Household Size | # Housing Units | % Housing Units |
| 1-Person Household | 5,288 | 38.5% |
| 2-Person Household | 4,374 | 31.9% |
| 3-Person Household | 1,627 | 11.8% |
| 4+ Person Household | 2,437 | 17.7% |
| Total Housing Units | 13,726 | 100.0% |
Occupancy by Ownership by Household Size in Rome
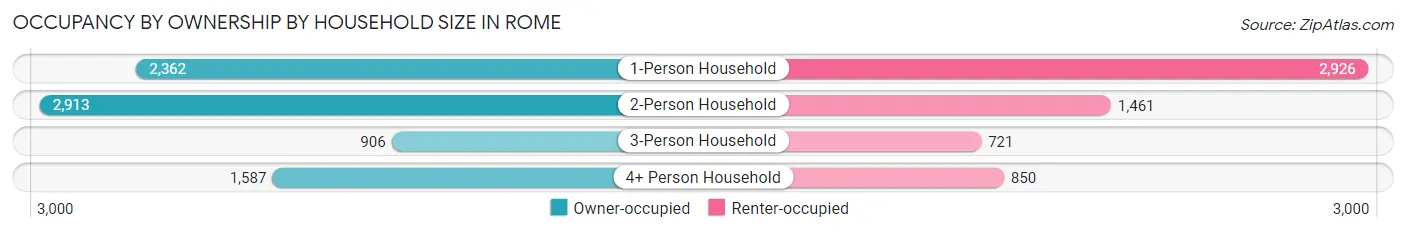
| Household Size | Owner-occupied | Renter-occupied |
| 1-Person Household | 2,362 (44.7%) | 2,926 (55.3%) |
| 2-Person Household | 2,913 (66.6%) | 1,461 (33.4%) |
| 3-Person Household | 906 (55.7%) | 721 (44.3%) |
| 4+ Person Household | 1,587 (65.1%) | 850 (34.9%) |
| Total Housing Units | 7,768 (56.6%) | 5,958 (43.4%) |
Occupancy by Educational Attainment in Rome
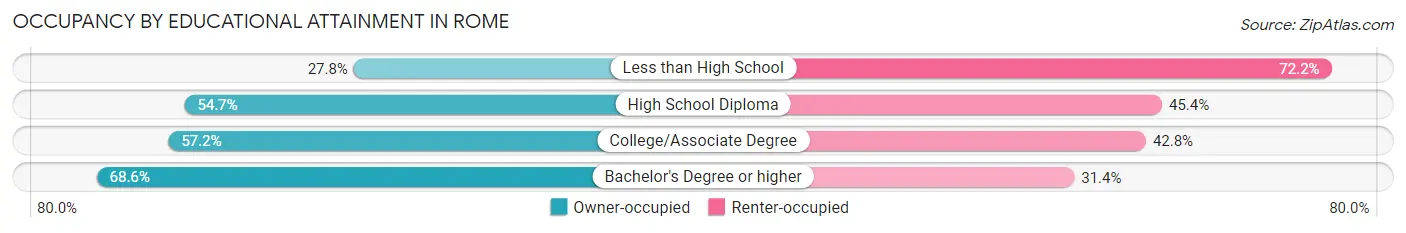
| Household Size | Owner-occupied | Renter-occupied |
| Less than High School | 360 (27.8%) | 935 (72.2%) |
| High School Diploma | 1,920 (54.6%) | 1,593 (45.4%) |
| College/Associate Degree | 3,158 (57.2%) | 2,362 (42.8%) |
| Bachelor's Degree or higher | 2,330 (68.6%) | 1,068 (31.4%) |
Occupancy by Age of Householder in Rome
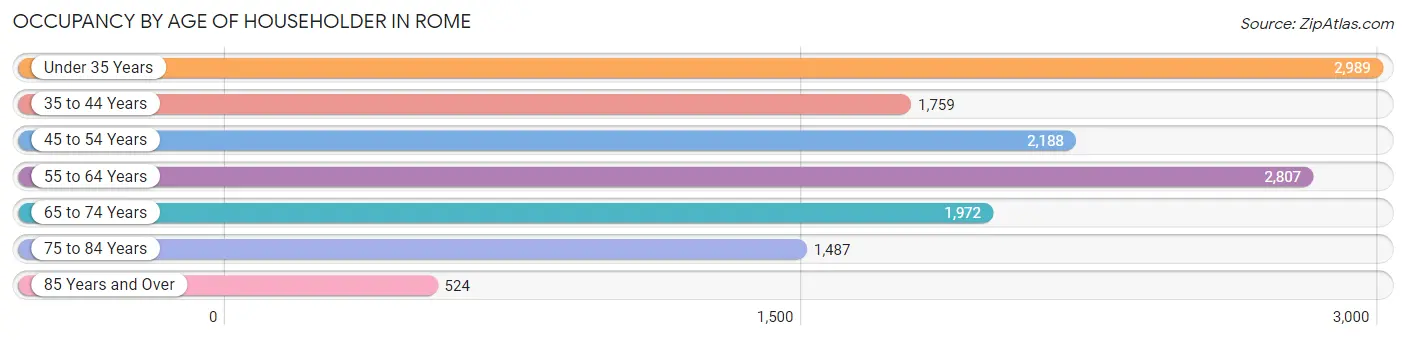
| Age Bracket | # Households | % Households |
| Under 35 Years | 2,989 | 21.8% |
| 35 to 44 Years | 1,759 | 12.8% |
| 45 to 54 Years | 2,188 | 15.9% |
| 55 to 64 Years | 2,807 | 20.4% |
| 65 to 74 Years | 1,972 | 14.4% |
| 75 to 84 Years | 1,487 | 10.8% |
| 85 Years and Over | 524 | 3.8% |
| Total | 13,726 | 100.0% |
Housing Finances in Rome
Median Income by Occupancy in Rome
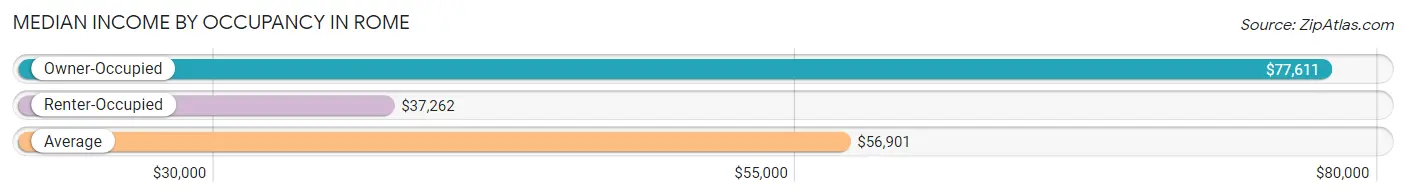
| Occupancy Type | # Households | Median Income |
| Owner-Occupied | 7,768 (56.6%) | $77,611 |
| Renter-Occupied | 5,958 (43.4%) | $37,262 |
| Average | 13,726 (100.0%) | $56,901 |
Occupancy by Householder Income Bracket in Rome
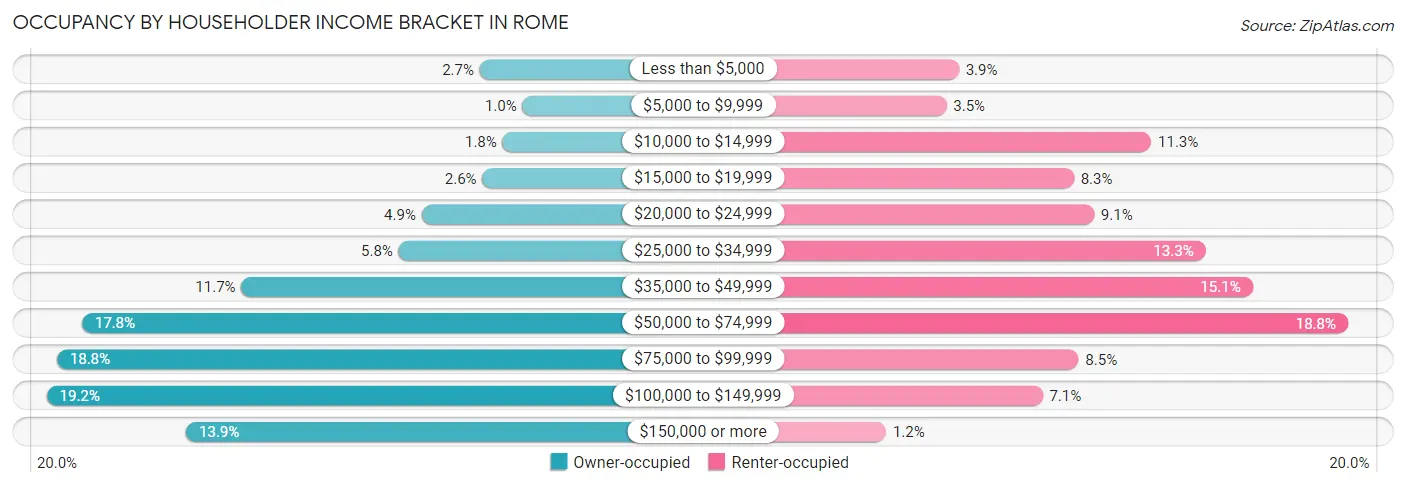
| Income Bracket | Owner-occupied | Renter-occupied |
| Less than $5,000 | 207 (2.7%) | 234 (3.9%) |
| $5,000 to $9,999 | 80 (1.0%) | 206 (3.5%) |
| $10,000 to $14,999 | 139 (1.8%) | 671 (11.3%) |
| $15,000 to $19,999 | 199 (2.6%) | 495 (8.3%) |
| $20,000 to $24,999 | 378 (4.9%) | 541 (9.1%) |
| $25,000 to $34,999 | 447 (5.8%) | 794 (13.3%) |
| $35,000 to $49,999 | 912 (11.7%) | 901 (15.1%) |
| $50,000 to $74,999 | 1,384 (17.8%) | 1,117 (18.8%) |
| $75,000 to $99,999 | 1,458 (18.8%) | 506 (8.5%) |
| $100,000 to $149,999 | 1,488 (19.2%) | 424 (7.1%) |
| $150,000 or more | 1,076 (13.9%) | 69 (1.2%) |
| Total | 7,768 (100.0%) | 5,958 (100.0%) |
Monthly Housing Cost Tiers in Rome
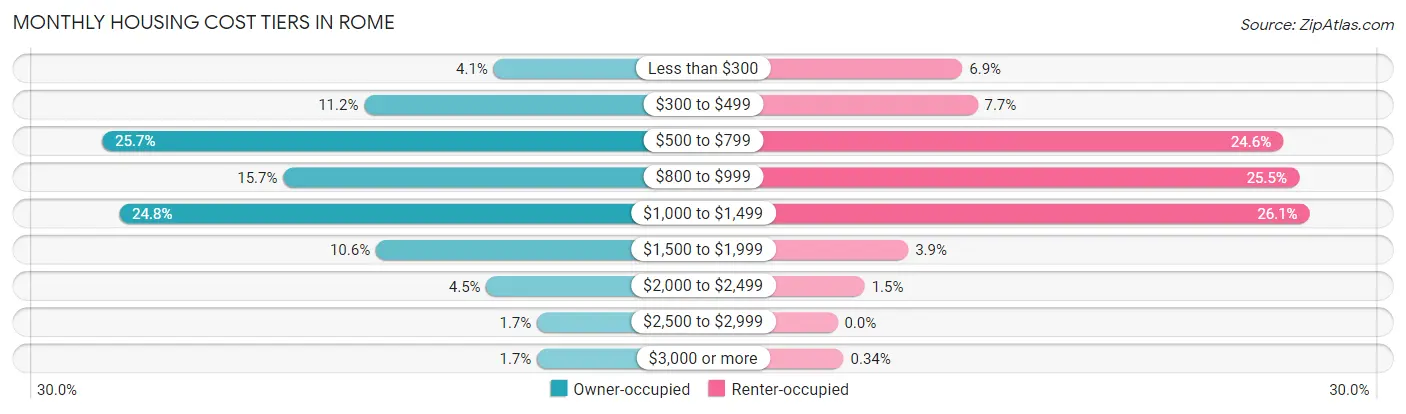
| Monthly Cost | Owner-occupied | Renter-occupied |
| Less than $300 | 318 (4.1%) | 411 (6.9%) |
| $300 to $499 | 873 (11.2%) | 461 (7.7%) |
| $500 to $799 | 1,998 (25.7%) | 1,466 (24.6%) |
| $800 to $999 | 1,220 (15.7%) | 1,518 (25.5%) |
| $1,000 to $1,499 | 1,925 (24.8%) | 1,553 (26.1%) |
| $1,500 to $1,999 | 823 (10.6%) | 233 (3.9%) |
| $2,000 to $2,499 | 349 (4.5%) | 90 (1.5%) |
| $2,500 to $2,999 | 131 (1.7%) | 0 (0.0%) |
| $3,000 or more | 131 (1.7%) | 20 (0.3%) |
| Total | 7,768 (100.0%) | 5,958 (100.0%) |
Physical Housing Characteristics in Rome
Housing Structures in Rome
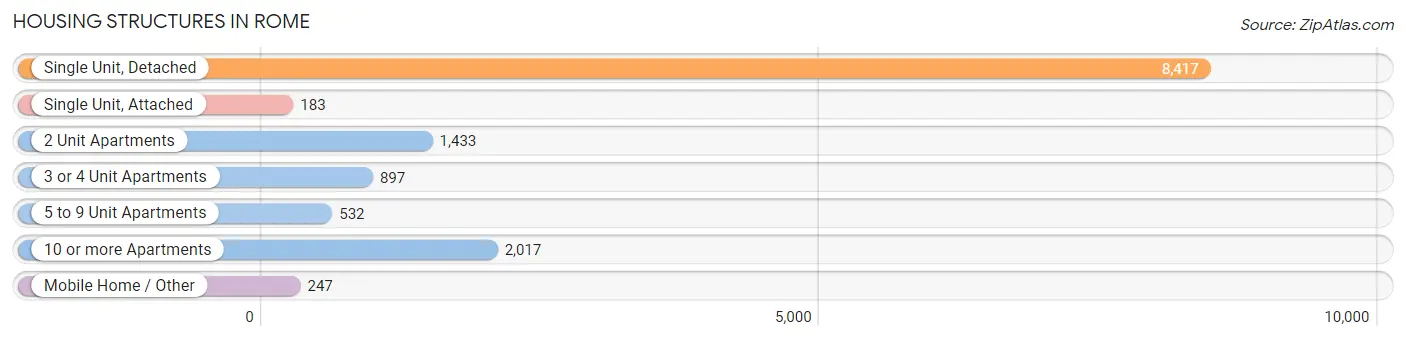
| Structure Type | # Housing Units | % Housing Units |
| Single Unit, Detached | 8,417 | 61.3% |
| Single Unit, Attached | 183 | 1.3% |
| 2 Unit Apartments | 1,433 | 10.4% |
| 3 or 4 Unit Apartments | 897 | 6.5% |
| 5 to 9 Unit Apartments | 532 | 3.9% |
| 10 or more Apartments | 2,017 | 14.7% |
| Mobile Home / Other | 247 | 1.8% |
| Total | 13,726 | 100.0% |
Housing Structures by Occupancy in Rome
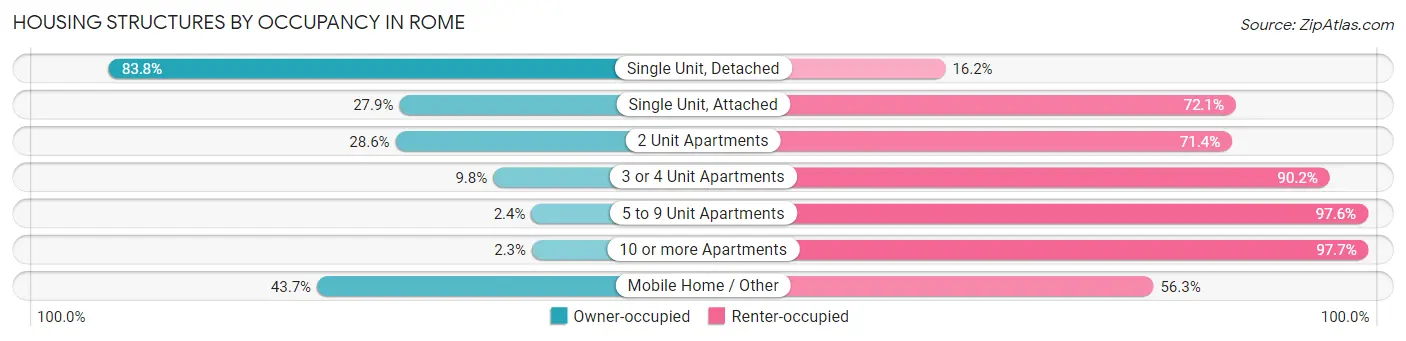
| Structure Type | Owner-occupied | Renter-occupied |
| Single Unit, Detached | 7,051 (83.8%) | 1,366 (16.2%) |
| Single Unit, Attached | 51 (27.9%) | 132 (72.1%) |
| 2 Unit Apartments | 410 (28.6%) | 1,023 (71.4%) |
| 3 or 4 Unit Apartments | 88 (9.8%) | 809 (90.2%) |
| 5 to 9 Unit Apartments | 13 (2.4%) | 519 (97.6%) |
| 10 or more Apartments | 47 (2.3%) | 1,970 (97.7%) |
| Mobile Home / Other | 108 (43.7%) | 139 (56.3%) |
| Total | 7,768 (56.6%) | 5,958 (43.4%) |
Housing Structures by Number of Rooms in Rome
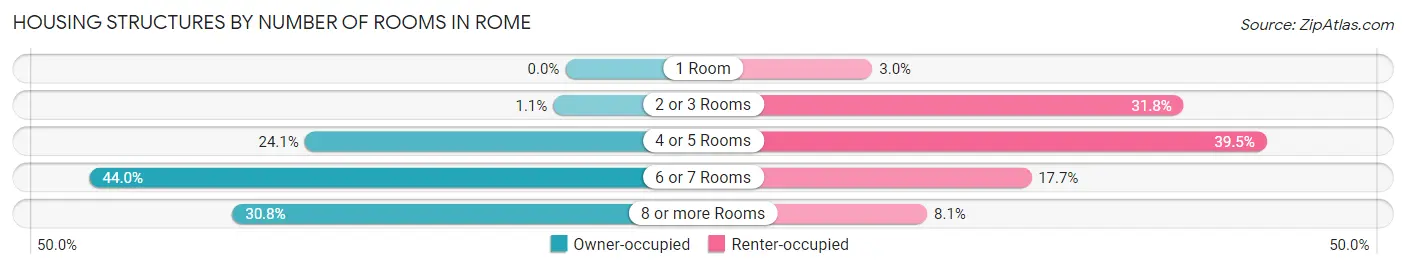
| Number of Rooms | Owner-occupied | Renter-occupied |
| 1 Room | 0 (0.0%) | 179 (3.0%) |
| 2 or 3 Rooms | 87 (1.1%) | 1,894 (31.8%) |
| 4 or 5 Rooms | 1,873 (24.1%) | 2,351 (39.5%) |
| 6 or 7 Rooms | 3,416 (44.0%) | 1,054 (17.7%) |
| 8 or more Rooms | 2,392 (30.8%) | 480 (8.1%) |
| Total | 7,768 (100.0%) | 5,958 (100.0%) |
Housing Structure by Heating Type in Rome
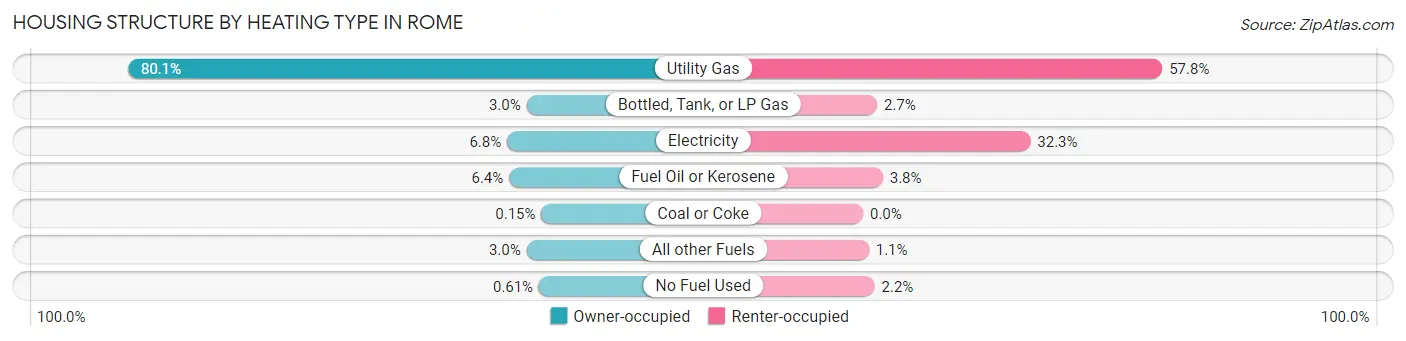
| Heating Type | Owner-occupied | Renter-occupied |
| Utility Gas | 6,219 (80.1%) | 3,445 (57.8%) |
| Bottled, Tank, or LP Gas | 234 (3.0%) | 161 (2.7%) |
| Electricity | 527 (6.8%) | 1,926 (32.3%) |
| Fuel Oil or Kerosene | 495 (6.4%) | 227 (3.8%) |
| Coal or Coke | 12 (0.2%) | 0 (0.0%) |
| All other Fuels | 234 (3.0%) | 66 (1.1%) |
| No Fuel Used | 47 (0.6%) | 133 (2.2%) |
| Total | 7,768 (100.0%) | 5,958 (100.0%) |
Household Vehicle Usage in Rome
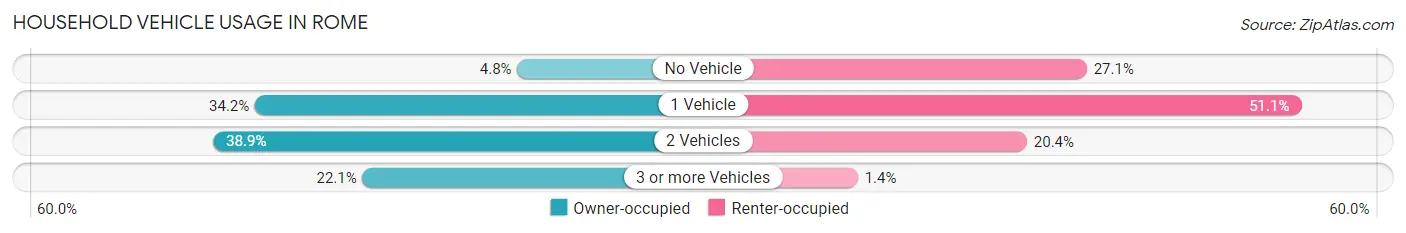
| Vehicles per Household | Owner-occupied | Renter-occupied |
| No Vehicle | 372 (4.8%) | 1,614 (27.1%) |
| 1 Vehicle | 2,655 (34.2%) | 3,045 (51.1%) |
| 2 Vehicles | 3,021 (38.9%) | 1,214 (20.4%) |
| 3 or more Vehicles | 1,720 (22.1%) | 85 (1.4%) |
| Total | 7,768 (100.0%) | 5,958 (100.0%) |
Real Estate & Mortgages in Rome
Real Estate and Mortgage Overview in Rome
| Characteristic | Without Mortgage | With Mortgage |
| Housing Units | 3,722 | 4,046 |
| Median Property Value | $116,200 | $135,700 |
| Median Household Income | $57,259 | $712 |
| Monthly Housing Costs | $626 | $131 |
| Real Estate Taxes | $3,935 | $218 |
Property Value by Mortgage Status in Rome
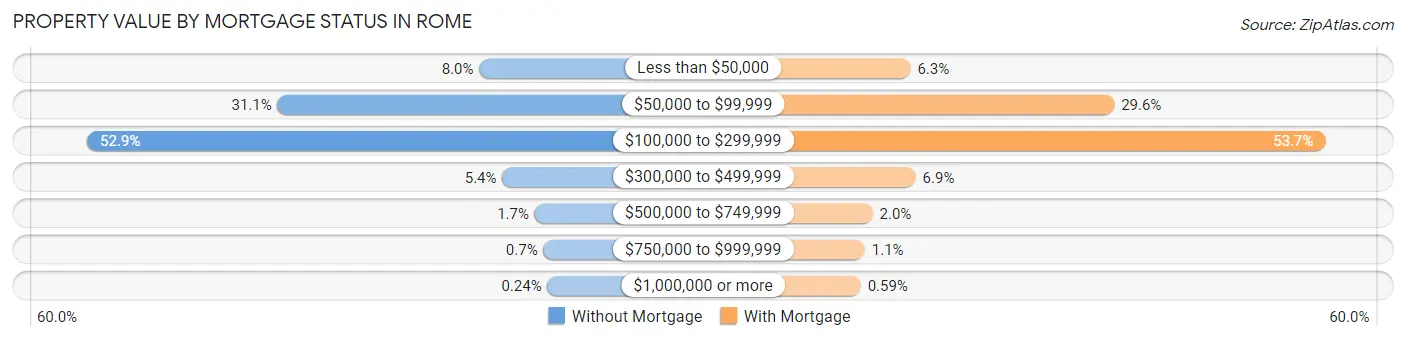
| Property Value | Without Mortgage | With Mortgage |
| Less than $50,000 | 299 (8.0%) | 254 (6.3%) |
| $50,000 to $99,999 | 1,157 (31.1%) | 1,196 (29.6%) |
| $100,000 to $299,999 | 1,967 (52.8%) | 2,172 (53.7%) |
| $300,000 to $499,999 | 201 (5.4%) | 278 (6.9%) |
| $500,000 to $749,999 | 63 (1.7%) | 79 (1.9%) |
| $750,000 to $999,999 | 26 (0.7%) | 43 (1.1%) |
| $1,000,000 or more | 9 (0.2%) | 24 (0.6%) |
| Total | 3,722 (100.0%) | 4,046 (100.0%) |
Household Income by Mortgage Status in Rome
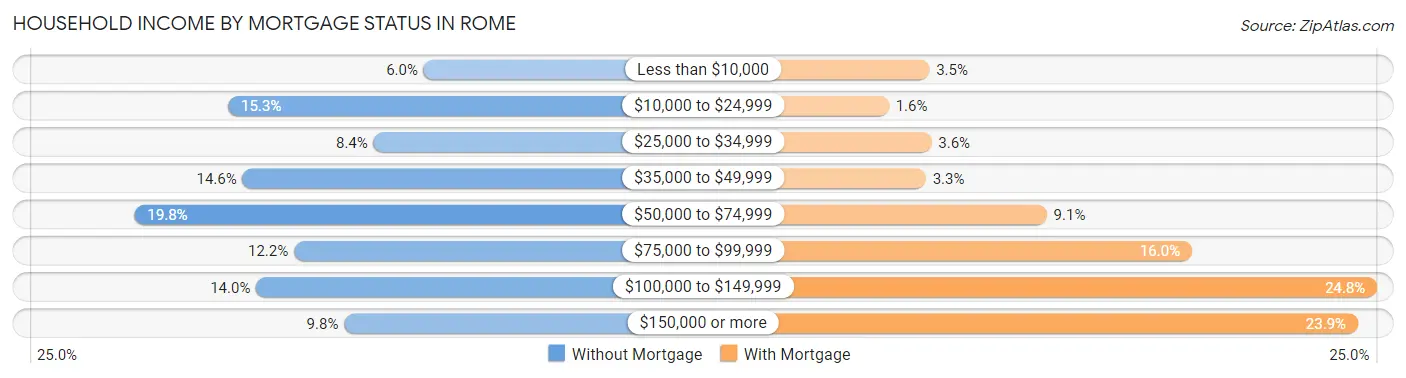
| Household Income | Without Mortgage | With Mortgage |
| Less than $10,000 | 223 (6.0%) | 142 (3.5%) |
| $10,000 to $24,999 | 570 (15.3%) | 64 (1.6%) |
| $25,000 to $34,999 | 312 (8.4%) | 146 (3.6%) |
| $35,000 to $49,999 | 544 (14.6%) | 135 (3.3%) |
| $50,000 to $74,999 | 736 (19.8%) | 368 (9.1%) |
| $75,000 to $99,999 | 453 (12.2%) | 648 (16.0%) |
| $100,000 to $149,999 | 520 (14.0%) | 1,005 (24.8%) |
| $150,000 or more | 364 (9.8%) | 968 (23.9%) |
| Total | 3,722 (100.0%) | 4,046 (100.0%) |
Property Value to Household Income Ratio in Rome
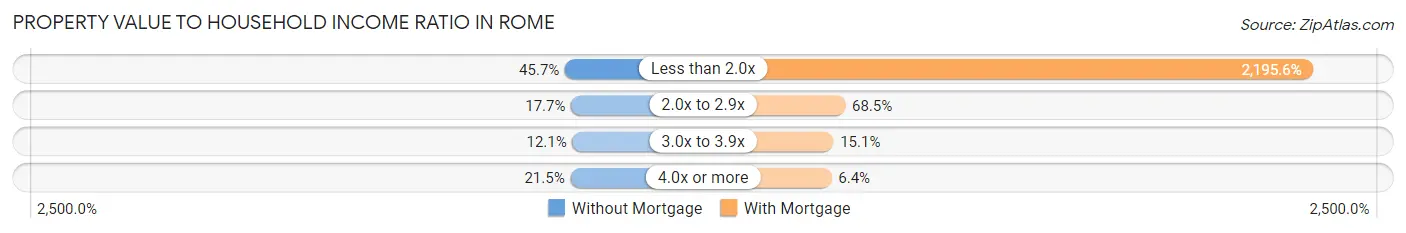
| Value-to-Income Ratio | Without Mortgage | With Mortgage |
| Less than 2.0x | 1,700 (45.7%) | 88,835 (2,195.6%) |
| 2.0x to 2.9x | 660 (17.7%) | 2,770 (68.5%) |
| 3.0x to 3.9x | 451 (12.1%) | 609 (15.0%) |
| 4.0x or more | 800 (21.5%) | 260 (6.4%) |
| Total | 3,722 (100.0%) | 4,046 (100.0%) |
Real Estate Taxes by Mortgage Status in Rome
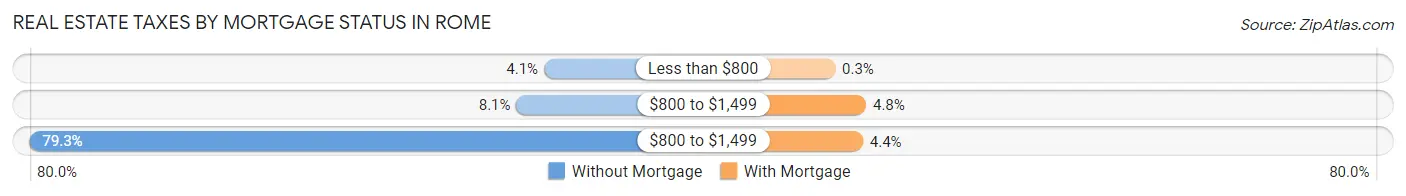
| Property Taxes | Without Mortgage | With Mortgage |
| Less than $800 | 153 (4.1%) | 12 (0.3%) |
| $800 to $1,499 | 303 (8.1%) | 195 (4.8%) |
| $800 to $1,499 | 2,951 (79.3%) | 176 (4.3%) |
| Total | 3,722 (100.0%) | 4,046 (100.0%) |
Health & Disability in Rome
Health Insurance Coverage by Age in Rome
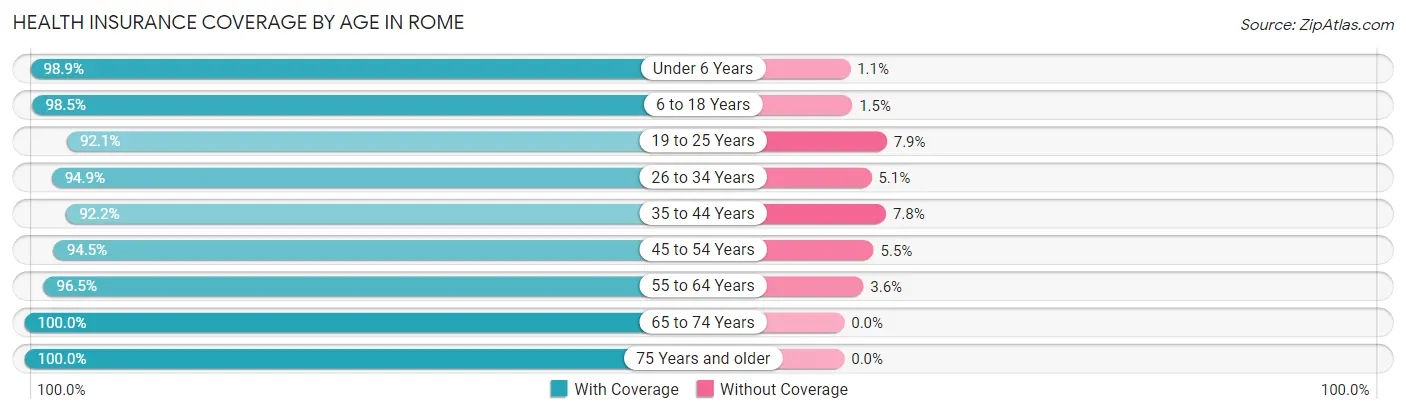
| Age Bracket | With Coverage | Without Coverage |
| Under 6 Years | 2,339 (98.9%) | 26 (1.1%) |
| 6 to 18 Years | 4,463 (98.5%) | 67 (1.5%) |
| 19 to 25 Years | 2,231 (92.1%) | 192 (7.9%) |
| 26 to 34 Years | 3,699 (94.9%) | 197 (5.1%) |
| 35 to 44 Years | 3,145 (92.2%) | 265 (7.8%) |
| 45 to 54 Years | 3,327 (94.5%) | 192 (5.5%) |
| 55 to 64 Years | 4,294 (96.5%) | 158 (3.5%) |
| 65 to 74 Years | 3,077 (100.0%) | 0 (0.0%) |
| 75 Years and older | 2,644 (100.0%) | 0 (0.0%) |
| Total | 29,219 (96.4%) | 1,097 (3.6%) |
Health Insurance Coverage by Citizenship Status in Rome
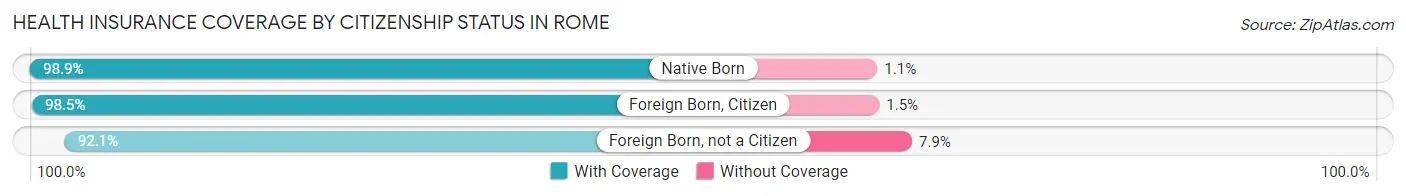
| Citizenship Status | With Coverage | Without Coverage |
| Native Born | 2,339 (98.9%) | 26 (1.1%) |
| Foreign Born, Citizen | 4,463 (98.5%) | 67 (1.5%) |
| Foreign Born, not a Citizen | 2,231 (92.1%) | 192 (7.9%) |
Health Insurance Coverage by Household Income in Rome
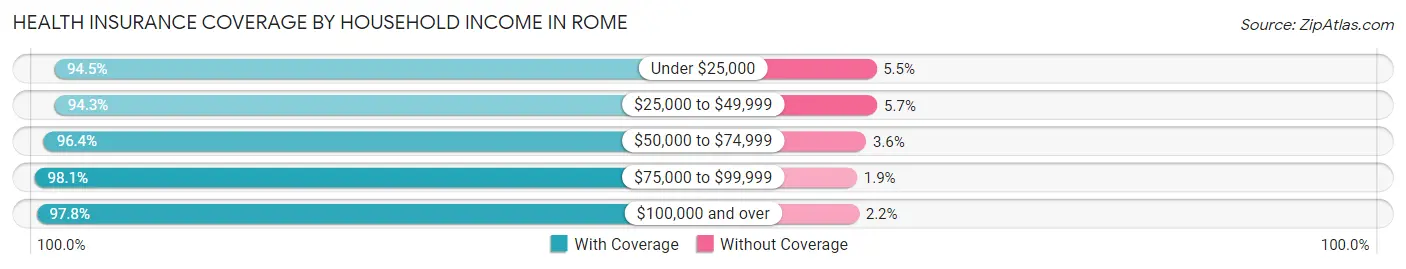
| Household Income | With Coverage | Without Coverage |
| Under $25,000 | 4,749 (94.5%) | 277 (5.5%) |
| $25,000 to $49,999 | 5,616 (94.3%) | 339 (5.7%) |
| $50,000 to $74,999 | 5,111 (96.4%) | 191 (3.6%) |
| $75,000 to $99,999 | 4,717 (98.1%) | 91 (1.9%) |
| $100,000 and over | 8,624 (97.8%) | 198 (2.2%) |
Public vs Private Health Insurance Coverage by Age in Rome
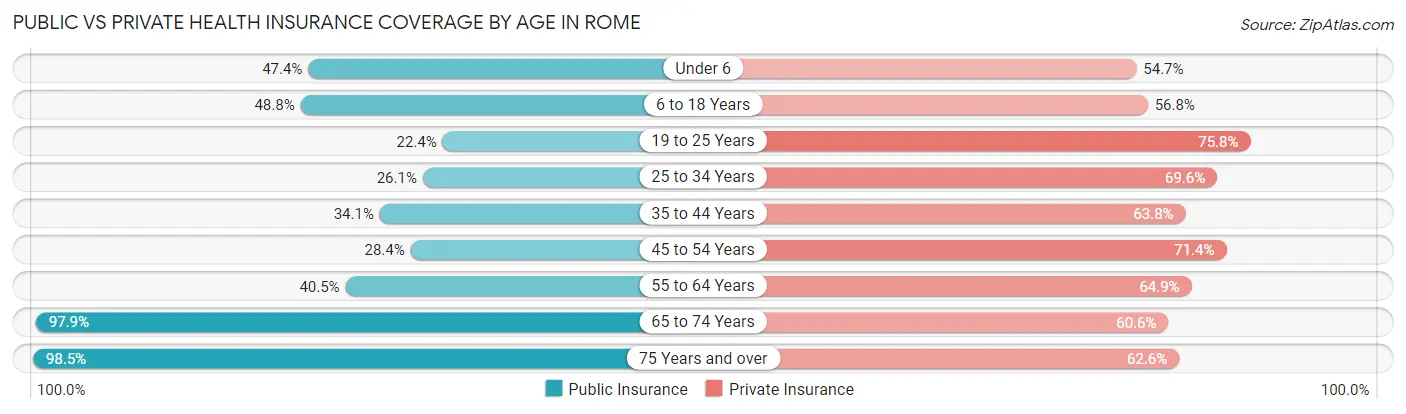
| Age Bracket | Public Insurance | Private Insurance |
| Under 6 | 1,120 (47.4%) | 1,293 (54.7%) |
| 6 to 18 Years | 2,210 (48.8%) | 2,572 (56.8%) |
| 19 to 25 Years | 543 (22.4%) | 1,837 (75.8%) |
| 25 to 34 Years | 1,017 (26.1%) | 2,713 (69.6%) |
| 35 to 44 Years | 1,162 (34.1%) | 2,175 (63.8%) |
| 45 to 54 Years | 998 (28.4%) | 2,511 (71.4%) |
| 55 to 64 Years | 1,801 (40.5%) | 2,889 (64.9%) |
| 65 to 74 Years | 3,013 (97.9%) | 1,865 (60.6%) |
| 75 Years and over | 2,603 (98.5%) | 1,655 (62.6%) |
| Total | 14,467 (47.7%) | 19,510 (64.4%) |
Disability Status by Sex by Age in Rome
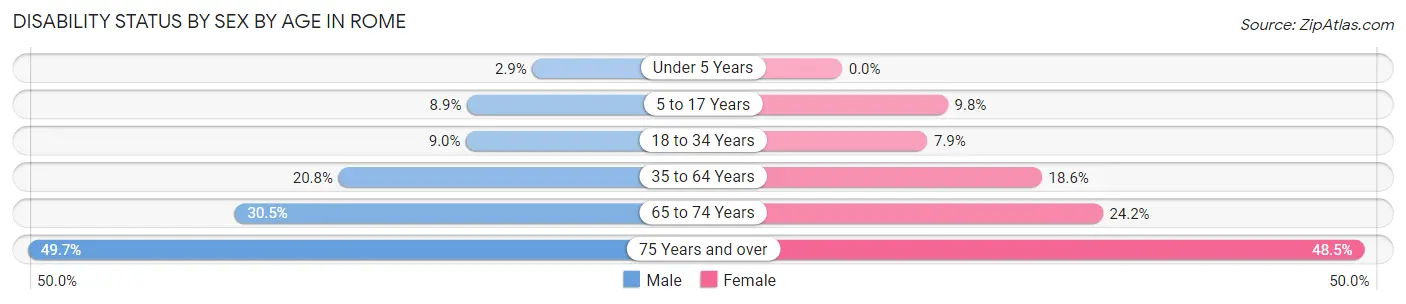
| Age Bracket | Male | Female |
| Under 5 Years | 27 (2.9%) | 0 (0.0%) |
| 5 to 17 Years | 216 (8.9%) | 235 (9.8%) |
| 18 to 34 Years | 290 (9.0%) | 263 (7.9%) |
| 35 to 64 Years | 1,151 (20.8%) | 1,087 (18.5%) |
| 65 to 74 Years | 437 (30.5%) | 398 (24.2%) |
| 75 Years and over | 570 (49.7%) | 726 (48.5%) |
Disability Class by Sex by Age in Rome
Disability Class: Hearing Difficulty
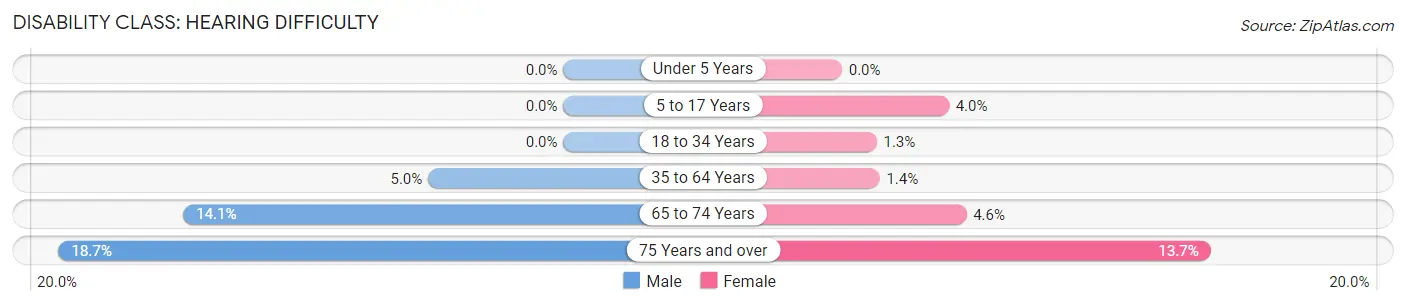
| Age Bracket | Male | Female |
| Under 5 Years | 0 (0.0%) | 0 (0.0%) |
| 5 to 17 Years | 0 (0.0%) | 95 (4.0%) |
| 18 to 34 Years | 0 (0.0%) | 43 (1.3%) |
| 35 to 64 Years | 277 (5.0%) | 82 (1.4%) |
| 65 to 74 Years | 202 (14.1%) | 76 (4.6%) |
| 75 Years and over | 215 (18.7%) | 205 (13.7%) |
Disability Class: Vision Difficulty
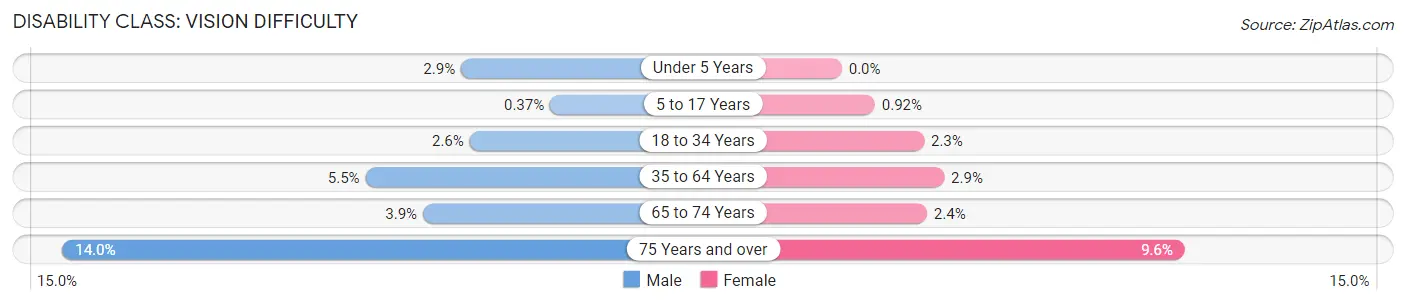
| Age Bracket | Male | Female |
| Under 5 Years | 27 (2.9%) | 0 (0.0%) |
| 5 to 17 Years | 9 (0.4%) | 22 (0.9%) |
| 18 to 34 Years | 84 (2.6%) | 76 (2.3%) |
| 35 to 64 Years | 304 (5.5%) | 167 (2.9%) |
| 65 to 74 Years | 56 (3.9%) | 39 (2.4%) |
| 75 Years and over | 160 (14.0%) | 143 (9.6%) |
Disability Class: Cognitive Difficulty
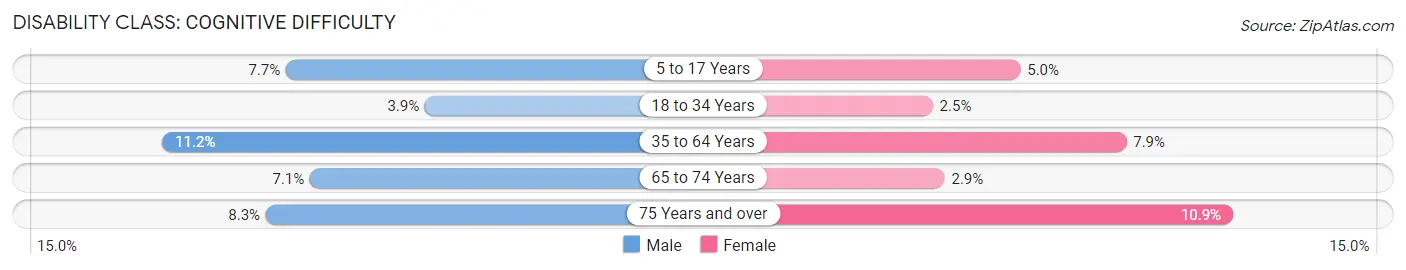
| Age Bracket | Male | Female |
| 5 to 17 Years | 187 (7.7%) | 119 (5.0%) |
| 18 to 34 Years | 124 (3.8%) | 84 (2.5%) |
| 35 to 64 Years | 617 (11.2%) | 464 (7.9%) |
| 65 to 74 Years | 101 (7.0%) | 47 (2.9%) |
| 75 Years and over | 95 (8.3%) | 163 (10.9%) |
Disability Class: Ambulatory Difficulty
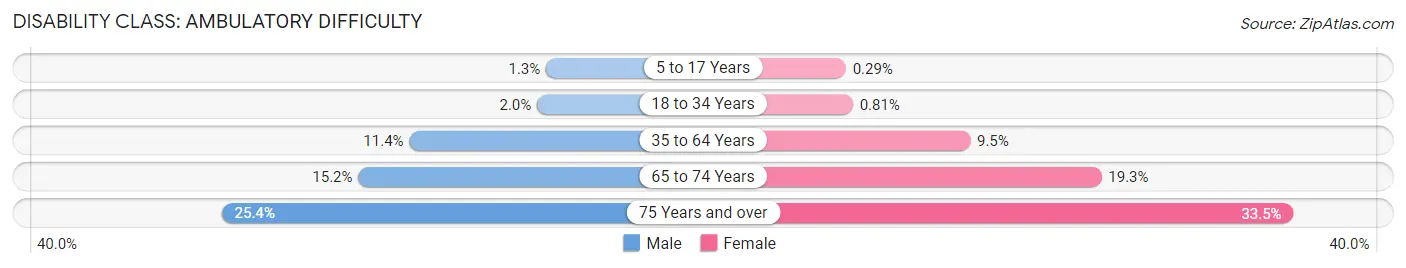
| Age Bracket | Male | Female |
| 5 to 17 Years | 31 (1.3%) | 7 (0.3%) |
| 18 to 34 Years | 63 (1.9%) | 27 (0.8%) |
| 35 to 64 Years | 631 (11.4%) | 558 (9.5%) |
| 65 to 74 Years | 218 (15.2%) | 317 (19.3%) |
| 75 Years and over | 291 (25.4%) | 502 (33.5%) |
Disability Class: Self-Care Difficulty
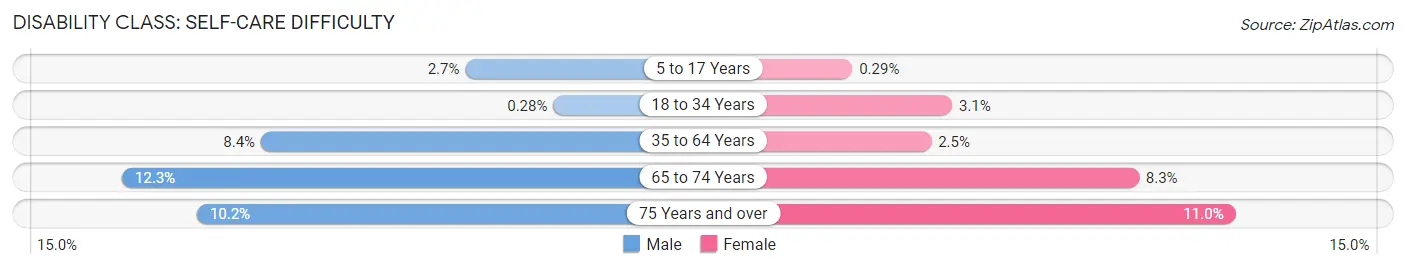
| Age Bracket | Male | Female |
| 5 to 17 Years | 66 (2.7%) | 7 (0.3%) |
| 18 to 34 Years | 9 (0.3%) | 102 (3.1%) |
| 35 to 64 Years | 465 (8.4%) | 146 (2.5%) |
| 65 to 74 Years | 176 (12.3%) | 136 (8.3%) |
| 75 Years and over | 117 (10.2%) | 164 (11.0%) |
Technology Access in Rome
Computing Device Access in Rome
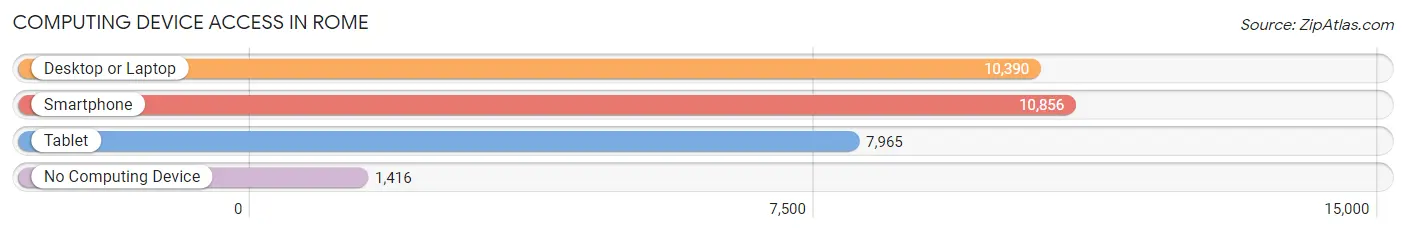
| Device Type | # Households | % Households |
| Desktop or Laptop | 10,390 | 75.7% |
| Smartphone | 10,856 | 79.1% |
| Tablet | 7,965 | 58.0% |
| No Computing Device | 1,416 | 10.3% |
| Total | 13,726 | 100.0% |
Internet Access in Rome
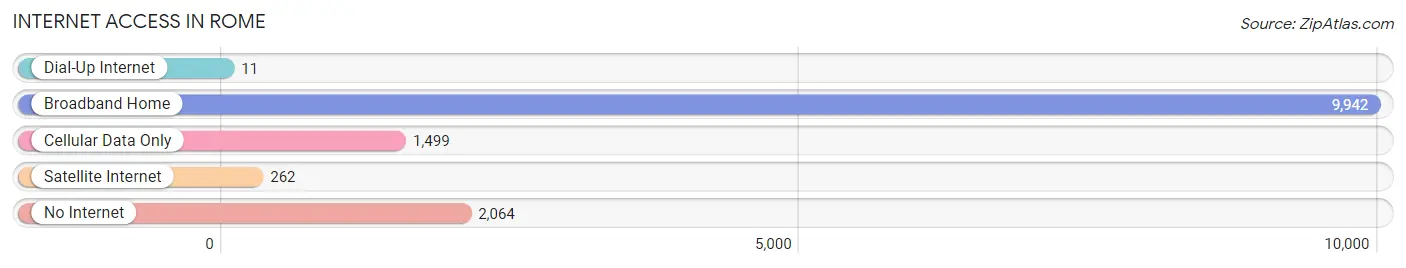
| Internet Type | # Households | % Households |
| Dial-Up Internet | 11 | 0.1% |
| Broadband Home | 9,942 | 72.4% |
| Cellular Data Only | 1,499 | 10.9% |
| Satellite Internet | 262 | 1.9% |
| No Internet | 2,064 | 15.0% |
| Total | 13,726 | 100.0% |
Rome Summary
Rome is a city located in Oneida County, New York, United States. It is located in the Mohawk Valley region of New York, approximately 30 miles east of Syracuse. The city has a population of 33,725 as of the 2010 census, making it the second-largest city in the county.
History
Rome was founded in 1796 by a group of settlers from New England. The city was named after the ancient city of Rome, Italy. The settlers were attracted to the area due to its fertile soil and abundant natural resources. The city quickly grew and became an important trading center for the region.
In the early 19th century, Rome became an important industrial center. The city was home to several factories, including a paper mill, a tannery, and a woolen mill. The city also became a major transportation hub, with the Erie Canal and the New York Central Railroad both running through the city.
In the late 19th century, Rome became a popular tourist destination. The city was home to several grand hotels, including the Hotel Rome and the Hotel Utica. The city also became a popular destination for outdoor recreation, with several parks and lakes in the area.
Geography
Rome is located in the Mohawk Valley region of New York, approximately 30 miles east of Syracuse. The city is situated on the banks of the Mohawk River, which flows through the city. The city is surrounded by several small towns and villages, including Rome, Floyd, Verona, and Westmoreland.
The city has a total area of 16.2 square miles, of which 15.9 square miles is land and 0.3 square miles is water. The city is located at an elevation of 590 feet above sea level.
Economy
Rome is an important economic center for the region. The city is home to several large employers, including Rome Memorial Hospital, Griffiss Business and Technology Park, and the Rome City School District. The city is also home to several small businesses, including restaurants, retail stores, and professional services.
The city is also home to several educational institutions, including Mohawk Valley Community College, Rome Free Academy, and Utica College.
Demographics
As of the 2010 census, Rome had a population of 33,725. The racial makeup of the city was 87.3% White, 8.2% African American, 0.4% Native American, 1.2% Asian, 0.1% Pacific Islander, and 2.8% from other races. Hispanic or Latino of any race were 5.2% of the population.
The median household income in Rome was $37,945, and the median family income was $45,945. The per capita income in the city was $20,845. About 15.3% of the population was below the poverty line.
Common Questions
What is Per Capita Income in Rome?
Per Capita income in Rome is $31,008.
What is the Median Family Income in Rome?
Median Family Income in Rome is $74,084.
What is the Median Household income in Rome?
Median Household Income in Rome is $56,901.
What is Income or Wage Gap in Rome?
Income or Wage Gap in Rome is 19.8%.
Women in Rome earn 80.2 cents for every dollar earned by a man.
What is Family Income Deficit in Rome?
Family Income Deficit in Rome is $13,981.
Families that are below poverty line in Rome earn $13,981 less on average than the poverty threshold level.
What is Inequality or Gini Index in Rome?
Inequality or Gini Index in Rome is 0.44.
What is the Total Population of Rome?
Total Population of Rome is 32,031.
What is the Total Male Population of Rome?
Total Male Population of Rome is 16,147.
What is the Total Female Population of Rome?
Total Female Population of Rome is 15,884.
What is the Ratio of Males per 100 Females in Rome?
There are 101.66 Males per 100 Females in Rome.
What is the Ratio of Females per 100 Males in Rome?
There are 98.37 Females per 100 Males in Rome.
What is the Median Population Age in Rome?
Median Population Age in Rome is 40.7 Years.
What is the Average Family Size in Rome
Average Family Size in Rome is 2.9 People.
What is the Average Household Size in Rome
Average Household Size in Rome is 2.2 People.
How Large is the Labor Force in Rome?
There are 13,847 People in the Labor Forcein in Rome.
What is the Percentage of People in the Labor Force in Rome?
53.1% of People are in the Labor Force in Rome.
What is the Unemployment Rate in Rome?
Unemployment Rate in Rome is 5.0%.